User login
Cancer Cases, Deaths in Men Predicted to Surge by 2050
TOPLINE:
— with substantial disparities in cancer cases and deaths by age and region of the world, a recent analysis found.
METHODOLOGY:
- Overall, men have higher cancer incidence and mortality rates, which can be largely attributed to a higher prevalence of modifiable risk factors such as smoking, alcohol consumption, and occupational carcinogens, as well as the underuse of cancer prevention, screening, and treatment services.
- To assess the burden of cancer in men of different ages and from different regions of the world, researchers analyzed data from the 2022 Global Cancer Observatory (GLOBOCAN), which provides national-level estimates for cancer cases and deaths.
- Study outcomes included the incidence, mortality, and prevalence of cancer among men in 2022, along with projections for 2050. Estimates were stratified by several factors, including age; region; and Human Development Index (HDI), a composite score for health, education, and standard of living.
- Researchers also calculated mortality-to-incidence ratios (MIRs) for various cancer types, where higher values indicate worse survival.
TAKEAWAY:
- The researchers reported an estimated 10.3 million cancer cases and 5.4 million deaths globally in 2022, with almost two thirds of cases and deaths occurring in men aged 65 years or older.
- By 2050, cancer cases and deaths were projected to increase by 84.3% (to 19 million) and 93.2% (to 10.5 million), respectively. The increase from 2022 to 2050 was more than twofold higher for older men and countries with low and medium HDI.
- In 2022, the estimated global cancer MIR among men was nearly 55%, with variations by cancer types, age, and HDI. The MIR was lowest for thyroid cancer (7.6%) and highest for pancreatic cancer (90.9%); among World Health Organization regions, Africa had the highest MIR (72.6%), while the Americas had the lowest MIR (39.1%); countries with the lowest HDI had the highest MIR (73.5% vs 41.1% for very high HDI).
- Lung cancer was the leading cause for cases and deaths in 2022 and was projected to remain the leading cause in 2050.
IN PRACTICE:
“Disparities in cancer incidence and mortality among men were observed across age groups, countries/territories, and HDI in 2022, with these disparities projected to widen further by 2050,” according to the authors, who called for efforts to “reduce disparities in cancer burden and ensure equity in cancer prevention and care for men across the globe.”
SOURCE:
The study, led by Habtamu Mellie Bizuayehu, PhD, School of Public Health, Faculty of Medicine, The University of Queensland, Brisbane, Australia, was published online in Cancer.
LIMITATIONS:
The findings may be influenced by the quality of GLOBOCAN data. Interpretation should be cautious as MIR may not fully reflect cancer outcome inequalities. The study did not include other measures of cancer burden, such as years of life lost or years lived with disability, which were unavailable from the data source.
DISCLOSURES:
The authors did not disclose any funding information. The authors declared no conflicts of interest.
This article was created using several editorial tools, including AI, as part of the process. Human editors reviewed this content before publication. A version of this article first appeared on Medscape.com.
Trends in Industry Payments to Dermatologists: A 5-Year Analysis of Open Payments Data (2017-2021)
Financial relationships between physicians and industry are prevalent and complex and may have implications for patient care. A 2007 study reported that 94% of 3167 physicians surveyed had established some form of paid relationship with companies in the pharmaceutical industry.1 To facilitate increased transparency around these relationships, lawmakers passed the Physician Payments Sunshine Act in 2010, which requires pharmaceutical companies and device manufacturers to report all payments made to physicians.2 Mandatory disclosures include meals, honoraria, travel expenses, grants, and ownership or investment interests greater than $10. The information is displayed publicly in the Open Payments database (OPD)(https://openpayments-data.cms.gov/), a platform run by the Centers for Medicare and Medicaid Services.
The OPD allows for in-depth analyses of industry payments made to physicians. Many medical specialties—including orthopedics,3-5 plastic surgery,6,7 ophthalmology,8 and gastroenterology9—have published extensive literature characterizing the nature of these payments and disparities in the distribution of payments based on sex, geographic distribution, and other factors. After the first full year of OPD data collection for dermatology in 2014, Feng et al10 examined the number, amount, and nature of industry payments to dermatologists, as well as their geographic distribution for that year. As a follow-up to this initial research, Schlager et al11 characterized payments made to dermatologists for the year 2016 and found an increase in the total payments, mean payments, and number of dermatologists receiving payments compared with the 2014 data.
Our study aimed to characterize the last 5 years of available OPD data—from January 1, 2017, to December 31, 2021—to further explore trends in industry payments made to dermatologists. In particular, we examined the effects of the COVID-19 pandemic on payments as well as sex disparities and the distribution of industry payments.
Methods
We performed a retrospective analysis of the OPD for the general payment datasets from January 1, 2017, to December 31, 2021. The results were filtered to include only payments made to dermatologists, excluding physicians from other specialties, physician assistants, and other types of practitioners. Data for each physician were grouped by National Provider Identifier (NPI) for providers included in the set, allowing for analysis at the individual level. Data on sex were extracted from the National Plan & Provider Enumeration System’s monthly data dissemination for NPIs for July 2023 (when the study was conducted) and were joined to the OPD data using the NPI number reported for each physician. All data were extracted, transformed, and analyzed using R software (version 4.2.1). Figures and visualizations were produced using Microsoft Excel 2016.
Results
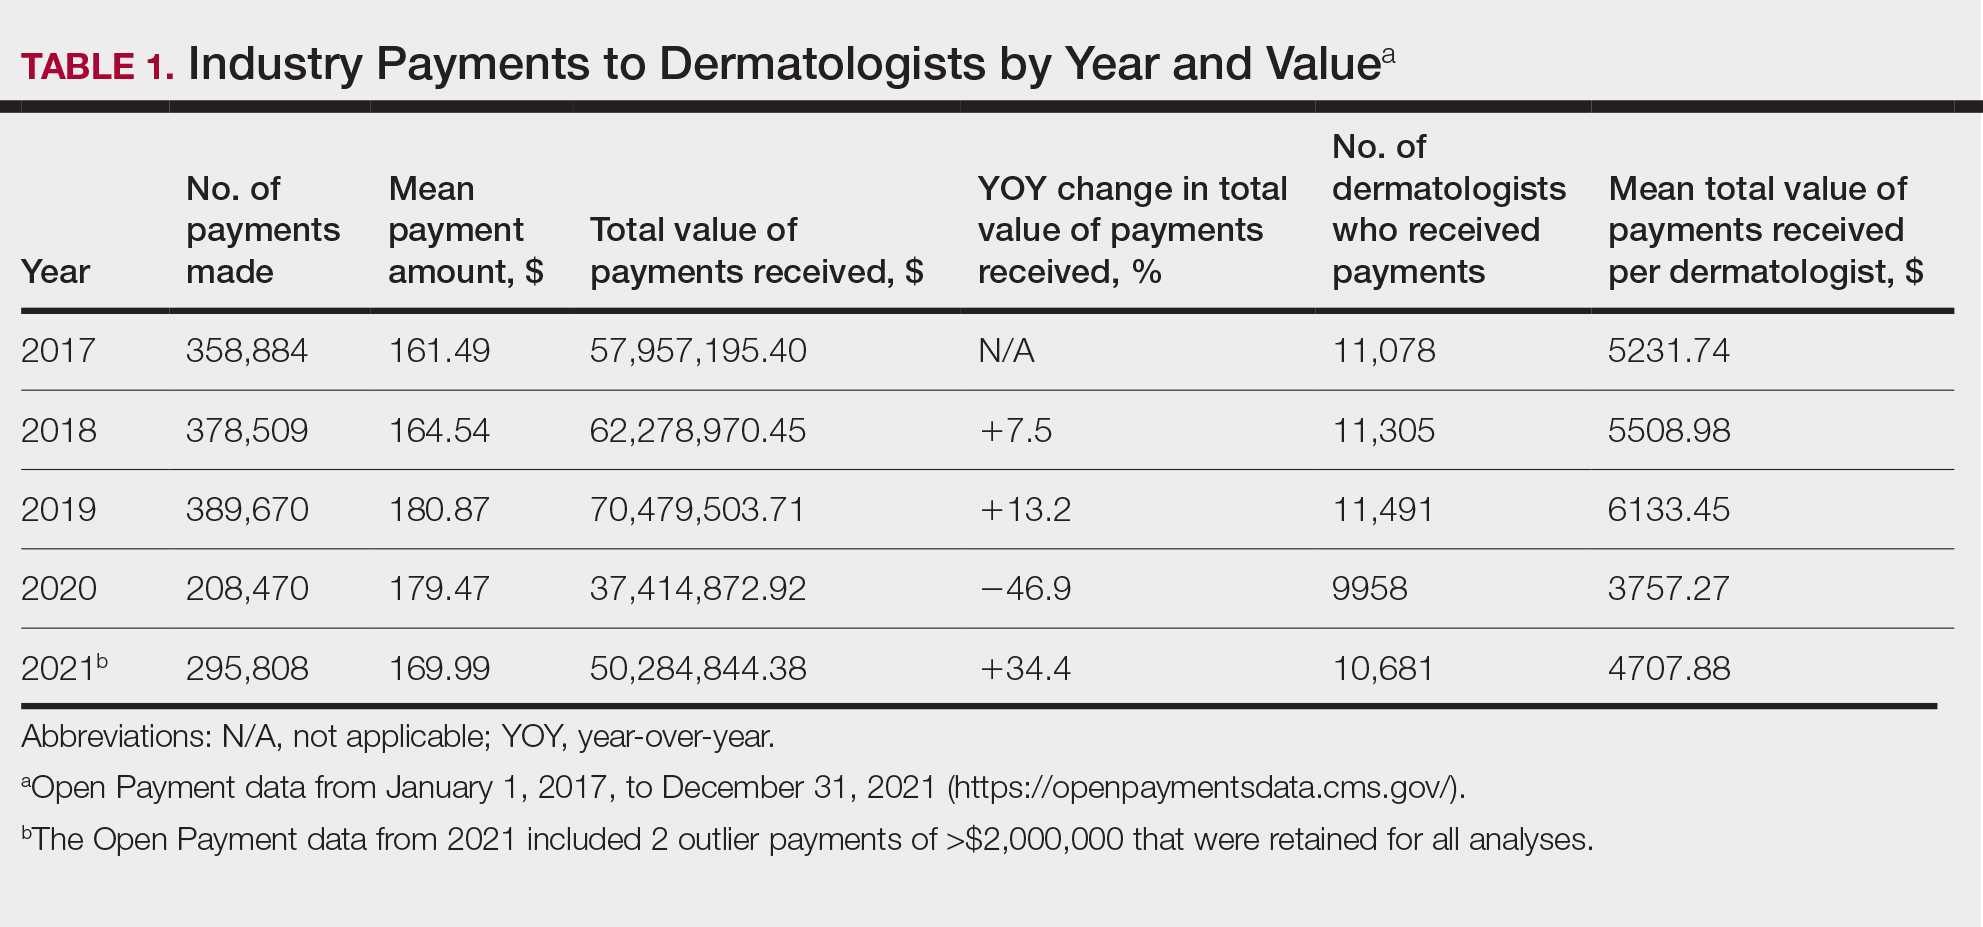
In 2017, a total of 358,884 payments were made by industry to dermatologists, accounting for nearly $58.0 million. The mean total value of payments received per dermatologist was $5231.74, and the mean payment amount was $161.49. In 2018, the total number of payments increased year-over-year by 5.5% (378,509 payments), the total value of payments received increased by 7.5% (approximately $62.3 million), and the mean total value of payments received per dermatologist increased by 5.3% ($5508.98). In 2019, the total number of payments increased by 3.0% (389,670 total payments), the total value of payments recieved increased by 13.2% (approximately $70.5 million), and the mean total value of payments received per dermatologist increased by 11.3% ($6133.45). All of these values decreased in 2020, likely due to COVID-19–related restrictions on travel and meetings (total number of payments, 208,470 [−46.5%]; total value of payments received, approximately $37.5 million [−46.9%], mean total value of payments received per dermatologist, $3757.27 [−38.7%]), but the mean payment amount remained stable at $179.47. In 2021, the total number of payments (295,808 [+41.9%]), total value of payments received (approximately $50.3 million [+34.4%]), and mean total value of payments received per dermatologist ($4707.88 [+25.3%]) all rebounded, but not to pre-2020 levels (Table 1). When looking at the geographic distribution of payments, the top 5 states receiving the highest total value of payments during the study period included California ($41.51 million), New York ($32.26 million), Florida ($21.38 million), Texas ($19.93 million), and Pennsylvania ($11.69 million).
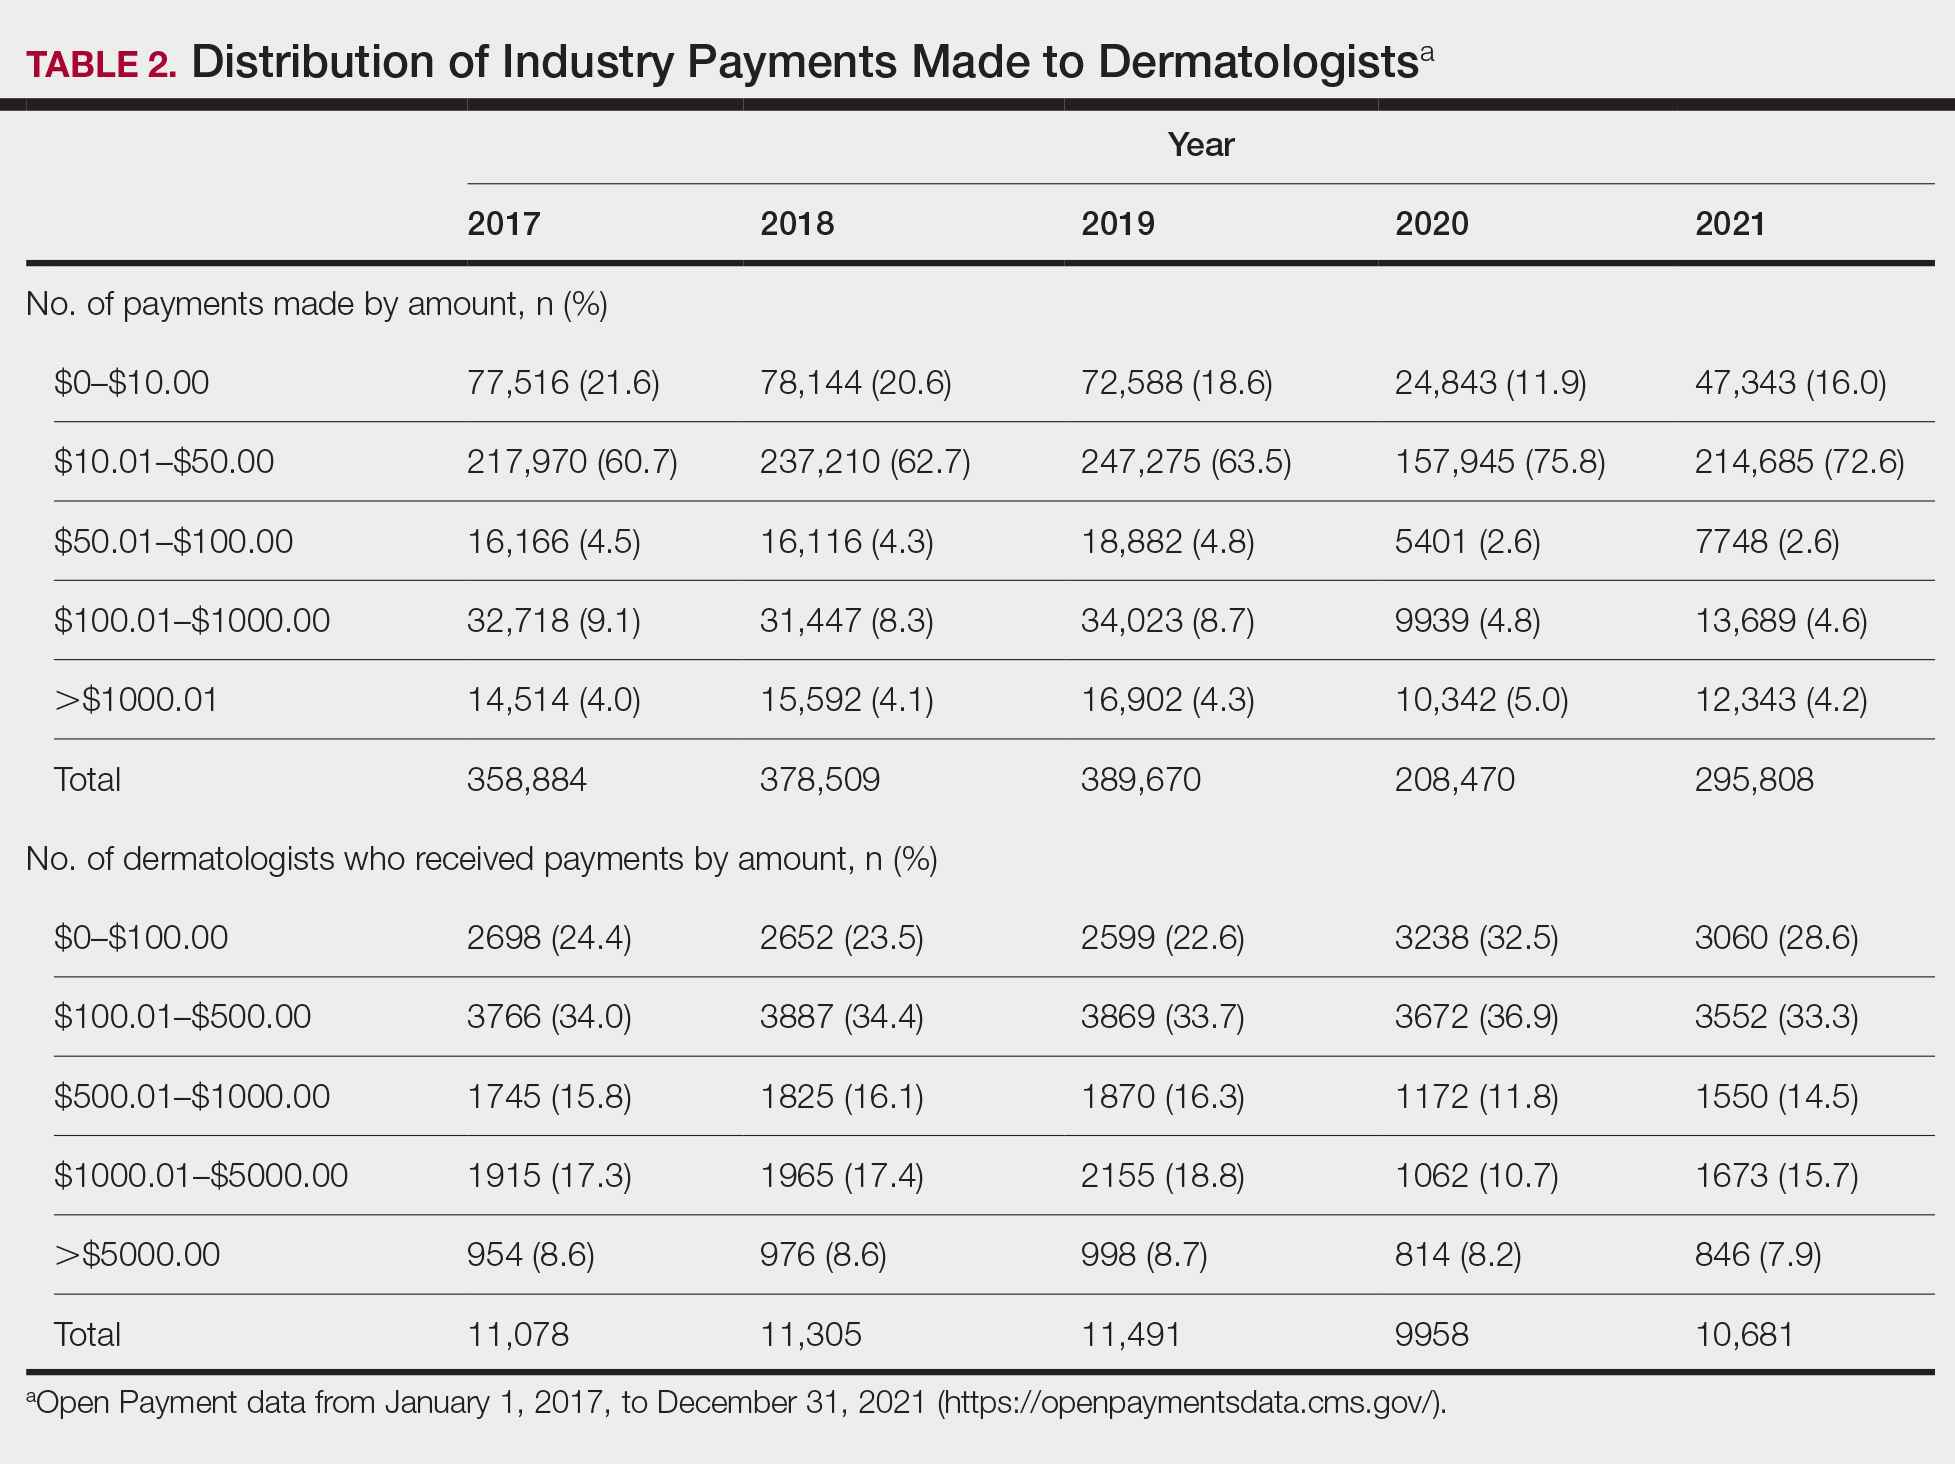
For each year from 2017 to 2021, more than 80% of payments made to dermatologists were less than $50. The majority (60.7%–75.8%) were in the $10 to $50 range. Between 4% and 5% of payments were more than $1000 for each year. Fewer than 10% of dermatologists received more than $5000 in total payments per year. Most dermatologists (33.3%–36.9%) received $100 to $500 per year. The distribution of payments stratified by number of payments made by amount and payment amount per dermatologist is further delineated in Table 2.
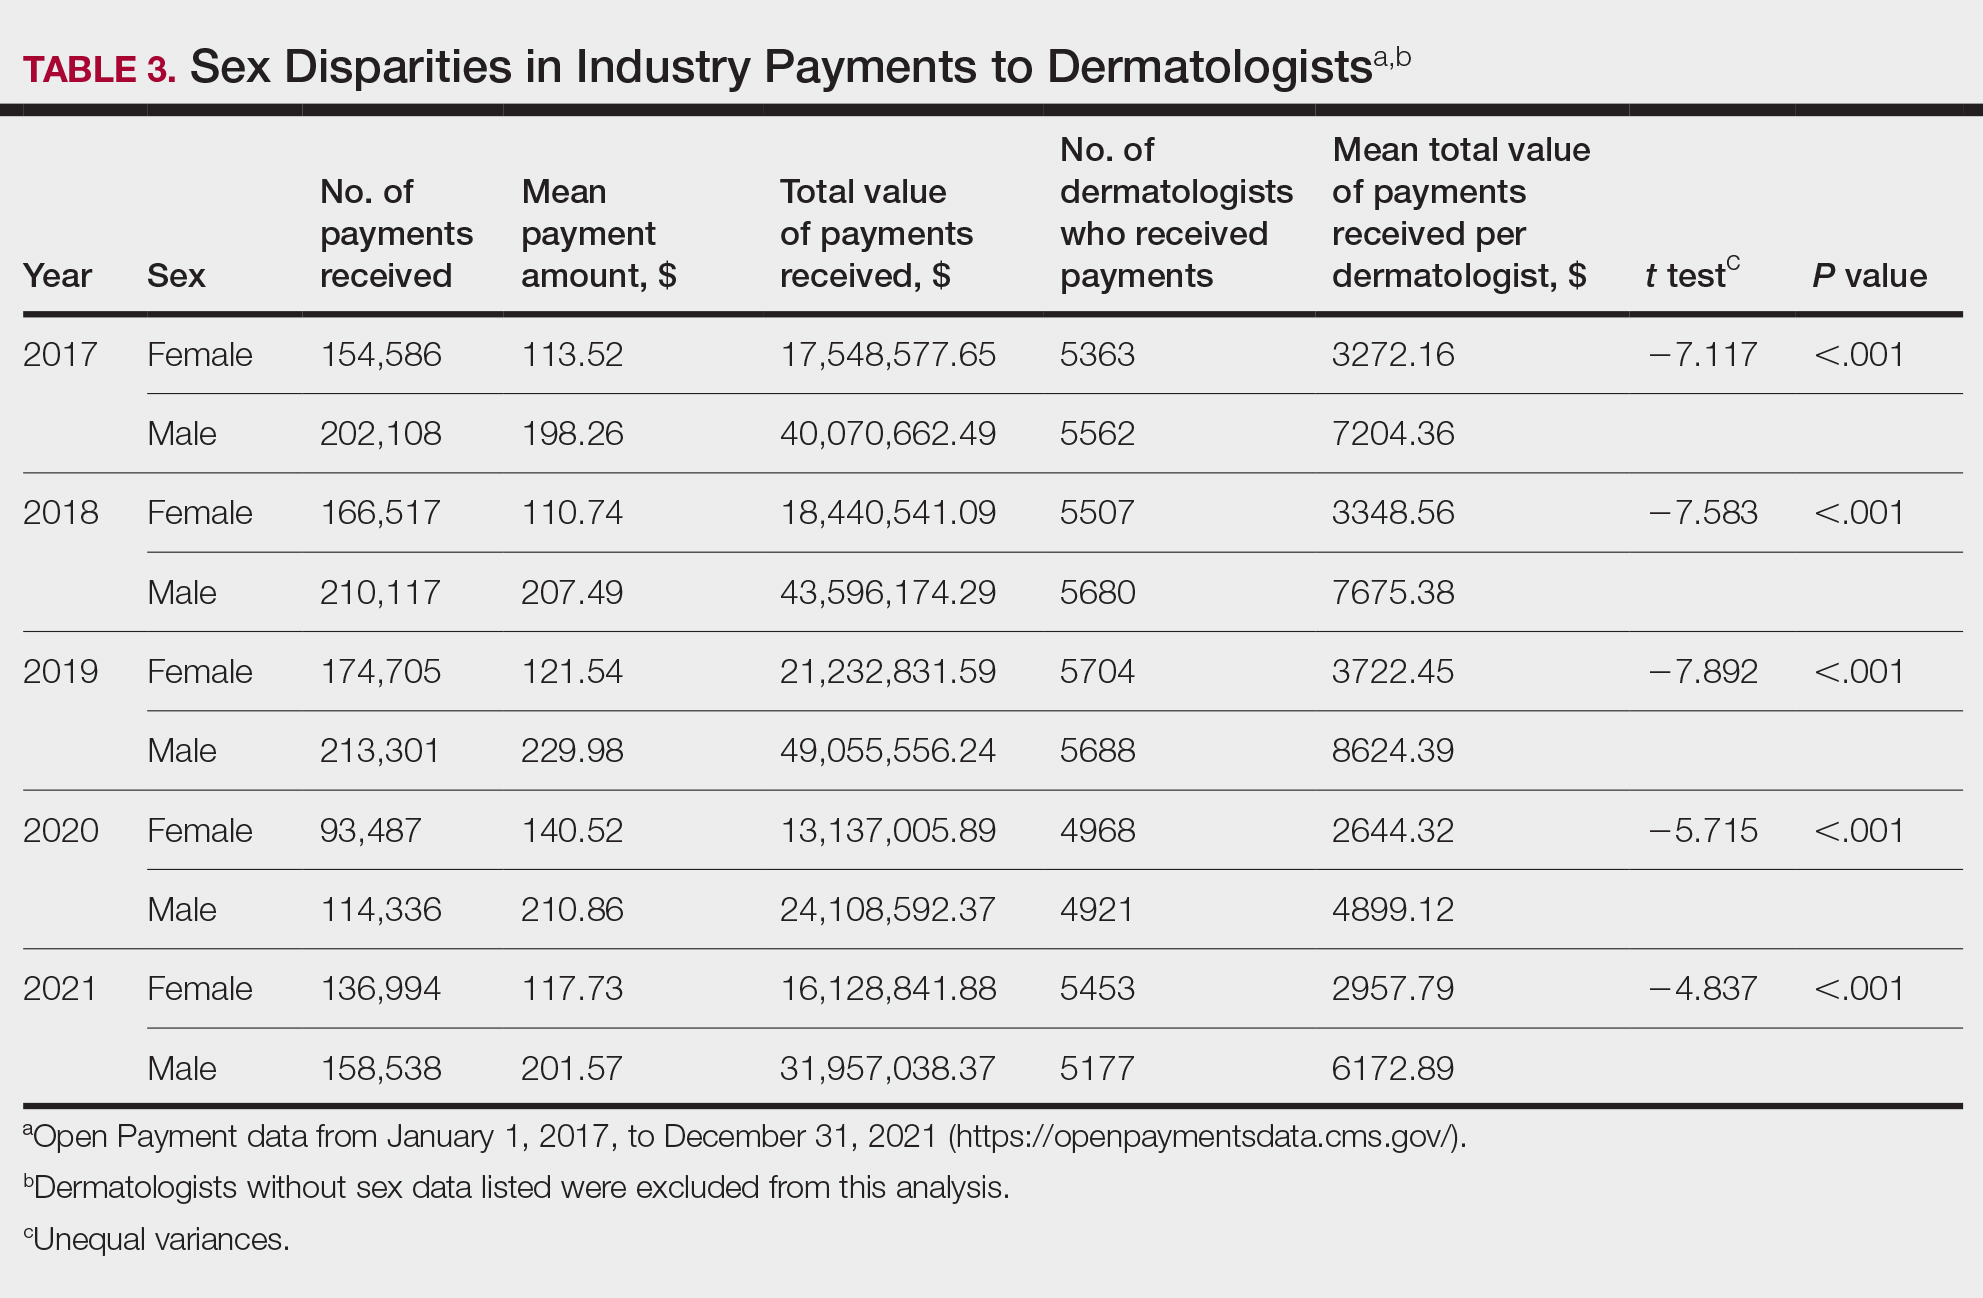
Among dermatologists who received industry payments in 2017, slightly more than half (50.9%) were male; however, male dermatologists accounted for more than $40.1 million of the more than $57.6 million total payments made to dermatologists (69.6%) that year. Male dermatologists received a mean payment amount of $198.26, while female dermatologists received a significantly smaller amount of $113.52 (P<.001). The mean total value of payments received per male dermatologist was $7204.36, while the mean total value for female dermatologists was $3272.16 (P<.001). The same statistically significant disparities in mean payment amount and mean total value of payments received by male vs female dermatologists were observed for every year from 2017 through 2021 (Table 3).
Comment
Benefits of Physician Relationships With Industry—The Physician Payments Sunshine Act increased transparency of industry payments to physicians by creating the OPD through which these relationships can be reported.12 The effects of these relationships on treatment practices have been the subject of many studies in recent years. Some have suggested that industry ties may impact prescription patterns of endorsed medications.13 It also has been reported that the chance of a research study identifying a positive outcome for a particular treatment is higher when the study is funded by a pharmaceutical company compared to other sponsors.14 On the other hand, some researchers have argued that, when established and maintained in an ethical manner, industry-physician relationships may help practitioners stay updated on the newest treatment paradigms and benefit patient care.15 Industry relationships may help drive innovation of new products with direct input from frontline physicians who take care of the patients these products aim to help.
Limitations of the OPD—Critics of the OPD have argued that the reported data lack sufficient context and are not easily interpretable by most patients.16 In addition, many patients might not know about the existence of the database. Indeed, one national survey-based study showed that only 12% of 3542 respondents knew that this information was publicly available, and only 5% knew whether their own physician had received industry payments.17
Increased Payments From Industry—Our analysis builds on previously reported data in dermatology from 2014 to 2016.10,11 We found that the trends of increasing numbers and dollar amounts of payments made by industry to dermatologists continued from 2017 to 2019, which may reflect the intended effects of the Physician Payments Sunshine Act, as more payments are being reported in a transparent manner. It also shows that relationships between industry and dermatologists have become more commonplace over time.
It is important to consider these trends in the context of overall Medicare expenditures and prescription volumes. Between 2008 and 2021, prescription volumes have been increasing at a rate of 1% to 4% per year, with 2020 being an exception as the volume decreased slightly from the year prior due to COVID-19 (−3%). Similarly, total Medicare and Medicaid expenditures have been growing at a rate of almost 5% per year.18 Based on our study results, it appears the total value of payments made between 2017 and 2021 increased at a rate that outpaced prescription volume and expenditures; however, it is difficult to draw conclusions about the relationship between payments made to dermatologists and spending without examining prescriptions specific to dermatologists in the OPD dataset. This relationship could be further explored in future studies.
COVID-19 Restrictions Impacted Payments in 2021—We hypothesize that COVID-19–related restrictions on traveling and in-person meetings led to a decrease in the number of payments, total payment amount, and mean total value of payments received per dermatologist. Notably, compensation for services other than consulting, including speaking fees, had the most precipitous decrease in total payment amount. On the other hand, honoraria and consulting fees were least impacted, as many dermatologists were still able to maintain relationships with industry on an advisory basis without traveling. From 2020 to 2021, the number of total payments and dollar amounts increased with easing of COVID-19 restrictions; however, they had not yet rebounded to 2019 levels during the study period. It will be interesting to continue monitoring these trends once data from future years become available.
Top-Compensated Dermatologists—Our study results also show that for all years from 2017 through 2021, the majority of industry payments were made to a small concentrated percentage of top-compensated dermatologists, which may reflect larger and more frequent payments to those identified by pharmaceutical companies as thought leaders and key opinion leaders in the field or those who are more willing to establish extensive ties with industry. Similarly skewed distributions in payments have been shown in other medical subspecialties including neurosurgery, plastic surgery, otolaryngology, and orthopedics.4,6,19,20 It also is apparent that the majority of compensated dermatologists in the OPD maintain relatively small ties with industry. For every year from 2017 to 2021, more than half of compensated dermatologists received total payments of less than $500 per year, most of which stemmed from the food and beverage category. Interestingly, a prior study showed that patient perceptions of industry-physician ties may be more strongly impacted by the payment category than the amount.21 For example, respondents viewed payments for meals and lodging more negatively, as they were seen more as personal gifts without direct benefit to patients. Conversely, respondents held more positive views of physicians who received free drug samples, which were perceived as benefiting patients, as well as those receiving consulting fees, which were perceived as a signal of physician expertise. Notably, in the same study, physicians who received no payments from industry were seen as honest but also were viewed by some respondents as being inexperienced or uninformed about new treatments.21
The contribution and public perception of dermatologists who conduct investigator-initiated research utilizing other types of funding (eg, government grants) also are important to consider but were not directly assessed within the scope of the current study.
Sex Disparities in Compensation—Multiple studies in the literature have demonstrated that sex inequities exist across medical specialties.22,23 In dermatology, although women make up slightly more than 50% of board-certified dermatologists, they continue to be underrepresented compared with men in leadership positions, academic rank, research funding, and lectureships at national meetings.24-27 In survey-based studies specifically examining gender-based physician compensation, male dermatologists were found to earn higher salaries than their female counterparts in both private practice and academic settings, even after adjusting for work hours, practice characteristics, and academic rank.28,29
Our study contributes to the growing body of evidence suggesting that sex inequities also may exist with regard to financial payments from industry. Our results showed that, although the number of male and female dermatologists with industry relationships was similar each year, the number of payments made and total payment amount were both significantly (P<.001) higher for male dermatologists from 2017 through 2021. In 2021, the mean payment amount ($201.57 for male dermatologists; $117.73 for female dermatologists) and mean total amount of payments received ($6172.89 and $2957.79, respectively) also were significantly higher for male compared with female dermatologists (P<.001). The cause of this disparity likely is multifactorial and warrants additional studies in the future. One hypothesis in the existing literature is that male physicians may be more inclined to seek out relationships with industry; it also is possible that disparities in research funding, academic rank, and speaking opportunities at national conferences detailed previously may contribute to inequities in industry payments as companies seek out perceived leaders in the field.30
Limitations and Future Directions—Several important limitations of our study warrant further consideration. As with any database study, the accuracy of the results presented and the conclusions drawn are highly dependent on the precision of the available data, which is reliant on transparent documentation by pharmaceutical companies and physicians. There are no independent methods of verifying the information reported. There have been reports in the literature questioning the utility of the OPD data and risk for misinterpretation.16,31 Furthermore, the OPD only includes companies whose products are covered by government-sponsored programs, such as Medicare and Medicaid, and therefore does not encompass the totality of industry-dermatologist relationships. We also focused specifically on board-certified dermatologists and did not analyze the extent of industry relationships involving residents, nurses, physician assistants, and other critical members of health care teams that may impact patient care. Differences between academic and private practice payments also could not be examined using the OPD but could present an interesting area for future studies.
Despite these limitations, our study was extensive, using the publicly available OPD to analyze trends and disparities in financial relationships between dermatologists and industry partners from 2017 through 2021. Notably, these findings are not intended to provide judgment or seek to tease out financial relationships that are beneficial for patient care from those that are not; rather, they are intended only to lend additional transparency, provoke thought, and encourage future studies and discussion surrounding this important topic.
Conclusion
Financial relationships between dermatologists and industry are complex and are becoming more prevalent, as shown in our study. These relationships may be critical to facilitate novel patient-centered research and growth in the field of dermatology; however, they also have the potential to be seen as bias in patient care. Transparent reporting of these relationships is an important step in future research regarding the effects of different payment types and serves as the basis for further understanding industry-dermatologist relationships as well as any inequities that exist in the distribution of payments. We encourage all dermatologists to review their public profiles in the OPD. Physicians have the opportunity to review all payment data reported by companies and challenge the accuracy of the data if necessary.
- Campbell EG, Gruen RL, Mountford J, et al. A national survey of physician-industry relationships. N Engl J Med. 2007;356:1742-1750.
- Kirschner NM, Sulmasy LS, Kesselheim AS. Health policy basics: the Physician Payment Sunshine Act and the Open Payments program. Ann Intern Med. 2014;161:519-521.
- Braithwaite J, Frane N, Partan MJ, et al. Review of industry payments to general orthopaedic surgeons reported by the open payments database: 2014 to 2019. J Am Acad Orthop Surg Glob Res Rev. 2021;5:E21.00060.
- Pathak N, Mercier MR, Galivanche AR, et al. Industry payments to orthopedic spine surgeons reported by the open payments database: 2014-2017. Clin Spine Surg. 2020;33:E572-E578.
- Almaguer AM, Wills BW, Robin JX, et al. Open payments reporting of industry compensation for orthopedic residents. J Surg Educ. 2020;77:1632-1637.
- Chao AH, Gangopadhyay N. Industry financial relationships in plastic surgery: analysis of the sunshine act open payments database. Plast Reconstr Surg. 2016;138:341E-348E.
- Khetpal S, Mets EJ, Ahmad M, et al. The open payments sunshine act database revisited: a 5-year analysis of industry payments to plastic surgeons. Plast Reconstr Surg. 2021;148:877E-878E.
- Slentz DH, Nelson CC, Lichter PR. Characteristics of industry payments to ophthalmologists in the open payments database. JAMA Ophthalmol. 2019;137:1038-1044.
- Gangireddy VGR, Amin R, Yu K, et al. Analysis of payments to GI physicians in the United States: open payments data study. JGH Open. 2020;4:1031-1036.
- Feng H, Wu P, Leger M. Exploring the industry-dermatologist financial relationship: insight from the open payment data. JAMA Dermatol. 2016;152:1307-1313.
- Schlager E, Flaten H, St Claire C, et al. Industry payments to dermatologists: updates from the 2016 open payment data. Dermatol Online J. 2018;24:13030/qt8r74w3c4.
- Agrawal S, Brennan N, Budetti P. The Sunshine Act—effects on physicians. N Engl J Med. 2013;368:2054-2057.
- DeJong C, Aguilar T, Tseng CW, et al. Pharmaceutical industry-sponsored meals and physician prescribing patterns for Medicare beneficiaries. JAMA Intern Med. 2016;176:1114-1122.
- Lexchin J, Bero LA, Djulbegovic B, et al. Pharmaceutical industry sponsorship and research outcome and quality: systematic review. BMJ. 2003;326:1167-1170.
- Nakayama DK. In defense of industry-physician relationships. Am Surg. 2010;76:987-994.
- Chimonas S, DeVito NJ, Rothman DJ. Bringing transparency to medicine: exploring physicians’ views and experiences of the sunshine act. Am J Bioeth. 2017;17:4-18.
- Pham-Kanter G, Mello MM, Lehmann LS, et la. Public awareness of and contact with physicians who receive industry payments: a national survey. J Gen Intern Med. 2017;32:767-774.
- National Health Expenditure Fact Sheet. Updated December 13, 2023 Accessed August 9, 2024. https://www.cms.gov/data-research/statistics-trends-and-reports/national-health-expenditure-data/nhe-fact-sheet
- de Lotbiniere-Bassett MP, McDonald PJ. Industry financial relationships in neurosurgery in 2015: analysis of the Sunshine Act Open Payments database. World Neurosurg. 2018;114:E920-E925.
- Pathak N, Fujiwara RJT, Mehra S. Assessment of nonresearch industry payments to otolaryngologists in 2014 and 2015. Otolaryngol Head Neck Surg. 2018;158:1028-1034.
- Perry JE, Cox D, Cox AD. Trust and transparency: patient perceptions of physicians’ financial relationships with pharmaceutical companies. J Law Med Ethics. 2014;42:475-491.
- Freund KM, Raj A, Kaplan SE, et al. Inequities in academic compensation by gender: a follow-up to the national faculty survey cohort study. Acad Med. 2016;91:1068-1073.
- Seabury SA, Chandra A, Jena AB. Trends in the earnings of male and female health care professionals in the United States, 1987 to 2010. JAMA Intern Med. 2013;173:1748-1750.
- Flaten HK, Goodman L, Wong E, et al. Analysis of speaking opportunities by gender at national dermatologic surgery conferences. Dermatol Surg. 2020;46:1195-1201.
- Lobl M, Grinnell M, Higgins S, et al. Representation of women as editors in dermatology journals: a comprehensive review. Int J Womens Dermatol. 2020;6:20-24.
- Stratman H, Stratman EJ. Assessment of percentage of women in the dermatology workforce presenting at American Academy of Dermatology annual meetings, 1992-2017. JAMA Dermatol. 2019;155:384-386.
- Wu AG, Lipner SR. Sex trends in leadership of the American Academy of Dermatology: a cross-sectional study. J Am Acad Dermatol. 2020;83:592-594.
- Weeks WB, Wallace AE. Gender differences in dermatologists’ annual incomes. Cutis. 2007;80:325-332.
- Sachdeva M, Price KN, Hsiao JL, et al. Gender and rank salary trends among academic dermatologists. Int J Womens Dermatol. 2020;6:324-326.
- Rose SL, Sanghani RM, Schmidt C, et al. Gender differences in physicians’ financial ties to industry: a study of national disclosure data. PLoS One. 2015;10:E0129197.
- Santhakumar S, Adashi EY. The physician payment sunshine act: testing the value of transparency. JAMA. 2015;313:23-24.
Financial relationships between physicians and industry are prevalent and complex and may have implications for patient care. A 2007 study reported that 94% of 3167 physicians surveyed had established some form of paid relationship with companies in the pharmaceutical industry.1 To facilitate increased transparency around these relationships, lawmakers passed the Physician Payments Sunshine Act in 2010, which requires pharmaceutical companies and device manufacturers to report all payments made to physicians.2 Mandatory disclosures include meals, honoraria, travel expenses, grants, and ownership or investment interests greater than $10. The information is displayed publicly in the Open Payments database (OPD)(https://openpayments-data.cms.gov/), a platform run by the Centers for Medicare and Medicaid Services.
The OPD allows for in-depth analyses of industry payments made to physicians. Many medical specialties—including orthopedics,3-5 plastic surgery,6,7 ophthalmology,8 and gastroenterology9—have published extensive literature characterizing the nature of these payments and disparities in the distribution of payments based on sex, geographic distribution, and other factors. After the first full year of OPD data collection for dermatology in 2014, Feng et al10 examined the number, amount, and nature of industry payments to dermatologists, as well as their geographic distribution for that year. As a follow-up to this initial research, Schlager et al11 characterized payments made to dermatologists for the year 2016 and found an increase in the total payments, mean payments, and number of dermatologists receiving payments compared with the 2014 data.
Our study aimed to characterize the last 5 years of available OPD data—from January 1, 2017, to December 31, 2021—to further explore trends in industry payments made to dermatologists. In particular, we examined the effects of the COVID-19 pandemic on payments as well as sex disparities and the distribution of industry payments.
Methods
We performed a retrospective analysis of the OPD for the general payment datasets from January 1, 2017, to December 31, 2021. The results were filtered to include only payments made to dermatologists, excluding physicians from other specialties, physician assistants, and other types of practitioners. Data for each physician were grouped by National Provider Identifier (NPI) for providers included in the set, allowing for analysis at the individual level. Data on sex were extracted from the National Plan & Provider Enumeration System’s monthly data dissemination for NPIs for July 2023 (when the study was conducted) and were joined to the OPD data using the NPI number reported for each physician. All data were extracted, transformed, and analyzed using R software (version 4.2.1). Figures and visualizations were produced using Microsoft Excel 2016.
Results
In 2017, a total of 358,884 payments were made by industry to dermatologists, accounting for nearly $58.0 million. The mean total value of payments received per dermatologist was $5231.74, and the mean payment amount was $161.49. In 2018, the total number of payments increased year-over-year by 5.5% (378,509 payments), the total value of payments received increased by 7.5% (approximately $62.3 million), and the mean total value of payments received per dermatologist increased by 5.3% ($5508.98). In 2019, the total number of payments increased by 3.0% (389,670 total payments), the total value of payments recieved increased by 13.2% (approximately $70.5 million), and the mean total value of payments received per dermatologist increased by 11.3% ($6133.45). All of these values decreased in 2020, likely due to COVID-19–related restrictions on travel and meetings (total number of payments, 208,470 [−46.5%]; total value of payments received, approximately $37.5 million [−46.9%], mean total value of payments received per dermatologist, $3757.27 [−38.7%]), but the mean payment amount remained stable at $179.47. In 2021, the total number of payments (295,808 [+41.9%]), total value of payments received (approximately $50.3 million [+34.4%]), and mean total value of payments received per dermatologist ($4707.88 [+25.3%]) all rebounded, but not to pre-2020 levels (Table 1). When looking at the geographic distribution of payments, the top 5 states receiving the highest total value of payments during the study period included California ($41.51 million), New York ($32.26 million), Florida ($21.38 million), Texas ($19.93 million), and Pennsylvania ($11.69 million).
For each year from 2017 to 2021, more than 80% of payments made to dermatologists were less than $50. The majority (60.7%–75.8%) were in the $10 to $50 range. Between 4% and 5% of payments were more than $1000 for each year. Fewer than 10% of dermatologists received more than $5000 in total payments per year. Most dermatologists (33.3%–36.9%) received $100 to $500 per year. The distribution of payments stratified by number of payments made by amount and payment amount per dermatologist is further delineated in Table 2.
Among dermatologists who received industry payments in 2017, slightly more than half (50.9%) were male; however, male dermatologists accounted for more than $40.1 million of the more than $57.6 million total payments made to dermatologists (69.6%) that year. Male dermatologists received a mean payment amount of $198.26, while female dermatologists received a significantly smaller amount of $113.52 (P<.001). The mean total value of payments received per male dermatologist was $7204.36, while the mean total value for female dermatologists was $3272.16 (P<.001). The same statistically significant disparities in mean payment amount and mean total value of payments received by male vs female dermatologists were observed for every year from 2017 through 2021 (Table 3).
Comment
Benefits of Physician Relationships With Industry—The Physician Payments Sunshine Act increased transparency of industry payments to physicians by creating the OPD through which these relationships can be reported.12 The effects of these relationships on treatment practices have been the subject of many studies in recent years. Some have suggested that industry ties may impact prescription patterns of endorsed medications.13 It also has been reported that the chance of a research study identifying a positive outcome for a particular treatment is higher when the study is funded by a pharmaceutical company compared to other sponsors.14 On the other hand, some researchers have argued that, when established and maintained in an ethical manner, industry-physician relationships may help practitioners stay updated on the newest treatment paradigms and benefit patient care.15 Industry relationships may help drive innovation of new products with direct input from frontline physicians who take care of the patients these products aim to help.
Limitations of the OPD—Critics of the OPD have argued that the reported data lack sufficient context and are not easily interpretable by most patients.16 In addition, many patients might not know about the existence of the database. Indeed, one national survey-based study showed that only 12% of 3542 respondents knew that this information was publicly available, and only 5% knew whether their own physician had received industry payments.17
Increased Payments From Industry—Our analysis builds on previously reported data in dermatology from 2014 to 2016.10,11 We found that the trends of increasing numbers and dollar amounts of payments made by industry to dermatologists continued from 2017 to 2019, which may reflect the intended effects of the Physician Payments Sunshine Act, as more payments are being reported in a transparent manner. It also shows that relationships between industry and dermatologists have become more commonplace over time.
It is important to consider these trends in the context of overall Medicare expenditures and prescription volumes. Between 2008 and 2021, prescription volumes have been increasing at a rate of 1% to 4% per year, with 2020 being an exception as the volume decreased slightly from the year prior due to COVID-19 (−3%). Similarly, total Medicare and Medicaid expenditures have been growing at a rate of almost 5% per year.18 Based on our study results, it appears the total value of payments made between 2017 and 2021 increased at a rate that outpaced prescription volume and expenditures; however, it is difficult to draw conclusions about the relationship between payments made to dermatologists and spending without examining prescriptions specific to dermatologists in the OPD dataset. This relationship could be further explored in future studies.
COVID-19 Restrictions Impacted Payments in 2021—We hypothesize that COVID-19–related restrictions on traveling and in-person meetings led to a decrease in the number of payments, total payment amount, and mean total value of payments received per dermatologist. Notably, compensation for services other than consulting, including speaking fees, had the most precipitous decrease in total payment amount. On the other hand, honoraria and consulting fees were least impacted, as many dermatologists were still able to maintain relationships with industry on an advisory basis without traveling. From 2020 to 2021, the number of total payments and dollar amounts increased with easing of COVID-19 restrictions; however, they had not yet rebounded to 2019 levels during the study period. It will be interesting to continue monitoring these trends once data from future years become available.
Top-Compensated Dermatologists—Our study results also show that for all years from 2017 through 2021, the majority of industry payments were made to a small concentrated percentage of top-compensated dermatologists, which may reflect larger and more frequent payments to those identified by pharmaceutical companies as thought leaders and key opinion leaders in the field or those who are more willing to establish extensive ties with industry. Similarly skewed distributions in payments have been shown in other medical subspecialties including neurosurgery, plastic surgery, otolaryngology, and orthopedics.4,6,19,20 It also is apparent that the majority of compensated dermatologists in the OPD maintain relatively small ties with industry. For every year from 2017 to 2021, more than half of compensated dermatologists received total payments of less than $500 per year, most of which stemmed from the food and beverage category. Interestingly, a prior study showed that patient perceptions of industry-physician ties may be more strongly impacted by the payment category than the amount.21 For example, respondents viewed payments for meals and lodging more negatively, as they were seen more as personal gifts without direct benefit to patients. Conversely, respondents held more positive views of physicians who received free drug samples, which were perceived as benefiting patients, as well as those receiving consulting fees, which were perceived as a signal of physician expertise. Notably, in the same study, physicians who received no payments from industry were seen as honest but also were viewed by some respondents as being inexperienced or uninformed about new treatments.21
The contribution and public perception of dermatologists who conduct investigator-initiated research utilizing other types of funding (eg, government grants) also are important to consider but were not directly assessed within the scope of the current study.
Sex Disparities in Compensation—Multiple studies in the literature have demonstrated that sex inequities exist across medical specialties.22,23 In dermatology, although women make up slightly more than 50% of board-certified dermatologists, they continue to be underrepresented compared with men in leadership positions, academic rank, research funding, and lectureships at national meetings.24-27 In survey-based studies specifically examining gender-based physician compensation, male dermatologists were found to earn higher salaries than their female counterparts in both private practice and academic settings, even after adjusting for work hours, practice characteristics, and academic rank.28,29
Our study contributes to the growing body of evidence suggesting that sex inequities also may exist with regard to financial payments from industry. Our results showed that, although the number of male and female dermatologists with industry relationships was similar each year, the number of payments made and total payment amount were both significantly (P<.001) higher for male dermatologists from 2017 through 2021. In 2021, the mean payment amount ($201.57 for male dermatologists; $117.73 for female dermatologists) and mean total amount of payments received ($6172.89 and $2957.79, respectively) also were significantly higher for male compared with female dermatologists (P<.001). The cause of this disparity likely is multifactorial and warrants additional studies in the future. One hypothesis in the existing literature is that male physicians may be more inclined to seek out relationships with industry; it also is possible that disparities in research funding, academic rank, and speaking opportunities at national conferences detailed previously may contribute to inequities in industry payments as companies seek out perceived leaders in the field.30
Limitations and Future Directions—Several important limitations of our study warrant further consideration. As with any database study, the accuracy of the results presented and the conclusions drawn are highly dependent on the precision of the available data, which is reliant on transparent documentation by pharmaceutical companies and physicians. There are no independent methods of verifying the information reported. There have been reports in the literature questioning the utility of the OPD data and risk for misinterpretation.16,31 Furthermore, the OPD only includes companies whose products are covered by government-sponsored programs, such as Medicare and Medicaid, and therefore does not encompass the totality of industry-dermatologist relationships. We also focused specifically on board-certified dermatologists and did not analyze the extent of industry relationships involving residents, nurses, physician assistants, and other critical members of health care teams that may impact patient care. Differences between academic and private practice payments also could not be examined using the OPD but could present an interesting area for future studies.
Despite these limitations, our study was extensive, using the publicly available OPD to analyze trends and disparities in financial relationships between dermatologists and industry partners from 2017 through 2021. Notably, these findings are not intended to provide judgment or seek to tease out financial relationships that are beneficial for patient care from those that are not; rather, they are intended only to lend additional transparency, provoke thought, and encourage future studies and discussion surrounding this important topic.
Conclusion
Financial relationships between dermatologists and industry are complex and are becoming more prevalent, as shown in our study. These relationships may be critical to facilitate novel patient-centered research and growth in the field of dermatology; however, they also have the potential to be seen as bias in patient care. Transparent reporting of these relationships is an important step in future research regarding the effects of different payment types and serves as the basis for further understanding industry-dermatologist relationships as well as any inequities that exist in the distribution of payments. We encourage all dermatologists to review their public profiles in the OPD. Physicians have the opportunity to review all payment data reported by companies and challenge the accuracy of the data if necessary.
- Campbell EG, Gruen RL, Mountford J, et al. A national survey of physician-industry relationships. N Engl J Med. 2007;356:1742-1750.
- Kirschner NM, Sulmasy LS, Kesselheim AS. Health policy basics: the Physician Payment Sunshine Act and the Open Payments program. Ann Intern Med. 2014;161:519-521.
- Braithwaite J, Frane N, Partan MJ, et al. Review of industry payments to general orthopaedic surgeons reported by the open payments database: 2014 to 2019. J Am Acad Orthop Surg Glob Res Rev. 2021;5:E21.00060.
- Pathak N, Mercier MR, Galivanche AR, et al. Industry payments to orthopedic spine surgeons reported by the open payments database: 2014-2017. Clin Spine Surg. 2020;33:E572-E578.
- Almaguer AM, Wills BW, Robin JX, et al. Open payments reporting of industry compensation for orthopedic residents. J Surg Educ. 2020;77:1632-1637.
- Chao AH, Gangopadhyay N. Industry financial relationships in plastic surgery: analysis of the sunshine act open payments database. Plast Reconstr Surg. 2016;138:341E-348E.
- Khetpal S, Mets EJ, Ahmad M, et al. The open payments sunshine act database revisited: a 5-year analysis of industry payments to plastic surgeons. Plast Reconstr Surg. 2021;148:877E-878E.
- Slentz DH, Nelson CC, Lichter PR. Characteristics of industry payments to ophthalmologists in the open payments database. JAMA Ophthalmol. 2019;137:1038-1044.
- Gangireddy VGR, Amin R, Yu K, et al. Analysis of payments to GI physicians in the United States: open payments data study. JGH Open. 2020;4:1031-1036.
- Feng H, Wu P, Leger M. Exploring the industry-dermatologist financial relationship: insight from the open payment data. JAMA Dermatol. 2016;152:1307-1313.
- Schlager E, Flaten H, St Claire C, et al. Industry payments to dermatologists: updates from the 2016 open payment data. Dermatol Online J. 2018;24:13030/qt8r74w3c4.
- Agrawal S, Brennan N, Budetti P. The Sunshine Act—effects on physicians. N Engl J Med. 2013;368:2054-2057.
- DeJong C, Aguilar T, Tseng CW, et al. Pharmaceutical industry-sponsored meals and physician prescribing patterns for Medicare beneficiaries. JAMA Intern Med. 2016;176:1114-1122.
- Lexchin J, Bero LA, Djulbegovic B, et al. Pharmaceutical industry sponsorship and research outcome and quality: systematic review. BMJ. 2003;326:1167-1170.
- Nakayama DK. In defense of industry-physician relationships. Am Surg. 2010;76:987-994.
- Chimonas S, DeVito NJ, Rothman DJ. Bringing transparency to medicine: exploring physicians’ views and experiences of the sunshine act. Am J Bioeth. 2017;17:4-18.
- Pham-Kanter G, Mello MM, Lehmann LS, et la. Public awareness of and contact with physicians who receive industry payments: a national survey. J Gen Intern Med. 2017;32:767-774.
- National Health Expenditure Fact Sheet. Updated December 13, 2023 Accessed August 9, 2024. https://www.cms.gov/data-research/statistics-trends-and-reports/national-health-expenditure-data/nhe-fact-sheet
- de Lotbiniere-Bassett MP, McDonald PJ. Industry financial relationships in neurosurgery in 2015: analysis of the Sunshine Act Open Payments database. World Neurosurg. 2018;114:E920-E925.
- Pathak N, Fujiwara RJT, Mehra S. Assessment of nonresearch industry payments to otolaryngologists in 2014 and 2015. Otolaryngol Head Neck Surg. 2018;158:1028-1034.
- Perry JE, Cox D, Cox AD. Trust and transparency: patient perceptions of physicians’ financial relationships with pharmaceutical companies. J Law Med Ethics. 2014;42:475-491.
- Freund KM, Raj A, Kaplan SE, et al. Inequities in academic compensation by gender: a follow-up to the national faculty survey cohort study. Acad Med. 2016;91:1068-1073.
- Seabury SA, Chandra A, Jena AB. Trends in the earnings of male and female health care professionals in the United States, 1987 to 2010. JAMA Intern Med. 2013;173:1748-1750.
- Flaten HK, Goodman L, Wong E, et al. Analysis of speaking opportunities by gender at national dermatologic surgery conferences. Dermatol Surg. 2020;46:1195-1201.
- Lobl M, Grinnell M, Higgins S, et al. Representation of women as editors in dermatology journals: a comprehensive review. Int J Womens Dermatol. 2020;6:20-24.
- Stratman H, Stratman EJ. Assessment of percentage of women in the dermatology workforce presenting at American Academy of Dermatology annual meetings, 1992-2017. JAMA Dermatol. 2019;155:384-386.
- Wu AG, Lipner SR. Sex trends in leadership of the American Academy of Dermatology: a cross-sectional study. J Am Acad Dermatol. 2020;83:592-594.
- Weeks WB, Wallace AE. Gender differences in dermatologists’ annual incomes. Cutis. 2007;80:325-332.
- Sachdeva M, Price KN, Hsiao JL, et al. Gender and rank salary trends among academic dermatologists. Int J Womens Dermatol. 2020;6:324-326.
- Rose SL, Sanghani RM, Schmidt C, et al. Gender differences in physicians’ financial ties to industry: a study of national disclosure data. PLoS One. 2015;10:E0129197.
- Santhakumar S, Adashi EY. The physician payment sunshine act: testing the value of transparency. JAMA. 2015;313:23-24.
Practice Points
- Industry payments to dermatologists are prevalent and complex and may have implications for patient care.
- To facilitate increased transparency around industry-physician relationships, lawmakers passed the Physician Payments Sunshine Act requiring pharmaceutical companies and device manufacturers to report all payments made to physicians.
- We encourage dermatologists to review their public profiles on the Open Payments database, as physicians have the opportunity to challenge the accuracy of the reported data, if applicable.
From Scrubs to Social Media: How Some Med Students Become Influencers
A medical student’s life is an endless cycle of classes, exams, clinical rotations, and residency preparation. On TikTok and Instagram, among other sites, they share medical school experiences and lessons learned in the classroom and advocate for causes such as increased diversity and gender rights in the medical field.
This news organization caught up with a few social media influencers with a large online following to learn how medical students can effectively use social media to build a professional brand and network. Most of the students interviewed said that their social media platforms offered an opportunity to educate others about significant medical developments, feel part of a community with a like-minded audience, and network with doctors who may lead them to a future residency or career path.
Many med students said that they built their large audiences by creating a platform for people of their ethnic background, nationality, race, gender, or simply what others weren’t already talking about. They said they saw a niche in social media that was missing or others hadn’t tackled in the same way.
When Joel Bervell began med school in 2020, he questioned some of the lessons he learned about how race is used in medical practice, which didn’t make sense to him. So, he began his own research. He had about 2000 followers on Instagram at the time.
Mr. Bervell read a new study about pulse oximeters and how they often produce misleading readings on patients with dark skin.
He wondered why he hadn’t learned this in medical school, so he posted it on TikTok. Within 24 hours, about 500,000 people viewed it. Most of the comments were from doctors, nurses, and physician assistants who said they weren’t aware of the disparity.
While his initial posts detailed his journey to medical school and a day-in-the-life of a medical student, he transitioned to posts primarily about race, health equity, and what he perceives as racial bias in medicine.
Now, the fourth-year Ghanaian-American student at the Elson S. Floyd College of Medicine at Washington State University Spokane has close to 1.2 million followers on Instagram and TikTok combined. He frequently visits the White House to advise on social media’s influence on healthcare and has appeared on the Kelly Clarkson Show, Good Morning America, CNN, and ABC, among others.
He said he also uses social media to translate complex medical information for a general audience, many of whom access health information online so they can manage their own healthcare. He sees his social media work as an extension of his medical education, allowing him to delve deeper into subjects and report on them as if he were publishing research in a medical journal.
“When I came to medical school, yes, I wanted to be a doctor. But I also wanted to impact people.” Social media allows him to educate many more people than individual patients, the 29-year-old told this news organization.
Inspiring Minorities
Tabhata Paulet, 27, started her TikTok presence as a premed student in 2021. She aimed to provide free resources to help low-income, first-generation Latinx students like herself study for standardized exams.
“I always looked online for guidance and resources, and the medical influencers did not share a similar background. So, I shared my story and what I had to do as a first-generation and first person in my family to become a physician. I did not have access to the same resources as my peers,” said Ms. Paulet, who was born in Peru and came to New Jersey as a child.
Students who are Hispanic, Latinx, or of Spanish origin made up 6.8% of total medical school enrollment in 2023-2024, up slightly from 6.7% in 2022-2023, according to the Association of American Medical Colleges (AAMC).
Ms. Paulet’s online presence grew when she began documenting her experiences as a first-year medical student, bridging the language barrier for Spanish-speaking patients so they could understand their diagnosis and treatment. She often posts about health disparity and barriers to care for underserved communities.
Most of her nearly 22,000 followers are Hispanic, said the now fourth-year student at Rutgers New Jersey Medical School in Newark, New Jersey. “I talk a lot about my interesting Spanish-speaking patients ... and how sometimes speaking their native language truly makes a difference in their care.”
She believes that she serves an important role in social media. “It can be very inspirational for those who come after you [in med school] to see someone from a similar culture and upbringing.”
Creating a Community
It was during a therapy session 4 years ago that Jeremy “JP” Scott decided to share Instagram posts about his experiences as a nontraditional medical student. The 37-year-old was studying at Ross University School of Medicine in Barbados and was feeling lonely as an international medical student training to be a doctor as a second career.
Before starting med school, Mr. Scott was an adjunct professor and lab supervisor at the University of Hartford Biology Department, West Hartford, Connecticut, and then a research assistant and lab manager at the Wistar Institute in Philadelphia.
Although he wanted to follow his mother’s path to becoming a doctor, it was more difficult than he envisioned, said the fourth-year student who completed clinical rotations in the United States and is now applying for residencies.
“I talked about how medical school is not what it appears to be ... There are a lot of challenges we are going through,” especially as people of color, he said.
Mr. Scott believes social media helps people feel included and less alone. He said many of his followers are med students and physicians.
His posts often focus on LGBTQIA+ pride and being a minority as a Black man in medicine.
“The pandemic spurred a lot of us. We had a racial reckoning in our country at the time. It inspired us to talk as Black creators and Black medical students.”
Black or African American medical students made up 8.5% of total med school enrollment in 2023-2024, a slight increase from 2022 to 2023, according to AAMC figures. Black men represented 7% of total enrollment in 2023-2024, while Black women represented 9.8%.
After only a handful of online posts in which Mr. Scott candidly discussed his mental health struggles and relationships, he attracted the attention of several medical apparel companies, including the popular FIGS scrubs. He’s now an ambassador for the company, which supports him and his content.
“My association with FIGS has helped attract a wider online audience, increasing my presence.” Today, he has 14,000 Instagram followers. “It opened up so many opportunities,” Mr. Scott said. One example is working with the national LGBTQIA+ community.
“The goal was never to be a social media influencer, to gain sponsorships or photo opportunities,” he said.
“My job, first, is as a medical student. Everything else is second. I am not trying to be a professional social media personality. I’m trying to be an actual physician.” He also tries to separate JP “social media” from Jeremy, the medical student.
“On Instagram, anyone can pull it up and see what you’re doing. The last thing I want is for them to think that I’m not serious about what I’m doing, that I’m not here to learn and become a doctor.”
Benefits and Drawbacks
Ms. Paulet said her social media following helped her connect with leaders in the Latinx medical community, including an obstetrics anesthesiologist, her intended specialty. “I don’t think I’d be able to do that without a social media platform.”
Her online activity also propelled her from regional to national leadership in the Latino Medical Student Association (LMSA). She now also runs their Instagram page, which has 14,000 followers.
Mr. Bervell believes social media is a great way to network. He’s connected with people he wouldn’t have met otherwise, including physicians. “I think it will help me get into a residency,” he said. “It allows people to know who you are ... They will be able to tell in a few videos the type of doctor I want to be.”
On the other hand, Mr. Bervell is aware of the negative impacts of social media on mental health. “You can get lost in social media.” For that reason, he often tries to disconnect. “I can go days without my phone.”
Posting on social media can be time-consuming, Mr. Bervell admitted. He said he spent about 2 hours a day researching, editing, and posting on TikTok when he first started building his following. Now, he spends about 2-3 hours a week creating videos. “I don’t post every day anymore. I don’t have the time.”
When she started building her TikTok presence, Ms. Paulet said she devoted 15 hours a week to the endeavor, but now she spends 10-12 hours a week posting online, including on LMSA’s Instagram page. “Whenever you are done with an exam or have a study break, this is something fun to do.” She also says you never know who you’re going to inspire when you put yourself out there.
“Talk about your journey, rotations, or your experience in your first or second year of medical school. Talk about milestones like board exams.”
Word to the Wise
Some students may be concerned that their posts might affect a potential residency program. But the medical students interviewed say they want to find programs that align with their values and accept them for who they are.
Mr. Scott said he’s not worried about someone not liking him because of who he is. “I am Black and openly gay. If it’s a problem, I don’t need to work with you or your institution.”
Mr. Bervell stressed that medical students should stay professional online. “I reach 5-10 million people a month, and I have to think: Would I want them to see this? You have to know at all times that someone is watching. I’m very careful about how I post. I script out every video.”
Mr. Scott agreed. He advises those interested in becoming medical influencers to know what they can’t post online. For example, to ensure safety and privacy, Mr. Scott doesn’t take photos in the hospital, show his medical badge, or post patient information. “You want to be respectful of your future medical profession,” he said.
“If it’s something my mother would be ashamed of, I don’t need to post about it.”
A version of this article first appeared on Medscape.com.
No Surprises Act: Private Equity Scores Big in Arbitrations
Four organizations owned by private equity firms — including two provider groups — dominated the No Surprises Act’s disputed bill arbitration process in its first year, filing about 70% of 657,040 cases against insurers in 2023, a new report finds.
The findings, recently published in Health Affairs, suggest that private equity–owned organizations are forcefully challenging insurers about payments for certain kinds of out-of-network care.
Their fighting stance has paid off: The percentage of resolved arbitration cases won by providers jumped from 72% in the first quarter of 2023 to 85% in the last quarter, and they were awarded a median of more than 300% the contracted in-network rates for the services in question.
With many more out-of-network bills disputed by providers than expected, “the system is not working exactly the way it was anticipated when this law was written,” lead author Jack Hoadley, PhD, a research professor emeritus at Georgetown University’s McCourt School of Public Policy, Washington, DC, told this news organization.
And, he said, the public and the federal government may end up paying a price.
Congress passed the No Surprises Act in 2020 and then-President Donald Trump signed it. The landmark bill, which went into effect in 2022, was designed to protect patients from unexpected and often exorbitant “surprise” bills after they received some kinds of out-of-network care.
Now, many types of providers are forbidden from billing patients beyond normal in-network costs. In these cases, health plans and out-of-network providers — who don’t have mutual agreements — must wrangle over payment amounts, which are intended to not exceed inflation-adjusted 2019 median levels.
A binding arbitration process kicks in when a provider and a health plan fail to agree about how much the plan will pay for a service. Then, a third-party arbitrator is called in to make a ruling that’s binding. The process is controversial, and a flurry of lawsuits from providers have challenged it.
The new report, which updates an earlier analysis, examines data about disputed cases from all of 2023.
Of the 657,040 new cases filed in 2023, about 70% came from four private equity-funded organizations: Team Health, SCP Health, Radiology Partners, and Envision, which each provide physician services.
About half of the 2023 cases were from just four states: Texas, Florida, Tennessee, and Georgia. The report says the four organizations are especially active in those states. In contrast, Connecticut, Maryland, Massachusetts, and Washington state each had just 1500 or fewer cases filed last year.
Health plans challenged a third of cases as ineligible, and 22% of all resolved cases were deemed ineligible.
Providers won 80% of resolved challenges in 2023, although it’s not clear how much money they reaped. Still, it’s clear that “in the vast majority of the cases, insurers have to pay larger amounts to the provider,” Dr. Hoadley said.
Radiologists made a median of at least 500% of the in-network rate in their cases. Surgeons and neurologists made even more money — a median of at least 800% of the in-network rate. Overall, providers made 322%-350% of in-network rates, depending on the quarter.
Dr. Hoadley cautioned that only a small percentage of medical payments are disputed. In those cases, “the amount that the insurer offers is accepted, and that’s the end of the story.”
Why are the providers often reaping much more than typical payments for in-network services? It’s “really hard to know,” Dr. Hoadley said. But one factor, he said, may be the fact that providers are able to offer evidence challenging that amounts that insurers say they paid previously: “Hey, when we were in network, we were paid this much.”
It’s not clear whether the dispute-and-arbitration system will cost insurers — and patients — more in the long run. The Congressional Budget Office actually thought the No Surprises Act might lower the growth of premiums slightly and save the federal government money, Dr. Hoadley said, but that could potentially not happen. The flood of litigation also contributes to uncertainty, he said.
Alan Sager, PhD, professor of Health Law, Policy, and Management at Boston University School of Public Health, told this news organization that premiums are bound to rise as insurers react to higher costs. He also expects that providers will question the value of being in-network. “If you’re out-of-network and can obtain much higher payments, why would any doctor or hospital remain in-network, especially since they don’t lose out on patient volume?”
Why are provider groups owned by private equity firms so aggressive at challenging health plans? Loren Adler, a fellow and associate director of the Brookings Institution’s Center on Health Policy, told this news organization that these companies play large roles in fields affected by the No Surprises Act. These include emergency medicine, radiology, and anesthesiology, said Mr. Adler, who’s also studied the No Surprises Act’s dispute/arbitration system.
Mr. Adler added that larger companies “are better suited to deal with technical complexities of this process and spend the sort of upfront money to go through it.”
In the big picture, Mr. Adler said, the new study “raises question of whether Congress at some point wants to try to basically bring prices from the arbitration process back in line with average in-network prices.”
The study was funded by the Commonwealth Fund and Arnold Ventures. Dr. Hoadley, Dr. Sager, and Mr. Adler had no disclosures.
A version of this article first appeared on Medscape.com.
Could Baseline MRIs Reshape Prostate Cancer Risk Assessment?
The multicenter, real-world trial showed that men with low-risk or favorable intermediate-risk disease who had higher Prostate Imaging Reporting and Data System (PI-RADS) scores at baseline were more likely to be reclassified with more aggressive disease on a future biopsy, wrote lead author Kiran R. Nandalur, MD and colleagues. The study was published in The Journal of Urology.
This means that without MRI, some cases of prostate cancer are being labeled as lower-risk than they actually are.
The investigators noted that MRI is increasingly being used to choose patients who are appropriate for active surveillance instead of treatment, but related clinical data are scarce.
Although PI-RADS is the preferred metric for characterizing prostate tumors via MRI, “most previous studies on the prognostic implications of baseline PI-RADS score included smaller populations from academic centers, limited inclusion of clinical and pathologic data into models, and/or [are] ambiguous on the implications of PI-RADS score,” they wrote.
These knowledge gaps prompted the present study.
How Were Baseline MRI Findings Related to Prostate Cancer Disease Risk?
The dataset included 1491 men with prostate cancer that was diagnosed at 46 hospital-based, academic, or private practice urology groups. All had low-risk or favorable intermediate-risk disease and had undergone MRI within 6 months before or after initial biopsy, along with enrollment in active surveillance.
“A novel aspect of this study was that the MRIs were not read by dedicated prostate MRI experts at academic institutions, but rather a mix of community and academic radiologists,” Dr. Nandalur, medical director of Corewell Health East Radiology, Royal Oak, Michigan, said in an interview.
After traditional risk factors were accounted for, baseline PI-RADS (four or more lesions) was significantly associated with increased likelihood of biopsy reclassification to high-grade prostate cancer on surveillance biopsy (hazard ratio, 2.3; 95% CI 1.6-3.2; P < .001).
“These patients with suspicious lesions on their initial MRI were more than twice as likely to have higher-grade disease within 5 years,” Nandalur noted. “This result was not only seen in the low-risk group but also in the favorable intermediate-risk group, which hasn’t been shown before.”
Grade group 2 vs 1 and increasing age were also associated with significantly increased risk for reclassification to a more aggressive cancer type.
How Might These Findings Improve Outcomes in Patients With Prostate Cancer?
Currently, 60%-70% of patients with low-risk disease choose active surveillance over immediate treatment, whereas 20% with favorable intermediate-risk disease choose active surveillance, according to Dr. Nandalur.
For low-risk patients, PI-RADS score is unlikely to change this decision, although surveillance intervals could be adjusted in accordance with risk. More notably, those with favorable intermediate-risk disease may benefit from considering PI-RADS score when choosing between active surveillance and immediate treatment.
“Most of the management strategies for prostate cancer are based on just your lab values and your pathology,” Dr. Nandalur said, “but this study shows that maybe we should start taking MRI into account — into the general paradigm of management of prostate cancer.”
Ideally, he added, prospective studies will confirm these findings, although such studies can be challenging to perform and similar data have historically been sufficient to reshape clinical practice.
“We are hoping that [baseline PI-RADS score] will be adopted into the NCCN [National Comprehensive Cancer Network] guidelines,” Dr. Nandalur said.
How Likely Are These Findings to Reshape Clinical Practice?
“The study’s large, multicenter cohort and its focus on the prognostic value of baseline MRI in active surveillance make it a crucial contribution to the field, providing evidence that can potentially refine patient management strategies in clinical practice,” Ismail Baris Turkbey, MD, FSAR, head of MRI Section, Molecular Imaging Branch, National Cancer Institute, Rockville, Maryland, said in a written comment.
“The findings from this study are likely to have a significant impact on clinical practice and potentially influence future guidelines in the management of localized prostate cancer, particularly in the context of active surveillance,” Dr. Turkbey said. “MRI, already a commonly used imaging modality in prostate cancer management, may become an even more integral part of the initial assessment and ongoing monitoring of patients with low or favorable-intermediate risk prostate cancer.”
Dr. Turkbey noted several strengths of the study.
First, the size and the diversity of the cohort, along with the variety of treatment centers, support generalizability of findings. Second, the study pinpoints a “critical aspect” of active surveillance by uncovering the link between baseline MRI findings and later risk reclassification. Finally, the study also showed that increasing age was associated with higher likelihood of risk reclassification, “further emphasizing the need for personalized risk assessment” among these patients.
What Were Some Limitations of This Study?
“One important limitation is the lack of inter-reader agreement for PI-RADS evaluations for baseline MRIs,” Dr. Turkbey said. “Variation of PI-RADS is quite known, and centralized evaluations could have made this study stronger. Same applies for centralized quality evaluation of MRIs using The Prostate Imaging Quality (PI-QUAL) score. These items are difficult to do in a multicenter prospective data registry, and maybe authors will consider including these additional analyses in their future work.”
How Does This New Approach to Prostate Cancer Risk Assessment Compare With Recent Advances in AI-Based Risk Assessment?
Over the past few years, artificial intelligence (AI)–assisted risk assessment in prostate cancer has been gaining increasing attention. Recently, for example, Artera, a self-styled “precision medicine company,” released the first AI tool to help patients choose between active surveillance and active treatment on the basis of analysis of digital pathology images.
When asked to compare this approach with the methods used in the present study, Dr. Nandalur called the AI model “a step forward” but noted that it still relies on conventional risk criteria.
“Our data show imaging with MRI has independent prognostic information for prostate cancer patients considering active surveillance, over and above these traditional factors,” he said. “Moreover, this predictive ability of MRI was seen in low and favorable intermediate risk groups, so the additive value is broad.”
Still, he predicted that the future will not involve a binary choice, but a combination approach.
“The exciting aspect is that MRI results can eventually be added to this novel AI model and further improve prediction models for patients,” Dr. Nandalur said. “The combination of recent AI models and MRI will likely represent the future paradigm for prostate cancer patients considering active surveillance versus immediate treatment.”
The study was supported by Blue Cross and Blue Shield of Michigan. The investigators and Dr. Turkbey reported no conflicts of interest.
A version of this article first appeared on Medscape.com.
FROM THE JOURNAL OF UROLOGY
Cancer Treatment 101: A Primer for Non-Oncologists
The remaining 700,000 or so often proceed to chemotherapy either immediately or upon cancer recurrence, spread, or newly recognized metastases. “Cures” after that point are rare.
I’m speaking in generalities, understanding that each cancer and each patient is unique.
Chemotherapy
Chemotherapy alone can cure a small number of cancer types. When added to radiation or surgery, chemotherapy can help to cure a wider range of cancer types. As an add-on, chemotherapy can extend the length and quality of life for many patients with cancer. Since chemotherapy is by definition “toxic,” it can also shorten the duration or harm the quality of life and provide false hope. The Table summarizes what chemotherapy can and cannot achieve in selected cancer types.
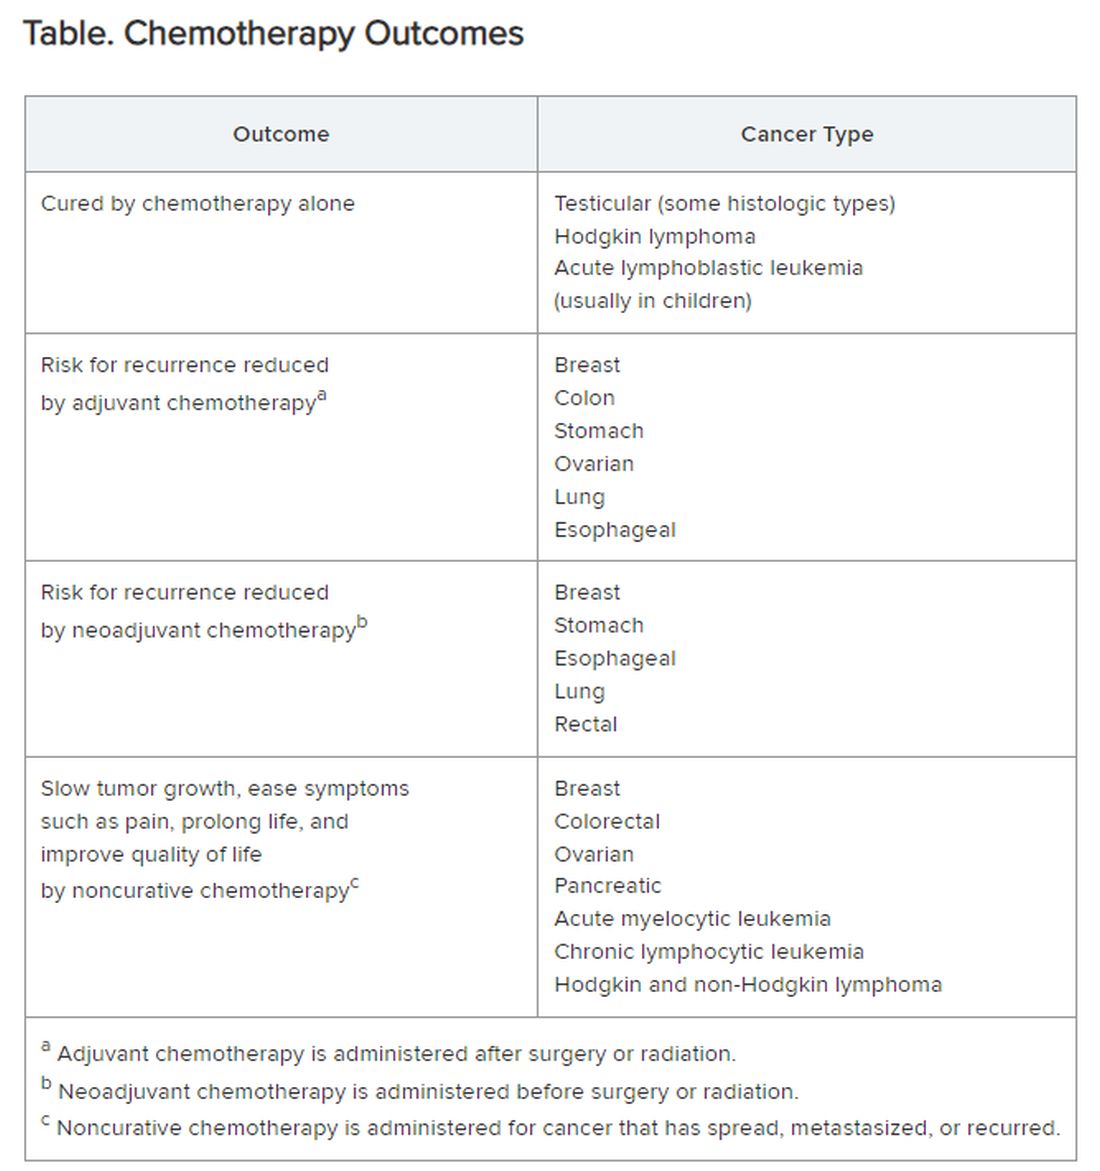
Careful, compassionate communication between patient and physician is key. Goals and expectations must be clearly understood.
Organized chemotherapeutic efforts are further categorized as first line, second line, and third line.
First-line treatment. The initial round of recommended chemotherapy for a specific cancer. It is typically considered the most effective treatment for that type and stage of cancer on the basis of current research and clinical trials.
Second-line treatment. This is the treatment used if the first-line chemotherapy doesn’t work as desired. Reasons to switch to second-line chemo include:
- Lack of response (the tumor failed to shrink).
- Progression (the cancer may have grown or spread further).
- Adverse side effects were too severe to continue.
The drugs used in second-line chemo will typically be different from those used in first line, sometimes because cancer cells can develop resistance to chemotherapy drugs over time. Moreover, the goal of second-line chemo may differ from that of first-line therapy. Rather than chiefly aiming for a cure, second-line treatment might focus on slowing cancer growth, managing symptoms, or improving quality of life. Unfortunately, not every type of cancer has a readily available second-line option.
Third-line treatment. Third-line options come into play when both the initial course of chemo (first line) and the subsequent treatment (second line) have failed to achieve remission or control the cancer’s spread. Owing to the progressive nature of advanced cancers, patients might not be eligible or healthy enough for third-line therapy. Depending on cancer type, the patient’s general health, and response to previous treatments, third-line options could include:
- New or different chemotherapy drugs compared with prior lines.
- Surgery to debulk the tumor.
- Radiation for symptom control.
- Targeted therapy: drugs designed to target specific vulnerabilities in cancer cells.
- Immunotherapy: agents that help the body’s immune system fight cancer cells.
- Clinical trials testing new or investigational treatments, which may be applicable at any time, depending on the questions being addressed.
The goals of third-line therapy may shift from aiming for a cure to managing symptoms, improving quality of life, and potentially slowing cancer growth. The decision to pursue third-line therapy involves careful consideration by the doctor and patient, weighing the potential benefits and risks of treatment considering the individual’s overall health and specific situation.
It’s important to have realistic expectations about the potential outcomes of third-line therapy. Although remission may be unlikely, third-line therapy can still play a role in managing the disease.
Navigating advanced cancer treatment is very complex. The patient and physician must together consider detailed explanations and clarifications to set expectations and make informed decisions about care.
Interventions to Consider Earlier
In traditional clinical oncology practice, other interventions are possible, but these may not be offered until treatment has reached the third line:
- Molecular testing.
- Palliation.
- Clinical trials.
- Innovative testing to guide targeted therapy by ascertaining which agents are most likely (or not likely at all) to be effective.
I would argue that the patient’s interests are better served by considering and offering these other interventions much earlier, even before starting first-line chemotherapy.
Molecular testing. The best time for molecular testing of a new malignant tumor is typically at the time of diagnosis. Here’s why:
- Molecular testing helps identify specific genetic mutations in the cancer cells. This information can be crucial for selecting targeted therapies that are most effective against those specific mutations. Early detection allows for the most treatment options. For example, for non–small cell lung cancer, early is best because treatment and outcomes may well be changed by test results.
- Knowing the tumor’s molecular makeup can help determine whether a patient qualifies for clinical trials of new drugs designed for specific mutations.
- Some molecular markers can offer information about the tumor’s aggressiveness and potential for metastasis so that prognosis can be informed.
Molecular testing can be a valuable tool throughout a cancer patient’s journey. With genetically diverse tumors, the initial biopsy might not capture the full picture. Molecular testing of circulating tumor DNA can be used to monitor a patient’s response to treatment and detect potential mutations that might arise during treatment resistance. Retesting after metastasis can provide additional information that can aid in treatment decisions.
Palliative care. The ideal time to discuss palliative care with a patient with cancer is early in the diagnosis and treatment process. Palliative care is not the same as hospice care; it isn’t just about end-of-life. Palliative care focuses on improving a patient’s quality of life throughout cancer treatment. Palliative care specialists can address a wide range of symptoms a patient might experience from cancer or its treatment, including pain, fatigue, nausea, and anxiety.
Early discussions allow for a more comprehensive care plan. Open communication about all treatment options, including palliative care, empowers patients to make informed decisions about their care goals and preferences.
Specific situations where discussing palliative care might be appropriate are:
- Soon after a cancer diagnosis.
- If the patient experiences significant side effects from cancer treatment.
- When considering different treatment options, palliative care can complement those treatments.
- In advanced stages of cancer, to focus on comfort and quality of life.
Clinical trials. Participation in a clinical trial to explore new or investigational treatments should always be considered.
In theory, clinical trials should be an option at any time in the patient’s course. But the organized clinical trial experience may not be available or appropriate. Then, the individual becomes a de facto “clinical trial with an n of 1.” Read this brief open-access blog post at Cancer Commons to learn more about that circumstance.
Innovative testing. The best choice of chemotherapeutic or targeted therapies is often unclear. The clinician is likely to follow published guidelines, often from the National Comprehensive Cancer Network.
These are evidence based and driven by consensus of experts. But guideline-recommended therapy is not always effective, and weeks or months can pass before this ineffectiveness becomes apparent. Thus, many researchers and companies are seeking methods of testing each patient’s specific cancer to determine in advance, or very quickly, whether a particular drug is likely to be effective.
Read more about these leading innovations:
SAGE Oncotest: Entering the Next Generation of Tailored Cancer Treatment
Alibrex: A New Blood Test to Reveal Whether a Cancer Treatment is Working
PARIS Test Uses Lab-Grown Mini-Tumors to Find a Patient’s Best Treatment
Using Live Cells from Patients to Find the Right Cancer Drug
Other innovative therapies under investigation could even be agnostic to cancer type:
Treating Pancreatic Cancer: Could Metabolism — Not Genomics — Be the Key?
High-Energy Blue Light Powers a Promising New Treatment to Destroy Cancer Cells
All-Clear Follow-Up: Hydrogen Peroxide Appears to Treat Oral and Skin Lesions
Cancer is a tough nut to crack. Many people and organizations are trying very hard. So much is being learned. Some approaches will be effective. We can all hope.
Dr. Lundberg, editor in chief, Cancer Commons, has disclosed no relevant financial relationships.
A version of this article appeared on Medscape.com.
The remaining 700,000 or so often proceed to chemotherapy either immediately or upon cancer recurrence, spread, or newly recognized metastases. “Cures” after that point are rare.
I’m speaking in generalities, understanding that each cancer and each patient is unique.
Chemotherapy
Chemotherapy alone can cure a small number of cancer types. When added to radiation or surgery, chemotherapy can help to cure a wider range of cancer types. As an add-on, chemotherapy can extend the length and quality of life for many patients with cancer. Since chemotherapy is by definition “toxic,” it can also shorten the duration or harm the quality of life and provide false hope. The Table summarizes what chemotherapy can and cannot achieve in selected cancer types.
Careful, compassionate communication between patient and physician is key. Goals and expectations must be clearly understood.
Organized chemotherapeutic efforts are further categorized as first line, second line, and third line.
First-line treatment. The initial round of recommended chemotherapy for a specific cancer. It is typically considered the most effective treatment for that type and stage of cancer on the basis of current research and clinical trials.
Second-line treatment. This is the treatment used if the first-line chemotherapy doesn’t work as desired. Reasons to switch to second-line chemo include:
- Lack of response (the tumor failed to shrink).
- Progression (the cancer may have grown or spread further).
- Adverse side effects were too severe to continue.
The drugs used in second-line chemo will typically be different from those used in first line, sometimes because cancer cells can develop resistance to chemotherapy drugs over time. Moreover, the goal of second-line chemo may differ from that of first-line therapy. Rather than chiefly aiming for a cure, second-line treatment might focus on slowing cancer growth, managing symptoms, or improving quality of life. Unfortunately, not every type of cancer has a readily available second-line option.
Third-line treatment. Third-line options come into play when both the initial course of chemo (first line) and the subsequent treatment (second line) have failed to achieve remission or control the cancer’s spread. Owing to the progressive nature of advanced cancers, patients might not be eligible or healthy enough for third-line therapy. Depending on cancer type, the patient’s general health, and response to previous treatments, third-line options could include:
- New or different chemotherapy drugs compared with prior lines.
- Surgery to debulk the tumor.
- Radiation for symptom control.
- Targeted therapy: drugs designed to target specific vulnerabilities in cancer cells.
- Immunotherapy: agents that help the body’s immune system fight cancer cells.
- Clinical trials testing new or investigational treatments, which may be applicable at any time, depending on the questions being addressed.
The goals of third-line therapy may shift from aiming for a cure to managing symptoms, improving quality of life, and potentially slowing cancer growth. The decision to pursue third-line therapy involves careful consideration by the doctor and patient, weighing the potential benefits and risks of treatment considering the individual’s overall health and specific situation.
It’s important to have realistic expectations about the potential outcomes of third-line therapy. Although remission may be unlikely, third-line therapy can still play a role in managing the disease.
Navigating advanced cancer treatment is very complex. The patient and physician must together consider detailed explanations and clarifications to set expectations and make informed decisions about care.
Interventions to Consider Earlier
In traditional clinical oncology practice, other interventions are possible, but these may not be offered until treatment has reached the third line:
- Molecular testing.
- Palliation.
- Clinical trials.
- Innovative testing to guide targeted therapy by ascertaining which agents are most likely (or not likely at all) to be effective.
I would argue that the patient’s interests are better served by considering and offering these other interventions much earlier, even before starting first-line chemotherapy.
Molecular testing. The best time for molecular testing of a new malignant tumor is typically at the time of diagnosis. Here’s why:
- Molecular testing helps identify specific genetic mutations in the cancer cells. This information can be crucial for selecting targeted therapies that are most effective against those specific mutations. Early detection allows for the most treatment options. For example, for non–small cell lung cancer, early is best because treatment and outcomes may well be changed by test results.
- Knowing the tumor’s molecular makeup can help determine whether a patient qualifies for clinical trials of new drugs designed for specific mutations.
- Some molecular markers can offer information about the tumor’s aggressiveness and potential for metastasis so that prognosis can be informed.
Molecular testing can be a valuable tool throughout a cancer patient’s journey. With genetically diverse tumors, the initial biopsy might not capture the full picture. Molecular testing of circulating tumor DNA can be used to monitor a patient’s response to treatment and detect potential mutations that might arise during treatment resistance. Retesting after metastasis can provide additional information that can aid in treatment decisions.
Palliative care. The ideal time to discuss palliative care with a patient with cancer is early in the diagnosis and treatment process. Palliative care is not the same as hospice care; it isn’t just about end-of-life. Palliative care focuses on improving a patient’s quality of life throughout cancer treatment. Palliative care specialists can address a wide range of symptoms a patient might experience from cancer or its treatment, including pain, fatigue, nausea, and anxiety.
Early discussions allow for a more comprehensive care plan. Open communication about all treatment options, including palliative care, empowers patients to make informed decisions about their care goals and preferences.
Specific situations where discussing palliative care might be appropriate are:
- Soon after a cancer diagnosis.
- If the patient experiences significant side effects from cancer treatment.
- When considering different treatment options, palliative care can complement those treatments.
- In advanced stages of cancer, to focus on comfort and quality of life.
Clinical trials. Participation in a clinical trial to explore new or investigational treatments should always be considered.
In theory, clinical trials should be an option at any time in the patient’s course. But the organized clinical trial experience may not be available or appropriate. Then, the individual becomes a de facto “clinical trial with an n of 1.” Read this brief open-access blog post at Cancer Commons to learn more about that circumstance.
Innovative testing. The best choice of chemotherapeutic or targeted therapies is often unclear. The clinician is likely to follow published guidelines, often from the National Comprehensive Cancer Network.
These are evidence based and driven by consensus of experts. But guideline-recommended therapy is not always effective, and weeks or months can pass before this ineffectiveness becomes apparent. Thus, many researchers and companies are seeking methods of testing each patient’s specific cancer to determine in advance, or very quickly, whether a particular drug is likely to be effective.
Read more about these leading innovations:
SAGE Oncotest: Entering the Next Generation of Tailored Cancer Treatment
Alibrex: A New Blood Test to Reveal Whether a Cancer Treatment is Working
PARIS Test Uses Lab-Grown Mini-Tumors to Find a Patient’s Best Treatment
Using Live Cells from Patients to Find the Right Cancer Drug
Other innovative therapies under investigation could even be agnostic to cancer type:
Treating Pancreatic Cancer: Could Metabolism — Not Genomics — Be the Key?
High-Energy Blue Light Powers a Promising New Treatment to Destroy Cancer Cells
All-Clear Follow-Up: Hydrogen Peroxide Appears to Treat Oral and Skin Lesions
Cancer is a tough nut to crack. Many people and organizations are trying very hard. So much is being learned. Some approaches will be effective. We can all hope.
Dr. Lundberg, editor in chief, Cancer Commons, has disclosed no relevant financial relationships.
A version of this article appeared on Medscape.com.
Physicians Lament Over Reliance on Relative Value Units: Survey
Most physicians oppose the way standardized relative value units (RVUs) are used to determine performance and compensation, according to Medscape’s 2024 Physicians and RVUs Report. About 6 in 10 survey respondents were unhappy with how RVUs affected them financially, while 7 in 10 said RVUs were poor measures of productivity.
The report analyzed 2024 survey data from 1005 practicing physicians who earn RVUs.
“I’m already mad that the medical field is controlled by health insurers and what they pay and authorize,” said an anesthesiologist in New York. “Then [that approach] is transferred to medical offices and hospitals, where physicians are paid by RVUs.”
Most physicians surveyed produced between 4000 and 8000 RVUs per year. Roughly one in six were high RVU generators, generating more than 10,000 annually.
In most cases, the metric influences earning potential — 42% of doctors surveyed said RVUs affect their salaries to some degree. One quarter said their salary was based entirely on RVUs. More than three fourths of physicians who received performance bonuses said they must meet RVU targets to do so.
“The current RVU system encourages unnecessary procedures, hurting patients,” said an orthopedic surgeon in Maine.
Nearly three fourths of practitioners surveyed said they occasionally to frequently felt pressure to take on more patients as a result of this system.
“I know numerous primary care doctors and specialists who have been forced to increase patient volume to meet RVU goals, and none is happy about it,” said Alok Patel, MD, a pediatric hospitalist with Stanford Hospital in Palo Alto, California. “Plus, patients are definitely not happy about being rushed.”
More than half of respondents said they occasionally or frequently felt compelled by their employer to use higher-level coding, which interferes with a physician’s ethical responsibility to the patient, said Arthur L. Caplan, PhD, a bioethicist at NYU Langone Medical Center in New York City.
“Rather than rewarding excellence or good outcomes, you’re kind of rewarding procedures and volume,” said Dr. Caplan. “It’s more than pressure; it’s expected.”
Nearly 6 in 10 physicians said that the method for calculating reimbursements was unfair. Almost half said that they weren’t happy with how their workplace uses RVUs.
A few respondents said that their RVU model, which is often based on what Dr. Patel called an “overly complicated algorithm,” did not account for the time spent on tasks or the fact that some patients miss appointments. RVUs also rely on factors outside the control of a physician, such as location and patient volume, said one doctor.
The model can also lower the level of care patients receive, Dr. Patel said.
“I know primary care doctors who work in RVU-based systems and simply cannot take the necessary time — even if it’s 30-45 minutes — to thoroughly assess a patient, when the model forces them to take on 15-minute encounters.”
Finally, over half of clinicians said alternatives to the RVU system would be more effective, and 77% suggested including qualitative data. One respondent recommended incorporating time spent doing paperwork and communicating with patients, complexity of conditions, and medication management.
A version of this article first appeared on Medscape.com.
FDA OKs First-Line Lazertinib With Amivantamab for NSCLC
This marks the first approval for lazertinib. Amivantamab was initially approved by the FDA in 2021 and carries a few indications for locally advanced or metastatic NSCLC. Both drugs are manufactured by Janssen Biotech Inc.
“Patients will now have the option of a potential new first-line standard of care with significant clinical benefits over osimertinib,” study investigator Alexander Spira, MD, PhD, director, Virginia Cancer Specialists Research Institute, said in a news release from Johnson & Johnson .
Lazertinib is an oral, highly selective, third-generation EGFR tyrosine kinase inhibitor that can penetrate the brain and amivantamab is a bispecific antibody targeting EGFR and MET.
The approval was based on results from the phase 3 MARIPOSA trial, which showed that the combination reduced the risk of disease progression or death by 30% compared with osimertinib.
The MARIPOSA trial randomly allocated 1074 patients with exon 19 deletion or exon 21 L858R substitution mutation-positive locally advanced or metastatic NSCLC and no prior systemic therapy for advanced disease to amivantamab plus lazertinib, osimertinib alone, or lazertinib alone.
Lazertinib plus amivantamab demonstrated a statistically significant improvement in progression-free survival compared with osimertinib (hazard ratio, 0.70; P < .001). Median progression-free survival was 23.7 months with the combination vs 16.6 months osimertinib alone and 18.5 months with lazertinib alone.
The median duration of response was 9 months longer with the combination compared with osimertinib (25.8 months vs 16.7 months).
The most common adverse reactions (≥ 20%) were rash, nail toxicity, infusion-related reactions (amivantamab), musculoskeletal pain, edema, stomatitis, venous thromboembolism, paresthesia, fatigue, diarrhea, constipation, COVID-19, hemorrhage, dry skin, decreased appetite, pruritus, nausea, and ocular toxicity.
“A serious safety signal of venous thromboembolic events was observed with lazertinib in combination with amivantamab and prophylactic anticoagulation should be administered for the first four months of therapy,” the FDA noted in a statement announcing the approval.
Results from MARIPOSA were first presented at the European Society for Medical Oncology 2023 Congress and published in The New England Journal of Medicine in June. Longer-term follow-up data from MARIPOSA will be presented at the International Association for the Study of Lung Cancer 2024 World Congress on Lung Cancer in September.
A version of this article appeared on Medscape.com.
Do New Blood Tests for Cancer Meet the Right Standards?
Biotech startups worldwide are rushing to market screening tests that they claim can detect various cancers in early stages with just a few drops of blood. The tests allegedly will simplify cancer care by eliminating tedious scans, scopes, and swabs at the doctor’s office.
The promise of these early detection tests is truly “enticing,” Hilary A. Robbins, PhD, from the International Agency for Research on Cancer of the World Health Organization in Lyon, France, said in an interview.
In an opinion article in The New England Journal of Medicine, she emphasized that the new cancer tests are much less cumbersome than traditional screening strategies for individual cancers. Moreover, they could enable the early detection of dozens of cancer types for which no screening has been available so far.
Meeting the Criteria
The problem is that these tests have not met the strict criteria typically required for traditional cancer screening tests. To be considered for introduction as a screening procedure, a test usually needs to meet the following four minimum requirements:
- The disease that the test screens for must have a presymptomatic form.
- The screening test must be able to identify this presymptomatic disease.
- Treating the disease in the presymptomatic phase improves prognosis (specifically, it affects cancer-specific mortality in a randomized controlled trial).
- The screening test is feasible, and the benefits outweigh potential risks.
“The new blood tests for multiple cancers have so far only met the second criteria, showing they can detect presymptomatic cancer,” Dr. Robbins wrote.
The next step would be to demonstrate that they affect cancer-specific mortality. “But currently, commercial interests seem to be influencing the evidence standards for these cancer tests,” said Dr. Robbins.
Inappropriate Endpoints?
Some proponents of such tests argue that, unlike for previous cancer screening procedures, initial approval should not depend on the endpoint of cancer-specific mortality. It would take too long to gather sufficient outcome data, and in the meantime, people would die, they argue.
Eric A. Klein, MD, from the Glickman Urological and Kidney Institute in Cleveland, Ohio, and colleagues advocate for alternative endpoints such as the incidence of late-stage cancer in an article published in Cancer Epidemiology, Biomarkers & Prevention.
“The concept would be,” they wrote, “that a negative signal would not indicate a mortality benefit, leading to the study being stopped. A positive signal, on the other hand, could result in provisional approval until mortality data and real-world evidence of effectiveness are available. This would resemble the accelerated approval of new cancer drugs, which often is based on progression-free survival until there postmarketing data on overall survival emerge.”
Dr. Klein is also employed at the US biotech start-up Grail, which developed the Galleri test, which is one of the best-known and most advanced cancer screening tests. The Galleri test uses cell-free DNA and machine learning to detect a common cancer signal in more than 50 cancer types and predict the origin of the cancer signal. Consumers in the United States can already order and perform the test.
An NHS Study
Arguments for different endpoints apparently resonated with the United Kingdom’s National Health Service (NHS). Three years ago, they initiated the Galleri study, a large randomized controlled trial to assess the effectiveness of Grail’s cancer test. The primary endpoint was not cancer-specific mortality, but the incidence of stage III or IV cancer.
The results are expected in 2026. But recruitment was stopped after 140,000 participants were enrolled. The NHS reported that the initial results were not convincing enough to continue the trial. Exact numbers were not disclosed.
The Galleri study deviates from the standard randomized controlled trial design for cancer screening procedures not only in terms of the primary endpoint, but also in blinding. The only participants who were unblinded and informed of their test results are those in the intervention group with a positive cancer test.
False Security
This trial design encourages participants to undergo blood tests once per year. But according to Dr. Robbins, it prevents the exploration of the phenomenon of “false security,” which is a potential drawback of the new cancer tests.
“Women with a negative mammogram can reasonably assume that they probably do not have breast cancer. But individuals with a negative cancer blood test could mistakenly believe they cannot have any cancer at all. As a result, they may not undergo standard early detection screenings or seek medical help early enough for potential cancer symptoms,” said Dr. Robbins.
To assess the actual risk-benefit ratio of the Galleri test, participants must receive their test results, she said. “Under real-world conditions, benefits and risks can come from positive and negative results.”
Upcoming Trial
More illuminating results may come from a large trial planned by the National Cancer Institute in the United States. Several new cancer tests will be evaluated for their ability to reduce cancer-specific mortality. A pilot phase will start later in 2024. “This study may be the only one with sufficient statistical power to determine whether an approach based on these cancer tests can reduce cancer-specific mortality,” said Dr. Robbins.
For the new blood tests for multiple cancers, it is crucial that health authorities “set a high bar for a benefit,” she said. This, according to her, also means that they must show an effect on cancer-specific mortality before being introduced. “This evidence must come from studies in which commercial interests do not influence the design, execution, data management, or data analysis.”
This story was translated from the Medscape German edition using several editorial tools, including AI, as part of the process. Human editors reviewed this content before publication. A version appeared on Medscape.com.
Jeffrey Weber, MD, PhD, Giant of Cancer Care, Dies
Dr. Weber, a melanoma and cancer immunotherapy specialist, served as deputy director of the Laura and Isaac Perlmutter Cancer Center at New York University (NYU) Langone Medical Center in New York City. He also held positions as the Laura and Isaac Perlmutter Professor of Oncology in the Department of Medicine at the NYU Grossman School of Medicine, director of the Experimental Therapeutics Program, and co-leader of the Clinical Melanoma Program Board at NYU Langone Health.
Dr. Weber was a principal investigator on many studies, including pivotal clinical drug trials in melanoma and trials focused on managing autoimmune side effects from immunotherapy. He published more than 150 articles in top peer-reviewed journals.
For many years, Dr. Weber hosted the popular “Weber on Oncology” series of video contributions for Medscape Oncology, sharing updates and insights on noteworthy research and breakthroughs in melanoma.
“The Melanoma Research Alliance mourns the passing of Dr. Jeffrey S. Weber, a true pioneer in the field of cancer immunotherapy and an extraordinary leader in melanoma research. His contributions have forever changed the landscape of melanoma treatment, bringing groundbreaking advances from the lab into clinical practice and offering hope to countless patients,” the Melanoma Research Alliance posted on LinkedIn.
Many X users also shared condolences and memories of Dr. Weber, praising his numerous contributions and accomplishments.
“[Cancer Research Institute] mourns the loss of Dr. Jeffrey S. Weber ... [a]s an accomplished physician scientist, Dr. Weber drove advances in melanoma research, and played an active role in educating patients about the lifesaving power of immunotherapy,” the Cancer Research Institute posted.
A colleague noted that “[h]e was involved in the early days of cytokine and cell therapy and most recently led studies of personalized vaccines for melanoma patients. ... He was a great friend and colleague to many of us in the melanoma and immunotherapy field and we will remember him as a pioneer, thought leader and compassionate physician.”
A version of this article first appeared on Medscape.com.