User login
Ivermectin for COVID-19: Final nail in the coffin
Welcome to Impact Factor, your weekly dose of commentary on a new medical study. I’m Dr F. Perry Wilson of the Yale School of Medicine.
It began in a petri dish.
Ivermectin, a widely available, cheap, and well-tolerated drug on the WHO’s list of essential medicines for its critical role in treating river blindness, was shown to dramatically reduce the proliferation of SARS-CoV-2 virus in cell culture.
You know the rest of the story. Despite the fact that the median inhibitory concentration in cell culture is about 100-fold higher than what one can achieve with oral dosing in humans, anecdotal reports of miraculous cures proliferated.
Cohort studies suggested that people who got ivermectin did very well in terms of COVID outcomes.
A narrative started to develop online – one that is still quite present today – that authorities were suppressing the good news about ivermectin in order to line their own pockets and those of the execs at Big Pharma. The official Twitter account of the Food and Drug Administration clapped back, reminding the populace that we are not horses or cows.
And every time a study came out that seemed like the nail in the coffin for the so-called horse paste, it rose again, vampire-like, feasting on the blood of social media outrage.
The truth is that, while excitement for ivermectin mounted online, it crashed quite quickly in scientific circles. Most randomized trials showed no effect of the drug. A couple of larger trials which seemed to show dramatic effects were subsequently shown to be fraudulent.
Then the TOGETHER trial was published. The 1,400-patient study from Brazil, which treated outpatients with COVID-19, found no significant difference in hospitalization or ER visits – the primary outcome – between those randomized to ivermectin vs. placebo or another therapy.
But still, Brazil. Different population than the United States. Different health systems. And very different rates of Strongyloides infections (this is a parasite that may be incidentally treated by ivermectin, leading to improvement independent of the drug’s effect on COVID). We all wanted a U.S. trial.
And now we have it. ACTIV-6 was published Oct. 21 in JAMA, a study randomizing outpatients with COVID-19 from 93 sites around the United States to ivermectin or placebo.
A total of 1,591 individuals – median age 47, 60% female – with confirmed symptomatic COVID-19 were randomized from June 2021 to February 2022. About half had been vaccinated.
The primary outcome was straightforward: time to clinical recovery. The time to recovery, defined as having three symptom-free days, was 12 days in the ivermectin group and 13 days in the placebo group – that’s within the margin of error.
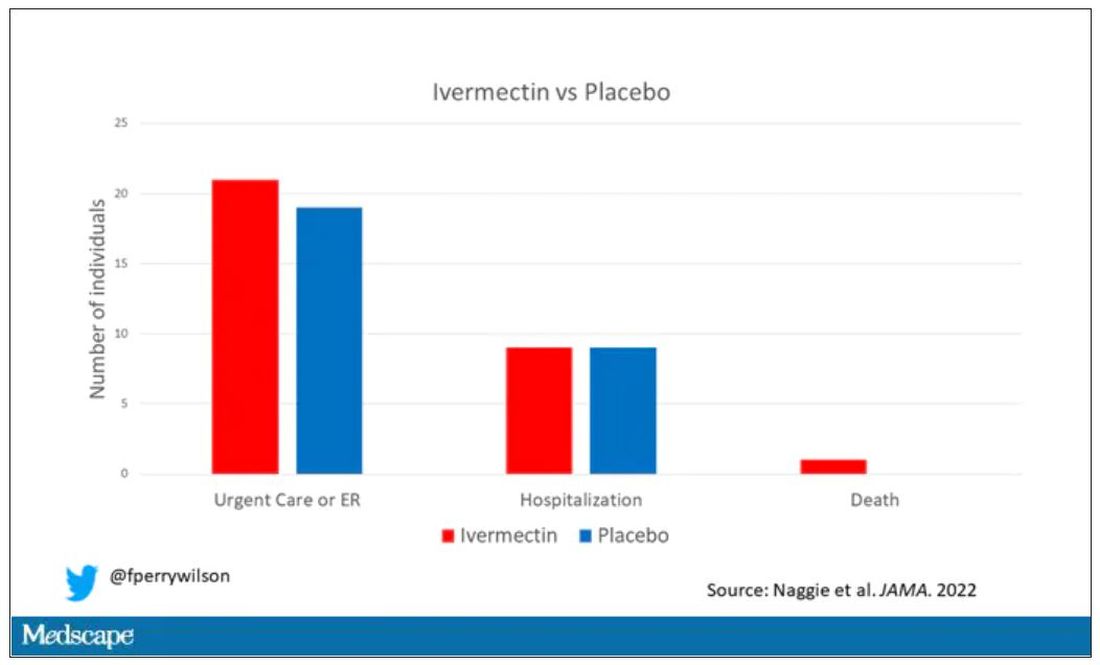
But overall, everyone in the trial did fairly well. Serious outcomes, like death, hospitalization, urgent care, or ER visits, occurred in 32 people in the ivermectin group and 28 in the placebo group. Death itself was rare – just one occurred in the trial, in someone receiving ivermectin.OK, are we done with this drug yet? Is this nice U.S. randomized trial enough to convince people that results from a petri dish don’t always transfer to humans, regardless of the presence or absence of an evil pharmaceutical cabal?
No, of course not. At this point, I can predict the responses. The dose wasn’t high enough. It wasn’t given early enough. The patients weren’t sick enough, or they were too sick. This is motivated reasoning, plain and simple. It’s not to say that there isn’t a chance that this drug has some off-target effects on COVID that we haven’t adequately measured, but studies like ACTIV-6 effectively rule out the idea that it’s a miracle cure. And you know what? That’s OK. Miracle cures are vanishingly rare. Most things that work in medicine work OK; they make us a little better, and we learn why they do that and improve on them, and try again and again. It’s not flashy; it doesn’t have that allure of secret knowledge. But it’s what separates science from magic.
F. Perry Wilson, MD, MSCE, is an associate professor of medicine and director of Yale’s Clinical and Translational Research Accelerator; his science communication work can be found in the Huffington Post, on NPR, and on Medscape.
A version of this article first appeared on Medscape.com.
Welcome to Impact Factor, your weekly dose of commentary on a new medical study. I’m Dr F. Perry Wilson of the Yale School of Medicine.
It began in a petri dish.
Ivermectin, a widely available, cheap, and well-tolerated drug on the WHO’s list of essential medicines for its critical role in treating river blindness, was shown to dramatically reduce the proliferation of SARS-CoV-2 virus in cell culture.
You know the rest of the story. Despite the fact that the median inhibitory concentration in cell culture is about 100-fold higher than what one can achieve with oral dosing in humans, anecdotal reports of miraculous cures proliferated.
Cohort studies suggested that people who got ivermectin did very well in terms of COVID outcomes.
A narrative started to develop online – one that is still quite present today – that authorities were suppressing the good news about ivermectin in order to line their own pockets and those of the execs at Big Pharma. The official Twitter account of the Food and Drug Administration clapped back, reminding the populace that we are not horses or cows.
And every time a study came out that seemed like the nail in the coffin for the so-called horse paste, it rose again, vampire-like, feasting on the blood of social media outrage.
The truth is that, while excitement for ivermectin mounted online, it crashed quite quickly in scientific circles. Most randomized trials showed no effect of the drug. A couple of larger trials which seemed to show dramatic effects were subsequently shown to be fraudulent.
Then the TOGETHER trial was published. The 1,400-patient study from Brazil, which treated outpatients with COVID-19, found no significant difference in hospitalization or ER visits – the primary outcome – between those randomized to ivermectin vs. placebo or another therapy.
But still, Brazil. Different population than the United States. Different health systems. And very different rates of Strongyloides infections (this is a parasite that may be incidentally treated by ivermectin, leading to improvement independent of the drug’s effect on COVID). We all wanted a U.S. trial.
And now we have it. ACTIV-6 was published Oct. 21 in JAMA, a study randomizing outpatients with COVID-19 from 93 sites around the United States to ivermectin or placebo.
A total of 1,591 individuals – median age 47, 60% female – with confirmed symptomatic COVID-19 were randomized from June 2021 to February 2022. About half had been vaccinated.
The primary outcome was straightforward: time to clinical recovery. The time to recovery, defined as having three symptom-free days, was 12 days in the ivermectin group and 13 days in the placebo group – that’s within the margin of error.
But overall, everyone in the trial did fairly well. Serious outcomes, like death, hospitalization, urgent care, or ER visits, occurred in 32 people in the ivermectin group and 28 in the placebo group. Death itself was rare – just one occurred in the trial, in someone receiving ivermectin.OK, are we done with this drug yet? Is this nice U.S. randomized trial enough to convince people that results from a petri dish don’t always transfer to humans, regardless of the presence or absence of an evil pharmaceutical cabal?
No, of course not. At this point, I can predict the responses. The dose wasn’t high enough. It wasn’t given early enough. The patients weren’t sick enough, or they were too sick. This is motivated reasoning, plain and simple. It’s not to say that there isn’t a chance that this drug has some off-target effects on COVID that we haven’t adequately measured, but studies like ACTIV-6 effectively rule out the idea that it’s a miracle cure. And you know what? That’s OK. Miracle cures are vanishingly rare. Most things that work in medicine work OK; they make us a little better, and we learn why they do that and improve on them, and try again and again. It’s not flashy; it doesn’t have that allure of secret knowledge. But it’s what separates science from magic.
F. Perry Wilson, MD, MSCE, is an associate professor of medicine and director of Yale’s Clinical and Translational Research Accelerator; his science communication work can be found in the Huffington Post, on NPR, and on Medscape.
A version of this article first appeared on Medscape.com.
Why the 5-day isolation period for COVID makes no sense
Welcome to Impact Factor, your weekly dose of commentary on a new medical study. I’m Dr. F. Perry Wilson of the Yale School of Medicine.
One of the more baffling decisions the CDC made during this pandemic was when they reduced the duration of isolation after a positive COVID test from 10 days to 5 days and did not require a negative antigen test to end isolation.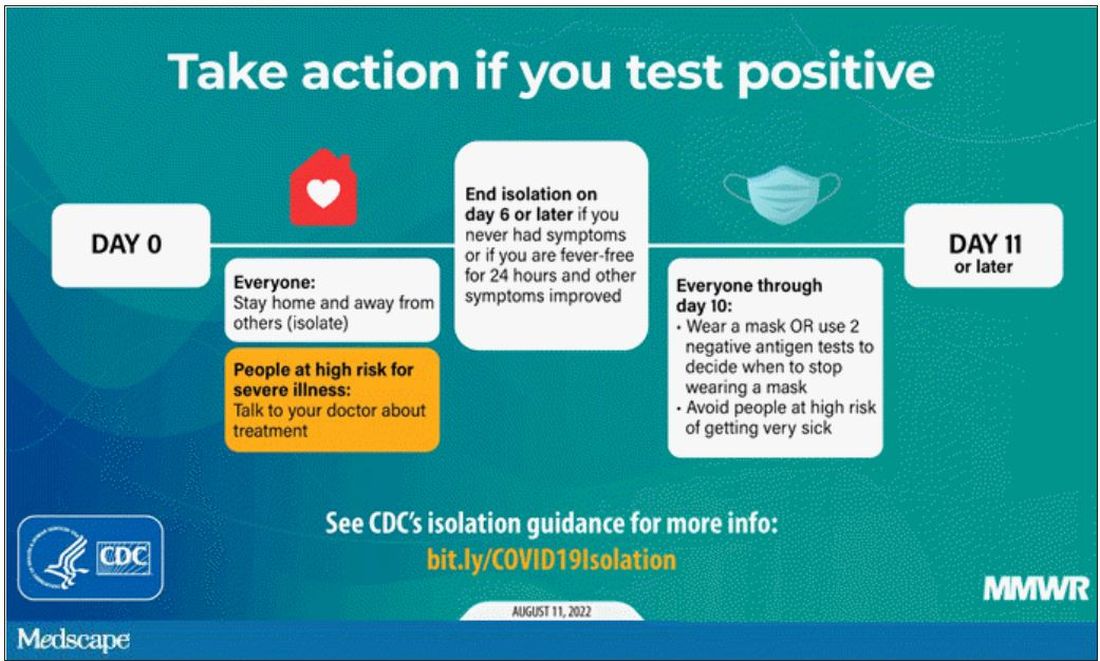
Multiple studies had suggested, after all, that positive antigen tests, while not perfect, were a decent proxy for infectivity. And if the purpose of isolation is to keep other community members safe, why not use a readily available test to know when it might be safe to go out in public again?
Also, 5 days just wasn’t that much time. Many individuals are symptomatic long after that point. Many people test positive long after that point. What exactly is the point of the 5-day isolation period?
We got some hard numbers this week to show just how good (or bad) an arbitrary-seeming 5-day isolation period is, thanks to this study from JAMA Network Open, which gives us a low-end estimate for the proportion of people who remain positive on antigen tests, which is to say infectious, after an isolation period.
This study estimates the low end of postisolation infectivity because of the study population: student athletes at an NCAA Division I school, which may or may not be Stanford. These athletes tested positive for COVID after having at least one dose of vaccine from January to May 2022. School protocol was to put the students in isolation for 7 days, at which time they could “test out” with a negative antigen test.
Put simply, these were healthy people. They were young. They were athletes. They were vaccinated. If anyone is going to have a brief, easy COVID course, it would be them. And they are doing at least a week of isolation, not 5 days.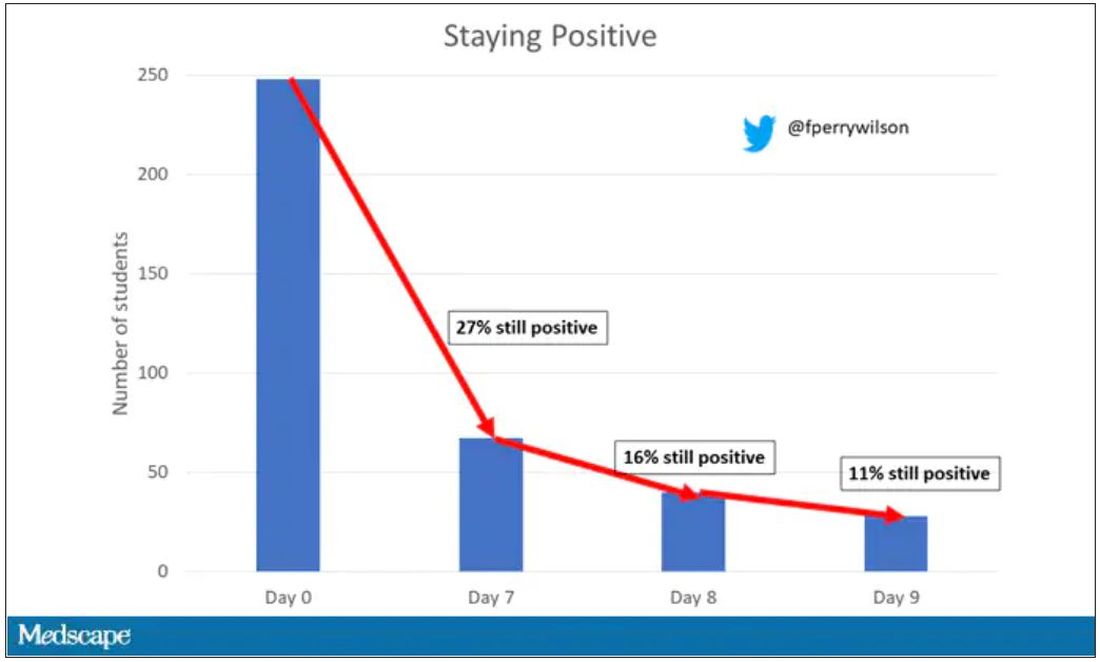
So – isolation for 7 days. Antigen testing on day 7. How many still tested positive? Of 248 individuals tested, 67 (27%) tested positive. One in four.
More than half of those positive on day 7 tested positive on day 8, and more than half of those tested positive again on day 9. By day 10, they were released from isolation without further testing.
So, right there .
There were some predictors of prolonged positivity.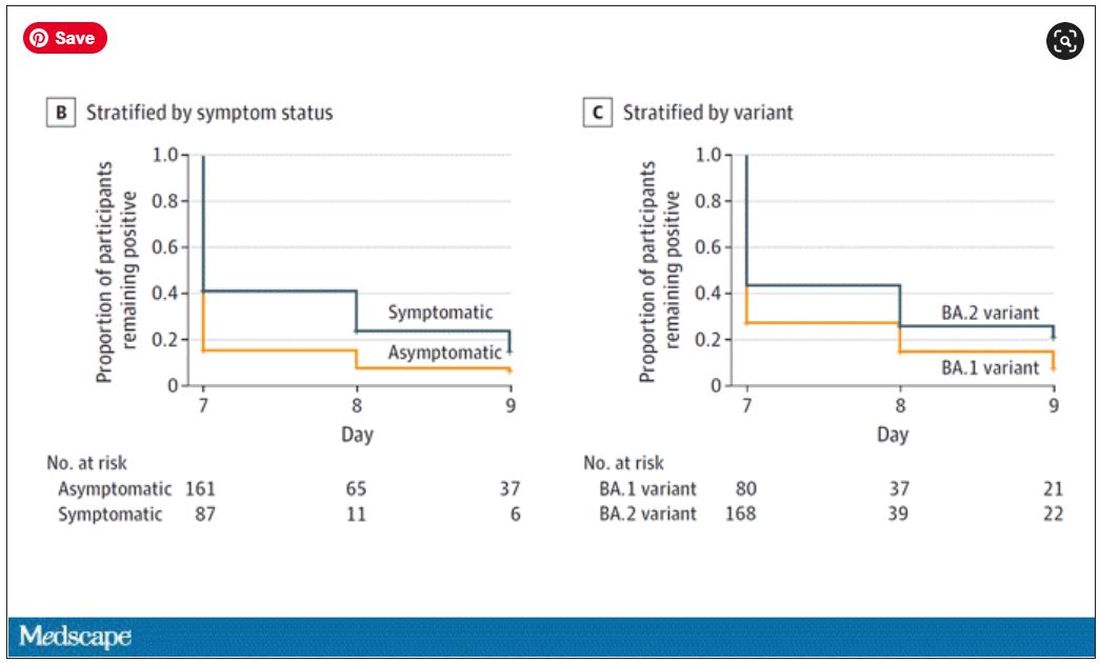
Symptomatic athletes were much more likely to test positive than asymptomatic athletes.
And the particular variant seemed to matter as well. In this time period, BA.1 and BA.2 were dominant, and it was pretty clear that BA.2 persisted longer than BA.1.
This brings me back to my original question: What is the point of the 5-day isolation period? On the basis of this study, you could imagine a guideline based on symptoms: Stay home until you feel better. You could imagine a guideline based on testing: Stay home until you test negative. A guideline based on time alone just doesn’t comport with the data. The benefit of policies based on symptoms or testing are obvious; some people would be out of isolation even before 5 days. But the downside, of course, is that some people would be stuck in isolation for much longer.
Maybe we should just say it. At this point, you could even imagine there being no recommendation at all – no isolation period. Like, you just stay home if you feel like you should stay home. I’m not entirely sure that such a policy would necessarily result in a greater number of infectious people out in the community.
In any case, as the arbitrariness of this particular 5-day isolation policy becomes more clear, the policy itself may be living on borrowed time.
F. Perry Wilson, MD, MSCE, is an associate professor of medicine and director of Yale’s Clinical and Translational Research Accelerator. His science communication work can be found in the Huffington Post, on NPR, and on Medscape. He tweets @fperrywilson and hosts a repository of his communication work at www.methodsman.com. He disclosed no relevant financial relationships.
A version of this article first appeared on Medscape.com.
Why people lie about COVID
This transcript has been edited for clarity.
Welcome to Impact Factor, your weekly dose of commentary on a new medical study. I’m Dr. F. Perry Wilson of the Yale School of Medicine.
Have you ever lied about COVID-19?
Before you get upset, before the “how dare you,” I want you to think carefully.
Did you have COVID-19 (or think you did) and not mention it to someone you were going to be with? Did you tell someone you were taking more COVID precautions than you really were? Did you tell someone you were vaccinated when you weren’t? Have you avoided getting a COVID test even though you knew you should have?
Researchers appreciated the fact that public health interventions in COVID are important but are only as good as the percentage of people who actually abide by them. So, they designed a survey to ask the questions that many people don’t want to hear the answer to.
A total of 1,733 participants – 80% of those invited – responded to the survey. By design, approximately one-third of respondents (477) had already had COVID, one-third (499) were vaccinated and not yet infected, and one-third (509) were unvaccinated and not yet infected.
Of those surveyed, 41.6% admitted that they lied about COVID or didn’t adhere to COVID guidelines - a conservative estimate, if you ask me.
Breaking down some of the results, about 20% of people who previously were infected with COVID said they didn’t mention it when meeting with someone. A similar number said they didn’t tell anyone when they were entering a public place. A bit more concerning to me, roughly 20% reported not disclosing their COVID-positive status when going to a health care provider’s office.
About 10% of those who had not been vaccinated reported lying about their vaccination status. That’s actually less than the 15% of vaccinated people who lied and told someone they weren’t vaccinated.
About 17% of people lied about the need to quarantine, and many more broke quarantine rules.
The authors tried to see if certain personal characteristics predicted people who were more likely to lie about COVID-19–related issues. Turns out there was only one thing that predicted honesty: age.
Older people were more honest about their COVID status and COVID habits. Other factors – gender, education, race, political affiliation, COVID-19 conspiracy beliefs, and where you got your COVID information – did not seem to make much of a difference. Why are older people more honest? Because older people take COVID more seriously. And they should; COVID is more severe in older people.
The problem arises, of course, because people who are at lower risk for COVID complications interact with people at higher risk – and in those situations, honesty matters more.
On the other hand, isn’t lying about COVID stuff inevitable? If you know that a positive test means you can’t go to work, and not going to work means you won’t get paid, might you not be more likely to lie about the test? Or not get the test at all?
The authors explored the reasons for dishonesty and they are fairly broad, ranging from the desire for life to feel normal (more than half of people who lied) to not believing that COVID was real (a whopping 30%). Some of the reasons for lying included:
- Wanted life to feel normal (50%).
- Freedom (45%).
- It’s no one’s business (40%).
- COVID isn’t real (30%).
In the end, though, we need to realize that public health recommendations are not going to be universally followed, and people may tell us they are following them when, in fact, they are not.
What this adds is another data point to a trend we’ve seen across the course of the pandemic, a shift from collective to individual responsibility. If you can’t be sure what others are doing in regard to COVID, you need to focus on protecting yourself. Perhaps that shift was inevitable. Doesn’t mean we have to like it.
A version of this article first appeared on Medscape.com.
F. Perry Wilson, MD, MSCE, is an associate professor of medicine and director of Yale’s Clinical and Translational Research Accelerator. His science communication work can be found in the Huffington Post, on NPR, and here on Medscape. He tweets @fperrywilson and hosts a repository of his communication work at www.methodsman.com.
The bionic pancreas triumphs in pivotal trial
This transcript of Impact Factor with F. Perry Wilson has been edited for clarity.
It was 100 years ago when Leonard Thompson, age 13, received a reprieve from a death sentence. Young master Thompson had type 1 diabetes, a disease that was uniformly fatal within months of diagnosis. But he received a new treatment, insulin, from a canine pancreas. He would live 13 more years before dying at age 26 of pneumonia.
The history of type 1 diabetes since that time has been a battle on two fronts: First, the search for a cause of and cure for the disease; second, the effort to make the administration of insulin safer, more reliable, and easier.
The past 2 decades have seen a technological revolution in type 1 diabetes care, with continuous glucose monitors decreasing the need for painful finger sticks, and insulin pumps allowing for more precise titration of doses.
The dream, of course, has been to combine those two technologies, continuous glucose monitoring and insulin pumps, to create so-called closed-loop systems – basically an artificial pancreas – that would obviate the need for any intervention on the part of the patient, save the occasional refilling of an insulin reservoir.
We aren’t there yet, but we are closer than ever.
Closed-loop systems for insulin delivery, like the Tandem Control IQ system, are a marvel of technology, but they are not exactly hands-free. Users need to dial in settings for their insulin usage, count carbohydrates at meals, and inform the system that they are about to eat those meals to allow the algorithm to administer an appropriate insulin dose.
The perceived complexity of these systems may be responsible for why there are substantial disparities in the prescription of closed-loop systems. Kids of lower socioeconomic status are dramatically less likely to receive these advanced technologies. Providers may feel that patients with lower health literacy or social supports are not “ideal” for these technologies, even though they lead to demonstrably better outcomes.
That means that easier might be better. And a “bionic pancreas,” as reported in an article from The New England Journal of Medicine, is exactly that.
Broadly, it’s another closed-loop system. The bionic pancreas integrates with a continuous glucose monitor and administers insulin when needed. But the algorithm appears to be a bit smarter than what we have in existing devices. For example, patients do not need to provide any information about their usual insulin doses – just their body weight. They don’t need to count carbohydrates at meals – just to inform the device when they are eating, and whether the meal is the usual amount they eat, more, or less. The algorithm learns and adapts as it is used. Easy.
And in this randomized trial, easy does it.
A total of 219 participants were randomized in a 2:1 ratio to the bionic pancreas or usual diabetes care, though it was required that control participants use a continuous glucose monitor. Participants were as young as 6 years old and up to 79 years old; the majority were White and had a relatively high household income. The mean A1c was around 7.8% at baseline.
By the end of the study, the A1c was significantly improved in the bionic pancreas group, with a mean of 7.3% vs. 7.7% in the usual-care group.
This effect was most pronounced in those with a higher A1c at baseline.
People randomized to the bionic pancreas also spent more time in the target glucose range of 70-180 mg/dL.
All in all, the technology that makes it easy to manage your blood sugar, well, made it easy to manage your blood sugar.
But new technology is never without its hiccups. Those randomized to the bionic pancreas had a markedly higher rate of adverse events (244 events in 126 people compared with 10 events in 8 people in the usual-care group.)
This is actually a little misleading, though. The vast majority of these events were hyperglycemic episodes due to infusion set failures, which were reportable only in the bionic pancreas group. In other words, the patients in the control group who had an infusion set failure (assuming they were using an insulin pump at all) would have just called their regular doctor to get things sorted and not reported it to the study team.
Nevertheless, these adverse events – not serious, but common – highlight the fact that good software is not the only key to solving the closed-loop problem. We need good hardware too, hardware that can withstand the very active lives that children with type 1 diabetes deserve to live.
In short, the dream of a functional cure to type 1 diabetes, a true artificial pancreas, is closer than ever, but it’s still just a dream. With iterative advances like this, though, the reality may be here before you know it.
Dr. Wilson is associate professor of medicine and director of Yale University’s Clinical and Translational Research Accelerator. His science communication work can be found in the Huffington Post, on NPR, and on Medscape. He tweets @fperrywilson and hosts a repository of his communication work at www.methodsman.com. A version of this article first appeared on Medscape.com.
Why our brains wear out at the end of the day
The transcript has been edited for clarity.
Welcome to Impact Factor, your weekly dose of commentary on a new medical study. I’m Dr. F. Perry Wilson of the Yale School of Medicine.
Once again, we’re doing an informal journal club to talk about a really interesting study, “A Neuro-metabolic Account of Why Daylong Cognitive Work Alters the Control of Economic Decisions,” that just came out. It tries to answer the question of why our brains wear out. I’m going to put myself in the corner here. Let’s walk through this study, which appears in Current Biology, by lead author Antonius Wiehler from Paris.
The big question is what’s going on with cognitive fatigue. If you look at chess players who are exerting a lot of cognitive effort, it’s well documented that over hours of play, they get worse and make more mistakes. It takes them longer to make decisions. The question is, why?
Why does your brain get tired?
To date, it’s been a little bit hard to tease that out. Now, there is some suggestion of what is responsible for this. The cognitive control center of the brain is probably somewhere in the left lateral prefrontal cortex (LLPC).
The prefrontal cortex is responsible for higher-level thinking. It’s what causes you to be inhibited. It gets shut off by alcohol and leads to impulsive behaviors. The LLPC, according to functional MRI studies, has reduced activity as people become more and more cognitively fatigued. The LLPC helps you think through choices. As you become more fatigued, this area of the brain isn’t working as well. But why would it not work as well? What is going on in that particular part of the brain? It doesn’t seem to be something simple, like glucose levels; that’s been investigated and glucose levels are pretty constant throughout the brain, regardless of cognitive task. This paper seeks to tease out what is actually going on in the LLPC when you are becoming cognitively tired.
They did an experiment where they induced cognitive fatigue, and it sounds like a painful experiment. For more than 6 hours, volunteers completed sessions during which they had to perform cognitive switching tasks. Investigators showed participants a letter, in either red or green, and the participant would respond with whether it was a vowel or a consonant or whether it was a capital or lowercase letter, based on the color. If it’s red, say whether it’s a consonant or vowel. If it’s green, say whether it’s upper- or lowercase.
It’s hard, and doing it for 6 hours is likely to induce a lot of cognitive fatigue. They had a control group as well, which is really important here. The control group also did a task like this for 6 hours, but for them, investigators didn’t change the color as often – perhaps only once per session. For the study group, they were switching colors back and forth quite a lot. They also incorporated a memory challenge that worked in a similar way.
So, what are the readouts of this study? They had a group who went through the hard cognitive challenge and a group who went through the easy cognitive challenge. They looked at a variety of metrics. I’ll describe a few.
The first is performance decrement. Did they get it wrong? What percentage of the time did the participant say “consonant” when they should have said “lowercase?”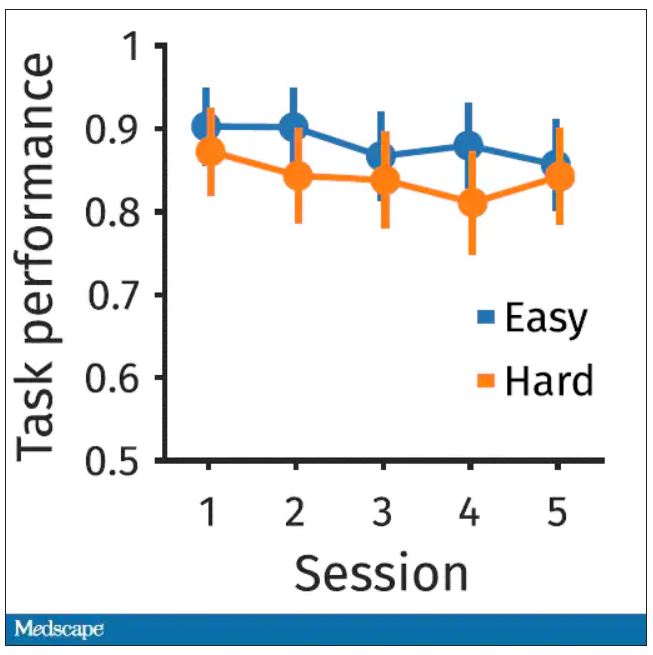
You can see here that the hard group did a little bit worse overall. It was harder, so they don’t do as well. That makes sense. But both groups kind of waned over time a little bit. It’s not as though the hard group declines much more. The slopes of those lines are pretty similar. So, not very robust findings there.
What about subjective fatigue? They asked the participants how exhausted they were from doing the tasks.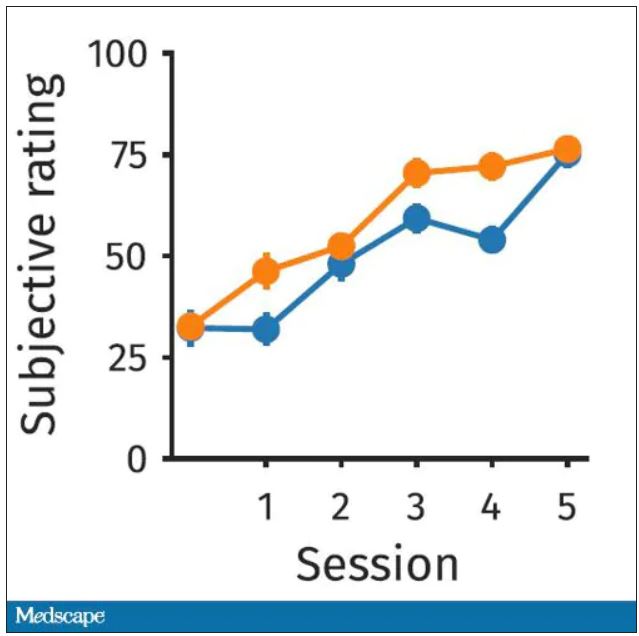
Both groups were worn out. It was a long day. There was a suggestion that the hard group became worn out a little bit sooner, but I don’t think this achieves statistical significance. Everyone was getting tired by hour 6 here.
What about response time? How quickly could the participant say “consonant,” “vowel,” “lowercase,” or “uppercase?”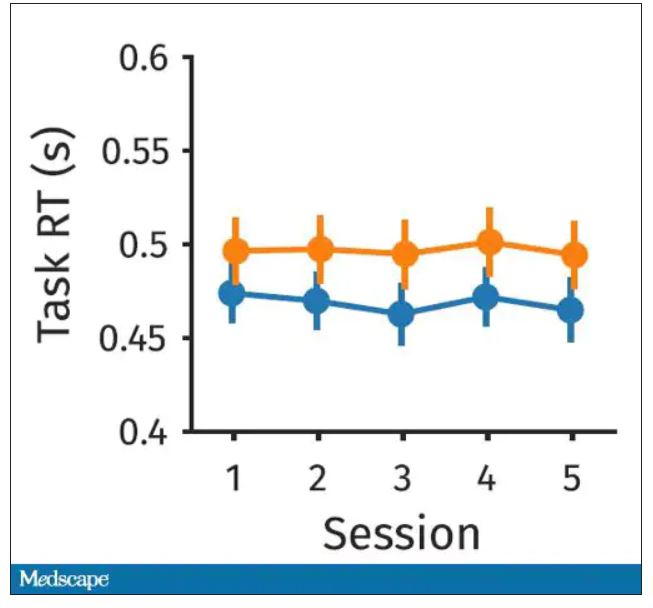
The hard group took longer to respond because it was a harder task. But over time, the response times were pretty flat.
So far there isn’t a robust readout that would make us say, oh, yeah, that is a good marker of cognitive fatigue. That’s how you measure cognitive fatigue. It’s not what people say. It’s not how quick they are. It’s not even how accurate they are.
But then the investigators got a little bit clever. Participants were asked to play a “would you rather” game, a reward game. Here are two examples.
Would you rather:
- Have a 25% chance of earning $50 OR a 95% chance of earning $17.30?
- Earn $50, but your next task session will be hard or earn $40 and your next task session will be easy?
Participants had to figure out the better odds – what should they be choosing here? They had to tease out whether they preferred lower cost lower-risk choices – when they are cognitively fatigued, which has been shown in prior studies.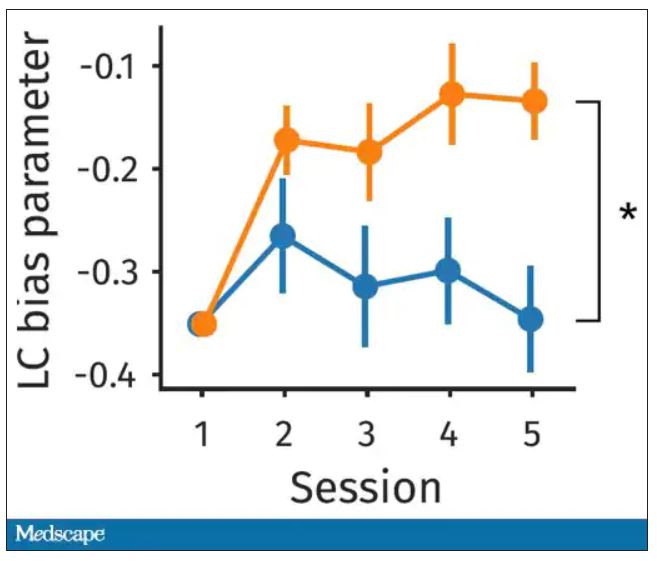
This showed a pretty dramatic difference between the groups in terms of the low-cost bias – how much more likely they were to pick the low-cost, easier choice as they became more and more cognitively fatigued. The hard group participants were more likely to pick the easy thing rather than the potentially more lucrative thing, which is really interesting when we think about how our own cognitive fatigue happens at the end of a difficult workday, how you may just be likely to go with the flow and do something easy because you just don’t have that much decision-making power left.
It would be nice to have some objective physiologic measurements for this, and they do. This is pupil dilation.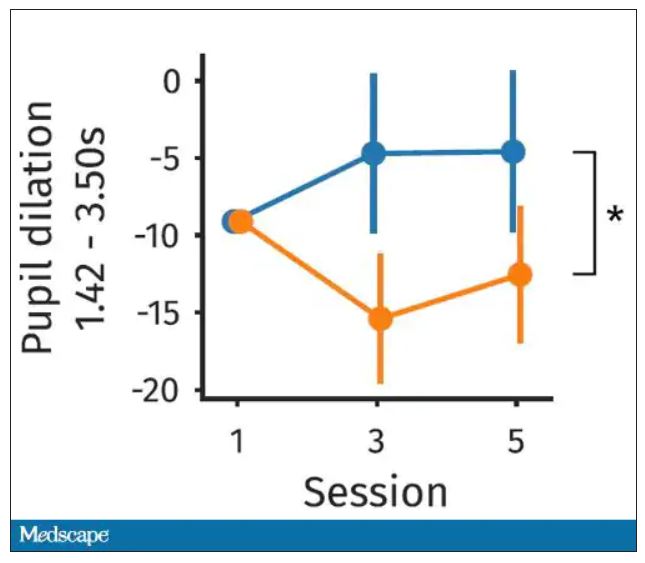
When you’re paying attention to something, your pupils dilate a little bit. They were able to show that as the hard group became more and more fatigued, pupil dilation sort of went away. In fact, if anything, their pupils constricted a little bit. But basically there was a significant difference here. The easy group’s pupils were still fine; they were still dilating. The hard group’s pupils got more sluggish. This is a physiologic correlate of what’s going on.
But again, these are all downstream of whatever is happening in the LLPC. So the real meat of this study is a functional MRI analysis, and the way they did this is pretty clever. They were looking for metabolites in the various parts of the brain using a labeled hydrogen MRI, which is even fancier than a functional MRI. It’s like MRI spectroscopy, and it can measure the levels of certain chemicals in the brain. They hypothesized that if there is a chemical that builds up when you are tired, it should build up preferentially in the LLPC.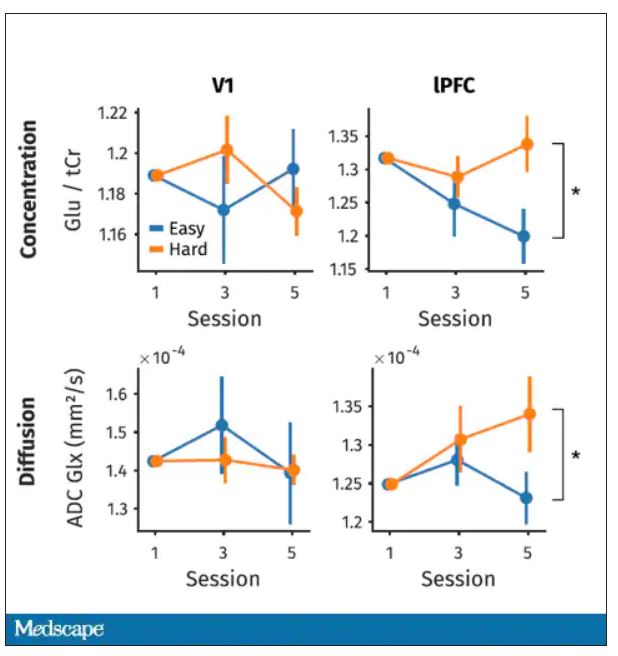
Whereas in the rest of the brain, there shouldn’t be that much difference because we know the action is happening in the LLPC. The control part of the brain is a section called V1. They looked at a variety of metabolites, but the only one that behaved the way they expected was glutamate and glutamic acid (glutamate metabolites). In the hard group, the glutamate is building up over time, so there is a higher concentration of glutamate in the LLPC but not the rest of the brain. There is also a greater diffusion of glutamate from the intracellular to the extracellular space, which suggests that it’s kind of leaking out of the cells.
So the signal here is that the thing that’s impacting that part of the brain is this buildup of glutamate. To tie this together, they showed in the scatterplot the relationship between the increase in glutamate and the low-cost bias from the decision fatigue example.
It’s not the strongest correlation, but it is statistically significant that the more glutamate in your LLPC, the more likely you are to just take the easy decision as opposed to really thinking things through. That is pretty powerful. It’s telling us that your brain making you fatigued, and making you less likely to continue to use your LLPC, may be a self-defense mechanism against a buildup of glutamate, which may be neurotoxic. And that’s a fascinating bit of homeostasis.
Of course, it makes you wonder how we might adjust glutamate levels in the brain, although maybe we should let the brain be tired if the brain wants to be tired. It reminds me of that old Far Side cartoon where the guy is raising his hand and asking: “Can I be excused? My brain is full.” That is essentially what’s happening. This part of your brain is becoming taxed and building up glutamate. There’s some kind of negative feedback loop. The authors don’t know what the receptor pathway is that down-regulates that part of the brain based on the glutamate buildup, but some kind of negative feedback loop is saying, okay, give this part of the brain a rest. Things have gone on too far here.
It’s a fascinating study, although it’s not clear what we can do with this information. It’s not clear whether we can manipulate glutamate levels in this particular part of the brain or not. But it’s nice to see some biologic correlates of a psychological phenomenon that is incredibly well described – the phenomenon of decision fatigue. I think we all feel it at the end of a hard workday. If you’ve been doing a lot of cognitively intensive tasks, you just don’t have it in you anymore. And maybe the act of a good night’s sleep is clearing out some of that glutamate in the LLPC, which lets you start over and make some good decisions again. So I hope you all make some good decisions and keep your glutamate levels low. And I’ll see you next time.
For Medscape, I’m Perry Wilson.
Dr. Wilson is an associate professor of medicine and director of the Clinical and Translational Research Accelerator at Yale University, New Haven, Conn. He reported no relevant conflicts of interest.
A version of this article first appeared on Medscape.com.
Could a common cold virus be causing severe hepatitis in kids?
This is a transcript of a video that first appeared on Medscape.com. It has been edited for clarity.
On April 21, 2022, the Centers for Disease Control and Prevention released a Health Alert Network advisory regarding a cluster of nine cases of acute hepatitis in children in Alabama over a 5-month period from October 2021 to February 2022 – a rate substantially higher than what would be expected, given the relative rarity of hepatitis in children.
Standard workup was negative for the common causative agents – hepatitis A, B, and C – and no toxic exposures were identified. But there was one common thread among all these kids: They all tested positive for adenovirus.
And that is really strange.
There are about 100 circulating adenoviruses in the world that we know of, and around 50 of them infect humans. If you are an adult, it’s a virtual certainty that you have been infected with an adenovirus in the past. Most strains cause symptoms we would describe as the common cold: runny nose, sore throat. Some strains cause conjunctivitis (pink eye). Some cause gastrointestinal illness – the stomach bugs that kids get.
It’s the banality of adenovirus that makes this hepatitis finding so surprising.
The United States is not alone in reporting this new hepatitis syndrome. As of April 21, 169 cases have been reported across the world, including 114 in the United Kingdom.
Of the 169 cases reported worldwide, 74 had evidence of adenovirus infection. On molecular testing, 18 of those were adenovirus 41.
What I wanted to do today was go through the various hypotheses for what could be going on with these hepatitis cases, one by one, and highlight the evidence supporting them. We won’t reach a conclusion, but hopefully by the end, the path forward will be more clear. OK, let’s get started.
Hypothesis 1: Nothing is happening.
It’s worth noting that “clusters” of disease occur all the time, even when no relevant epidemiologic process has occurred. If there is some baseline rate of hepatitis, every once in a while, through bad luck alone, you’d see a group of cases all at once. This is known as the clustering illusion. And I’m quite confident in saying that this is not the case here.
For one, this phenomenon is worldwide, as we know from the World Health Organization report. In fact, the CDC didn’t provide the most detailed data about the nine (now 12) cases in the United States. This study from Scotland is the first to give a detailed accounting of cases, reporting on 13 cases of acute hepatitis of unknown cause in kids at a single hospital from January to April. Typically, the hospital sees fewer than four cases of hepatitis per year. Five of these 13 kids tested positive for adenovirus. So let’s take the clustering illusion off the list.
Hypothesis 2: It’s adenovirus.
The major evidence supporting adenovirus as the causative agent here is that a lot of these kids had adenovirus, and adenovirus 41 – a gut-tropic strain – in particular. This is important, because stool testing might be necessary for diagnosis and lots of kids with this condition didn’t get that. In other words, we have hard evidence of adenovirus infection in about 40% of the cases so far, but the true number might be substantially higher.
That said, adenovirus is seasonal, and we are in adenovirus season. Granted, 40% seems quite a bit higher than the background infection rate, but we have to be careful not to assume that correlation means causation.
The evidence against adenovirus, even adenovirus 41, is that this acute hepatitis syndrome is new, and adenovirus 41 is not. To be fair, we know adenoviruses can cause acute hepatitis, but the vast majority of reports are in immunocompromised individuals – organ transplant recipients and those with HIV. I was able to find just a handful of cases of immunocompetent kids developing hepatitis from adenovirus prior to this current outbreak.
The current outbreak would exceed the published literature by nearly two orders of magnitude. It feels like something else has to be going on.
Hypothesis 3: It’s coronavirus.
SARS-CoV-2 is a strange virus, both in its acute presentation and its long-term outcomes. It was clear early in the pandemic that some children infected by the coronavirus would develop MIS-C – multisystem inflammatory syndrome in children. MIS-C is associated with hepatitis in about 10% of children, according to this New England Journal of Medicine
But the presentation of these kids is quite different from MIS-C; fever is rare, for example. The WHO reports that of the 169 identified cases so far, 20 had active COVID infection. The Scotland cohort suggests that a similar proportion had past COVID infections. In other times, we might consider this a smoking gun, but at this point a history of COVID is not remarkable – after the Omicron wave, it’s about as common to have a history of COVID as it is not to have a history of COVID.
A brief aside here. This is not because of coronavirus vaccination. Of the more than 100 cases reported in the United Kingdom, none of these kids were vaccinated. So let’s put aside the possibility that this is a vaccine effect – there’s no real evidence to support that.
Which brings us to …
Hypothesis 4: It’s coronavirus and adenovirus.
This is sort of intriguing and can work a few different ways, via a direct and indirect path.
In the direct path, we posit that COVID infection does something to kids’ immune systems – something we don’t yet understand that limits their ability to fight off adenovirus. There is some support for this idea. This study in Immunity found that COVID infection can functionally impair dendritic cells and T-cells, including natural killer cells. These cells are important components of our innate antiviral immunity.
There’s an indirect path as well. COVID has led to lockdowns, distancing, masking – stuff that prevents kids from being exposed to germs from other kids. Could a lack of exposure to adenovirus or other viruses because of distancing increase the risk for severe disease when restrictions are lifted? Also possible – the severity of respiratory syncytial virus (RSV) infections this year is substantially higher than what we’ve seen in the past, for example.
And finally, hypothesis 5: This is something new.
We can’t ignore the possibility that this is simply a new disease-causing agent. Toxicology studies so far have been negative, and we wouldn’t expect hepatitis from a chemical toxin to appear in multiple countries around the world; this is almost certainly a biological phenomenon. It is possible that this is a new strain of adenovirus 41, or that adenovirus is a red herring altogether. Remember, we knew about “non-A/non-B viral hepatitis” for more than 2 decades before hepatitis C was discovered.
The pace of science is faster now, fortunately, and information is coming out quickly. As we learn more, we’ll share it with you.
Dr. Wilson, MD, MSCE, is an associate professor of medicine at Yale University, New Haven, Conn., and director of Yale’s Clinical and Translational Research Accelerator. His science communication work can be found in the Huffington Post, on NPR, and on Medscape. He tweets @fperrywilson and hosts a repository of his communication work at www.methodsman.com. Dr. Wilson has disclosed no relevant financial relationships.
Don’t drink calories: Artificial sweeteners beat sugar in new analysis
This transcript of Impact Factor with F. Perry Wilson has been edited for clarity.
Welcome to Impact Factor, your weekly dose of commentary on a new medical study. I’m Dr. F. Perry Wilson of the Yale School of Medicine.
When I counsel patients who are trying to lose weight, there is something I always discuss: “Don’t drink calories.” The idea is that it is so easy to consume sweetened beverages (and alcoholic ones, for that matter) and we don’t really get a sense of how many calories we’re taking in.
Some patients balk at the idea, saying they can’t stand the taste of water or just can’t bring themselves to drink it. While, as a nephrologist, this pains me deeply to hear, I often suggest going for low- or zero-calorie flavored drinks instead of the sugary stuff.
And yet ... I need to admit that recently I’ve been more nervous about that advice. A very nice study in Nature, for example, found that artificial sweeteners induce glucose intolerance and weight gain – in mice.
Several observational studies have suggested that the use of nonnutritive sweeteners – sucralose, aspartame, and so on – are associated with higher body weight and type 2 diabetes. Of course,
Randomized trials, as ever, are the key to deeper understanding, but most trials in this space are relatively small. That makes a good case for this study, appearing in JAMA Network Open, which combines data from 17 randomized trials to determine what effects substituting sugary drinks with low- and zero-calorie drinks truly has.
So, what’s the bottom line? Should I ditch the Splenda in my morning coffee and drop in some sugar cubes?
It turns out that the effects of drinking low- or zero-calorie drinks instead of sugary ones is modest, but overall beneficial, depending on the outcome you’re trying to achieve.
Randomized trials show that switching to low-cal drinks reduces body weight by about a kilogram, and BMI by 0.3 points. It also reduces body fat by about half a percent.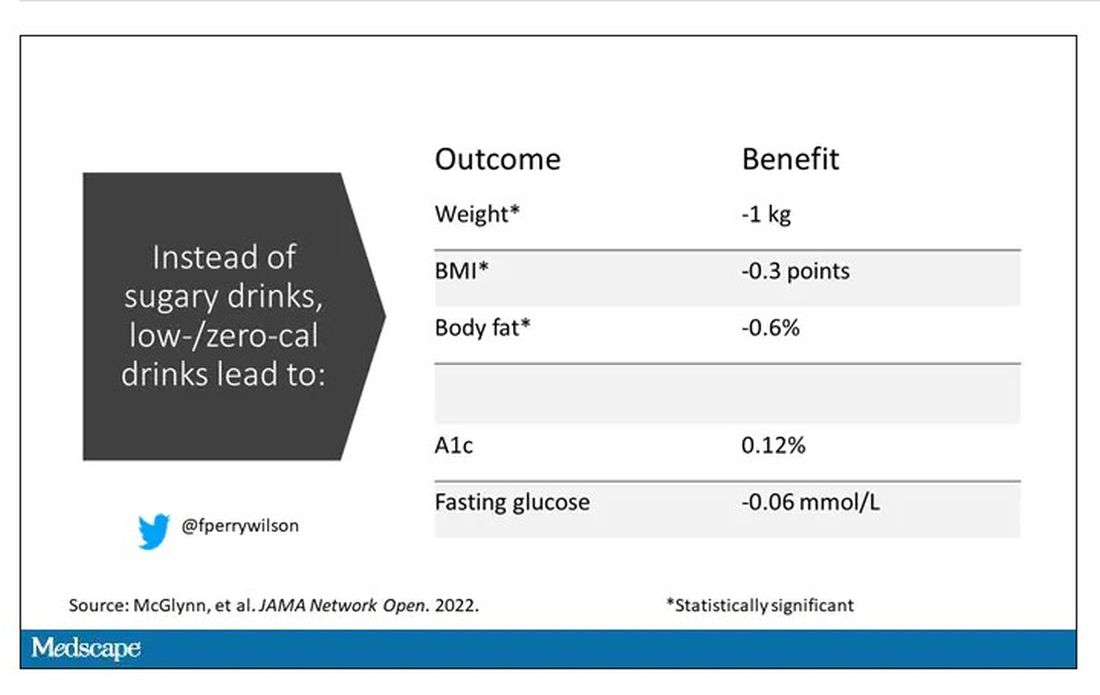
Effects on glucose homeostasis – hemoglobin A1c level and fasting glucose – were not that impressive, though.
The authors also compared sugar-sweetened beverages with plain old water. I expected this analysis to show more dramatic benefits. After all, we’re all just ugly, giant bags of mostly water. Interestingly, the effects of switching to water were not as dramatic and largely nonsignificant with respect to most outcomes evaluated.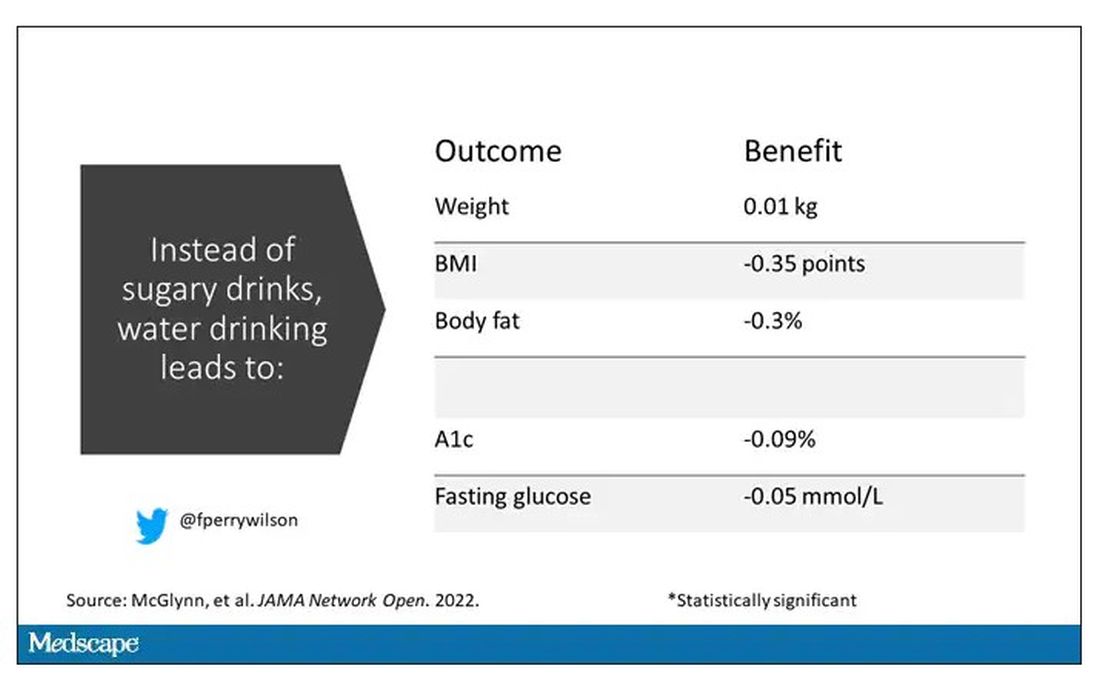
So, what do we make of this? If someone is a habitual drinker of sugar-sweetened beverages, is it preferable to switch to a zero-calorie flavored drink, compared with plain water?
One possibility is that in the trials where people are randomized to switch to water, they aren’t as adherent. Just because we ask someone to drink water doesn’t mean they do it, and so there may be a tendency to “cheat” with sugar-sweetened beverages. However, if told that low- or zero-calorie flavored drinks are okay, maybe it’s easier to stick to the plan? This is essentially the argument you get from people who say that vaping is a good way to quit smoking. It may or may not be true.
It could also be that we just don’t have enough rigorous data to make a firm conclusion. Of the 17 trials examined, only three of them used water substitution as an intervention.
All in all, these data provide some reassurance that the zero-calorie sweeteners aren’t secretly exacerbating the obesity epidemic. I’d certainly rather my patients drink Diet Coke than regular Coke. That said, these studies are necessarily short term; the longer-term effects of sugar substitutes, while perhaps not as bad as the long-term effects of sugar, must necessarily be worse than the long-term effects of drinking water. Maybe this is the nephrologist in me talking again, but I doubt that there could possibly be a fluid better for the human body than good old H2O. Except coffee, of course.
F. Perry Wilson, MD, MSCE, is an associate professor of medicine and director of Yale University’s Clinical and Translational Research Accelerator. He disclosed no relevant financial relationships.
A version of this article first appeared on Medscape.com.