User login
Discharge Medical Complexity, Change in Medical Complexity and Pediatric 30-day Readmission
Hospitalizations are disruptive, stressful, and costly for patients and families.1-5 Hospital readmissions subject families to the additional morbidity inherent to hospitalization and place patients at additional risk of hospital-acquired conditions or other harm.6-9 In pediatrics, hospital readmissions are common for specific conditions;10 with rates varying across institutions;10,11 and as many as one-third of unplanned pediatric readmissions are potentially preventable.12
Reducing pediatric readmissions requires a deeper understanding of the mechanisms through which readmissions occur. Medical complexity—specifically chronic conditions and use of medical technology—is associated with increased risk of readmission.13,14 Polypharmacy at discharge has also been associated with readmission.15,16 However, prior studies on polypharmacy and readmission risk examined the count of total medications and did not consider the nuances of scheduled versus as-needed medications, or the frequency of doses. These nuances may be critical to caregivers as discharge medical complexity can be overwhelming, even in diagnoses which are not traditionally considered complex.17 Finally, of potentially greater importance than medical complexity at discharge is a change in medical complexity during a hospitalization—for example, new diagnoses or new technologies that require additional education in hospital and management at home.
We sought to further understand the relationship between discharge medical complexity and readmission risk with regards to polypharmacy and home healthcare referrals at discharge. Specifically, we hypothesized that a change in medical complexity during an admission—ie, a new chronic diagnosis or new technology—would be a more prominent risk factor for readmission than discharge complexity alone. We examined these factors in the context of length of stay (LOS) since this is a marker of in-hospital severity of illness and a potentially modifiable function of time allowed for in-hospital teaching and discharge preparation.
METHODS
We conducted a retrospective, case-control study of pediatric hospitalizations at one tertiary care children’s hospital. Children <18 years were eligible for inclusion. Normal birth hospitalizations were excluded. We randomly selected one hospitalization from each child as the index visit. We identified cases, hospitalizations at C.S. Mott Children’s Hospital between 2008 and 2012 with a subsequent unplanned 30-day readmission,18 and matched them one to one with hospitalizations at the same hospital during the same period without subsequent readmission. We matched cases to controls based on the month of admission to account for seasonality of certain illnesses. We also matched on distance and direction from the hospital to the patient’s home to account for the potential to have readmissions to other institutions. We utilized both distance and direction recognizing that a family living 30 miles in one direction would be closer to an urban area with access to more facilities, as opposed to 30 miles in another direction in a rural area without additional access. We subsequently performed medical record review to abstract relevant covariates.
Primary Predictors
Medical Complexity Models (Models 1 and 2):
We evaluated three attributes of discharge medical complexity abstracted by medical record review—discharge medications, technology assistance (ie, tracheostomy, cerebral spinal fluid ventricular shunt, enteral feeding tube, central line), and the need for home healthcare after discharge. We counted discharge medications based on the number of medications listed on the discharge summary separated into scheduled or as needed.19 We also considered the number of scheduled doses to be administered in a 24-hour period (see Appendix methods for more information on counting discharge medications). For assistance by technology, we considered the presence of tracheostomy, cerebral spinal fluid ventricular shunt, enteral feeding tube, and central lines. While we describe these technologies separately, for multivariable analyses we considered the presence of any of the four types of technology.
Change in Medical Complexity Models (Models 3 and 4)
We examined two aspects of change in medical complexity—the presence of a new complex chronic condition (CCC)20 diagnosed during the hospitalization, and a new reliance on medical technology. The presence of new CCC was determined by comparing discharge diagnoses to past medical history abstracted by medical record review. A new CCC was defined as any complex chronic condition that was captured in the discharge diagnoses but was not evident in the past medical history. By definition, all CCCs coded during birth hospitalization (eg, at discharge from the neonatal intensive care unit) were assigned to “new” CCC. We calculated a kappa statistic to determine interrater reliability in determining the designation of new CCC. A sensitivity analysis examining these birth CCCs was also performed comparing no new CCC, new CCC, and new CCC after birth hospitalization. The methods appendix provides additional information on considering new CCCs. New technology, abstracted from chart review, was defined as technology placed during hospitalization that remained in place at discharge. If a child with existing technology had additional technology placed during the hospitalization (eg, a new tracheostomy in a child with a previously placed enteral feeding tube), the encounter was considered as having new technology placed.
Covariates
We created different sets of multivariable models to account for patient/hospitalization characteristics.
Statistical Analysis
A review of 600 cases and 600 controls yields 89% power to detect statistical significance for covariates with an odds ratio of 1.25 (β = 0.22) if the candidate covariate has low to moderate correlation with other covariates (<0.3). If a candidate covariate has a moderate correlation with other covariates (0.6), we have 89% power to detect an odds ratio of 1.35 (β = 0.30).21 We calculated odds of 30-days unplanned readmission using conditional logistic regression to account for matched case-control design. All the analyses were performed using STATA 13 (Stata Corp., College Station, Texas).
RESULTS
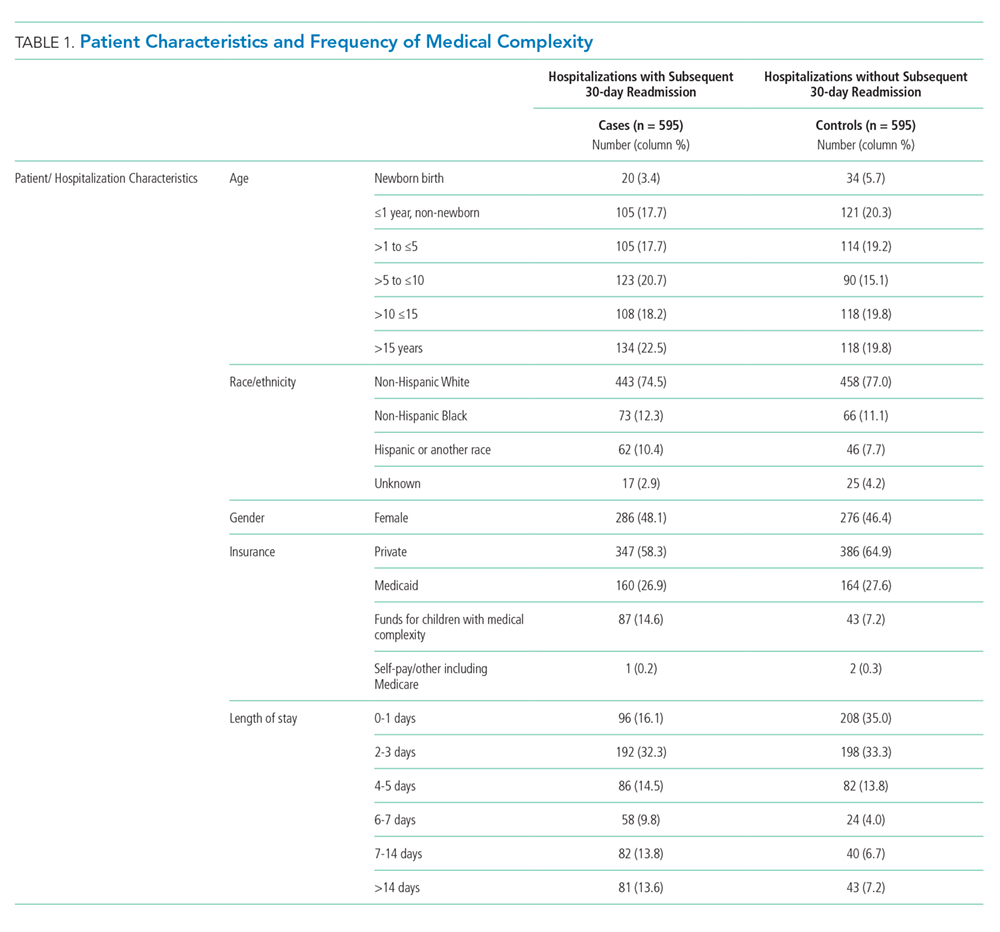
Of the 41,422 eligible index hospitalizations during the study period, 9.4% resulted in a 30-day unplanned readmission. After randomly selecting one hospitalization per child, there were 781 eligible cases. We subsequent matched all but one eligible case to a control. We randomly selected encounters for medical record review, reviewing a total of 1,212 encounters. After excluding pairs with incomplete records, we included 595 cases and 595 controls in this analysis (Figure). Patient/hospitalization characteristics are displayed in Table 1. The most frequent primary discharge diagnoses are displayed in Appendix Table 1.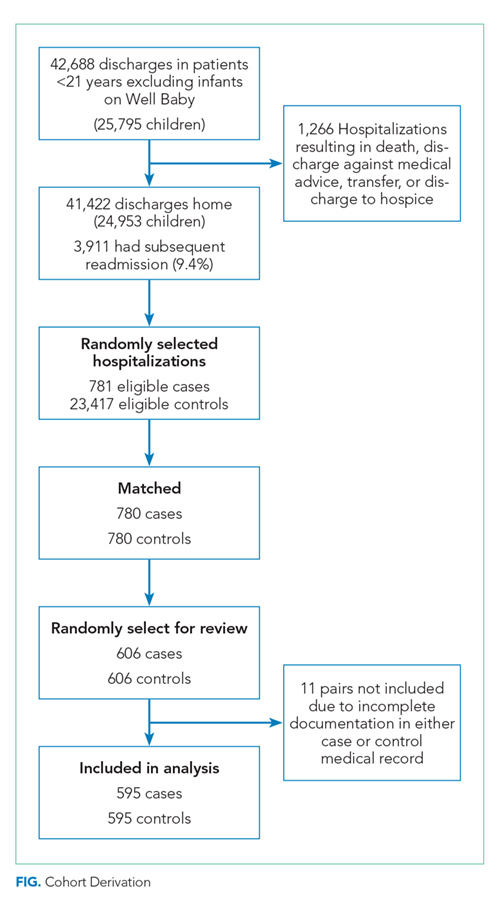
Models of Medical Complexity at Discharge
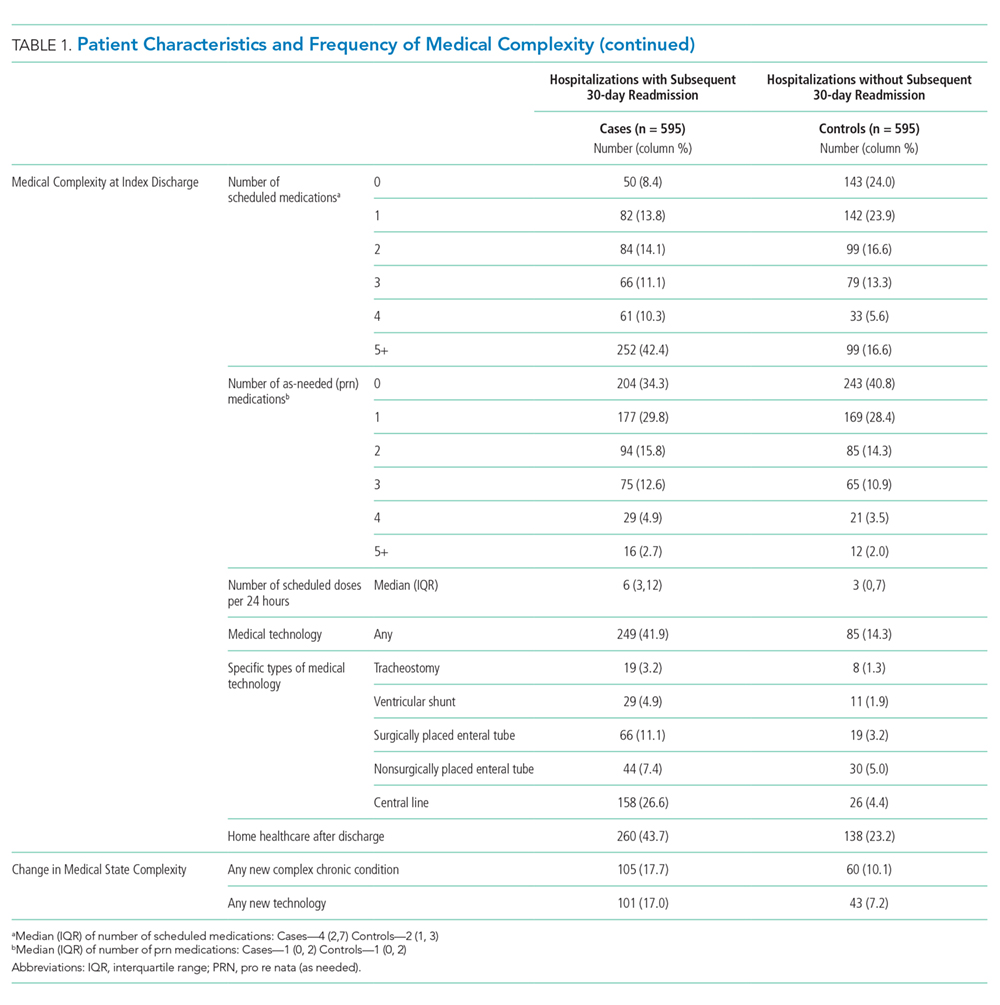
Polypharmacy after discharge was common for both readmitted and nonreadmitted patients. Children who experienced unplanned readmission in 30 days were discharged with a median of four different scheduled medications (interquartile range [IQR] 2,7) which translated into a median of six (IQR 3,12) scheduled doses in a 24-hour period. In comparison, children without an unplanned readmission had a median of two different scheduled medications (IQR 1,3) with a median of three (IQR 0,7) scheduled doses in a 24-hour period. Medical technology was more common in case children (42%) than in control children (14%). Central lines and enteral tubes were the most common forms of medical technology in both cases and controls. Home health referral was common in both cases (44%) and controls (23%; Table 1).
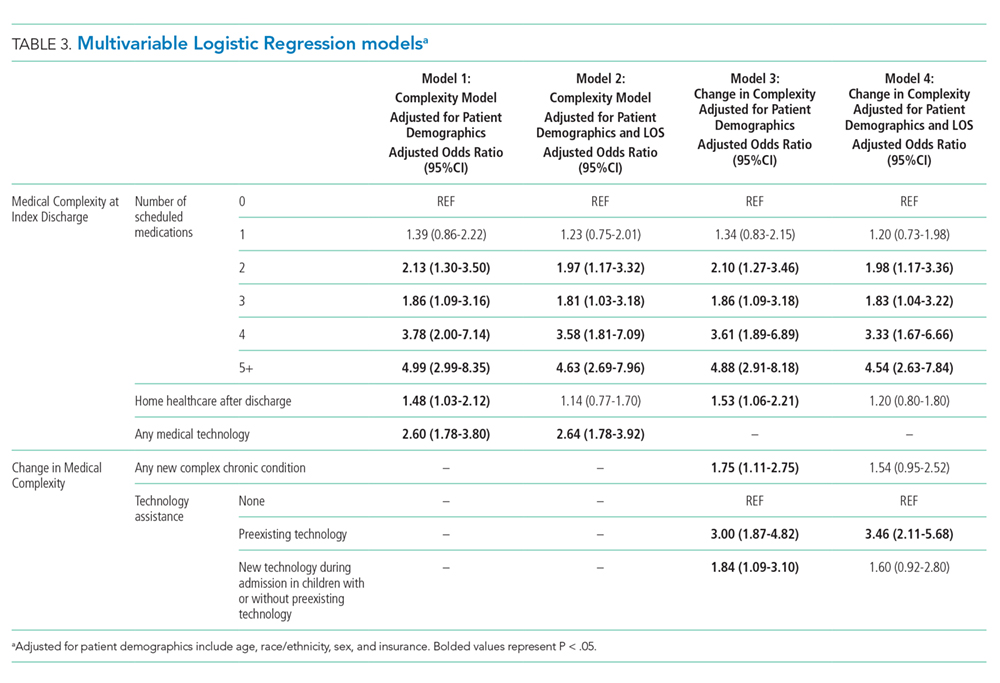
In Model 1 (adjusting only for patient characteristics; Table 3), being discharged on two or more scheduled medications was associated with higher odds of readmission compared to being discharged without medications, with additional medications associated with even higher odds of readmission. Children with any technology had higher odds of readmission than children without medical technology. Likewise, home healthcare visits after discharge were associated with elevated odds of readmission in multivariable analyses without LOS. However, after adding LOS to the model (Model 2), home healthcare visits were no longer significantly associated with readmission.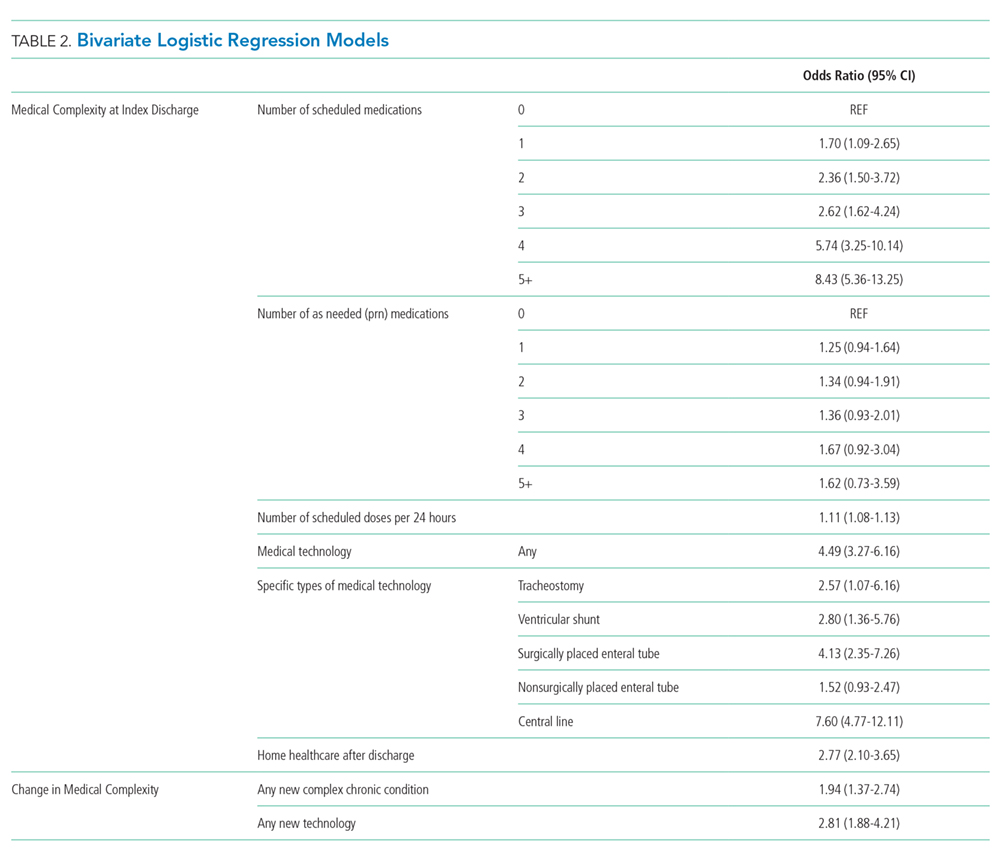
Change in Medical Complexity Models
The adjudication of new CCCs had good reliability (Κ = 0.72). New CCCs occurred in 18% and new technologies occurred in 17% of cases. Comparatively, new CCCs occurred in 10% and new technologies in 7% of hospitalizations in control children (Table 1). In bivariate analyses, both aspects of change in medical complexity were associated with higher odds of readmission (Table 2). In multivariate analysis with patient characteristics (Model 3; Table 3), all aspects of change in complexity were associated with elevated odds of readmission. A new CCC was associated with higher odds of readmission (adjusted OR (AOR) 1.75, 95% CI: 1.11-2.75) as was new technology during admission (AOR 1.84, 95%CI: 1.09-3.10). Furthermore, the odds of readmission for medical complexity variables (polypharmacy and home healthcare need) remained largely unchanged when adding the change in medical complexity variables (ie, comparing Model 1 and Model 3). However, when accounting for LOS (Model 4), neither the acquisition of a new CCC nor the addition of new technology was associated with readmission. The most common form of new technology was central line followed by nonsurgically placed enteral tube (Appendix Table 2). Finally, in sensitivity analyses (results not detailed), separating new CCC acquired at birth and new CCCs in nonbirth hospitalizations, compared to hospitalizations with no new CCC, yielded similar results as the primary analyses.
DISCUSSION
We examined multiple attributes of polypharmacy—the number of scheduled medications, number of as-needed medications, and number of scheduled doses per 24 hours. Interestingly, only the scheduled medications (count of medication and number of doses) were associated with elevated readmission risk. As-needed medications have heterogeneity in the level of importance from critical (eg, seizure rescue) to discretionary (eg, antipyretics, creams). The burden of managing these types of medications may still be high (ie, parents must decide when to administer a critical medication); however, this burden does not translate into increased readmission risk in this population.
Not surprisingly, greater medical complexity—as defined by higher numbers of scheduled discharge medications and technology assistance—is associated with 30-day readmission risk. Our analyses do not allow us to determine how much of the increased risk is due to additional care burden and risks of polypharmacy versus the inherent increase in complexity and severity of illness for which polypharmacy is a marker. Tailoring discharge regimens to the realities of daily life, with the goal of “minimally disruptive medicine”22,23 (eg, integrating manageable discharge medication routines into school and work schedules), is not a common feature of pediatric discharge planning. For adult patients with complex medical conditions, tailoring medication regimens in a minimally disruptive way is known to improve outcomes.24 Similarly, adopting minimally disruptive techniques to integrate the polypharmacy inherent in discharge could potentially mitigate some of the readmission risks for children and adolescents.
Contrary to our hypothesis, new technologies and new diagnoses did not confer additional readmission risk when accounting for LOS and patient characteristics. One potential explanation is varying risks conveyed by different types of new technologies placed during hospitalization. Central lines, the most common form of new technology, is associated with higher odds of reutilization in unadjusted analyses. However, the second most common form of new technology, nonsurgically placed enteral feeding tube, was not. Further analyses of the differential effects of new technology should be further examined in larger datasets. Additionally, the lack of additional readmission risk from new technology may relate to additional teaching and support provided to families of patients undergoing unfamiliar procedures offsets the risks inherent of greater complexity. If so, it may be that the more intensive teaching and postdischarge support provided to families with new technology or a new diagnosis could be replicated through refresher teaching during hospitalizations, when a patient’s state of health is status quo for the family (ie, the child was admitted and discharged with the same technology and diagnoses). This notion is supported by prior work that demonstrated successful readmission reduction interventions for children with chronic conditions often rely on enhanced education or coaching.25,26
We elected to present models both with and without LOS as a confounder because it is a potentially modifiable attribute of hospitalization. Change in medical complexity aspects were significantly associated with readmission in multivariable models without LOS. However, with the addition of LOS, they were no longer significant. Thus, the readmission risk of new complexity is accounted for by the readmission risk inherent in a longer LOS. This finding prompts additional questions that merit further study: is it that LOS is a general marker for heightened complexity, or is it that a longer LOS can modify readmission risk through additional in-hospital care and time for enhanced education?
Our study has several strengths. We were able to discern true complexity at the time of discharge through medical record review. For example, if a child had a peripherally inserted central catheter placed during hospitalization, it cannot be ascertained through administrative data without medical record review if the technology was removed or in place at discharge. Likewise, medical record review allows for identification of medical technology which is not surgically implanted (eg, nasogastric feeding tubes). Given the “fog” families report as part of their in-hospital experience and its threats to education and postdischarge contingency planning,17 we felt it important to evaluate medical technology regardless of whether or not it was surgically placed. Additionally, the more detailed and nuanced understanding gained of polypharmacy burden can better inform both risk prediction models and interventions to improve the transition from hospital to home.
This study
CONCLUSION
Medical complexity at discharge is associated with pediatric readmission risk. Contrary to our hypothesis, the addition of new technologies and new CCC diagnoses are not associated with pediatric readmission, after accounting for patient and hospitalization factors including LOS. The dynamics of LOS as a risk factor for readmission for children with medical complexity are likely multifaceted and merit further investigation in a multi-institutional study.
Disclosures
The authors report no potential conflicts of interest.
Funding
This work was supported by a grant from the Agency for Healthcare Research and Quality (1K08HS204735-01A1) and a grant from the Blue Cross Blue Shield of Michigan Foundation.
1. Diaz-Caneja A, Gledhill J, Weaver T, Nadel S, Garralda E. A child’s admission to hospital: a qualitative study examining the experiences of parents. Intensive Care Med. 2005;31(9):1248-1254. https://doi.org/10.1007/s00134-005-2728-8.
2. Lapillonne A, Regnault A, Gournay V, et al. Impact on parents of bronchiolitis hospitalization of full-term, preterm and congenital heart disease infants. BMC Pediatrics. 2012;12:171. https://doi.org/10.1186/1471-2431-12-171.
3. Leader S, Jacobson P, Marcin J, Vardis R, Sorrentino M, Murray D. A method for identifying the financial burden of hospitalized infants on families. Value Health. 2002;5(1):55-59. https://doi.org/10.1046/j.1524-4733.2002.51076.x.
4. Leidy NK, Margolis MK, Marcin JP, et al. The impact of severe respiratory syncytial virus on the child, caregiver, and family during hospitalization and recovery. Pediatrics. 2005;115(6):1536-1546. https://doi.org/10.1542/peds.2004-1149.
5. Rennick JE, Johnston CC, Dougherty G, Platt R, Ritchie JA. Children’s psychological responses after critical illness and exposure to invasive technology. J Dev Behav Pediatr. 2002;23(3):133-144. PubMed
6. Brennan TA, Leape LL, Laird NM, et al. Incidence of adverse events and negligence in hospitalized patients. Results of the Harvard Medical Practice Study I. N Engl J Med. 1991;324(6):370-376. https://doi.org/10.1056/NEJM199102073240604.
7. Kohn LT, Corrigan J, Donaldson MS. To err is human: building a safer health system. Washington DC: National Academy Press; 2000.
8. Landrigan CP, Parry GJ, Bones CB, Hackbarth AD, Goldmann DA, Sharek PJ. Temporal trends in rates of patient harm resulting from medical care. N Engl J Med. 2010;363(22):2124-2134. https://doi.org/10.1056/NEJMsa1004404.
9. Magill SS, Edwards JR, Bamberg W, et al. Multistate point-prevalence survey of healthcare-associated infections. N Engl J Med. 2014;370(13):1198-1208. https://doi.org/10.1056/NEJMoa1306801.
10. Berry JG, Toomey SL, Zaslavsky AM, et al. Pediatric readmission prevalence and variability across hospitals. JAMA. 2013;309(4):372-380. https://doi.org/10.1001/jama.2012.188351.
11. Bardach NS, Vittinghoff E, Asteria-Penaloza R, et al. Measuring hospital quality using pediatric readmission and revisit rates. Pediatrics. 2013;132(3):429-436. https://doi.org/10.1542/peds.2012-3527.
12. Toomey SL, Peltz A, Loren S, et al. Potentially preventable 30-day hospital readmissions at a children’s hospital. Pediatrics. 2016;138(2):pii: e20154182. https://doi.org/10.1542/peds.2015-4182.
13. Bucholz EM, Gay JC, Hall M, Harris M, Berry JG. Timing and causes of common pediatric readmissions. J Pediatr. 2018;200:240-248. https://doi.org/10.1016/j.jpeds.2018.04.044.
14. Berry JG, Hall DE, Kuo DZ, et al. Hospital utilization and characteristics of patients experiencing recurrent readmissions within children’s hospitals. JAMA. 2011;305(7):682-690. https://doi.org/10.1001/jama.2011.122.
15. Winer JC, Aragona E, Fields AI, Stockwell DC. Comparison of clinical risk factors among pediatric patients with single admission, multiple admissions (without any 7-day readmissions), and 7-day readmission. Hosp Pediatr. 2016;6(3):119-125. https://doi.org/10.1542/hpeds.2015-0110.
16. Brittan MS, Martin S, Anderson L, Moss A, Torok MR. An electronic health record tool designed to improve pediatric hospital discharge has low predictive utility for readmissions. J Hosp Med. 2018;13(11):779-782. https://doi.org/10.12788/jhm.3043.
17. Solan LG, Beck AF, Brunswick SA, et al. The family perspective on hospital to home transitions: a qualitative study. Pediatrics. 2015;136(6):e1539-e1549. https://doi.org/10.1542/peds.2015-2098.
18. Auger KA, Mueller EL, Weinberg SH, et al. A validated method for identifying unplanned pediatric readmission. J Pediatr. 2016;170:105-112. https://doi.org/10.1016/j.jpeds.2015.11.051.
19. Auger KA, Shah SS, Davis MD, Brady PW. Counting the Ways to Count Medications: The Challenges of Defining Pediatric Polypharmacy. J Hosp Med. 2019;14(8):506-507. https://doi.org/10.12788/jhm.3213.
20. Feudtner C, Feinstein JA, Zhong W, Hall M, Dai D. Pediatric complex chronic conditions classification system version 2: updated for ICD-10 and complex medical technology dependence and transplantation. BMC Pediatrics. 2014;14:199. https://doi.org/10.1186/1471-2431-14-199.
21. Hsieh FY. Sample size tables for logistic regression. Stat Med. 1989;8(7):795-802. https://doi.org/10.1002/sim.4780080704.
22. May C, Montori VM, Mair FS. We need minimally disruptive medicine. BMJ. 2009;339:b2803. https://doi.org/10.1136/bmj.b2803.
23. Leppin AL, Montori VM, Gionfriddo MR. Minimally disruptive medicine: a pragmatically comprehensive model for delivering care to patients with multiple chronic conditions. Healthcare (Basel). 2015;3(1):50-63. https://doi.org/10.3390/healthcare3010050.
24. Serrano V, Spencer-Bonilla G, Boehmer KR, Montori VM. Minimally disruptive medicine for patients with diabetes. Curr Diab Rep. 2017;17(11):104. https://doi.org/10.1007/s11892-017-0935-7.
25. Auger KA, Kenyon CC, Feudtner C, Davis MM. Pediatric hospital discharge interventions to reduce subsequent utilization: a systematic review. J Hosp Med. 2013;9(4):251-260. https://doi.org/10.1002/jhm.2134.
26. Coller RJ, Klitzner TS, Lerner CF, et al. Complex care hospital use and postdischarge coaching: a randomized controlled trial. Pediatrics. 2018;142(2):pii: e20174278. https://doi.org/10.1542/peds.2017-4278.
27. Hain PD, Gay JC, Berutti TW, Whitney GM, Wang W, Saville BR. Preventability of early readmissions at a children’s hospital. Pediatrics. 2013;131(1):e171-e181. https://doi.org/10.1542/peds.2012-0820.
28. Auger KA, Teufel RJ, 2nd, Harris JM, 2nd, et al. Children’s hospital characteristics and readmission metrics. Pediatrics. 2017;139(2). https://doi.org/10.1542/peds.2016-1720.
29. Gay JC, Agrawal R, Auger KA, et al. Rates and impact of potentially preventable readmissions at children’s hospitals. J Pediatr. 2015;166(3):613-619 e615. https://doi.org/10.1016/j.jpeds.2014.10.052.
Hospitalizations are disruptive, stressful, and costly for patients and families.1-5 Hospital readmissions subject families to the additional morbidity inherent to hospitalization and place patients at additional risk of hospital-acquired conditions or other harm.6-9 In pediatrics, hospital readmissions are common for specific conditions;10 with rates varying across institutions;10,11 and as many as one-third of unplanned pediatric readmissions are potentially preventable.12
Reducing pediatric readmissions requires a deeper understanding of the mechanisms through which readmissions occur. Medical complexity—specifically chronic conditions and use of medical technology—is associated with increased risk of readmission.13,14 Polypharmacy at discharge has also been associated with readmission.15,16 However, prior studies on polypharmacy and readmission risk examined the count of total medications and did not consider the nuances of scheduled versus as-needed medications, or the frequency of doses. These nuances may be critical to caregivers as discharge medical complexity can be overwhelming, even in diagnoses which are not traditionally considered complex.17 Finally, of potentially greater importance than medical complexity at discharge is a change in medical complexity during a hospitalization—for example, new diagnoses or new technologies that require additional education in hospital and management at home.
We sought to further understand the relationship between discharge medical complexity and readmission risk with regards to polypharmacy and home healthcare referrals at discharge. Specifically, we hypothesized that a change in medical complexity during an admission—ie, a new chronic diagnosis or new technology—would be a more prominent risk factor for readmission than discharge complexity alone. We examined these factors in the context of length of stay (LOS) since this is a marker of in-hospital severity of illness and a potentially modifiable function of time allowed for in-hospital teaching and discharge preparation.
METHODS
We conducted a retrospective, case-control study of pediatric hospitalizations at one tertiary care children’s hospital. Children <18 years were eligible for inclusion. Normal birth hospitalizations were excluded. We randomly selected one hospitalization from each child as the index visit. We identified cases, hospitalizations at C.S. Mott Children’s Hospital between 2008 and 2012 with a subsequent unplanned 30-day readmission,18 and matched them one to one with hospitalizations at the same hospital during the same period without subsequent readmission. We matched cases to controls based on the month of admission to account for seasonality of certain illnesses. We also matched on distance and direction from the hospital to the patient’s home to account for the potential to have readmissions to other institutions. We utilized both distance and direction recognizing that a family living 30 miles in one direction would be closer to an urban area with access to more facilities, as opposed to 30 miles in another direction in a rural area without additional access. We subsequently performed medical record review to abstract relevant covariates.
Primary Predictors
Medical Complexity Models (Models 1 and 2):
We evaluated three attributes of discharge medical complexity abstracted by medical record review—discharge medications, technology assistance (ie, tracheostomy, cerebral spinal fluid ventricular shunt, enteral feeding tube, central line), and the need for home healthcare after discharge. We counted discharge medications based on the number of medications listed on the discharge summary separated into scheduled or as needed.19 We also considered the number of scheduled doses to be administered in a 24-hour period (see Appendix methods for more information on counting discharge medications). For assistance by technology, we considered the presence of tracheostomy, cerebral spinal fluid ventricular shunt, enteral feeding tube, and central lines. While we describe these technologies separately, for multivariable analyses we considered the presence of any of the four types of technology.
Change in Medical Complexity Models (Models 3 and 4)
We examined two aspects of change in medical complexity—the presence of a new complex chronic condition (CCC)20 diagnosed during the hospitalization, and a new reliance on medical technology. The presence of new CCC was determined by comparing discharge diagnoses to past medical history abstracted by medical record review. A new CCC was defined as any complex chronic condition that was captured in the discharge diagnoses but was not evident in the past medical history. By definition, all CCCs coded during birth hospitalization (eg, at discharge from the neonatal intensive care unit) were assigned to “new” CCC. We calculated a kappa statistic to determine interrater reliability in determining the designation of new CCC. A sensitivity analysis examining these birth CCCs was also performed comparing no new CCC, new CCC, and new CCC after birth hospitalization. The methods appendix provides additional information on considering new CCCs. New technology, abstracted from chart review, was defined as technology placed during hospitalization that remained in place at discharge. If a child with existing technology had additional technology placed during the hospitalization (eg, a new tracheostomy in a child with a previously placed enteral feeding tube), the encounter was considered as having new technology placed.
Covariates
We created different sets of multivariable models to account for patient/hospitalization characteristics.
Statistical Analysis
A review of 600 cases and 600 controls yields 89% power to detect statistical significance for covariates with an odds ratio of 1.25 (β = 0.22) if the candidate covariate has low to moderate correlation with other covariates (<0.3). If a candidate covariate has a moderate correlation with other covariates (0.6), we have 89% power to detect an odds ratio of 1.35 (β = 0.30).21 We calculated odds of 30-days unplanned readmission using conditional logistic regression to account for matched case-control design. All the analyses were performed using STATA 13 (Stata Corp., College Station, Texas).
RESULTS
Of the 41,422 eligible index hospitalizations during the study period, 9.4% resulted in a 30-day unplanned readmission. After randomly selecting one hospitalization per child, there were 781 eligible cases. We subsequent matched all but one eligible case to a control. We randomly selected encounters for medical record review, reviewing a total of 1,212 encounters. After excluding pairs with incomplete records, we included 595 cases and 595 controls in this analysis (Figure). Patient/hospitalization characteristics are displayed in Table 1. The most frequent primary discharge diagnoses are displayed in Appendix Table 1.
Models of Medical Complexity at Discharge
Polypharmacy after discharge was common for both readmitted and nonreadmitted patients. Children who experienced unplanned readmission in 30 days were discharged with a median of four different scheduled medications (interquartile range [IQR] 2,7) which translated into a median of six (IQR 3,12) scheduled doses in a 24-hour period. In comparison, children without an unplanned readmission had a median of two different scheduled medications (IQR 1,3) with a median of three (IQR 0,7) scheduled doses in a 24-hour period. Medical technology was more common in case children (42%) than in control children (14%). Central lines and enteral tubes were the most common forms of medical technology in both cases and controls. Home health referral was common in both cases (44%) and controls (23%; Table 1).
In Model 1 (adjusting only for patient characteristics; Table 3), being discharged on two or more scheduled medications was associated with higher odds of readmission compared to being discharged without medications, with additional medications associated with even higher odds of readmission. Children with any technology had higher odds of readmission than children without medical technology. Likewise, home healthcare visits after discharge were associated with elevated odds of readmission in multivariable analyses without LOS. However, after adding LOS to the model (Model 2), home healthcare visits were no longer significantly associated with readmission.
Change in Medical Complexity Models
The adjudication of new CCCs had good reliability (Κ = 0.72). New CCCs occurred in 18% and new technologies occurred in 17% of cases. Comparatively, new CCCs occurred in 10% and new technologies in 7% of hospitalizations in control children (Table 1). In bivariate analyses, both aspects of change in medical complexity were associated with higher odds of readmission (Table 2). In multivariate analysis with patient characteristics (Model 3; Table 3), all aspects of change in complexity were associated with elevated odds of readmission. A new CCC was associated with higher odds of readmission (adjusted OR (AOR) 1.75, 95% CI: 1.11-2.75) as was new technology during admission (AOR 1.84, 95%CI: 1.09-3.10). Furthermore, the odds of readmission for medical complexity variables (polypharmacy and home healthcare need) remained largely unchanged when adding the change in medical complexity variables (ie, comparing Model 1 and Model 3). However, when accounting for LOS (Model 4), neither the acquisition of a new CCC nor the addition of new technology was associated with readmission. The most common form of new technology was central line followed by nonsurgically placed enteral tube (Appendix Table 2). Finally, in sensitivity analyses (results not detailed), separating new CCC acquired at birth and new CCCs in nonbirth hospitalizations, compared to hospitalizations with no new CCC, yielded similar results as the primary analyses.
DISCUSSION
We examined multiple attributes of polypharmacy—the number of scheduled medications, number of as-needed medications, and number of scheduled doses per 24 hours. Interestingly, only the scheduled medications (count of medication and number of doses) were associated with elevated readmission risk. As-needed medications have heterogeneity in the level of importance from critical (eg, seizure rescue) to discretionary (eg, antipyretics, creams). The burden of managing these types of medications may still be high (ie, parents must decide when to administer a critical medication); however, this burden does not translate into increased readmission risk in this population.
Not surprisingly, greater medical complexity—as defined by higher numbers of scheduled discharge medications and technology assistance—is associated with 30-day readmission risk. Our analyses do not allow us to determine how much of the increased risk is due to additional care burden and risks of polypharmacy versus the inherent increase in complexity and severity of illness for which polypharmacy is a marker. Tailoring discharge regimens to the realities of daily life, with the goal of “minimally disruptive medicine”22,23 (eg, integrating manageable discharge medication routines into school and work schedules), is not a common feature of pediatric discharge planning. For adult patients with complex medical conditions, tailoring medication regimens in a minimally disruptive way is known to improve outcomes.24 Similarly, adopting minimally disruptive techniques to integrate the polypharmacy inherent in discharge could potentially mitigate some of the readmission risks for children and adolescents.
Contrary to our hypothesis, new technologies and new diagnoses did not confer additional readmission risk when accounting for LOS and patient characteristics. One potential explanation is varying risks conveyed by different types of new technologies placed during hospitalization. Central lines, the most common form of new technology, is associated with higher odds of reutilization in unadjusted analyses. However, the second most common form of new technology, nonsurgically placed enteral feeding tube, was not. Further analyses of the differential effects of new technology should be further examined in larger datasets. Additionally, the lack of additional readmission risk from new technology may relate to additional teaching and support provided to families of patients undergoing unfamiliar procedures offsets the risks inherent of greater complexity. If so, it may be that the more intensive teaching and postdischarge support provided to families with new technology or a new diagnosis could be replicated through refresher teaching during hospitalizations, when a patient’s state of health is status quo for the family (ie, the child was admitted and discharged with the same technology and diagnoses). This notion is supported by prior work that demonstrated successful readmission reduction interventions for children with chronic conditions often rely on enhanced education or coaching.25,26
We elected to present models both with and without LOS as a confounder because it is a potentially modifiable attribute of hospitalization. Change in medical complexity aspects were significantly associated with readmission in multivariable models without LOS. However, with the addition of LOS, they were no longer significant. Thus, the readmission risk of new complexity is accounted for by the readmission risk inherent in a longer LOS. This finding prompts additional questions that merit further study: is it that LOS is a general marker for heightened complexity, or is it that a longer LOS can modify readmission risk through additional in-hospital care and time for enhanced education?
Our study has several strengths. We were able to discern true complexity at the time of discharge through medical record review. For example, if a child had a peripherally inserted central catheter placed during hospitalization, it cannot be ascertained through administrative data without medical record review if the technology was removed or in place at discharge. Likewise, medical record review allows for identification of medical technology which is not surgically implanted (eg, nasogastric feeding tubes). Given the “fog” families report as part of their in-hospital experience and its threats to education and postdischarge contingency planning,17 we felt it important to evaluate medical technology regardless of whether or not it was surgically placed. Additionally, the more detailed and nuanced understanding gained of polypharmacy burden can better inform both risk prediction models and interventions to improve the transition from hospital to home.
This study
CONCLUSION
Medical complexity at discharge is associated with pediatric readmission risk. Contrary to our hypothesis, the addition of new technologies and new CCC diagnoses are not associated with pediatric readmission, after accounting for patient and hospitalization factors including LOS. The dynamics of LOS as a risk factor for readmission for children with medical complexity are likely multifaceted and merit further investigation in a multi-institutional study.
Disclosures
The authors report no potential conflicts of interest.
Funding
This work was supported by a grant from the Agency for Healthcare Research and Quality (1K08HS204735-01A1) and a grant from the Blue Cross Blue Shield of Michigan Foundation.
1. Diaz-Caneja A, Gledhill J, Weaver T, Nadel S, Garralda E. A child’s admission to hospital: a qualitative study examining the experiences of parents. Intensive Care Med. 2005;31(9):1248-1254. https://doi.org/10.1007/s00134-005-2728-8.
2. Lapillonne A, Regnault A, Gournay V, et al. Impact on parents of bronchiolitis hospitalization of full-term, preterm and congenital heart disease infants. BMC Pediatrics. 2012;12:171. https://doi.org/10.1186/1471-2431-12-171.
3. Leader S, Jacobson P, Marcin J, Vardis R, Sorrentino M, Murray D. A method for identifying the financial burden of hospitalized infants on families. Value Health. 2002;5(1):55-59. https://doi.org/10.1046/j.1524-4733.2002.51076.x.
4. Leidy NK, Margolis MK, Marcin JP, et al. The impact of severe respiratory syncytial virus on the child, caregiver, and family during hospitalization and recovery. Pediatrics. 2005;115(6):1536-1546. https://doi.org/10.1542/peds.2004-1149.
5. Rennick JE, Johnston CC, Dougherty G, Platt R, Ritchie JA. Children’s psychological responses after critical illness and exposure to invasive technology. J Dev Behav Pediatr. 2002;23(3):133-144. PubMed
6. Brennan TA, Leape LL, Laird NM, et al. Incidence of adverse events and negligence in hospitalized patients. Results of the Harvard Medical Practice Study I. N Engl J Med. 1991;324(6):370-376. https://doi.org/10.1056/NEJM199102073240604.
7. Kohn LT, Corrigan J, Donaldson MS. To err is human: building a safer health system. Washington DC: National Academy Press; 2000.
8. Landrigan CP, Parry GJ, Bones CB, Hackbarth AD, Goldmann DA, Sharek PJ. Temporal trends in rates of patient harm resulting from medical care. N Engl J Med. 2010;363(22):2124-2134. https://doi.org/10.1056/NEJMsa1004404.
9. Magill SS, Edwards JR, Bamberg W, et al. Multistate point-prevalence survey of healthcare-associated infections. N Engl J Med. 2014;370(13):1198-1208. https://doi.org/10.1056/NEJMoa1306801.
10. Berry JG, Toomey SL, Zaslavsky AM, et al. Pediatric readmission prevalence and variability across hospitals. JAMA. 2013;309(4):372-380. https://doi.org/10.1001/jama.2012.188351.
11. Bardach NS, Vittinghoff E, Asteria-Penaloza R, et al. Measuring hospital quality using pediatric readmission and revisit rates. Pediatrics. 2013;132(3):429-436. https://doi.org/10.1542/peds.2012-3527.
12. Toomey SL, Peltz A, Loren S, et al. Potentially preventable 30-day hospital readmissions at a children’s hospital. Pediatrics. 2016;138(2):pii: e20154182. https://doi.org/10.1542/peds.2015-4182.
13. Bucholz EM, Gay JC, Hall M, Harris M, Berry JG. Timing and causes of common pediatric readmissions. J Pediatr. 2018;200:240-248. https://doi.org/10.1016/j.jpeds.2018.04.044.
14. Berry JG, Hall DE, Kuo DZ, et al. Hospital utilization and characteristics of patients experiencing recurrent readmissions within children’s hospitals. JAMA. 2011;305(7):682-690. https://doi.org/10.1001/jama.2011.122.
15. Winer JC, Aragona E, Fields AI, Stockwell DC. Comparison of clinical risk factors among pediatric patients with single admission, multiple admissions (without any 7-day readmissions), and 7-day readmission. Hosp Pediatr. 2016;6(3):119-125. https://doi.org/10.1542/hpeds.2015-0110.
16. Brittan MS, Martin S, Anderson L, Moss A, Torok MR. An electronic health record tool designed to improve pediatric hospital discharge has low predictive utility for readmissions. J Hosp Med. 2018;13(11):779-782. https://doi.org/10.12788/jhm.3043.
17. Solan LG, Beck AF, Brunswick SA, et al. The family perspective on hospital to home transitions: a qualitative study. Pediatrics. 2015;136(6):e1539-e1549. https://doi.org/10.1542/peds.2015-2098.
18. Auger KA, Mueller EL, Weinberg SH, et al. A validated method for identifying unplanned pediatric readmission. J Pediatr. 2016;170:105-112. https://doi.org/10.1016/j.jpeds.2015.11.051.
19. Auger KA, Shah SS, Davis MD, Brady PW. Counting the Ways to Count Medications: The Challenges of Defining Pediatric Polypharmacy. J Hosp Med. 2019;14(8):506-507. https://doi.org/10.12788/jhm.3213.
20. Feudtner C, Feinstein JA, Zhong W, Hall M, Dai D. Pediatric complex chronic conditions classification system version 2: updated for ICD-10 and complex medical technology dependence and transplantation. BMC Pediatrics. 2014;14:199. https://doi.org/10.1186/1471-2431-14-199.
21. Hsieh FY. Sample size tables for logistic regression. Stat Med. 1989;8(7):795-802. https://doi.org/10.1002/sim.4780080704.
22. May C, Montori VM, Mair FS. We need minimally disruptive medicine. BMJ. 2009;339:b2803. https://doi.org/10.1136/bmj.b2803.
23. Leppin AL, Montori VM, Gionfriddo MR. Minimally disruptive medicine: a pragmatically comprehensive model for delivering care to patients with multiple chronic conditions. Healthcare (Basel). 2015;3(1):50-63. https://doi.org/10.3390/healthcare3010050.
24. Serrano V, Spencer-Bonilla G, Boehmer KR, Montori VM. Minimally disruptive medicine for patients with diabetes. Curr Diab Rep. 2017;17(11):104. https://doi.org/10.1007/s11892-017-0935-7.
25. Auger KA, Kenyon CC, Feudtner C, Davis MM. Pediatric hospital discharge interventions to reduce subsequent utilization: a systematic review. J Hosp Med. 2013;9(4):251-260. https://doi.org/10.1002/jhm.2134.
26. Coller RJ, Klitzner TS, Lerner CF, et al. Complex care hospital use and postdischarge coaching: a randomized controlled trial. Pediatrics. 2018;142(2):pii: e20174278. https://doi.org/10.1542/peds.2017-4278.
27. Hain PD, Gay JC, Berutti TW, Whitney GM, Wang W, Saville BR. Preventability of early readmissions at a children’s hospital. Pediatrics. 2013;131(1):e171-e181. https://doi.org/10.1542/peds.2012-0820.
28. Auger KA, Teufel RJ, 2nd, Harris JM, 2nd, et al. Children’s hospital characteristics and readmission metrics. Pediatrics. 2017;139(2). https://doi.org/10.1542/peds.2016-1720.
29. Gay JC, Agrawal R, Auger KA, et al. Rates and impact of potentially preventable readmissions at children’s hospitals. J Pediatr. 2015;166(3):613-619 e615. https://doi.org/10.1016/j.jpeds.2014.10.052.
© 2019 Society of Hospital Medicine
Leading By Example: How Medical Journals Can Improve Representation in Academic Medicine
Women and racial and ethnic minorities remain underrepresented in senior faculty roles and academic leadership positions.1 Participation in peer review and publication in medical journals are important components of academic advancement that are emphasized in the promotion process. These efforts offer recognition of expertise and increase visibility in the scientific community, which may enhance opportunities for networking and collaboration, and provide other opportunities for career advancement. In addition, abundant evidence shows that organizations benefit from diverse teams, with better quality decisions and increased productivity resulting from diverse ideas and perspectives.2
Numerous studies have highlighted the prevalence and persistence of disparities in peer review and authorship.3,4 Much of this work has focused on gender though gaps in these measures likely exist for racial and ethnic minorities. Yet, there are few examples of journals implementing strategies to address disparities and track results of such efforts.5 While institutional barriers to advancement must be addressed, we believe that medical journals have an obligation to address unequal opportunities.
At the Journal of Hospital Medicine, we are committed to leading by example and developing approaches to create equity in all facets of journal leadership and authorship.6 The first step towards progress is to assess the current representation of women and racial and ethnic minorities in our journal community, including first and senior authors, invited expert contributors, reviewers, and editorial team members. Like most journals, we have not collected demographic information from authors or reviewers. But now, as part of the journal’s commitment to this cause, we request that everyone in the journal community (author, reviewer, editor) update their journal account (accessible at https://mc.manuscriptcentral.com/jhm) with demographic data, including gender, race, and ethnicity.
Inclusion of these data is voluntary. While each individual will be able to access and edit their personal demographic data, the individual data will remain private and unviewable to others. As such, it will not be available for nor will it be used in the manuscript review or decision process but rather for assessing our own inclusiveness. We will review these data in aggregate to broadly inform outreach efforts to promote diversity and inclusion in our author, invited expert contributor, reviewer, and journal leadership pools. We will report on the progress of these efforts in upcoming years.
We are committed to equity in providing opportunities for academic advancement across the journal community. Diversity and inclusion are important in raising the quality of the work that we publish. Different perspectives strengthen our journal and will help us continue to advance the field of Hospital Medicine.
Disclosures
The authors have nothing to disclose.
1. American Association of Medical Colleges. U.S. Medical School Faculty, 2018. https://www.aamc.org/data/facultyroster/reports/494946/usmsf18.html. Accessed May 6, 2019.
2. Turban S, Wu D, Zhang L. “When Gender Diversity Makes Firms More Productive” Harvard Business Review Feb 2019. https://hbr.org/2019/02/research-when-gender-diversity-makes-firms-more-productive. Accessed May 6, 2019.
3. Silver JK, Poorman JA, Reilly JM, Spector ND, Goldstein R, Zafonte RD. Assessment of women physicians among authors of perspective-type articles published in high-impact pediatric journals. JAMA Netw Open. 2018;1(3):e180802. doi: 10.1001/jamanetworkopen.2018.0802. PubMed
4. Jagsi R, Guancial EA, Worobey CC, Henault LE, Chang Y, Starr R, Tarbell NJ, Hylek EM. The “gender gap” in authorship of academic medical literature- a 35-year perspective. N Engl J Med. 2006;355(3):281-287. doi: 10.1056/NEJMsa053910. PubMed
5. Nature’s under-representation of women. Nature. 2018;558:344. doi: 10.1038/d41586-018-05465-7. PubMed
6. Shah SS. The Journal of Hospital Medicine in 2019 and beyond. J Hosp Med. 2019;14(1):7. doi: 10.12788/jhm.3143. PubMed
Women and racial and ethnic minorities remain underrepresented in senior faculty roles and academic leadership positions.1 Participation in peer review and publication in medical journals are important components of academic advancement that are emphasized in the promotion process. These efforts offer recognition of expertise and increase visibility in the scientific community, which may enhance opportunities for networking and collaboration, and provide other opportunities for career advancement. In addition, abundant evidence shows that organizations benefit from diverse teams, with better quality decisions and increased productivity resulting from diverse ideas and perspectives.2
Numerous studies have highlighted the prevalence and persistence of disparities in peer review and authorship.3,4 Much of this work has focused on gender though gaps in these measures likely exist for racial and ethnic minorities. Yet, there are few examples of journals implementing strategies to address disparities and track results of such efforts.5 While institutional barriers to advancement must be addressed, we believe that medical journals have an obligation to address unequal opportunities.
At the Journal of Hospital Medicine, we are committed to leading by example and developing approaches to create equity in all facets of journal leadership and authorship.6 The first step towards progress is to assess the current representation of women and racial and ethnic minorities in our journal community, including first and senior authors, invited expert contributors, reviewers, and editorial team members. Like most journals, we have not collected demographic information from authors or reviewers. But now, as part of the journal’s commitment to this cause, we request that everyone in the journal community (author, reviewer, editor) update their journal account (accessible at https://mc.manuscriptcentral.com/jhm) with demographic data, including gender, race, and ethnicity.
Inclusion of these data is voluntary. While each individual will be able to access and edit their personal demographic data, the individual data will remain private and unviewable to others. As such, it will not be available for nor will it be used in the manuscript review or decision process but rather for assessing our own inclusiveness. We will review these data in aggregate to broadly inform outreach efforts to promote diversity and inclusion in our author, invited expert contributor, reviewer, and journal leadership pools. We will report on the progress of these efforts in upcoming years.
We are committed to equity in providing opportunities for academic advancement across the journal community. Diversity and inclusion are important in raising the quality of the work that we publish. Different perspectives strengthen our journal and will help us continue to advance the field of Hospital Medicine.
Disclosures
The authors have nothing to disclose.
1. American Association of Medical Colleges. U.S. Medical School Faculty, 2018. https://www.aamc.org/data/facultyroster/reports/494946/usmsf18.html. Accessed May 6, 2019.
2. Turban S, Wu D, Zhang L. “When Gender Diversity Makes Firms More Productive” Harvard Business Review Feb 2019. https://hbr.org/2019/02/research-when-gender-diversity-makes-firms-more-productive. Accessed May 6, 2019.
3. Silver JK, Poorman JA, Reilly JM, Spector ND, Goldstein R, Zafonte RD. Assessment of women physicians among authors of perspective-type articles published in high-impact pediatric journals. JAMA Netw Open. 2018;1(3):e180802. doi: 10.1001/jamanetworkopen.2018.0802. PubMed
4. Jagsi R, Guancial EA, Worobey CC, Henault LE, Chang Y, Starr R, Tarbell NJ, Hylek EM. The “gender gap” in authorship of academic medical literature- a 35-year perspective. N Engl J Med. 2006;355(3):281-287. doi: 10.1056/NEJMsa053910. PubMed
5. Nature’s under-representation of women. Nature. 2018;558:344. doi: 10.1038/d41586-018-05465-7. PubMed
6. Shah SS. The Journal of Hospital Medicine in 2019 and beyond. J Hosp Med. 2019;14(1):7. doi: 10.12788/jhm.3143. PubMed
© 2019 Society of Hospital Medicine
Progress (?) Toward Reducing Pediatric Readmissions
Readmission rates have been used by payers to administer financial incentives or penalties to hospitals as a measure of quality. The Centers for Medicare and Medicaid Services (CMS) reduces payments to hospitals with excess readmissions for adult Medicare patients.1 Although the Medicare readmission penalties do not apply to children, several state Medicaid agencies have adopted policies to reduce reimbursement for hospitals with higher than expected readmission rates. These Medicaid programs often use potentially preventable readmission (PPR) rates calculated with proprietary software.2 As a result of these incentives and with a goal of improving care, many children’s hospitals have focused on reducing readmissions through participation in local, regional, and national collaboratives.3
Rates of unplanned readmissions in children are lower than in older adults, with all-cause 30-day pediatric readmission rates around 13%.4-7 Even so, as many as 30% of pediatric readmissions may be potentially preventable, with the most common transition failure involving a hospital factor, such as failure to recognize worsening clinical status prior to discharge.8 While readmission metrics are often judged across peer institutions, little is known about national trends over time. Therefore, we sought to examine readmission rates at children’s hospitals over a six-year timeframe to determine if progress has been made toward reducing readmissions.
METHODS
We utilized data from the Children’s Hospital Association Inpatient Essentials Database and included index hospitalizations from January 1, 2010 through June 30, 2016. This database contains demographic information, diagnosis and procedure codes, and All-Patient Refined Diagnosis-Related Groups (APR-DRGs; 3M Health Information Systems) to describe the principal reason for each hospitalization.9 We included 66 hospitals from 31 states plus the District of Columbia with complete data during the study period.
Seven-day all-cause (AC) readmission and PPR rates were calculated using the output from 3M potentially preventable readmission software (version 32). The PPR software utilizes a proprietary algorithm to designate potentially preventable readmissions based on diagnosis codes and the severity of illness (as measured by the APR-DRG severity of illness classification). We chose seven-day readmissions, as opposed to a longer window, as readmissions soon after discharge are more likely to be preventable8 and thus theoretically more amenable to prevention efforts. Quarterly rates were generated for each hospital and in aggregate across the population. We chose quarterly rates a priori to assess changes in rates without focusing on minor monthly fluctuations due to seasonal differences. We performed generalized linear mixed regression models with cluster adjustments at the hospital level to assess changes in readmission rates over time adjusted for case mix index, as admissions to children’s hospitals have increased in complexity over time.10,11 We operationalized the case mix index as an average of pediatric admissions’ relative weights at each hospital for the quarter.12 We assessed AC and PPR models separately. The average case mix index was a covariate in both regression models.
Finally, to determine if readmission reduction may be specific to particular conditions, we generated readmission rates for a select number of APR-DRGs. We focused on conditions with a very high percentage of AC readmissions classified as PPR (appendectomy, connective tissue disorders, ventricular shunt procedures, bronchiolitis, asthma, and sickle cell crisis) as well as those with a very low percentage of AC readmissions classified as PPR (gastrointestinal infections, hematologic disease, and bone marrow transplant [BMT]).5
RESULTS
We included 4.52 million admissions to the 66 included hospitals. Most hospitals (62%) were freestanding acute-care children’s hospitals. The hospitals were geographically diverse. Two-thirds had magnet status (Appendix Table 1). Appendix Table 2 displays patient/admission characteristics over time. Approximately 49% of children were non-Hispanic white, 19% were non-Hispanic black, and 19% were Hispanic. Half of the children were insured by Medicaid. These characteristics were stable over time, except case mix index, which increased during the study period (P = .04).
Across Diagnosis All-Cause and Potentially Preventable Readmission Rates
Over the study period, there were 227,378 AC seven-day readmissions (5.1% readmission rate), and 91,467 readmissions (40% of AC readmissions) were considered PPRs. Readmission rates did not vary over the study period (Figure, Panel A). The median AC seven-day readmission rate across all quarters was 5.1%, ranging from 4.3% to 5.3% (Figure, Panels A and B). The median seven-day PPR rate across all quarters was 2.5% and ranged from 2.1% to 2.5% (Figure, Panels A and C). When adjusted for case mix index, the AC rate increased slightly (on average 0.006% increase per quarter, P = .01) and PPR rates were unchanged over time (PPR model P = .14; Figure, Panel D).
Condition-Specific Readmission Rates
Of the condition-specific readmission rates, only the AC rate for BMT changed significantly, with a decrease of 0.1% per quarter, P = .048. None of the conditions had significant trends in increasing or decreasing readmission in PPR rates. Some conditions, including sickle cell and cerebrospinal fluid ventricular shunt procedures, had fluctuating readmission rates throughout the study period (Appendix Figure, Panels A-G).
DISCUSSION
Despite substantial national efforts to reduce pediatric readmissions,3 seven-day readmission rates at children’s hospitals have not decreased over six years. When individual conditions are examined, there are minor fluctuations of readmission rates over time but no clear trend of decreased readmission events.
Our results are contrary to findings in the Medicare population, where 30-day readmission rates have decreased over time.13,14 In these analyses, we focused on seven-day readmission, as earlier pediatric readmissions are more likely to be preventable. Importantly, the majority of our included hospitals (88%) participate in the Solutions for Patient Safety collaborative, which focuses on reducing seven-day readmissions. Thus, we are confident that a concerted effort to decrease readmission has been ongoing. Further, our findings are contrary to recent analyses indicating an increase in pediatric readmission rates using the pediatric all-condition readmission rate in the National Readmission Database.15 Our analyses are distinctly different in that they allow a focus on hospital-level performance in children’s hospitals. Although in our analyses the all-cause adjusted readmission rate did increase significantly over time (0.006% a quarter or 0.024% per year), this small increase is unlikely to be clinically relevant.
There are several potential reasons for the lack of change in pediatric readmission rates despite concerted efforts to decrease readmissions. First, pediatric readmissions across all conditions are relatively infrequent compared with adult readmission rates. Extrapolating from the largest pediatric study on readmission preventability,8 it is estimated that only two in 100 pediatric hospitalizations results in a PPR.16 Given the lack of robust pediatric readmission prediction tools, the ability to prospectively identify children at high risk for readmission and target interventions is challenging. Second, as we have previously described, children are readmitted after hospitalization for a wide variety of conditions.5 Medicare readmission penalties are leveraged on specific conditions; yet, Medicaid policies include all conditions. In pediatrics, successful interventions to reduce readmissions have focused on hospitalizations for specific conditions.17 In the only two large pediatric readmission reduction trials across multiple conditions, postdischarge homecare nursing contact did not reduce reutilization.18,19 It is challenging to decrease readmissions in heterogenous populations without a robust set of evidence-based interventions. Third, there are multiple ways to measure pediatric readmissions, and different institutions may focus on different methods. Given the proprietary nature and the reliance on retrospective administrative data, PPR rates cannot be assessed during admission and thus are not feasible as a real-time quality improvement outcome. Fourth, in contrast to other hospital quality metrics such as central line-associated bloodstream infections or catheter-associated urinary tract infection, the locus of control for readmission is not entirely within the purview of the hospital.
It is unclear what readmission rate in children is appropriate—or safe—and whether that level has already been met. National readmission prevention efforts may have collateral benefits such as improved communication, medication errors or adherence, and other important aspects of care during transitions. In this scenario, lower readmission rates may not reflect improved quality. Future research should focus on determining if and how readmission reduction efforts are helping to ease the transition to home. Alternatively, research should determine if there are better interventions to assist with transition challenges which should receive resources divested from failing readmission reduction efforts.
Using administrative data, we are limited in delineating truly preventable readmissions from nonpreventable readmissions. Nevertheless, we chose to focus on the PPR and AC metrics, as these are the most policy-relevant metrics. Additionally, we examined aggregate rates of readmission across a cohort of hospitals and did not assess for within-hospital changes in readmission rates. Thus, it is possible (and likely) that some hospitals saw improvements and others saw increases in readmission rates during the study period. We are unable to examine readmission rates at hospitals based on investment in readmission reduction efforts or individual state Medicaid reimbursement policies. Finally, we are unable to assess readmissions to other institutions; however, it is unlikely that readmissions to other hospitals have decreased significantly when readmissions to the discharging hospital have not changed.
Pediatric readmissions at children’s hospitals have not decreased in the past six years, despite widespread readmission reduction efforts. Readmission rates for individual conditions have fluctuated but have not decreased.
Disclosures
Dr. Auger reports grants from AHRQ, during the conduct of the study. Drs. Harris, Gay, Teufel, McLead, Neuman, Peltz, Morse, Del Beccaro, Simon, Argawal, and Fieldston have nothing to disclose. Dr. Shah is the Editor-in-Chief of the Journal of Hospital Medicine.
Funding
Dr. Auger’s research is funded by a K08 award from the Agency for Healthcare Research and Quality (1K08HS024735-01A).
1. Centers for Medicare & Medicaid Services. Readmissions Reduction Program (HRRP). https://www.cms.gov/Medicare/Medicare-Fee-for-Service-Payment/AcuteInpatientPPS/Readmissions-Reduction-Program.html. Accessed January 19, 2018.
2. 3M Health Information Systems. Potentially Preventable Readmissions Classification System: Methodology Overview. http://multimedia.3m.com/mws/media/1042610O/resources-and-references-his-2015.pdf. Accessed April 5, 2019.
3. Children’s Hospitals’ Solutions for Patient Safety. SPS prevention bundles: readmission. http://www.solutionsforpatientsafety.org/wp-content/uploads/SPS-Prevention-Bundles.pdf. Accessed January 11, 2017.
4. Berry JG, Toomey SL, Zaslavsky AM, et al. Pediatric readmission prevalence and variability across hospitals. JAMA. 2013;309(4):372-380. https://doi.org/10.1001/jama.2012.188351.
5. Gay JC, Agrawal R, Auger KA, et al. Rates and impact of potentially preventable readmissions at children’s hospitals. J Pediatr. 2015;166(3):613-619. https://doi.org/10.1016/j.jpeds.2014.10.052.
6. Auger KA, Teufel RJ, Harris JM, et al. Children’s hospital characteristics and readmission metrics. Pediatrics. 2017;139(2):e20161720. https://doi.org/10.1542/peds.2016-1720.
7. Joynt KE, Orav EJ, Jha AK. Thirty-day readmission rates for medicare beneficiaries by race and site of care. JAMA. 2011;305(7):675-681. https://doi.org/10.1001/jama.2011.123.
8. Toomey SL, Peltz A, Loren S, et al. Potentially preventable 30-day hospital readmissions at a children’s hospital. Pediatrics. 2016;138(2):e20154182. doi: 10.1542/peds.2015-4182.
9. Children’s Hospital Association. Pediatric analytic solutions. https://www.childrenshospitals.org/Programs-and-Services/Data-Analytics-and-Research/Pediatric-Analytic-Solutions. Accessed June 2, 2018.
10. Simon TD, Berry J, Feudtner C, et al. Children with complex chronic conditions in inpatient hospital settings in the United States. Pediatrics. 2010;126(4):647-655. https://doi.org/10.1542/peds.2009-3266.
11. Berry JG, Hall M, Hall DE, et al. Inpatient growth and resource use in 28 children’s hospitals: a longitudinal, multi-institutional study. JAMA Pediatr. 2013;167(2):170-177.https://doi.org/10.1001/jamapediatrics.2013.432.
12. Richardson T, Rodean J, Harris M, et al. Development of hospitalization resource intensity scores for kids (H-RISK) and comparison across pediatric populations. J Hosp Med. 2018;13(9):602-608. https://doi.org/10.12788/jhm.2948.
13. Zuckerman RB, Sheingold SH, Orav EJ, Ruhter J, Epstein AM. Readmissions, observation, and the hospital readmissions reduction program. N Engl J Med. 2016;374(16):1543-1551. https://doi.org/10.1056/NEJMsa1513024.
14. Desai NR, Ross JS, Kwon JY, et al. Association between hospital penalty status under the hospital readmission reduction program and readmission rates for target and nontarget conditions. JAMA. 2016;316(24):2647-2656. https://doi.org/10.1001/jama.2016.18533.
15. Bucholz EM, Toomey SL, Schuster MA. Trends in pediatric hospitalizations and readmissions: 2010-2016. Pediatrics. 2019;143(2):e20181958. https://doi.org/10.1542/peds.2018-1958.
16. Brittan M, Shah SS, Auger KA. Preventing pediatric readmissions: how does the hospital fit in? Pediatrics. 2016;138(2):e20161643. https://doi.org/10.1542/peds.2016-1643.
17. Auger KA, Kenyon CC, Feudtner C, Davis MM. Pediatric hospital discharge interventions to reduce subsequent utilization: a systematic review. J Hosp Med. 2014;9(4):251-260. https://doi.org/10.1002/jhm.2134.
18. Auger KA, Simmons JM, Tubbs-Cooley H, et al. Hospital to home outcomes (H2O) randomized trial of a post-discharge nurse home visit. Pediatrics. In press.
19. Auger KA, Shah SS, Tubbs-Cooley HL, et al. Effects of a 1-time nurse-led telephone call after pediatric discharge: the H2O II randomized clinical trial. JAMA Pediatr. 2018;172(9):e181482. https://doi.org/10.1001/jamapediatrics.2018.1482.
Readmission rates have been used by payers to administer financial incentives or penalties to hospitals as a measure of quality. The Centers for Medicare and Medicaid Services (CMS) reduces payments to hospitals with excess readmissions for adult Medicare patients.1 Although the Medicare readmission penalties do not apply to children, several state Medicaid agencies have adopted policies to reduce reimbursement for hospitals with higher than expected readmission rates. These Medicaid programs often use potentially preventable readmission (PPR) rates calculated with proprietary software.2 As a result of these incentives and with a goal of improving care, many children’s hospitals have focused on reducing readmissions through participation in local, regional, and national collaboratives.3
Rates of unplanned readmissions in children are lower than in older adults, with all-cause 30-day pediatric readmission rates around 13%.4-7 Even so, as many as 30% of pediatric readmissions may be potentially preventable, with the most common transition failure involving a hospital factor, such as failure to recognize worsening clinical status prior to discharge.8 While readmission metrics are often judged across peer institutions, little is known about national trends over time. Therefore, we sought to examine readmission rates at children’s hospitals over a six-year timeframe to determine if progress has been made toward reducing readmissions.
METHODS
We utilized data from the Children’s Hospital Association Inpatient Essentials Database and included index hospitalizations from January 1, 2010 through June 30, 2016. This database contains demographic information, diagnosis and procedure codes, and All-Patient Refined Diagnosis-Related Groups (APR-DRGs; 3M Health Information Systems) to describe the principal reason for each hospitalization.9 We included 66 hospitals from 31 states plus the District of Columbia with complete data during the study period.
Seven-day all-cause (AC) readmission and PPR rates were calculated using the output from 3M potentially preventable readmission software (version 32). The PPR software utilizes a proprietary algorithm to designate potentially preventable readmissions based on diagnosis codes and the severity of illness (as measured by the APR-DRG severity of illness classification). We chose seven-day readmissions, as opposed to a longer window, as readmissions soon after discharge are more likely to be preventable8 and thus theoretically more amenable to prevention efforts. Quarterly rates were generated for each hospital and in aggregate across the population. We chose quarterly rates a priori to assess changes in rates without focusing on minor monthly fluctuations due to seasonal differences. We performed generalized linear mixed regression models with cluster adjustments at the hospital level to assess changes in readmission rates over time adjusted for case mix index, as admissions to children’s hospitals have increased in complexity over time.10,11 We operationalized the case mix index as an average of pediatric admissions’ relative weights at each hospital for the quarter.12 We assessed AC and PPR models separately. The average case mix index was a covariate in both regression models.
Finally, to determine if readmission reduction may be specific to particular conditions, we generated readmission rates for a select number of APR-DRGs. We focused on conditions with a very high percentage of AC readmissions classified as PPR (appendectomy, connective tissue disorders, ventricular shunt procedures, bronchiolitis, asthma, and sickle cell crisis) as well as those with a very low percentage of AC readmissions classified as PPR (gastrointestinal infections, hematologic disease, and bone marrow transplant [BMT]).5
RESULTS
We included 4.52 million admissions to the 66 included hospitals. Most hospitals (62%) were freestanding acute-care children’s hospitals. The hospitals were geographically diverse. Two-thirds had magnet status (Appendix Table 1). Appendix Table 2 displays patient/admission characteristics over time. Approximately 49% of children were non-Hispanic white, 19% were non-Hispanic black, and 19% were Hispanic. Half of the children were insured by Medicaid. These characteristics were stable over time, except case mix index, which increased during the study period (P = .04).
Across Diagnosis All-Cause and Potentially Preventable Readmission Rates
Over the study period, there were 227,378 AC seven-day readmissions (5.1% readmission rate), and 91,467 readmissions (40% of AC readmissions) were considered PPRs. Readmission rates did not vary over the study period (Figure, Panel A). The median AC seven-day readmission rate across all quarters was 5.1%, ranging from 4.3% to 5.3% (Figure, Panels A and B). The median seven-day PPR rate across all quarters was 2.5% and ranged from 2.1% to 2.5% (Figure, Panels A and C). When adjusted for case mix index, the AC rate increased slightly (on average 0.006% increase per quarter, P = .01) and PPR rates were unchanged over time (PPR model P = .14; Figure, Panel D).
Condition-Specific Readmission Rates
Of the condition-specific readmission rates, only the AC rate for BMT changed significantly, with a decrease of 0.1% per quarter, P = .048. None of the conditions had significant trends in increasing or decreasing readmission in PPR rates. Some conditions, including sickle cell and cerebrospinal fluid ventricular shunt procedures, had fluctuating readmission rates throughout the study period (Appendix Figure, Panels A-G).
DISCUSSION
Despite substantial national efforts to reduce pediatric readmissions,3 seven-day readmission rates at children’s hospitals have not decreased over six years. When individual conditions are examined, there are minor fluctuations of readmission rates over time but no clear trend of decreased readmission events.
Our results are contrary to findings in the Medicare population, where 30-day readmission rates have decreased over time.13,14 In these analyses, we focused on seven-day readmission, as earlier pediatric readmissions are more likely to be preventable. Importantly, the majority of our included hospitals (88%) participate in the Solutions for Patient Safety collaborative, which focuses on reducing seven-day readmissions. Thus, we are confident that a concerted effort to decrease readmission has been ongoing. Further, our findings are contrary to recent analyses indicating an increase in pediatric readmission rates using the pediatric all-condition readmission rate in the National Readmission Database.15 Our analyses are distinctly different in that they allow a focus on hospital-level performance in children’s hospitals. Although in our analyses the all-cause adjusted readmission rate did increase significantly over time (0.006% a quarter or 0.024% per year), this small increase is unlikely to be clinically relevant.
There are several potential reasons for the lack of change in pediatric readmission rates despite concerted efforts to decrease readmissions. First, pediatric readmissions across all conditions are relatively infrequent compared with adult readmission rates. Extrapolating from the largest pediatric study on readmission preventability,8 it is estimated that only two in 100 pediatric hospitalizations results in a PPR.16 Given the lack of robust pediatric readmission prediction tools, the ability to prospectively identify children at high risk for readmission and target interventions is challenging. Second, as we have previously described, children are readmitted after hospitalization for a wide variety of conditions.5 Medicare readmission penalties are leveraged on specific conditions; yet, Medicaid policies include all conditions. In pediatrics, successful interventions to reduce readmissions have focused on hospitalizations for specific conditions.17 In the only two large pediatric readmission reduction trials across multiple conditions, postdischarge homecare nursing contact did not reduce reutilization.18,19 It is challenging to decrease readmissions in heterogenous populations without a robust set of evidence-based interventions. Third, there are multiple ways to measure pediatric readmissions, and different institutions may focus on different methods. Given the proprietary nature and the reliance on retrospective administrative data, PPR rates cannot be assessed during admission and thus are not feasible as a real-time quality improvement outcome. Fourth, in contrast to other hospital quality metrics such as central line-associated bloodstream infections or catheter-associated urinary tract infection, the locus of control for readmission is not entirely within the purview of the hospital.
It is unclear what readmission rate in children is appropriate—or safe—and whether that level has already been met. National readmission prevention efforts may have collateral benefits such as improved communication, medication errors or adherence, and other important aspects of care during transitions. In this scenario, lower readmission rates may not reflect improved quality. Future research should focus on determining if and how readmission reduction efforts are helping to ease the transition to home. Alternatively, research should determine if there are better interventions to assist with transition challenges which should receive resources divested from failing readmission reduction efforts.
Using administrative data, we are limited in delineating truly preventable readmissions from nonpreventable readmissions. Nevertheless, we chose to focus on the PPR and AC metrics, as these are the most policy-relevant metrics. Additionally, we examined aggregate rates of readmission across a cohort of hospitals and did not assess for within-hospital changes in readmission rates. Thus, it is possible (and likely) that some hospitals saw improvements and others saw increases in readmission rates during the study period. We are unable to examine readmission rates at hospitals based on investment in readmission reduction efforts or individual state Medicaid reimbursement policies. Finally, we are unable to assess readmissions to other institutions; however, it is unlikely that readmissions to other hospitals have decreased significantly when readmissions to the discharging hospital have not changed.
Pediatric readmissions at children’s hospitals have not decreased in the past six years, despite widespread readmission reduction efforts. Readmission rates for individual conditions have fluctuated but have not decreased.
Disclosures
Dr. Auger reports grants from AHRQ, during the conduct of the study. Drs. Harris, Gay, Teufel, McLead, Neuman, Peltz, Morse, Del Beccaro, Simon, Argawal, and Fieldston have nothing to disclose. Dr. Shah is the Editor-in-Chief of the Journal of Hospital Medicine.
Funding
Dr. Auger’s research is funded by a K08 award from the Agency for Healthcare Research and Quality (1K08HS024735-01A).
1. Centers for Medicare & Medicaid Services. Readmissions Reduction Program (HRRP). https://www.cms.gov/Medicare/Medicare-Fee-for-Service-Payment/AcuteInpatientPPS/Readmissions-Reduction-Program.html. Accessed January 19, 2018.
2. 3M Health Information Systems. Potentially Preventable Readmissions Classification System: Methodology Overview. http://multimedia.3m.com/mws/media/1042610O/resources-and-references-his-2015.pdf. Accessed April 5, 2019.
3. Children’s Hospitals’ Solutions for Patient Safety. SPS prevention bundles: readmission. http://www.solutionsforpatientsafety.org/wp-content/uploads/SPS-Prevention-Bundles.pdf. Accessed January 11, 2017.
4. Berry JG, Toomey SL, Zaslavsky AM, et al. Pediatric readmission prevalence and variability across hospitals. JAMA. 2013;309(4):372-380. https://doi.org/10.1001/jama.2012.188351.
5. Gay JC, Agrawal R, Auger KA, et al. Rates and impact of potentially preventable readmissions at children’s hospitals. J Pediatr. 2015;166(3):613-619. https://doi.org/10.1016/j.jpeds.2014.10.052.
6. Auger KA, Teufel RJ, Harris JM, et al. Children’s hospital characteristics and readmission metrics. Pediatrics. 2017;139(2):e20161720. https://doi.org/10.1542/peds.2016-1720.
7. Joynt KE, Orav EJ, Jha AK. Thirty-day readmission rates for medicare beneficiaries by race and site of care. JAMA. 2011;305(7):675-681. https://doi.org/10.1001/jama.2011.123.
8. Toomey SL, Peltz A, Loren S, et al. Potentially preventable 30-day hospital readmissions at a children’s hospital. Pediatrics. 2016;138(2):e20154182. doi: 10.1542/peds.2015-4182.
9. Children’s Hospital Association. Pediatric analytic solutions. https://www.childrenshospitals.org/Programs-and-Services/Data-Analytics-and-Research/Pediatric-Analytic-Solutions. Accessed June 2, 2018.
10. Simon TD, Berry J, Feudtner C, et al. Children with complex chronic conditions in inpatient hospital settings in the United States. Pediatrics. 2010;126(4):647-655. https://doi.org/10.1542/peds.2009-3266.
11. Berry JG, Hall M, Hall DE, et al. Inpatient growth and resource use in 28 children’s hospitals: a longitudinal, multi-institutional study. JAMA Pediatr. 2013;167(2):170-177.https://doi.org/10.1001/jamapediatrics.2013.432.
12. Richardson T, Rodean J, Harris M, et al. Development of hospitalization resource intensity scores for kids (H-RISK) and comparison across pediatric populations. J Hosp Med. 2018;13(9):602-608. https://doi.org/10.12788/jhm.2948.
13. Zuckerman RB, Sheingold SH, Orav EJ, Ruhter J, Epstein AM. Readmissions, observation, and the hospital readmissions reduction program. N Engl J Med. 2016;374(16):1543-1551. https://doi.org/10.1056/NEJMsa1513024.
14. Desai NR, Ross JS, Kwon JY, et al. Association between hospital penalty status under the hospital readmission reduction program and readmission rates for target and nontarget conditions. JAMA. 2016;316(24):2647-2656. https://doi.org/10.1001/jama.2016.18533.
15. Bucholz EM, Toomey SL, Schuster MA. Trends in pediatric hospitalizations and readmissions: 2010-2016. Pediatrics. 2019;143(2):e20181958. https://doi.org/10.1542/peds.2018-1958.
16. Brittan M, Shah SS, Auger KA. Preventing pediatric readmissions: how does the hospital fit in? Pediatrics. 2016;138(2):e20161643. https://doi.org/10.1542/peds.2016-1643.
17. Auger KA, Kenyon CC, Feudtner C, Davis MM. Pediatric hospital discharge interventions to reduce subsequent utilization: a systematic review. J Hosp Med. 2014;9(4):251-260. https://doi.org/10.1002/jhm.2134.
18. Auger KA, Simmons JM, Tubbs-Cooley H, et al. Hospital to home outcomes (H2O) randomized trial of a post-discharge nurse home visit. Pediatrics. In press.
19. Auger KA, Shah SS, Tubbs-Cooley HL, et al. Effects of a 1-time nurse-led telephone call after pediatric discharge: the H2O II randomized clinical trial. JAMA Pediatr. 2018;172(9):e181482. https://doi.org/10.1001/jamapediatrics.2018.1482.
© 2019 Society of Hospital Medicine
Comparison of Parent Report with Administrative Data to Identify Pediatric Reutilization Following Hospital Discharge
Prior healthcare utilization predicts future utilization;1 thus, providers should know when a child has had a recent healthcare visit. Healthcare providers typically obtain this information from parents and caregivers, who may not always provide accurate information.2-4
The Hospital to Home Outcomes study (H2O) was a randomized controlled trial conducted to assess the effects of a one-time home nurse visit following discharge on unplanned healthcare reutilization.5 We assessed reutilization through two sources: parent report via a postdischarge telephone call and administrative data. In this analysis, we sought to understand differences in reutilization rates by source by comparing parent report with administrative data.
METHODS
The H2O trial included children (<18 years) hospitalized on the hospital medicine (HM) or neuroscience (Neurology/Neurosurgery) services at Cincinnati Children’s Hospital Medical Center (CCHMC) from February 2015 to April 2016; they had an English-speaking parent and were discharged to home without skilled nursing care.6 For this analysis, we restricted the sample to children randomized to the control arm (discharge without a home visit), which reflects typical clinical care.
We used administrative data to capture 14-day reutilization (unplanned hospital readmissions, emergency department [ED] visits, or urgent care visits). CCHMC is the only pediatric admitting facility in the region and includes two pediatric EDs and five urgent care centers. We supplemented hospital data with a dataset (The Health Collaborative7) that included utilization at other regional facilities. Parent report was assessed via a research coordinator phone call 14-23 days after discharge. Parents were asked: “I’m going to [ask] about your child’s health since [discharge date]. Has s/he been hospitalized overnight? Has s/he been taken to the Emergency Room/Emergency Department (didn’t stay overnight)? Has s/he been taken to an urgent care?” We report 14-day reutilization rates by source (parent and/or administrative) and visit type.
We considered administrative data the gold standard for documentation of reutilization events for two reasons. First, all healthcare encounters generate billing and are therefore documented with verifiable coding. Second, we had access to data from our center and other regional healthcare facilities. Any parent-reported utilization to a facility not documented in either dataset was considered an unverifiable event (eg, outside our catchment region). Agreement between administrative and parent report of 14-day reutilization was summarized as positive agreement (reutilization documented in both administrative and parent report), negative agreement (no reutilization reported in either administrative or parent report), and overall agreement (combination of positive and negative agreement). We classified discrepancies as reutilization events in administrative data without parent report of reutilization or vice versa. We performed medical record review of discrepancies in our institutional data.
We summarized agreement by using the Cohen’s kappa statistic by reuse type (hospital readmission, ED, and urgent care visit) and overall (any reutilization event). Strength of agreement based on the kappa statistics was classified as poor (<0.20), fair (0.21-0.40), moderate (0.41-0.60), good (0.61-0.80), and very good (0.81-1.00).8 We used McNemar’s test to evaluate marginal homogeneity.
RESULTS
Of 749 children randomized to the standard of care arm, 723 parents completed the 14-day follow-up call and were included in this analysis. The median child age was two years (interquartile range: 0.4, 6.9), the median length of stay (LOS) was two days (1, 3), and the majority were white (62%). Payer mix varied, with 44% privately insured and 54% publicly insured. Most patients (83%) were admitted to the HM service, and the most common diagnoses groups for index admission were respiratory (35%), neurologic (14%), and gastrointestinal (9%) diseases.
Administrative data showed 63 children with any reutilization event; parents reported 63 with any reutilization event; 48 children had events reported by both sources. The overall agreement was high, ranging from 95.9% to 98.5% (Table 1) depending on visit type. The positive agreement (ie, parent and administrative data indicated reutilization) ranged from 47.6% to 76.2%. Negative agreement (ie, parent and administrative data agreed no reutilization) was very high, 97.7% to 99.2%. Parents reported three ED visits and four urgent care visits that were unverifiable due to lack of access to administrative data (sites of care reported were not included in our datasets).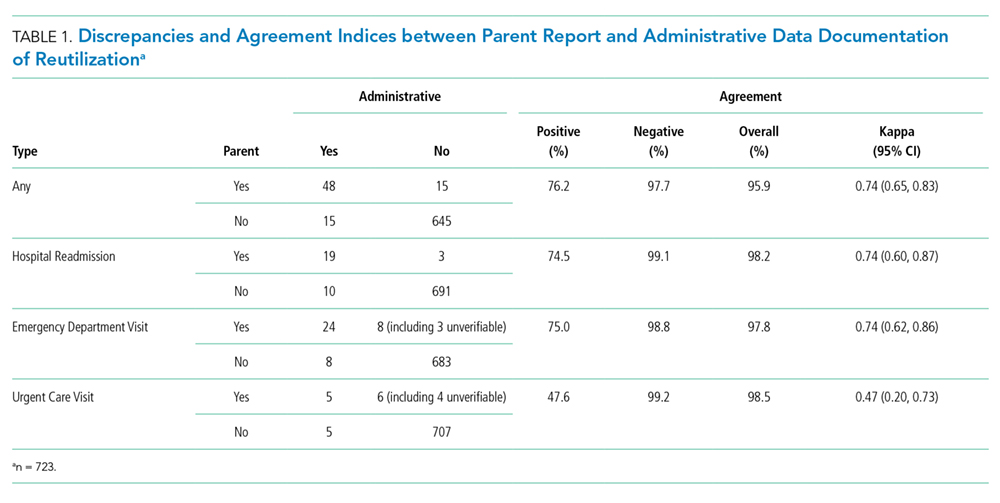
The kappa statistics indicated good agreement between parent report and administrative data for hospital readmission, ED visit, and composite any type of reutilization but moderate agreement for urgent care visit (Table 1).
Discrepancies were noted between parent report and administrative data (Table 2). In 15 children, a parent reported no reutilization when the administrative data included one; in 15 children, a parent reported a reutilization (including seven unverifiable events) when the administrative data revealed none. However, a few discrepancies were due to the incorrect site of care report (Table 2). Chart review of discrepancies involving CCHMC locations verified the accuracy of administrative data except in one case. In this case, a child’s ED revisit appeared to be a separate encounter but actually led to a hospital readmission.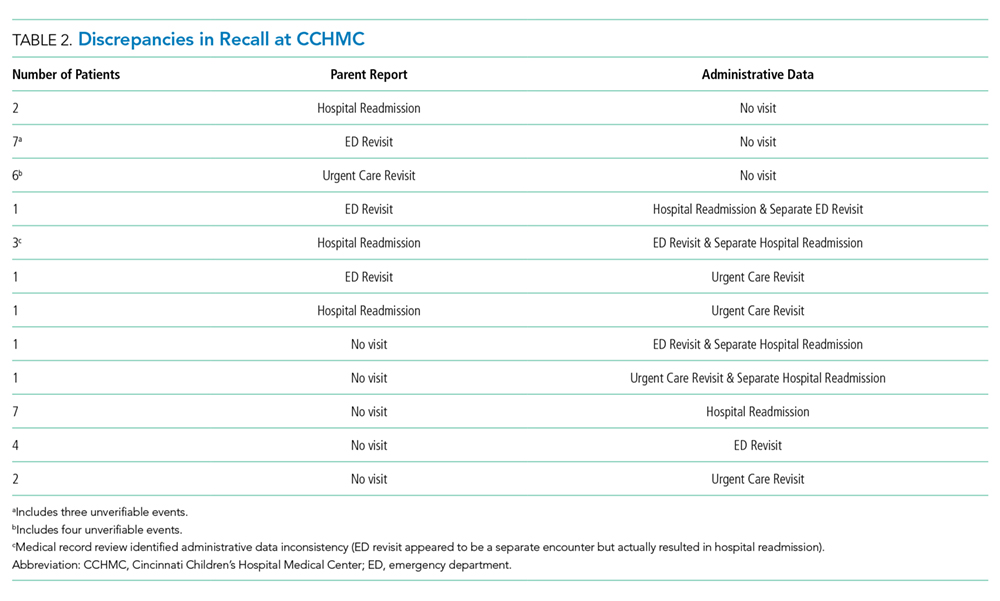
The 14-day reutilization rates by type (any, hospital readmission, ED visit, and urgent care visit) and data source (administrative data only, parent report only, and administrative or parent report) are depicted in the Appendix. Reutilization rates were similar when computed using administrative only or parent report only. However, reutilization rates increased slightly if a composite measure of any administrative data or parent report was utilized. No significant difference was found between administrative data and parent report in the marginal reuse proportions, with McNemar’s test P values all >.05 for hospital readmission, ED visit, and urgent care visit evaluated separately.
DISCUSSION
By comparing parent report of reutilization after hospital discharge through postdischarge phone calls with administrative data, we demonstrated high overall agreement between sources (95.9%); this finding is similar to prior research investigating the relationship between an established medical home and reutilization.9 However, this agreement is largely due to both sources reporting no reutilization. When revisits did occur, the agreement was notably lower, especially with regard to urgent care visits.
Discrepancies between sources have several possible explanations. First, parents may be confused by the framing of reutilization questions, perhaps lacking clarity around which visit we were referencing. Second, parents may experience limitations in health literacy10,11 with a lack of familiarity with healthcare language, such as the ability to delineate location types (for example, a parent may identify an urgent care visit as an ED visit, given their close proximity at our facility). Finally, our prior work identified that the “fog” of hospitalization,12 which is often a stressful and disruptive time for families, may linger after admission and could lead to difficulty in recalling detailed events.
Our findings have implications for effective care in a complex healthcare system where parent report may be the most practical method to obtain historical information, both within clinical care and in the context of research or quality measures, such as postdischarge utilization. Given that one of the greatest risk factors for readmission is prior utilization,1 the knowledge that a patient experienced a reutilization after a prior discharge might prompt the inpatient provider to better prepare families for subsequent transition to home.
To apply our findings practically, it is important to realize that a parent report may be sufficient when reporting that no revisit occurred, if there is also no record of a visit in accessible administrative data (such as an electronic health record). However, further questions or investigation should be considered when parents report a visit did occur or when administrative data indicate a visit occurred that the parent does not recall. Providers and researchers alike should remember to use health literacy universal precautions with all families, employing plain language without medical jargon.13 As linked electronic health record use becomes more prevalent, administrative data may be accessible in real-time, allowing for verification of family interview information. Administrative data beyond a single hospital system should be considered to effectively capture reutilization for research or quality efforts.
Our study has several limitations. Similar to most studies using reutilization outcomes, our data may miss a few unverifiable reuse events. By supplementing with additional regional data,7 we likely captured most events. Second, we did not include patients with limited English proficiency, although it is unclear how this might have biased our results. Third, while relatively few families did not complete the calls, it is possible that more discrepancies would have been noted in nonresponders. Fourth, research coordinators administering the calls followed a script to determine reutilization information; in clinical practice, a practitioner might not ask questions as clearly, which could negatively impact recall or might add clarifying follow-up questions to enhance recall. Finally, the analysis occurred in the setting of a randomized controlled trial that included children with relatively noncomplex health conditions with short LOS;6 thus, the results may not apply to other populations.
In conclusion, parent report and administrative data of reutilization following hospital discharge were usually in agreement when no reutilization occurred; however, discrepancies were noted more often when reutilizations occurred and may have care implications.
Collaborators
On behalf of the H2O Trial study group including: Joanne Bachus, BSN, RN; Andrew F. Beck, MD, MPH; Monica L. Borell, BSN, RN; Lenisa V. Chang, MA, PhD; Patricia Crawford, RN; Jennifer M. Gold, MSN, RN; Judy A. Heilman BSN, RN; Jane C. Khoury, PhD; Pierce Kuhnell, MS; Karen Lawley, BSN, RN; Allison Loechtenfeldt, BS; Colleen Mangeot, MS; Lynn O’Donnell, BSN, RN; Rita H. Pickler, PhD, RN; Hadley S. Sauers-Ford, MPH; Anita N. Shah, DO, MPH; Susan N. Sherman, DPA; Lauren G. Solan, MD, MEd; Karen P. Sullivan, BSN, RN; Susan Wade-Murphy, MSN, RN
Disclosures
Hospital to Home Outcomes team reports grants from the Patient Centered Outcomes Research Institute during the conduct of the study. Dr. White reports personal fees from the Institute for Health Care Improvement, outside the submitted work.
Funding
This work was supported by the Patient Centered Outcomes Research Institute (IHS-1306-0081 to Dr. S. Shah). All statements in this report, including findings and conclusions, are solely those of the authors and do not necessarily represent the views of the Patient-Centered Outcomes Research Institute, its Board of Governors, or the Methodology Committee. Dr Auger’s research is funded by the Agency for Healthcare Research and Quality (1K08HS024735).
1. Berry JG, Hall DE, Kuo DZ, et al. Hospital utilization and characteristics of patients experiencing recurrent readmissions within children’s hospitals. JAMA. 2011;305(7):682-690. doi: 10.1001/jama.2011.122. PubMed
2. Schwarz JN, Monti A, Savelli-Castillo I, Nelson LP. Accuracy of familial reporting of a child’s medical history in a dental clinic setting. Pediatr Dent. 2004;26(5):433-439. PubMed
3. Williams ER, Meza YE, Salazar S, Dominici P, Fasano CJ. Immunization histories given by adult caregivers accompanying children 3-36 months to the emergency department: are their histories valid for the Haemophilus influenzae B and pneumococcal vaccines? Pediatr Emerg Care. 2007;23(5):285-288. doi: 10.1097/01.pec.0000248699.42175.62. PubMed
4. Stupiansky NW, Zimet GD, Cummings T, Fortenberry JD, Shew M. Accuracy of self-reported human papillomavirus vaccine receipt among adolescent girls and their mothers. J Adolesc Health. 2012;50(1):103-105. doi: 10.1016/j.jadohealth.2011.04.010. PubMed
5. Tubbs-Cooley HL, Pickler RH, Simmons JM, et al. Testing a post-discharge nurse-led transitional home visit in acute care pediatrics: the Hospital-To-Home Outcomes (H2O) study protocol. J Adv Nurs. 2016;72(4):915-925. doi: 10.1111/jan.12882. PubMed
6. Auger KA, Simmons JM, Tubbs-Cooley HL, et al. Postdischarge nurse home visits and reuse: the hospital to home outcomes (H2O) trial. Pediatrics. 2018;142(1):e20173919. doi: 10.1542/peds.2017-3919. PubMed
7. The Health Collaborative. The Health Collaborative Healthbridge Analytics. http://healthcollab.org/hbanalytics/. Accessed August 11, 2017.
8. Altman DG. Practical statistics for medical research. Boca Raton, Florida: CRC Press; 1990.
9. Coller RJ, Klitzner TS, Saenz AA, Lerner CF, Nelson BB, Chung PJ. The medical home and hospital readmissions. Pediatrics. 2015;136(6):e1550-e1560. doi: 10.1542/peds.2015-1618. PubMed
10. Office of Disease Prevention and Health Promotion. US Department of Health and Human Services. Healthy People 2010: Understanding and Improving Health. 2nd ed. Washington, DC: US Government Printing Office; 2000.
11. Yin HS, Johnson M, Mendelsohn AL, Abrams MA, Sanders LM, Dreyer BP. The health literacy of parents in the United States: a nationally representative study. Pediatrics. 2009;124(3):S289-S298. doi: 10.1542/peds.2009-1162E. PubMed
12. Solan LG, Beck AF, Brunswick SA, et al. The family perspective on hospital to home transitions: a qualitative study. Pediatrics. 2015;136(6):e1539-e1549. PubMed
13. DeWalt DA CL, Hawk VH, Broucksou KA, Hink A, Rudd R, Brach C. Health Literacy Universal Precautions Toolkit. (Prepared by North Carolina Network Consortium, The Cecil G. Sheps Center for Health Services Research, The University of North Carolina at Chapel Hill, under Contract No. HHSA290200710014.). Rockville, MD: Agency for Healthcare Research and Quality; 2010.
Prior healthcare utilization predicts future utilization;1 thus, providers should know when a child has had a recent healthcare visit. Healthcare providers typically obtain this information from parents and caregivers, who may not always provide accurate information.2-4
The Hospital to Home Outcomes study (H2O) was a randomized controlled trial conducted to assess the effects of a one-time home nurse visit following discharge on unplanned healthcare reutilization.5 We assessed reutilization through two sources: parent report via a postdischarge telephone call and administrative data. In this analysis, we sought to understand differences in reutilization rates by source by comparing parent report with administrative data.
METHODS
The H2O trial included children (<18 years) hospitalized on the hospital medicine (HM) or neuroscience (Neurology/Neurosurgery) services at Cincinnati Children’s Hospital Medical Center (CCHMC) from February 2015 to April 2016; they had an English-speaking parent and were discharged to home without skilled nursing care.6 For this analysis, we restricted the sample to children randomized to the control arm (discharge without a home visit), which reflects typical clinical care.
We used administrative data to capture 14-day reutilization (unplanned hospital readmissions, emergency department [ED] visits, or urgent care visits). CCHMC is the only pediatric admitting facility in the region and includes two pediatric EDs and five urgent care centers. We supplemented hospital data with a dataset (The Health Collaborative7) that included utilization at other regional facilities. Parent report was assessed via a research coordinator phone call 14-23 days after discharge. Parents were asked: “I’m going to [ask] about your child’s health since [discharge date]. Has s/he been hospitalized overnight? Has s/he been taken to the Emergency Room/Emergency Department (didn’t stay overnight)? Has s/he been taken to an urgent care?” We report 14-day reutilization rates by source (parent and/or administrative) and visit type.
We considered administrative data the gold standard for documentation of reutilization events for two reasons. First, all healthcare encounters generate billing and are therefore documented with verifiable coding. Second, we had access to data from our center and other regional healthcare facilities. Any parent-reported utilization to a facility not documented in either dataset was considered an unverifiable event (eg, outside our catchment region). Agreement between administrative and parent report of 14-day reutilization was summarized as positive agreement (reutilization documented in both administrative and parent report), negative agreement (no reutilization reported in either administrative or parent report), and overall agreement (combination of positive and negative agreement). We classified discrepancies as reutilization events in administrative data without parent report of reutilization or vice versa. We performed medical record review of discrepancies in our institutional data.
We summarized agreement by using the Cohen’s kappa statistic by reuse type (hospital readmission, ED, and urgent care visit) and overall (any reutilization event). Strength of agreement based on the kappa statistics was classified as poor (<0.20), fair (0.21-0.40), moderate (0.41-0.60), good (0.61-0.80), and very good (0.81-1.00).8 We used McNemar’s test to evaluate marginal homogeneity.
RESULTS
Of 749 children randomized to the standard of care arm, 723 parents completed the 14-day follow-up call and were included in this analysis. The median child age was two years (interquartile range: 0.4, 6.9), the median length of stay (LOS) was two days (1, 3), and the majority were white (62%). Payer mix varied, with 44% privately insured and 54% publicly insured. Most patients (83%) were admitted to the HM service, and the most common diagnoses groups for index admission were respiratory (35%), neurologic (14%), and gastrointestinal (9%) diseases.
Administrative data showed 63 children with any reutilization event; parents reported 63 with any reutilization event; 48 children had events reported by both sources. The overall agreement was high, ranging from 95.9% to 98.5% (Table 1) depending on visit type. The positive agreement (ie, parent and administrative data indicated reutilization) ranged from 47.6% to 76.2%. Negative agreement (ie, parent and administrative data agreed no reutilization) was very high, 97.7% to 99.2%. Parents reported three ED visits and four urgent care visits that were unverifiable due to lack of access to administrative data (sites of care reported were not included in our datasets).
The kappa statistics indicated good agreement between parent report and administrative data for hospital readmission, ED visit, and composite any type of reutilization but moderate agreement for urgent care visit (Table 1).
Discrepancies were noted between parent report and administrative data (Table 2). In 15 children, a parent reported no reutilization when the administrative data included one; in 15 children, a parent reported a reutilization (including seven unverifiable events) when the administrative data revealed none. However, a few discrepancies were due to the incorrect site of care report (Table 2). Chart review of discrepancies involving CCHMC locations verified the accuracy of administrative data except in one case. In this case, a child’s ED revisit appeared to be a separate encounter but actually led to a hospital readmission.
The 14-day reutilization rates by type (any, hospital readmission, ED visit, and urgent care visit) and data source (administrative data only, parent report only, and administrative or parent report) are depicted in the Appendix. Reutilization rates were similar when computed using administrative only or parent report only. However, reutilization rates increased slightly if a composite measure of any administrative data or parent report was utilized. No significant difference was found between administrative data and parent report in the marginal reuse proportions, with McNemar’s test P values all >.05 for hospital readmission, ED visit, and urgent care visit evaluated separately.
DISCUSSION
By comparing parent report of reutilization after hospital discharge through postdischarge phone calls with administrative data, we demonstrated high overall agreement between sources (95.9%); this finding is similar to prior research investigating the relationship between an established medical home and reutilization.9 However, this agreement is largely due to both sources reporting no reutilization. When revisits did occur, the agreement was notably lower, especially with regard to urgent care visits.
Discrepancies between sources have several possible explanations. First, parents may be confused by the framing of reutilization questions, perhaps lacking clarity around which visit we were referencing. Second, parents may experience limitations in health literacy10,11 with a lack of familiarity with healthcare language, such as the ability to delineate location types (for example, a parent may identify an urgent care visit as an ED visit, given their close proximity at our facility). Finally, our prior work identified that the “fog” of hospitalization,12 which is often a stressful and disruptive time for families, may linger after admission and could lead to difficulty in recalling detailed events.
Our findings have implications for effective care in a complex healthcare system where parent report may be the most practical method to obtain historical information, both within clinical care and in the context of research or quality measures, such as postdischarge utilization. Given that one of the greatest risk factors for readmission is prior utilization,1 the knowledge that a patient experienced a reutilization after a prior discharge might prompt the inpatient provider to better prepare families for subsequent transition to home.
To apply our findings practically, it is important to realize that a parent report may be sufficient when reporting that no revisit occurred, if there is also no record of a visit in accessible administrative data (such as an electronic health record). However, further questions or investigation should be considered when parents report a visit did occur or when administrative data indicate a visit occurred that the parent does not recall. Providers and researchers alike should remember to use health literacy universal precautions with all families, employing plain language without medical jargon.13 As linked electronic health record use becomes more prevalent, administrative data may be accessible in real-time, allowing for verification of family interview information. Administrative data beyond a single hospital system should be considered to effectively capture reutilization for research or quality efforts.
Our study has several limitations. Similar to most studies using reutilization outcomes, our data may miss a few unverifiable reuse events. By supplementing with additional regional data,7 we likely captured most events. Second, we did not include patients with limited English proficiency, although it is unclear how this might have biased our results. Third, while relatively few families did not complete the calls, it is possible that more discrepancies would have been noted in nonresponders. Fourth, research coordinators administering the calls followed a script to determine reutilization information; in clinical practice, a practitioner might not ask questions as clearly, which could negatively impact recall or might add clarifying follow-up questions to enhance recall. Finally, the analysis occurred in the setting of a randomized controlled trial that included children with relatively noncomplex health conditions with short LOS;6 thus, the results may not apply to other populations.
In conclusion, parent report and administrative data of reutilization following hospital discharge were usually in agreement when no reutilization occurred; however, discrepancies were noted more often when reutilizations occurred and may have care implications.
Collaborators
On behalf of the H2O Trial study group including: Joanne Bachus, BSN, RN; Andrew F. Beck, MD, MPH; Monica L. Borell, BSN, RN; Lenisa V. Chang, MA, PhD; Patricia Crawford, RN; Jennifer M. Gold, MSN, RN; Judy A. Heilman BSN, RN; Jane C. Khoury, PhD; Pierce Kuhnell, MS; Karen Lawley, BSN, RN; Allison Loechtenfeldt, BS; Colleen Mangeot, MS; Lynn O’Donnell, BSN, RN; Rita H. Pickler, PhD, RN; Hadley S. Sauers-Ford, MPH; Anita N. Shah, DO, MPH; Susan N. Sherman, DPA; Lauren G. Solan, MD, MEd; Karen P. Sullivan, BSN, RN; Susan Wade-Murphy, MSN, RN
Disclosures
Hospital to Home Outcomes team reports grants from the Patient Centered Outcomes Research Institute during the conduct of the study. Dr. White reports personal fees from the Institute for Health Care Improvement, outside the submitted work.
Funding
This work was supported by the Patient Centered Outcomes Research Institute (IHS-1306-0081 to Dr. S. Shah). All statements in this report, including findings and conclusions, are solely those of the authors and do not necessarily represent the views of the Patient-Centered Outcomes Research Institute, its Board of Governors, or the Methodology Committee. Dr Auger’s research is funded by the Agency for Healthcare Research and Quality (1K08HS024735).
1. Berry JG, Hall DE, Kuo DZ, et al. Hospital utilization and characteristics of patients experiencing recurrent readmissions within children’s hospitals. JAMA. 2011;305(7):682-690. doi: 10.1001/jama.2011.122. PubMed
2. Schwarz JN, Monti A, Savelli-Castillo I, Nelson LP. Accuracy of familial reporting of a child’s medical history in a dental clinic setting. Pediatr Dent. 2004;26(5):433-439. PubMed
3. Williams ER, Meza YE, Salazar S, Dominici P, Fasano CJ. Immunization histories given by adult caregivers accompanying children 3-36 months to the emergency department: are their histories valid for the Haemophilus influenzae B and pneumococcal vaccines? Pediatr Emerg Care. 2007;23(5):285-288. doi: 10.1097/01.pec.0000248699.42175.62. PubMed
4. Stupiansky NW, Zimet GD, Cummings T, Fortenberry JD, Shew M. Accuracy of self-reported human papillomavirus vaccine receipt among adolescent girls and their mothers. J Adolesc Health. 2012;50(1):103-105. doi: 10.1016/j.jadohealth.2011.04.010. PubMed
5. Tubbs-Cooley HL, Pickler RH, Simmons JM, et al. Testing a post-discharge nurse-led transitional home visit in acute care pediatrics: the Hospital-To-Home Outcomes (H2O) study protocol. J Adv Nurs. 2016;72(4):915-925. doi: 10.1111/jan.12882. PubMed
6. Auger KA, Simmons JM, Tubbs-Cooley HL, et al. Postdischarge nurse home visits and reuse: the hospital to home outcomes (H2O) trial. Pediatrics. 2018;142(1):e20173919. doi: 10.1542/peds.2017-3919. PubMed
7. The Health Collaborative. The Health Collaborative Healthbridge Analytics. http://healthcollab.org/hbanalytics/. Accessed August 11, 2017.
8. Altman DG. Practical statistics for medical research. Boca Raton, Florida: CRC Press; 1990.
9. Coller RJ, Klitzner TS, Saenz AA, Lerner CF, Nelson BB, Chung PJ. The medical home and hospital readmissions. Pediatrics. 2015;136(6):e1550-e1560. doi: 10.1542/peds.2015-1618. PubMed
10. Office of Disease Prevention and Health Promotion. US Department of Health and Human Services. Healthy People 2010: Understanding and Improving Health. 2nd ed. Washington, DC: US Government Printing Office; 2000.
11. Yin HS, Johnson M, Mendelsohn AL, Abrams MA, Sanders LM, Dreyer BP. The health literacy of parents in the United States: a nationally representative study. Pediatrics. 2009;124(3):S289-S298. doi: 10.1542/peds.2009-1162E. PubMed
12. Solan LG, Beck AF, Brunswick SA, et al. The family perspective on hospital to home transitions: a qualitative study. Pediatrics. 2015;136(6):e1539-e1549. PubMed
13. DeWalt DA CL, Hawk VH, Broucksou KA, Hink A, Rudd R, Brach C. Health Literacy Universal Precautions Toolkit. (Prepared by North Carolina Network Consortium, The Cecil G. Sheps Center for Health Services Research, The University of North Carolina at Chapel Hill, under Contract No. HHSA290200710014.). Rockville, MD: Agency for Healthcare Research and Quality; 2010.
© 2019 Society of Hospital Medicine
Achievable Benchmarks of Care for Pediatric Readmissions
Hospital readmission rates are a common metric for defining, evaluating, and benchmarking quality of care. The Centers for Medicare and Medicaid Services (CMS) publicly report hospital readmission rates for common adult conditions and reduces payments to hospitals with excessive readmissions.1 Recently, the focus on pediatric readmission rates has increased and the National Quality Forum (NQF) has endorsed at least two pediatric readmission-specific quality indicators which could be used by public and private payers in pay-for-performance programs aimed at institutions caring for children.2 While preventability of readmissions and their value as a marker of quality remains debated, their acceptance by the NQF and CMS has led public and private payers to propose readmission-related penalties for hospitals caring for children. 3-5
All-cause 30-day same-hospital readmission rates for pediatric conditions are half of the adult readmission rates, around 6% in most studies, compared to 12% in adults.6,7 The lower rates of pediatric readmissions makes it difficult to only use mean readmission rates to stratify hospitals into high- or low-performers and set target goals for improvement.8 While adult readmissions have been studied in depth, there are no consistent measures used to benchmark pediatric readmissions across hospital types.
Given the emphasis placed on readmissions, it is essential to understand patterns in pediatric readmission rates to determine optimal and achievable targets for improvement. Achievable Benchmarks of Care (ABCs) are one approach to understanding readmission rates and have an advantage over using mean or medians in performance improvement as they can stratify performance for conditions with low readmission rates and low volumes.9 When creating benchmarks, it is important that hospitals performance is evaluated among peer hospitals with similar patient populations, not just a cumulative average from all hospital types which may punish hospitals with a more complex patient case mix.10 The goal of this study was to calculate the readmission rates and the ABCs for common pediatric diagnoses by hospital type to identify priority conditions for quality improvement efforts using a previously published methodology.11-13
METHODS
Data Source
We conducted a retrospective analysis of patients less than 18 years of age in the Healthcare Utilization Project 2014 Nationwide Readmissions Database (NRD). The NRD includes public hospitals; academic medical centers; and specialty hospitals in obstetrics and gynecology, otolaryngology, orthopedics, and cancer; and pediatric, public, and academic medical hospitals. Excluded are long-term care facilities such as rehabilitation, long-term acute care, psychiatric, alcoholism, and chemical dependency hospitals. The readmissions data contains information from hospitals grouped by region, population census, and teaching status.14 Three hospital type classifications used in this study were metropolitan teaching hospitals, metropolitan nonteaching hospitals, and nonmetropolitan hospitals. These three hospital type classifications follow the reporting format in the NRD.
Study Population
Patients less than 18 years old were included if they were discharged from January 1, 2014 through November 30, 2014 and had a readmission to the index hospital within 30 days. We limited inclusion to discharges through November 30 so we could identify patients with a 30-day readmission as patient identifiers do not link across years in the NRD.
Exposure
We included 30-day, all-cause, same-hospital readmissions to the index acute care hospital, excluding labor and delivery, normal newborn care, chemotherapy, transfers, and mortalities. Intrahospital discharge and admissions within the same hospital system were not defined as a readmission, but rather as a “same-day event.”15 For example, institutions with inpatient mental health facilities, medical unit discharges and admission to the mental health unit were not identified as a readmission in this dataset.
Outcome
For each hospital type, we measured same-hospital, all-cause, 30-day readmission rates and achievable benchmark of care for the 17 most commonly readmitted pediatric discharge diagnoses. To identify the target readmission diagnoses and all-cause, 30-day readmissions based on their index hospitalizations, All-Patient Refined Diagnosis-Related Groups (APR-DRG), version 25 (3M Health Information Systems, Salt Lake City, Utah) were ordered by frequency for each hospital type. The 20 most common APR-DRGs were the same across all hospital types. The authors then evaluated these 20 APR-DRGs for clinical consistency of included diagnoses identified by the International Classification of Diseases, Ninth Revision, Clinical Modification (ICD-9-CM) codes within each APR-DRG. Three diagnosis-related groups were excluded from the analysis (major hematologic/immunologic disease except for sickle cell, other anemia and disorders of blood and blood forming organs, and other digestive system diagnoses) due to the heterogeneity of the diagnoses identified by the ICD-9-CM codes within each APR-DRG. We refer to each APR-DRG as a “diagnosis” throughout the article.
Analysis
The demographic characteristics of the patients seen at the three hospital types were summarized using frequencies and percentages. Reports were generated for patient age, gender, payer source, patient residence, median household income, patient complexity, and discharge disposition. Patient complexity was defined using complex chronic condition (CCC) and the number of chronic conditions (CCI).16,17 As previously defined in the literature, a complex chronic condition is “any medical condition that can be reasonably expected to last at least 12 months (unless death intervenes) and to involve either several different organ systems or one organ system severely enough to require specialty pediatric care and probably some period of hospitalization in a tertiary care center.”16 Whereas, the Agency for Healthcare Research and Quality’s Chronic Condition Indicator (CCI) defines single, non-CCCs (eg, allergic rhinitis).17
For each diagnosis, we calculated the mean readmission rate for hospitals in each hospital type category. We then calculated an ABC for each diagnosis in each hospital type using a four-step process.13,18 First, to control for hospitals with small sample sizes, we adjusted all readmission rates using an adjusted performance fraction ([numerator+1]/[denominator +2]), where the numerator is the number of all-cause 30-day readmissions and the denominator is the number of discharges for the selected diagnosis. Then the hospitals were ordered from lowest (best performing) to highest (worst performing) using the adjusted readmission rate. Third, the number of discharges from the best performing hospital to the worst performing hospital was summed until at least 10% of the total discharges had been accounted for. Finally, we computed the ABC as the average of these best performing hospitals. We only report ABCs for which at least three hospitals were included as best performers in the calculation.13
To evaluate hospital performance on ABCs for each diagnosis, we identified the percent of hospitals in each setting that were outliers. We defined an outlier as any hospital whose 95% confidence interval for their readmission rate for a given diagnosis did not contain the ABC for their hospital type. All the statistical analyses were performed using SAS version 9.3 (SAS Institute, Inc, Cary, North Carolina).
This project was reviewed by the Cincinnati Children’s Hospital Medical Center Institutional Review Board and determined to be nonhuman subjects research.
RESULTS
Hospital-Type Demographics
The 690,949 discharges from 1,664 hospitals were categorized into 525 metropolitan teaching (550,039 discharges, 79.6% of discharges), 552 metropolitan nonteaching (97,207 discharges, 14% of discharges), and 587 nonmetropolitan hospitals (43,703 discharges, 6.3% of discharges; Table 1). There were significant differences in the patient composition among the three hospital settings. Nonmetropolitan hospitals had a larger percentage of younger patients (aged 0-4 years, P < .001), prominence of first and second quartile median household income, and fewer medically complex patients (48.3% No CCC/No CCI versus 25.5% metropolitan teaching and 33.7% nonteaching, P < .001). Disposition home was over 96% in all three hospital types; however, the metropolitan teaching had a greater percentage of patients discharged to home health versus metropolitan nonteaching and nonmetropolitan hospitals (2.3% versus 0.5%; P < .001).
Readmission Rates
The 17 most common diagnoses based on the number of all-cause 30-day same-hospital readmissions, were categorized into two surgical, seven acute/infectious, four chronic, and four mental health diagnoses (Table 2). Readmission rates varied based on diagnosis and hospital type (Table 2). Overall, mean readmission rates were low, especially in acute respiratory tract related diseases. For chronic diseases, asthma readmissions were consistently low in all three hospital types, whereas sickle cell disease had the highest readmission rate in all three hospital types.
Achievable Benchmarks of Care by Hospital Type
The diagnoses for which ABC could be calculated across all three hospital types included appendectomy and four acute conditions (bronchiolitis, pneumonia, nonbacterial gastroenteritis, and kidney/urinary tract infections). For these conditions, metropolitan teaching hospitals had a more significant percentage of outlier hospitals compared to metropolitan nonteaching and nonmetropolitan hospitals. The percent of outlier hospitals varied by diagnosis and hospital type (Figure).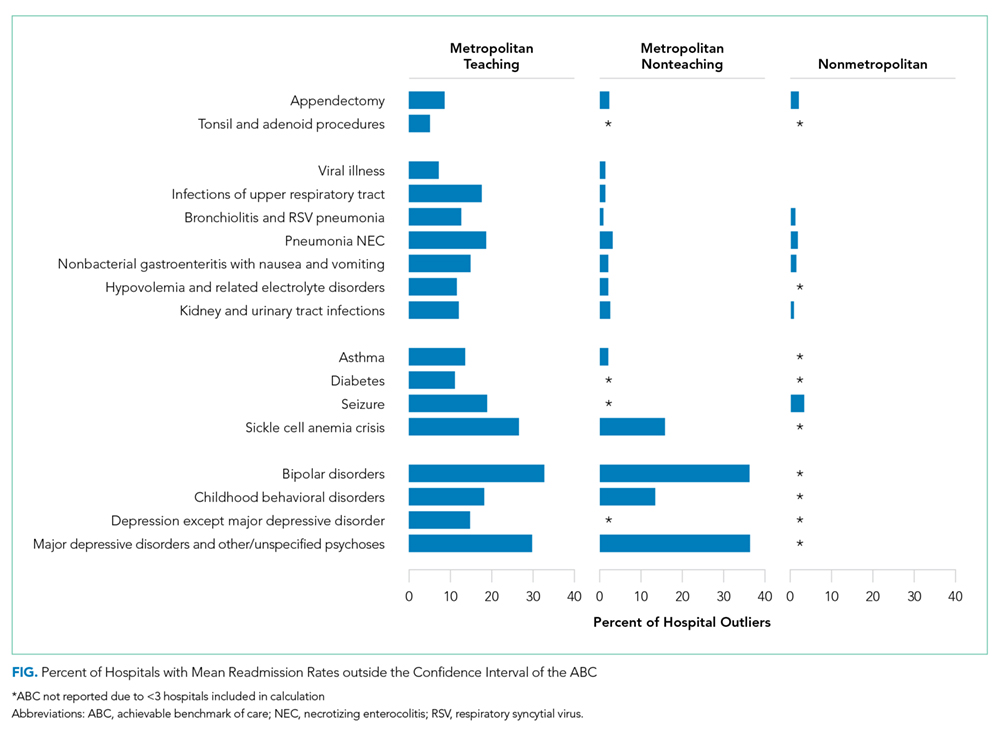
Metropolitan Teaching
The readmission ABC was calculated for all 17 diagnoses (Table 2). The ABC ranged from 0.4% in acute kidney and urinary tract infection to 7.0% in sickle cell anemia crisis. Bipolar disorder, major depressive disorders and other psychoses, and sickle cell disease (SCD) had the highest percent of outlier hospitals whose mean readmission rates confidence interval did not contain the ABC; tonsil and adenoid procedures and viral illness had the lowest.1
Metropolitan Nonteaching
The ABC was calculated for 13 of the 17 diagnoses because ABCs were not calculated when there were fewer than three best practicing hospitals. This was the case for tonsil and adenoid procedures, diabetes, seizures, and depression except for major depressive disorder (Table 2). Seven of the 13 diagnoses had an ABC of 0.0%: viral illness, infections of the upper respiratory tract, bronchiolitis, gastroenteritis, hypovolemia and electrolyte disorders, asthma, and childhood behavioral disorders. Like the findings at the metropolitan teaching hospitals, ABCs were lowest for surgical and acute conditions while bipolar disorder, major depressive disorders and other psychoses, and SCD had the highest percent of outlier hospitals with readmission rates beyond the 95% confidence interval of their hospital type’s ABC.
Nonmetropolitan
There was a sufficient number of best practicing hospitals to calculate the ABC for six of the 17 diagnoses (Table 2). For conditions where readmission ABCs could be calculated, they were low: 0.0% for appendectomy, bronchiolitis, gastroenteritis, and seizure; 0.3% for pneumonia; and 1.3% in kidney and urinary tract disorders. None of the conditions with the highest ABCs in other hospital settings (bipolar disease, sickle cell anemia crisis, and major depressive disorders and other psychoses) could be calculated in this setting. Seizure-related readmissions exhibited the most outlier hospitals yet were less than 5%.1
DISCUSSION
Among a nationally representative sample of different hospital types that deliver care to children, we report the mean readmission rates and ABCs for 30-day all-cause, same-hospital readmissions for the most commonly readmitted pediatric diagnoses based on hospital type. Previous studies have shown patient variables such as race, ethnicity, and insurance type influencing readmission rates.19,20 However, hospital type has also been associated with a higher risk of readmission due to the varying complexity of patients at different hospital types.21,22 Our analyses provide hospital-type specific national estimates of pediatric readmission ABCs for medical and surgical conditions, many less than 1%. While commonly encountered pediatric conditions like asthma and bronchiolitis had low mean readmission rates and ABCs across all hospital types, the mean rates and ABCs for SCD and mental health disorders were much higher with more hospitals performing far from the ABCs.
Diagnoses with a larger percentage of outlier hospitals may represent a national opportunity to improve care for children. Conditions such as SCD and mental illnesses have the highest percentage of hospitals whose readmission rates fall outside of the ABCs in both metropolitan teaching and metropolitan nonteaching hospitals. Hospital performance on SCD and mental health disorders may not reflect deficits in hospital quality or poor adherence to evidence-based best practices, but rather the complex interplay of factors on various levels from government policy and insurance plans, to patient and family resources, to access and availability of medical and mental health specific care. Most importantly, these diseases may represent a significant opportunity for quality improvementin hospitals across the United States.
Sickle cell disease is predominantly a disease among African-Americans, a demographic risk factor for decreased access to care and limited patient and family resources.23-26 In previous studies evaluating the disparity in readmission rates for Black children with asthma, socioeconomic variables explained 53% of the observed disparity and readmission rates were inversely related to the childhood opportunity index of the patient’s census tract and positively related with geographic social risk.27,28 Likewise, with SCD affecting a specific demographic and being a chronic disease, best practice policies need to account for the child’s medical needs and include the patient and family resources to ensure access to care and enhanced case management for chronic disease if we aim to improve performance among the outlier hospitals.
Similarly, barriers to care for children with mental illnesses in the United States need attention.29,30 While there is a paucity of data on the prevalence of mental health disorders in children, one national report estimates that one in 10 American adolescents have depression.29,31 The American Academy of Pediatrics has developed a policy statement on mental health competencies and a mental health tool-kit for primary care pediatricians; however, no such guidelines or policy statements exist for hospitalized patients with acute or chronic psychiatric conditions.32,33 Moreover, hospitals are increasingly facing “boarding” of children with acute psychiatric illness in inpatient units and emergency departments.34 The American Medical Association and the American College of Emergency Physicians have expressed concerns regarding the boarding of children with acute psychiatric illness because nonpsychiatric hospitals do not have adequate resources to evaluate, manage, and place these children who deserve appropriate facilities for further management. Coordinated case management and “bundled” discharge planning in other chronic illnesses have shown benefit in cost reduction and readmission.35-37 Evidence-based practices around pediatric readmissions in other diagnoses should be explored as possible interventions in these conditions.38
There are several limitations to this study. Our data is limited to one calendar year; therefore, admissions in January do not account for potential readmissions from December of the previous year, as patient identifiers do not link across years in the NRD. We also limited our evaluation to the conventional 30-day readmission window, but recent publications may indicate that readmission windows with different timelines could be a more accurate reflection of medically preventable readmissions versus a reflection of social determinants of health leading to readmissions.24 Newborn index admissions were not an allowable index admission; therefore, we may be underreporting readmissions in the neonatal age group. We also chose to include all-cause readmissions, a conventional method to evaluate readmission within an institution, but which may not reflect the quality of care delivered in the index admission. For example, an asthmatic discharged after an acute exacerbation readmitted for dehydration secondary to gastroenteritis may not reflect a lack of quality in asthma inpatient care. Readmissions were limited to the same hospital; therefore, this study cannot account for readmissions at other institutions, which may cause us to underestimate readmission rates. However, end-users of our findings most likely have access only to their own institution’s data. The inclusion of observation status admissions in the database varies from state to state; therefore, this percent of admissions in the database is unknown.
The use of the ABC methodology has some inherent limitations. One hospital with a significant volume diagnosis and low readmission rate within a hospital type may prohibit the reporting of an ABC if less than three hospitals composed the total of the ‘best performing’ hospitals. This was a significant limitation leading to the exclusion of many ABCs in nonmetropolitan institutions. The limitation of calculating and reporting an ABC then prohibits the calculation of outlier hospitals within a hospital type for a given diagnosis. However, when the ABCs are not available, we do provide the mean readmission rate for the diagnosis within the hospital type. While the hospital groupings by population and teaching status for ABCs provide meaningful comparisons for within each hospital setting, it should be noted that there may be vast differences among hospitals within each type (eg, tertiary children’s hospitals compared to teaching hospitals with a pediatric floor in the metropolitan teaching hospital category).39,40
As healthcare moves from a fee-for-service model to a population-health centered, value-based model, reduction in readmission rates will be more than a quality measure and will have potential financial implications.41 In the Medicare fee-for-service patients, the Hospital Readmission Reduction Program (HRRP) penalize hospitals with excess readmissions for acute myocardial infarction, heart failure, and pneumonia. The hospitals subject to penalties in the HRRP had greater reduction in readmission rates in the targeted, and even nontargeted conditions, compared with hospitals not subject to penalties.42 Similarly, we believe that our data on low readmission rates and ABCs for conditions such as asthma, bronchiolitis, and appendicitis could represent decades of quality improvement work for the most common pediatric conditions among hospitalized children. Sickle cell disease and mental health problems remain as outliers and merit further attention. To move to a true population-health model, hospitals will need to explore outlier conditions including evaluating patient-level readmission patterns across institutions. This moves readmission from a hospital quality measure to a patient-centric quality measure, and perhaps will provide value to the patient and the healthcare system alike.
CONCLUSIONS
The readmission ABCs for the most commonly readmitted pediatric diagnoses are low, regardless of the hospital setting. The highest pediatric readmission rates in SCD, bipolar disorders, and major depressive disorder were lower than the most common adult readmission diagnoses. However, mental health conditions and SCD remain as outliers for pediatric readmissions, burden hospital systems, and perhaps warrant national-level attention. The ABCs stratified by hospital type in this study facilitate comparisons and identify opportunities for population-level interventions to meaningfully improve patient care.
Disclosures
The authors have nothing to disclose.
1. Medicare. 30-day death and readmission measures data. https://www.medicare.gov/hospitalcompare/Data/30-day-measures.html. Accessed October 24, 2017.
2. National Quality Forum. Performance Measures; 2016 https://www.quality fourm.org/Measuring_Performance/Endorsed_Performance_Measures_Maintenance.aspx. Accessed October 24, 2017.
3. Auger KA, Simon TD, Cooperberg D, et al. Summary of STARNet: seamless transitions and (re)admissions network. Pediatrics. 2015;135(1):164-175. https://doi.org/10.1542/peds.2014-1887.
4. Toomey SL, Peltz A, Loren S, et al. Potentially preventable 30-day hospital readmissions at a children’s hospital. Pediatrics. 2016;138(2):e20154182-e20154182. https://doi.org/10.1542/peds.2015-4182.
5. Halfon P, Eggli Y, Prêtre-Rohrbach I, et al. Validation of the potentially avoidable hospital readmission rate as a routine indicator of the quality of hospital care. Med Care. 2006;44(11):972-981. https://doi.org/10.1097/01.mlr.0000228002.43688.c2.
6. Gay JC, Agrawal R, Auger KA, et al. Rates and impact of potentially preventable readmissions at children’s hospitals. J Pediatr. 2015;166(3):613-619. https://doi.org/10.1016/j.jpeds.2014.10.052.
7. Berry JG, Gay JC, Joynt Maddox KJ, et al. Age trends in 30 day hospital readmissions: US national retrospective analysis. BMJ. 2018;360:k497. https://doi.org/10.1136/bmj.k497.
8. Bardach NS, Vittinghoff E, Asteria-Penaloza R, et al. Measuring hospital quality using pediatric readmission and revisit rates. Pediatrics. 2013;132(3):429-436. https://doi.org/10.1542/peds.2012-3527d.
9. Berry JG, Toomey SL, Zaslavsky AM, et al. Pediatric readmission prevalence and variability across hospitals. JAMA. 2013;309(4):372-380. https://doi.org/10.1001/jama.2012.188351.
10. Gohil SK, Datta R, Cao C, et al. Impact of hospital population case-mix, including poverty, on hospital all-cause and infection-related 30-day readmission rates. Clin Infect Dis. 2015;61(8):1235-1243. https://doi.org/10.1093/cid/civ539.
11. Parikh K, Hall M, Mittal V, et al. Establishing benchmarks for the hospitalized care of children with asthma, bronchiolitis, and pneumonia. Pediatrics. 2014;134(3):555-562. https://doi.org/10.1542/peds.2014-1052.
12. Reyes M, Paulus E, Hronek C, et al. Choosing wisely campaign: report card and achievable benchmarks of care for children’s hospitals. Hosp Pediatr. 2017;7(11):633-641. https://doi.org/10.1542/hpeds.2017-0029.
13. Kiefe CI, Weissman NW, Allison JJ, et al. Identifying achievable benchmarks of care: concepts and methodology. Int J Qual Health Care. 1998;10(5):443-447. https://doi.org/10.1093/intqhc/10.5.443.
14. Agency for Healthcare Research and Quality. Nationwide Readmissions Database Availability of Data Elements. . https://www.hcup-us.ahrq.gov/partner/MOARef/HCUPdata_elements.pdf. Accessed 2018 Jun 6
15. Healthcare Cost and Utilization Project. HCUP NRD description of data elements. Agency Healthc Res Qual. https://www.hcup-us.ahrq.gov/db/vars/samedayevent/nrdnote.jsp. Accessed 2018 Jun 6; 2015.
16. Feudtner C, Feinstein JA, Zhong W, Hall M, Dai D. Pediatric complex chronic conditions classification system version 2: updated for ICD-10 and complex medical technology dependence and transplantation. BMC Pediatr. 2014;14:199. https://doi.org/10.1186/1471-2431-14-199.
17. Agency for Healthcare Research and Quality. HCUP chronic condition indicator. Healthc Cost Util Proj. https://www.hcup-us.ahrq.gov/toolssoftware/chronic/chronic.jsp. Accessed 2016 Apr 26; 2009.
18. Weissman NW, Allison JJ, Kiefe CI, et al. Achievable benchmarks of care: the ABCs of benchmarking. J Eval Clin Pract. 1999;5(3):269-281. https://doi.org/10.1046/j.1365-2753.1999.00203.x.
19. Joynt KE, Orav EJ, Jha AK. Thirty-day readmission rates for medicare beneficiaries by race and site of care. JAMA. 2011;305(7):675-681. https://doi.org/10.1001/jama.2011.123.
20. Kenyon CC, Melvin PR, Chiang VW, et al. Rehospitalization for childhood asthma: timing, variation, and opportunities for intervention. J Pediatr. 2014;164(2):300-305. https://doi.org/10.1016/j.jpeds.2013.10.003.
21. Sobota A, Graham DA, Neufeld EJ, Heeney MM. Thirty-day readmission rates following hospitalization for pediatric sickle cell crisis at freestanding children’s hospitals: risk factors and hospital variation. Pediatr Blood Cancer. 2012;58(1):61-65. https://doi.org/10.1002/pbc.23221.
22. Berry JG, Hall DE, Kuo DZ, et al. Hospital utilization and characteristics of patients experiencing recurrent readmissions within children’s hospitals. JAMA. 2011;305(7):682-690. https://doi.org/10.1001/jama.2011.122.
23. Ginde AA, Espinola JA, Camargo CA. Improved overall trends but persistent racial disparities in emergency department visits for acute asthma, 1993-2005. J Allergy Clin Immunol. 2008;122(2):313-318. https://doi.org/10.1016/j.jaci.2008.04.024.
24. Parikh K, Berry J, Hall M, et al. Racial and ethnic differences in pediatric readmissions for common chronic conditions. J Pediatr. 2017;186. https://doi.org/10.1016/j.jpeds.2017.03.046.
25. Chen BK, Hibbert J, Cheng X, Bennett K. Travel distance and sociodemographic correlates of potentially avoidable emergency department visits in California, 2006-2010: an observational study. Int J Equity Health. 2015;14(1):30. https://doi.org/10.1186/s12939-015-0158-y.
26. Ray KN, Chari AV, Engberg J, et al. Disparities in time spent seeking medical care in the United States. JAMA Intern Med. 2015;175(12):175(12):1983-1986. https://doi.org/10.1001/jamainternmed.2015.4468.
27. Beck AF, Huang B, Wheeler K, et al. The child opportunity index and disparities in pediatric asthma hospitalizations across one Ohio metropolitan area. J Pediatr. 2011-2013;190:200-206. https://doi.org/10.1016/j.jpeds.2017.08.007.
28. Beck AF, Simmons JM, Huang B, Kahn RS. Geomedicine: area-based socioeconomic measures for assessing the risk of hospital reutilization among children admitted for asthma. Am J Public Health. 2012;102(12):2308-2314. https://doi.org/10.2105/AJPH.2012.300806.
29. Avenevoli S, Swendsen J, He JP, Burstein M, Merikangas KR. Major depression in the national comorbidity survey-adolescent supplement: prevalence, correlates, and treatment. J Am Acad Child Adolesc Psychiatry. 2015;54(1):37-44.e2. https://doi.org/10.1016/j.jaac.2014.10.010.
30. Feng JY, Toomey SL, Zaslavsky AM, Nakamura MM, Schuster MA. Readmission after pediatric mental health admissions. Pediatrics. 2017;140(6):e20171571. https://doi.org/10.1542/peds.2017-1571.
31. Merikangas KR, He JP, Burstein M, et al. Lifetime prevalence of mental disorders in U.S. adolescents: results from the National comorbidity Survey Replication-Adolescent Supplement (NCS-A). J Am Acad Child Adolesc Psychiatry. 2010;49(10):980-989. https://doi.org/10.1016/j.jaac.2010.05.017.
32. Cheung AH, Zuckerbrot RA, Jensen PS, et al. Guidelines for adolescent depression in primary care (GLAD-PC): Part II. Treatment and ongoing management. Pediatrics. 2018;141(3):e20174082. https://doi.org/10.1542/peds.2017-4082.
33. Zuckerbrot RA, Cheung A, Jensen PS, et al. Guidelines for adolescent depression in primary care (GLAD-PC): Part I. Practice preparation, identification, assessment, and initial management. Pediatrics. 2018;141(3):e20174081. https://doi.org/10.1542/peds.2017-4081.
34. Dolan MA, Fein JA, Committee on Pediatric Emergency Medicine. Pediatric and adolescent mental health emergencies in the emergency Medical Services system. Pediatrics. 2011;127(5):e1356-e1366. https://doi.org/10.1542/peds.2011-0522.
35. Collaborative Healthcare Strategies. Hospital Guide to Reducing Medicaid Readmissions. Rockville, MD: 2014. https://www.ahrq.gov/sites/default/files/publications/files/medreadmissions.pdf. Accessed 2017 Oct 11.
36. Hilbert K, Payne R, Wooton S. Children’s Hospitals’ Solutions for Patient Safety. Readmissions Bundle Tools. Cincinnati, OH; 2014.
37. Nuckols TK, Keeler E, Morton S, et al. Economic evaluation of quality improvement interventions designed to prevent hospital readmission: a systematic review and meta-analysis. JAMA Intern Med. 2017;177(7):975-985. https://doi.org/10.1001/jamainternmed.2017.1136.
38. Berry JG, Blaine K, Rogers J, et al. A framework of pediatric hospital discharge care informed by legislation, research, and practice. JAMA Pediatr. 2014;168(10):955-962. https://doi.org/10.1001/jamapediatrics.2014.891.
39. Chen HF, Carlson E, Popoola T, Suzuki S. The impact of rurality on 30-day preventable readmission, illness severity, and risk of mortality for heart failure Medicare home health beneficiaries. J Rural Health. 2016;32(2):176-187. https://doi.org/10.1111/jrh.12142.
40. Khan A, Nakamura MM, Zaslavsky AM, et al. Same-hospital readmission rates as a measure of pediatric quality of care. JAMA Pediatr. 2015;169(10):905-912. https://doi.org/10.1001/jamapediatrics.2015.1129.
41. Share DA, Campbell DA, Birkmeyer N, et al. How a regional collaborative of hospitals and physicians in Michigan cut costs and improved the quality of care. Health Aff. 2011;30(4):636-645. https://doi.org/10.1377/hlthaff.2010.0526.
42. Desai NR, Ross JS, Kwon JY, et al. Association between hospital penalty status under the hospital readmission reduction program and readmission rates for target and nontarget conditions. JAMA. 2016;316(24):2647-2656. https://doi.org/10.1001/jama.2016.18533.
Hospital readmission rates are a common metric for defining, evaluating, and benchmarking quality of care. The Centers for Medicare and Medicaid Services (CMS) publicly report hospital readmission rates for common adult conditions and reduces payments to hospitals with excessive readmissions.1 Recently, the focus on pediatric readmission rates has increased and the National Quality Forum (NQF) has endorsed at least two pediatric readmission-specific quality indicators which could be used by public and private payers in pay-for-performance programs aimed at institutions caring for children.2 While preventability of readmissions and their value as a marker of quality remains debated, their acceptance by the NQF and CMS has led public and private payers to propose readmission-related penalties for hospitals caring for children. 3-5
All-cause 30-day same-hospital readmission rates for pediatric conditions are half of the adult readmission rates, around 6% in most studies, compared to 12% in adults.6,7 The lower rates of pediatric readmissions makes it difficult to only use mean readmission rates to stratify hospitals into high- or low-performers and set target goals for improvement.8 While adult readmissions have been studied in depth, there are no consistent measures used to benchmark pediatric readmissions across hospital types.
Given the emphasis placed on readmissions, it is essential to understand patterns in pediatric readmission rates to determine optimal and achievable targets for improvement. Achievable Benchmarks of Care (ABCs) are one approach to understanding readmission rates and have an advantage over using mean or medians in performance improvement as they can stratify performance for conditions with low readmission rates and low volumes.9 When creating benchmarks, it is important that hospitals performance is evaluated among peer hospitals with similar patient populations, not just a cumulative average from all hospital types which may punish hospitals with a more complex patient case mix.10 The goal of this study was to calculate the readmission rates and the ABCs for common pediatric diagnoses by hospital type to identify priority conditions for quality improvement efforts using a previously published methodology.11-13
METHODS
Data Source
We conducted a retrospective analysis of patients less than 18 years of age in the Healthcare Utilization Project 2014 Nationwide Readmissions Database (NRD). The NRD includes public hospitals; academic medical centers; and specialty hospitals in obstetrics and gynecology, otolaryngology, orthopedics, and cancer; and pediatric, public, and academic medical hospitals. Excluded are long-term care facilities such as rehabilitation, long-term acute care, psychiatric, alcoholism, and chemical dependency hospitals. The readmissions data contains information from hospitals grouped by region, population census, and teaching status.14 Three hospital type classifications used in this study were metropolitan teaching hospitals, metropolitan nonteaching hospitals, and nonmetropolitan hospitals. These three hospital type classifications follow the reporting format in the NRD.
Study Population
Patients less than 18 years old were included if they were discharged from January 1, 2014 through November 30, 2014 and had a readmission to the index hospital within 30 days. We limited inclusion to discharges through November 30 so we could identify patients with a 30-day readmission as patient identifiers do not link across years in the NRD.
Exposure
We included 30-day, all-cause, same-hospital readmissions to the index acute care hospital, excluding labor and delivery, normal newborn care, chemotherapy, transfers, and mortalities. Intrahospital discharge and admissions within the same hospital system were not defined as a readmission, but rather as a “same-day event.”15 For example, institutions with inpatient mental health facilities, medical unit discharges and admission to the mental health unit were not identified as a readmission in this dataset.
Outcome
For each hospital type, we measured same-hospital, all-cause, 30-day readmission rates and achievable benchmark of care for the 17 most commonly readmitted pediatric discharge diagnoses. To identify the target readmission diagnoses and all-cause, 30-day readmissions based on their index hospitalizations, All-Patient Refined Diagnosis-Related Groups (APR-DRG), version 25 (3M Health Information Systems, Salt Lake City, Utah) were ordered by frequency for each hospital type. The 20 most common APR-DRGs were the same across all hospital types. The authors then evaluated these 20 APR-DRGs for clinical consistency of included diagnoses identified by the International Classification of Diseases, Ninth Revision, Clinical Modification (ICD-9-CM) codes within each APR-DRG. Three diagnosis-related groups were excluded from the analysis (major hematologic/immunologic disease except for sickle cell, other anemia and disorders of blood and blood forming organs, and other digestive system diagnoses) due to the heterogeneity of the diagnoses identified by the ICD-9-CM codes within each APR-DRG. We refer to each APR-DRG as a “diagnosis” throughout the article.
Analysis
The demographic characteristics of the patients seen at the three hospital types were summarized using frequencies and percentages. Reports were generated for patient age, gender, payer source, patient residence, median household income, patient complexity, and discharge disposition. Patient complexity was defined using complex chronic condition (CCC) and the number of chronic conditions (CCI).16,17 As previously defined in the literature, a complex chronic condition is “any medical condition that can be reasonably expected to last at least 12 months (unless death intervenes) and to involve either several different organ systems or one organ system severely enough to require specialty pediatric care and probably some period of hospitalization in a tertiary care center.”16 Whereas, the Agency for Healthcare Research and Quality’s Chronic Condition Indicator (CCI) defines single, non-CCCs (eg, allergic rhinitis).17
For each diagnosis, we calculated the mean readmission rate for hospitals in each hospital type category. We then calculated an ABC for each diagnosis in each hospital type using a four-step process.13,18 First, to control for hospitals with small sample sizes, we adjusted all readmission rates using an adjusted performance fraction ([numerator+1]/[denominator +2]), where the numerator is the number of all-cause 30-day readmissions and the denominator is the number of discharges for the selected diagnosis. Then the hospitals were ordered from lowest (best performing) to highest (worst performing) using the adjusted readmission rate. Third, the number of discharges from the best performing hospital to the worst performing hospital was summed until at least 10% of the total discharges had been accounted for. Finally, we computed the ABC as the average of these best performing hospitals. We only report ABCs for which at least three hospitals were included as best performers in the calculation.13
To evaluate hospital performance on ABCs for each diagnosis, we identified the percent of hospitals in each setting that were outliers. We defined an outlier as any hospital whose 95% confidence interval for their readmission rate for a given diagnosis did not contain the ABC for their hospital type. All the statistical analyses were performed using SAS version 9.3 (SAS Institute, Inc, Cary, North Carolina).
This project was reviewed by the Cincinnati Children’s Hospital Medical Center Institutional Review Board and determined to be nonhuman subjects research.
RESULTS
Hospital-Type Demographics
The 690,949 discharges from 1,664 hospitals were categorized into 525 metropolitan teaching (550,039 discharges, 79.6% of discharges), 552 metropolitan nonteaching (97,207 discharges, 14% of discharges), and 587 nonmetropolitan hospitals (43,703 discharges, 6.3% of discharges; Table 1). There were significant differences in the patient composition among the three hospital settings. Nonmetropolitan hospitals had a larger percentage of younger patients (aged 0-4 years, P < .001), prominence of first and second quartile median household income, and fewer medically complex patients (48.3% No CCC/No CCI versus 25.5% metropolitan teaching and 33.7% nonteaching, P < .001). Disposition home was over 96% in all three hospital types; however, the metropolitan teaching had a greater percentage of patients discharged to home health versus metropolitan nonteaching and nonmetropolitan hospitals (2.3% versus 0.5%; P < .001).
Readmission Rates
The 17 most common diagnoses based on the number of all-cause 30-day same-hospital readmissions, were categorized into two surgical, seven acute/infectious, four chronic, and four mental health diagnoses (Table 2). Readmission rates varied based on diagnosis and hospital type (Table 2). Overall, mean readmission rates were low, especially in acute respiratory tract related diseases. For chronic diseases, asthma readmissions were consistently low in all three hospital types, whereas sickle cell disease had the highest readmission rate in all three hospital types.
Achievable Benchmarks of Care by Hospital Type
The diagnoses for which ABC could be calculated across all three hospital types included appendectomy and four acute conditions (bronchiolitis, pneumonia, nonbacterial gastroenteritis, and kidney/urinary tract infections). For these conditions, metropolitan teaching hospitals had a more significant percentage of outlier hospitals compared to metropolitan nonteaching and nonmetropolitan hospitals. The percent of outlier hospitals varied by diagnosis and hospital type (Figure).
Metropolitan Teaching
The readmission ABC was calculated for all 17 diagnoses (Table 2). The ABC ranged from 0.4% in acute kidney and urinary tract infection to 7.0% in sickle cell anemia crisis. Bipolar disorder, major depressive disorders and other psychoses, and sickle cell disease (SCD) had the highest percent of outlier hospitals whose mean readmission rates confidence interval did not contain the ABC; tonsil and adenoid procedures and viral illness had the lowest.1
Metropolitan Nonteaching
The ABC was calculated for 13 of the 17 diagnoses because ABCs were not calculated when there were fewer than three best practicing hospitals. This was the case for tonsil and adenoid procedures, diabetes, seizures, and depression except for major depressive disorder (Table 2). Seven of the 13 diagnoses had an ABC of 0.0%: viral illness, infections of the upper respiratory tract, bronchiolitis, gastroenteritis, hypovolemia and electrolyte disorders, asthma, and childhood behavioral disorders. Like the findings at the metropolitan teaching hospitals, ABCs were lowest for surgical and acute conditions while bipolar disorder, major depressive disorders and other psychoses, and SCD had the highest percent of outlier hospitals with readmission rates beyond the 95% confidence interval of their hospital type’s ABC.
Nonmetropolitan
There was a sufficient number of best practicing hospitals to calculate the ABC for six of the 17 diagnoses (Table 2). For conditions where readmission ABCs could be calculated, they were low: 0.0% for appendectomy, bronchiolitis, gastroenteritis, and seizure; 0.3% for pneumonia; and 1.3% in kidney and urinary tract disorders. None of the conditions with the highest ABCs in other hospital settings (bipolar disease, sickle cell anemia crisis, and major depressive disorders and other psychoses) could be calculated in this setting. Seizure-related readmissions exhibited the most outlier hospitals yet were less than 5%.1
DISCUSSION
Among a nationally representative sample of different hospital types that deliver care to children, we report the mean readmission rates and ABCs for 30-day all-cause, same-hospital readmissions for the most commonly readmitted pediatric diagnoses based on hospital type. Previous studies have shown patient variables such as race, ethnicity, and insurance type influencing readmission rates.19,20 However, hospital type has also been associated with a higher risk of readmission due to the varying complexity of patients at different hospital types.21,22 Our analyses provide hospital-type specific national estimates of pediatric readmission ABCs for medical and surgical conditions, many less than 1%. While commonly encountered pediatric conditions like asthma and bronchiolitis had low mean readmission rates and ABCs across all hospital types, the mean rates and ABCs for SCD and mental health disorders were much higher with more hospitals performing far from the ABCs.
Diagnoses with a larger percentage of outlier hospitals may represent a national opportunity to improve care for children. Conditions such as SCD and mental illnesses have the highest percentage of hospitals whose readmission rates fall outside of the ABCs in both metropolitan teaching and metropolitan nonteaching hospitals. Hospital performance on SCD and mental health disorders may not reflect deficits in hospital quality or poor adherence to evidence-based best practices, but rather the complex interplay of factors on various levels from government policy and insurance plans, to patient and family resources, to access and availability of medical and mental health specific care. Most importantly, these diseases may represent a significant opportunity for quality improvementin hospitals across the United States.
Sickle cell disease is predominantly a disease among African-Americans, a demographic risk factor for decreased access to care and limited patient and family resources.23-26 In previous studies evaluating the disparity in readmission rates for Black children with asthma, socioeconomic variables explained 53% of the observed disparity and readmission rates were inversely related to the childhood opportunity index of the patient’s census tract and positively related with geographic social risk.27,28 Likewise, with SCD affecting a specific demographic and being a chronic disease, best practice policies need to account for the child’s medical needs and include the patient and family resources to ensure access to care and enhanced case management for chronic disease if we aim to improve performance among the outlier hospitals.
Similarly, barriers to care for children with mental illnesses in the United States need attention.29,30 While there is a paucity of data on the prevalence of mental health disorders in children, one national report estimates that one in 10 American adolescents have depression.29,31 The American Academy of Pediatrics has developed a policy statement on mental health competencies and a mental health tool-kit for primary care pediatricians; however, no such guidelines or policy statements exist for hospitalized patients with acute or chronic psychiatric conditions.32,33 Moreover, hospitals are increasingly facing “boarding” of children with acute psychiatric illness in inpatient units and emergency departments.34 The American Medical Association and the American College of Emergency Physicians have expressed concerns regarding the boarding of children with acute psychiatric illness because nonpsychiatric hospitals do not have adequate resources to evaluate, manage, and place these children who deserve appropriate facilities for further management. Coordinated case management and “bundled” discharge planning in other chronic illnesses have shown benefit in cost reduction and readmission.35-37 Evidence-based practices around pediatric readmissions in other diagnoses should be explored as possible interventions in these conditions.38
There are several limitations to this study. Our data is limited to one calendar year; therefore, admissions in January do not account for potential readmissions from December of the previous year, as patient identifiers do not link across years in the NRD. We also limited our evaluation to the conventional 30-day readmission window, but recent publications may indicate that readmission windows with different timelines could be a more accurate reflection of medically preventable readmissions versus a reflection of social determinants of health leading to readmissions.24 Newborn index admissions were not an allowable index admission; therefore, we may be underreporting readmissions in the neonatal age group. We also chose to include all-cause readmissions, a conventional method to evaluate readmission within an institution, but which may not reflect the quality of care delivered in the index admission. For example, an asthmatic discharged after an acute exacerbation readmitted for dehydration secondary to gastroenteritis may not reflect a lack of quality in asthma inpatient care. Readmissions were limited to the same hospital; therefore, this study cannot account for readmissions at other institutions, which may cause us to underestimate readmission rates. However, end-users of our findings most likely have access only to their own institution’s data. The inclusion of observation status admissions in the database varies from state to state; therefore, this percent of admissions in the database is unknown.
The use of the ABC methodology has some inherent limitations. One hospital with a significant volume diagnosis and low readmission rate within a hospital type may prohibit the reporting of an ABC if less than three hospitals composed the total of the ‘best performing’ hospitals. This was a significant limitation leading to the exclusion of many ABCs in nonmetropolitan institutions. The limitation of calculating and reporting an ABC then prohibits the calculation of outlier hospitals within a hospital type for a given diagnosis. However, when the ABCs are not available, we do provide the mean readmission rate for the diagnosis within the hospital type. While the hospital groupings by population and teaching status for ABCs provide meaningful comparisons for within each hospital setting, it should be noted that there may be vast differences among hospitals within each type (eg, tertiary children’s hospitals compared to teaching hospitals with a pediatric floor in the metropolitan teaching hospital category).39,40
As healthcare moves from a fee-for-service model to a population-health centered, value-based model, reduction in readmission rates will be more than a quality measure and will have potential financial implications.41 In the Medicare fee-for-service patients, the Hospital Readmission Reduction Program (HRRP) penalize hospitals with excess readmissions for acute myocardial infarction, heart failure, and pneumonia. The hospitals subject to penalties in the HRRP had greater reduction in readmission rates in the targeted, and even nontargeted conditions, compared with hospitals not subject to penalties.42 Similarly, we believe that our data on low readmission rates and ABCs for conditions such as asthma, bronchiolitis, and appendicitis could represent decades of quality improvement work for the most common pediatric conditions among hospitalized children. Sickle cell disease and mental health problems remain as outliers and merit further attention. To move to a true population-health model, hospitals will need to explore outlier conditions including evaluating patient-level readmission patterns across institutions. This moves readmission from a hospital quality measure to a patient-centric quality measure, and perhaps will provide value to the patient and the healthcare system alike.
CONCLUSIONS
The readmission ABCs for the most commonly readmitted pediatric diagnoses are low, regardless of the hospital setting. The highest pediatric readmission rates in SCD, bipolar disorders, and major depressive disorder were lower than the most common adult readmission diagnoses. However, mental health conditions and SCD remain as outliers for pediatric readmissions, burden hospital systems, and perhaps warrant national-level attention. The ABCs stratified by hospital type in this study facilitate comparisons and identify opportunities for population-level interventions to meaningfully improve patient care.
Disclosures
The authors have nothing to disclose.
1. Medicare. 30-day death and readmission measures data. https://www.medicare.gov/hospitalcompare/Data/30-day-measures.html. Accessed October 24, 2017.
2. National Quality Forum. Performance Measures; 2016 https://www.quality fourm.org/Measuring_Performance/Endorsed_Performance_Measures_Maintenance.aspx. Accessed October 24, 2017.
3. Auger KA, Simon TD, Cooperberg D, et al. Summary of STARNet: seamless transitions and (re)admissions network. Pediatrics. 2015;135(1):164-175. https://doi.org/10.1542/peds.2014-1887.
4. Toomey SL, Peltz A, Loren S, et al. Potentially preventable 30-day hospital readmissions at a children’s hospital. Pediatrics. 2016;138(2):e20154182-e20154182. https://doi.org/10.1542/peds.2015-4182.
5. Halfon P, Eggli Y, Prêtre-Rohrbach I, et al. Validation of the potentially avoidable hospital readmission rate as a routine indicator of the quality of hospital care. Med Care. 2006;44(11):972-981. https://doi.org/10.1097/01.mlr.0000228002.43688.c2.
6. Gay JC, Agrawal R, Auger KA, et al. Rates and impact of potentially preventable readmissions at children’s hospitals. J Pediatr. 2015;166(3):613-619. https://doi.org/10.1016/j.jpeds.2014.10.052.
7. Berry JG, Gay JC, Joynt Maddox KJ, et al. Age trends in 30 day hospital readmissions: US national retrospective analysis. BMJ. 2018;360:k497. https://doi.org/10.1136/bmj.k497.
8. Bardach NS, Vittinghoff E, Asteria-Penaloza R, et al. Measuring hospital quality using pediatric readmission and revisit rates. Pediatrics. 2013;132(3):429-436. https://doi.org/10.1542/peds.2012-3527d.
9. Berry JG, Toomey SL, Zaslavsky AM, et al. Pediatric readmission prevalence and variability across hospitals. JAMA. 2013;309(4):372-380. https://doi.org/10.1001/jama.2012.188351.
10. Gohil SK, Datta R, Cao C, et al. Impact of hospital population case-mix, including poverty, on hospital all-cause and infection-related 30-day readmission rates. Clin Infect Dis. 2015;61(8):1235-1243. https://doi.org/10.1093/cid/civ539.
11. Parikh K, Hall M, Mittal V, et al. Establishing benchmarks for the hospitalized care of children with asthma, bronchiolitis, and pneumonia. Pediatrics. 2014;134(3):555-562. https://doi.org/10.1542/peds.2014-1052.
12. Reyes M, Paulus E, Hronek C, et al. Choosing wisely campaign: report card and achievable benchmarks of care for children’s hospitals. Hosp Pediatr. 2017;7(11):633-641. https://doi.org/10.1542/hpeds.2017-0029.
13. Kiefe CI, Weissman NW, Allison JJ, et al. Identifying achievable benchmarks of care: concepts and methodology. Int J Qual Health Care. 1998;10(5):443-447. https://doi.org/10.1093/intqhc/10.5.443.
14. Agency for Healthcare Research and Quality. Nationwide Readmissions Database Availability of Data Elements. . https://www.hcup-us.ahrq.gov/partner/MOARef/HCUPdata_elements.pdf. Accessed 2018 Jun 6
15. Healthcare Cost and Utilization Project. HCUP NRD description of data elements. Agency Healthc Res Qual. https://www.hcup-us.ahrq.gov/db/vars/samedayevent/nrdnote.jsp. Accessed 2018 Jun 6; 2015.
16. Feudtner C, Feinstein JA, Zhong W, Hall M, Dai D. Pediatric complex chronic conditions classification system version 2: updated for ICD-10 and complex medical technology dependence and transplantation. BMC Pediatr. 2014;14:199. https://doi.org/10.1186/1471-2431-14-199.
17. Agency for Healthcare Research and Quality. HCUP chronic condition indicator. Healthc Cost Util Proj. https://www.hcup-us.ahrq.gov/toolssoftware/chronic/chronic.jsp. Accessed 2016 Apr 26; 2009.
18. Weissman NW, Allison JJ, Kiefe CI, et al. Achievable benchmarks of care: the ABCs of benchmarking. J Eval Clin Pract. 1999;5(3):269-281. https://doi.org/10.1046/j.1365-2753.1999.00203.x.
19. Joynt KE, Orav EJ, Jha AK. Thirty-day readmission rates for medicare beneficiaries by race and site of care. JAMA. 2011;305(7):675-681. https://doi.org/10.1001/jama.2011.123.
20. Kenyon CC, Melvin PR, Chiang VW, et al. Rehospitalization for childhood asthma: timing, variation, and opportunities for intervention. J Pediatr. 2014;164(2):300-305. https://doi.org/10.1016/j.jpeds.2013.10.003.
21. Sobota A, Graham DA, Neufeld EJ, Heeney MM. Thirty-day readmission rates following hospitalization for pediatric sickle cell crisis at freestanding children’s hospitals: risk factors and hospital variation. Pediatr Blood Cancer. 2012;58(1):61-65. https://doi.org/10.1002/pbc.23221.
22. Berry JG, Hall DE, Kuo DZ, et al. Hospital utilization and characteristics of patients experiencing recurrent readmissions within children’s hospitals. JAMA. 2011;305(7):682-690. https://doi.org/10.1001/jama.2011.122.
23. Ginde AA, Espinola JA, Camargo CA. Improved overall trends but persistent racial disparities in emergency department visits for acute asthma, 1993-2005. J Allergy Clin Immunol. 2008;122(2):313-318. https://doi.org/10.1016/j.jaci.2008.04.024.
24. Parikh K, Berry J, Hall M, et al. Racial and ethnic differences in pediatric readmissions for common chronic conditions. J Pediatr. 2017;186. https://doi.org/10.1016/j.jpeds.2017.03.046.
25. Chen BK, Hibbert J, Cheng X, Bennett K. Travel distance and sociodemographic correlates of potentially avoidable emergency department visits in California, 2006-2010: an observational study. Int J Equity Health. 2015;14(1):30. https://doi.org/10.1186/s12939-015-0158-y.
26. Ray KN, Chari AV, Engberg J, et al. Disparities in time spent seeking medical care in the United States. JAMA Intern Med. 2015;175(12):175(12):1983-1986. https://doi.org/10.1001/jamainternmed.2015.4468.
27. Beck AF, Huang B, Wheeler K, et al. The child opportunity index and disparities in pediatric asthma hospitalizations across one Ohio metropolitan area. J Pediatr. 2011-2013;190:200-206. https://doi.org/10.1016/j.jpeds.2017.08.007.
28. Beck AF, Simmons JM, Huang B, Kahn RS. Geomedicine: area-based socioeconomic measures for assessing the risk of hospital reutilization among children admitted for asthma. Am J Public Health. 2012;102(12):2308-2314. https://doi.org/10.2105/AJPH.2012.300806.
29. Avenevoli S, Swendsen J, He JP, Burstein M, Merikangas KR. Major depression in the national comorbidity survey-adolescent supplement: prevalence, correlates, and treatment. J Am Acad Child Adolesc Psychiatry. 2015;54(1):37-44.e2. https://doi.org/10.1016/j.jaac.2014.10.010.
30. Feng JY, Toomey SL, Zaslavsky AM, Nakamura MM, Schuster MA. Readmission after pediatric mental health admissions. Pediatrics. 2017;140(6):e20171571. https://doi.org/10.1542/peds.2017-1571.
31. Merikangas KR, He JP, Burstein M, et al. Lifetime prevalence of mental disorders in U.S. adolescents: results from the National comorbidity Survey Replication-Adolescent Supplement (NCS-A). J Am Acad Child Adolesc Psychiatry. 2010;49(10):980-989. https://doi.org/10.1016/j.jaac.2010.05.017.
32. Cheung AH, Zuckerbrot RA, Jensen PS, et al. Guidelines for adolescent depression in primary care (GLAD-PC): Part II. Treatment and ongoing management. Pediatrics. 2018;141(3):e20174082. https://doi.org/10.1542/peds.2017-4082.
33. Zuckerbrot RA, Cheung A, Jensen PS, et al. Guidelines for adolescent depression in primary care (GLAD-PC): Part I. Practice preparation, identification, assessment, and initial management. Pediatrics. 2018;141(3):e20174081. https://doi.org/10.1542/peds.2017-4081.
34. Dolan MA, Fein JA, Committee on Pediatric Emergency Medicine. Pediatric and adolescent mental health emergencies in the emergency Medical Services system. Pediatrics. 2011;127(5):e1356-e1366. https://doi.org/10.1542/peds.2011-0522.
35. Collaborative Healthcare Strategies. Hospital Guide to Reducing Medicaid Readmissions. Rockville, MD: 2014. https://www.ahrq.gov/sites/default/files/publications/files/medreadmissions.pdf. Accessed 2017 Oct 11.
36. Hilbert K, Payne R, Wooton S. Children’s Hospitals’ Solutions for Patient Safety. Readmissions Bundle Tools. Cincinnati, OH; 2014.
37. Nuckols TK, Keeler E, Morton S, et al. Economic evaluation of quality improvement interventions designed to prevent hospital readmission: a systematic review and meta-analysis. JAMA Intern Med. 2017;177(7):975-985. https://doi.org/10.1001/jamainternmed.2017.1136.
38. Berry JG, Blaine K, Rogers J, et al. A framework of pediatric hospital discharge care informed by legislation, research, and practice. JAMA Pediatr. 2014;168(10):955-962. https://doi.org/10.1001/jamapediatrics.2014.891.
39. Chen HF, Carlson E, Popoola T, Suzuki S. The impact of rurality on 30-day preventable readmission, illness severity, and risk of mortality for heart failure Medicare home health beneficiaries. J Rural Health. 2016;32(2):176-187. https://doi.org/10.1111/jrh.12142.
40. Khan A, Nakamura MM, Zaslavsky AM, et al. Same-hospital readmission rates as a measure of pediatric quality of care. JAMA Pediatr. 2015;169(10):905-912. https://doi.org/10.1001/jamapediatrics.2015.1129.
41. Share DA, Campbell DA, Birkmeyer N, et al. How a regional collaborative of hospitals and physicians in Michigan cut costs and improved the quality of care. Health Aff. 2011;30(4):636-645. https://doi.org/10.1377/hlthaff.2010.0526.
42. Desai NR, Ross JS, Kwon JY, et al. Association between hospital penalty status under the hospital readmission reduction program and readmission rates for target and nontarget conditions. JAMA. 2016;316(24):2647-2656. https://doi.org/10.1001/jama.2016.18533.
© 2019 Society of Hospital Medicine
Association of Herpes Simplex Virus Testing with Hospital Length of Stay for Infants ≤60 Days of Age Undergoing Evaluation for Meningitis
Neonatal herpes simplex virus (HSV) is associated with significant morbidity and mortality,1 particularly when the diagnosis or treatment is delayed.2 Therefore, many infants aged ≤60 days being evaluated for meningitis undergo cerebrospinal fluid (CSF) HSV polymerase chain reaction (PCR) testing even though the risk of HSV infection is low [estimated at 0.4% of those undergoing evaluation for central nervous system (CNS) infection].3 A single-center study demonstrated that CSF HSV PCR testing increases the hospital length of stay (LOS) for infants aged ≤56 days,4 although these single-center findings may not be generalizable. To this end, we measured the association between CSF HSV PCR testing and LOS in a multicenter cohort of hospitalized young infants.
METHODS
Study Design
We conducted a planned secondary analysis of a retrospective cohort of infants aged ≤60 days who presented to the emergency department (ED) between January 1, 2005 and December 31, 2013, enrolled in the Pediatric Emergency Medicine Collaborative Research Committee (PEM CRC) HSV study.3 Our study was limited to the 20 hospitals that contributed hospital LOS data. The study protocol was approved by each site’s institutional review board with permission for data sharing.
Study Population
Eligible infants were identified at each site using a site-specific electronic search strategy. Infants were eligible for inclusion if a CSF culture was obtained in the ED or within 24 hours of ED arrival. We excluded infants who were discharged from the ED and those with missing hospital LOS data.
Data Collection
Site investigators extracted the following data elements either electronically or from medical records: patient demographics; ED arrival date and time; hospital discharge date and time; urinalysis results; peripheral and CSF cell counts; blood, urine, and CSF bacterial culture results; as well as the results of HSV PCR and viral cultures. Infants with growth of a pathogen in blood or CSF, or a catheterized urine culture with ≥50,000 colony-forming units (CFUs)/mL of a single pathogenic bacteria, or 10,000-50,000 CFUs/mL of a single pathogenic bacteria with an abnormal urinalysis (ie, positive nitrite or leukocyte esterase on urine dipstick or >5 white blood cells [WBCs] per high power field on urine microscopy) were classified as having a serious bacterial infection (SBI).5,6 Infants with a positive HSV PCR or viral culture from any site were classified as having HSV infection.3 Hospitalized infants who did not have an HSV PCR test performed were assumed not to have HSV disease if not diagnosed during the hospital stay or repeat ED encounter.3
Outcome Measures
The primary outcome was hospital LOS, defined at all hospitals as the time from ED arrival to provider signature of the hospital discharge order, calculated in minutes and then converted into days.
Statistical Analysis
We described LOS using medians with interquartile ranges (IQR) and compared between infants with and without a CSF HSV PCR test performed using the Mann–Whitney U test. To evaluate the association between performance of CSF HSV PCR testing and hospital LOS, we used negative binomial regression given the count variable outcome (LOS) with an overdispersed distribution. For this analysis, we clustered by hospital after adjusting for the following factors determined a priori: age, gender, study year, and presence of serious bacterial or HSV infection. Using the relative marginal modeled estimates of LOS (tested vs not tested), we determined the percentage increase in LOS. We then repeated the analyses after stratifying by the location of testing (ie, in-house vs send-out), age (≤28 days vs 29-60 days), and presence or absence of CSF pleocytosis (defined as a CSF WBC of ≥16 cells/mm3for infants aged ≤28 days and ≥10 cells/mm3for infants aged 29-60 days),7 because infants aged 29-60 days and those without CSF pleocytosis are reported to be at very low risk for CNS HSV infection.3,8 We utilized Stata Data Analysis and Statistical Software, version 15.0 (StataCorp, Inc.; College Station, Texas) for statistical analyses.
RESULTS
Of 24,103 infants with CSF cultures obtained at the 20 participating sites, we excluded 2,673 (11.1%) discharged from the ED or with missing disposition and 934 (3.9%) with missing LOS, leaving a study cohort of 20,496 infants (Figure). Overall, 1,780 infants (8.7%) had an SBI and 99 (0.5%) had an HSV infection, of which 46 (46.5%) had a CNS HSV infection.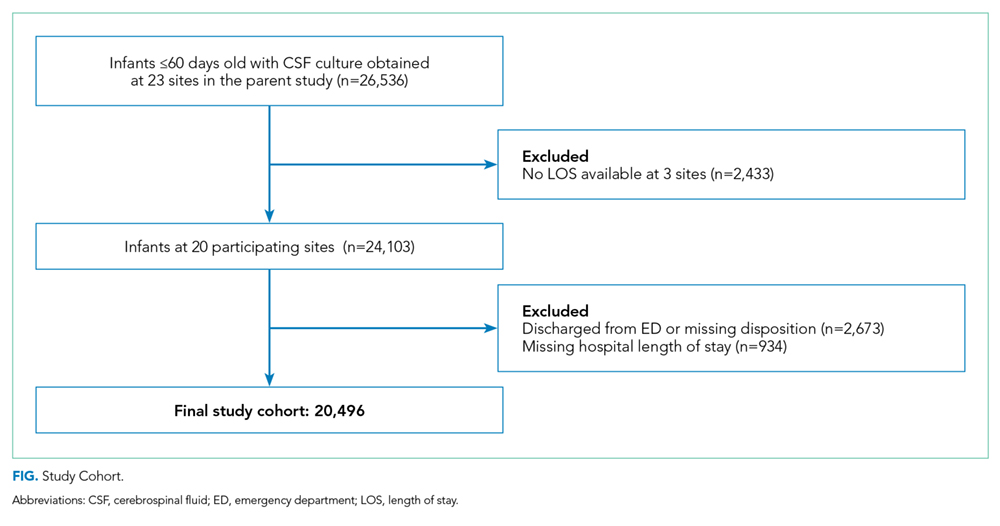
Among the 20,496 study infants, 7,399 (36.1%) had a CSF HSV PCR test performed; 5,935 infants (80.2% of those tested) had in-house and 1,464 (19.8%) had send-out testing. Among infants with available CSF cell counts, a CSF HSV PCR test was more commonly performed in infants with CSF pleocytosis than in those without (1,865/4,439 [42.0%] with CSF pleocytosis vs 3,705/12,002 [30.9%] without CSF pleocytosis; odds ratio [OR] 1.6, 95% CI 1.5-1.7). Of the 7,399 infants who had a CSF HSV PCR test performed, 46 (0.6%) had a positive test. Of the tested infants, 5,570 (75.3%) had an available CSF WBC count; a positive CSF HSV PCR test was more common in infants with CSF pleocytosis than in those without (25 positive tests/1,865 infants with CSF pleocytosis [1.3%] vs 9/3,705 [0.2%] without CSF pleocytosis; OR 5.6, 95% CI 2.6-12.0). Among the 5,308 infants aged 29-60 days without CSF pleocytosis, 1,110 (20.9%) had a CSF HSV PCR test performed and only one infant (0.09% of those tested) had a positive test.
Without adjustment, infants with a CSF HSV PCR test had a longer median LOS than infants who were not tested (2.5 vs 2.3 days; P < .001). After adjustment, infants with a CSF HSV PCR test performed had a 23% longer duration of hospitalization. The association between testing and LOS was similar for older vs younger infants, infants with and without CSF pleocytosis, and in-house vs send-out testing (Table).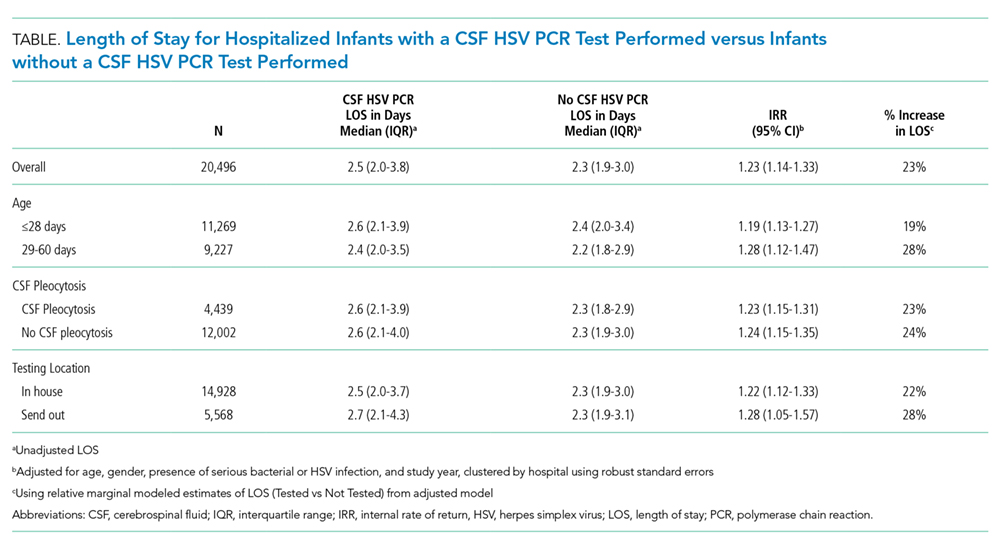
DISCUSSION
In a large, multicenter cohort of more than 20,000 hospitalized infants aged ≤60 days undergoing evaluation for meningitis, we examined the association of CSF HSV PCR testing with hospital LOS. Approximately one-third of study infants had a CSF HSV PCR test obtained. After adjustment for patient- and hospital-level factors, the treating clinician’s decision to obtain a CSF HSV PCR test was associated with a 23% longer hospital LOS (nearly one-half day).
Our findings are consistent with those of previous studies. First, our observed association of the decision to obtain a CSF HSV PCR test and LOS was similar in magnitude to that of a previous single-center investigation.4 Second, we also found that older infants and those without CSF pleocytosis were at very low risk of HSV infection.3,8 For the otherwise low-risk infants, the longer LOS may be due to delays in obtaining CSF HSV PCR test results, which should be explored in future research. Our study has greater generalizability than previous single-center studies by substantially increasing the population size as well as the variety of clinical settings. Ensuring clinicians’ access to rapid HSV PCR testing platforms will further mitigate the impact of HSV testing on LOS.
When deciding to perform a CSF HSV PCR test for infants aged ≤60 days, clinicians must balance the low incidence of neonatal HSV3 with the risk of delayed diagnosis and treatment of HSV infection, which include neurologic sequelae or even death.1,2 As infants with CNS HSV infection commonly present nonspecifically and only a minority of infected infants have skin vesicles,1 controversy exists as to which infants should be evaluated for HSV infection, resulting in considerable variability in HSV testing.3 Some clinicians advocate for more conservative testing strategies that include the performance of CSF HSV PCR testing in all febrile infants aged ≤21 days.9 Others suggest limiting testing to infants who meet high-risk criteria (eg, seizures, ill-appearance, or CSF pleocytosis).10,11 Further investigation will need to elucidate the clinical and laboratory predictors of HSV infection to identify those infants who would benefit most from HSV testing as well as the outcomes of infants not tested.
Our study has several limitations. First, we could not determine the reason why clinicians elected to obtain a CSF HSV PCR test, and we do not know the test turnaround time or the time when results became available to the clinical team. Second, we did not abstract clinical data such as ill-appearance or seizures. Although we adjusted for the presence of serious bacterial or HSV infection as proxy measures for illness severity, it is possible that other clinical factors were associated with HSV testing and LOS. Third, although we adjusted for patient- and hospital-level factors in our regression model, the potential for residual confounding persists. Fourth, we did not explore acyclovir administration as a factor associated with LOS as some sites did not provide data on acyclovir. Fifth, we did not evaluate the impact of HSV testing of other sample types (eg, blood or skin) on LOS. Sixth, our study was conducted primarily at children’s hospitals, and our findings may not be generalizable to general hospitals with hospitalized neonates.
CONCLUSIONS
For infants aged ≤60 days undergoing evaluation for meningitis, CSF HSV PCR testing was associated with a slightly longer hospital LOS. Improved methods to identify and target testing to higher risk infants may mitigate the impact on LOS for low-risk infants.
Acknowledgments
The authors acknowledge the following collaborators in the Pediatric Emergency Medicine Clinical Research Network (PEM CRC) Herpes Simplex Virus (HSV) Study Group who collected data for this study and/or the parent study: Joseph L Arms, MD (Minneapolis, Minnesota), Stuart A Bradin, DO (Ann Arbor, Michigan), Sarah J Curtis, MD, MSc (Edmonton, Alberta, Canada), Paul T Ishimine, MD (San Diego, California), Dina Kulik, MD (Toronto, Ontario, Canada), Prashant Mahajan, MD, MPH, MBA (Ann Arbor, Michigan), Aaron S Miller, MD, MSPH (St. Louis, Missouri), Pamela J Okada, MD (Dallas, Texas), Christopher M Pruitt, MD (Birmingham, Alabama), Suzanne M Schmidt, MD (Chicago, Illinois), David Schnadower, Amy D Thompson, MD (Wilmington, Delaware), Joanna E Thomson, MD, MPH (Cincinnati, Ohio), MD, MPH (St. Louis, Missouri), and Neil G. Uspal, MD (Seattle, Washington).
Disclosures
Dr. Aronson reports grants from the Agency for Healthcare Research and Quality during the conduct of the study. Dr. Shah reports grants from Patient-Centered Outcomes Research Institute, grants from the National Institute of Allergy and Infectious Diseases, and grants from the National Heart Lung Blood Institute, outside the submitted work. Dr. Shah is the Editor-in-Chief of the Journal of Hospital Medicine. All other authors have no conflicts of interest or financial relationships relevant to this article to disclose.
Funding
This project was supported by the Section of Emergency Medicine of the American Academy of Pediatrics (AAP) and Baylor College of Medicine and by the grant number K08HS026006 (Aronson) from the Agency for Healthcare Research and Quality. The content is solely the responsibi
1. Kimberlin DW, Lin CY, Jacobs RF, et al. Natural history of neonatal herpes simplex virus infections in the acyclovir era. Pediatrics. 2001;108(2):223-229. PubMed
2. Shah SS, Aronson PL, Mohamad Z, Lorch SA. Delayed acyclovir therapy and death among neonates with herpes simplex virus infection. Pediatrics. 2011;128(6):1153-1160. https://doi.org/10.1136/eb-2012-100674.
3. Cruz AT, Freedman SB, Kulik DM, et al. Herpes simplex virus infection in infants undergoing meningitis evaluation. Pediatrics. 2018;141(2):e20171688. https://doi.org/10.1542/peds.2017-1688.
4. Shah SS, Volk J, Mohamad Z, Hodinka RL, Zorc JJ. Herpes simplex virus testing and hospital length of stay in neonates and young infants. J Pediatr. 2010;156(5):738-743. https://doi.org/10.1016/j.jpeds.2009.11.079.
5. Mahajan P, Kuppermann N, Mejias A, et al. Association of RNA biosignatures with bacterial infections in febrile infants aged 60 days or younger. JAMA. 2016;316(8):846-857. https://doi.org/10.1001/jama.2016.9207.
6. Schnadower D, Kuppermann N, Macias CG, et al. Febrile infants with urinary tract infections at very low risk for adverse events and bacteremia. Pediatrics. 2010;126(6):1074-1083. https://doi.org/10.1542/peds.2010-0479.
7. Thomson J, Sucharew H, Cruz AT, et al. Cerebrospinal fluid reference values for young infants undergoing lumbar puncture. Pediatrics. 2018;141(3):e20173405. https://doi.org/10.1542/peds.2017-3405.
8. Caviness AC, Demmler GJ, Almendarez Y, Selwyn BJ. The prevalence of neonatal herpes simplex virus infection compared with serious bacterial illness in hospitalized neonates. J Pediatr. 2008;153(2):164-169. https://doi.org/10.1016/j.jpeds.2008.02.031.
9. Long SS. In defense of empiric acyclovir therapy in certain neonates. J Pediatr. 2008;153(2):157-158. https://doi.org/10.1016/j.jpeds.2008.04.071.
10. Brower L, Schondelmeyer A, Wilson P, Shah SS. Testing and empiric treatment for neonatal herpes simplex virus: challenges and opportunities for improving the value of care. Hosp Pediatr. 2016;6(2):108-111. https://doi.org/10.1542/hpeds.2015-0166.
11. Kimberlin DW. When should you initiate acyclovir therapy in a neonate? J Pediatr. 2008;153(2):155-156. https://doi.org/10.1016/j.jpeds.2008.04.027.
Neonatal herpes simplex virus (HSV) is associated with significant morbidity and mortality,1 particularly when the diagnosis or treatment is delayed.2 Therefore, many infants aged ≤60 days being evaluated for meningitis undergo cerebrospinal fluid (CSF) HSV polymerase chain reaction (PCR) testing even though the risk of HSV infection is low [estimated at 0.4% of those undergoing evaluation for central nervous system (CNS) infection].3 A single-center study demonstrated that CSF HSV PCR testing increases the hospital length of stay (LOS) for infants aged ≤56 days,4 although these single-center findings may not be generalizable. To this end, we measured the association between CSF HSV PCR testing and LOS in a multicenter cohort of hospitalized young infants.
METHODS
Study Design
We conducted a planned secondary analysis of a retrospective cohort of infants aged ≤60 days who presented to the emergency department (ED) between January 1, 2005 and December 31, 2013, enrolled in the Pediatric Emergency Medicine Collaborative Research Committee (PEM CRC) HSV study.3 Our study was limited to the 20 hospitals that contributed hospital LOS data. The study protocol was approved by each site’s institutional review board with permission for data sharing.
Study Population
Eligible infants were identified at each site using a site-specific electronic search strategy. Infants were eligible for inclusion if a CSF culture was obtained in the ED or within 24 hours of ED arrival. We excluded infants who were discharged from the ED and those with missing hospital LOS data.
Data Collection
Site investigators extracted the following data elements either electronically or from medical records: patient demographics; ED arrival date and time; hospital discharge date and time; urinalysis results; peripheral and CSF cell counts; blood, urine, and CSF bacterial culture results; as well as the results of HSV PCR and viral cultures. Infants with growth of a pathogen in blood or CSF, or a catheterized urine culture with ≥50,000 colony-forming units (CFUs)/mL of a single pathogenic bacteria, or 10,000-50,000 CFUs/mL of a single pathogenic bacteria with an abnormal urinalysis (ie, positive nitrite or leukocyte esterase on urine dipstick or >5 white blood cells [WBCs] per high power field on urine microscopy) were classified as having a serious bacterial infection (SBI).5,6 Infants with a positive HSV PCR or viral culture from any site were classified as having HSV infection.3 Hospitalized infants who did not have an HSV PCR test performed were assumed not to have HSV disease if not diagnosed during the hospital stay or repeat ED encounter.3
Outcome Measures
The primary outcome was hospital LOS, defined at all hospitals as the time from ED arrival to provider signature of the hospital discharge order, calculated in minutes and then converted into days.
Statistical Analysis
We described LOS using medians with interquartile ranges (IQR) and compared between infants with and without a CSF HSV PCR test performed using the Mann–Whitney U test. To evaluate the association between performance of CSF HSV PCR testing and hospital LOS, we used negative binomial regression given the count variable outcome (LOS) with an overdispersed distribution. For this analysis, we clustered by hospital after adjusting for the following factors determined a priori: age, gender, study year, and presence of serious bacterial or HSV infection. Using the relative marginal modeled estimates of LOS (tested vs not tested), we determined the percentage increase in LOS. We then repeated the analyses after stratifying by the location of testing (ie, in-house vs send-out), age (≤28 days vs 29-60 days), and presence or absence of CSF pleocytosis (defined as a CSF WBC of ≥16 cells/mm3for infants aged ≤28 days and ≥10 cells/mm3for infants aged 29-60 days),7 because infants aged 29-60 days and those without CSF pleocytosis are reported to be at very low risk for CNS HSV infection.3,8 We utilized Stata Data Analysis and Statistical Software, version 15.0 (StataCorp, Inc.; College Station, Texas) for statistical analyses.
RESULTS
Of 24,103 infants with CSF cultures obtained at the 20 participating sites, we excluded 2,673 (11.1%) discharged from the ED or with missing disposition and 934 (3.9%) with missing LOS, leaving a study cohort of 20,496 infants (Figure). Overall, 1,780 infants (8.7%) had an SBI and 99 (0.5%) had an HSV infection, of which 46 (46.5%) had a CNS HSV infection.
Among the 20,496 study infants, 7,399 (36.1%) had a CSF HSV PCR test performed; 5,935 infants (80.2% of those tested) had in-house and 1,464 (19.8%) had send-out testing. Among infants with available CSF cell counts, a CSF HSV PCR test was more commonly performed in infants with CSF pleocytosis than in those without (1,865/4,439 [42.0%] with CSF pleocytosis vs 3,705/12,002 [30.9%] without CSF pleocytosis; odds ratio [OR] 1.6, 95% CI 1.5-1.7). Of the 7,399 infants who had a CSF HSV PCR test performed, 46 (0.6%) had a positive test. Of the tested infants, 5,570 (75.3%) had an available CSF WBC count; a positive CSF HSV PCR test was more common in infants with CSF pleocytosis than in those without (25 positive tests/1,865 infants with CSF pleocytosis [1.3%] vs 9/3,705 [0.2%] without CSF pleocytosis; OR 5.6, 95% CI 2.6-12.0). Among the 5,308 infants aged 29-60 days without CSF pleocytosis, 1,110 (20.9%) had a CSF HSV PCR test performed and only one infant (0.09% of those tested) had a positive test.
Without adjustment, infants with a CSF HSV PCR test had a longer median LOS than infants who were not tested (2.5 vs 2.3 days; P < .001). After adjustment, infants with a CSF HSV PCR test performed had a 23% longer duration of hospitalization. The association between testing and LOS was similar for older vs younger infants, infants with and without CSF pleocytosis, and in-house vs send-out testing (Table).
DISCUSSION
In a large, multicenter cohort of more than 20,000 hospitalized infants aged ≤60 days undergoing evaluation for meningitis, we examined the association of CSF HSV PCR testing with hospital LOS. Approximately one-third of study infants had a CSF HSV PCR test obtained. After adjustment for patient- and hospital-level factors, the treating clinician’s decision to obtain a CSF HSV PCR test was associated with a 23% longer hospital LOS (nearly one-half day).
Our findings are consistent with those of previous studies. First, our observed association of the decision to obtain a CSF HSV PCR test and LOS was similar in magnitude to that of a previous single-center investigation.4 Second, we also found that older infants and those without CSF pleocytosis were at very low risk of HSV infection.3,8 For the otherwise low-risk infants, the longer LOS may be due to delays in obtaining CSF HSV PCR test results, which should be explored in future research. Our study has greater generalizability than previous single-center studies by substantially increasing the population size as well as the variety of clinical settings. Ensuring clinicians’ access to rapid HSV PCR testing platforms will further mitigate the impact of HSV testing on LOS.
When deciding to perform a CSF HSV PCR test for infants aged ≤60 days, clinicians must balance the low incidence of neonatal HSV3 with the risk of delayed diagnosis and treatment of HSV infection, which include neurologic sequelae or even death.1,2 As infants with CNS HSV infection commonly present nonspecifically and only a minority of infected infants have skin vesicles,1 controversy exists as to which infants should be evaluated for HSV infection, resulting in considerable variability in HSV testing.3 Some clinicians advocate for more conservative testing strategies that include the performance of CSF HSV PCR testing in all febrile infants aged ≤21 days.9 Others suggest limiting testing to infants who meet high-risk criteria (eg, seizures, ill-appearance, or CSF pleocytosis).10,11 Further investigation will need to elucidate the clinical and laboratory predictors of HSV infection to identify those infants who would benefit most from HSV testing as well as the outcomes of infants not tested.
Our study has several limitations. First, we could not determine the reason why clinicians elected to obtain a CSF HSV PCR test, and we do not know the test turnaround time or the time when results became available to the clinical team. Second, we did not abstract clinical data such as ill-appearance or seizures. Although we adjusted for the presence of serious bacterial or HSV infection as proxy measures for illness severity, it is possible that other clinical factors were associated with HSV testing and LOS. Third, although we adjusted for patient- and hospital-level factors in our regression model, the potential for residual confounding persists. Fourth, we did not explore acyclovir administration as a factor associated with LOS as some sites did not provide data on acyclovir. Fifth, we did not evaluate the impact of HSV testing of other sample types (eg, blood or skin) on LOS. Sixth, our study was conducted primarily at children’s hospitals, and our findings may not be generalizable to general hospitals with hospitalized neonates.
CONCLUSIONS
For infants aged ≤60 days undergoing evaluation for meningitis, CSF HSV PCR testing was associated with a slightly longer hospital LOS. Improved methods to identify and target testing to higher risk infants may mitigate the impact on LOS for low-risk infants.
Acknowledgments
The authors acknowledge the following collaborators in the Pediatric Emergency Medicine Clinical Research Network (PEM CRC) Herpes Simplex Virus (HSV) Study Group who collected data for this study and/or the parent study: Joseph L Arms, MD (Minneapolis, Minnesota), Stuart A Bradin, DO (Ann Arbor, Michigan), Sarah J Curtis, MD, MSc (Edmonton, Alberta, Canada), Paul T Ishimine, MD (San Diego, California), Dina Kulik, MD (Toronto, Ontario, Canada), Prashant Mahajan, MD, MPH, MBA (Ann Arbor, Michigan), Aaron S Miller, MD, MSPH (St. Louis, Missouri), Pamela J Okada, MD (Dallas, Texas), Christopher M Pruitt, MD (Birmingham, Alabama), Suzanne M Schmidt, MD (Chicago, Illinois), David Schnadower, Amy D Thompson, MD (Wilmington, Delaware), Joanna E Thomson, MD, MPH (Cincinnati, Ohio), MD, MPH (St. Louis, Missouri), and Neil G. Uspal, MD (Seattle, Washington).
Disclosures
Dr. Aronson reports grants from the Agency for Healthcare Research and Quality during the conduct of the study. Dr. Shah reports grants from Patient-Centered Outcomes Research Institute, grants from the National Institute of Allergy and Infectious Diseases, and grants from the National Heart Lung Blood Institute, outside the submitted work. Dr. Shah is the Editor-in-Chief of the Journal of Hospital Medicine. All other authors have no conflicts of interest or financial relationships relevant to this article to disclose.
Funding
This project was supported by the Section of Emergency Medicine of the American Academy of Pediatrics (AAP) and Baylor College of Medicine and by the grant number K08HS026006 (Aronson) from the Agency for Healthcare Research and Quality. The content is solely the responsibi
1. Kimberlin DW, Lin CY, Jacobs RF, et al. Natural history of neonatal herpes simplex virus infections in the acyclovir era. Pediatrics. 2001;108(2):223-229. PubMed
2. Shah SS, Aronson PL, Mohamad Z, Lorch SA. Delayed acyclovir therapy and death among neonates with herpes simplex virus infection. Pediatrics. 2011;128(6):1153-1160. https://doi.org/10.1136/eb-2012-100674.
3. Cruz AT, Freedman SB, Kulik DM, et al. Herpes simplex virus infection in infants undergoing meningitis evaluation. Pediatrics. 2018;141(2):e20171688. https://doi.org/10.1542/peds.2017-1688.
4. Shah SS, Volk J, Mohamad Z, Hodinka RL, Zorc JJ. Herpes simplex virus testing and hospital length of stay in neonates and young infants. J Pediatr. 2010;156(5):738-743. https://doi.org/10.1016/j.jpeds.2009.11.079.
5. Mahajan P, Kuppermann N, Mejias A, et al. Association of RNA biosignatures with bacterial infections in febrile infants aged 60 days or younger. JAMA. 2016;316(8):846-857. https://doi.org/10.1001/jama.2016.9207.
6. Schnadower D, Kuppermann N, Macias CG, et al. Febrile infants with urinary tract infections at very low risk for adverse events and bacteremia. Pediatrics. 2010;126(6):1074-1083. https://doi.org/10.1542/peds.2010-0479.
7. Thomson J, Sucharew H, Cruz AT, et al. Cerebrospinal fluid reference values for young infants undergoing lumbar puncture. Pediatrics. 2018;141(3):e20173405. https://doi.org/10.1542/peds.2017-3405.
8. Caviness AC, Demmler GJ, Almendarez Y, Selwyn BJ. The prevalence of neonatal herpes simplex virus infection compared with serious bacterial illness in hospitalized neonates. J Pediatr. 2008;153(2):164-169. https://doi.org/10.1016/j.jpeds.2008.02.031.
9. Long SS. In defense of empiric acyclovir therapy in certain neonates. J Pediatr. 2008;153(2):157-158. https://doi.org/10.1016/j.jpeds.2008.04.071.
10. Brower L, Schondelmeyer A, Wilson P, Shah SS. Testing and empiric treatment for neonatal herpes simplex virus: challenges and opportunities for improving the value of care. Hosp Pediatr. 2016;6(2):108-111. https://doi.org/10.1542/hpeds.2015-0166.
11. Kimberlin DW. When should you initiate acyclovir therapy in a neonate? J Pediatr. 2008;153(2):155-156. https://doi.org/10.1016/j.jpeds.2008.04.027.
© 2019 Society of Hospital Medicine
Focus on Science, Not Format: Introducing No Hassle Submissions to the Journal of Hospital Medicine
The Journal of Hospital Medicine® is committed to continually improving the author experience. Our goal is to allow authors to focus more time on communicating their message and less time on navigating the submission and publication process. We commit to three initial areas of emphasis: (1) Make it easy for authors to submit their work; (2) Make timely disposition decisions; and (3) Facilitate dissemination of work that we publish.
We are pleased to introduce a new “No hassle” process for initial original research and brief report manuscript submissions. There is no universally followed format for manuscript submission to medical journals.1-3 As a result, authors spend considerable time reformatting manuscripts for submission to meet each journal’s unique requirements before knowing whether or not their manuscript will be accepted for publication—or even sent for peer review. To streamline the submission process and eliminate unnecessary and burdensome reformatting, we have eased formatting requirements for initial manuscript submissions. We will even accept all manuscript elements in a single PDF (portable document format) file in another journal’s format if your manuscript was submitted elsewhere first but not accepted for publication. Tables and figures can be included in the single document or uploaded separately, depending on your preference. Of course, common elements necessary to assess a manuscript, including declaration of funding sources and conflicts of interest, are required on the title page.1 Journal-specific formatting and signed disclosure and copyright forms will be deferred until a revision request.
We also seek to make timely decisions. Our rapid turnaround allows authors to submit elsewhere expeditiously if not accepted by the Journal of Hospital Medicine. We reject approximately 50% of original research and brief report manuscripts without formal peer review. The rationale for this approach is two-fold. We want to be respectful of how we engage our peer reviewers and we would rather not have them spend time reviewing manuscripts that we are unlikely to publish. We also want to be respectful of our authors’ time. If we are unlikely to publish a manuscript based on lower priority scores assigned by the Editor-in-Chief and other journal editors, we prefer to return the manuscript to authors for timely submission elsewhere. Our average time from submission to rejection without formal peer review is 1.3 days (median, <1 day). If we send a manuscript out for peer review, our time from submission to first decision is 23 days. Further, if we request a manuscript revision, we sincerely hope to publish the manuscript. Thus, most manuscripts for which we request a revision are ultimately accepted for publication. We are also tracking how quickly we can publish accepted manuscripts with a goal of 120 or fewer days from submission to publication and 60 or fewer days from acceptance to publication.
We highlight our published research in many ways to facilitate dissemination. We promote articles through formal press releases, tweets, visual abstracts, and, more recently, graphic medicine abstracts or comics. Select articles are discussed through our online journal club (#JHMChat).4 Other synergistic methods of dissemination are being planned and we’ll share these ideas with you in the coming year.
We are grateful to receive a large number of submissions and are honored that authors view the Journal of Hospital Medicine as an important venue to showcase their work. We continually strive to improve the author experience and welcome your input.
1. International Committee of Medical Journal Editors. Recommendations for the conduct, reporting, editing, and publication of scholarly work in medical journals. Updated December 2018. www.icmje.org/recommendations/browse/. Accessed April 2, 2019. PubMed
2. Schriger DL, Arora S, Altman DG. The content of medical journal instructions for authors. Ann Emerg Med. 2006;48(6):743-749. doi: 10.1016/j.annemergmed.2006.03.028 PubMed
3. Barron JP. The uniform requirements for manuscripts submitted to biomedical journals recommended by the International Committee of Medical Journal Editors. Chest. 2006;129(4):1098-1099. doi: 10.1378/chest.129.4.1098. PubMed
4. Wray CM, Auerbach AD, Arora VM. The adoption of an online journal club to improve research dissemination and social media engagement among hospitalists. J Hosp Med. 2018;13(11):764-769. doi: 10.12788/jhm.2987. PubMed
The Journal of Hospital Medicine® is committed to continually improving the author experience. Our goal is to allow authors to focus more time on communicating their message and less time on navigating the submission and publication process. We commit to three initial areas of emphasis: (1) Make it easy for authors to submit their work; (2) Make timely disposition decisions; and (3) Facilitate dissemination of work that we publish.
We are pleased to introduce a new “No hassle” process for initial original research and brief report manuscript submissions. There is no universally followed format for manuscript submission to medical journals.1-3 As a result, authors spend considerable time reformatting manuscripts for submission to meet each journal’s unique requirements before knowing whether or not their manuscript will be accepted for publication—or even sent for peer review. To streamline the submission process and eliminate unnecessary and burdensome reformatting, we have eased formatting requirements for initial manuscript submissions. We will even accept all manuscript elements in a single PDF (portable document format) file in another journal’s format if your manuscript was submitted elsewhere first but not accepted for publication. Tables and figures can be included in the single document or uploaded separately, depending on your preference. Of course, common elements necessary to assess a manuscript, including declaration of funding sources and conflicts of interest, are required on the title page.1 Journal-specific formatting and signed disclosure and copyright forms will be deferred until a revision request.
We also seek to make timely decisions. Our rapid turnaround allows authors to submit elsewhere expeditiously if not accepted by the Journal of Hospital Medicine. We reject approximately 50% of original research and brief report manuscripts without formal peer review. The rationale for this approach is two-fold. We want to be respectful of how we engage our peer reviewers and we would rather not have them spend time reviewing manuscripts that we are unlikely to publish. We also want to be respectful of our authors’ time. If we are unlikely to publish a manuscript based on lower priority scores assigned by the Editor-in-Chief and other journal editors, we prefer to return the manuscript to authors for timely submission elsewhere. Our average time from submission to rejection without formal peer review is 1.3 days (median, <1 day). If we send a manuscript out for peer review, our time from submission to first decision is 23 days. Further, if we request a manuscript revision, we sincerely hope to publish the manuscript. Thus, most manuscripts for which we request a revision are ultimately accepted for publication. We are also tracking how quickly we can publish accepted manuscripts with a goal of 120 or fewer days from submission to publication and 60 or fewer days from acceptance to publication.
We highlight our published research in many ways to facilitate dissemination. We promote articles through formal press releases, tweets, visual abstracts, and, more recently, graphic medicine abstracts or comics. Select articles are discussed through our online journal club (#JHMChat).4 Other synergistic methods of dissemination are being planned and we’ll share these ideas with you in the coming year.
We are grateful to receive a large number of submissions and are honored that authors view the Journal of Hospital Medicine as an important venue to showcase their work. We continually strive to improve the author experience and welcome your input.
1. International Committee of Medical Journal Editors. Recommendations for the conduct, reporting, editing, and publication of scholarly work in medical journals. Updated December 2018. www.icmje.org/recommendations/browse/. Accessed April 2, 2019. PubMed
2. Schriger DL, Arora S, Altman DG. The content of medical journal instructions for authors. Ann Emerg Med. 2006;48(6):743-749. doi: 10.1016/j.annemergmed.2006.03.028 PubMed
3. Barron JP. The uniform requirements for manuscripts submitted to biomedical journals recommended by the International Committee of Medical Journal Editors. Chest. 2006;129(4):1098-1099. doi: 10.1378/chest.129.4.1098. PubMed
4. Wray CM, Auerbach AD, Arora VM. The adoption of an online journal club to improve research dissemination and social media engagement among hospitalists. J Hosp Med. 2018;13(11):764-769. doi: 10.12788/jhm.2987. PubMed
© 2019 Society of Hospital Medicine
Reviews Reenvisioned: Supporting Enhanced Practice Improvement for Hospitalists
As part of the Journal of Hospital Medicine’s® commitment to our readership, we are excited to announce innovative new review formats, designed for busy hospitalists. The state of knowledge in our field is changing rapidly, and the 21st century poses a conundrum to clinicians in the form of increasingly complex studies and guidelines amidst ever-decreasing time to digest them. As a result, it can be challenging for hospitalists to access and interpret recently published research to inform their clinical practice. Because we are committed to practical innovation for hospitalists, starting in 2019, JHM will offer focused yet informative content that places important advances into relevant clinical or methodological context and provides our readers with information that is accessible, meaningful, and actionable—all in a more concise format.
Our new Clinical Guideline Highlights for the Hospitalist is a brief, targeted review of recently published clinical guidelines, distilling the major recommendations relevant to hospital medicine and placing them in context of the available evidence. This review format also offers a critique of gaps in the literature and notes areas ripe for future study. In this issue, we debut two articles using this new approach—one aimed at adult hospitalists and the other at pediatric hospitalists—regarding recently published studies and guidelines about maintenance intravenous fluids.1-5
In 2019, we will also introduce a second new format, called Progress Notes. These reviews will be shorter than JHM’s traditional review format, and will accept two types of articles: clinical and methodological. The clinical Progress Notes will provide an update on the last several years of evidence related to diagnosis, treatment, risk stratification, and/or prevention of a clinical problem highly pertinent to hospitalists. The methodological Progress Notes will provide our readers with insight into the application of quantitative, qualitative, and quality improvement methods commonly used in work published in this journal. Our aim is to use Progress Notes as a way to enhance both clinical practice and scholarship efforts by our readers.
Finally, we will introduce “Hospital Medicine: The Year in Review,” an annual feature that concisely compiles and critiques the top articles in both adult and pediatric hospital medicine over the past year. The “Year in Review” will serve as a written corollary to the popular “Updates in Hospital Medicine” presentation at the Society of Hospital Medicine annual meeting, and will highlight important research that advanced our field or provided us a fresh perspective on hospitalist practice.
As we introduce these new review formats, it is important to note that JHM will continue to accept traditional, long-form reviews on any topic relevant to hospitalists, with a preference for rigorous systematic reviews or meta-analyses. Equally important is that JHM’s overarching commitment remains unchanged: support clinicians, leaders, and scholars in our field in their pursuit of delivering evidence-based, high-value clinical care. We hope you enjoy these new article formats and we look forward to your feedback.
Disclosures
The authors declare they have no conflicts of interest/competing interests.
1. National Clinical Guideline Centre. Intravenous Fluid Therapy: Intravenous Fluid Therapy in Adults in Hospital. London: Royal College of Physicians (UK); 2013 Dec. PubMed
2. Selmer MW, Self WH, Wanderer JP, et al. Balanced Crystalloids versus Saline in Critically Ill Adults, N Engl J Med. 2018 Mar 1;378(9):829-839. doi: 10.1056/NEJMoa1711584. PubMed
3. Fled LG, et. al. “Clinical Practice Guideline: Maintenance Intravenous Fluids in Children,” Pediatrics. 2018 Dec;142(6). doi: 10.1542/peds.2018-3083. PubMed
4. Gottenborg E, Pierce R. Clinical Guideline Highlights for the Hospitalist: The Use of Intravenous Fluids in the Hospitalized Adult. J Hosp Med. 2019;14(3):172-173. doi: 10.12788/jhm.3178. PubMed
5. Girdwood ST, Parker MW, Shaughnessy EE. Clinical Guideline Highlights for the Hospitalist: Maintenance Intravenous Fluids in Infants and Children. J Hosp Med. 2019;14(3):170-171. doi: 10.12788/jhm.3177. PubMed
As part of the Journal of Hospital Medicine’s® commitment to our readership, we are excited to announce innovative new review formats, designed for busy hospitalists. The state of knowledge in our field is changing rapidly, and the 21st century poses a conundrum to clinicians in the form of increasingly complex studies and guidelines amidst ever-decreasing time to digest them. As a result, it can be challenging for hospitalists to access and interpret recently published research to inform their clinical practice. Because we are committed to practical innovation for hospitalists, starting in 2019, JHM will offer focused yet informative content that places important advances into relevant clinical or methodological context and provides our readers with information that is accessible, meaningful, and actionable—all in a more concise format.
Our new Clinical Guideline Highlights for the Hospitalist is a brief, targeted review of recently published clinical guidelines, distilling the major recommendations relevant to hospital medicine and placing them in context of the available evidence. This review format also offers a critique of gaps in the literature and notes areas ripe for future study. In this issue, we debut two articles using this new approach—one aimed at adult hospitalists and the other at pediatric hospitalists—regarding recently published studies and guidelines about maintenance intravenous fluids.1-5
In 2019, we will also introduce a second new format, called Progress Notes. These reviews will be shorter than JHM’s traditional review format, and will accept two types of articles: clinical and methodological. The clinical Progress Notes will provide an update on the last several years of evidence related to diagnosis, treatment, risk stratification, and/or prevention of a clinical problem highly pertinent to hospitalists. The methodological Progress Notes will provide our readers with insight into the application of quantitative, qualitative, and quality improvement methods commonly used in work published in this journal. Our aim is to use Progress Notes as a way to enhance both clinical practice and scholarship efforts by our readers.
Finally, we will introduce “Hospital Medicine: The Year in Review,” an annual feature that concisely compiles and critiques the top articles in both adult and pediatric hospital medicine over the past year. The “Year in Review” will serve as a written corollary to the popular “Updates in Hospital Medicine” presentation at the Society of Hospital Medicine annual meeting, and will highlight important research that advanced our field or provided us a fresh perspective on hospitalist practice.
As we introduce these new review formats, it is important to note that JHM will continue to accept traditional, long-form reviews on any topic relevant to hospitalists, with a preference for rigorous systematic reviews or meta-analyses. Equally important is that JHM’s overarching commitment remains unchanged: support clinicians, leaders, and scholars in our field in their pursuit of delivering evidence-based, high-value clinical care. We hope you enjoy these new article formats and we look forward to your feedback.
Disclosures
The authors declare they have no conflicts of interest/competing interests.
1. National Clinical Guideline Centre. Intravenous Fluid Therapy: Intravenous Fluid Therapy in Adults in Hospital. London: Royal College of Physicians (UK); 2013 Dec. PubMed
2. Selmer MW, Self WH, Wanderer JP, et al. Balanced Crystalloids versus Saline in Critically Ill Adults, N Engl J Med. 2018 Mar 1;378(9):829-839. doi: 10.1056/NEJMoa1711584. PubMed
3. Fled LG, et. al. “Clinical Practice Guideline: Maintenance Intravenous Fluids in Children,” Pediatrics. 2018 Dec;142(6). doi: 10.1542/peds.2018-3083. PubMed
4. Gottenborg E, Pierce R. Clinical Guideline Highlights for the Hospitalist: The Use of Intravenous Fluids in the Hospitalized Adult. J Hosp Med. 2019;14(3):172-173. doi: 10.12788/jhm.3178. PubMed
5. Girdwood ST, Parker MW, Shaughnessy EE. Clinical Guideline Highlights for the Hospitalist: Maintenance Intravenous Fluids in Infants and Children. J Hosp Med. 2019;14(3):170-171. doi: 10.12788/jhm.3177. PubMed
© 2019 Society of Hospital Medicine