User login
SHM Inducts New Officers at Annual Meeting
Enter text here
Enter text here
Enter text here
Other Pediatric Literature of Interest
1. Bender B, Skae C, Ozuah P. Oral rehydration therapy: the clear solution to fluid loss. Contemp Pediatr. 2005;22:72-6.
Acute diarrhea leads to more than 1.5 million outpatient visits, 200,000 hospital visits, and 300 deaths per year in the United States. Oral rehydration therapy (ORT) is the preferred approach to treat mild to moderate dehydration due to acute gastroenteritis that includes diarrhea and vomiting. Mild dehydration is defined as a fluid deficit of less than 3%–5%, moderated dehydration is 5%–10%, and severe dehydration is greater than 9%–10%.
The practice of oral rehydration can be traced back more than 150 years. Studies have shown that more than 90% of children can be successfully rehydrated orally and that these children have a lower complication rate than those treated with IV fluids. The key to successful rehydration is to use the appropriate rehydration fluid. These fluids include Pedialyte, Enfalyte, Rehydralyte, or any other “lyte” fluid. Parents should be discouraged from using soda, juice, and chicken broth, because these liquids can cause electrolyte abnormalities.
There are 2 components of ORT: rehydration and maintenance. For rehydration, a child should receive 50–100 ml/kg of oral rehydration solution over a 3–4 hour period. Replacement fluids are estimated at 10 mL/kg for each stool and 2 mL/kg for each episode of vomiting. The most important consideration in successfully rehydrating a child who is vomiting is to offer a small volume frequently. ORT should start with one teaspoon every 1–2 minutes. Severely dehydrated children should receive IV fluid boluses until perfusion and mental status is normal, and then ORT can be initiated.
Treatment of ORT remains widely underused. Stated barriers include lack of convenience, inadequately trained staff , children’s unwillingness to take the solution, parents and staff preference for IV therapy, lower reimbursement for ORT, cost of ORT to parents, extended length of stay in the emergency department compared with IV therapy, and persistent vomiting that prevents administration of ORT. Recent data show that in the emergency department ORT actually requires less time than IV therapy and is less painful. In addition, the data showed that parents were more satisfied with the ED visit when ORT was used. ORT is less expensive than IV therapy. Children who refuse oral rehydration solution are usually not dehydrated and therefore do not crave the high salt concentration found in oral rehydration solutions.
- Concise Reviews of Pediatric Infectious Diseases: Treatment of community-associated methicillinresistant Staphylococcus aureus infections. Pediatr Infect Dis J. 2005;24:45760.
Supplements
Supplement to Pediatric Critical Care Medicine. 2005;6. This supplement is devoted to sepsis in infants and children.
Pediatric in the Literature
Hospital “Report Cards”: Variation in the Management of Bronchiolitis
Christakis DA, Cowan CA, Garrison MM, Molteni R, Marcuse E, Zerr DM. Variation in Inpatient Diagnostic Testing and Management of Bronchiolitis. Pediatrics. 2005;115:878-4.
Bronchiolitis remains 1 of the most common causes of hospitalization in children within the first 2 years of life. In this analysis, the authors conducted a large retrospective descriptive study of infants who were admitted with bronchiolitis to children’s hospitals across the United States. The study examined the variability in length of stay (LOS), diagnostic testing, medications used, and readmission rates. The authors reviewed data on a total of 17,397 infants younger than 1 year of age. Information was obtained from the Pediatric Health Information System, which includes demographic and diagnostic data on 36 freestanding, noncompeting children’s hospitals. The authors found significant and wide variation in LOS, readmission rates, treatment approaches, and use of diagnostic tests for inpatient management of bronchiolitis.
Results indicated that 72% of patients received chest radiographs, 45% received antibiotics, and 25% received systemic steroids. The mean LOS varied considerably across hospitals, with a range of 2.40–3.90 days. The use of antibiotics varied from 28% to 62%, and the use of chest radiographs varied from 38% to 89%. There was also significant difference in readmission rates, which varied from 0% to 2.7%. The variation between hospitals remained a significant contributor even after controlling for multiple potential confounding factors.
Decreasing LOS and unnecessary medication and test utilization is supportive of pediatric patient safety initiatives. The authors suggest that chest radiographs may be leading to unnecessary use of antibiotics due to presumptive treatment based on nonspecific findings. In addition, the authors hypothesize that increased virologic testing may be cost-effective if it leads to decreased use of antibiotics.
The study concludes that there are considerable, unexplained variations that exist in the inpatient management of bronchiolitis. Development of national guidelines and controlled trials of new therapies and different approaches are indicated. Hospitals need to direct resources at analyzing and improving their inpatient care by implementing a more evidence-based approach to management of this common problem.
Maternal Group B Streptococcal Positivity: Risk factor or not?
Puopolo KM, Madoff LC, Eichenwald EC. Early-onset group B streptococcal disease in the era of maternal screening. Pediatrics. 2005;115:1240-6.
Despite implementation of intrapartum antibiotic prophylaxis (IAP) based on maternal screening for group B streptococcus (GBS) colonization, cases of early-onset neonatal GBS disease (EOGBS) continue to occur with significant morbidity and mortality. Researchers at the Brigham and Woman’s Hospital in Boston, MA devised this retrospective analysis to determine which attributes of maternal screening, provision of IAP, or evaluation of newborns for sepsis might influence the persistence of EOGBS cases. A retrospective review of all cases of culture proven EOGBS between 1997 and 2003 identified 25 cases of EOGBS among the 67,260 live births, for an overall incidence of 0.37 per 1000 live births. The incidence in infants of very low birth weight was 3.3 cases per 1,000 live births. Among the mothers of term infants with EOGBS, 14 of 17 (82%) had been screened GBS negative; 1 was GBS unknown. Eight of these 14 GBS negative mothers had at least 1 intrapartum risk factor for neonatal sepsis but did not receive IAP. The authors hypothesize that the negative GBS status in these cases may have provided a false sense of reassurance to obstetricians.
Ten of the 17 term infants were evaluated for sepsis due to clinical signs of illness, while the remaining infants were evaluated based on intrapartum risk factors alone. Interestingly, the retrospective analysis demonstrated that 5 of the 25 bacterial isolates were resistant to clindamycin and/or erythromycin, with another 5 isolates partially resistant to 1 or both of these medications. One case of EOGBS disease was found in the child of a penicillin-allergic mother who received clindamycin for IAP. This article highlights the importance of reviewing intrapartum risk factors other than GBS colonization—i.e., delivery at <37 weeks’ gestation,
intrapartum temperature >100.4°C, or signs of clinical chorioamnionitis, in addition to documenting if IAP was provided and with which antibiotic in evaluation of neonates for possible EOGBS.
Treating Refractory Kawasaki Syndrome with Infliximab
Burns JC, Mason, WH, Hauger SB, et al. Infliximab treatment for refractory Kawasaki syndrome. J Pediatr. 2005;146: 662-7.
Citing a 10% to 20% failure rate for intravenous immunoglobulin (IVIG) in combination with high-dose aspirin (ASA) for treating Kawasaki syndrome (KS), these authors present a case series of patients with refractory KS who were treated with infliximab. Several treatments have been suggested for KS patients with persistent or recrudescent fever after IVIG and ASA; however, no clinical trials have established an optimal treatment. Tumor necrosis factor-alpha (TNF-α) has been shown not only to be elevated in patients with KS but also to correlate with development of coronary artery aneurysms. Infliximab, a TNF-α antagonist licensed for clinical use (Remicade, Centocor, Malvern, PA), is used in several immunologic diseases with inflammation mediated by this proinflammatory cytokine. In this poorly controlled case series, 17 patients with acute KS received infliximab after at least 2 doses of IVIG (2 g/kg) and daily ASA (80–100 mg/kg/day) because they were either persistently febrile (16 patients) or had severe arthritis without fever (1 patient). Fourteen of 16 febrile patients became afebrile. C-reactive protein was lower after infliximab in all patients with elevated CRP when remeasured within 48 hours of treatment. In addition to these signs of inflammation, the researchers also studied patient outcomes.
Of 12 patients with coronary artery abnormalities before treatment with infliximab, 4 had dilatation that resolved after treatment. The remaining 8 had either aneurysms or ectasia that were unchanged after therapy. No patients in the series had complications attributed to infliximab. The authors note that the cost of treatment with infliximab compares favorably with a 2 g/kg dose of IVIG. Appropriately, they also specifically address the potential adverse effects of infliximab, for which the pharmacodynamics, pharmacokinetics and safety have not been established in children <5 years of age. Data with regard to possible complications is inadequate and comes from studies of children and adults who typically receive multiple doses of infliximab for chronic inflammatory conditions that inherently can produce multiorgan symptoms. Of note, infliximab does not carry the risk of possible infectious contamination that treatment with IVIG poses. There are several important limitations to the study that are adequately addressed by the authors. Nonetheless, the series highlights the significance of current and future randomized, controlled clinical trials defining the role of TNF-α antagonism in the treatment of KS.
Do Freestanding Children’s Hospitals Improve Care?
Merenstein D, Egleston B, Diener-West M. Lengths of stay and costs associated with children’s hospitals. Pediatrics. 2005;115: 839-44.
Adult literature has shown that access to more subspecialty oriented care results in higher costs and more procedures but does not guarantee improved outcomes. Researchers from Johns Hopkins School of Medicine and Johns Hopkins School of Public Health hypothesized that freestanding children’s hospitals would have longer lengths of stay (LOS) and higher costs compared with other hospitals with regard to similar diagnoses. To test the hypothesis, they studied 24,322 inpatient encounters for pneumonia, gastroenteritis, respiratory syncytial virus, dehydration, or asthma from the Heathcare Cost and Utilization Project Kids’ Inpatient database 2000. Of these encounters, 3,408 were from 23 different freestanding children’s hospitals, and the remaining 20,194 encounters were from 1,749 non-children’s hospitals. The children’s hospitals were all urban teaching hospitals. After adjusting for potentially confounding variables, the researchers found no significant difference in the LOS by hospital type. In this study, the median cost for an admission at a freestanding hospital was $1,294 more per hospitalization after adjustment for LOS and other potential confounder variables. In addition, the results showed that children’s hospitals were more likely to care for minority patients, patients with Medicaid, patients with multiple diagnoses, and patients transferred from other hospitals. The study design did not include direct measures of quality of care, so it is unclear if the increased cost of admission to a children’s hospital leads to improved care.
Asthma and Invasive Pneumococcal Infections
Talbot RT, Hartert TV Mitchel E, et al. Asthma as a risk factor for invasive pneumococcal disease. N Engl J Med. 2005; 352: 2082-90.
Current guidelines for pneumococcal vaccination exclude people with asthma, nor do the most recently published guidelines for management of asthma include pneumococcal vaccination. The authors of this study utilized public health databases to perform a nested case-controlled cohort study to determine the risk of pneumococcal disease among people with asthma. By combining a database of active surveillance for invasive pneumococcal disease (IPD) with a state-based managed healthcare program, researchers identified 635 cases of IPD in people with asthma and paired them with 6,350 age-matched controls. The age range of test subjects was 2 to 49 years (mean, 28.5). After adjustment for race and other conditions with high risk for IPD, asthma was significantly associated with increased risk of IPD (OR: 2.4; 95% CI: 1.9 to 3.1). This finding was consistent in analyses stratified for age (2 to 4 years and 5 to 17 years). Of the isolates causing IPD, 56.9% were among the 7 serotypes included in the pneumococcal conjugate vaccine, with an additional 29.1% found only in the 23-valent polysaccharide vaccine. The authors hypothesize that obstruction caused by increased production and decreased clearance of mucus and the chronic airway inflammation found in asthma are plausible etiologies for the increased risk of IPD. They conclude that consideration should be given for the addition of asthma to the list of conditions warranting pneumococcal vaccination, particularly for the younger population in the study, who are less likely to have other high-risk conditions for which vaccination is already recommended.
Pediatric Practice Profile
Contact
Marcus C. Hermansen, MD
Southern New Hampshire Medical Center
8 Prospect Street
Nashua, NH 03061
603-577-2609
E-mail: Marcus.Hermansen@SNHMC.org
Physician Staff (FTE)
Valeria Atkins, MD, Neonatologist and Pediatric Hospitalist
Suzanne Fetter, MD, Pediatric Hospitalist
Anshula Greene, MD, Pediatric Hospitalist
Marcus C. Hermansen, MD, Neonatologist and Pediatric Hospitalist
Sumana Myneni, MD, Pediatric Hospitalist
Cynthia Wright-Devine, CRNP, Neonatal Nurse Practitioner
Other Staff
Lisa Ormond, Practice Manager
The Original Challenge and Solution
The Southern New Hampshire Medical Center maintained a relatively small neonatal intensive care unit (NICU) and pediatric ward. Neither was large enough to justify the desired 24/7 in-house coverage. A combined neonatal-pediatric hospitalist program has been developed and staffed by a combination of neonatologists and pediatric hospitalists. 24/7 in-house coverage is now provided.
History and Background
The Southern New Hampshire Medical Center traditionally staffed its Level 3A NICU with 1 or 2 neonatologists. Approximately 1,500 deliveries take place annually at the medical center; however, these tend to be relatively low-risk deliveries and do not provide enough clinical activity to support a larger group of neonatologists. This prevented the neonatologists from providing the desired 24/7 in-house coverage. To increase clinical activity, the program expanded to include pediatric hospitalist services in 1999. Within 2 years, the combined neonatal-pediatric hospitalist program had grown to allow for 24/7 in-house coverage.
Clinical and Educational Services
The neonatal-pediatric hospitalist team provides services for both the hospital’s neonatology and the pediatric practices. Prior to the team’s development, all community pediatricians were expected to attend high-risk deliveries with availability upon 30 minutes request. Since the development of the in-house neonatal-pediatric hospitalist team, only these team members attend high-risk deliveries. The team attends approximately half of all births at the hospital and has a goal of availability upon 2 minutes notice. Members of the neonatal-pediatric hospitalist team are certified in both neonatal and pediatric resuscitation.
The neonatal-pediatric hospitalist team serves as the attending physician for all admissions to the NICU. Prior to the team’s establishment, it was not possible to care for critically ill infants in the NICU requiring 24/7 in-house attendance; however, with the current team, the NICU can care for smaller and more acutely ill neonates. Additionally, the hospital’s obstetrics department has been able to improve recruitment of high-risk obstetrical patients based upon the improved neonatal staffing.
The team’s non-neonatal pediatric care includes providing consultations in the emergency department and services on the 8-bed pediatric ward. Nearly all of the community pediatricians and family practitioners have asked the hospitalist team to perform the necessary pediatric inpatient history and physical examinations. The unique circumstances of each case determine whether the hospitalist or the PCP serves as the attending physician in the hospital. Additionally, the neonatal-pediatric hospitalist team currently serves as the attending physician in the normal new-born nursery for approximately 25% of all newborns.
Staffing and Schedule
Each day is divided into 2 12-hour shifts: 7:30 a.m. to 7:30 p.m., and 7:30 p.m. to 7:30 a.m. Each fulltime clinician is expected to work 3 or 4 shifts each week. A physician is always available as “back-up” coverage when the neonatal nurse practitioner is providing the in-house coverage. The typical patient load consists of 8–12 NICU patients, 2–4 pediatric ward patients, and 2–5 normal newborns. Each member of the team is employed by The Medical Center and receives a guaranteed salary and benefits.
Philosophic Principles
Certain principles have been followed during the development of the program. These include:
- All services are offered to community PCPs on a voluntary basis. No hospitalist service is mandatory.
- Close communication with the PCP is of primary importance. Telephone, email, and transcribed summaries are provided throughout the hospital stay and at discharge.
- High-quality patient care must be provided. The team members recognize that some patients are too sick for care at The medical center and are better served at one of the nearby tertiary academic centers.
Ongoing Challenges

The primary challenge stems from the relatively small neonatal and pediatric services. Combining the neonatal and pediatric programs to provide 24/7 coverage required the difficult task of recruiting of neonatologists willing to provide pediatric care and pediatric hospitalists willing to provide care in the NICU. Additionally, because of the small services, there is limited pediatric subspecialty support available at the Medical Center. The hospitalist occasionally serves as consultant to community PCPs on issues related to pediatric cardiology, neurology, endocrinology, and other disciplines for which there are no other consulting specialists available.
Although the team has grown to include 5 full-time healthcare providers, the small size of the team still provides challenges. There is little flexibility in scheduling, making it difficult for 2 providers to take an extended vacation at the same time. Finally, the small size of the group prevents the ability to provide back-up coverage to the in-house hospitalist. Community pediatricians fulfill this function.
Every year the team is producing improved financial results but still does not generate revenues to support the team’s salaries; a hospital subsidy provides the difference.
Future Opportunities
The neonatal-hospital team continues to explore opportunities for growth. Opportunities under consideration include provision of pediatric conscious sedation, developing Level II pediatric intensive care unit services, performance of circumcisions on normal newborns, marketing the NICU to nearby primary care community hospitals to obtain more neonatal, pediatric, and obstetric referrals and provision of expanded services in the emergency department.
Contact
Marcus C. Hermansen, MD
Southern New Hampshire Medical Center
8 Prospect Street
Nashua, NH 03061
603-577-2609
E-mail: Marcus.Hermansen@SNHMC.org
Physician Staff (FTE)
Valeria Atkins, MD, Neonatologist and Pediatric Hospitalist
Suzanne Fetter, MD, Pediatric Hospitalist
Anshula Greene, MD, Pediatric Hospitalist
Marcus C. Hermansen, MD, Neonatologist and Pediatric Hospitalist
Sumana Myneni, MD, Pediatric Hospitalist
Cynthia Wright-Devine, CRNP, Neonatal Nurse Practitioner
Other Staff
Lisa Ormond, Practice Manager
The Original Challenge and Solution
The Southern New Hampshire Medical Center maintained a relatively small neonatal intensive care unit (NICU) and pediatric ward. Neither was large enough to justify the desired 24/7 in-house coverage. A combined neonatal-pediatric hospitalist program has been developed and staffed by a combination of neonatologists and pediatric hospitalists. 24/7 in-house coverage is now provided.
History and Background
The Southern New Hampshire Medical Center traditionally staffed its Level 3A NICU with 1 or 2 neonatologists. Approximately 1,500 deliveries take place annually at the medical center; however, these tend to be relatively low-risk deliveries and do not provide enough clinical activity to support a larger group of neonatologists. This prevented the neonatologists from providing the desired 24/7 in-house coverage. To increase clinical activity, the program expanded to include pediatric hospitalist services in 1999. Within 2 years, the combined neonatal-pediatric hospitalist program had grown to allow for 24/7 in-house coverage.
Clinical and Educational Services
The neonatal-pediatric hospitalist team provides services for both the hospital’s neonatology and the pediatric practices. Prior to the team’s development, all community pediatricians were expected to attend high-risk deliveries with availability upon 30 minutes request. Since the development of the in-house neonatal-pediatric hospitalist team, only these team members attend high-risk deliveries. The team attends approximately half of all births at the hospital and has a goal of availability upon 2 minutes notice. Members of the neonatal-pediatric hospitalist team are certified in both neonatal and pediatric resuscitation.
The neonatal-pediatric hospitalist team serves as the attending physician for all admissions to the NICU. Prior to the team’s establishment, it was not possible to care for critically ill infants in the NICU requiring 24/7 in-house attendance; however, with the current team, the NICU can care for smaller and more acutely ill neonates. Additionally, the hospital’s obstetrics department has been able to improve recruitment of high-risk obstetrical patients based upon the improved neonatal staffing.
The team’s non-neonatal pediatric care includes providing consultations in the emergency department and services on the 8-bed pediatric ward. Nearly all of the community pediatricians and family practitioners have asked the hospitalist team to perform the necessary pediatric inpatient history and physical examinations. The unique circumstances of each case determine whether the hospitalist or the PCP serves as the attending physician in the hospital. Additionally, the neonatal-pediatric hospitalist team currently serves as the attending physician in the normal new-born nursery for approximately 25% of all newborns.
Staffing and Schedule
Each day is divided into 2 12-hour shifts: 7:30 a.m. to 7:30 p.m., and 7:30 p.m. to 7:30 a.m. Each fulltime clinician is expected to work 3 or 4 shifts each week. A physician is always available as “back-up” coverage when the neonatal nurse practitioner is providing the in-house coverage. The typical patient load consists of 8–12 NICU patients, 2–4 pediatric ward patients, and 2–5 normal newborns. Each member of the team is employed by The Medical Center and receives a guaranteed salary and benefits.
Philosophic Principles
Certain principles have been followed during the development of the program. These include:
- All services are offered to community PCPs on a voluntary basis. No hospitalist service is mandatory.
- Close communication with the PCP is of primary importance. Telephone, email, and transcribed summaries are provided throughout the hospital stay and at discharge.
- High-quality patient care must be provided. The team members recognize that some patients are too sick for care at The medical center and are better served at one of the nearby tertiary academic centers.
Ongoing Challenges
The primary challenge stems from the relatively small neonatal and pediatric services. Combining the neonatal and pediatric programs to provide 24/7 coverage required the difficult task of recruiting of neonatologists willing to provide pediatric care and pediatric hospitalists willing to provide care in the NICU. Additionally, because of the small services, there is limited pediatric subspecialty support available at the Medical Center. The hospitalist occasionally serves as consultant to community PCPs on issues related to pediatric cardiology, neurology, endocrinology, and other disciplines for which there are no other consulting specialists available.
Although the team has grown to include 5 full-time healthcare providers, the small size of the team still provides challenges. There is little flexibility in scheduling, making it difficult for 2 providers to take an extended vacation at the same time. Finally, the small size of the group prevents the ability to provide back-up coverage to the in-house hospitalist. Community pediatricians fulfill this function.
Every year the team is producing improved financial results but still does not generate revenues to support the team’s salaries; a hospital subsidy provides the difference.
Future Opportunities
The neonatal-hospital team continues to explore opportunities for growth. Opportunities under consideration include provision of pediatric conscious sedation, developing Level II pediatric intensive care unit services, performance of circumcisions on normal newborns, marketing the NICU to nearby primary care community hospitals to obtain more neonatal, pediatric, and obstetric referrals and provision of expanded services in the emergency department.
Other Literature of Interest
1. Chimowitz MI, Lynn MJ, Howlett-Smith H, et al. Comparison of warfarin and aspirin for symptomatic intracranial arterial stenosis. N Engl J Med. 352:1305-16.
This is the first prospective study comparing antithrombotic therapies for patients with atherosclerotic stenosis of major intracranial arteries. This multicenter, NINDS-sponsored, placebo-controlled, blinded study randomized 569 patients to aspirin (650 mg twice daily) or warfarin (initially 5 mg daily, titrated to achieve an INR of 2.0–3.0) and followed them for nearly 2 years. The study was terminated early over safely concerns about patients in the warfarin group. Baseline characteristics between the 2 groups were not significantly different. Warfarin was not more effective than aspirin in its effect on the primary endpoints of ischemic stroke, brain hemorrhage, or vascular death other than from stroke (as defined in the study protocol). However, major cardiac events (myocardial infarction or sudden death) were significantly higher in the warfarin group, and major hemorrhage (defined as any intracranial or systemic hemorrhage requiring hospitalization, transfusion, or surgical intervention) was also significantly higher in the warfarin group. The authors note the difficulty maintaining the INR in the target range (achieved only 63.1 % of the time during the maintenance period, an observation in line with other anticoagulation studies). In an accompanying editorial, Dr. Koroshetz of the stroke service at the Massachusetts General Hospital also observed that difficulties in achieving the therapeutic goal with warfarin could have impacted the results. The authors also note that the dose of aspirin employed in this study is somewhat higher than in previous trials. Nevertheless, until other data emerge, this investigation’s results favor aspirin in preference to warfarin for this high-risk condition.
2. Cornish PL, Knowles, SR, Marchesano R, et al. Unintended medication discrepancies at the time of hospital admission Arch Intern Med. 2005;165:424-9
Of the various types of medical errors, medication errors are believed to be the most common. At the time of hospital admission, medication discrepancies may lead to unintended drug interactions, toxicity, or interruption of appropriate drug therapies. These investigators performed a prospective study to identify unintended medication discrepancies between the patient’s home medications and those ordered at the time of the patient’s admission and to evaluate the potential clinical significance of these discrepancies.
This study was conducted at a 1,000-bed tertiary care hospital in Canada on the general medicine teaching service. A member of the study team reviewed each medical record to ascertain the physician-recorded medication history, the nurse-recorded medication history, the admission medication orders, and demographic information. A comprehensive list of all of the patient’s prescription or nonprescription drugs was compiled by interviewing patients, families, and pharmacists, and by inspecting the bottles. A discrepancy was defined as any difference between this comprehensive list and the admission medication orders. These were categorized into omission or addition of a medication, substitution of an agent within the same drug class, and change in dose, route, and frequency of administration of an agent. The medical team caring for the patient was then asked whether or not these discrepancies were intended. The team then reconciled any unintended discrepancies. These unintended discrepancies were further classified according to their potential for harm by 3 medical hospitalists into Class 1, 2, 3, in increasing order of potential harm. One hundred fifty-one patients were included in the analysis. A total of 140 errors occurred in 81 patients (54%). The overall error rate was 0.93 per patient. Of the errors, 46% consisted of omission of a regularly prescribed medication, 25% involved discrepant doses, 17.1% involved discrepant frequency, and 11.4% were actually incorrect drugs. Breakdown of error severity resulted in designation of 61% as Class 1, 33% as Class 2, and 5.7% as Class 3. The interrater agreement was a kappa of 0.26. These discrepancies were not found to be associated with night or weekend admissions, high patient volume, or high numbers of medications.
Real-time clinical correlation with the responsible physicians allowed distinction of intended from unintended discrepancies. This presumably improved the accuracy of the error rate measurement. This study confirmed the relatively high rate previously reported. Further study can focus on possible intervention to minimize these errors.
3. Liperoti R, Gambassi G, Lapane KL, et al. Conventional and atypical antipsychotics and the risk of hospitalization for ventricular arrhythmias or cardiac arrest Arch Intern Med. 2005;165:696-701.
As the number of hospitalized elderly and demented patients increases, use of both typical and atypical antipsychotics has become prevalent. QT prolongation, ventricular arrhythmia, and cardiac arrest are more commonly associated with the older conventional antipsychotics than with newer atypical agents. This case-control study was conducted to estimate the effect of both conventional and atypical antipsychotics use on the risk of hospital admission for ventricular arrhythmia or cardiac arrest.
The patient population involved consisted of elderly nursing home residents in 6 US states. The investigators utilized Systematic Assessment of Geriatric Drug Use via Epidemiology database that contains data from minimum data set (MDS), a standardized data set required of all certified nursing homes in the United States. Case patients were selected by ICD-9 codes for cardiac arrest or ventricular arrhythmia. Control patients were selected via ICD-9 codes of 6 other common inpatient diagnoses. Antipsychotic exposure was determined by use of the most recent assessment in the nursing homes prior to admission. Exposed patients were those who received atypical antipsychotics such as risperidone, olanzapine, quetiapine, and clozapine, and those who used conventional agents such as haloperidol and others. After control for potential confounders, users of conventional antipsychotics showed an 86% increase in the risk of hospitalization for ventricular arrhythmias or cardiac arrest (OR: 1.86) compared with nonusers. No increased risk was reported for users of atypical antipsychotics. (OR: 0.87). When compared with atypical antipsychotic use, conventional antipsychotic use carries an OR of 2.13 for these cardiac outcomes. In patients using conventional antipsychotics, the presence and absence of cardiac diseases were 3.27 times and 2.05 times, respectively, more likely to be associated with hospitalization for ventricular arrhythmias and cardiac arrest, compared with nonusers without cardiac diseases.
These results suggest that atypical antipsychotics may carry less cardiac risk than conventional agents. In an inpatient population with advancing age and increasing prevalence of dementia and cardiac disease, use of atypical antipsychotic agents may be safer than older, typical agents.
4. Mayer SA, Brun NC, Begtrup K, et al. Recombinant activated factor VII for acute intracerebral hemorrhage. N Engl J Med. 352:777-85.
This placebo-controlled, double-blind, multicenter, industry-sponsored trial of early treatment of hemorrhagic stroke with rFVIIa at 3 escalating doses, evaluated stroke hematoma growth, mortality, and functional outcomes up to 90 days. The authors note the substantial mortality and high morbidity of this condition, which currently lacks definitive treatment. Patients within 3 hours of symptoms with intracerebral hemorrhage on CT and who met study criteria were randomized to receive either placebo or a single intravenous dose of 40, 80, or 160 mcg/kg of rFVIIa within 1 hour of baseline CT and no more than 4 hours after symptoms. Follow-up CTs at 24 and 72 hours were obtained and functional assessments were performed serially at frequent intervals throughout the study period. Three hundred ninety-nine patients were analyzed and were found similar in their baseline characteristics. Lesion volume was significantly less with treatment, in a dose-dependent fashion. Mortality at 3 months was significantly less (29% vs. 18%) with treatment, and all 4 of the global functional outcome scales utilized were favorable, 3 of them (modified Rankin Scale for all doses, NIH Stroke Scale for all doses, and the Barthel Index at the 80 and 160 mcg/kg doses) in a statistically significant fashion. However, the authors noted an increase in serious thromboembolic events in the treatment groups, with a statistically significant increased frequency of arterial thromboembolic events. These included myocardial ischemic events and cerebral infarction, and most occurred within 3 days of rFVIIa treatment. Of note, the majority of patients who suffered these events made recovery from their complications, and the overall rates of fatal or disabling thromboembolic occurrences between the treatment and placebo groups were similar. This study offers new and exciting insights into potential therapy for this serious form of stroke, although safety concerns merit further study.
5. Siguret V, Gouin I, Debray M, et al. Initiation of warfarin therapy in elderly medical inpatients: a safe and accurate regimen. Am J Med. 2005; 118:137-142.
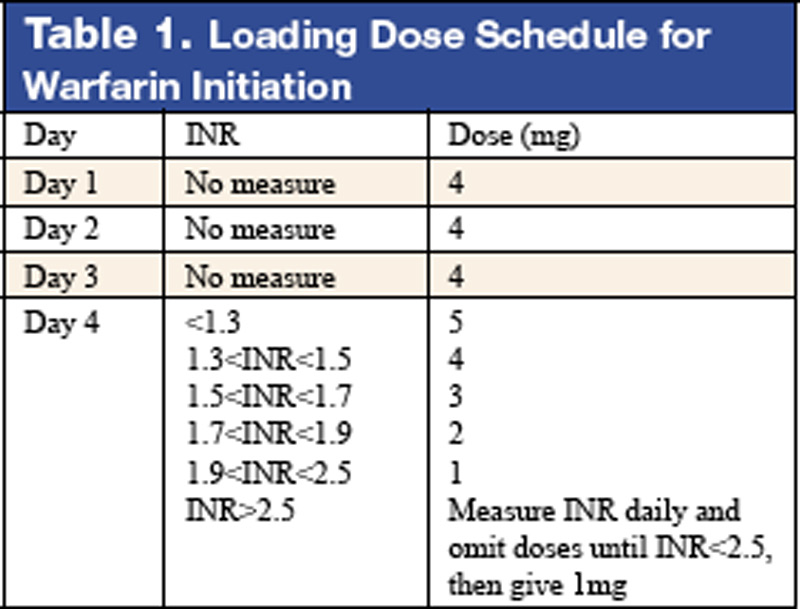
Warfarin therapy is widely used in geriatric populations. Sometimes over-anticoagulation occurs when warfarin therapy is initiated based on standard loading and maintenance dose in the hospital setting. This is mainly due to decreased hepatic clearance and polypharmacy in the geriatric population. A recent study in France demonstrated a useful and simple low-dose regimen for starting warfarin therapy (target INR: 2.0–3.0) in the elderly without over-anticoagulation. The patients enrolled in this study were typical geriatric patients with multiple comorbid conditions. These patients also received concomitant medications known to potentiate the effect of warfarin. One hundred six consecutive inpatients (age %70, mean age of 85 years) were given a 4-mg induction dose of warfarin for 3 days, and INR levels were measured on the 4th day. From this point, the daily warfarin dose was adjusted according to an algorithm (see Table 1), and INR values were obtained every 2–3 days until actual maintenance doses were determined. The maintenance dose was defined as the amount of warfarin required to yield an INR in 2.0 to 3.0 range on 2 consecutive samples obtained 48–72 hours apart in the absence of any dosage change for at least 4 days. Based on this algorithm, the predicted daily warfarin dose (3.1 ± 1.6 mg/day) correlated closely with the actual maintenance dose (3.2 ± 1.7 mg/day). The average time needed to achieve a therapeutic INR was 6.7 ± 3.3 days. None of the patients had an INR >4.0 during the induction period. This regimen also required fewer INR measurements.
Intracranial hemorrhage and gastrointestinal bleeding are serious complications of over-anticoagulation. The majority of gastrointestinal bleeding episodes respond to withholding warfarin and reversing anticoagulation. However, intracranial hemorrhage frequently leads to devastating outcomes. A recent report suggested that an age over 85 and INR of 3.5 or greater were associated with increased risk of intracranial hemorrhage. The warfarin algorithm proposed in this study provides a simple, safe, and effective tool to predict warfarin dosing in elderly hospitalized patients without over-anticoagulation. Although this regimen still needs to be validated in a large patient population in the future, it can be incorporated into computer-based dosing entry programs in the hospital setting to guide physicians in initiating warfarin therapy.
6. Wisnivesky JP, Henschke C, Balentine J, Willner, C, Deloire AM, McGinn TG. Prospective validation of a prediction model for isolating inpatients with suspected pulmonary tuberculosis. Arch Intern Med. 2005;165:453-7.
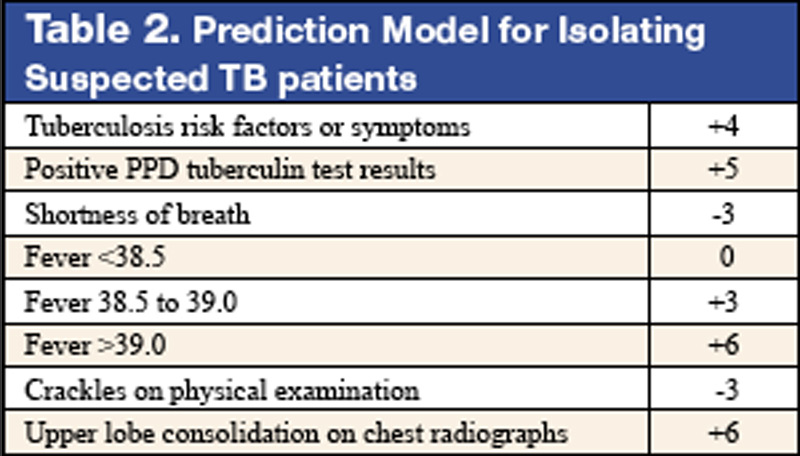
Whether to isolate a patient for suspected pulmonary tuberculosis (TB) is often a balancing act between clinical risk assessment and optimal hospital resource utilitization. Practitioners need a relatively simple but sophisticated tool that they can use at the bedside to more precisely assess the likelihood of TB for more efficient and effective triage.
These authors previously developed such a tool with a sensitivity of 98% and specificity of 46%. (See Table 2 for details) This study was designed to validate this decision rule in a new set of patients. Patients were enrolled in 2 tertiary-care hospitals in New York City area over a 21-month period. They were all admitted and isolated because of clinical suspicion for pulmonary TB, not utilizing the decision rule under study. Study team members collected demographic, clinical risk factors, presenting symptoms, and signs, laboratory, and radiographic findings. Chest x-ray findings were reviewed by investigators who were blinded to the other clinical and demographical information. The gold standard of diagnosis was at least 1 sputum culture that was positive for Mycobacterium tuberculosis.
A total of 516 patients were enrolled in this study. Of the 516, 19 (3.7%) were found to have culture-proven pulmonary TB. Univariate analyses showed that history of positive PPD, higher (98% vs. 95%) oxygen saturation, upper-lobe consolidation (not upper lobe cavity), and lymphadenopathy (hilar, mediastinal, or paratracheal) were all associated with the presence of pulmonary TB. Shortness of breath was associated with the absence of TB. A total score of 1 or higher in the prediction rule had a sensitivity of 95% for pulmonary TB, and score of less than 1 had a specificity of 35%. The investigators estimated a prevalence of 3.7%, thereby yielding a positive predictive value of 9.6% but a negative predictive value of 99.7%. They estimated that 35% of patients isolated would not have been with this prediction rule.
Though validated scientifically, this tool still has a false-negative rate of 5%. In a less endemic area, the false-negative rate would be correspondingly lower and thus more acceptable from a public health perspective. This is one step closer to a balance of optimal bed utilization and reasoned clinical assessment.
1. Chimowitz MI, Lynn MJ, Howlett-Smith H, et al. Comparison of warfarin and aspirin for symptomatic intracranial arterial stenosis. N Engl J Med. 352:1305-16.
This is the first prospective study comparing antithrombotic therapies for patients with atherosclerotic stenosis of major intracranial arteries. This multicenter, NINDS-sponsored, placebo-controlled, blinded study randomized 569 patients to aspirin (650 mg twice daily) or warfarin (initially 5 mg daily, titrated to achieve an INR of 2.0–3.0) and followed them for nearly 2 years. The study was terminated early over safely concerns about patients in the warfarin group. Baseline characteristics between the 2 groups were not significantly different. Warfarin was not more effective than aspirin in its effect on the primary endpoints of ischemic stroke, brain hemorrhage, or vascular death other than from stroke (as defined in the study protocol). However, major cardiac events (myocardial infarction or sudden death) were significantly higher in the warfarin group, and major hemorrhage (defined as any intracranial or systemic hemorrhage requiring hospitalization, transfusion, or surgical intervention) was also significantly higher in the warfarin group. The authors note the difficulty maintaining the INR in the target range (achieved only 63.1 % of the time during the maintenance period, an observation in line with other anticoagulation studies). In an accompanying editorial, Dr. Koroshetz of the stroke service at the Massachusetts General Hospital also observed that difficulties in achieving the therapeutic goal with warfarin could have impacted the results. The authors also note that the dose of aspirin employed in this study is somewhat higher than in previous trials. Nevertheless, until other data emerge, this investigation’s results favor aspirin in preference to warfarin for this high-risk condition.
2. Cornish PL, Knowles, SR, Marchesano R, et al. Unintended medication discrepancies at the time of hospital admission Arch Intern Med. 2005;165:424-9
Of the various types of medical errors, medication errors are believed to be the most common. At the time of hospital admission, medication discrepancies may lead to unintended drug interactions, toxicity, or interruption of appropriate drug therapies. These investigators performed a prospective study to identify unintended medication discrepancies between the patient’s home medications and those ordered at the time of the patient’s admission and to evaluate the potential clinical significance of these discrepancies.
This study was conducted at a 1,000-bed tertiary care hospital in Canada on the general medicine teaching service. A member of the study team reviewed each medical record to ascertain the physician-recorded medication history, the nurse-recorded medication history, the admission medication orders, and demographic information. A comprehensive list of all of the patient’s prescription or nonprescription drugs was compiled by interviewing patients, families, and pharmacists, and by inspecting the bottles. A discrepancy was defined as any difference between this comprehensive list and the admission medication orders. These were categorized into omission or addition of a medication, substitution of an agent within the same drug class, and change in dose, route, and frequency of administration of an agent. The medical team caring for the patient was then asked whether or not these discrepancies were intended. The team then reconciled any unintended discrepancies. These unintended discrepancies were further classified according to their potential for harm by 3 medical hospitalists into Class 1, 2, 3, in increasing order of potential harm. One hundred fifty-one patients were included in the analysis. A total of 140 errors occurred in 81 patients (54%). The overall error rate was 0.93 per patient. Of the errors, 46% consisted of omission of a regularly prescribed medication, 25% involved discrepant doses, 17.1% involved discrepant frequency, and 11.4% were actually incorrect drugs. Breakdown of error severity resulted in designation of 61% as Class 1, 33% as Class 2, and 5.7% as Class 3. The interrater agreement was a kappa of 0.26. These discrepancies were not found to be associated with night or weekend admissions, high patient volume, or high numbers of medications.
Real-time clinical correlation with the responsible physicians allowed distinction of intended from unintended discrepancies. This presumably improved the accuracy of the error rate measurement. This study confirmed the relatively high rate previously reported. Further study can focus on possible intervention to minimize these errors.
3. Liperoti R, Gambassi G, Lapane KL, et al. Conventional and atypical antipsychotics and the risk of hospitalization for ventricular arrhythmias or cardiac arrest Arch Intern Med. 2005;165:696-701.
As the number of hospitalized elderly and demented patients increases, use of both typical and atypical antipsychotics has become prevalent. QT prolongation, ventricular arrhythmia, and cardiac arrest are more commonly associated with the older conventional antipsychotics than with newer atypical agents. This case-control study was conducted to estimate the effect of both conventional and atypical antipsychotics use on the risk of hospital admission for ventricular arrhythmia or cardiac arrest.
The patient population involved consisted of elderly nursing home residents in 6 US states. The investigators utilized Systematic Assessment of Geriatric Drug Use via Epidemiology database that contains data from minimum data set (MDS), a standardized data set required of all certified nursing homes in the United States. Case patients were selected by ICD-9 codes for cardiac arrest or ventricular arrhythmia. Control patients were selected via ICD-9 codes of 6 other common inpatient diagnoses. Antipsychotic exposure was determined by use of the most recent assessment in the nursing homes prior to admission. Exposed patients were those who received atypical antipsychotics such as risperidone, olanzapine, quetiapine, and clozapine, and those who used conventional agents such as haloperidol and others. After control for potential confounders, users of conventional antipsychotics showed an 86% increase in the risk of hospitalization for ventricular arrhythmias or cardiac arrest (OR: 1.86) compared with nonusers. No increased risk was reported for users of atypical antipsychotics. (OR: 0.87). When compared with atypical antipsychotic use, conventional antipsychotic use carries an OR of 2.13 for these cardiac outcomes. In patients using conventional antipsychotics, the presence and absence of cardiac diseases were 3.27 times and 2.05 times, respectively, more likely to be associated with hospitalization for ventricular arrhythmias and cardiac arrest, compared with nonusers without cardiac diseases.
These results suggest that atypical antipsychotics may carry less cardiac risk than conventional agents. In an inpatient population with advancing age and increasing prevalence of dementia and cardiac disease, use of atypical antipsychotic agents may be safer than older, typical agents.
4. Mayer SA, Brun NC, Begtrup K, et al. Recombinant activated factor VII for acute intracerebral hemorrhage. N Engl J Med. 352:777-85.
This placebo-controlled, double-blind, multicenter, industry-sponsored trial of early treatment of hemorrhagic stroke with rFVIIa at 3 escalating doses, evaluated stroke hematoma growth, mortality, and functional outcomes up to 90 days. The authors note the substantial mortality and high morbidity of this condition, which currently lacks definitive treatment. Patients within 3 hours of symptoms with intracerebral hemorrhage on CT and who met study criteria were randomized to receive either placebo or a single intravenous dose of 40, 80, or 160 mcg/kg of rFVIIa within 1 hour of baseline CT and no more than 4 hours after symptoms. Follow-up CTs at 24 and 72 hours were obtained and functional assessments were performed serially at frequent intervals throughout the study period. Three hundred ninety-nine patients were analyzed and were found similar in their baseline characteristics. Lesion volume was significantly less with treatment, in a dose-dependent fashion. Mortality at 3 months was significantly less (29% vs. 18%) with treatment, and all 4 of the global functional outcome scales utilized were favorable, 3 of them (modified Rankin Scale for all doses, NIH Stroke Scale for all doses, and the Barthel Index at the 80 and 160 mcg/kg doses) in a statistically significant fashion. However, the authors noted an increase in serious thromboembolic events in the treatment groups, with a statistically significant increased frequency of arterial thromboembolic events. These included myocardial ischemic events and cerebral infarction, and most occurred within 3 days of rFVIIa treatment. Of note, the majority of patients who suffered these events made recovery from their complications, and the overall rates of fatal or disabling thromboembolic occurrences between the treatment and placebo groups were similar. This study offers new and exciting insights into potential therapy for this serious form of stroke, although safety concerns merit further study.
5. Siguret V, Gouin I, Debray M, et al. Initiation of warfarin therapy in elderly medical inpatients: a safe and accurate regimen. Am J Med. 2005; 118:137-142.
Warfarin therapy is widely used in geriatric populations. Sometimes over-anticoagulation occurs when warfarin therapy is initiated based on standard loading and maintenance dose in the hospital setting. This is mainly due to decreased hepatic clearance and polypharmacy in the geriatric population. A recent study in France demonstrated a useful and simple low-dose regimen for starting warfarin therapy (target INR: 2.0–3.0) in the elderly without over-anticoagulation. The patients enrolled in this study were typical geriatric patients with multiple comorbid conditions. These patients also received concomitant medications known to potentiate the effect of warfarin. One hundred six consecutive inpatients (age %70, mean age of 85 years) were given a 4-mg induction dose of warfarin for 3 days, and INR levels were measured on the 4th day. From this point, the daily warfarin dose was adjusted according to an algorithm (see Table 1), and INR values were obtained every 2–3 days until actual maintenance doses were determined. The maintenance dose was defined as the amount of warfarin required to yield an INR in 2.0 to 3.0 range on 2 consecutive samples obtained 48–72 hours apart in the absence of any dosage change for at least 4 days. Based on this algorithm, the predicted daily warfarin dose (3.1 ± 1.6 mg/day) correlated closely with the actual maintenance dose (3.2 ± 1.7 mg/day). The average time needed to achieve a therapeutic INR was 6.7 ± 3.3 days. None of the patients had an INR >4.0 during the induction period. This regimen also required fewer INR measurements.
Intracranial hemorrhage and gastrointestinal bleeding are serious complications of over-anticoagulation. The majority of gastrointestinal bleeding episodes respond to withholding warfarin and reversing anticoagulation. However, intracranial hemorrhage frequently leads to devastating outcomes. A recent report suggested that an age over 85 and INR of 3.5 or greater were associated with increased risk of intracranial hemorrhage. The warfarin algorithm proposed in this study provides a simple, safe, and effective tool to predict warfarin dosing in elderly hospitalized patients without over-anticoagulation. Although this regimen still needs to be validated in a large patient population in the future, it can be incorporated into computer-based dosing entry programs in the hospital setting to guide physicians in initiating warfarin therapy.
6. Wisnivesky JP, Henschke C, Balentine J, Willner, C, Deloire AM, McGinn TG. Prospective validation of a prediction model for isolating inpatients with suspected pulmonary tuberculosis. Arch Intern Med. 2005;165:453-7.
Whether to isolate a patient for suspected pulmonary tuberculosis (TB) is often a balancing act between clinical risk assessment and optimal hospital resource utilitization. Practitioners need a relatively simple but sophisticated tool that they can use at the bedside to more precisely assess the likelihood of TB for more efficient and effective triage.
These authors previously developed such a tool with a sensitivity of 98% and specificity of 46%. (See Table 2 for details) This study was designed to validate this decision rule in a new set of patients. Patients were enrolled in 2 tertiary-care hospitals in New York City area over a 21-month period. They were all admitted and isolated because of clinical suspicion for pulmonary TB, not utilizing the decision rule under study. Study team members collected demographic, clinical risk factors, presenting symptoms, and signs, laboratory, and radiographic findings. Chest x-ray findings were reviewed by investigators who were blinded to the other clinical and demographical information. The gold standard of diagnosis was at least 1 sputum culture that was positive for Mycobacterium tuberculosis.
A total of 516 patients were enrolled in this study. Of the 516, 19 (3.7%) were found to have culture-proven pulmonary TB. Univariate analyses showed that history of positive PPD, higher (98% vs. 95%) oxygen saturation, upper-lobe consolidation (not upper lobe cavity), and lymphadenopathy (hilar, mediastinal, or paratracheal) were all associated with the presence of pulmonary TB. Shortness of breath was associated with the absence of TB. A total score of 1 or higher in the prediction rule had a sensitivity of 95% for pulmonary TB, and score of less than 1 had a specificity of 35%. The investigators estimated a prevalence of 3.7%, thereby yielding a positive predictive value of 9.6% but a negative predictive value of 99.7%. They estimated that 35% of patients isolated would not have been with this prediction rule.
Though validated scientifically, this tool still has a false-negative rate of 5%. In a less endemic area, the false-negative rate would be correspondingly lower and thus more acceptable from a public health perspective. This is one step closer to a balance of optimal bed utilization and reasoned clinical assessment.
In the Literature
Role of Computerized Physician Order Entry Systems in Facilitating Medication Errors
Koppel R, Metlay JP, Cohen A, et al. Role of computerized physician order entry systems in facilitating medication errors. JAMA. 2005;293:1197-1203.
Computerized Physician Order Entry (CPOE) has been touted as an effective means to reduce medical errors, especially medication errors. There have been preliminary studies that showed both potential and actual error reductions with CPOE. More recent data suggested that there may be potential for facilitating errors as well.
Koppel et al. aimed to study CPOE system-related factors that may actually increase risk of medication errors. The authors conducted structured interviews with end users (housestaff, pharmacists, nurses, nurse managers, and attending physicians), real-time observations of end users interfacing with the system, entering orders, charting medications, and reviewing orders, and focus groups with housestaff. These qualitative data were used to help generate a 71-question structured survey subsequently given to the housestaff. These questions pertain to working conditions, sources of stress, and errors. There were 261 responses representing an 88% response rate.
Twenty-two previously unexplored potential medication error sources abstracted from the survey were grouped into the 2 categories: 1) information errors, and 2) human-machine interface flaws. The first category refers to fragmented data and the disparate information systems within hospitals. The latter category includes rigid machine programming that does not correspond to or facilitate workflow. Only 10 survey elements with sufficiently robust results were reported. About 40% of respondents used CPOE to determine dosage of infrequently prescribed medications at least once a week or more. Incorrect doses may be ordered if users follow the dosage information in the system that is based on drug inventory rather than clinical recommendations. Twenty-two percent of respondents noted that more than once a week duplicate or conflicting medications were ordered and not detected for several hours. Disorganized display of patient medications was believed to be partly responsible. More than 80% of respondents noted unintended delay in renewing antibiotics at least once. Such gaps were possible partially because the reminder system occurred in the paper chart while order entry was done with the computer. With respect to the human-machine interface, 55% reported difficulty identifying the correct patient because of poor or fragmented displays, and 23% reported this occurring more than a few times per week. System downtime leading to delay in order entry was reported by 47% to occur more than once a week. System inflexibility also led to difficulties in specifying medications and ordering nonformulary medications. This was reported by 31% to occur at least several times a week, and 24% reported this daily or more frequently.
This was a survey of end users of a CPOE system in a single institution, and the survey elements were mainly estimates of error risks. Nevertheless, it appropriately draws attention to the importance of the unique culture of each institution, efficient workflow, and coherent human-machine interface. The anticipated error reductions may not materialize if these issues are neglected. Hospitalists can serve a critical role in implementation and customization of CPOE systems that allow clinicians to do the right thing more timely and efficiently.
Risk Stratification for In-hospital Mortality in Acutely Decompensated Heart Failure: Classification and Regression Tree Analysis
Fonarow GC, Adams KF, Abraham WT, Yancy CW, Boscardin WJ; ADHERE Scientific Advisory Committee, Study Group, and Investigators. Risk stratification for in-hospital mortality in acutely decompensated heart failure: classification and regression tree analysis. JAMA. 2005;293:572-80.
Heart failure is an important and growing cause of hospitalization in this country, and it is one of the most common clinical entities encountered by hospitalists. While there are some risk assessment tools available for outpatients with heart failure, there has not been a risk stratification tool published for inpatients. In this study by Fonarow et al. in JAMA, the authors describe a simple risk-stratification formula for in-hospital mortality in patients with acutely decompensated heart failure. Data from the ADHERE registry (Acute Decompensated Heart Failure National Registry, which is industry sponsored, as was this study) were used to model the risk of in-hospital death using a classification and regression tree (CART) analysis. This was done in a 2-stage process. First, investigators established a derivation cohort of approximately 33,000 patients (sequential hospital admissions from October 2001 to February 2003) from the ADHERE registry, and used the CART method to analyze 39 clinical variables to determine which were the best predictors of in-hospital mortality. This analysis was used to derive a risk tree to partition patients into low-, intermediate-, and high-risk groups. Second, the validity of this method was tested by applying the prediction tool to a cohort of the subsequent 32,229 patients hospitalized in the ADHERE registry, from March 2003 to July 2003. The results were striking. Baseline characteristics and clinical outcomes between the derivation and validation cohorts were similar across the wide range of parameters examined. The difference in mortality between the low-, intermediate-, and high-risk groups was 23.6% in the highest-risk category and 1.8% in the low-risk category, while the intermediate group was stratified into 3 levels, with 20.0%, 5.0%, and 5.1% mortality risk in intermediate group levels 1, 2, and 3, respectively. Aside from the more than 10-fold range in mortality risk across the various groups, the outstanding feature of the authors’ findings was that 3 simple parameters were the most significant predictors of in-hospital mortality risk: BUN, SBP, and serum creatinine. Specifically, combinations of a serum BUN of 43 or greater, a serum creatinine of 2.75 or greater, and a systolic blood pressure of less than 115 were associated with higher mortality. They note that adding other predictors did not meaningfully increase the model’s accuracy. The authors comment that unlike other predictive models based on multivariate analyses (which are often complex, and therefore difficult to employ at bedside), this simple tool is easy to use. An additional advantage is that the data needed are typically available at time of admission and can therefore be used to make a timely clinical decision in terms of triage into an appropriate level of care. Similar risk assessment tools exist for the risk stratification of patients with the acute coronary syndrome, and given the frequency with which patients are admitted with acutely decompensated heart failure, this new tool should prove a welcome addition to the clinical decision-making abilities of hospitalists.
Risk of Endocarditis among Patients with Prosthetic Valves and Staphylococcus Aureus Bacteremia
El-Ahdab F, Benjamin DK, Wang A, , et al. Risk of endocarditis among patients with prosthetic valves and Staphylococcus aureus bacteremia. Am J Med. 2005;118:225-9.
The risk of developing endocarditis in patients with Staphylococcus aureus bacteremia and prosthetic valves increases as more than 600,000 prosthetic valves are implanted annually in the United States. A prospective study at Duke University identified 51 patients with prosthetic valves or mitral ring who developed S. aureus bacteremia. The modified Duke criteria were used for the diagnosis of endocarditis. The onset and sources of bacteremia, locations of acquiring bacteremia, as well as clinical outcome were analyzed. The overall incidence of definite prosthetic valve endocarditis was as high as 51%, with the remaining 49% patients meeting Duke criteria for possible endocarditis. The results showed that endocarditis occurred more frequently in mitral (62%) and aortic positions (48%), and with mitral ring the rate of endocarditis was slightly lower (33%). Among prostheses, mechanical and bioprosthetic valves had endocarditis rates of 62% and 44%, respectively. About 63% of patients had early onset of bacteremia (<1 year after valve placement), and 37% had late onset of bacteremia (>1 year after valve placement). Overall, the most common source of bacteremia was from infected surgical wound sites (33%). Early bacteremia was more likely to result from infected surgical wound sites (59%), while late bacteremia was more likely to have an unidentified source (48%). The majority of episodes of bacteremia (47%) were hospital-acquired (i.e., a positive blood culture occurred >72 hours after admission). The frequency of healthcare-associated bacteremia and community-acquired bacteremia was about 26%–27%.
In terms of mortality, there was no difference for a patient with early and late S. aureus bacteremia, bioprosthetic and mechanical valves, and infection due to methicillin-resistant or methicillin-susceptible S. aureus. However, mortality was higher among patients with definite endocarditis (62%) vs. possible endocarditis (28%). Patients with endocarditis who underwent valve surgery had lower mortality than those who did not undergo valve surgery due to inoperable comorbid conditions, such as stroke, multiorgan system failure, and mediastinitis. Persistent fever (≥ 38°C after 72 hours of adequate parenteral antibiotics) and persistent bacteremia (positive blood culture within 2–4 days of the initial positive blood culture) were independently associated with definite endocarditis with odds ratio of 4.4 and 11.7, respectively. Overall, 96% of patients underwent echocardiography (55% with both transesophageal and transthoracic echo, 14% with only transesophageal echo, 27% with only transthoracic echo). However, 10% patients with definite endocarditis had no diagnostic finding on either transthoracic or transesophageal echocardiography.
S. aureus bacteremia is a common phenomenon in inpatient settings. This study demonstrated an approximately 50% rate of definite prosthetic valve endocarditis in patients with S. aureus bacteremia. The risks of endocarditis were independent of valve type, location, and duration of implantation. This study highlights the need for aggressive treatment and evaluation of S. aureus bacteremia in patients with prosthetic valves. Clinically, persistent fever and bacteremia were independently associated with definite endocarditis in this study population. Clinicians cannot over-rely on transesophageal echocardiogram to identify occult endocarditis in high-risk patients.
Optimizing the Prediction of Perioperative Mortality in Vascular Surgery by Using a Customized Probability Model
Kertai MD, Boersma E, Klein J, van Urk H, Poldermans D. Optimizing the prediction of perioperative mortality in vascular surgery by using a customized probability model. Arch Intern Med. 2005;165:898-904.
Traditional perioperative risk-assessment models and indexes have focused primarily on cardiac outcomes and involved mainly clinical risk factors. The model proposed in this paper focused instead on overall mortality and incorporated not only clinical risk factors but also more precise surgery-specific risks and the use of beta-blocker and statin agents.
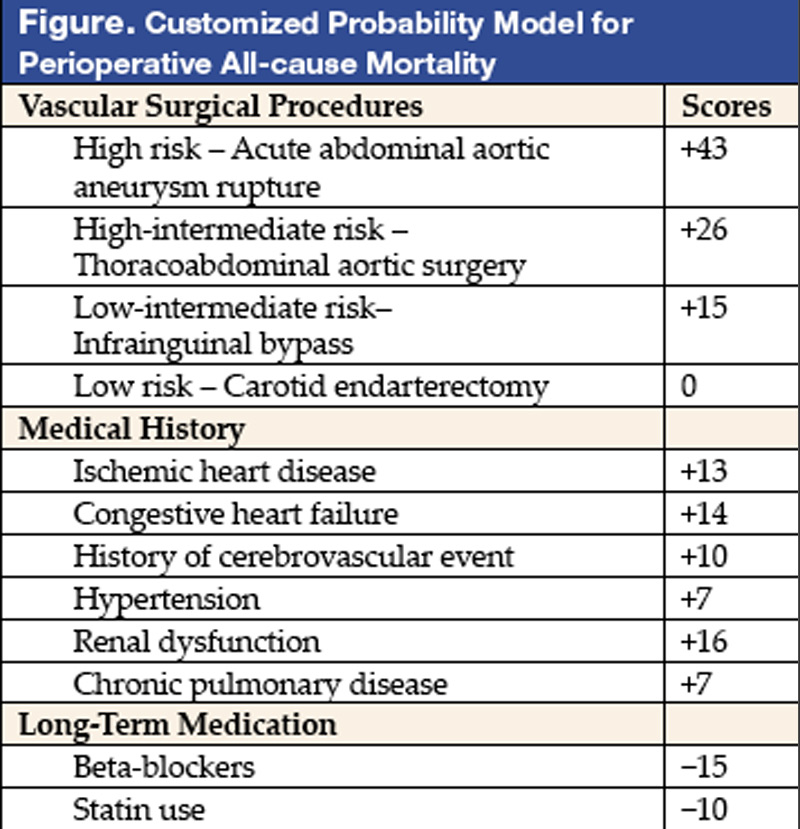
Investigators in the Netherlands targeted only vascular surgery patients identified from a computerized hospital information system. From a system, 2,310 patients who underwent 2,758 noncardiac vascular surgeries during a 10-year period in the 1990s were selected. Clinical risk factors, data on noninvasive stress testing, and long-term medication use, including statin agents, beta-blockers, calcium channel blockers, diuretics, insulin, nitrate, and aspirin, were abstracted. Outcome measures were all-cause mortality before discharge or within 30 days after surgery. The proposed model (see Figure) was based on modifications of the original Goldman Index, with the addition of more precise surgery risk stratification and statin and beta-blocker use. The specific types of vascular surgeries: carotid endarterectomy, infrainguinal bypass, abdominal aortic surgery, thoracoabdominal surgery, and acute abdominal aortic aneurysm rupture repair, carried systematically increased risk in expected fashion. Upon univariate analysis in the derivation cohort (n = 1,537), most of the clinical predictors from the Goldman Index were associated with increased perioperative mortality. Similar conclusions persisted in multivariate logistic regression analysis. Risk of surgical procedures, cardiovascular morbidity (ischemic heart disease, congestive heart failure, history of cerebrovascular event, and hypertension), renal dysfunction, and chronic pulmonary disease are independent predictors of increased all-cause perioperative mortality. In contrast, use of beta-blockers and statins were associated with reduced incidence of perioperative mortality. The final model included a scoring system with points assigned according to risk estimates of individual predictors. Beta-blocker and statin use in this model are assigned negative scores as their use lowers risk. For example, a patient with ischemic heart disease and hypertension undergoing abdominal aortic surgery would have a score of 46, corresponding to a 14% probability of mortality. That risk would be reduced to about 4% (score of 31) by use of beta-blockers (−15). In the same database, with 773 patients as the validation cohort, this prediction model performed nearly as well as the derivation model. Hypertension was not found to be an independent predictor in this validation cohort.
This tool appears provide robust risk assessment for vascular surgery patients. The inclusion of estimated benefit-of-statin and beta-blocker use may allow a more accurate “net” risk assessment. Those patients who are already on these 2 agents but still deemed at higher risk can be informed and may benefit from close monitoring. Additional preoperative interventions may include revascularization, if these high-risk patients have a decompensated cardiac status.
Role of Computerized Physician Order Entry Systems in Facilitating Medication Errors
Koppel R, Metlay JP, Cohen A, et al. Role of computerized physician order entry systems in facilitating medication errors. JAMA. 2005;293:1197-1203.
Computerized Physician Order Entry (CPOE) has been touted as an effective means to reduce medical errors, especially medication errors. There have been preliminary studies that showed both potential and actual error reductions with CPOE. More recent data suggested that there may be potential for facilitating errors as well.
Koppel et al. aimed to study CPOE system-related factors that may actually increase risk of medication errors. The authors conducted structured interviews with end users (housestaff, pharmacists, nurses, nurse managers, and attending physicians), real-time observations of end users interfacing with the system, entering orders, charting medications, and reviewing orders, and focus groups with housestaff. These qualitative data were used to help generate a 71-question structured survey subsequently given to the housestaff. These questions pertain to working conditions, sources of stress, and errors. There were 261 responses representing an 88% response rate.
Twenty-two previously unexplored potential medication error sources abstracted from the survey were grouped into the 2 categories: 1) information errors, and 2) human-machine interface flaws. The first category refers to fragmented data and the disparate information systems within hospitals. The latter category includes rigid machine programming that does not correspond to or facilitate workflow. Only 10 survey elements with sufficiently robust results were reported. About 40% of respondents used CPOE to determine dosage of infrequently prescribed medications at least once a week or more. Incorrect doses may be ordered if users follow the dosage information in the system that is based on drug inventory rather than clinical recommendations. Twenty-two percent of respondents noted that more than once a week duplicate or conflicting medications were ordered and not detected for several hours. Disorganized display of patient medications was believed to be partly responsible. More than 80% of respondents noted unintended delay in renewing antibiotics at least once. Such gaps were possible partially because the reminder system occurred in the paper chart while order entry was done with the computer. With respect to the human-machine interface, 55% reported difficulty identifying the correct patient because of poor or fragmented displays, and 23% reported this occurring more than a few times per week. System downtime leading to delay in order entry was reported by 47% to occur more than once a week. System inflexibility also led to difficulties in specifying medications and ordering nonformulary medications. This was reported by 31% to occur at least several times a week, and 24% reported this daily or more frequently.
This was a survey of end users of a CPOE system in a single institution, and the survey elements were mainly estimates of error risks. Nevertheless, it appropriately draws attention to the importance of the unique culture of each institution, efficient workflow, and coherent human-machine interface. The anticipated error reductions may not materialize if these issues are neglected. Hospitalists can serve a critical role in implementation and customization of CPOE systems that allow clinicians to do the right thing more timely and efficiently.
Risk Stratification for In-hospital Mortality in Acutely Decompensated Heart Failure: Classification and Regression Tree Analysis
Fonarow GC, Adams KF, Abraham WT, Yancy CW, Boscardin WJ; ADHERE Scientific Advisory Committee, Study Group, and Investigators. Risk stratification for in-hospital mortality in acutely decompensated heart failure: classification and regression tree analysis. JAMA. 2005;293:572-80.
Heart failure is an important and growing cause of hospitalization in this country, and it is one of the most common clinical entities encountered by hospitalists. While there are some risk assessment tools available for outpatients with heart failure, there has not been a risk stratification tool published for inpatients. In this study by Fonarow et al. in JAMA, the authors describe a simple risk-stratification formula for in-hospital mortality in patients with acutely decompensated heart failure. Data from the ADHERE registry (Acute Decompensated Heart Failure National Registry, which is industry sponsored, as was this study) were used to model the risk of in-hospital death using a classification and regression tree (CART) analysis. This was done in a 2-stage process. First, investigators established a derivation cohort of approximately 33,000 patients (sequential hospital admissions from October 2001 to February 2003) from the ADHERE registry, and used the CART method to analyze 39 clinical variables to determine which were the best predictors of in-hospital mortality. This analysis was used to derive a risk tree to partition patients into low-, intermediate-, and high-risk groups. Second, the validity of this method was tested by applying the prediction tool to a cohort of the subsequent 32,229 patients hospitalized in the ADHERE registry, from March 2003 to July 2003. The results were striking. Baseline characteristics and clinical outcomes between the derivation and validation cohorts were similar across the wide range of parameters examined. The difference in mortality between the low-, intermediate-, and high-risk groups was 23.6% in the highest-risk category and 1.8% in the low-risk category, while the intermediate group was stratified into 3 levels, with 20.0%, 5.0%, and 5.1% mortality risk in intermediate group levels 1, 2, and 3, respectively. Aside from the more than 10-fold range in mortality risk across the various groups, the outstanding feature of the authors’ findings was that 3 simple parameters were the most significant predictors of in-hospital mortality risk: BUN, SBP, and serum creatinine. Specifically, combinations of a serum BUN of 43 or greater, a serum creatinine of 2.75 or greater, and a systolic blood pressure of less than 115 were associated with higher mortality. They note that adding other predictors did not meaningfully increase the model’s accuracy. The authors comment that unlike other predictive models based on multivariate analyses (which are often complex, and therefore difficult to employ at bedside), this simple tool is easy to use. An additional advantage is that the data needed are typically available at time of admission and can therefore be used to make a timely clinical decision in terms of triage into an appropriate level of care. Similar risk assessment tools exist for the risk stratification of patients with the acute coronary syndrome, and given the frequency with which patients are admitted with acutely decompensated heart failure, this new tool should prove a welcome addition to the clinical decision-making abilities of hospitalists.
Risk of Endocarditis among Patients with Prosthetic Valves and Staphylococcus Aureus Bacteremia
El-Ahdab F, Benjamin DK, Wang A, , et al. Risk of endocarditis among patients with prosthetic valves and Staphylococcus aureus bacteremia. Am J Med. 2005;118:225-9.
The risk of developing endocarditis in patients with Staphylococcus aureus bacteremia and prosthetic valves increases as more than 600,000 prosthetic valves are implanted annually in the United States. A prospective study at Duke University identified 51 patients with prosthetic valves or mitral ring who developed S. aureus bacteremia. The modified Duke criteria were used for the diagnosis of endocarditis. The onset and sources of bacteremia, locations of acquiring bacteremia, as well as clinical outcome were analyzed. The overall incidence of definite prosthetic valve endocarditis was as high as 51%, with the remaining 49% patients meeting Duke criteria for possible endocarditis. The results showed that endocarditis occurred more frequently in mitral (62%) and aortic positions (48%), and with mitral ring the rate of endocarditis was slightly lower (33%). Among prostheses, mechanical and bioprosthetic valves had endocarditis rates of 62% and 44%, respectively. About 63% of patients had early onset of bacteremia (<1 year after valve placement), and 37% had late onset of bacteremia (>1 year after valve placement). Overall, the most common source of bacteremia was from infected surgical wound sites (33%). Early bacteremia was more likely to result from infected surgical wound sites (59%), while late bacteremia was more likely to have an unidentified source (48%). The majority of episodes of bacteremia (47%) were hospital-acquired (i.e., a positive blood culture occurred >72 hours after admission). The frequency of healthcare-associated bacteremia and community-acquired bacteremia was about 26%–27%.
In terms of mortality, there was no difference for a patient with early and late S. aureus bacteremia, bioprosthetic and mechanical valves, and infection due to methicillin-resistant or methicillin-susceptible S. aureus. However, mortality was higher among patients with definite endocarditis (62%) vs. possible endocarditis (28%). Patients with endocarditis who underwent valve surgery had lower mortality than those who did not undergo valve surgery due to inoperable comorbid conditions, such as stroke, multiorgan system failure, and mediastinitis. Persistent fever (≥ 38°C after 72 hours of adequate parenteral antibiotics) and persistent bacteremia (positive blood culture within 2–4 days of the initial positive blood culture) were independently associated with definite endocarditis with odds ratio of 4.4 and 11.7, respectively. Overall, 96% of patients underwent echocardiography (55% with both transesophageal and transthoracic echo, 14% with only transesophageal echo, 27% with only transthoracic echo). However, 10% patients with definite endocarditis had no diagnostic finding on either transthoracic or transesophageal echocardiography.
S. aureus bacteremia is a common phenomenon in inpatient settings. This study demonstrated an approximately 50% rate of definite prosthetic valve endocarditis in patients with S. aureus bacteremia. The risks of endocarditis were independent of valve type, location, and duration of implantation. This study highlights the need for aggressive treatment and evaluation of S. aureus bacteremia in patients with prosthetic valves. Clinically, persistent fever and bacteremia were independently associated with definite endocarditis in this study population. Clinicians cannot over-rely on transesophageal echocardiogram to identify occult endocarditis in high-risk patients.
Optimizing the Prediction of Perioperative Mortality in Vascular Surgery by Using a Customized Probability Model
Kertai MD, Boersma E, Klein J, van Urk H, Poldermans D. Optimizing the prediction of perioperative mortality in vascular surgery by using a customized probability model. Arch Intern Med. 2005;165:898-904.
Traditional perioperative risk-assessment models and indexes have focused primarily on cardiac outcomes and involved mainly clinical risk factors. The model proposed in this paper focused instead on overall mortality and incorporated not only clinical risk factors but also more precise surgery-specific risks and the use of beta-blocker and statin agents.
Investigators in the Netherlands targeted only vascular surgery patients identified from a computerized hospital information system. From a system, 2,310 patients who underwent 2,758 noncardiac vascular surgeries during a 10-year period in the 1990s were selected. Clinical risk factors, data on noninvasive stress testing, and long-term medication use, including statin agents, beta-blockers, calcium channel blockers, diuretics, insulin, nitrate, and aspirin, were abstracted. Outcome measures were all-cause mortality before discharge or within 30 days after surgery. The proposed model (see Figure) was based on modifications of the original Goldman Index, with the addition of more precise surgery risk stratification and statin and beta-blocker use. The specific types of vascular surgeries: carotid endarterectomy, infrainguinal bypass, abdominal aortic surgery, thoracoabdominal surgery, and acute abdominal aortic aneurysm rupture repair, carried systematically increased risk in expected fashion. Upon univariate analysis in the derivation cohort (n = 1,537), most of the clinical predictors from the Goldman Index were associated with increased perioperative mortality. Similar conclusions persisted in multivariate logistic regression analysis. Risk of surgical procedures, cardiovascular morbidity (ischemic heart disease, congestive heart failure, history of cerebrovascular event, and hypertension), renal dysfunction, and chronic pulmonary disease are independent predictors of increased all-cause perioperative mortality. In contrast, use of beta-blockers and statins were associated with reduced incidence of perioperative mortality. The final model included a scoring system with points assigned according to risk estimates of individual predictors. Beta-blocker and statin use in this model are assigned negative scores as their use lowers risk. For example, a patient with ischemic heart disease and hypertension undergoing abdominal aortic surgery would have a score of 46, corresponding to a 14% probability of mortality. That risk would be reduced to about 4% (score of 31) by use of beta-blockers (−15). In the same database, with 773 patients as the validation cohort, this prediction model performed nearly as well as the derivation model. Hypertension was not found to be an independent predictor in this validation cohort.
This tool appears provide robust risk assessment for vascular surgery patients. The inclusion of estimated benefit-of-statin and beta-blocker use may allow a more accurate “net” risk assessment. Those patients who are already on these 2 agents but still deemed at higher risk can be informed and may benefit from close monitoring. Additional preoperative interventions may include revascularization, if these high-risk patients have a decompensated cardiac status.
The Template Progress Note: a Timesaving Innovation
Documentation in the form of the daily progress note is an important and cumbersome detail in the life of a hospitalist. Recognizing this, we saw an opportunity for improvement in this process and began a creative endeavor to rework the progress note. Our goal was to decrease the length of time that we spent on documenting redundant information such as writing out “lungs are clear to auscultation” on every patient, in order for us to focus our documentation time on more individualized information and discussion of the patients. We also wanted to simultaneously include quality improvement measures on indicators such as deep vein thrombosis (DVT) prophylaxis, urinary catheter existence, ambulation status, and nutrition. In January 2004, we instituted a template progress note for our hospital medicine service at Lee Memorial Health Systems in Lee County, FL, that has changed how we document increased DVT prophylaxis and increased our efficiency.
After some literature review, we found that evidence existed to support our initiative. Findings of several studies suggest that strategies focused on the prevention of errors of omission have utility in improving guideline compliance (1,2,3). We also found that reminders for prevention at the point of care (the progress note in our situation) were important for compliance (2–5). Furthermore, the findings of one study suggested that it was the facilitation of documentation and ordering of recommended procedures that improved guideline compliance in a small sample of resident physicians (3).
The creation of the template progress note had just begun. We knew that it would require several revisions. Therefore, we wanted to have the control of the template without needing hospital approval. To do this, we decided to use the hospital’s standard blank progress note and print the template onto the progress note using a word processing document and a laser printer. We solicited input from various members of the group for the design and required information on the template, and we reviewed previous template notes that had been utilized (although these were created for outpatient environments). We learned that having a 1-page template was important for the group. We also discovered that the hospitalists needed ample room for free writing subjective data as well as the assessment and discussion. We finally arrived at the hospitalist template progress note.
Each hospitalist was sent a copy of the template via electronic mail that could easily be printed at each nursing station. A supply of preprinted template progress notes was placed at each nursing station and maintained by our support staff. The hospitalists could also have the progress note on their personal digital assistant (PDA) and print out to the infrared enabled laser printers found throughout our institution. This option was not exercised routinely by our hospitalists.
It took a few months for the hospitalists to adapt to using the template progress notes. The initial hurdles were documentation habits and the availability of the notes at the nursing station. The documentation habits quickly changed to using the templates once the hospitalists were able to appreciate the time they saved. After 1 year of implementation, we have 100% utilization among the hospitalists at Lee Memorial Hospital (the flagship hospital of the health system). Utilization at the smaller hospitals in the system remains disappointing, likely a result of lack of template availability at the nursing stations.
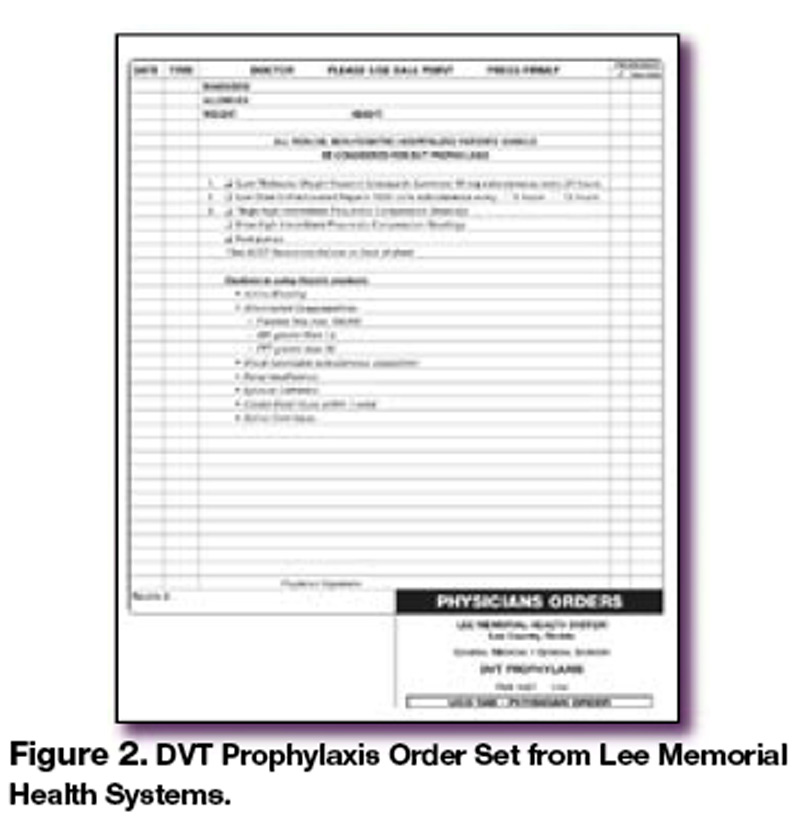
An early supporter of the template progress note was Director of Case Management at Lee Memorial Health Systems Karen Harris Wise. She said, “The template progress notes are great from a case management standpoint. We can easily identify the physician, and it gives us the necessary information for our job.” Case management soon came to ask us to incorporate the estimated date of discharge at the bottom of the progress note. Once we incorporated the estimated date of discharge, the hospitalists felt they received fewer calls from case management, and the case managers were soon requesting hospitalists not using the template progress note to do so, thus improving utilization compliance.
Once implemented, the accolades and success stories for the template progress notes began flowing. Other non-hospitalist physicians at the hospital liked the idea so much that they created their own. A local pulmonologist said, “The progress note template is a great idea. It cuts out the time you waste documenting routine items and gives you more time and highlights the thoughts that you document in the discussion section.” His group later created and implemented their own template progress note specifically for ICU patients, based upon our template.
The progress note decreased the time to document each patient by approximately 42 seconds. This may not seem substantial, but multiplied by 18 patients per day (our average), this equated to over 12 minutes each day, over an hour each week, and over 60 hours a year per hospitalist.
After about 6 months of experience and success with the progress note templates, the hospital approached us to make a standardized progress note that could be used by the entire staff (Figure 1). They also wanted to incorporate Joint Commission on Accreditation of Healthcare Organizations (JCAHO) quality indicators such as smoking cessation documentation and vaccination status. We submitted our form with some modifications, and the hospital approved and published it as an official progress note template. When the hospital was inspected by JCAHO in March of 2005, it received accolades for this quality improvement tool.
This template was created with the input of our group as an initiative to have a system-wide progress note for Internal Medicine based on the success our hospitalist group had with the template progress note. (Reproduced with permission from LMHS.)
Implementing documentation of DVT prophylaxis (if applicable) was one of our original motivations for the progress note. With a check box at the top of the template note, hospitalists were faced with this documentation on every patient. We also reinforced the DVT prophylaxis with quarterly educational sessions. A DVT prophylaxis order set (Figure 2) with DVT prophylaxis indications and recommendations was also encouraged and utilized during this period of time. DVT prophylaxis compliance in our group went from less than 50% to nearly 100% during the first year of implementing the hospital progress note.
Another potential benefit may be coding compliance. Prior to implementation, we had a substantial failure rate on Medicare audits. We suspect that this number will be substantially reduced with detailed physical examination documentation built into the template, although corroborating data are not available.
Based upon our experience, a hospitalist progress note template is a promising tool with regard to time efficiency, coding compliance, and quality improvement. The electronic medical record will likely soon become the standard of inpatient documentation. The template progress note may serve as an efficient tool in the meantime and may even serve as a basis for the hospitalist electronic templates, as electronic medical records are often template based.
References
- McDonald CJ. Protocol-based reminders, the quality of care, and the non-perfectibility of man. N Engl J Med. 1976;295: 1351-5.
- Overhage JM, Tierney WM, Zhou X, McDonald CJ. A randomized trial of “corollary orders” to prevent errors of omission. J Am Med Inform Assoc. 1997;4: 364-71.
- Nilasena DS, Lincoln MJ. A computer-based reminder system improved physician compliance with diabetes preventive care guidelines. Proc 19th Annu Symp Comput Appl Med Care. 1995:640-5.
- Lobach DF, Hammond WE. Development and evaluation of a computer-assisted management protocol (CAMP): improved compliance with care guidelines for diabetes mellitus. Proc 18th Annu Symp Comput Appl Med Care. 1994:787-91.
- Tierney WM, Hui SL, McDonald CJ. Delayed feedback of physician performance versus immediate reminders to perform preventive care. Effects on physician compliance. Med Care. 1986;24:659-66.
Robert Hasty, DO, is assistant professor of internal medicine and a hospitalist at Nova Southeastern University College of Osteopathic Medicine in Fort Lauderdale, FL. Prior to his academic career, he was an associate lead hospitalist for Cogent Healthcare, Inc., at Lee Memorial Health Systems in Lee County, FL. Dr. Hasty can be contacted at hasty@nsu.nova.edu or 954-262-1473.
Documentation in the form of the daily progress note is an important and cumbersome detail in the life of a hospitalist. Recognizing this, we saw an opportunity for improvement in this process and began a creative endeavor to rework the progress note. Our goal was to decrease the length of time that we spent on documenting redundant information such as writing out “lungs are clear to auscultation” on every patient, in order for us to focus our documentation time on more individualized information and discussion of the patients. We also wanted to simultaneously include quality improvement measures on indicators such as deep vein thrombosis (DVT) prophylaxis, urinary catheter existence, ambulation status, and nutrition. In January 2004, we instituted a template progress note for our hospital medicine service at Lee Memorial Health Systems in Lee County, FL, that has changed how we document increased DVT prophylaxis and increased our efficiency.
After some literature review, we found that evidence existed to support our initiative. Findings of several studies suggest that strategies focused on the prevention of errors of omission have utility in improving guideline compliance (1,2,3). We also found that reminders for prevention at the point of care (the progress note in our situation) were important for compliance (2–5). Furthermore, the findings of one study suggested that it was the facilitation of documentation and ordering of recommended procedures that improved guideline compliance in a small sample of resident physicians (3).
The creation of the template progress note had just begun. We knew that it would require several revisions. Therefore, we wanted to have the control of the template without needing hospital approval. To do this, we decided to use the hospital’s standard blank progress note and print the template onto the progress note using a word processing document and a laser printer. We solicited input from various members of the group for the design and required information on the template, and we reviewed previous template notes that had been utilized (although these were created for outpatient environments). We learned that having a 1-page template was important for the group. We also discovered that the hospitalists needed ample room for free writing subjective data as well as the assessment and discussion. We finally arrived at the hospitalist template progress note.
Each hospitalist was sent a copy of the template via electronic mail that could easily be printed at each nursing station. A supply of preprinted template progress notes was placed at each nursing station and maintained by our support staff. The hospitalists could also have the progress note on their personal digital assistant (PDA) and print out to the infrared enabled laser printers found throughout our institution. This option was not exercised routinely by our hospitalists.
It took a few months for the hospitalists to adapt to using the template progress notes. The initial hurdles were documentation habits and the availability of the notes at the nursing station. The documentation habits quickly changed to using the templates once the hospitalists were able to appreciate the time they saved. After 1 year of implementation, we have 100% utilization among the hospitalists at Lee Memorial Hospital (the flagship hospital of the health system). Utilization at the smaller hospitals in the system remains disappointing, likely a result of lack of template availability at the nursing stations.
An early supporter of the template progress note was Director of Case Management at Lee Memorial Health Systems Karen Harris Wise. She said, “The template progress notes are great from a case management standpoint. We can easily identify the physician, and it gives us the necessary information for our job.” Case management soon came to ask us to incorporate the estimated date of discharge at the bottom of the progress note. Once we incorporated the estimated date of discharge, the hospitalists felt they received fewer calls from case management, and the case managers were soon requesting hospitalists not using the template progress note to do so, thus improving utilization compliance.
Once implemented, the accolades and success stories for the template progress notes began flowing. Other non-hospitalist physicians at the hospital liked the idea so much that they created their own. A local pulmonologist said, “The progress note template is a great idea. It cuts out the time you waste documenting routine items and gives you more time and highlights the thoughts that you document in the discussion section.” His group later created and implemented their own template progress note specifically for ICU patients, based upon our template.
The progress note decreased the time to document each patient by approximately 42 seconds. This may not seem substantial, but multiplied by 18 patients per day (our average), this equated to over 12 minutes each day, over an hour each week, and over 60 hours a year per hospitalist.
After about 6 months of experience and success with the progress note templates, the hospital approached us to make a standardized progress note that could be used by the entire staff (Figure 1). They also wanted to incorporate Joint Commission on Accreditation of Healthcare Organizations (JCAHO) quality indicators such as smoking cessation documentation and vaccination status. We submitted our form with some modifications, and the hospital approved and published it as an official progress note template. When the hospital was inspected by JCAHO in March of 2005, it received accolades for this quality improvement tool.
This template was created with the input of our group as an initiative to have a system-wide progress note for Internal Medicine based on the success our hospitalist group had with the template progress note. (Reproduced with permission from LMHS.)
Implementing documentation of DVT prophylaxis (if applicable) was one of our original motivations for the progress note. With a check box at the top of the template note, hospitalists were faced with this documentation on every patient. We also reinforced the DVT prophylaxis with quarterly educational sessions. A DVT prophylaxis order set (Figure 2) with DVT prophylaxis indications and recommendations was also encouraged and utilized during this period of time. DVT prophylaxis compliance in our group went from less than 50% to nearly 100% during the first year of implementing the hospital progress note.
Another potential benefit may be coding compliance. Prior to implementation, we had a substantial failure rate on Medicare audits. We suspect that this number will be substantially reduced with detailed physical examination documentation built into the template, although corroborating data are not available.
Based upon our experience, a hospitalist progress note template is a promising tool with regard to time efficiency, coding compliance, and quality improvement. The electronic medical record will likely soon become the standard of inpatient documentation. The template progress note may serve as an efficient tool in the meantime and may even serve as a basis for the hospitalist electronic templates, as electronic medical records are often template based.
References
- McDonald CJ. Protocol-based reminders, the quality of care, and the non-perfectibility of man. N Engl J Med. 1976;295: 1351-5.
- Overhage JM, Tierney WM, Zhou X, McDonald CJ. A randomized trial of “corollary orders” to prevent errors of omission. J Am Med Inform Assoc. 1997;4: 364-71.
- Nilasena DS, Lincoln MJ. A computer-based reminder system improved physician compliance with diabetes preventive care guidelines. Proc 19th Annu Symp Comput Appl Med Care. 1995:640-5.
- Lobach DF, Hammond WE. Development and evaluation of a computer-assisted management protocol (CAMP): improved compliance with care guidelines for diabetes mellitus. Proc 18th Annu Symp Comput Appl Med Care. 1994:787-91.
- Tierney WM, Hui SL, McDonald CJ. Delayed feedback of physician performance versus immediate reminders to perform preventive care. Effects on physician compliance. Med Care. 1986;24:659-66.
Robert Hasty, DO, is assistant professor of internal medicine and a hospitalist at Nova Southeastern University College of Osteopathic Medicine in Fort Lauderdale, FL. Prior to his academic career, he was an associate lead hospitalist for Cogent Healthcare, Inc., at Lee Memorial Health Systems in Lee County, FL. Dr. Hasty can be contacted at hasty@nsu.nova.edu or 954-262-1473.
Transforming Care at the Bedside
“Culture trumps strategy every time”
As hospitalists attempt to improve hospital care delivery, they strive to develop strategies for successful implementation of new guidelines, order sets, and alteration of utilization patterns. Key to this success will be collaboration with staff also caring for patients in the hospital. How best to make these changes is unclear, but Kurt Swartout, a hospitalist at Kaiser Permanente’s Roseville Medical Center in California, is involved in a unique project to figure this out. Roseville is one of 13 hospitals (Figure 1) participating in the Institute for Healthcare Improvement (IHI) Transforming Care at the Bedside (TCAB) initiative.
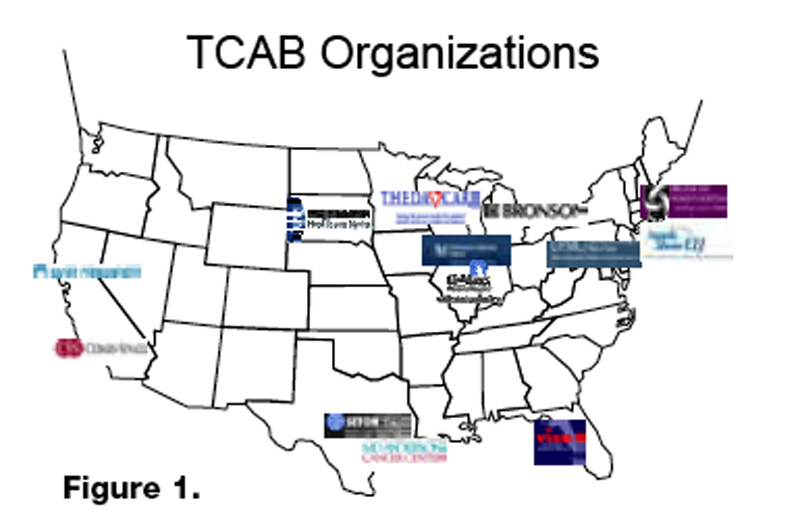
“In July 2003, The Robert Wood Johnson Foundation awarded IHI a grant to study and develop one or more models of care at the bedside on medical and surgical units that would result in improved quality of patient care and service, more effective care teams, improved staff satisfaction and retention, and greater efficiency. Utilizing an innovative approach, IHI and select pilot organizations have been piloting new ideas based on the six Institute of Medicine dimensions of quality (safety, effectiveness, patient-centeredness, timeliness, efficiency, and equity), plus the added dimension of vitality” (www.ihi.org).
Since joining the project in October 2003, many changes have occurred on a couple of the hospital floors at Roseville Medical Center. Dr. Swartout raves about this initiative: “TCAB significantly helped set the stage for effective communication and has helped improve the quality of care at the hospital in which I work. It is the most exciting project in which I have been involved and has done more to improve the quality of patient care than anything else I have seen as a hospitalist.”
Dr. Swartout’s hospital was selected as 1 of 3 test hospitals along with the University of Pittsburgh Medical Center at Shady Side and Seton Hospital in Austin, TX. The first phase at Kaiser Roseville started with a meeting of all employees who worked on medical floor Two South. This included the nurses, the unit assistant, respiratory and physical therapists, pharmacists, administrators, and physicians working on the unit. They had 9 areas from which to choose to study and as a group selected 3:
- Increasing patient safety;
- Improving communication among different health care providers; and
- Making care more patient oriented (patient-centered care).
Utilizing rapid-cycle testing and small tests of change, they then moved forward to improve performance with the above aims. To generate ideas, a “safe” environment was created in which no ideas were considered “bad” and everyone was encouraged to exchange suggestions freely. Administrative support was and continues to be critical to the success of TCAB, because everyone involved was given permission and in fact was empowered to develop creative testing solutions to common problems. Interventions were implemented using rapid-cycle tests and evaluated on 1 patient for 1 shift. Depending upon the outcome, these interventions were either adopted for expansion, or they were modified for further testing or abandoned if unsuccessful. This rapid-cycle testing using small tests of change appealed to everyone, generating a level of energy and enthusiasm among the entire team that had not been present among hospital staff prior to TCAB. Unique to the philosophy of the TCAB initiative, whenever an idea was being tested, the rank-and-file staff had the opportunity to stop it, no matter how enthusiastic the management staff believed in it.
During phase I, Two South rapid-cycle tested over 250 staff-generated ideas. Of note, brainstorming by the staff mainly yielded low-cost and easy-to-implement ideas. Many interventions were simple but allowed the caregiver to focus on the patient, experimenting with ideas that had previously gone unsolicited by management. For example, the staff evaluated placing white boards at the patient’s bedside on which the daily goals were outlined in collaboration with the patient, family, and caregivers. Additionally, they tried alternating midnight rounds between the hospitalist and charge nurse to proactively address issues that might otherwise result in an early, 4 a.m. phone call to the physician. These trials were successful and became permanent efforts.
Perhaps the biggest impact was on the culture of the unit. Because identified issues had become opportunities for improvement instead of problems, a new sense of optimism prevailed. Care on one patient typified this evolving approach induced by the TCAB initiative. An 81-year-old demented man was admitted for behavioral problems because the family could no longer handle him; he appeared destined to languish in the hospital. We have all taken care of patients like this, and difficulties in their management combined with no obvious disposition usually result in prolonged hospitalizations. The staff immediately saw this patient as an opportunity to work closely with the family. Making arrangements for the wife to spend time with the patient in the hospital and aggressively devising a care plan that involved the family resulted in the patient’s return home after just 4 days. The patient’s family was delighted with the care, and everybody on the unit shared a real sense of accomplishment.
A concrete example of using the white board for communication resulted in optimization of care for another gentleman who was admitted after a complicated bowel resection with a projected length of stay of 8–10 days according to the surgeon. The Two South staff worked closely with the surgeon and placed daily goals on the white board for all to see. Additionally, the nurses and patient were actively involved in the decision-making process, particularly with regard to increasing ambulation and decreasing narcotic use. This resulted in more rapid achievement of goals and recovery by the patient, with discharge from the unit occurring after just 4 days.
With the success of phase I at Kaiser Roseville, the staff anxiously set forth to participate in Phase II. Phase II increased the number of hospital sites to 13 and increased the rapid-cycle testing module. Ten areas of focused improvement were selected, including attempts to reduce unplanned transfers to the ICU and decreasing adverse events for hospitalized patients. During Phase II, Roseville developed its own Rapid Medical Response Team (RMRT). The RMRT is composed of the charge nurse for the ICU, a respiratory therapist, and a house supervisor. This team responds emergently at the request of any Medical-Surgical nurse to evaluate any patient about whom the nurse has concerns. These patients usually have a quickly evolving medical crisis such as respiratory distress, hypotension, or an altered level of consciousness. The primary goal of the RMRT is to quickly evaluate the patient, obtain physician support if needed, and stabilize the patient promptly on the floor or transfer them in a controlled fashion to the ICU. A secondary goal pertains to another TCAB aim, staff vitality, in that the medical-surgical nurse is now placed in a safe environment where he or she interacts with peers from the RMRT and gain additional critical thinking and physical assessment skills through that interaction. It is still early, as we just started the RMRT in September 2004, but the early data suggest we have significantly decreased transfers to the ICU, Code Blues outside the ICU, and unplanned mortality on the Medical-Surgical floors.
In an effort to minimize patient falls, Roseville instituted hourly safety rounds in which a direct care provider (RN, LVN, or NA) quickly looks at all the patients and their current status and implements a fall prevention protocol as needed. Another intervention they have adopted is the use of portable bed alarms, which alerts staff that a patient is attempting to get out of bed. The net result of this has been a dramatic reduction in the fall rate on the floor from a California average of 3.1 falls/thousand patient days to 0.8 falls/ thousand patient days on Two North, demonstrating expansion of the TCAB initiative to other floors in the hospital.
When the TCAB initiative was initiated at Roseville 18 months ago with the Robert Wood Johnson Foundation and the IHI, the Roseville staff had no idea of how much could be achieved—from enhancing patient care to improving both physician and nursing satisfaction to decreasing patient mortality. Although the TCAB initiative is viewed as an ongoing journey, the staff is eagerly anticipating the remainder of the voyage.
An example of an initiative at other hospitals among the 13 includes “peace and quiet time” at Long Island Jewish/North Shore. These nursing “magnet” hospitals discovered when they surveyed their patients that noise preventing patients from resting and recuperating was a major problem. Beginning with 30 minutes of enforced quiet time in the afternoon and then expanding to an hour, patients have reportedly been delighted with this. Snacks were passed out to the patients so they would buy into the initiative and believe they were not being ignored—a floor staff suggestion!
Another hospital modified the usual “multidisciplinary rounds” into highly functional, true patient rounds. At this hospital they originally were called “discharge rounds,” with a focus on discharging the patient. Recognizing that the patient had not been involved because these occurred in a conference room, they were renamed “patient care rounds” and moved out of the conference room to round in the patients’ rooms. Following the dictum of “nothing about the patient without the patient,” these rounds include a pharmacist, a social worker, the charge nurse, a nutritionist, a case manager, and the patient in the patients’ room. This team rounds on all the patients on the unit, seeing up to 37 patients in 1 hour! After initial difficulties involving the residents, they now have “firm directors,” so a physician is now involved. Based on this experience, they proclaim that their culture has changed from “no, it won’t work” to “why not try it?”
Hospitals and staff participating in TCAB are discovering just how successful they can be in achieving enhanced communication, implementing novel interventions to improve care, and optimizing the overall hospital experience for patients.
“Culture trumps strategy every time”
As hospitalists attempt to improve hospital care delivery, they strive to develop strategies for successful implementation of new guidelines, order sets, and alteration of utilization patterns. Key to this success will be collaboration with staff also caring for patients in the hospital. How best to make these changes is unclear, but Kurt Swartout, a hospitalist at Kaiser Permanente’s Roseville Medical Center in California, is involved in a unique project to figure this out. Roseville is one of 13 hospitals (Figure 1) participating in the Institute for Healthcare Improvement (IHI) Transforming Care at the Bedside (TCAB) initiative.
“In July 2003, The Robert Wood Johnson Foundation awarded IHI a grant to study and develop one or more models of care at the bedside on medical and surgical units that would result in improved quality of patient care and service, more effective care teams, improved staff satisfaction and retention, and greater efficiency. Utilizing an innovative approach, IHI and select pilot organizations have been piloting new ideas based on the six Institute of Medicine dimensions of quality (safety, effectiveness, patient-centeredness, timeliness, efficiency, and equity), plus the added dimension of vitality” (www.ihi.org).
Since joining the project in October 2003, many changes have occurred on a couple of the hospital floors at Roseville Medical Center. Dr. Swartout raves about this initiative: “TCAB significantly helped set the stage for effective communication and has helped improve the quality of care at the hospital in which I work. It is the most exciting project in which I have been involved and has done more to improve the quality of patient care than anything else I have seen as a hospitalist.”
Dr. Swartout’s hospital was selected as 1 of 3 test hospitals along with the University of Pittsburgh Medical Center at Shady Side and Seton Hospital in Austin, TX. The first phase at Kaiser Roseville started with a meeting of all employees who worked on medical floor Two South. This included the nurses, the unit assistant, respiratory and physical therapists, pharmacists, administrators, and physicians working on the unit. They had 9 areas from which to choose to study and as a group selected 3:
- Increasing patient safety;
- Improving communication among different health care providers; and
- Making care more patient oriented (patient-centered care).
Utilizing rapid-cycle testing and small tests of change, they then moved forward to improve performance with the above aims. To generate ideas, a “safe” environment was created in which no ideas were considered “bad” and everyone was encouraged to exchange suggestions freely. Administrative support was and continues to be critical to the success of TCAB, because everyone involved was given permission and in fact was empowered to develop creative testing solutions to common problems. Interventions were implemented using rapid-cycle tests and evaluated on 1 patient for 1 shift. Depending upon the outcome, these interventions were either adopted for expansion, or they were modified for further testing or abandoned if unsuccessful. This rapid-cycle testing using small tests of change appealed to everyone, generating a level of energy and enthusiasm among the entire team that had not been present among hospital staff prior to TCAB. Unique to the philosophy of the TCAB initiative, whenever an idea was being tested, the rank-and-file staff had the opportunity to stop it, no matter how enthusiastic the management staff believed in it.
During phase I, Two South rapid-cycle tested over 250 staff-generated ideas. Of note, brainstorming by the staff mainly yielded low-cost and easy-to-implement ideas. Many interventions were simple but allowed the caregiver to focus on the patient, experimenting with ideas that had previously gone unsolicited by management. For example, the staff evaluated placing white boards at the patient’s bedside on which the daily goals were outlined in collaboration with the patient, family, and caregivers. Additionally, they tried alternating midnight rounds between the hospitalist and charge nurse to proactively address issues that might otherwise result in an early, 4 a.m. phone call to the physician. These trials were successful and became permanent efforts.
Perhaps the biggest impact was on the culture of the unit. Because identified issues had become opportunities for improvement instead of problems, a new sense of optimism prevailed. Care on one patient typified this evolving approach induced by the TCAB initiative. An 81-year-old demented man was admitted for behavioral problems because the family could no longer handle him; he appeared destined to languish in the hospital. We have all taken care of patients like this, and difficulties in their management combined with no obvious disposition usually result in prolonged hospitalizations. The staff immediately saw this patient as an opportunity to work closely with the family. Making arrangements for the wife to spend time with the patient in the hospital and aggressively devising a care plan that involved the family resulted in the patient’s return home after just 4 days. The patient’s family was delighted with the care, and everybody on the unit shared a real sense of accomplishment.
A concrete example of using the white board for communication resulted in optimization of care for another gentleman who was admitted after a complicated bowel resection with a projected length of stay of 8–10 days according to the surgeon. The Two South staff worked closely with the surgeon and placed daily goals on the white board for all to see. Additionally, the nurses and patient were actively involved in the decision-making process, particularly with regard to increasing ambulation and decreasing narcotic use. This resulted in more rapid achievement of goals and recovery by the patient, with discharge from the unit occurring after just 4 days.
With the success of phase I at Kaiser Roseville, the staff anxiously set forth to participate in Phase II. Phase II increased the number of hospital sites to 13 and increased the rapid-cycle testing module. Ten areas of focused improvement were selected, including attempts to reduce unplanned transfers to the ICU and decreasing adverse events for hospitalized patients. During Phase II, Roseville developed its own Rapid Medical Response Team (RMRT). The RMRT is composed of the charge nurse for the ICU, a respiratory therapist, and a house supervisor. This team responds emergently at the request of any Medical-Surgical nurse to evaluate any patient about whom the nurse has concerns. These patients usually have a quickly evolving medical crisis such as respiratory distress, hypotension, or an altered level of consciousness. The primary goal of the RMRT is to quickly evaluate the patient, obtain physician support if needed, and stabilize the patient promptly on the floor or transfer them in a controlled fashion to the ICU. A secondary goal pertains to another TCAB aim, staff vitality, in that the medical-surgical nurse is now placed in a safe environment where he or she interacts with peers from the RMRT and gain additional critical thinking and physical assessment skills through that interaction. It is still early, as we just started the RMRT in September 2004, but the early data suggest we have significantly decreased transfers to the ICU, Code Blues outside the ICU, and unplanned mortality on the Medical-Surgical floors.
In an effort to minimize patient falls, Roseville instituted hourly safety rounds in which a direct care provider (RN, LVN, or NA) quickly looks at all the patients and their current status and implements a fall prevention protocol as needed. Another intervention they have adopted is the use of portable bed alarms, which alerts staff that a patient is attempting to get out of bed. The net result of this has been a dramatic reduction in the fall rate on the floor from a California average of 3.1 falls/thousand patient days to 0.8 falls/ thousand patient days on Two North, demonstrating expansion of the TCAB initiative to other floors in the hospital.
When the TCAB initiative was initiated at Roseville 18 months ago with the Robert Wood Johnson Foundation and the IHI, the Roseville staff had no idea of how much could be achieved—from enhancing patient care to improving both physician and nursing satisfaction to decreasing patient mortality. Although the TCAB initiative is viewed as an ongoing journey, the staff is eagerly anticipating the remainder of the voyage.
An example of an initiative at other hospitals among the 13 includes “peace and quiet time” at Long Island Jewish/North Shore. These nursing “magnet” hospitals discovered when they surveyed their patients that noise preventing patients from resting and recuperating was a major problem. Beginning with 30 minutes of enforced quiet time in the afternoon and then expanding to an hour, patients have reportedly been delighted with this. Snacks were passed out to the patients so they would buy into the initiative and believe they were not being ignored—a floor staff suggestion!
Another hospital modified the usual “multidisciplinary rounds” into highly functional, true patient rounds. At this hospital they originally were called “discharge rounds,” with a focus on discharging the patient. Recognizing that the patient had not been involved because these occurred in a conference room, they were renamed “patient care rounds” and moved out of the conference room to round in the patients’ rooms. Following the dictum of “nothing about the patient without the patient,” these rounds include a pharmacist, a social worker, the charge nurse, a nutritionist, a case manager, and the patient in the patients’ room. This team rounds on all the patients on the unit, seeing up to 37 patients in 1 hour! After initial difficulties involving the residents, they now have “firm directors,” so a physician is now involved. Based on this experience, they proclaim that their culture has changed from “no, it won’t work” to “why not try it?”
Hospitals and staff participating in TCAB are discovering just how successful they can be in achieving enhanced communication, implementing novel interventions to improve care, and optimizing the overall hospital experience for patients.
Time Management and the Hospitalist
Hospital medicine groups are becoming an integral part of healthcare delivery in the US. Since the term hospitalist was coined in 1996 by Robert Wachter, the U.S. has witnessed an amazing growth and development of inpatient programs. Physicians going into inpatient medicine experience impressive fluctuations in patient volume when new programs begin and when existing programs expand their primary referral base or comanage patients with subspecialists and surgeons.
Ideal patient volume numbers vary from group to group but range, on average, from 15 to 18 patients per hospitalist. Layered on the management of patients in the hospital is a myriad of duties the hospitalist must perform to effectively care for patients. Depending on program layout, hospitalists will also be involved in committee work, end-of-life discussions, protocol development, and measurement of data that links improvement of care when hospitalists are involved in caring for patients.
A good reason to talk about inpatient time management is that without it physicians can become overstressed. Physician burnout, job dissatisfaction, and high turnover with hospital medicine groups are major concerns, due in part to the increased demands placed on hospitalists. Small programs, especially, can experience great fluctuations in volume as they define their patient referral base, and deficient physician time management skills can be the main reason a program does not gain momentum.
Early in my training, I wondered if there was a better way to see patients and not feel stressed when new patients were admitted to my service. But it wasn’t until I started work with a healthcare organization in Wisconsin that I noticed there was a way to gain control of my busy day. I was introduced to time management principles by physicians who exercised this important skill everyday. These physicians did not seem stressed when the day seemed to be getting “out of control.” Their time management skills allowed them to stay efficient. After a few busy days, it didn’t take long for me to seek out information on time management and begin my own journey of self-assessment. At its core, that’s what time management is: an honest assessment of yourself. After learning about time management, I created a plan to assist me in getting through my day. Now, time management is automatic, an integral part of my ability to function on a busy inpatient floor. Time management is important for anyone who wants to achieve more control of his or her day, improve on work efficiency, set personal and professional goals, and, in my opinion, extend himself or herself in ways that don’t seem possible.
Some important terms to review include “goal,” “objective,” and “priority.” Goals are long-range and provide overall direction for an individual or a group. A good goal for a hospital medicine group is to be the premiere group in their state or their region. A good goal for a hospitalist is to implement an inpatient time management strategy. An objective is a clear-cut description of how to achieve a goal, and priorities are the ranked items in a goal or objective list. Priorities must be assigned to time management objectives. An exact order will ensure nothing is missed when working on a given objective.
The best way to tackle inpatient time management is to see how the day is laid out by keeping a time log and by performing an internal review of how a typical day marches out. When I performed my internal review I realized I looked at my day chopped into sections that were spent rounding, teaching, and discharging. I never discharged a patient in the morning. I saved all my discharges until the afternoon. I knew discharges required more time, and I felt better seeing patients first and then going back and doing discharges. I wasn’t being efficient with this method, because I always felt tired in the afternoon.
There were different categories of patients: new admits from the previous night, discharges, routine patients, and critical patients. Critical patients received my highest priority, and discharges received the least priority. I was looking at critical patients differently than my discharges. Processing the ICU patients meant more thinking, diagnosing, and reviewing, whereas discharging meant dictating, writing prescriptions, educating patients, and making PCP call-backs. I wasn’t looking at each process in terms of time; rather, I was looking at discharges as a final step and the ICU as a place where all my energy had to be placed. I wasn’t making the connection with time and how I was comparing patients being discharged with patients in the ICU.
Energy level and task demands, in relationship to productive time, can be graphed (Figure 1). Energy level is highest in the morning, and tasks march out throughout the day. At the intersection, the time is usually noon for hospitalists. Energy level begins to dip after this time. The most productive time is in the early morning with a plateau around noon. This is why I felt tired in the afternoon, having important discharges to finish.
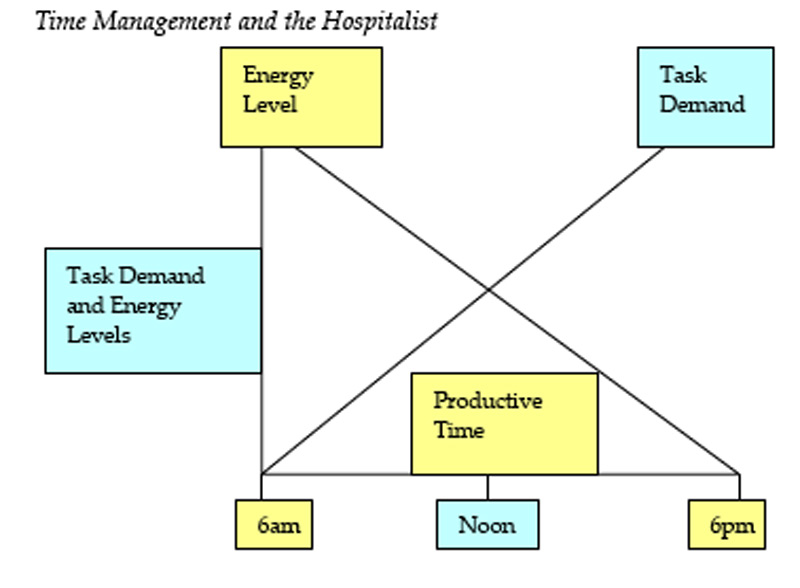
Once I made the connection that discharges take time and ICU patients take time, I knew I had to revamp how I saw patients. The most time-consuming patients need to be seen first when my energy level is high.
My new routine was to see the ICU patients first, new admissions second, and discharges third, all before noon. This new plan allowed me to begin seeing routine patients earlier. For my routine patients, I review the chart, look at lab and imaging tests ordered, and then go into the room and examine the patient. The difference with these patients is that I wait to write my final impression and discussion section until after I’ve seen all the routine patients. Then I go back and write my final notes. The rest of the day is concentrated on finishing notes, PCP call-backs, billing, family conferences, new admissions, and emergencies.
A good way to look at inpatient work is in sets of blocks. (Figure 2) Within each block are the duties of the hospitalist. Blocks are prioritized in order of importance. Within the prioritized blocks are the “absolute” duties that a hospitalist must perform each day. They include patient care (new and existing), billing capture, and multidisciplinary care conferences. After the absolutes come duties that are routinely performed, including patient and nonpatient functions such as PCP call-backs, family conferencing, resident teaching, and time interrupters. Inpatient blocks can be stacked, with the first layer containing the absolutes and the subsequent layers containing the regular duties or tasks.
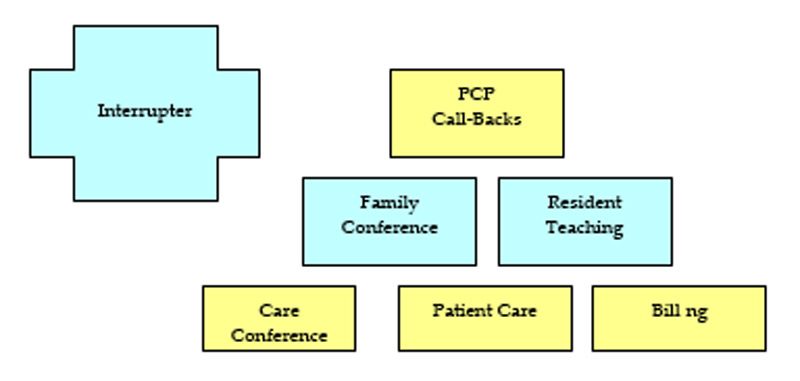
Interrupters are time delays that take a busy hospitalist away from absolute and regular work tasks. They are polygonal and can be placed anywhere along the blocks. Interrupters may be new patients, an established patient with an emergency, an outside physician trying to contact the service, a spouse, the medical records department, a funeral home inquiring about a death certificate, a home health agency trying to get certification for a patient’s wheelchair or a subspecialist, for example.
An ideal day shows the blocks in perfect formation, pyramid style. A day with interruptions will result in the blocks appearing disorganized. The ability to recognize time interrupters and to have a plan to deal with them is the key to managing a busy inpatient service. Any plan developed must use patient care as the focus. Everything the hospitalist does is centered on this block, and priorities can be developed to keep it focused.
Interruptions are a part of any busy inpatient service. Interrupters need to be prioritized, and a system needs to be in place for handling them with any good time management plan. Code Blue response, emergency patient need, and new patients on the floor rank high in priority for interrupters. Phone interruptions and nursing questions are ranked based on urgency and patient impact. One of the best ways to avoid too many phone interruptions is to have a coordinator or secretary assist with filtering incoming calls. This person will have specific instructions on how calls are to be handled. Emergency calls and incoming calls from physicians are given priority. A call from a drug representative or friend can be postponed.
A good rule to have when seeing new patients on the floor is to visualize each new patient coming onto the service. ER physicians visualize each patient coming into the ED arena. By direct visualization of incoming patients, ER physicians determine what their level of involvement will be. A patient who appears ill will get a quicker evaluation than a patient who appears stable. Principles that underlie patient triage include meeting the patient and identifying oneself as the responsible physician, visualization of the patient even while interviewing others, and communication and delegation of work.
Talking to an ED physician about a patient or to a PCP at an outreach facility is helpful, but the direct visualization of the patient by the hospitalist when he or she arrives on the ward is key to managing floor time. This method allows for patients to be prioritized based on acuity. Direct visualization can also be performed before resident contact is initiated. A quick look at the patient and his or her vitals provides reassurance that nothing immediate needs to be performed. A brief hospitalist introduction gives comfort to the patient and family. Patients are impressed when you meet them in their room when they arrive.
Critical patients require more attention, and care can be started with a primary survey. Trauma services have modes of triage care and initial evaluations of trauma patients that can be modified by hospitalists.
The objectives of initial trauma care include 1) stabilization, 2) identification of life-threatening injuries and initiation of adequate supportive therapy, and 3) efficient and rapid organization of either definitive therapy or transfer to a facility that provides definite therapy. Within this set of objectives is a triage objective to prioritize patients with a high likelihood of early deterioration.
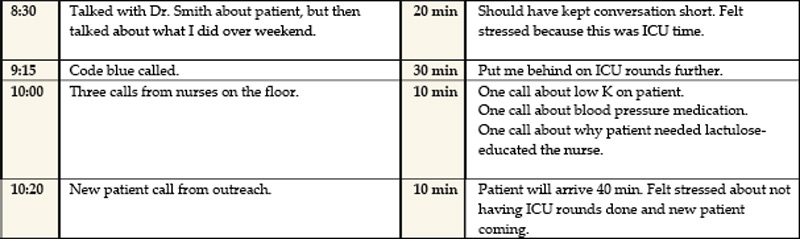
Direct hospitalist visualization of every patient coming onto the service accomplishes the objectives of initial care and triage. Of course, the hospitalist isn’t prioritizing a gunshot wound patient, but the principles are the same: visualizing the patient, determining a level of involvement, and initiating a primary survey for critical patients. This approach to patients can be adopted in the hospitalist patient-care repertoire.
As an example, I was asked to consult on a patient with a subarachnoid bleed to manage hypertension. The patient was already admitted into the ICU by the neurosurgeon. Subarachnoid bleed and hypertension are 2 urgent needs, and this was a new patient on my service. I went to visualize the patient. I finished my brief survey and was writing down some orders when the nurse came over to me and told me the patient was not responding to her the way he had earlier. The patient’s admitting blood pressure was 180/100 and when the nurse reported the change to me, the blood pressure was 230/106. The patient was obtunded and unable to protect his airway. In addition to intubating the patient and hyperventilating him, I contacted the neurosurgeon to notify him of the change in status, started intravenous mannitol, established large bore venous access, and started nitroprusside. The surgeon returned to the ICU and took the patient for corrective surgery.
When the nurse alerted me to the change in status with the patient, I performed actions based on my survey, stabilized the patient, identified a threat, provided supportive care, and contacted the person who would be able to provide definitive treatment. I was able to do this because of the discipline provided to me with time management and by prioritizing an interrupter.
Developing a system to flexibly see new patients and provide quick surveys should be a focus for any hospitalist. By doing this, the hospitalist is providing the plan for how the day will flow, regardless of interruptions. The plan, the objectives, and the priorities are there to ensure a day happens the way the physician wants it to happen.
Time management courses and books usually recommend that people complete a daily log of how and what they do in the course of their day. (Figure 3) The daily log is an honest portrayal of the day as it unfolds and how one responds to events as they happen. Logs include phone calls to friends, stockbrokers, and spouses. Each hospitalist’s log notes when a patient or family conference occurred, when interruptions occurred, and how they were handled. Taking coffee breaks, reading a paper, and talking to a partner are all fair game in the log. Everything needs to be put in the log. Keeping a log for 1 or 2 days is a great exercise with endless ways of showing people where their time and energy is going. I encourage physicians who ask me what some of my secrets are to getting done early to read a book on time management or attend a course.
When I took my first time management course in 1998, I became an instant student of my time and an observer of how others mange their time. I didn’t realize how incredible a force time management was, because I thought it was mainly for business people. A course may range from the implementation of a few basic strategies to a complete revamp of how the day is structured, but any hospitalist can benefit from time management techniques.
Dr. Houser can be contacted at houserr@siouxvalley.org.
Reading List
- Mackenzie A. The Time Trap: The Classic Book on Time Management. New York, NY: AMACOM; 1997.
- Lane, B and Rierdan, R. Managing People-A Practical Guide. Oasis Press. 2001.
- Wachter R. The emerging role of “hospitalists” in the American health care system, N Engl J Me. 1996;335:514-7.
- Dries DJ. Initial evaluation of the trauma patient. www.eMedicine.com, 2004.
Hospital medicine groups are becoming an integral part of healthcare delivery in the US. Since the term hospitalist was coined in 1996 by Robert Wachter, the U.S. has witnessed an amazing growth and development of inpatient programs. Physicians going into inpatient medicine experience impressive fluctuations in patient volume when new programs begin and when existing programs expand their primary referral base or comanage patients with subspecialists and surgeons.
Ideal patient volume numbers vary from group to group but range, on average, from 15 to 18 patients per hospitalist. Layered on the management of patients in the hospital is a myriad of duties the hospitalist must perform to effectively care for patients. Depending on program layout, hospitalists will also be involved in committee work, end-of-life discussions, protocol development, and measurement of data that links improvement of care when hospitalists are involved in caring for patients.
A good reason to talk about inpatient time management is that without it physicians can become overstressed. Physician burnout, job dissatisfaction, and high turnover with hospital medicine groups are major concerns, due in part to the increased demands placed on hospitalists. Small programs, especially, can experience great fluctuations in volume as they define their patient referral base, and deficient physician time management skills can be the main reason a program does not gain momentum.
Early in my training, I wondered if there was a better way to see patients and not feel stressed when new patients were admitted to my service. But it wasn’t until I started work with a healthcare organization in Wisconsin that I noticed there was a way to gain control of my busy day. I was introduced to time management principles by physicians who exercised this important skill everyday. These physicians did not seem stressed when the day seemed to be getting “out of control.” Their time management skills allowed them to stay efficient. After a few busy days, it didn’t take long for me to seek out information on time management and begin my own journey of self-assessment. At its core, that’s what time management is: an honest assessment of yourself. After learning about time management, I created a plan to assist me in getting through my day. Now, time management is automatic, an integral part of my ability to function on a busy inpatient floor. Time management is important for anyone who wants to achieve more control of his or her day, improve on work efficiency, set personal and professional goals, and, in my opinion, extend himself or herself in ways that don’t seem possible.
Some important terms to review include “goal,” “objective,” and “priority.” Goals are long-range and provide overall direction for an individual or a group. A good goal for a hospital medicine group is to be the premiere group in their state or their region. A good goal for a hospitalist is to implement an inpatient time management strategy. An objective is a clear-cut description of how to achieve a goal, and priorities are the ranked items in a goal or objective list. Priorities must be assigned to time management objectives. An exact order will ensure nothing is missed when working on a given objective.
The best way to tackle inpatient time management is to see how the day is laid out by keeping a time log and by performing an internal review of how a typical day marches out. When I performed my internal review I realized I looked at my day chopped into sections that were spent rounding, teaching, and discharging. I never discharged a patient in the morning. I saved all my discharges until the afternoon. I knew discharges required more time, and I felt better seeing patients first and then going back and doing discharges. I wasn’t being efficient with this method, because I always felt tired in the afternoon.
There were different categories of patients: new admits from the previous night, discharges, routine patients, and critical patients. Critical patients received my highest priority, and discharges received the least priority. I was looking at critical patients differently than my discharges. Processing the ICU patients meant more thinking, diagnosing, and reviewing, whereas discharging meant dictating, writing prescriptions, educating patients, and making PCP call-backs. I wasn’t looking at each process in terms of time; rather, I was looking at discharges as a final step and the ICU as a place where all my energy had to be placed. I wasn’t making the connection with time and how I was comparing patients being discharged with patients in the ICU.
Energy level and task demands, in relationship to productive time, can be graphed (Figure 1). Energy level is highest in the morning, and tasks march out throughout the day. At the intersection, the time is usually noon for hospitalists. Energy level begins to dip after this time. The most productive time is in the early morning with a plateau around noon. This is why I felt tired in the afternoon, having important discharges to finish.
Once I made the connection that discharges take time and ICU patients take time, I knew I had to revamp how I saw patients. The most time-consuming patients need to be seen first when my energy level is high.
My new routine was to see the ICU patients first, new admissions second, and discharges third, all before noon. This new plan allowed me to begin seeing routine patients earlier. For my routine patients, I review the chart, look at lab and imaging tests ordered, and then go into the room and examine the patient. The difference with these patients is that I wait to write my final impression and discussion section until after I’ve seen all the routine patients. Then I go back and write my final notes. The rest of the day is concentrated on finishing notes, PCP call-backs, billing, family conferences, new admissions, and emergencies.
A good way to look at inpatient work is in sets of blocks. (Figure 2) Within each block are the duties of the hospitalist. Blocks are prioritized in order of importance. Within the prioritized blocks are the “absolute” duties that a hospitalist must perform each day. They include patient care (new and existing), billing capture, and multidisciplinary care conferences. After the absolutes come duties that are routinely performed, including patient and nonpatient functions such as PCP call-backs, family conferencing, resident teaching, and time interrupters. Inpatient blocks can be stacked, with the first layer containing the absolutes and the subsequent layers containing the regular duties or tasks.
Interrupters are time delays that take a busy hospitalist away from absolute and regular work tasks. They are polygonal and can be placed anywhere along the blocks. Interrupters may be new patients, an established patient with an emergency, an outside physician trying to contact the service, a spouse, the medical records department, a funeral home inquiring about a death certificate, a home health agency trying to get certification for a patient’s wheelchair or a subspecialist, for example.
An ideal day shows the blocks in perfect formation, pyramid style. A day with interruptions will result in the blocks appearing disorganized. The ability to recognize time interrupters and to have a plan to deal with them is the key to managing a busy inpatient service. Any plan developed must use patient care as the focus. Everything the hospitalist does is centered on this block, and priorities can be developed to keep it focused.
Interruptions are a part of any busy inpatient service. Interrupters need to be prioritized, and a system needs to be in place for handling them with any good time management plan. Code Blue response, emergency patient need, and new patients on the floor rank high in priority for interrupters. Phone interruptions and nursing questions are ranked based on urgency and patient impact. One of the best ways to avoid too many phone interruptions is to have a coordinator or secretary assist with filtering incoming calls. This person will have specific instructions on how calls are to be handled. Emergency calls and incoming calls from physicians are given priority. A call from a drug representative or friend can be postponed.
A good rule to have when seeing new patients on the floor is to visualize each new patient coming onto the service. ER physicians visualize each patient coming into the ED arena. By direct visualization of incoming patients, ER physicians determine what their level of involvement will be. A patient who appears ill will get a quicker evaluation than a patient who appears stable. Principles that underlie patient triage include meeting the patient and identifying oneself as the responsible physician, visualization of the patient even while interviewing others, and communication and delegation of work.
Talking to an ED physician about a patient or to a PCP at an outreach facility is helpful, but the direct visualization of the patient by the hospitalist when he or she arrives on the ward is key to managing floor time. This method allows for patients to be prioritized based on acuity. Direct visualization can also be performed before resident contact is initiated. A quick look at the patient and his or her vitals provides reassurance that nothing immediate needs to be performed. A brief hospitalist introduction gives comfort to the patient and family. Patients are impressed when you meet them in their room when they arrive.
Critical patients require more attention, and care can be started with a primary survey. Trauma services have modes of triage care and initial evaluations of trauma patients that can be modified by hospitalists.
The objectives of initial trauma care include 1) stabilization, 2) identification of life-threatening injuries and initiation of adequate supportive therapy, and 3) efficient and rapid organization of either definitive therapy or transfer to a facility that provides definite therapy. Within this set of objectives is a triage objective to prioritize patients with a high likelihood of early deterioration.
Direct hospitalist visualization of every patient coming onto the service accomplishes the objectives of initial care and triage. Of course, the hospitalist isn’t prioritizing a gunshot wound patient, but the principles are the same: visualizing the patient, determining a level of involvement, and initiating a primary survey for critical patients. This approach to patients can be adopted in the hospitalist patient-care repertoire.
As an example, I was asked to consult on a patient with a subarachnoid bleed to manage hypertension. The patient was already admitted into the ICU by the neurosurgeon. Subarachnoid bleed and hypertension are 2 urgent needs, and this was a new patient on my service. I went to visualize the patient. I finished my brief survey and was writing down some orders when the nurse came over to me and told me the patient was not responding to her the way he had earlier. The patient’s admitting blood pressure was 180/100 and when the nurse reported the change to me, the blood pressure was 230/106. The patient was obtunded and unable to protect his airway. In addition to intubating the patient and hyperventilating him, I contacted the neurosurgeon to notify him of the change in status, started intravenous mannitol, established large bore venous access, and started nitroprusside. The surgeon returned to the ICU and took the patient for corrective surgery.
When the nurse alerted me to the change in status with the patient, I performed actions based on my survey, stabilized the patient, identified a threat, provided supportive care, and contacted the person who would be able to provide definitive treatment. I was able to do this because of the discipline provided to me with time management and by prioritizing an interrupter.
Developing a system to flexibly see new patients and provide quick surveys should be a focus for any hospitalist. By doing this, the hospitalist is providing the plan for how the day will flow, regardless of interruptions. The plan, the objectives, and the priorities are there to ensure a day happens the way the physician wants it to happen.
Time management courses and books usually recommend that people complete a daily log of how and what they do in the course of their day. (Figure 3) The daily log is an honest portrayal of the day as it unfolds and how one responds to events as they happen. Logs include phone calls to friends, stockbrokers, and spouses. Each hospitalist’s log notes when a patient or family conference occurred, when interruptions occurred, and how they were handled. Taking coffee breaks, reading a paper, and talking to a partner are all fair game in the log. Everything needs to be put in the log. Keeping a log for 1 or 2 days is a great exercise with endless ways of showing people where their time and energy is going. I encourage physicians who ask me what some of my secrets are to getting done early to read a book on time management or attend a course.
When I took my first time management course in 1998, I became an instant student of my time and an observer of how others mange their time. I didn’t realize how incredible a force time management was, because I thought it was mainly for business people. A course may range from the implementation of a few basic strategies to a complete revamp of how the day is structured, but any hospitalist can benefit from time management techniques.
Dr. Houser can be contacted at houserr@siouxvalley.org.
Reading List
- Mackenzie A. The Time Trap: The Classic Book on Time Management. New York, NY: AMACOM; 1997.
- Lane, B and Rierdan, R. Managing People-A Practical Guide. Oasis Press. 2001.
- Wachter R. The emerging role of “hospitalists” in the American health care system, N Engl J Me. 1996;335:514-7.
- Dries DJ. Initial evaluation of the trauma patient. www.eMedicine.com, 2004.
Patient Satisfaction: the Hospitalist's Role
Introduction
Patient satisfaction is a highly desirable outcome of clinical care in the hospital and may even be an element of health status itself (1). A patient’s expression of satisfaction or dissatisfaction is a judgment on the quality of hospital care in all of its aspects. Whatever its strengths and limitations, patient satisfaction is an indicator that should be indispensable to the assessment of the quality of care in hospitals.
The word “hospital” comes from the Latin for both “guest” and “host,” and the true spirit of hospitality is at the core of the hospital experience (2). The original mission of hospitals was to serve as houses of mercy, refuge, and dying for pilgrims returning from the Holy Land at the time of the late Christian antiquity (3). The striving to please patients is in harmony with the service calling of medicine and is certainly the right thing to do.
Current Reality
From the patient’s perspective, hospitals can be scary and unfriendly places. The American Hospital Association’s Reality Check (4) evaluated the public’s perceptions of hospitals and hospital care using a time-honored technique of asking focus group participants to imagine that the hospital was an animal and a car. Two out of 3 respondents chose animals that would be seen as aggressive, scary, or lumbering to suggest traits such as arrogance, uncontrolled power, and sluggishness. For cars, no respondent chose the Toyota Camry or any other model that would likely make the Consumer Reports list of best values. Instead, the cars chosen were representatives of unreasonable overpricing, waste, and outdated engineering.
“Imagine that the hospital is …”
A Car
“Volkswagen bus...Old, very noisy, just not a real great car.”
“A Rolls Royce, because of the expense.”
“A Pinto, because it was run down.”
“Ford Escort, just barely passing the test.”
“A Cadillac…big and expensive.”
An Animal
“A bear…a grizzly…horrible.”
“Elephant…large…cumbersome.”
“A leech.…I’m sure all hospitals aren’t that lowly.”
“A snake, kind of slithery and sneaky, because of what hospitals charge.”
The same AHA survey showed that patients felt that insurance companies and not physicians were in charge of their care in the hospital. A follow-up question revealed that patients clearly want to be in charge of their own hospital care. Additionally, patients do not see hospitals as part of a planned or consumer-focused health care system. In fact, they see quite the opposite: a confusing, expensive, unreliable, and often impersonal disassembly of medical professionals and institutions. If they see any system at all, it is one devoted to maximizing profits by blocking access, reducing quality, and limiting spending, all at the expense of the patient.
The American Customer Satisfaction Index (5) gave hospitals an overall 67% satisfaction rating, ranking 27th out of 31 industries. This ranking placed hospitals 10 percentage points below the tobacco industry and just above the Internal Revenue Service. A National Coalition on Health Care survey (6) found that 80% of respondents believe hospitals cut corners to save money, and 77% believe that these cuts have endangered patients. Quality of care and patient safety have become significant public concerns recently. “To Err is Human,” the 1999 report from the Institute of Medicine, highlighted the potential for serious injury and death in U.S. hospitals (7). Estimates are that 44,000 to 98,000 Americans die each year in hospitals as a result of medical errors and unsafe practices.
Patient Satisfaction Is Important
Patient satisfaction is the health care recipient’s reaction to aspects of his or her service experience (8). Patient satisfaction belongs to the service dimension as opposed to the technical dimension of quality of care. Most patients report few problems related to technical quality of care in hospitals and moreover do not feel qualified to judge technical quality and therefore assume technical competence (9).
From 1986 to 1992, the Health Care Financing Administration publicly reported hospital mortality rates as an effort to aid consumers in selecting hospitals (10). Hospitals with over twice the expected mortality rate saw very little change in volume during that time. Patients do not seem to be affected by morbidity and mortality statistics but more by personal stories of care. Patient perception of quality is assessed through dimensions of what is personally valued, and often they do not distinguish between the provider of the service and the service received.
Being treated with respect and dignity and involvement in treatment decisions are intangible issues of patient satisfaction that are paramount issues for patients (11).
As many as one quarter of 13,000 patients discharged from 51 Massachusetts hospitals reported problems with patient satisfaction issues such as the involvement of families in their care, communication and coordination of care, and the transition from hospital to home (12). Patients who had been admitted to academic health centers and teaching hospitals generally reported more problems than those cared for in community hospitals. As it turns out, service outcomes such as patient satisfaction drive market share and profitability for hospitals (13). With the average medical/surgery hospital charge amounting to $12,083, hospitals cannot afford to lose patients and, therefore, revenue due to issues of patient dissatisfaction (14). Recruiting new patients as customers is 5 times more costly than retaining an existing customer base (15).
There is compelling evidence from well-developed lines of research demonstrating that increasing patient satisfaction improves clinical outcomes, such as functional status and physiologic measures of health (16,17). Finally, it is important for clinicians to know that it has been clearly demonstrated that satisfied patients improve physician satisfaction (18,19).
Psychology of Satisfaction
To create a culture of customer service excellence in hospitals and achieve outstanding patient satisfaction, it is necessary to understand the intangible aspects of perception and expectation that contribute to patient satisfaction. The “First Law of Service” provides a useful, simple mathematical model of satisfaction (20). The formula for this model is Satisfaction = Perception – Expectation. If a patient’s perception of their hospital experience meets or exceeds the expectation, there will be a corresponding degree of satisfaction. However, if the perception does not meet the expectation, there will be resulting dissatisfaction. Thus, patient satisfaction results from meeting or exceeding patients’ expectations. Patient perceptions of care can be measured directly from patient satisfaction surveys, focus groups, and telephone surveys. A hospital’s reputation and market share are indirect measurements of patient perceptions. There are 2 main directions in which patient satisfaction can be influenced: by working on what the patient perceives and on what the patient expects.
Expectations are integral to the experience of being a customer. There has been confusion and controversy in health care as to whether patients are in fact customers. This confusion may be at the root of the overall service failing of hospitals (21). “The more horizontal they are, the more they are a patient. The more vertical they are, the more they are a customer” (22). Using a technical definition, a customer is anyone who has expectations about process operations or outputs (23). Therefore, all patients are customers, but not all customers are patients (21). Hospitals have a whole list of primary and secondary customers, each of whom has his or her own set of expectations. Patients and their families can be seen as primary customers, and referring physicians, third-party payers, external overseers, communities, shareholders, and employees are all secondary customers of hospitals.
Expectations are psychological phenomena that can be defined as beliefs created and sustained by cognitive processes (24). Expectations of patients as hospital customers rise from past experiences of their own or of others, as well as from current needs and unique internal preferences that form the basis of a value system. Expectations cannot be mandated, because they are based in self-gratification. However, expectations may change over time, and, very importantly, they can be measured and perhaps modified through education. For most people, illness and hospitalization is a rare event. Patients will know something is wrong and that treatment is needed, but most won’t know the nature of their disease, the diagnostic and therapeutic options, and the likely outcomes. Therefore, patients seek out health care professionals who have the opportunity to inform them on what to expect as a way to begin the process of managing expectations.
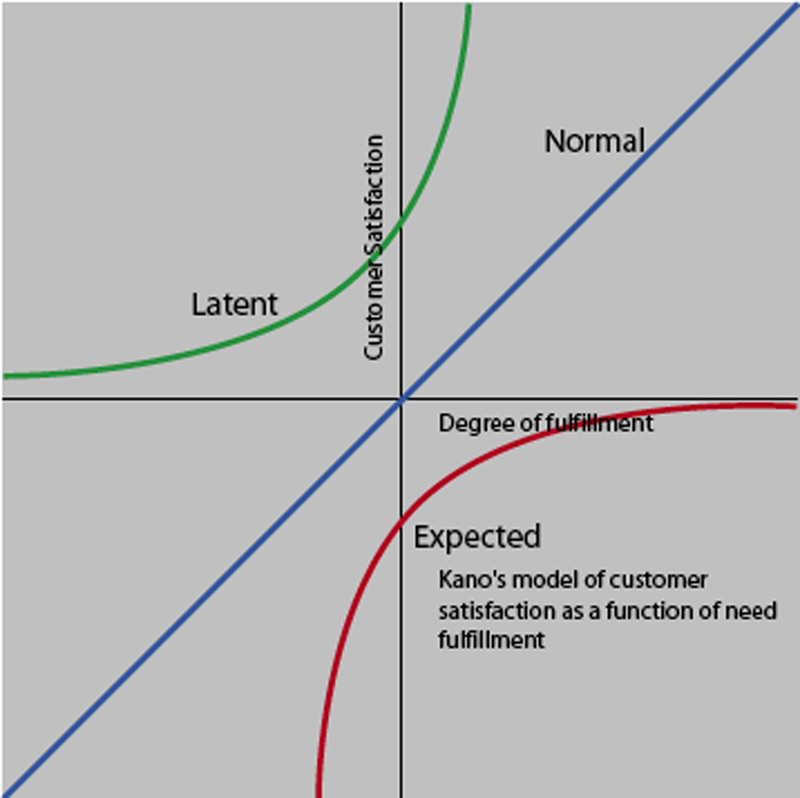
The Kano Model
The Kano Model provides a useful tool for studying different levels of patient expectations (23).
This model is useful to examine the voice of the customer in the relationship between satisfaction and quality, and it is relevant for hospital encounters. According to the model, patients will have a basic set of subconscious expectations about their care that will be taken for granted. These expectations are so routine and expected that patients don’t recognize them as comparative quality factors, but they will be shocked if they are absent. For example, patients assume that physicians are basically competent, and that hospitals are capable of providing safe, courteous, lifesaving medical care (25). Although these expectations are in the patient’s subconscious, if they are not met, the patient will be dissatisfied. Providing this level of basic quality isn’t necessarily enough to create satisfied patients.
There is a normal level of service that patients consciously consider, they have to do with the anticipated issues of hospital care related to access, wait times, scheduling, and billing. The model shows that satisfaction increases as more of these expectations are met and that patients will be dissatisfied if these quality expectations are not met. Patients use comparisons of these expectations to recognize differences among competitors and to make choices.
The latent quality curve lies entirely in the satisfaction region and represents supraconscious, unexpected quality items that patients didn’t know they wanted and result in a delightful surprise when present. In this experience, patients receive more than they had expected, often as the result of innovation that can raise patient expectations and provide a significant competitive advantage. The data from hospitals show that this is achieved primarily through the patient’s perception of personalized, customized service, provided by caring and concerned clinicians (26).
There is a tremendous opportunity in hospital care to modify patient expectations through education and to create high levels of patient satisfaction. Hospitals that are successful in this endeavor will have a significant competitive advantage. Hospital patients have a whole list of issues about which they have expectations: the smoothness of the admission and discharge process, accuracy and clarity of billing statements, courtesy of hospital employees, response time for calls and requests, the level of technology available in the hospital, nurse competency, taste and temperature of the food, and price. Most of these issues are not directly related to clinical care and certainly not under the control or influence of the hospitalist. What are the expectations that patients have for their clinical care by hospitalists, and how can we give it to them?
The Hospitalist as a Caring and Concerned Clinician
A useful model to define the hospitalist’s role in patient satisfaction is that of a caring and concerned clinician. This caring and concern for patients is exemplified by attentiveness, dignity and respect, effective information transfer, and shared decision making (23).
The outcome service chain for hospitals begins with the patient’s perception of caring and concerned clinicians who demonstrate these attributes of attentiveness, dignity and respect, effective information transfer, and shared decision making. This leads to the degree of patient satisfaction and loyalty that results in patients who will return to the hospital, seek related business, and refer additional business. This drives market share and financial success for hospitals (9).
The characteristics of the caring and concerned clinician begin with attentiveness. This is the practice of establishing a person-to-person connection with patients and involves attending to them as unique individuals and not just in their role as patients. The constant interruptions that occur in physician/patient encounters, control issues, discontinuity of care, and the often overwhelming complexity of a patient’s illness can be obstacles to the perception of attentiveness that result in patients feeling connected with the clinician. Some effective tools for attentiveness are demonstrating curiosity about the patient as a person, using open-ended questions to gather clinical data, orienting patients to the process of care, and actively eliciting a patient’s agenda for their care and then summarizing their concerns.
The demonstration of dignity and respect results in a patient’s feeling understood and accepted as a person. This is the practice of empathy, which is often confused with sympathy (27). Sympathy is an expression of one’s own feelings (“I’m sorry”). Empathy is the demonstration of an understanding of the patient’s feelings (“You must be very sad”). The confusion of medical terminology as well as the time constraints of modern hospital-care encounters can be obstacles to achieving the type of dignity and respect that results in a high degree of patient satisfaction. A number of effective tools are available to facilitate this important result. Sitting down during patient encounters greatly enhances the perception of time and caring of hospitalists on the part of patients. Eye contact and appropriate touch are demonstrations of dignity and respect, as is seeing patients fully clothed. It is important to pay attention to nonverbal communication issues with patients. An important element of how hospitalists are perceived by patients has to do with nonverbal issues such as demeanor, body posture, and verbal tone. Using a patient’s own words and addressing underlying feelings facilitates the practice of dignity and respect (28). Patients perceive statements of assured understanding as confirmation that they have been listened to. Remember the words of Sir William Osler: “Listening is unspoken caring.”
The effective transfer of information is at the core of physician/patient communication (29). Patients have the need to provide complete information to physicians to facilitate an accurate diagnosis. The physician’s role is to provide information that addresses the cognitive, behavioral, and affective needs of patients and their families concerning their illness. The discrepancy of language, time constraints, and the ability of patients to remember are all barriers to the effective transfer of information. Some useful techniques for effective information transfer include assessing a patient’s current level of understanding and asking about their self-diagnosis. Timeliness in providing results of diagnostic tests is an important issue to patients who are often waiting expectantly. Studies have shown that the majority of patients have questions about the so-called “mysteries of medicine,” related to the diagnosis, etiology, and prognosis of their illness (30).
Patients may not specifically ask these questions; however, they are present, and patient satisfaction will increase if these questions are answered. Patients have decisively indicated their desire for shared decision making regarding their health care and for patient and family control of all-important choices (26). The process of shared decision making can be facilitated by collaboration between patients and the hospitalist around goals ands plans for treatment in the hospital (31). A barrier to shared decision making is a patient/physician relationship based on a model of paternalism (“I’m the doctor, and I know best”). A more productive model for the therapeutic relationship is that of a partnership between the hospitalist and the patient, particularly in the present era of web-educated, sophisticated consumer patients.
An important tool to achieving this type of collaboration involves the approach of presenting patients and families with treatment options and then actively soliciting patient preferences. A question is whether patients will actively participate in treatment decisions and then adhere to treatment plans. This is in large part determined by the interpersonal relationship skills of the clinician and can be further facilitated with simplified regimens that have been agreed upon by the patient and the hospitalist (32).
A complete model of the hospital-care encounter provided by hospitalists has an opening and a closing. In between there is a series of moments of truth that can potentially be imbued with attentiveness, dignity and respect, effective information transfer, and shared decision making. The opening is a brief moment that will set the stage for the remainder of the encounter. Greeting patients by name and maintaining eye contact will help in establishing the early perception of being a caring and concerned clinician. It is important to close hospital encounters with a sense of hope and optimism, making sure that all of the patient’s issues have been addressed, as well as planning for the next steps.
The development and growth of hospital medicine is the latest site-specific evolution of practice specialization and focuses on the complex care of hospitalized patients. Hospitalists spend most of their professional time in the hospital providing care for general medical patients and are well positioned and uniquely committed to improving the care of hospitalized patients. Exceptional patient satisfaction is a key outcome that should result from the care provided by hospitalists.
References
- Donabedian A. The quality of care. How can it be assessed? JAMA. 1988;260:1743-8.
- Zaleski P. Knights Hospitaller: the rise and fall of a chivalric order of Christian caregiving. Parabola. 1990;15:55-62.
- Risse GB. Mending Bodies, Saving Souls. New York, NY: Oxford University Press; 1999.
- Reality Check: Public Perceptions of Health Care and Hospitals. The American Hospital Association. 1996.
- Now are you satisfied? Fortune. February 1998:166.
- National Coalition on Health Care. How Americans perceive the health care system. www.nchc.org/perceive.html. Accessed August 2004.
- To Err Is Human: Building a Safer Health Care System. Committee on Quality of Health Care in America, Institute of Medicine. Washington, DC: National Academy Press; 1998.
- Pascoe GC. Patient satisfaction in primary health care: a literature review and analysis. Eval Prog Plann. 1983;6:185-210.
- Kenagy JW, Berwick DM, Shore MF. Service quality in heath care. JAMA. 1999;281:661-5.
- Mennemeyer ST, Morrisey MA, Howard LZ. Death and reputation: how consumers acted upon HCFA mortality information. Inquiry. 1997;34:117-28.
- Cleary PD, Edgman-Levitan S. Health care quality. Incorporating consumer perspectives. JAMA. 1997;278:1608-12.
- Rogers G, Smith DP. Reporting comparative results from hospital surveys. Int J Qual Health Care. 1999;11:251-9.
- Schlesinger LA, Heskett JL. The service-driven service company. Harvard Business Review. 1991;Sept-Oct:1-19.
- Modern Health care. 2000;May:70.
- Mittal B, Lassar W. Why do customers switch? The dynamics of satisfaction versus loyalty. Journal of Services Marketing. 1998;12:177-191.
- Greenfield S, Kaplan S, Ware WE Jr. Expanding patient involvement in care: Effects on patient outcomes. Ann Intern Med. 1985;102:520-8.
- Sobel DS. Rethinking medicine: improving health outcomes with cost-effective psychosocial interventions. Psychosom Med. 1995;57:234-44.
- Novack DH, Suchman AL, Clark W, Epstein RM, Najberg E, Kaplan C. Calibrating the physician. Personal awareness and effective patient care. Working Group on Promoting Physician Personal Awareness, American Academy on Physician and Patient. JAMA. 1997;278:502-9.
- Suchman AL, Roter D, Green M, Lipkin M Jr. Physician satisfaction with primary care office visits. Collaborative Study Group of the American Academy on Physician and Patient. Med Care. 1993;31:1083-92.
- Maister DH. The Psychology of Waiting Lines. Case No. 9-684-064. Boston, Mass: Harvard Business School Publishing; 1984.
- Fottler MD, Ford RC, Heaton CP. Achieving Service Excellence. Chicago, Ill.: Health Administration Press; 2002.
- Mayer T, Cates RJ. Service excellence in health care. JAMA. 1999;282:1281-83.
- James BC. Curing vs. Caring: The Art of Service Quality. Institute for Health Care Delivery Research. Intermountain Health Care. Salt Lake City, Utah; 2003.
- Thompson AG, Sunol R. Expectations as determinants of patient satisfaction: concepts, theory and evidence. Int J Qual Health Care. 1995;7:127-41.
- Larson CO, Nelson EC, Gustafson D, Batalden PB. The relationship between meeting patient’s information needs and their satisfaction with hospital care and general health status outcomes. Int J Qual Health Care. 1996;8:447-56.
- Gerteis M, Edgman-Levitan S, Daley J, Deblanco T, eds. Through the Patient’s Eyes. San Francisco, Calif.: Jossey-Bass; 1993.
- Spiro H, Peschel E, Curnen MG, St. James D, eds. Empathy and the Practice of Medicine: Beyond Pills and the Scalpel. New Haven, Conn.: Yale University Press; 1993.
- Branch WT, Malik TK. Using ‘windows of opportunities’ in brief interviews to understand patients’ concerns. JAMA. 1993;269:1667-68.
- Worthlin Group. Communication and the physician/patient relationship: A physician and communication survey. Bayer Institute for Health Care Communication. New Haven, CT; 1995.
- Clinician Patient Communication to Enhance Health Outcomes. Bayer Institute for Health Care Communication Workshop. Bayer Institute, New Haven, Conn.; 1999.
- Donovan J, Blake R. Patient non-compliance: deviance or reasoned decision-making? Soc Sci Med. 1992;34:507-13.
- DiMatteo MR, Reiter RC, Gambone JC. Enhancing medication adherence through communication and informed collaborative choice. Health Commun. 1994;6:253-65.
Introduction
Patient satisfaction is a highly desirable outcome of clinical care in the hospital and may even be an element of health status itself (1). A patient’s expression of satisfaction or dissatisfaction is a judgment on the quality of hospital care in all of its aspects. Whatever its strengths and limitations, patient satisfaction is an indicator that should be indispensable to the assessment of the quality of care in hospitals.
The word “hospital” comes from the Latin for both “guest” and “host,” and the true spirit of hospitality is at the core of the hospital experience (2). The original mission of hospitals was to serve as houses of mercy, refuge, and dying for pilgrims returning from the Holy Land at the time of the late Christian antiquity (3). The striving to please patients is in harmony with the service calling of medicine and is certainly the right thing to do.
Current Reality
From the patient’s perspective, hospitals can be scary and unfriendly places. The American Hospital Association’s Reality Check (4) evaluated the public’s perceptions of hospitals and hospital care using a time-honored technique of asking focus group participants to imagine that the hospital was an animal and a car. Two out of 3 respondents chose animals that would be seen as aggressive, scary, or lumbering to suggest traits such as arrogance, uncontrolled power, and sluggishness. For cars, no respondent chose the Toyota Camry or any other model that would likely make the Consumer Reports list of best values. Instead, the cars chosen were representatives of unreasonable overpricing, waste, and outdated engineering.
“Imagine that the hospital is …”
A Car
“Volkswagen bus...Old, very noisy, just not a real great car.”
“A Rolls Royce, because of the expense.”
“A Pinto, because it was run down.”
“Ford Escort, just barely passing the test.”
“A Cadillac…big and expensive.”
An Animal
“A bear…a grizzly…horrible.”
“Elephant…large…cumbersome.”
“A leech.…I’m sure all hospitals aren’t that lowly.”
“A snake, kind of slithery and sneaky, because of what hospitals charge.”
The same AHA survey showed that patients felt that insurance companies and not physicians were in charge of their care in the hospital. A follow-up question revealed that patients clearly want to be in charge of their own hospital care. Additionally, patients do not see hospitals as part of a planned or consumer-focused health care system. In fact, they see quite the opposite: a confusing, expensive, unreliable, and often impersonal disassembly of medical professionals and institutions. If they see any system at all, it is one devoted to maximizing profits by blocking access, reducing quality, and limiting spending, all at the expense of the patient.
The American Customer Satisfaction Index (5) gave hospitals an overall 67% satisfaction rating, ranking 27th out of 31 industries. This ranking placed hospitals 10 percentage points below the tobacco industry and just above the Internal Revenue Service. A National Coalition on Health Care survey (6) found that 80% of respondents believe hospitals cut corners to save money, and 77% believe that these cuts have endangered patients. Quality of care and patient safety have become significant public concerns recently. “To Err is Human,” the 1999 report from the Institute of Medicine, highlighted the potential for serious injury and death in U.S. hospitals (7). Estimates are that 44,000 to 98,000 Americans die each year in hospitals as a result of medical errors and unsafe practices.
Patient Satisfaction Is Important
Patient satisfaction is the health care recipient’s reaction to aspects of his or her service experience (8). Patient satisfaction belongs to the service dimension as opposed to the technical dimension of quality of care. Most patients report few problems related to technical quality of care in hospitals and moreover do not feel qualified to judge technical quality and therefore assume technical competence (9).
From 1986 to 1992, the Health Care Financing Administration publicly reported hospital mortality rates as an effort to aid consumers in selecting hospitals (10). Hospitals with over twice the expected mortality rate saw very little change in volume during that time. Patients do not seem to be affected by morbidity and mortality statistics but more by personal stories of care. Patient perception of quality is assessed through dimensions of what is personally valued, and often they do not distinguish between the provider of the service and the service received.
Being treated with respect and dignity and involvement in treatment decisions are intangible issues of patient satisfaction that are paramount issues for patients (11).
As many as one quarter of 13,000 patients discharged from 51 Massachusetts hospitals reported problems with patient satisfaction issues such as the involvement of families in their care, communication and coordination of care, and the transition from hospital to home (12). Patients who had been admitted to academic health centers and teaching hospitals generally reported more problems than those cared for in community hospitals. As it turns out, service outcomes such as patient satisfaction drive market share and profitability for hospitals (13). With the average medical/surgery hospital charge amounting to $12,083, hospitals cannot afford to lose patients and, therefore, revenue due to issues of patient dissatisfaction (14). Recruiting new patients as customers is 5 times more costly than retaining an existing customer base (15).
There is compelling evidence from well-developed lines of research demonstrating that increasing patient satisfaction improves clinical outcomes, such as functional status and physiologic measures of health (16,17). Finally, it is important for clinicians to know that it has been clearly demonstrated that satisfied patients improve physician satisfaction (18,19).
Psychology of Satisfaction
To create a culture of customer service excellence in hospitals and achieve outstanding patient satisfaction, it is necessary to understand the intangible aspects of perception and expectation that contribute to patient satisfaction. The “First Law of Service” provides a useful, simple mathematical model of satisfaction (20). The formula for this model is Satisfaction = Perception – Expectation. If a patient’s perception of their hospital experience meets or exceeds the expectation, there will be a corresponding degree of satisfaction. However, if the perception does not meet the expectation, there will be resulting dissatisfaction. Thus, patient satisfaction results from meeting or exceeding patients’ expectations. Patient perceptions of care can be measured directly from patient satisfaction surveys, focus groups, and telephone surveys. A hospital’s reputation and market share are indirect measurements of patient perceptions. There are 2 main directions in which patient satisfaction can be influenced: by working on what the patient perceives and on what the patient expects.
Expectations are integral to the experience of being a customer. There has been confusion and controversy in health care as to whether patients are in fact customers. This confusion may be at the root of the overall service failing of hospitals (21). “The more horizontal they are, the more they are a patient. The more vertical they are, the more they are a customer” (22). Using a technical definition, a customer is anyone who has expectations about process operations or outputs (23). Therefore, all patients are customers, but not all customers are patients (21). Hospitals have a whole list of primary and secondary customers, each of whom has his or her own set of expectations. Patients and their families can be seen as primary customers, and referring physicians, third-party payers, external overseers, communities, shareholders, and employees are all secondary customers of hospitals.
Expectations are psychological phenomena that can be defined as beliefs created and sustained by cognitive processes (24). Expectations of patients as hospital customers rise from past experiences of their own or of others, as well as from current needs and unique internal preferences that form the basis of a value system. Expectations cannot be mandated, because they are based in self-gratification. However, expectations may change over time, and, very importantly, they can be measured and perhaps modified through education. For most people, illness and hospitalization is a rare event. Patients will know something is wrong and that treatment is needed, but most won’t know the nature of their disease, the diagnostic and therapeutic options, and the likely outcomes. Therefore, patients seek out health care professionals who have the opportunity to inform them on what to expect as a way to begin the process of managing expectations.
The Kano Model
The Kano Model provides a useful tool for studying different levels of patient expectations (23).
This model is useful to examine the voice of the customer in the relationship between satisfaction and quality, and it is relevant for hospital encounters. According to the model, patients will have a basic set of subconscious expectations about their care that will be taken for granted. These expectations are so routine and expected that patients don’t recognize them as comparative quality factors, but they will be shocked if they are absent. For example, patients assume that physicians are basically competent, and that hospitals are capable of providing safe, courteous, lifesaving medical care (25). Although these expectations are in the patient’s subconscious, if they are not met, the patient will be dissatisfied. Providing this level of basic quality isn’t necessarily enough to create satisfied patients.
There is a normal level of service that patients consciously consider, they have to do with the anticipated issues of hospital care related to access, wait times, scheduling, and billing. The model shows that satisfaction increases as more of these expectations are met and that patients will be dissatisfied if these quality expectations are not met. Patients use comparisons of these expectations to recognize differences among competitors and to make choices.
The latent quality curve lies entirely in the satisfaction region and represents supraconscious, unexpected quality items that patients didn’t know they wanted and result in a delightful surprise when present. In this experience, patients receive more than they had expected, often as the result of innovation that can raise patient expectations and provide a significant competitive advantage. The data from hospitals show that this is achieved primarily through the patient’s perception of personalized, customized service, provided by caring and concerned clinicians (26).
There is a tremendous opportunity in hospital care to modify patient expectations through education and to create high levels of patient satisfaction. Hospitals that are successful in this endeavor will have a significant competitive advantage. Hospital patients have a whole list of issues about which they have expectations: the smoothness of the admission and discharge process, accuracy and clarity of billing statements, courtesy of hospital employees, response time for calls and requests, the level of technology available in the hospital, nurse competency, taste and temperature of the food, and price. Most of these issues are not directly related to clinical care and certainly not under the control or influence of the hospitalist. What are the expectations that patients have for their clinical care by hospitalists, and how can we give it to them?
The Hospitalist as a Caring and Concerned Clinician
A useful model to define the hospitalist’s role in patient satisfaction is that of a caring and concerned clinician. This caring and concern for patients is exemplified by attentiveness, dignity and respect, effective information transfer, and shared decision making (23).
The outcome service chain for hospitals begins with the patient’s perception of caring and concerned clinicians who demonstrate these attributes of attentiveness, dignity and respect, effective information transfer, and shared decision making. This leads to the degree of patient satisfaction and loyalty that results in patients who will return to the hospital, seek related business, and refer additional business. This drives market share and financial success for hospitals (9).
The characteristics of the caring and concerned clinician begin with attentiveness. This is the practice of establishing a person-to-person connection with patients and involves attending to them as unique individuals and not just in their role as patients. The constant interruptions that occur in physician/patient encounters, control issues, discontinuity of care, and the often overwhelming complexity of a patient’s illness can be obstacles to the perception of attentiveness that result in patients feeling connected with the clinician. Some effective tools for attentiveness are demonstrating curiosity about the patient as a person, using open-ended questions to gather clinical data, orienting patients to the process of care, and actively eliciting a patient’s agenda for their care and then summarizing their concerns.
The demonstration of dignity and respect results in a patient’s feeling understood and accepted as a person. This is the practice of empathy, which is often confused with sympathy (27). Sympathy is an expression of one’s own feelings (“I’m sorry”). Empathy is the demonstration of an understanding of the patient’s feelings (“You must be very sad”). The confusion of medical terminology as well as the time constraints of modern hospital-care encounters can be obstacles to achieving the type of dignity and respect that results in a high degree of patient satisfaction. A number of effective tools are available to facilitate this important result. Sitting down during patient encounters greatly enhances the perception of time and caring of hospitalists on the part of patients. Eye contact and appropriate touch are demonstrations of dignity and respect, as is seeing patients fully clothed. It is important to pay attention to nonverbal communication issues with patients. An important element of how hospitalists are perceived by patients has to do with nonverbal issues such as demeanor, body posture, and verbal tone. Using a patient’s own words and addressing underlying feelings facilitates the practice of dignity and respect (28). Patients perceive statements of assured understanding as confirmation that they have been listened to. Remember the words of Sir William Osler: “Listening is unspoken caring.”
The effective transfer of information is at the core of physician/patient communication (29). Patients have the need to provide complete information to physicians to facilitate an accurate diagnosis. The physician’s role is to provide information that addresses the cognitive, behavioral, and affective needs of patients and their families concerning their illness. The discrepancy of language, time constraints, and the ability of patients to remember are all barriers to the effective transfer of information. Some useful techniques for effective information transfer include assessing a patient’s current level of understanding and asking about their self-diagnosis. Timeliness in providing results of diagnostic tests is an important issue to patients who are often waiting expectantly. Studies have shown that the majority of patients have questions about the so-called “mysteries of medicine,” related to the diagnosis, etiology, and prognosis of their illness (30).
Patients may not specifically ask these questions; however, they are present, and patient satisfaction will increase if these questions are answered. Patients have decisively indicated their desire for shared decision making regarding their health care and for patient and family control of all-important choices (26). The process of shared decision making can be facilitated by collaboration between patients and the hospitalist around goals ands plans for treatment in the hospital (31). A barrier to shared decision making is a patient/physician relationship based on a model of paternalism (“I’m the doctor, and I know best”). A more productive model for the therapeutic relationship is that of a partnership between the hospitalist and the patient, particularly in the present era of web-educated, sophisticated consumer patients.
An important tool to achieving this type of collaboration involves the approach of presenting patients and families with treatment options and then actively soliciting patient preferences. A question is whether patients will actively participate in treatment decisions and then adhere to treatment plans. This is in large part determined by the interpersonal relationship skills of the clinician and can be further facilitated with simplified regimens that have been agreed upon by the patient and the hospitalist (32).
A complete model of the hospital-care encounter provided by hospitalists has an opening and a closing. In between there is a series of moments of truth that can potentially be imbued with attentiveness, dignity and respect, effective information transfer, and shared decision making. The opening is a brief moment that will set the stage for the remainder of the encounter. Greeting patients by name and maintaining eye contact will help in establishing the early perception of being a caring and concerned clinician. It is important to close hospital encounters with a sense of hope and optimism, making sure that all of the patient’s issues have been addressed, as well as planning for the next steps.
The development and growth of hospital medicine is the latest site-specific evolution of practice specialization and focuses on the complex care of hospitalized patients. Hospitalists spend most of their professional time in the hospital providing care for general medical patients and are well positioned and uniquely committed to improving the care of hospitalized patients. Exceptional patient satisfaction is a key outcome that should result from the care provided by hospitalists.
References
- Donabedian A. The quality of care. How can it be assessed? JAMA. 1988;260:1743-8.
- Zaleski P. Knights Hospitaller: the rise and fall of a chivalric order of Christian caregiving. Parabola. 1990;15:55-62.
- Risse GB. Mending Bodies, Saving Souls. New York, NY: Oxford University Press; 1999.
- Reality Check: Public Perceptions of Health Care and Hospitals. The American Hospital Association. 1996.
- Now are you satisfied? Fortune. February 1998:166.
- National Coalition on Health Care. How Americans perceive the health care system. www.nchc.org/perceive.html. Accessed August 2004.
- To Err Is Human: Building a Safer Health Care System. Committee on Quality of Health Care in America, Institute of Medicine. Washington, DC: National Academy Press; 1998.
- Pascoe GC. Patient satisfaction in primary health care: a literature review and analysis. Eval Prog Plann. 1983;6:185-210.
- Kenagy JW, Berwick DM, Shore MF. Service quality in heath care. JAMA. 1999;281:661-5.
- Mennemeyer ST, Morrisey MA, Howard LZ. Death and reputation: how consumers acted upon HCFA mortality information. Inquiry. 1997;34:117-28.
- Cleary PD, Edgman-Levitan S. Health care quality. Incorporating consumer perspectives. JAMA. 1997;278:1608-12.
- Rogers G, Smith DP. Reporting comparative results from hospital surveys. Int J Qual Health Care. 1999;11:251-9.
- Schlesinger LA, Heskett JL. The service-driven service company. Harvard Business Review. 1991;Sept-Oct:1-19.
- Modern Health care. 2000;May:70.
- Mittal B, Lassar W. Why do customers switch? The dynamics of satisfaction versus loyalty. Journal of Services Marketing. 1998;12:177-191.
- Greenfield S, Kaplan S, Ware WE Jr. Expanding patient involvement in care: Effects on patient outcomes. Ann Intern Med. 1985;102:520-8.
- Sobel DS. Rethinking medicine: improving health outcomes with cost-effective psychosocial interventions. Psychosom Med. 1995;57:234-44.
- Novack DH, Suchman AL, Clark W, Epstein RM, Najberg E, Kaplan C. Calibrating the physician. Personal awareness and effective patient care. Working Group on Promoting Physician Personal Awareness, American Academy on Physician and Patient. JAMA. 1997;278:502-9.
- Suchman AL, Roter D, Green M, Lipkin M Jr. Physician satisfaction with primary care office visits. Collaborative Study Group of the American Academy on Physician and Patient. Med Care. 1993;31:1083-92.
- Maister DH. The Psychology of Waiting Lines. Case No. 9-684-064. Boston, Mass: Harvard Business School Publishing; 1984.
- Fottler MD, Ford RC, Heaton CP. Achieving Service Excellence. Chicago, Ill.: Health Administration Press; 2002.
- Mayer T, Cates RJ. Service excellence in health care. JAMA. 1999;282:1281-83.
- James BC. Curing vs. Caring: The Art of Service Quality. Institute for Health Care Delivery Research. Intermountain Health Care. Salt Lake City, Utah; 2003.
- Thompson AG, Sunol R. Expectations as determinants of patient satisfaction: concepts, theory and evidence. Int J Qual Health Care. 1995;7:127-41.
- Larson CO, Nelson EC, Gustafson D, Batalden PB. The relationship between meeting patient’s information needs and their satisfaction with hospital care and general health status outcomes. Int J Qual Health Care. 1996;8:447-56.
- Gerteis M, Edgman-Levitan S, Daley J, Deblanco T, eds. Through the Patient’s Eyes. San Francisco, Calif.: Jossey-Bass; 1993.
- Spiro H, Peschel E, Curnen MG, St. James D, eds. Empathy and the Practice of Medicine: Beyond Pills and the Scalpel. New Haven, Conn.: Yale University Press; 1993.
- Branch WT, Malik TK. Using ‘windows of opportunities’ in brief interviews to understand patients’ concerns. JAMA. 1993;269:1667-68.
- Worthlin Group. Communication and the physician/patient relationship: A physician and communication survey. Bayer Institute for Health Care Communication. New Haven, CT; 1995.
- Clinician Patient Communication to Enhance Health Outcomes. Bayer Institute for Health Care Communication Workshop. Bayer Institute, New Haven, Conn.; 1999.
- Donovan J, Blake R. Patient non-compliance: deviance or reasoned decision-making? Soc Sci Med. 1992;34:507-13.
- DiMatteo MR, Reiter RC, Gambone JC. Enhancing medication adherence through communication and informed collaborative choice. Health Commun. 1994;6:253-65.