User login
An obese 48-year-old man with progressive fatigue and decreased libido
A 48-year-old man presents to his primary care physician because of progressively decreasing energy and gradual decline in both libido and erectile function for the past 18 months. He has noticed decreased morning erections as well. He rates his libido at 3 to 4 on a scale of 10 for the past 6 months. He also reports poor motivation, depressed mood, impaired concentration, and sleep disturbances. He reports no hair loss, headache, or dizziness, and no decrease in shaving frequency. Review of his systems is otherwise unremarkable.
He has had dyslipidemia for 3 years and is not known to have hypertension or diabetes. His medications include atorvastatin, vitamin E, and multivitamins.
He is married with 3 children and does not wish to have more. He works as a software engineer and leads a sedentary lifestyle. He is a nonsmoker and occasionally drinks alcohol on the weekends.
On physical examination, he is alert and oriented and appears well. His height is 5 feet 10 inches (178 cm), weight 230 lb (104 kg), and body mass index (BMI) 32.8 kg/m2. His blood pressure is 115/83 mm Hg and pulse rate is 82 beats per minute and regular. Findings on cardiovascular and pulmonary examination are normal. He has large fatty breasts but without palpable glandular tissue.

Genitourinary examination reveals normal hair distribution, a normal-sized penis, and slightly soft testes with testicular volume of 18–20 mL bilaterally.
His primary care physician suspects that he has low testosterone and orders some basic laboratory tests; the results are normal except for a low total testosterone level (Table 1).
FURTHER TESTING
1. Which of the following tests should his physician order next?
- Repeat total testosterone measurement
- Free testosterone measurement by commercial assay
- Calculated free testosterone
- Bioavailable testosterone measurement
- Serum inhibin B measurement
This patient presents with several nonspecific symptoms. But collectively they suggest testosterone deficiency (hypogonadism).

Together, erectile dysfunction, low libido, and decreased morning erections strongly suggest hypogonadism.2 Loss of body hair and decreased shaving frequency are specific symptoms of hypogonadism; however, they require years to develop.3 Gynecomastia can also occur due to loss of the inhibitory action of testosterone on breast growth and a relative increase in estradiol. This occurs more in primary hypogonadism, due to the increase in luteinizing hormone (LH), which stimulates the remaining Leydig cells to secrete estradiol rather than testosterone.4

To diagnose hypogonadism in men and to start treatment for it, current guidelines recommend that the patient should have clinical features as well as laboratory evidence of low testosterone.5,6
Measuring testosterone: Total, free, bound, and bioavailable
Testosterone, a steroid hormone, circulates in the serum either as free testosterone or bound to several plasma proteins, mainly sex-hormone binding globulin (SHBG) and albumin.
Total testosterone includes both the free and bound fractions, whereas bioavailable testosterone includes both free and the portion bound to albumin, which has low affinity and can dissociate and be used at the tissue level.11
Low levels of total testosterone do not necessarily reflect a hypogonadal state, as a man with altered SHBG levels or binding capabilities can have low total but normal free testosterone levels and no manifestations.12 Several conditions can alter the levels of SHBG, including obesity, diabetes, aging, thyroid dysfunction, and others.5,13
Because our patient is obese, his total testosterone level is not a reliable indicator of hypogonadism, and repeating its measurement will not add diagnostic value.
Therefore, an alternative measurement should be used to accurately reflect the testosterone levels. From a physiologic point of view, bioavailable testosterone is the active form of testosterone and is the most accurate to be measured in a patient with hypogonadism. Nevertheless, because of technical difficulties in its measurement and lack of evidence correlating bioavailable testosterone with the clinical picture of hypogonadism, it is recommended that the level of free testosterone be used.5
The gold standard for direct measurement of serum free testosterone is equilibrium dialysis, but this is expensive and time-consuming.14 Commercial assays for free testosterone exist but have been deemed unreliable.14,15 It is recommended that free testosterone be measured by equilibrium dialysis or calculated using equations based on total testosterone, SHBG, and albumin levels.5 These equations are reliable and give results very close to the values obtained by equilibrium dialysis.15 Therefore, in our patient, it would be suitable to calculate the free testosterone level next.
Serum levels of free testosterone vary according to several factors. Diurnal variation of testosterone has been established: levels are highest in the morning and decline throughout the day.16 Food decreases testosterone levels.17 In addition, there is considerable day-to-day variation.18 Therefore, at least 2 readings of fasting morning testosterone on 2 separate days are recommended for the diagnosis of hypogonadism.5
Inhibin B is a hormone produced by Sertoli cells in the testes in response to follicle-stimulating hormone (FSH) stimulation. In turn, it acts as negative feedback, together with testosterone, to inhibit FSH release from the pituitary. Inhibin B has been shown to reflect spermatogenesis in the testes and therefore fertility.19 Inhibin B levels were found to be low in patients with central hypogonadism, due to less FSH release; however, they did not correlate with testosterone levels.20
CASE RESUMED: CHARACTERIZING HIS HYPOGONADISM
The patient’s physician orders morning fasting total testosterone, SHBG, and albumin testing and calculates the free testosterone level, which yields a value of 3 ng/dL (reference range 4.5–17). This is confirmed by a repeat measurement, which yields a value of 2.9 ng/dL. Laboratory test results combined with his clinical presentation are consistent with hypogonadism.
2. What is the most appropriate next step?
- Measurement of serum LH and FSH
- Measurement of serum prolactin
- Scrotal ultrasonography
- Gonadotropin-releasing hormone (GnRH) stimulation test
- Semen analysis
After hypogonadism is diagnosed, it is important to distinguish if it is primary or central. This is achieved by measuring serum LH and FSH.5 All biotin supplements should be stopped at least 72 hours before measuring LH and FSH, as biotin can interfere with the assays, yielding false values.21
Secretion of FSH and LH from the anterior pituitary is under the influence of pulsatile release of GnRH from the hypothalamus. LH acts on Leydig cells in the testes to produce testosterone, whereas FSH acts on Sertoli cells, together with testosterone, to bring about spermatogenesis in the seminiferous tubules. Testosterone acts centrally as negative feedback to decrease the release of LH and FSH.
Primary hypogonadism occurs due to testicular failure, ie, the testes themselves fail to produce testosterone, leading to hypogonadism. The decrease in testosterone levels, together with inhibin B if Sertoli cells are damaged, lead to loss of negative feedback on the hypothalamus and pituitary, and therefore increased levels of LH and FSH. This is termed hypergonadotropic hypogonadism. Testicular failure may also result in impaired spermatogenesis and infertility due to destruction of testicular structures, in which case fertility cannot be restored.
Central hypogonadism occurs when the pituitary fails to produce LH and FSH (secondary hypogonadism) or when the hypothalamus fails to produce GnRH and subsequently the lack of secretion of LH and FSH from the pituitary (tertiary hypogonadism). The lack of LH will result in no stimulation of Leydig cells to produce testosterone, and therefore its deficiency. Serum hormone levels in central hypogonadism will reveal low testosterone, with either low or inappropriately normal gonadotropins (LH and FSH). This is termed hypogonadotropic hypogonadism. The lack of FSH, together with testosterone deficiency will also result in decreased spermatogenesis and therefore infertility. Testicular structures are preserved, however, and fertility can be restored with appropriate therapy, as discussed below.
Prolactin should be measured only if the patient has central hypogonadism. Its measurement is not warranted at this point in the patient’s workup. The implications of prolactin and its relationship to hypogonadism will be discussed later.
Although, this stepwise approach is not convenient for many patients, some physicians follow it because it is cost-effective, especially in those who are not insured. However, other physicians order FSH, LH, and sometimes prolactin with the confirmatory low testosterone measurement. Laboratories can also be instructed to wait to measure the pituitary hormones and to do so only if low testosterone is confirmed.
Varicocele, a possible cause of male infertility, can also impair Leydig cell function and cause low testosterone. In fact, surgical repair of varicocele has been demonstrated to increase serum testosterone.22 Scrotal ultrasonography is used to diagnose varicocele, but this also should be ordered at a later stage in the workup if primary hypogonadism is diagnosed.
The GnRH stimulation test is important for the diagnosis and evaluation of precocious or delayed puberty in children. In boys with delayed puberty, a poorer response to GnRH stimulation indicates central hypogonadism rather than constitutional delay.23 It has no role in the evaluation of postpubertal or adult-onset hypogonadism.
Semen analysis is important to evaluate fertility if the patient is interested in further procreation.5 Low testosterone levels may result in impaired spermatogenesis and therefore infertility. On the other hand, treatment with exogenous testosterone will also result in infertility, by feedback inhibition of LH and FSH and therefore inhibition of spermatogenesis. If the patient wishes to preserve fertility, treatment options other than testosterone should be considered; examples include clomiphene citrate, human menopausal gonadotropin, and human chorionic gonadotropin.23,24
Our patient has no desire to expand his family; therefore, a semen analysis and attempts to preserve spermatogenesis are not indicated.
CASE RESUMED: SEARCHING FOR CAUSES
His physician orders testing of serum LH and FSH, yielding the following values:
- LH 1.6 mIU/mL (reference range 1.8–12)
- FSH 1.9 mIU/mL (reference range 1.5–12.5).
The diagnosis of central hypogonadism is established.
3. Which investigation is the least appropriate in the further evaluation of this patient?

- Serum prolactin measurement
- Serum ferritin measurement
- Pituitary magnetic resonance imaging (MRI)
- Chromosomal karyotyping

The diagnosis of central hypogonadism warrants evaluation for possible causes. These are summarized in Table 4.
Serum free thyroxine and morning cortisol
Since this patient’s LH and FSH values are abnormal, it is important to evaluate the status of other anterior pituitary hormones. In patients with pituitary abnormalities, serum free T4 is a more reliable test for assessing thyroid function than thyroid-stimulating hormone (TSH), because of loss of the negative feedback of thyroid hormones on the diseased pituitary. In contrast, serum TSH is considered the best single thyroid test to assess primary thyroid dysfunction.
Other measurements include prolactin and morning cortisol (reflecting adrenocorticotropic hormone status).
Prolactin measurement
Prolactin measurement is important to evaluate for hyperprolactinemia, as this will lead to hypogonadism by inhibition of GnRH secretion.25 Different pathologic, pharmacologic, and physiologic conditions can result in hyperprolactinemia, including prolactinomas, other pituitary and hypothalamic lesions, primary hypothyroidism, and medications such as antipsychotics.25 Dopamine agonists are the mainstay treatment for hyperprolactinemia.
Ferritin measurement
Ferritin measurement is indicated to diagnose iron overload conditions such as hemochromatosis, which can result in primary hypogonadism via testicular damage or in secondary hypogonadism via pituitary damage.26
Pituitary MRI with contrast
Pituitary MRI with contrast is used to diagnose structural lesions of the pituitary or hypothalamus. This diagnostic modality is indicated for patients with pituitary dysfunction, including central hypogonadism, manifestations of a mass effect (headache, visual field defects), persistent hyperprolactinemia, and panhypopituitarism, among others. To improve the diagnostic yield of pituitary MRI, the Endocrine Society guidelines recommend it for men with serum total testosterone levels below 150 ng/dL.5 However, some clinicians have a lower threshold for ordering pituitary MRI for patients with central hypogonadism. Physician judgment and expertise should be exercised and the decision made on an individual basis.
Chromosomal karyotyping
Chromosomal karyotyping is not indicated in our patient. It is reserved for those with primary hypogonadism to diagnose Klinefelter syndrome, which has a karyotype of 47,XXY.
CASE RESUMED: MOSH SYNDROME
Our patient’s prolactin, free T4, morning cortisol, and ferritin levels are measured, yielding normal values. No abnormalities are seen on pituitary MRI. A clinical reevaluation is conducted, revealing no history of head trauma or head and neck radiation. The lack of an obvious cause in our patient’s clinical presentation and workup, together with his obesity (BMI 32.8 kg/m2) supports the diagnosis of obesity as the cause of his hypogonadism.
Obesity can be a cause of secondary hypogonadism, which has led to the term “MOSH” (male obesity-associated secondary hypogonadism) syndrome. In fact, a cross-sectional study has demonstrated that 40% of nondiabetic obese (BMI ≥ 30 kg/m2) men over age 45 have low serum free testosterone levels, compared with 26% for lean (BMI < 25 kg/m2) men.27 Moreover, obesity has been found to be a strong predictor of testosterone replacement therapy.28 Other studies have also found an inverse relationship between BMI and testosterone levels.29
Several mechanisms interact in the pathogenesis of MOSH syndrome. Adipose tissue possesses aromatase activity, which converts androgens into estrogens.30 Peripheral estrogen production can in turn exert feedback inhibition on pituitary gonadotropin secretion.31 In obese men, increased adipose tissue leads to increased aromatase activity and more estrogen, so more feedback inhibition on the pituitary and subsequently secondary hypogonadism.
Leptin, a hormone produced by adipocytes, is also increased in obesity, and was found to be inversely correlated with serum testosterone.32 Studies have demonstrated that leptin has an inhibitory effect on the enzymatic pathway that synthesizes testosterone in Leydig cells.33
Proinflammatory cytokines have also been implicated, as central obesity is associated with an increase in these cytokines, which in turn act negatively on the hypothalamus and impair GnRH release leading to lower testosterone.34,35
Treating obesity-related hypogonadism
In a pilot study,36 lifestyle attempts to reduce obesity were shown to improve hormonal levels. Bariatric surgery has also been demonstrated to be successful.37
Clomiphene citrate, a selective estrogen receptor modulator, increases endogenous testosterone secretion by inhibiting the negative feedback of estrogen on the hypothalamus and pituitary and thus increasing LH and FSH. It also preserves endogenous testosterone production, since it does not suppress the hypothalamic-pituitary-testicular axis.38 This made clomiphene citrate a potential treatment for men with central hypogonadism including those with MOSH.39
Nevertheless, there are no randomized trials to prove its safety and efficacy in the management of central hypogonadism.5 Regarding its use in men wishing to preserve fertility, most studies did not show improvement. However, a meta-analysis demonstrated statistically significant increased pregnancy rates in partners of men with idiopathic infertility if the men used 50 mg of clomiphene citrate daily.40
Testosterone deficiency can be a marker of metabolic syndrome, which needs to be managed more urgently than hypogonadism. A cross-sectional study found not only an association between metabolic syndrome and low serum testosterone, but also with each individual component of metabolic syndrome on its own, all of which need to be addressed.10
CASE CONTINUED: BEGINNING TREATMENT
The physician counsels the patient regarding the implications, potential adverse outcomes, and available treatments for his obesity, including lifestyle modification and bariatric surgery. The patient declines surgery and wishes to adopt a weight-reducing diet and exercise program, for which he is referred to a dietitian.
In addition, in view of the patient’s clinically and biochemically proven hypogonadism, his physician offers testosterone replacement therapy. He orders a serum prostate-specific antigen (PSA) level, which is 1.3 ng/dL (reference range < 4 ng/dL). The patient is prescribed 5 g of 1% testosterone gel daily.
TESTOSTERONE REPLACEMENT THERAPY
4. Which is the most common adverse effect of testosterone replacement therapy?
- Cardiovascular events
- Erythrocytosis
- Prostate cancer
- Infertility
- Obstructive sleep apnea

Clinicians should be very cautious in initiating testosterone replacement therapy in any patient with an unstable medical condition.
There are several formulations of testosterone replacement therapy, including intramuscular injections, transdermal gels or patches, buccal tablets, an intranasal gel, and oral tablets. Of note, there are 2 different forms of oral testosterone preparations: testosterone undecanoate and 17-alpha alkylated testosterone. The former is unavailable in the United States and the latter is not recommended for use due to its proven hepatic toxicity.41
Testosterone and erythrocytosis
Meta-analyses have concluded that the most frequent adverse event of testosterone replacement therapy is a significant rise in hematocrit.42 This rise was found to be dose-dependent and was more marked in older men.43 Although all preparations can cause erythrocytosis, parenteral forms have been observed to raise it the most, particularly short-term injectables.44,45
The mechanism behind this increase is attributed to increased erythropoietin levels and improved usage of iron for red blood cell synthesis.46 In fact, testosterone replacement therapy has been shown to improve hemoglobin levels in patients with anemia.47 On the other hand, increasing hematocrit levels may lead to thrombotic and vasoocclusive events.44

Testosterone and prostate cancer
The relationship between testosterone treatment and prostate cancer has long been studied. Historically, testosterone replacement therapy was believed to increase the risk of prostate cancer; however, recent studies and meta-analyses have shown that this is not the case.42,48 Nevertheless, clinical guidelines still recommend prostate monitoring for men on testosterone replacement therapy.5,6

Testosterone and cardiovascular risk
The evidence regarding this issue has been contradictory and inconsistent. Meta-analyses have demonstrated that low testosterone is associated with higher risk of major adverse cardiovascular events.50 These studies argue for the use of testosterone replacement therapy in hypogonadal men to decrease the risk. However, other studies and meta-analyses have found that testosterone replacement therapy is associated with increased cardiovascular risk and have concluded that major adverse cardiac events are in fact a risk of testosterone replacement therapy.51
Current recommendations advocate against the use of testosterone replacement therapy in men with uncontrolled heart failure or with cardiovascular events in the past 3 to 6 months.5,6 Cardiovascular risk factors should be addressed and corrected, and patients should be educated on cardiovascular symptoms and the need to report them if they occur.
Testosterone and infertility
As described earlier, testosterone replacement therapy increases negative feedback on the pituitary and decreases LH and FSH production, leading to less spermatogenesis. Other treatment options should be sought for hypogonadal men wishing to preserve fertility.
Other adverse effects
Other adverse effects of testosterone replacement therapy include acne, oily skin, obstructive sleep apnea, gynecomastia, and balding.
Given all the adverse events that can be associated with testosterone replacement therapy, the risks and benefits of treating hypogonadism in each patient should be taken into consideration, and an individualized approach is required.
CASE RESUMED: FOLLOW-UP
The patient presents 3 months later for follow-up. He reports significant improvement in his presenting symptoms including energy, libido, and erectile function. He also reports some improvement in his mood and concentration. He has lost 12 lb (5.4 kg) and is still trying to improve his diet and exercise program. He is compliant with his testosterone gel therapy.
His serum calculated free testosterone level is 7.8 ng/dL (4.5–17), and his hematocrit is 46%. The patient is instructed to continue his treatment and to return after 9 months for further follow-up.
TAKE-HOME POINTS
- Men with hypogonadism usually present with nonspecific manifestations, so clinicians should keep a high index of suspicion.
- Both clinical and biochemical evidence of hypogonadism should be present to diagnose and start treatment for it.
- Low levels of serum total testosterone do not necessarily reflect hypogonadism.
- The hormonal profile of central hypogonadism reveals low serum testosterone with low or inappropriately normal serum LH and FSH levels.
Obesity can cause central hypogonadism and should be suspected after pituitary and other systemic causes are excluded.
- Araujo AB, Esche GR, Kupelian V, et al. Prevalence of symptomatic androgen deficiency in men. J Clin Endocrinol Metab 2007; 92(11):4241–4247. doi:10.1210/jc.2007-1245
- Wu FCW, Tajar A, Beynon JM, et al; EMAS Group. Identification of late-onset hypogonadism in middle-aged and elderly men. N Engl J Med 2010; 363(2):123–135. doi:10.1056/NEJMoa0911101
- Arver S, Lehtihet M. Current guidelines for the diagnosis of testosterone deficiency. Front Horm Res 2009; 37:5–20. doi:10.1159/000175839
- Narula HS, Carlson HE. Gynaecomastia—pathophysiology, diagnosis and treatment. Nat Rev Endocrinol 2014; 10(11):684–698. doi:10.1038/nrendo.2014.139
- Bhasin S, Brito JP, Cunningham GR, et al. Testosterone therapy in men with hypogonadism: an Endocrine Society clinical practice guideline. J Clin Endocrinol Metab 2018; 103(5):1715–1744. doi:10.1210/jc.2018-00229
- Mulhall JP, Trost LW, Brannigan RE, et al. Evaluation and management of testosterone deficiency: AUA guideline. J Urol 2018; 200(2):423–432. doi:10.1016/j.juro.2018.03.115
- Balasubramanian V, Naing S. Hypogonadism in chronic obstructive pulmonary disease: incidence and effects. Curr Opin Pulm Med 2012; 18(2):112–117. doi:10.1097/MCP.0b013e32834feb37
- Atlantis E, Fahey P, Cochrane B, Wittert G, Smith S. Endogenous testosterone level and testosterone supplementation therapy in chronic obstructive pulmonary disease (COPD): a systematic review and meta-analysis. BMJ Open 2013; 3(8)pii:e003127. doi:10.1136/bmjopen-2013-003127
- Bawor M, Bami H, Dennis BB, et al. Testosterone suppression in opioid users: a systematic review and meta-analysis. Drug Alcohol Depend 2015; 149:1–9. doi:10.1016/j.drugalcdep.2015.01.038
- Tan WS, Ng CJ, Khoo EM, Low WY, Tan HM. The triad of erectile dysfunction, testosterone deficiency syndrome and metabolic syndrome: findings from a multi-ethnic Asian men study (The Subang Men's Health Study). Aging Male 2011; 14(4):231–236. doi:10.3109/13685538.2011.597463
- Goldman AL, Bhasin S, Wu FCW, Krishna M, Matsumoto AM, Jasuja R. A reappraisal of testosterone’s binding in circulation: physiological and clinical implications. Endocr Rev 2017; 38(4):302–324. doi:10.1210/er.2017-00025
- Antonio L, Wu FC, O’Neill TW, et al; European Male Ageing Study Study Group. Low free testosterone is associated with hypogonadal signs and symptoms in men with normal total testosterone. J Clin Endocrinol Metab 2016; 101(7):2647–2657. doi:10.1210/jc.2015-4106
- Liu F, Shen X, Wang R, et al. Association of central obesity with sex hormone binding globulin: a cross-sectional study of 1166 Chinese men. Open Med (Wars) 2018; 13:196–202. doi:10.1515/med-2018-0030
- Vermeulen A, Verdonck L, Kaufman JM. A critical evaluation of simple methods for the estimation of free testosterone in serum. J Clin Endocrinol Metab 1999; 84(10):3666–3672. doi:10.1210/jcem.84.10.6079
- Halmenschlager G, Rhoden EL, Riedner CE. Calculated free testosterone and radioimmunoassay free testosterone as a predictor of subnormal levels of total testosterone. Int Urol Nephrol 2012; 44(3):673–681. doi:10.1007/s11255-011-0066-z
- Brambilla DJ, Matsumoto AM, Araujo AB, McKinlay JB. The effect of diurnal variation on clinical measurement of serum testosterone and other sex hormone levels in men. J Clin Endocrinol Metab 2009; 94(3):907–913. doi:10.1210/jc.2008-1902
- Lehtihet M, Arver S, Bartuseviciene I, Pousette Å. S-testosterone decrease after a mixed meal in healthy men independent of SHBG and gonadotrophin levels. Andrologia 2012; 44(6):405–410. doi:10.1111/j.1439-0272.2012.01296.x
- Brambilla DJ, O’Donnell AB, Matsumoto AM, McKinlay JB. Intraindividual variation in levels of serum testosterone and other reproductive and adrenal hormones in men. Clin Endocrinol (Oxf) 2007; 67(6):853–862. doi:10.1111/j.1365-2265.2007.02976.x
- Manzoor SM, Sattar A, Hashim R, et al. Serum inhibin B as a diagnostic marker of male infertility. J Ayub Med Coll Abbottabad 2012; 24(3–4):113–116. pmid:24669628
- Kolb BA, Stanczyk FZ, Sokol RZ. Serum inhibin B levels in males with gonadal dysfunction. Fertil Steril 2000; 74(2):234–238. pmid:10927037
- Trambas CM, Sikaris KA, Lu ZX. More on biotin treatment mimicking Graves’ disease. N Engl J Med 2016; 375(17):1698. doi:10.1056/NEJMc1611875
- Li F, Yue H, Yamaguchi K, et al. Effect of surgical repair on testosterone production in infertile men with varicocele: a meta-analysis. Int J Urol 2012; 19(2):149–154. doi:10.1111/j.1442-2042.2011.02890.x
- Crosnoe-Shipley LE, Elkelany OO, Rahnema CD, Kim ED. Treatment of hypogonadotropic male hypogonadism: case-based scenarios. World J Nephrol 2015; 4(2):245–253. doi:10.5527/wjn.v4.i2.245
- Majzoub A, Sabanegh E Jr. Testosterone replacement in the infertile man. Transl Androl Urol 2016; 5(6):859–865. doi:10.21037/tau.2016.08.03
- Majumdar A, Mangal NS. Hyperprolactinemia. J Hum Reprod Sci 2013; 6(3):168–175. doi:10.4103/0974-1208.121400
- El Osta R, Grandpre N, Monnin N, Hubert J, Koscinski I. Hypogonadotropic hypogonadism in men with hereditary hemochromatosis. Basic Clin Androl 2017; 27:13. doi:10.1186/s12610-017-0057-8
- Dhindsa S, Miller MG, McWhirter CL, et al. Testosterone concentrations in diabetic and nondiabetic obese men. Diabetes Care 2010; 33(6):1186–1192. doi:10.2337/dc09-1649
- Jasuja GK, Bhasin S, Reisman JI, et al. Who gets testosterone? Patient characteristics associated with testosterone prescribing in the Veteran Affairs system: a cross-sectional study. J Gen Intern Med 2017; 32(3):304–311. doi:10.1007/s11606-016-3940-7
- Kaplan SA, Lee JY, O’Neill EA, Meehan AG, Kusek JW. Prevalence of low testosterone and its relationship to body mass index in older men with lower urinary tract symptoms associated with benign prostatic hyperplasia. Aging Male 2013; 16(4):169–172. doi:10.3109/13685538.2013.844786
- Lee HK, Lee JK, Cho B. The role of androgen in the adipose tissue of males. World J Mens Health 2013; 31(2):136–140. doi:10.5534/wjmh.2013.31.2.136
- Raven G, De Jong FH, Kaufman JM, De Ronde W. In men, peripheral estradiol levels directly reflect the action of estrogens at the hypothalamo-pituitary level to inhibit gonadotropin secretion. J Clin Endocrinol Metab 2006; 91(9):3324–3328. doi:10.1210/jc.2006-0462
- Hofny ER, Ali ME, Abdel-Hafez HZ, et al. Semen parameters and hormonal profile in obese fertile and infertile males. Fertil Steril 2010; 94(2):581–584. doi:10.1016/j.fertnstert.2009.03.085
- Isidori AM, Caprio M, Strollo F, et al. Leptin and androgens in male obesity: evidence for leptin contribution to reduced androgen levels. J Clin Endocrinol Metab 1999; 84(10):3673–3680. doi:10.1210/jcem.84.10.6082
- El-Wakkad A, Hassan NM, Sibaii H, El-Zayat SR. Proinflammatory, anti-inflammatory cytokines and adiponkines in students with central obesity. Cytokine 2013; 61(2):682–687. doi:10.1016/j.cyto.2012.11.010
- Maggio M, Basaria S, Ceda GP, et al. The relationship between testosterone and molecular markers of inflammation in older men. J Endocrinol Invest 2005; 28(suppl proceedings 11):116–119. pmid:16760639
- de Lorenzo A, Noce A, Moriconi E, et al. MOSH syndrome (male obesity secondary hypogonadism): clinical assessment and possible therapeutic approaches. Nutrients 2018; 10(4)pii:E474. doi:10.3390/nu10040474
- Escobar-Morreale HF, Santacruz E, Luque-Ramírez M, Botella Carretero JI. Prevalence of ‘obesity-associated gonadal dysfunction’ in severely obese men and women and its resolution after bariatric surgery: a systematic review and meta-analysis. Hum Reprod Update 2017; 23(4):390–408. doi:10.1093/humupd/dmx012
- Lo EM, Rodriguez KM, Pastuszak AW, Khera M. Alternatives to testosterone therapy: a review. Sex Med Rev 2018; 6(1):106–113. doi:10.1016/j.sxmr.2017.09.004
- Soares AH, Horie NC, Chiang LAP, et al. Effects of clomiphene citrate on male obesity-associated hypogonadism: a randomized, double-blind, placebo-controlled study. Int J Obes (Lond) 2018; 42(5):953–963. doi:10.1038/s41366-018-0105-2
- Chua ME, Escusa KG, Luna S, Tapia LC, Dofitas B, Morales M. Revisiting oestrogen antagonists (clomiphene or tamoxifen) as medical empiric therapy for idiopathic male infertility: a meta-analysis. Andrology 2013; 1(5):749–757. doi:10.1111/j.2047-2927.2013.00107.x
- Westaby D, Ogle SJ, Paradinas FJ, Randell JB, Murray-Lyon IM. Liver damage from long-term methyltestosterone. Lancet 1977; 2(8032):262–263. pmid:69876
- Fernández-Balsells MM, Murad MH, Lane M, et al. Clinical review 1: Adverse effects of testosterone therapy in adult men: a systematic review and meta-analysis. J Clin Endocrinol Metab 2010; 95(6):2560–2575. doi:10.1210/jc.2009-2575
- Coviello AD, Kaplan B, Lakshman KM, Chen T, Singh AB, Bhasin S. Effects of graded doses of testosterone on erythropoiesis in healthy young and older men. J Clin Endocrinol Metab 2008; 93(3):914–919. doi:10.1210/jc.2007-1692
- Ohlander SJ, Varghese B, Pastuszak AW. Erythrocytosis following testosterone therapy. Sex Med Rev 2018; 6(1):77–85. doi:10.1016/j.sxmr.2017.04.001
- Jones SD Jr, Dukovac T, Sangkum P, Yafi FA, Hellstrom WJ. Erythrocytosis and polycythemia secondary to testosterone replacement therapy in the aging male. Sex Med Rev 2015; 3(2):101–112. doi:10.1002/smrj.43
- Bachman E, Travison TG, Basaria S, et al. Testosterone induces erythrocytosis via increased erythropoietin and suppressed hepcidin: evidence for a new erythropoietin/hemoglobin set point. J Gerontol A Biol Sci Med Sci 2014; 69(6):725–735. doi:10.1093/gerona/glt154
- Roy CN, Snyder PJ, Stephens-Shields AJ, et al. Association of testosterone levels with anemia in older men: a controlled clinical trial. JAMA Intern Med 2017; 177(4):480–490. doi:10.1001/jamainternmed.2016.9540
- Klap J, Schmid M, Loughlin KR. The relationship between total testosterone levels and prostate cancer: a review of the continuing controversy. J Urol 2015; 193(2):403–413. doi:10.1016/j.juro.2014.07.123
- Gilbert SM, Cavallo CB, Kahane H, Lowe FC. Evidence suggesting PSA cutpoint of 2.5 ng/mL for prompting prostate biopsy: review of 36,316 biopsies. Urology 2005; 65(3):549–553. doi:10.1016/j.urology.2004.10.064
- Araujo AB, Dixon JM, Suarez EA, Murad MH, Guey LT, Wittert GA. Clinical review: Endogenous testosterone and mortality in men: a systematic review and meta-analysis. J Clin Endocrinol Metab 2011; 96(10):3007–3019. doi:10.1210/jc.2011-1137
- Xu L, Freeman G, Cowling BJ, Schooling CM. Testosterone therapy and cardiovascular events among men: a systematic review and meta-analysis of placebo-controlled randomized trials. BMC Med 2013; 11:108. doi:10.1186/1741-7015-11-108
A 48-year-old man presents to his primary care physician because of progressively decreasing energy and gradual decline in both libido and erectile function for the past 18 months. He has noticed decreased morning erections as well. He rates his libido at 3 to 4 on a scale of 10 for the past 6 months. He also reports poor motivation, depressed mood, impaired concentration, and sleep disturbances. He reports no hair loss, headache, or dizziness, and no decrease in shaving frequency. Review of his systems is otherwise unremarkable.
He has had dyslipidemia for 3 years and is not known to have hypertension or diabetes. His medications include atorvastatin, vitamin E, and multivitamins.
He is married with 3 children and does not wish to have more. He works as a software engineer and leads a sedentary lifestyle. He is a nonsmoker and occasionally drinks alcohol on the weekends.
On physical examination, he is alert and oriented and appears well. His height is 5 feet 10 inches (178 cm), weight 230 lb (104 kg), and body mass index (BMI) 32.8 kg/m2. His blood pressure is 115/83 mm Hg and pulse rate is 82 beats per minute and regular. Findings on cardiovascular and pulmonary examination are normal. He has large fatty breasts but without palpable glandular tissue.
Genitourinary examination reveals normal hair distribution, a normal-sized penis, and slightly soft testes with testicular volume of 18–20 mL bilaterally.
His primary care physician suspects that he has low testosterone and orders some basic laboratory tests; the results are normal except for a low total testosterone level (Table 1).
FURTHER TESTING
1. Which of the following tests should his physician order next?
- Repeat total testosterone measurement
- Free testosterone measurement by commercial assay
- Calculated free testosterone
- Bioavailable testosterone measurement
- Serum inhibin B measurement
This patient presents with several nonspecific symptoms. But collectively they suggest testosterone deficiency (hypogonadism).
Together, erectile dysfunction, low libido, and decreased morning erections strongly suggest hypogonadism.2 Loss of body hair and decreased shaving frequency are specific symptoms of hypogonadism; however, they require years to develop.3 Gynecomastia can also occur due to loss of the inhibitory action of testosterone on breast growth and a relative increase in estradiol. This occurs more in primary hypogonadism, due to the increase in luteinizing hormone (LH), which stimulates the remaining Leydig cells to secrete estradiol rather than testosterone.4
To diagnose hypogonadism in men and to start treatment for it, current guidelines recommend that the patient should have clinical features as well as laboratory evidence of low testosterone.5,6
Measuring testosterone: Total, free, bound, and bioavailable
Testosterone, a steroid hormone, circulates in the serum either as free testosterone or bound to several plasma proteins, mainly sex-hormone binding globulin (SHBG) and albumin.
Total testosterone includes both the free and bound fractions, whereas bioavailable testosterone includes both free and the portion bound to albumin, which has low affinity and can dissociate and be used at the tissue level.11
Low levels of total testosterone do not necessarily reflect a hypogonadal state, as a man with altered SHBG levels or binding capabilities can have low total but normal free testosterone levels and no manifestations.12 Several conditions can alter the levels of SHBG, including obesity, diabetes, aging, thyroid dysfunction, and others.5,13
Because our patient is obese, his total testosterone level is not a reliable indicator of hypogonadism, and repeating its measurement will not add diagnostic value.
Therefore, an alternative measurement should be used to accurately reflect the testosterone levels. From a physiologic point of view, bioavailable testosterone is the active form of testosterone and is the most accurate to be measured in a patient with hypogonadism. Nevertheless, because of technical difficulties in its measurement and lack of evidence correlating bioavailable testosterone with the clinical picture of hypogonadism, it is recommended that the level of free testosterone be used.5
The gold standard for direct measurement of serum free testosterone is equilibrium dialysis, but this is expensive and time-consuming.14 Commercial assays for free testosterone exist but have been deemed unreliable.14,15 It is recommended that free testosterone be measured by equilibrium dialysis or calculated using equations based on total testosterone, SHBG, and albumin levels.5 These equations are reliable and give results very close to the values obtained by equilibrium dialysis.15 Therefore, in our patient, it would be suitable to calculate the free testosterone level next.
Serum levels of free testosterone vary according to several factors. Diurnal variation of testosterone has been established: levels are highest in the morning and decline throughout the day.16 Food decreases testosterone levels.17 In addition, there is considerable day-to-day variation.18 Therefore, at least 2 readings of fasting morning testosterone on 2 separate days are recommended for the diagnosis of hypogonadism.5
Inhibin B is a hormone produced by Sertoli cells in the testes in response to follicle-stimulating hormone (FSH) stimulation. In turn, it acts as negative feedback, together with testosterone, to inhibit FSH release from the pituitary. Inhibin B has been shown to reflect spermatogenesis in the testes and therefore fertility.19 Inhibin B levels were found to be low in patients with central hypogonadism, due to less FSH release; however, they did not correlate with testosterone levels.20
CASE RESUMED: CHARACTERIZING HIS HYPOGONADISM
The patient’s physician orders morning fasting total testosterone, SHBG, and albumin testing and calculates the free testosterone level, which yields a value of 3 ng/dL (reference range 4.5–17). This is confirmed by a repeat measurement, which yields a value of 2.9 ng/dL. Laboratory test results combined with his clinical presentation are consistent with hypogonadism.
2. What is the most appropriate next step?
- Measurement of serum LH and FSH
- Measurement of serum prolactin
- Scrotal ultrasonography
- Gonadotropin-releasing hormone (GnRH) stimulation test
- Semen analysis
After hypogonadism is diagnosed, it is important to distinguish if it is primary or central. This is achieved by measuring serum LH and FSH.5 All biotin supplements should be stopped at least 72 hours before measuring LH and FSH, as biotin can interfere with the assays, yielding false values.21
Secretion of FSH and LH from the anterior pituitary is under the influence of pulsatile release of GnRH from the hypothalamus. LH acts on Leydig cells in the testes to produce testosterone, whereas FSH acts on Sertoli cells, together with testosterone, to bring about spermatogenesis in the seminiferous tubules. Testosterone acts centrally as negative feedback to decrease the release of LH and FSH.
Primary hypogonadism occurs due to testicular failure, ie, the testes themselves fail to produce testosterone, leading to hypogonadism. The decrease in testosterone levels, together with inhibin B if Sertoli cells are damaged, lead to loss of negative feedback on the hypothalamus and pituitary, and therefore increased levels of LH and FSH. This is termed hypergonadotropic hypogonadism. Testicular failure may also result in impaired spermatogenesis and infertility due to destruction of testicular structures, in which case fertility cannot be restored.
Central hypogonadism occurs when the pituitary fails to produce LH and FSH (secondary hypogonadism) or when the hypothalamus fails to produce GnRH and subsequently the lack of secretion of LH and FSH from the pituitary (tertiary hypogonadism). The lack of LH will result in no stimulation of Leydig cells to produce testosterone, and therefore its deficiency. Serum hormone levels in central hypogonadism will reveal low testosterone, with either low or inappropriately normal gonadotropins (LH and FSH). This is termed hypogonadotropic hypogonadism. The lack of FSH, together with testosterone deficiency will also result in decreased spermatogenesis and therefore infertility. Testicular structures are preserved, however, and fertility can be restored with appropriate therapy, as discussed below.
Prolactin should be measured only if the patient has central hypogonadism. Its measurement is not warranted at this point in the patient’s workup. The implications of prolactin and its relationship to hypogonadism will be discussed later.
Although, this stepwise approach is not convenient for many patients, some physicians follow it because it is cost-effective, especially in those who are not insured. However, other physicians order FSH, LH, and sometimes prolactin with the confirmatory low testosterone measurement. Laboratories can also be instructed to wait to measure the pituitary hormones and to do so only if low testosterone is confirmed.
Varicocele, a possible cause of male infertility, can also impair Leydig cell function and cause low testosterone. In fact, surgical repair of varicocele has been demonstrated to increase serum testosterone.22 Scrotal ultrasonography is used to diagnose varicocele, but this also should be ordered at a later stage in the workup if primary hypogonadism is diagnosed.
The GnRH stimulation test is important for the diagnosis and evaluation of precocious or delayed puberty in children. In boys with delayed puberty, a poorer response to GnRH stimulation indicates central hypogonadism rather than constitutional delay.23 It has no role in the evaluation of postpubertal or adult-onset hypogonadism.
Semen analysis is important to evaluate fertility if the patient is interested in further procreation.5 Low testosterone levels may result in impaired spermatogenesis and therefore infertility. On the other hand, treatment with exogenous testosterone will also result in infertility, by feedback inhibition of LH and FSH and therefore inhibition of spermatogenesis. If the patient wishes to preserve fertility, treatment options other than testosterone should be considered; examples include clomiphene citrate, human menopausal gonadotropin, and human chorionic gonadotropin.23,24
Our patient has no desire to expand his family; therefore, a semen analysis and attempts to preserve spermatogenesis are not indicated.
CASE RESUMED: SEARCHING FOR CAUSES
His physician orders testing of serum LH and FSH, yielding the following values:
- LH 1.6 mIU/mL (reference range 1.8–12)
- FSH 1.9 mIU/mL (reference range 1.5–12.5).
The diagnosis of central hypogonadism is established.
3. Which investigation is the least appropriate in the further evaluation of this patient?
- Serum prolactin measurement
- Serum ferritin measurement
- Pituitary magnetic resonance imaging (MRI)
- Chromosomal karyotyping
The diagnosis of central hypogonadism warrants evaluation for possible causes. These are summarized in Table 4.
Serum free thyroxine and morning cortisol
Since this patient’s LH and FSH values are abnormal, it is important to evaluate the status of other anterior pituitary hormones. In patients with pituitary abnormalities, serum free T4 is a more reliable test for assessing thyroid function than thyroid-stimulating hormone (TSH), because of loss of the negative feedback of thyroid hormones on the diseased pituitary. In contrast, serum TSH is considered the best single thyroid test to assess primary thyroid dysfunction.
Other measurements include prolactin and morning cortisol (reflecting adrenocorticotropic hormone status).
Prolactin measurement
Prolactin measurement is important to evaluate for hyperprolactinemia, as this will lead to hypogonadism by inhibition of GnRH secretion.25 Different pathologic, pharmacologic, and physiologic conditions can result in hyperprolactinemia, including prolactinomas, other pituitary and hypothalamic lesions, primary hypothyroidism, and medications such as antipsychotics.25 Dopamine agonists are the mainstay treatment for hyperprolactinemia.
Ferritin measurement
Ferritin measurement is indicated to diagnose iron overload conditions such as hemochromatosis, which can result in primary hypogonadism via testicular damage or in secondary hypogonadism via pituitary damage.26
Pituitary MRI with contrast
Pituitary MRI with contrast is used to diagnose structural lesions of the pituitary or hypothalamus. This diagnostic modality is indicated for patients with pituitary dysfunction, including central hypogonadism, manifestations of a mass effect (headache, visual field defects), persistent hyperprolactinemia, and panhypopituitarism, among others. To improve the diagnostic yield of pituitary MRI, the Endocrine Society guidelines recommend it for men with serum total testosterone levels below 150 ng/dL.5 However, some clinicians have a lower threshold for ordering pituitary MRI for patients with central hypogonadism. Physician judgment and expertise should be exercised and the decision made on an individual basis.
Chromosomal karyotyping
Chromosomal karyotyping is not indicated in our patient. It is reserved for those with primary hypogonadism to diagnose Klinefelter syndrome, which has a karyotype of 47,XXY.
CASE RESUMED: MOSH SYNDROME
Our patient’s prolactin, free T4, morning cortisol, and ferritin levels are measured, yielding normal values. No abnormalities are seen on pituitary MRI. A clinical reevaluation is conducted, revealing no history of head trauma or head and neck radiation. The lack of an obvious cause in our patient’s clinical presentation and workup, together with his obesity (BMI 32.8 kg/m2) supports the diagnosis of obesity as the cause of his hypogonadism.
Obesity can be a cause of secondary hypogonadism, which has led to the term “MOSH” (male obesity-associated secondary hypogonadism) syndrome. In fact, a cross-sectional study has demonstrated that 40% of nondiabetic obese (BMI ≥ 30 kg/m2) men over age 45 have low serum free testosterone levels, compared with 26% for lean (BMI < 25 kg/m2) men.27 Moreover, obesity has been found to be a strong predictor of testosterone replacement therapy.28 Other studies have also found an inverse relationship between BMI and testosterone levels.29
Several mechanisms interact in the pathogenesis of MOSH syndrome. Adipose tissue possesses aromatase activity, which converts androgens into estrogens.30 Peripheral estrogen production can in turn exert feedback inhibition on pituitary gonadotropin secretion.31 In obese men, increased adipose tissue leads to increased aromatase activity and more estrogen, so more feedback inhibition on the pituitary and subsequently secondary hypogonadism.
Leptin, a hormone produced by adipocytes, is also increased in obesity, and was found to be inversely correlated with serum testosterone.32 Studies have demonstrated that leptin has an inhibitory effect on the enzymatic pathway that synthesizes testosterone in Leydig cells.33
Proinflammatory cytokines have also been implicated, as central obesity is associated with an increase in these cytokines, which in turn act negatively on the hypothalamus and impair GnRH release leading to lower testosterone.34,35
Treating obesity-related hypogonadism
In a pilot study,36 lifestyle attempts to reduce obesity were shown to improve hormonal levels. Bariatric surgery has also been demonstrated to be successful.37
Clomiphene citrate, a selective estrogen receptor modulator, increases endogenous testosterone secretion by inhibiting the negative feedback of estrogen on the hypothalamus and pituitary and thus increasing LH and FSH. It also preserves endogenous testosterone production, since it does not suppress the hypothalamic-pituitary-testicular axis.38 This made clomiphene citrate a potential treatment for men with central hypogonadism including those with MOSH.39
Nevertheless, there are no randomized trials to prove its safety and efficacy in the management of central hypogonadism.5 Regarding its use in men wishing to preserve fertility, most studies did not show improvement. However, a meta-analysis demonstrated statistically significant increased pregnancy rates in partners of men with idiopathic infertility if the men used 50 mg of clomiphene citrate daily.40
Testosterone deficiency can be a marker of metabolic syndrome, which needs to be managed more urgently than hypogonadism. A cross-sectional study found not only an association between metabolic syndrome and low serum testosterone, but also with each individual component of metabolic syndrome on its own, all of which need to be addressed.10
CASE CONTINUED: BEGINNING TREATMENT
The physician counsels the patient regarding the implications, potential adverse outcomes, and available treatments for his obesity, including lifestyle modification and bariatric surgery. The patient declines surgery and wishes to adopt a weight-reducing diet and exercise program, for which he is referred to a dietitian.
In addition, in view of the patient’s clinically and biochemically proven hypogonadism, his physician offers testosterone replacement therapy. He orders a serum prostate-specific antigen (PSA) level, which is 1.3 ng/dL (reference range < 4 ng/dL). The patient is prescribed 5 g of 1% testosterone gel daily.
TESTOSTERONE REPLACEMENT THERAPY
4. Which is the most common adverse effect of testosterone replacement therapy?
- Cardiovascular events
- Erythrocytosis
- Prostate cancer
- Infertility
- Obstructive sleep apnea
Clinicians should be very cautious in initiating testosterone replacement therapy in any patient with an unstable medical condition.
There are several formulations of testosterone replacement therapy, including intramuscular injections, transdermal gels or patches, buccal tablets, an intranasal gel, and oral tablets. Of note, there are 2 different forms of oral testosterone preparations: testosterone undecanoate and 17-alpha alkylated testosterone. The former is unavailable in the United States and the latter is not recommended for use due to its proven hepatic toxicity.41
Testosterone and erythrocytosis
Meta-analyses have concluded that the most frequent adverse event of testosterone replacement therapy is a significant rise in hematocrit.42 This rise was found to be dose-dependent and was more marked in older men.43 Although all preparations can cause erythrocytosis, parenteral forms have been observed to raise it the most, particularly short-term injectables.44,45
The mechanism behind this increase is attributed to increased erythropoietin levels and improved usage of iron for red blood cell synthesis.46 In fact, testosterone replacement therapy has been shown to improve hemoglobin levels in patients with anemia.47 On the other hand, increasing hematocrit levels may lead to thrombotic and vasoocclusive events.44
Testosterone and prostate cancer
The relationship between testosterone treatment and prostate cancer has long been studied. Historically, testosterone replacement therapy was believed to increase the risk of prostate cancer; however, recent studies and meta-analyses have shown that this is not the case.42,48 Nevertheless, clinical guidelines still recommend prostate monitoring for men on testosterone replacement therapy.5,6
Testosterone and cardiovascular risk
The evidence regarding this issue has been contradictory and inconsistent. Meta-analyses have demonstrated that low testosterone is associated with higher risk of major adverse cardiovascular events.50 These studies argue for the use of testosterone replacement therapy in hypogonadal men to decrease the risk. However, other studies and meta-analyses have found that testosterone replacement therapy is associated with increased cardiovascular risk and have concluded that major adverse cardiac events are in fact a risk of testosterone replacement therapy.51
Current recommendations advocate against the use of testosterone replacement therapy in men with uncontrolled heart failure or with cardiovascular events in the past 3 to 6 months.5,6 Cardiovascular risk factors should be addressed and corrected, and patients should be educated on cardiovascular symptoms and the need to report them if they occur.
Testosterone and infertility
As described earlier, testosterone replacement therapy increases negative feedback on the pituitary and decreases LH and FSH production, leading to less spermatogenesis. Other treatment options should be sought for hypogonadal men wishing to preserve fertility.
Other adverse effects
Other adverse effects of testosterone replacement therapy include acne, oily skin, obstructive sleep apnea, gynecomastia, and balding.
Given all the adverse events that can be associated with testosterone replacement therapy, the risks and benefits of treating hypogonadism in each patient should be taken into consideration, and an individualized approach is required.
CASE RESUMED: FOLLOW-UP
The patient presents 3 months later for follow-up. He reports significant improvement in his presenting symptoms including energy, libido, and erectile function. He also reports some improvement in his mood and concentration. He has lost 12 lb (5.4 kg) and is still trying to improve his diet and exercise program. He is compliant with his testosterone gel therapy.
His serum calculated free testosterone level is 7.8 ng/dL (4.5–17), and his hematocrit is 46%. The patient is instructed to continue his treatment and to return after 9 months for further follow-up.
TAKE-HOME POINTS
- Men with hypogonadism usually present with nonspecific manifestations, so clinicians should keep a high index of suspicion.
- Both clinical and biochemical evidence of hypogonadism should be present to diagnose and start treatment for it.
- Low levels of serum total testosterone do not necessarily reflect hypogonadism.
- The hormonal profile of central hypogonadism reveals low serum testosterone with low or inappropriately normal serum LH and FSH levels.
Obesity can cause central hypogonadism and should be suspected after pituitary and other systemic causes are excluded.
- Araujo AB, Esche GR, Kupelian V, et al. Prevalence of symptomatic androgen deficiency in men. J Clin Endocrinol Metab 2007; 92(11):4241–4247. doi:10.1210/jc.2007-1245
- Wu FCW, Tajar A, Beynon JM, et al; EMAS Group. Identification of late-onset hypogonadism in middle-aged and elderly men. N Engl J Med 2010; 363(2):123–135. doi:10.1056/NEJMoa0911101
- Arver S, Lehtihet M. Current guidelines for the diagnosis of testosterone deficiency. Front Horm Res 2009; 37:5–20. doi:10.1159/000175839
- Narula HS, Carlson HE. Gynaecomastia—pathophysiology, diagnosis and treatment. Nat Rev Endocrinol 2014; 10(11):684–698. doi:10.1038/nrendo.2014.139
- Bhasin S, Brito JP, Cunningham GR, et al. Testosterone therapy in men with hypogonadism: an Endocrine Society clinical practice guideline. J Clin Endocrinol Metab 2018; 103(5):1715–1744. doi:10.1210/jc.2018-00229
- Mulhall JP, Trost LW, Brannigan RE, et al. Evaluation and management of testosterone deficiency: AUA guideline. J Urol 2018; 200(2):423–432. doi:10.1016/j.juro.2018.03.115
- Balasubramanian V, Naing S. Hypogonadism in chronic obstructive pulmonary disease: incidence and effects. Curr Opin Pulm Med 2012; 18(2):112–117. doi:10.1097/MCP.0b013e32834feb37
- Atlantis E, Fahey P, Cochrane B, Wittert G, Smith S. Endogenous testosterone level and testosterone supplementation therapy in chronic obstructive pulmonary disease (COPD): a systematic review and meta-analysis. BMJ Open 2013; 3(8)pii:e003127. doi:10.1136/bmjopen-2013-003127
- Bawor M, Bami H, Dennis BB, et al. Testosterone suppression in opioid users: a systematic review and meta-analysis. Drug Alcohol Depend 2015; 149:1–9. doi:10.1016/j.drugalcdep.2015.01.038
- Tan WS, Ng CJ, Khoo EM, Low WY, Tan HM. The triad of erectile dysfunction, testosterone deficiency syndrome and metabolic syndrome: findings from a multi-ethnic Asian men study (The Subang Men's Health Study). Aging Male 2011; 14(4):231–236. doi:10.3109/13685538.2011.597463
- Goldman AL, Bhasin S, Wu FCW, Krishna M, Matsumoto AM, Jasuja R. A reappraisal of testosterone’s binding in circulation: physiological and clinical implications. Endocr Rev 2017; 38(4):302–324. doi:10.1210/er.2017-00025
- Antonio L, Wu FC, O’Neill TW, et al; European Male Ageing Study Study Group. Low free testosterone is associated with hypogonadal signs and symptoms in men with normal total testosterone. J Clin Endocrinol Metab 2016; 101(7):2647–2657. doi:10.1210/jc.2015-4106
- Liu F, Shen X, Wang R, et al. Association of central obesity with sex hormone binding globulin: a cross-sectional study of 1166 Chinese men. Open Med (Wars) 2018; 13:196–202. doi:10.1515/med-2018-0030
- Vermeulen A, Verdonck L, Kaufman JM. A critical evaluation of simple methods for the estimation of free testosterone in serum. J Clin Endocrinol Metab 1999; 84(10):3666–3672. doi:10.1210/jcem.84.10.6079
- Halmenschlager G, Rhoden EL, Riedner CE. Calculated free testosterone and radioimmunoassay free testosterone as a predictor of subnormal levels of total testosterone. Int Urol Nephrol 2012; 44(3):673–681. doi:10.1007/s11255-011-0066-z
- Brambilla DJ, Matsumoto AM, Araujo AB, McKinlay JB. The effect of diurnal variation on clinical measurement of serum testosterone and other sex hormone levels in men. J Clin Endocrinol Metab 2009; 94(3):907–913. doi:10.1210/jc.2008-1902
- Lehtihet M, Arver S, Bartuseviciene I, Pousette Å. S-testosterone decrease after a mixed meal in healthy men independent of SHBG and gonadotrophin levels. Andrologia 2012; 44(6):405–410. doi:10.1111/j.1439-0272.2012.01296.x
- Brambilla DJ, O’Donnell AB, Matsumoto AM, McKinlay JB. Intraindividual variation in levels of serum testosterone and other reproductive and adrenal hormones in men. Clin Endocrinol (Oxf) 2007; 67(6):853–862. doi:10.1111/j.1365-2265.2007.02976.x
- Manzoor SM, Sattar A, Hashim R, et al. Serum inhibin B as a diagnostic marker of male infertility. J Ayub Med Coll Abbottabad 2012; 24(3–4):113–116. pmid:24669628
- Kolb BA, Stanczyk FZ, Sokol RZ. Serum inhibin B levels in males with gonadal dysfunction. Fertil Steril 2000; 74(2):234–238. pmid:10927037
- Trambas CM, Sikaris KA, Lu ZX. More on biotin treatment mimicking Graves’ disease. N Engl J Med 2016; 375(17):1698. doi:10.1056/NEJMc1611875
- Li F, Yue H, Yamaguchi K, et al. Effect of surgical repair on testosterone production in infertile men with varicocele: a meta-analysis. Int J Urol 2012; 19(2):149–154. doi:10.1111/j.1442-2042.2011.02890.x
- Crosnoe-Shipley LE, Elkelany OO, Rahnema CD, Kim ED. Treatment of hypogonadotropic male hypogonadism: case-based scenarios. World J Nephrol 2015; 4(2):245–253. doi:10.5527/wjn.v4.i2.245
- Majzoub A, Sabanegh E Jr. Testosterone replacement in the infertile man. Transl Androl Urol 2016; 5(6):859–865. doi:10.21037/tau.2016.08.03
- Majumdar A, Mangal NS. Hyperprolactinemia. J Hum Reprod Sci 2013; 6(3):168–175. doi:10.4103/0974-1208.121400
- El Osta R, Grandpre N, Monnin N, Hubert J, Koscinski I. Hypogonadotropic hypogonadism in men with hereditary hemochromatosis. Basic Clin Androl 2017; 27:13. doi:10.1186/s12610-017-0057-8
- Dhindsa S, Miller MG, McWhirter CL, et al. Testosterone concentrations in diabetic and nondiabetic obese men. Diabetes Care 2010; 33(6):1186–1192. doi:10.2337/dc09-1649
- Jasuja GK, Bhasin S, Reisman JI, et al. Who gets testosterone? Patient characteristics associated with testosterone prescribing in the Veteran Affairs system: a cross-sectional study. J Gen Intern Med 2017; 32(3):304–311. doi:10.1007/s11606-016-3940-7
- Kaplan SA, Lee JY, O’Neill EA, Meehan AG, Kusek JW. Prevalence of low testosterone and its relationship to body mass index in older men with lower urinary tract symptoms associated with benign prostatic hyperplasia. Aging Male 2013; 16(4):169–172. doi:10.3109/13685538.2013.844786
- Lee HK, Lee JK, Cho B. The role of androgen in the adipose tissue of males. World J Mens Health 2013; 31(2):136–140. doi:10.5534/wjmh.2013.31.2.136
- Raven G, De Jong FH, Kaufman JM, De Ronde W. In men, peripheral estradiol levels directly reflect the action of estrogens at the hypothalamo-pituitary level to inhibit gonadotropin secretion. J Clin Endocrinol Metab 2006; 91(9):3324–3328. doi:10.1210/jc.2006-0462
- Hofny ER, Ali ME, Abdel-Hafez HZ, et al. Semen parameters and hormonal profile in obese fertile and infertile males. Fertil Steril 2010; 94(2):581–584. doi:10.1016/j.fertnstert.2009.03.085
- Isidori AM, Caprio M, Strollo F, et al. Leptin and androgens in male obesity: evidence for leptin contribution to reduced androgen levels. J Clin Endocrinol Metab 1999; 84(10):3673–3680. doi:10.1210/jcem.84.10.6082
- El-Wakkad A, Hassan NM, Sibaii H, El-Zayat SR. Proinflammatory, anti-inflammatory cytokines and adiponkines in students with central obesity. Cytokine 2013; 61(2):682–687. doi:10.1016/j.cyto.2012.11.010
- Maggio M, Basaria S, Ceda GP, et al. The relationship between testosterone and molecular markers of inflammation in older men. J Endocrinol Invest 2005; 28(suppl proceedings 11):116–119. pmid:16760639
- de Lorenzo A, Noce A, Moriconi E, et al. MOSH syndrome (male obesity secondary hypogonadism): clinical assessment and possible therapeutic approaches. Nutrients 2018; 10(4)pii:E474. doi:10.3390/nu10040474
- Escobar-Morreale HF, Santacruz E, Luque-Ramírez M, Botella Carretero JI. Prevalence of ‘obesity-associated gonadal dysfunction’ in severely obese men and women and its resolution after bariatric surgery: a systematic review and meta-analysis. Hum Reprod Update 2017; 23(4):390–408. doi:10.1093/humupd/dmx012
- Lo EM, Rodriguez KM, Pastuszak AW, Khera M. Alternatives to testosterone therapy: a review. Sex Med Rev 2018; 6(1):106–113. doi:10.1016/j.sxmr.2017.09.004
- Soares AH, Horie NC, Chiang LAP, et al. Effects of clomiphene citrate on male obesity-associated hypogonadism: a randomized, double-blind, placebo-controlled study. Int J Obes (Lond) 2018; 42(5):953–963. doi:10.1038/s41366-018-0105-2
- Chua ME, Escusa KG, Luna S, Tapia LC, Dofitas B, Morales M. Revisiting oestrogen antagonists (clomiphene or tamoxifen) as medical empiric therapy for idiopathic male infertility: a meta-analysis. Andrology 2013; 1(5):749–757. doi:10.1111/j.2047-2927.2013.00107.x
- Westaby D, Ogle SJ, Paradinas FJ, Randell JB, Murray-Lyon IM. Liver damage from long-term methyltestosterone. Lancet 1977; 2(8032):262–263. pmid:69876
- Fernández-Balsells MM, Murad MH, Lane M, et al. Clinical review 1: Adverse effects of testosterone therapy in adult men: a systematic review and meta-analysis. J Clin Endocrinol Metab 2010; 95(6):2560–2575. doi:10.1210/jc.2009-2575
- Coviello AD, Kaplan B, Lakshman KM, Chen T, Singh AB, Bhasin S. Effects of graded doses of testosterone on erythropoiesis in healthy young and older men. J Clin Endocrinol Metab 2008; 93(3):914–919. doi:10.1210/jc.2007-1692
- Ohlander SJ, Varghese B, Pastuszak AW. Erythrocytosis following testosterone therapy. Sex Med Rev 2018; 6(1):77–85. doi:10.1016/j.sxmr.2017.04.001
- Jones SD Jr, Dukovac T, Sangkum P, Yafi FA, Hellstrom WJ. Erythrocytosis and polycythemia secondary to testosterone replacement therapy in the aging male. Sex Med Rev 2015; 3(2):101–112. doi:10.1002/smrj.43
- Bachman E, Travison TG, Basaria S, et al. Testosterone induces erythrocytosis via increased erythropoietin and suppressed hepcidin: evidence for a new erythropoietin/hemoglobin set point. J Gerontol A Biol Sci Med Sci 2014; 69(6):725–735. doi:10.1093/gerona/glt154
- Roy CN, Snyder PJ, Stephens-Shields AJ, et al. Association of testosterone levels with anemia in older men: a controlled clinical trial. JAMA Intern Med 2017; 177(4):480–490. doi:10.1001/jamainternmed.2016.9540
- Klap J, Schmid M, Loughlin KR. The relationship between total testosterone levels and prostate cancer: a review of the continuing controversy. J Urol 2015; 193(2):403–413. doi:10.1016/j.juro.2014.07.123
- Gilbert SM, Cavallo CB, Kahane H, Lowe FC. Evidence suggesting PSA cutpoint of 2.5 ng/mL for prompting prostate biopsy: review of 36,316 biopsies. Urology 2005; 65(3):549–553. doi:10.1016/j.urology.2004.10.064
- Araujo AB, Dixon JM, Suarez EA, Murad MH, Guey LT, Wittert GA. Clinical review: Endogenous testosterone and mortality in men: a systematic review and meta-analysis. J Clin Endocrinol Metab 2011; 96(10):3007–3019. doi:10.1210/jc.2011-1137
- Xu L, Freeman G, Cowling BJ, Schooling CM. Testosterone therapy and cardiovascular events among men: a systematic review and meta-analysis of placebo-controlled randomized trials. BMC Med 2013; 11:108. doi:10.1186/1741-7015-11-108

A woman, age 35, with new-onset ascites
A 35-year-old woman is admitted to the hospital with a 5-day history of abdominal distention and jaundice. She reports no history of fever, chills, night sweats, abdominal pain, nausea, vomiting, diarrhea, changes in urine color, change in stool color, weight loss, weight gain, or loss of appetite.
She is petite, with a body mass index of 19.4 kg/m2. She has no known history of medical conditions or surgery and is not taking any medications. Her family history is unremarkable, and she denies current or past tobacco, alcohol, or illicit drug use.
RECENT TRAVEL
She says that during a trip to Central America several months ago, she had suffered a seizure and was taken to a local hospital, where laboratory testing revealed elevated aspartate aminotransferase (AST) and alanine aminotransferase (ALT) levels. She says that the rest of the workup at that time was normal.
About 1 week after that incident, she returned home and saw her primary care physician, who ordered further testing, which showed mild hyperbilirubinemia and mild elevation of AST and ALT levels. Her physician attributed the elevations to atovaquone, which she had been taking for malaria prophylaxis, as repeat testing 2 weeks later showed improvement in AST and ALT levels.
The patient says she returned to her normal state of health until about 5 days ago, when she noticed jaundice and abdominal distention, but without abdominal pain, dark urine, or clay-colored stools. She became concerned and went to her local hospital. Testing there noted mild elevation of AST and ALT, as well as an elevated international normalized ratio (INR) and hyperbilirubinemia. Computed tomography of the abdomen and pelvis showed hepatomegaly with possible fatty liver. Because of these results, the patient was transferred to our institution for further evaluation.
EVALUATION AT OUR INSTITUTION
On examination at our institution, she is afebrile, and vital signs are within normal ranges. She has bilateral scleral icterus and diffuse jaundice, but no other skin finding such as rash or spider angioma. She has no lymphadenopathy. Her abdomen is distended, with tense ascites, and her liver is tender to palpation. The tip of the spleen is not palpable.

The cardiovascular examination reveals no murmurs, rubs, or gallops, but she has jugular venous distention and +2 pitting edema of both lower extremities.
On respiratory examination, there is dullness to percussion, with slight crackles on auscultation at the right lung base. The neurologic examination is normal.
Table 1 shows the results of initial laboratory testing.
1. Which study would provide the most information on the cause of ascites?
- Abdominal ultrasonography
- Abdominal paracentesis with ascitic fluid analysis
- Chest radiography
- Echocardiography
- Urine protein-to-creatinine ratio
Abdominal paracentesis with ascitic fluid analysis is the essential study for any patient with clinically apparent new-onset ascites.1–3 It is the study that provides the most information on the cause of ascites.
In our patient, abdominal paracentesis yields 1,000 mL of straw-colored ascitic fluid, and analysis shows 86 nucleated cells, 28 of which are polymorphonuclear cells, and 0 red blood cells, with negative Gram stain and culture. The ascitic albumin level is 0.85 g/dL, with an ascitic protein of 1.1 g/dL.
Abdominal ultrasonography shows a diffusely echogenic liver, no focal lesions, moderate ascites, normal portal vein flow, no intrahepatic or extrahepatic biliary duct dilation, normal kidney sizes, no hydronephrosis, and no intra-abdominal mass. Chest radiography is clear with no sign of consolidation, edema, or effusion. Echocardiography shows a normal left ventricular ejection fraction with no valvular disease or pericardial effusion. A random urine protein-creatinine ratio is normal at 0.1 (reference range < 0.2).
2. What is the most likely cause of her ascites based on the workup to this point?
- Cirrhosis
- Heart failure
- Nephrotic syndrome
- Portal vein thrombus
- Abdominal malignancy
- Malaria
 and ascitic protein levels.")
An initial approach to ascitic fluid analysis is to calculate the serum-ascites albumin gradient (SAAG). The SAAG is calculated as the serum albumin level minus the ascitic fluid albumin level.4,5 This is useful in determining the cause of the ascites (Figure 1).4,5 A gradient of 1.1 g/dL or higher indicates portal hypertension.4,5
Common causes of portal hypertension include cirrhosis, alcoholic hepatitis, heart failure, vascular occlusion syndromes (eg, Budd-Chiari syndrome, portal vein thrombosis), idiopathic portal fibrosis, and metastatic liver disease.5,6
If portal hypertension is present based on the SAAG, the next step is to review the ascitic protein level to help distinguish between a hepatic and a cardiac etiology of the ascites. An ascitic protein level less than 2.5 g/dL indicates a primary liver pathology (eg, cirrhosis). An ascitic protein level of 2.5 g/dL or greater typically indicates a cardiac condition (eg, heart failure, pericardial disease) with secondary congestive hepatopathy.5,6
If the SAAG is less than 1.1 g/dL, the ascites is likely not from portal hypertension. Typical causes of a low SAAG include infection, malignancy, pancreatic ascites, and nephrotic syndrome.5,6
In our patient, the SAAG is 1.35 g/dL (2.2 g/dL minus 0.85 g/dL), ie, elevated and due to portal hypertension. With an SAAG of 1.1 g/dL or greater and an ascitic fluid protein level less than 2.5 g/dL, as in our patient, the most likely cause is cirrhosis.
Heart failure is unlikely based on her normal brain natriuretic peptide level, an ascitic fluid protein level below 2.5 g/dL, and normal results on echocardiography. Nephrotic syndrome is also very unlikely based on the patient’s normal random urine protein-creatinine ratio. Portal vein thrombus and abdominal malignancy are essentially ruled out by the negative results of Doppler abdominal ultrasonography, with normal venous flow and no intra-abdominal mass and coupled with an elevated SAAG.
Although the patient has a history of travel, the incubation period for malaria would not fit the time frame of presentation. Also, she did not have typical malarial symptoms, her rapid malaria test was negative, and a peripheral blood smear for blood parasites was negative. It should be noted, however, that Plasmodium malariae infection classically presents with flulike symptoms and can resemble nephrotic syndrome, including peripheral edema, ascites, heavy proteinuria, hypoalbuminemia, and hyperlipidemia.7
3. In which patients is antibiotic prophylaxis against spontaneous bacterial peritonitis (SBP) appropriate?
- Any patient with cirrhosis
- Any patient with cirrhosis who is hospitalized
- Any patient with cirrhosis and an ascitic fluid protein level below 2.0 g/dL
- Any patient with cirrhosis and a history of SBP
Any patient with cirrhosis and a history of SBP should receive prophylactic antibiotics,8 as should any patient deemed at high risk of SBP. It is indicated in the following patients:
- Patients with cirrhosis and gastrointestinal bleeding9,10
- Patients with cirrhosis and a previous episode of SBP8
- Patients with cirrhosis and an ascitic fluid protein level less than 1.5 g/dL with either impaired renal function (creatinine ≥ 1.2 mg/dL, blood urea nitrogen level ≥ 25 mg/dL, or serum sodium ≤ 130 mmol/L) or liver failure (Child-Pugh score ≥ 9 and a bilirubin ≥ 3 mg/dL)9
- Patients with cirrhosis who are hospitalized for other reasons and have an ascitic protein level < 1.0 g/dL.9
Our patient has no signs or symptoms of gastrointestinal bleeding and no history of SBP. Her ascitic fluid protein level is 1.1 g/dL, and she has normal renal function. However, her Child-Pugh score is 12 (3 points for total bilirubin > 3 mg/dL, 3 points for serum albumin < 2.8 g/dL, 2 points for an INR 1.7 to 2.2, 3 points for moderate ascites, and 1 point for no encephalopathy), with a bilirubin of 17.0 mg/dL. Based on this, she is placed on antibiotic prophylaxis for SBP.
Our patient then undergoes an extensive workup for liver disease. Results of tests for toxins, autoimmune diseases, and inheritable diseases are all within normal limits. At this point, despite the patient’s reported negative alcohol history, our leading diagnosis is alcoholic hepatitis.
 shows severe steatosis from lipid accumulation in hepatocytes (arrow). Higher magnification (bottom) shows inflammatory cells (neutrophils, arrows) surrounding Mallory-Denk bodies.")
To confirm this diagnosis, she subsequently undergoes transjugular liver biopsy, considered the gold standard for the diagnosis of alcoholic hepatitis. During the procedure, the hepatic venous pressure gradient is measured at 18 mm Hg (reference range 1–5 mm Hg), suggestive of portal hypertension. The pathology study shows severe fatty change, active steatohepatitis with ballooning degeneration, easily identifiable Mallory-Denk bodies, and prominent neutrophilic infiltration, as well as extensive bridging fibrosis (Figure 2). These findings point to alcoholic hepatitis.
After the biopsy results, we speak with the patient further about her alcohol habits. At this point, she informs us that she has consumed significant amounts of alcohol since the age of 18 (6 to 12 alcoholic beverages per day, including beer and hard liquor). Therefore, based on this new information, on her jaundice and ascites, and on results of laboratory testing and biopsy, we confirmed our diagnosis of alcoholic hepatitis.
4. When is drug treatment appropriate for alcoholic hepatitis?
- Model for End-stage Liver Disease (MELD) score greater than 12
- MELD score greater than 15
- Maddrey Discriminant Function score greater than 25
- Maddrey Discriminant Function score greater than 32
- Glasgow score greater than 5
- Glasgow score greater than 7
The best answer is a Maddrey Discriminant Function score greater than 32. A variety of scoring systems have been used to assess the severity of alcoholic hepatitis and to guide treatment, including the Maddrey Discriminant Function score, the MELD score, and the Glasgow score.11–16 They share similar laboratory values in their calculations, including prothrombin time (or INR) and total bilirubin.11–16 Typically, a Maddrey Discriminant Function score greater than 32, a Glasgow score of greater than 9, or a MELD score greater than 21 is used to determine whether pharmacologic treatment is indicated.11–16

The typical treatment is prednisolone or pentoxifylline.11,17–21 The Lille score is designed to help decide whether to stop corticosteroids after 1 week of administration due to lack of treatment response.22 It predicts mortality rates within 6 months; a score of 0.45 or less indicates a good prognosis, and corticosteroid therapy should continue for 28 days (Figure 3).22
Our patient’s discriminant function score is 50, her Glasgow score is 10, and her MELD score is 28; thus, she begins treatment with oral prednisolone. Her Lille score at 1 week is 0.119, indicating a good prognosis, and her corticosteroids are continued for a total of 28 days.
It should be highlighted that the most important treatment is abstinence from alcohol.11 Recent literature suggests that any benefit of prednisolone or pentoxifylline in terms of mortality rates is questionable,19–20 and there is evidence that giving both drugs simultaneously may improve mortality rates,11,21 but the evidence remains conflicting at this time.
ALCOHOLIC HEPATITIS
Alcoholic hepatitis is a clinical syndrome of jaundice and liver failure, often in the setting of heavy alcohol use for decades.11,12 The incidence is unknown, but the typical age of presentation is between 40 and 50.11,12 The chief sign is a rapid onset of jaundice (< 3 months); common signs and symptoms include fever, ascites, proximal muscle loss, and an enlarged, tender liver.12 Encephalopathy may be seen in severe alcoholic hepatitis.12
Our patient is 35 years old. She has jaundice with rapid onset, as well as ascites and a tender liver.
The diagnosis of alcoholic hepatitis must take into account the patient’s history, physical examination, and laboratory findings. Until proven otherwise, the diagnosis should be presumed in the following scenario: ascites and jaundice on examination (usually with a duration < 3 months); a history of heavy alcohol use; neutrophilic leukocytosis; an AST level that is elevated but below 300 U/L; an ALT level above the normal range but below 300 U/L; an AST-ALT ratio greater than 2; a total serum bilirubin level above 5 mg/dL; and an elevated INR.11,12 Liver biopsy is the gold standard for diagnosis. Though not routinely done because of risks associated with the procedure, it may help confirm the diagnosis if it is in question.
CASE CONCLUDED
We start our patient on oral prednisolone 40 mg daily for alcoholic hepatitis. Her symptoms and laboratory testing results including bilirubin improve. Her Lille score at 7 days indicates a good prognosis, prompting continuation of corticosteroid treatment for the full 28 days.
She is referred to an outpatient alcohol rehabilitation program and has remained sober as of the last outpatient note.
Alcoholic hepatitis is extremely difficult to diagnose, and no single blood test or imaging study confirms the diagnosis. The history, physical examination findings, and laboratory findings are crucial. If the diagnosis is still in doubt, liver biopsy may help confirm the diagnosis.
- Ruyon BA; AASLD Practice Guidelines Committee. Management of adult patients with ascites due to cirrhosis: an update. Hepatology 2009; 49(6):2087–2107. doi:10.1002/hep.22853
- Hoefs JC, Canawati HN, Sapico FL, Hopkins RR, Weiner J, Montgomerie JZ. Spontaneous bacterial peritonitis. Hepatology 1982; 2(4):399–407. pmid:7095741
- Ginès P, Cárdenas A, Arroyo V, Rodés J. Management of cirrhosis and ascites. N Engl J Med 2004; 350(16):1646–1654. doi:10.1056/NEJMra035021
- Runyon BA, Montano AA, Akriviadis EA, Antillon MR, Irving MA, McHutchison JG. The serum-ascites albumin gradient is superior to the exudate-transudate concept in the differential diagnosis of ascites. Ann Intern Med 1992; 117(3):215–220. pmid:1616215
- Hernaez R, Hamilton JP. Unexplained ascites. Clin Liver Dis 2016; 7(3):53–56. https://aasldpubs.onlinelibrary.wiley.com/doi/epdf/10.1002/cld.537
- Huang LL, Xia HH, Zhu SL. Ascitic fluid analysis in the differential diagnosis of ascites: focus on cirrhotic ascites. J Clin Transl Hepatol 2014; 2(1):58–64. doi:10.14218/JCTH.2013.00010
- Bartoloni A, Zammarchi L. Clinical aspects of uncomplicated and severe malaria. Mediterr J Hematol Infect Dis 2012; 4(1):e2012026. doi:10.4084/MJHID.2012.026
- Titó L, Rimola A, Ginès P, Llach J, Arroyo V, Rodés J. Recurrence of spontaneous bacterial peritonitis in cirrhosis: frequency and predictive factors. Hepatology 1988; 8(1):27–31. pmid:3257456
- Fernández J, Ruiz del Arbol L, Gómez C, et al. Norfloxacin vs ceftriaxone in the prophylaxis of infections in patients with advanced cirrhosis and hemorrhage. Gastroenterology 2006; 131(4):1049–1056. doi:10.1053/j.gastro.2006.07.010
- Runyon B; The American Association for the Study of Liver Diseases (AASLD). Management of adult patients with ascites due to cirrhosis: update 2012. https://www.aasld.org/sites/default/files/guideline_documents/141020_Guideline_Ascites_4UFb_2015.pdf. Accessed September 4, 2018.
- Sidhu SS, Goyal O, Kishore H, Sidhu S. New paradigms in management of alcoholic hepatitis: a review. Hepatol Int 2017; 11(3):255–267. doi:10.1007/s12072-017-9790-5
- Lucey MR, Mathurin P, Morgan TR. Alcoholic hepatitis. N Engl J Med 2009; 360(26):2758–2769. doi:10.1056/NEJMra0805786
- Maddrey WC, Boitnott JK, Bedine MS, Weber FL Jr, Mezey E, White RI Jr. Corticosteroid therapy of alcoholic hepatitis. Gastroenterology 1978; 75(2):193–199. pmid:352788
- Forrest EH, Evans CD, Stewart S, et al. Analysis of factors predictive of mortality in alcoholic hepatitis and derivation and validation of the Glasgow alcoholic hepatitis score. Gut 2005; 54(8):1174–1179. doi:10.1136/gut.2004.050781
- Dunn W, Jamil LH, Brown LS, et al. MELD accurately predicts mortality in patients with alcoholic hepatitis. Hepatology 2005; 41(2):353–358. doi:10.1002/hep.20503
- Sheth M, Riggs M, Patel T. Utility of the Mayo end-stage liver disease (MELD) score in assessing prognosis of patients with alcoholic hepatitis. BMC Gastroenterol 2002; 2:2. pmid:11835693
- Akriviadis E, Botla R, Briggs W, Han S, Reynolds T, Shakil O. Pentoxifylline improves short-term survival in severe acute alcoholic hepatitis: a double-blind, placebo-controlled trial. Gastroenterology 2000; 119(6):1637–1648. pmid:11113085
- Mathurin P, O’Grady J, Carithers RL, et al. Corticosteroids improve short-term survival in patients with severe alcoholic hepatitis: meta-analysis of individual patient data. Gut 2011; 60(2):255–260. doi:10.1136/gut.2010.224097
- Thursz MR, Richardson P, Allison M, et al; STOPAH Trial. Prednisolone or pentoxifylline for alcoholic hepatitis. N Engl J Med 2015; 372(17):1619–1628. doi:10.1056/NEJMoa1412278
- Thursz M, Forrest E, Roderick P, et al. The clinical effectiveness and cost-effectiveness of steroids or pentoxifylline for alcoholic hepatitis (STOPAH): a 2 × 2 factorial randomised controlled trial. Health Technol Assess 2015; 19(102):1–104. doi:10.3310/hta191020
- Lee YS, Kim HJ, Kim JH, et al. Treatment of severe alcoholic hepatitis with corticosteroid, pentoxifylline, or dual therapy: a systematic review and meta-analysis. J Clin Gastroenterol 2017; 51(4):364–377. doi:10.1097/MCG.0000000000000674
- Louvet A, Naveau S, Abdelnour M, et al. The Lille model: a new tool for therapeutic strategy in patients with severe alcoholic hepatitis treated with steroids. Hepatology 2007; 45(6):1348–1354. doi:10.1002/hep.21607
A 35-year-old woman is admitted to the hospital with a 5-day history of abdominal distention and jaundice. She reports no history of fever, chills, night sweats, abdominal pain, nausea, vomiting, diarrhea, changes in urine color, change in stool color, weight loss, weight gain, or loss of appetite.
She is petite, with a body mass index of 19.4 kg/m2. She has no known history of medical conditions or surgery and is not taking any medications. Her family history is unremarkable, and she denies current or past tobacco, alcohol, or illicit drug use.
RECENT TRAVEL
She says that during a trip to Central America several months ago, she had suffered a seizure and was taken to a local hospital, where laboratory testing revealed elevated aspartate aminotransferase (AST) and alanine aminotransferase (ALT) levels. She says that the rest of the workup at that time was normal.
About 1 week after that incident, she returned home and saw her primary care physician, who ordered further testing, which showed mild hyperbilirubinemia and mild elevation of AST and ALT levels. Her physician attributed the elevations to atovaquone, which she had been taking for malaria prophylaxis, as repeat testing 2 weeks later showed improvement in AST and ALT levels.
The patient says she returned to her normal state of health until about 5 days ago, when she noticed jaundice and abdominal distention, but without abdominal pain, dark urine, or clay-colored stools. She became concerned and went to her local hospital. Testing there noted mild elevation of AST and ALT, as well as an elevated international normalized ratio (INR) and hyperbilirubinemia. Computed tomography of the abdomen and pelvis showed hepatomegaly with possible fatty liver. Because of these results, the patient was transferred to our institution for further evaluation.
EVALUATION AT OUR INSTITUTION
On examination at our institution, she is afebrile, and vital signs are within normal ranges. She has bilateral scleral icterus and diffuse jaundice, but no other skin finding such as rash or spider angioma. She has no lymphadenopathy. Her abdomen is distended, with tense ascites, and her liver is tender to palpation. The tip of the spleen is not palpable.
The cardiovascular examination reveals no murmurs, rubs, or gallops, but she has jugular venous distention and +2 pitting edema of both lower extremities.
On respiratory examination, there is dullness to percussion, with slight crackles on auscultation at the right lung base. The neurologic examination is normal.
Table 1 shows the results of initial laboratory testing.
1. Which study would provide the most information on the cause of ascites?
- Abdominal ultrasonography
- Abdominal paracentesis with ascitic fluid analysis
- Chest radiography
- Echocardiography
- Urine protein-to-creatinine ratio
Abdominal paracentesis with ascitic fluid analysis is the essential study for any patient with clinically apparent new-onset ascites.1–3 It is the study that provides the most information on the cause of ascites.
In our patient, abdominal paracentesis yields 1,000 mL of straw-colored ascitic fluid, and analysis shows 86 nucleated cells, 28 of which are polymorphonuclear cells, and 0 red blood cells, with negative Gram stain and culture. The ascitic albumin level is 0.85 g/dL, with an ascitic protein of 1.1 g/dL.
Abdominal ultrasonography shows a diffusely echogenic liver, no focal lesions, moderate ascites, normal portal vein flow, no intrahepatic or extrahepatic biliary duct dilation, normal kidney sizes, no hydronephrosis, and no intra-abdominal mass. Chest radiography is clear with no sign of consolidation, edema, or effusion. Echocardiography shows a normal left ventricular ejection fraction with no valvular disease or pericardial effusion. A random urine protein-creatinine ratio is normal at 0.1 (reference range < 0.2).
2. What is the most likely cause of her ascites based on the workup to this point?
- Cirrhosis
- Heart failure
- Nephrotic syndrome
- Portal vein thrombus
- Abdominal malignancy
- Malaria
An initial approach to ascitic fluid analysis is to calculate the serum-ascites albumin gradient (SAAG). The SAAG is calculated as the serum albumin level minus the ascitic fluid albumin level.4,5 This is useful in determining the cause of the ascites (Figure 1).4,5 A gradient of 1.1 g/dL or higher indicates portal hypertension.4,5
Common causes of portal hypertension include cirrhosis, alcoholic hepatitis, heart failure, vascular occlusion syndromes (eg, Budd-Chiari syndrome, portal vein thrombosis), idiopathic portal fibrosis, and metastatic liver disease.5,6
If portal hypertension is present based on the SAAG, the next step is to review the ascitic protein level to help distinguish between a hepatic and a cardiac etiology of the ascites. An ascitic protein level less than 2.5 g/dL indicates a primary liver pathology (eg, cirrhosis). An ascitic protein level of 2.5 g/dL or greater typically indicates a cardiac condition (eg, heart failure, pericardial disease) with secondary congestive hepatopathy.5,6
If the SAAG is less than 1.1 g/dL, the ascites is likely not from portal hypertension. Typical causes of a low SAAG include infection, malignancy, pancreatic ascites, and nephrotic syndrome.5,6
In our patient, the SAAG is 1.35 g/dL (2.2 g/dL minus 0.85 g/dL), ie, elevated and due to portal hypertension. With an SAAG of 1.1 g/dL or greater and an ascitic fluid protein level less than 2.5 g/dL, as in our patient, the most likely cause is cirrhosis.
Heart failure is unlikely based on her normal brain natriuretic peptide level, an ascitic fluid protein level below 2.5 g/dL, and normal results on echocardiography. Nephrotic syndrome is also very unlikely based on the patient’s normal random urine protein-creatinine ratio. Portal vein thrombus and abdominal malignancy are essentially ruled out by the negative results of Doppler abdominal ultrasonography, with normal venous flow and no intra-abdominal mass and coupled with an elevated SAAG.
Although the patient has a history of travel, the incubation period for malaria would not fit the time frame of presentation. Also, she did not have typical malarial symptoms, her rapid malaria test was negative, and a peripheral blood smear for blood parasites was negative. It should be noted, however, that Plasmodium malariae infection classically presents with flulike symptoms and can resemble nephrotic syndrome, including peripheral edema, ascites, heavy proteinuria, hypoalbuminemia, and hyperlipidemia.7
3. In which patients is antibiotic prophylaxis against spontaneous bacterial peritonitis (SBP) appropriate?
- Any patient with cirrhosis
- Any patient with cirrhosis who is hospitalized
- Any patient with cirrhosis and an ascitic fluid protein level below 2.0 g/dL
- Any patient with cirrhosis and a history of SBP
Any patient with cirrhosis and a history of SBP should receive prophylactic antibiotics,8 as should any patient deemed at high risk of SBP. It is indicated in the following patients:
- Patients with cirrhosis and gastrointestinal bleeding9,10
- Patients with cirrhosis and a previous episode of SBP8
- Patients with cirrhosis and an ascitic fluid protein level less than 1.5 g/dL with either impaired renal function (creatinine ≥ 1.2 mg/dL, blood urea nitrogen level ≥ 25 mg/dL, or serum sodium ≤ 130 mmol/L) or liver failure (Child-Pugh score ≥ 9 and a bilirubin ≥ 3 mg/dL)9
- Patients with cirrhosis who are hospitalized for other reasons and have an ascitic protein level < 1.0 g/dL.9
Our patient has no signs or symptoms of gastrointestinal bleeding and no history of SBP. Her ascitic fluid protein level is 1.1 g/dL, and she has normal renal function. However, her Child-Pugh score is 12 (3 points for total bilirubin > 3 mg/dL, 3 points for serum albumin < 2.8 g/dL, 2 points for an INR 1.7 to 2.2, 3 points for moderate ascites, and 1 point for no encephalopathy), with a bilirubin of 17.0 mg/dL. Based on this, she is placed on antibiotic prophylaxis for SBP.
Our patient then undergoes an extensive workup for liver disease. Results of tests for toxins, autoimmune diseases, and inheritable diseases are all within normal limits. At this point, despite the patient’s reported negative alcohol history, our leading diagnosis is alcoholic hepatitis.
To confirm this diagnosis, she subsequently undergoes transjugular liver biopsy, considered the gold standard for the diagnosis of alcoholic hepatitis. During the procedure, the hepatic venous pressure gradient is measured at 18 mm Hg (reference range 1–5 mm Hg), suggestive of portal hypertension. The pathology study shows severe fatty change, active steatohepatitis with ballooning degeneration, easily identifiable Mallory-Denk bodies, and prominent neutrophilic infiltration, as well as extensive bridging fibrosis (Figure 2). These findings point to alcoholic hepatitis.
After the biopsy results, we speak with the patient further about her alcohol habits. At this point, she informs us that she has consumed significant amounts of alcohol since the age of 18 (6 to 12 alcoholic beverages per day, including beer and hard liquor). Therefore, based on this new information, on her jaundice and ascites, and on results of laboratory testing and biopsy, we confirmed our diagnosis of alcoholic hepatitis.
4. When is drug treatment appropriate for alcoholic hepatitis?
- Model for End-stage Liver Disease (MELD) score greater than 12
- MELD score greater than 15
- Maddrey Discriminant Function score greater than 25
- Maddrey Discriminant Function score greater than 32
- Glasgow score greater than 5
- Glasgow score greater than 7
The best answer is a Maddrey Discriminant Function score greater than 32. A variety of scoring systems have been used to assess the severity of alcoholic hepatitis and to guide treatment, including the Maddrey Discriminant Function score, the MELD score, and the Glasgow score.11–16 They share similar laboratory values in their calculations, including prothrombin time (or INR) and total bilirubin.11–16 Typically, a Maddrey Discriminant Function score greater than 32, a Glasgow score of greater than 9, or a MELD score greater than 21 is used to determine whether pharmacologic treatment is indicated.11–16
The typical treatment is prednisolone or pentoxifylline.11,17–21 The Lille score is designed to help decide whether to stop corticosteroids after 1 week of administration due to lack of treatment response.22 It predicts mortality rates within 6 months; a score of 0.45 or less indicates a good prognosis, and corticosteroid therapy should continue for 28 days (Figure 3).22
Our patient’s discriminant function score is 50, her Glasgow score is 10, and her MELD score is 28; thus, she begins treatment with oral prednisolone. Her Lille score at 1 week is 0.119, indicating a good prognosis, and her corticosteroids are continued for a total of 28 days.
It should be highlighted that the most important treatment is abstinence from alcohol.11 Recent literature suggests that any benefit of prednisolone or pentoxifylline in terms of mortality rates is questionable,19–20 and there is evidence that giving both drugs simultaneously may improve mortality rates,11,21 but the evidence remains conflicting at this time.
ALCOHOLIC HEPATITIS
Alcoholic hepatitis is a clinical syndrome of jaundice and liver failure, often in the setting of heavy alcohol use for decades.11,12 The incidence is unknown, but the typical age of presentation is between 40 and 50.11,12 The chief sign is a rapid onset of jaundice (< 3 months); common signs and symptoms include fever, ascites, proximal muscle loss, and an enlarged, tender liver.12 Encephalopathy may be seen in severe alcoholic hepatitis.12
Our patient is 35 years old. She has jaundice with rapid onset, as well as ascites and a tender liver.
The diagnosis of alcoholic hepatitis must take into account the patient’s history, physical examination, and laboratory findings. Until proven otherwise, the diagnosis should be presumed in the following scenario: ascites and jaundice on examination (usually with a duration < 3 months); a history of heavy alcohol use; neutrophilic leukocytosis; an AST level that is elevated but below 300 U/L; an ALT level above the normal range but below 300 U/L; an AST-ALT ratio greater than 2; a total serum bilirubin level above 5 mg/dL; and an elevated INR.11,12 Liver biopsy is the gold standard for diagnosis. Though not routinely done because of risks associated with the procedure, it may help confirm the diagnosis if it is in question.
CASE CONCLUDED
We start our patient on oral prednisolone 40 mg daily for alcoholic hepatitis. Her symptoms and laboratory testing results including bilirubin improve. Her Lille score at 7 days indicates a good prognosis, prompting continuation of corticosteroid treatment for the full 28 days.
She is referred to an outpatient alcohol rehabilitation program and has remained sober as of the last outpatient note.
Alcoholic hepatitis is extremely difficult to diagnose, and no single blood test or imaging study confirms the diagnosis. The history, physical examination findings, and laboratory findings are crucial. If the diagnosis is still in doubt, liver biopsy may help confirm the diagnosis.
- Ruyon BA; AASLD Practice Guidelines Committee. Management of adult patients with ascites due to cirrhosis: an update. Hepatology 2009; 49(6):2087–2107. doi:10.1002/hep.22853
- Hoefs JC, Canawati HN, Sapico FL, Hopkins RR, Weiner J, Montgomerie JZ. Spontaneous bacterial peritonitis. Hepatology 1982; 2(4):399–407. pmid:7095741
- Ginès P, Cárdenas A, Arroyo V, Rodés J. Management of cirrhosis and ascites. N Engl J Med 2004; 350(16):1646–1654. doi:10.1056/NEJMra035021
- Runyon BA, Montano AA, Akriviadis EA, Antillon MR, Irving MA, McHutchison JG. The serum-ascites albumin gradient is superior to the exudate-transudate concept in the differential diagnosis of ascites. Ann Intern Med 1992; 117(3):215–220. pmid:1616215
- Hernaez R, Hamilton JP. Unexplained ascites. Clin Liver Dis 2016; 7(3):53–56. https://aasldpubs.onlinelibrary.wiley.com/doi/epdf/10.1002/cld.537
- Huang LL, Xia HH, Zhu SL. Ascitic fluid analysis in the differential diagnosis of ascites: focus on cirrhotic ascites. J Clin Transl Hepatol 2014; 2(1):58–64. doi:10.14218/JCTH.2013.00010
- Bartoloni A, Zammarchi L. Clinical aspects of uncomplicated and severe malaria. Mediterr J Hematol Infect Dis 2012; 4(1):e2012026. doi:10.4084/MJHID.2012.026
- Titó L, Rimola A, Ginès P, Llach J, Arroyo V, Rodés J. Recurrence of spontaneous bacterial peritonitis in cirrhosis: frequency and predictive factors. Hepatology 1988; 8(1):27–31. pmid:3257456
- Fernández J, Ruiz del Arbol L, Gómez C, et al. Norfloxacin vs ceftriaxone in the prophylaxis of infections in patients with advanced cirrhosis and hemorrhage. Gastroenterology 2006; 131(4):1049–1056. doi:10.1053/j.gastro.2006.07.010
- Runyon B; The American Association for the Study of Liver Diseases (AASLD). Management of adult patients with ascites due to cirrhosis: update 2012. https://www.aasld.org/sites/default/files/guideline_documents/141020_Guideline_Ascites_4UFb_2015.pdf. Accessed September 4, 2018.
- Sidhu SS, Goyal O, Kishore H, Sidhu S. New paradigms in management of alcoholic hepatitis: a review. Hepatol Int 2017; 11(3):255–267. doi:10.1007/s12072-017-9790-5
- Lucey MR, Mathurin P, Morgan TR. Alcoholic hepatitis. N Engl J Med 2009; 360(26):2758–2769. doi:10.1056/NEJMra0805786
- Maddrey WC, Boitnott JK, Bedine MS, Weber FL Jr, Mezey E, White RI Jr. Corticosteroid therapy of alcoholic hepatitis. Gastroenterology 1978; 75(2):193–199. pmid:352788
- Forrest EH, Evans CD, Stewart S, et al. Analysis of factors predictive of mortality in alcoholic hepatitis and derivation and validation of the Glasgow alcoholic hepatitis score. Gut 2005; 54(8):1174–1179. doi:10.1136/gut.2004.050781
- Dunn W, Jamil LH, Brown LS, et al. MELD accurately predicts mortality in patients with alcoholic hepatitis. Hepatology 2005; 41(2):353–358. doi:10.1002/hep.20503
- Sheth M, Riggs M, Patel T. Utility of the Mayo end-stage liver disease (MELD) score in assessing prognosis of patients with alcoholic hepatitis. BMC Gastroenterol 2002; 2:2. pmid:11835693
- Akriviadis E, Botla R, Briggs W, Han S, Reynolds T, Shakil O. Pentoxifylline improves short-term survival in severe acute alcoholic hepatitis: a double-blind, placebo-controlled trial. Gastroenterology 2000; 119(6):1637–1648. pmid:11113085
- Mathurin P, O’Grady J, Carithers RL, et al. Corticosteroids improve short-term survival in patients with severe alcoholic hepatitis: meta-analysis of individual patient data. Gut 2011; 60(2):255–260. doi:10.1136/gut.2010.224097
- Thursz MR, Richardson P, Allison M, et al; STOPAH Trial. Prednisolone or pentoxifylline for alcoholic hepatitis. N Engl J Med 2015; 372(17):1619–1628. doi:10.1056/NEJMoa1412278
- Thursz M, Forrest E, Roderick P, et al. The clinical effectiveness and cost-effectiveness of steroids or pentoxifylline for alcoholic hepatitis (STOPAH): a 2 × 2 factorial randomised controlled trial. Health Technol Assess 2015; 19(102):1–104. doi:10.3310/hta191020
- Lee YS, Kim HJ, Kim JH, et al. Treatment of severe alcoholic hepatitis with corticosteroid, pentoxifylline, or dual therapy: a systematic review and meta-analysis. J Clin Gastroenterol 2017; 51(4):364–377. doi:10.1097/MCG.0000000000000674
- Louvet A, Naveau S, Abdelnour M, et al. The Lille model: a new tool for therapeutic strategy in patients with severe alcoholic hepatitis treated with steroids. Hepatology 2007; 45(6):1348–1354. doi:10.1002/hep.21607
A paraneoplastic potassium and acid-base disturbance
NOTE: The scenario presented here is partly based on cases reported elsewhere by Martínez-Valles et al1 and Fernández-Rodríguez et al.2
A 55-year-old man is admitted to the hospital with generalized malaise, paresthesias, and severe hypertension. He says he had experienced agitation along with weakness on exertion 24 hours before presentation to the emergency department, with subsequent onset of paresthesias in his lower extremities and perioral area.
He is already known to have mild chronic obstructive pulmonary disease, with a ratio of forced expiratory volume in 1 second (FEV1)to forced vital capacity (FVC) of less than 70% and an FEV1 85% of predicted. In addition, he was recently diagnosed with diabetes, resistant hypertension requiring maximum doses of 3 agents (a calcium channel blocker, an angiotensin-converting enzyme inhibitor, and a loop diuretic), and hyperlipidemia.
He is a current smoker with a 30-pack-year smoking history. He does not use alcohol. His family history is noncontributory.

ASSESSING ACID-BASE DISORDERS
1. What type of acid-base disorder does this patient have?
- Metabolic acidosis
- Respiratory acidosis
- Metabolic alkalosis
- Respiratory alkalosis
The patient has metabolic alkalosis.
A 5-step approach

1. Acidosis or alkalosis? The patient’s arterial pH is 7.5, which is alkalemic because it is higher than 7.44.
2. Metabolic or respiratory? The primary process in our patient is overwhelmingly metabolic, as his partial pressure of carbon dioxide (Pco2) is slightly elevated, a direction that would cause acidosis, not alkalosis.
3. The anion gap (the serum sodium concentration minus the sum of the chloride and bicarbonate concentrations) is normal at 8 mmol/L (DRG:HYBRiD-XL Immunoassay and Clinical Chemistry Analyzer, reference range 8–16).
4. Is the disturbance compensated? We have determined that this patient has a metabolic alkalemia; the question now is whether there is any compensation for the primary disturbance.
In metabolic alkalosis, the Pco2 may increase by approximately 0.6 mm Hg (range 0.5–0.8) above the nominal normal level of 40 mm Hg for each 1-mmol/L increase in bicarbonate above the nominal normal level of 25 mmol/L.4 If the patient requires oxygen, the calculation may be unreliable, however, as hypoxemia may have an overriding influence on respiratory drive.
Patients with chronically high Pco2 levels such as those with chronic obstructive pulmonary disease can become accustomed to high carbon dioxide levels and lose their hyper-
capnic respiratory drive. Giving oxygen supplementation is thought to decrease respiratory drive in these patients, so that they will breathe slower and retain more carbon dioxide. There is some degree of respiratory compensation for metabolic alkalosis that occurs by breathing less, though it is limited overall—even in very alkalotic patients, breathing less results in CO2 retention, which, by displacing O2 molecules in the alveoli, will in turn result in hypoxia. The brain then senses the hypoxia and makes one breathe faster, thereby limiting this compensation.
This patient’s serum bicarbonate level is 40 mmol/L, or 15 mmol/L higher than the nominal normal level. If he is compensating, his Pco2 should be 40 + (15 × 0.6) = 49 mm Hg, and in fact it is 51 mm Hg, which is within the normal range of expected compensation (47.5–52 mm Hg). Therefore, yes, he is compensating for the primary disturbance.
5. In metabolic acidosis, is there a delta gap? As our patient has metabolic alkalosis, not acidosis, this question does not apply in this case.
WHICH TEST TO FIND THE CAUSE?
2. Which is the best test to order next to determine the cause of this patient’s hypokalemic metabolic alkalosis?
- Serum magnesium level
- Spot urine chloride
- Renal ultrasonography
- 24-hour urine collection for sodium, potassium, and chloride

The patient’s loop diuretic is withheld for 12 hours and a spot urine chloride is obtained, which is reported as 44 mmol/L. This high value suggests that a volume-independent hypokalemic metabolic alkalosis is present with potassium depletion.
As for the other answer choices:
Serum magnesium. Though hypomagnesemia can cause hypokalemia due to lack of inhibition of renal outer medullary potassium channels and subsequent increased excretion of potassium in the apical tubular membrane, it is not independently associated with acid-base disturbances.5
Renal ultrasonography gives information about structural kidney disease but is of limited utility in identifying the cause of hypokalemic metabolic alkalosis.
A 24-hour urine collection is unnecessary in this setting and would ultimately result in delay in diagnosis, as spot urine chloride is a more efficient means of rapidly distinguishing volume-responsive vs volume-independent causes of hypokalemic metabolic alkalosis.6
IS HIS HYPERTENSION SECONDARY? IF SO, WHAT IS THE CAUSE?
Several features of this case suggest that the patient’s hypertension is secondary rather than primary. It is of recent onset. The patient’s family history is noncontributory, and his hypertension is resistant to the use of maximum doses of 3 antihypertensive agents.
3. Which of the following causes of secondary hypertension is not commonly associated with hypokalemia and metabolic alkalosis?
- Hyperaldosteronism
- Liddle syndrome
- Cushing syndrome
- Renal parenchymal disease
- Chronic licorice ingestion
Renal parenchymal disease is a cause of resistant hypertension, but it is not characterized by metabolic alkalosis, hypokalemia, and elevated urine chloride,7 while the others listed here—hyperaldosteronism, Liddle syndrome, Cushing syndrome, and chronic licorice ingestion—are. Other common causes of resistant hypertension without these metabolic abnormalities include obstructive sleep apnea, alcohol abuse, and nonadherence to treatment.
While treatment of hypertension with loop diuretics can result in hypokalemia and metabolic alkalosis due to the effect of these drugs on potassium reabsorption in the loop of Henle, the patient’s hypokalemia persisted after this agent was withdrawn.8
Causes of hypokalemic metabolic alkalosis with and without hypertension are further delineated in Figure 1.
Additional diagnostic testing: Plasma renin and plasma aldosterone
At this juncture, the differential diagnosis for this patient’s potassium depletion, metabolic alkalosis, high urine chloride, and hypertension has been narrowed to primary or secondary hyperaldosteronism, surreptitious mineralocorticoid ingestion, Cushing syndrome, licorice ingestion, Liddle syndrome, or one of the 3 hydroxylase deficiencies (11-, 17-, and 21-) (Figure 1).

Although clues in the history, physical examination, and imaging may suggest a specific cause of his abnormal laboratory values, the next step in the diagnostic workup is to measure the plasma renin and aldosterone levels (Table 3).
HYPERALDOSTERONISM
4. Hyperaldosteronism is associated with which of the following patterns of renin and aldosterone values?
- High renin, high aldosterone, normal ratio of plasma aldosterone concentration (PAC) to plasma renin activity (PRA)
- Low renin, low aldosterone, normal PAC–PRA ratio
- Low renin, high aldosterone, high PAC–PRA ratio
- High renin, low aldosterone, low PAC–PRA ratio
The pattern of low renin, high aldosterone, and high PAC–PRA ratio is associated with hyperaldosteronism.
Primary hyperaldosteronism
Primary hyperaldosteronism is one of the most common causes of resistant hypertension and is underappreciated, being diagnosed in up to 20% of patients referred to hypertension specialty clinics.7 Potassium levels may be normal, likely contributing to its lack of recognition in this target population.
Primary hyperaldosteronism should be suspected in patients who have a plasma aldosterone PAC–PRA ratio greater than 20 with elevated plasma aldosterone concentrations
(> 15 ng/dL).
Persistently elevated aldosterone levels in the setting of elevated plasma volume is proof that aldosterone secretion is independent of the renin-angiotensin-aldosterone axis, and therefore is autonomous (secondary to adrenal tumor or hyperplasia). Further testing in the form of oral salt loading, saline infusion, or fludrocortisone (a sodium-retaining steroid) administration is thus required to confirm inappropriate, autonomous aldosterone secretion.9
After establishing the diagnosis of primary hyperaldosteronism, one should determine the subtype (ie, due to an adrenal carcinoma, unilateral hypersecreting adenoma, or unilateral or bilateral hyperplasia). Further testing includes adrenal computed tomography (CT) to rule out adrenal carcinomas, which are suspected with adenomas larger than 4 cm. Though part of the diagnostic workup, CT as a means of confirmational testing alone does not preclude the possibility of bilateral adrenal hyperplasia in some patients, even in the presence of an adrenal adenoma. For this reason, adrenal venous sampling is required to definitively determine whether the condition is due to a hypersecreting adrenal adenoma or unilateral or bilateral hyperplasia.9,10
Treatment of primary hyperaldosteronism depends on the subtype of the disease and involves salt restriction in addition to an aldosterone antagonist (spironolactone or eplerenone in the case of bilateral disease) or surgery (unilateral disease).9,11,12
Secondary hyperaldosteronism
Secondary hyperaldosteronism should be suspected when plasma renin and aldosterone levels are both elevated with a PAC–PRA ratio less than 10.
This pattern is most commonly seen with diuretic use but can also be a consequence of renal artery stenosis or, rarely, a renin-secreting tumor.13 Renal artery stenosis is a common finding in patients with hypertension undergoing cardiac catheterization, which is not surprising as more than 90% of such stenoses are atherosclerotic.7 Renin-secreting tumors are exceedingly rare, with fewer than 100 cases reported in the literature, and are more common in younger individuals.13
Our patient has low-normal aldosterone and plasma renin
On further testing, this patient’s plasma aldosterone level is 2.55 ng/dL (normal < 15 ng/dL), his plasma renin activity is 0.53 ng/mL/hour (normal 0.2–2.8 ng/mL/hour), and his PAC–PRA ratio is therefore 4.81.
The categories discussed thus far have included primary and secondary hyperaldosteronism, which typically do not present with low to normal levels of both renin and aldosterone. Surreptitious mineralocorticoid use could present in this manner, but is unlikely in this patient, whose medications do not include fludrocortisone.
The low-normal values thus lead to consideration of a third category: apparent mineralocorticoid excess. Diseases in this category such as Cushing disease or adrenocorticotropic hormone (ACTH) excess are characterized by increases in corticosteroids so that the potassium depletion, metabolic alkalosis, and hypertension are not a consequence of renin and aldosterone but rather the excess corticosteroids.14
Causes of apparent mineralocorticoid excess
There are several possible causes of mineralocorticoid excess associated with hypertension and hypokalemic metabolic alkalosis not due to renin and aldosterone.
Chronic licorice ingestion in high volumes is one such cause and is thought to result in inhibition of 11B-hydroxysteroid dehydrogenase or possibly cortisol oxidase by licorice’s active component, glycyrrhetinic acid. This inhibition results in an inability to convert cortisol to cortisone. The cortisol excess binds to mineralocorticoid receptors, and acting like aldosterone, results in hypertension and hypokalemic metabolic alkalosis as well as feedback inhibition of renin and aldosterone levels.15
Partial hydroxylase deficiencies, though rare, should also be considered as a cause of hypokalemic metabolic alkalosis, hypertension, and, potentially, hirsutism and clitoromegaly in women. They can be diagnosed with elevated levels of 17-ketosteroids and dehydroepiandrosterone sulfate, both of which, in excess, may act on aldosterone receptors in a manner similar to cortisol.16
Liddle syndrome, a rare autosomal dominant condition, may also present with suppressed levels of both renin and aldosterone. In contrast to the disorders of nonaldosterone mineralocorticoid excess, however, the sodium channel defect in Liddle syndrome is characterized by a primary increase in sodium reabsorption in the collecting tubule and potassium wasting. The resultant volume expansion leads to suppressed renin and aldosterone levels and hypertension with low potassium and elevated bicarbonate concentrations.17
Liddle syndrome is commonly diagnosed in childhood but may go unrecognized due to occasional absence of hypokalemia at presentation. Potassium-sparing diuretics such as amiloride or triamterene are the mainstays of treatment.18


Rates of cardiovascular and all-cause mortality are increased in patients with long-term hypercortisolism, even after plasma concentrations of cortisol are normalized.21
Figure 2 shows the cascade of the hypothalamic-pituitary-adrenal axis.
TESTING FOR HYPERCORTISOLISM IN OUR PATIENT
Given the patient’s clinical presentation and laboratory and imaging findings with normal plasma renin and aldosterone levels, a workup for suspected hypercortisolism is initiated.
Initial diagnostic testing for hypercortisolism depends on the degree of clinical suspicion. In those with low probability of the disease, testing should consist of 1 of the following, as a single negative test may be sufficient to rule out the disease:
- 24-hour urinary cortisol levels
- Overnight dexamethasone suppression testing
- Late-night salivary cortisol measurements.
In those with a high index of suspicion, 2 of the aforementioned tests should be performed, as 1 normal result may not be sufficient to exclude the diagnosis.22,23
A 24-hour urinary cortisol collection and overnight dexamethasone suppression test are obtained. His 24-hour urinary free cortisol level is elevated at 6,600 µg (normal 4–100), and suppression testing with 8 mg of dexamethasone (a form of “high-dose” testing)demonstrates only an 8% decline in serum cortisol levels. Cortisol should generally drop more than 90%.
Morning serum cortisol concentration is less than 5 µg/dL (140 nmol/L) in most patients with Cushing disease (ie, a pituitary tumor), and is usually undetectable in normal subjects. Only about 50% of neuroendocrine ACTH-secreting tumors will suppress with this test.
The patient’s clinical presentation, in conjunction with his diagnostic testing, are thus consistent with Cushing syndrome.
CUSHING SYNDROME
Cushing syndrome is most often exogenous or iatrogenic, ie, a result of supraphysiologic doses of glucocorticoids used to treat a variety of inflammatory, autoimmune, and neoplastic conditions.
Endogenous Cushing syndrome, on the other hand, is rare, with an estimated prevalence of 0.7 to 2.4 cases per million per year. ACTH-dependent causes account for 80% of endogenous Cushing syndrome cases, with ACTH-secreting pituitary adenomas (Cushing disease) accounting for 75% to 80% and ectopic ACTH secretion accounting for 15% to 20%. Less than 1% of cases are due to tumors that produce corticotropin-releasing hormone (CRH).
ACTH-independent Cushing syndrome is diagnosed in 20% of endogenous cases and is most commonly caused by a unilateral adrenal tumor. Rare causes of ACTH-independent disease include adrenal carcinoma, McCune-Albright syndrome, and adrenal hyperplasia.24
The patient’s ACTH is high
To determine whether this is an ACTH-dependent or independent process, the next step is to order an ACTH level. His ACTH level is high at 107 pg/mL (normal < 46 pg/mL), confirming the diagnosis of ACTH-dependent Cushing syndrome.
To find out if this ACTH-dependent process is due to a pituitary adenoma, magnetic resonance imaging (MRI) of the pituitary is obtained but is normal.
Large masses (> 6 mm) strongly suggest Cushing disease, but these tumors are often small and may be missed even with more advanced imaging techniques. Corticotropin-secreting adenomas arising from normal cells in the pituitary retain some sensitivity to glucocorticoid negative feedback and CRH stimulation, and thus high-dose dexamethasone suppression testing in conjunction with CRH stimulation testing can be used to differentiate Cushing disease from ectopic ACTH secretion.24,25 Both of these tests have poor diagnostic accuracy, however, and thus inferior petrosal sampling remains the gold standard for the diagnosis of Cushing disease.

ACTH-SECRETING TUMORS
5. Cushing syndrome due to ectopic ACTH secretion is most commonly attributed to which of the following tumors?
- Small-cell lung carcinoma
- Pancreatic carcinoma
- Medullary thyroid carcinoma
- Gastrinoma
Severe cases of Cushing syndrome are often attributable to ectopic ACTH secretion due to an underlying malignancy, most commonly small-cell lung carcinoma or neuroendocrine tumors of pulmonary origin. Other causes include pancreatic and thymic neuroendocrine tumors, gastrinomas, and medullary thyroid carcinoma.25,26
Because most ACTH-producing tumors are intrathoracic, initial imaging in cases of suspected ectopic ACTH secretion should focus on the chest, with CT the usual first choice. Octreotide scintigraphy can also be useful in localizing disease, as many neuroendocrine tumors express somatostatin receptors. Specialized positron-emission tomography scans may also be helpful in tumor identification.24
TREATMENT OF CUSHING SYNDROME DUE TO ECTOPIC ACTH SECRETION
6. Which of the following is most appropriate medical therapy for suppression of cortisol secretion in Cushing syndrome due to ectopic ACTH secretion?
- Spironolactone
- Dexamethasone
- Somatostatin
- Estrogen
- Ketoconazole
Hyperglycemia, hypokalemia, hypertension, psychiatric disturbances, venous thromboembolism, and systemic infections appear to be common in ectopic ACTH syndrome and often correlate with the degree of hypercortisolemia. Severe Cushing syndrome due to ectopic ACTH secretion is an emergency requiring prompt control of cortisol secretion.
First-line treatments include steroidogenesis inhibitors (ketoconazole, metyrapone, etomidate, mitotane) and glucocorticoid receptor antagonists (mifepristone). High-dose spironolactone and eplerenone can also be used to treat the hypertension and hypokalemia associated with mineralocorticoid receptor stimulation. Definitive treatment involves surgical resection, chemotherapy, or radiotherapy when applicable.24,25
After confirmation of the diagnosis, the patient is prescribed ketoconazole and spironolactone, with substantial improvement. He subsequently is started on combination chemotherapy and radiation therapy for his small-cell lung carcinoma.
DISCUSSION
The differential diagnosis for hypokalemia is broad and relies on information obtained during the history and physical examination, followed by interpretation of selected laboratory results. Myriad pathologies in diverse organ systems, eg, diarrhea, renal tubular acidosis, and adrenal disease, may be responsible for a low serum potassium. Further categorizing potassium depletion on the basis of an associated acid-base disturbance, such as metabolic alkalosis, allows one to use an algorithmic approach that can identify specific etiologies responsible for both the potassium and the acid-base disturbances.
Using the spot urine chloride in the setting of hypokalemic metabolic alkalosis with or without hypertension can narrow the differential diagnosis and allow additional clinical findings to guide clinical problem-solving and decision-making, even for conditions not commonly encountered in routine medical practice.
Obtaining renin and aldosterone measurements in patients with potassium depletion, metabolic alkalosis, high urine chloride excretion, and hypertension permits further categorization into 3 clinical groups: elevated aldosterone and renin (secondary hyperaldosteronism), elevated aldosterone and low renin (primary hyperaldosteronism), or apparent mineralocorticoid excess wherein neither renin nor aldosterone are responsible for the syndrome.
The patient in our case had apparent mineralocorticoid excess as a consequence of an ACTH-producing small-cell carcinoma.
- Martínez-Valles MA, Palafox-Cazarez A, Paredes-Avina JA. Severe hypokalemia, metabolic alkalosis and hypertension in a 54 year old male with ectopic ACTH syndrome: a case report. Cases J 2009; 2:6174. doi:10.4076/1757-1626-2-6174
- Fernández-Rodríguez E, Villar-Taibo R, Pinal-Osorio I, et al. Severe hypertension and hypokalemia as first clinical manifestations in ectopic Cushing’s syndrome. Arq Bras Endocrinol Metabol 2008; 52(6):1066–1070. pmid:18820819
- Mani S, Rutecki GW. A patient with altered mental status and an acid-base disturbance. Cleve Clin J Med 2017; 84(1):27–34. doi:10.3949/ccjm.84a.16042
- Adrogué HJ, Madias NE. Secondary responses to altered acid-base status: the rules of engagement. J Am Soc Nephrol 2010; 21(6):920–923. doi:10.1681/ASN.2009121211
- Huang CL, Kuo E. Mechanism of hypokalemia in magnesium deficiency. J Am Soc Nephrol 2007; 18(10):2649–2652. doi:10.1681/ASN.2007070792
- Rose BD. Metabolic alkalosis. In: Clinical Physiology of Acid-Base and Electrolyte Disorders. 4th ed. New York, NY: McGraw-Hill, Health Professions Division; 1994:515.
- Calhoun DA, Jones D, Textor S, et al; American Heart Association Professional Education Committee. Resistant hypertension: diagnosis, evaluation, and treatment: a scientific statement from the American Heart Association Professional Education Committee of the Council for High Blood Pressure Research. Circulation 2008; 117(25):e510–e526. doi:10.1161/CIRCULATIONAHA.108.189141
- Koeppen BM, Stanton BA. Physiology of diuretic action. In: Renal Physiology. 5th ed. Philadelphia, PA: Elsevier Inc; 2013:167–178.
- Blumenfeld JD, Sealey JE, Schlussel Y, et al. Diagnosis and treatment of primary hyperaldosteronism. Ann Intern Med 1994; 121(11):877–885. pmid:7978702
- Kempers MJ, Lenders JW, van Outheusden L, et al. Systematic review: diagnostic procedures to differentiate unilateral from bilateral adrenal abnormality in primary aldosteronism. Ann Intern Med 2009; 151(5):329–337. pmid:19721021
- Karagiannis A, Tziomalos K, Papageorgiou A, et al. Spironolactone versus eplerenone for the treatment of idiopathic hyperaldosteronism. Expert Opin Pharmacother 2008; 9(4):509–515. doi:10.1517/14656566.9.4.509
- Sawka AM, Young WF, Thompson GB, et al. Primary aldosteronism: factors associated with normalization of blood pressure after surgery. Ann Intern Med 2001; 135(4):258–261. pmid:11511140
- Haab F, Duclos JM, Guyenne T, Plouin PF, Corvol P. Renin secreting tumors: diagnosis, conservative surgical approach and long-term results. J Urol 1995; 153(6):1781–1784. pmid:7752315
- Sabbadin C, Armanini D. Syndromes that mimic an excess of mineralocorticoids. High Blood Press Cardiovasc Prev 2016; 23(3):231–235. doi:10.1007/s40292-016-0160-5
- Apostolakos JM, Caines LC. Apparent mineralocorticoid excess syndrome: a case of resistant hypertension from licorice tea consumption. J Clin Hypertens (Greenwich) 2016; 18(10):991–993. doi:10.1111/jch.12841
- Glatt K, Garzon DL, Popovic J. Congenital adrenal hyperplasia due to 21-hydroxylase deficiency. J Spec Pediatr Nurs 2005; 10(3):104–114. doi:10.1111/j.1744-6155.2005.00022.x
- Findling JW, Raff H, Hansson JH, Lifton RP. Liddle’s syndrome: prospective genetic screening and suppressed aldosterone secretion in an extended kindred. J Clin Endocrinol Metab 1997; 82(4):1071–1074. doi:10.1210/jcem.82.4.3862
- Wang C, Chan TK, Yeung RT, Coghlan JP, Scoggins BA, Stockigt JR. The effect of triamterene and sodium intake on renin, aldosterone, and erythrocyte sodium transport in Liddle’s syndrome. J Clin Endocrinol Metab 1981; 52(5):1027–1032. doi:10.1210/jcem-52-5-1027
- Torpy DJ, Mullen N, Ilias I, Nieman LK. Association of hypertension and hypokalemia with Cushing’s syndrome caused by ectopic ACTH secretion: a series of 58 cases. Ann N Y Acad Sci 2002; 970:134–144. pmid:12381548
- Saruta T, Suzuki H, Handa M, Igarashi Y, Kondo K, Senba S. Multiple factors contribute to the pathogenesis of hypertension in Cushing’s syndrome. J Clin Endocrinol Metab 1986; 62(2):275–279. doi:10.1210/jcem-62-2-275
- Clayton RN, Jones PW, Reulen RC, et al. Mortality in patients with Cushing’s disease more than 10 years after remission: a multicentre, multinational, retrospective cohort study. Lancet Diabetes Endocrinol 2016; 4(7):569–576. doi:10.1016/S2213-8587(16)30005-5
- Baid SK, Rubino D, Sinaii N, Ramsey S, Frank A, Nieman LK. Specificity of screening tests for Cushing’s syndrome in an overweight and obese population. J Clin Endocrinol Metab 2009; 94(10):3857–3864. doi:10.1210/jc.2008-2766
- Nieman LK, Biller BM, Findling JW, et al. The diagnosis of Cushing’s syndrome: an Endocrine Society Clinical Practice Guideline. J Clin Endocrinol Metab 2008; 93(5):1526–1540. doi:10.1210/jc.2008-0125
- Sharma ST, Nieman LK, Feelders RA. Cushing’s syndrome: epidemiology and developments in disease management. Clin Epidemiol 2015; 7:281–293. doi:10.2147/CLEP.S44336
- Tavares Bello C, van der Poest Clement E, Feelders R. Severe Cushing’s syndrome and bilateral pulmonary nodules: beyond ectopic ACTH. Endocrinol Diabetes Metab Case Rep 2017; pii:17–0100. doi:10.1530/EDM-17-0100
- Sathyakumar S, Paul TV, Asha HS, et al. Ectopic Cushing syndrome: a 10-year experience from a tertiary care center in southern India. Endocr Pract 2017; 23(8):907–914. doi:10.4158/EP161677.OR
NOTE: The scenario presented here is partly based on cases reported elsewhere by Martínez-Valles et al1 and Fernández-Rodríguez et al.2
A 55-year-old man is admitted to the hospital with generalized malaise, paresthesias, and severe hypertension. He says he had experienced agitation along with weakness on exertion 24 hours before presentation to the emergency department, with subsequent onset of paresthesias in his lower extremities and perioral area.
He is already known to have mild chronic obstructive pulmonary disease, with a ratio of forced expiratory volume in 1 second (FEV1)to forced vital capacity (FVC) of less than 70% and an FEV1 85% of predicted. In addition, he was recently diagnosed with diabetes, resistant hypertension requiring maximum doses of 3 agents (a calcium channel blocker, an angiotensin-converting enzyme inhibitor, and a loop diuretic), and hyperlipidemia.
He is a current smoker with a 30-pack-year smoking history. He does not use alcohol. His family history is noncontributory.
ASSESSING ACID-BASE DISORDERS
1. What type of acid-base disorder does this patient have?
- Metabolic acidosis
- Respiratory acidosis
- Metabolic alkalosis
- Respiratory alkalosis
The patient has metabolic alkalosis.
A 5-step approach
1. Acidosis or alkalosis? The patient’s arterial pH is 7.5, which is alkalemic because it is higher than 7.44.
2. Metabolic or respiratory? The primary process in our patient is overwhelmingly metabolic, as his partial pressure of carbon dioxide (Pco2) is slightly elevated, a direction that would cause acidosis, not alkalosis.
3. The anion gap (the serum sodium concentration minus the sum of the chloride and bicarbonate concentrations) is normal at 8 mmol/L (DRG:HYBRiD-XL Immunoassay and Clinical Chemistry Analyzer, reference range 8–16).
4. Is the disturbance compensated? We have determined that this patient has a metabolic alkalemia; the question now is whether there is any compensation for the primary disturbance.
In metabolic alkalosis, the Pco2 may increase by approximately 0.6 mm Hg (range 0.5–0.8) above the nominal normal level of 40 mm Hg for each 1-mmol/L increase in bicarbonate above the nominal normal level of 25 mmol/L.4 If the patient requires oxygen, the calculation may be unreliable, however, as hypoxemia may have an overriding influence on respiratory drive.
Patients with chronically high Pco2 levels such as those with chronic obstructive pulmonary disease can become accustomed to high carbon dioxide levels and lose their hyper-
capnic respiratory drive. Giving oxygen supplementation is thought to decrease respiratory drive in these patients, so that they will breathe slower and retain more carbon dioxide. There is some degree of respiratory compensation for metabolic alkalosis that occurs by breathing less, though it is limited overall—even in very alkalotic patients, breathing less results in CO2 retention, which, by displacing O2 molecules in the alveoli, will in turn result in hypoxia. The brain then senses the hypoxia and makes one breathe faster, thereby limiting this compensation.
This patient’s serum bicarbonate level is 40 mmol/L, or 15 mmol/L higher than the nominal normal level. If he is compensating, his Pco2 should be 40 + (15 × 0.6) = 49 mm Hg, and in fact it is 51 mm Hg, which is within the normal range of expected compensation (47.5–52 mm Hg). Therefore, yes, he is compensating for the primary disturbance.
5. In metabolic acidosis, is there a delta gap? As our patient has metabolic alkalosis, not acidosis, this question does not apply in this case.
WHICH TEST TO FIND THE CAUSE?
2. Which is the best test to order next to determine the cause of this patient’s hypokalemic metabolic alkalosis?
- Serum magnesium level
- Spot urine chloride
- Renal ultrasonography
- 24-hour urine collection for sodium, potassium, and chloride
The patient’s loop diuretic is withheld for 12 hours and a spot urine chloride is obtained, which is reported as 44 mmol/L. This high value suggests that a volume-independent hypokalemic metabolic alkalosis is present with potassium depletion.
As for the other answer choices:
Serum magnesium. Though hypomagnesemia can cause hypokalemia due to lack of inhibition of renal outer medullary potassium channels and subsequent increased excretion of potassium in the apical tubular membrane, it is not independently associated with acid-base disturbances.5
Renal ultrasonography gives information about structural kidney disease but is of limited utility in identifying the cause of hypokalemic metabolic alkalosis.
A 24-hour urine collection is unnecessary in this setting and would ultimately result in delay in diagnosis, as spot urine chloride is a more efficient means of rapidly distinguishing volume-responsive vs volume-independent causes of hypokalemic metabolic alkalosis.6
IS HIS HYPERTENSION SECONDARY? IF SO, WHAT IS THE CAUSE?
Several features of this case suggest that the patient’s hypertension is secondary rather than primary. It is of recent onset. The patient’s family history is noncontributory, and his hypertension is resistant to the use of maximum doses of 3 antihypertensive agents.
3. Which of the following causes of secondary hypertension is not commonly associated with hypokalemia and metabolic alkalosis?
- Hyperaldosteronism
- Liddle syndrome
- Cushing syndrome
- Renal parenchymal disease
- Chronic licorice ingestion
Renal parenchymal disease is a cause of resistant hypertension, but it is not characterized by metabolic alkalosis, hypokalemia, and elevated urine chloride,7 while the others listed here—hyperaldosteronism, Liddle syndrome, Cushing syndrome, and chronic licorice ingestion—are. Other common causes of resistant hypertension without these metabolic abnormalities include obstructive sleep apnea, alcohol abuse, and nonadherence to treatment.
While treatment of hypertension with loop diuretics can result in hypokalemia and metabolic alkalosis due to the effect of these drugs on potassium reabsorption in the loop of Henle, the patient’s hypokalemia persisted after this agent was withdrawn.8
Causes of hypokalemic metabolic alkalosis with and without hypertension are further delineated in Figure 1.
Additional diagnostic testing: Plasma renin and plasma aldosterone
At this juncture, the differential diagnosis for this patient’s potassium depletion, metabolic alkalosis, high urine chloride, and hypertension has been narrowed to primary or secondary hyperaldosteronism, surreptitious mineralocorticoid ingestion, Cushing syndrome, licorice ingestion, Liddle syndrome, or one of the 3 hydroxylase deficiencies (11-, 17-, and 21-) (Figure 1).
Although clues in the history, physical examination, and imaging may suggest a specific cause of his abnormal laboratory values, the next step in the diagnostic workup is to measure the plasma renin and aldosterone levels (Table 3).
HYPERALDOSTERONISM
4. Hyperaldosteronism is associated with which of the following patterns of renin and aldosterone values?
- High renin, high aldosterone, normal ratio of plasma aldosterone concentration (PAC) to plasma renin activity (PRA)
- Low renin, low aldosterone, normal PAC–PRA ratio
- Low renin, high aldosterone, high PAC–PRA ratio
- High renin, low aldosterone, low PAC–PRA ratio
The pattern of low renin, high aldosterone, and high PAC–PRA ratio is associated with hyperaldosteronism.
Primary hyperaldosteronism
Primary hyperaldosteronism is one of the most common causes of resistant hypertension and is underappreciated, being diagnosed in up to 20% of patients referred to hypertension specialty clinics.7 Potassium levels may be normal, likely contributing to its lack of recognition in this target population.
Primary hyperaldosteronism should be suspected in patients who have a plasma aldosterone PAC–PRA ratio greater than 20 with elevated plasma aldosterone concentrations
(> 15 ng/dL).
Persistently elevated aldosterone levels in the setting of elevated plasma volume is proof that aldosterone secretion is independent of the renin-angiotensin-aldosterone axis, and therefore is autonomous (secondary to adrenal tumor or hyperplasia). Further testing in the form of oral salt loading, saline infusion, or fludrocortisone (a sodium-retaining steroid) administration is thus required to confirm inappropriate, autonomous aldosterone secretion.9
After establishing the diagnosis of primary hyperaldosteronism, one should determine the subtype (ie, due to an adrenal carcinoma, unilateral hypersecreting adenoma, or unilateral or bilateral hyperplasia). Further testing includes adrenal computed tomography (CT) to rule out adrenal carcinomas, which are suspected with adenomas larger than 4 cm. Though part of the diagnostic workup, CT as a means of confirmational testing alone does not preclude the possibility of bilateral adrenal hyperplasia in some patients, even in the presence of an adrenal adenoma. For this reason, adrenal venous sampling is required to definitively determine whether the condition is due to a hypersecreting adrenal adenoma or unilateral or bilateral hyperplasia.9,10
Treatment of primary hyperaldosteronism depends on the subtype of the disease and involves salt restriction in addition to an aldosterone antagonist (spironolactone or eplerenone in the case of bilateral disease) or surgery (unilateral disease).9,11,12
Secondary hyperaldosteronism
Secondary hyperaldosteronism should be suspected when plasma renin and aldosterone levels are both elevated with a PAC–PRA ratio less than 10.
This pattern is most commonly seen with diuretic use but can also be a consequence of renal artery stenosis or, rarely, a renin-secreting tumor.13 Renal artery stenosis is a common finding in patients with hypertension undergoing cardiac catheterization, which is not surprising as more than 90% of such stenoses are atherosclerotic.7 Renin-secreting tumors are exceedingly rare, with fewer than 100 cases reported in the literature, and are more common in younger individuals.13
Our patient has low-normal aldosterone and plasma renin
On further testing, this patient’s plasma aldosterone level is 2.55 ng/dL (normal < 15 ng/dL), his plasma renin activity is 0.53 ng/mL/hour (normal 0.2–2.8 ng/mL/hour), and his PAC–PRA ratio is therefore 4.81.
The categories discussed thus far have included primary and secondary hyperaldosteronism, which typically do not present with low to normal levels of both renin and aldosterone. Surreptitious mineralocorticoid use could present in this manner, but is unlikely in this patient, whose medications do not include fludrocortisone.
The low-normal values thus lead to consideration of a third category: apparent mineralocorticoid excess. Diseases in this category such as Cushing disease or adrenocorticotropic hormone (ACTH) excess are characterized by increases in corticosteroids so that the potassium depletion, metabolic alkalosis, and hypertension are not a consequence of renin and aldosterone but rather the excess corticosteroids.14
Causes of apparent mineralocorticoid excess
There are several possible causes of mineralocorticoid excess associated with hypertension and hypokalemic metabolic alkalosis not due to renin and aldosterone.
Chronic licorice ingestion in high volumes is one such cause and is thought to result in inhibition of 11B-hydroxysteroid dehydrogenase or possibly cortisol oxidase by licorice’s active component, glycyrrhetinic acid. This inhibition results in an inability to convert cortisol to cortisone. The cortisol excess binds to mineralocorticoid receptors, and acting like aldosterone, results in hypertension and hypokalemic metabolic alkalosis as well as feedback inhibition of renin and aldosterone levels.15
Partial hydroxylase deficiencies, though rare, should also be considered as a cause of hypokalemic metabolic alkalosis, hypertension, and, potentially, hirsutism and clitoromegaly in women. They can be diagnosed with elevated levels of 17-ketosteroids and dehydroepiandrosterone sulfate, both of which, in excess, may act on aldosterone receptors in a manner similar to cortisol.16
Liddle syndrome, a rare autosomal dominant condition, may also present with suppressed levels of both renin and aldosterone. In contrast to the disorders of nonaldosterone mineralocorticoid excess, however, the sodium channel defect in Liddle syndrome is characterized by a primary increase in sodium reabsorption in the collecting tubule and potassium wasting. The resultant volume expansion leads to suppressed renin and aldosterone levels and hypertension with low potassium and elevated bicarbonate concentrations.17
Liddle syndrome is commonly diagnosed in childhood but may go unrecognized due to occasional absence of hypokalemia at presentation. Potassium-sparing diuretics such as amiloride or triamterene are the mainstays of treatment.18
Rates of cardiovascular and all-cause mortality are increased in patients with long-term hypercortisolism, even after plasma concentrations of cortisol are normalized.21
Figure 2 shows the cascade of the hypothalamic-pituitary-adrenal axis.
TESTING FOR HYPERCORTISOLISM IN OUR PATIENT
Given the patient’s clinical presentation and laboratory and imaging findings with normal plasma renin and aldosterone levels, a workup for suspected hypercortisolism is initiated.
Initial diagnostic testing for hypercortisolism depends on the degree of clinical suspicion. In those with low probability of the disease, testing should consist of 1 of the following, as a single negative test may be sufficient to rule out the disease:
- 24-hour urinary cortisol levels
- Overnight dexamethasone suppression testing
- Late-night salivary cortisol measurements.
In those with a high index of suspicion, 2 of the aforementioned tests should be performed, as 1 normal result may not be sufficient to exclude the diagnosis.22,23
A 24-hour urinary cortisol collection and overnight dexamethasone suppression test are obtained. His 24-hour urinary free cortisol level is elevated at 6,600 µg (normal 4–100), and suppression testing with 8 mg of dexamethasone (a form of “high-dose” testing)demonstrates only an 8% decline in serum cortisol levels. Cortisol should generally drop more than 90%.
Morning serum cortisol concentration is less than 5 µg/dL (140 nmol/L) in most patients with Cushing disease (ie, a pituitary tumor), and is usually undetectable in normal subjects. Only about 50% of neuroendocrine ACTH-secreting tumors will suppress with this test.
The patient’s clinical presentation, in conjunction with his diagnostic testing, are thus consistent with Cushing syndrome.
CUSHING SYNDROME
Cushing syndrome is most often exogenous or iatrogenic, ie, a result of supraphysiologic doses of glucocorticoids used to treat a variety of inflammatory, autoimmune, and neoplastic conditions.
Endogenous Cushing syndrome, on the other hand, is rare, with an estimated prevalence of 0.7 to 2.4 cases per million per year. ACTH-dependent causes account for 80% of endogenous Cushing syndrome cases, with ACTH-secreting pituitary adenomas (Cushing disease) accounting for 75% to 80% and ectopic ACTH secretion accounting for 15% to 20%. Less than 1% of cases are due to tumors that produce corticotropin-releasing hormone (CRH).
ACTH-independent Cushing syndrome is diagnosed in 20% of endogenous cases and is most commonly caused by a unilateral adrenal tumor. Rare causes of ACTH-independent disease include adrenal carcinoma, McCune-Albright syndrome, and adrenal hyperplasia.24
The patient’s ACTH is high
To determine whether this is an ACTH-dependent or independent process, the next step is to order an ACTH level. His ACTH level is high at 107 pg/mL (normal < 46 pg/mL), confirming the diagnosis of ACTH-dependent Cushing syndrome.
To find out if this ACTH-dependent process is due to a pituitary adenoma, magnetic resonance imaging (MRI) of the pituitary is obtained but is normal.
Large masses (> 6 mm) strongly suggest Cushing disease, but these tumors are often small and may be missed even with more advanced imaging techniques. Corticotropin-secreting adenomas arising from normal cells in the pituitary retain some sensitivity to glucocorticoid negative feedback and CRH stimulation, and thus high-dose dexamethasone suppression testing in conjunction with CRH stimulation testing can be used to differentiate Cushing disease from ectopic ACTH secretion.24,25 Both of these tests have poor diagnostic accuracy, however, and thus inferior petrosal sampling remains the gold standard for the diagnosis of Cushing disease.
ACTH-SECRETING TUMORS
5. Cushing syndrome due to ectopic ACTH secretion is most commonly attributed to which of the following tumors?
- Small-cell lung carcinoma
- Pancreatic carcinoma
- Medullary thyroid carcinoma
- Gastrinoma
Severe cases of Cushing syndrome are often attributable to ectopic ACTH secretion due to an underlying malignancy, most commonly small-cell lung carcinoma or neuroendocrine tumors of pulmonary origin. Other causes include pancreatic and thymic neuroendocrine tumors, gastrinomas, and medullary thyroid carcinoma.25,26
Because most ACTH-producing tumors are intrathoracic, initial imaging in cases of suspected ectopic ACTH secretion should focus on the chest, with CT the usual first choice. Octreotide scintigraphy can also be useful in localizing disease, as many neuroendocrine tumors express somatostatin receptors. Specialized positron-emission tomography scans may also be helpful in tumor identification.24
TREATMENT OF CUSHING SYNDROME DUE TO ECTOPIC ACTH SECRETION
6. Which of the following is most appropriate medical therapy for suppression of cortisol secretion in Cushing syndrome due to ectopic ACTH secretion?
- Spironolactone
- Dexamethasone
- Somatostatin
- Estrogen
- Ketoconazole
Hyperglycemia, hypokalemia, hypertension, psychiatric disturbances, venous thromboembolism, and systemic infections appear to be common in ectopic ACTH syndrome and often correlate with the degree of hypercortisolemia. Severe Cushing syndrome due to ectopic ACTH secretion is an emergency requiring prompt control of cortisol secretion.
First-line treatments include steroidogenesis inhibitors (ketoconazole, metyrapone, etomidate, mitotane) and glucocorticoid receptor antagonists (mifepristone). High-dose spironolactone and eplerenone can also be used to treat the hypertension and hypokalemia associated with mineralocorticoid receptor stimulation. Definitive treatment involves surgical resection, chemotherapy, or radiotherapy when applicable.24,25
After confirmation of the diagnosis, the patient is prescribed ketoconazole and spironolactone, with substantial improvement. He subsequently is started on combination chemotherapy and radiation therapy for his small-cell lung carcinoma.
DISCUSSION
The differential diagnosis for hypokalemia is broad and relies on information obtained during the history and physical examination, followed by interpretation of selected laboratory results. Myriad pathologies in diverse organ systems, eg, diarrhea, renal tubular acidosis, and adrenal disease, may be responsible for a low serum potassium. Further categorizing potassium depletion on the basis of an associated acid-base disturbance, such as metabolic alkalosis, allows one to use an algorithmic approach that can identify specific etiologies responsible for both the potassium and the acid-base disturbances.
Using the spot urine chloride in the setting of hypokalemic metabolic alkalosis with or without hypertension can narrow the differential diagnosis and allow additional clinical findings to guide clinical problem-solving and decision-making, even for conditions not commonly encountered in routine medical practice.
Obtaining renin and aldosterone measurements in patients with potassium depletion, metabolic alkalosis, high urine chloride excretion, and hypertension permits further categorization into 3 clinical groups: elevated aldosterone and renin (secondary hyperaldosteronism), elevated aldosterone and low renin (primary hyperaldosteronism), or apparent mineralocorticoid excess wherein neither renin nor aldosterone are responsible for the syndrome.
The patient in our case had apparent mineralocorticoid excess as a consequence of an ACTH-producing small-cell carcinoma.
- Martínez-Valles MA, Palafox-Cazarez A, Paredes-Avina JA. Severe hypokalemia, metabolic alkalosis and hypertension in a 54 year old male with ectopic ACTH syndrome: a case report. Cases J 2009; 2:6174. doi:10.4076/1757-1626-2-6174
- Fernández-Rodríguez E, Villar-Taibo R, Pinal-Osorio I, et al. Severe hypertension and hypokalemia as first clinical manifestations in ectopic Cushing’s syndrome. Arq Bras Endocrinol Metabol 2008; 52(6):1066–1070. pmid:18820819
- Mani S, Rutecki GW. A patient with altered mental status and an acid-base disturbance. Cleve Clin J Med 2017; 84(1):27–34. doi:10.3949/ccjm.84a.16042
- Adrogué HJ, Madias NE. Secondary responses to altered acid-base status: the rules of engagement. J Am Soc Nephrol 2010; 21(6):920–923. doi:10.1681/ASN.2009121211
- Huang CL, Kuo E. Mechanism of hypokalemia in magnesium deficiency. J Am Soc Nephrol 2007; 18(10):2649–2652. doi:10.1681/ASN.2007070792
- Rose BD. Metabolic alkalosis. In: Clinical Physiology of Acid-Base and Electrolyte Disorders. 4th ed. New York, NY: McGraw-Hill, Health Professions Division; 1994:515.
- Calhoun DA, Jones D, Textor S, et al; American Heart Association Professional Education Committee. Resistant hypertension: diagnosis, evaluation, and treatment: a scientific statement from the American Heart Association Professional Education Committee of the Council for High Blood Pressure Research. Circulation 2008; 117(25):e510–e526. doi:10.1161/CIRCULATIONAHA.108.189141
- Koeppen BM, Stanton BA. Physiology of diuretic action. In: Renal Physiology. 5th ed. Philadelphia, PA: Elsevier Inc; 2013:167–178.
- Blumenfeld JD, Sealey JE, Schlussel Y, et al. Diagnosis and treatment of primary hyperaldosteronism. Ann Intern Med 1994; 121(11):877–885. pmid:7978702
- Kempers MJ, Lenders JW, van Outheusden L, et al. Systematic review: diagnostic procedures to differentiate unilateral from bilateral adrenal abnormality in primary aldosteronism. Ann Intern Med 2009; 151(5):329–337. pmid:19721021
- Karagiannis A, Tziomalos K, Papageorgiou A, et al. Spironolactone versus eplerenone for the treatment of idiopathic hyperaldosteronism. Expert Opin Pharmacother 2008; 9(4):509–515. doi:10.1517/14656566.9.4.509
- Sawka AM, Young WF, Thompson GB, et al. Primary aldosteronism: factors associated with normalization of blood pressure after surgery. Ann Intern Med 2001; 135(4):258–261. pmid:11511140
- Haab F, Duclos JM, Guyenne T, Plouin PF, Corvol P. Renin secreting tumors: diagnosis, conservative surgical approach and long-term results. J Urol 1995; 153(6):1781–1784. pmid:7752315
- Sabbadin C, Armanini D. Syndromes that mimic an excess of mineralocorticoids. High Blood Press Cardiovasc Prev 2016; 23(3):231–235. doi:10.1007/s40292-016-0160-5
- Apostolakos JM, Caines LC. Apparent mineralocorticoid excess syndrome: a case of resistant hypertension from licorice tea consumption. J Clin Hypertens (Greenwich) 2016; 18(10):991–993. doi:10.1111/jch.12841
- Glatt K, Garzon DL, Popovic J. Congenital adrenal hyperplasia due to 21-hydroxylase deficiency. J Spec Pediatr Nurs 2005; 10(3):104–114. doi:10.1111/j.1744-6155.2005.00022.x
- Findling JW, Raff H, Hansson JH, Lifton RP. Liddle’s syndrome: prospective genetic screening and suppressed aldosterone secretion in an extended kindred. J Clin Endocrinol Metab 1997; 82(4):1071–1074. doi:10.1210/jcem.82.4.3862
- Wang C, Chan TK, Yeung RT, Coghlan JP, Scoggins BA, Stockigt JR. The effect of triamterene and sodium intake on renin, aldosterone, and erythrocyte sodium transport in Liddle’s syndrome. J Clin Endocrinol Metab 1981; 52(5):1027–1032. doi:10.1210/jcem-52-5-1027
- Torpy DJ, Mullen N, Ilias I, Nieman LK. Association of hypertension and hypokalemia with Cushing’s syndrome caused by ectopic ACTH secretion: a series of 58 cases. Ann N Y Acad Sci 2002; 970:134–144. pmid:12381548
- Saruta T, Suzuki H, Handa M, Igarashi Y, Kondo K, Senba S. Multiple factors contribute to the pathogenesis of hypertension in Cushing’s syndrome. J Clin Endocrinol Metab 1986; 62(2):275–279. doi:10.1210/jcem-62-2-275
- Clayton RN, Jones PW, Reulen RC, et al. Mortality in patients with Cushing’s disease more than 10 years after remission: a multicentre, multinational, retrospective cohort study. Lancet Diabetes Endocrinol 2016; 4(7):569–576. doi:10.1016/S2213-8587(16)30005-5
- Baid SK, Rubino D, Sinaii N, Ramsey S, Frank A, Nieman LK. Specificity of screening tests for Cushing’s syndrome in an overweight and obese population. J Clin Endocrinol Metab 2009; 94(10):3857–3864. doi:10.1210/jc.2008-2766
- Nieman LK, Biller BM, Findling JW, et al. The diagnosis of Cushing’s syndrome: an Endocrine Society Clinical Practice Guideline. J Clin Endocrinol Metab 2008; 93(5):1526–1540. doi:10.1210/jc.2008-0125
- Sharma ST, Nieman LK, Feelders RA. Cushing’s syndrome: epidemiology and developments in disease management. Clin Epidemiol 2015; 7:281–293. doi:10.2147/CLEP.S44336
- Tavares Bello C, van der Poest Clement E, Feelders R. Severe Cushing’s syndrome and bilateral pulmonary nodules: beyond ectopic ACTH. Endocrinol Diabetes Metab Case Rep 2017; pii:17–0100. doi:10.1530/EDM-17-0100
- Sathyakumar S, Paul TV, Asha HS, et al. Ectopic Cushing syndrome: a 10-year experience from a tertiary care center in southern India. Endocr Pract 2017; 23(8):907–914. doi:10.4158/EP161677.OR
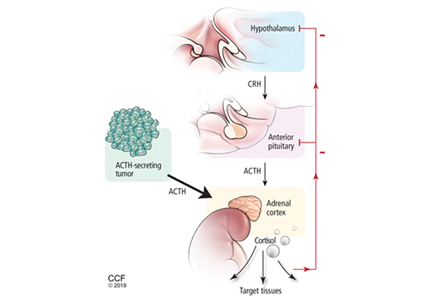
Rapidly progressive pleural effusion
A 33-year-old male nonsmoker with no significant medical history presented to the pulmonary clinic with severe left-sided pleuritic chest pain and mild breathlessness for the past 5 days. He denied fever, chills, cough, phlegm, runny nose, or congestion.
Five days before this visit, he had been seen in the emergency department with mild left-sided pleuritic chest pain. His vital signs at that time had been as follows:
- Blood pressure 141/77 mm Hg
- Heart rate 77 beats/minute
- Respiratory rate 17 breaths/minute
- Temperature 36.8°C (98.2°F)
- Oxygen saturation 98% on room air.
 showed a mild left-sided pleural reaction (arrow). Computed tomography (B) showed a mild pleural reaction (arrow) and parenchymal atelectatic and fibrotic changes.")
- White blood cell count 6.89 × 10⁹/L (reference range 3.70–11.00)
- Neutrophils 58% (40%–70%)
- Lymphocytes 29.6% (22%–44%)
- Monocytes 10.7% (0–11%)
- Eosinophils 1% (0–4%)
- Basophils 0.6% (0–1%)
- Troponin T and D-dimer levels normal.
DIFFERENTIAL DIAGNOSIS OF PLEURITIC CHEST PAIN
1. What is the most likely cause of his pleuritic chest pain?
- Pleuritis
- Pneumonia
- Pulmonary embolism
- Malignancy
The differential diagnosis of pleuritic chest pain is broad.
The patient’s symptoms at presentation to the emergency department did not suggest an infectious process. There was no fever, cough, or phlegm, and his white blood cell count was normal. Nonetheless, pneumonia could not be ruled out, as the lung parenchyma was not normal on radiography, and the findings could have been consistent with an early or resolving infectious process.
Pulmonary embolism was a possibility, but his normal D-dimer level argued against it. Further, the patient subsequently underwent CT angiography, which ruled out pulmonary embolism.
Malignancy was unlikely in a young nonsmoker, but follow-up imaging would be needed to ensure resolution and rule this out.
The emergency department physician diagnosed inflammatory pleuritis and discharged him home on a nonsteroidal anti-inflammatory drug.
CLINIC VISIT 5 DAYS LATER
At his pulmonary clinic visit 5 days later, the patient reported persistent but stable left-sided pleuritic chest pain and mild breathlessness on exertion. His blood pressure was 137/81 mm Hg, heart rate 109 beats per minute, temperature 37.1°C (98.8°F), and oxygen saturation 97% on room air.
Auscultation of the lungs revealed rales and slightly decreased breath sounds at the left base. No dullness to percussion could be detected.
Because the patient had developed mild tachycardia and breathlessness along with clinical signs that suggested worsening infiltrates, consolidation, or the development of pleural effusion, he underwent further investigation with chest radiography, a complete blood cell count, and measurement of serum inflammatory markers.

- White blood cell count 13.08 × 10⁹/L
- Neutrophils 81%
- Lymphocytes 7.4%
- Monocytes 7.2%
- Eeosinophils 0.2%
- Basophils 0.2%
- Procalcitonin 0.34 µg/L (reference range < 0.09).
Bedside ultrasonography to assess the effusion’s size and characteristics and the need for thoracentesis indicated that the effusion was too small to tap, and there were no fibrinous strands or loculations to suggest empyema.
FURTHER TREATMENT
2. What was the best management strategy for this patient at this time?
- Admit to the hospital for thoracentesis and intravenous antibiotics
- Give oral antibiotics with close follow-up
- Perform thoracentesis on an outpatient basis and give oral antibiotics
- Repeat chest CT
The patient had worsening pleuritic pain with development of a small left pleural effusion. His symptoms had not improved on a nonsteroidal anti-inflammatory drug. He now had an elevated white blood cell count with a “left shift” (ie, an increase in neutrophils, indicating more immature cells in circulation) and elevated procalcitonin. The most likely diagnosis was pneumonia with a resulting pleural effusion, ie, parapneumonic effusion, requiring appropriate antibiotic therapy. Ideally, the pleural effusion should be sampled by thoracentesis, with management on an outpatient or inpatient basis.

5 DAYS LATER, THE EFFUSION HAD BECOME MASSIVE
On follow-up 5 days later, the patient’s chest pain was better, but he was significantly more short of breath. His blood pressure was 137/90 mm Hg, heart rate 117 beats/minute, respiratory rate 16 breaths/minute, oxygen saturation 97% on room air, and temperature 36.9°C (98.4°F). Chest auscultation revealed decreased breath sounds over the left hemithorax, with dullness to percussion and decreased fremitus.
 and massive pleural effusion causing mediastinal shift to the right on computed tomography (B).")
RAPIDLY PROGRESSIVE PLEURAL EFFUSIONS
A rapidly progressive pleural effusion in a healthy patient suggests parapneumonic effusion. The most likely organism is streptococcal.2
Explosive pleuritis is defined as a pleural effusion that increases in size in less than 24 hours. It was first described by Braman and Donat3 in 1986 as an effusion that develops within hours of admission. In 2001, Sharma and Marrie4 refined the definition as rapid development of pleural effusion involving more than 90% of the hemithorax within 24 hours, causing compression of pulmonary tissue and a mediastinal shift. It is a medical emergency that requires prompt investigation and treatment with drainage and antibiotics. All reported cases of explosive pleuritis have been parapneumonic effusion.
The organisms implicated in explosive pleuritis include gram-positive cocci such as Streptococcus pneumoniae, S pyogenes, other streptococci, staphylococci, and gram-negative cocci such as Neisseria meningitidis and Moraxella catarrhalis. Gram-negative bacilli include Haemophilus influenzae, Klebsiella pneumoniae, Pseudomonas species, Escherichia coli, Proteus species, Enterobacter species, Bacteroides species, and Legionella species.4,5 However, malignancy is the most common cause of massive pleural effusion, accounting for 54% of cases; 17% of cases are idiopathic, 13% are parapneumonic, and 12% are hydrothorax related to liver cirrhosis.6
CASE CONTINUED
Our patient’s massive effusion needed drainage, and he was admitted to the hospital for further management. Samples of blood and sputum were sent for culture. Intravenous piperacillin-tazobactam was started, and an intercostal chest tube was inserted into the pleural cavity under ultrasonographic guidance to drain turbid fluid.


Multiple pleural fluid samples sent for bacterial, fungal, and acid-fast bacilli culture were negative. Blood and sputum cultures also showed no growth. The administration of oral antibiotics for 5 days on an outpatient basis before pleural fluid culture could have led to sterility of all cultures.

Our patient had inadequate pleural fluid output through his chest tube, and radiography showed that the pleural collections failed to clear. In fact, an apical locule did not appear to be connecting with the lower aspect of the pleural collection. In such cases, instillation of intrapleural agents through the chest tube has become common practice in an attempt to lyse adhesions, to connect various locules or pockets of pleural fluid, and to improve drainage.
LOCULATED EMPYEMA: MANAGEMENT
3. What was the best management strategy for this loculated empyema?
- Continue intravenous antibiotics and existing chest tube drainage for 5 to 7 days, then reassess
- Continue intravenous antibiotics and instill intrapleural fibrinolytics (eg, tissue plasminogen activator [tPA]) through the existing chest tube
- Continue intravenous antibiotics and instill intrapleural fibrinolytics with deoxyribonuclease (DNase) into the existing chest tube
- Continue intravenous antibiotics, insert a second chest tube into the apical pocket under imaging guidance, and instill tPA and DNase
- Surgical decortication
Continuing antibiotics with existing chest tube drainage and the two options of using single-agent intrapleural fibrinolytics have been shown to be less effective than combining tPA and DNase when managing a loculated empyema. As such, surgical decortication, attempting intrapleural instillation of fibrinolytics and DNase (with or without further chest tube insertion into noncommunicating locules), or both were the most appropriate options at this stage.
MANAGEMENT OF PARAPNEUMONIC PLEURAL EFFUSION IN ADULTS
There are several options for managing parapneumonic effusion, and clinicians can use the classification system in Table 1 to assess the risk of a poor outcome and to plan the management. Based on radiographic findings and pleural fluid sampling, a pleural effusion can be either observed or drained.
Options for drainage of the pleural space include repeat thoracentesis, surgical insertion of a chest tube, or image-guided insertion of a small-bore catheter. Although no randomized trial has been done to compare tube sizes, a large retrospective series showed that small-bore tubes (< 14 F) perform similarly to standard large-bore tubes.8 However, in another study, Keeling et al9 reported higher failure rates when tubes smaller than 12 F were used. Regular flushing of the chest tube (ideally twice a day) is recommended to keep it patent, particularly with small-bore tubes. Multiloculated empyema may require multiple intercostal chest tubes to drain completely, and therefore small-bore tubes are recommended.
In cases that do not improve radiographically and clinically, one must consider whether the antibiotic choice is adequate, review the position of the chest tube, and assess for loculations. As such, repeating chest CT within 24 to 48 hours of tube insertion and drainage is recommended to confirm adequate tube positioning, assess effective drainage, look for different locules and pockets, and determine the degree of communication between them.
The largest well-powered randomized controlled trials of intrapleural agents in the management of pleural infection, the Multicentre Intrapleural Sepsis Trial (MIST1)10 and MIST2,11 clearly demonstrated that intrapleural fibrinolytics were not beneficial when used alone compared with placebo. However, in MIST2, the combination of tPA and DNase led to clinically significant benefits including radiologic improvement, shorter hospital stay, and less need for surgical decortication.
At our hospital, we follow the MIST2 protocol using a combination of tPA and DNase given intrapleurally twice daily for 3 days. In our patient, we inserted a chest tube into the apical pocket under ultrasonographic guidance, as 2 instillations of intrapleural tPA and DNase did not result in drainage of the apical locule.
Success rates with intrapleural tPA-DNase for complicated pleural effusion and empyema range from 68% to 92%.12–15 Pleural thickening and necrotizing pneumonia and abscess are important predictors of failure of tPA-DNase therapy and of the need for surgery.13,14
Early surgical intervention was another reasonable option in this case. The decision to proceed with surgery is based on need to debride multiloculated empyemas or uniloculated empyemas that fail to resolve with antibiotics and tube thoracostomy drainage. Nonetheless, the decision must be individualized and based on factors such as the patient’s risks vs possible benefit from a surgical procedure under general anesthesia, the patient’s ability to tolerate multiple thoracentesis procedures and chest tubes for a potentially lengthy period, the patient’s pain threshold, the patient’s wishes to avoid a surgical procedure balanced against a longer hospital stay, and cultural norms and beliefs.
Surgical options include video-assisted thoracoscopy, thoracotomy, and open drainage. Decortication can be considered early to control pleural sepsis, or late (after 3 to 6 months) if the lung does not expand. Debate continues on the optimal timing for video-assisted thoracoscopy, with data suggesting that when the procedure is performed later in the course of the disease there is a greater chance of complications and of the need to convert to thoracotomy.
A 2017 Cochrane review16 of surgical vs nonsurgical management of empyema identified 8 randomized trials, 6 in children and 2 in adults, with a total of 391 patients. The authors compared video-assisted thoracoscopy vs tube thoracotomy, with and without intrapleural fibrinolytics. They noted no difference in rates of mortality or procedural complications. However, the mean length of hospital stay was shorter with video-assisted thoracoscopy than with tube thoracotomy (5.9 vs 15.4 days). They could not assess the impact of fibrinolytic therapy on total cost of treatment in the 2 groups.
A randomized trial is planned to compare early video-assisted thoracoscopy vs treatment with chest tube drainage and t-PA-DNase.17
At our institution, we use a multidisciplinary approach, discussing cases at weekly meetings with thoracic surgeons, pulmonologists, infectious disease specialists, and interventional radiologists. We generally try conservative management first, with chest tube drainage and intrapleural agents for 5 to 7 days, before considering surgery if the response is unsatisfactory.
THE PATIENT RECOVERED
In our patient, the multiloculated empyema was successfully cleared after intrapleural instillation of 4 doses of tPA and DNAse over 3 days and insertion of a second intercostal chest tube into the noncommunicating apical locule. He completed 14 days of intravenous piperacillin-tazobactam treatment and, after discharge home, completed another 4 weeks of oral amoxicillin-clavulanate. He made a full recovery and was back at work 2 weeks after discharge. Chest radiography 10 weeks after discharge showed normal results.
- Colice GL, Curtis A, Deslauriers J, et al. Medical and surgical treatment of parapneumonic effusions: an evidence-based guideline. Chest 2000; 118(4):1158–1171. pmid:11035692
- Bryant RE, Salmon CJ. Pleural empyema. Clin Infect Dis 1996; 22(5):747–762. pmid:8722927
- Braman SS, Donat WE. Explosive pleuritis. Manifestation of group A beta-hemolytic streptococcal infection. Am J Med 1986; 81(4):723–726. pmid:3532794
- Sharma JK, Marrie TJ. Explosive pleuritis. Can J Infect Dis 2001; 12(2):104–107. pmid:18159325
- Johnson JL. Pleurisy, fever, and rapidly progressive pleural effusion in a healthy, 29-year-old physician. Chest 2001; 119(4):1266–1269. pmid:11296198
- Jimenez D, Diaz G, Gil D, et al. Etiology and prognostic significance of massive pleural effusions. Respir Med 2005; 99(9):1183–1187. doi:10.1016/j.rmed.2005.02.022
- Light RW, MacGregor MI, Luchsinger PC, Ball WC Jr. Pleural effusions: the diagnostic separation of transudates and exudates. Ann Intern Med 1972; 77:507–513. pmid:4642731
- Rahman NM, Maskell NA, Davies CW, et al. The relationship between chest tube size and clinical outcome in pleural infection. Chest 2010; 137(3):536–543. doi:10.1378/chest.09-1044
- Keeling AN, Leong S, Logan PM, Lee MJ. Empyema and effusion: outcome of image-guided small-bore catheter drainage. Cardiovasc Intervent Radiol 2008; 31(1):135–141. doi:10.1007/s00270-007-9197-0
- Maskell NA, Davies CW, Nunn AJ, et al. UK controlled trial of intrapleural streptokinase for pleural infection. N Engl J Med 2005; 352(9):865–874. doi:10.1056/NEJMoa042473
- Rahman NM, Maskell NA, West A, et al. Intrapleural use of tissue plasminogen activator and DNase in pleural infection. N Engl J Med 2011; 365(6):518–526. doi:10.1056/NEJMoa1012740
- Piccolo F, Pitman N, Bhatnagar R, et al. Intrapleural tissue plasminogen activator and deoxyribonuclease for pleural infection. An effective and safe alternative to surgery. Ann Am Thorac Soc 2014; 11(9):1419–1425. doi:10.1513/AnnalsATS.201407-329OC
- Khemasuwan D, Sorensen J, Griffin DC. Predictive variables for failure in administration of intrapleural tissue plasminogen activator/deoxyribonuclease in patients with complicated parapneumonic effusions/empyema. Chest 2018; 154(3):550–556. doi:10.1016/j.chest.2018.01.037
- Abu-Daff S, Maziak DE, Alshehab D, et al. Intrapleural fibrinolytic therapy (IPFT) in loculated pleural effusions—analysis of predictors for failure of therapy and bleeding: a cohort study. BMJ Open 2013; 3(2):e001887. doi:10.1136/bmjopen-2012-001887
- Bishwakarma R, Shah S, Frank L, Zhang W, Sharma G, Nishi SP. Mixing it up: coadministration of tPA/DNase in complicated parapneumonic pleural effusions and empyema. J Bronchology Interv Pulmonol 2017; 24(1):40–47. doi:10.1097/LBR.0000000000000334
- Redden MD, Chin TY, van Driel ML. Surgical versus non-surgical management for pleural empyema. Cochrane Database Syst Rev 2017; 3:CD010651. doi:10.1002/14651858.CD010651.pub2
- Feller-Kopman D, Light R. Pleural disease. N Engl J Med 2018; 378(8):740–751. doi:10.1056/NEJMra1403503
A 33-year-old male nonsmoker with no significant medical history presented to the pulmonary clinic with severe left-sided pleuritic chest pain and mild breathlessness for the past 5 days. He denied fever, chills, cough, phlegm, runny nose, or congestion.
Five days before this visit, he had been seen in the emergency department with mild left-sided pleuritic chest pain. His vital signs at that time had been as follows:
- Blood pressure 141/77 mm Hg
- Heart rate 77 beats/minute
- Respiratory rate 17 breaths/minute
- Temperature 36.8°C (98.2°F)
- Oxygen saturation 98% on room air.
- White blood cell count 6.89 × 10⁹/L (reference range 3.70–11.00)
- Neutrophils 58% (40%–70%)
- Lymphocytes 29.6% (22%–44%)
- Monocytes 10.7% (0–11%)
- Eosinophils 1% (0–4%)
- Basophils 0.6% (0–1%)
- Troponin T and D-dimer levels normal.
DIFFERENTIAL DIAGNOSIS OF PLEURITIC CHEST PAIN
1. What is the most likely cause of his pleuritic chest pain?
- Pleuritis
- Pneumonia
- Pulmonary embolism
- Malignancy
The differential diagnosis of pleuritic chest pain is broad.
The patient’s symptoms at presentation to the emergency department did not suggest an infectious process. There was no fever, cough, or phlegm, and his white blood cell count was normal. Nonetheless, pneumonia could not be ruled out, as the lung parenchyma was not normal on radiography, and the findings could have been consistent with an early or resolving infectious process.
Pulmonary embolism was a possibility, but his normal D-dimer level argued against it. Further, the patient subsequently underwent CT angiography, which ruled out pulmonary embolism.
Malignancy was unlikely in a young nonsmoker, but follow-up imaging would be needed to ensure resolution and rule this out.
The emergency department physician diagnosed inflammatory pleuritis and discharged him home on a nonsteroidal anti-inflammatory drug.
CLINIC VISIT 5 DAYS LATER
At his pulmonary clinic visit 5 days later, the patient reported persistent but stable left-sided pleuritic chest pain and mild breathlessness on exertion. His blood pressure was 137/81 mm Hg, heart rate 109 beats per minute, temperature 37.1°C (98.8°F), and oxygen saturation 97% on room air.
Auscultation of the lungs revealed rales and slightly decreased breath sounds at the left base. No dullness to percussion could be detected.
Because the patient had developed mild tachycardia and breathlessness along with clinical signs that suggested worsening infiltrates, consolidation, or the development of pleural effusion, he underwent further investigation with chest radiography, a complete blood cell count, and measurement of serum inflammatory markers.
- White blood cell count 13.08 × 10⁹/L
- Neutrophils 81%
- Lymphocytes 7.4%
- Monocytes 7.2%
- Eeosinophils 0.2%
- Basophils 0.2%
- Procalcitonin 0.34 µg/L (reference range < 0.09).
Bedside ultrasonography to assess the effusion’s size and characteristics and the need for thoracentesis indicated that the effusion was too small to tap, and there were no fibrinous strands or loculations to suggest empyema.
FURTHER TREATMENT
2. What was the best management strategy for this patient at this time?
- Admit to the hospital for thoracentesis and intravenous antibiotics
- Give oral antibiotics with close follow-up
- Perform thoracentesis on an outpatient basis and give oral antibiotics
- Repeat chest CT
The patient had worsening pleuritic pain with development of a small left pleural effusion. His symptoms had not improved on a nonsteroidal anti-inflammatory drug. He now had an elevated white blood cell count with a “left shift” (ie, an increase in neutrophils, indicating more immature cells in circulation) and elevated procalcitonin. The most likely diagnosis was pneumonia with a resulting pleural effusion, ie, parapneumonic effusion, requiring appropriate antibiotic therapy. Ideally, the pleural effusion should be sampled by thoracentesis, with management on an outpatient or inpatient basis.
5 DAYS LATER, THE EFFUSION HAD BECOME MASSIVE
On follow-up 5 days later, the patient’s chest pain was better, but he was significantly more short of breath. His blood pressure was 137/90 mm Hg, heart rate 117 beats/minute, respiratory rate 16 breaths/minute, oxygen saturation 97% on room air, and temperature 36.9°C (98.4°F). Chest auscultation revealed decreased breath sounds over the left hemithorax, with dullness to percussion and decreased fremitus.
RAPIDLY PROGRESSIVE PLEURAL EFFUSIONS
A rapidly progressive pleural effusion in a healthy patient suggests parapneumonic effusion. The most likely organism is streptococcal.2
Explosive pleuritis is defined as a pleural effusion that increases in size in less than 24 hours. It was first described by Braman and Donat3 in 1986 as an effusion that develops within hours of admission. In 2001, Sharma and Marrie4 refined the definition as rapid development of pleural effusion involving more than 90% of the hemithorax within 24 hours, causing compression of pulmonary tissue and a mediastinal shift. It is a medical emergency that requires prompt investigation and treatment with drainage and antibiotics. All reported cases of explosive pleuritis have been parapneumonic effusion.
The organisms implicated in explosive pleuritis include gram-positive cocci such as Streptococcus pneumoniae, S pyogenes, other streptococci, staphylococci, and gram-negative cocci such as Neisseria meningitidis and Moraxella catarrhalis. Gram-negative bacilli include Haemophilus influenzae, Klebsiella pneumoniae, Pseudomonas species, Escherichia coli, Proteus species, Enterobacter species, Bacteroides species, and Legionella species.4,5 However, malignancy is the most common cause of massive pleural effusion, accounting for 54% of cases; 17% of cases are idiopathic, 13% are parapneumonic, and 12% are hydrothorax related to liver cirrhosis.6
CASE CONTINUED
Our patient’s massive effusion needed drainage, and he was admitted to the hospital for further management. Samples of blood and sputum were sent for culture. Intravenous piperacillin-tazobactam was started, and an intercostal chest tube was inserted into the pleural cavity under ultrasonographic guidance to drain turbid fluid.
Multiple pleural fluid samples sent for bacterial, fungal, and acid-fast bacilli culture were negative. Blood and sputum cultures also showed no growth. The administration of oral antibiotics for 5 days on an outpatient basis before pleural fluid culture could have led to sterility of all cultures.
Our patient had inadequate pleural fluid output through his chest tube, and radiography showed that the pleural collections failed to clear. In fact, an apical locule did not appear to be connecting with the lower aspect of the pleural collection. In such cases, instillation of intrapleural agents through the chest tube has become common practice in an attempt to lyse adhesions, to connect various locules or pockets of pleural fluid, and to improve drainage.
LOCULATED EMPYEMA: MANAGEMENT
3. What was the best management strategy for this loculated empyema?
- Continue intravenous antibiotics and existing chest tube drainage for 5 to 7 days, then reassess
- Continue intravenous antibiotics and instill intrapleural fibrinolytics (eg, tissue plasminogen activator [tPA]) through the existing chest tube
- Continue intravenous antibiotics and instill intrapleural fibrinolytics with deoxyribonuclease (DNase) into the existing chest tube
- Continue intravenous antibiotics, insert a second chest tube into the apical pocket under imaging guidance, and instill tPA and DNase
- Surgical decortication
Continuing antibiotics with existing chest tube drainage and the two options of using single-agent intrapleural fibrinolytics have been shown to be less effective than combining tPA and DNase when managing a loculated empyema. As such, surgical decortication, attempting intrapleural instillation of fibrinolytics and DNase (with or without further chest tube insertion into noncommunicating locules), or both were the most appropriate options at this stage.
MANAGEMENT OF PARAPNEUMONIC PLEURAL EFFUSION IN ADULTS
There are several options for managing parapneumonic effusion, and clinicians can use the classification system in Table 1 to assess the risk of a poor outcome and to plan the management. Based on radiographic findings and pleural fluid sampling, a pleural effusion can be either observed or drained.
Options for drainage of the pleural space include repeat thoracentesis, surgical insertion of a chest tube, or image-guided insertion of a small-bore catheter. Although no randomized trial has been done to compare tube sizes, a large retrospective series showed that small-bore tubes (< 14 F) perform similarly to standard large-bore tubes.8 However, in another study, Keeling et al9 reported higher failure rates when tubes smaller than 12 F were used. Regular flushing of the chest tube (ideally twice a day) is recommended to keep it patent, particularly with small-bore tubes. Multiloculated empyema may require multiple intercostal chest tubes to drain completely, and therefore small-bore tubes are recommended.
In cases that do not improve radiographically and clinically, one must consider whether the antibiotic choice is adequate, review the position of the chest tube, and assess for loculations. As such, repeating chest CT within 24 to 48 hours of tube insertion and drainage is recommended to confirm adequate tube positioning, assess effective drainage, look for different locules and pockets, and determine the degree of communication between them.
The largest well-powered randomized controlled trials of intrapleural agents in the management of pleural infection, the Multicentre Intrapleural Sepsis Trial (MIST1)10 and MIST2,11 clearly demonstrated that intrapleural fibrinolytics were not beneficial when used alone compared with placebo. However, in MIST2, the combination of tPA and DNase led to clinically significant benefits including radiologic improvement, shorter hospital stay, and less need for surgical decortication.
At our hospital, we follow the MIST2 protocol using a combination of tPA and DNase given intrapleurally twice daily for 3 days. In our patient, we inserted a chest tube into the apical pocket under ultrasonographic guidance, as 2 instillations of intrapleural tPA and DNase did not result in drainage of the apical locule.
Success rates with intrapleural tPA-DNase for complicated pleural effusion and empyema range from 68% to 92%.12–15 Pleural thickening and necrotizing pneumonia and abscess are important predictors of failure of tPA-DNase therapy and of the need for surgery.13,14
Early surgical intervention was another reasonable option in this case. The decision to proceed with surgery is based on need to debride multiloculated empyemas or uniloculated empyemas that fail to resolve with antibiotics and tube thoracostomy drainage. Nonetheless, the decision must be individualized and based on factors such as the patient’s risks vs possible benefit from a surgical procedure under general anesthesia, the patient’s ability to tolerate multiple thoracentesis procedures and chest tubes for a potentially lengthy period, the patient’s pain threshold, the patient’s wishes to avoid a surgical procedure balanced against a longer hospital stay, and cultural norms and beliefs.
Surgical options include video-assisted thoracoscopy, thoracotomy, and open drainage. Decortication can be considered early to control pleural sepsis, or late (after 3 to 6 months) if the lung does not expand. Debate continues on the optimal timing for video-assisted thoracoscopy, with data suggesting that when the procedure is performed later in the course of the disease there is a greater chance of complications and of the need to convert to thoracotomy.
A 2017 Cochrane review16 of surgical vs nonsurgical management of empyema identified 8 randomized trials, 6 in children and 2 in adults, with a total of 391 patients. The authors compared video-assisted thoracoscopy vs tube thoracotomy, with and without intrapleural fibrinolytics. They noted no difference in rates of mortality or procedural complications. However, the mean length of hospital stay was shorter with video-assisted thoracoscopy than with tube thoracotomy (5.9 vs 15.4 days). They could not assess the impact of fibrinolytic therapy on total cost of treatment in the 2 groups.
A randomized trial is planned to compare early video-assisted thoracoscopy vs treatment with chest tube drainage and t-PA-DNase.17
At our institution, we use a multidisciplinary approach, discussing cases at weekly meetings with thoracic surgeons, pulmonologists, infectious disease specialists, and interventional radiologists. We generally try conservative management first, with chest tube drainage and intrapleural agents for 5 to 7 days, before considering surgery if the response is unsatisfactory.
THE PATIENT RECOVERED
In our patient, the multiloculated empyema was successfully cleared after intrapleural instillation of 4 doses of tPA and DNAse over 3 days and insertion of a second intercostal chest tube into the noncommunicating apical locule. He completed 14 days of intravenous piperacillin-tazobactam treatment and, after discharge home, completed another 4 weeks of oral amoxicillin-clavulanate. He made a full recovery and was back at work 2 weeks after discharge. Chest radiography 10 weeks after discharge showed normal results.
- Colice GL, Curtis A, Deslauriers J, et al. Medical and surgical treatment of parapneumonic effusions: an evidence-based guideline. Chest 2000; 118(4):1158–1171. pmid:11035692
- Bryant RE, Salmon CJ. Pleural empyema. Clin Infect Dis 1996; 22(5):747–762. pmid:8722927
- Braman SS, Donat WE. Explosive pleuritis. Manifestation of group A beta-hemolytic streptococcal infection. Am J Med 1986; 81(4):723–726. pmid:3532794
- Sharma JK, Marrie TJ. Explosive pleuritis. Can J Infect Dis 2001; 12(2):104–107. pmid:18159325
- Johnson JL. Pleurisy, fever, and rapidly progressive pleural effusion in a healthy, 29-year-old physician. Chest 2001; 119(4):1266–1269. pmid:11296198
- Jimenez D, Diaz G, Gil D, et al. Etiology and prognostic significance of massive pleural effusions. Respir Med 2005; 99(9):1183–1187. doi:10.1016/j.rmed.2005.02.022
- Light RW, MacGregor MI, Luchsinger PC, Ball WC Jr. Pleural effusions: the diagnostic separation of transudates and exudates. Ann Intern Med 1972; 77:507–513. pmid:4642731
- Rahman NM, Maskell NA, Davies CW, et al. The relationship between chest tube size and clinical outcome in pleural infection. Chest 2010; 137(3):536–543. doi:10.1378/chest.09-1044
- Keeling AN, Leong S, Logan PM, Lee MJ. Empyema and effusion: outcome of image-guided small-bore catheter drainage. Cardiovasc Intervent Radiol 2008; 31(1):135–141. doi:10.1007/s00270-007-9197-0
- Maskell NA, Davies CW, Nunn AJ, et al. UK controlled trial of intrapleural streptokinase for pleural infection. N Engl J Med 2005; 352(9):865–874. doi:10.1056/NEJMoa042473
- Rahman NM, Maskell NA, West A, et al. Intrapleural use of tissue plasminogen activator and DNase in pleural infection. N Engl J Med 2011; 365(6):518–526. doi:10.1056/NEJMoa1012740
- Piccolo F, Pitman N, Bhatnagar R, et al. Intrapleural tissue plasminogen activator and deoxyribonuclease for pleural infection. An effective and safe alternative to surgery. Ann Am Thorac Soc 2014; 11(9):1419–1425. doi:10.1513/AnnalsATS.201407-329OC
- Khemasuwan D, Sorensen J, Griffin DC. Predictive variables for failure in administration of intrapleural tissue plasminogen activator/deoxyribonuclease in patients with complicated parapneumonic effusions/empyema. Chest 2018; 154(3):550–556. doi:10.1016/j.chest.2018.01.037
- Abu-Daff S, Maziak DE, Alshehab D, et al. Intrapleural fibrinolytic therapy (IPFT) in loculated pleural effusions—analysis of predictors for failure of therapy and bleeding: a cohort study. BMJ Open 2013; 3(2):e001887. doi:10.1136/bmjopen-2012-001887
- Bishwakarma R, Shah S, Frank L, Zhang W, Sharma G, Nishi SP. Mixing it up: coadministration of tPA/DNase in complicated parapneumonic pleural effusions and empyema. J Bronchology Interv Pulmonol 2017; 24(1):40–47. doi:10.1097/LBR.0000000000000334
- Redden MD, Chin TY, van Driel ML. Surgical versus non-surgical management for pleural empyema. Cochrane Database Syst Rev 2017; 3:CD010651. doi:10.1002/14651858.CD010651.pub2
- Feller-Kopman D, Light R. Pleural disease. N Engl J Med 2018; 378(8):740–751. doi:10.1056/NEJMra1403503
Pulmonary infarction due to pulmonary embolism
A 76-year-old man whose history included abdominal aortic aneurysm repair, bilateral femoral artery bypass for popliteal artery aneurysm, hypertension, and peptic ulcer disease was admitted to a community hospital with pleuritic chest pain and shortness of breath. Two days earlier, he had undergone repair of a ventral hernia.
At the time of that admission, he reported no fever, chills, night sweats, cough, or history of heart or lung disease. His vital signs were normal, and physical examination had revealed no apparent respiratory distress, no jugular venous distention, normal heart sounds, and no pedal edema; however, decreased air entry was noted in the right lung base. Initial serum levels of troponin and N-terminal pro-B-type natriuretic peptide were normal.
At that time, computed tomographic angiography of the chest showed segmental pulmonary emboli in the left upper and right lower lobes of the lungs and right pleural effusion. Transthoracic echocardiography showed normal atrial and ventricular sizes with no right or left ventricular systolic dysfunction and a left ventricular ejection fraction of 59%.
Treatment with intravenous heparin was started, and the patient was transferred to our hospital.
PLEURAL EFFUSION AND PULMONARY EMBOLISM
1. Which of the following is true about pleural effusion?
- It is rarely, if ever, associated with pulmonary embolism
- Most patients with pleural effusion due to pulmonary embolism do not have pleuritic chest pain
- Pulmonary embolism should be excluded in all cases of pleural effusion without a clear cause
Pulmonary embolism should be excluded in all cases of pleural effusion that do not have a clear cause. As for the other answer choices:
- Pulmonary embolism is the fourth leading cause of pleural effusion in the United States, after heart failure, pneumonia, and malignancy.1
- About 75% of patients who develop pleural effusion in the setting of pulmonary embolism complain of pleuritic chest pain on the side of the effusion.2 Most effusions are unilateral, small, and usually exudative.3
EVALUATION BEGINS: RESULTS OF THORACENTESIS
Our patient continued to receive intravenous heparin.
He underwent thoracentesis on hospital day 3, and 1,000 mL of turbid sanguineous pleural fluid was removed. Analysis of the fluid showed pH 7.27, white blood cell count 3.797 × 10⁹/L with 80% neutrophils, and lactate dehydrogenase (LDH) concentration 736 U/L (a ratio of pleural fluid LDH to a concurrent serum LDH > 0.6 is suggestive of an exudate); the fluid was also sent for culture and cytology. Thoracentesis was terminated early due to cough, and follow-up chest radiography showed a moderate-sized pneumothorax.

Computed tomography (CT) of the chest at this time showed a small wedge-shaped area of lung consolidation in the right lower lobe (also seen on CT done 1 day before admission to our hospital), with an intrinsic air-fluid level suggesting a focal infarct or lung abscess, now obscured by adjacent consolidation and atelectasis. In the interval since the previous CT, the multiloculated right pleural effusion had increased in size (Figure 1).
THE NEXT STEP
2. What is the most appropriate next step for this patient?
- Consult an interventional radiologist for chest tube placement
- Start empiric antibiotic therapy and ask an interventional radiologist to place a chest tube
- Start empiric antibiotic therapy, withhold anticoagulation, and consult a thoracic surgeon
- Start empiric antibiotic therapy and consult a thoracic surgeon while continuing anticoagulation
The most appropriate next step is to start empiric antibiotic therapy and consult a thoracic surgeon while continuing anticoagulation.
In this patient, it is appropriate to initiate antibiotics empirically on the basis of his significant pleural loculations, a wedge-shaped consolidation, and 80% neutrophils in the pleural fluid, all of which suggest infection. The unmasking of a wedge-shaped consolidation after thoracentesis, with a previously noted air-fluid level and an interval increase in multiloculated pleural fluid, raises suspicion of a necrotic infection that may have ruptured into the pleural space, a possible lung infarct, or a malignancy. Hence, simply placing a chest tube may not be enough.
Blood in the pleural fluid does not necessitate withholding anticoagulation unless the bleeding is heavy. A pleural fluid hematocrit greater than 50% of the peripheral blood hematocrit suggests hemothorax and is an indication to withhold anticoagulation.1 Our patient’s pleural fluid was qualitatively sanguineous but not frankly bloody, and therefore we judged that it was not necessary to stop his heparin.
HOW DOES PULMONARY INFARCTION PRESENT CLINICALLY?
3. Which of the following statements about pulmonary infarction is incorrect?
- Cavitation and infarction are more common with larger emboli
- Cavitation occurs in fewer than 10% of pulmonary infarctions
- Lung abscess develops in more than 50% of pulmonary infarctions
- Pulmonary thromboembolism is the most common cause of pulmonary infarction
Lung abscess develops in far fewer than 50% of cases of pulmonary infarction. The rest of the statements are correct.
Cavitation complicates about 4% to 7% of infarctions and is more common when the infarction is 4 cm or greater in diameter.4 These cavities are usually single and predominantly on the right side in the apical or posterior segment of the upper lobe or the apical segment of the right lower lobe, as in our patient.5–8 CT demonstrating scalloped inner margins and cross-cavity band shadows suggests a cavitary pulmonary infarction.9,10
Infection and abscess in pulmonary infarction are poorly understood but have been linked to larger infarctions, coexistent congestion or atelectasis, and dental or oropharyngeal infection. In an early series of 550 cases of pulmonary infarction, 23 patients (4.2%) developed lung abscess and 6 (1.1%) developed empyema.11 The mean time to cavitation for an infected pulmonary infarction has been reported to be 18 days.12
A reversed halo sign, generally described as a focal, rounded area of ground-glass opacity surrounded by a nearly complete ring of consolidation, has been reported to be more frequent with pulmonary infarction than with other diseases, especially when in the lower lobes.13
CASE CONTINUED: THORACOSCOPY
A cardiothoracic surgeon was consulted, intravenous heparin was discontinued, an inferior vena cava filter was placed, and the patient underwent video-assisted thoracoscopy.
Purulent fluid was noted on the lateral aspect of right lower lobe; this appeared to be the ruptured cavitary lesion functioning like an uncontrolled bronchopleural fistula. Two chest tubes, sizes 32F and 28F, were placed after decortication, resection of the lung abscess, and closure of the bronchopleural fistula. No significant air leak was noted after resection of this segment of lung.

Pathologic study showed acute organizing pneumonia with abscess formation; no malignant cells or granulomas were seen (Figure 2). Pleural fluid cultures grew Streptococcus intermedius, while the tissue culture was negative for any growth, including acid-fast bacilli and fungi.
On 3 different occasions, both chest tubes were shortened, backed out 2 cm, and resecured with sutures and pins, and Heimlich valves were applied before the patient was discharged.
Intravenous piperacillin-tazobactam was started on the fifth hospital day. On discharge, the patient was advised to continue this treatment for 3 weeks at home.
The patient was receiving enoxaparin subcutaneously in prophylactic doses; 72 hours after the thorascopic procedure this was increased to therapeutic doses, continuing after discharge. Bridging to warfarin was not advised in view of his chest tubes.
Our patient appeared to have developed a right lower lobe infarction that cavitated and ruptured into the pleural space, causing a bronchopleural fistula with empyema after a recent pulmonary embolism. Other reported causes of pulmonary infarction in pulmonary embolism are malignancy and heavy clot burden,6 but these have not been confirmed in subsequent studies.5 Malignancy was ruled out by biopsy of the resected portion of the lung, and our patient did not have a history of heart failure. A clear cavity was not noted (because it ruptured into the pleura), but an air-fluid level was described in a wedge-shaped consolidation, suggesting infarction.
How common is pulmonary infarction after pulmonary embolism?
Pulmonary infarction occurs in few patients with pulmonary embolism.13 Since the lungs receive oxygen from the airways and have a dual blood supply from the pulmonary and bronchial arteries, they are not particularly vulnerable to ischemia. However, the reported incidence of pulmonary infarction in patients with pulmonary embolism has ranged from 10% to higher than 30%.5,14,15
The reasons behind pulmonary infarction with complications after pulmonary embolism have varied in different case series in different eras. CT, biopsy, or autopsy studies reveal pulmonary infarction after pulmonary embolism to be more common than suspected by clinical symptoms.
In a Mayo Clinic series of 43 cases of pulmonary infarction diagnosed over a 6-year period by surgical lung biopsy, 18 (42%) of the patients had underlying pulmonary thromboembolism, which was the most common cause.16
RISK FACTORS FOR PULMONARY INFARCTION
4. Which statement about risk factors for pulmonary infarction in pulmonary embolism is incorrect?
- Heart failure may be a risk factor for pulmonary infarction
- Pulmonary hemorrhage is a risk factor for pulmonary infarction
- Pulmonary infarction is more common with more proximal sites of pulmonary embolism
- Collateral circulation may protect against pulmonary infarction
Infarction is more common with emboli that are distal rather than proximal.
Dalen et al15 suggested that after pulmonary embolism, pulmonary hemorrhage is an important contributor to the development of pulmonary infarction independent of the presence or absence of associated cardiac or pulmonary disease, but that the effect depends on the site of obstruction.
This idea was first proposed in 1913, when Karsner and Ghoreyeb17 showed that when pulmonary arteries are completely obstructed, the bronchial arteries take over, except when the embolism is present in a small branch of the pulmonary artery. This is because the physiologic anastomosis between the pulmonary artery and the bronchial arteries is located at the precapillary level of the pulmonary artery, and the bronchial circulation does not take over until the pulmonary arterial pressure in the area of the embolism drops to zero.
Using CT data, Kirchner et al5 confirmed that the risk of pulmonary infarction is higher if the obstruction is peripheral, ie, distal.
Using autopsy data, Tsao et al18 reported a higher risk of pulmonary infarction in embolic occlusion of pulmonary vessels less than 3 mm in diameter.
Collateral circulation has been shown to protect against pulmonary infarction. For example, Miniati et al14 showed that healthy young patients with pulmonary embolism were more prone to develop pulmonary infarction, probably because they had less efficient collateral systems in the peripheral lung fields. In lung transplant recipients, it has been shown that the risk of infarction decreased with development of collateral circulation.19
Dalen et al,15 however, attributed delayed resolution of pulmonary hemorrhage (as measured by resolution of infiltrate on chest radiography) to higher underlying pulmonary venous pressure in patients with heart failure and consequent pulmonary infarction. In comparison, healthy patients without cardiac or pulmonary disease have faster resolution of pulmonary hemorrhage when present, and less likelihood of pulmonary infarction (and death in submassive pulmonary embolism).
Data on the management of infected pulmonary infarction are limited. Mortality rates have been as high as 41% with noninfected and 73% with infected cavitary infarctions.4 Some authors have advocated early surgical resection in view of high rates of failure of medical treatment due to lack of blood supply within the cavity and continued risk of infection.
KEY POINTS
In patients with a recently diagnosed pulmonary embolism and concurrent symptoms of bacterial pneumonia, a diagnosis of cavitary pulmonary infarction should be considered.
Consolidations that are pleural-based with sharp, rounded margins and with focal areas of central hyperlucencies representing hemorrhage on the mediastinal windows on CT are more likely to represent a pulmonary infarct.20
- Light RW. Pleural Diseases. 4th ed. Baltimore, MD: Lippincott, Williams & Wilkins; 2001.
- Stein PD, Terrin ML, Hales CA, et al. Clinical, laboratory, roentgenographic, and electrocardiographic findings in patients with acute pulmonary embolism and no pre-existing cardiac or pulmonary disease. Chest 1991; 100(3):598–603. pmid:1909617
- Light RW. Pleural effusion due to pulmonary emboli. Curr Opin Pulm Med 2001; 7(4):198–201. pmid:11470974
- Libby LS, King TE, LaForce FM, Schwarz MI. Pulmonary cavitation following pulmonary infarction. Medicine (Baltimore) 1985; 64(5):342–348. pmid:4033411
- Kirchner J, Obermann A, Stuckradt S, et al. Lung infarction following pulmonary embolism: a comparative study on clinical conditions and CT findings to identify predisposing factors. Rofo 2015; 187(6):440–444. doi:10.1055/s-0034-1399006
- He H, Stein MW, Zalta B, Haramati LB. Pulmonary infarction: spectrum of findings on multidetector helical CT. J Thorac Imaging 2006; 21(1):1–7. doi:10.1097/01.rti.0000187433.06762.fb
- Scharf J, Nahir AM, Munk J, Lichtig C. Aseptic cavitation in pulmonary infarction. Chest 1971; 59(4):456–458. pmid:5551596
- Wilson AG, Joseph AE, Butland RJ. The radiology of aseptic cavitation in pulmonary infarction. Clin Radiol 1986; 37(4):327–333. pmid:3731699
- Butler MD, Biscardi FH, Schain DC, Humphries JE, Blow O, Spotnitz WD. Pulmonary resection for treatment of cavitary pulmonary infarction. Ann Thorac Surg 1997; 63(3):849–850. pmid:9066420
- Koroscil MT, Hauser TR. Acute pulmonary embolism leading to cavitation and large pulmonary abscess: a rare complication of pulmonary infarction. Respir Med Case Rep 2016; 20:72–74. doi:10.1016/j.rmcr.2016.12.001
- Levin L, Kernohan JW, Moersch HJ. Pulmonary abscess secondary to bland pulmonary infarction. Dis Chest 1948; 14(2):218–232. pmid:18904835
- Marchiori E, Menna Barreto M, Pereira Freitas HM, et al. Morphological characteristics of the reversed halo sign that may strongly suggest pulmonary infarction. Clin Radiol 2018; 73(5):503.e7–503.e13. doi:10.1016/j.crad.2017.11.022
- Smith GT, Dexter L, Dammin GJ. Postmortem quantitative studies in pulmonary embolism. In: Sasahara AA, Stein M, eds. Pulmonary Embolic Disease. New York, NY: Grune & Stratton, Inc; 1965:120–126.
- Miniati M, Bottai M, Ciccotosto C, Roberto L, Monti S. Predictors of pulmonary infarction. Medicine (Baltimore) 2015; 94(41):e1488. doi:10.1097/MD.0000000000001488
- Dalen JE, Haffajee CI, Alpert JS, Howe JP, Ockene IS, Paraskos JA. Pulmonary embolism, pulmonary hemorrhage and pulmonary infarction. N Engl J Med 1977; 296(25):1431–1435. doi:10.1056/NEJM197706232962503
- Parambil JG, Savci CD, Tazelaar HD, Ryu JH. Causes and presenting features of pulmonary infarctions in 43 cases identified by surgical lung biopsy. Chest 2005; 127(4):1178–1183. doi:10.1378/chest.127.4.1178
- Karsner HT, Ghoreyeb AA. Studies in infarction: III. The circulation in experimental pulmonary embolism. J Exp Med 1913; 18(5):507–511. pmid:19867725
- Tsao MS, Schraufnagel D, Wang NS. Pathogenesis of pulmonary infarction. Am J Med 1982; 72(4):599–606. pmid:6462058
- Burns KE, Iacono AT. Incidence of clinically unsuspected pulmonary embolism in mechanically ventilated lung transplant recipients. Transplantation 2003; 76(6):964–968. doi:10.1097/01.TP.0000084523.58610.BA
- Yousem SA. The surgical pathology of pulmonary infarcts: diagnostic confusion with granulomatous disease, vasculitis, and neoplasia. Mod Pathol 2009; 22(5):679–685. doi:10.1038/modpathol.2009.20
A 76-year-old man whose history included abdominal aortic aneurysm repair, bilateral femoral artery bypass for popliteal artery aneurysm, hypertension, and peptic ulcer disease was admitted to a community hospital with pleuritic chest pain and shortness of breath. Two days earlier, he had undergone repair of a ventral hernia.
At the time of that admission, he reported no fever, chills, night sweats, cough, or history of heart or lung disease. His vital signs were normal, and physical examination had revealed no apparent respiratory distress, no jugular venous distention, normal heart sounds, and no pedal edema; however, decreased air entry was noted in the right lung base. Initial serum levels of troponin and N-terminal pro-B-type natriuretic peptide were normal.
At that time, computed tomographic angiography of the chest showed segmental pulmonary emboli in the left upper and right lower lobes of the lungs and right pleural effusion. Transthoracic echocardiography showed normal atrial and ventricular sizes with no right or left ventricular systolic dysfunction and a left ventricular ejection fraction of 59%.
Treatment with intravenous heparin was started, and the patient was transferred to our hospital.
PLEURAL EFFUSION AND PULMONARY EMBOLISM
1. Which of the following is true about pleural effusion?
- It is rarely, if ever, associated with pulmonary embolism
- Most patients with pleural effusion due to pulmonary embolism do not have pleuritic chest pain
- Pulmonary embolism should be excluded in all cases of pleural effusion without a clear cause
Pulmonary embolism should be excluded in all cases of pleural effusion that do not have a clear cause. As for the other answer choices:
- Pulmonary embolism is the fourth leading cause of pleural effusion in the United States, after heart failure, pneumonia, and malignancy.1
- About 75% of patients who develop pleural effusion in the setting of pulmonary embolism complain of pleuritic chest pain on the side of the effusion.2 Most effusions are unilateral, small, and usually exudative.3
EVALUATION BEGINS: RESULTS OF THORACENTESIS
Our patient continued to receive intravenous heparin.
He underwent thoracentesis on hospital day 3, and 1,000 mL of turbid sanguineous pleural fluid was removed. Analysis of the fluid showed pH 7.27, white blood cell count 3.797 × 10⁹/L with 80% neutrophils, and lactate dehydrogenase (LDH) concentration 736 U/L (a ratio of pleural fluid LDH to a concurrent serum LDH > 0.6 is suggestive of an exudate); the fluid was also sent for culture and cytology. Thoracentesis was terminated early due to cough, and follow-up chest radiography showed a moderate-sized pneumothorax.
Computed tomography (CT) of the chest at this time showed a small wedge-shaped area of lung consolidation in the right lower lobe (also seen on CT done 1 day before admission to our hospital), with an intrinsic air-fluid level suggesting a focal infarct or lung abscess, now obscured by adjacent consolidation and atelectasis. In the interval since the previous CT, the multiloculated right pleural effusion had increased in size (Figure 1).
THE NEXT STEP
2. What is the most appropriate next step for this patient?
- Consult an interventional radiologist for chest tube placement
- Start empiric antibiotic therapy and ask an interventional radiologist to place a chest tube
- Start empiric antibiotic therapy, withhold anticoagulation, and consult a thoracic surgeon
- Start empiric antibiotic therapy and consult a thoracic surgeon while continuing anticoagulation
The most appropriate next step is to start empiric antibiotic therapy and consult a thoracic surgeon while continuing anticoagulation.
In this patient, it is appropriate to initiate antibiotics empirically on the basis of his significant pleural loculations, a wedge-shaped consolidation, and 80% neutrophils in the pleural fluid, all of which suggest infection. The unmasking of a wedge-shaped consolidation after thoracentesis, with a previously noted air-fluid level and an interval increase in multiloculated pleural fluid, raises suspicion of a necrotic infection that may have ruptured into the pleural space, a possible lung infarct, or a malignancy. Hence, simply placing a chest tube may not be enough.
Blood in the pleural fluid does not necessitate withholding anticoagulation unless the bleeding is heavy. A pleural fluid hematocrit greater than 50% of the peripheral blood hematocrit suggests hemothorax and is an indication to withhold anticoagulation.1 Our patient’s pleural fluid was qualitatively sanguineous but not frankly bloody, and therefore we judged that it was not necessary to stop his heparin.
HOW DOES PULMONARY INFARCTION PRESENT CLINICALLY?
3. Which of the following statements about pulmonary infarction is incorrect?
- Cavitation and infarction are more common with larger emboli
- Cavitation occurs in fewer than 10% of pulmonary infarctions
- Lung abscess develops in more than 50% of pulmonary infarctions
- Pulmonary thromboembolism is the most common cause of pulmonary infarction
Lung abscess develops in far fewer than 50% of cases of pulmonary infarction. The rest of the statements are correct.
Cavitation complicates about 4% to 7% of infarctions and is more common when the infarction is 4 cm or greater in diameter.4 These cavities are usually single and predominantly on the right side in the apical or posterior segment of the upper lobe or the apical segment of the right lower lobe, as in our patient.5–8 CT demonstrating scalloped inner margins and cross-cavity band shadows suggests a cavitary pulmonary infarction.9,10
Infection and abscess in pulmonary infarction are poorly understood but have been linked to larger infarctions, coexistent congestion or atelectasis, and dental or oropharyngeal infection. In an early series of 550 cases of pulmonary infarction, 23 patients (4.2%) developed lung abscess and 6 (1.1%) developed empyema.11 The mean time to cavitation for an infected pulmonary infarction has been reported to be 18 days.12
A reversed halo sign, generally described as a focal, rounded area of ground-glass opacity surrounded by a nearly complete ring of consolidation, has been reported to be more frequent with pulmonary infarction than with other diseases, especially when in the lower lobes.13
CASE CONTINUED: THORACOSCOPY
A cardiothoracic surgeon was consulted, intravenous heparin was discontinued, an inferior vena cava filter was placed, and the patient underwent video-assisted thoracoscopy.
Purulent fluid was noted on the lateral aspect of right lower lobe; this appeared to be the ruptured cavitary lesion functioning like an uncontrolled bronchopleural fistula. Two chest tubes, sizes 32F and 28F, were placed after decortication, resection of the lung abscess, and closure of the bronchopleural fistula. No significant air leak was noted after resection of this segment of lung.
Pathologic study showed acute organizing pneumonia with abscess formation; no malignant cells or granulomas were seen (Figure 2). Pleural fluid cultures grew Streptococcus intermedius, while the tissue culture was negative for any growth, including acid-fast bacilli and fungi.
On 3 different occasions, both chest tubes were shortened, backed out 2 cm, and resecured with sutures and pins, and Heimlich valves were applied before the patient was discharged.
Intravenous piperacillin-tazobactam was started on the fifth hospital day. On discharge, the patient was advised to continue this treatment for 3 weeks at home.
The patient was receiving enoxaparin subcutaneously in prophylactic doses; 72 hours after the thorascopic procedure this was increased to therapeutic doses, continuing after discharge. Bridging to warfarin was not advised in view of his chest tubes.
Our patient appeared to have developed a right lower lobe infarction that cavitated and ruptured into the pleural space, causing a bronchopleural fistula with empyema after a recent pulmonary embolism. Other reported causes of pulmonary infarction in pulmonary embolism are malignancy and heavy clot burden,6 but these have not been confirmed in subsequent studies.5 Malignancy was ruled out by biopsy of the resected portion of the lung, and our patient did not have a history of heart failure. A clear cavity was not noted (because it ruptured into the pleura), but an air-fluid level was described in a wedge-shaped consolidation, suggesting infarction.
How common is pulmonary infarction after pulmonary embolism?
Pulmonary infarction occurs in few patients with pulmonary embolism.13 Since the lungs receive oxygen from the airways and have a dual blood supply from the pulmonary and bronchial arteries, they are not particularly vulnerable to ischemia. However, the reported incidence of pulmonary infarction in patients with pulmonary embolism has ranged from 10% to higher than 30%.5,14,15
The reasons behind pulmonary infarction with complications after pulmonary embolism have varied in different case series in different eras. CT, biopsy, or autopsy studies reveal pulmonary infarction after pulmonary embolism to be more common than suspected by clinical symptoms.
In a Mayo Clinic series of 43 cases of pulmonary infarction diagnosed over a 6-year period by surgical lung biopsy, 18 (42%) of the patients had underlying pulmonary thromboembolism, which was the most common cause.16
RISK FACTORS FOR PULMONARY INFARCTION
4. Which statement about risk factors for pulmonary infarction in pulmonary embolism is incorrect?
- Heart failure may be a risk factor for pulmonary infarction
- Pulmonary hemorrhage is a risk factor for pulmonary infarction
- Pulmonary infarction is more common with more proximal sites of pulmonary embolism
- Collateral circulation may protect against pulmonary infarction
Infarction is more common with emboli that are distal rather than proximal.
Dalen et al15 suggested that after pulmonary embolism, pulmonary hemorrhage is an important contributor to the development of pulmonary infarction independent of the presence or absence of associated cardiac or pulmonary disease, but that the effect depends on the site of obstruction.
This idea was first proposed in 1913, when Karsner and Ghoreyeb17 showed that when pulmonary arteries are completely obstructed, the bronchial arteries take over, except when the embolism is present in a small branch of the pulmonary artery. This is because the physiologic anastomosis between the pulmonary artery and the bronchial arteries is located at the precapillary level of the pulmonary artery, and the bronchial circulation does not take over until the pulmonary arterial pressure in the area of the embolism drops to zero.
Using CT data, Kirchner et al5 confirmed that the risk of pulmonary infarction is higher if the obstruction is peripheral, ie, distal.
Using autopsy data, Tsao et al18 reported a higher risk of pulmonary infarction in embolic occlusion of pulmonary vessels less than 3 mm in diameter.
Collateral circulation has been shown to protect against pulmonary infarction. For example, Miniati et al14 showed that healthy young patients with pulmonary embolism were more prone to develop pulmonary infarction, probably because they had less efficient collateral systems in the peripheral lung fields. In lung transplant recipients, it has been shown that the risk of infarction decreased with development of collateral circulation.19
Dalen et al,15 however, attributed delayed resolution of pulmonary hemorrhage (as measured by resolution of infiltrate on chest radiography) to higher underlying pulmonary venous pressure in patients with heart failure and consequent pulmonary infarction. In comparison, healthy patients without cardiac or pulmonary disease have faster resolution of pulmonary hemorrhage when present, and less likelihood of pulmonary infarction (and death in submassive pulmonary embolism).
Data on the management of infected pulmonary infarction are limited. Mortality rates have been as high as 41% with noninfected and 73% with infected cavitary infarctions.4 Some authors have advocated early surgical resection in view of high rates of failure of medical treatment due to lack of blood supply within the cavity and continued risk of infection.
KEY POINTS
In patients with a recently diagnosed pulmonary embolism and concurrent symptoms of bacterial pneumonia, a diagnosis of cavitary pulmonary infarction should be considered.
Consolidations that are pleural-based with sharp, rounded margins and with focal areas of central hyperlucencies representing hemorrhage on the mediastinal windows on CT are more likely to represent a pulmonary infarct.20
- Light RW. Pleural Diseases. 4th ed. Baltimore, MD: Lippincott, Williams & Wilkins; 2001.
- Stein PD, Terrin ML, Hales CA, et al. Clinical, laboratory, roentgenographic, and electrocardiographic findings in patients with acute pulmonary embolism and no pre-existing cardiac or pulmonary disease. Chest 1991; 100(3):598–603. pmid:1909617
- Light RW. Pleural effusion due to pulmonary emboli. Curr Opin Pulm Med 2001; 7(4):198–201. pmid:11470974
- Libby LS, King TE, LaForce FM, Schwarz MI. Pulmonary cavitation following pulmonary infarction. Medicine (Baltimore) 1985; 64(5):342–348. pmid:4033411
- Kirchner J, Obermann A, Stuckradt S, et al. Lung infarction following pulmonary embolism: a comparative study on clinical conditions and CT findings to identify predisposing factors. Rofo 2015; 187(6):440–444. doi:10.1055/s-0034-1399006
- He H, Stein MW, Zalta B, Haramati LB. Pulmonary infarction: spectrum of findings on multidetector helical CT. J Thorac Imaging 2006; 21(1):1–7. doi:10.1097/01.rti.0000187433.06762.fb
- Scharf J, Nahir AM, Munk J, Lichtig C. Aseptic cavitation in pulmonary infarction. Chest 1971; 59(4):456–458. pmid:5551596
- Wilson AG, Joseph AE, Butland RJ. The radiology of aseptic cavitation in pulmonary infarction. Clin Radiol 1986; 37(4):327–333. pmid:3731699
- Butler MD, Biscardi FH, Schain DC, Humphries JE, Blow O, Spotnitz WD. Pulmonary resection for treatment of cavitary pulmonary infarction. Ann Thorac Surg 1997; 63(3):849–850. pmid:9066420
- Koroscil MT, Hauser TR. Acute pulmonary embolism leading to cavitation and large pulmonary abscess: a rare complication of pulmonary infarction. Respir Med Case Rep 2016; 20:72–74. doi:10.1016/j.rmcr.2016.12.001
- Levin L, Kernohan JW, Moersch HJ. Pulmonary abscess secondary to bland pulmonary infarction. Dis Chest 1948; 14(2):218–232. pmid:18904835
- Marchiori E, Menna Barreto M, Pereira Freitas HM, et al. Morphological characteristics of the reversed halo sign that may strongly suggest pulmonary infarction. Clin Radiol 2018; 73(5):503.e7–503.e13. doi:10.1016/j.crad.2017.11.022
- Smith GT, Dexter L, Dammin GJ. Postmortem quantitative studies in pulmonary embolism. In: Sasahara AA, Stein M, eds. Pulmonary Embolic Disease. New York, NY: Grune & Stratton, Inc; 1965:120–126.
- Miniati M, Bottai M, Ciccotosto C, Roberto L, Monti S. Predictors of pulmonary infarction. Medicine (Baltimore) 2015; 94(41):e1488. doi:10.1097/MD.0000000000001488
- Dalen JE, Haffajee CI, Alpert JS, Howe JP, Ockene IS, Paraskos JA. Pulmonary embolism, pulmonary hemorrhage and pulmonary infarction. N Engl J Med 1977; 296(25):1431–1435. doi:10.1056/NEJM197706232962503
- Parambil JG, Savci CD, Tazelaar HD, Ryu JH. Causes and presenting features of pulmonary infarctions in 43 cases identified by surgical lung biopsy. Chest 2005; 127(4):1178–1183. doi:10.1378/chest.127.4.1178
- Karsner HT, Ghoreyeb AA. Studies in infarction: III. The circulation in experimental pulmonary embolism. J Exp Med 1913; 18(5):507–511. pmid:19867725
- Tsao MS, Schraufnagel D, Wang NS. Pathogenesis of pulmonary infarction. Am J Med 1982; 72(4):599–606. pmid:6462058
- Burns KE, Iacono AT. Incidence of clinically unsuspected pulmonary embolism in mechanically ventilated lung transplant recipients. Transplantation 2003; 76(6):964–968. doi:10.1097/01.TP.0000084523.58610.BA
- Yousem SA. The surgical pathology of pulmonary infarcts: diagnostic confusion with granulomatous disease, vasculitis, and neoplasia. Mod Pathol 2009; 22(5):679–685. doi:10.1038/modpathol.2009.20