User login
Flu activity increases after 2 weeks of declines
according to the Centers for Disease Control and Prevention.
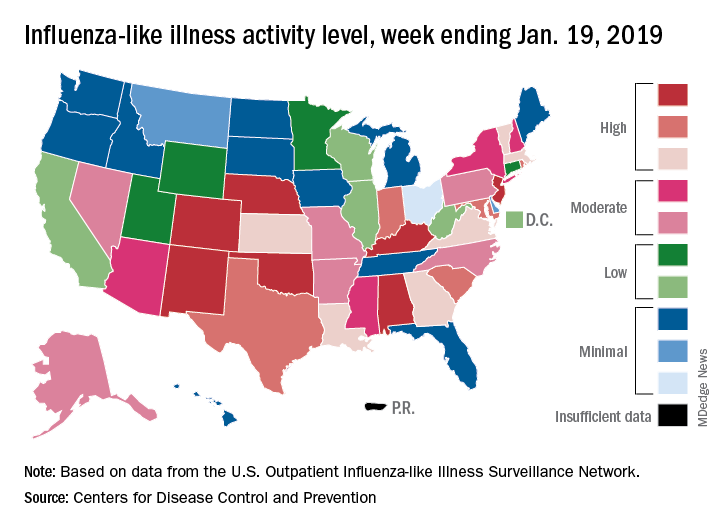
The proportion of outpatient visits for influenza-like illness (ILI) was 3.3% for the most recent measurement period, the CDC’s influenza division reported Jan 25. The previous 2-week decline had seen ILI visits dip down to 3.1% for the week ending Jan. 12 after hitting a season high of 4%.
To go along with the national increase in visits, more states reported high levels of flu activity. For the week ending Jan. 19, seven states were at level 10 on the CDC’s 1-10 scale, compared with four the previous week, and there were 18 states in the high range (levels 8-10), compared with 9 the week before, the CDC said.
Three flu-related pediatric deaths were reported in the week ending Jan. 19, although all three occurred during earlier weeks. The total number of pediatric deaths for the 2018-2019 season is now up to 22. Deaths among all ages, which are reported a week later, totaled 118 for the week ending Jan. 12, with 63% of reporting complete. There were 144 deaths during the week ending Jan. 5, with reporting 86% complete. During the second full week of 2018, in the middle of the very severe 2017-2018 season, there were 1,537 flu-related deaths, CDC data show.
according to the Centers for Disease Control and Prevention.
The proportion of outpatient visits for influenza-like illness (ILI) was 3.3% for the most recent measurement period, the CDC’s influenza division reported Jan 25. The previous 2-week decline had seen ILI visits dip down to 3.1% for the week ending Jan. 12 after hitting a season high of 4%.
To go along with the national increase in visits, more states reported high levels of flu activity. For the week ending Jan. 19, seven states were at level 10 on the CDC’s 1-10 scale, compared with four the previous week, and there were 18 states in the high range (levels 8-10), compared with 9 the week before, the CDC said.
Three flu-related pediatric deaths were reported in the week ending Jan. 19, although all three occurred during earlier weeks. The total number of pediatric deaths for the 2018-2019 season is now up to 22. Deaths among all ages, which are reported a week later, totaled 118 for the week ending Jan. 12, with 63% of reporting complete. There were 144 deaths during the week ending Jan. 5, with reporting 86% complete. During the second full week of 2018, in the middle of the very severe 2017-2018 season, there were 1,537 flu-related deaths, CDC data show.
New study determines factors that can send flu patients to the ICU
Numerous independent factors – including a history of obstructive/central sleep apnea syndrome (OSAS/CSAS) or myocardial infarction, along with a body mass index greater than 30 g/m2 – could be related to ICU admission and subsequent high mortality rates in influenza patients, according to an analysis of patients in the Netherlands who were treated during the influenza epidemic of 2015-2016.

Along with determining these factors, lead author M.C. Beumer, of Radboud University Medical Center, the Netherlands, and his coauthors found that “coinfections with bacterial, fungal, and viral pathogens developed more often in patients who were admitted to the ICU.” The study was published in the Journal of Critical Care.
The coauthors reviewed 199 influenza patients who were admitted to two medical centers in the Netherlands during October 2015–April 2016. Of those patients, 45 (23%) were admitted to the ICU, primarily because of respiratory failure, and their mortality rate was 17/45 (38%) versus an overall mortality rate of 18/199 (9%).
Compared with patients in the normal ward, patients admitted to the ICU more frequently had a history of OSAS/CSAS (11% vs. 3%; P = .03) and MI (20% vs. 6%; P = .007), along with a BMI higher than 30 g/m2 (30% vs. 15%; P = .04) and dyspnea as a symptom (77% vs. 48%,; P = .001). In addition, more ICU-admitted patients had influenza A rather than influenza B, compared with those not admitted (87% vs. 66%; P = .009).
Pulmonary coinfections – including bacterial, fungal, and viral pathogens – were also proportionally higher among the 45 ICU patients (56% vs. 20%; P less than .0001). The most common bacterial pathogens were Staphylococcus aureus (11%) and Streptococcus pneumoniae (7%) while Aspergillus fumigatus (18%) and Pneumocystis jirovecii (7%) topped the fungal pathogens.
Mr. Beumer and his colleagues noted potential limitations of their work, including the selection of patients from among the “most severely ill” contributing to an ICU admission rate that surpassed the 5%-10% described elsewhere. They also admitted that their study relied on a “relatively small sample size,” focusing on one seasonal influenza outbreak. However, “despite the limited validity,” they reiterated that “the identified factors may contribute to a complicated disease course and could represent a tool for early recognition of the influenza patients at risk for a complicated disease course.”
The authors reported no conflicts of interest.
SOURCE: Beumer MC et al. J Crit Care. 2019;50:59-65.
.
Numerous independent factors – including a history of obstructive/central sleep apnea syndrome (OSAS/CSAS) or myocardial infarction, along with a body mass index greater than 30 g/m2 – could be related to ICU admission and subsequent high mortality rates in influenza patients, according to an analysis of patients in the Netherlands who were treated during the influenza epidemic of 2015-2016.
Along with determining these factors, lead author M.C. Beumer, of Radboud University Medical Center, the Netherlands, and his coauthors found that “coinfections with bacterial, fungal, and viral pathogens developed more often in patients who were admitted to the ICU.” The study was published in the Journal of Critical Care.
The coauthors reviewed 199 influenza patients who were admitted to two medical centers in the Netherlands during October 2015–April 2016. Of those patients, 45 (23%) were admitted to the ICU, primarily because of respiratory failure, and their mortality rate was 17/45 (38%) versus an overall mortality rate of 18/199 (9%).
Compared with patients in the normal ward, patients admitted to the ICU more frequently had a history of OSAS/CSAS (11% vs. 3%; P = .03) and MI (20% vs. 6%; P = .007), along with a BMI higher than 30 g/m2 (30% vs. 15%; P = .04) and dyspnea as a symptom (77% vs. 48%,; P = .001). In addition, more ICU-admitted patients had influenza A rather than influenza B, compared with those not admitted (87% vs. 66%; P = .009).
Pulmonary coinfections – including bacterial, fungal, and viral pathogens – were also proportionally higher among the 45 ICU patients (56% vs. 20%; P less than .0001). The most common bacterial pathogens were Staphylococcus aureus (11%) and Streptococcus pneumoniae (7%) while Aspergillus fumigatus (18%) and Pneumocystis jirovecii (7%) topped the fungal pathogens.
Mr. Beumer and his colleagues noted potential limitations of their work, including the selection of patients from among the “most severely ill” contributing to an ICU admission rate that surpassed the 5%-10% described elsewhere. They also admitted that their study relied on a “relatively small sample size,” focusing on one seasonal influenza outbreak. However, “despite the limited validity,” they reiterated that “the identified factors may contribute to a complicated disease course and could represent a tool for early recognition of the influenza patients at risk for a complicated disease course.”
The authors reported no conflicts of interest.
SOURCE: Beumer MC et al. J Crit Care. 2019;50:59-65.
.
FROM THE JOURNAL OF CRITICAL CARE
Key clinical point:
Major finding: Flu patients in the ICU more frequently had a history of obstructive/central sleep apnea syndrome (11% vs. 3%; P = .03) and MI (20% vs. 6%; P = .007), compared with non-ICU flu patients.
Study details: A retrospective cohort study of 199 flu patients who were admitted to two academic hospitals in the Netherlands.
Disclosures: The authors reported no conflicts of interest.
Source: Beumer MC et al. J Crit Care. 2019; 50:59-65.
Flu activity down for second consecutive week
The second week of the new year brought a second straight week of declining activity for the 2018-2019 flu season, according to the Centers for Disease Control and Prevention.
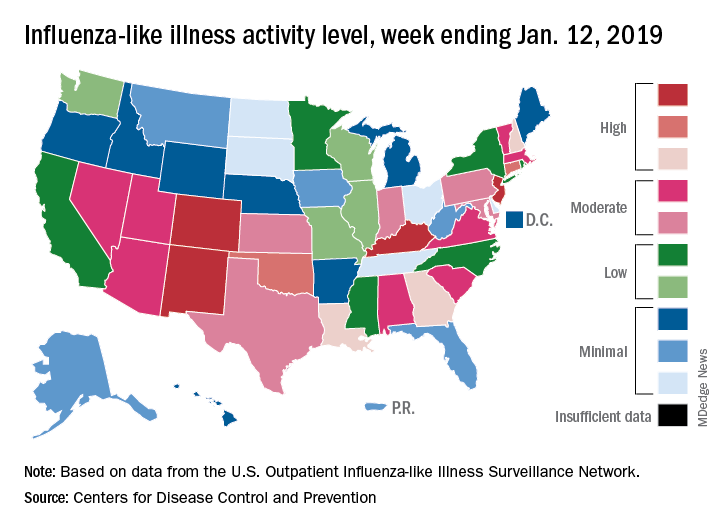
The proportion of outpatient visits for influenza-like illness (ILI) was 3.1% for the week ending Jan. 12, 2019, down from 3.5% the previous week but still above the national baseline level of 2.2%, the CDC’s influenza division reported Jan. 18.
Activity was also down at the state level. There were 4 states – Colorado, Kentucky, New Jersey, and New Mexico – at level 10 on the CDC’s 1-10 scale for ILI activity, compared with 10 the week before, and a total of 9 were in the high range from 8 to 10, compared with 15 the previous week, data from the influenza division show.
Reports of total influenza deaths, which lag a week behind other measures, continue to rise: 111 for the week ending Jan. 5, although reporting is only 72% complete. There were 89 deaths during the previous week, with reporting 82% complete so far. Total flu-related deaths among children are up to 19 for the 2018-2019 season after three more were reported during the week ending Jan. 12, the CDC said. Influenza deaths from the comparable weeks of the much more severe 2017-2018 season were 1,163 for all ages and 10 for children.
The second week of the new year brought a second straight week of declining activity for the 2018-2019 flu season, according to the Centers for Disease Control and Prevention.
The proportion of outpatient visits for influenza-like illness (ILI) was 3.1% for the week ending Jan. 12, 2019, down from 3.5% the previous week but still above the national baseline level of 2.2%, the CDC’s influenza division reported Jan. 18.
Activity was also down at the state level. There were 4 states – Colorado, Kentucky, New Jersey, and New Mexico – at level 10 on the CDC’s 1-10 scale for ILI activity, compared with 10 the week before, and a total of 9 were in the high range from 8 to 10, compared with 15 the previous week, data from the influenza division show.
Reports of total influenza deaths, which lag a week behind other measures, continue to rise: 111 for the week ending Jan. 5, although reporting is only 72% complete. There were 89 deaths during the previous week, with reporting 82% complete so far. Total flu-related deaths among children are up to 19 for the 2018-2019 season after three more were reported during the week ending Jan. 12, the CDC said. Influenza deaths from the comparable weeks of the much more severe 2017-2018 season were 1,163 for all ages and 10 for children.
Flu season showing signs of decline
The 2018-2019 flu season may have peaked as measures of influenza-like illness (ILI) activity dropped in the first week of the new year, according to the U.S. Centers for Disease Control and Prevention.

The proportion of outpatients visits for ILI dropped to 3.5% for the week ending Jan. 5, 2019, after reaching 4.0% the previous week. Outpatient ILI visits first topped the national baseline of 2.2% during the week ending Dec. 8, 2018, and have remained above that value for 5 consecutive weeks, the CDC’s influenza division said on Jan. 11.
Flu activity reported by the states reflects the national drop: 10 states came in at level 10 on the CDC’s 1-10 scale of activity for the week ending Jan. 5 – down from 12 the week before – and a total of 15 were in the high range from 8 to 10, compared with 19 the previous week, the CDC said. Two states, Mississippi and Texas, dropped from level 10 to level 7, which the CDC categorizes as moderate activity.
A total of 73 ILI-related deaths were reported during the week ending Dec. 29 (the latest with data available; reporting less than 68% complete), which already exceeds the 71 deaths reported for the week ending Dec. 22 (reporting 85% complete). Flu deaths totaled 437 through the first 13 weeks of the 2018-2019 season, compared with the 1,659 that occurred during weeks 1-13 of the very severe 2017-2018 season, CDC data show.
For the week ending Jan. 5, the CDC received reports of three flu-related pediatric deaths, all of which occurred the previous week. For the season so far, there have been 16 pediatric deaths, compared with 20 at this point in the 2017-2018 season.
Estimates released during the flu season for the first time show that between 6 and 7 million Americans have been infected since Oct. 1, 2018, and that 69,000-84,000 people have been hospitalized with the flu through Jan. 5, 2019. These cumulative totals have previously been available only at the end of the season, the CDC noted.
The 2018-2019 flu season may have peaked as measures of influenza-like illness (ILI) activity dropped in the first week of the new year, according to the U.S. Centers for Disease Control and Prevention.
The proportion of outpatients visits for ILI dropped to 3.5% for the week ending Jan. 5, 2019, after reaching 4.0% the previous week. Outpatient ILI visits first topped the national baseline of 2.2% during the week ending Dec. 8, 2018, and have remained above that value for 5 consecutive weeks, the CDC’s influenza division said on Jan. 11.
Flu activity reported by the states reflects the national drop: 10 states came in at level 10 on the CDC’s 1-10 scale of activity for the week ending Jan. 5 – down from 12 the week before – and a total of 15 were in the high range from 8 to 10, compared with 19 the previous week, the CDC said. Two states, Mississippi and Texas, dropped from level 10 to level 7, which the CDC categorizes as moderate activity.
A total of 73 ILI-related deaths were reported during the week ending Dec. 29 (the latest with data available; reporting less than 68% complete), which already exceeds the 71 deaths reported for the week ending Dec. 22 (reporting 85% complete). Flu deaths totaled 437 through the first 13 weeks of the 2018-2019 season, compared with the 1,659 that occurred during weeks 1-13 of the very severe 2017-2018 season, CDC data show.
For the week ending Jan. 5, the CDC received reports of three flu-related pediatric deaths, all of which occurred the previous week. For the season so far, there have been 16 pediatric deaths, compared with 20 at this point in the 2017-2018 season.
Estimates released during the flu season for the first time show that between 6 and 7 million Americans have been infected since Oct. 1, 2018, and that 69,000-84,000 people have been hospitalized with the flu through Jan. 5, 2019. These cumulative totals have previously been available only at the end of the season, the CDC noted.
Children who are coughing: Is it flu or bacterial pneumonia?
We are in the middle of flu season, and many of our patients are coughing. Is it the flu or might the child have a secondary bacterial pneumonia? Let’s start with the history for a tip off. The course of flu and respiratory viral infections in general involves a typical pattern of timing for fever and cough.
A late-developing fever or fever that subsides then recurs should raise concern. A prolonged cough or cough that subsides then recurs also should raise concern. The respiratory rate and chest retractions are key physical findings that can aid in distinguishing children with bacterial pneumonia. Rales and decreased breath sounds in lung segments are best heard with deep breaths.
What diagnostic laboratory and imaging tests should be used
Fortunately, rapid tests to detect influenza are available, and many providers have added those to their laboratory evaluation. A complete blood count and differential may be helpful. If a pulse oximeter is available, checking oxygen saturation might be helpful. The American Academy of Pediatrics community pneumonia guideline states that routine chest radiographs are not necessary for the confirmation of suspected community-acquired pneumonia (CAP) in patients well enough to be treated in the outpatient setting (Clin Inf Dis. 2011 Oct;53[7]:e25–e76). Blood cultures should not be performed routinely in nontoxic, fully immunized children with CAP managed in the outpatient setting.
What antibiotic should be used
Antimicrobial therapy is not routinely required for preschool-aged children with cough, even cough caused by CAP, because viral pathogens are responsible for the great majority of clinical disease. If the diagnosis of CAP is made, the AAP endorses amoxicillin as first-line therapy for previously healthy, appropriately immunized infants and preschool children with mild to moderate CAP suspected to be of bacterial origin. For previously healthy, appropriately immunized school-aged children and adolescents with mild to moderate CAP, amoxicillin is recommended for treatment of Streptococcus pneumoniae, the most prominent invasive bacterial pathogen.
However, the treatment paradigm is complicated because Mycoplasma pneumoniae also should be considered in management decisions. Children with signs and symptoms suspicious for M. pneumoniae should be tested to help guide antibiotic selection. This may be a simple bedside cold agglutinin test. The highest incidence of Mycoplasma pneumonia is in 5- to 20-year-olds (51% in 5- to 9-year-olds, 74% in 9- to 15-year-olds, and 3%-18% in adults with pneumonia), but 9% of CAP occurs in patients younger than 5 years old. The clinical features of Mycoplasma pneumonia resemble influenza: The patient has gradual onset of headache, malaise, fever, sore throat, and cough. Mycoplasma pneumonia has a similar incidence of productive cough, rales, and diarrhea as pneumococcal CAP, but with more frequent upper respiratory symptoms and a normal leukocyte count. Mycoplasma bronchopneumonia occurs 30 times more frequently than Mycoplasma lobar pneumonia. The radiologic features of Mycoplasma is typical of a bronchopneumonia, usually involving a single lobe, subsegmental atelectasis, peribronchial thickening, and streaky interstitial densities. While Mycoplasma pneumonia is usually self-limited, the duration of illness is shortened by oral treatment with doxycycline, erythromycin, clarithromycin, or azithromycin.
What is the appropriate duration of antimicrobial therapy
Recommendations by the AAP for CAP note that treatment courses of 10 days have been best studied, although shorter courses may be just as effective, particularly for mild disease managed on an outpatient basis.
When should children be hospitalized

Dr. Pichichero is a specialist in pediatric infectious diseases and director of the Research Institute at Rochester (N.Y.) General Hospital. He had no conflicts to declare. Email him at pdnews@mdedge.com.
We are in the middle of flu season, and many of our patients are coughing. Is it the flu or might the child have a secondary bacterial pneumonia? Let’s start with the history for a tip off. The course of flu and respiratory viral infections in general involves a typical pattern of timing for fever and cough.
A late-developing fever or fever that subsides then recurs should raise concern. A prolonged cough or cough that subsides then recurs also should raise concern. The respiratory rate and chest retractions are key physical findings that can aid in distinguishing children with bacterial pneumonia. Rales and decreased breath sounds in lung segments are best heard with deep breaths.
What diagnostic laboratory and imaging tests should be used
Fortunately, rapid tests to detect influenza are available, and many providers have added those to their laboratory evaluation. A complete blood count and differential may be helpful. If a pulse oximeter is available, checking oxygen saturation might be helpful. The American Academy of Pediatrics community pneumonia guideline states that routine chest radiographs are not necessary for the confirmation of suspected community-acquired pneumonia (CAP) in patients well enough to be treated in the outpatient setting (Clin Inf Dis. 2011 Oct;53[7]:e25–e76). Blood cultures should not be performed routinely in nontoxic, fully immunized children with CAP managed in the outpatient setting.
What antibiotic should be used
Antimicrobial therapy is not routinely required for preschool-aged children with cough, even cough caused by CAP, because viral pathogens are responsible for the great majority of clinical disease. If the diagnosis of CAP is made, the AAP endorses amoxicillin as first-line therapy for previously healthy, appropriately immunized infants and preschool children with mild to moderate CAP suspected to be of bacterial origin. For previously healthy, appropriately immunized school-aged children and adolescents with mild to moderate CAP, amoxicillin is recommended for treatment of Streptococcus pneumoniae, the most prominent invasive bacterial pathogen.
However, the treatment paradigm is complicated because Mycoplasma pneumoniae also should be considered in management decisions. Children with signs and symptoms suspicious for M. pneumoniae should be tested to help guide antibiotic selection. This may be a simple bedside cold agglutinin test. The highest incidence of Mycoplasma pneumonia is in 5- to 20-year-olds (51% in 5- to 9-year-olds, 74% in 9- to 15-year-olds, and 3%-18% in adults with pneumonia), but 9% of CAP occurs in patients younger than 5 years old. The clinical features of Mycoplasma pneumonia resemble influenza: The patient has gradual onset of headache, malaise, fever, sore throat, and cough. Mycoplasma pneumonia has a similar incidence of productive cough, rales, and diarrhea as pneumococcal CAP, but with more frequent upper respiratory symptoms and a normal leukocyte count. Mycoplasma bronchopneumonia occurs 30 times more frequently than Mycoplasma lobar pneumonia. The radiologic features of Mycoplasma is typical of a bronchopneumonia, usually involving a single lobe, subsegmental atelectasis, peribronchial thickening, and streaky interstitial densities. While Mycoplasma pneumonia is usually self-limited, the duration of illness is shortened by oral treatment with doxycycline, erythromycin, clarithromycin, or azithromycin.
What is the appropriate duration of antimicrobial therapy
Recommendations by the AAP for CAP note that treatment courses of 10 days have been best studied, although shorter courses may be just as effective, particularly for mild disease managed on an outpatient basis.
When should children be hospitalized
Dr. Pichichero is a specialist in pediatric infectious diseases and director of the Research Institute at Rochester (N.Y.) General Hospital. He had no conflicts to declare. Email him at pdnews@mdedge.com.
LAIV4 was less effective for children than IIV against influenza A/H1N1pdm09
The live attenuated influenza vaccine was less effective against the influenza A/H1N1pdm09 virus in children and adolescents across multiple influenza seasons between 2013 and 2016, compared with the inactivated influenza vaccine, according to research published in the journal Pediatrics.
Jessie R. Chung, MPH, from the influenza division at the Centers for Disease Control and Prevention in Atlanta, and her colleagues performed an analysis of five different studies where vaccine effectiveness (VE) was examined for quadrivalent live attenuated vaccine (LAIV4) and inactivated influenza vaccine (IIV) in children and adolescents aged 2-17 years from 42 states.
The analysis included data from the U.S. Influenza Vaccine Effectiveness Network (6,793 patients), a study from the Louisiana State University Health Sciences Center (3,822 patients), the Influenza Clinical Investigation for Children (3,521 patients), Department of Defense Global, Laboratory-based, Influenza Surveillance Program (1,935 patients), and the Influenza Incidence Surveillance Project (1,102 patients) between the periods of 2013-2014 and 2015-2016. The researchers sourced current and previous season vaccination history from electronic medical records and immunization registries.
Of patients who were vaccinated across all seasons, there was 67% effectiveness against influenza A/H1N1pdm09 (95% confidence interval, 62%-72%) for those who received the IIV and 20% (95% CI, −6%-39%) for LAIV4. Among patients who received the LAIV4 vaccination, there was a significantly higher likelihood of developing influenza A/H1N1pdm09 (odds ratio, 2.66; 95% CI, 2.06-3.44) compared with patients who received the IIV vaccination.
With regard to other strains, there was similar effectiveness against influenza A/H3N2 and influenza B with LAIV4 and IIV vaccinations.
“In contrast to findings of reduced LAIV4 effectiveness against influenza A/H1N1pdm09 viruses, our results suggest a possible but nonsignificant benefit of LAIV4 over IIV against influenza B viruses, which has been described previously,” the investigators wrote.
Limitations of the study included having data only one season prior to enrollment and little available demographic information beyond age, gender, and geographic location.
The Influenza Clinical Investigation for Children was funded by MedImmune, a member of the AstraZeneca Group. Two of the researchers are employees of AstraZeneca. The other authors reported having no conflicts of interest. The U.S. Influenza Vaccine Effectiveness Network was supported by the CDC through cooperative agreements with the University of Michigan, Kaiser Permanente Washington Health Research Institute, Marshfield Clinic Research Institute, University of Pittsburgh, and Baylor Scott & White Health. At the University of Pittsburgh, the project also was supported by the National Institutes of Health.
SOURCE: Chung JR et al. Pediatrics. 2018. doi: 10.1542/peds.2018-2094.
There are many explanations for the decline in effectiveness of the live attenuated influenza vaccine (LAIV4), but the data are complicated by conflicting information from studies outside the United States indicating “reasonable protection” against influenza A/H1N1pdm09, A/H3N2, and influenza B, compared with the inactivated influenza virus (IIV), Pedro A. Piedra, MD, wrote in an accompanying editorial.
In 2016, the World Health Organization met to discuss LAIV effectiveness and highlighted factors such as methodological study differences, inadequate vaccine handling at distribution centers, intrinsic virological differences of the A/H1N1pdm09 virus, and increased preexisting population immunity in the United States since 2010 as potential explanations. During the transition from LAIV3 to LAIV4 for the 2013-2014 influenza season, viral interference may have also occurred when the influenza B strain was introduced into the vaccine, he added.
According to the CDC’s Advisory Committee on Immunization Practices (ACIP), viral growth properties of A/H1N1pdm09 has improved in LAIV4, and viral shedding also has improved for children between 2 years and 4 years of age. Although effectiveness numbers were not available for the ACIP recommendation, an interim analysis from Public Health England for the 2017-2018 influenza season found a vaccine effectiveness of 90.3% (95% confidence interval, 16.4%-98.9%).
“This early result is encouraging and supports the reintroduction of LAIV4 in the United States as an option for the control of seasonal influenza,” he said. “It also highlights the need for annual influenza vaccine effectiveness estimates and the importance of the U.S. Influenza Vaccine Effectiveness Network in providing updated information for ACIP recommendations.”
Dr. Piedra is from the departments of molecular virology and microbiology and pediatrics, Baylor College of Medicine, Houston. He reports being a consultant for AstraZeneca, Sanofi Pasteur, GlaxoSmithKline, and Merck Sharp and Dohme, and he has received travel support to present at an influenza seminar supported by Seqirus. His comments are from an editorial accompanying the article by Chung and colleagues ( Pediatrics. 2019. doi: 10.1542/peds.2018- 3290 ).
The live attenuated influenza vaccine was less effective against the influenza A/H1N1pdm09 virus in children and adolescents across multiple influenza seasons between 2013 and 2016, compared with the inactivated influenza vaccine, according to research published in the journal Pediatrics.
Jessie R. Chung, MPH, from the influenza division at the Centers for Disease Control and Prevention in Atlanta, and her colleagues performed an analysis of five different studies where vaccine effectiveness (VE) was examined for quadrivalent live attenuated vaccine (LAIV4) and inactivated influenza vaccine (IIV) in children and adolescents aged 2-17 years from 42 states.
The analysis included data from the U.S. Influenza Vaccine Effectiveness Network (6,793 patients), a study from the Louisiana State University Health Sciences Center (3,822 patients), the Influenza Clinical Investigation for Children (3,521 patients), Department of Defense Global, Laboratory-based, Influenza Surveillance Program (1,935 patients), and the Influenza Incidence Surveillance Project (1,102 patients) between the periods of 2013-2014 and 2015-2016. The researchers sourced current and previous season vaccination history from electronic medical records and immunization registries.
Of patients who were vaccinated across all seasons, there was 67% effectiveness against influenza A/H1N1pdm09 (95% confidence interval, 62%-72%) for those who received the IIV and 20% (95% CI, −6%-39%) for LAIV4. Among patients who received the LAIV4 vaccination, there was a significantly higher likelihood of developing influenza A/H1N1pdm09 (odds ratio, 2.66; 95% CI, 2.06-3.44) compared with patients who received the IIV vaccination.
With regard to other strains, there was similar effectiveness against influenza A/H3N2 and influenza B with LAIV4 and IIV vaccinations.
“In contrast to findings of reduced LAIV4 effectiveness against influenza A/H1N1pdm09 viruses, our results suggest a possible but nonsignificant benefit of LAIV4 over IIV against influenza B viruses, which has been described previously,” the investigators wrote.
Limitations of the study included having data only one season prior to enrollment and little available demographic information beyond age, gender, and geographic location.
The Influenza Clinical Investigation for Children was funded by MedImmune, a member of the AstraZeneca Group. Two of the researchers are employees of AstraZeneca. The other authors reported having no conflicts of interest. The U.S. Influenza Vaccine Effectiveness Network was supported by the CDC through cooperative agreements with the University of Michigan, Kaiser Permanente Washington Health Research Institute, Marshfield Clinic Research Institute, University of Pittsburgh, and Baylor Scott & White Health. At the University of Pittsburgh, the project also was supported by the National Institutes of Health.
SOURCE: Chung JR et al. Pediatrics. 2018. doi: 10.1542/peds.2018-2094.
FROM PEDIATRICS
Key clinical point: The live attenuated influenza vaccine (LAIV4) was significantly less effective than was the inactivated influenza vaccine (IIV) for children against the influenza A/H1N1pdm09 virus across multiple flu seasons.
Major finding:
Study details: A combined analysis of five studies in the United States between the periods of 2013-2014 and 2015-2016 from the U.S. Influenza Vaccine Effectiveness Network.
Disclosures: The Influenza Clinical Investigation for Children was funded by MedImmune, a member of the AstraZeneca Group. Two of the researchers are employees of AstraZeneca. The other authors reported having no conflicts of interest. The U.S. Influenza Vaccine Effectiveness Network was supported by the CDC through cooperative agreements with the University of Michigan, Kaiser Permanente Washington Health Research Institute, Marshfield Clinic Research Institute, University of Pittsburgh, and Baylor Scott & White Health. At the University of Pittsburgh, the project also was supported by the National Institutes of Health.
Source: Chung JR et al. Pediatrics. 2018. doi: 10.1542/peds.2018-2094.
Flu season intensifies: High activity now in 19 states
The effects of the flu became much more widespread in the last full week of 2018 as the number of states with a high level of influenza activity more than doubled from the week before, according to the Centers for Disease Control and Prevention.
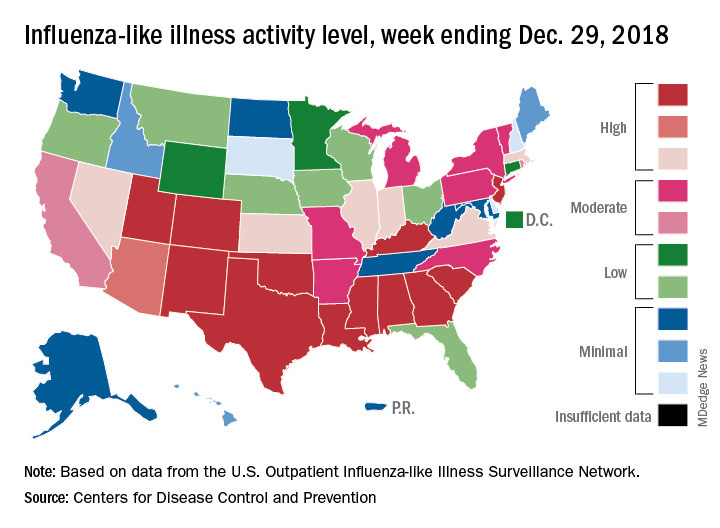
A total of 19 states were in the high range (8-10) on the CDC’s 1-10 scale of influenza-like illness (ILI) activity for the week ending Dec. 29, compared with 9 states the week before, the CDC’s influenza division reported Jan. 4. Of those 19 most-affected states, 12 were at level 10, 1 was at level 9, and 6 were at level 8. Geographic distribution of the virus was reported to be widespread in 24 states, the CDC said.
The proportion of outpatient visits for ILI – defined as fever (temperature of 100° F or greater) and cough and/or sore throat – rose to 4.1% for the week, which was up from 3.3% the previous week and well above the national baseline of 2.2%.
“The increase in the percentage of patient visits for ILI may be influenced in part by a reduction in routine health care visits during the winter holidays,” the report noted. There were 38 influenza deaths reported for the most recent week with available data (the week ending Dec. 22), although reporting for that week was just over 54% complete as of Jan. 4. For the previous weeks, 39 flu-related deaths occurred during the week ending Dec. 15 (reporting 84% complete) and 43 deaths during the week ending Dec. 8 (reporting 94% complete). For the respective weeks of last year’s flu season, total deaths were 359, 165, and 118, CDC data show.
For the week ending Dec. 29, two pediatric deaths were reported, one of which occurred the week before. For the 2018-2019 season so far, 13 flu-related pediatric deaths have been reported, the CDC said.
The effects of the flu became much more widespread in the last full week of 2018 as the number of states with a high level of influenza activity more than doubled from the week before, according to the Centers for Disease Control and Prevention.
A total of 19 states were in the high range (8-10) on the CDC’s 1-10 scale of influenza-like illness (ILI) activity for the week ending Dec. 29, compared with 9 states the week before, the CDC’s influenza division reported Jan. 4. Of those 19 most-affected states, 12 were at level 10, 1 was at level 9, and 6 were at level 8. Geographic distribution of the virus was reported to be widespread in 24 states, the CDC said.
The proportion of outpatient visits for ILI – defined as fever (temperature of 100° F or greater) and cough and/or sore throat – rose to 4.1% for the week, which was up from 3.3% the previous week and well above the national baseline of 2.2%.
“The increase in the percentage of patient visits for ILI may be influenced in part by a reduction in routine health care visits during the winter holidays,” the report noted. There were 38 influenza deaths reported for the most recent week with available data (the week ending Dec. 22), although reporting for that week was just over 54% complete as of Jan. 4. For the previous weeks, 39 flu-related deaths occurred during the week ending Dec. 15 (reporting 84% complete) and 43 deaths during the week ending Dec. 8 (reporting 94% complete). For the respective weeks of last year’s flu season, total deaths were 359, 165, and 118, CDC data show.
For the week ending Dec. 29, two pediatric deaths were reported, one of which occurred the week before. For the 2018-2019 season so far, 13 flu-related pediatric deaths have been reported, the CDC said.
CDC: Flu activity ‘high’ in nine states
according to the Centers for Disease Control and Prevention.
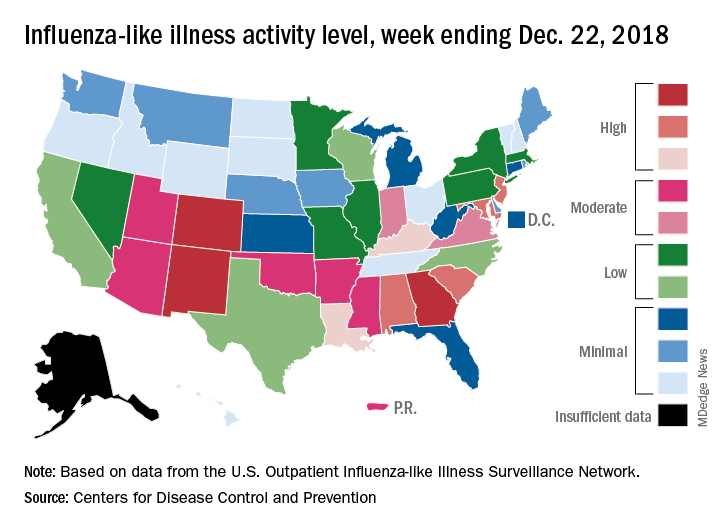
Patients with ILI made up an estimated 3.3% of outpatient visits for the week, which is up from 2.7% the previous week and well above the baseline rate of 2.2%, which the 2018-2019 flu season has now exceeded for the past 3 weeks, the CDC reported Dec. 28. ILI is defined “as fever (temperature of 100°F [37.8°C] or greater) and cough and/or sore throat.”
Three states – Colorado, Georgia, and New Mexico – are now at the highest level of flu activity on the CDC’s 1-10 scale, and nine states are in the “high” range (8-10), compared with two states in high range (both at level 10) for the week ending Dec. 15. Another seven states and Puerto Rico are now in the “moderate” range of 6-7, data from the CDC’s Outpatient ILI Surveillance Network show.
Four flu-related deaths in children were reported during the week ending Dec. 22, two of which occurred in previous weeks, which brings the total to 11 for the 2018-2019 season, the CDC reported.
according to the Centers for Disease Control and Prevention.
Patients with ILI made up an estimated 3.3% of outpatient visits for the week, which is up from 2.7% the previous week and well above the baseline rate of 2.2%, which the 2018-2019 flu season has now exceeded for the past 3 weeks, the CDC reported Dec. 28. ILI is defined “as fever (temperature of 100°F [37.8°C] or greater) and cough and/or sore throat.”
Three states – Colorado, Georgia, and New Mexico – are now at the highest level of flu activity on the CDC’s 1-10 scale, and nine states are in the “high” range (8-10), compared with two states in high range (both at level 10) for the week ending Dec. 15. Another seven states and Puerto Rico are now in the “moderate” range of 6-7, data from the CDC’s Outpatient ILI Surveillance Network show.
Four flu-related deaths in children were reported during the week ending Dec. 22, two of which occurred in previous weeks, which brings the total to 11 for the 2018-2019 season, the CDC reported.
2018-2019 flu season starts in earnest
National flu activity moved solidly into above-average territory during the week ending Dec. 15, as Colorado and Georgia took the lead with the highest activity levels in the country, according to the Centers for Disease Control and Prevention.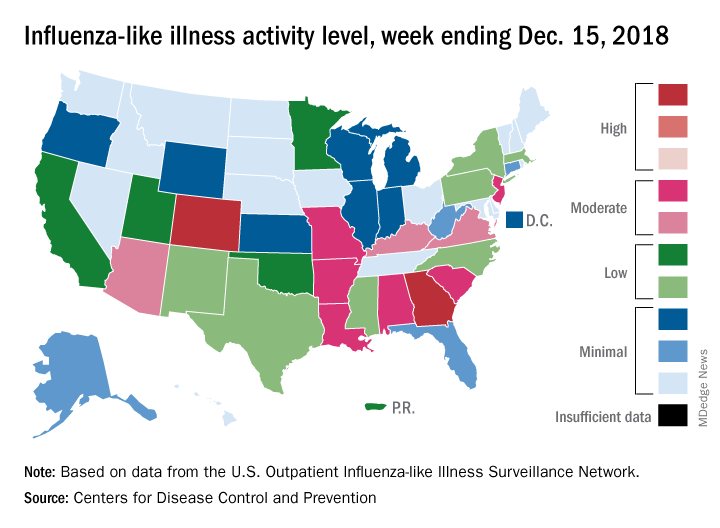
The proportion of outpatient visits for influenza-like illness (ILI) was 2.7% for the week, which was up from 2.3% the previous week and above the national baseline of 2.2%, the CDC reported. ILI is defined “as fever (temperature of 100°F [37.8°C] or greater) and cough and/or sore throat.”
Colorado and Georgia both reported ILI activity of 10 on the CDC’s 1-10 scale, making them the only states in the “high” range (8-10). Nine states and New York City had activity levels in the “moderate” range (6-7), Puerto Rico and 11 states were in the “low” range (4-5), and 28 states and the District of Columbia were in the “minimal” range (1-3), the CDC said.
During the comparable period of last year’s high-severity flu season, which ultimately resulted in 900,000 flu-related hospitalizations and 80,000 deaths (185 pediatric), nine states were already at level 10. For the 2018-2019 season so far, there have been seven ILI-related pediatric deaths, CDC data show.
Pregnant women commonly refuse the influenza vaccine
Pregnant women commonly refuse vaccines, and refusal of influenza vaccine is more common than refusal of Tdap vaccine, according to a nationally representative survey of obstetrician/gynecologists.

“It appears vaccine refusal among pregnant women may be more common than parental refusal of childhood vaccines,” Sean T. O’Leary, MD, MPH, director of the Colorado Children’s Outcomes Network at the University of Colorado in Aurora, and his coauthors wrote in Obstetrics & Gynecology.
The survey was sent to 477 ob.gyns. via both email and mail between March and June 2016. The response rate was 69%, and almost all respondents reported recommending both influenza (97%) and Tdap (95%) vaccines to pregnant women.
However, respondents also reported that refusal of both vaccines was common, with more refusals of influenza vaccine than Tdap vaccine. Of ob.gyns. who responded, 62% reported that 10% or greater of their pregnant patients refused the influenza vaccine, compared with 32% reporting this for Tdap vaccine (P greater than .001; x2, less than 10% vs. 10% or greater). Of those refusing the vaccine, 48% believed influenza vaccine would make them sick; 38% felt they were unlikely to get a vaccine-preventable disease; and 32% had general worries about vaccines overall. In addition, the only strategy perceived as “very effective” in convincing a vaccine refuser to choose otherwise was “explaining that not getting the vaccine puts the fetus or newborn at risk.”
The authors shared potential limitations of their study, including the fact that they examined reported practices and perceptions, not observed practices, along with the potential that the attitudes and practices of respondents may differ from those of nonrespondents. However, they noted that this is unlikely given prior work and that next steps should consider responses to refusal while also sympathizing with the patients’ concerns. “Future work should focus on testing evidence-based strategies for addressing vaccine refusal in the obstetric setting and understanding how the unique concerns of pregnant women influence the effectiveness of such strategies,” they wrote.
The study was funded by the Centers for Disease Control and Prevention. No conflicts of interest were reported.
SOURCE: O’Leary ST et al. Obstet Gynecol. 2018 Dec. doi: 10.1097/AOG.0000000000003005.
Pregnant women make up 1% of the population but accounted for 5% of all influenza deaths during the 2009 H1N1 pandemic, which makes the common vaccine refusals reported by the nation’s ob.gyns. all the more serious, according to Sonja A. Rasmussen, MD, MS, of the University of Florida in Gainesville and Denise J. Jamieson, MD, MPH, of Emory University in Atlanta.
After the 2009 pandemic, vaccination coverage for pregnant woman during flu season leapt from less than 30% to 54%, according to data from a 2016-2017 Internet panel survey. This was in large part because of the committed work of the Centers for Disease Control and Prevention and the American College of Obstetricians and Gynecologists, who emphasized the importance of the influenza vaccine. But coverage rates have stagnated since then, and these two coauthors wrote that “the 2017-2018 severe influenza season was a stern reminder that influenza should not be underestimated.”
These last 2 years saw the highest-documented rate of hospitalizations for influenza since 2005-2006, but given that there’s been very little specific information available on hospitalizations of pregnant women, Dr. Rasmussen and Dr. Jamieson fear the onset of “complacency among health care providers, pregnant women, and the general public” when it comes to the effects of influenza.
They insisted that, as 2009 drifts even further into memory, “obstetric providers should not become complacent regarding influenza.” Strategies to improve coverage are necessary to break that 50% barrier, and “pregnant women and their infants deserve our best efforts to protect them from influenza.”
These comments are adapted from an accompanying editorial (Obstet Gynecol. 2018 Dec. doi: 10.1097/AOG.0000000000003040). No conflicts of interest were reported.
Pregnant women commonly refuse vaccines, and refusal of influenza vaccine is more common than refusal of Tdap vaccine, according to a nationally representative survey of obstetrician/gynecologists.
“It appears vaccine refusal among pregnant women may be more common than parental refusal of childhood vaccines,” Sean T. O’Leary, MD, MPH, director of the Colorado Children’s Outcomes Network at the University of Colorado in Aurora, and his coauthors wrote in Obstetrics & Gynecology.
The survey was sent to 477 ob.gyns. via both email and mail between March and June 2016. The response rate was 69%, and almost all respondents reported recommending both influenza (97%) and Tdap (95%) vaccines to pregnant women.
However, respondents also reported that refusal of both vaccines was common, with more refusals of influenza vaccine than Tdap vaccine. Of ob.gyns. who responded, 62% reported that 10% or greater of their pregnant patients refused the influenza vaccine, compared with 32% reporting this for Tdap vaccine (P greater than .001; x2, less than 10% vs. 10% or greater). Of those refusing the vaccine, 48% believed influenza vaccine would make them sick; 38% felt they were unlikely to get a vaccine-preventable disease; and 32% had general worries about vaccines overall. In addition, the only strategy perceived as “very effective” in convincing a vaccine refuser to choose otherwise was “explaining that not getting the vaccine puts the fetus or newborn at risk.”
The authors shared potential limitations of their study, including the fact that they examined reported practices and perceptions, not observed practices, along with the potential that the attitudes and practices of respondents may differ from those of nonrespondents. However, they noted that this is unlikely given prior work and that next steps should consider responses to refusal while also sympathizing with the patients’ concerns. “Future work should focus on testing evidence-based strategies for addressing vaccine refusal in the obstetric setting and understanding how the unique concerns of pregnant women influence the effectiveness of such strategies,” they wrote.
The study was funded by the Centers for Disease Control and Prevention. No conflicts of interest were reported.
SOURCE: O’Leary ST et al. Obstet Gynecol. 2018 Dec. doi: 10.1097/AOG.0000000000003005.
FROM OBSTETRICS & GYNECOLOGY
Key clinical point: Although almost all ob.gyns. recommend the influenza and Tdap vaccines for pregnant women, both commonly are refused.
Major finding: A total of 62% of ob.gyns. reported that 10% or greater of their pregnant patients refused the influenza vaccine; 32% reported this for Tdap vaccine.
Study details: An email and mail survey sent to a national network of ob.gyns. between March and June 2016.
Disclosures: The study was funded by the Centers for Disease Control and Prevention. No conflicts of interest were reported.
Source: O’Leary ST et al. Obstet Gynecol. 2018 Dec. doi: 10.1097/AOG.0000000000003005.