User login
Optimal gestational age for cell-free DNA sampling in obese women
cfDNA screening failures occur in 1% to 12% of samples, a rate that has an inverse relationship to gestational age. Recent studies have shown an increased risk for screening failures among obese women. To determine the optimal gestational age for cfDNA testing among obese women, Mary C. Livergood, MD, and colleagues at the Mercy Hospital in St. Louis, Missouri, performed a retrospective cohort study of those undergoing cfDNA testing at one center from 2011 through 2016. Study results recently were published online in the American Journal of Obstetrics and Gynecology.1
Details of the study
Adjusted odds ratios (aORs) with 95% confidence interval (CI) for a cfDNA screening failure (referred to as a “no call” in the study) were determined for each body mass index (BMI) weight class (TABLE). Each BMI weight class also was compared with the aOR of normal-weight women (BMI <25.0 kg/m2). The predicted probability of a no call was determined for each week of gestational age for normal weight and obese women and the results were compared.1
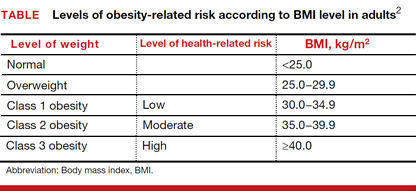
Among the 2,385 patients meeting inclusion criteria, 4.4% (n = 105) received a no call. Compared with normal weight women, the aOR of no call increased as weight increased from overweight (aOR, 2.31 [95% CI, 1.21–4.42]) to obesity class III (aOR, 8.55 [95% CI, 4.16–17.56]).1
At 21 weeks’ gestation, a cut-point was identified for obesity class II/III women (ie, there was no longer a significant difference in the probability of no call when compared with normal-weight women). From 8 to 16 weeks’ gestation, there was a 4.5% reduction in the probability of a no call for obesity class II/III women (aOR, 14.9; 95% CI, 8.95–20.78 and aOR, 10.4; 95% CI, 7.20–13.61; Ptrend<.01).1
Although the authors conclude that a cut-point of 21 weeks’ gestation allowed for optimal sampling of cfDNA in obese women, they also acknowledge that this cut-point limits a woman’s reproductive choices. However, they say that delaying cfDNA testing in obese women is a reasonable strategy to reduce the probability of screening failure.1
- Livergood MC, Lechien KA, Trudell AS. Obesity and cell-free DNA “no calls”: is there an optimal gestational age at time of sampling? [published online ahead of print January 28, 2017]. Am J Obstet Gynecol. doi:10.1016/j.ajog.2017.01.011.
- Health risks of obesity. MedlinePlus website. https://medlineplus.gov/ency/patientinstructions/000348.htm. Updated February 7, 2017. Accessed March 10, 2017.
cfDNA screening failures occur in 1% to 12% of samples, a rate that has an inverse relationship to gestational age. Recent studies have shown an increased risk for screening failures among obese women. To determine the optimal gestational age for cfDNA testing among obese women, Mary C. Livergood, MD, and colleagues at the Mercy Hospital in St. Louis, Missouri, performed a retrospective cohort study of those undergoing cfDNA testing at one center from 2011 through 2016. Study results recently were published online in the American Journal of Obstetrics and Gynecology.1
Details of the study
Adjusted odds ratios (aORs) with 95% confidence interval (CI) for a cfDNA screening failure (referred to as a “no call” in the study) were determined for each body mass index (BMI) weight class (TABLE). Each BMI weight class also was compared with the aOR of normal-weight women (BMI <25.0 kg/m2). The predicted probability of a no call was determined for each week of gestational age for normal weight and obese women and the results were compared.1
Among the 2,385 patients meeting inclusion criteria, 4.4% (n = 105) received a no call. Compared with normal weight women, the aOR of no call increased as weight increased from overweight (aOR, 2.31 [95% CI, 1.21–4.42]) to obesity class III (aOR, 8.55 [95% CI, 4.16–17.56]).1
At 21 weeks’ gestation, a cut-point was identified for obesity class II/III women (ie, there was no longer a significant difference in the probability of no call when compared with normal-weight women). From 8 to 16 weeks’ gestation, there was a 4.5% reduction in the probability of a no call for obesity class II/III women (aOR, 14.9; 95% CI, 8.95–20.78 and aOR, 10.4; 95% CI, 7.20–13.61; Ptrend<.01).1
Although the authors conclude that a cut-point of 21 weeks’ gestation allowed for optimal sampling of cfDNA in obese women, they also acknowledge that this cut-point limits a woman’s reproductive choices. However, they say that delaying cfDNA testing in obese women is a reasonable strategy to reduce the probability of screening failure.1
- Livergood MC, Lechien KA, Trudell AS. Obesity and cell-free DNA “no calls”: is there an optimal gestational age at time of sampling? [published online ahead of print January 28, 2017]. Am J Obstet Gynecol. doi:10.1016/j.ajog.2017.01.011.
- Health risks of obesity. MedlinePlus website. https://medlineplus.gov/ency/patientinstructions/000348.htm. Updated February 7, 2017. Accessed March 10, 2017.

ObGyn salaries jumped in the last year
The mean income for ObGyns rose by 10% in 2015 over 2014 ($277,000 compared with $249,000), according to a recent report from Medscape.1 This jump follows a gradual increase over the last few years ($243,000 in 2013; $242,000 in 2012; $220,000 in 2011).1−3 The report included responses from 19,183 physicians across 26 specialties, 5% (nearly 1,000) of whom were ObGyns.1
The highest earners among all physician specialties were orthopedists ($443,000), cardiologists, and dermatologists. The lowest earners were pediatricians ($204,000), endocrinologists, and family physicians. The highest ObGyn earners lived in the Southwest ($307,000), the North Central region, and the West.1
Merritt Hawkins & Associates, a national physician search and consulting firm, recently evaluated the annual starting salaries and year-over-year increases of 3,342 of its physician and advanced practitioner recruiting assignments. They found that ObGyns had the second greatest increase in starting salaries among specialties, at 16%. They also found obstetrics and gynecology to be among the top 5 specialties most in demand.4
The gender picture
As in past years, male ObGyns reported higher earnings than their female counterparts: full-time male ObGyns earned $304,000 while full-time female ObGyns earned $256,000.1
According to a report published in the British Medical Journal in June 2016, there are drastic differences between the incomes of white and black male and female physicians in the United States.5 White male physicians had an adjusted median annual income of $253,042 (95% confidence interval [CI], $248,670−$257,413), compared with $188,230 ($170,844−$205,616) for black male physicians, $163,234 (95% CI, $159,912−$166,557) for white female physicians, and $152,784 (95% CI, $137,927−$167,641) for black female physicians.
How does employment status factor in? Of the self-employed, men earn $310,000 while women earn $285,000. Men who are employed report earning $293,000, with women reporting $244,000.5 (This includes full-time workers but does not control for the number of hours worked.) When Medscape evaluated full- versus part-time work (<40 hours per week), results indicated that, among primary care and most other specialties, more female physicians (25%) are part-timers than males (12%).6 However, among ObGyns, 13% of women report part-time employment versus 16% of men.1
Time with patients. Medscape reports that, among all physicians, 41% of men spent 17 minutes or more with their patients, compared with 49% of women. For office-based ObGyns, 31% of men and 39% of women spent 17 minutes or more with patients.1
Can disparity in leadership positions explain gender-related salary discrepancy?
In 2015, 48% of all medical students were female.7 In residency, the ratio of men to women is similar: For 2013−2014, the Association of American Medical Colleges (AAMC) reported that 46% of all residents were female.8 For ObGyn residency, however, the AMA’s FREIDA Online specialty training search (detailing 2014 general program information) indicates that, of the 5,018 active residents and fellows in ObGyn, 81.4% are female.9
Although the ObGyn field is becoming female-dominated, leadership within the specialty remains male dominated, points out Laura E. Baecher-Lind, MD, MPH, Director of the Division of General Obstetrics & Gynecology at Tufts Medical Center, Boston, Massachusetts. Dr. Baecher-Lind authored a study in 2012 in which she explored whether the proportions of ObGyn leadership positions held by women reflect the proportion of women who entered the field at the same time as current leaders.10 She found that very few academic department chair positions in ObGyn are held by women, although that number is gradually increasing.10 In addition, her study results indicated that women should hold 71 of the total of 194 ObGyn leadership positions. In actuality, 41 of the leadership positions were held by women (21.1%, P<.001) when based on the proportion of women entering residency programs. When considering only leaders who graduated during the years in which residency matching data were available, she found that women should hold 28 of 74 leadership positions, but they actually held 20 (27.0%, P = .05).10
Could the salary discrepancy disappear if more women held leadership positions? OBG <scaps>Management</scaps> posed this question to Dr. Baecher-Lind. “I suspect that the gender pay gap would persist,” she said. “Studies indicate that women hold implicit gender bias as strongly as men. This bias leads to devaluing women’s skills and accomplishments compared with men’s and is a strong contributor to the leadership and pay gaps in this country and in our specialty. We need to be mindful of this implicit bias and work against it with policies such as salary transparency and salary audits to encourage parity.”11
Do patients have a gender preference for their ObGyn?
Although multiple surveys have been published regarding patient gender preference when choosing an ObGyn, overall results have not been analyzed. To address this literature gap, Kyle J. Tobler, MD, and colleagues at the Womack Army Medical Center in Fort Bragg, North Carolina, and Uniformed Services University of the Health Sciences in Bethesda, Maryland, searched multiple sources to provide a conglomerate analysis of patients' gender preference when choosing an ObGyn. An abstract describing their study was published in Obstetrics & Gynecology in May 2016 and presented at the American College of Obstetricians and Gynecologists 2016 Annual Clinical and Scientific Meeting, May 14−17, in Washington, DC.1
A personal impetus for studying gender preference
The impetus for this project truly was initiated for Dr. Tobler when he was a 4th-year medical student. "I was trying to decide if Obstetrics and Gynecology was the right field for me," he said. "I was discouraged by many people around me, who told me that men in ObGyn would not have a place, as female patients only wanted female ObGyns. And with the residency match at 60% to 70% women for ObGyn, it did seem that men would not have a place. Thus, I began searching the literature to verify if the question for gender preference for their ObGyn provider had been evaluated previously, and I found mixed results." After medical school Dr. Tobler pursued this current meta-analysis to address the conflict-ing results.
Details of the study
Dr. Tobler and his colleagues explored PubMed, Embase, PsycINFO (American Psychological Association's medical literature database), Cumulative Index to Nursing and Allied Health Literature (EBSCO Health's database), Scopus (Elsevier's abstract and citation database of peer-reviewed literature), and references of relevant articles. Included were 4,822 electronically identified citations of English-language studies, including surveys administered to patients that specifically asked for gender preference of their ObGyn provider.
The researchers found that 23 studies met their inclusion criteria, comprising 14,736 patients. Overall, 8.3% (95% confidence interval [CI], 0.08-0.09) of ObGyn patients reported a preference for a male provider, 50.2% (95% CI, 0.49-0.51) preferred a female provider, and 41.3% (95% CI, 0.40-0.42) reported no gender preference when choosing an ObGyn.1
What about US patients?
A subanalysis of studies (n = 9,861) conducted in the United States from 1999 to 2008 (with the last search undertaken in April 2015) showed that 8.4% (95% CI, 0.08-0.09) preferred a male ObGyn, 53.2% (95% CI, 0.52-0.54) preferred a female ObGyn, and 38.5% (95% CI, 0.38-0.39) had no gender preference.1
"We were surprised by the numbers," comments Dr. Tobler. "The general trend demonstrated a mix between no preference or a preference for female providers, but not by a large margin."
"We considered analyzing for age," he said, "but most of the studies gave a mean or median age value and were widely distributed. We were able, however, to break our analysis down into regions where one would expect a very strong preference for female providers--the Middle East and Africa. But, in fact, results were not much different than for Western countries. Our results for this subanalysis of Middle Eastern countries and Nigeria (n = 1,951) demonstrated that 8.7% of women (95% CI, 4.1-13.3) preferred a male provider, 51.2% (95% CI, 17.2-85.1) preferred a female provider, and 46.9% (95% CI, 9.3-84.5) had no gender preference."1
References
- Tobler KJ, Wu J, Khafagy AM, et al. Gender preference of the obstetrician gynecologist provider: a systematic review and meta-analysis. Obstet Gynecol. 2016;127(5)(suppl):43S. http://journals.lww.com/greenjournal/page/results.aspx?txtkeywords=Gender+preference+of+the+obstetrician+gynecologist+provider. Accessed May 18, 2016.
What are ObGyns’ greatest practice concerns?
The Medicus Firm reported in its 2016 Physician Practice Preference and Relocation Survey that the top 3 major practice concerns for practicing physicians were compensation, work-life balance, and work-related burnout and stress.12 They found that physicians in general were slightly more satisfied with their 2015 income than their 2014 income, but less optimistic about the future. Only 29% projected that their 2016 income would increase over their 2015 earnings.
With ObGyn salaries on the up in 2015, less than half (46%) of ObGyns reported to Medscape that they feel fairly compensated; these physicians made $62,000 more than those who believed their pay was unfair.1 Fifty-four percent of employed male ObGyns and 64% of employed female ObGyns reported feeling fairly compensated, compared with 43% and 32%, respectively, who were self-employed.
ObGyns indicated in the 2016 Medscape report that the prime causes of stress were bureaucratic tasks and spending too many hours at work. More than half (52%) of ObGyns spend 30 to 45 hours per week seeing patients, and 40% spend more time than that.1 According to employment status, 56% of those who are self-employed and 58% of those who are employed spend 10 hours or more per week on administrative tasks.1
Lucia DiVenere, MA, Officer, Government and Political Affairs, at the American Congress of Obstetricians and Gynecologists (ACOG) in Washington, DC, offers a brief look, with an in-depth focus to come in an upcoming issue, at the growing concern of burnout among physicians and how it can affect both ObGyns and their patients. She outlines ACOG’s efforts to help ObGyns maintain work-life balance in “ObGyn burnout: ACOG takes aim.”
ObGyn burnout: ACOG takes aim

Lucia DiVenere, MA
The good news: More women have access to coverage for health care than ever before--better insurance coverage for pregnancy, contraceptives, and well-woman care.
The bad news: America faces a shortage of ObGyns to provide that care, a shortage not likely to go away soon.
One of the imperatives of this dynamic is that we need to help every practicing ObGyn perform at his or her very best: your highest level of quality care, your best productivity, and your best ability to survive and thrive in an always changing and often challenging work environment.
This imperative is undermined when ObGyns are so stressed, overworked, overworried, and undersupported that you experience the very real effects of physician burnout.
Studies show that:
- ObGyns experience high rates of burnout
- rates of burnout are increasing over time
- women, the majority gender in obstetrics and gynecology, experience higher rates of burnout than their male counterparts.
Between 2011 and 2014, rates of physician burnout increased from 45.5% to 54.4%.1 Fifty-one percent of ObGyns reported experiencing burnout in 2015, with women reporting 55% compared to 46% for men.2
This insert is a quick look at this important issue, which can seriously erode an ObGyn's ability to provide high-quality care and continue enjoying practice. It can take a real toll on your personal health and well-being, too. In an upcoming issue of OBG Management, I will take a deeper dive, previewing the American College of Obstetricians and Gynecologists (ACOG) and American Medical Association resources to help you avoid burnout, plus highlighting ObGyns who provide insight and inspiration. I also will interview ACOG President Tom Gellhaus, MD, who is dedicating his presidency to providing you with opportunities to experience new and meaningful aspects of the ObGyn specialty. I will discuss ACOG's programs to help you combat burnout, as well as how you can:
- help underserved women around the globe through medical missions
- bring your leadership and passion for women's health to your state and national capitals
- explore your artistic side.
ObGyn burnout amounts to a public health challenge in women's health care. ACOG takes your well-being seriously, so that you can continue to ensure the well-being of women.
Lucia DiVenere, MA, is Officer, Government and Political Affairs, at the American Congress of Obstetricians and Gynecologists in Washington, DC.
Ms. DiVenere reports no financial relationships relevant to this article. .
References
- Shanafelt TD, Hasan O, Dyrbye LN, et al. Changes in burnout and satisfaction with work-life balance in physicians and the general US working population between 2011 and 2014. Mayo Clinic Proceedings. 2015;90(12):1600-1613.
- Peckham C. Medscape Lifestyle Report 2016: Bias and Burnout. Medscape website. http://www.medscape.com/features/slideshow/lifestyle/2016/public/overview. Published January 13, 2016. Accessed June 14, 2016.
Effects of the ACA on ObGyns
As of February 2016, 12.7 million Americans selected plans through the Health Insurance Marketplace of the Affordable Care Act (ACA).1 Physicians often have no choice in whether or not they participate in Health Insurance Exchanges; however, in 2016, 24% of ObGyns said they plan to participate in exchanges, 25% do not, and the rest are unsure.1
It is still unclear how the ACA affects physician income.1 When ObGyns who participated in Health Insurance Exchanges in 2015 were asked whether their income was affected, approximately 60% reported no change, 30% reported a decrease, and 9% said it increased.1
Medicus reported that physicians’ approval of the ACA has declined since last year. In their 2016 report, 71% of respondents gave the ACA a passing grade (A, B, C, or D), compared with 83% in 2015 and 77% in 2014. Fewer than 3% of 2016 respondents gave the ACA an “A.”12
Medscape reported that 36% of ObGyns have seen an increase in the number of patients due to the ACA.1 A 2015 report from the Kaiser Family Foundation and The Commonwealth Fund assessing the experiences and attitudes of primary care providers after the first year of ACA coverage found no association with lower- and higher-quality care whether or not patient load had increased.13 Among those in the Medscape report who said that quality of care had worsened, 21% had a greater patient load; 18% reported no increase in patient load. Seventy-eight percent of physicians whose patient load increased said that quality had stayed the same or improved; 82% of those who experienced no increase in patient load reported that quality had stayed the same or improved.1
Share your thoughts! Send your Letter to the Editor to rbarbieri@frontlinemedcom.com. Please include your name and the city and state in which you practice.
- Peckham C. Medscape Ob/Gyn Compensation Report 2016. Medscape website. http://www.medscape.com/features/slideshow/compensation/2016/womenshealth. Published April 1, 2016. Accessed June 8, 2016.
- Reale D, Yates J. ObGyn salaries continue gradual improvement. OBG Manag. 2015;27(7):34−37.
- Peckham C. Medscape Ob/Gyn Compensation Report 2014. Medscape website. http://www.medscape.com/features/slideshow/compensation/2014/womenshealth. Published April 14, 2014. Accessed June 8, 2016.
- Merritt Hawkins. Survey: Starting salaries for physicians spiking. http://www.merritthawkins.com/uploadedFiles/MerrittHawkins/Pdf/Merritt_Hawkins_Starting_Salaries_For_Physicians_Spiking.pdf. Published June 7, 2016. Accessed June 17, 2016.
- Ly DP, Seabury SA, Jena AB, Newhouse RL. Differences in incomes of physicians in the United States by race and sex: observational study [published online ahead of print June 7, 2016]. BMJ. 2016;353:i2923. http://dx.doi.org/10.1136/bmj.i2923. Accessed June 8, 2016.
- Peckham C. Medscape Physician Compensation Report 2016. Medscape website. http://www.medscape.com/features/slideshow/compensation/2016/public/overview#page=1. Published April 1, 2016. Accessed June 15, 2016.
- Kaiser Family Foundation. Distribution of medical school graduates by gender. http://kff.org/other/state-indicator/medical-school-graduates-by-gender/. Published 2016. Accessed June 22, 2016.
- Lautenberger DM, Dandar VM, Raezer CL, Sloane RA. The state of women in academic medicine, 2013-2014. Association of American Medical Colleges. 2014. https://members.aamc.org/eweb/upload/The%20State%20of%20Women%20in%20Academic%20Medicine%202013-2014%20FINAL.pdf. Accessed June 17, 2016.
- American Medical Association. FREIDA Online specialty training search: Obstetrics and Gynecology, 2014. https://freida.ama-assn.org/Freida/user/specStatisticsSearch.do?method=viewDetail&pageNumber=2&spcCd=220. Accessed June 17, 2016.
- Baecher-Lind L. Women in leadership positions within obstetrics and gynecology. Obstet Gynecol. 2012;120(6):1415−1418.
- Email correspondence with Laura E. Baecher-Lind, June 19, 2016.
- Medicus Firm. The Medicus Firm releases annual Physician Practice Preference Survey for 2016. http://www .themedicusfirm.com/the-medicus-firm-releases-annual-physician-practice-preference-survey-for-2016. Published May 4, 2016. Accessed June 10, 2016.
- Hamel L, Doty MM, Norton M, et al; Kaiser Family Foundation and The Commonwealth Fund. Experiences and attitudes of primary care providers under the first year of ACA coverage expansion. http://www.commonwealthfund.org/publications/issue-briefs/2015/jun/primary-care-providers-first-year-aca. Published June 18, 2015. Accessed June 15, 2016.
The mean income for ObGyns rose by 10% in 2015 over 2014 ($277,000 compared with $249,000), according to a recent report from Medscape.1 This jump follows a gradual increase over the last few years ($243,000 in 2013; $242,000 in 2012; $220,000 in 2011).1−3 The report included responses from 19,183 physicians across 26 specialties, 5% (nearly 1,000) of whom were ObGyns.1
The highest earners among all physician specialties were orthopedists ($443,000), cardiologists, and dermatologists. The lowest earners were pediatricians ($204,000), endocrinologists, and family physicians. The highest ObGyn earners lived in the Southwest ($307,000), the North Central region, and the West.1
Merritt Hawkins & Associates, a national physician search and consulting firm, recently evaluated the annual starting salaries and year-over-year increases of 3,342 of its physician and advanced practitioner recruiting assignments. They found that ObGyns had the second greatest increase in starting salaries among specialties, at 16%. They also found obstetrics and gynecology to be among the top 5 specialties most in demand.4
The gender picture
As in past years, male ObGyns reported higher earnings than their female counterparts: full-time male ObGyns earned $304,000 while full-time female ObGyns earned $256,000.1
According to a report published in the British Medical Journal in June 2016, there are drastic differences between the incomes of white and black male and female physicians in the United States.5 White male physicians had an adjusted median annual income of $253,042 (95% confidence interval [CI], $248,670−$257,413), compared with $188,230 ($170,844−$205,616) for black male physicians, $163,234 (95% CI, $159,912−$166,557) for white female physicians, and $152,784 (95% CI, $137,927−$167,641) for black female physicians.
How does employment status factor in? Of the self-employed, men earn $310,000 while women earn $285,000. Men who are employed report earning $293,000, with women reporting $244,000.5 (This includes full-time workers but does not control for the number of hours worked.) When Medscape evaluated full- versus part-time work (<40 hours per week), results indicated that, among primary care and most other specialties, more female physicians (25%) are part-timers than males (12%).6 However, among ObGyns, 13% of women report part-time employment versus 16% of men.1
Time with patients. Medscape reports that, among all physicians, 41% of men spent 17 minutes or more with their patients, compared with 49% of women. For office-based ObGyns, 31% of men and 39% of women spent 17 minutes or more with patients.1
Can disparity in leadership positions explain gender-related salary discrepancy?
In 2015, 48% of all medical students were female.7 In residency, the ratio of men to women is similar: For 2013−2014, the Association of American Medical Colleges (AAMC) reported that 46% of all residents were female.8 For ObGyn residency, however, the AMA’s FREIDA Online specialty training search (detailing 2014 general program information) indicates that, of the 5,018 active residents and fellows in ObGyn, 81.4% are female.9
Although the ObGyn field is becoming female-dominated, leadership within the specialty remains male dominated, points out Laura E. Baecher-Lind, MD, MPH, Director of the Division of General Obstetrics & Gynecology at Tufts Medical Center, Boston, Massachusetts. Dr. Baecher-Lind authored a study in 2012 in which she explored whether the proportions of ObGyn leadership positions held by women reflect the proportion of women who entered the field at the same time as current leaders.10 She found that very few academic department chair positions in ObGyn are held by women, although that number is gradually increasing.10 In addition, her study results indicated that women should hold 71 of the total of 194 ObGyn leadership positions. In actuality, 41 of the leadership positions were held by women (21.1%, P<.001) when based on the proportion of women entering residency programs. When considering only leaders who graduated during the years in which residency matching data were available, she found that women should hold 28 of 74 leadership positions, but they actually held 20 (27.0%, P = .05).10
Could the salary discrepancy disappear if more women held leadership positions? OBG <scaps>Management</scaps> posed this question to Dr. Baecher-Lind. “I suspect that the gender pay gap would persist,” she said. “Studies indicate that women hold implicit gender bias as strongly as men. This bias leads to devaluing women’s skills and accomplishments compared with men’s and is a strong contributor to the leadership and pay gaps in this country and in our specialty. We need to be mindful of this implicit bias and work against it with policies such as salary transparency and salary audits to encourage parity.”11
Do patients have a gender preference for their ObGyn?
Although multiple surveys have been published regarding patient gender preference when choosing an ObGyn, overall results have not been analyzed. To address this literature gap, Kyle J. Tobler, MD, and colleagues at the Womack Army Medical Center in Fort Bragg, North Carolina, and Uniformed Services University of the Health Sciences in Bethesda, Maryland, searched multiple sources to provide a conglomerate analysis of patients' gender preference when choosing an ObGyn. An abstract describing their study was published in Obstetrics & Gynecology in May 2016 and presented at the American College of Obstetricians and Gynecologists 2016 Annual Clinical and Scientific Meeting, May 14−17, in Washington, DC.1
A personal impetus for studying gender preference
The impetus for this project truly was initiated for Dr. Tobler when he was a 4th-year medical student. "I was trying to decide if Obstetrics and Gynecology was the right field for me," he said. "I was discouraged by many people around me, who told me that men in ObGyn would not have a place, as female patients only wanted female ObGyns. And with the residency match at 60% to 70% women for ObGyn, it did seem that men would not have a place. Thus, I began searching the literature to verify if the question for gender preference for their ObGyn provider had been evaluated previously, and I found mixed results." After medical school Dr. Tobler pursued this current meta-analysis to address the conflict-ing results.
Details of the study
Dr. Tobler and his colleagues explored PubMed, Embase, PsycINFO (American Psychological Association's medical literature database), Cumulative Index to Nursing and Allied Health Literature (EBSCO Health's database), Scopus (Elsevier's abstract and citation database of peer-reviewed literature), and references of relevant articles. Included were 4,822 electronically identified citations of English-language studies, including surveys administered to patients that specifically asked for gender preference of their ObGyn provider.
The researchers found that 23 studies met their inclusion criteria, comprising 14,736 patients. Overall, 8.3% (95% confidence interval [CI], 0.08-0.09) of ObGyn patients reported a preference for a male provider, 50.2% (95% CI, 0.49-0.51) preferred a female provider, and 41.3% (95% CI, 0.40-0.42) reported no gender preference when choosing an ObGyn.1
What about US patients?
A subanalysis of studies (n = 9,861) conducted in the United States from 1999 to 2008 (with the last search undertaken in April 2015) showed that 8.4% (95% CI, 0.08-0.09) preferred a male ObGyn, 53.2% (95% CI, 0.52-0.54) preferred a female ObGyn, and 38.5% (95% CI, 0.38-0.39) had no gender preference.1
"We were surprised by the numbers," comments Dr. Tobler. "The general trend demonstrated a mix between no preference or a preference for female providers, but not by a large margin."
"We considered analyzing for age," he said, "but most of the studies gave a mean or median age value and were widely distributed. We were able, however, to break our analysis down into regions where one would expect a very strong preference for female providers--the Middle East and Africa. But, in fact, results were not much different than for Western countries. Our results for this subanalysis of Middle Eastern countries and Nigeria (n = 1,951) demonstrated that 8.7% of women (95% CI, 4.1-13.3) preferred a male provider, 51.2% (95% CI, 17.2-85.1) preferred a female provider, and 46.9% (95% CI, 9.3-84.5) had no gender preference."1
References
- Tobler KJ, Wu J, Khafagy AM, et al. Gender preference of the obstetrician gynecologist provider: a systematic review and meta-analysis. Obstet Gynecol. 2016;127(5)(suppl):43S. http://journals.lww.com/greenjournal/page/results.aspx?txtkeywords=Gender+preference+of+the+obstetrician+gynecologist+provider. Accessed May 18, 2016.
What are ObGyns’ greatest practice concerns?
The Medicus Firm reported in its 2016 Physician Practice Preference and Relocation Survey that the top 3 major practice concerns for practicing physicians were compensation, work-life balance, and work-related burnout and stress.12 They found that physicians in general were slightly more satisfied with their 2015 income than their 2014 income, but less optimistic about the future. Only 29% projected that their 2016 income would increase over their 2015 earnings.
With ObGyn salaries on the up in 2015, less than half (46%) of ObGyns reported to Medscape that they feel fairly compensated; these physicians made $62,000 more than those who believed their pay was unfair.1 Fifty-four percent of employed male ObGyns and 64% of employed female ObGyns reported feeling fairly compensated, compared with 43% and 32%, respectively, who were self-employed.
ObGyns indicated in the 2016 Medscape report that the prime causes of stress were bureaucratic tasks and spending too many hours at work. More than half (52%) of ObGyns spend 30 to 45 hours per week seeing patients, and 40% spend more time than that.1 According to employment status, 56% of those who are self-employed and 58% of those who are employed spend 10 hours or more per week on administrative tasks.1
Lucia DiVenere, MA, Officer, Government and Political Affairs, at the American Congress of Obstetricians and Gynecologists (ACOG) in Washington, DC, offers a brief look, with an in-depth focus to come in an upcoming issue, at the growing concern of burnout among physicians and how it can affect both ObGyns and their patients. She outlines ACOG’s efforts to help ObGyns maintain work-life balance in “ObGyn burnout: ACOG takes aim.”
ObGyn burnout: ACOG takes aim
Lucia DiVenere, MA
The good news: More women have access to coverage for health care than ever before--better insurance coverage for pregnancy, contraceptives, and well-woman care.
The bad news: America faces a shortage of ObGyns to provide that care, a shortage not likely to go away soon.
One of the imperatives of this dynamic is that we need to help every practicing ObGyn perform at his or her very best: your highest level of quality care, your best productivity, and your best ability to survive and thrive in an always changing and often challenging work environment.
This imperative is undermined when ObGyns are so stressed, overworked, overworried, and undersupported that you experience the very real effects of physician burnout.
Studies show that:
- ObGyns experience high rates of burnout
- rates of burnout are increasing over time
- women, the majority gender in obstetrics and gynecology, experience higher rates of burnout than their male counterparts.
Between 2011 and 2014, rates of physician burnout increased from 45.5% to 54.4%.1 Fifty-one percent of ObGyns reported experiencing burnout in 2015, with women reporting 55% compared to 46% for men.2
This insert is a quick look at this important issue, which can seriously erode an ObGyn's ability to provide high-quality care and continue enjoying practice. It can take a real toll on your personal health and well-being, too. In an upcoming issue of OBG Management, I will take a deeper dive, previewing the American College of Obstetricians and Gynecologists (ACOG) and American Medical Association resources to help you avoid burnout, plus highlighting ObGyns who provide insight and inspiration. I also will interview ACOG President Tom Gellhaus, MD, who is dedicating his presidency to providing you with opportunities to experience new and meaningful aspects of the ObGyn specialty. I will discuss ACOG's programs to help you combat burnout, as well as how you can:
- help underserved women around the globe through medical missions
- bring your leadership and passion for women's health to your state and national capitals
- explore your artistic side.
ObGyn burnout amounts to a public health challenge in women's health care. ACOG takes your well-being seriously, so that you can continue to ensure the well-being of women.
Lucia DiVenere, MA, is Officer, Government and Political Affairs, at the American Congress of Obstetricians and Gynecologists in Washington, DC.
Ms. DiVenere reports no financial relationships relevant to this article. .
References
- Shanafelt TD, Hasan O, Dyrbye LN, et al. Changes in burnout and satisfaction with work-life balance in physicians and the general US working population between 2011 and 2014. Mayo Clinic Proceedings. 2015;90(12):1600-1613.
- Peckham C. Medscape Lifestyle Report 2016: Bias and Burnout. Medscape website. http://www.medscape.com/features/slideshow/lifestyle/2016/public/overview. Published January 13, 2016. Accessed June 14, 2016.
Effects of the ACA on ObGyns
As of February 2016, 12.7 million Americans selected plans through the Health Insurance Marketplace of the Affordable Care Act (ACA).1 Physicians often have no choice in whether or not they participate in Health Insurance Exchanges; however, in 2016, 24% of ObGyns said they plan to participate in exchanges, 25% do not, and the rest are unsure.1
It is still unclear how the ACA affects physician income.1 When ObGyns who participated in Health Insurance Exchanges in 2015 were asked whether their income was affected, approximately 60% reported no change, 30% reported a decrease, and 9% said it increased.1
Medicus reported that physicians’ approval of the ACA has declined since last year. In their 2016 report, 71% of respondents gave the ACA a passing grade (A, B, C, or D), compared with 83% in 2015 and 77% in 2014. Fewer than 3% of 2016 respondents gave the ACA an “A.”12
Medscape reported that 36% of ObGyns have seen an increase in the number of patients due to the ACA.1 A 2015 report from the Kaiser Family Foundation and The Commonwealth Fund assessing the experiences and attitudes of primary care providers after the first year of ACA coverage found no association with lower- and higher-quality care whether or not patient load had increased.13 Among those in the Medscape report who said that quality of care had worsened, 21% had a greater patient load; 18% reported no increase in patient load. Seventy-eight percent of physicians whose patient load increased said that quality had stayed the same or improved; 82% of those who experienced no increase in patient load reported that quality had stayed the same or improved.1
Share your thoughts! Send your Letter to the Editor to rbarbieri@frontlinemedcom.com. Please include your name and the city and state in which you practice.
- Peckham C. Medscape Ob/Gyn Compensation Report 2016. Medscape website. http://www.medscape.com/features/slideshow/compensation/2016/womenshealth. Published April 1, 2016. Accessed June 8, 2016.
- Reale D, Yates J. ObGyn salaries continue gradual improvement. OBG Manag. 2015;27(7):34−37.
- Peckham C. Medscape Ob/Gyn Compensation Report 2014. Medscape website. http://www.medscape.com/features/slideshow/compensation/2014/womenshealth. Published April 14, 2014. Accessed June 8, 2016.
- Merritt Hawkins. Survey: Starting salaries for physicians spiking. http://www.merritthawkins.com/uploadedFiles/MerrittHawkins/Pdf/Merritt_Hawkins_Starting_Salaries_For_Physicians_Spiking.pdf. Published June 7, 2016. Accessed June 17, 2016.
- Ly DP, Seabury SA, Jena AB, Newhouse RL. Differences in incomes of physicians in the United States by race and sex: observational study [published online ahead of print June 7, 2016]. BMJ. 2016;353:i2923. http://dx.doi.org/10.1136/bmj.i2923. Accessed June 8, 2016.
- Peckham C. Medscape Physician Compensation Report 2016. Medscape website. http://www.medscape.com/features/slideshow/compensation/2016/public/overview#page=1. Published April 1, 2016. Accessed June 15, 2016.
- Kaiser Family Foundation. Distribution of medical school graduates by gender. http://kff.org/other/state-indicator/medical-school-graduates-by-gender/. Published 2016. Accessed June 22, 2016.
- Lautenberger DM, Dandar VM, Raezer CL, Sloane RA. The state of women in academic medicine, 2013-2014. Association of American Medical Colleges. 2014. https://members.aamc.org/eweb/upload/The%20State%20of%20Women%20in%20Academic%20Medicine%202013-2014%20FINAL.pdf. Accessed June 17, 2016.
- American Medical Association. FREIDA Online specialty training search: Obstetrics and Gynecology, 2014. https://freida.ama-assn.org/Freida/user/specStatisticsSearch.do?method=viewDetail&pageNumber=2&spcCd=220. Accessed June 17, 2016.
- Baecher-Lind L. Women in leadership positions within obstetrics and gynecology. Obstet Gynecol. 2012;120(6):1415−1418.
- Email correspondence with Laura E. Baecher-Lind, June 19, 2016.
- Medicus Firm. The Medicus Firm releases annual Physician Practice Preference Survey for 2016. http://www .themedicusfirm.com/the-medicus-firm-releases-annual-physician-practice-preference-survey-for-2016. Published May 4, 2016. Accessed June 10, 2016.
- Hamel L, Doty MM, Norton M, et al; Kaiser Family Foundation and The Commonwealth Fund. Experiences and attitudes of primary care providers under the first year of ACA coverage expansion. http://www.commonwealthfund.org/publications/issue-briefs/2015/jun/primary-care-providers-first-year-aca. Published June 18, 2015. Accessed June 15, 2016.
In this Article
- ACOG takes aim at burnout
- Considering salary and leadership disparities
- ObGyns’ greatest practice concerns

ObGyn salaries continue gradual improvement
Female ObGyns continue to make less than their male counterparts, although the gap is narrower for those who are employed versus in private practice
The mean income for ObGyns rose by 2% in 2014 over 2013 to $249,000,1 according to the 2015 Medscape Compensation Report. This slight rise continues a gradual increase over the past few years ($242,000 in 2012; $220,000 in 2011).1–4 The 2015 Report took into account survey responses from 19,657 physicians across 26 specialties, 5% (982) of whom were ObGyns.
The highest earners among all physician specialties were orthopedists ($421,000), cardiologists, and gastroenterologists. The lowest earners were pediatricians, family physicians, and endocrinologists and internists ($196,000).The highest ObGyn earners lived in the Northwest ($289,000) and Great Lakes ($268,000) regions; the lowest earners lived in the Mid-Atlantic ($230,000) and Northeast ($235,000) areas.1
SURVEY FINDINGS
Career satisfaction for ObGyns is dipping
In 2011, 69%, 53%, and 48% of ObGyns indicated they would choose a career in medicine again, select the same specialty, and pick the same practice setting, respectively. In the 2015 survey, 67% of ObGyns reported that they would still choose medicine; however, only 40% would pick obstetrics and gynecology as their specialty, and only 22% would select the same practice setting.1
Employment over private practice: Who feels best compensated?
Overall, 63% of all physicians are now employed, with only 23% reporting to be in private practice. Employment appears to be more popular for women: 59% of men and 72% of women responded that they work for a salary. Slightly more than a third (36%) of men and about a quarter (23%) of women are self-employed.5The gender picture. Half of all ObGyns are women, and almost half of medical school graduates are women, yet male ObGyns continue to make more money than their female counterparts.1,5,6 The 9% difference between compensation rates for self-employed male and female ObGyns ($265,000 vs $242,000, respectively) is less than the 14% between their employed colleagues ($266,000 vs $229,000, respectively).1 Women tend to work shorter hours, fewer weeks, and see fewer patients than men, which could account for the lower compensation rate for female ObGyns. Studies suggest that greater schedule flexibility and fewer hours are key factors that improve satisfaction rates for female physicians.5
Male and female ObGyns tend to agree on their income satisfaction: less than half are satisfied (male, 44%; female, 46%). Many more employed ObGyns (55%) believe that they are fairly compensated than self-employed ObGyns (31%).1
Which practice settings pay better?
Compensation rates for ObGyns in 2015 are greatest for those in office-based multispecialty group practice ($280,000), followed by those who work in1:
- health care organizations ($269,000)
- office-based single-specialty group practices ($266,000)
- outpatient clinics ($223,000)
- academic settings (nonhospital)
- research, military, and government ($219,000).
The lowest paid practice settings are office-based solo practices ($218,000) and hospital-employed ObGyns ($209,000). In 2013, ObGyns who earned the most worked for health care organizations ($273,000); those who earned the least worked for outpatient clinics ($207,000).1
Do you take insurance, Medicare, Medicaid?
More employed (82%) than self-employed (53%) ObGyns will continue to take new and current Medicare or Medicaid patients, which is a rise from data published in the 2014 report (employed, 72%; self-employed, 46%).1
More than half (58%) of all physicians received less than $100 from private insurers for a new-patient office visit in 2014. Among ObGyns, 26% said they would drop insurers that pay poorly; 29% replied that they would not drop an insurer because they need all payers.1
The rate of participation in Accountable Care Organizations (ACOs) has increased from 25% in 2013 to 35% in 2014, with 8% more expecting to join an ACO in 2015. Concierge practice (2%) and cash-only practice (5%) were reportedly not significant payment models for ObGyns in 2014.1
Only 26% of ObGyns are planning to participate in health insurance exchanges; 23% said they are not participating, and 51% are not sure whether they will participate. Close to half (41%) of ObGyns believe their income will decrease because of health insurance exchanges, whereas 54% do not anticipate a change in income.1
Do you offer ancillary services?
When asked, 11% of employed ObGyns and 28% of self-employed ObGyns revealed that they have offered new ancillary services within the past 3 years. These ancillary services can include mammography, bone density testing, ultrasound, in-house laboratory services, bioidentical hormone replacement therapy, and weight management.1
How much time do you spend with patients?
In 2014, 62% of ObGyns reported spending 9 to 16 minutes with a patient during a visit. This is compared to 56% of family physicians and 44% of internists (TABLE).1,5
More than one-half (52%) of ObGyns spend 30 to 45 hours per week seeing patients. Fewer (38%) spend more than 45 hours per week, and 9% spend less than 30 hours per week with patients. This decline may be due to the increasing proportion of women and older physicians who tend to work shorter hours and fewer weeks.1
In the general physician population, 24% of women and 13% of men work part time, whereas 16% of both men and women ObGyns work part time. ObGyns aged 65 years or older constitute 35% of part-timers; 9% of those aged 35 to 49 years, and 11% of those aged 50 to 64 years, work part time. Only 2% of those younger than 35 work part time.1
What is most rewarding?
When given several choices to select as the most rewarding aspect of their jobs, more female ObGyns (47%) than males (41%) reported that their physician-patient relationships are the major source of satisfaction. More men (10%) than women (7%) cite that making good money at a job they like is most gratifying. Only 3% of men and 2% of women reported no reward to being an ObGyn.1
Survey methodology
Medscape reports that the recruitment period for the 2015 Physician Compensation Report was from December 30, 2014, through March 11, 2015. Data were collected via a third-party online survey collection site. The margin of error for the survey was ±0.69%.1
- Peckham C. Medscape OB/GYN Compensation Report 2015. Medscape Web site. http://www.medscape.com/features/slideshow/compensation/2015/womenshealth. Published April 21, 2015. Accessed May 13, 2015.
- Peckham C. Medscape OB/GYN Compensation Report 2014. Medscape Web site. http://www.medscape.com/features/slideshow/compensation/2014/womenshealth. Published April 15, 2014. Accessed June 2, 2014.
- Medscape News. Ob/Gyn Compensation Report 2013. Medscape Web site. http://www.medscape.com/features/slideshow/compensation/2013/womenshealth. Accessed June 30, 2013.
- Reale D. Mean income for ObGyns increased in 2012. OBG Manag. 2013;25(8):34–36.
- Peckham C. Medscape Physician Compensation Report 2015. Medscape Web site. http://www.medscape.com/features/slideshow/compensation/2015/public/overview. Published April 21, 2015. Accessed May 13, 2015.
Female ObGyns continue to make less than their male counterparts, although the gap is narrower for those who are employed versus in private practice
The mean income for ObGyns rose by 2% in 2014 over 2013 to $249,000,1 according to the 2015 Medscape Compensation Report. This slight rise continues a gradual increase over the past few years ($242,000 in 2012; $220,000 in 2011).1–4 The 2015 Report took into account survey responses from 19,657 physicians across 26 specialties, 5% (982) of whom were ObGyns.
The highest earners among all physician specialties were orthopedists ($421,000), cardiologists, and gastroenterologists. The lowest earners were pediatricians, family physicians, and endocrinologists and internists ($196,000).The highest ObGyn earners lived in the Northwest ($289,000) and Great Lakes ($268,000) regions; the lowest earners lived in the Mid-Atlantic ($230,000) and Northeast ($235,000) areas.1
SURVEY FINDINGS
Career satisfaction for ObGyns is dipping
In 2011, 69%, 53%, and 48% of ObGyns indicated they would choose a career in medicine again, select the same specialty, and pick the same practice setting, respectively. In the 2015 survey, 67% of ObGyns reported that they would still choose medicine; however, only 40% would pick obstetrics and gynecology as their specialty, and only 22% would select the same practice setting.1
Employment over private practice: Who feels best compensated?
Overall, 63% of all physicians are now employed, with only 23% reporting to be in private practice. Employment appears to be more popular for women: 59% of men and 72% of women responded that they work for a salary. Slightly more than a third (36%) of men and about a quarter (23%) of women are self-employed.5The gender picture. Half of all ObGyns are women, and almost half of medical school graduates are women, yet male ObGyns continue to make more money than their female counterparts.1,5,6 The 9% difference between compensation rates for self-employed male and female ObGyns ($265,000 vs $242,000, respectively) is less than the 14% between their employed colleagues ($266,000 vs $229,000, respectively).1 Women tend to work shorter hours, fewer weeks, and see fewer patients than men, which could account for the lower compensation rate for female ObGyns. Studies suggest that greater schedule flexibility and fewer hours are key factors that improve satisfaction rates for female physicians.5
Male and female ObGyns tend to agree on their income satisfaction: less than half are satisfied (male, 44%; female, 46%). Many more employed ObGyns (55%) believe that they are fairly compensated than self-employed ObGyns (31%).1
Which practice settings pay better?
Compensation rates for ObGyns in 2015 are greatest for those in office-based multispecialty group practice ($280,000), followed by those who work in1:
- health care organizations ($269,000)
- office-based single-specialty group practices ($266,000)
- outpatient clinics ($223,000)
- academic settings (nonhospital)
- research, military, and government ($219,000).
The lowest paid practice settings are office-based solo practices ($218,000) and hospital-employed ObGyns ($209,000). In 2013, ObGyns who earned the most worked for health care organizations ($273,000); those who earned the least worked for outpatient clinics ($207,000).1
Do you take insurance, Medicare, Medicaid?
More employed (82%) than self-employed (53%) ObGyns will continue to take new and current Medicare or Medicaid patients, which is a rise from data published in the 2014 report (employed, 72%; self-employed, 46%).1
More than half (58%) of all physicians received less than $100 from private insurers for a new-patient office visit in 2014. Among ObGyns, 26% said they would drop insurers that pay poorly; 29% replied that they would not drop an insurer because they need all payers.1
The rate of participation in Accountable Care Organizations (ACOs) has increased from 25% in 2013 to 35% in 2014, with 8% more expecting to join an ACO in 2015. Concierge practice (2%) and cash-only practice (5%) were reportedly not significant payment models for ObGyns in 2014.1
Only 26% of ObGyns are planning to participate in health insurance exchanges; 23% said they are not participating, and 51% are not sure whether they will participate. Close to half (41%) of ObGyns believe their income will decrease because of health insurance exchanges, whereas 54% do not anticipate a change in income.1
Do you offer ancillary services?
When asked, 11% of employed ObGyns and 28% of self-employed ObGyns revealed that they have offered new ancillary services within the past 3 years. These ancillary services can include mammography, bone density testing, ultrasound, in-house laboratory services, bioidentical hormone replacement therapy, and weight management.1
How much time do you spend with patients?
In 2014, 62% of ObGyns reported spending 9 to 16 minutes with a patient during a visit. This is compared to 56% of family physicians and 44% of internists (TABLE).1,5
More than one-half (52%) of ObGyns spend 30 to 45 hours per week seeing patients. Fewer (38%) spend more than 45 hours per week, and 9% spend less than 30 hours per week with patients. This decline may be due to the increasing proportion of women and older physicians who tend to work shorter hours and fewer weeks.1
In the general physician population, 24% of women and 13% of men work part time, whereas 16% of both men and women ObGyns work part time. ObGyns aged 65 years or older constitute 35% of part-timers; 9% of those aged 35 to 49 years, and 11% of those aged 50 to 64 years, work part time. Only 2% of those younger than 35 work part time.1
What is most rewarding?
When given several choices to select as the most rewarding aspect of their jobs, more female ObGyns (47%) than males (41%) reported that their physician-patient relationships are the major source of satisfaction. More men (10%) than women (7%) cite that making good money at a job they like is most gratifying. Only 3% of men and 2% of women reported no reward to being an ObGyn.1
Survey methodology
Medscape reports that the recruitment period for the 2015 Physician Compensation Report was from December 30, 2014, through March 11, 2015. Data were collected via a third-party online survey collection site. The margin of error for the survey was ±0.69%.1
- Peckham C. Medscape OB/GYN Compensation Report 2015. Medscape Web site. http://www.medscape.com/features/slideshow/compensation/2015/womenshealth. Published April 21, 2015. Accessed May 13, 2015.
- Peckham C. Medscape OB/GYN Compensation Report 2014. Medscape Web site. http://www.medscape.com/features/slideshow/compensation/2014/womenshealth. Published April 15, 2014. Accessed June 2, 2014.
- Medscape News. Ob/Gyn Compensation Report 2013. Medscape Web site. http://www.medscape.com/features/slideshow/compensation/2013/womenshealth. Accessed June 30, 2013.
- Reale D. Mean income for ObGyns increased in 2012. OBG Manag. 2013;25(8):34–36.
- Peckham C. Medscape Physician Compensation Report 2015. Medscape Web site. http://www.medscape.com/features/slideshow/compensation/2015/public/overview. Published April 21, 2015. Accessed May 13, 2015.
ObGyn salaries continue gradual improvement
The mean income for ObGyns rose by 2% in 2014 over 2013 to $249,000, according to the 2015 Medscape Compensation Report.1 This slight rise continues a gradual increase over the past few years ($242,000 in 2012; $220,000 in 2011).1–4 The 2015 report took into account survey responses from 19,657 physicians across 26 specialties, 5% (982) of whom were ObGyns.
The highest earners among all physician specialties were orthopedists ($421,000), cardiologists, and gastroenterologists. The lowest earners were pediatricians, family physicians, endocrinologists, and internists ($196,000). The highest ObGyn earners lived in the Northwest ($289,000) and Great Lakes ($268,000) regions; the lowest earners lived in the Mid-Atlantic ($230,000) and Northeast ($235,000) areas.1
Survey findings
Career satisfaction for ObGyns is dipping
In 2011, 69%, 53%, and 48% of ObGyns indicated they would choose a career in medicine again, select the same specialty, and pick the same practice setting, respectively.4 In the 2015 survey, 67% of ObGyns reported that they would still choose medicine; however, only 40% would pick obstetrics and gynecology as their specialty, and only 22% would select the same practice setting.1
Employment over private practice: Who feels best compensated?
Overall, 63% of all physicians are now employed, with only 23% reporting to be in private practice. Employment appears to be more popular for women: 59% of men and 72% of women responded that they work for a salary. Slightly more than a third (36%) of men and about a quarter (23%) of women are self-employed.5
The gender picture. Half of all ObGyns are women, and almost half of medical school graduates are women, yet male ObGyns continue to make more money than their female counterparts.1,5,6 The 9% difference between compensation rates for self-employed male and female ObGyns ($265,000 vs $242,000, respectively) is less than the 14% difference between their employed colleagues ($266,000 vs $229,000, respectively).1 Women tend to work shorter hours, fewer weeks, and see fewer patients than men, which could account for the lower compensation rate for female ObGyns. Studies suggest that greater schedule flexibility and fewer hours are key factors that improve satisfaction rates for female physicians.5
Male and female ObGyns tend to agree on their income satisfaction: less than half are satisfied (male, 44%; female, 46%). Many more employed ObGyns (55%) than self-employed ObGyns (31%) believe that they are fairly compensated.1

Which practice settings pay better?
Compensation rates for ObGyns in 2015 are greatest for those in office-based multispecialty group practice ($280,000), followed by those who work in1:
- health care organizations ($269,000)
- office-based single-specialty group practices ($266,000)
- outpatient clinics ($223,000)
- academic settings (nonhospital), research, military, and government ($219,000).
The lowest paid practice settings are office-based solo practices ($218,000) and hospital-employed ObGyns ($209,000).
In 2013, ObGyns who earned the most worked for health care organizations ($273,000); those who earned the least worked for outpatient clinics ($207,000).1
Do you take insurance, Medicare, Medicaid?
More employed (82%) than self-employed (53%) ObGyns will continue to take new and current Medicare or Medicaid patients, which is a rise from data published in the 2014 report (employed, 72%; self-employed, 46%).1
More than half (58%) of all physicians received less than $100 from private insurers for a new-patient office visit in 2014. Among ObGyns, 26% said they would drop insurers that pay poorly; 29% replied that they would not drop an insurer because they need all payers.1
The rate of participation in Accountable Care Organizations (ACOs) has increased from 25% in 2013 to 35% in 2014, with 8% more expecting to join an ACO in 2015. Concierge practice (2%) and cash-only practice (5%) were reportedly not significant payment models for ObGyns in 2014.1
Only 26% of ObGyns are planning to participate in health insurance exchanges; 23% said they are not participating, and 51% are not sure whether they will participate. Close to half (41%) of ObGyns believe their income will decrease because of health insurance exchanges, whereas 54% do not anticipate a change in income.1
Do you offer ancillary services?
When asked, 11% of employed ObGyns and 28% of self-employed ObGyns revealed that they have offered new ancillary services within the past 3 years. These ancillary services can include mammography, bone density testing, ultrasound, in-house laboratory services, bioidentical hormone replacement therapy, and weight management.1
How much time do you spend with patients?
In 2014, 62% of ObGyns reported spending 9 to 16 minutes with a patient during a visit. This is compared to 56% of family physicians and 44% of internists (TABLE).1,5
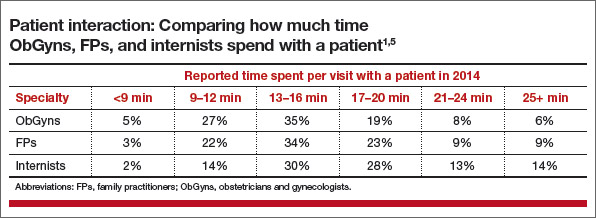
More than one-half (52%) of ObGynsspend 30 to 45 hours per week seeing patients. Fewer (38%) spend more than 45 hours per week, and 9% spend less than 30 hours per week with patients. This decline may be due to the increasing proportion of women and older physicians who tend to work shorter hours and fewer weeks.1
In the general physician population, 24% of women and 13% of men work part time, whereas 16% of both male and female ObGyns work part time. ObGyns aged 65 years or older constitute 35% of part-timers; 9% of those aged 35 to 49 years, and 11% of those aged 50 to 64 years, work part time. Only 2% of those younger than age 35 work part time.1
Would you select a career in obstetrics and gynecology all over again?
If given a second chance, would you rather choose orthopedic surgery as your specialty, or even choose medicine as a career again? OBG Management recently asked readers to weigh in, through its Quick Poll posted at obgmanagement.com, on whether or not they would choose ObGyn all over again. Ninety-one readers answered “yes” and 70 answered “no,” for a total of 161 respondents.
When this same question was posed to OBG Management’s Virtual Board of Editors (VBE), the perspectives were as split as the Quick Poll results:
- “No, no, no, I would not choose ObGyn all over again.”
- “Yes, I still love what I do.”
- “Yes, it is still the most unique specialty in medicine because it involves both surgery and primary care.”
- “Yes, for all the reasons I first loved the specialty: every week’s schedule, and every day is different. There is a mix of office care, surgery, and call.”
- “No! There is constant concern of litigation for complications, poor reimbursement, and compromised lifestyle.”
“There are much easier ways to make a living,” said one respondent, and another replied, “Work is very tough right now and the payment is too low.”
“The specialty has changed,” said Mary Vanko, MD, who practices in the suburbs of “blue collar Indiana.” “The public has very little idea of the breadth of our knowledge. The ObGyn generalist has the ability to serve as a woman’s doctor throughout her lifetime, not just perform the deliveries and surgeries. All of a sudden we are excluded from primary care status and people have to fight to see us. The newbies will never experience what it used to be as an ObGyn, the woman’s primary. Now we are the doctors to see when someone wants an IUD or is bleeding or pregnant. Big difference.”
Wesley Hambright, MD, practices in a small community hospital, but feels that “a larger hospital with more specialties may offer more flexibility and support in dealing with external pressures.” Tameka O’Neal, MD, is currently hospital employed but feels “as though I have little say in my practice.” Shaukat Ashai, MD, who is retired after 35 years in practice, says he would have preferred an academic setting on a full-time basis, citing long hours and poor compensation.
Robert del Rosario, MD, is in a large single-specialty suburban practice and would choose this practice setting again, although he would not choose a career as an ObGyn again. “The work demands have taken away too much from family,” he says. In addition, “as a male ObGyn, I am regularly faced with patients who choose their doctors based on gender rather than on skill. Our colleagues are no better. Early in my career and until the present, I hear people say, ‘Oh, I can’t hire Dr. X because we’re looking to hire a female.’”
Joe Walsh, MD, of Philadelphia, Pennsylvania, expresses similar discontent as a male ObGyn practicing in today’s female-populated specialty. In a letter to the editor in response to Editor in Chief Robert L. Barbieri, MD’s Editorial in the May 2015 issue, “Why is obstetrics and gynecology a popular choice for medical students?” Dr. Walsh states: “The unaddressed question is why is it unpopular for half of medical students? Ninety-three percent of resident graduates in the field are women, while women account for half of medical student graduates. Men rarely go into the field today. Perhaps job advertisements touting physician opportunities in ‘all female groups’ discourage men. Perhaps hospitals’ ‘Women’s Health Centers’ with such slogans as ‘Women taking care of women’ discourage men. Perhaps receptionists’ asking patients whether they prefer a male or female physician discourages male ObGyns.”
Many VBE members express some frustrations—with their practice setting, compensation, and longer work hours—but say that the patient relationships are the most rewarding aspect of their jobs. After 29 years in practice, Patrick Pevoto, MD, says the most rewarding aspect of his job is “being part of the legacy in people’s lives.”
Others say what keeps them engaged is:
- Enjoying “good outcomes.”
- “The patient contact. It’s fun having someone come up to me in the grocery store and introduce me to a teenager that I delivered 15 years ago.”
- “Surgery.”
- “Helping patients and teaching fellows.”
- “Knowing that I am making a difference in people’s lives.”
What is most rewarding?
When given several choices to select as the most rewarding aspect of their jobs, more female ObGyns (47%) than males (41%) reported that their physician-patient relationships are the major source of satisfaction. More men (10%) than women (7%) cite that making good money at a job they like is most gratifying. Only 3% of men and 2% of women reported no reward to being an ObGyn.1
Survey methodology
Medscape reports that the recruitment period for the 2015 Physician Compensation Report was from December 30, 2014, through March 11, 2015. Data were collected via a third-party online survey collection site. The margin of error for the survey was ±0.69%.1
Share your thoughts on this article! Send your Letter to the Editor to rbarbieri@frontlinemedcom.com. Please include your name and the city and state in which you practice.
1. Peckham C. Medscape OB/GYN Compensation Report 2015. Medscape Web site. http://www.medscape.com/features/slideshow/compensation/2015/womenshealth. Published April 21, 2015. Accessed May 13, 2015.
2. Peckham C. Medscape OB/GYN Compensation Report 2014. Medscape Web site. http://www.medscape.com/features/slideshow/compensation/2014/womenshealth. Published April 15, 2014. Accessed June 2, 2014.
3. Medscape News. Ob/Gyn Compensation Report 2013. Medscape Web site. http://www.medscape.com/features/slideshow/compensation/2013/womenshealth. Accessed June 30, 2013.
4. Reale D. Mean income for ObGyns increased in 2012. OBG Manag. 2013;25(8):34–36.
5. Peckham C. Medscape Physician Compensation Report 2015. Medscape Web site. http://www.medscape.com/features/slideshow/compensation/2015/public/overview. Published April 21, 2015. Accessed May 13, 2015.
6. Distribution of medical school graduates by gender. Henry Kaiser Family Foundation Web site. http://kff.org/other/state-indicator/medical-school-graduates-by-gender/. Accessed May 13, 2015.
The mean income for ObGyns rose by 2% in 2014 over 2013 to $249,000, according to the 2015 Medscape Compensation Report.1 This slight rise continues a gradual increase over the past few years ($242,000 in 2012; $220,000 in 2011).1–4 The 2015 report took into account survey responses from 19,657 physicians across 26 specialties, 5% (982) of whom were ObGyns.
The highest earners among all physician specialties were orthopedists ($421,000), cardiologists, and gastroenterologists. The lowest earners were pediatricians, family physicians, endocrinologists, and internists ($196,000). The highest ObGyn earners lived in the Northwest ($289,000) and Great Lakes ($268,000) regions; the lowest earners lived in the Mid-Atlantic ($230,000) and Northeast ($235,000) areas.1
Survey findings
Career satisfaction for ObGyns is dipping
In 2011, 69%, 53%, and 48% of ObGyns indicated they would choose a career in medicine again, select the same specialty, and pick the same practice setting, respectively.4 In the 2015 survey, 67% of ObGyns reported that they would still choose medicine; however, only 40% would pick obstetrics and gynecology as their specialty, and only 22% would select the same practice setting.1
Employment over private practice: Who feels best compensated?
Overall, 63% of all physicians are now employed, with only 23% reporting to be in private practice. Employment appears to be more popular for women: 59% of men and 72% of women responded that they work for a salary. Slightly more than a third (36%) of men and about a quarter (23%) of women are self-employed.5
The gender picture. Half of all ObGyns are women, and almost half of medical school graduates are women, yet male ObGyns continue to make more money than their female counterparts.1,5,6 The 9% difference between compensation rates for self-employed male and female ObGyns ($265,000 vs $242,000, respectively) is less than the 14% difference between their employed colleagues ($266,000 vs $229,000, respectively).1 Women tend to work shorter hours, fewer weeks, and see fewer patients than men, which could account for the lower compensation rate for female ObGyns. Studies suggest that greater schedule flexibility and fewer hours are key factors that improve satisfaction rates for female physicians.5
Male and female ObGyns tend to agree on their income satisfaction: less than half are satisfied (male, 44%; female, 46%). Many more employed ObGyns (55%) than self-employed ObGyns (31%) believe that they are fairly compensated.1
Which practice settings pay better?
Compensation rates for ObGyns in 2015 are greatest for those in office-based multispecialty group practice ($280,000), followed by those who work in1:
- health care organizations ($269,000)
- office-based single-specialty group practices ($266,000)
- outpatient clinics ($223,000)
- academic settings (nonhospital), research, military, and government ($219,000).
The lowest paid practice settings are office-based solo practices ($218,000) and hospital-employed ObGyns ($209,000).
In 2013, ObGyns who earned the most worked for health care organizations ($273,000); those who earned the least worked for outpatient clinics ($207,000).1
Do you take insurance, Medicare, Medicaid?
More employed (82%) than self-employed (53%) ObGyns will continue to take new and current Medicare or Medicaid patients, which is a rise from data published in the 2014 report (employed, 72%; self-employed, 46%).1
More than half (58%) of all physicians received less than $100 from private insurers for a new-patient office visit in 2014. Among ObGyns, 26% said they would drop insurers that pay poorly; 29% replied that they would not drop an insurer because they need all payers.1
The rate of participation in Accountable Care Organizations (ACOs) has increased from 25% in 2013 to 35% in 2014, with 8% more expecting to join an ACO in 2015. Concierge practice (2%) and cash-only practice (5%) were reportedly not significant payment models for ObGyns in 2014.1
Only 26% of ObGyns are planning to participate in health insurance exchanges; 23% said they are not participating, and 51% are not sure whether they will participate. Close to half (41%) of ObGyns believe their income will decrease because of health insurance exchanges, whereas 54% do not anticipate a change in income.1
Do you offer ancillary services?
When asked, 11% of employed ObGyns and 28% of self-employed ObGyns revealed that they have offered new ancillary services within the past 3 years. These ancillary services can include mammography, bone density testing, ultrasound, in-house laboratory services, bioidentical hormone replacement therapy, and weight management.1
How much time do you spend with patients?
In 2014, 62% of ObGyns reported spending 9 to 16 minutes with a patient during a visit. This is compared to 56% of family physicians and 44% of internists (TABLE).1,5
More than one-half (52%) of ObGynsspend 30 to 45 hours per week seeing patients. Fewer (38%) spend more than 45 hours per week, and 9% spend less than 30 hours per week with patients. This decline may be due to the increasing proportion of women and older physicians who tend to work shorter hours and fewer weeks.1
In the general physician population, 24% of women and 13% of men work part time, whereas 16% of both male and female ObGyns work part time. ObGyns aged 65 years or older constitute 35% of part-timers; 9% of those aged 35 to 49 years, and 11% of those aged 50 to 64 years, work part time. Only 2% of those younger than age 35 work part time.1
Would you select a career in obstetrics and gynecology all over again?
If given a second chance, would you rather choose orthopedic surgery as your specialty, or even choose medicine as a career again? OBG Management recently asked readers to weigh in, through its Quick Poll posted at obgmanagement.com, on whether or not they would choose ObGyn all over again. Ninety-one readers answered “yes” and 70 answered “no,” for a total of 161 respondents.
When this same question was posed to OBG Management’s Virtual Board of Editors (VBE), the perspectives were as split as the Quick Poll results:
- “No, no, no, I would not choose ObGyn all over again.”
- “Yes, I still love what I do.”
- “Yes, it is still the most unique specialty in medicine because it involves both surgery and primary care.”
- “Yes, for all the reasons I first loved the specialty: every week’s schedule, and every day is different. There is a mix of office care, surgery, and call.”
- “No! There is constant concern of litigation for complications, poor reimbursement, and compromised lifestyle.”
“There are much easier ways to make a living,” said one respondent, and another replied, “Work is very tough right now and the payment is too low.”
“The specialty has changed,” said Mary Vanko, MD, who practices in the suburbs of “blue collar Indiana.” “The public has very little idea of the breadth of our knowledge. The ObGyn generalist has the ability to serve as a woman’s doctor throughout her lifetime, not just perform the deliveries and surgeries. All of a sudden we are excluded from primary care status and people have to fight to see us. The newbies will never experience what it used to be as an ObGyn, the woman’s primary. Now we are the doctors to see when someone wants an IUD or is bleeding or pregnant. Big difference.”
Wesley Hambright, MD, practices in a small community hospital, but feels that “a larger hospital with more specialties may offer more flexibility and support in dealing with external pressures.” Tameka O’Neal, MD, is currently hospital employed but feels “as though I have little say in my practice.” Shaukat Ashai, MD, who is retired after 35 years in practice, says he would have preferred an academic setting on a full-time basis, citing long hours and poor compensation.
Robert del Rosario, MD, is in a large single-specialty suburban practice and would choose this practice setting again, although he would not choose a career as an ObGyn again. “The work demands have taken away too much from family,” he says. In addition, “as a male ObGyn, I am regularly faced with patients who choose their doctors based on gender rather than on skill. Our colleagues are no better. Early in my career and until the present, I hear people say, ‘Oh, I can’t hire Dr. X because we’re looking to hire a female.’”
Joe Walsh, MD, of Philadelphia, Pennsylvania, expresses similar discontent as a male ObGyn practicing in today’s female-populated specialty. In a letter to the editor in response to Editor in Chief Robert L. Barbieri, MD’s Editorial in the May 2015 issue, “Why is obstetrics and gynecology a popular choice for medical students?” Dr. Walsh states: “The unaddressed question is why is it unpopular for half of medical students? Ninety-three percent of resident graduates in the field are women, while women account for half of medical student graduates. Men rarely go into the field today. Perhaps job advertisements touting physician opportunities in ‘all female groups’ discourage men. Perhaps hospitals’ ‘Women’s Health Centers’ with such slogans as ‘Women taking care of women’ discourage men. Perhaps receptionists’ asking patients whether they prefer a male or female physician discourages male ObGyns.”
Many VBE members express some frustrations—with their practice setting, compensation, and longer work hours—but say that the patient relationships are the most rewarding aspect of their jobs. After 29 years in practice, Patrick Pevoto, MD, says the most rewarding aspect of his job is “being part of the legacy in people’s lives.”
Others say what keeps them engaged is:
- Enjoying “good outcomes.”
- “The patient contact. It’s fun having someone come up to me in the grocery store and introduce me to a teenager that I delivered 15 years ago.”
- “Surgery.”
- “Helping patients and teaching fellows.”
- “Knowing that I am making a difference in people’s lives.”
What is most rewarding?
When given several choices to select as the most rewarding aspect of their jobs, more female ObGyns (47%) than males (41%) reported that their physician-patient relationships are the major source of satisfaction. More men (10%) than women (7%) cite that making good money at a job they like is most gratifying. Only 3% of men and 2% of women reported no reward to being an ObGyn.1
Survey methodology
Medscape reports that the recruitment period for the 2015 Physician Compensation Report was from December 30, 2014, through March 11, 2015. Data were collected via a third-party online survey collection site. The margin of error for the survey was ±0.69%.1
Share your thoughts on this article! Send your Letter to the Editor to rbarbieri@frontlinemedcom.com. Please include your name and the city and state in which you practice.
1. Peckham C. Medscape OB/GYN Compensation Report 2015. Medscape Web site. http://www.medscape.com/features/slideshow/compensation/2015/womenshealth. Published April 21, 2015. Accessed May 13, 2015.
2. Peckham C. Medscape OB/GYN Compensation Report 2014. Medscape Web site. http://www.medscape.com/features/slideshow/compensation/2014/womenshealth. Published April 15, 2014. Accessed June 2, 2014.
3. Medscape News. Ob/Gyn Compensation Report 2013. Medscape Web site. http://www.medscape.com/features/slideshow/compensation/2013/womenshealth. Accessed June 30, 2013.
4. Reale D. Mean income for ObGyns increased in 2012. OBG Manag. 2013;25(8):34–36.
5. Peckham C. Medscape Physician Compensation Report 2015. Medscape Web site. http://www.medscape.com/features/slideshow/compensation/2015/public/overview. Published April 21, 2015. Accessed May 13, 2015.
6. Distribution of medical school graduates by gender. Henry Kaiser Family Foundation Web site. http://kff.org/other/state-indicator/medical-school-graduates-by-gender/. Accessed May 13, 2015.
In this article
- Which practice settings pay better?
- Would you select a career in ObGyn again?
- Comparing time spent with patients

Is the use of a containment bag at minimally invasive hysterectomy or myomectomy effective at reducing tissue spillage?
Tissue extraction during laparoscopic or robot-assisted laparoscopic gynecologic surgery raises safety concerns for dissemination of tissue during the open, or uncontained, electromechanical morcellation process. Researchers from Brigham & Women’s Hospital in Boston, Massachusetts, investigated whether contained tissue extraction using power morcellators entirely within a bag is safe and practical for preventing tissue spillage. Goggins and colleagues presented their findings in a poster at the 2015 Annual Clinical Meeting of the American College of Obstetricians and Gynecologists in San Francisco, California.
A total of 76 women at 4 institutions underwent laparoscopic or robotic multiport surgery (42 hysterectomy; 34 myomectomy). The average (SD) age and body mass index of the women were 43.16 (8.53) years and 26.47 kg/m2 (5.93), respectively. After surgical dissection, each specimen was placed into a containment bag that also included blue dye. The bag was insufflated intracorporeally and electromechanical morcellation and extraction of tissue were performed. The bag was evaluated visually for dye leakage or tears before and after the procedure.
Results
In one case, there was a tear in the bag before morcellation; no bag tears occurred during the morcellation process. Spillage of dye or tissue was noted in 7 cases, although containment bags were intact in each instance. One patient experienced intraoperative blood loss (3600 mL), and that procedure was converted to open radical hysterectomy. The most common pathologic finding was benign leiomyoma.
Conclusion
Goggins and colleagues concluded, “Contained tissue extraction using electromechanical morcellation and intracorporeally insufflated bags may provide a safe alternative to uncontained morcellation by decreasing the spread of tissue in the peritoneal cavity while allowing for the traditional benefits of laparoscopy.”
Share your thoughts! Send your Letter to the Editor to rbarbieri@frontlinemedcom.com. Please include your name and the city and state in which you practice.
Reference
- Goggins ER, Greenberg JA, Cohen SL, Morris SN, Brown DN, Einarsson JI. Efficacy of contained tissue extraction for minimizing tissue dissemination during laparoscopic hysterectomy and myomectomy. Obstet Gynecol. 2015;125(5)(suppl):29S.
Tissue extraction during laparoscopic or robot-assisted laparoscopic gynecologic surgery raises safety concerns for dissemination of tissue during the open, or uncontained, electromechanical morcellation process. Researchers from Brigham & Women’s Hospital in Boston, Massachusetts, investigated whether contained tissue extraction using power morcellators entirely within a bag is safe and practical for preventing tissue spillage. Goggins and colleagues presented their findings in a poster at the 2015 Annual Clinical Meeting of the American College of Obstetricians and Gynecologists in San Francisco, California.
A total of 76 women at 4 institutions underwent laparoscopic or robotic multiport surgery (42 hysterectomy; 34 myomectomy). The average (SD) age and body mass index of the women were 43.16 (8.53) years and 26.47 kg/m2 (5.93), respectively. After surgical dissection, each specimen was placed into a containment bag that also included blue dye. The bag was insufflated intracorporeally and electromechanical morcellation and extraction of tissue were performed. The bag was evaluated visually for dye leakage or tears before and after the procedure.
Results
In one case, there was a tear in the bag before morcellation; no bag tears occurred during the morcellation process. Spillage of dye or tissue was noted in 7 cases, although containment bags were intact in each instance. One patient experienced intraoperative blood loss (3600 mL), and that procedure was converted to open radical hysterectomy. The most common pathologic finding was benign leiomyoma.
Conclusion
Goggins and colleagues concluded, “Contained tissue extraction using electromechanical morcellation and intracorporeally insufflated bags may provide a safe alternative to uncontained morcellation by decreasing the spread of tissue in the peritoneal cavity while allowing for the traditional benefits of laparoscopy.”
Share your thoughts! Send your Letter to the Editor to rbarbieri@frontlinemedcom.com. Please include your name and the city and state in which you practice.
Reference
- Goggins ER, Greenberg JA, Cohen SL, Morris SN, Brown DN, Einarsson JI. Efficacy of contained tissue extraction for minimizing tissue dissemination during laparoscopic hysterectomy and myomectomy. Obstet Gynecol. 2015;125(5)(suppl):29S.
Reference
- Goggins ER, Greenberg JA, Cohen SL, Morris SN, Brown DN, Einarsson JI. Efficacy of contained tissue extraction for minimizing tissue dissemination during laparoscopic hysterectomy and myomectomy. Obstet Gynecol. 2015;125(5)(suppl):29S.
ObGyns, and US women, are embracing LARCs
Use of long-acting reversible contraception (LARC) has increased nearly 5-fold in the last decade, reported the Centers for Disease Control and Prevention (CDC) in a National Center for Health Statistics (NCHS) Data Brief on the trends in LARC use among US women aged 15 to 44.1
Data from the National Survey of Family Growth indicate that LARCs, which include intrauterine devices (IUDs) and subdermal hormonal implants, are gaining popularity because of their high efficacy in preventing unintended pregnancies. LARCs have demonstrated greater efficacy in preventing unintended pregnancy among all women compared with other contraceptive methods, including the oral contraceptive pill and the transdermal patch.
Age-related trends
For women aged 15 to 44, LARC use doubled between 2002 (1.5%) and the period 2006–2010 (3.8%) and then nearly doubled again for 2011–2013 (7.2%). IUD use increased 83% from the 2006–2010 period (3.5%) to the 2011–2013 period (6.4%). Implant use tripled from 2002 (0.3%) to the 2011–2013 period (0.8%).
LARC use was higher among women aged 25 to 34 than among women aged 15 to 24. The difference in LARC use was not statistically significant between women aged 25 to 34 and women aged 35 to 44.
- LARC use increased nearly 4-fold for women aged 15 to 24 between 2002 (0.6%) and 2006–2010 (2.3%), and doubled again for 2011–2013 (5.0%).
- LARC use almost doubled among women aged 25 to 34 from 2006–2010 to 2011–2013 (5.3% to 11.1%).
- LARC use tripled between 2002 (1.1%) and 2006–2010 (3.8%) for women aged 35 to 44, and increased to 5.3% in 2011–2013.
Patterns of use by race
Although LARC use tripled for non-Hispanic white women and increased 4-fold for non-Hispanic black women between 2002 and 2006–2010, use among Hispanic women declined 10% during this period. LARC use increased by 129% among Hispanic women and by 128% among non-Hispanic white women from 2006–2010 to 2011–2013. Use of LARCs in non-Hispanic black women increased by 30% during this same period.
Parous vs nulliparous women
Women who have had at least one birth use LARC at a higher rate than women who have had no previous births. During the period 2011–2013, rate of use was 3 times greater among parous (11.0%) women compared with nulliparous (2.8%) women.
- Among parous women, LARC use increased from 2.4% in 2002 to 6.3% in 2006–2010, and to 10.6% in 2011–2013.
- In nulliparous women, LARC use increased 10-fold between 2006–2010 and 2011–2013.
For additional information, visit the NCHS Data Brief at http://www.cdc.gov/nchs/data/databriefs/db188.htm
Share your thoughts on this article! Send your Letter to the Editor to rbarbieri@frontlinemedcom.com. Please include your name and the city and state in which you practice.
Reference
- Branum AM, Jones J. Trends in long-acting reversible contraception use among U.S. women aged 15–44. NCHS data brief, no 188. Hyattsville, MD: National Center for Health Statistics. 2015. http://www.cdc.gov/nchs/data/databriefs/db188.htm. Updated February 24, 2015. Accessed March 25, 2015.
Use of long-acting reversible contraception (LARC) has increased nearly 5-fold in the last decade, reported the Centers for Disease Control and Prevention (CDC) in a National Center for Health Statistics (NCHS) Data Brief on the trends in LARC use among US women aged 15 to 44.1
Data from the National Survey of Family Growth indicate that LARCs, which include intrauterine devices (IUDs) and subdermal hormonal implants, are gaining popularity because of their high efficacy in preventing unintended pregnancies. LARCs have demonstrated greater efficacy in preventing unintended pregnancy among all women compared with other contraceptive methods, including the oral contraceptive pill and the transdermal patch.
Age-related trends
For women aged 15 to 44, LARC use doubled between 2002 (1.5%) and the period 2006–2010 (3.8%) and then nearly doubled again for 2011–2013 (7.2%). IUD use increased 83% from the 2006–2010 period (3.5%) to the 2011–2013 period (6.4%). Implant use tripled from 2002 (0.3%) to the 2011–2013 period (0.8%).
LARC use was higher among women aged 25 to 34 than among women aged 15 to 24. The difference in LARC use was not statistically significant between women aged 25 to 34 and women aged 35 to 44.
- LARC use increased nearly 4-fold for women aged 15 to 24 between 2002 (0.6%) and 2006–2010 (2.3%), and doubled again for 2011–2013 (5.0%).
- LARC use almost doubled among women aged 25 to 34 from 2006–2010 to 2011–2013 (5.3% to 11.1%).
- LARC use tripled between 2002 (1.1%) and 2006–2010 (3.8%) for women aged 35 to 44, and increased to 5.3% in 2011–2013.
Patterns of use by race
Although LARC use tripled for non-Hispanic white women and increased 4-fold for non-Hispanic black women between 2002 and 2006–2010, use among Hispanic women declined 10% during this period. LARC use increased by 129% among Hispanic women and by 128% among non-Hispanic white women from 2006–2010 to 2011–2013. Use of LARCs in non-Hispanic black women increased by 30% during this same period.
Parous vs nulliparous women
Women who have had at least one birth use LARC at a higher rate than women who have had no previous births. During the period 2011–2013, rate of use was 3 times greater among parous (11.0%) women compared with nulliparous (2.8%) women.
- Among parous women, LARC use increased from 2.4% in 2002 to 6.3% in 2006–2010, and to 10.6% in 2011–2013.
- In nulliparous women, LARC use increased 10-fold between 2006–2010 and 2011–2013.
For additional information, visit the NCHS Data Brief at http://www.cdc.gov/nchs/data/databriefs/db188.htm
Share your thoughts on this article! Send your Letter to the Editor to rbarbieri@frontlinemedcom.com. Please include your name and the city and state in which you practice.
Reference
- Branum AM, Jones J. Trends in long-acting reversible contraception use among U.S. women aged 15–44. NCHS data brief, no 188. Hyattsville, MD: National Center for Health Statistics. 2015. http://www.cdc.gov/nchs/data/databriefs/db188.htm. Updated February 24, 2015. Accessed March 25, 2015.
Use of NIPT reduces invasive testing at one medical center
Following the introduction of noninvasive prenatal testing (NIPT) at the Maine Medical Center in Portland, the number of invasive prenatal diagnostic procedures decreased.
In a retrospective study, Joseph R. Wax, MD, and colleagues gathered statistics on the rates of genetic counseling, invasive prenatal diagnosis, and trisomy 21 detection among women who were at increased risk for aneuploidy. These rates were compared before and after the availability of NIPT.
The study included 1,046 women who underwent NIPT between June 1, 2012, and February 1, 2013, as well as 1,464 women who would have been eligible for NIPT if it had been available between December 1, 2010, and November 30, 2011. All women were aged 35 years or older and had ultrasound findings suggestive of increased risk of aneuploidy, a positive aneuploidy screen, prior trisomic fetus, or parental balanced translocation with increased risk for trisomy 13 or 21. One laboratory performed NIPT after patients received genetic counseling. The two groups were compared by maternal demographics, aneuploidy risk factors, rates of genetic counseling, invasive diagnostic procedures, and trisomy 21 detection.1
Results of the study
A total of 33 fetuses with trisomy 21 were identified by positive aneuploidy screening. After the introduction of NIPT, genetic counseling for aneuploidy risk increased (adjusted odds ratio [aOR], 1.77; P <.0001). However, the overall use of invasive diagnostic testing (aOR, 0.42; P <.0001), including amniocentesis (aOR, 0.37, P <.0001), decreased, although the prenatal diagnosis of trisomy 21 remained similar (88% vs 100%; P = .86).1
Dr. Wax and colleagues concluded that, “NIPT in clinical practice uses more genetic counseling resources but requires significantly fewer invasive procedures to maintain the detection rates of trisomy 21.”1
Reference
1. Wax JR, Cartin A, Chard R, Lucas FL, Pinette MG. Noninvasive prenatal testing: Impact on genetic counseling, invasive prenatal diagnosis, and trisomy 21 detection. J Clinic Ultrasound. 2015;43(1):1–6.
Following the introduction of noninvasive prenatal testing (NIPT) at the Maine Medical Center in Portland, the number of invasive prenatal diagnostic procedures decreased.
In a retrospective study, Joseph R. Wax, MD, and colleagues gathered statistics on the rates of genetic counseling, invasive prenatal diagnosis, and trisomy 21 detection among women who were at increased risk for aneuploidy. These rates were compared before and after the availability of NIPT.
The study included 1,046 women who underwent NIPT between June 1, 2012, and February 1, 2013, as well as 1,464 women who would have been eligible for NIPT if it had been available between December 1, 2010, and November 30, 2011. All women were aged 35 years or older and had ultrasound findings suggestive of increased risk of aneuploidy, a positive aneuploidy screen, prior trisomic fetus, or parental balanced translocation with increased risk for trisomy 13 or 21. One laboratory performed NIPT after patients received genetic counseling. The two groups were compared by maternal demographics, aneuploidy risk factors, rates of genetic counseling, invasive diagnostic procedures, and trisomy 21 detection.1
Results of the study
A total of 33 fetuses with trisomy 21 were identified by positive aneuploidy screening. After the introduction of NIPT, genetic counseling for aneuploidy risk increased (adjusted odds ratio [aOR], 1.77; P <.0001). However, the overall use of invasive diagnostic testing (aOR, 0.42; P <.0001), including amniocentesis (aOR, 0.37, P <.0001), decreased, although the prenatal diagnosis of trisomy 21 remained similar (88% vs 100%; P = .86).1
Dr. Wax and colleagues concluded that, “NIPT in clinical practice uses more genetic counseling resources but requires significantly fewer invasive procedures to maintain the detection rates of trisomy 21.”1
Reference
1. Wax JR, Cartin A, Chard R, Lucas FL, Pinette MG. Noninvasive prenatal testing: Impact on genetic counseling, invasive prenatal diagnosis, and trisomy 21 detection. J Clinic Ultrasound. 2015;43(1):1–6.
Reference
1. Wax JR, Cartin A, Chard R, Lucas FL, Pinette MG. Noninvasive prenatal testing: Impact on genetic counseling, invasive prenatal diagnosis, and trisomy 21 detection. J Clinic Ultrasound. 2015;43(1):1–6.
Survey: ObGyns’ salaries rose slightly in 2013
The 2014 Medscape Compensation Report surveyed more than 24,000 physicians in 25 specialties. Five percent of respondents were ObGyns, whose mean income rose slightly to $243,000 in 2013 from $242,000 in 2012, up from $220,000 in 2011.1–3 The highest ObGyn earners lived in the Great Lakes and North Central regions.1
Survey findings
Men make more than women. In 2013, male ObGyns reported earning $256,000; female ObGyns reported $229,000 in mean income. However, women felt more satisfied with their salary (47% of women vs 38% of men). Regardless of gender, ObGyns were slightly less happy with their income than all physicians (50% satisfied).1
Among all female physicians, more were employed than self-employed; the opposite was true for male physicians.4 Half of all graduating physicians are now female, and demographics show that 62% of all female physicians are younger than age 45.1
Practice settings are key to income. Sixty percent of ObGyns indicated they would choose medicine again as a career; 43% would choose their own specialty. However, only 25% of ObGyns would make the same decision about practice setting.1
In 2013, employed and self-employed ObGyns reported nearly the same mean income: $243,000 versus $246,000, respectively. However, when broken down by specific practice setting, the highest earners were ObGyns who worked for health-care organizations, at $273,000. Additional 2013 mean earnings ranked by work setting were1:
- multispecialty office-based group practices, $271,000
- single-specialty office-based group practices, $255,000
- hospitals, $228,000
- solo office-based practices, $212,000
- outpatient clinics, $207,000.
In 2013, 49% of employed physicians worked in hospitals or in groups owned by a hospital, while 21% were employed by private groups. Other employment situations included community health centers, corporate laboratories, correction institutions, military bases, and nursing homes.4
ACO participation grows. In 2013, 37% of ObGyns either participated in an Accountable Care Organization (ACO) or planned on joining an ACO within the next year.1 This was an increase from 25% in 2012.2,3
In the most recent report, 2% chose concierge practices (also known as direct primary care) and 5% opted for cash-only practices.1 In 2012, only 1% of ObGyns opted for concierge practices, and 3% for cash-only practices.2,3
Related article: Is private ObGyn practice on its way out? Lucia DiVenere, MA (October 2011)
Employment over private practice? In 2013, physicians were enticed to seek employment by the financial challenges of private practice (38%); not having to be concerned about administrative issues (29%); and working shorter and more regular hours (19%). Other reported benefits of employment were academic opportunities, better life−work balance, more vacation time, and no loss of income during vacation. More than half (53%) of employed physicians who were previously self-employed felt that patient care was superior now that they were employed, and 37% thought it was about the same.4
Related article: Mean income for ObGyns increased in 2012. Deborah Reale (News for your Practice; August 2013)
Career satisfaction
ObGyns were close to the bottom among all physicians (48%) when it came to overall career satisfaction, tied with nephrologists, surgeons, and pulmonologists. The most satisfied physicians were dermatologists (65%); the least satisfied were plastic surgeons (45%).1
What drives you? In 2013, more ObGyns (41%) than all physicians (33%) reported that the most rewarding part of their job was their relationships with patients. Thirty percent of ObGyns chose being good at their jobs; 8% chose making good money; and 2% found nothing rewarding about the job.1
How much patient time do you spend? The majority (58%) of ObGyns reported spending more than 40 hours per week with patients and 16 minutes or less (66%) per patient.1 In 2012, 60% of ObGyn respondents reported spending 16 minutes or less per patient.2,3
Anticipating the effects of the Affordable Care Act
Under the Affordable Care Act (ACA), an organization’s revenue will still be determined largely by the volume generated by physicians. The percentage of ObGyns who saw 50 to 124 patients per week increased from 57% in 2012 to 69% in 2013 (TABLE).1,2
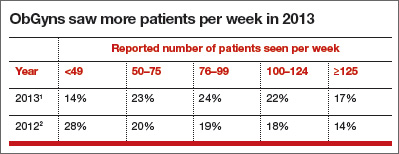
In 2013, 53% of ObGyns still were undecided about health-insurance exchange participation—the same percentage as all survey respondents. Among ObGyns, 30% would participate, and 17% would not participate.1
Related article: As the Affordable Care Act comes of age, a look behind the headlines. Lucia DiVenere, MA (Practice Management; January 2014)
Almost half (49%) of ObGyns expect their income under the ACA to decrease. About 45% of ObGyns did not foresee any change, and 5% believed their incomes would increase (1% didn’t know) under the ACA. ObGyns also anticipated a higher workload, a decline in quality of patient care and access, and reduced ability to make decisions.1
Almost one-third of ObGyns dropped poorly paying insurers. In 2013, 29% of ObGyns said they regularly drop insurers who pay poorly, but 46% said they keep their insurers year after year. In 2012, 26% of ObGyns said they drop insurers who pay the least or create the most trouble; 29% said they keep all insurers.2,3 Private insurance paid for 63% of patient visits to ObGyns in 2013.1
Fewer ObGyns indicated they would see Medicare and Medicaid patients. In 2013, 20% of self-employed and 5% of employed ObGyns said that they plan to stop taking new Medicare or Medicaid patients. More employed (72%) than self-employed (46%) ObGyns reported that they would continue seeing new and current Medicare and Medicaid patients.1
Related article: Medicare and Medicaid are on the brink of insolvency, and you’re not just a bystander. Robert L. Barbieri, MD (Editorial; October 2011)
In 2012, 15% of ObGyn respondents planned to stop taking new Medicare or Medicaid patients, but 53% of ObGyn respondents said they would continue to see current patients and would take on new Medicare or Medicaid patients.2,3
TELL US WHAT YOU THINK! Share your thoughts on this article. Send your Letter to the Editor to: rbarbieri@frontlinemedcom.com
- Peckham C. Medscape OB/GYN Compensation Report 2014. Medscape Web site. http://www.medscape.com/features/slideshow/compensation/2014/womenshealth. Published April 15, 2014. Accessed June 2, 2014.
- Medscape News. Ob/Gyn Compensation Report 2013. Medscape Web site. http://www.medscape.com/features/slideshow/compensation/2013/womenshealth. Accessed June 30, 2013.
- Reale D. Mean income for ObGyns increased in 2012. OBG Manag. 2013;25(8):34–36.
- Kane L. Employed vs self-employed: Who is better off? Medscape Web site. http://www.medscape.com/features/slideshow/public/employed-doctors. Published March 11, 2014. Accessed June 2, 2014.
The 2014 Medscape Compensation Report surveyed more than 24,000 physicians in 25 specialties. Five percent of respondents were ObGyns, whose mean income rose slightly to $243,000 in 2013 from $242,000 in 2012, up from $220,000 in 2011.1–3 The highest ObGyn earners lived in the Great Lakes and North Central regions.1
Survey findings
Men make more than women. In 2013, male ObGyns reported earning $256,000; female ObGyns reported $229,000 in mean income. However, women felt more satisfied with their salary (47% of women vs 38% of men). Regardless of gender, ObGyns were slightly less happy with their income than all physicians (50% satisfied).1
Among all female physicians, more were employed than self-employed; the opposite was true for male physicians.4 Half of all graduating physicians are now female, and demographics show that 62% of all female physicians are younger than age 45.1
Practice settings are key to income. Sixty percent of ObGyns indicated they would choose medicine again as a career; 43% would choose their own specialty. However, only 25% of ObGyns would make the same decision about practice setting.1
In 2013, employed and self-employed ObGyns reported nearly the same mean income: $243,000 versus $246,000, respectively. However, when broken down by specific practice setting, the highest earners were ObGyns who worked for health-care organizations, at $273,000. Additional 2013 mean earnings ranked by work setting were1:
- multispecialty office-based group practices, $271,000
- single-specialty office-based group practices, $255,000
- hospitals, $228,000
- solo office-based practices, $212,000
- outpatient clinics, $207,000.
In 2013, 49% of employed physicians worked in hospitals or in groups owned by a hospital, while 21% were employed by private groups. Other employment situations included community health centers, corporate laboratories, correction institutions, military bases, and nursing homes.4
ACO participation grows. In 2013, 37% of ObGyns either participated in an Accountable Care Organization (ACO) or planned on joining an ACO within the next year.1 This was an increase from 25% in 2012.2,3
In the most recent report, 2% chose concierge practices (also known as direct primary care) and 5% opted for cash-only practices.1 In 2012, only 1% of ObGyns opted for concierge practices, and 3% for cash-only practices.2,3
Related article: Is private ObGyn practice on its way out? Lucia DiVenere, MA (October 2011)
Employment over private practice? In 2013, physicians were enticed to seek employment by the financial challenges of private practice (38%); not having to be concerned about administrative issues (29%); and working shorter and more regular hours (19%). Other reported benefits of employment were academic opportunities, better life−work balance, more vacation time, and no loss of income during vacation. More than half (53%) of employed physicians who were previously self-employed felt that patient care was superior now that they were employed, and 37% thought it was about the same.4
Related article: Mean income for ObGyns increased in 2012. Deborah Reale (News for your Practice; August 2013)
Career satisfaction
ObGyns were close to the bottom among all physicians (48%) when it came to overall career satisfaction, tied with nephrologists, surgeons, and pulmonologists. The most satisfied physicians were dermatologists (65%); the least satisfied were plastic surgeons (45%).1
What drives you? In 2013, more ObGyns (41%) than all physicians (33%) reported that the most rewarding part of their job was their relationships with patients. Thirty percent of ObGyns chose being good at their jobs; 8% chose making good money; and 2% found nothing rewarding about the job.1
How much patient time do you spend? The majority (58%) of ObGyns reported spending more than 40 hours per week with patients and 16 minutes or less (66%) per patient.1 In 2012, 60% of ObGyn respondents reported spending 16 minutes or less per patient.2,3
Anticipating the effects of the Affordable Care Act
Under the Affordable Care Act (ACA), an organization’s revenue will still be determined largely by the volume generated by physicians. The percentage of ObGyns who saw 50 to 124 patients per week increased from 57% in 2012 to 69% in 2013 (TABLE).1,2
In 2013, 53% of ObGyns still were undecided about health-insurance exchange participation—the same percentage as all survey respondents. Among ObGyns, 30% would participate, and 17% would not participate.1
Related article: As the Affordable Care Act comes of age, a look behind the headlines. Lucia DiVenere, MA (Practice Management; January 2014)
Almost half (49%) of ObGyns expect their income under the ACA to decrease. About 45% of ObGyns did not foresee any change, and 5% believed their incomes would increase (1% didn’t know) under the ACA. ObGyns also anticipated a higher workload, a decline in quality of patient care and access, and reduced ability to make decisions.1
Almost one-third of ObGyns dropped poorly paying insurers. In 2013, 29% of ObGyns said they regularly drop insurers who pay poorly, but 46% said they keep their insurers year after year. In 2012, 26% of ObGyns said they drop insurers who pay the least or create the most trouble; 29% said they keep all insurers.2,3 Private insurance paid for 63% of patient visits to ObGyns in 2013.1
Fewer ObGyns indicated they would see Medicare and Medicaid patients. In 2013, 20% of self-employed and 5% of employed ObGyns said that they plan to stop taking new Medicare or Medicaid patients. More employed (72%) than self-employed (46%) ObGyns reported that they would continue seeing new and current Medicare and Medicaid patients.1
Related article: Medicare and Medicaid are on the brink of insolvency, and you’re not just a bystander. Robert L. Barbieri, MD (Editorial; October 2011)
In 2012, 15% of ObGyn respondents planned to stop taking new Medicare or Medicaid patients, but 53% of ObGyn respondents said they would continue to see current patients and would take on new Medicare or Medicaid patients.2,3
TELL US WHAT YOU THINK! Share your thoughts on this article. Send your Letter to the Editor to: rbarbieri@frontlinemedcom.com
- Peckham C. Medscape OB/GYN Compensation Report 2014. Medscape Web site. http://www.medscape.com/features/slideshow/compensation/2014/womenshealth. Published April 15, 2014. Accessed June 2, 2014.
- Medscape News. Ob/Gyn Compensation Report 2013. Medscape Web site. http://www.medscape.com/features/slideshow/compensation/2013/womenshealth. Accessed June 30, 2013.
- Reale D. Mean income for ObGyns increased in 2012. OBG Manag. 2013;25(8):34–36.
- Kane L. Employed vs self-employed: Who is better off? Medscape Web site. http://www.medscape.com/features/slideshow/public/employed-doctors. Published March 11, 2014. Accessed June 2, 2014.

Paroxetine mesylate 7.5 mg found to be a safe alternative to hormone therapy for menopausal women with hot flashes
The US Food and Drug Administration (FDA) recently approved paroxetine mesylate 7.5 mg (Brisdelle) for the treatment of moderate to severe menopausal vasomotor symptoms (VMS). Paroxetine, formerly known as low-dose mesylate salt of paroxetine (LDMP), is a nonhormonal agent, which makes it an alternative hot flash therapy for menopausal women who cannot or do not want to use hormones. Paroxetine mesylate (Pexeva, Brisdelle) and paroxetine hydrochloride (Paxil, and generics) are two salts of the same active compound (paroxetine). They may have somewhat different metabolism.
The efficacy and safety of paroxetine mesylate, a selective serotonin-reuptake inhibitor (SSRI), were evaluated individually in three Phase 2 or 3 multicenter, double-blind, randomized, placebo-controlled trials, published by James Simon, MD, from George Washington University School of Medicine, and colleagues,1 and Joffe and colleagues.2 Most treatment-emergent adverse events (TEAEs) in the individual studies were mild or moderate in severity, with minimal acute discontinuation symptoms reported on treatment cessation.
In a study3 presented April 29, at the 2014 Annual Clinical Meeting of The American College of Obstetricians and Gynecologists (ACOG) in Chicago, Illinois, Simon and colleagues further reported on the overall tolerability and safety profile of paroxetine mesylate 7.5 mg using pooled data from the three randomized trials. In their post-hoc analyses, they specifically examined the emergence of adverse events linked to the use of SSRIs when prescribed for psychiatric disorders at therapeutically higher doses than 7.5 mg. The adverse events focused on included weight gain, decreased libido, and sleep disturbance, as well as suicidality, abnormal bleeding, and bone fracture.
Study details. A total of 1,276 postmenopausal women (approximately 70% white) aged 40 years or older (median age, 54 years) with moderate to severe VMS (7−8 hot flashes/day; 50−60 hot flashes/wk) received either paroxetine mesylate or placebo at bedtime for 8 (Phase 2), 12 (Phase 3), or 24 (Phase 3) weeks. The study was sponsored by Noven Therapeutics, LLC.
Treatment-emergent adverse events and discontinuation
About half (50.4%) of the 635 women in the paroxetine group and 47.0% of the 641 women in the placebo group reported at least one TEAE. Most commonly reported TEAEs in the paroxetine group (reported in ≥2% of patients and with a twofold or higher frequency than in the placebo group) were nausea, fatigue, and dizziness.
TEAEs that were determined to be related to the study drug were reported in 19.5% in the paroxetine group and in 17.6% in the placebo group. These most frequent TEAEs were fatigue, nausea, dizziness, and diarrhea.
Severe AEs were reported in 3.9% and 3.6% of women in the paroxetine and placebo groups, respectively, although the investigator determined that less than 1% were related to paroxetine treatment.
TEAEs that led to discontinuation occurred in 4.7% of paroxetine-treated women and in 3.7% of placebo-treated women, although the incidence of study drug interruptions from TEAEs was similar (0.9%) between treatments. The most frequent adverse reactions leading to discontinuation in the paroxetine arm were abdominal pain (0.3%), attention disturbances (0.3%), headache (0.3%), and suicidal ideation (0.3%).
Of the most common AEs, nausea occurred mainly within the first 4 weeks of treatment; fatigue occurred primarily within the first week of treatment and decreased in frequency with continued therapy. Incidences and types of AEs that began after 12 weeks were similar to those that began during the first 12 weeks of treatment.
AEs related to SSRIs not found to be problematic
No differences were found between groups with regard to TEAEs related to weight, libido, or sleep. No clinically meaningful changes in laboratory values, vital signs, or ECGs were observed with either group. No clinically important findings on abnormal bleeding, bone fracture, or suicidality were evident in the paroxetine arm.
In the Phase 3 studies:
- One suicide attempt was reported in the paroxetine group in the 24-week study, but was determined by investigators to be unrelated to treatment
- Incidence rates of gastrointestinal and other bleeding events were similar between groups
- Five bone fractures were reported: One in the paroxetine group and four among three participants in the placebo group.
One death occurred in the 12-week Phase 3 study due to acute respiratory failure with evidence of hypertension-mediated pulmonary edema and hypertensive cardiovascular disease. The investigator did not consider the death to be related to the study drug.
Study conclusion
The authors concluded that paroxetine 7.5 mg had favorable tolerability in menopausal women with moderate to severe VMS.
“Paroxetine 7.5 mg offers a nonhormonal treatment option for women who seek treatment for moderate to severe hot flashes associated with menopause,” said Dr. Simon.3
Tell us what you think! Send your Letter to the Editor: rbarbieri@frontlinemedcom.com
1. Simon JA, et al. Low dose paroxetine 7.5 mg for menopausal vasomotor symptoms: two randomized controlled trials. Menopause. 2013;20(10):1027–1035.
2. Joffe H et al. Low-dose mesylate salt of paroxetine (LDMP) in treatment of vasomotor symptoms (VMS) in menopause. Presented at: 2012 Annual Clinical Meeting of The American College of Obstetricians and Gynecologists; May 7, 2012; San Diego, CA. Poster 43.
3. Simon JA, Portman DJ, Kazempour K, Mekonnen H, Bhaskar S, Lippman J. Safety profile of paroxetine 7.5 mg in women with moderate to severe vasomotor symptoms. Poster presented at: 2014 Annual Clinical Meeting of The American College of Obstetricians and Gynecologists (ACOG); April 26–30, 2014; Chicago, IL.
The US Food and Drug Administration (FDA) recently approved paroxetine mesylate 7.5 mg (Brisdelle) for the treatment of moderate to severe menopausal vasomotor symptoms (VMS). Paroxetine, formerly known as low-dose mesylate salt of paroxetine (LDMP), is a nonhormonal agent, which makes it an alternative hot flash therapy for menopausal women who cannot or do not want to use hormones. Paroxetine mesylate (Pexeva, Brisdelle) and paroxetine hydrochloride (Paxil, and generics) are two salts of the same active compound (paroxetine). They may have somewhat different metabolism.
The efficacy and safety of paroxetine mesylate, a selective serotonin-reuptake inhibitor (SSRI), were evaluated individually in three Phase 2 or 3 multicenter, double-blind, randomized, placebo-controlled trials, published by James Simon, MD, from George Washington University School of Medicine, and colleagues,1 and Joffe and colleagues.2 Most treatment-emergent adverse events (TEAEs) in the individual studies were mild or moderate in severity, with minimal acute discontinuation symptoms reported on treatment cessation.
In a study3 presented April 29, at the 2014 Annual Clinical Meeting of The American College of Obstetricians and Gynecologists (ACOG) in Chicago, Illinois, Simon and colleagues further reported on the overall tolerability and safety profile of paroxetine mesylate 7.5 mg using pooled data from the three randomized trials. In their post-hoc analyses, they specifically examined the emergence of adverse events linked to the use of SSRIs when prescribed for psychiatric disorders at therapeutically higher doses than 7.5 mg. The adverse events focused on included weight gain, decreased libido, and sleep disturbance, as well as suicidality, abnormal bleeding, and bone fracture.
Study details. A total of 1,276 postmenopausal women (approximately 70% white) aged 40 years or older (median age, 54 years) with moderate to severe VMS (7−8 hot flashes/day; 50−60 hot flashes/wk) received either paroxetine mesylate or placebo at bedtime for 8 (Phase 2), 12 (Phase 3), or 24 (Phase 3) weeks. The study was sponsored by Noven Therapeutics, LLC.
Treatment-emergent adverse events and discontinuation
About half (50.4%) of the 635 women in the paroxetine group and 47.0% of the 641 women in the placebo group reported at least one TEAE. Most commonly reported TEAEs in the paroxetine group (reported in ≥2% of patients and with a twofold or higher frequency than in the placebo group) were nausea, fatigue, and dizziness.
TEAEs that were determined to be related to the study drug were reported in 19.5% in the paroxetine group and in 17.6% in the placebo group. These most frequent TEAEs were fatigue, nausea, dizziness, and diarrhea.
Severe AEs were reported in 3.9% and 3.6% of women in the paroxetine and placebo groups, respectively, although the investigator determined that less than 1% were related to paroxetine treatment.
TEAEs that led to discontinuation occurred in 4.7% of paroxetine-treated women and in 3.7% of placebo-treated women, although the incidence of study drug interruptions from TEAEs was similar (0.9%) between treatments. The most frequent adverse reactions leading to discontinuation in the paroxetine arm were abdominal pain (0.3%), attention disturbances (0.3%), headache (0.3%), and suicidal ideation (0.3%).
Of the most common AEs, nausea occurred mainly within the first 4 weeks of treatment; fatigue occurred primarily within the first week of treatment and decreased in frequency with continued therapy. Incidences and types of AEs that began after 12 weeks were similar to those that began during the first 12 weeks of treatment.
AEs related to SSRIs not found to be problematic
No differences were found between groups with regard to TEAEs related to weight, libido, or sleep. No clinically meaningful changes in laboratory values, vital signs, or ECGs were observed with either group. No clinically important findings on abnormal bleeding, bone fracture, or suicidality were evident in the paroxetine arm.
In the Phase 3 studies:
- One suicide attempt was reported in the paroxetine group in the 24-week study, but was determined by investigators to be unrelated to treatment
- Incidence rates of gastrointestinal and other bleeding events were similar between groups
- Five bone fractures were reported: One in the paroxetine group and four among three participants in the placebo group.
One death occurred in the 12-week Phase 3 study due to acute respiratory failure with evidence of hypertension-mediated pulmonary edema and hypertensive cardiovascular disease. The investigator did not consider the death to be related to the study drug.
Study conclusion
The authors concluded that paroxetine 7.5 mg had favorable tolerability in menopausal women with moderate to severe VMS.
“Paroxetine 7.5 mg offers a nonhormonal treatment option for women who seek treatment for moderate to severe hot flashes associated with menopause,” said Dr. Simon.3
Tell us what you think! Send your Letter to the Editor: rbarbieri@frontlinemedcom.com
1. Simon JA, et al. Low dose paroxetine 7.5 mg for menopausal vasomotor symptoms: two randomized controlled trials. Menopause. 2013;20(10):1027–1035.
2. Joffe H et al. Low-dose mesylate salt of paroxetine (LDMP) in treatment of vasomotor symptoms (VMS) in menopause. Presented at: 2012 Annual Clinical Meeting of The American College of Obstetricians and Gynecologists; May 7, 2012; San Diego, CA. Poster 43.
3. Simon JA, Portman DJ, Kazempour K, Mekonnen H, Bhaskar S, Lippman J. Safety profile of paroxetine 7.5 mg in women with moderate to severe vasomotor symptoms. Poster presented at: 2014 Annual Clinical Meeting of The American College of Obstetricians and Gynecologists (ACOG); April 26–30, 2014; Chicago, IL.
FDA Advisory Committee recommends HPV test as primary screening tool for cervical cancer
The US Food and Drug Administration (FDA) Microbiology Devices Panel of the Medical Devices Advisory Committee has unanimously recommended that the cobas HPV (human papillomavirus) test be used as a first-line primary screening tool in women aged 25 years and older to assess their risk of cervical cancer based on the presence of clinically relevant high-risk HPV DNA. The committee’s recommendation indicates that the benefits outweigh the risks of the test, and that the cobas HPV test is safe and effective for the proposed indication for use.1
If approved by the FDA, the cobas HPV test would become the “first and only HPV test indicated as the first-line primary screen of cervical cancer in the United States.”2 Although the FDA is not required to follow the Advisory Committee’s recommendation, it takes the advice into consideration.
Data behind the recommendation
The Advisory Committee’s recommendation is supported by data from the ATHENA study, which included more than 47,000 women – the largest US-based registration study for cervical cancer screening. Data show that when the cobas HPV test was used as the primary test and Pap cytology as a secondary test, significantly more cervical disease was detected compared with Pap screening alone.2
“Through technological and scientific advancement, we now have a better screening tool for cervical cancer. Women around the world deserve the best tool to know their risk and reduce their chances of developing cervical cancer,” said Roland Diggelmann, COO for the Division of Roche Diagnostics, the company who developed and manufactures the test. “We look forward to working with the FDA and medical community to support the growing understanding and awareness of the role that HPV plays in cervical disease, and the importance of the cobas HPV test, which provides the necessary medical benefit to become the first-line test in a cervical cancer screening strategy.”2
How could current practice change as a result of final FDA approval?
The cobas HPV test is currently FDA-approved for co-testing with the Pap smear in women older than age 30 for cervical cancer screening, and for screening patients aged 21 and older with abnormal cervical cytology results.
Mark H. Einstein, MD, MS, chair of the cervical cancer education efforts of the Foundation for Women’s Cancer and professor of obstetrics and gynecology at Albert Einstein Cancer Center and Montefiore Medical Center in Bronx, New York, says final approval of this testing as a primary screening tool represents significant changes to clinical practice. However, “similar to what happened when co-testing [with the cobas HPV test] was approved, it took time for scientific stakeholding groups to update clinical guidelines, then years before clinicians adopted it into routine practice.”
“Unlike a new prescription, clinical algorithms tend to be 'hard-wired' into clinicians heads, and adopting significant change is a process,” Einstein says. “It’s likely that a new cervical cancer screening testing clinical algorithm would be adopted by some clinicians early and by many clinicians over time.” He added that the Society of Gynecologic Oncologists and the American Society for Colposcopy and Cervical Pathology have an interim clinical guidance document currently drafted, and those guidelines will be released soon after any decisions by the FDA.
When that time comes (assuming final FDA approval is received), Einstein says, “some clinical settings will be able to start with the more sensitive HPV test. For some patients, this will be followed by genotyping or cytology. This has been shown to be an effective strategy for honing in on the most at-risk women in a screening population.”
- FDA Executive Summary: March 12, 2014. 2014 Meeting Materials of the Microbiology Devices Panel. FDA Web site. http://www.fda.gov/downloads/AdvisoryCommittees/CommitteesMeetingMaterials/MedicalDevices/MedicalDevicesAdvisoryCommittee/MicrobiologyDevicesPanel/UCM388564.pdf. Accessed March 14, 2014.
- FDA Advisory Committee unanimously recommends Roche's HPV Test as primary screening tool for detection of women at high risk for cervical cancer [media release]. http://www.roche.com/media/media_releases/med-cor-2014-03-13.htm. Published March 13, 2014. Accessed March 14, 2014.
The US Food and Drug Administration (FDA) Microbiology Devices Panel of the Medical Devices Advisory Committee has unanimously recommended that the cobas HPV (human papillomavirus) test be used as a first-line primary screening tool in women aged 25 years and older to assess their risk of cervical cancer based on the presence of clinically relevant high-risk HPV DNA. The committee’s recommendation indicates that the benefits outweigh the risks of the test, and that the cobas HPV test is safe and effective for the proposed indication for use.1
If approved by the FDA, the cobas HPV test would become the “first and only HPV test indicated as the first-line primary screen of cervical cancer in the United States.”2 Although the FDA is not required to follow the Advisory Committee’s recommendation, it takes the advice into consideration.
Data behind the recommendation
The Advisory Committee’s recommendation is supported by data from the ATHENA study, which included more than 47,000 women – the largest US-based registration study for cervical cancer screening. Data show that when the cobas HPV test was used as the primary test and Pap cytology as a secondary test, significantly more cervical disease was detected compared with Pap screening alone.2
“Through technological and scientific advancement, we now have a better screening tool for cervical cancer. Women around the world deserve the best tool to know their risk and reduce their chances of developing cervical cancer,” said Roland Diggelmann, COO for the Division of Roche Diagnostics, the company who developed and manufactures the test. “We look forward to working with the FDA and medical community to support the growing understanding and awareness of the role that HPV plays in cervical disease, and the importance of the cobas HPV test, which provides the necessary medical benefit to become the first-line test in a cervical cancer screening strategy.”2
How could current practice change as a result of final FDA approval?
The cobas HPV test is currently FDA-approved for co-testing with the Pap smear in women older than age 30 for cervical cancer screening, and for screening patients aged 21 and older with abnormal cervical cytology results.
Mark H. Einstein, MD, MS, chair of the cervical cancer education efforts of the Foundation for Women’s Cancer and professor of obstetrics and gynecology at Albert Einstein Cancer Center and Montefiore Medical Center in Bronx, New York, says final approval of this testing as a primary screening tool represents significant changes to clinical practice. However, “similar to what happened when co-testing [with the cobas HPV test] was approved, it took time for scientific stakeholding groups to update clinical guidelines, then years before clinicians adopted it into routine practice.”
“Unlike a new prescription, clinical algorithms tend to be 'hard-wired' into clinicians heads, and adopting significant change is a process,” Einstein says. “It’s likely that a new cervical cancer screening testing clinical algorithm would be adopted by some clinicians early and by many clinicians over time.” He added that the Society of Gynecologic Oncologists and the American Society for Colposcopy and Cervical Pathology have an interim clinical guidance document currently drafted, and those guidelines will be released soon after any decisions by the FDA.
When that time comes (assuming final FDA approval is received), Einstein says, “some clinical settings will be able to start with the more sensitive HPV test. For some patients, this will be followed by genotyping or cytology. This has been shown to be an effective strategy for honing in on the most at-risk women in a screening population.”
- FDA Executive Summary: March 12, 2014. 2014 Meeting Materials of the Microbiology Devices Panel. FDA Web site. http://www.fda.gov/downloads/AdvisoryCommittees/CommitteesMeetingMaterials/MedicalDevices/MedicalDevicesAdvisoryCommittee/MicrobiologyDevicesPanel/UCM388564.pdf. Accessed March 14, 2014.
- FDA Advisory Committee unanimously recommends Roche's HPV Test as primary screening tool for detection of women at high risk for cervical cancer [media release]. http://www.roche.com/media/media_releases/med-cor-2014-03-13.htm. Published March 13, 2014. Accessed March 14, 2014.