User login
Price Display Systematic Review
Rising healthcare spending has garnered significant public attention, and is considered a threat to other national priorities. Up to one‐third of national health expenditures are wasteful, the largest fraction generated through unnecessary services that could be substituted for less‐costly alternatives or omitted altogether.[1] Physicians play a central role in health spending, as they purchase nearly all tests and therapies on behalf of patients.
One strategy to enhance cost‐conscious physician ordering is to increase transparency of cost data for providers.[2, 3, 4] Although physicians consider price an important factor in ordering decisions, they have difficulty estimating costs accurately or finding price information easily.[5, 6] Improving physicians' knowledge of order costs may prompt them to forego diagnostic tests or therapies of low utility, or shift ordering to lower‐cost alternatives. Real‐time price display during provider order entry is 1 approach for achieving this goal. Modern electronic health records (EHRs) with computerized physician order entry (CPOE) make price display not only practical but also scalable. Integrating price display into clinical workflow, however, can be challenging, and there remains lack of clarity about potential risks and benefits. The dissemination of real‐time CPOE price display, therefore, requires an understanding of its impact on clinical care.
Over the past 3 decades, several studies in the medical literature have evaluated the effect of price display on physician ordering behavior. To date, however, there has been only 1 narrative review of this literature, which did not include several recent studies on the topic or formally address study quality and physician acceptance of price display modules.[7] Therefore, to help inform healthcare leaders, technology innovators, and policy makers, we conducted a systematic review to address 4 key questions: (1) What are the characteristics of interventions that have displayed order prices to physicians in the context of actual practice? (2) To what degree does real‐time display of order prices impact order costs and order volume? (3) Does price display impact patient safety outcomes, and is it acceptable to providers? (4) What is the quality of the current literature on this topic?
METHODS
Data Sources
We searched 2 electronic databases, MEDLINE and Embase, using a combination of controlled vocabulary terms and keywords that covered both the targeted intervention (eg, fees and charges) and the outcome of interest (eg, physician's practice patterns), limited to English language articles with no restriction on country or year of publication (see Supporting Information, Appendix 1, in the online version of this article). The search was run through August 2014. Results from both database searches were combined and duplicates eliminated. We also ran a MEDLINE keyword search on titles and abstracts of articles from 2014 that were not yet indexed. A medical librarian was involved in all aspects of the search process.[8]
Study Selection
Studies were included if they evaluated the effect of displaying actual order prices to providers during the ordering process and reported the impact on provider ordering practices. Reports in any clinical context and with any study design were included. To assess most accurately the effect of price display on real‐life ordering and patient outcomes, studies were excluded if: (1) they were review articles, commentaries, or editorials; (2) they did not show order prices to providers; (3) the context was a simulation; (4) the prices displayed were relative (eg, $/$$/$$$) or were only cumulative; (5) prices were not presented real‐time during the ordering process; or (6) the primary outcome was neither order costs nor order volume. We decided a priori to exclude simulations because these may not accurately reflect provider behavior when treating real patients, and to exclude studies showing relative prices due to concerns that it is a less significant price transparency intervention and that providers may interpret relative prices differently from actual prices.
Two reviewers, both physicians and health service researchers (M.T.S. and T.R.B.), separately reviewed the full list of titles and abstracts. For studies that potentially met inclusion criteria, full articles were obtained and were independently read for inclusion in the final review. The references of all included studies were searched manually, and the Scopus database was used to search all studies that cited the included studies. We also searched the references of relevant literature reviews.[9, 10, 11] Articles of interest discovered through manual search were then subjected to the same process.
Data Extraction and Quality Assessment
Two reviewers (M.T.S. and T.R.B.) independently performed data extraction using a standardized spreadsheet. Discrepancies were resolved by reviewer consensus. Extracted study characteristics included study design and duration, clinical setting, study size, type of orders involved, characteristics of price display intervention and control, and type of outcome. Findings regarding patient safety and provider acceptability were also extracted when available.
Study quality was independently evaluated and scored by both reviewers using the Downs and Black checklist, designed to assess quality of both randomized and nonrandomized studies.[12] The checklist contains 5 items pertaining to allocation concealment, blinding, or follow‐up that are not applicable to an administrative intervention like price display, so these questions were excluded. Additionally, few studies calculated sample size or reported post hoc statistical power, so we also excluded this question, leaving a modified 21‐item checklist. We also assessed each study for sources of bias that were not already assessed by the Downs and Black checklist, including contamination between study groups, confounding of results, and incomplete intervention or data collection.
Data Synthesis
Data are reported in tabular form for all included studies. Due to heterogeneity of study designs and outcome measures, data from the studies were not pooled quantitatively. This review is reported according to the Preferred Reporting Items for Systematic Reviews and Meta‐Analysis guidelines.
RESULTS
Database searches yielded a total of 1400 articles, of which 18 were selected on the basis of title and abstract for detailed assessment. Reference searching led us to retrieve 94 further studies of possible interest, of which 23 were selected on the basis of abstract for detailed assessment. Thus, 41 publications underwent full manuscript review, 19 of which met all inclusion criteria (see Supporting Information, Appendix 2, in the online version of this article).[13, 14, 15, 16, 17, 18, 19, 20, 21, 22, 23, 24, 25, 26, 27, 28, 29, 30, 31] These studies were published between 1983 and 2014, and were conducted primarily in the United States.
Study Characteristics
There was considerable heterogeneity among the 19 studies with regard to design, setting, and scope (Table 1). There were 5 randomized trials, for which the units of randomization were patient (1), provider team (2), and test (2). There were 13 pre‐post intervention studies, 5 of which used a concomitant control group, and 2 of which included a washout period. There was 1 interrupted time series study. Studies were conducted within inpatient hospital floors (8), outpatient clinics (4), emergency departments (ED) or urgent care facilities (4), and hospital operating rooms (3).
| Study | Design | Clinical Setting | Providers | Intervention and Duration | Order(s) Studied | Type of Price Displayed | Concurrent Interventions |
|---|---|---|---|---|---|---|---|
| |||||||
| Fang et al.[14] 2014 | Pre‐post study with control group | Academic hospital (USA) | All inpatient ordering providers | CPOE system with prices displayed for reference lab tests; 8 months | All send‐out lab tests | Charge from send‐out laboratory, displayed as range (eg, $100300) | Display also contained expected lab turnaround time |
| Nougon et al.[13] 2014 | Pre‐post study with washout | Academic adult emergency department (Belgium) | 9 ED house staff | CPOE system with prices displayed on common orders form, and price list displayed above all workstations and in patient rooms; 2 months | Common lab and imaging tests | Reference costs from Belgian National Institute for Health Insurance and Invalidity | None |
| Durand et al.[17] 2013 | RCT (randomized by test) | Academic hospital, all inpatients (USA) | All inpatient ordering providers | CPOE system with prices displayed; 6 months | 10 common imaging tests | Medicare allowable fee | None |
| Feldman et al.[16] 2013 | RCT (randomized by test) | Academic hospital, all inpatients (USA) | All inpatient ordering providers | CPOE system with prices displayed; 6 months | 61 lab tests | Medicare allowable fee | None |
| Horn et al.[15] 2014 | Interrupted time series study with control group | Private outpatient group practice alliance (USA) | 215 primary care physicians | CPOE system with prices displayed; 6 months | 27 lab tests | Medicare allowable fee, displayed as narrow range (eg, $5$10) | None |
| Ellemdin et al.[18] 2011 | Pre‐post study with control group | Academic hospital, internal medicine units (South Africa) | Internal medicine physicians (number NR) | Sheet with lab test costs given to intervention group physicians who were required to write out cost for each order; 4 months | Common lab tests | Not reported | None |
| Schilling,[19] 2010 | Pre‐post study with control group | Academic adult emergency department (Sweden) | All internal medicine physicians in ED | Standard provider workstations with price lists posted on each; 2 months | 91 common lab tests, 39 common imaging tests | Not reported | None |
| Guterman et al.[21] 2002 | Pre‐post study | Academic‐affiliated urgent care clinic (USA) | 51 attendings and housestaff | Preformatted paper prescription form with medication prices displayed; 2 weeks | 2 H2‐blocker medications | Acquisition cost of medication plus fill fee | None |
| Seguin et al.[20] 2002 | Pre‐post study | Academic surgical intensive care unit (France) | All intensive care unit physicians | Paper quick‐order checklist with prices displayed; 2 months | 6 common lab tests, 1 imaging test | Not reported | None |
| Hampers et al.[23] 1999 | Pre‐post study with washout | Academic pediatric emergency department (USA) | Pediatric ED attendings and housestaff (number NR) | Paper common‐order checklist with prices displayed; 3 months | 22 common lab and imaging tests | Chargemaster price* | Physicians required to calculate total charges for diagnostic workup |
| Ornstein et al.[22] 1999 | Pre‐post study | Academic family medicine outpatient clinic (USA) | 46 attendings and housestaff | Microcomputer CPOE system with medication prices displayed; 6 months | All medications | AWP for total supply (acute medications) or 30‐day supply (chronic medications) | Additional keystroke produced list of less costly alternative medications |
| Lin et al.[25] 1998 | Pre‐post study | Academic hospital operating rooms (USA) | All anesthesia providers | Standard muscle relaxant drug vials with price stickers displayed; 12 months | All muscle relaxant medications | Not reported | None |
| McNitt et al.[24] 1998 | Pre‐post study | Academic hospital operating rooms (USA) | 90 anesthesia attendings, housestaff and anesthetists | List of drug costs displayed in operating rooms, anesthesia lounge, and anesthesia satellite pharmacy; 10 months | 22 common anesthesia medications | Hospital acquisition cost | Regular anesthesia department reviews of drug usage and cost |
| Bates et al.[27] 1997 | RCT (randomized by patient) | Academic hospital, medical and surgical inpatients (USA) | All inpatient ordering providers | CPOE system with display of test price and running total of prices for the ordering session; 4 months (lab) and 7 months (imaging) | All lab tests, 35 common imaging tests | Chargemaster price | None |
| Vedsted et al.[26] 1997 | Pre‐post study with control group | Outpatient general practices (Denmark) | 231 general practitioners | In practices already using APEX CPOE system, introduction of medication price display (control practices used non‐APEX computer system or paper‐based prescribing); 12 months | All medications | Chargemaster price | Medication price comparison module (stars indicated availability of cheaper option) |
| Horrow et al.[28] 1994 | Pre‐post study | Private tertiary care hospital operating rooms (USA) | 56 anesthesia attendings, housestaff and anesthetists | Standard anesthesia drug vials and syringes with supermarket price stickers displayed; 3 months | 13 neuromuscular relaxant and sedative‐hypnotic medications | Hospital acquisition cost | None |
| Tierney et al.[29] 1993 | Cluster RCT (randomized by provider team) | Public hospital, internal medicine services (USA) | 68 teams of internal medicine attendings and housestaff | Microcomputer CPOE system with prices displayed (control group used written order sheets); 17 months | All orders | Chargemaster price | CPOE system listed cost‐effective tests for common problems and displayed reasonable test intervals |
| Tierney et al.[30] 1990 | Cluster RCT (randomized by clinic session) | Academic, outpatient, general medicine practice (USA) | 121 internal medicine attendings and housestaff | Microcomputer CPOE system with pop‐up window displaying price for current test and running total of cumulative test prices for current visit; 6 months | All lab and imaging tests | Chargemaster price | None |
| Everett et al.[31] 1983 | Pre‐post study with control group | Academic hospital, general internal medicine wards (USA) | Internal medicine attendings and housestaff (number NR) | Written order sheet with adjacent sheet of lab test prices; 3 months | Common lab tests | Chargemaster price | None |
Prices were displayed for laboratory tests (12 studies), imaging tests (8 studies), and medications (7 studies). Study scope ranged from examining a single medication class to evaluating all inpatient orders. The type of price used for the display varied, with the most common being the facility charges or chargemaster prices (6 studies), and Medicare prices (3 studies). In several cases, price display was only 1 component of the study, and 6 studies introduced additional interventions concurrent with price display, such as cost‐effective ordering menus,[29] medication comparison modules,[26] or display of test turnaround times.[14] Seven of the 19 studies were conducted in the past decade, of which 5 displayed prices within an EHR.[13, 14, 15, 16, 17]
Order Costs and Volume
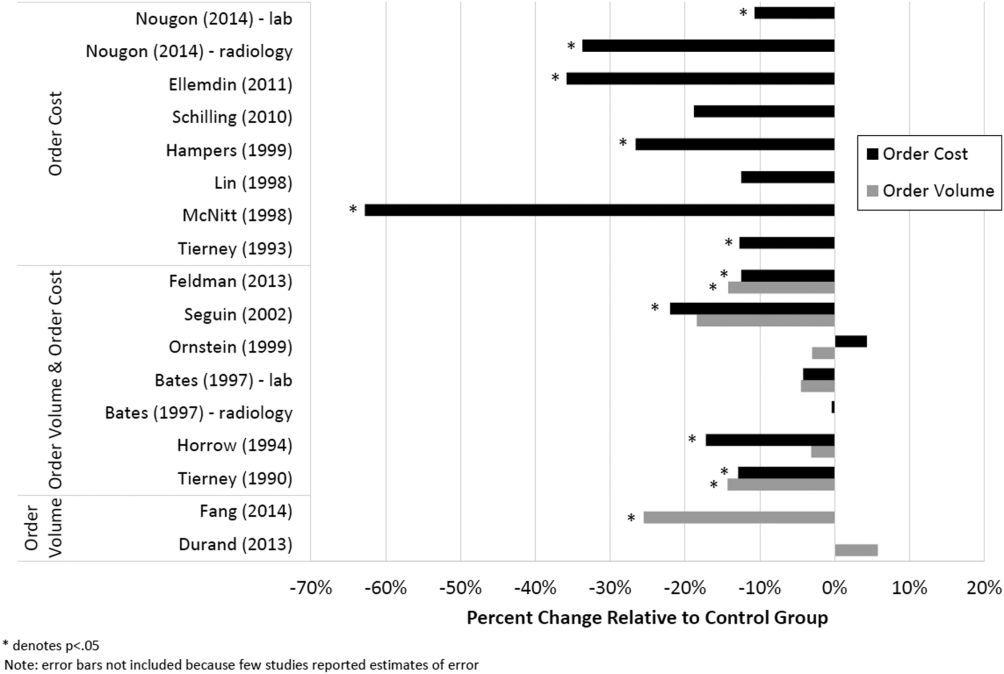
Thirteen studies reported the numeric impact of price display on aggregate order costs (Table 2). Nine of these demonstrated a statistically significant (P < 0.05) decrease in order costs, with effect sizes ranging from 10.7% to 62.8%.[13, 16, 18, 20, 23, 24, 28, 29, 30] Decreases were found for lab costs, imaging costs, and medication costs, and were observed in both the inpatient and outpatient settings. Three of these 9 studies were randomized. For example, in 1 study randomizing 61 lab tests to price display or no price display, costs for the intervention labs dropped 9.6% compared to the year prior, whereas costs for control labs increased 2.9% (P < 0.001).[16] Two studies randomized by provider group showed that providers seeing order prices accrued 12.7% fewer charges per inpatient admission (P = 0.02) and 12.9% fewer test charges per outpatient visit (P < 0.05).[29, 30] Three studies found no significant association between price display and order costs, with effect sizes ranging from a decrease of 18.8% to an increase of 4.3%.[19, 22, 27] These studies also evaluated lab, imaging, and medication costs, and included 1 randomized trial. One additional large study noted a 12.5% decrease in medication costs after initiation of price display, but did not statistically evaluate this difference.[25]
| Study | No. of Encounters | Primary Outcome Measure(s) | Impact on Order Costs | Impact on Order Volume | ||||
|---|---|---|---|---|---|---|---|---|
| Control Group Outcome | Intervention Group Outcome | Relative Change | Control Group Outcome | Intervention Group Outcome | Relative Change | |||
| ||||||||
| Fang et al.[14] 2014 | 378,890 patient‐days | Reference lab orders per 1000 patient‐days | NR | NR | NA | 51 orders/1000 patient‐days | 38 orders/1000 patient‐days | 25.5% orders/1000 patient‐days (P < 0.001) |
| Nougon et al.[13] 2015 | 2422 ED visits (excluding washout) | Lab and imaging test costs per ED visit | 7.1/visit (lab); 21.8/visit (imaging) | 6.4/visit (lab); 14.4/visit (imaging) | 10.7% lab costs/ visit (P = 0.02); 33.7% imaging costs/visit (P < 0.001) | NR | NR | NA |
| Durand et al.[17] 2013 | NR | Imaging orders compared to baseline 1 year prior | NR | NR | NA | 3.0% total orders | +2.8% total orders | +5.8% total orders (P = 0.10) |
| Feldman et al.[16] 2013 | 245,758 patient‐days | Lab orders and fees per patient‐day compared to baseline 1 year prior | +2.9% fees/ patient‐day | 9.6% fees/ patient‐day | 12.5% fees/patient‐day (P < 0.001) | +5.6% orders/patient‐day | 8.6% orders/ patient‐day | 14.2% orders/patient‐day (P < 0.001) |
| Horn et al.[15] 2014 | NR | Lab test volume per patient visit, by individual lab test | NR | NR | NA | Aggregate data not reported | Aggregate data not reported | 5 of 27 tests had significant reduction in ordering (2.1% to 15.2%/patient visit) |
| Ellemdin et al.[18] 2011 | 897 admissions | Lab cost per hospital day | R442.90/day | R284.14/day | 35.8% lab costs/patient‐day (P = 0.001) | NR | NR | NA |
| Schilling[19] 2010 | 3222 ED visits | Combined lab and imaging test costs per ED visit | 108/visit | 88/visit | 18.8% test costs/visit (P = 0.07) | NR | NR | NA |
| Guterman et al.[21] 2002 | 168 urgent care visits | Percent of acid reducer prescriptions for ranitidine (the higher‐cost option) | NR | NR | NA | 49% ranitidine | 21% ranitidine | 57.1% ranitidine (P = 0.007) |
| Seguin et al.[20] 2002 | 287 SICU admissions | Tests ordered per admission; test costs per admission | 341/admission | 266/admission | 22.0% test costs/admission (P < 0.05) | 13.6 tests/admission | 11.1 tests/ admission | 18.4% tests/admission (P = 0.12) |
| Hampers et al.[23] 1999 | 4881 ED visits (excluding washout) | Adjusted mean test charges per patient visit | $86.79/visit | $63.74/visit | 26.6% test charges/visit (P < 0.01) | NR | NR | NA |
| Ornstein et al.[22] 1999 | 30,461 outpatient visits | Prescriptions per visit; prescription cost per visit; cost per prescription | $12.49/visit; $21.83/ prescription | $13.03/visit; $22.03/prescription |
+4.3% prescription costs/visit (P = 0.12); +0.9% cost/prescription (P = 0.61) |
0.66 prescriptions/visit | 0.64 prescriptions/ visit | 3.0% prescriptions/visit (P value not reported) |
| Lin et al.[25] 1998 | 40,747 surgical cases | Annual spending on muscle relaxants medication |
$378,234/year (20,389 cases) |
$330,923/year (20,358 cases) |
12.5% | NR | NR | NA |
| McNitt et al.[24] 1998 | 15,130 surgical cases | Anesthesia drug cost per case | $51.02/case | $18.99/case | 62.8% drug costs/case (P < 0.05) | NR | NR | NA |
| Bates et al.[27] 1997 | 7090 admissions (lab); 17,381 admissions (imaging) | Tests ordered per admission; charges for tests ordered per admission |
$771/ admission (lab); $276/admission (imaging) |
$739/admission (lab); $275/admission (imaging) |
4.2% lab charges/admission (P = 0.97); 0.4% imaging charges/admission (P = 0.10) |
26.8 lab tests/admission; 1.76 imaging tests/admission |
25.6 lab tests/ admission; 1.76 imaging tests/ admission |
4.5% lab tests/admission (P = 0.74); 0% imaging tests/admission (P = 0.13) |
| Vedsted et al.[26] 1997 | NR | Prescribed daily doses per 1000 insured; total drug reimbursement per 1000 insured; reimbursement per daily dose | Reported graphically only | Reported graphically only | No difference | Reported graphically only | Reported graphically only | No difference |
| Horrow et al.[28] 1994 | NR | Anesthetic drugs used per week; anesthetic drug cost per week | $3837/week | $3179/week | 17.1% drug costs/week (P = 0.04) | 97 drugs/week | 94 drugs/week | 3.1% drugs/week (P = 0.56) |
| Tierney et al.[29] 1993 | 5219 admissions | Total charges per admission | $6964/admission | $6077/admission | 12.7% total charges/admission (P = 0.02) | NR | NR | NA |
| Tierney et al.[30] 1990 | 15,257 outpatient visits | Test orders per outpatient visit; test charges per outpatient visit | $51.81/visit | $45.13/visit | 12.9% test charges/visit (P < 0.05) | 1.82 tests/visit | 1.56 tests/visit | 14.3% tests/visit (P < 0.005) |
| Everett et al.[31] 1983 | NR | Lab tests per admission; charges per admission | NR | NR | NA | NR | NR | No statistically significant changes |
Eight studies reported the numeric impact of price display on aggregate order volume. Three of these demonstrated a statistically significant decrease in order volume, with effect sizes ranging from 14.2% to 25.5%.[14, 16, 30] Decreases were found for lab and imaging tests, and were observed in both inpatient and outpatient settings. For example, 1 pre‐post study displaying prices for inpatient send‐out lab tests demonstrated a 25.5% reduction in send‐out labs per 1000 patient‐days (P < 0.001), whereas there was no change for the control group in‐house lab tests, for which prices were not shown.[14] The other 5 studies reported no significant association between price display and order volume, with effect sizes ranging from a decrease of 18.4% to an increase of 5.8%.[17, 20, 22, 27, 28] These studies evaluated lab, imaging, and medication volume. One trial randomizing by individual inpatient showed a nonsignificant decrease of 4.5% in lab orders per admission in the intervention group (P = 0.74), although the authors noted that their study had insufficient power to detect differences less than 10%.[27] Of note, 2 of the 5 studies reporting nonsignificant impacts on order volume (3.1%, P = 0.56; and 18.4%, P = 0.12) did demonstrate significant decreases in order costs (17.1%, P = 0.04; and 22.0%, P < 0.05).[20, 28]
There were an additional 2 studies that reported the impact of price display on order volume for individual orders only. In 1 time‐series study showing lab test prices, there was a statistically significant decrease in order volume for 5 of 27 individual tests studied (using a Bonferroni‐adjusted threshold of significance), with no tests showing a significant increase.[15] In 1 pre‐post study showing prices for H2‐antagonist drugs, there was a statistically significant 57.1% decrease in order volume for the high‐cost medication, with a corresponding 58.7% increase in the low‐cost option.[21] These studies did not report impact on aggregate order costs. Two further studies in this review did not report outcomes numerically, but did state in their articles that significant impacts on order volume were not observed.[26, 31]
Therefore, of the 19 studies included in this review, 17 reported numeric results. Of these 17 studies, 12 showed that price display was associated with statistically significant decreases in either order costs or volume, either in aggregate (10 studies; Figure 1) or for individual orders (2 studies). Of the 7 studies conducted within the past decade, 5 noted significant decreases in order costs or volume. Prices were embedded into an EHR in 5 of these recent studies, and 4 of the 5 observed significant decreases in order costs or volume. Only 2 studies from the past decade1 from Belgium and 1 from the United Statesincorporated prices into an EHR and reported aggregate order costs. Both found statistically significant decreases in order costs with price display.[13, 16]
Patient Safety and Provider Acceptability
Five studies reported patient‐safety outcomes. One inpatient randomized trial showed similar rates of postdischarge utilization and charges between the intervention and control groups.[29] An outpatient randomized trial showed similar rates of hospital admissions, ED visits, and outpatient visits between the intervention and control groups.[30] Two pre‐post studies showing anesthesia prices in hospital operating rooms included a quality assurance review and showed no changes in adverse outcomes such as prolonged postoperative intubation, recovery room stay, or unplanned intensive care unit admissions.[24, 25] The only adverse safety finding was in a pre‐post study in a pediatric ED, which showed a higher rate of unscheduled follow‐up care during the intervention period compared to the control period (24.4% vs 17.8%, P < 0.01) but similar rates of patients feeling better (83.4% vs 86.7%, P = 0.05). These findings, however, were based on self‐report during telephone follow‐up with a 47% response rate.[23]
Five studies reported on provider acceptability of price display. Two conducted questionnaires as part of the study plan, whereas the other 3 offered general provider feedback. One questionnaire revealed that 83% of practices were satisfied or very satisfied with the price display.[26] The other questionnaire found that 81% of physicians felt the price display improved my knowledge of the relative costs of tests I order and similarly 81% would like additional cost information displayed for other orders.[15] Three studies reported subjectively that showing prices initially caused questions from most physicians,[13] but that ultimately, physicians like seeing this information[27] and gave feedback that was generally positive.[21] One study evaluated the impact of price display on provider cost knowledge. Providers in the intervention group did not improve in their cost‐awareness, with average errors in cost estimates exceeding 40% even after 6 months of price display.[30]
Study Quality
Using a modified Downs and Black checklist of 21 items, studies in this review ranged in scores from 5 to 20, with a median score of 15. Studies most frequently lost points for being nonrandomized, failing to describe or adjust for potential confounders, being prone to historical confounding, or not evaluating potential adverse events.
We supplemented this modified Downs and Black checklist by reviewing 3 categories of study limitations not well‐reflected in the checklist scoring (Table 3). The first was potential for contamination between study groups, which was a concern in 4 studies. For example, 1 pre‐post study assessing medication ordering included clinical pharmacists in patient encounters both before and after the price display intervention.[22] This may have enhanced cost‐awareness even before prices were shown. The second set of limitations, present in 12 studies, included confounders that were not addressed by study design or analysis. For example, the intervention in 1 study displayed not just test cost but also test turnaround time, which may have separately influenced providers against ordering a particular test.[14] The third set of limitations included unanticipated gaps in the display of prices or in the collection of ordering data, which occurred in 5 studies. If studies did not report on gaps in the intervention or data collection, we assumed there were none.
| Study | Modified Downs & Black Score (Max Score 21) | Other Price Display Quality Criteria (Not Included in Downs & Black Score) | ||
|---|---|---|---|---|
| Potential for Contamination Between Study Groups | Potential Confounders of Results Not Addressed by Study Design or Analysis | Incomplete Price Display Intervention or Data Collection | ||
| ||||
| Fang et al.[14] 2014 | 14 | None | Concurrent display of test turnaround time may have independently contributed to decreased test ordering | 21% of reference lab orders were excluded from analysis because no price or turnaround‐time data were available |
| Nougon et al.[13] 2015 | 16 | None | Historical confounding may have existed due to pre‐post study design without control group | None |
| Durand et al.[17] 2013 | 17 | Providers seeing test prices for intervention tests (including lab tests in concurrent Feldman study) may have remained cost‐conscious when placing orders for control tests | Interference between units likely occurred because intervention test ordering (eg, chest x‐ray) was not independent of control test ordering (eg, CT chest) | None |
| Feldman et al.[16] 2013 | 18 | Providers seeing test prices for intervention tests (including imaging tests in concurrent Durand study) may have remained cost‐conscious when placing orders for control tests | Interference between units likely occurred because intervention test ordering (eg, CMP) was not independent of control test ordering (eg, BMP) | None |
| Horn et al.[15] 2014 | 15 | None | None | None |
| Ellemdin et al.[18] 2011 | 15 | None | None | None |
| Schilling[19] 2010 | 12 | None | None | None |
| Guterman et al.[21] 2002 | 14 | None | Historical confounding may have existed due to pre‐post study design without control group | None |
| Seguin et al.[20] 2002 | 17 | None | Because primary outcome was not adjusted for length of stay, the 30% shorter average length of stay during intervention period may have contributed to decreased costs per admission; historical confounding may have existed due to pre‐post study design without control group | None |
| Hampers et al.[23] 1999 | 17 | None | Requirement that physicians calculate total charges for each visit may have independently contributed to decreased test ordering; historical confounding may have existed due to pre‐post study design without control group | 10% of eligible patient visits were excluded from analysis because prices were not displayed or ordering data were not collected |
| Ornstein et al.[22] 1999 | 15 | Clinical pharmacists and pharmacy students involved in half of all patient contacts may have enhanced cost‐awareness during control period | Emergence of new drugs during intervention period and an ongoing quality improvement activity to increase prescribing of lipid‐lowering medications may have contributed to increased medication costs; historical confounding may have existed due to pre‐post study design without control group | 25% of prescription orders had no price displayed, and average prices were imputed for purposes of analysis |
| Lin et al.[25] 1998 | 12 | None | Emergence of new drug during intervention period and changes in several drug prices may have contributed to decreased order costs; historical confounding may have existed due to pre‐post study design without control group | None |
| McNitt et al.[24] 1998 | 15 | None | Intensive drug‐utilization review and cost‐reduction efforts may have independently contributed to decreased drug costs; historical confounding may have existed due to pre‐post study design without control group | None |
| Bates et al.[27] 1997 | 18 | Providers seeing test prices on intervention patients may have remembered prices or remained cost‐conscious when placing orders for control patients | None | 47% of lab tests and 26% of imaging tests were ordered manually outside of the trial's CPOE display system* |
| Vedsted et al.[26] 1997 | 5 | None | Medication price comparison module may have independently influenced physician ordering | None |
| Horrow et al.[28] 1994 | 14 | None | Historical confounding may have existed due to pre‐post study design without control group | Ordering data for 2 medications during 2 of 24 weeks were excluded from analysis due to internal inconsistency in the data |
| Tierney et al.[29] 1993 | 20 | None | Introduction of computerized order entry and menus for cost‐effective ordering may have independently contributed to decreased test ordering | None |
| Tierney et al.[30] 1990 | 20 | None | None | None |
| Everett et al.[31] 1983 | 7 | None | None | None |
Even among the 5 randomized trials there were substantial limitations. For example, 2 trials used individual tests as the unit of randomization, although ordering patterns for these tests are not independent of each other (eg, ordering rates for comprehensive metabolic panels are not independent of ordering rates for basic metabolic panels).[16, 17] This creates interference between units that was not accounted for in the analysis.[32] A third trial was randomized at the level of the patient, so was subject to contamination as providers seeing the price display for intervention group patients may have remained cost‐conscious while placing orders for control group patients.[27] In a fourth trial, the measured impact of the price display may have been confounded by other aspects of the overall cost intervention, which included cost‐effective test menus and suggestions for reasonable testing intervals.[29]
The highest‐quality study was a cluster‐randomized trial published in 1990 specifically measuring the effect of price display on a wide range of orders.[30] Providers and patients were separated by clinic session so as to avoid contamination between groups, and the trial included more than 15,000 outpatient visits. The intervention group providers ordered 14.3% fewer tests than control group providers, which resulted in 12.9% lower charges.
DISCUSSION
We identified 19 published reports of interventions that displayed real‐time order prices to providers and evaluated the impact on provider ordering. There was substantial heterogeneity in study setting, design, and quality. Although there is insufficient evidence on which to base strong conclusions, these studies collectively suggest that provider price display likely reduces order costs to a modest degree. Data on patient safety were largely lacking, although in the few studies that examined patient outcomes, there was little evidence that patient safety was adversely affected by the intervention. Providers widely viewed display of prices positively.
Our findings align with those of a recent systematic review that concluded that real‐time price information changed provider ordering in the majority of studies.[7] Whereas that review evaluated 17 studies from both clinical settings and simulations, our review focused exclusively on studies conducted in actual ordering environments. Additionally, our literature search yielded 8 studies not previously reviewed. We believe that the alignment of our findings with the prior review, despite the differences in studies included, adds validity to the conclusion that price display likely has a modest impact on reducing order costs. Our review contains several additions important for those considering price display interventions. We provide detailed information on study settings and intervention characteristics. We present a formal assessment of study quality to evaluate the strength of individual study findings and to guide future research in this area. Finally, because both patient safety and provider acceptability may be a concern when prices are shown, we describe all safety outcomes and provider feedback that these studies reported.
The largest effect sizes were noted in 5 studies reporting decreases in order volume or costs greater than 25%.[13, 14, 18, 23, 24] These were all pre‐post intervention studies, so the effect sizes may have been exaggerated by historical confounding. However, the 2 studies with concurrent control groups found no decreases in order volume or cost in the control group.[14, 18] Among the 5 studies that did not find a significant association between price display and provider ordering, 3 were subject to contamination between study groups,[17, 22, 27] 1 was underpowered,[19] and 1 noted a substantial effect size but did not perform a statistical analysis.[25] We also found that order costs were more frequently reduced than order volume, likely because shifts in ordering to less expensive alternatives may cause costs to decrease while volume remains unchanged.[20, 28]
If price display reduces order costs, as the majority of studies in this review indicate, this finding carries broad implications. Policy makers could promote cost‐conscious care by creating incentives for widespread adoption of price display. Hospital and health system leaders could improve transparency and reduce expenses by prioritizing price display. The specific beneficiaries of any reduced spending would depend on payment structures. With shifts toward financial risk‐bearing arrangements like accountable care organizations, healthcare institutions may have a financial interest in adopting price display. Because price display is an administrative intervention that can be developed within EHRs, it is potentially 1 of the most rapidly scalable strategies for reducing healthcare spending. Even modest reductions in spending on laboratory tests, imaging studies, and medications would result in substantial savings on a system‐wide basis.
Implementing price display does not come without challenges. Prices need to be calculated or obtained, loaded into an EHR system, and updated periodically. Technology innovators could enhance EHR software by making these processes easier. Healthcare institutions may find displaying relative prices (eg, $/$$/$$$) logistically simpler in some contexts than showing actual prices (eg, purchase cost), such as when contracts require prices to be confidential. Although we decided to exclude studies displaying relative prices, our search identified no studies that met other inclusion criteria but displayed relative prices, suggesting a lack of evidence regarding the impact of relative price display as an alternative to actual price display.
There are 4 key limitations to our review. First, the heterogeneity of the study designs and reported outcomes precluded pooling of data. The variety of clinical settings and mechanisms through which prices were displayed enhances the generalizability of our findings, but makes it difficult to identify particular contexts (eg, type of price or type of order) in which the intervention may be most effective. Second, although the presence of negative studies on this subject reduces the concern for reporting bias, it remains possible that sites willing to implement and study price displays may be inherently more sensitive to prices, such that published results might be more pronounced than if the intervention were widely implemented across multiple sites. Third, the mixed study quality limits the strength of conclusions that can be drawn. Several studies with both positive and negative findings had issues of bias, contamination, or confounding that make it difficult to be confident of the direction or magnitude of the main findings. Studies evaluating price display are challenging to conduct without these limitations, and that was apparent in our review. Finally, because over half of the studies were conducted over 15 years ago, it may limit their generalizability to modern ordering environments.
We believe there remains a need for high‐quality evidence on this subject within a contemporary context to confirm these findings. The optimal methodology for evaluating this intervention is a cluster randomized trial by facility or provider group, similar to that reported by Tierney et al. in 1990, with a primary outcome of aggregate order costs.[30] Given the substantial investment this would require, a large time series study could also be informative. As most prior price display interventions have been under 6 months in duration, it would be useful to know if the impact on order costs is sustained over a longer time period. The concurrent introduction of any EHR alerts that could impact ordering (eg, duplicate test warnings) should be simultaneously measured and reported. Studies also need to determine the impact of price display alone compared to price comparison displays (displaying prices for the selected order along with reasonable alternatives). Although price comparison was a component of the intervention in some of the studies in this review, it was not evaluated relative to price display alone. Furthermore, it would be helpful to know if the type of price displayed affects its impact. For instance, if providers are most sensitive to the absolute magnitude of prices, then displaying chargemaster prices may impact ordering more than showing hospital costs. If, however, relative prices are all that providers need, then showing lower numbers, such as Medicare prices or hospital costs, may be sufficient. Finally, it would be reassuring to have additional evidence that price display does not adversely impact patient outcomes.
Although some details need elucidation, the studies synthesized in this review provide valuable data in the current climate of increased emphasis on price transparency. Although substantial attention has been devoted by the academic community, technology start‐ups, private insurers, and even state legislatures to improving price transparency to patients, less focus has been given to physicians, for whom healthcare prices are often just as opaque.[4] The findings from this review suggest that provider price display may be an effective, safe, and acceptable approach to empower physicians to control healthcare spending.
Disclosures: Dr. Silvestri, Dr. Bongiovanni, and Ms. Glover have nothing to disclose. Dr. Gross reports grants from Johnson & Johnson, Medtronic Inc., and 21st Century Oncology during the conduct of this study. In addition, he received payment from Fair Health Inc. and ASTRO outside the submitted work.
- Institute of Medicine. Best Care at Lower Cost: The Path to Continuously Learning Health Care in America: Washington, DC: National Academies Press; 2012.
- . Do physicians need a “shopping cart” for health care services? JAMA. 2012;307(8):791–792.
- . The disruptive innovation of price transparency in health care. JAMA. 2013;310(18):1927–1928.
- , . Providing price displays for physicians: which price is right? JAMA. 2014;312(16):1631–1632.
- , . Physician awareness of diagnostic and nondrug therapeutic costs: a systematic review. Int J Tech Assess Health Care. 2008;24(2):158–165.
- , , . Physician awareness of drug cost: a systematic review. PLoS Med. 2007;4(9):e283.
- , , , . The effect of charge display on cost of care and physician practice behaviors: a systematic review. J Gen Intern Med. 2015;30:835–842.
- , , . Engaging medical librarians to improve the quality of review articles. JAMA. 2014;312(10):999–1000.
- , , . Influencing behavior of physicians ordering laboratory tests: a literature study. Med Care. 1993;31(9):784–794.
- , . Trials of providing costing information to general practitioners: a systematic review. Med J Aust. 1997;167(2):89–92.
- . A review of physician cost‐containment strategies for laboratory testing. Med Care. 1983;21(8):783–802.
- , . The feasibility of creating a checklist for the assessment of the methodological quality both of randomised and non‐randomised studies of health care interventions. J Epidemiol Community Health. 1998;52(6):377–384.
- , , , et al. Does offering pricing information to resident physicians in the emergency department potentially reduce laboratory and radiology costs? Eur J Emerg Med. 2015;22:247–252.
- , , , et al. Cost and turn‐around time display decreases inpatient ordering of reference laboratory tests: a time series. BMJ Qual Saf. 2014;23:994–1000.
- , , , , . The impact of cost displays on primary care physician laboratory test ordering. J Gen Intern Med. 2014;29:708–714.
- , , , et al. Impact of providing fee data on laboratory test ordering: a controlled clinical trial. JAMA Intern Med. 2013;173(10):903–908.
- , , , . Provider cost transparency alone has no impact on inpatient imaging utilization. J Am Coll Radiol. 2013;10(2):108–113.
- , , . Providing clinicians with information on laboratory test costs leads to reduction in hospital expenditure. S Afr Med J. 2011;101(10):746–748.
- . Cutting costs: the impact of price lists on the cost development at the emergency department. Eur J Emerg Med. 2010;17(6):337–339.
- , , , , . Effects of price information on test ordering in an intensive care unit. Intens Care Med. 2002;28(3):332–335.
- , , , , , . Modifying provider behavior: a low‐tech approach to pharmaceutical ordering. J Gen Intern Med. 2002;17(10):792–796.
- , , , , . Medication cost information in a computer‐based patient record system. Impact on prescribing in a family medicine clinical practice. Arch Fam Med. 1999;8(2):118–121.
- , , , , . The effect of price information on test‐ordering behavior and patient outcomes in a pediatric emergency department. Pediatrics. 1999;103(4 pt 2):877–882.
- , , . Long‐term pharmaceutical cost reduction using a data management system. Anesth Analg. 1998;87(4):837–842.
- , . The impact of price labeling of muscle relaxants on cost consciousness among anesthesiologists. J Clin Anesth. 1998;10(5):401–403.
- , , . Does a computerized price comparison module reduce prescribing costs in general practice? Fam Pract. 1997;14(3):199–203.
- , , , et al. Does the computerized display of charges affect inpatient ancillary test utilization? Arch Intern Med. 1997;157(21):2501–2508.
- , . Price stickers do not alter drug usage. Can J Anaesth. 1994;41(11):1047–1052.
- , , , . Physician inpatient order writing on microcomputer workstations. Effects on resource utilization. JAMA. 1993;269(3):379–383.
- , , . The effect on test ordering of informing physicians of the charges for outpatient diagnostic tests. N Engl J Med. 1990;322(21):1499–1504.
- , , , . Effect of cost education, cost audits, and faculty chart review on the use of laboratory services. Arch Intern Med. 1983;143(5):942–944.
- . Interference between units in randomized experiments. J Am Stat Assoc. 2007;102(477):191–200.
Rising healthcare spending has garnered significant public attention, and is considered a threat to other national priorities. Up to one‐third of national health expenditures are wasteful, the largest fraction generated through unnecessary services that could be substituted for less‐costly alternatives or omitted altogether.[1] Physicians play a central role in health spending, as they purchase nearly all tests and therapies on behalf of patients.
One strategy to enhance cost‐conscious physician ordering is to increase transparency of cost data for providers.[2, 3, 4] Although physicians consider price an important factor in ordering decisions, they have difficulty estimating costs accurately or finding price information easily.[5, 6] Improving physicians' knowledge of order costs may prompt them to forego diagnostic tests or therapies of low utility, or shift ordering to lower‐cost alternatives. Real‐time price display during provider order entry is 1 approach for achieving this goal. Modern electronic health records (EHRs) with computerized physician order entry (CPOE) make price display not only practical but also scalable. Integrating price display into clinical workflow, however, can be challenging, and there remains lack of clarity about potential risks and benefits. The dissemination of real‐time CPOE price display, therefore, requires an understanding of its impact on clinical care.
Over the past 3 decades, several studies in the medical literature have evaluated the effect of price display on physician ordering behavior. To date, however, there has been only 1 narrative review of this literature, which did not include several recent studies on the topic or formally address study quality and physician acceptance of price display modules.[7] Therefore, to help inform healthcare leaders, technology innovators, and policy makers, we conducted a systematic review to address 4 key questions: (1) What are the characteristics of interventions that have displayed order prices to physicians in the context of actual practice? (2) To what degree does real‐time display of order prices impact order costs and order volume? (3) Does price display impact patient safety outcomes, and is it acceptable to providers? (4) What is the quality of the current literature on this topic?
METHODS
Data Sources
We searched 2 electronic databases, MEDLINE and Embase, using a combination of controlled vocabulary terms and keywords that covered both the targeted intervention (eg, fees and charges) and the outcome of interest (eg, physician's practice patterns), limited to English language articles with no restriction on country or year of publication (see Supporting Information, Appendix 1, in the online version of this article). The search was run through August 2014. Results from both database searches were combined and duplicates eliminated. We also ran a MEDLINE keyword search on titles and abstracts of articles from 2014 that were not yet indexed. A medical librarian was involved in all aspects of the search process.[8]
Study Selection
Studies were included if they evaluated the effect of displaying actual order prices to providers during the ordering process and reported the impact on provider ordering practices. Reports in any clinical context and with any study design were included. To assess most accurately the effect of price display on real‐life ordering and patient outcomes, studies were excluded if: (1) they were review articles, commentaries, or editorials; (2) they did not show order prices to providers; (3) the context was a simulation; (4) the prices displayed were relative (eg, $/$$/$$$) or were only cumulative; (5) prices were not presented real‐time during the ordering process; or (6) the primary outcome was neither order costs nor order volume. We decided a priori to exclude simulations because these may not accurately reflect provider behavior when treating real patients, and to exclude studies showing relative prices due to concerns that it is a less significant price transparency intervention and that providers may interpret relative prices differently from actual prices.
Two reviewers, both physicians and health service researchers (M.T.S. and T.R.B.), separately reviewed the full list of titles and abstracts. For studies that potentially met inclusion criteria, full articles were obtained and were independently read for inclusion in the final review. The references of all included studies were searched manually, and the Scopus database was used to search all studies that cited the included studies. We also searched the references of relevant literature reviews.[9, 10, 11] Articles of interest discovered through manual search were then subjected to the same process.
Data Extraction and Quality Assessment
Two reviewers (M.T.S. and T.R.B.) independently performed data extraction using a standardized spreadsheet. Discrepancies were resolved by reviewer consensus. Extracted study characteristics included study design and duration, clinical setting, study size, type of orders involved, characteristics of price display intervention and control, and type of outcome. Findings regarding patient safety and provider acceptability were also extracted when available.
Study quality was independently evaluated and scored by both reviewers using the Downs and Black checklist, designed to assess quality of both randomized and nonrandomized studies.[12] The checklist contains 5 items pertaining to allocation concealment, blinding, or follow‐up that are not applicable to an administrative intervention like price display, so these questions were excluded. Additionally, few studies calculated sample size or reported post hoc statistical power, so we also excluded this question, leaving a modified 21‐item checklist. We also assessed each study for sources of bias that were not already assessed by the Downs and Black checklist, including contamination between study groups, confounding of results, and incomplete intervention or data collection.
Data Synthesis
Data are reported in tabular form for all included studies. Due to heterogeneity of study designs and outcome measures, data from the studies were not pooled quantitatively. This review is reported according to the Preferred Reporting Items for Systematic Reviews and Meta‐Analysis guidelines.
RESULTS
Database searches yielded a total of 1400 articles, of which 18 were selected on the basis of title and abstract for detailed assessment. Reference searching led us to retrieve 94 further studies of possible interest, of which 23 were selected on the basis of abstract for detailed assessment. Thus, 41 publications underwent full manuscript review, 19 of which met all inclusion criteria (see Supporting Information, Appendix 2, in the online version of this article).[13, 14, 15, 16, 17, 18, 19, 20, 21, 22, 23, 24, 25, 26, 27, 28, 29, 30, 31] These studies were published between 1983 and 2014, and were conducted primarily in the United States.
Study Characteristics
There was considerable heterogeneity among the 19 studies with regard to design, setting, and scope (Table 1). There were 5 randomized trials, for which the units of randomization were patient (1), provider team (2), and test (2). There were 13 pre‐post intervention studies, 5 of which used a concomitant control group, and 2 of which included a washout period. There was 1 interrupted time series study. Studies were conducted within inpatient hospital floors (8), outpatient clinics (4), emergency departments (ED) or urgent care facilities (4), and hospital operating rooms (3).
| Study | Design | Clinical Setting | Providers | Intervention and Duration | Order(s) Studied | Type of Price Displayed | Concurrent Interventions |
|---|---|---|---|---|---|---|---|
| |||||||
| Fang et al.[14] 2014 | Pre‐post study with control group | Academic hospital (USA) | All inpatient ordering providers | CPOE system with prices displayed for reference lab tests; 8 months | All send‐out lab tests | Charge from send‐out laboratory, displayed as range (eg, $100300) | Display also contained expected lab turnaround time |
| Nougon et al.[13] 2014 | Pre‐post study with washout | Academic adult emergency department (Belgium) | 9 ED house staff | CPOE system with prices displayed on common orders form, and price list displayed above all workstations and in patient rooms; 2 months | Common lab and imaging tests | Reference costs from Belgian National Institute for Health Insurance and Invalidity | None |
| Durand et al.[17] 2013 | RCT (randomized by test) | Academic hospital, all inpatients (USA) | All inpatient ordering providers | CPOE system with prices displayed; 6 months | 10 common imaging tests | Medicare allowable fee | None |
| Feldman et al.[16] 2013 | RCT (randomized by test) | Academic hospital, all inpatients (USA) | All inpatient ordering providers | CPOE system with prices displayed; 6 months | 61 lab tests | Medicare allowable fee | None |
| Horn et al.[15] 2014 | Interrupted time series study with control group | Private outpatient group practice alliance (USA) | 215 primary care physicians | CPOE system with prices displayed; 6 months | 27 lab tests | Medicare allowable fee, displayed as narrow range (eg, $5$10) | None |
| Ellemdin et al.[18] 2011 | Pre‐post study with control group | Academic hospital, internal medicine units (South Africa) | Internal medicine physicians (number NR) | Sheet with lab test costs given to intervention group physicians who were required to write out cost for each order; 4 months | Common lab tests | Not reported | None |
| Schilling,[19] 2010 | Pre‐post study with control group | Academic adult emergency department (Sweden) | All internal medicine physicians in ED | Standard provider workstations with price lists posted on each; 2 months | 91 common lab tests, 39 common imaging tests | Not reported | None |
| Guterman et al.[21] 2002 | Pre‐post study | Academic‐affiliated urgent care clinic (USA) | 51 attendings and housestaff | Preformatted paper prescription form with medication prices displayed; 2 weeks | 2 H2‐blocker medications | Acquisition cost of medication plus fill fee | None |
| Seguin et al.[20] 2002 | Pre‐post study | Academic surgical intensive care unit (France) | All intensive care unit physicians | Paper quick‐order checklist with prices displayed; 2 months | 6 common lab tests, 1 imaging test | Not reported | None |
| Hampers et al.[23] 1999 | Pre‐post study with washout | Academic pediatric emergency department (USA) | Pediatric ED attendings and housestaff (number NR) | Paper common‐order checklist with prices displayed; 3 months | 22 common lab and imaging tests | Chargemaster price* | Physicians required to calculate total charges for diagnostic workup |
| Ornstein et al.[22] 1999 | Pre‐post study | Academic family medicine outpatient clinic (USA) | 46 attendings and housestaff | Microcomputer CPOE system with medication prices displayed; 6 months | All medications | AWP for total supply (acute medications) or 30‐day supply (chronic medications) | Additional keystroke produced list of less costly alternative medications |
| Lin et al.[25] 1998 | Pre‐post study | Academic hospital operating rooms (USA) | All anesthesia providers | Standard muscle relaxant drug vials with price stickers displayed; 12 months | All muscle relaxant medications | Not reported | None |
| McNitt et al.[24] 1998 | Pre‐post study | Academic hospital operating rooms (USA) | 90 anesthesia attendings, housestaff and anesthetists | List of drug costs displayed in operating rooms, anesthesia lounge, and anesthesia satellite pharmacy; 10 months | 22 common anesthesia medications | Hospital acquisition cost | Regular anesthesia department reviews of drug usage and cost |
| Bates et al.[27] 1997 | RCT (randomized by patient) | Academic hospital, medical and surgical inpatients (USA) | All inpatient ordering providers | CPOE system with display of test price and running total of prices for the ordering session; 4 months (lab) and 7 months (imaging) | All lab tests, 35 common imaging tests | Chargemaster price | None |
| Vedsted et al.[26] 1997 | Pre‐post study with control group | Outpatient general practices (Denmark) | 231 general practitioners | In practices already using APEX CPOE system, introduction of medication price display (control practices used non‐APEX computer system or paper‐based prescribing); 12 months | All medications | Chargemaster price | Medication price comparison module (stars indicated availability of cheaper option) |
| Horrow et al.[28] 1994 | Pre‐post study | Private tertiary care hospital operating rooms (USA) | 56 anesthesia attendings, housestaff and anesthetists | Standard anesthesia drug vials and syringes with supermarket price stickers displayed; 3 months | 13 neuromuscular relaxant and sedative‐hypnotic medications | Hospital acquisition cost | None |
| Tierney et al.[29] 1993 | Cluster RCT (randomized by provider team) | Public hospital, internal medicine services (USA) | 68 teams of internal medicine attendings and housestaff | Microcomputer CPOE system with prices displayed (control group used written order sheets); 17 months | All orders | Chargemaster price | CPOE system listed cost‐effective tests for common problems and displayed reasonable test intervals |
| Tierney et al.[30] 1990 | Cluster RCT (randomized by clinic session) | Academic, outpatient, general medicine practice (USA) | 121 internal medicine attendings and housestaff | Microcomputer CPOE system with pop‐up window displaying price for current test and running total of cumulative test prices for current visit; 6 months | All lab and imaging tests | Chargemaster price | None |
| Everett et al.[31] 1983 | Pre‐post study with control group | Academic hospital, general internal medicine wards (USA) | Internal medicine attendings and housestaff (number NR) | Written order sheet with adjacent sheet of lab test prices; 3 months | Common lab tests | Chargemaster price | None |
Prices were displayed for laboratory tests (12 studies), imaging tests (8 studies), and medications (7 studies). Study scope ranged from examining a single medication class to evaluating all inpatient orders. The type of price used for the display varied, with the most common being the facility charges or chargemaster prices (6 studies), and Medicare prices (3 studies). In several cases, price display was only 1 component of the study, and 6 studies introduced additional interventions concurrent with price display, such as cost‐effective ordering menus,[29] medication comparison modules,[26] or display of test turnaround times.[14] Seven of the 19 studies were conducted in the past decade, of which 5 displayed prices within an EHR.[13, 14, 15, 16, 17]
Order Costs and Volume
Thirteen studies reported the numeric impact of price display on aggregate order costs (Table 2). Nine of these demonstrated a statistically significant (P < 0.05) decrease in order costs, with effect sizes ranging from 10.7% to 62.8%.[13, 16, 18, 20, 23, 24, 28, 29, 30] Decreases were found for lab costs, imaging costs, and medication costs, and were observed in both the inpatient and outpatient settings. Three of these 9 studies were randomized. For example, in 1 study randomizing 61 lab tests to price display or no price display, costs for the intervention labs dropped 9.6% compared to the year prior, whereas costs for control labs increased 2.9% (P < 0.001).[16] Two studies randomized by provider group showed that providers seeing order prices accrued 12.7% fewer charges per inpatient admission (P = 0.02) and 12.9% fewer test charges per outpatient visit (P < 0.05).[29, 30] Three studies found no significant association between price display and order costs, with effect sizes ranging from a decrease of 18.8% to an increase of 4.3%.[19, 22, 27] These studies also evaluated lab, imaging, and medication costs, and included 1 randomized trial. One additional large study noted a 12.5% decrease in medication costs after initiation of price display, but did not statistically evaluate this difference.[25]
| Study | No. of Encounters | Primary Outcome Measure(s) | Impact on Order Costs | Impact on Order Volume | ||||
|---|---|---|---|---|---|---|---|---|
| Control Group Outcome | Intervention Group Outcome | Relative Change | Control Group Outcome | Intervention Group Outcome | Relative Change | |||
| ||||||||
| Fang et al.[14] 2014 | 378,890 patient‐days | Reference lab orders per 1000 patient‐days | NR | NR | NA | 51 orders/1000 patient‐days | 38 orders/1000 patient‐days | 25.5% orders/1000 patient‐days (P < 0.001) |
| Nougon et al.[13] 2015 | 2422 ED visits (excluding washout) | Lab and imaging test costs per ED visit | 7.1/visit (lab); 21.8/visit (imaging) | 6.4/visit (lab); 14.4/visit (imaging) | 10.7% lab costs/ visit (P = 0.02); 33.7% imaging costs/visit (P < 0.001) | NR | NR | NA |
| Durand et al.[17] 2013 | NR | Imaging orders compared to baseline 1 year prior | NR | NR | NA | 3.0% total orders | +2.8% total orders | +5.8% total orders (P = 0.10) |
| Feldman et al.[16] 2013 | 245,758 patient‐days | Lab orders and fees per patient‐day compared to baseline 1 year prior | +2.9% fees/ patient‐day | 9.6% fees/ patient‐day | 12.5% fees/patient‐day (P < 0.001) | +5.6% orders/patient‐day | 8.6% orders/ patient‐day | 14.2% orders/patient‐day (P < 0.001) |
| Horn et al.[15] 2014 | NR | Lab test volume per patient visit, by individual lab test | NR | NR | NA | Aggregate data not reported | Aggregate data not reported | 5 of 27 tests had significant reduction in ordering (2.1% to 15.2%/patient visit) |
| Ellemdin et al.[18] 2011 | 897 admissions | Lab cost per hospital day | R442.90/day | R284.14/day | 35.8% lab costs/patient‐day (P = 0.001) | NR | NR | NA |
| Schilling[19] 2010 | 3222 ED visits | Combined lab and imaging test costs per ED visit | 108/visit | 88/visit | 18.8% test costs/visit (P = 0.07) | NR | NR | NA |
| Guterman et al.[21] 2002 | 168 urgent care visits | Percent of acid reducer prescriptions for ranitidine (the higher‐cost option) | NR | NR | NA | 49% ranitidine | 21% ranitidine | 57.1% ranitidine (P = 0.007) |
| Seguin et al.[20] 2002 | 287 SICU admissions | Tests ordered per admission; test costs per admission | 341/admission | 266/admission | 22.0% test costs/admission (P < 0.05) | 13.6 tests/admission | 11.1 tests/ admission | 18.4% tests/admission (P = 0.12) |
| Hampers et al.[23] 1999 | 4881 ED visits (excluding washout) | Adjusted mean test charges per patient visit | $86.79/visit | $63.74/visit | 26.6% test charges/visit (P < 0.01) | NR | NR | NA |
| Ornstein et al.[22] 1999 | 30,461 outpatient visits | Prescriptions per visit; prescription cost per visit; cost per prescription | $12.49/visit; $21.83/ prescription | $13.03/visit; $22.03/prescription |
+4.3% prescription costs/visit (P = 0.12); +0.9% cost/prescription (P = 0.61) |
0.66 prescriptions/visit | 0.64 prescriptions/ visit | 3.0% prescriptions/visit (P value not reported) |
| Lin et al.[25] 1998 | 40,747 surgical cases | Annual spending on muscle relaxants medication |
$378,234/year (20,389 cases) |
$330,923/year (20,358 cases) |
12.5% | NR | NR | NA |
| McNitt et al.[24] 1998 | 15,130 surgical cases | Anesthesia drug cost per case | $51.02/case | $18.99/case | 62.8% drug costs/case (P < 0.05) | NR | NR | NA |
| Bates et al.[27] 1997 | 7090 admissions (lab); 17,381 admissions (imaging) | Tests ordered per admission; charges for tests ordered per admission |
$771/ admission (lab); $276/admission (imaging) |
$739/admission (lab); $275/admission (imaging) |
4.2% lab charges/admission (P = 0.97); 0.4% imaging charges/admission (P = 0.10) |
26.8 lab tests/admission; 1.76 imaging tests/admission |
25.6 lab tests/ admission; 1.76 imaging tests/ admission |
4.5% lab tests/admission (P = 0.74); 0% imaging tests/admission (P = 0.13) |
| Vedsted et al.[26] 1997 | NR | Prescribed daily doses per 1000 insured; total drug reimbursement per 1000 insured; reimbursement per daily dose | Reported graphically only | Reported graphically only | No difference | Reported graphically only | Reported graphically only | No difference |
| Horrow et al.[28] 1994 | NR | Anesthetic drugs used per week; anesthetic drug cost per week | $3837/week | $3179/week | 17.1% drug costs/week (P = 0.04) | 97 drugs/week | 94 drugs/week | 3.1% drugs/week (P = 0.56) |
| Tierney et al.[29] 1993 | 5219 admissions | Total charges per admission | $6964/admission | $6077/admission | 12.7% total charges/admission (P = 0.02) | NR | NR | NA |
| Tierney et al.[30] 1990 | 15,257 outpatient visits | Test orders per outpatient visit; test charges per outpatient visit | $51.81/visit | $45.13/visit | 12.9% test charges/visit (P < 0.05) | 1.82 tests/visit | 1.56 tests/visit | 14.3% tests/visit (P < 0.005) |
| Everett et al.[31] 1983 | NR | Lab tests per admission; charges per admission | NR | NR | NA | NR | NR | No statistically significant changes |
Eight studies reported the numeric impact of price display on aggregate order volume. Three of these demonstrated a statistically significant decrease in order volume, with effect sizes ranging from 14.2% to 25.5%.[14, 16, 30] Decreases were found for lab and imaging tests, and were observed in both inpatient and outpatient settings. For example, 1 pre‐post study displaying prices for inpatient send‐out lab tests demonstrated a 25.5% reduction in send‐out labs per 1000 patient‐days (P < 0.001), whereas there was no change for the control group in‐house lab tests, for which prices were not shown.[14] The other 5 studies reported no significant association between price display and order volume, with effect sizes ranging from a decrease of 18.4% to an increase of 5.8%.[17, 20, 22, 27, 28] These studies evaluated lab, imaging, and medication volume. One trial randomizing by individual inpatient showed a nonsignificant decrease of 4.5% in lab orders per admission in the intervention group (P = 0.74), although the authors noted that their study had insufficient power to detect differences less than 10%.[27] Of note, 2 of the 5 studies reporting nonsignificant impacts on order volume (3.1%, P = 0.56; and 18.4%, P = 0.12) did demonstrate significant decreases in order costs (17.1%, P = 0.04; and 22.0%, P < 0.05).[20, 28]
There were an additional 2 studies that reported the impact of price display on order volume for individual orders only. In 1 time‐series study showing lab test prices, there was a statistically significant decrease in order volume for 5 of 27 individual tests studied (using a Bonferroni‐adjusted threshold of significance), with no tests showing a significant increase.[15] In 1 pre‐post study showing prices for H2‐antagonist drugs, there was a statistically significant 57.1% decrease in order volume for the high‐cost medication, with a corresponding 58.7% increase in the low‐cost option.[21] These studies did not report impact on aggregate order costs. Two further studies in this review did not report outcomes numerically, but did state in their articles that significant impacts on order volume were not observed.[26, 31]
Therefore, of the 19 studies included in this review, 17 reported numeric results. Of these 17 studies, 12 showed that price display was associated with statistically significant decreases in either order costs or volume, either in aggregate (10 studies; Figure 1) or for individual orders (2 studies). Of the 7 studies conducted within the past decade, 5 noted significant decreases in order costs or volume. Prices were embedded into an EHR in 5 of these recent studies, and 4 of the 5 observed significant decreases in order costs or volume. Only 2 studies from the past decade1 from Belgium and 1 from the United Statesincorporated prices into an EHR and reported aggregate order costs. Both found statistically significant decreases in order costs with price display.[13, 16]
Patient Safety and Provider Acceptability
Five studies reported patient‐safety outcomes. One inpatient randomized trial showed similar rates of postdischarge utilization and charges between the intervention and control groups.[29] An outpatient randomized trial showed similar rates of hospital admissions, ED visits, and outpatient visits between the intervention and control groups.[30] Two pre‐post studies showing anesthesia prices in hospital operating rooms included a quality assurance review and showed no changes in adverse outcomes such as prolonged postoperative intubation, recovery room stay, or unplanned intensive care unit admissions.[24, 25] The only adverse safety finding was in a pre‐post study in a pediatric ED, which showed a higher rate of unscheduled follow‐up care during the intervention period compared to the control period (24.4% vs 17.8%, P < 0.01) but similar rates of patients feeling better (83.4% vs 86.7%, P = 0.05). These findings, however, were based on self‐report during telephone follow‐up with a 47% response rate.[23]
Five studies reported on provider acceptability of price display. Two conducted questionnaires as part of the study plan, whereas the other 3 offered general provider feedback. One questionnaire revealed that 83% of practices were satisfied or very satisfied with the price display.[26] The other questionnaire found that 81% of physicians felt the price display improved my knowledge of the relative costs of tests I order and similarly 81% would like additional cost information displayed for other orders.[15] Three studies reported subjectively that showing prices initially caused questions from most physicians,[13] but that ultimately, physicians like seeing this information[27] and gave feedback that was generally positive.[21] One study evaluated the impact of price display on provider cost knowledge. Providers in the intervention group did not improve in their cost‐awareness, with average errors in cost estimates exceeding 40% even after 6 months of price display.[30]
Study Quality
Using a modified Downs and Black checklist of 21 items, studies in this review ranged in scores from 5 to 20, with a median score of 15. Studies most frequently lost points for being nonrandomized, failing to describe or adjust for potential confounders, being prone to historical confounding, or not evaluating potential adverse events.
We supplemented this modified Downs and Black checklist by reviewing 3 categories of study limitations not well‐reflected in the checklist scoring (Table 3). The first was potential for contamination between study groups, which was a concern in 4 studies. For example, 1 pre‐post study assessing medication ordering included clinical pharmacists in patient encounters both before and after the price display intervention.[22] This may have enhanced cost‐awareness even before prices were shown. The second set of limitations, present in 12 studies, included confounders that were not addressed by study design or analysis. For example, the intervention in 1 study displayed not just test cost but also test turnaround time, which may have separately influenced providers against ordering a particular test.[14] The third set of limitations included unanticipated gaps in the display of prices or in the collection of ordering data, which occurred in 5 studies. If studies did not report on gaps in the intervention or data collection, we assumed there were none.
| Study | Modified Downs & Black Score (Max Score 21) | Other Price Display Quality Criteria (Not Included in Downs & Black Score) | ||
|---|---|---|---|---|
| Potential for Contamination Between Study Groups | Potential Confounders of Results Not Addressed by Study Design or Analysis | Incomplete Price Display Intervention or Data Collection | ||
| ||||
| Fang et al.[14] 2014 | 14 | None | Concurrent display of test turnaround time may have independently contributed to decreased test ordering | 21% of reference lab orders were excluded from analysis because no price or turnaround‐time data were available |
| Nougon et al.[13] 2015 | 16 | None | Historical confounding may have existed due to pre‐post study design without control group | None |
| Durand et al.[17] 2013 | 17 | Providers seeing test prices for intervention tests (including lab tests in concurrent Feldman study) may have remained cost‐conscious when placing orders for control tests | Interference between units likely occurred because intervention test ordering (eg, chest x‐ray) was not independent of control test ordering (eg, CT chest) | None |
| Feldman et al.[16] 2013 | 18 | Providers seeing test prices for intervention tests (including imaging tests in concurrent Durand study) may have remained cost‐conscious when placing orders for control tests | Interference between units likely occurred because intervention test ordering (eg, CMP) was not independent of control test ordering (eg, BMP) | None |
| Horn et al.[15] 2014 | 15 | None | None | None |
| Ellemdin et al.[18] 2011 | 15 | None | None | None |
| Schilling[19] 2010 | 12 | None | None | None |
| Guterman et al.[21] 2002 | 14 | None | Historical confounding may have existed due to pre‐post study design without control group | None |
| Seguin et al.[20] 2002 | 17 | None | Because primary outcome was not adjusted for length of stay, the 30% shorter average length of stay during intervention period may have contributed to decreased costs per admission; historical confounding may have existed due to pre‐post study design without control group | None |
| Hampers et al.[23] 1999 | 17 | None | Requirement that physicians calculate total charges for each visit may have independently contributed to decreased test ordering; historical confounding may have existed due to pre‐post study design without control group | 10% of eligible patient visits were excluded from analysis because prices were not displayed or ordering data were not collected |
| Ornstein et al.[22] 1999 | 15 | Clinical pharmacists and pharmacy students involved in half of all patient contacts may have enhanced cost‐awareness during control period | Emergence of new drugs during intervention period and an ongoing quality improvement activity to increase prescribing of lipid‐lowering medications may have contributed to increased medication costs; historical confounding may have existed due to pre‐post study design without control group | 25% of prescription orders had no price displayed, and average prices were imputed for purposes of analysis |
| Lin et al.[25] 1998 | 12 | None | Emergence of new drug during intervention period and changes in several drug prices may have contributed to decreased order costs; historical confounding may have existed due to pre‐post study design without control group | None |
| McNitt et al.[24] 1998 | 15 | None | Intensive drug‐utilization review and cost‐reduction efforts may have independently contributed to decreased drug costs; historical confounding may have existed due to pre‐post study design without control group | None |
| Bates et al.[27] 1997 | 18 | Providers seeing test prices on intervention patients may have remembered prices or remained cost‐conscious when placing orders for control patients | None | 47% of lab tests and 26% of imaging tests were ordered manually outside of the trial's CPOE display system* |
| Vedsted et al.[26] 1997 | 5 | None | Medication price comparison module may have independently influenced physician ordering | None |
| Horrow et al.[28] 1994 | 14 | None | Historical confounding may have existed due to pre‐post study design without control group | Ordering data for 2 medications during 2 of 24 weeks were excluded from analysis due to internal inconsistency in the data |
| Tierney et al.[29] 1993 | 20 | None | Introduction of computerized order entry and menus for cost‐effective ordering may have independently contributed to decreased test ordering | None |
| Tierney et al.[30] 1990 | 20 | None | None | None |
| Everett et al.[31] 1983 | 7 | None | None | None |
Even among the 5 randomized trials there were substantial limitations. For example, 2 trials used individual tests as the unit of randomization, although ordering patterns for these tests are not independent of each other (eg, ordering rates for comprehensive metabolic panels are not independent of ordering rates for basic metabolic panels).[16, 17] This creates interference between units that was not accounted for in the analysis.[32] A third trial was randomized at the level of the patient, so was subject to contamination as providers seeing the price display for intervention group patients may have remained cost‐conscious while placing orders for control group patients.[27] In a fourth trial, the measured impact of the price display may have been confounded by other aspects of the overall cost intervention, which included cost‐effective test menus and suggestions for reasonable testing intervals.[29]
The highest‐quality study was a cluster‐randomized trial published in 1990 specifically measuring the effect of price display on a wide range of orders.[30] Providers and patients were separated by clinic session so as to avoid contamination between groups, and the trial included more than 15,000 outpatient visits. The intervention group providers ordered 14.3% fewer tests than control group providers, which resulted in 12.9% lower charges.
DISCUSSION
We identified 19 published reports of interventions that displayed real‐time order prices to providers and evaluated the impact on provider ordering. There was substantial heterogeneity in study setting, design, and quality. Although there is insufficient evidence on which to base strong conclusions, these studies collectively suggest that provider price display likely reduces order costs to a modest degree. Data on patient safety were largely lacking, although in the few studies that examined patient outcomes, there was little evidence that patient safety was adversely affected by the intervention. Providers widely viewed display of prices positively.
Our findings align with those of a recent systematic review that concluded that real‐time price information changed provider ordering in the majority of studies.[7] Whereas that review evaluated 17 studies from both clinical settings and simulations, our review focused exclusively on studies conducted in actual ordering environments. Additionally, our literature search yielded 8 studies not previously reviewed. We believe that the alignment of our findings with the prior review, despite the differences in studies included, adds validity to the conclusion that price display likely has a modest impact on reducing order costs. Our review contains several additions important for those considering price display interventions. We provide detailed information on study settings and intervention characteristics. We present a formal assessment of study quality to evaluate the strength of individual study findings and to guide future research in this area. Finally, because both patient safety and provider acceptability may be a concern when prices are shown, we describe all safety outcomes and provider feedback that these studies reported.
The largest effect sizes were noted in 5 studies reporting decreases in order volume or costs greater than 25%.[13, 14, 18, 23, 24] These were all pre‐post intervention studies, so the effect sizes may have been exaggerated by historical confounding. However, the 2 studies with concurrent control groups found no decreases in order volume or cost in the control group.[14, 18] Among the 5 studies that did not find a significant association between price display and provider ordering, 3 were subject to contamination between study groups,[17, 22, 27] 1 was underpowered,[19] and 1 noted a substantial effect size but did not perform a statistical analysis.[25] We also found that order costs were more frequently reduced than order volume, likely because shifts in ordering to less expensive alternatives may cause costs to decrease while volume remains unchanged.[20, 28]
If price display reduces order costs, as the majority of studies in this review indicate, this finding carries broad implications. Policy makers could promote cost‐conscious care by creating incentives for widespread adoption of price display. Hospital and health system leaders could improve transparency and reduce expenses by prioritizing price display. The specific beneficiaries of any reduced spending would depend on payment structures. With shifts toward financial risk‐bearing arrangements like accountable care organizations, healthcare institutions may have a financial interest in adopting price display. Because price display is an administrative intervention that can be developed within EHRs, it is potentially 1 of the most rapidly scalable strategies for reducing healthcare spending. Even modest reductions in spending on laboratory tests, imaging studies, and medications would result in substantial savings on a system‐wide basis.
Implementing price display does not come without challenges. Prices need to be calculated or obtained, loaded into an EHR system, and updated periodically. Technology innovators could enhance EHR software by making these processes easier. Healthcare institutions may find displaying relative prices (eg, $/$$/$$$) logistically simpler in some contexts than showing actual prices (eg, purchase cost), such as when contracts require prices to be confidential. Although we decided to exclude studies displaying relative prices, our search identified no studies that met other inclusion criteria but displayed relative prices, suggesting a lack of evidence regarding the impact of relative price display as an alternative to actual price display.
There are 4 key limitations to our review. First, the heterogeneity of the study designs and reported outcomes precluded pooling of data. The variety of clinical settings and mechanisms through which prices were displayed enhances the generalizability of our findings, but makes it difficult to identify particular contexts (eg, type of price or type of order) in which the intervention may be most effective. Second, although the presence of negative studies on this subject reduces the concern for reporting bias, it remains possible that sites willing to implement and study price displays may be inherently more sensitive to prices, such that published results might be more pronounced than if the intervention were widely implemented across multiple sites. Third, the mixed study quality limits the strength of conclusions that can be drawn. Several studies with both positive and negative findings had issues of bias, contamination, or confounding that make it difficult to be confident of the direction or magnitude of the main findings. Studies evaluating price display are challenging to conduct without these limitations, and that was apparent in our review. Finally, because over half of the studies were conducted over 15 years ago, it may limit their generalizability to modern ordering environments.
We believe there remains a need for high‐quality evidence on this subject within a contemporary context to confirm these findings. The optimal methodology for evaluating this intervention is a cluster randomized trial by facility or provider group, similar to that reported by Tierney et al. in 1990, with a primary outcome of aggregate order costs.[30] Given the substantial investment this would require, a large time series study could also be informative. As most prior price display interventions have been under 6 months in duration, it would be useful to know if the impact on order costs is sustained over a longer time period. The concurrent introduction of any EHR alerts that could impact ordering (eg, duplicate test warnings) should be simultaneously measured and reported. Studies also need to determine the impact of price display alone compared to price comparison displays (displaying prices for the selected order along with reasonable alternatives). Although price comparison was a component of the intervention in some of the studies in this review, it was not evaluated relative to price display alone. Furthermore, it would be helpful to know if the type of price displayed affects its impact. For instance, if providers are most sensitive to the absolute magnitude of prices, then displaying chargemaster prices may impact ordering more than showing hospital costs. If, however, relative prices are all that providers need, then showing lower numbers, such as Medicare prices or hospital costs, may be sufficient. Finally, it would be reassuring to have additional evidence that price display does not adversely impact patient outcomes.
Although some details need elucidation, the studies synthesized in this review provide valuable data in the current climate of increased emphasis on price transparency. Although substantial attention has been devoted by the academic community, technology start‐ups, private insurers, and even state legislatures to improving price transparency to patients, less focus has been given to physicians, for whom healthcare prices are often just as opaque.[4] The findings from this review suggest that provider price display may be an effective, safe, and acceptable approach to empower physicians to control healthcare spending.
Disclosures: Dr. Silvestri, Dr. Bongiovanni, and Ms. Glover have nothing to disclose. Dr. Gross reports grants from Johnson & Johnson, Medtronic Inc., and 21st Century Oncology during the conduct of this study. In addition, he received payment from Fair Health Inc. and ASTRO outside the submitted work.
- Institute of Medicine. Best Care at Lower Cost: The Path to Continuously Learning Health Care in America: Washington, DC: National Academies Press; 2012.
- . Do physicians need a “shopping cart” for health care services? JAMA. 2012;307(8):791–792.
- . The disruptive innovation of price transparency in health care. JAMA. 2013;310(18):1927–1928.
- , . Providing price displays for physicians: which price is right? JAMA. 2014;312(16):1631–1632.
- , . Physician awareness of diagnostic and nondrug therapeutic costs: a systematic review. Int J Tech Assess Health Care. 2008;24(2):158–165.
- , , . Physician awareness of drug cost: a systematic review. PLoS Med. 2007;4(9):e283.
- , , , . The effect of charge display on cost of care and physician practice behaviors: a systematic review. J Gen Intern Med. 2015;30:835–842.
- , , . Engaging medical librarians to improve the quality of review articles. JAMA. 2014;312(10):999–1000.
- , , . Influencing behavior of physicians ordering laboratory tests: a literature study. Med Care. 1993;31(9):784–794.
- , . Trials of providing costing information to general practitioners: a systematic review. Med J Aust. 1997;167(2):89–92.
- . A review of physician cost‐containment strategies for laboratory testing. Med Care. 1983;21(8):783–802.
- , . The feasibility of creating a checklist for the assessment of the methodological quality both of randomised and non‐randomised studies of health care interventions. J Epidemiol Community Health. 1998;52(6):377–384.
- , , , et al. Does offering pricing information to resident physicians in the emergency department potentially reduce laboratory and radiology costs? Eur J Emerg Med. 2015;22:247–252.
- , , , et al. Cost and turn‐around time display decreases inpatient ordering of reference laboratory tests: a time series. BMJ Qual Saf. 2014;23:994–1000.
- , , , , . The impact of cost displays on primary care physician laboratory test ordering. J Gen Intern Med. 2014;29:708–714.
- , , , et al. Impact of providing fee data on laboratory test ordering: a controlled clinical trial. JAMA Intern Med. 2013;173(10):903–908.
- , , , . Provider cost transparency alone has no impact on inpatient imaging utilization. J Am Coll Radiol. 2013;10(2):108–113.
- , , . Providing clinicians with information on laboratory test costs leads to reduction in hospital expenditure. S Afr Med J. 2011;101(10):746–748.
- . Cutting costs: the impact of price lists on the cost development at the emergency department. Eur J Emerg Med. 2010;17(6):337–339.
- , , , , . Effects of price information on test ordering in an intensive care unit. Intens Care Med. 2002;28(3):332–335.
- , , , , , . Modifying provider behavior: a low‐tech approach to pharmaceutical ordering. J Gen Intern Med. 2002;17(10):792–796.
- , , , , . Medication cost information in a computer‐based patient record system. Impact on prescribing in a family medicine clinical practice. Arch Fam Med. 1999;8(2):118–121.
- , , , , . The effect of price information on test‐ordering behavior and patient outcomes in a pediatric emergency department. Pediatrics. 1999;103(4 pt 2):877–882.
- , , . Long‐term pharmaceutical cost reduction using a data management system. Anesth Analg. 1998;87(4):837–842.
- , . The impact of price labeling of muscle relaxants on cost consciousness among anesthesiologists. J Clin Anesth. 1998;10(5):401–403.
- , , . Does a computerized price comparison module reduce prescribing costs in general practice? Fam Pract. 1997;14(3):199–203.
- , , , et al. Does the computerized display of charges affect inpatient ancillary test utilization? Arch Intern Med. 1997;157(21):2501–2508.
- , . Price stickers do not alter drug usage. Can J Anaesth. 1994;41(11):1047–1052.
- , , , . Physician inpatient order writing on microcomputer workstations. Effects on resource utilization. JAMA. 1993;269(3):379–383.
- , , . The effect on test ordering of informing physicians of the charges for outpatient diagnostic tests. N Engl J Med. 1990;322(21):1499–1504.
- , , , . Effect of cost education, cost audits, and faculty chart review on the use of laboratory services. Arch Intern Med. 1983;143(5):942–944.
- . Interference between units in randomized experiments. J Am Stat Assoc. 2007;102(477):191–200.

Hospitalists Can Improve Healthcare Value
As the nation considers how to reduce healthcare costs, hospitalists can play a crucial role in this effort because they control many healthcare services through routine clinical decisions at the point of care. In fact, the government, payers, and the public now look to hospitalists as essential partners for reining in healthcare costs.[1, 2] The role of hospitalists is even more critical as payers, including Medicare, seek to shift reimbursements from volume to value.[1] Medicare's Value‐Based Purchasing program has already tied a percentage of hospital payments to metrics of quality, patient satisfaction, and cost,[1, 3] and Health and Human Services Secretary Sylvia Burwell announced that by the end of 2018, the goal is to have 50% of Medicare payments tied to quality or value through alternative payment models.[4]
Major opportunities for cost savings exist across the care continuum, particularly in postacute and transitional care, and hospitalist groups are leading innovative models that show promise for coordinating care and improving value.[5] Individual hospitalists are also in a unique position to provide high‐value care for their patients through advocating for appropriate care and leading local initiatives to improve value of care.[6, 7, 8] This commentary article aims to provide practicing hospitalists with a framework to incorporate these strategies into their daily work.
DESIGN STRATEGIES TO COORDINATE CARE
As delivery systems undertake the task of population health management, hospitalists will inevitably play a critical role in facilitating coordination between community, acute, and postacute care. During admission, discharge, and the hospitalization itself, standardizing care pathways for common hospital conditions such as pneumonia and cellulitis can be effective in decreasing utilization and improving clinical outcomes.[9, 10] Intermountain Healthcare in Utah has applied evidence‐based protocols to more than 60 clinical processes, re‐engineering roughly 80% of all care that they deliver.[11] These types of care redesigns and standardization promise to provide better, more efficient, and often safer care for more patients. Hospitalists can play important roles in developing and delivering on these pathways.
In addition, hospital physician discontinuity during admissions may lead to increased resource utilization, costs, and lower patient satisfaction.[12] Therefore, ensuring clear handoffs between inpatient providers, as well as with outpatient providers during transitions in care, is a vital component of delivering high‐value care. Of particular importance is the population of patients frequently readmitted to the hospital. Hospitalists are often well acquainted with these patients, and the myriad of psychosocial, economic, and environmental challenges this vulnerable population faces. Although care coordination programs are increasing in prevalence, data on their cost‐effectiveness are mixed, highlighting the need for testing innovations.[13] Certainly, hospitalists can be leaders adopting and documenting the effectiveness of spreading interventions that have been shown to be promising in improving care transitions at discharge, such as the Care Transitions Intervention, Project RED (Re‐Engineered Discharge), or the Transitional Care Model.[14, 15, 16]
The University of Chicago, through funding from the Centers for Medicare and Medicaid Innovation, is testing the use of a single physician who cares for frequently admitted patients both in and out of the hospital, thereby reducing the costs of coordination.[5] This comprehensivist model depends on physicians seeing patients in the hospital and then in a clinic located in or near the hospital for the subset of patients who stand to benefit most from this continuity. This differs from the old model of having primary care providers (PCPs) see inpatients and outpatients because the comprehensivist's patient panel is enriched with only patients who are at high risk for hospitalization, and thus these physicians have a more direct focus on hospital‐related care and higher daily hospitalized patient censuses, whereas PCPs were seeing fewer and fewer of their patients in the hospital on a daily basis. Evidence concerning the effectiveness of this model is expected by 2016. Hospitalists have also ventured out of the hospital into skilled nursing facilities, specializing in long‐term care.[17] These physicians are helping provide care to the roughly 1.6 million residents of US nursing homes.[17, 18] Preliminary evidence suggests increased physician staffing is associated with decreased hospitalization of nursing home residents.[18]
ADVOCATE FOR APPROPRIATE CARE
Hospitalists can advocate for appropriate care through avoiding low‐value services at the point of care, as well as learning and teaching about value.
Avoiding Low‐Value Services at the Point of Care
The largest contributor to the approximately $750 billion in annual healthcare waste is unnecessary services, which includes overuse, discretionary use beyond benchmarks, and unnecessary choice of higher‐cost services.[19] Drivers of overuse include medical culture, fee‐for‐service payments, patient expectations, and fear of malpractice litigation.[20] For practicing hospitalists, the most substantial motivation for overuse may be a desire to reassure patients and themselves.[21] Unfortunately, patients commonly overestimate the benefits and underestimate the potential harms of testing and treatments.[22] However, clear communication with patients can reduce overuse, underuse, and misuse.[23]
Specific targets for improving appropriate resource utilization may be identified from resources such as Choosing Wisely lists, guidelines, and appropriateness criteria. The Choosing Wisely campaign has brought together an unprecedented number of medical specialty societies to issue top five lists of things that physicians and patients should question (
| Adult Hospital Medicine Recommendations | Pediatric Hospital Medicine Recommendations |
|---|---|
| 1. Do not place, or leave in place, urinary catheters for incontinence or convenience, or monitoring of output for noncritically ill patients (acceptable indications: critical illness, obstruction, hospice, perioperatively for <2 days or urologic procedures; use weights instead to monitor diuresis). | 1. Do not order chest radiographs in children with uncomplicated asthma or bronchiolitis. |
| 2. Do not prescribe medications for stress ulcer prophylaxis to medical inpatients unless at high risk for gastrointestinal complication. | 2. Do not routinely use bronchodilators in children with bronchiolitis. |
| 3. Avoid transfusing red blood cells just because hemoglobin levels are below arbitrary thresholds such as 10, 9, or even 8 mg/dL in the absence of symptoms. | 3. Do not use systemic corticosteroids in children under 2 years of age with an uncomplicated lower respiratory tract infection. |
| 4. Avoid overuse/unnecessary use of telemetry monitoring in the hospital, particularly for patients at low risk for adverse cardiac outcomes. | 4. Do not treat gastroesophageal reflux in infants routinely with acid suppression therapy. |
| 5. Do not perform repetitive complete blood count and chemistry testing in the face of clinical and lab stability. | 5. Do not use continuous pulse oximetry routinely in children with acute respiratory illness unless they are on supplemental oxygen. |
As an example of this strategy, 1 multi‐institutional group has started training medical students to augment the traditional subjective‐objective‐assessment‐plan (SOAP) daily template with a value section (SOAP‐V), creating a cognitive forcing function to promote discussion of high‐value care delivery.[28] Physicians could include brief thoughts in this section about why they chose a specific intervention, their consideration of the potential benefits and harms compared to alternatives, how it may incorporate the patient's goals and values, and the known and potential costs of the intervention. Similarly, Flanders and Saint recommend that daily progress notes and sign‐outs include the indication, day of administration, and expected duration of therapy for all antimicrobial treatments, as a mechanism for curbing antimicrobial overuse in hospitalized patients.[29] Likewise, hospitalists can also document whether or not a patient needs routine labs, telemetry, continuous pulse oximetry, or other interventions or monitoring. It is not yet clear how effective this type of strategy will be, and drawbacks include creating longer progress notes and requiring more time for documentation. Another approach would be to work with the electronic health record to flag patients who are scheduled for telemetry or other potentially wasteful practices to inspire a daily practice audit to question whether the patient still meets criteria for such care. This approach acknowledges that patient's clinical status changes, and overcomes the inertia that results in so many therapies being continued despite a need or indication.
Communicating With Patients Who Want Everything
Some patients may be more worried about not getting every possible test, rather than concerns regarding associated costs. This may oftentimes be related to patients routinely overestimating the benefits of testing and treatments while not realizing the many potential downstream harms.[22] The perception is that patient demands frequently drive overtesting, but studies suggest the demanding patient is actually much less common than most physicians think.[30]
The Choosing Wisely campaign features video modules that provide a framework and specific examples for physician‐patient communication around some of the Choosing Wisely recommendations (available at:
Clinicians can explain why they do not believe that a test will help a patient and can share their concerns about the potential harms and downstream consequences of a given test. In addition, Consumer Reports and other groups have created trusted resources for patients that provide clear information for the public about unnecessary testing and services.
Learn and Teach Value
Traditionally, healthcare costs have largely remained hidden from both the public and medical professionals.[31, 32] As a result, hospitalists are generally not aware of the costs associated with their care.[33, 34] Although medical education has historically avoided the topic of healthcare costs,[35] recent calls to teach healthcare value have led to new educational efforts.[35, 36, 37] Future generations of medical professionals will be trained in these skills, but current hospitalists should seek opportunities to improve their knowledge of healthcare value and costs.
Fortunately, several resources can fill this gap. In addition to Choosing Wisely and ACR appropriateness criteria discussed above, newer tools focus on how to operationalize these recommendations with patients. The American College of Physicians (ACP) has launched a high‐value care educational platform that includes clinical recommendations, physician resources, curricula and public policy recommendations, and patient resources to help them understand the benefits, harms, and costs of tests and treatments for common clinical issues (
In an effort to provide frontline clinicians with the knowledge and tools necessary to address healthcare value, we have authored a textbook, Understanding Value‐Based Healthcare.[38] To identify the most promising ways of teaching these concepts, we also host the annual Teaching Value & Choosing Wisely Challenge and convene the Teaching Value in Healthcare Learning Network (bit.ly/teachingvaluenetwork) through our nonprofit, Costs of Care.[39]
In addition, hospitalists can also advocate for greater price transparency to help improve cost awareness and drive more appropriate care. The evidence on the effect of transparent costs in the electronic ordering system is evolving. Historically, efforts to provide diagnostic test prices at time of order led to mixed results,[40] but recent studies show clear benefits in resource utilization related to some form of cost display.[41, 42] This may be because physicians care more about healthcare costs and resource utilization than before. Feldman and colleagues found in a controlled clinical trial at Johns Hopkins that providing the costs of lab tests resulted in substantial decreases of certain lab tests and yielded a net cost reduction (based on 2011 Medicare Allowable Rate) of more than $400,000 at the hospital level during the 6‐month intervention period.[41] A recent systematic review concluded that charge information changed ordering and prescribing behavior in the majority of studies.[42] Some hospitalist programs are developing dashboards for various quality and utilization metrics. Sharing ratings or metrics internally or publically is a powerful way to motivate behavior change.[43]
LEAD LOCAL VALUE INITIATIVES
Hospitalists are ideal leaders of local value initiatives, whether it be through running value‐improvement projects or launching formal high‐value care programs.
Conduct Value‐Improvement Projects
Hospitalists across the country have largely taken the lead on designing value‐improvement pilots, programs, and groups within hospitals. Although value‐improvement projects may be built upon the established structures and techniques for quality improvement, importantly these programs should also include expertise in cost analyses.[8] Furthermore, some traditional quality‐improvement programs have failed to result in actual cost savings[44]; thus, it is not enough to simply rebrand quality improvement with a banner of value. Value‐improvement efforts must overcome the cultural hurdle of more care as better care, as well as pay careful attention to the diplomacy required with value improvement, because reducing costs may result in decreased revenue for certain departments or even decreases in individuals' wages.
One framework that we have used to guide value‐improvement project design is COST: culture, oversight accountability, system support, and training.[45] This approach leverages principles from implementation science to ensure that value‐improvement projects successfully provide multipronged tactics for overcoming the many barriers to high‐value care delivery. Figure 1 includes a worksheet for individual clinicians or teams to use when initially planning value‐improvement project interventions.[46] The examples in this worksheet come from a successful project at the University of California, San Francisco aimed at improving blood utilization stewardship by supporting adherence to a restrictive transfusion strategy. To address culture, a hospital‐wide campaign was led by physician peer champions to raise awareness about appropriate transfusion practices. This included posters that featured prominent local physician leaders displaying their support for the program. Oversight was provided through regular audit and feedback. Each month the number of patients on the medicine service who received transfusion with a pretransfusion hemoglobin above 8 grams per deciliter was shared at a faculty lunch meeting and shown on a graph included in the quality newsletter that was widely distributed in the hospital. The ordering system in the electronic medical record was eventually modified to include the patient's pretransfusion hemoglobin level at time of transfusion order and to provide default options and advice based on whether or not guidelines would generally recommend transfusion. Hospitalists and resident physicians were trained through multiple lectures and informal teaching settings about the rationale behind the changes and the evidence that supported a restrictive transfusion strategy.
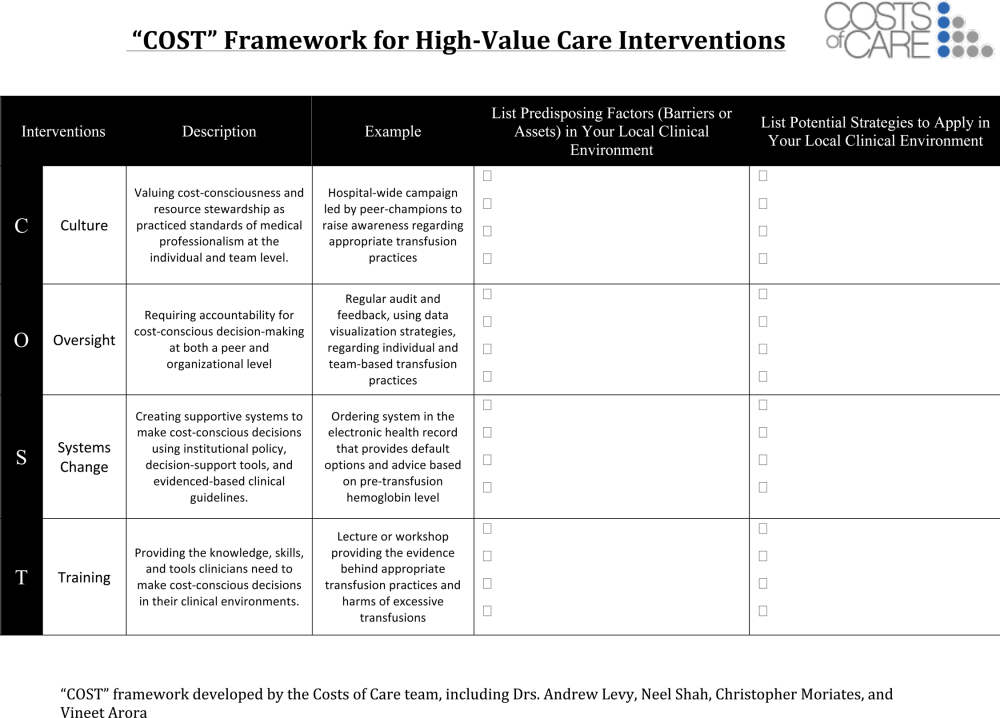
Launch High‐Value Care Programs
As value‐improvement projects grow, some institutions have created high‐value care programs and infrastructure. In March 2012, the University of California, San Francisco Division of Hospital Medicine launched a high‐value care program to promote healthcare value and clinician engagement.[8] The program was led by clinical hospitalists alongside a financial administrator, and aimed to use financial data to identify areas with clear evidence of waste, create evidence‐based interventions that would simultaneously improve quality while cutting costs, and pair interventions with cost awareness education and culture change efforts. In the first year of this program, 6 projects were launched targeting: (1) nebulizer to inhaler transitions,[47] (2) overuse of proton pump inhibitor stress ulcer prophlaxis,[48] (3) transfusions, (4) telemetry, (5) ionized calcium lab ordering, and (6) repeat inpatient echocardiograms.[8]
Similar hospitalist‐led groups have now formed across the country including the Johns Hopkins High‐Value Care Committee, Johns Hopkins Bayview Physicians for Responsible Ordering, and High‐Value Carolina. These groups are relatively new, and best practices and early lessons are still emerging, but all focus on engaging frontline clinicians in choosing targets and leading multipronged intervention efforts.
What About Financial Incentives?
Hospitalist high‐value care groups thus far have mostly focused on intrinsic motivations for decreasing waste by appealing to hospitalists' sense of professionalism and their commitment to improve patient affordability. When financial incentives are used, it is important that they are well aligned with internal motivations for clinicians to provide the best possible care to their patients. The Institute of Medicine recommends that payments are structured in a way to reward continuous learning and improvement in the provision of best care at lower cost.[19] In the Geisinger Health System in Pennsylvania, physician incentives are designed to reward teamwork and collaboration. For example, endocrinologists' goals are based on good control of glucose levels for all diabetes patients in the system, not just those they see.[49] Moreover, a collaborative approach is encouraged by bringing clinicians together across disciplinary service lines to plan, budget, and evaluate one another's performance. These efforts are partly credited with a 43% reduction in hospitalized days and $100 per member per month in savings among diabetic patients.[50]
Healthcare leaders, Drs. Tom Lee and Toby Cosgrove, have made a number of recommendations for creating incentives that lead to sustainable changes in care delivery[49]: avoid attaching large sums to any single target, watch for conflicts of interest, reward collaboration, and communicate the incentive program and goals clearly to clinicians.
In general, when appropriate extrinsic motivators align or interact synergistically with intrinsic motivation, it can promote high levels of performance and satisfaction.[51]
CONCLUSIONS
Hospitalists are now faced with a responsibility to reduce financial harm and provide high‐value care. To achieve this goal, hospitalist groups are developing innovative models for care across the continuum from hospital to home, and individual hospitalists can advocate for appropriate care and lead value‐improvement initiatives in hospitals. Through existing knowledge and new frameworks and tools that specifically address value, hospitalists can champion value at the bedside and ensure their patients get the best possible care at lower costs.
Disclosures: Drs. Moriates, Shah, and Arora have received grant funding from the ABIM Foundation, and royalties from McGraw‐Hill for the textbook Understanding Value‐Based Healthcare. The authors report no conflicts of interest.
- , . Value‐based purchasing—national programs to move from volume to value. N Engl J Med. 2012;367(4):292–295.
- . Value‐driven health care: implications for hospitals and hospitalists. J Hosp Med. 2009;4(8):507–511.
- , . Hospital value‐based purchasing. J Hosp Med. 2013;8(5):271–277.
- . Setting value‐based payment goals—HHS efforts to improve U.S. health care. N Engl J Med. 2015;372(10):897–899.
- , . Redesigning care for patients at increased hospitalization risk: the Comprehensive Care Physician model. Health Aff Proj Hope. 2014;33(5):770–777.
- , , , et al. Choosing wisely in adult hospital medicine: five opportunities for improved healthcare value. J Hosp Med. 2013;8(9):486–492.
- , , . First, do no (financial) harm. JAMA. 2013;310(6):577–578.
- , , , . Development of a hospital‐based program focused on improving healthcare value. J Hosp Med. 2014;9(10):671–677.
- , , , et al. A controlled trial of a critical pathway for treatment of community‐acquired pneumonia. JAMA. 2000;283(6):749–755.
- , , , , . Evidence‐based care pathway for cellulitis improves process, clinical, and cost outcomes [published online July 28, 2015]. J Hosp Med. doi:10.1002/jhm.2433.
- . The Lean approach to health care: safety, quality, and cost. Institute of Medicine. Available at: http://nam.edu/perspectives‐2012‐the‐lean‐approach‐to‐health‐care‐safety‐quality‐and‐cost/. Accessed September 22, 2015.
- , , , et al. The impact of hospitalist discontinuity on hospital cost, readmissions, and patient satisfaction. J Gen Intern Med. 2014;29(7):1004–1008.
- Congressional Budget Office. Lessons from Medicare's Demonstration Projects on Disease Management, Care Coordination, and Value‐Based Payment. Available at: https://www.cbo.gov/publication/42860. Accessed April 26, 2015.
- , , , et al. A reengineered hospital discharge program to decrease rehospitalization: a randomized trial. Ann Intern Med. 2009;150(3):178–187.
- , , , . The care transitions intervention: results of a randomized controlled trial. Arch Intern Med. 2006;166(17):1822–1828.
- , , , et al. Comprehensive discharge planning and home follow‐up of hospitalized elders: a randomized clinical trial. JAMA. 1999;281(7):613–620.
- . “SNFists” at work: nursing home docs patterned after hospitalists. Mod Healthc. 2012;42(13):32–33.
- , , , . Nursing home physician specialists: a response to the workforce crisis in long‐term care. Ann Intern Med. 2009;150(6):411–413.
- Institute of Medicine. Best Care at Lower Cost: The Path to Continuously Learning Health Care in America. Washington, DC: National Academies Press; 2012.
- , . The perfect storm of overutilization. JAMA. 2008;299(23):2789–2791.
- , , , et al. Overuse of testing in preoperative evaluation and syncope: a survey of hospitalists. Ann Intern Med. 2015;162(2):100–108.
- , . Patients' expectations of the benefits and harms of treatments, screening, and tests: a systematic review. JAMA Intern Med. 2015;175(2):274–286.
- , , , et al. Enhancing the Use and Quality of Colorectal Cancer Screening. Rockville, MD: Agency for Healthcare Research and Quality; 2010. Available at: http://www.ncbi.nlm.nih.gov/books/NBK44526. Accessed September 30, 2013.
- , , , et al. Choosing wisely in pediatric hospital medicine: five opportunities for improved healthcare value. J Hosp Med. 2013;8(9):479–485.
- . Teaching Choosing Wisely in medical education and training: the story of a pioneer. The Medical Professionalism Blog. Available at: http://blog.abimfoundation.org/teaching‐choosing‐wisely‐in‐meded. Accessed March 29, 2014.
- American College of Radiology. ACR appropriateness criteria overview. November 2013. Available at: http://www.acr.org/∼/media/ACR/Documents/AppCriteria/Overview.pdf. Accessed March 4, 2014.
- American College of Cardiology Foundation. Appropriate use criteria: what you need to know. Available at: http://www.cardiosource.org/∼/media/Files/Science%20and%20Quality/Quality%20Programs/FOCUS/E1302_AUC_Primer_Update.ashx. Accessed March 4, 2014.
- , , , , . SOAP‐V: applying high‐value care during patient care. The Medical Professionalism Blog. Available at: http://blog.abimfoundation.org/soap‐v‐applying‐high‐value‐care‐during‐patient‐care. Accessed April 3, 2015.
- , . Why does antimicrobial overuse in hospitalized patients persist? JAMA Intern Med. 2014;174(5):661–662.
- . The myth of the demanding patient. JAMA Oncol. 2015;1(1):18–19.
- . The disruptive innovation of price transparency in health care. JAMA. 2013;310(18):1927–1928.
- United States Government Accountability Office. Health Care Price Transparency—Meaningful Price Information Is Difficult for Consumers to Obtain Prior to Receiving Care. Washington, DC: United States Government Accountability Office; 2011:43.
- , , . General pediatric attending physicians' and residents' knowledge of inpatient hospital finances. Pediatrics. 2013;131(6):1072–1080.
- , , . Hospitalists' awareness of patient charges associated with inpatient care. J Hosp Med. 2010;5(5):295–297.
- . Cost consciousness in patient care—what is medical education's responsibility? N Engl J Med. 2010;362(14):1253–1255.
- . Providing high‐value, cost‐conscious care: a critical seventh general competency for physicians. Ann Intern Med. 2011;155(6):386–388.
- , , , . Defining competencies for education in health care value: recommendations from the University of California, San Francisco Center for Healthcare Value Training Initiative. Acad Med. 2015;90(4):421–424.
- , , . Understanding Value‐Based Healthcare. New York: McGraw‐Hill; 2015.
- , , , . Wisdom of the crowd: bright ideas and innovations from the teaching value and choosing wisely challenge. Acad Med. 2015;90(5):624–628.
- , , , et al. Does the computerized display of charges affect inpatient ancillary test utilization? Arch Intern Med. 1997;157(21):2501–2508.
- , , , et al. Impact of providing fee data on laboratory test ordering: a controlled clinical trial. JAMA Intern Med. 2013;173(10):903–908.
- , , , . The effect of charge display on cost of care and physician practice behaviors: a systematic review. J Gen Intern Med. 2015;30(6):835–842.
- , , , , , . Closing the Quality Gap: Revisiting the State of the Science. Vol. 5. Public Reporting as a Quality Improvement Strategy. Rockville, MD: Agency for Healthcare Research and Quality; 2012.
- , , , . The savings illusion—why clinical quality improvement fails to deliver bottom‐line results. N Engl J Med. 2011;365(26):e48.
- , , , . Fostering value in clinical practice among future physicians: time to consider COST. Acad Med. 2014;89(11):1440.
- , , , , , . The Teaching Value Workshop. MedEdPORTAL Publications; 2014. Available at: https://www.mededportal.org/publication/9859. Accessed September 22, 2015.
- , , , , . “Nebs no more after 24”: a pilot program to improve the use of appropriate respiratory therapies. JAMA Intern Med. 2013;173(17):1647–1648.
- , , , et al. The development and implementation of a bundled quality improvement initiative to reduce inappropriate stress ulcer prophylaxis. ICU Dir. 2013;4(6):322–325.
- , . Engaging doctors in the health care revolution. Harvard Business Review. June 2014. Available at: http://hbr.org/2014/06/engaging‐doctors‐in‐the‐health‐care‐revolution/ar/1. Accessed July 30, 2014.
- , , . Geisinger Health System: achieving the potential of system integration through innovation, leadership, measurement, and incentives. June 2009. Available at: http://www.commonwealthfund.org/publications/case‐studies/2009/jun/geisinger‐health‐system‐achieving‐the‐potential‐of‐system‐integration. Accessed September 22, 2015.
- Motivational synergy: toward new conceptualizations of intrinsic and extrinsic motivation in the workplace. Hum Resource Manag 1993;3(3):185–201. Available at: http://www.hbs.edu/faculty/Pages/item.aspx?num=2500. Accessed July 31, 2014.
As the nation considers how to reduce healthcare costs, hospitalists can play a crucial role in this effort because they control many healthcare services through routine clinical decisions at the point of care. In fact, the government, payers, and the public now look to hospitalists as essential partners for reining in healthcare costs.[1, 2] The role of hospitalists is even more critical as payers, including Medicare, seek to shift reimbursements from volume to value.[1] Medicare's Value‐Based Purchasing program has already tied a percentage of hospital payments to metrics of quality, patient satisfaction, and cost,[1, 3] and Health and Human Services Secretary Sylvia Burwell announced that by the end of 2018, the goal is to have 50% of Medicare payments tied to quality or value through alternative payment models.[4]
Major opportunities for cost savings exist across the care continuum, particularly in postacute and transitional care, and hospitalist groups are leading innovative models that show promise for coordinating care and improving value.[5] Individual hospitalists are also in a unique position to provide high‐value care for their patients through advocating for appropriate care and leading local initiatives to improve value of care.[6, 7, 8] This commentary article aims to provide practicing hospitalists with a framework to incorporate these strategies into their daily work.
DESIGN STRATEGIES TO COORDINATE CARE
As delivery systems undertake the task of population health management, hospitalists will inevitably play a critical role in facilitating coordination between community, acute, and postacute care. During admission, discharge, and the hospitalization itself, standardizing care pathways for common hospital conditions such as pneumonia and cellulitis can be effective in decreasing utilization and improving clinical outcomes.[9, 10] Intermountain Healthcare in Utah has applied evidence‐based protocols to more than 60 clinical processes, re‐engineering roughly 80% of all care that they deliver.[11] These types of care redesigns and standardization promise to provide better, more efficient, and often safer care for more patients. Hospitalists can play important roles in developing and delivering on these pathways.
In addition, hospital physician discontinuity during admissions may lead to increased resource utilization, costs, and lower patient satisfaction.[12] Therefore, ensuring clear handoffs between inpatient providers, as well as with outpatient providers during transitions in care, is a vital component of delivering high‐value care. Of particular importance is the population of patients frequently readmitted to the hospital. Hospitalists are often well acquainted with these patients, and the myriad of psychosocial, economic, and environmental challenges this vulnerable population faces. Although care coordination programs are increasing in prevalence, data on their cost‐effectiveness are mixed, highlighting the need for testing innovations.[13] Certainly, hospitalists can be leaders adopting and documenting the effectiveness of spreading interventions that have been shown to be promising in improving care transitions at discharge, such as the Care Transitions Intervention, Project RED (Re‐Engineered Discharge), or the Transitional Care Model.[14, 15, 16]
The University of Chicago, through funding from the Centers for Medicare and Medicaid Innovation, is testing the use of a single physician who cares for frequently admitted patients both in and out of the hospital, thereby reducing the costs of coordination.[5] This comprehensivist model depends on physicians seeing patients in the hospital and then in a clinic located in or near the hospital for the subset of patients who stand to benefit most from this continuity. This differs from the old model of having primary care providers (PCPs) see inpatients and outpatients because the comprehensivist's patient panel is enriched with only patients who are at high risk for hospitalization, and thus these physicians have a more direct focus on hospital‐related care and higher daily hospitalized patient censuses, whereas PCPs were seeing fewer and fewer of their patients in the hospital on a daily basis. Evidence concerning the effectiveness of this model is expected by 2016. Hospitalists have also ventured out of the hospital into skilled nursing facilities, specializing in long‐term care.[17] These physicians are helping provide care to the roughly 1.6 million residents of US nursing homes.[17, 18] Preliminary evidence suggests increased physician staffing is associated with decreased hospitalization of nursing home residents.[18]
ADVOCATE FOR APPROPRIATE CARE
Hospitalists can advocate for appropriate care through avoiding low‐value services at the point of care, as well as learning and teaching about value.
Avoiding Low‐Value Services at the Point of Care
The largest contributor to the approximately $750 billion in annual healthcare waste is unnecessary services, which includes overuse, discretionary use beyond benchmarks, and unnecessary choice of higher‐cost services.[19] Drivers of overuse include medical culture, fee‐for‐service payments, patient expectations, and fear of malpractice litigation.[20] For practicing hospitalists, the most substantial motivation for overuse may be a desire to reassure patients and themselves.[21] Unfortunately, patients commonly overestimate the benefits and underestimate the potential harms of testing and treatments.[22] However, clear communication with patients can reduce overuse, underuse, and misuse.[23]
Specific targets for improving appropriate resource utilization may be identified from resources such as Choosing Wisely lists, guidelines, and appropriateness criteria. The Choosing Wisely campaign has brought together an unprecedented number of medical specialty societies to issue top five lists of things that physicians and patients should question (
| Adult Hospital Medicine Recommendations | Pediatric Hospital Medicine Recommendations |
|---|---|
| 1. Do not place, or leave in place, urinary catheters for incontinence or convenience, or monitoring of output for noncritically ill patients (acceptable indications: critical illness, obstruction, hospice, perioperatively for <2 days or urologic procedures; use weights instead to monitor diuresis). | 1. Do not order chest radiographs in children with uncomplicated asthma or bronchiolitis. |
| 2. Do not prescribe medications for stress ulcer prophylaxis to medical inpatients unless at high risk for gastrointestinal complication. | 2. Do not routinely use bronchodilators in children with bronchiolitis. |
| 3. Avoid transfusing red blood cells just because hemoglobin levels are below arbitrary thresholds such as 10, 9, or even 8 mg/dL in the absence of symptoms. | 3. Do not use systemic corticosteroids in children under 2 years of age with an uncomplicated lower respiratory tract infection. |
| 4. Avoid overuse/unnecessary use of telemetry monitoring in the hospital, particularly for patients at low risk for adverse cardiac outcomes. | 4. Do not treat gastroesophageal reflux in infants routinely with acid suppression therapy. |
| 5. Do not perform repetitive complete blood count and chemistry testing in the face of clinical and lab stability. | 5. Do not use continuous pulse oximetry routinely in children with acute respiratory illness unless they are on supplemental oxygen. |
As an example of this strategy, 1 multi‐institutional group has started training medical students to augment the traditional subjective‐objective‐assessment‐plan (SOAP) daily template with a value section (SOAP‐V), creating a cognitive forcing function to promote discussion of high‐value care delivery.[28] Physicians could include brief thoughts in this section about why they chose a specific intervention, their consideration of the potential benefits and harms compared to alternatives, how it may incorporate the patient's goals and values, and the known and potential costs of the intervention. Similarly, Flanders and Saint recommend that daily progress notes and sign‐outs include the indication, day of administration, and expected duration of therapy for all antimicrobial treatments, as a mechanism for curbing antimicrobial overuse in hospitalized patients.[29] Likewise, hospitalists can also document whether or not a patient needs routine labs, telemetry, continuous pulse oximetry, or other interventions or monitoring. It is not yet clear how effective this type of strategy will be, and drawbacks include creating longer progress notes and requiring more time for documentation. Another approach would be to work with the electronic health record to flag patients who are scheduled for telemetry or other potentially wasteful practices to inspire a daily practice audit to question whether the patient still meets criteria for such care. This approach acknowledges that patient's clinical status changes, and overcomes the inertia that results in so many therapies being continued despite a need or indication.
Communicating With Patients Who Want Everything
Some patients may be more worried about not getting every possible test, rather than concerns regarding associated costs. This may oftentimes be related to patients routinely overestimating the benefits of testing and treatments while not realizing the many potential downstream harms.[22] The perception is that patient demands frequently drive overtesting, but studies suggest the demanding patient is actually much less common than most physicians think.[30]
The Choosing Wisely campaign features video modules that provide a framework and specific examples for physician‐patient communication around some of the Choosing Wisely recommendations (available at:
Clinicians can explain why they do not believe that a test will help a patient and can share their concerns about the potential harms and downstream consequences of a given test. In addition, Consumer Reports and other groups have created trusted resources for patients that provide clear information for the public about unnecessary testing and services.
Learn and Teach Value
Traditionally, healthcare costs have largely remained hidden from both the public and medical professionals.[31, 32] As a result, hospitalists are generally not aware of the costs associated with their care.[33, 34] Although medical education has historically avoided the topic of healthcare costs,[35] recent calls to teach healthcare value have led to new educational efforts.[35, 36, 37] Future generations of medical professionals will be trained in these skills, but current hospitalists should seek opportunities to improve their knowledge of healthcare value and costs.
Fortunately, several resources can fill this gap. In addition to Choosing Wisely and ACR appropriateness criteria discussed above, newer tools focus on how to operationalize these recommendations with patients. The American College of Physicians (ACP) has launched a high‐value care educational platform that includes clinical recommendations, physician resources, curricula and public policy recommendations, and patient resources to help them understand the benefits, harms, and costs of tests and treatments for common clinical issues (
In an effort to provide frontline clinicians with the knowledge and tools necessary to address healthcare value, we have authored a textbook, Understanding Value‐Based Healthcare.[38] To identify the most promising ways of teaching these concepts, we also host the annual Teaching Value & Choosing Wisely Challenge and convene the Teaching Value in Healthcare Learning Network (bit.ly/teachingvaluenetwork) through our nonprofit, Costs of Care.[39]
In addition, hospitalists can also advocate for greater price transparency to help improve cost awareness and drive more appropriate care. The evidence on the effect of transparent costs in the electronic ordering system is evolving. Historically, efforts to provide diagnostic test prices at time of order led to mixed results,[40] but recent studies show clear benefits in resource utilization related to some form of cost display.[41, 42] This may be because physicians care more about healthcare costs and resource utilization than before. Feldman and colleagues found in a controlled clinical trial at Johns Hopkins that providing the costs of lab tests resulted in substantial decreases of certain lab tests and yielded a net cost reduction (based on 2011 Medicare Allowable Rate) of more than $400,000 at the hospital level during the 6‐month intervention period.[41] A recent systematic review concluded that charge information changed ordering and prescribing behavior in the majority of studies.[42] Some hospitalist programs are developing dashboards for various quality and utilization metrics. Sharing ratings or metrics internally or publically is a powerful way to motivate behavior change.[43]
LEAD LOCAL VALUE INITIATIVES
Hospitalists are ideal leaders of local value initiatives, whether it be through running value‐improvement projects or launching formal high‐value care programs.
Conduct Value‐Improvement Projects
Hospitalists across the country have largely taken the lead on designing value‐improvement pilots, programs, and groups within hospitals. Although value‐improvement projects may be built upon the established structures and techniques for quality improvement, importantly these programs should also include expertise in cost analyses.[8] Furthermore, some traditional quality‐improvement programs have failed to result in actual cost savings[44]; thus, it is not enough to simply rebrand quality improvement with a banner of value. Value‐improvement efforts must overcome the cultural hurdle of more care as better care, as well as pay careful attention to the diplomacy required with value improvement, because reducing costs may result in decreased revenue for certain departments or even decreases in individuals' wages.
One framework that we have used to guide value‐improvement project design is COST: culture, oversight accountability, system support, and training.[45] This approach leverages principles from implementation science to ensure that value‐improvement projects successfully provide multipronged tactics for overcoming the many barriers to high‐value care delivery. Figure 1 includes a worksheet for individual clinicians or teams to use when initially planning value‐improvement project interventions.[46] The examples in this worksheet come from a successful project at the University of California, San Francisco aimed at improving blood utilization stewardship by supporting adherence to a restrictive transfusion strategy. To address culture, a hospital‐wide campaign was led by physician peer champions to raise awareness about appropriate transfusion practices. This included posters that featured prominent local physician leaders displaying their support for the program. Oversight was provided through regular audit and feedback. Each month the number of patients on the medicine service who received transfusion with a pretransfusion hemoglobin above 8 grams per deciliter was shared at a faculty lunch meeting and shown on a graph included in the quality newsletter that was widely distributed in the hospital. The ordering system in the electronic medical record was eventually modified to include the patient's pretransfusion hemoglobin level at time of transfusion order and to provide default options and advice based on whether or not guidelines would generally recommend transfusion. Hospitalists and resident physicians were trained through multiple lectures and informal teaching settings about the rationale behind the changes and the evidence that supported a restrictive transfusion strategy.
Launch High‐Value Care Programs
As value‐improvement projects grow, some institutions have created high‐value care programs and infrastructure. In March 2012, the University of California, San Francisco Division of Hospital Medicine launched a high‐value care program to promote healthcare value and clinician engagement.[8] The program was led by clinical hospitalists alongside a financial administrator, and aimed to use financial data to identify areas with clear evidence of waste, create evidence‐based interventions that would simultaneously improve quality while cutting costs, and pair interventions with cost awareness education and culture change efforts. In the first year of this program, 6 projects were launched targeting: (1) nebulizer to inhaler transitions,[47] (2) overuse of proton pump inhibitor stress ulcer prophlaxis,[48] (3) transfusions, (4) telemetry, (5) ionized calcium lab ordering, and (6) repeat inpatient echocardiograms.[8]
Similar hospitalist‐led groups have now formed across the country including the Johns Hopkins High‐Value Care Committee, Johns Hopkins Bayview Physicians for Responsible Ordering, and High‐Value Carolina. These groups are relatively new, and best practices and early lessons are still emerging, but all focus on engaging frontline clinicians in choosing targets and leading multipronged intervention efforts.
What About Financial Incentives?
Hospitalist high‐value care groups thus far have mostly focused on intrinsic motivations for decreasing waste by appealing to hospitalists' sense of professionalism and their commitment to improve patient affordability. When financial incentives are used, it is important that they are well aligned with internal motivations for clinicians to provide the best possible care to their patients. The Institute of Medicine recommends that payments are structured in a way to reward continuous learning and improvement in the provision of best care at lower cost.[19] In the Geisinger Health System in Pennsylvania, physician incentives are designed to reward teamwork and collaboration. For example, endocrinologists' goals are based on good control of glucose levels for all diabetes patients in the system, not just those they see.[49] Moreover, a collaborative approach is encouraged by bringing clinicians together across disciplinary service lines to plan, budget, and evaluate one another's performance. These efforts are partly credited with a 43% reduction in hospitalized days and $100 per member per month in savings among diabetic patients.[50]
Healthcare leaders, Drs. Tom Lee and Toby Cosgrove, have made a number of recommendations for creating incentives that lead to sustainable changes in care delivery[49]: avoid attaching large sums to any single target, watch for conflicts of interest, reward collaboration, and communicate the incentive program and goals clearly to clinicians.
In general, when appropriate extrinsic motivators align or interact synergistically with intrinsic motivation, it can promote high levels of performance and satisfaction.[51]
CONCLUSIONS
Hospitalists are now faced with a responsibility to reduce financial harm and provide high‐value care. To achieve this goal, hospitalist groups are developing innovative models for care across the continuum from hospital to home, and individual hospitalists can advocate for appropriate care and lead value‐improvement initiatives in hospitals. Through existing knowledge and new frameworks and tools that specifically address value, hospitalists can champion value at the bedside and ensure their patients get the best possible care at lower costs.
Disclosures: Drs. Moriates, Shah, and Arora have received grant funding from the ABIM Foundation, and royalties from McGraw‐Hill for the textbook Understanding Value‐Based Healthcare. The authors report no conflicts of interest.
- , . Value‐based purchasing—national programs to move from volume to value. N Engl J Med. 2012;367(4):292–295.
- . Value‐driven health care: implications for hospitals and hospitalists. J Hosp Med. 2009;4(8):507–511.
- , . Hospital value‐based purchasing. J Hosp Med. 2013;8(5):271–277.
- . Setting value‐based payment goals—HHS efforts to improve U.S. health care. N Engl J Med. 2015;372(10):897–899.
- , . Redesigning care for patients at increased hospitalization risk: the Comprehensive Care Physician model. Health Aff Proj Hope. 2014;33(5):770–777.
- , , , et al. Choosing wisely in adult hospital medicine: five opportunities for improved healthcare value. J Hosp Med. 2013;8(9):486–492.
- , , . First, do no (financial) harm. JAMA. 2013;310(6):577–578.
- , , , . Development of a hospital‐based program focused on improving healthcare value. J Hosp Med. 2014;9(10):671–677.
- , , , et al. A controlled trial of a critical pathway for treatment of community‐acquired pneumonia. JAMA. 2000;283(6):749–755.
- , , , , . Evidence‐based care pathway for cellulitis improves process, clinical, and cost outcomes [published online July 28, 2015]. J Hosp Med. doi:10.1002/jhm.2433.
- . The Lean approach to health care: safety, quality, and cost. Institute of Medicine. Available at: http://nam.edu/perspectives‐2012‐the‐lean‐approach‐to‐health‐care‐safety‐quality‐and‐cost/. Accessed September 22, 2015.
- , , , et al. The impact of hospitalist discontinuity on hospital cost, readmissions, and patient satisfaction. J Gen Intern Med. 2014;29(7):1004–1008.
- Congressional Budget Office. Lessons from Medicare's Demonstration Projects on Disease Management, Care Coordination, and Value‐Based Payment. Available at: https://www.cbo.gov/publication/42860. Accessed April 26, 2015.
- , , , et al. A reengineered hospital discharge program to decrease rehospitalization: a randomized trial. Ann Intern Med. 2009;150(3):178–187.
- , , , . The care transitions intervention: results of a randomized controlled trial. Arch Intern Med. 2006;166(17):1822–1828.
- , , , et al. Comprehensive discharge planning and home follow‐up of hospitalized elders: a randomized clinical trial. JAMA. 1999;281(7):613–620.
- . “SNFists” at work: nursing home docs patterned after hospitalists. Mod Healthc. 2012;42(13):32–33.
- , , , . Nursing home physician specialists: a response to the workforce crisis in long‐term care. Ann Intern Med. 2009;150(6):411–413.
- Institute of Medicine. Best Care at Lower Cost: The Path to Continuously Learning Health Care in America. Washington, DC: National Academies Press; 2012.
- , . The perfect storm of overutilization. JAMA. 2008;299(23):2789–2791.
- , , , et al. Overuse of testing in preoperative evaluation and syncope: a survey of hospitalists. Ann Intern Med. 2015;162(2):100–108.
- , . Patients' expectations of the benefits and harms of treatments, screening, and tests: a systematic review. JAMA Intern Med. 2015;175(2):274–286.
- , , , et al. Enhancing the Use and Quality of Colorectal Cancer Screening. Rockville, MD: Agency for Healthcare Research and Quality; 2010. Available at: http://www.ncbi.nlm.nih.gov/books/NBK44526. Accessed September 30, 2013.
- , , , et al. Choosing wisely in pediatric hospital medicine: five opportunities for improved healthcare value. J Hosp Med. 2013;8(9):479–485.
- . Teaching Choosing Wisely in medical education and training: the story of a pioneer. The Medical Professionalism Blog. Available at: http://blog.abimfoundation.org/teaching‐choosing‐wisely‐in‐meded. Accessed March 29, 2014.
- American College of Radiology. ACR appropriateness criteria overview. November 2013. Available at: http://www.acr.org/∼/media/ACR/Documents/AppCriteria/Overview.pdf. Accessed March 4, 2014.
- American College of Cardiology Foundation. Appropriate use criteria: what you need to know. Available at: http://www.cardiosource.org/∼/media/Files/Science%20and%20Quality/Quality%20Programs/FOCUS/E1302_AUC_Primer_Update.ashx. Accessed March 4, 2014.
- , , , , . SOAP‐V: applying high‐value care during patient care. The Medical Professionalism Blog. Available at: http://blog.abimfoundation.org/soap‐v‐applying‐high‐value‐care‐during‐patient‐care. Accessed April 3, 2015.
- , . Why does antimicrobial overuse in hospitalized patients persist? JAMA Intern Med. 2014;174(5):661–662.
- . The myth of the demanding patient. JAMA Oncol. 2015;1(1):18–19.
- . The disruptive innovation of price transparency in health care. JAMA. 2013;310(18):1927–1928.
- United States Government Accountability Office. Health Care Price Transparency—Meaningful Price Information Is Difficult for Consumers to Obtain Prior to Receiving Care. Washington, DC: United States Government Accountability Office; 2011:43.
- , , . General pediatric attending physicians' and residents' knowledge of inpatient hospital finances. Pediatrics. 2013;131(6):1072–1080.
- , , . Hospitalists' awareness of patient charges associated with inpatient care. J Hosp Med. 2010;5(5):295–297.
- . Cost consciousness in patient care—what is medical education's responsibility? N Engl J Med. 2010;362(14):1253–1255.
- . Providing high‐value, cost‐conscious care: a critical seventh general competency for physicians. Ann Intern Med. 2011;155(6):386–388.
- , , , . Defining competencies for education in health care value: recommendations from the University of California, San Francisco Center for Healthcare Value Training Initiative. Acad Med. 2015;90(4):421–424.
- , , . Understanding Value‐Based Healthcare. New York: McGraw‐Hill; 2015.
- , , , . Wisdom of the crowd: bright ideas and innovations from the teaching value and choosing wisely challenge. Acad Med. 2015;90(5):624–628.
- , , , et al. Does the computerized display of charges affect inpatient ancillary test utilization? Arch Intern Med. 1997;157(21):2501–2508.
- , , , et al. Impact of providing fee data on laboratory test ordering: a controlled clinical trial. JAMA Intern Med. 2013;173(10):903–908.
- , , , . The effect of charge display on cost of care and physician practice behaviors: a systematic review. J Gen Intern Med. 2015;30(6):835–842.
- , , , , , . Closing the Quality Gap: Revisiting the State of the Science. Vol. 5. Public Reporting as a Quality Improvement Strategy. Rockville, MD: Agency for Healthcare Research and Quality; 2012.
- , , , . The savings illusion—why clinical quality improvement fails to deliver bottom‐line results. N Engl J Med. 2011;365(26):e48.
- , , , . Fostering value in clinical practice among future physicians: time to consider COST. Acad Med. 2014;89(11):1440.
- , , , , , . The Teaching Value Workshop. MedEdPORTAL Publications; 2014. Available at: https://www.mededportal.org/publication/9859. Accessed September 22, 2015.
- , , , , . “Nebs no more after 24”: a pilot program to improve the use of appropriate respiratory therapies. JAMA Intern Med. 2013;173(17):1647–1648.
- , , , et al. The development and implementation of a bundled quality improvement initiative to reduce inappropriate stress ulcer prophylaxis. ICU Dir. 2013;4(6):322–325.
- , . Engaging doctors in the health care revolution. Harvard Business Review. June 2014. Available at: http://hbr.org/2014/06/engaging‐doctors‐in‐the‐health‐care‐revolution/ar/1. Accessed July 30, 2014.
- , , . Geisinger Health System: achieving the potential of system integration through innovation, leadership, measurement, and incentives. June 2009. Available at: http://www.commonwealthfund.org/publications/case‐studies/2009/jun/geisinger‐health‐system‐achieving‐the‐potential‐of‐system‐integration. Accessed September 22, 2015.
- Motivational synergy: toward new conceptualizations of intrinsic and extrinsic motivation in the workplace. Hum Resource Manag 1993;3(3):185–201. Available at: http://www.hbs.edu/faculty/Pages/item.aspx?num=2500. Accessed July 31, 2014.
© 2015 Society of Hospital Medicine

SOAP‐V Method for Bending the Cost Curve
Today's medical students will enter practice over the next decade and inherit the escalating costs of the US healthcare system. Approximately 30% of healthcare costs, or $750 billion dollars annually, are spent on unnecessary tests or procedures.[1] High healthcare costs combined with calls to eliminate waste, improve patient safety, and increase quality[2] are driving our healthcare system to evolve from a fee‐based system to a value‐based system. Additionally, many patients are being harmed by overtesting and the stress associated with rising healthcare bills. Financial risk has increasingly shifted to patients in the form of higher deductibles and reduced caps, and medical indebtedness is the number 1 risk for bankruptcy.[3, 4] False positive results of low‐yield diagnostic tests lead to additional testing, anxiety, excess radiation exposure, and unnecessary invasive procedures.[5] To minimize harm to patients, evidence must guide physicians in their ordering behavior. In addition, any care plan a physician develops should be individualized to incorporate patients' values and preferences. Unfortunately, medical students, who are at an impressionable stage in their careers, frequently observe overtesting and unnecessary treatment behaviors in their clinical encounters.[6] Instead, our medical students and trainees must be prepared to deliver patient care that is evidence based, patient centered, and cost conscious. They must become effective stewards of limited healthcare resources.
To help prepare our students for this evolving healthcare paradigm, we created a new tool called SOAP‐V (Subjective‐Objective‐Assessment‐PlanValue), designed to embed discussion of healthcare value into medical student oral presentations and note writing. Students are encouraged to use this tool at the point of care to bring up value concepts with physicians and residents as part of medical decision making. In so doing, we propose that medical students can serve as change agents to shift physician practice at our academic medical centers to focus on healthcare value. This article describes the SOAP‐V tool, contains links to educational materials to help hospitalists and other clinician educators to implement this tool, and provides preliminary findings and reflections.
INNOVATION
SOAP‐V was conceived at the Millennium Conference on Teaching High‐Value Care, which was sponsored by the Beth Israel Deaconess Medical Center Shapiro Institute for Education and Research, the Association of American Medical Colleges, and the American College of Physicians. Educators from several medical schools decided to form a group to specifically consider ways to train medical students and residents in the concept of high‐value care (HVC), which is framed as improving patient outcomes while decreasing patient cost and harm.[7] Our group recognized several challenges in teaching HVC. First, physician practice habits are influenced by the way they are trained,[8] yet faculty who teach those future physicians frequently have not themselves been taught, nor do they consistently practice HVC.[9] Second, we needed to teach students the requisite HVC knowledge, attitudes, and skills, and therefore wanted to provide opportunities to not only learn, but practice, HVC, preferably in authentic patient experiences to optimize their learning.[10, 11] Third, we recognized that adding another teaching task to the already oversubscribed day of an attending might understandably be met with resistance. We envisioned a tool that could be used with minimal or no faculty training, could be attached to authentic patient experiences, and based on LEAN‐Six Sigma principles,[12] would be embedded in the normal workflow. Furthermore, we considered social networking principles, such as those described by Christakis and Fowler that describe how an individual's behavior impacts behaviors of those surrounding them,[13] and hoped to empower medical students to serve as change agents. Medical students could initiate discussions of value concepts at the point of care in a way that challenges a heavily entrenched test‐ordering culture and encourages other members of the team to balance potential benefit with harms and cost. Following the conference, the group held bimonthly phone conferences and subsequently developed the SOAP‐V tool, created teaching materials, and planned a research project on SOAP‐V.
SOAP‐V modifies the traditional SOAP (Subjective‐Objective‐Assessment‐Plan) oral presentation or medical note, to include value (V). It serves as a cognitive forcing function designed to create a pause and promote discussions of HVC during patient delivery. It prompts the student to ask 3 value questions: (1) Before choosing an intervention, have I considered whether the result would change management? (2) Have I incorporated the patient's goals and values, and considered the potential harm of the intervention compared to alternatives? (3) What is the known and potential cost of the intervention, both immediate and downstream? The student gathers information during the patient interview and brings back the information to the team during rounds where management decisions are made.
In the summer of 2014, we launched an institutional review boardapproved, multi‐institutional study to implement SOAP‐V at Penn State College of Medicine, Harvard Medical School, and Case Western Reserve University School of Medicine for third‐year medical students during their internal medicine clerkships. Students in the intervention arm participated in an interactive workshop on SOAP‐V. Authors S.F., S.G., and C.D.P., who serve as clerkship directors in internal medicine, provided student training for each cohort of intervention students at the beginning of each rotation on general medicine inpatient wards. The workshop began with trigger videos that demonstrate pressures encountered by a student on rounds that might lead to overuse.[14] Following a discussion on overuse and methods to avoid overuse, the students were introduced to the SOAP‐V framework, watched a video of a student modeling a SOAP‐V presentation on rounds,[15] and engaged in a SOAP‐V role play. They received a SOAP‐V pocket card as well as a Web link to Healthcare Bluebook[16] to research costs. An outline of the session and associated materials can be found in an online attachment.[17] The students then used the SOAP‐V tool during inpatient rounds. We advised supervising faculty that students might present using a SOAP‐V format, and provided them with a SOAP‐V card, but we did not provide faculty development on SOAP‐V. Students participating in the control arm did not receive training specific to SOAP‐V.
Students in intervention and control arms at each school were surveyed on their attitudes toward HVC at the beginning of the clerkship year and then again at the completion of the medicine clerkship via a 19‐item questionnaire soliciting perceptions and self‐reported practices in HVC. Intervention arm students received biweekly e‐mail links that allowed them to anonymously document their use of SOAP‐V, as well as an end‐of‐clerkship open‐ended question about the usefulness of SOAP‐V. We analyzed questionnaire results using McNemar's test for paired data.
PRELIMINARY FINDINGS
The preintervention attitudinal survey (n = 226) demonstrated that although 90% of medical students agreed on the importance of considering costs of treatments, only 50% felt comfortable bringing up cost considerations with their team, and 50% considered costs to the healthcare system in clinical decisions. An interim analysis of the available data at 6 months (response rate approximately 50% across sites) showed that students in the intervention arm reported increased agreement with the phrases, I have the power to address the economic healthcare crisis (pre‐37%, post‐65%, P = 0.046); I would be comfortable initiating a discussion about unnecessary tests or treatments with my team, (pre‐46%, post‐85%, P = 0.027); and In my clinical decisions, I consider the potential costs to the healthcare system (pre‐41%, post‐60%, P = 0.023) compared to control arm students, who showed no significant differences pre‐ versus postrotation in these 3 domains (Figure 1).

To date, biweekly surveys and direct observation of rounds have verified student use of SOAP‐V. Student comments have included: Allowed me the ability to raise important issues with the team while feeling like I was helping my patients and the healthcare system. A great principle that I used almost daily. Great to implement this at such a young stage in my med career. Broadened my perspective on the role of a physician.
SOAP‐V has inspired some of our medical students to consider value in healthcare more closely. In a notable example, a SOAP‐Vtrained student admitted a young man with lymphadenopathy, pulmonary infiltrates, and weight loss who underwent an extensive and costly workup including liver biopsy, bronchoscopy, and multiple computed tomography and positron emission tomography scans and was eventually diagnosed with sarcoidosis. The SOAP‐Vtrained student reviewed the patient's workup, estimated that the team spent more than $6000 to make the diagnosis, and recommended a more cost‐effective approach.
Common barriers experienced by the pilot sites included time constraints limiting discussion of value, variability in perceived receptivity depending on team leadership, and student confidence in initiating this dialogue. Solutions included underscoring the notion that value discussions can be brief, may be appropriately initiated by any member of the team, and may have an effect on choice of management and/or patient preference issues that can make medical care more efficient and effective. Resident and faculty physicians were made aware of the intervention, and encouraged to support students in using the SOAP‐V tool.
CONCLUSION
SOAP‐V was successfully implemented within the inpatient internal medicine clerkship at 3 academic institutions. Our preliminary results demonstrate that students can use this framework to apply considerations of high‐value, cost‐conscious care in their medical decision making and to promote discussion of these concepts during rounds with their inpatient teams. Students in the intervention arm report greater comfort discussing unnecessary tests and treatments with their team and a greater likelihood to consider potential costs to the healthcare system. Additionally, these students commented that the SOAP‐V framework broadened their perspective on their role as a physician in curbing costs, and that they felt more empowered to address the economic healthcare crisis. The next phase of our project will involve conducting end‐of‐year surveys to evaluate whether SOAP‐V has a persistent impact on the frequency and quality of value discussions on rounds, as well as students' attitudes about cost consciousness. We will also gauge whether resident and faculty attitudes about HVC have changed as a result of the intervention.
Our SOAP‐V student training was provided in a 1‐hour session. We believe that the ease of training and the simplicity of the SOAP‐V framework permit SOAP‐V to be easily transferred for use by residents, medical students in other clerkships, and other healthcare learners. Additional research is needed to demonstrate this expanded use and prove sustainability. An additional important question is whether use of SOAP‐V by students and residents results in reductions in unnecessary costs. Future educational efforts will include embedding the SOAP‐V tool in other clerkships and promoting the SOAP‐V tool within corresponding residencies in both hospital and outpatient clinic settings and analyzing potential reductions in wasteful spending.
It is generally conceived that medical students learn the information they are taught, and are impacted by the culture in which they reside; multiple studies bear this out.[18, 19] However, students may also be change agents. Our students will inherit the healthcare systems of the future. We must empower them to change the status quo. There can be tremendous utility in employing such a bottom up approach to process improvement. What a student discusses today may spark the resident (or faculty) to consider in their own workflow tomorrow. In this way, we envision that the SOAP‐V is a tool by which ideas concerning HVC can be generated and shared at the point of care. It is our hope that this straightforward intervention is one that may slowly change the culture and perhaps eventually the practice patterns of our academic medical centers.
Disclosure
Nothing to report.
- Institute of Medicine. The Healthcare Imperative: Lowering Costs and Improving Outcomes. Washington, DC: The National Academies Press; 2010.
- Institute for Healthcare Improvement. IHI triple aim initiative. Available at: http://www.ihi.org/Engage/Initiatives/TripleAim/pages/default.aspx. Accessed August 7, 2015.
- , , , . Medical bankruptcy in the United States, 2007. Am J Med. 2009;122(8):741–746.
- . Kaiser Family Foundation. Health care costs: a primer. Key information on health care costs and their impact. May 2012. Available at: https://kaiserfamilyfoundation.files.wordpress.com/2013/01/7670–03.pdf. Accessed August 7, 2015.
- , . Over‐testing: why more is not better. Am J Med. 2014;127:362–363.
- , , . Medical student perceptions of cost‐conscious care in an internal medicine clerkship: a thematic analysis [published online May 1, 2015]. J Gen Intern Med. doi: 10.1007/s11606‐015‐3324‐4.
- , , , . High‐value, cost‐conscious health care: concepts for clinicians to evaluate the benefits, harms, and costs of medical interventions. Ann Intern Med. 2011;154:174–180.
- . Providing high‐value, cost‐conscious care: a critical seventh general competency for physicians. Ann Intern Med. 2011;155:386–388.
- , , . Teaching value in academic environments: shifting the ivory tower. JAMA. 2013;310(16):1671–1672.
- , , . Theories of teaching. In: The Adult Learner. New York, NY: Routledge; 2012:72–114.
- . Medical education and the maintenance of incompetence. Med Teach. 2006;28:690–696.
- , , , , . Lean Six Sigma in healthcare. J Healthcare Qual. 2006;2:4–11
- , . Connected. New York, NY: Little, Brown 2009.
- Teaching Value Project. Costs of care. Available at: teachingvalue.org Available at: https://www.dropbox.com/s/tb8ysfjtzklwd8g/OverrunPart1.webm; https://www.dropbox.com/s/cxt9mvabj4re4g9/OverrunPart2.webm. Accessed August 7, 2015.
- , , . SOAP‐V [online video]. Available at: https://www.youtube.com/watch?v=goUgAzLuTzY47(2):134–143.
- , , , , , . How medical students learn from residents in the workplace: a qualitative study. Acad Med. 2014:89(3):490–496.
Today's medical students will enter practice over the next decade and inherit the escalating costs of the US healthcare system. Approximately 30% of healthcare costs, or $750 billion dollars annually, are spent on unnecessary tests or procedures.[1] High healthcare costs combined with calls to eliminate waste, improve patient safety, and increase quality[2] are driving our healthcare system to evolve from a fee‐based system to a value‐based system. Additionally, many patients are being harmed by overtesting and the stress associated with rising healthcare bills. Financial risk has increasingly shifted to patients in the form of higher deductibles and reduced caps, and medical indebtedness is the number 1 risk for bankruptcy.[3, 4] False positive results of low‐yield diagnostic tests lead to additional testing, anxiety, excess radiation exposure, and unnecessary invasive procedures.[5] To minimize harm to patients, evidence must guide physicians in their ordering behavior. In addition, any care plan a physician develops should be individualized to incorporate patients' values and preferences. Unfortunately, medical students, who are at an impressionable stage in their careers, frequently observe overtesting and unnecessary treatment behaviors in their clinical encounters.[6] Instead, our medical students and trainees must be prepared to deliver patient care that is evidence based, patient centered, and cost conscious. They must become effective stewards of limited healthcare resources.
To help prepare our students for this evolving healthcare paradigm, we created a new tool called SOAP‐V (Subjective‐Objective‐Assessment‐PlanValue), designed to embed discussion of healthcare value into medical student oral presentations and note writing. Students are encouraged to use this tool at the point of care to bring up value concepts with physicians and residents as part of medical decision making. In so doing, we propose that medical students can serve as change agents to shift physician practice at our academic medical centers to focus on healthcare value. This article describes the SOAP‐V tool, contains links to educational materials to help hospitalists and other clinician educators to implement this tool, and provides preliminary findings and reflections.
INNOVATION
SOAP‐V was conceived at the Millennium Conference on Teaching High‐Value Care, which was sponsored by the Beth Israel Deaconess Medical Center Shapiro Institute for Education and Research, the Association of American Medical Colleges, and the American College of Physicians. Educators from several medical schools decided to form a group to specifically consider ways to train medical students and residents in the concept of high‐value care (HVC), which is framed as improving patient outcomes while decreasing patient cost and harm.[7] Our group recognized several challenges in teaching HVC. First, physician practice habits are influenced by the way they are trained,[8] yet faculty who teach those future physicians frequently have not themselves been taught, nor do they consistently practice HVC.[9] Second, we needed to teach students the requisite HVC knowledge, attitudes, and skills, and therefore wanted to provide opportunities to not only learn, but practice, HVC, preferably in authentic patient experiences to optimize their learning.[10, 11] Third, we recognized that adding another teaching task to the already oversubscribed day of an attending might understandably be met with resistance. We envisioned a tool that could be used with minimal or no faculty training, could be attached to authentic patient experiences, and based on LEAN‐Six Sigma principles,[12] would be embedded in the normal workflow. Furthermore, we considered social networking principles, such as those described by Christakis and Fowler that describe how an individual's behavior impacts behaviors of those surrounding them,[13] and hoped to empower medical students to serve as change agents. Medical students could initiate discussions of value concepts at the point of care in a way that challenges a heavily entrenched test‐ordering culture and encourages other members of the team to balance potential benefit with harms and cost. Following the conference, the group held bimonthly phone conferences and subsequently developed the SOAP‐V tool, created teaching materials, and planned a research project on SOAP‐V.
SOAP‐V modifies the traditional SOAP (Subjective‐Objective‐Assessment‐Plan) oral presentation or medical note, to include value (V). It serves as a cognitive forcing function designed to create a pause and promote discussions of HVC during patient delivery. It prompts the student to ask 3 value questions: (1) Before choosing an intervention, have I considered whether the result would change management? (2) Have I incorporated the patient's goals and values, and considered the potential harm of the intervention compared to alternatives? (3) What is the known and potential cost of the intervention, both immediate and downstream? The student gathers information during the patient interview and brings back the information to the team during rounds where management decisions are made.
In the summer of 2014, we launched an institutional review boardapproved, multi‐institutional study to implement SOAP‐V at Penn State College of Medicine, Harvard Medical School, and Case Western Reserve University School of Medicine for third‐year medical students during their internal medicine clerkships. Students in the intervention arm participated in an interactive workshop on SOAP‐V. Authors S.F., S.G., and C.D.P., who serve as clerkship directors in internal medicine, provided student training for each cohort of intervention students at the beginning of each rotation on general medicine inpatient wards. The workshop began with trigger videos that demonstrate pressures encountered by a student on rounds that might lead to overuse.[14] Following a discussion on overuse and methods to avoid overuse, the students were introduced to the SOAP‐V framework, watched a video of a student modeling a SOAP‐V presentation on rounds,[15] and engaged in a SOAP‐V role play. They received a SOAP‐V pocket card as well as a Web link to Healthcare Bluebook[16] to research costs. An outline of the session and associated materials can be found in an online attachment.[17] The students then used the SOAP‐V tool during inpatient rounds. We advised supervising faculty that students might present using a SOAP‐V format, and provided them with a SOAP‐V card, but we did not provide faculty development on SOAP‐V. Students participating in the control arm did not receive training specific to SOAP‐V.
Students in intervention and control arms at each school were surveyed on their attitudes toward HVC at the beginning of the clerkship year and then again at the completion of the medicine clerkship via a 19‐item questionnaire soliciting perceptions and self‐reported practices in HVC. Intervention arm students received biweekly e‐mail links that allowed them to anonymously document their use of SOAP‐V, as well as an end‐of‐clerkship open‐ended question about the usefulness of SOAP‐V. We analyzed questionnaire results using McNemar's test for paired data.
PRELIMINARY FINDINGS
The preintervention attitudinal survey (n = 226) demonstrated that although 90% of medical students agreed on the importance of considering costs of treatments, only 50% felt comfortable bringing up cost considerations with their team, and 50% considered costs to the healthcare system in clinical decisions. An interim analysis of the available data at 6 months (response rate approximately 50% across sites) showed that students in the intervention arm reported increased agreement with the phrases, I have the power to address the economic healthcare crisis (pre‐37%, post‐65%, P = 0.046); I would be comfortable initiating a discussion about unnecessary tests or treatments with my team, (pre‐46%, post‐85%, P = 0.027); and In my clinical decisions, I consider the potential costs to the healthcare system (pre‐41%, post‐60%, P = 0.023) compared to control arm students, who showed no significant differences pre‐ versus postrotation in these 3 domains (Figure 1).
To date, biweekly surveys and direct observation of rounds have verified student use of SOAP‐V. Student comments have included: Allowed me the ability to raise important issues with the team while feeling like I was helping my patients and the healthcare system. A great principle that I used almost daily. Great to implement this at such a young stage in my med career. Broadened my perspective on the role of a physician.
SOAP‐V has inspired some of our medical students to consider value in healthcare more closely. In a notable example, a SOAP‐Vtrained student admitted a young man with lymphadenopathy, pulmonary infiltrates, and weight loss who underwent an extensive and costly workup including liver biopsy, bronchoscopy, and multiple computed tomography and positron emission tomography scans and was eventually diagnosed with sarcoidosis. The SOAP‐Vtrained student reviewed the patient's workup, estimated that the team spent more than $6000 to make the diagnosis, and recommended a more cost‐effective approach.
Common barriers experienced by the pilot sites included time constraints limiting discussion of value, variability in perceived receptivity depending on team leadership, and student confidence in initiating this dialogue. Solutions included underscoring the notion that value discussions can be brief, may be appropriately initiated by any member of the team, and may have an effect on choice of management and/or patient preference issues that can make medical care more efficient and effective. Resident and faculty physicians were made aware of the intervention, and encouraged to support students in using the SOAP‐V tool.
CONCLUSION
SOAP‐V was successfully implemented within the inpatient internal medicine clerkship at 3 academic institutions. Our preliminary results demonstrate that students can use this framework to apply considerations of high‐value, cost‐conscious care in their medical decision making and to promote discussion of these concepts during rounds with their inpatient teams. Students in the intervention arm report greater comfort discussing unnecessary tests and treatments with their team and a greater likelihood to consider potential costs to the healthcare system. Additionally, these students commented that the SOAP‐V framework broadened their perspective on their role as a physician in curbing costs, and that they felt more empowered to address the economic healthcare crisis. The next phase of our project will involve conducting end‐of‐year surveys to evaluate whether SOAP‐V has a persistent impact on the frequency and quality of value discussions on rounds, as well as students' attitudes about cost consciousness. We will also gauge whether resident and faculty attitudes about HVC have changed as a result of the intervention.
Our SOAP‐V student training was provided in a 1‐hour session. We believe that the ease of training and the simplicity of the SOAP‐V framework permit SOAP‐V to be easily transferred for use by residents, medical students in other clerkships, and other healthcare learners. Additional research is needed to demonstrate this expanded use and prove sustainability. An additional important question is whether use of SOAP‐V by students and residents results in reductions in unnecessary costs. Future educational efforts will include embedding the SOAP‐V tool in other clerkships and promoting the SOAP‐V tool within corresponding residencies in both hospital and outpatient clinic settings and analyzing potential reductions in wasteful spending.
It is generally conceived that medical students learn the information they are taught, and are impacted by the culture in which they reside; multiple studies bear this out.[18, 19] However, students may also be change agents. Our students will inherit the healthcare systems of the future. We must empower them to change the status quo. There can be tremendous utility in employing such a bottom up approach to process improvement. What a student discusses today may spark the resident (or faculty) to consider in their own workflow tomorrow. In this way, we envision that the SOAP‐V is a tool by which ideas concerning HVC can be generated and shared at the point of care. It is our hope that this straightforward intervention is one that may slowly change the culture and perhaps eventually the practice patterns of our academic medical centers.
Disclosure
Nothing to report.
- Institute of Medicine. The Healthcare Imperative: Lowering Costs and Improving Outcomes. Washington, DC: The National Academies Press; 2010.
- Institute for Healthcare Improvement. IHI triple aim initiative. Available at: http://www.ihi.org/Engage/Initiatives/TripleAim/pages/default.aspx. Accessed August 7, 2015.
- , , , . Medical bankruptcy in the United States, 2007. Am J Med. 2009;122(8):741–746.
- . Kaiser Family Foundation. Health care costs: a primer. Key information on health care costs and their impact. May 2012. Available at: https://kaiserfamilyfoundation.files.wordpress.com/2013/01/7670–03.pdf. Accessed August 7, 2015.
- , . Over‐testing: why more is not better. Am J Med. 2014;127:362–363.
- , , . Medical student perceptions of cost‐conscious care in an internal medicine clerkship: a thematic analysis [published online May 1, 2015]. J Gen Intern Med. doi: 10.1007/s11606‐015‐3324‐4.
- , , , . High‐value, cost‐conscious health care: concepts for clinicians to evaluate the benefits, harms, and costs of medical interventions. Ann Intern Med. 2011;154:174–180.
- . Providing high‐value, cost‐conscious care: a critical seventh general competency for physicians. Ann Intern Med. 2011;155:386–388.
- , , . Teaching value in academic environments: shifting the ivory tower. JAMA. 2013;310(16):1671–1672.
- , , . Theories of teaching. In: The Adult Learner. New York, NY: Routledge; 2012:72–114.
- . Medical education and the maintenance of incompetence. Med Teach. 2006;28:690–696.
- , , , , . Lean Six Sigma in healthcare. J Healthcare Qual. 2006;2:4–11
- , . Connected. New York, NY: Little, Brown 2009.
- Teaching Value Project. Costs of care. Available at: teachingvalue.org Available at: https://www.dropbox.com/s/tb8ysfjtzklwd8g/OverrunPart1.webm; https://www.dropbox.com/s/cxt9mvabj4re4g9/OverrunPart2.webm. Accessed August 7, 2015.
- , , . SOAP‐V [online video]. Available at: https://www.youtube.com/watch?v=goUgAzLuTzY47(2):134–143.
- , , , , , . How medical students learn from residents in the workplace: a qualitative study. Acad Med. 2014:89(3):490–496.
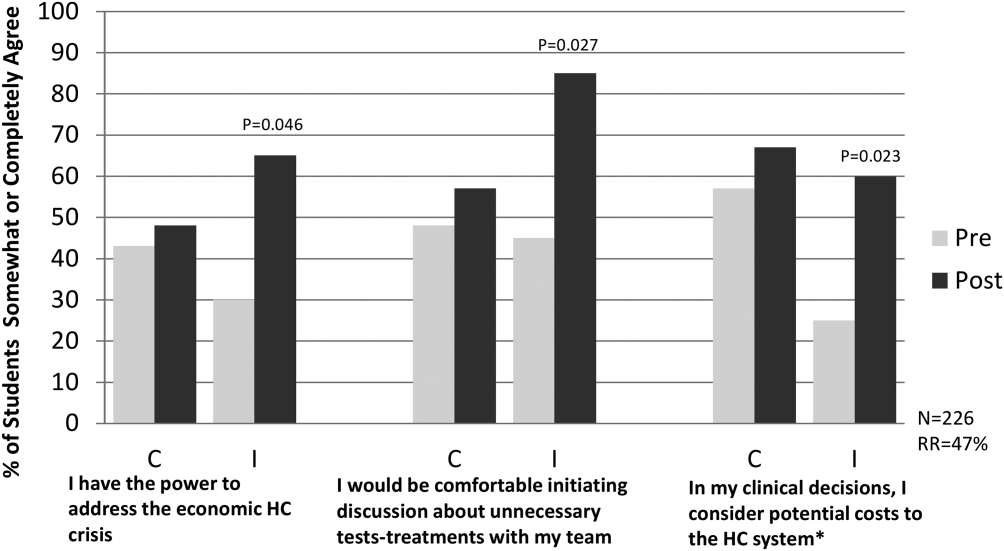
Telemetry Use for LOS and Cost Reduction
Inpatient hospital services are a major component of total US civilian noninstitutionalized healthcare expenses, accounting for 29.3% of spending in 2009[1] when the average cost per stay was $9700.[2] Telemetry monitoring, a widely used resource for the identification of life‐threatening arrhythmias, contributes to these costs. In 1998, Sivaram et al. estimated the cost per patient at $683; in 2010, Ivonye et al. published the cost difference between a telemetry bed and a nonmonitored bed in their inner‐city public teaching facility reached $800.[3, 4]
In 1991, the American College of Cardiology published guidelines for telemetry use, which were later revised by the American Heart Association in 2004.[5, 6] Notably, the guidelines are based on expert opinion and on research data in electrocardiography.[7] The guidelines divide patients into 3 classes based on clinical condition: recommending telemetry monitoring for almost all class I patients, stating possible benefit in class II patients, and discouraging cardiac monitoring for the low‐risk class III patients.[5, 6] The Choosing Wisely campaign, an initiative of the American Board of Internal Medicine and the Society of Hospital Medicine, highlights telemetry monitoring as 1 of the top 5 interventions that physicians and patients should question when determining tests and procedures.[8] Choosing Wisely suggests using a protocol to govern continuation of telemetry outside of the intensive care unit (ICU), as inappropriate monitoring increases care costs and may result in patient harm.[8] The Joint Commission 2014 National Patient Safety Goals notes that numerous alarm signals and the resulting noise and displayed information tends to desensitize staff and cause them to miss or ignore alarm signals or even disable them.[9]
Few studies have examined implementation methods for improved telemetry bed utilization. One study evaluated the impact of a multispecialty telemetry policy with enforcement by an outside cardiologist and nurse team, noting improved cardiac monitoring bed utilization and decreased academic hospital closure, which previously resulted in inability to accept new patients or procedure cancellation.[10] Another study provided an orientation handout discussed by the chief resident and telemetry indication reviews during multidisciplinary rounds 3 times a week.[11]
Our study is one the first to demonstrate a model for a hospitalist‐led approach to guide appropriate telemetry use. We investigated the impact of a multipronged approach to guide telemetry usage: (1) a hospitalist‐led, daily review of bed utilization during attending rounds, (2) a hospitalist attending‐driven, trainee‐focused education module on telemetry utilization, (3) quarterly feedback on telemetry bed utilization rates, and (4) financial incentives. We analyzed pre‐ and post‐evaluation results from the education module to measure impact on knowledge, skills, and attitudes. Additionally, we evaluated the effect of the intervention on length of stay (LOS) and bed utilization costs, while monitoring case mix index (CMI) and overall mortality.
METHODS
Setting
This study took place at Stanford Hospital and Clinics, a teaching academic center in Stanford, California. Stanford Hospital is a 444‐bed, urban medical center with 114 telemetry intermediate ICU beds, and 66 ICU beds. The 264 medicalsurgical beds lack telemetry monitoring, which can only be completed in the intermediate and full ICU. All patients on telemetry units receive both cardiac monitoring and increased nursing ratios. Transfer orders are placed in the electronic medical record to shift patients between care levels. Bed control attempts to transfer patients as soon as an open bed in the appropriate care level exists.
The study included all 5 housestaff inpatient general internal medicine wards teams (which excludes cardiology, pulmonary hypertension, hematology, oncology, and post‐transplant patients). Hospitalists and nonhospitalists attend on the wards for 1‐ to 2‐week blocks. Teaching teams are staffed by 1 to 2 medical students, 2 interns, 1 resident, and 1 attending. The university institutional review board notice of determination waived review for this study because it was classified as quality improvement.
Participants
Ten full‐ and part‐time hospitalist physicians participated in the standardized telemetry teaching. Fifty‐six of the approximately 80 medical students and housestaff on hospitalists' teams completed the educational evaluation. Both hospitalist and nonhospitalist teams participated in daily multidisciplinary rounds, focusing on barriers to discharge including telemetry use. Twelve nonhospitalists served on the wards during the intervention period. Hospitalists covered 72% of the internal medicine wards during the intervention period.
Study Design
We investigated the impact of a multipronged approach to guide telemetry usage from January 2013 to August 2013 (intervention period).
Hospitalist‐Led Daily Review of Bed Utilization
Hospitalists were encouraged to discuss the need of telemetry on daily attending rounds and review indications for telemetry while on service. Prior to starting a ward block, attendings were emailed the teaching module with a reminder to discuss the need for telemetry on attending rounds. Reminders to discuss telemetry utilization were also provided during every‐other‐week hospitalist meetings. Compliance of daily discussion was not tracked.
Hospitalist‐Driven, Trainee‐Focused, Education Module on Telemetry Utilization
The educational module was taught during teaching sessions only by the hospitalists. Trainees on nonhospitalist teams did not receive dedicated teaching about telemetry usage. The module was given to learners only once. The module was a 10‐slide, Microsoft PowerPoint (Microsoft Corp., Redmond, WA) presentation that reviewed the history of telemetry, the American College of Cardiology and the American Heart Association guidelines, the cost difference between telemetry and nonmonitored beds, and the perceived barriers to discontinuation. The presentation was accompanied by a pre‐ and post‐evaluation to elicit knowledge, skills, and attitudes of telemetry use (see Supporting Information, Appendix A, in the online version of this article). The pre‐ and post‐evaluations were created through consensus with a multidisciplinary, expert panel after reviewing the evidence‐based literature.
Quarterly Feedback on Telemetry Bed Utilization Rates
Hospital beduse and CMI data were obtained from the Stanford finance department for the intervention period and for the baseline period, which was the year prior to the study, January 1, 2012 to December 31, 2012. Hospital beduse data included the number of days patients were on telemetry units versus medicalsurgical units (nontelemetry units), differentiated by hospitalists and nonhospitalists. Cost savings were calculated by the Stanford finance department that used Stanford‐specific, internal cost accounting data to determine the impact of the intervention. These data were reviewed at hospitalist meetings on a quarterly basis. We also obtained the University Healthsystem Consortium mortality index (observed to expected) for the general internal medicine service during the baseline and intervention periods.
To measure sustainment of telemetry reduction in the postintervention period, we measured telemetry LOS from September 2014 to March 2015 (extension period).
Financial Incentives
Hospitalists were provided a $2000 bonus at the end of fiscal year 2013 if the group showed a decrease in telemetry bed use in comparison to the baseline period.
Statistical Analysis of Clinical Outcome Measures
Continuous outcomes were tested using 2‐tailed t tests. Comparison of continuous outcome included differences in telemetry and nontelemetry LOS and CMI. Pairwise comparisons were made for various time periods. A P value of <0.05 was considered statistically significant. Statistical analyses were performed using Stata 12.0 software (StataCorp, College Station, TX).
RESULTS
Clinical and Value Outcomes
Baseline (January 2012December 2012) Versus Intervention Period (January 2013August 2013)
LOS for telemetry beds was significantly reduced over the intervention period (2.75 days vs 2.13 days, P=0.005) for hospitalists. Notably, there was no significant difference in mean LOS between baseline and intervention periods for nontelemetry beds (2.84 days vs 2.72 days, P=0.32) for hospitalists. In comparison, for nonhospitalists, there was no difference in mean LOS for telemetry beds between baseline and intervention periods (2.75 days vs 2.46 days, P=0.33) and nontelemetry beds (2.64 days vs 2.89 days, P=0.26) (Table 1).
| Baseline Period | Intervention Period | P Value | Extension Period | P Value | |
|---|---|---|---|---|---|
| |||||
| Length of stay | |||||
| Hospitalists | |||||
| Telemetry beds | 2.75 | 2.13 | 0.005 | 1.93 | 0.09 |
| Nontelemetry beds | 2.84 | 2.72 | 0.324 | 2.44 | 0.21 |
| Nonhospitalists | |||||
| Telemetry beds | 2.75 | 2.46 | 0.331 | 2.22 | 0.43 |
| Nontelemetry beds | 2.64 | 2.89 | 0.261 | 2.26 | 0.05 |
| Case mix index | |||||
| Hospitalists | 1.44 | 1.45 | 0.68 | 1.40 | 0.21 |
| Nonhospitalists | 1.46 | 1.40 | 0.53 | 1.53 | 0.18 |
Costs of hospital stay were also reduced in the multipronged, hospitalist‐driven intervention group. Expenditures for telemetry beds were reduced by 22.5% over the intervention period for hospitalists (Table 2).
| Baseline to Intervention Period | Intervention to Extension Period | |
|---|---|---|
| ||
| Hospitalists | ||
| Telemetry beds | 22.55% | 9.55% |
| Nontelemetry beds | 4.23% | 10.14% |
| Nonhospitalists | ||
| Telemetry beds | 10.55% | 9.89% |
| Nontelemetry beds | 9.47% | 21.84% |
The mean CMI of the patient cohort managed by the hospitalists in the baseline and intervention periods was not significantly different (1.44 vs 1.45, P=0.68). The mean CMI of the patients managed by the nonhospitalists in the baseline and intervention periods was also not significantly different (1.46 vs 1.40, P=0.53) (Table 1). Mortality index during the baseline and intervention periods was not significantly different (0.770.22 vs 0.660.23, P=0.54), as during the intervention and extension periods (0.660.23 vs 0.650.15, P=0.95).
Intervention Period (January 2013August 2013) Versus Extension Period (September 2014‐March 2015)
The decreased telemetry LOS for hospitalists was sustained from the intervention period to the extension period, from 2.13 to 1.93 (P=0.09). There was no significant change in the nontelemetry LOS in the intervention period compared to the extension period (2.72 vs 2.44, P=0.21). There was no change in the telemetry LOS for nonhospitalists from the intervention period to the extension period (2.46 vs 2.22, P=0.43).
The mean CMI in the hospitalist group was not significantly different in the intervention period compared to the extension period (1.45 to 1.40, P=0.21). The mean CMI in the nonhospitalist group did not change from the intervention period to the extension period (1.40 vs 1.53, P=0.18) (Table 1).
Education Outcomes
Out of the 56 participants completing the education module and survey, 28.6% were medical students, 53.6% were interns, 12.5% were second‐year residents, and 5.4% were third‐year residents. Several findings were seen at baseline via pretest. In evaluating patterns of current telemetry use, 32.2% of participants reported evaluating the necessity of telemetry for patients on admission only, 26.3% during transitions of care, 5.1% after discharge plans were cemented, 33.1% on a daily basis, and 3.4% rarely. When asked which member of the care team was most likely to encourage use of appropriate telemetry, 20.8% identified another resident, 13.9% nursing, 37.5% attending physician, 20.8% self, 4.2% the team as a whole, and 2.8% as not any.
Figure 1 shows premodule results regarding the trainees perceived percentage of patient encounters during which a participant's team discussed their patient's need for telemetry.
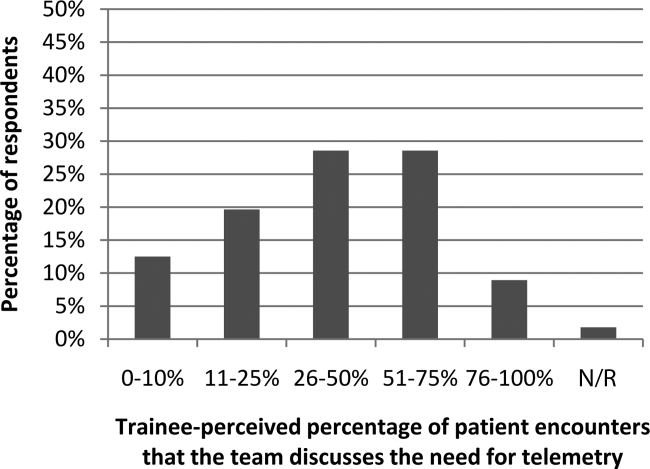
In assessing perception of current telemetry utilization, 1.8% of participants thought 0% to 10% of patients were currently on telemetry, 19.6% thought 11% to 20%, 42.9% thought 21% to 31%, 30.4% thought 31% to 40%, and 3.6% thought 41% to 50%.
Two areas were assessed at both baseline and after the intervention: knowledge of indications of telemetry use and cost related to telemetry use. We saw increased awareness of cost‐saving actions. To assess current knowledge of the indications of proper telemetry use according to American Heart Association guidelines, participants were presented with a list of 5 patients with different clinical indications for telemetry use and asked which patient required telemetry the most. Of the participants, 54.5% identified the correct answer in the pretest and 61.8% identified the correct answer in the post‐test. To assess knowledge of the costs of telemetry relative to other patient care, participants were presented with a patient case and asked to identify the most and least cost‐saving actions to safely care for the patient. When asked to identify the most cost‐saving action, 20.3% identified the correct answer in the pretest and 61.0% identified the correct answer in the post‐test. Of those who answered incorrectly in the pretest, 51.1% answered correctly in the post‐test (P=0.002). When asked to identify the least cost‐saving action, 23.7% identified the correct answer in the pretest and 50.9% identified the correct answer in the posttest. Of those who answered incorrectly in the pretest, 60.0% answered correctly in the post‐test (P=0.003).
In the post‐test, when asked about the importance of appropriate telemetry usage in providing cost‐conscious care and assuring appropriate hospital resource management, 76.8% of participants found the need very important, 21.4% somewhat important, and 1.8% as not applicable. The most commonly perceived barriers impeding discontinuation of telemetry, as reported by participants via post‐test, were nursing desires and time. Figure 2 shows all perceived barriers.
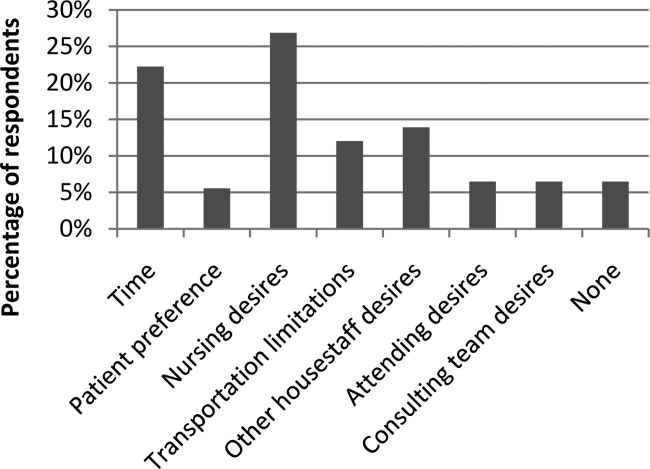
DISCUSSION
Our study is one of the first to our knowledge to demonstrate reductions in telemetry LOS by a hospitalist intervention for telemetry utilization. Others[10, 11] have studied the impact of an orientation handout by chief residents or a multispecialty telemetry policy with enforcement by an outside cardiologist and nurse team. Dressler et al. later sustained a 70% reduction in telemetry use without adversely affecting patient safety, as assessed through numbers of rapid response activations, codes, and deaths, through integrating the AHA guidelines into their electronic ordering system.[12] However, our study has the advantage of the primary team, who knows the patient and clinical scenario best, driving the change during attending rounds. In an era where cost consciousness intersects the practice of medicine, any intervention in patient care that demonstrates cost savings without an adverse impact on patient care and resource utilization must be emphasized. This is particularly important in academic institutions, where residents and medical students are learning to integrate the principles of patient safety and quality improvement into their clinical practice.[13] We actually showed sustained telemetry LOS reductions into the extension period after our intervention. We believe this may be due to telemetry triage being integrated into our attending and resident rounding practices. Future work should include integration of telemetry triage into clinical decision support in the electronic medical record and multidisciplinary rounds to disseminate telemetry triage hospital‐wide in both the academic and community settings.
Our study also revealed that nearly half of participants were not aware of the criteria for appropriate utilization of telemetry before our intervention; in the preintervention period, there were many anecdotal and objective findings of inappropriate utilization of telemetry as well as prolonged continuation beyond the clinical needs in both the hospitalist and nonhospitalist group. For the hospitalist group (ie, the group receiving guideline‐based education on appropriate indications for telemetry utilization), there was an assessment of both appropriate usage and timely discontinuation of telemetry in the postintervention period, which we attribute in large part to adherence to the education provided to this group.
We were able to show increased knowledge of cost‐saving actions among trainees with our educational module. We believe it is imperative to educate our providers (physicians, nurses, case managers, and students within these disciplines) on the appropriate indications for telemetry use, not only to help with cost savings and resource availability (ie, allowing telemetry beds to be available for patients who need them most), but also to instill consistent expectations among our patients. For the hospitalist group (ie, the group receiving guideline‐based education on appropriate indications for telemetry utilization), there was an assessment of both appropriate usage and timely discontinuation of telemetry in the postintervention period, which we attribute in large part to adherence to the education provided to this group.
Additionally, we feel it is important to consider the impacts of inappropriate use of telemetry from a patient's perspective: it is physically restrictive/emnconvenient, alarms are disruptive, it can be a barrier for other treatments such as physical therapy, it may increase the time it takes for imaging studies, a nurse may be required to accompany patients on telemetry, and poses additional costs to their medical bill.
We believe our success is due to several strategies. First, at the start of the fiscal year when quality improvement metrics are established, this particular metric (improving the appropriate utilization and timely discontinuation of telemetry) was deemed important by all hospitalists, engendering group buy‐in prior to the intervention. Our hospitalists received a detailed and interactive tutorial session in person at the beginning of the study. This tutorial provided the hospitalists with a comprehensive understanding of the appropriate (and inappropriate) indications for telemetry monitoring, hence facilitating guideline‐directed utilization. Email reminders and the tutorial tool were provided each time a hospitalist attended on the wards, and hospitalists received a small financial incentive to comply with appropriate telemetry utilization.
Our study has several strengths. First, the time frame of our study was long enough (8 months) to allow consistent trends to emerge and to optimize exposure of housestaff and medical students to this quality‐improvement initiative. Second, our cost savings came from 2 factors, direct reduction of inappropriate telemetry use and reduction in length of stay, highlighting the dual impact of appropriate telemetry utilization on cost. The overall reductions in telemetry utilization for the intervention group were a result of both reductions in initial placement on telemetry for patients who did not meet criteria for such monitoring as well as timely discontinuation of telemetry during the patient's hospitalization. Third, our study demonstrates that physicians can be effective in driving appropriate telemetry usage by participating in the clinical decision making regarding necessity and educating providers, trainees/students, and patients on appropriate indications. Finally, we show sustainment of our intervention in the extension period, suggesting telemetry triage integration into rounding practice.
Our study has limitations as well. First, our sample size is relatively small at a single academic center. Second, due to complexities in our faculty scheduling, we were unable to completely randomize patients to a hospitalist versus nonhospitalist team. However, we believe that despite the inability to randomize, our study does show the benefit of a hospitalist attending to reduce telemetry LOS given there was no change in nonhospitalist telemetry LOS despite all of the other hospital‐wide interventions (multidisciplinary rounds, similar housestaff). Third, our study was limited in that the CMI was used as a proxy for patient complexity, and the mortality index was used as the overall marker of safety. Further studies should monitor frequency and outcomes of arrhythmic events of patients transferred from telemetry monitoring to medicalsurgical beds. Finally, as the intervention was multipronged, we are unable to determine which component led to the reductions in telemetry utilization. Each component, however, remains easily transferrable to outside institutions. We demonstrated both a reduction in initiation of telemetry as well as timely discontinuation; however, due to the complexity in capturing this accurately, we were unable to numerically quantify these individual outcomes.
Additionally, there were approximately 10 nonhospitalist attendings who also staffed the wards during the intervention time period of our study; these attendings did not undergo the telemetry tutorial/orientation. This difference, along with the Hawthorne effect for the hospitalist attendings, also likely contributed to the difference in outcomes between the 2 attending cohorts in the intervention period.
CONCLUSIONS
Our results demonstrate that a multipronged hospitalist‐driven intervention to improve appropriate use of telemetry reduces telemetry LOS and cost. Hence, we believe that targeted, education‐driven interventions with monitoring of progress can have demonstrable impacts on changing practice. Physicians will need to make trade‐offs in clinical practice to balance efficient resource utilization with the patient's evolving condition in the inpatient setting, the complexities of clinical workflow, and the patient's expectations.[14] Appropriate telemetry utilization is a prime example of what needs to be done well in the future for high‐value care.
Acknowledgements
The authors acknowledge the hospitalists who participated in the intervention: Jeffrey Chi, Willliam Daines, Sumbul Desai, Poonam Hosamani, John Kugler, Charles Liao, Errol Ozdalga, and Sang Hoon Woo. The authors also acknowledge Joan Hendershott in the Finance Department and Joseph Hopkins in the Quality Department.
Disclosures: All coauthors have seen and agree with the contents of the article; submission (aside from abstracts) was not under review by any other publication. The authors report no disclosures of financial support from, or equity positions in, manufacturers of drugs or products mentioned in the article.
- , National health care expenses in the U.S. civilian noninstitutionalized population, 2009. Statistical brief 355. 2012. Agency for Healthcare Research and Quality, Rockville, MD.
- , , Costs for hospital stays in the United States, 2010. Statistical brief 146. 2013. Agency for Healthcare Research and Quality, Rockville, MD.
- , , Telemetry outside critical care units: patterns of utilization and influence on management decisions. Clin Cardiol. 1998;21(7):503–505.
- , , , et al. Evaluation of telemetry utilization, policy, and outcomes in an inner‐city academic medical center. J Natl Med Assoc. 2010;102(7):598–604.
- , , Recommended guidelines for in‐hospital cardiac monitoring of adults for detection of arrhythmia. Emergency Cardiac Care Committee members. J Am Coll Cardiol. 1991;18(6):1431–1433.
- , , , et al. Practice standards for electrocardiographic monitoring in hospital settings: an American Heart Association scientific statement from the Councils on Cardiovascular Nursing, Clinical Cardiology, and Cardiovascular Disease in the Young: endorsed by the International Society of Computerized Electrocardiology and the American Association of Critical‐Care Nurses. Circulation. 2004;110(17):2721–2746.
- , , , , , Is telemetry overused? Is it as helpful as thought? Cleve Clin J Med. 2009;76(6):368–372.
- Society of Hospital Medicine. Adult Hospital Medicine. Five things physicians and patients should question. Available at: http://www.choosingwisely.org/societies/society‐of‐hospital‐medicine‐adult. Published February 21, 2013. Accessed October 5, 2014.
- Joint Commission on Accreditation of Healthcare Organizations. The Joint Commission announces 2014 national patient safety goal. Jt Comm Perspect. 2013;33(7):1–4.
- , , , , Optimizing telemetry utilization in an academic medical center. J Clin Outcomes Manage. 2008;15(9):435–440.
- , Improving utilization of telemetry in a university hospital. J Clin Outcomes Manage. 2005;12(10):519–522.
- , , , , Altering overuse of cardiac telemetry in non‐intensive care unit settings by hardwiring the use of American Heart Association guidelines. JAMA Intern Med. 2014;174:1852–1854.
- , , "Innovation" institutes in academic health centers: enhancing value through leadership, education, engagement, and scholarship. Acad Med. 2014;89(9):1204–1206.
- , , , , , Controlling health costs: physician responses to patient expectations for medical care. J Gen Intern Med. 2014;29(9):1234–1241.
Inpatient hospital services are a major component of total US civilian noninstitutionalized healthcare expenses, accounting for 29.3% of spending in 2009[1] when the average cost per stay was $9700.[2] Telemetry monitoring, a widely used resource for the identification of life‐threatening arrhythmias, contributes to these costs. In 1998, Sivaram et al. estimated the cost per patient at $683; in 2010, Ivonye et al. published the cost difference between a telemetry bed and a nonmonitored bed in their inner‐city public teaching facility reached $800.[3, 4]
In 1991, the American College of Cardiology published guidelines for telemetry use, which were later revised by the American Heart Association in 2004.[5, 6] Notably, the guidelines are based on expert opinion and on research data in electrocardiography.[7] The guidelines divide patients into 3 classes based on clinical condition: recommending telemetry monitoring for almost all class I patients, stating possible benefit in class II patients, and discouraging cardiac monitoring for the low‐risk class III patients.[5, 6] The Choosing Wisely campaign, an initiative of the American Board of Internal Medicine and the Society of Hospital Medicine, highlights telemetry monitoring as 1 of the top 5 interventions that physicians and patients should question when determining tests and procedures.[8] Choosing Wisely suggests using a protocol to govern continuation of telemetry outside of the intensive care unit (ICU), as inappropriate monitoring increases care costs and may result in patient harm.[8] The Joint Commission 2014 National Patient Safety Goals notes that numerous alarm signals and the resulting noise and displayed information tends to desensitize staff and cause them to miss or ignore alarm signals or even disable them.[9]
Few studies have examined implementation methods for improved telemetry bed utilization. One study evaluated the impact of a multispecialty telemetry policy with enforcement by an outside cardiologist and nurse team, noting improved cardiac monitoring bed utilization and decreased academic hospital closure, which previously resulted in inability to accept new patients or procedure cancellation.[10] Another study provided an orientation handout discussed by the chief resident and telemetry indication reviews during multidisciplinary rounds 3 times a week.[11]
Our study is one the first to demonstrate a model for a hospitalist‐led approach to guide appropriate telemetry use. We investigated the impact of a multipronged approach to guide telemetry usage: (1) a hospitalist‐led, daily review of bed utilization during attending rounds, (2) a hospitalist attending‐driven, trainee‐focused education module on telemetry utilization, (3) quarterly feedback on telemetry bed utilization rates, and (4) financial incentives. We analyzed pre‐ and post‐evaluation results from the education module to measure impact on knowledge, skills, and attitudes. Additionally, we evaluated the effect of the intervention on length of stay (LOS) and bed utilization costs, while monitoring case mix index (CMI) and overall mortality.
METHODS
Setting
This study took place at Stanford Hospital and Clinics, a teaching academic center in Stanford, California. Stanford Hospital is a 444‐bed, urban medical center with 114 telemetry intermediate ICU beds, and 66 ICU beds. The 264 medicalsurgical beds lack telemetry monitoring, which can only be completed in the intermediate and full ICU. All patients on telemetry units receive both cardiac monitoring and increased nursing ratios. Transfer orders are placed in the electronic medical record to shift patients between care levels. Bed control attempts to transfer patients as soon as an open bed in the appropriate care level exists.
The study included all 5 housestaff inpatient general internal medicine wards teams (which excludes cardiology, pulmonary hypertension, hematology, oncology, and post‐transplant patients). Hospitalists and nonhospitalists attend on the wards for 1‐ to 2‐week blocks. Teaching teams are staffed by 1 to 2 medical students, 2 interns, 1 resident, and 1 attending. The university institutional review board notice of determination waived review for this study because it was classified as quality improvement.
Participants
Ten full‐ and part‐time hospitalist physicians participated in the standardized telemetry teaching. Fifty‐six of the approximately 80 medical students and housestaff on hospitalists' teams completed the educational evaluation. Both hospitalist and nonhospitalist teams participated in daily multidisciplinary rounds, focusing on barriers to discharge including telemetry use. Twelve nonhospitalists served on the wards during the intervention period. Hospitalists covered 72% of the internal medicine wards during the intervention period.
Study Design
We investigated the impact of a multipronged approach to guide telemetry usage from January 2013 to August 2013 (intervention period).
Hospitalist‐Led Daily Review of Bed Utilization
Hospitalists were encouraged to discuss the need of telemetry on daily attending rounds and review indications for telemetry while on service. Prior to starting a ward block, attendings were emailed the teaching module with a reminder to discuss the need for telemetry on attending rounds. Reminders to discuss telemetry utilization were also provided during every‐other‐week hospitalist meetings. Compliance of daily discussion was not tracked.
Hospitalist‐Driven, Trainee‐Focused, Education Module on Telemetry Utilization
The educational module was taught during teaching sessions only by the hospitalists. Trainees on nonhospitalist teams did not receive dedicated teaching about telemetry usage. The module was given to learners only once. The module was a 10‐slide, Microsoft PowerPoint (Microsoft Corp., Redmond, WA) presentation that reviewed the history of telemetry, the American College of Cardiology and the American Heart Association guidelines, the cost difference between telemetry and nonmonitored beds, and the perceived barriers to discontinuation. The presentation was accompanied by a pre‐ and post‐evaluation to elicit knowledge, skills, and attitudes of telemetry use (see Supporting Information, Appendix A, in the online version of this article). The pre‐ and post‐evaluations were created through consensus with a multidisciplinary, expert panel after reviewing the evidence‐based literature.
Quarterly Feedback on Telemetry Bed Utilization Rates
Hospital beduse and CMI data were obtained from the Stanford finance department for the intervention period and for the baseline period, which was the year prior to the study, January 1, 2012 to December 31, 2012. Hospital beduse data included the number of days patients were on telemetry units versus medicalsurgical units (nontelemetry units), differentiated by hospitalists and nonhospitalists. Cost savings were calculated by the Stanford finance department that used Stanford‐specific, internal cost accounting data to determine the impact of the intervention. These data were reviewed at hospitalist meetings on a quarterly basis. We also obtained the University Healthsystem Consortium mortality index (observed to expected) for the general internal medicine service during the baseline and intervention periods.
To measure sustainment of telemetry reduction in the postintervention period, we measured telemetry LOS from September 2014 to March 2015 (extension period).
Financial Incentives
Hospitalists were provided a $2000 bonus at the end of fiscal year 2013 if the group showed a decrease in telemetry bed use in comparison to the baseline period.
Statistical Analysis of Clinical Outcome Measures
Continuous outcomes were tested using 2‐tailed t tests. Comparison of continuous outcome included differences in telemetry and nontelemetry LOS and CMI. Pairwise comparisons were made for various time periods. A P value of <0.05 was considered statistically significant. Statistical analyses were performed using Stata 12.0 software (StataCorp, College Station, TX).
RESULTS
Clinical and Value Outcomes
Baseline (January 2012December 2012) Versus Intervention Period (January 2013August 2013)
LOS for telemetry beds was significantly reduced over the intervention period (2.75 days vs 2.13 days, P=0.005) for hospitalists. Notably, there was no significant difference in mean LOS between baseline and intervention periods for nontelemetry beds (2.84 days vs 2.72 days, P=0.32) for hospitalists. In comparison, for nonhospitalists, there was no difference in mean LOS for telemetry beds between baseline and intervention periods (2.75 days vs 2.46 days, P=0.33) and nontelemetry beds (2.64 days vs 2.89 days, P=0.26) (Table 1).
| Baseline Period | Intervention Period | P Value | Extension Period | P Value | |
|---|---|---|---|---|---|
| |||||
| Length of stay | |||||
| Hospitalists | |||||
| Telemetry beds | 2.75 | 2.13 | 0.005 | 1.93 | 0.09 |
| Nontelemetry beds | 2.84 | 2.72 | 0.324 | 2.44 | 0.21 |
| Nonhospitalists | |||||
| Telemetry beds | 2.75 | 2.46 | 0.331 | 2.22 | 0.43 |
| Nontelemetry beds | 2.64 | 2.89 | 0.261 | 2.26 | 0.05 |
| Case mix index | |||||
| Hospitalists | 1.44 | 1.45 | 0.68 | 1.40 | 0.21 |
| Nonhospitalists | 1.46 | 1.40 | 0.53 | 1.53 | 0.18 |
Costs of hospital stay were also reduced in the multipronged, hospitalist‐driven intervention group. Expenditures for telemetry beds were reduced by 22.5% over the intervention period for hospitalists (Table 2).
| Baseline to Intervention Period | Intervention to Extension Period | |
|---|---|---|
| ||
| Hospitalists | ||
| Telemetry beds | 22.55% | 9.55% |
| Nontelemetry beds | 4.23% | 10.14% |
| Nonhospitalists | ||
| Telemetry beds | 10.55% | 9.89% |
| Nontelemetry beds | 9.47% | 21.84% |
The mean CMI of the patient cohort managed by the hospitalists in the baseline and intervention periods was not significantly different (1.44 vs 1.45, P=0.68). The mean CMI of the patients managed by the nonhospitalists in the baseline and intervention periods was also not significantly different (1.46 vs 1.40, P=0.53) (Table 1). Mortality index during the baseline and intervention periods was not significantly different (0.770.22 vs 0.660.23, P=0.54), as during the intervention and extension periods (0.660.23 vs 0.650.15, P=0.95).
Intervention Period (January 2013August 2013) Versus Extension Period (September 2014‐March 2015)
The decreased telemetry LOS for hospitalists was sustained from the intervention period to the extension period, from 2.13 to 1.93 (P=0.09). There was no significant change in the nontelemetry LOS in the intervention period compared to the extension period (2.72 vs 2.44, P=0.21). There was no change in the telemetry LOS for nonhospitalists from the intervention period to the extension period (2.46 vs 2.22, P=0.43).
The mean CMI in the hospitalist group was not significantly different in the intervention period compared to the extension period (1.45 to 1.40, P=0.21). The mean CMI in the nonhospitalist group did not change from the intervention period to the extension period (1.40 vs 1.53, P=0.18) (Table 1).
Education Outcomes
Out of the 56 participants completing the education module and survey, 28.6% were medical students, 53.6% were interns, 12.5% were second‐year residents, and 5.4% were third‐year residents. Several findings were seen at baseline via pretest. In evaluating patterns of current telemetry use, 32.2% of participants reported evaluating the necessity of telemetry for patients on admission only, 26.3% during transitions of care, 5.1% after discharge plans were cemented, 33.1% on a daily basis, and 3.4% rarely. When asked which member of the care team was most likely to encourage use of appropriate telemetry, 20.8% identified another resident, 13.9% nursing, 37.5% attending physician, 20.8% self, 4.2% the team as a whole, and 2.8% as not any.
Figure 1 shows premodule results regarding the trainees perceived percentage of patient encounters during which a participant's team discussed their patient's need for telemetry.
In assessing perception of current telemetry utilization, 1.8% of participants thought 0% to 10% of patients were currently on telemetry, 19.6% thought 11% to 20%, 42.9% thought 21% to 31%, 30.4% thought 31% to 40%, and 3.6% thought 41% to 50%.
Two areas were assessed at both baseline and after the intervention: knowledge of indications of telemetry use and cost related to telemetry use. We saw increased awareness of cost‐saving actions. To assess current knowledge of the indications of proper telemetry use according to American Heart Association guidelines, participants were presented with a list of 5 patients with different clinical indications for telemetry use and asked which patient required telemetry the most. Of the participants, 54.5% identified the correct answer in the pretest and 61.8% identified the correct answer in the post‐test. To assess knowledge of the costs of telemetry relative to other patient care, participants were presented with a patient case and asked to identify the most and least cost‐saving actions to safely care for the patient. When asked to identify the most cost‐saving action, 20.3% identified the correct answer in the pretest and 61.0% identified the correct answer in the post‐test. Of those who answered incorrectly in the pretest, 51.1% answered correctly in the post‐test (P=0.002). When asked to identify the least cost‐saving action, 23.7% identified the correct answer in the pretest and 50.9% identified the correct answer in the posttest. Of those who answered incorrectly in the pretest, 60.0% answered correctly in the post‐test (P=0.003).
In the post‐test, when asked about the importance of appropriate telemetry usage in providing cost‐conscious care and assuring appropriate hospital resource management, 76.8% of participants found the need very important, 21.4% somewhat important, and 1.8% as not applicable. The most commonly perceived barriers impeding discontinuation of telemetry, as reported by participants via post‐test, were nursing desires and time. Figure 2 shows all perceived barriers.
DISCUSSION
Our study is one of the first to our knowledge to demonstrate reductions in telemetry LOS by a hospitalist intervention for telemetry utilization. Others[10, 11] have studied the impact of an orientation handout by chief residents or a multispecialty telemetry policy with enforcement by an outside cardiologist and nurse team. Dressler et al. later sustained a 70% reduction in telemetry use without adversely affecting patient safety, as assessed through numbers of rapid response activations, codes, and deaths, through integrating the AHA guidelines into their electronic ordering system.[12] However, our study has the advantage of the primary team, who knows the patient and clinical scenario best, driving the change during attending rounds. In an era where cost consciousness intersects the practice of medicine, any intervention in patient care that demonstrates cost savings without an adverse impact on patient care and resource utilization must be emphasized. This is particularly important in academic institutions, where residents and medical students are learning to integrate the principles of patient safety and quality improvement into their clinical practice.[13] We actually showed sustained telemetry LOS reductions into the extension period after our intervention. We believe this may be due to telemetry triage being integrated into our attending and resident rounding practices. Future work should include integration of telemetry triage into clinical decision support in the electronic medical record and multidisciplinary rounds to disseminate telemetry triage hospital‐wide in both the academic and community settings.
Our study also revealed that nearly half of participants were not aware of the criteria for appropriate utilization of telemetry before our intervention; in the preintervention period, there were many anecdotal and objective findings of inappropriate utilization of telemetry as well as prolonged continuation beyond the clinical needs in both the hospitalist and nonhospitalist group. For the hospitalist group (ie, the group receiving guideline‐based education on appropriate indications for telemetry utilization), there was an assessment of both appropriate usage and timely discontinuation of telemetry in the postintervention period, which we attribute in large part to adherence to the education provided to this group.
We were able to show increased knowledge of cost‐saving actions among trainees with our educational module. We believe it is imperative to educate our providers (physicians, nurses, case managers, and students within these disciplines) on the appropriate indications for telemetry use, not only to help with cost savings and resource availability (ie, allowing telemetry beds to be available for patients who need them most), but also to instill consistent expectations among our patients. For the hospitalist group (ie, the group receiving guideline‐based education on appropriate indications for telemetry utilization), there was an assessment of both appropriate usage and timely discontinuation of telemetry in the postintervention period, which we attribute in large part to adherence to the education provided to this group.
Additionally, we feel it is important to consider the impacts of inappropriate use of telemetry from a patient's perspective: it is physically restrictive/emnconvenient, alarms are disruptive, it can be a barrier for other treatments such as physical therapy, it may increase the time it takes for imaging studies, a nurse may be required to accompany patients on telemetry, and poses additional costs to their medical bill.
We believe our success is due to several strategies. First, at the start of the fiscal year when quality improvement metrics are established, this particular metric (improving the appropriate utilization and timely discontinuation of telemetry) was deemed important by all hospitalists, engendering group buy‐in prior to the intervention. Our hospitalists received a detailed and interactive tutorial session in person at the beginning of the study. This tutorial provided the hospitalists with a comprehensive understanding of the appropriate (and inappropriate) indications for telemetry monitoring, hence facilitating guideline‐directed utilization. Email reminders and the tutorial tool were provided each time a hospitalist attended on the wards, and hospitalists received a small financial incentive to comply with appropriate telemetry utilization.
Our study has several strengths. First, the time frame of our study was long enough (8 months) to allow consistent trends to emerge and to optimize exposure of housestaff and medical students to this quality‐improvement initiative. Second, our cost savings came from 2 factors, direct reduction of inappropriate telemetry use and reduction in length of stay, highlighting the dual impact of appropriate telemetry utilization on cost. The overall reductions in telemetry utilization for the intervention group were a result of both reductions in initial placement on telemetry for patients who did not meet criteria for such monitoring as well as timely discontinuation of telemetry during the patient's hospitalization. Third, our study demonstrates that physicians can be effective in driving appropriate telemetry usage by participating in the clinical decision making regarding necessity and educating providers, trainees/students, and patients on appropriate indications. Finally, we show sustainment of our intervention in the extension period, suggesting telemetry triage integration into rounding practice.
Our study has limitations as well. First, our sample size is relatively small at a single academic center. Second, due to complexities in our faculty scheduling, we were unable to completely randomize patients to a hospitalist versus nonhospitalist team. However, we believe that despite the inability to randomize, our study does show the benefit of a hospitalist attending to reduce telemetry LOS given there was no change in nonhospitalist telemetry LOS despite all of the other hospital‐wide interventions (multidisciplinary rounds, similar housestaff). Third, our study was limited in that the CMI was used as a proxy for patient complexity, and the mortality index was used as the overall marker of safety. Further studies should monitor frequency and outcomes of arrhythmic events of patients transferred from telemetry monitoring to medicalsurgical beds. Finally, as the intervention was multipronged, we are unable to determine which component led to the reductions in telemetry utilization. Each component, however, remains easily transferrable to outside institutions. We demonstrated both a reduction in initiation of telemetry as well as timely discontinuation; however, due to the complexity in capturing this accurately, we were unable to numerically quantify these individual outcomes.
Additionally, there were approximately 10 nonhospitalist attendings who also staffed the wards during the intervention time period of our study; these attendings did not undergo the telemetry tutorial/orientation. This difference, along with the Hawthorne effect for the hospitalist attendings, also likely contributed to the difference in outcomes between the 2 attending cohorts in the intervention period.
CONCLUSIONS
Our results demonstrate that a multipronged hospitalist‐driven intervention to improve appropriate use of telemetry reduces telemetry LOS and cost. Hence, we believe that targeted, education‐driven interventions with monitoring of progress can have demonstrable impacts on changing practice. Physicians will need to make trade‐offs in clinical practice to balance efficient resource utilization with the patient's evolving condition in the inpatient setting, the complexities of clinical workflow, and the patient's expectations.[14] Appropriate telemetry utilization is a prime example of what needs to be done well in the future for high‐value care.
Acknowledgements
The authors acknowledge the hospitalists who participated in the intervention: Jeffrey Chi, Willliam Daines, Sumbul Desai, Poonam Hosamani, John Kugler, Charles Liao, Errol Ozdalga, and Sang Hoon Woo. The authors also acknowledge Joan Hendershott in the Finance Department and Joseph Hopkins in the Quality Department.
Disclosures: All coauthors have seen and agree with the contents of the article; submission (aside from abstracts) was not under review by any other publication. The authors report no disclosures of financial support from, or equity positions in, manufacturers of drugs or products mentioned in the article.
- , National health care expenses in the U.S. civilian noninstitutionalized population, 2009. Statistical brief 355. 2012. Agency for Healthcare Research and Quality, Rockville, MD.
- , , Costs for hospital stays in the United States, 2010. Statistical brief 146. 2013. Agency for Healthcare Research and Quality, Rockville, MD.
- , , Telemetry outside critical care units: patterns of utilization and influence on management decisions. Clin Cardiol. 1998;21(7):503–505.
- , , , et al. Evaluation of telemetry utilization, policy, and outcomes in an inner‐city academic medical center. J Natl Med Assoc. 2010;102(7):598–604.
- , , Recommended guidelines for in‐hospital cardiac monitoring of adults for detection of arrhythmia. Emergency Cardiac Care Committee members. J Am Coll Cardiol. 1991;18(6):1431–1433.
- , , , et al. Practice standards for electrocardiographic monitoring in hospital settings: an American Heart Association scientific statement from the Councils on Cardiovascular Nursing, Clinical Cardiology, and Cardiovascular Disease in the Young: endorsed by the International Society of Computerized Electrocardiology and the American Association of Critical‐Care Nurses. Circulation. 2004;110(17):2721–2746.
- , , , , , Is telemetry overused? Is it as helpful as thought? Cleve Clin J Med. 2009;76(6):368–372.
- Society of Hospital Medicine. Adult Hospital Medicine. Five things physicians and patients should question. Available at: http://www.choosingwisely.org/societies/society‐of‐hospital‐medicine‐adult. Published February 21, 2013. Accessed October 5, 2014.
- Joint Commission on Accreditation of Healthcare Organizations. The Joint Commission announces 2014 national patient safety goal. Jt Comm Perspect. 2013;33(7):1–4.
- , , , , Optimizing telemetry utilization in an academic medical center. J Clin Outcomes Manage. 2008;15(9):435–440.
- , Improving utilization of telemetry in a university hospital. J Clin Outcomes Manage. 2005;12(10):519–522.
- , , , , Altering overuse of cardiac telemetry in non‐intensive care unit settings by hardwiring the use of American Heart Association guidelines. JAMA Intern Med. 2014;174:1852–1854.
- , , "Innovation" institutes in academic health centers: enhancing value through leadership, education, engagement, and scholarship. Acad Med. 2014;89(9):1204–1206.
- , , , , , Controlling health costs: physician responses to patient expectations for medical care. J Gen Intern Med. 2014;29(9):1234–1241.

SCAMP Tool for an Old Problem
The traditional tools of observation, retrospective studies, registries, clinical practice guidelines (CPGs), prospective studies, and randomized control trials have all contributed to much of the progress of modern medicine to date. However, each of these tools has inherent tensions, strengths, and weaknesses: prospective versus retrospective, standardization versus personalization, and the art versus the science of medicine. As the field of medicine continually evolves, so too should our tools and methods. We review the Standardized Clinical Assessment and Management Plan (SCAMP) as a complementary tool to facilitate learning and discovery.
WHAT IS A SCAMP?
The methodology and major components of a SCAMP have been described in detail.[1, 2, 3] The goals of SCAMPs are to (1) reduce practice variation, (2) improve patient outcomes, and to (3) identify unnecessary resource utilization. SCAMPs leverage concepts from CPGs and prospective trials and infuse the iterative Plan, Do, Study, Act Cycle quality‐improvement techniques. Like most novel initiatives, SCAMPs methodology itself has matured over time and with experience. Briefly, creating a SCAMP has the following steps. Step 1 is to summarize the available data and expert opinions on a topic of interest. This is a critical first step, as it identifies gaps in our knowledge base and can help focus areas for the SCAMP to explore. Occasionally, retrospective studies are needed to provide data regarding local practices, procedures, and outcome metrics. These data can be used as a historical benchmark to compare SCAMP data with. Step 2 is to convene a group of clinicians who are engaged by the topic to define the patients to be included and to create a standardized care algorithm. Decision points and recommendations made within these algorithms should be precise and concrete, knowing that they can be changed or improved after data analysis and review. Figure 1 is a partial snapshot of the algorithm from the Hypertrophic Cardiomyopathy SCAMP describing the follow‐up in adults with known hypertrophic cardiomyopathy. Creation of the algorithm is often done in parallel with step 3, which is the generation of a set of targeted data statements (TDSs). TDSs are driven by the main objectives of the SCAMP, focus on areas of high uncertainty and variation in care, and frame the SCAMP to keep the amount of data collected in scope. A good TDS is concrete, measurable, and clearly relates to the recommendations in the algorithm. Here is an example of a TDS from the adult Congestive Heart Failure SCAMP: Greater than 75% of patients will be discharged on at least their admission doses of ‐blockers, angiotensin‐converting enzyme inhibitors, and angiotensin receptor blockers.

The last step for SCAMP creation involves developing online or paper data forms that allow for efficient data capture at the point of care. The key to these data forms is limiting the data capture to only what is needed to answer the TDS and documenting the reasons why clinicians chose not to follow SCAMP recommendations. Figure 2 is a partial data form from the adult Distal Radius Fracture SCAMP. Implementation of a SCAMP is a key component to a SCAMP's success but is outside the scope of this review.
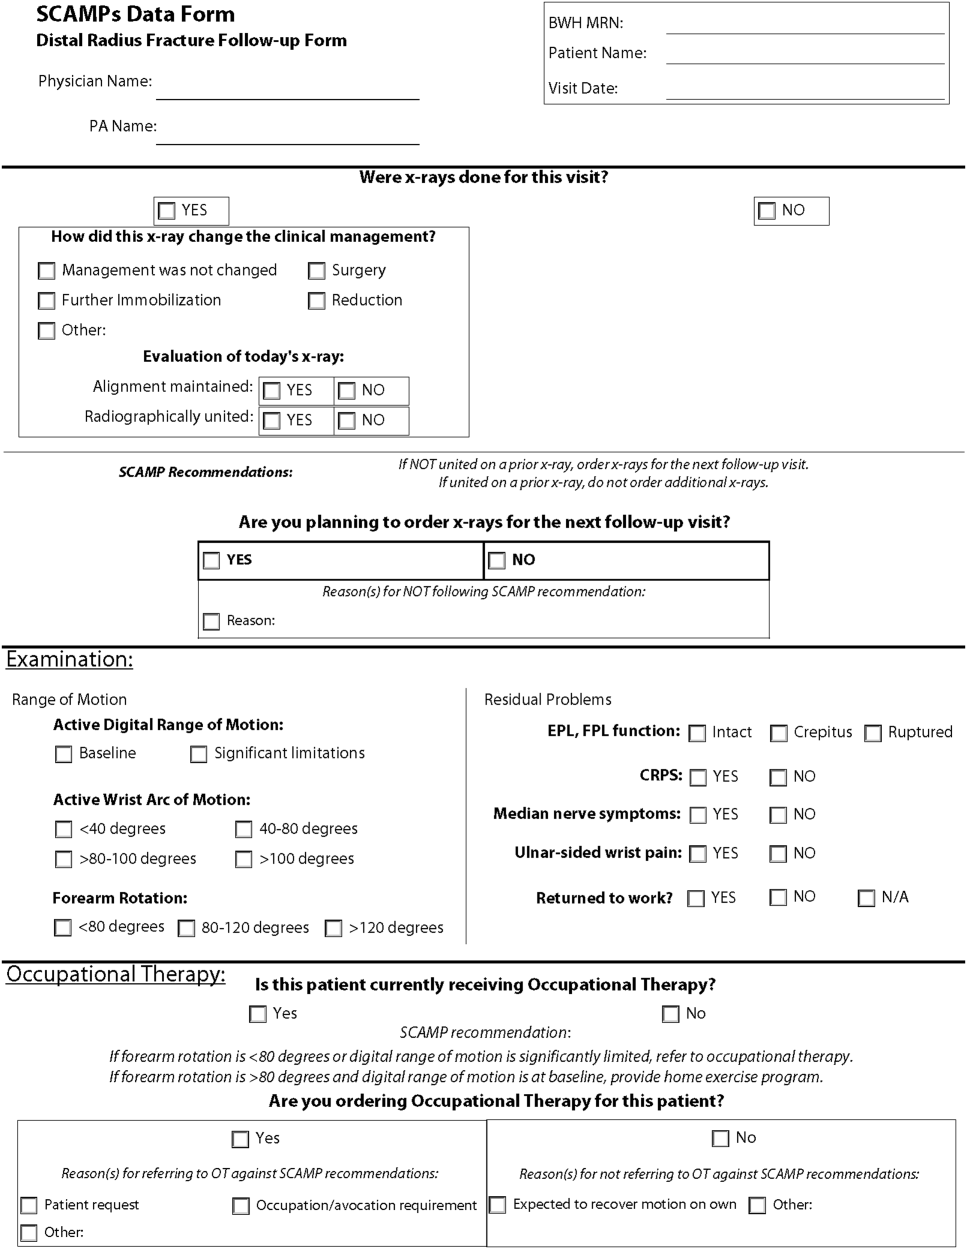
One of the hallmark features of SCAMPs is iterative, rapid data analysis, which is meant to inform and help change the SCAMP algorithm. For example, the Congestive Heart Failure TDS example above was based on the assumption that patients should be discharged home on equal or higher doses of their home medications. However, analysis of SCAMP patients showed that, in fact, clinicians were discharging a large number of patients on lower doses despite algorithm recommendations. The SCAMP algorithm was changed to explore and better understand the associations between neurohormonal medication dose changes and patients' renal function, blood pressures, and overall hemodynamic stability. This type of data capture, analysis, and algorithm change to improve the SCAMP itself can occur in relatively rapid fashion (typically in 6‐ to 12‐month cycles).
WHAT MAKES A GOOD SCAMP TOPIC?
A good SCAMP topic typically involves high stakes. The subject matter or the anticipated impact must be substantial enough to warrant the time and resource investments. These interests often parallel the overall goals of the SCAMP. The best SCAMPs target areas where the stakes are high in terms of the costs of practice variation, the importance of patient outcomes, and the waste of unnecessary resource utilization. We have shown that SCAMPs can apply to the spectrum of clinical care (inpatient, outpatient, procedures, adult, pediatric, long‐ or short‐range episodes of care) and to both common and rare diagnoses in medicine. To date, there have been 47 SCAMPs created and implemented across a network of 11 centers and societies. A full list of available adult and pediatric SCAMPs can be found at
WHAT MAKES A SCAMP DIFFERENT?
More Than a Clinical Practice Guideline
The initial process of developing a SCAMP is very similar to developing a CPG. There is reliance on available published data and expert opinion to create the TDS and algorithms. However, in contrast to CPGs, there is a fundamental tenet to the SCAMPs methodology that, within a given knowledge base on a particular subject, there are considerable holes where definitive truth is not known. There are errors in our data and understanding, but we do not know exactly which assumptions are correct or misguided. Acknowledging the limitations of our knowledge base gives the freedom to make recommendations in the algorithm that are, essentially, educated guesses. Within a short time period, the authors will get informed data and the opportunity to make adjustments, as necessary, to the algorithm. This type of prospective data collection and rapid analyses are generally not part of CPGs.
The Role of Diversions
No CPG, prospective study, randomized trial, or SCAMP algorithm will perfectly fit every patient, every time. The bedside clinician will occasionally have insights into that particular patient's care that justify not following an algorithm, regardless if it comes from a CPG, trial, or SCAMP. SCAMPs encourage these diversions, as they are a rich set of data that can be used to highlight deficiencies in the algorithms, especially when numerous providers identify similar concerns. In a CPG, these diversions are typically chalked up to noncompliance, whereas in a SCAMP, the decision, as well as the rationale behind the decision making, is captured. The key to diversions is capturing the logic and rationale of the decision making for that patient. These critical clinical decision‐making data are often lost or buried within an electronic medical record, in a form (e.g. free text) that cannot easily be identified or analyzed. During the analysis, the data regarding diversions are reviewed, looking for similar patterns of why clinicians did not follow the SCAMP algorithm. For example, in the adult Inpatient Chest Pain SCAMP, there was a high rate of diversions regarding the amount of inpatient testing being done for the evaluation of patients at low or intermediate risk for acute coronary syndrome. In analysis of the diversions, it seems that many of these patients did not have a primary cardiologist or lived far away. The SCAMP algorithm was modified to have different recommendations based on where the patient lived and if they had a cardiologist. In the next analysis, this subgroup can be compared against patients who live closer and had a primary cardiologist to see if additional inpatient testing did or did not affect outcomes.
Little Data Instead of Big Data
There has been a lot of focus across hospital systems on the analysis of big data. Over the last several years, there has been an explosion in the availability of large, often unstructured, datasets. In many ways, big data analytics look to find meaning across very large datasets because the critical data (e.g. clinical decision making) is not captured in a discrete analyzable fashion. In electronic health records, much of the decision making as to why the clinician chose the red pill instead of the blue pill is lost in the free text abyss of clinic and inpatient notes. Through the use of TDSs, the SCAMP authors are asked to identify the critical data elements needed to say which patient should get what pill. By doing this, the clinical decision making is codified in a way that will facilitate future analysis and SCAMP modifications. Decisions made by clinicians and how they got to those decisions (either via the SCAMP algorithm or by diversion) are captured in an easily analyzable form. This approach, choosing only critical and targeted little data, also reduces the data collection burden and increases clinician compliance.
A Grassroots Effort
Many CPGs are created by panels of international experts in the field/subject matter. The origins of most SCAMPs tend to start more locally, often by frustrated clinicians who struggle with the data and knowledge gaps. They are often motivated to improve their care delivery, not necessarily on a national level, but in their clinic or inpatient setting. The data they get back in the interim analyses are about their patientstheir data. This empowers them to expand and grow the SCAMP. The flexibility of allowing diversions increases this engagement. SCAMPs are created and authored by clinicians on the front lines. This more grassroots approach feels more palatable compared to the top down verdicts that come from CPGs.
SCAMPs are a novel, complementary, but alternative tool to help deliver better care. By focusing on targeted little data collection, allowing diversions, and performing rapid analysis to iteratively improve the algorithm, SCAMPs blend the strengths of many of our traditional tools of good change to affect better change. By choosing topics with high stakes, they allow the frontline clinicians to shape and improve how they delivery care.
Disclosure: Nothing to report.
- , , , et al. A novel approach to gathering and acting on relevant clinical information: SCAMPs. Congenit Heart Dis. 2010;5:343–353.
- , , , et al. Standardized clinical assessment and management plans (SCAMPs) provide a better alternative to clinical practice guidelines. Health Aff (Millwood). 2013;32:911–920.
- , , , Gathering and learning from relevant clinical data: a new framework. Acad Med. 2015;90(2):143–148.
The traditional tools of observation, retrospective studies, registries, clinical practice guidelines (CPGs), prospective studies, and randomized control trials have all contributed to much of the progress of modern medicine to date. However, each of these tools has inherent tensions, strengths, and weaknesses: prospective versus retrospective, standardization versus personalization, and the art versus the science of medicine. As the field of medicine continually evolves, so too should our tools and methods. We review the Standardized Clinical Assessment and Management Plan (SCAMP) as a complementary tool to facilitate learning and discovery.
WHAT IS A SCAMP?
The methodology and major components of a SCAMP have been described in detail.[1, 2, 3] The goals of SCAMPs are to (1) reduce practice variation, (2) improve patient outcomes, and to (3) identify unnecessary resource utilization. SCAMPs leverage concepts from CPGs and prospective trials and infuse the iterative Plan, Do, Study, Act Cycle quality‐improvement techniques. Like most novel initiatives, SCAMPs methodology itself has matured over time and with experience. Briefly, creating a SCAMP has the following steps. Step 1 is to summarize the available data and expert opinions on a topic of interest. This is a critical first step, as it identifies gaps in our knowledge base and can help focus areas for the SCAMP to explore. Occasionally, retrospective studies are needed to provide data regarding local practices, procedures, and outcome metrics. These data can be used as a historical benchmark to compare SCAMP data with. Step 2 is to convene a group of clinicians who are engaged by the topic to define the patients to be included and to create a standardized care algorithm. Decision points and recommendations made within these algorithms should be precise and concrete, knowing that they can be changed or improved after data analysis and review. Figure 1 is a partial snapshot of the algorithm from the Hypertrophic Cardiomyopathy SCAMP describing the follow‐up in adults with known hypertrophic cardiomyopathy. Creation of the algorithm is often done in parallel with step 3, which is the generation of a set of targeted data statements (TDSs). TDSs are driven by the main objectives of the SCAMP, focus on areas of high uncertainty and variation in care, and frame the SCAMP to keep the amount of data collected in scope. A good TDS is concrete, measurable, and clearly relates to the recommendations in the algorithm. Here is an example of a TDS from the adult Congestive Heart Failure SCAMP: Greater than 75% of patients will be discharged on at least their admission doses of ‐blockers, angiotensin‐converting enzyme inhibitors, and angiotensin receptor blockers.
The last step for SCAMP creation involves developing online or paper data forms that allow for efficient data capture at the point of care. The key to these data forms is limiting the data capture to only what is needed to answer the TDS and documenting the reasons why clinicians chose not to follow SCAMP recommendations. Figure 2 is a partial data form from the adult Distal Radius Fracture SCAMP. Implementation of a SCAMP is a key component to a SCAMP's success but is outside the scope of this review.
One of the hallmark features of SCAMPs is iterative, rapid data analysis, which is meant to inform and help change the SCAMP algorithm. For example, the Congestive Heart Failure TDS example above was based on the assumption that patients should be discharged home on equal or higher doses of their home medications. However, analysis of SCAMP patients showed that, in fact, clinicians were discharging a large number of patients on lower doses despite algorithm recommendations. The SCAMP algorithm was changed to explore and better understand the associations between neurohormonal medication dose changes and patients' renal function, blood pressures, and overall hemodynamic stability. This type of data capture, analysis, and algorithm change to improve the SCAMP itself can occur in relatively rapid fashion (typically in 6‐ to 12‐month cycles).
WHAT MAKES A GOOD SCAMP TOPIC?
A good SCAMP topic typically involves high stakes. The subject matter or the anticipated impact must be substantial enough to warrant the time and resource investments. These interests often parallel the overall goals of the SCAMP. The best SCAMPs target areas where the stakes are high in terms of the costs of practice variation, the importance of patient outcomes, and the waste of unnecessary resource utilization. We have shown that SCAMPs can apply to the spectrum of clinical care (inpatient, outpatient, procedures, adult, pediatric, long‐ or short‐range episodes of care) and to both common and rare diagnoses in medicine. To date, there have been 47 SCAMPs created and implemented across a network of 11 centers and societies. A full list of available adult and pediatric SCAMPs can be found at
WHAT MAKES A SCAMP DIFFERENT?
More Than a Clinical Practice Guideline
The initial process of developing a SCAMP is very similar to developing a CPG. There is reliance on available published data and expert opinion to create the TDS and algorithms. However, in contrast to CPGs, there is a fundamental tenet to the SCAMPs methodology that, within a given knowledge base on a particular subject, there are considerable holes where definitive truth is not known. There are errors in our data and understanding, but we do not know exactly which assumptions are correct or misguided. Acknowledging the limitations of our knowledge base gives the freedom to make recommendations in the algorithm that are, essentially, educated guesses. Within a short time period, the authors will get informed data and the opportunity to make adjustments, as necessary, to the algorithm. This type of prospective data collection and rapid analyses are generally not part of CPGs.
The Role of Diversions
No CPG, prospective study, randomized trial, or SCAMP algorithm will perfectly fit every patient, every time. The bedside clinician will occasionally have insights into that particular patient's care that justify not following an algorithm, regardless if it comes from a CPG, trial, or SCAMP. SCAMPs encourage these diversions, as they are a rich set of data that can be used to highlight deficiencies in the algorithms, especially when numerous providers identify similar concerns. In a CPG, these diversions are typically chalked up to noncompliance, whereas in a SCAMP, the decision, as well as the rationale behind the decision making, is captured. The key to diversions is capturing the logic and rationale of the decision making for that patient. These critical clinical decision‐making data are often lost or buried within an electronic medical record, in a form (e.g. free text) that cannot easily be identified or analyzed. During the analysis, the data regarding diversions are reviewed, looking for similar patterns of why clinicians did not follow the SCAMP algorithm. For example, in the adult Inpatient Chest Pain SCAMP, there was a high rate of diversions regarding the amount of inpatient testing being done for the evaluation of patients at low or intermediate risk for acute coronary syndrome. In analysis of the diversions, it seems that many of these patients did not have a primary cardiologist or lived far away. The SCAMP algorithm was modified to have different recommendations based on where the patient lived and if they had a cardiologist. In the next analysis, this subgroup can be compared against patients who live closer and had a primary cardiologist to see if additional inpatient testing did or did not affect outcomes.
Little Data Instead of Big Data
There has been a lot of focus across hospital systems on the analysis of big data. Over the last several years, there has been an explosion in the availability of large, often unstructured, datasets. In many ways, big data analytics look to find meaning across very large datasets because the critical data (e.g. clinical decision making) is not captured in a discrete analyzable fashion. In electronic health records, much of the decision making as to why the clinician chose the red pill instead of the blue pill is lost in the free text abyss of clinic and inpatient notes. Through the use of TDSs, the SCAMP authors are asked to identify the critical data elements needed to say which patient should get what pill. By doing this, the clinical decision making is codified in a way that will facilitate future analysis and SCAMP modifications. Decisions made by clinicians and how they got to those decisions (either via the SCAMP algorithm or by diversion) are captured in an easily analyzable form. This approach, choosing only critical and targeted little data, also reduces the data collection burden and increases clinician compliance.
A Grassroots Effort
Many CPGs are created by panels of international experts in the field/subject matter. The origins of most SCAMPs tend to start more locally, often by frustrated clinicians who struggle with the data and knowledge gaps. They are often motivated to improve their care delivery, not necessarily on a national level, but in their clinic or inpatient setting. The data they get back in the interim analyses are about their patientstheir data. This empowers them to expand and grow the SCAMP. The flexibility of allowing diversions increases this engagement. SCAMPs are created and authored by clinicians on the front lines. This more grassroots approach feels more palatable compared to the top down verdicts that come from CPGs.
SCAMPs are a novel, complementary, but alternative tool to help deliver better care. By focusing on targeted little data collection, allowing diversions, and performing rapid analysis to iteratively improve the algorithm, SCAMPs blend the strengths of many of our traditional tools of good change to affect better change. By choosing topics with high stakes, they allow the frontline clinicians to shape and improve how they delivery care.
Disclosure: Nothing to report.
- , , , et al. A novel approach to gathering and acting on relevant clinical information: SCAMPs. Congenit Heart Dis. 2010;5:343–353.
- , , , et al. Standardized clinical assessment and management plans (SCAMPs) provide a better alternative to clinical practice guidelines. Health Aff (Millwood). 2013;32:911–920.
- , , , Gathering and learning from relevant clinical data: a new framework. Acad Med. 2015;90(2):143–148.
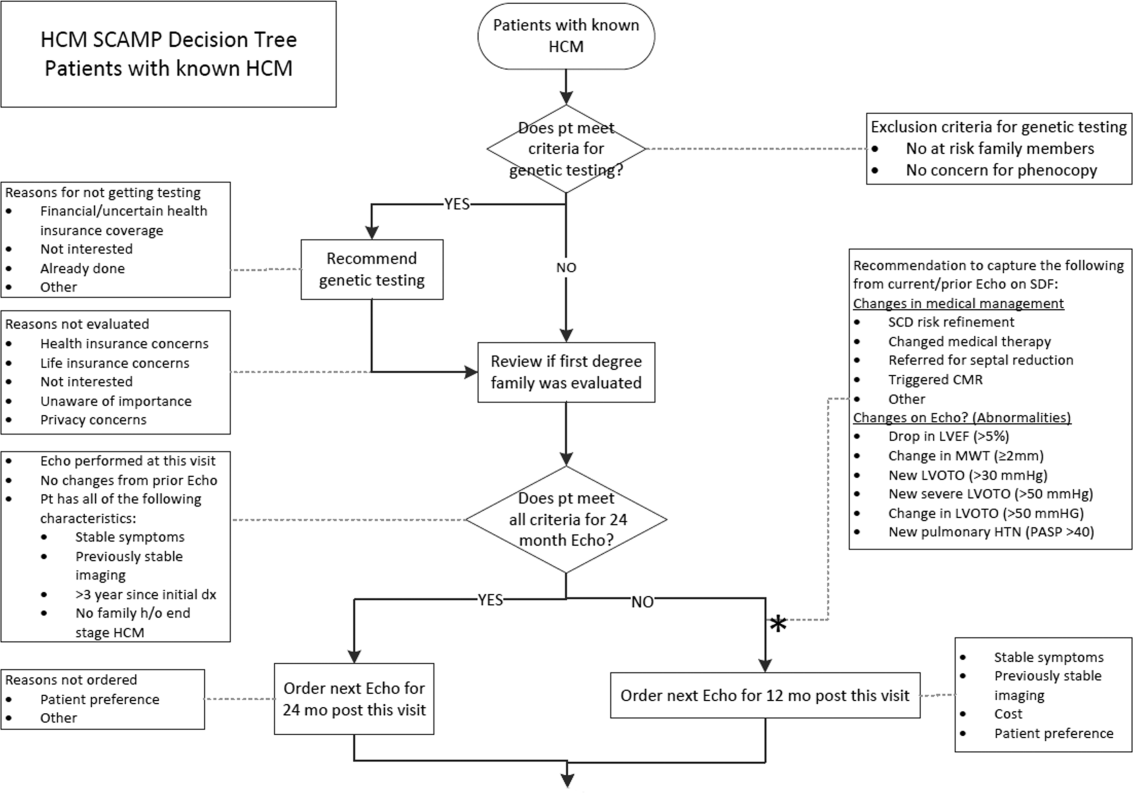
Who is going to make the wise choice?
Failure of academic medicine to improve value will undermine professionalism and threaten autonomy because outside forces, such as insurers and regulators, will surely impose change if academic leaders and physicians fail. [1]
The verdict is indoctors order too many tests. This problem is most prominent in academic health centers (AHCs), where the use of testing resources is higher than in community hospitals.[2] Most prior attempts to improve the value of care at AHCs have been driven by faculty and hospital administration in a top‐down fashion with only transient success.[3] We believe that successful and sustainable change should start with the housestaff, who are training in a system afflicted by wasteful overuse of healthcare resources. Therefore, we created a housestaff‐led initiative called the Vanderbilt Choosing Wisely Steering Committee to change the culture of academic medicine. If AHCs are going to start choosing wisely, housestaff must be part of the engine behind the change.
FORMING THE VANDERBILT CHOOSING WISELY STEERING COMMITTEE
The idea for the Vanderbilt Choosing Wisely Steering Committee (VCWSC) was born in December 2013 during a monthly Graduate Medical Education Committee meeting involving housestaff and faculty representatives from multiple subspecialties. At that time, the national Choosing Wisely campaign was in full stride, with more than 50 organizations having proposed top 5 lists of tests and procedures that should be questioned.[4] Several participants at the meeting decided to create a steering committee to integrate these proposals into daily practice at Vanderbilt University Medical Center.
Housestaff have formed the core of the VCWSC from the beginning. The initial members were residents on the Graduate Medical Education Committee, including a fifth‐year radiology resident and a second‐year internal medicine resident who served as the first co‐chairs. More housestaff were recruited by email and word‐of‐mouth. Currently, the committee is composed of residents from the departments of internal medicine, radiology, pediatrics, neurology, anesthesiology, pathology, and general surgery. These residents perform all of the committee's vital functions, including organizing biweekly meetings, brainstorming and carrying out high‐value care initiatives, and recruiting new members. Of course, this committee would not have the authority to create real change without the guidance of numerous faculty supporters, including the designated institutional official and the associate vice chancellor for health affairs. However, we firmly believe that the primary reason this committee has been successful is that it is led by housestaff.
THE IMPORTANCE OF HOUSESTAFF LEADERSHIP
Residents are at the front line of care delivery at academic health centers (AHCs). Innumerable tests and procedures at these institutions are ordered and performed by housestaff. Therefore, culture change in academic medicine will not occur without housestaff culture change. Unfortunately, residents have been shown to have a lower level of competency with regard to high‐value care than more experienced providers.[5] The housestaff‐led VCWSC is uniquely positioned to address this problem by using personal experience and peer‐to‐peer communication to address the fears, biases, and knowledge gaps that cause trainees to waste healthcare resources. Resident members of the VCWSC wrestle daily with the temptation to overtest to avoid missing something or make a rare diagnosis. They are familiar with the systems that encourage overutilization, like shortcuts in ordering software that allow automatically recurring orders. Perhaps most importantly, they are able to discuss high‐value care with other trainees as equals, instead of trying to enforce compliance with a set of restrictions put in place by supervisors.
A SYSTEMATIC STRATEGY FOR EFFECTING CHANGE
To successfully implement high‐value care initiatives, the VCWSC follows a strategy proposed by John Kotter for effecting change in large organizations.[6] According to Kotter, it is critical to create a vision for change, communicate the vision effectively, and empower others to act on the vision. The VCWSC's vision for change is to encourage optimal medical practice by implementing Choosing Wisely top 5 recommendations. To communicate this vision, the VCWSC follows the rhetorical style of the national Choosing Wisely campaign. The American Board of Internal Medicine Foundation researched this rhetoric extensively in the years leading up to the development of the top 5 lists. They found that simply asking providers to judiciously distribute healthcare resources often created a feeling of patient abandonment. Instead, providers are much more likely to respond to messages that encourage wise choices that enhance professional fulfillment, patient well‐being, and the overall quality of care.[4] Therefore, the VCWSC emphasizes these same values in its e‐mails, fliers, and presentations. Importantly, the VCWSC does not directly limit providers abilities to order tests or perform procedures. Instead, the VCWSC uses education and data to empower others to act on the Choosing Wisely vision for high‐value care.
After communicating the vision for change, Kotter recommends sustaining the vision by creating short‐term wins.[6] To demonstrate these wins, the VCWSC collects data on the effects of its initiatives and celebrates the success of individuals and teams through regular widely distributed emails. Initially this involved manually counting the number of tests ordered by many providers. Fortunately, experts from the Department of Bioinformatics partnered with the VCWSC to create an automated data collection system that is much more efficient, enabling the committee to quickly collect and analyze data on tests and procedures at Vanderbilt University Medical Center. These data are fed back to participants in various initiatives, and they are used to demonstrate the efficacy of these initiatives to others throughout the medical center, thus garnering trust and encouraging others to participate in VCWSC projects. With enough short‐term wins, the VCWSC hopes to achieve Kotter's ultimate goal, which is to consolidate and institutionalize changes to have a lasting impact.[6]
REDUCING DAILY LABSAN EARLY SUCCESS OF THE VCWSC
One example of the committee's early success is the reduction of routine complete blood counts (CBCs) and basic metabolic panels (BMPs) on internal medicine services, as recommended in the Choosing Wisely top 5 list proposed by the Society of Hospital Medicine. Prior studies on reducing routine labs required interventions like displaying charges at the time of test ordering,[7, 8] using financial incentives,[2, 9] and eliminating the ability to order recurring daily labs.[10] Instead of replicating these efforts, the VCWSC decided to use an educational campaign and real‐time data feedback to focus on the root of the problema culture of overtesting. After obtaining the support of the internal medicine residency program leadership, the VCWSC distributed an evidence‐based flier (see Supporting Information in the online version of this article) summarizing the harms of and misconceptions surrounding excessive lab testing. These data were also presented at housestaff conferences.
Following this initial educational intervention, the VCWSC began tracking the labs ordered for patients on housestaff internal medicine teams to see what proportion have a BMP or CBC drawn each day of their hospitalization. Each week, the teams are sent an email with their lab rate compared to the lab rates of analogous teams. At the end of each month, all internal medicine housestaff and faculty are notified which teams had the lowest lab rate for the month. The VCWSC does not attempt to define an unnecessary lab or offer incentives; the teams are simply reminded that ordering fewer labs can be good for patient care. Since the initiative began, the teams have succeeded in reducing the percentage of patients receiving a CBC and BMP each day from an average of 90% to below 70%.
FUTURE DIRECTIONS
Moving forward, the VCWSC hopes to further engrain the culture of Choosing Wisely into daily practice at Vanderbilt University Medical Center. The labs initiative has expanded to many services including surgery, neurology, and the medical intensive care unit. Other initiatives are focusing on excessive telemetry monitoring and daily chest radiographs in intensive care units. In addition, the VCWSC is collaborating with other AHCs to help them implement their own Choosing Wisely projects.
A CALL FOR MORE HOUSESTAFF CHOOSING WISELY INITIATIVES
Housestaff are perfectly positioned to lead a change in the culture of academic medicine toward high‐value care. The VCWSC has already seen promising results, and we hope that similar initiatives will be created at AHCs across the country. By following John Kotter's recommendations for implementing change and using the Choosing Wisely top 5 lists as a guide, housestaff‐run committees like the VCWSC have the potential to change the culture of medicine at every AHC. If we do not want outside regulators to decide the future of academic medicine, we must find a way to cut down on wasteful spending and unnecessary testing. Residents everywhere, let us choose wisely together.
Acknowledgements
The authors of this study acknowledge the faculty, residents, and medical students who have supported the efforts of the Vanderbilt University Choosing Wisely Steering Committee.
Disclosures: Dr. Brady serves on the board of the ACGME but receives no financial payment other than compensation for travel expenses to board meetings. He also was Chair of the Board for the American Academy on Communication in Healthcare in 2014.
- , , Teaching value in academic environments. Shifting the ivory tower. JAMA. 2013;310(16):1671–1672.
- , , , , A trial of two strategies to modify the test‐ordering behavior of medical residents. N Engl J Med. 1980;303(23):1330–1336.
- , , , Techniques to improve physicians' use of diagnostic tests: a new conceptual framework. JAMA. 1998;280(23):2020–2027.
- , , Engaging physicians and consumers in conversations about treatment overuse and waste: a short history of the Choosing Wisely campaign. Acad Med. 2014;89(7):990–995.
- , , , , , “Choosing Wisely” in an academic department of medicine [published online June 26, 2014]. Am J Med Qual. doi:10.1177/1062860614540982.
- Leading change; why transformation efforts fail. Harv Bus Rev. 1995;March‐April:57–67.
- , , , et al. Impact of providing fee data on laboratory test ordering: a controlled clinical trial. JAMA Intern Med. 2013;173(10):903–908.
- , , The effect on test ordering of informing physicians of the charges for outpatient diagnostic tests. N Engl J Med. 1990;322(21):1499–1504.
- , , , et al. Targeted reduction in neurosurgical laboratory utilization: resident‐led effort at a single academic institution. J Neurosurg. 2014;120(1):173–177.
- , , , et al. The impact of peer management on test‐ordering behavior. Ann Intern Med. 2004;141(3):196–204.
Failure of academic medicine to improve value will undermine professionalism and threaten autonomy because outside forces, such as insurers and regulators, will surely impose change if academic leaders and physicians fail. [1]
The verdict is indoctors order too many tests. This problem is most prominent in academic health centers (AHCs), where the use of testing resources is higher than in community hospitals.[2] Most prior attempts to improve the value of care at AHCs have been driven by faculty and hospital administration in a top‐down fashion with only transient success.[3] We believe that successful and sustainable change should start with the housestaff, who are training in a system afflicted by wasteful overuse of healthcare resources. Therefore, we created a housestaff‐led initiative called the Vanderbilt Choosing Wisely Steering Committee to change the culture of academic medicine. If AHCs are going to start choosing wisely, housestaff must be part of the engine behind the change.
FORMING THE VANDERBILT CHOOSING WISELY STEERING COMMITTEE
The idea for the Vanderbilt Choosing Wisely Steering Committee (VCWSC) was born in December 2013 during a monthly Graduate Medical Education Committee meeting involving housestaff and faculty representatives from multiple subspecialties. At that time, the national Choosing Wisely campaign was in full stride, with more than 50 organizations having proposed top 5 lists of tests and procedures that should be questioned.[4] Several participants at the meeting decided to create a steering committee to integrate these proposals into daily practice at Vanderbilt University Medical Center.
Housestaff have formed the core of the VCWSC from the beginning. The initial members were residents on the Graduate Medical Education Committee, including a fifth‐year radiology resident and a second‐year internal medicine resident who served as the first co‐chairs. More housestaff were recruited by email and word‐of‐mouth. Currently, the committee is composed of residents from the departments of internal medicine, radiology, pediatrics, neurology, anesthesiology, pathology, and general surgery. These residents perform all of the committee's vital functions, including organizing biweekly meetings, brainstorming and carrying out high‐value care initiatives, and recruiting new members. Of course, this committee would not have the authority to create real change without the guidance of numerous faculty supporters, including the designated institutional official and the associate vice chancellor for health affairs. However, we firmly believe that the primary reason this committee has been successful is that it is led by housestaff.
THE IMPORTANCE OF HOUSESTAFF LEADERSHIP
Residents are at the front line of care delivery at academic health centers (AHCs). Innumerable tests and procedures at these institutions are ordered and performed by housestaff. Therefore, culture change in academic medicine will not occur without housestaff culture change. Unfortunately, residents have been shown to have a lower level of competency with regard to high‐value care than more experienced providers.[5] The housestaff‐led VCWSC is uniquely positioned to address this problem by using personal experience and peer‐to‐peer communication to address the fears, biases, and knowledge gaps that cause trainees to waste healthcare resources. Resident members of the VCWSC wrestle daily with the temptation to overtest to avoid missing something or make a rare diagnosis. They are familiar with the systems that encourage overutilization, like shortcuts in ordering software that allow automatically recurring orders. Perhaps most importantly, they are able to discuss high‐value care with other trainees as equals, instead of trying to enforce compliance with a set of restrictions put in place by supervisors.
A SYSTEMATIC STRATEGY FOR EFFECTING CHANGE
To successfully implement high‐value care initiatives, the VCWSC follows a strategy proposed by John Kotter for effecting change in large organizations.[6] According to Kotter, it is critical to create a vision for change, communicate the vision effectively, and empower others to act on the vision. The VCWSC's vision for change is to encourage optimal medical practice by implementing Choosing Wisely top 5 recommendations. To communicate this vision, the VCWSC follows the rhetorical style of the national Choosing Wisely campaign. The American Board of Internal Medicine Foundation researched this rhetoric extensively in the years leading up to the development of the top 5 lists. They found that simply asking providers to judiciously distribute healthcare resources often created a feeling of patient abandonment. Instead, providers are much more likely to respond to messages that encourage wise choices that enhance professional fulfillment, patient well‐being, and the overall quality of care.[4] Therefore, the VCWSC emphasizes these same values in its e‐mails, fliers, and presentations. Importantly, the VCWSC does not directly limit providers abilities to order tests or perform procedures. Instead, the VCWSC uses education and data to empower others to act on the Choosing Wisely vision for high‐value care.
After communicating the vision for change, Kotter recommends sustaining the vision by creating short‐term wins.[6] To demonstrate these wins, the VCWSC collects data on the effects of its initiatives and celebrates the success of individuals and teams through regular widely distributed emails. Initially this involved manually counting the number of tests ordered by many providers. Fortunately, experts from the Department of Bioinformatics partnered with the VCWSC to create an automated data collection system that is much more efficient, enabling the committee to quickly collect and analyze data on tests and procedures at Vanderbilt University Medical Center. These data are fed back to participants in various initiatives, and they are used to demonstrate the efficacy of these initiatives to others throughout the medical center, thus garnering trust and encouraging others to participate in VCWSC projects. With enough short‐term wins, the VCWSC hopes to achieve Kotter's ultimate goal, which is to consolidate and institutionalize changes to have a lasting impact.[6]
REDUCING DAILY LABSAN EARLY SUCCESS OF THE VCWSC
One example of the committee's early success is the reduction of routine complete blood counts (CBCs) and basic metabolic panels (BMPs) on internal medicine services, as recommended in the Choosing Wisely top 5 list proposed by the Society of Hospital Medicine. Prior studies on reducing routine labs required interventions like displaying charges at the time of test ordering,[7, 8] using financial incentives,[2, 9] and eliminating the ability to order recurring daily labs.[10] Instead of replicating these efforts, the VCWSC decided to use an educational campaign and real‐time data feedback to focus on the root of the problema culture of overtesting. After obtaining the support of the internal medicine residency program leadership, the VCWSC distributed an evidence‐based flier (see Supporting Information in the online version of this article) summarizing the harms of and misconceptions surrounding excessive lab testing. These data were also presented at housestaff conferences.
Following this initial educational intervention, the VCWSC began tracking the labs ordered for patients on housestaff internal medicine teams to see what proportion have a BMP or CBC drawn each day of their hospitalization. Each week, the teams are sent an email with their lab rate compared to the lab rates of analogous teams. At the end of each month, all internal medicine housestaff and faculty are notified which teams had the lowest lab rate for the month. The VCWSC does not attempt to define an unnecessary lab or offer incentives; the teams are simply reminded that ordering fewer labs can be good for patient care. Since the initiative began, the teams have succeeded in reducing the percentage of patients receiving a CBC and BMP each day from an average of 90% to below 70%.
FUTURE DIRECTIONS
Moving forward, the VCWSC hopes to further engrain the culture of Choosing Wisely into daily practice at Vanderbilt University Medical Center. The labs initiative has expanded to many services including surgery, neurology, and the medical intensive care unit. Other initiatives are focusing on excessive telemetry monitoring and daily chest radiographs in intensive care units. In addition, the VCWSC is collaborating with other AHCs to help them implement their own Choosing Wisely projects.
A CALL FOR MORE HOUSESTAFF CHOOSING WISELY INITIATIVES
Housestaff are perfectly positioned to lead a change in the culture of academic medicine toward high‐value care. The VCWSC has already seen promising results, and we hope that similar initiatives will be created at AHCs across the country. By following John Kotter's recommendations for implementing change and using the Choosing Wisely top 5 lists as a guide, housestaff‐run committees like the VCWSC have the potential to change the culture of medicine at every AHC. If we do not want outside regulators to decide the future of academic medicine, we must find a way to cut down on wasteful spending and unnecessary testing. Residents everywhere, let us choose wisely together.
Acknowledgements
The authors of this study acknowledge the faculty, residents, and medical students who have supported the efforts of the Vanderbilt University Choosing Wisely Steering Committee.
Disclosures: Dr. Brady serves on the board of the ACGME but receives no financial payment other than compensation for travel expenses to board meetings. He also was Chair of the Board for the American Academy on Communication in Healthcare in 2014.
- , , Teaching value in academic environments. Shifting the ivory tower. JAMA. 2013;310(16):1671–1672.
- , , , , A trial of two strategies to modify the test‐ordering behavior of medical residents. N Engl J Med. 1980;303(23):1330–1336.
- , , , Techniques to improve physicians' use of diagnostic tests: a new conceptual framework. JAMA. 1998;280(23):2020–2027.
- , , Engaging physicians and consumers in conversations about treatment overuse and waste: a short history of the Choosing Wisely campaign. Acad Med. 2014;89(7):990–995.
- , , , , , “Choosing Wisely” in an academic department of medicine [published online June 26, 2014]. Am J Med Qual. doi:10.1177/1062860614540982.
- Leading change; why transformation efforts fail. Harv Bus Rev. 1995;March‐April:57–67.
- , , , et al. Impact of providing fee data on laboratory test ordering: a controlled clinical trial. JAMA Intern Med. 2013;173(10):903–908.
- , , The effect on test ordering of informing physicians of the charges for outpatient diagnostic tests. N Engl J Med. 1990;322(21):1499–1504.
- , , , et al. Targeted reduction in neurosurgical laboratory utilization: resident‐led effort at a single academic institution. J Neurosurg. 2014;120(1):173–177.
- , , , et al. The impact of peer management on test‐ordering behavior. Ann Intern Med. 2004;141(3):196–204.
Multifaceted Hospitalist QI Intervention
Waste in US healthcare is a public health threat, with an estimated value of $910 billion per year.[1] It constitutes some of the relatively high per‐discharge healthcare spending seen in the United States when compared to other nations.[2] Waste takes many forms, one of which is excessive use of diagnostic laboratory testing.[1] Many hospital providers obtain common labs, such as complete blood counts (CBCs) and basic metabolic panels (BMPs), in an open‐ended, daily manner for their hospitalized patients, without regard for the patient's clinical condition or despite stability of the previous results. Reasons for ordering these tests in a nonpatient‐centered manner include provider convenience (such as inclusion in an order set), ease of access, habit, or defensive practice.[3, 4, 5] All of these reasons may represent waste.
Although the potential waste of routine daily labs may seem small, the frequency with which they are ordered results in a substantial real and potential cost, both financially and clinically. Multiple studies have shown a link between excessive diagnostic phlebotomy and hospital‐acquired anemia.[6, 7, 8, 9] Hospital‐acquired anemia itself has been associated with increased mortality.[10] In addition to blood loss and financial cost, patient experience and satisfaction are also detrimentally affected by excessive laboratory testing in the form of pain and inconvenience from the act of phlebotomy.[11]
There are many reports of strategies to decrease excessive diagnostic laboratory testing as a means of addressing this waste in the inpatient setting.[12, 13, 14, 15, 16, 17, 18, 19, 20, 21] All of these studies have taken place in a traditional academic setting, and many implemented their intervention through a computer‐based order entry system. Based on the literature search regarding this topic, we found no examples of studies conducted among and within community‐based hospitalist practices. More recently, this issue was highlighted as part of the Choosing Wisely campaign sponsored by the American Board of Internal Medicine Foundation, Consumer Reports, and more than 60 specialty societies. The Society of Hospital Medicine, the professional society for hospitalists, recommended avoidance of repetitive common laboratory testing in the face of clinical stability.[22]
Much has been written about quality improvement (QI) by the Institute for Healthcare Improvement, the Society of Hospitalist Medicine, and others.[23, 24, 25] How best to move from a Choosing Wisely recommendation to highly reliable incorporation in clinical practice in a community setting is not known and likely varies depending upon the care environment. Successful QI interventions are often multifaceted and include academic detailing and provider education, transparent display of data, and regular audit and feedback of performance data.[26, 27, 28, 29] Prior to the publication of the Society of Hospital Medicine's Choosing Wisely recommendations, we chose to implement the recommendation to decrease ordering of daily labs using 3 QI strategies in our community 4‐hospital health system.
METHODS
Study Participants
This activity was undertaken as a QI initiative by Swedish Hospital Medicine (SHM), a 53‐provider employed hospitalist group that staffs a total of 1420 beds across 4 inpatient facilities. SHM has a longstanding record of working together as a team on QI projects.
An informal preliminary audit of our common lab ordering by a member of the study team revealed multiple examples of labs ordered every day without medical‐record evidence of intervention or management decisions being made based on the results. This preliminary activity raised the notion within the hospitalist group that this was a topic ripe for intervention and improvement. Four common labs, CBC, BMP, nutrition panel (called TPN 2 in our system, consisting of a BMP and magnesium and phosphorus) and comprehensive metabolic panel (BMP and liver function tests), formed the bulk of the repetitively ordered labs and were the focus of our activity. We excluded prothrombin time/International Normalized Ratio, as it was less clear that obtaining these daily clearly represented waste. We then reviewed medical literature for successful QI strategies and chose academic detailing, transparent display of data, and audit and feedback as our QI tactics.[29]
Using data from our electronic medical record, we chose a convenience preintervention period of 10 months for our baseline data. We allowed for a 2‐month wash‐in period in August 2013, and a convenience period of 7 months was chosen as the intervention period.
Intervention
An introductory email was sent out in mid‐August 2013 to all hospitalist providers describing the waste and potential harm to patients associated with unnecessary common blood tests, in particular those ordered as daily. The email recommended 2 changes: (1) immediate cessation of the practice of ordering common labs as daily, in an open, unending manner and (2) assessing the need for common labs in the next 24 hours, and ordering based on that need, but no further into the future.
Hospitalist providers were additionally informed that the number of common labs ordered daily would be tracked prospectively, with monthly reporting of individual provider ordering. In addition, the 5 members of the hospitalist team who most frequently ordered common labs as daily during January 2013 to March 2013 were sent individual emails informing them of their top‐5 position.
During the 7‐month intervention period, a monthly email was sent to all members of the hospitalist team with 4 basic components: (1) reiteration of the recommendations and reasoning stated in the original email; (2) a list of all members of the hospitalist team and the corresponding frequency of common labs ordered as daily (open ended) per provider for the month; (3) a recommendation to discontinue any common labs ordered as daily; and (4) at least 1 example of a patient cared for during the month by the hospitalist team, who had at least 1 common lab ordered for at least 5 days in a row, with no mention of the results in the progress notes and no apparent contribution to the management of the medical conditions for which the patient was being treated.
The change in number of tests ordered during the intervention was not shared with the team until early January 2014.
Data Elements and Endpoints
Number of common labs ordered as daily, and the total number of common labs per hospital‐day, ordered by any frequency, on hospitalist patients were abstracted from the electronic medical record. Hospitalist patients were defined as those both admitted and discharged by a hospitalist provider. We chose to compare the 10 months prior to the intervention with the 7 months during the intervention, allowing 1 month as the intervention wash‐in period. No other interventions related to lab ordering occurred during the study period. Additional variables collected included duration of hospitalization, mortality, readmission, and transfusion data. Consistency of providers in the preintervention and intervention period was high. Two providers were included in some of the preintervention data, but were not included in the intervention data, as they both left for other positions. Otherwise, all other providers in the data were consistent between the 2 time periods.
The primary endpoint was chosen a priori as the total number of common labs ordered per hospital‐day. Additionally, we identified a priori potential confounders, including age, sex, and primary discharge diagnosis, as captured by the all‐patient refined diagnosis‐related group (APR‐DRG, hereafter DRG). DRG was chosen as a clinical risk adjustment variable because there does not exist an established method to model the effects of clinical conditions on the propensity to obtain labs, the primary endpoint. Many models used for risk adjustment in patient quality reporting use hospital mortality as the primary endpoint, not the need for laboratory testing.[30, 31] As our primary endpoint was common labs and not mortality, we chose DRG as the best single variable to model changes in the clinical case mix that might affect the number of common labs.
Secondary endpoints were also determined a priori. Out of desire to assess the patient safety implications of an intervention targeting decreased monitoring, we included hospital mortality, duration of hospitalization, and readmission as safety variables. Two secondary endpoints were obtained as possible additional efficacy endpoints to test the hypothesis that the intervention might be associated with a reduction in transfusion burden: red blood cell transfusion and transfusion volume. We also tracked the frequency with which providers ordered common labs as daily in the baseline and intervention periods, as this was the behavior targeted by the interventions.
Costs to the hospital to produce the lab studies were also considered as a secondary endpoint. Median hospital costs were obtained from the first‐quarter, 2013 Premier dataset, a national dataset of hospital costs (basic metabolic panel $14.69, complete blood count $11.68, comprehensive metabolic panel $18.66). Of note, the Premier data did not include cost data on what our institution calls a TPN 2, and BMP cost was used as a substitute, given the overlap of the 2 tests' components and a desire to conservatively estimate the effects on cost to produce. Additionally, we factored in estimate of hospitalist and analyst time at $150/hour and $75/hour, respectively, to conduct that data abstraction and analysis and to manage the program. We did not formally factor in other costs, including electronic medical record acquisition costs.
Statistical Analyses
Descriptive statistics were used to describe the 2 cohorts. To test our primary hypothesis about the association between cohort membership and number of common labs per patient day, a clustered multivariable linear regression model was constructed to adjust for the a priori identified potential confounders, including sex, age, and principle discharge diagnosis. Each DRG was entered as a categorical variable in the model. Clustering was employed to account for correlation of lab ordering behavior by a given hospitalist. Separate clustered multivariable models were constructed to test the association between cohort and secondary outcomes, including duration of hospitalization, readmission, mortality, transfusion frequency, and transfusion volume using the same potential confounders. All P values were 2‐sided, and a P<0.05 was considered statistically significant. All analyses were conducted with Stata 11.2 (StataCorp, College Station, TX). The study was reviewed by the Swedish Health Services Clinical Research Center and determined to be nonhuman subjects research.
RESULTS
Patient Characteristics
Patient characteristics in the before and after cohorts are shown in Table 1. Both proportion of male sex (44.9% vs 44.9%, P=1.0) and the mean age (64.6 vs 64.8 years, P=0.5) did not significantly differ between the 2 cohorts. Interestingly, there was a significant change in the distribution of DRGs between the 2 cohorts, with each of the top 10 DRGs becoming more common in the intervention cohort. For example, the percentage of patients with sepsis or severe sepsis, DRGs 871 and 872, increased by 2.2% (8.2% vs 10.4%, P<0.01).
| Baseline, n=7832 | Intervention, n=5759 | P Valuea | |
|---|---|---|---|
| |||
| Age, y, mean (SD) | 64.6 (19.6) | 64.8 | 0.5 |
| Male, n (%) | 3,514 (44.9) | 2,585 (44.9) | 1.0 |
| Primary discharge diagnosis, DRG no., name, n (%)b | |||
| 871 and 872, severe sepsis | 641 (8.2) | 599 (10.4) | <0.01 |
| 885, psychoses | 72 (0.9) | 141 (2.4) | <0.01 |
| 392, esophagitis, gastroenteritis and miscellaneous intestinal disorders | 171 (2.2) | 225 (3.9) | <0.01 |
| 313, chest pain | 114 (1.5) | 123 (2.1) | <0.01 |
| 378, gastrointestinal bleed | 100 (1.3) | 117 (2.0) | <0.01 |
| 291, congestive heart failure and shock | 83 (1.1) | 101 (1.8) | <0.01 |
| 189, pulmonary edema and respiratory failure | 69 (0.9) | 112 (1.9) | <0.01 |
| 312, syncope and collapse | 82 (1.0) | 119 (2.1) | <0.01 |
| 64, intracranial hemorrhage or cerebral infarction | 49 (0.6) | 54 (0.9) | 0.04 |
| 603, cellulitis | 96 (1.2) | 94 (1.6) | 0.05 |
Primary Endpoint
In the unadjusted comparison, 3 of the 4 common labs showed a similar decrease in the intervention cohort from the baseline (Table 2). For example, the mean number of CBCs ordered per patient‐day decreased by 0.15 labs per patient day (1.06 vs 0.91, P<0.01). The total number of common labs ordered per patient‐day decreased by 0.30 labs per patient‐day (2.06 vs 1.76, P<0.01) in the unadjusted analysis (Figure 1 and Table 2). Part of our hypothesis was that decreasing the number of labs that were ordered as daily, in an open‐ended manner, would likely decrease the number of common labs obtained per day. We found that the number of labs ordered as daily decreased by 0.71 labs per patient‐day (0.872.90 vs 0.161.01, P<0.01), an 81.6% decrease from the preintervention time period.
| Baseline | Intervention | P Valuea | |
|---|---|---|---|
| |||
| Complete blood count, per patient‐day, mean (SD) | 1.06 (0.76) | 0.91 (0.75) | <0.01 |
| Basic metabolic panel, per patient‐day, mean (SD) | 0.68 (0.71) | 0.55 (0.60) | <0.01 |
| Nutrition panel, mean (SD)b | 0.06 (0.24) | 0.07 (0.32) | 0.01 |
| Comprehensive metabolic panel, per patient‐day, mean (SD) | 0.27 (0.49) | 0.23 (0.46) | <0.01 |
| Total no. of basic labs ordered per patient‐day, mean (SD) | 2.06 (1.40) | 1.76 (1.37) | <0.01 |
| Transfused, n (%) | 414 (5.3) | 268 (4.7) | 0.1 |
| Transfused volume, mL, mean (SD) | 847.3 (644.3) | 744.9 (472.0) | 0.02 |
| Length of stay, days, mean (SD) | 3.79 (4.58) | 3.81 (4.50) | 0.7 |
| Readmitted, n (%) | 1049 (13.3) | 733 (12.7) | 0.3 |
| Died, n (%) | 173 (2.2) | 104 (1.8) | 0.1 |
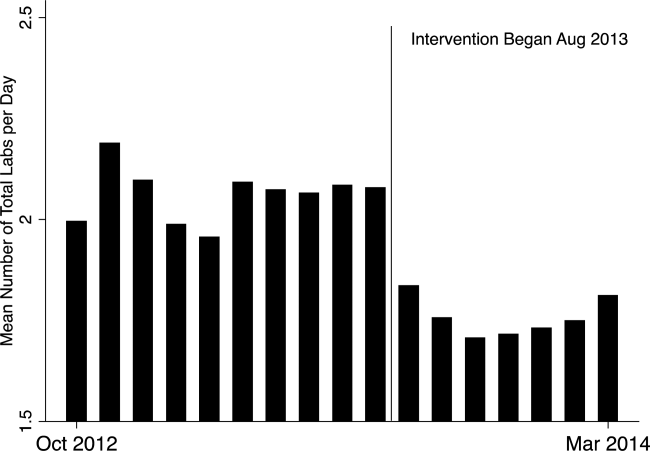
In our multivariable regression model, after adjusting for sex, age, and the primary reason for admission as captured by DRG, the number of common labs ordered per day was reduced by 0.22 (95% CI, 0.34 to 0.11; P<0.01). This represents a 10.7% reduction in common labs ordered per patient day.
Secondary Endpoints
Table 2 shows secondary outcomes of the study. Patient safety endpoints were not changed in unadjusted analyses. For example, the hospital length of stay in number of days was similar in both the baseline and intervention cohorts (3.784.58 vs 3.814.50, P=0.7). There was a nonsignificant reduction in the hospital mortality rate during the intervention period by 0.4% (2.2% vs 1.8%, P=0.1). No significant differences were found when the multivariable model was rerun for each of the 3 secondary endpoints individually, readmissions, mortality, and length of stay.
Two secondary efficacy endpoints were also evaluated. The percentage of patients receiving transfusions did not decrease in either the unadjusted or adjusted analysis. However, the volume of blood transfused per patient who received a transfusion decreased by 91.9 mL in the bivariate analysis (836.8 mL621.4 mL vs 744.9 mL472.0 mL; P=0.03) (Table 2). The decrease, however, was not significant in the multivariable model (127.2 mL; 95% CI, 257.9 to 3.6; P=0.06).
Cost Data
Based on the Premier estimate of the cost to the hospital to perform the common lab tests, the intervention likely decreased direct costs by $16.19 per patient (95% CI, $12.95 to $19.43). The cost saving was decreased by the expense of the intervention, which is estimated to be $8000 and was driven by hospitalist and analyst time. Based on the patient volume in our health system, and factoring in the cost of implementation, we estimate that this intervention resulted in annualized savings of $151,682 (95% CI, $119,746 to $187,618).
DISCUSSION
Ordering common labs daily is a routine practice among providers at many institutions. In fact, at our institution, prior to the intervention, 42% of all common labs were ordered as daily, meaning they were obtained each day without regard to the previous value or the patient's clinical condition. The practice is one of convenience or habit, and many times not clinically indicated.[5, 32]
We observed a significant reduction in the number of common labs ordered as daily, and more importantly, the total number of common labs in the intervention period. The rapid change in provider behavior is notable and likely due to several factors. First, there was a general sentiment among the hospitalists in the merits of the project. Second, there may have been an aversion to the display of lower performance relative to peers in the monthly e‐mails. Third, and perhaps most importantly, our hospitalist team had worked together for many years on projects like this, creating a culture of QI and willingness to change practice patterns in response to data.[33]
Concern about decreasing waste and increasing the value of healthcare abound, particularly in the United States.[1] Decreasing the cost to produce equivalent or improved health outcomes for a given episode of care has been proposed as a way to improve value.[34] This intervention results in modest waste reduction, the benefits of which are readily apparent in a DRG‐based reimbursement model, where the hospital realizes any saving in the cost of producing a hospital stay, as well as in a total cost of care environment, such as could be found in an Accountable Care Organization.
The previous work in the field of lab reduction has all been performed at university‐affiliated academic institutions. We demonstrated that the QI tactics described in the literature can be successfully employed in a community‐based hospitalist practice. This has broad applicability to increasing the value of healthcare and could serve as a model for future community‐based hospitalist QI projects.
The study has several limitations. First, the length of follow‐up is only 7 months, and although there was rapid and effective adoption of the intervention, provider behavior may regress to previous practice patterns over time. Second, the simple before‐after nature of our trial design raises the possibility that environmental influences exist and that changes in ordering behavior may have been the result of something other than the intervention. Most notably, the Choosing Wisely recommendation for hospitalists was published in September of 2013, coinciding with our intervention period.[22] The reduction in number of labs ordered may have been a partial result of these recommendations. Third, the 2 cohorts included different times of the year based on the distribution of DRGs, which likely had a different composition of diagnoses being treated. To address this we adjusted for DRG, but there may have been some residual confounding, as some diagnoses may be managed with more laboratory tests than others in a way that was not fully adjusted for in our model. Fourth, the intervention was made possible because of the substantial and ongoing investments that our health system has made in our electronic medical record and data analytics capability. The variability of these resources across institutions limits generalizability. Fifth, although we used the QI tools that were described, we did not do a formal process map or utilize other Lean or Six Sigma tools. As the healthcare industry continues on its journey to high reliability, these use tools will hopefully become more widespread. We demonstrated that even with these simple tactics, significant progress can be made.
Finally, there exists a concern that decreasing regular laboratory monitoring might be associated with undetected worsening in the patient's clinical status. We did not observe any significant adverse effects on coarse measures of clinical performance, including length of stay, readmission rate, or mortality. However, we did not collect data on all clinical parameters, and it is possible that there could have been an undetected effect on incident renal failure or hemodialysis or intensive care unit transfer. Other studies on this type of intervention have evaluated some of these possible adverse outcomes and have not noted an association.[12, 15, 18, 20, 22] Future studies should evaluate harms associated with implementation of Choosing Wisely and other interventions targeted at waste reduction. Future work is also needed to disseminate more formal and rigorous QI tools and methodologies.
CONCLUSION
We implemented a multifaceted QI intervention including provider education, transparent display of data, and audit and feedback that was associated with a significant reduction in the number of common labs ordered in a large community‐based hospitalist group, without evidence of harm. Further study is needed to understand how hospitalist groups can optimally decrease waste in healthcare.
Disclosures
This work was performed at the Swedish Health System, Seattle, Washington. Dr. Corson served as primary author, designed the study protocol, obtained the data, analyzed all the data and wrote the manuscript and its revisions, and approved the final version of the manuscript. He attests that no undisclosed authors contributed to the manuscript. Dr. Fan designed the study protocol, reviewed the manuscript, and approved the final version of the manuscript. Mr. White reviewed the study protocol, obtained the study data, reviewed the manuscript, and approved the final version of the manuscript. Sean D. Sullivan, PhD, designed the study protocol, obtained study data, reviewed the manuscript, and approved the final version of the manuscript. Dr. Asakura designed the study protocol, reviewed the manuscript, and approved the final version of the manuscript. Dr. Myint reviewed the study protocol and data, reviewed the manuscript, and approved the final version of the manuscript. Dr. Dale designed the study protocol, analyzed the data, reviewed the manuscript, and approved the final version of the manuscript. The authors report no conflicts of interest.
- . Eliminating “waste” in health care. JAMA. 2012;307(14):1513–1516.
- . The U.S. health system in perspective: a comparison of twelve industrialized nations. Issue Brief (Commonw Fund). 2011;16:1–14.
- , . Is the defensive use of diagnostic tests good for patients, or bad? Med Decis Mak. 1998;18(1):19–28.
- , . Physician characteristics and organizational factors influencing use of ambulatory tests. Med Decis Making. 1985;5:401–415.
- , , ; Pilot Group of the Appropriate Utilization of Laboratory Tests (REDCONLAB) Working Group. Differences in laboratory requesting patterns in emergency department in Spain. Ann Clin Biochem. 2013;50:353–359.
- , . Hospital‐acquired anemia. J Med Assoc Thail. 2006;89(1):63–67.
- , , , , . Do blood tests cause anemia in hospitalized patients? The effect of diagnostic phlebotomy on hemoglobin and hematocrit levels. J Gen Intern Med. 2005;20(6):520–524.
- , . Phlebotomy for diagnostic laboratory tests in adults. Pattern of use and effect on transfusion requirements. N Engl J Med. 1986;314(19):1233–1235.
- , , , et al. Diagnostic blood loss from phlebotomy and hospital‐acquired anemia during acute myocardial infarction. Arch Intern Med. 2011;171(18):1646–1653.
- , , , et al. Hospital‐acquired anemia: prevalence, outcomes, and healthcare implications. J Hosp Med. 2013;8(9):506–512.
- , , . Laboratory phlebotomy. College of American Pathologists Q‐Probe study of patient satisfaction and complications in 23,783 patients. Arch Pathol Lab Med. 1991;115:867–872.
- , , , et al. A cost‐effective method for reducing the volume of laboratory tests in a university‐associated teaching hospital. Mt Sinai J Med. 2006;73(5):787–794.
- , . Inappropriate use of laboratory services: long term combined approach to modify request patterns. BMJ. 1990;301(6764):1305–1307.
- , . Effect of a controlled feedback intervention on laboratory test ordering by community physicians. Clin Chem. 2004;50(2):321–326.
- , , , , . An administrative intervention to improve the utilization of laboratory tests within a university hospital. Int J Qual Heal Care. 2005;17(3):243–248.
- . Surgical vampires and rising health care expenditure. Arch Surg. 2011;146(5):524–527.
- , , , et al. Trial of strategy for reducing the use of laboratory tests. Br Med J (Clin Res Ed). 1986;292(6524):883–885.
- , , , et al. Improving house staff ordering of three common laboratory tests. Reductions in test ordering need not result in underutilization. Med Care. 1987;25(10):928–935.
- , , , et al. Reducing unnecessary inpatient laboratory testing in a teaching hospital. Am J Clin Pathol. 2006;126(2):200–206.
- , , , et al. Improving patient care the impact of peer management on test‐ordering behavior. Ann Intern Med. 2004;141(3):196–204.
- , , . The laboratory test justified. An effective means to reduce routine laboratory testing. Am J Clin Pathol. 1985;86(6):756–759.
- , , , et al. Choosing wisely in adult hospital medicine: five opportunities for improved healthcare value. J Hosp Med. 2013;8(9):486–492.
- . Quality Improvement in the intensive care unit. In: Scales DC, Rubenfeld GD, eds. The Organization of Critical Care. New York, NY: Humana Press; 2014:279.
- , , , et al. Intensive care unit quality improvement: a “how‐to” guide for the interdisciplinary team. Crit Care Med. 2006;34:211–218.
- . Navigating adaptive challenges in quality improvement. BMJ Qual Safety. 2011;20(7):560–563.
- , , , et al. A multifaceted intervention for quality improvement in a network of intensive care units: a cluster randomized trial. JAMA. 2011;305:363–372.
- O'Neill SM. How do quality improvement interventions succeed? Archetypes of success and failure. Available at: http://www.rand.org/pubs/rgs_dissertations/RGSD282.html. Published 2011.
- , , , et al. Effect of a multifaceted intervention on use of evidence‐based therapies in patients with acute coronary syndromes in Brazil: the BRIDGE‐ACS randomized trial. JAMA. 2012;307:2041–2049.
- , , , et al. Audit and feedback: effects on professional practice and healthcare outcomes. Cochrane Database Syst Rev. 2012;6:CD000259.
- , , , . Impact of the present‐on‐admission indicator on hospital quality measurement: experience with the Agency for Healthcare Research and Quality (AHRQ) Inpatient Quality Indicators. Med Care. 2008;46:112–119.
- , , , et al. Enhancement of claims data to improve risk adjustment of hospital mortality. JAMA. 2007;297:71–76.
- , , , . Primary care use of laboratory tests in Spain: measurement through appropriateness indicators. Clin Lab. 2014;60(3):483–490.
- , , , et al. What distinguishes top‐performing hospitals in acute myocardial infarction mortality rates? a qualitative study. Ann Intern Med. 2011;154(6):384–390.
- . What is value in health care? N Engl J Med. 2010;363(26):2477–2481.
Waste in US healthcare is a public health threat, with an estimated value of $910 billion per year.[1] It constitutes some of the relatively high per‐discharge healthcare spending seen in the United States when compared to other nations.[2] Waste takes many forms, one of which is excessive use of diagnostic laboratory testing.[1] Many hospital providers obtain common labs, such as complete blood counts (CBCs) and basic metabolic panels (BMPs), in an open‐ended, daily manner for their hospitalized patients, without regard for the patient's clinical condition or despite stability of the previous results. Reasons for ordering these tests in a nonpatient‐centered manner include provider convenience (such as inclusion in an order set), ease of access, habit, or defensive practice.[3, 4, 5] All of these reasons may represent waste.
Although the potential waste of routine daily labs may seem small, the frequency with which they are ordered results in a substantial real and potential cost, both financially and clinically. Multiple studies have shown a link between excessive diagnostic phlebotomy and hospital‐acquired anemia.[6, 7, 8, 9] Hospital‐acquired anemia itself has been associated with increased mortality.[10] In addition to blood loss and financial cost, patient experience and satisfaction are also detrimentally affected by excessive laboratory testing in the form of pain and inconvenience from the act of phlebotomy.[11]
There are many reports of strategies to decrease excessive diagnostic laboratory testing as a means of addressing this waste in the inpatient setting.[12, 13, 14, 15, 16, 17, 18, 19, 20, 21] All of these studies have taken place in a traditional academic setting, and many implemented their intervention through a computer‐based order entry system. Based on the literature search regarding this topic, we found no examples of studies conducted among and within community‐based hospitalist practices. More recently, this issue was highlighted as part of the Choosing Wisely campaign sponsored by the American Board of Internal Medicine Foundation, Consumer Reports, and more than 60 specialty societies. The Society of Hospital Medicine, the professional society for hospitalists, recommended avoidance of repetitive common laboratory testing in the face of clinical stability.[22]
Much has been written about quality improvement (QI) by the Institute for Healthcare Improvement, the Society of Hospitalist Medicine, and others.[23, 24, 25] How best to move from a Choosing Wisely recommendation to highly reliable incorporation in clinical practice in a community setting is not known and likely varies depending upon the care environment. Successful QI interventions are often multifaceted and include academic detailing and provider education, transparent display of data, and regular audit and feedback of performance data.[26, 27, 28, 29] Prior to the publication of the Society of Hospital Medicine's Choosing Wisely recommendations, we chose to implement the recommendation to decrease ordering of daily labs using 3 QI strategies in our community 4‐hospital health system.
METHODS
Study Participants
This activity was undertaken as a QI initiative by Swedish Hospital Medicine (SHM), a 53‐provider employed hospitalist group that staffs a total of 1420 beds across 4 inpatient facilities. SHM has a longstanding record of working together as a team on QI projects.
An informal preliminary audit of our common lab ordering by a member of the study team revealed multiple examples of labs ordered every day without medical‐record evidence of intervention or management decisions being made based on the results. This preliminary activity raised the notion within the hospitalist group that this was a topic ripe for intervention and improvement. Four common labs, CBC, BMP, nutrition panel (called TPN 2 in our system, consisting of a BMP and magnesium and phosphorus) and comprehensive metabolic panel (BMP and liver function tests), formed the bulk of the repetitively ordered labs and were the focus of our activity. We excluded prothrombin time/International Normalized Ratio, as it was less clear that obtaining these daily clearly represented waste. We then reviewed medical literature for successful QI strategies and chose academic detailing, transparent display of data, and audit and feedback as our QI tactics.[29]
Using data from our electronic medical record, we chose a convenience preintervention period of 10 months for our baseline data. We allowed for a 2‐month wash‐in period in August 2013, and a convenience period of 7 months was chosen as the intervention period.
Intervention
An introductory email was sent out in mid‐August 2013 to all hospitalist providers describing the waste and potential harm to patients associated with unnecessary common blood tests, in particular those ordered as daily. The email recommended 2 changes: (1) immediate cessation of the practice of ordering common labs as daily, in an open, unending manner and (2) assessing the need for common labs in the next 24 hours, and ordering based on that need, but no further into the future.
Hospitalist providers were additionally informed that the number of common labs ordered daily would be tracked prospectively, with monthly reporting of individual provider ordering. In addition, the 5 members of the hospitalist team who most frequently ordered common labs as daily during January 2013 to March 2013 were sent individual emails informing them of their top‐5 position.
During the 7‐month intervention period, a monthly email was sent to all members of the hospitalist team with 4 basic components: (1) reiteration of the recommendations and reasoning stated in the original email; (2) a list of all members of the hospitalist team and the corresponding frequency of common labs ordered as daily (open ended) per provider for the month; (3) a recommendation to discontinue any common labs ordered as daily; and (4) at least 1 example of a patient cared for during the month by the hospitalist team, who had at least 1 common lab ordered for at least 5 days in a row, with no mention of the results in the progress notes and no apparent contribution to the management of the medical conditions for which the patient was being treated.
The change in number of tests ordered during the intervention was not shared with the team until early January 2014.
Data Elements and Endpoints
Number of common labs ordered as daily, and the total number of common labs per hospital‐day, ordered by any frequency, on hospitalist patients were abstracted from the electronic medical record. Hospitalist patients were defined as those both admitted and discharged by a hospitalist provider. We chose to compare the 10 months prior to the intervention with the 7 months during the intervention, allowing 1 month as the intervention wash‐in period. No other interventions related to lab ordering occurred during the study period. Additional variables collected included duration of hospitalization, mortality, readmission, and transfusion data. Consistency of providers in the preintervention and intervention period was high. Two providers were included in some of the preintervention data, but were not included in the intervention data, as they both left for other positions. Otherwise, all other providers in the data were consistent between the 2 time periods.
The primary endpoint was chosen a priori as the total number of common labs ordered per hospital‐day. Additionally, we identified a priori potential confounders, including age, sex, and primary discharge diagnosis, as captured by the all‐patient refined diagnosis‐related group (APR‐DRG, hereafter DRG). DRG was chosen as a clinical risk adjustment variable because there does not exist an established method to model the effects of clinical conditions on the propensity to obtain labs, the primary endpoint. Many models used for risk adjustment in patient quality reporting use hospital mortality as the primary endpoint, not the need for laboratory testing.[30, 31] As our primary endpoint was common labs and not mortality, we chose DRG as the best single variable to model changes in the clinical case mix that might affect the number of common labs.
Secondary endpoints were also determined a priori. Out of desire to assess the patient safety implications of an intervention targeting decreased monitoring, we included hospital mortality, duration of hospitalization, and readmission as safety variables. Two secondary endpoints were obtained as possible additional efficacy endpoints to test the hypothesis that the intervention might be associated with a reduction in transfusion burden: red blood cell transfusion and transfusion volume. We also tracked the frequency with which providers ordered common labs as daily in the baseline and intervention periods, as this was the behavior targeted by the interventions.
Costs to the hospital to produce the lab studies were also considered as a secondary endpoint. Median hospital costs were obtained from the first‐quarter, 2013 Premier dataset, a national dataset of hospital costs (basic metabolic panel $14.69, complete blood count $11.68, comprehensive metabolic panel $18.66). Of note, the Premier data did not include cost data on what our institution calls a TPN 2, and BMP cost was used as a substitute, given the overlap of the 2 tests' components and a desire to conservatively estimate the effects on cost to produce. Additionally, we factored in estimate of hospitalist and analyst time at $150/hour and $75/hour, respectively, to conduct that data abstraction and analysis and to manage the program. We did not formally factor in other costs, including electronic medical record acquisition costs.
Statistical Analyses
Descriptive statistics were used to describe the 2 cohorts. To test our primary hypothesis about the association between cohort membership and number of common labs per patient day, a clustered multivariable linear regression model was constructed to adjust for the a priori identified potential confounders, including sex, age, and principle discharge diagnosis. Each DRG was entered as a categorical variable in the model. Clustering was employed to account for correlation of lab ordering behavior by a given hospitalist. Separate clustered multivariable models were constructed to test the association between cohort and secondary outcomes, including duration of hospitalization, readmission, mortality, transfusion frequency, and transfusion volume using the same potential confounders. All P values were 2‐sided, and a P<0.05 was considered statistically significant. All analyses were conducted with Stata 11.2 (StataCorp, College Station, TX). The study was reviewed by the Swedish Health Services Clinical Research Center and determined to be nonhuman subjects research.
RESULTS
Patient Characteristics
Patient characteristics in the before and after cohorts are shown in Table 1. Both proportion of male sex (44.9% vs 44.9%, P=1.0) and the mean age (64.6 vs 64.8 years, P=0.5) did not significantly differ between the 2 cohorts. Interestingly, there was a significant change in the distribution of DRGs between the 2 cohorts, with each of the top 10 DRGs becoming more common in the intervention cohort. For example, the percentage of patients with sepsis or severe sepsis, DRGs 871 and 872, increased by 2.2% (8.2% vs 10.4%, P<0.01).
| Baseline, n=7832 | Intervention, n=5759 | P Valuea | |
|---|---|---|---|
| |||
| Age, y, mean (SD) | 64.6 (19.6) | 64.8 | 0.5 |
| Male, n (%) | 3,514 (44.9) | 2,585 (44.9) | 1.0 |
| Primary discharge diagnosis, DRG no., name, n (%)b | |||
| 871 and 872, severe sepsis | 641 (8.2) | 599 (10.4) | <0.01 |
| 885, psychoses | 72 (0.9) | 141 (2.4) | <0.01 |
| 392, esophagitis, gastroenteritis and miscellaneous intestinal disorders | 171 (2.2) | 225 (3.9) | <0.01 |
| 313, chest pain | 114 (1.5) | 123 (2.1) | <0.01 |
| 378, gastrointestinal bleed | 100 (1.3) | 117 (2.0) | <0.01 |
| 291, congestive heart failure and shock | 83 (1.1) | 101 (1.8) | <0.01 |
| 189, pulmonary edema and respiratory failure | 69 (0.9) | 112 (1.9) | <0.01 |
| 312, syncope and collapse | 82 (1.0) | 119 (2.1) | <0.01 |
| 64, intracranial hemorrhage or cerebral infarction | 49 (0.6) | 54 (0.9) | 0.04 |
| 603, cellulitis | 96 (1.2) | 94 (1.6) | 0.05 |
Primary Endpoint
In the unadjusted comparison, 3 of the 4 common labs showed a similar decrease in the intervention cohort from the baseline (Table 2). For example, the mean number of CBCs ordered per patient‐day decreased by 0.15 labs per patient day (1.06 vs 0.91, P<0.01). The total number of common labs ordered per patient‐day decreased by 0.30 labs per patient‐day (2.06 vs 1.76, P<0.01) in the unadjusted analysis (Figure 1 and Table 2). Part of our hypothesis was that decreasing the number of labs that were ordered as daily, in an open‐ended manner, would likely decrease the number of common labs obtained per day. We found that the number of labs ordered as daily decreased by 0.71 labs per patient‐day (0.872.90 vs 0.161.01, P<0.01), an 81.6% decrease from the preintervention time period.
| Baseline | Intervention | P Valuea | |
|---|---|---|---|
| |||
| Complete blood count, per patient‐day, mean (SD) | 1.06 (0.76) | 0.91 (0.75) | <0.01 |
| Basic metabolic panel, per patient‐day, mean (SD) | 0.68 (0.71) | 0.55 (0.60) | <0.01 |
| Nutrition panel, mean (SD)b | 0.06 (0.24) | 0.07 (0.32) | 0.01 |
| Comprehensive metabolic panel, per patient‐day, mean (SD) | 0.27 (0.49) | 0.23 (0.46) | <0.01 |
| Total no. of basic labs ordered per patient‐day, mean (SD) | 2.06 (1.40) | 1.76 (1.37) | <0.01 |
| Transfused, n (%) | 414 (5.3) | 268 (4.7) | 0.1 |
| Transfused volume, mL, mean (SD) | 847.3 (644.3) | 744.9 (472.0) | 0.02 |
| Length of stay, days, mean (SD) | 3.79 (4.58) | 3.81 (4.50) | 0.7 |
| Readmitted, n (%) | 1049 (13.3) | 733 (12.7) | 0.3 |
| Died, n (%) | 173 (2.2) | 104 (1.8) | 0.1 |
In our multivariable regression model, after adjusting for sex, age, and the primary reason for admission as captured by DRG, the number of common labs ordered per day was reduced by 0.22 (95% CI, 0.34 to 0.11; P<0.01). This represents a 10.7% reduction in common labs ordered per patient day.
Secondary Endpoints
Table 2 shows secondary outcomes of the study. Patient safety endpoints were not changed in unadjusted analyses. For example, the hospital length of stay in number of days was similar in both the baseline and intervention cohorts (3.784.58 vs 3.814.50, P=0.7). There was a nonsignificant reduction in the hospital mortality rate during the intervention period by 0.4% (2.2% vs 1.8%, P=0.1). No significant differences were found when the multivariable model was rerun for each of the 3 secondary endpoints individually, readmissions, mortality, and length of stay.
Two secondary efficacy endpoints were also evaluated. The percentage of patients receiving transfusions did not decrease in either the unadjusted or adjusted analysis. However, the volume of blood transfused per patient who received a transfusion decreased by 91.9 mL in the bivariate analysis (836.8 mL621.4 mL vs 744.9 mL472.0 mL; P=0.03) (Table 2). The decrease, however, was not significant in the multivariable model (127.2 mL; 95% CI, 257.9 to 3.6; P=0.06).
Cost Data
Based on the Premier estimate of the cost to the hospital to perform the common lab tests, the intervention likely decreased direct costs by $16.19 per patient (95% CI, $12.95 to $19.43). The cost saving was decreased by the expense of the intervention, which is estimated to be $8000 and was driven by hospitalist and analyst time. Based on the patient volume in our health system, and factoring in the cost of implementation, we estimate that this intervention resulted in annualized savings of $151,682 (95% CI, $119,746 to $187,618).
DISCUSSION
Ordering common labs daily is a routine practice among providers at many institutions. In fact, at our institution, prior to the intervention, 42% of all common labs were ordered as daily, meaning they were obtained each day without regard to the previous value or the patient's clinical condition. The practice is one of convenience or habit, and many times not clinically indicated.[5, 32]
We observed a significant reduction in the number of common labs ordered as daily, and more importantly, the total number of common labs in the intervention period. The rapid change in provider behavior is notable and likely due to several factors. First, there was a general sentiment among the hospitalists in the merits of the project. Second, there may have been an aversion to the display of lower performance relative to peers in the monthly e‐mails. Third, and perhaps most importantly, our hospitalist team had worked together for many years on projects like this, creating a culture of QI and willingness to change practice patterns in response to data.[33]
Concern about decreasing waste and increasing the value of healthcare abound, particularly in the United States.[1] Decreasing the cost to produce equivalent or improved health outcomes for a given episode of care has been proposed as a way to improve value.[34] This intervention results in modest waste reduction, the benefits of which are readily apparent in a DRG‐based reimbursement model, where the hospital realizes any saving in the cost of producing a hospital stay, as well as in a total cost of care environment, such as could be found in an Accountable Care Organization.
The previous work in the field of lab reduction has all been performed at university‐affiliated academic institutions. We demonstrated that the QI tactics described in the literature can be successfully employed in a community‐based hospitalist practice. This has broad applicability to increasing the value of healthcare and could serve as a model for future community‐based hospitalist QI projects.
The study has several limitations. First, the length of follow‐up is only 7 months, and although there was rapid and effective adoption of the intervention, provider behavior may regress to previous practice patterns over time. Second, the simple before‐after nature of our trial design raises the possibility that environmental influences exist and that changes in ordering behavior may have been the result of something other than the intervention. Most notably, the Choosing Wisely recommendation for hospitalists was published in September of 2013, coinciding with our intervention period.[22] The reduction in number of labs ordered may have been a partial result of these recommendations. Third, the 2 cohorts included different times of the year based on the distribution of DRGs, which likely had a different composition of diagnoses being treated. To address this we adjusted for DRG, but there may have been some residual confounding, as some diagnoses may be managed with more laboratory tests than others in a way that was not fully adjusted for in our model. Fourth, the intervention was made possible because of the substantial and ongoing investments that our health system has made in our electronic medical record and data analytics capability. The variability of these resources across institutions limits generalizability. Fifth, although we used the QI tools that were described, we did not do a formal process map or utilize other Lean or Six Sigma tools. As the healthcare industry continues on its journey to high reliability, these use tools will hopefully become more widespread. We demonstrated that even with these simple tactics, significant progress can be made.
Finally, there exists a concern that decreasing regular laboratory monitoring might be associated with undetected worsening in the patient's clinical status. We did not observe any significant adverse effects on coarse measures of clinical performance, including length of stay, readmission rate, or mortality. However, we did not collect data on all clinical parameters, and it is possible that there could have been an undetected effect on incident renal failure or hemodialysis or intensive care unit transfer. Other studies on this type of intervention have evaluated some of these possible adverse outcomes and have not noted an association.[12, 15, 18, 20, 22] Future studies should evaluate harms associated with implementation of Choosing Wisely and other interventions targeted at waste reduction. Future work is also needed to disseminate more formal and rigorous QI tools and methodologies.
CONCLUSION
We implemented a multifaceted QI intervention including provider education, transparent display of data, and audit and feedback that was associated with a significant reduction in the number of common labs ordered in a large community‐based hospitalist group, without evidence of harm. Further study is needed to understand how hospitalist groups can optimally decrease waste in healthcare.
Disclosures
This work was performed at the Swedish Health System, Seattle, Washington. Dr. Corson served as primary author, designed the study protocol, obtained the data, analyzed all the data and wrote the manuscript and its revisions, and approved the final version of the manuscript. He attests that no undisclosed authors contributed to the manuscript. Dr. Fan designed the study protocol, reviewed the manuscript, and approved the final version of the manuscript. Mr. White reviewed the study protocol, obtained the study data, reviewed the manuscript, and approved the final version of the manuscript. Sean D. Sullivan, PhD, designed the study protocol, obtained study data, reviewed the manuscript, and approved the final version of the manuscript. Dr. Asakura designed the study protocol, reviewed the manuscript, and approved the final version of the manuscript. Dr. Myint reviewed the study protocol and data, reviewed the manuscript, and approved the final version of the manuscript. Dr. Dale designed the study protocol, analyzed the data, reviewed the manuscript, and approved the final version of the manuscript. The authors report no conflicts of interest.
- . Eliminating “waste” in health care. JAMA. 2012;307(14):1513–1516.
- . The U.S. health system in perspective: a comparison of twelve industrialized nations. Issue Brief (Commonw Fund). 2011;16:1–14.
- , . Is the defensive use of diagnostic tests good for patients, or bad? Med Decis Mak. 1998;18(1):19–28.
- , . Physician characteristics and organizational factors influencing use of ambulatory tests. Med Decis Making. 1985;5:401–415.
- , , ; Pilot Group of the Appropriate Utilization of Laboratory Tests (REDCONLAB) Working Group. Differences in laboratory requesting patterns in emergency department in Spain. Ann Clin Biochem. 2013;50:353–359.
- , . Hospital‐acquired anemia. J Med Assoc Thail. 2006;89(1):63–67.
- , , , , . Do blood tests cause anemia in hospitalized patients? The effect of diagnostic phlebotomy on hemoglobin and hematocrit levels. J Gen Intern Med. 2005;20(6):520–524.
- , . Phlebotomy for diagnostic laboratory tests in adults. Pattern of use and effect on transfusion requirements. N Engl J Med. 1986;314(19):1233–1235.
- , , , et al. Diagnostic blood loss from phlebotomy and hospital‐acquired anemia during acute myocardial infarction. Arch Intern Med. 2011;171(18):1646–1653.
- , , , et al. Hospital‐acquired anemia: prevalence, outcomes, and healthcare implications. J Hosp Med. 2013;8(9):506–512.
- , , . Laboratory phlebotomy. College of American Pathologists Q‐Probe study of patient satisfaction and complications in 23,783 patients. Arch Pathol Lab Med. 1991;115:867–872.
- , , , et al. A cost‐effective method for reducing the volume of laboratory tests in a university‐associated teaching hospital. Mt Sinai J Med. 2006;73(5):787–794.
- , . Inappropriate use of laboratory services: long term combined approach to modify request patterns. BMJ. 1990;301(6764):1305–1307.
- , . Effect of a controlled feedback intervention on laboratory test ordering by community physicians. Clin Chem. 2004;50(2):321–326.
- , , , , . An administrative intervention to improve the utilization of laboratory tests within a university hospital. Int J Qual Heal Care. 2005;17(3):243–248.
- . Surgical vampires and rising health care expenditure. Arch Surg. 2011;146(5):524–527.
- , , , et al. Trial of strategy for reducing the use of laboratory tests. Br Med J (Clin Res Ed). 1986;292(6524):883–885.
- , , , et al. Improving house staff ordering of three common laboratory tests. Reductions in test ordering need not result in underutilization. Med Care. 1987;25(10):928–935.
- , , , et al. Reducing unnecessary inpatient laboratory testing in a teaching hospital. Am J Clin Pathol. 2006;126(2):200–206.
- , , , et al. Improving patient care the impact of peer management on test‐ordering behavior. Ann Intern Med. 2004;141(3):196–204.
- , , . The laboratory test justified. An effective means to reduce routine laboratory testing. Am J Clin Pathol. 1985;86(6):756–759.
- , , , et al. Choosing wisely in adult hospital medicine: five opportunities for improved healthcare value. J Hosp Med. 2013;8(9):486–492.
- . Quality Improvement in the intensive care unit. In: Scales DC, Rubenfeld GD, eds. The Organization of Critical Care. New York, NY: Humana Press; 2014:279.
- , , , et al. Intensive care unit quality improvement: a “how‐to” guide for the interdisciplinary team. Crit Care Med. 2006;34:211–218.
- . Navigating adaptive challenges in quality improvement. BMJ Qual Safety. 2011;20(7):560–563.
- , , , et al. A multifaceted intervention for quality improvement in a network of intensive care units: a cluster randomized trial. JAMA. 2011;305:363–372.
- O'Neill SM. How do quality improvement interventions succeed? Archetypes of success and failure. Available at: http://www.rand.org/pubs/rgs_dissertations/RGSD282.html. Published 2011.
- , , , et al. Effect of a multifaceted intervention on use of evidence‐based therapies in patients with acute coronary syndromes in Brazil: the BRIDGE‐ACS randomized trial. JAMA. 2012;307:2041–2049.
- , , , et al. Audit and feedback: effects on professional practice and healthcare outcomes. Cochrane Database Syst Rev. 2012;6:CD000259.
- , , , . Impact of the present‐on‐admission indicator on hospital quality measurement: experience with the Agency for Healthcare Research and Quality (AHRQ) Inpatient Quality Indicators. Med Care. 2008;46:112–119.
- , , , et al. Enhancement of claims data to improve risk adjustment of hospital mortality. JAMA. 2007;297:71–76.
- , , , . Primary care use of laboratory tests in Spain: measurement through appropriateness indicators. Clin Lab. 2014;60(3):483–490.
- , , , et al. What distinguishes top‐performing hospitals in acute myocardial infarction mortality rates? a qualitative study. Ann Intern Med. 2011;154(6):384–390.
- . What is value in health care? N Engl J Med. 2010;363(26):2477–2481.

Introducing Choosing Wisely®
In this issue of the Journal of Hospital Medicine, we introduce a new recurring feature, Choosing Wisely: Next Steps in Improving Healthcare Value, sponsored by the American Board of Internal Medicine Foundation. The Choosing Wisely campaign is a collaborative initiative led by the American Board of Internal Medicine Foundation, in which specialty societies develop priority lists of activities that physicians should question doing routinely. The program has been broadly embraced by both patient and provider stakeholder groups. More than 35 specialty societies have contributed 26 published lists, including the Society of Hospital Medicine, which published 2 lists, 1 for adults and 1 for pediatrics. These included suggestions such as avoiding urinary catheters for convenience or monitoring of output, avoiding stress ulcer prophylaxis for low‐ to medium‐risk patients, and avoiding routine daily laboratory testing in clinically stable patients. A recent study estimated that up to $5 billion might be saved if just the primary care‐related recommendations were implemented.[1]
THE NEED FOR CHANGE
The Choosing Wisely campaign has so far focused primarily on identifying individual treatments that are not beneficial and potentially harmful to patients. At the Journal of Hospital Medicine, we believe the discipline of hospital medicine is well‐positioned to advance the broader discussion about achieving the triple aim: better healthcare, better health, and better value. Inpatient care represents only 7% of US healthcare encounters but 29% of healthcare expenditures (over $375 billion annually).[2] Patients aged 65 years and over account for 41% of all hospital costs and 34% of all hospital stays. Accordingly, without a change in current utilization patterns, the aging of the baby boomer generation will have a marked impact on expenditures for hospital care. Healthcare costs are increasingly edging out discretionary federal and municipal spending on critical services such as education and scientific research. Historically, federal discretionary spending has averaged 8.3% of gross domestic product (GDP). In 2014, it dropped to 7.2% and is projected to decline to 5.1% in 2024. By comparison, federal spending for Medicare, Medicaid, and health insurance subsidies was 2.1% in 1990[3] but in 2014 is estimated at 4.8% of GDP, rising to 5.7% by 2024.[4]
In conjunction with the deleterious consequences of unchecked growth in healthcare costs on national fiscal health, hospitals are feeling intense and increasing pressure to improve quality and value. In fiscal year 2015, hospitals will be at risk for up to 5.5% of Medicare payments under the parameters of the Hospital Readmission Reduction Program (maximum penalty 3% of base diagnosis‐related group [DRG] payments), Value‐Based Purchasing (maximum withholding 1.5% of base DRG payments), and the Hospital Acquired Conditions Program (maximum penalty 1% of all payments). Simultaneously, long‐standing subsidies are being phased out, including payments to teaching hospitals or for disproportionate share of care delivered to uninsured populations. The challenge for hospital medicine will be to take a leadership role in defining national priorities for change, organizing and guiding a pivot toward lower‐intensity care settings and services, and most importantly, promoting innovation in hospital‐based healthcare delivery.
EXISTING INNOVATIONS
The passage of the Affordable Care Act gave the Centers for Medicare & Medicaid Services (CMS) a platform for spurring innovation in healthcare delivery. In addition to deploying the payment penalty programs described above, the CMS Center for Medicare & Medicaid Innovation has a $10 billion budget to test alternate models of care. Demonstration projects to date include Accountable Care Organization pilots (ACOs, encouraging hospitals to join with community clinicians to provide integrated and coordinated care), the Bundled Payment program (paying providers a lump fee for an extended episode of care rather than service volume), a Comprehensive End Stage Renal Disease Care Initiative, and a variety of other tests of novel delivery and payment models that directly involve hospital medicine.[5] Private insurers are following suit, with an increasing proportion of hospital contracts involving shared savings or risk.
Hospitals are already responding to this new era of cost sharing and cross‐continuum accountability in a variety of creative ways. The University of Utah has developed an award‐winning cost accounting system that integrates highly detailed patient‐level cost data with clinical information to create a value‐driven outcomes tool that enables the hospital to consider costs as they relate to the results of care delivery. In this way, the hospital can justify maintaining high cost/better outcome activities, while targeting high cost/worse outcome practices for improvement.[6] Boston Children's Hospital is leading a group of healthcare systems in the development and application of a series of Standardized Clinical Assessment and Management Plans (SCAMPs), designed to improve patient care while decreasing unnecessary utilization (particularly in cases where existing evidence or guidelines are insufficient or outdated). Unlike traditional clinical care pathways or clinical guidelines, SCAMPs are developed iteratively based on actual internal practices, especially deviations from the standard plan, and their relationship to outcomes.[7, 8]
Local innovations, however, are of limited national importance in bending the cost curve unless broadly disseminated. The last decade has brought a new degree of cross‐institution collaboration to hospital care. Regional consortiums to improve care have existed for years, often prompted by CMS‐funded quality improvement organizations and demonstration projects.[9, 10] CMS's Partnership for Patients program has aimed to reduce hospital‐acquired conditions and readmissions by enrolling hospitals in 26 regional Hospital Engagement Networks.[11] Increasingly, however, hospitals are voluntarily engaging in collaboratives to improve the quality and value of their care. Over 500 US hospitals participate in the American College of Surgeons National Surgical Quality Improvement Program to improve surgical outcomes, nearly 1000 joined the Door‐to‐Balloon Alliance to improve percutaneous catheterization outcomes, and over 1000 joined the Hospital2Home collaborative to improve care transitions.[12, 13, 14] In 2008, the Premier hospital alliance formed QUEST (Quality, Efficiency, Safety and Transparency), a collaborative of approximately 350 members committed to improving a wide range of outcomes, from cost and efficiency to safety and mortality. Most recently, the High Value Healthcare Collaborative was formed, encompassing 19 large healthcare delivery organizations and over 70 million patients, with the central objective of creating a true learning healthcare system. In principle, these boundary‐spanning collaboratives should accelerate change nationally and serve as transformational agents. In practice, outcomes from these efforts have been variable, largely depending on the degree to which hospitals are able to share data, evaluate outcomes, and identify generalizable improvement interventions that can be reliably adopted.
Last, the focus of hospital care has already begun to extend beyond inpatient care. Hospitals already care for more outpatients than they do inpatients, and that trend is expected to continue. In 2012, hospitals treated 34.4 million inpatient admissions, but cared for nearly 675 million outpatient visits, only a fraction of which were emergency department visits or observation stays. From 2011 to 2012, outpatient visits to hospitals increased 2.9%, whereas inpatient admissions declined 1.2%.[15] Hospitals are buying up outpatient practices, creating infusion centers to provide intravenous‐based therapy to outpatients, establishing postdischarge clinics to transition their discharged patients, chartering their own visiting nurse agencies, and testing a host of other outpatient‐focused activities. Combined with an enhanced focus on postacute transitions following an inpatient admission as part of the care continuum, this broadening reach of hospital medicine brings a host of new opportunities for innovation in care delivery and payment models.
CHOOSING WISELY: NEXT STEPS IN IMPROVING HEALTHCARE VALUE
This series will consider a wide range of ways in which hospital medicine can help drive improvements in healthcare value, both from a conceptual standpoint (what to do and why?), as well as demonstration of practical application of these principles (how?). A companion series, Choosing Wisely: Things We Do For No Reason, will focus more explicitly on services such as blood transfusions or diagnostic tests such as creatinine kinase that are commonly overutilized. Example topics of interest for Next Steps include:
- Best methodologies for improvement science in hospital settings, including Lean healthcare, behavioral economics, human factors engineering
- Strategies for reconciling system‐level standardization with the delivery of personalized, patient‐centered care
- Impacts of national policies on hospital‐based improvement efforts: how do ACOs, bundled payments, and medical homes alter hospital practice?
- Reports on creative new ideas to help achieve value: changes in clinical workflow or care pathways, radical physical plant redesign, electronic medical record innovations, payment incentives, provider accountability and more
- Results of models that move the reach of hospital medicine beyond the walls as an integrated part of the care continuum.
We welcome unsolicited proposals for series topics submitted as a 500‐word precis to: nextsteps@hospitalmedicine.org.
Disclosures
Choosing Wisely: Next Steps in Improving Healthcare Value is sponsored by the American Board of Internal Medicine Foundation. Dr. Horwitz is supported by the National Institute on Aging (K08 AG038336) and by the American Federation for Aging Research through the Paul B. Beeson Career Development Award Program. The authors report no conflicts of interest.
- , , , . “Top 5” lists top $5 billion. Arch Intern Med. 2011;171(20):1858–1859.
- Healthcare Cost and Utilization Project. Statistical brief #146. Available at: http://www.hcup‐us.ahrq.gov/reports/statbriefs/sb146.pdf. Published January 2013. Accessed October 18, 2014.
- Centers for Medicare 32(5):911–920.
- Institute for Relevant Clinical Data Analytics, Inc. Relevant clinical data analytics I. SCAMPs mission statement. 2014. Available at: http://www.scamps.org/index.htm. Accessed October 18, 2014.
- , , , . The long‐term effect of premier pay for performance on patient outcomes. N Engl J Med. 2012;366(17):1606–1615.
- . Effects of the Premier Hospital Quality Incentive Demonstration on Medicare patient mortality and cost. Health Serv Res. 2009;44(3):821–842.
- Centers for Medicare 1(1):97–104.
- American College of Cardiology. Quality Improvement for Institutions. Hospital to home. 2014. Available at: http://cvquality.acc.org/Initiatives/H2H.aspx. Accessed October 19, 2014.
- American College of Surgeons. National Surgical Quality Improvement Program. 2014. Available at: http://site.acsnsqip.org/. Accessed October 19, 2014.
- . Hospitals on the rebound, show stronger operating margins. Modern Healthcare website. Available at: http://www. modernhealthcare.com/article/20140103/NEWS/301039973. Published January 3, 2014. Accessed October 18, 2014.
In this issue of the Journal of Hospital Medicine, we introduce a new recurring feature, Choosing Wisely: Next Steps in Improving Healthcare Value, sponsored by the American Board of Internal Medicine Foundation. The Choosing Wisely campaign is a collaborative initiative led by the American Board of Internal Medicine Foundation, in which specialty societies develop priority lists of activities that physicians should question doing routinely. The program has been broadly embraced by both patient and provider stakeholder groups. More than 35 specialty societies have contributed 26 published lists, including the Society of Hospital Medicine, which published 2 lists, 1 for adults and 1 for pediatrics. These included suggestions such as avoiding urinary catheters for convenience or monitoring of output, avoiding stress ulcer prophylaxis for low‐ to medium‐risk patients, and avoiding routine daily laboratory testing in clinically stable patients. A recent study estimated that up to $5 billion might be saved if just the primary care‐related recommendations were implemented.[1]
THE NEED FOR CHANGE
The Choosing Wisely campaign has so far focused primarily on identifying individual treatments that are not beneficial and potentially harmful to patients. At the Journal of Hospital Medicine, we believe the discipline of hospital medicine is well‐positioned to advance the broader discussion about achieving the triple aim: better healthcare, better health, and better value. Inpatient care represents only 7% of US healthcare encounters but 29% of healthcare expenditures (over $375 billion annually).[2] Patients aged 65 years and over account for 41% of all hospital costs and 34% of all hospital stays. Accordingly, without a change in current utilization patterns, the aging of the baby boomer generation will have a marked impact on expenditures for hospital care. Healthcare costs are increasingly edging out discretionary federal and municipal spending on critical services such as education and scientific research. Historically, federal discretionary spending has averaged 8.3% of gross domestic product (GDP). In 2014, it dropped to 7.2% and is projected to decline to 5.1% in 2024. By comparison, federal spending for Medicare, Medicaid, and health insurance subsidies was 2.1% in 1990[3] but in 2014 is estimated at 4.8% of GDP, rising to 5.7% by 2024.[4]
In conjunction with the deleterious consequences of unchecked growth in healthcare costs on national fiscal health, hospitals are feeling intense and increasing pressure to improve quality and value. In fiscal year 2015, hospitals will be at risk for up to 5.5% of Medicare payments under the parameters of the Hospital Readmission Reduction Program (maximum penalty 3% of base diagnosis‐related group [DRG] payments), Value‐Based Purchasing (maximum withholding 1.5% of base DRG payments), and the Hospital Acquired Conditions Program (maximum penalty 1% of all payments). Simultaneously, long‐standing subsidies are being phased out, including payments to teaching hospitals or for disproportionate share of care delivered to uninsured populations. The challenge for hospital medicine will be to take a leadership role in defining national priorities for change, organizing and guiding a pivot toward lower‐intensity care settings and services, and most importantly, promoting innovation in hospital‐based healthcare delivery.
EXISTING INNOVATIONS
The passage of the Affordable Care Act gave the Centers for Medicare & Medicaid Services (CMS) a platform for spurring innovation in healthcare delivery. In addition to deploying the payment penalty programs described above, the CMS Center for Medicare & Medicaid Innovation has a $10 billion budget to test alternate models of care. Demonstration projects to date include Accountable Care Organization pilots (ACOs, encouraging hospitals to join with community clinicians to provide integrated and coordinated care), the Bundled Payment program (paying providers a lump fee for an extended episode of care rather than service volume), a Comprehensive End Stage Renal Disease Care Initiative, and a variety of other tests of novel delivery and payment models that directly involve hospital medicine.[5] Private insurers are following suit, with an increasing proportion of hospital contracts involving shared savings or risk.
Hospitals are already responding to this new era of cost sharing and cross‐continuum accountability in a variety of creative ways. The University of Utah has developed an award‐winning cost accounting system that integrates highly detailed patient‐level cost data with clinical information to create a value‐driven outcomes tool that enables the hospital to consider costs as they relate to the results of care delivery. In this way, the hospital can justify maintaining high cost/better outcome activities, while targeting high cost/worse outcome practices for improvement.[6] Boston Children's Hospital is leading a group of healthcare systems in the development and application of a series of Standardized Clinical Assessment and Management Plans (SCAMPs), designed to improve patient care while decreasing unnecessary utilization (particularly in cases where existing evidence or guidelines are insufficient or outdated). Unlike traditional clinical care pathways or clinical guidelines, SCAMPs are developed iteratively based on actual internal practices, especially deviations from the standard plan, and their relationship to outcomes.[7, 8]
Local innovations, however, are of limited national importance in bending the cost curve unless broadly disseminated. The last decade has brought a new degree of cross‐institution collaboration to hospital care. Regional consortiums to improve care have existed for years, often prompted by CMS‐funded quality improvement organizations and demonstration projects.[9, 10] CMS's Partnership for Patients program has aimed to reduce hospital‐acquired conditions and readmissions by enrolling hospitals in 26 regional Hospital Engagement Networks.[11] Increasingly, however, hospitals are voluntarily engaging in collaboratives to improve the quality and value of their care. Over 500 US hospitals participate in the American College of Surgeons National Surgical Quality Improvement Program to improve surgical outcomes, nearly 1000 joined the Door‐to‐Balloon Alliance to improve percutaneous catheterization outcomes, and over 1000 joined the Hospital2Home collaborative to improve care transitions.[12, 13, 14] In 2008, the Premier hospital alliance formed QUEST (Quality, Efficiency, Safety and Transparency), a collaborative of approximately 350 members committed to improving a wide range of outcomes, from cost and efficiency to safety and mortality. Most recently, the High Value Healthcare Collaborative was formed, encompassing 19 large healthcare delivery organizations and over 70 million patients, with the central objective of creating a true learning healthcare system. In principle, these boundary‐spanning collaboratives should accelerate change nationally and serve as transformational agents. In practice, outcomes from these efforts have been variable, largely depending on the degree to which hospitals are able to share data, evaluate outcomes, and identify generalizable improvement interventions that can be reliably adopted.
Last, the focus of hospital care has already begun to extend beyond inpatient care. Hospitals already care for more outpatients than they do inpatients, and that trend is expected to continue. In 2012, hospitals treated 34.4 million inpatient admissions, but cared for nearly 675 million outpatient visits, only a fraction of which were emergency department visits or observation stays. From 2011 to 2012, outpatient visits to hospitals increased 2.9%, whereas inpatient admissions declined 1.2%.[15] Hospitals are buying up outpatient practices, creating infusion centers to provide intravenous‐based therapy to outpatients, establishing postdischarge clinics to transition their discharged patients, chartering their own visiting nurse agencies, and testing a host of other outpatient‐focused activities. Combined with an enhanced focus on postacute transitions following an inpatient admission as part of the care continuum, this broadening reach of hospital medicine brings a host of new opportunities for innovation in care delivery and payment models.
CHOOSING WISELY: NEXT STEPS IN IMPROVING HEALTHCARE VALUE
This series will consider a wide range of ways in which hospital medicine can help drive improvements in healthcare value, both from a conceptual standpoint (what to do and why?), as well as demonstration of practical application of these principles (how?). A companion series, Choosing Wisely: Things We Do For No Reason, will focus more explicitly on services such as blood transfusions or diagnostic tests such as creatinine kinase that are commonly overutilized. Example topics of interest for Next Steps include:
- Best methodologies for improvement science in hospital settings, including Lean healthcare, behavioral economics, human factors engineering
- Strategies for reconciling system‐level standardization with the delivery of personalized, patient‐centered care
- Impacts of national policies on hospital‐based improvement efforts: how do ACOs, bundled payments, and medical homes alter hospital practice?
- Reports on creative new ideas to help achieve value: changes in clinical workflow or care pathways, radical physical plant redesign, electronic medical record innovations, payment incentives, provider accountability and more
- Results of models that move the reach of hospital medicine beyond the walls as an integrated part of the care continuum.
We welcome unsolicited proposals for series topics submitted as a 500‐word precis to: nextsteps@hospitalmedicine.org.
Disclosures
Choosing Wisely: Next Steps in Improving Healthcare Value is sponsored by the American Board of Internal Medicine Foundation. Dr. Horwitz is supported by the National Institute on Aging (K08 AG038336) and by the American Federation for Aging Research through the Paul B. Beeson Career Development Award Program. The authors report no conflicts of interest.
- , , , . “Top 5” lists top $5 billion. Arch Intern Med. 2011;171(20):1858–1859.
- Healthcare Cost and Utilization Project. Statistical brief #146. Available at: http://www.hcup‐us.ahrq.gov/reports/statbriefs/sb146.pdf. Published January 2013. Accessed October 18, 2014.
- Centers for Medicare 32(5):911–920.
- Institute for Relevant Clinical Data Analytics, Inc. Relevant clinical data analytics I. SCAMPs mission statement. 2014. Available at: http://www.scamps.org/index.htm. Accessed October 18, 2014.
- , , , . The long‐term effect of premier pay for performance on patient outcomes. N Engl J Med. 2012;366(17):1606–1615.
- . Effects of the Premier Hospital Quality Incentive Demonstration on Medicare patient mortality and cost. Health Serv Res. 2009;44(3):821–842.
- Centers for Medicare 1(1):97–104.
- American College of Cardiology. Quality Improvement for Institutions. Hospital to home. 2014. Available at: http://cvquality.acc.org/Initiatives/H2H.aspx. Accessed October 19, 2014.
- American College of Surgeons. National Surgical Quality Improvement Program. 2014. Available at: http://site.acsnsqip.org/. Accessed October 19, 2014.
- . Hospitals on the rebound, show stronger operating margins. Modern Healthcare website. Available at: http://www. modernhealthcare.com/article/20140103/NEWS/301039973. Published January 3, 2014. Accessed October 18, 2014.
MPI Variation and Utilization
Myocardial perfusion imaging (MPI) is the single largest contributor to ionizing radiation in the United States, with a dose equivalent to percutaneous coronary intervention, or 5 times the yearly radiation from the sun.[1] Because MPI is performed commonly (frequently multiple times over a patient's lifetime), it accounts for almost a quarter of ionizing radiation in the United States.[1] It also ranks among the costliest commonly ordered inpatient tests. Although the utilization rate of the exercise tolerance test (ETT) without imaging, diagnostic coronary angiography, and echocardiography has remained stable over the last 2 decades, MPI's rate has increased steadily over the same time period.[2]
In the inpatient setting, MPIs are usually ordered by hospitalists. Chest pain admissions generally conclude with a stress testfrequently an MPI study. The recent evidence that ionizing radiation could be an under‐recognized risk factor for cancer in younger individuals[3] has highlighted the hospitalist's role in reducing unnecessary radiation exposure. Appropriateness guidelines are published in the cardiology literature,[4] yet 1 in 7 MPI tests is performed inappropriately.[5] We examined the MPI ordering behavior of members of a hospitalist division, presented the data back to them, and noted that this intervention, in conjunction with longitudinal educational activities on MPI appropriateness use criteria, was associated with a decrease in the division's ordering rate.
METHODS
Database Collection
We performed a prospective study of MPI utilization at a 313‐bed community teaching hospital in the greater Boston, Massachusetts area. The hospitalist division cares for 100% of medical admissions; its members have been practicing for a mean of 3.7 years ( 2.2), and its reimbursement was entirely fee‐for‐service during the study period. The institutional review board at our hospital approved the study. Our primary outcome was hospitalist group MPI rate before and after the intervention. For this outcome, the preintervention period was March 2010 to February 2011. We defined 3 postintervention time periods to examine the sustainability of any change: March 2011 to February 2012 (postintervention year 1), March 2012 to February 2013 (postintervention year 2), and March 2013 to February 2014 (postintervention year 3). Using the hospital's billing database, we identified the number of MPIs done on inpatients in each interval by the relevant Current Procedural Terminology codes. A similar database revealed the number of inpatient discharges.
To impact the group MPI rate via our intervention, we analyzed individual hospitalist ordering rates (using the same baseline period but a shorter postintervention period of July 2011March 2012). For this subgroup analysis, we excluded 6 hospitalists working <0.35 clinical full‐time equivalents (FTEs): their combined FTEs of 1.5 (rest of division, 15.5 FTEs) made analysis of small MPI volumes unfeasible. This resulted in 20 hospitalists being included in the baseline and 23 in the postintervention section. We assigned an MPI study to the discharging hospitalist, the only strategy compatible with our database. To make each hospitalist's patient population similar, we limited ourselves to patients admitted to the cardiac floor. Individual ordering rates were calculated by dividing the total number of MPIs performed by a hospitalist by the total number of patients discharged by that hospitalist.
Finally, to see if our intervention had caused a shift in test utilization, we collected data on the ordering of an ETT without imaging and stress echocardiography for the above 4 years; our institution does not currently utilize inpatient dobutamine echocardiography.
Intervention
Our intervention was 2‐fold. First, we shared with the hospitalist division in a blinded format baseline data on individual MPI ordering rates for cardiac floor patients. Second, we conducted educational activities on MPI appropriateness use criteria. These occurred during scheduled hospitalist education series: practice exercises and clinical examples illustrated the relationship between Bayes Theorem, pretest, and post‐test probability of coronary artery disease (CAD).[6] Additionally, local experts were invited to discuss guidelines for exercise and pharmacologic MPIs (eg, do not perform MPI for pretest probability of CAD <10% or if certain electrocardiographic criteria are met).[4, 7] All education materials were made available electronically to the hospitalist division for future reference.
Statistical Analysis
For the primary outcome of group MPI rate, we used [2] testing to examine the change in MPI rate before and after the intervention. We compared each postintervention year to the baseline period. For the subgroup of hospitalists caring for cardiac floor patients, we calculated baseline and postintervention MPI rates for each individual. To determine whether their MPI rate had changed significantly after the intervention, we used a random‐effects model. The outcome variable was the MPI rate of each physician: the physician was treated as a random effect and the time period as a fixed effect. To see if our educational interventions had an effect on inappropriate MPI ordering, we reviewed cases involving exercise tolerance MPIs; pharmacologic MPIs were excluded because alternative testing for patients unable to exercise is not available at our institution. A chart review was performed to calculate the pretest probability of CAD for each case based on established guidelines.[6] Using the 2 test, we calculated the change in the group's rate of inappropriate exercise MPI ordering (ie, pretest CAD probability <10% [the postintervention period for this calculation was July 2011March 2013]).
RESULTS
The change in group MPI rate over time can be seen in Table 1. Comparing each postintervention year to baseline, we noted that a statistically significant 1.1% absolute reduction in the MPI rate for postintervention year 1 (P=0.009) was maintained a year later (P=0.004) and became more pronounced in postintervention year 3, a 2.1% absolute reduction (P<0.00001).
| MPI Volume | Discharges | MPI Rate | ARR (95% CI) | RRR (95% CI) | P Value | |
|---|---|---|---|---|---|---|
| ||||||
| Baseline period | 357 | 5,881 | 6.1% | |||
| Postintervention year 1 | 312 | 6,265 | 5.0% | 1.1% (0.2‐2.0) | 18% (529) | 0.009 |
| Postintervention year 2 | 310 | 6,337 | 4.9% | 1.2% (0.4‐2.0) | 19% (730) | 0.004 |
| Postintervention year 3 | 249 | 6,312 | 3.9% | 2.1% (1.3‐2.1) | 35% (2444) | <0.00001 |
| All years after baseline combined | 871 | 18,914 | 4.6% | 1.5% (0.8‐2.1) | 24% (1533) | <0.00001 |
A similar decline was seen in the MPI rate in the subgroup of patients cared for on the cardiac floor. In the baseline period, 20 hospitalists ordered 204 MPI tests on 2458 cardiac discharges, an average utilization rate 8.3 MPIs per 100 discharges (individual ranges, 4.0%11.7%). In the postintervention period, 23 hospitalists ordered 173 MPI studies on 2629 cardiac discharges, which is an average utilization rate of 6.6 MPIs per 100 discharges (individual ranges, 3.4%11.3%). Because there was variability in individual rates and no hospitalist's decrease was statistically significant, we used random‐effects modeling to compare the magnitude of change for this entire subgroup of hospitalists. We found that their MPI rate decreased statistically significantly from 8.0% in the baseline period to 6.7% in the postintervention period (P=0.039).
Table 2 shows volumes and rates for all stress‐testing modalities employed at our hospital; there was no significant difference in either our ETT or stress echocardiography rates over the years. We include these figures because our intervention could have caused hospitalists, in an effort to avoid radiation exposure, to redirect ordering to other modalities. Finally, the influence of continuing education on appropriate ordering can be seen in Table 3. The rate of inappropriate exercise MPIs on patients with a pretest CAD probability <10% dropped almost in half, from 16.5% in the baseline period to 9.0% in the subsequent 20 months. This difference also reached statistical significance (P=0.034) and underlies a trend of even greater clinical impacta decrease in a test clearly not indicated for the patient's condition.
| Intervention | Baseline Period | Postintervention Year 1 | Postintervention Year 2 | Postintervention Year 3 |
|---|---|---|---|---|
| ||||
| ETT volume (rate) | 275 (4.7) | 259 (4.1) | 289 (4.6) | 299 (4.7) |
| MPI volume (rate) | 357 (6.1) | 312 (5.0) | 310 (4.9) | 249 (3.9) |
| Stress ECHO volume (rate) | 16 (0.027) | 9 (0.014) | 16 (0.029) | 22 (0.035) |
| ETT‐MPIs with Pretest CAD Probability <10% | Total ETT‐MPIs Performed | Proportion of Inappropriate ETT‐MPIs | ARR | RRR | P Value | |
|---|---|---|---|---|---|---|
| ||||||
| Baseline period | 22 | 133 | 16.5% | |||
| Postintervention years 1 and 2 | 19 | 212 | 9% | 7.5% (1.915) | 46% (3.970) | 0.034 |
DISCUSSION
In this prospective study of MPI ordering variation among hospitalists at a community teaching hospital, we found a statistically significant, sustained decline in the group MPI rate; a statistically significant decrease in the MPI rate for cardiac floor patients; and no corresponding increases in the use of other stress‐testing modalities. Finally, and perhaps most relevant clinically, the proportion of inappropriately ordered MPIs decreased almost by half following our intervention.
Variation in physician practice has been the subject of research for decades,[8] with recent studies looking into geographical and physician variation in performing coronary angiography[9] or electrocardiograms.[10] We sought to determine whether examining variation among hospitalists was a viable strategy to influence their MPI ordering behavior. Our findings reveal that sharing individual MPI rates, coupled with educational initiatives on appropriateness use criteria, led to a continuous decline in group MPI rate for 3 consecutive years following our intervention. This sustainability of change is among our study's most encouraging findings. Education‐based quality improvement projects can sometimes fizzle out after an impressive start. The persistent decline in MPI utilization suggests that our efforts had a long‐lasting impact on MPI ordering behavior without affecting the utilization of stress tests not employing ionizing radiation. We have no evidence of any other secular trends that could have accounted for these changes. There were no other programs at our institution addressing MPI use, nor was there a change in hospital or physician reimbursement during the study period.
Inappropriate stress testing has long been a concern in low‐risk chest pain admissions; over two‐thirds of such patients undergo stress testing prior to discharge,[11] and physicians rarely consider the patient's CAD pretest probability, resulting in an alarming number of stress tests performed without clinical indications.[12] Our finding of a statistically significant 46% decline in inappropriate exercise MPI ordering was thus particularly illuminating. With a number of 13 needed to treat or prevent 1 unnecessary MPI, education on appropriateness use criteria makes a compelling case for an effective strategy to reduce unwarranted imaging. To further reinforce its benefits, we have started periodically updating the hospitalist division on any changes in appropriateness use guidelines and on its ongoing MPI rate.
Decreased MPI utilization has certain cost implications as well. On average, 67 fewer MPIs are performed yearly in our hospital following our intervention. With charges of $3585 for ETT‐MPIs and $4378 for pharmacological MPIs, which constitute 55% of all MPIs, this would result in yearly cost savings of $269,536, or $35,850 annually if only looking at inappropriately ordered ETT‐MPIs. Such cost savings may become particularly relevant in a new risk‐sharing environment where such studies may not be reimbursed.
Our study has several limitations. It was a small, single‐center, pre‐ and postintervention study, thereby limiting its generalizability to other settings. MPI attribution was based on the discharging hospitalist who sometimes did not admit the patient. MPI figures were obtained from billing rather than ordering database; occasionally the cardiologist interpreting the stress test would change a nonimaging test to an MPI affecting the hospitalist rate. About half of our patients are on teaching services where tests are ordered by housestaff, also potentially influencing the group MPI rate. Finally, we did not study any clinical measures to see whether our intervention had any influence on patient outcomes.
Despite the above limitations, our examination of MPI ordering variation in a hospitalist division revealed that in an age of increasing scrutiny of high‐cost imaging, such an approach can be extremely productive. In our experience, hospitalists are receptive to the continuous evaluation of their ordering behavior and to educational activities on appropriateness use criteria. It is our opinion that similar interventions could be applied to other high‐cost imaging modalities under the daily purview of hospitalists such as computed tomography and magnetic resonance imaging.
Acknowledgements
The authors thank Eduartina Perez and Cortland Montross for their assistance with data collection.
Disclosure: Nothing to report.
- , , , et al. Exposure of low‐dose ionizing radiation from medical procedure imaging. N Engl J Med. 2009;361(9):849–857.
- , , , . Temporal trends in the utilization of diagnostic testing and treatments for cardiovascular disease in the United States, 1993–2001. Circulation. 2006;113(3):374–379.
- , , , et al. Radiation dose associated with common computed tomography examinations and the associated lifetime attributable risk of cancer. Arch Intern Med. 2009;169(22):2078–2086.
- , , , et al. ACCF/ASNC/ACR/AHA/ASE/SCCT/SCMR/SNM 2009 appropriate use criteria for cardiac radionuclide imaging: a report of the American College of Cardiology Foundation Appropriate Use Criteria Task Force, the American Society of Nuclear Cardiology, the American College of Radiology, the American Heart Association, the American Society of Echocardiography, the Society of Cardiovascular Computed Tomography, the Society for Cardiovascular Magnetic Resonance, and the Society of Nuclear Medicine: endorsed by the American College of Emergency Physicians. J Am Coll Cardiol. 2009;53(23):2201–2229.
- Hendel RC, Cerqueira M, Douglas PS, et al. A multicenter assessment of the use of single‐photon emission computed tomography myocardial perfusion imaging with appropriateness criteria, J Am Coll Card. 2010;55(2):156–162.
- , . Analysis of probability as an aid in the clinical diagnosis of coronary artery disease. N Engl J Med. 1979;300:1350–1358.
- , , , et al. 2012 ACCF/AHA/ACP/AATS/PCNA/SCAI/STS guideline for the diagnosis and management of patients with stable ischemic heart disease: executive summary. J Am Coll Cardiol. 2012;60(24):2564–2603.
- , . Small area variations in health care delivery. Science. 1973;182(4117):1102–1108.
- , , , et al. Regional variation in cardiac catherization appropriateness and baseline risk after acute myocardial infarction. J Am Coll Card. 2008;51(7):716–723.
- , . Variation in routine electrocardiogram use in academic primary care practice. Arch Intern Med. 2001;161(19):2351–2355.
- , , , , . The effect of inpatient stress testing on subsequent emergency department visits, readmissions, and costs. J Hosp Med. 2013;8(10):564–568.
- , , , , . Outcomes of patients admitted for observation of chest pain. Arch Intern Med. 2012;172(11):873–877.
Myocardial perfusion imaging (MPI) is the single largest contributor to ionizing radiation in the United States, with a dose equivalent to percutaneous coronary intervention, or 5 times the yearly radiation from the sun.[1] Because MPI is performed commonly (frequently multiple times over a patient's lifetime), it accounts for almost a quarter of ionizing radiation in the United States.[1] It also ranks among the costliest commonly ordered inpatient tests. Although the utilization rate of the exercise tolerance test (ETT) without imaging, diagnostic coronary angiography, and echocardiography has remained stable over the last 2 decades, MPI's rate has increased steadily over the same time period.[2]
In the inpatient setting, MPIs are usually ordered by hospitalists. Chest pain admissions generally conclude with a stress testfrequently an MPI study. The recent evidence that ionizing radiation could be an under‐recognized risk factor for cancer in younger individuals[3] has highlighted the hospitalist's role in reducing unnecessary radiation exposure. Appropriateness guidelines are published in the cardiology literature,[4] yet 1 in 7 MPI tests is performed inappropriately.[5] We examined the MPI ordering behavior of members of a hospitalist division, presented the data back to them, and noted that this intervention, in conjunction with longitudinal educational activities on MPI appropriateness use criteria, was associated with a decrease in the division's ordering rate.
METHODS
Database Collection
We performed a prospective study of MPI utilization at a 313‐bed community teaching hospital in the greater Boston, Massachusetts area. The hospitalist division cares for 100% of medical admissions; its members have been practicing for a mean of 3.7 years ( 2.2), and its reimbursement was entirely fee‐for‐service during the study period. The institutional review board at our hospital approved the study. Our primary outcome was hospitalist group MPI rate before and after the intervention. For this outcome, the preintervention period was March 2010 to February 2011. We defined 3 postintervention time periods to examine the sustainability of any change: March 2011 to February 2012 (postintervention year 1), March 2012 to February 2013 (postintervention year 2), and March 2013 to February 2014 (postintervention year 3). Using the hospital's billing database, we identified the number of MPIs done on inpatients in each interval by the relevant Current Procedural Terminology codes. A similar database revealed the number of inpatient discharges.
To impact the group MPI rate via our intervention, we analyzed individual hospitalist ordering rates (using the same baseline period but a shorter postintervention period of July 2011March 2012). For this subgroup analysis, we excluded 6 hospitalists working <0.35 clinical full‐time equivalents (FTEs): their combined FTEs of 1.5 (rest of division, 15.5 FTEs) made analysis of small MPI volumes unfeasible. This resulted in 20 hospitalists being included in the baseline and 23 in the postintervention section. We assigned an MPI study to the discharging hospitalist, the only strategy compatible with our database. To make each hospitalist's patient population similar, we limited ourselves to patients admitted to the cardiac floor. Individual ordering rates were calculated by dividing the total number of MPIs performed by a hospitalist by the total number of patients discharged by that hospitalist.
Finally, to see if our intervention had caused a shift in test utilization, we collected data on the ordering of an ETT without imaging and stress echocardiography for the above 4 years; our institution does not currently utilize inpatient dobutamine echocardiography.
Intervention
Our intervention was 2‐fold. First, we shared with the hospitalist division in a blinded format baseline data on individual MPI ordering rates for cardiac floor patients. Second, we conducted educational activities on MPI appropriateness use criteria. These occurred during scheduled hospitalist education series: practice exercises and clinical examples illustrated the relationship between Bayes Theorem, pretest, and post‐test probability of coronary artery disease (CAD).[6] Additionally, local experts were invited to discuss guidelines for exercise and pharmacologic MPIs (eg, do not perform MPI for pretest probability of CAD <10% or if certain electrocardiographic criteria are met).[4, 7] All education materials were made available electronically to the hospitalist division for future reference.
Statistical Analysis
For the primary outcome of group MPI rate, we used [2] testing to examine the change in MPI rate before and after the intervention. We compared each postintervention year to the baseline period. For the subgroup of hospitalists caring for cardiac floor patients, we calculated baseline and postintervention MPI rates for each individual. To determine whether their MPI rate had changed significantly after the intervention, we used a random‐effects model. The outcome variable was the MPI rate of each physician: the physician was treated as a random effect and the time period as a fixed effect. To see if our educational interventions had an effect on inappropriate MPI ordering, we reviewed cases involving exercise tolerance MPIs; pharmacologic MPIs were excluded because alternative testing for patients unable to exercise is not available at our institution. A chart review was performed to calculate the pretest probability of CAD for each case based on established guidelines.[6] Using the 2 test, we calculated the change in the group's rate of inappropriate exercise MPI ordering (ie, pretest CAD probability <10% [the postintervention period for this calculation was July 2011March 2013]).
RESULTS
The change in group MPI rate over time can be seen in Table 1. Comparing each postintervention year to baseline, we noted that a statistically significant 1.1% absolute reduction in the MPI rate for postintervention year 1 (P=0.009) was maintained a year later (P=0.004) and became more pronounced in postintervention year 3, a 2.1% absolute reduction (P<0.00001).
| MPI Volume | Discharges | MPI Rate | ARR (95% CI) | RRR (95% CI) | P Value | |
|---|---|---|---|---|---|---|
| ||||||
| Baseline period | 357 | 5,881 | 6.1% | |||
| Postintervention year 1 | 312 | 6,265 | 5.0% | 1.1% (0.2‐2.0) | 18% (529) | 0.009 |
| Postintervention year 2 | 310 | 6,337 | 4.9% | 1.2% (0.4‐2.0) | 19% (730) | 0.004 |
| Postintervention year 3 | 249 | 6,312 | 3.9% | 2.1% (1.3‐2.1) | 35% (2444) | <0.00001 |
| All years after baseline combined | 871 | 18,914 | 4.6% | 1.5% (0.8‐2.1) | 24% (1533) | <0.00001 |
A similar decline was seen in the MPI rate in the subgroup of patients cared for on the cardiac floor. In the baseline period, 20 hospitalists ordered 204 MPI tests on 2458 cardiac discharges, an average utilization rate 8.3 MPIs per 100 discharges (individual ranges, 4.0%11.7%). In the postintervention period, 23 hospitalists ordered 173 MPI studies on 2629 cardiac discharges, which is an average utilization rate of 6.6 MPIs per 100 discharges (individual ranges, 3.4%11.3%). Because there was variability in individual rates and no hospitalist's decrease was statistically significant, we used random‐effects modeling to compare the magnitude of change for this entire subgroup of hospitalists. We found that their MPI rate decreased statistically significantly from 8.0% in the baseline period to 6.7% in the postintervention period (P=0.039).
Table 2 shows volumes and rates for all stress‐testing modalities employed at our hospital; there was no significant difference in either our ETT or stress echocardiography rates over the years. We include these figures because our intervention could have caused hospitalists, in an effort to avoid radiation exposure, to redirect ordering to other modalities. Finally, the influence of continuing education on appropriate ordering can be seen in Table 3. The rate of inappropriate exercise MPIs on patients with a pretest CAD probability <10% dropped almost in half, from 16.5% in the baseline period to 9.0% in the subsequent 20 months. This difference also reached statistical significance (P=0.034) and underlies a trend of even greater clinical impacta decrease in a test clearly not indicated for the patient's condition.
| Intervention | Baseline Period | Postintervention Year 1 | Postintervention Year 2 | Postintervention Year 3 |
|---|---|---|---|---|
| ||||
| ETT volume (rate) | 275 (4.7) | 259 (4.1) | 289 (4.6) | 299 (4.7) |
| MPI volume (rate) | 357 (6.1) | 312 (5.0) | 310 (4.9) | 249 (3.9) |
| Stress ECHO volume (rate) | 16 (0.027) | 9 (0.014) | 16 (0.029) | 22 (0.035) |
| ETT‐MPIs with Pretest CAD Probability <10% | Total ETT‐MPIs Performed | Proportion of Inappropriate ETT‐MPIs | ARR | RRR | P Value | |
|---|---|---|---|---|---|---|
| ||||||
| Baseline period | 22 | 133 | 16.5% | |||
| Postintervention years 1 and 2 | 19 | 212 | 9% | 7.5% (1.915) | 46% (3.970) | 0.034 |
DISCUSSION
In this prospective study of MPI ordering variation among hospitalists at a community teaching hospital, we found a statistically significant, sustained decline in the group MPI rate; a statistically significant decrease in the MPI rate for cardiac floor patients; and no corresponding increases in the use of other stress‐testing modalities. Finally, and perhaps most relevant clinically, the proportion of inappropriately ordered MPIs decreased almost by half following our intervention.
Variation in physician practice has been the subject of research for decades,[8] with recent studies looking into geographical and physician variation in performing coronary angiography[9] or electrocardiograms.[10] We sought to determine whether examining variation among hospitalists was a viable strategy to influence their MPI ordering behavior. Our findings reveal that sharing individual MPI rates, coupled with educational initiatives on appropriateness use criteria, led to a continuous decline in group MPI rate for 3 consecutive years following our intervention. This sustainability of change is among our study's most encouraging findings. Education‐based quality improvement projects can sometimes fizzle out after an impressive start. The persistent decline in MPI utilization suggests that our efforts had a long‐lasting impact on MPI ordering behavior without affecting the utilization of stress tests not employing ionizing radiation. We have no evidence of any other secular trends that could have accounted for these changes. There were no other programs at our institution addressing MPI use, nor was there a change in hospital or physician reimbursement during the study period.
Inappropriate stress testing has long been a concern in low‐risk chest pain admissions; over two‐thirds of such patients undergo stress testing prior to discharge,[11] and physicians rarely consider the patient's CAD pretest probability, resulting in an alarming number of stress tests performed without clinical indications.[12] Our finding of a statistically significant 46% decline in inappropriate exercise MPI ordering was thus particularly illuminating. With a number of 13 needed to treat or prevent 1 unnecessary MPI, education on appropriateness use criteria makes a compelling case for an effective strategy to reduce unwarranted imaging. To further reinforce its benefits, we have started periodically updating the hospitalist division on any changes in appropriateness use guidelines and on its ongoing MPI rate.
Decreased MPI utilization has certain cost implications as well. On average, 67 fewer MPIs are performed yearly in our hospital following our intervention. With charges of $3585 for ETT‐MPIs and $4378 for pharmacological MPIs, which constitute 55% of all MPIs, this would result in yearly cost savings of $269,536, or $35,850 annually if only looking at inappropriately ordered ETT‐MPIs. Such cost savings may become particularly relevant in a new risk‐sharing environment where such studies may not be reimbursed.
Our study has several limitations. It was a small, single‐center, pre‐ and postintervention study, thereby limiting its generalizability to other settings. MPI attribution was based on the discharging hospitalist who sometimes did not admit the patient. MPI figures were obtained from billing rather than ordering database; occasionally the cardiologist interpreting the stress test would change a nonimaging test to an MPI affecting the hospitalist rate. About half of our patients are on teaching services where tests are ordered by housestaff, also potentially influencing the group MPI rate. Finally, we did not study any clinical measures to see whether our intervention had any influence on patient outcomes.
Despite the above limitations, our examination of MPI ordering variation in a hospitalist division revealed that in an age of increasing scrutiny of high‐cost imaging, such an approach can be extremely productive. In our experience, hospitalists are receptive to the continuous evaluation of their ordering behavior and to educational activities on appropriateness use criteria. It is our opinion that similar interventions could be applied to other high‐cost imaging modalities under the daily purview of hospitalists such as computed tomography and magnetic resonance imaging.
Acknowledgements
The authors thank Eduartina Perez and Cortland Montross for their assistance with data collection.
Disclosure: Nothing to report.
- , , , et al. Exposure of low‐dose ionizing radiation from medical procedure imaging. N Engl J Med. 2009;361(9):849–857.
- , , , . Temporal trends in the utilization of diagnostic testing and treatments for cardiovascular disease in the United States, 1993–2001. Circulation. 2006;113(3):374–379.
- , , , et al. Radiation dose associated with common computed tomography examinations and the associated lifetime attributable risk of cancer. Arch Intern Med. 2009;169(22):2078–2086.
- , , , et al. ACCF/ASNC/ACR/AHA/ASE/SCCT/SCMR/SNM 2009 appropriate use criteria for cardiac radionuclide imaging: a report of the American College of Cardiology Foundation Appropriate Use Criteria Task Force, the American Society of Nuclear Cardiology, the American College of Radiology, the American Heart Association, the American Society of Echocardiography, the Society of Cardiovascular Computed Tomography, the Society for Cardiovascular Magnetic Resonance, and the Society of Nuclear Medicine: endorsed by the American College of Emergency Physicians. J Am Coll Cardiol. 2009;53(23):2201–2229.
- Hendel RC, Cerqueira M, Douglas PS, et al. A multicenter assessment of the use of single‐photon emission computed tomography myocardial perfusion imaging with appropriateness criteria, J Am Coll Card. 2010;55(2):156–162.
- , . Analysis of probability as an aid in the clinical diagnosis of coronary artery disease. N Engl J Med. 1979;300:1350–1358.
- , , , et al. 2012 ACCF/AHA/ACP/AATS/PCNA/SCAI/STS guideline for the diagnosis and management of patients with stable ischemic heart disease: executive summary. J Am Coll Cardiol. 2012;60(24):2564–2603.
- , . Small area variations in health care delivery. Science. 1973;182(4117):1102–1108.
- , , , et al. Regional variation in cardiac catherization appropriateness and baseline risk after acute myocardial infarction. J Am Coll Card. 2008;51(7):716–723.
- , . Variation in routine electrocardiogram use in academic primary care practice. Arch Intern Med. 2001;161(19):2351–2355.
- , , , , . The effect of inpatient stress testing on subsequent emergency department visits, readmissions, and costs. J Hosp Med. 2013;8(10):564–568.
- , , , , . Outcomes of patients admitted for observation of chest pain. Arch Intern Med. 2012;172(11):873–877.