User login
Discrepancies in Skin Cancer Screening Reporting Among Patients, Primary Care Physicians, and Patient Medical Records
Keratinocyte carcinoma (KC), or nonmelanoma skin cancer, is the most commonly diagnosed cancer in the United States.1 Basal cell carcinoma comprises the majority of all KCs.2,3 Squamous cell carcinoma is the second most common skin cancer, representing approximately 20% of KCs and accounting for the majority of KC-related deaths.4-7 Malignant melanoma represents the majority of all skin cancer–related deaths.8 The incidence of basal cell carcinoma, squamous cell carcinoma, and malignant melanoma in the United States is on the rise and carries substantial morbidity and mortality with notable social and economic burdens.1,8-10
Prevention is necessary to reduce skin cancer morbidity and mortality as well as rising treatment costs. The most commonly used skin cancer screening method among dermatologists is the visual full-body skin examination (FBSE), which is a noninvasive, safe, quick, and cost-effective method of early detection and prevention.11 To effectively confront the growing incidence and health care burden of skin cancer, primary care providers (PCPs) must join dermatologists in conducting FBSEs.12,13
Despite being the predominant means of secondary skin cancer prevention, the US Preventive Services Task Force (USPSTF) issued an I rating for insufficient evidence to assess the benefits vs harms of screening the adult general population by PCPs.14,15 A major barrier to studying screening is the lack of a standardized method for conducting and reporting FBSEs.13 Systematic thorough skin examination generally is not performed in the primary care setting.16-18
We aimed to investigate what occurs during an FBSE in the primary care setting and how often they are performed. We examined whether there was potential variation in the execution of the examination, what was perceived by the patient vs reported by the physician, and what was ultimately included in the medical record. Miscommunication between patient and provider regarding performance of FBSEs has previously been noted,17-19 and we sought to characterize and quantify that miscommunication. We hypothesized that there would be lower patient-reported FBSEs compared to physicians and patient medical records. We also hypothesized that there would be variability in how physicians screened for skin cancer.
METHODS
This study was cross-sectional and was conducted based on interviews and a review of medical records at secondary- and tertiary-level units (clinics and hospitals) across the United States. We examined baseline data from a randomized controlled trial of a Web-based skin cancer early detection continuing education course—the Basic Skin Cancer Triage curriculum. Complete details have been described elsewhere.12 This study was approved by the institutional review boards of the Providence Veterans Affairs Medical Center, Rhode Island Hospital, and Brown University (all in Providence, Rhode Island), as well as those of all recruitment sites.
Data were collected from 2005 to 2008 and included physician online surveys, patient telephone interviews, and patient medical record data abstracted by research assistants. Primary care providers included in the study were general internists, family physicians, or medicine-pediatrics practitioners who were recruited from 4 collaborating centers across the United States in the mid-Atlantic region, Ohio, Kansas, and southern California, and who had been in practice for at least a year. Patients were recruited from participating physician practices and selected by research assistants who traveled to each clinic for coordination, recruitment, and performance of medical record reviews. Patients were selected as having minimal risk of melanoma (eg, no signs of severe photodamage to the skin). Patients completed structured telephone surveys within 1 to 2 weeks of the office visit regarding the practices observed and clinical questions asked during their recent clinical encounter with their PCP.
Measures
Demographics—Demographic variables asked of physicians included age, sex, ethnicity, academic degree (MD vs DO), years in practice, training, and prior dermatology training. Demographic information asked of patients included age, sex, ethnicity, education, and household income.
Physician-Reported Examination and Counseling Variables—Physicians were asked to characterize their clinical practices, prompted by questions regarding performance of FBSEs: “Please think of a typical month and using the scale below, indicate how frequently you perform a total body skin exam during an annual exam (eg, periodic follow-up exam).” Physicians responded to 3 questions on a 5-point scale (1=never, 2=sometimes, 3=about half, 4=often, 5=almost always).
Patient-Reported Examination Variables—Patients also were asked to characterize the skin examination experienced in their clinical encounter with their PCP, including: “During your last visit, as far as you could tell, did your physician: (1) look at the skin on your back? (2) look at the skin on your belly area? (3) look at the skin on the back of your legs?” Patient responses were coded as yes, no, don’t know, or refused. Participants who refused were excluded from analysis; participants who responded are detailed in Table 1. In addition, patients also reported the level of undress with their physician by answering the following question: “During your last medical exam, did you: 1=keep your clothes on; 2=partially undress; 3=totally undress except for undergarments; 4=totally undress, including all undergarments?”

Patient Medical Record–Extracted Data—Research assistants used a structured abstract form to extract the information from the patient’s medical record and graded it as 0 (absence) or 1 (presence) from the medical record.
Statistical Analysis
Descriptive statistics included mean and standard deviation (SD) for continuous variables as well as frequency and percentage for categorical variables. Logit/logistic regression analysis was used to predict the odds of patient-reported outcomes that were binary with physician-reported variables as the predictor. Linear regression analysis was used to assess the association between 2 continuous variables. All analyses were conducted using SPSS version 24 (IBM).20 Significance criterion was set at α of .05.
RESULTS Demographics
The final sample included data from 53 physicians and 3343 patients. The study sample mean age (SD) was 50.3 (9.9) years for PCPs (n=53) and 59.8 (16.9) years for patients (n=3343). The physician sample was 36% female and predominantly White (83%). Ninety-one percent of the PCPs had an MD (the remaining had a DO degree), and the mean (SD) years practicing was 21.8 (10.6) years. Seventeen percent of PCPs were trained in internal medicine, 4% in internal medicine and pediatrics, and 79% family medicine; 79% of PCPs had received prior training in dermatology. The patient sample was 58% female, predominantly White (84%), non-Hispanic/Latinx (95%), had completed high school (94%), and earned more than $40,000 annually (66%).
Physician- and Patient-Reported FBSEs
Physicians reported performing FBSEs with variable frequency. Among PCPs who conducted FBSEs with greater frequency, there was a modest increase in the odds that patients reported a particular body part was examined (back: odds ratio [OR], 24.5% [95% CI, 1.18-1.31; P<.001]; abdomen: OR, 23.3% [95% CI, 1.17-1.30; P<.001]; backs of legs: OR, 20.4% [95% CI, 1.13-1.28; P<.001])(Table 1). The patient-reported level of undress during examination was significantly associated with physician-reported FBSE (β=0.16 [95% CI, 0.13-0.18; P<.001])(Table 2).

Because of the bimodal distribution of scores in the physician-reported frequency of FBSEs, particularly pertaining to the extreme points of the scale, we further repeated analysis with only the never and almost always groups (Table 1). Primary care providers who reported almost always for FBSE had 29.6% increased odds of patient-reported back examination (95% CI, 1.00-1.68; P=.048) and 59.3% increased odds of patient-reported abdomen examination (95% CI, 1.23-2.06; P<.001). The raw percentages of patients who reported having their back, abdomen, and backs of legs examined when the PCP reported having never conducted an FBSE were 56%, 40%, and 26%, respectively. The raw percentages of patients who reported having their back, abdomen, and backs of legs examined when the PCP reported having almost always conducted an FBSE were 52%, 51%, and 30%, respectively. Raw percentages were calculated by dividing the number of "yes" responses by participants for each body part examined by thetotal number of participant responses (“yes” and “no”) for each respective body part. There was no significant change in odds of patient-reported backs of legs examined with PCP-reported never vs almost always conducting an FBSE. In addition, a greater patient-reported level of undress was associated with 20.2% increased odds of PCPs reporting almost always conducting an FBSE (95% CI, 1.08-1.34; P=.001).
FBSEs in Patient Medical Records
When comparing PCP-reported FBSE and report of FBSE in patient medical records, there was a 39.0% increased odds of the patient medical record indicating FBSE when physicians reported conducting an FBSE with greater frequency (95% CI, 1.30-1.48; P<.001)(eTable 1). When examining PCP-reported never vs almost always conducting an FBSE, a report of almost always was associated with 79.0% increased odds of the patient medical record indicating that an FBSE was conducted (95% CI, 1.28-2.49; P=.001). The raw percentage of the patient medical record indicating an FBSE was conducted when the PCP reported having never conducted an FBSE was 17% and 26% when the PCP reported having almost always conducted an FBSE.

When comparing the patient-reported body part examined with patient FBSE medical record documentation, an indication of yes for FBSE on the patient medical record was associated with a considerable increase in odds that patients reported a particular body part was examined (back: 91.4% [95% CI, 1.59-2.31; P<.001]; abdomen: 75.0% [95% CI, 1.45-2.11; P<.001]; backs of legs: 91.6% [95% CI, 1.56-2.36; P<.001])(eTable 2). The raw percentages of patients who reported having their back, abdomen, and backs of legs examined vs not examined when the patient medical record indicated an FBSE was completed were 24% vs 14%, 23% vs 15%, and 26% vs 16%, respectively. An increase in patient-reported level of undress was associated with a 57.0% increased odds of their medical record indicating an FBSE was conducted (95% CI, 1.45-1.70; P<.001).

COMMENT How PCPs Perform FBSEs Varies
We found that PCPs performed FBSEs with variable frequency, and among those who did, the patient report of their examination varied considerably (Table 1). There appears to be considerable ambiguity in each of these means of determining the extent to which the skin was inspected for skin cancer, which may render the task of improving such inspection more difficult. We asked patients whether their back, abdomen, and backs of legs were examined as an assessment of some of the variety of areas inspected during an FBSE. During a general well-visit appointment, a patient’s back and abdomen may be examined for multiple reasons. Patients may have misinterpreted elements of the pulmonary, cardiac, abdominal, or musculoskeletal examinations as being part of the FBSE. The back and abdomen—the least specific features of the FBSE—were reported by patients to be the most often examined. Conversely, the backs of the legs—the most specific feature of the FBSE—had the lowest odds of being examined (Table 1).
In addition to the potential limitations of patient awareness of physician activity, our results also could be explained by differences among PCPs in how they performed FBSEs. There is no standardized method of conducting an FBSE. Furthermore, not all medical students and residents are exposed to dermatology training. In our sample of 53 physicians, 79% had reported receiving dermatology training; however, we did not assess the extent to which they had been trained in conducting an FBSE and/or identifying malignant lesions. In an American survey of 659 medical students, more than two-thirds of students had never been trained or never examined a patient for skin cancer.21 In another American survey of 342 internal medicine, family medicine, pediatrics, and obstetrics/gynecology residents across 7 medical schools and 4 residency programs, more than three-quarters of residents had never been trained in skin cancer screening.22 Our findings reflect insufficient and inconsistent training in skin cancer screening and underscore the need for mandatory education to ensure quality FBSEs are performed in the primary care setting.
Frequency of PCPs Performing FBSEs
Similar to prior studies analyzing the frequency of FBSE performance in the primary care setting,16,19,23,24 more than half of our PCP sample reported sometimes to never conducting FBSEs. The percentage of physicians who reported conducting FBSEs in our sample was greater than the proportion reported by the National Health Interview Survey, in which only 8% of patients received an FBSE in the prior year by a PCP or obstetrician/gynecologist,16 but similar to a smaller patient study.19 In that study, 87% of patients, regardless of their skin cancer history, also reported that they would like their PCP to perform an FBSE regularly.19 Although some of our patient participants may have declined an FBSE, it is unlikely that that would have entirely accounted for the relatively low number of PCPs who reported frequently performing FBSEs.
Documentation in Medical Records of FBSEs
Compared to PCP self-reported performance of FBSEs, considerably fewer PCPs marked the patient medical record as having completed an FBSE. Among patients with medical records that indicated an FBSE had been conducted, they reported higher odds of all 3 body parts being examined, the highest being the backs of the legs. Also, when the patient medical record indicated an FBSE had been completed, the odds that the PCP reported an FBSE also were higher. The relatively low medical record documentation of FBSEs highlights the need for more rigorous enforcement of accurate documentation. However, among the cases that were recorded, it appeared that the content of the examinations was more consistent.
Benefits of PCP-Led FBSEs
Although the USPSTF issued an I rating for PCP-led FBSEs,14 multiple national medical societies, including the American Cancer Society,25 American Academy of Dermatology,26 and Skin Cancer Foundation,27 as well as international guidelines in Germany,28 Australia,29,30 and New Zealand,31 recommend regular FBSEs among the general or at-risk population; New Zealand and Australia have the highest incidence and prevalence of melanoma in the world.8 The benefits of physician-led FBSEs on detection of early-stage skin cancer, and in particular, melanoma detection, have been documented in numerous studies.30,32-38 However, the variability and often poor quality of skin screening may contribute in part to the just as numerous null results from prior skin screening studies,15 perpetuating the insufficient status of skin examinations by USPSTF standards.14 Our study underscores both the variability in frequency and content of PCP-administered FBSEs. It also highlights the need for standardization of screening examinations at the medical student, trainee, and physician level.
Study Limitations
The present study has several limitations. First, there was an unknown time lag between the FBSEs and physician self-reported surveys. Similarly, there was a variable time lag between the patient examination encounter and subsequent telephone survey. Both the physician and patient survey data may have been affected by recall bias. Second, patients were not asked directly whether an FBSE had been conducted. Furthermore, patients may not have appreciated whether the body part examined was part of the FBSE or another examination. Also, screenings often were not recorded in the medical record, assuming that the patient report and/or physician report was more accurate than the medical record.
Our study also was limited by demographics; our patient sample was largely comprised of White, educated, US adults, potentially limiting the generalizability of our findings. Conversely, a notable strength of our study was that our participants were recruited from 4 geographically diverse centers. Furthermore, we had a comparatively large sample size of patients and physicians. Also, the independent assessment of provider-reported examinations, objective assessment of medical records, and patient reports of their encounters provides a strong foundation for assessing the independent contributions of each data source.
CONCLUSION
Our study highlights the challenges future studies face in promoting skin cancer screening in the primary care setting. Our findings underscore the need for a standardized FBSE as well as clear clinical expectations regarding skin cancer screening that is expected of PCPs.
As long as skin cancer screening rates remain low in the United States, patients will be subject to potential delays and missed diagnoses, impacting morbidity and mortality.8 There are burgeoning resources and efforts in place to increase skin cancer screening. For example, free validated online training is available for early detection of melanoma and other skin cancers (https://www.visualdx.com/skin-cancer-education/).39-42 Future directions for bolstering screening numbers must focus on educating PCPs about skin cancer prevention and perhaps narrowing the screening population by age-appropriate risk assessments.
- Rogers HW, Weinstock MA, Feldman SR, et al. Incidence estimate of nonmelanoma skin cancer (keratinocyte carcinomas) in the U.S. population, 2012. JAMA Dermatol. 2015;151:1081-1086.
- Marzuka AG, Book SE. Basal cell carcinoma: pathogenesis, epidemiology, clinical features, diagnosis, histopathology, and management. Yale J Biol Med. 2015;88:167-179.
- Dourmishev LA, Rusinova D, Botev I. Clinical variants, stages, and management of basal cell carcinoma. Indian Dermatol Online J. 2013;4:12-17.
- Thompson AK, Kelley BF, Prokop LJ, et al. Risk factors for cutaneous squamous cell carcinoma outcomes: a systematic review and meta-analysis. JAMA Dermatol. 2016;152:419-428.
- Motaparthi K, Kapil JP, Velazquez EF. Cutaneous squamous cell carcinoma: review of the eighth edition of the American Joint Committee on Cancer Staging Guidelines, Prognostic Factors, and Histopathologic Variants. Adv Anat Pathol. 2017;24:171-194.
- Barton V, Armeson K, Hampras S, et al. Nonmelanoma skin cancer and risk of all-cause and cancer-related mortality: a systematic review. Arch Dermatol Res. 2017;309:243-251.
- Weinstock MA, Bogaars HA, Ashley M, et al. Nonmelanoma skin cancer mortality. a population-based study. Arch Dermatol. 1991;127:1194-1197.
- Matthews NH, Li W-Q, Qureshi AA, et al. Epidemiology of melanoma. In: Ward WH, Farma JM, eds. Cutaneous Melanoma: Etiology and Therapy. Codon Publications; 2017:3-22.
- Cakir BO, Adamson P, Cingi C. Epidemiology and economic burden of nonmelanoma skin cancer. Facial Plast Surg Clin North Am. 2012;20:419-422.
- Guy GP, Machlin SR, Ekwueme DU, et al. Prevalence and costs of skin cancer treatment in the U.S., 2002-2006 and 2007-2011. Am J Prev Med. 2015;48:183-187.
- Losina E, Walensky RP, Geller A, et al. Visual screening for malignant melanoma: a cost-effectiveness analysis. Arch Dermatol. 2007;143:21-28.
- Markova A, Weinstock MA, Risica P, et al. Effect of a web-based curriculum on primary care practice: basic skin cancer triage trial. Fam Med. 2013;45:558-568.
- Johnson MM, Leachman SA, Aspinwall LG, et al. Skin cancer screening: recommendations for data-driven screening guidelines and a review of the US Preventive Services Task Force controversy. Melanoma Manag. 2017;4:13-37.
- Agency for Healthcare Research and Quality. Screening for skin cancer in adults: an updated systematic evidence review for the U.S. Preventive Services Task Force. November 30, 2015. Accessed July 25, 2022. http://uspreventiveservicestaskforce.org/Page/Document/draft-evidence-review159/skin-cancer-screening2
- Wernli KJ, Henrikson NB, Morrison CC, et al. Screening for skin cancer in adults: updated evidence report and systematic review forthe US Preventive Services Task Force. JAMA. 2016;316:436-447.
- LeBlanc WG, Vidal L, Kirsner RS, et al. Reported skin cancer screening of US adult workers. J Am Acad Dermatol. 2008;59:55-63.
- Federman DG, Concato J, Caralis PV, et al. Screening for skin cancer in primary care settings. Arch Dermatol. 1997;133:1423-1425.
- Kirsner RS, Muhkerjee S, Federman DG. Skin cancer screening in primary care: prevalence and barriers. J Am Acad Dermatol. 1999;41:564-566.
- Federman DG, Kravetz JD, Tobin DG, et al. Full-body skin examinations: the patient’s perspective. Arch Dermatol. 2004;140:530-534.
- IBM. IBM SPSS Statistics for Windows. IBM Corp; 2015.
- Moore MM, Geller AC, Zhang Z, et al. Skin cancer examination teaching in US medical education. Arch Dermatol. 2006;142:439-444.
- Wise E, Singh D, Moore M, et al. Rates of skin cancer screening and prevention counseling by US medical residents. Arch Dermatol. 2009;145:1131-1136.
- Lakhani NA, Saraiya M, Thompson TD, et al. Total body skin examination for skin cancer screening among U.S. adults from 2000 to 2010. Prev Med. 2014;61:75-80.
- Coups EJ, Geller AC, Weinstock MA, et al. Prevalence and correlates of skin cancer screening among middle-aged and older white adults in the United States. Am J Med. 2010;123:439-445.
- American Cancer Society. Cancer facts & figures 2016. Accessed March 13, 2022. https://cancer.org/research/cancerfactsstatistics/cancerfactsfigures2016/
- American Academy of Dermatology. Skin cancer incidence rates. Updated April 22, 2022. Accessed August 1, 2022. https://www.aad.org/media/stats-skin-cancer
- Skin Cancer Foundation. Skin cancer prevention. Accessed July 25, 2022. http://skincancer.org/prevention/sun-protection/prevention-guidelines
- Katalinic A, Eisemann N, Waldmann A. Skin cancer screening in Germany. documenting melanoma incidence and mortality from 2008 to 2013. Dtsch Arztebl Int. 2015;112:629-634.
- Cancer Council Australia. Position statement: screening and early detection of skin cancer. Published July 2014. Accessed July 25, 2022. https://dermcoll.edu.au/wp-content/uploads/2014/05/PosStatEarlyDetectSkinCa.pdf
- Royal Australian College of General Practitioners. Guidelines for Preventive Activities in General Practice. 9th ed. The Royal Australian College of General Practitioners; 2016. Accessed July 27, 2022. https://www.racgp.org.au/download/Documents/Guidelines/Redbook9/17048-Red-Book-9th-Edition.pdf
- Cancer Council Australia and Australian Cancer Network and New Zealand Guidelines Group. Clinical Practice Guidelines for the Management of Melanoma in Australia and New Zealand. The Cancer Council Australia and Australian Cancer Network, Sydney and New Zealand Guidelines Group, Wellington; 2008. Accessed July 27, 2022. https://www.health.govt.nz/system/files/documents/publications/melanoma-guideline-nov08-v2.pdf
- Swetter SM, Pollitt RA, Johnson TM, et al. Behavioral determinants of successful early melanoma detection: role of self and physician skin examination. Cancer. 2012;118:3725-3734.
- Terushkin V, Halpern AC. Melanoma early detection. Hematol Oncol Clin North Am. 2009;23:481-500, viii.
- Aitken JF, Elwood M, Baade PD, et al. Clinical whole-body skin examination reduces the incidence of thick melanomas. Int J Cancer. 2010;126:450-458.
- Aitken JF, Elwood JM, Lowe JB, et al. A randomised trial of population screening for melanoma. J Med Screen. 2002;9:33-37.
- Breitbart EW, Waldmann A, Nolte S, et al. Systematic skin cancer screening in Northern Germany. J Am Acad Dermatol. 2012;66:201-211.
- Janda M, Lowe JB, Elwood M, et al. Do centralised skin screening clinics increase participation in melanoma screening (Australia)? Cancer Causes Control. 2006;17:161-168.
- Aitken JF, Janda M, Elwood M, et al. Clinical outcomes from skin screening clinics within a community-based melanoma screening program. J Am Acad Dermatol. 2006;54:105-114.
- Eide MJ, Asgari MM, Fletcher SW, et al. Effects on skills and practice from a web-based skin cancer course for primary care providers. J Am Board Fam Med. 2013;26:648-657.
- Weinstock MA, Ferris LK, Saul MI, et al. Downstream consequences of melanoma screening in a community practice setting: first results. Cancer. 2016;122:3152-3156.
- Matthews NH, Risica PM, Ferris LK, et al. Psychosocial impact of skin biopsies in the setting of melanoma screening: a cross-sectional survey. Br J Dermatol. 2019;180:664-665.
- Risica PM, Matthews NH, Dionne L, et al. Psychosocial consequences of skin cancer screening. Prev Med Rep. 2018;10:310-316.
Keratinocyte carcinoma (KC), or nonmelanoma skin cancer, is the most commonly diagnosed cancer in the United States.1 Basal cell carcinoma comprises the majority of all KCs.2,3 Squamous cell carcinoma is the second most common skin cancer, representing approximately 20% of KCs and accounting for the majority of KC-related deaths.4-7 Malignant melanoma represents the majority of all skin cancer–related deaths.8 The incidence of basal cell carcinoma, squamous cell carcinoma, and malignant melanoma in the United States is on the rise and carries substantial morbidity and mortality with notable social and economic burdens.1,8-10
Prevention is necessary to reduce skin cancer morbidity and mortality as well as rising treatment costs. The most commonly used skin cancer screening method among dermatologists is the visual full-body skin examination (FBSE), which is a noninvasive, safe, quick, and cost-effective method of early detection and prevention.11 To effectively confront the growing incidence and health care burden of skin cancer, primary care providers (PCPs) must join dermatologists in conducting FBSEs.12,13
Despite being the predominant means of secondary skin cancer prevention, the US Preventive Services Task Force (USPSTF) issued an I rating for insufficient evidence to assess the benefits vs harms of screening the adult general population by PCPs.14,15 A major barrier to studying screening is the lack of a standardized method for conducting and reporting FBSEs.13 Systematic thorough skin examination generally is not performed in the primary care setting.16-18
We aimed to investigate what occurs during an FBSE in the primary care setting and how often they are performed. We examined whether there was potential variation in the execution of the examination, what was perceived by the patient vs reported by the physician, and what was ultimately included in the medical record. Miscommunication between patient and provider regarding performance of FBSEs has previously been noted,17-19 and we sought to characterize and quantify that miscommunication. We hypothesized that there would be lower patient-reported FBSEs compared to physicians and patient medical records. We also hypothesized that there would be variability in how physicians screened for skin cancer.
METHODS
This study was cross-sectional and was conducted based on interviews and a review of medical records at secondary- and tertiary-level units (clinics and hospitals) across the United States. We examined baseline data from a randomized controlled trial of a Web-based skin cancer early detection continuing education course—the Basic Skin Cancer Triage curriculum. Complete details have been described elsewhere.12 This study was approved by the institutional review boards of the Providence Veterans Affairs Medical Center, Rhode Island Hospital, and Brown University (all in Providence, Rhode Island), as well as those of all recruitment sites.
Data were collected from 2005 to 2008 and included physician online surveys, patient telephone interviews, and patient medical record data abstracted by research assistants. Primary care providers included in the study were general internists, family physicians, or medicine-pediatrics practitioners who were recruited from 4 collaborating centers across the United States in the mid-Atlantic region, Ohio, Kansas, and southern California, and who had been in practice for at least a year. Patients were recruited from participating physician practices and selected by research assistants who traveled to each clinic for coordination, recruitment, and performance of medical record reviews. Patients were selected as having minimal risk of melanoma (eg, no signs of severe photodamage to the skin). Patients completed structured telephone surveys within 1 to 2 weeks of the office visit regarding the practices observed and clinical questions asked during their recent clinical encounter with their PCP.
Measures
Demographics—Demographic variables asked of physicians included age, sex, ethnicity, academic degree (MD vs DO), years in practice, training, and prior dermatology training. Demographic information asked of patients included age, sex, ethnicity, education, and household income.
Physician-Reported Examination and Counseling Variables—Physicians were asked to characterize their clinical practices, prompted by questions regarding performance of FBSEs: “Please think of a typical month and using the scale below, indicate how frequently you perform a total body skin exam during an annual exam (eg, periodic follow-up exam).” Physicians responded to 3 questions on a 5-point scale (1=never, 2=sometimes, 3=about half, 4=often, 5=almost always).
Patient-Reported Examination Variables—Patients also were asked to characterize the skin examination experienced in their clinical encounter with their PCP, including: “During your last visit, as far as you could tell, did your physician: (1) look at the skin on your back? (2) look at the skin on your belly area? (3) look at the skin on the back of your legs?” Patient responses were coded as yes, no, don’t know, or refused. Participants who refused were excluded from analysis; participants who responded are detailed in Table 1. In addition, patients also reported the level of undress with their physician by answering the following question: “During your last medical exam, did you: 1=keep your clothes on; 2=partially undress; 3=totally undress except for undergarments; 4=totally undress, including all undergarments?”
Patient Medical Record–Extracted Data—Research assistants used a structured abstract form to extract the information from the patient’s medical record and graded it as 0 (absence) or 1 (presence) from the medical record.
Statistical Analysis
Descriptive statistics included mean and standard deviation (SD) for continuous variables as well as frequency and percentage for categorical variables. Logit/logistic regression analysis was used to predict the odds of patient-reported outcomes that were binary with physician-reported variables as the predictor. Linear regression analysis was used to assess the association between 2 continuous variables. All analyses were conducted using SPSS version 24 (IBM).20 Significance criterion was set at α of .05.
RESULTS Demographics
The final sample included data from 53 physicians and 3343 patients. The study sample mean age (SD) was 50.3 (9.9) years for PCPs (n=53) and 59.8 (16.9) years for patients (n=3343). The physician sample was 36% female and predominantly White (83%). Ninety-one percent of the PCPs had an MD (the remaining had a DO degree), and the mean (SD) years practicing was 21.8 (10.6) years. Seventeen percent of PCPs were trained in internal medicine, 4% in internal medicine and pediatrics, and 79% family medicine; 79% of PCPs had received prior training in dermatology. The patient sample was 58% female, predominantly White (84%), non-Hispanic/Latinx (95%), had completed high school (94%), and earned more than $40,000 annually (66%).
Physician- and Patient-Reported FBSEs
Physicians reported performing FBSEs with variable frequency. Among PCPs who conducted FBSEs with greater frequency, there was a modest increase in the odds that patients reported a particular body part was examined (back: odds ratio [OR], 24.5% [95% CI, 1.18-1.31; P<.001]; abdomen: OR, 23.3% [95% CI, 1.17-1.30; P<.001]; backs of legs: OR, 20.4% [95% CI, 1.13-1.28; P<.001])(Table 1). The patient-reported level of undress during examination was significantly associated with physician-reported FBSE (β=0.16 [95% CI, 0.13-0.18; P<.001])(Table 2).
Because of the bimodal distribution of scores in the physician-reported frequency of FBSEs, particularly pertaining to the extreme points of the scale, we further repeated analysis with only the never and almost always groups (Table 1). Primary care providers who reported almost always for FBSE had 29.6% increased odds of patient-reported back examination (95% CI, 1.00-1.68; P=.048) and 59.3% increased odds of patient-reported abdomen examination (95% CI, 1.23-2.06; P<.001). The raw percentages of patients who reported having their back, abdomen, and backs of legs examined when the PCP reported having never conducted an FBSE were 56%, 40%, and 26%, respectively. The raw percentages of patients who reported having their back, abdomen, and backs of legs examined when the PCP reported having almost always conducted an FBSE were 52%, 51%, and 30%, respectively. Raw percentages were calculated by dividing the number of "yes" responses by participants for each body part examined by thetotal number of participant responses (“yes” and “no”) for each respective body part. There was no significant change in odds of patient-reported backs of legs examined with PCP-reported never vs almost always conducting an FBSE. In addition, a greater patient-reported level of undress was associated with 20.2% increased odds of PCPs reporting almost always conducting an FBSE (95% CI, 1.08-1.34; P=.001).
FBSEs in Patient Medical Records
When comparing PCP-reported FBSE and report of FBSE in patient medical records, there was a 39.0% increased odds of the patient medical record indicating FBSE when physicians reported conducting an FBSE with greater frequency (95% CI, 1.30-1.48; P<.001)(eTable 1). When examining PCP-reported never vs almost always conducting an FBSE, a report of almost always was associated with 79.0% increased odds of the patient medical record indicating that an FBSE was conducted (95% CI, 1.28-2.49; P=.001). The raw percentage of the patient medical record indicating an FBSE was conducted when the PCP reported having never conducted an FBSE was 17% and 26% when the PCP reported having almost always conducted an FBSE.
When comparing the patient-reported body part examined with patient FBSE medical record documentation, an indication of yes for FBSE on the patient medical record was associated with a considerable increase in odds that patients reported a particular body part was examined (back: 91.4% [95% CI, 1.59-2.31; P<.001]; abdomen: 75.0% [95% CI, 1.45-2.11; P<.001]; backs of legs: 91.6% [95% CI, 1.56-2.36; P<.001])(eTable 2). The raw percentages of patients who reported having their back, abdomen, and backs of legs examined vs not examined when the patient medical record indicated an FBSE was completed were 24% vs 14%, 23% vs 15%, and 26% vs 16%, respectively. An increase in patient-reported level of undress was associated with a 57.0% increased odds of their medical record indicating an FBSE was conducted (95% CI, 1.45-1.70; P<.001).
COMMENT How PCPs Perform FBSEs Varies
We found that PCPs performed FBSEs with variable frequency, and among those who did, the patient report of their examination varied considerably (Table 1). There appears to be considerable ambiguity in each of these means of determining the extent to which the skin was inspected for skin cancer, which may render the task of improving such inspection more difficult. We asked patients whether their back, abdomen, and backs of legs were examined as an assessment of some of the variety of areas inspected during an FBSE. During a general well-visit appointment, a patient’s back and abdomen may be examined for multiple reasons. Patients may have misinterpreted elements of the pulmonary, cardiac, abdominal, or musculoskeletal examinations as being part of the FBSE. The back and abdomen—the least specific features of the FBSE—were reported by patients to be the most often examined. Conversely, the backs of the legs—the most specific feature of the FBSE—had the lowest odds of being examined (Table 1).
In addition to the potential limitations of patient awareness of physician activity, our results also could be explained by differences among PCPs in how they performed FBSEs. There is no standardized method of conducting an FBSE. Furthermore, not all medical students and residents are exposed to dermatology training. In our sample of 53 physicians, 79% had reported receiving dermatology training; however, we did not assess the extent to which they had been trained in conducting an FBSE and/or identifying malignant lesions. In an American survey of 659 medical students, more than two-thirds of students had never been trained or never examined a patient for skin cancer.21 In another American survey of 342 internal medicine, family medicine, pediatrics, and obstetrics/gynecology residents across 7 medical schools and 4 residency programs, more than three-quarters of residents had never been trained in skin cancer screening.22 Our findings reflect insufficient and inconsistent training in skin cancer screening and underscore the need for mandatory education to ensure quality FBSEs are performed in the primary care setting.
Frequency of PCPs Performing FBSEs
Similar to prior studies analyzing the frequency of FBSE performance in the primary care setting,16,19,23,24 more than half of our PCP sample reported sometimes to never conducting FBSEs. The percentage of physicians who reported conducting FBSEs in our sample was greater than the proportion reported by the National Health Interview Survey, in which only 8% of patients received an FBSE in the prior year by a PCP or obstetrician/gynecologist,16 but similar to a smaller patient study.19 In that study, 87% of patients, regardless of their skin cancer history, also reported that they would like their PCP to perform an FBSE regularly.19 Although some of our patient participants may have declined an FBSE, it is unlikely that that would have entirely accounted for the relatively low number of PCPs who reported frequently performing FBSEs.
Documentation in Medical Records of FBSEs
Compared to PCP self-reported performance of FBSEs, considerably fewer PCPs marked the patient medical record as having completed an FBSE. Among patients with medical records that indicated an FBSE had been conducted, they reported higher odds of all 3 body parts being examined, the highest being the backs of the legs. Also, when the patient medical record indicated an FBSE had been completed, the odds that the PCP reported an FBSE also were higher. The relatively low medical record documentation of FBSEs highlights the need for more rigorous enforcement of accurate documentation. However, among the cases that were recorded, it appeared that the content of the examinations was more consistent.
Benefits of PCP-Led FBSEs
Although the USPSTF issued an I rating for PCP-led FBSEs,14 multiple national medical societies, including the American Cancer Society,25 American Academy of Dermatology,26 and Skin Cancer Foundation,27 as well as international guidelines in Germany,28 Australia,29,30 and New Zealand,31 recommend regular FBSEs among the general or at-risk population; New Zealand and Australia have the highest incidence and prevalence of melanoma in the world.8 The benefits of physician-led FBSEs on detection of early-stage skin cancer, and in particular, melanoma detection, have been documented in numerous studies.30,32-38 However, the variability and often poor quality of skin screening may contribute in part to the just as numerous null results from prior skin screening studies,15 perpetuating the insufficient status of skin examinations by USPSTF standards.14 Our study underscores both the variability in frequency and content of PCP-administered FBSEs. It also highlights the need for standardization of screening examinations at the medical student, trainee, and physician level.
Study Limitations
The present study has several limitations. First, there was an unknown time lag between the FBSEs and physician self-reported surveys. Similarly, there was a variable time lag between the patient examination encounter and subsequent telephone survey. Both the physician and patient survey data may have been affected by recall bias. Second, patients were not asked directly whether an FBSE had been conducted. Furthermore, patients may not have appreciated whether the body part examined was part of the FBSE or another examination. Also, screenings often were not recorded in the medical record, assuming that the patient report and/or physician report was more accurate than the medical record.
Our study also was limited by demographics; our patient sample was largely comprised of White, educated, US adults, potentially limiting the generalizability of our findings. Conversely, a notable strength of our study was that our participants were recruited from 4 geographically diverse centers. Furthermore, we had a comparatively large sample size of patients and physicians. Also, the independent assessment of provider-reported examinations, objective assessment of medical records, and patient reports of their encounters provides a strong foundation for assessing the independent contributions of each data source.
CONCLUSION
Our study highlights the challenges future studies face in promoting skin cancer screening in the primary care setting. Our findings underscore the need for a standardized FBSE as well as clear clinical expectations regarding skin cancer screening that is expected of PCPs.
As long as skin cancer screening rates remain low in the United States, patients will be subject to potential delays and missed diagnoses, impacting morbidity and mortality.8 There are burgeoning resources and efforts in place to increase skin cancer screening. For example, free validated online training is available for early detection of melanoma and other skin cancers (https://www.visualdx.com/skin-cancer-education/).39-42 Future directions for bolstering screening numbers must focus on educating PCPs about skin cancer prevention and perhaps narrowing the screening population by age-appropriate risk assessments.
- Rogers HW, Weinstock MA, Feldman SR, et al. Incidence estimate of nonmelanoma skin cancer (keratinocyte carcinomas) in the U.S. population, 2012. JAMA Dermatol. 2015;151:1081-1086.
- Marzuka AG, Book SE. Basal cell carcinoma: pathogenesis, epidemiology, clinical features, diagnosis, histopathology, and management. Yale J Biol Med. 2015;88:167-179.
- Dourmishev LA, Rusinova D, Botev I. Clinical variants, stages, and management of basal cell carcinoma. Indian Dermatol Online J. 2013;4:12-17.
- Thompson AK, Kelley BF, Prokop LJ, et al. Risk factors for cutaneous squamous cell carcinoma outcomes: a systematic review and meta-analysis. JAMA Dermatol. 2016;152:419-428.
- Motaparthi K, Kapil JP, Velazquez EF. Cutaneous squamous cell carcinoma: review of the eighth edition of the American Joint Committee on Cancer Staging Guidelines, Prognostic Factors, and Histopathologic Variants. Adv Anat Pathol. 2017;24:171-194.
- Barton V, Armeson K, Hampras S, et al. Nonmelanoma skin cancer and risk of all-cause and cancer-related mortality: a systematic review. Arch Dermatol Res. 2017;309:243-251.
- Weinstock MA, Bogaars HA, Ashley M, et al. Nonmelanoma skin cancer mortality. a population-based study. Arch Dermatol. 1991;127:1194-1197.
- Matthews NH, Li W-Q, Qureshi AA, et al. Epidemiology of melanoma. In: Ward WH, Farma JM, eds. Cutaneous Melanoma: Etiology and Therapy. Codon Publications; 2017:3-22.
- Cakir BO, Adamson P, Cingi C. Epidemiology and economic burden of nonmelanoma skin cancer. Facial Plast Surg Clin North Am. 2012;20:419-422.
- Guy GP, Machlin SR, Ekwueme DU, et al. Prevalence and costs of skin cancer treatment in the U.S., 2002-2006 and 2007-2011. Am J Prev Med. 2015;48:183-187.
- Losina E, Walensky RP, Geller A, et al. Visual screening for malignant melanoma: a cost-effectiveness analysis. Arch Dermatol. 2007;143:21-28.
- Markova A, Weinstock MA, Risica P, et al. Effect of a web-based curriculum on primary care practice: basic skin cancer triage trial. Fam Med. 2013;45:558-568.
- Johnson MM, Leachman SA, Aspinwall LG, et al. Skin cancer screening: recommendations for data-driven screening guidelines and a review of the US Preventive Services Task Force controversy. Melanoma Manag. 2017;4:13-37.
- Agency for Healthcare Research and Quality. Screening for skin cancer in adults: an updated systematic evidence review for the U.S. Preventive Services Task Force. November 30, 2015. Accessed July 25, 2022. http://uspreventiveservicestaskforce.org/Page/Document/draft-evidence-review159/skin-cancer-screening2
- Wernli KJ, Henrikson NB, Morrison CC, et al. Screening for skin cancer in adults: updated evidence report and systematic review forthe US Preventive Services Task Force. JAMA. 2016;316:436-447.
- LeBlanc WG, Vidal L, Kirsner RS, et al. Reported skin cancer screening of US adult workers. J Am Acad Dermatol. 2008;59:55-63.
- Federman DG, Concato J, Caralis PV, et al. Screening for skin cancer in primary care settings. Arch Dermatol. 1997;133:1423-1425.
- Kirsner RS, Muhkerjee S, Federman DG. Skin cancer screening in primary care: prevalence and barriers. J Am Acad Dermatol. 1999;41:564-566.
- Federman DG, Kravetz JD, Tobin DG, et al. Full-body skin examinations: the patient’s perspective. Arch Dermatol. 2004;140:530-534.
- IBM. IBM SPSS Statistics for Windows. IBM Corp; 2015.
- Moore MM, Geller AC, Zhang Z, et al. Skin cancer examination teaching in US medical education. Arch Dermatol. 2006;142:439-444.
- Wise E, Singh D, Moore M, et al. Rates of skin cancer screening and prevention counseling by US medical residents. Arch Dermatol. 2009;145:1131-1136.
- Lakhani NA, Saraiya M, Thompson TD, et al. Total body skin examination for skin cancer screening among U.S. adults from 2000 to 2010. Prev Med. 2014;61:75-80.
- Coups EJ, Geller AC, Weinstock MA, et al. Prevalence and correlates of skin cancer screening among middle-aged and older white adults in the United States. Am J Med. 2010;123:439-445.
- American Cancer Society. Cancer facts & figures 2016. Accessed March 13, 2022. https://cancer.org/research/cancerfactsstatistics/cancerfactsfigures2016/
- American Academy of Dermatology. Skin cancer incidence rates. Updated April 22, 2022. Accessed August 1, 2022. https://www.aad.org/media/stats-skin-cancer
- Skin Cancer Foundation. Skin cancer prevention. Accessed July 25, 2022. http://skincancer.org/prevention/sun-protection/prevention-guidelines
- Katalinic A, Eisemann N, Waldmann A. Skin cancer screening in Germany. documenting melanoma incidence and mortality from 2008 to 2013. Dtsch Arztebl Int. 2015;112:629-634.
- Cancer Council Australia. Position statement: screening and early detection of skin cancer. Published July 2014. Accessed July 25, 2022. https://dermcoll.edu.au/wp-content/uploads/2014/05/PosStatEarlyDetectSkinCa.pdf
- Royal Australian College of General Practitioners. Guidelines for Preventive Activities in General Practice. 9th ed. The Royal Australian College of General Practitioners; 2016. Accessed July 27, 2022. https://www.racgp.org.au/download/Documents/Guidelines/Redbook9/17048-Red-Book-9th-Edition.pdf
- Cancer Council Australia and Australian Cancer Network and New Zealand Guidelines Group. Clinical Practice Guidelines for the Management of Melanoma in Australia and New Zealand. The Cancer Council Australia and Australian Cancer Network, Sydney and New Zealand Guidelines Group, Wellington; 2008. Accessed July 27, 2022. https://www.health.govt.nz/system/files/documents/publications/melanoma-guideline-nov08-v2.pdf
- Swetter SM, Pollitt RA, Johnson TM, et al. Behavioral determinants of successful early melanoma detection: role of self and physician skin examination. Cancer. 2012;118:3725-3734.
- Terushkin V, Halpern AC. Melanoma early detection. Hematol Oncol Clin North Am. 2009;23:481-500, viii.
- Aitken JF, Elwood M, Baade PD, et al. Clinical whole-body skin examination reduces the incidence of thick melanomas. Int J Cancer. 2010;126:450-458.
- Aitken JF, Elwood JM, Lowe JB, et al. A randomised trial of population screening for melanoma. J Med Screen. 2002;9:33-37.
- Breitbart EW, Waldmann A, Nolte S, et al. Systematic skin cancer screening in Northern Germany. J Am Acad Dermatol. 2012;66:201-211.
- Janda M, Lowe JB, Elwood M, et al. Do centralised skin screening clinics increase participation in melanoma screening (Australia)? Cancer Causes Control. 2006;17:161-168.
- Aitken JF, Janda M, Elwood M, et al. Clinical outcomes from skin screening clinics within a community-based melanoma screening program. J Am Acad Dermatol. 2006;54:105-114.
- Eide MJ, Asgari MM, Fletcher SW, et al. Effects on skills and practice from a web-based skin cancer course for primary care providers. J Am Board Fam Med. 2013;26:648-657.
- Weinstock MA, Ferris LK, Saul MI, et al. Downstream consequences of melanoma screening in a community practice setting: first results. Cancer. 2016;122:3152-3156.
- Matthews NH, Risica PM, Ferris LK, et al. Psychosocial impact of skin biopsies in the setting of melanoma screening: a cross-sectional survey. Br J Dermatol. 2019;180:664-665.
- Risica PM, Matthews NH, Dionne L, et al. Psychosocial consequences of skin cancer screening. Prev Med Rep. 2018;10:310-316.
PRACTICE POINTS
- Dermatologists should be aware of the variability in practice and execution of full-body skin examinations (FBSEs) among primary care providers and offer comprehensive examinations for every patient.
- Variability in reporting and execution of FBSEs may impact the continued US Preventive Services Task Force I rating in their guidelines and promotion of skin cancer screening in the primary care setting.
Combatting Climate Change: 10 Interventions for Dermatologists to Consider for Sustainability
The impacts of anthropogenic climate change on human health are numerous and growing. The evidence that climate change is occurring due to the burning of fossil fuels is substantial, with a 2019 report elevating the data supporting anthropogenic climate change to a gold standard 5-sigma level of significance.1 In the peer-reviewed scientific literature, the consensus that humans are causing climate change is greater than 99%.2 Both the American Medical Association and the American College of Physicians have acknowledged the health impacts of climate change and importance for action. They encourage physicians to engage in environmentally sustainable practices and to advocate for effective climate change mitigation strategies.3,4 A survey of dermatologists also found that 99.3% (n=148) recognize climate change is occurring, and similarly high numbers are concerned about its health impacts.5
Notably, the health care industry must grapple not only with the health impacts of climate change but with the fact that the health care sector itself is responsible for a large amount of carbon emissions.6 The global health care industry as a whole produces enough carbon emissions to be ranked as the fifth largest emitting nation in the world.7 A quarter of these emissions are attributed to the US health care system.8,9 Climate science has shown we must limit CO2 emissions to avoid catastrophic climate change, with the sixth assessment report of the United Nations’ Intergovernmental Panel on Climate Change and the Paris Agreement targeting large emission reductions within the next decade.10 In August 2021, the US Department of Health and Human Services created the Office of Climate Change and Health Equity. Assistant Secretary for Health ADM Rachel L. Levine, MD, has committed to reducing the carbon emissions from the health care sector by 25% in the next decade, in line with scientific consensus regarding necessary changes.11
The dermatologic impacts of climate change are myriad. Rising temperatures, increasing air and water pollution, and stratospheric ozone depletion will lead to expanded geographic ranges of vector-borne diseases, worsening of chronic skin conditions such as atopic dermatitis/eczema and pemphigus, and increasing rates of skin cancer.12 For instance, warmer temperatures have allowed mosquitoes of the Aedes genus to infest new areas, leading to outbreaks of viral illnesses with cutaneous manifestations such as dengue, chikungunya, and Zika virus in previously nonindigenous regions.13 Rising temperatures also have been associated with an expanding geographic range of tick- and sandfly-borne illnesses such as Lyme disease, Rocky Mountain spotted fever, and cutaneous leishmaniasis.13,14 Additionally, short-term exposure to air pollution from wildfire smoke has been associated with an increased use of health care services by patients with atopic dermatitis.15 Increased levels of air pollutants also have been found to be associated with psoriasis flares as well as hyperpigmentation and wrinkle formation.16,17 Skin cancer incidence is predicted to rise due to increased UV radiation exposure secondary to stratospheric ozone depletion.18
Although the effects of climate change are significant and the magnitude of the climate crisis may feel overwhelming, it is essential to avoid doomerism and focus on meaningful impactful actions. Current CO2 emissions will remain in the atmosphere for hundreds to thousands of years, and the choices we make now commit future generations to live in a world shaped by our decisions. Importantly, there are impactful and low-cost, cost-effective, or cost-saving changes that can be made to mitigate the climate crisis. Herein, we provide 10 practical actionable interventions for dermatologists to help combat climate change.
10 Interventions for Dermatologists to Combat Climate Change
1. Consider switching to renewable sources of energy. Making this switch often is the most impactful decision a dermatologist can make to address climate change. The electricity sector is the largest source of greenhouse gas emissions in the US health care system, and dermatology outpatient practices in particular have been observed to have a higher peak energy consumption than most other specialties studied.19,20 Many dermatology practices—both privately owned and academic—can switch to renewable energy seamlessly through power purchase agreements (PPAs), which are contracts between power providers and private entities to install renewable energy equipment or source renewable energy from offsite sources at a fixed rate. Using PPAs instead of traditional fossil fuel energy can provide cost savings as well as protect buyers from electrical price volatility. Numerous health care systems utilize PPAs such as Kaiser Permanente, Cleveland Clinic, and Rochester Regional Health. Additionally, dermatologists can directly purchase renewable energy equipment and eventually receive a return on investment from substantially lowered electric bills. It is important to note that the cost of commercial solar energy systems has decreased 69% since 2010 with further cost reductions predicted.21,22
2. Reduce standby power consumption. This refers to the use of electricity by a device when it appears to be off or is not in use, which can lead to considerable energy consumption and subsequently a larger carbon footprint for your practice. Ensuring electronics such as phone chargers, light fixtures, television screens, and computers are switched off prior to the end of the workday can make a large difference; for instance, a single radiology department at the University of Maryland (College Park, Maryland) found that if clinical workstations were shut down when not in use after an 8-hour workday, it would save 83,866 kWh of energy and $9225.33 per year.23 Additionally, using power strips with an automatic shutoff feature to shut off power to devices not in use provides a more convenient way to reduce standby power.
3. Optimize thermostat settings. An analysis of energy consumption in 157,000 US health care facilities found that space heating and cooling accounted for 40% of their total energy consumption.24 Thus, ensuring your thermostat and heating/cooling systems are working efficiently can conserve a substantial amount of energy. For maximum efficiency, it is recommended to set air conditioners to 74 °F (24 °C) and heaters to 68 °F (20 °C) or employ smart thermostats to optimally adjust temperatures when the office is not in use.25 In addition, routinely replacing or cleaning air conditioner filters can lower energy consumption by 5% to 15%.26 Similarly, improving insulation and ruggedization of both homes and offices may reduce heating and cooling waste and limit costs and emissions as a result.
4. Offer bicycle racks and charging ports for electric vehicles. In the United States, transportation generates more greenhouse gas emissions than any other source, primarily due to the burning of fossil fuels to power automobiles, trains, and planes. Because bicycles do not consume any fossil fuels and the use of electric vehicles has been found to result in substantial air pollution health benefits, encouraging the use of both can make a considerable positive impact on our climate.27 Providing these resources not only allows those who already travel sustainably to continue to do so but also serves as a reminder to your patients that sustainability is important to you as their health care provider. As electric vehicle sales continue to climb, infrastructure to support their use, including charging stations, will grow in importance. A physician’s office that offers a car-charging station may soon have a competitive advantage over others in the area.
5. Ensure properly regulated medical waste management. Regulated medical waste (also known as infectious medical waste or red bag waste) refers to health care–generated waste unsuitable for disposal in municipal solid waste systems due to concern for the spread of infectious or pathogenic materials. This waste largely is disposed via incineration, which harms the environment in a multitude of ways—both through harmful byproducts and from the CO2 emissions required to ship the waste to special processing facilities.28 Incineration of regulated medical waste emits potent toxins such as dioxins and furans as well as particulate matter, which contribute to air pollution. Ensuring only materials with infectious potential (as defined by each state’s Environmental Protection Agency) are disposed in regulated medical waste containers can dramatically reduce the harmful effects of incineration. Additionally, limiting regulated medical waste can be very cost-effective, as its disposal is 5- to 10-times more expensive than that of unregulated medical waste.29 Simple nudge measures such as educating staff about what waste goes in which receptacle, placing signage over the red bag waste to prompt staff to pause to consider if use of that bin is required before utilizing, using weights or clasps to make opening red bag waste containers slightly harder, and positioning different trash receptacles in different parts of examination rooms may help reduce inappropriate use of red bag waste.
6. Consider virtual platforms when possible. Due to the COVID-19 pandemic, virtual meeting platforms saw a considerable increase in usage by dermatologists. Teledermatology for patient care became much more widely adopted, and traditionally in-person meetings turned virtual.30 The reduction in emissions from these changes was remarkable. A recent study looking at the environmental impact of 3 months of teledermatology visits early during the COVID-19 pandemic found that 1476 teledermatology appointments saved 55,737 miles of car travel, equivalent to 15.37 metric tons of CO2.31 Whether for patient care when appropriate, academic conferences and continuing medical education credit, or for interviews (eg, medical students, residents, other staff), use of virtual platforms can reduce unnecessary travel and therefore substantially reduce travel-related emissions. When travel is unavoidable, consider exploring validated vetted companies that offer carbon offsets to reduce the harmful environmental impact of high-emission flights.
7. Limit use of single-use disposable items. Although single-use items such as examination gloves or needles are necessary in a dermatology practice, there are many opportunities to incorporate reusable items in your workplace. For instance, you can replace plastic cutlery and single-use plates in kitchen or dining areas with reusable alternatives. Additionally, using reusable isolation gowns instead of their single-use counterparts can help reduce waste; a reusable isolation gown system for providers including laundering services was found to consume 28% less energy and emit 30% fewer greenhouse gases than a single-use isolation gown system.32 Similarly, opting for reusable instruments instead of single-use instruments when possible also can help reduce your practice’s carbon footprint. Carefully evaluating each part of your “dermatology visit supply chain” may offer opportunities to utilize additional cost-saving, environmentally friendly options; for example, an individually plastic-wrapped Dermablade vs a bulk-packaged blade for shave biopsies has a higher cost and worse environmental impact. A single gauze often is sufficient for shave biopsies, but many practices open a plastic container of bulk gauze, much of which results in waste that too often is inappropriately disposed of as regulated medical waste despite not being saturated in blood/body fluids.
8. Educate on the effects of climate change. Dermatologists and other physicians have the unique opportunity to teach members of their community every day through patient care. Physicians are trusted messengers, and appropriately counseling patients regarding the risks of climate change and its effects on their dermatologic health is in line with both American Medical Association and American College of Physicians guidelines.3,4 For instance, patients with Lyme disease in Canada or Maine were unheard of a few decades ago, but now they are common; flares of atopic dermatitis in regions adjacent to recent wildfires may be attributable to harmful particulate matter resulting from fossil-fueled climate change and record droughts. Educating medical trainees on the impacts of climate change is just as vital, as it is a topic that often is neglected in medical school and residency curricula.33
9. Install water-efficient toilets and faucets. Anthropogenic climate change has been shown to increase the duration and intensity of droughts throughout the world.34 Much of the western United States also is experiencing record droughts. One way in which dermatology practices can work to combat droughts is through the use of water-conserving toilets, faucets, and urinals. Using water fixtures with the US Environmental Protection Agency’s WaterSense label is a convenient way to do so. The WaterSense label helps identify water fixtures certified to use at least 20% less water as well as save energy and decrease water costs.
10. Advocate through local and national organizations. There are numerous ways in which dermatologists can advocate for action against climate change. Joining professional organizations focused on addressing the climate crisis can help you connect with fellow dermatologists and physicians. The Expert Resource Group on Climate Change and Environmental Issues affiliated with the American Academy of Dermatology (AAD) is one such organization with many opportunities to raise awareness within the field of dermatology. The AAD recently joined the Medical Society Consortium on Climate and Health, an organization providing opportunities for policy and media outreach as well as research on climate change. Advocacy also can mean joining your local chapter of Physicians for Social Responsibility or encouraging divestment from fossil fuel companies within your institution. Voicing support for climate change–focused lectures at events such as grand rounds and society meetings at the local, regional, and state-wide levels can help raise awareness. As the dermatologic effects of climate change grow, being knowledgeable of the views of future leaders in our specialty and country on this issue will become increasingly important.
Final Thoughts
In addition to the climate-friendly decisions one can make as a dermatologist, there are many personal lifestyle choices to consider. Small dietary changes such as limiting consumption of beef and minimizing food waste can have large downstream effects. Opting for transportation via train and limiting air travel are both impactful decisions in reducing CO2 emissions. Similarly, switching to an electric vehicle or vehicle with minimal emissions can work to reduce greenhouse gas accumulation. For additional resources, note the AAD has partnered with My Green Doctor, a nonprofit service for health care practices that includes practical cost-saving suggestions to support sustainability in physician practices.
A recent joint publication in more than 200 medical journals described climate change as the greatest threat to global public health.35 Climate change is having devastating effects on dermatologic health and will only continue to do so if not addressed now. Dermatologists have the opportunity to join with our colleagues in the house of medicine and to take action to fight climate change and mitigate the health impacts on our patients, the population, and future generations.
- Santer BD, Bonfils CJW, Fu Q, et al. Celebrating the anniversary of three key events in climate change science. Nat Clim Chang. 2019;9:180-182.
- Lynas M, Houlton BZ, Perry S. Greater than 99% consensus on human caused climate change in the peer-reviewed scientific literature. Environ Res Lett. 2021;16:114005.
- Crowley RA; Health and Public Policy Committee of the American College of Physicians. Climate change and health: a position paper of the American College of Physicians [published online April 19, 2016]. Ann Intern Med. 2016;164:608-610. doi:10.7326/M15-2766
- Global climate change and human health H-135.398. American Medical Association website. Updated 2019. Accessed July 13, 2022. https://policysearch.ama-assn.org/policyfinder/detail/climate%20change?uri=%2FAMADoc%2FHOD.xml-0-309.xml
- Mieczkowska K, Stringer T, Barbieri JS, et al. Surveying the attitudes of dermatologists regarding climate change. Br J Dermatol. 2022;186:748-750.
- Eckelman MJ, Sherman J. Environmental impacts of the U.S. health care system and effects on public health. PLoS One. 2016;11:e0157014. doi:10.1371/journal.pone.0157014
- Karliner J, Slotterback S, Boyd R, et al. Health care’s climate footprint: how the health sector contributes to the global climate crisis and opportunities for action. Health Care Without Harm website. Published September 2019. Accessed July 13, 2022. https://noharm-global.org/sites/default/files/documents-files/5961/HealthCaresClimateFootprint_090619.pdf
- Pichler PP, Jaccard IS, Weisz U, et al. International comparison of health care carbon footprints. Environ Res Lett. 2019;14:064004.
- Solomon CG, LaRocque RC. Climate change—a health emergency. N Engl J Med. 2019;380:209-211. doi:10.1056/NEJMp1817067
- IPCC, 2021: Summary for Policymakers. In: Masson-Delmotte V, Zhai P, Pirani A, et al, eds. Climate Change 2021: The Physical Science Basis. Contribution of Working Group I to the Sixth Assessment Report of the Intergovernmental Panel on Climate Change. Cambridge University Press; 2021:3-32.
- Dzau VJ, Levine R, Barrett G, et al. Decarbonizing the U.S. Health Sector—a call to action [published online October 13, 2021]. N Engl J Med. 2021;385:2117-2119. doi:10.1056/NEJMp2115675
- Silva GS, Rosenbach M. Climate change and dermatology: an introduction to a special topic, for this special issue. Int J Womens Dermatol 2021;7:3-7.
- Coates SJ, Norton SA. The effects of climate change on infectious diseases with cutaneous manifestations. Int J Womens Dermatol. 2021;7:8-16. doi:10.1016/j.ijwd.2020.07.005
- Andersen LK, Davis MD. Climate change and the epidemiology of selected tick-borne and mosquito-borne diseases: update from the International Society of Dermatology Climate Change Task Force [published online October 1, 2016]. Int J Dermatol. 2017;56:252-259. doi:10.1111/ijd.13438
- Fadadu RP, Grimes B, Jewell NP, et al. Association of wildfire air pollution and health care use for atopic dermatitis and itch. JAMA Dermatol. 2021;157:658-666. doi:10.1001/jamadermatol.2021.0179
- Bellinato F, Adami G, Vaienti S, et al. Association between short-term exposure to environmental air pollution and psoriasis flare. JAMA Dermatol. 2022;158:375-381. doi:10.1001/jamadermatol.2021.6019
- Krutmann J, Bouloc A, Sore G, et al. The skin aging exposome [published online September 28, 2016]. J Dermatol Sci. 2017;85:152-161.
- Parker ER. The influence of climate change on skin cancer incidence—a review of the evidence. Int J Womens Dermatol. 2020;7:17-27. doi:10.1016/j.ijwd.2020.07.003
- Eckelman MJ, Huang K, Lagasse R, et al. Health care pollution and public health damage in the United States: an update. Health Aff (Millwood). 2020;39:2071-2079.
- Sheppy M, Pless S, Kung F. Healthcare energy end-use monitoring. US Department of Energy website. Published August 2014. Accessed July 13, 2022. https://www.energy.gov/sites/prod/files/2014/09/f18/61064.pdf
- Feldman D, Ramasamy V, Fu R, et al. U.S. solar photovoltaic system and energy storage cost benchmark: Q1 2020. Published January 2021. Accessed July 7, 2022. https://www.nrel.gov/docs/fy21osti/77324.pdf
- 22. Apostoleris H, Sgouridis S, Stefancich M, et al. Utility solar prices will continue to drop all over the world even without subsidies. Nat Energy. 2019;4:833-834.
- Prasanna PM, Siegel E, Kunce A. Greening radiology. J Am Coll Radiol. 2011;8:780-784. doi:10.1016/j.jacr.2011.07.017
- Bawaneh K, Nezami FG, Rasheduzzaman MD, et al. Energy consumption analysis and characterization of healthcare facilities in the United States. Energies. 2019;12:1-20. doi:10.3390/en12193775
- Blum S, Buckland M, Sack TL, et al. Greening the office: saving resources, saving money, and educating our patients [published online July 4, 2020]. Int J Womens Dermatol. 2020;7:112-116.
- Maintaining your air conditioner. US Department of Energy website. Accessed July 13, 2022. https://www.energy.gov/energysaver/maintaining-your-air-conditioner
- Choma EF, Evans JS, Hammitt JK, et al. Assessing the health impacts of electric vehicles through air pollution in the United States [published online August 25, 2020]. Environ Int. 2020;144:106015.
- Windfeld ES, Brooks MS. Medical waste management—a review [published online August 22, 2015]. J Environ Manage. 2015;1;163:98-108. doi:10.1016/j.jenvman.2015.08.013
- Fathy R, Nelson CA, Barbieri JS. Combating climate change in the clinic: cost-effective strategies to decrease the carbon footprint of outpatient dermatologic practice. Int J Womens Dermatol. 2020;7:107-111.
- Pulsipher KJ, Presley CL, Rundle CW, et al. Teledermatology application use in the COVID-19 era. Dermatol Online J. 2020;26:13030/qt1fs0m0tp.
- O’Connell G, O’Connor C, Murphy M. Every cloud has a silver lining: the environmental benefit of teledermatology during the COVID-19 pandemic [published online July 9, 2021]. Clin Exp Dermatol. 2021;46:1589-1590. doi:10.1111/ced.14795
- Vozzola E, Overcash M, Griffing E. Environmental considerations in the selection of isolation gowns: a life cycle assessment of reusable and disposable alternatives [published online April 11, 2018]. Am J Infect Control. 2018;46:881-886. doi:10.1016/j.ajic.2018.02.002
- Rabin BM, Laney EB, Philipsborn RP. The unique role of medical students in catalyzing climate change education [published online October 14, 2020]. J Med Educ Curric Dev. doi:10.1177/2382120520957653
- Chiang F, Mazdiyasni O, AghaKouchak A. Evidence of anthropogenic impacts on global drought frequency, duration, and intensity [published online May 12, 2021]. Nat Commun. 2021;12:2754. doi:10.1038/s41467-021-22314-w
- Atwoli L, Baqui AH, Benfield T, et al. Call for emergency action to limit global temperature increases, restore biodiversity, and protect health [published online September 5, 2021]. N Engl J Med. 2021;385:1134-1137. doi:10.1056/NEJMe2113200
The impacts of anthropogenic climate change on human health are numerous and growing. The evidence that climate change is occurring due to the burning of fossil fuels is substantial, with a 2019 report elevating the data supporting anthropogenic climate change to a gold standard 5-sigma level of significance.1 In the peer-reviewed scientific literature, the consensus that humans are causing climate change is greater than 99%.2 Both the American Medical Association and the American College of Physicians have acknowledged the health impacts of climate change and importance for action. They encourage physicians to engage in environmentally sustainable practices and to advocate for effective climate change mitigation strategies.3,4 A survey of dermatologists also found that 99.3% (n=148) recognize climate change is occurring, and similarly high numbers are concerned about its health impacts.5
Notably, the health care industry must grapple not only with the health impacts of climate change but with the fact that the health care sector itself is responsible for a large amount of carbon emissions.6 The global health care industry as a whole produces enough carbon emissions to be ranked as the fifth largest emitting nation in the world.7 A quarter of these emissions are attributed to the US health care system.8,9 Climate science has shown we must limit CO2 emissions to avoid catastrophic climate change, with the sixth assessment report of the United Nations’ Intergovernmental Panel on Climate Change and the Paris Agreement targeting large emission reductions within the next decade.10 In August 2021, the US Department of Health and Human Services created the Office of Climate Change and Health Equity. Assistant Secretary for Health ADM Rachel L. Levine, MD, has committed to reducing the carbon emissions from the health care sector by 25% in the next decade, in line with scientific consensus regarding necessary changes.11
The dermatologic impacts of climate change are myriad. Rising temperatures, increasing air and water pollution, and stratospheric ozone depletion will lead to expanded geographic ranges of vector-borne diseases, worsening of chronic skin conditions such as atopic dermatitis/eczema and pemphigus, and increasing rates of skin cancer.12 For instance, warmer temperatures have allowed mosquitoes of the Aedes genus to infest new areas, leading to outbreaks of viral illnesses with cutaneous manifestations such as dengue, chikungunya, and Zika virus in previously nonindigenous regions.13 Rising temperatures also have been associated with an expanding geographic range of tick- and sandfly-borne illnesses such as Lyme disease, Rocky Mountain spotted fever, and cutaneous leishmaniasis.13,14 Additionally, short-term exposure to air pollution from wildfire smoke has been associated with an increased use of health care services by patients with atopic dermatitis.15 Increased levels of air pollutants also have been found to be associated with psoriasis flares as well as hyperpigmentation and wrinkle formation.16,17 Skin cancer incidence is predicted to rise due to increased UV radiation exposure secondary to stratospheric ozone depletion.18
Although the effects of climate change are significant and the magnitude of the climate crisis may feel overwhelming, it is essential to avoid doomerism and focus on meaningful impactful actions. Current CO2 emissions will remain in the atmosphere for hundreds to thousands of years, and the choices we make now commit future generations to live in a world shaped by our decisions. Importantly, there are impactful and low-cost, cost-effective, or cost-saving changes that can be made to mitigate the climate crisis. Herein, we provide 10 practical actionable interventions for dermatologists to help combat climate change.
10 Interventions for Dermatologists to Combat Climate Change
1. Consider switching to renewable sources of energy. Making this switch often is the most impactful decision a dermatologist can make to address climate change. The electricity sector is the largest source of greenhouse gas emissions in the US health care system, and dermatology outpatient practices in particular have been observed to have a higher peak energy consumption than most other specialties studied.19,20 Many dermatology practices—both privately owned and academic—can switch to renewable energy seamlessly through power purchase agreements (PPAs), which are contracts between power providers and private entities to install renewable energy equipment or source renewable energy from offsite sources at a fixed rate. Using PPAs instead of traditional fossil fuel energy can provide cost savings as well as protect buyers from electrical price volatility. Numerous health care systems utilize PPAs such as Kaiser Permanente, Cleveland Clinic, and Rochester Regional Health. Additionally, dermatologists can directly purchase renewable energy equipment and eventually receive a return on investment from substantially lowered electric bills. It is important to note that the cost of commercial solar energy systems has decreased 69% since 2010 with further cost reductions predicted.21,22
2. Reduce standby power consumption. This refers to the use of electricity by a device when it appears to be off or is not in use, which can lead to considerable energy consumption and subsequently a larger carbon footprint for your practice. Ensuring electronics such as phone chargers, light fixtures, television screens, and computers are switched off prior to the end of the workday can make a large difference; for instance, a single radiology department at the University of Maryland (College Park, Maryland) found that if clinical workstations were shut down when not in use after an 8-hour workday, it would save 83,866 kWh of energy and $9225.33 per year.23 Additionally, using power strips with an automatic shutoff feature to shut off power to devices not in use provides a more convenient way to reduce standby power.
3. Optimize thermostat settings. An analysis of energy consumption in 157,000 US health care facilities found that space heating and cooling accounted for 40% of their total energy consumption.24 Thus, ensuring your thermostat and heating/cooling systems are working efficiently can conserve a substantial amount of energy. For maximum efficiency, it is recommended to set air conditioners to 74 °F (24 °C) and heaters to 68 °F (20 °C) or employ smart thermostats to optimally adjust temperatures when the office is not in use.25 In addition, routinely replacing or cleaning air conditioner filters can lower energy consumption by 5% to 15%.26 Similarly, improving insulation and ruggedization of both homes and offices may reduce heating and cooling waste and limit costs and emissions as a result.
4. Offer bicycle racks and charging ports for electric vehicles. In the United States, transportation generates more greenhouse gas emissions than any other source, primarily due to the burning of fossil fuels to power automobiles, trains, and planes. Because bicycles do not consume any fossil fuels and the use of electric vehicles has been found to result in substantial air pollution health benefits, encouraging the use of both can make a considerable positive impact on our climate.27 Providing these resources not only allows those who already travel sustainably to continue to do so but also serves as a reminder to your patients that sustainability is important to you as their health care provider. As electric vehicle sales continue to climb, infrastructure to support their use, including charging stations, will grow in importance. A physician’s office that offers a car-charging station may soon have a competitive advantage over others in the area.
5. Ensure properly regulated medical waste management. Regulated medical waste (also known as infectious medical waste or red bag waste) refers to health care–generated waste unsuitable for disposal in municipal solid waste systems due to concern for the spread of infectious or pathogenic materials. This waste largely is disposed via incineration, which harms the environment in a multitude of ways—both through harmful byproducts and from the CO2 emissions required to ship the waste to special processing facilities.28 Incineration of regulated medical waste emits potent toxins such as dioxins and furans as well as particulate matter, which contribute to air pollution. Ensuring only materials with infectious potential (as defined by each state’s Environmental Protection Agency) are disposed in regulated medical waste containers can dramatically reduce the harmful effects of incineration. Additionally, limiting regulated medical waste can be very cost-effective, as its disposal is 5- to 10-times more expensive than that of unregulated medical waste.29 Simple nudge measures such as educating staff about what waste goes in which receptacle, placing signage over the red bag waste to prompt staff to pause to consider if use of that bin is required before utilizing, using weights or clasps to make opening red bag waste containers slightly harder, and positioning different trash receptacles in different parts of examination rooms may help reduce inappropriate use of red bag waste.
6. Consider virtual platforms when possible. Due to the COVID-19 pandemic, virtual meeting platforms saw a considerable increase in usage by dermatologists. Teledermatology for patient care became much more widely adopted, and traditionally in-person meetings turned virtual.30 The reduction in emissions from these changes was remarkable. A recent study looking at the environmental impact of 3 months of teledermatology visits early during the COVID-19 pandemic found that 1476 teledermatology appointments saved 55,737 miles of car travel, equivalent to 15.37 metric tons of CO2.31 Whether for patient care when appropriate, academic conferences and continuing medical education credit, or for interviews (eg, medical students, residents, other staff), use of virtual platforms can reduce unnecessary travel and therefore substantially reduce travel-related emissions. When travel is unavoidable, consider exploring validated vetted companies that offer carbon offsets to reduce the harmful environmental impact of high-emission flights.
7. Limit use of single-use disposable items. Although single-use items such as examination gloves or needles are necessary in a dermatology practice, there are many opportunities to incorporate reusable items in your workplace. For instance, you can replace plastic cutlery and single-use plates in kitchen or dining areas with reusable alternatives. Additionally, using reusable isolation gowns instead of their single-use counterparts can help reduce waste; a reusable isolation gown system for providers including laundering services was found to consume 28% less energy and emit 30% fewer greenhouse gases than a single-use isolation gown system.32 Similarly, opting for reusable instruments instead of single-use instruments when possible also can help reduce your practice’s carbon footprint. Carefully evaluating each part of your “dermatology visit supply chain” may offer opportunities to utilize additional cost-saving, environmentally friendly options; for example, an individually plastic-wrapped Dermablade vs a bulk-packaged blade for shave biopsies has a higher cost and worse environmental impact. A single gauze often is sufficient for shave biopsies, but many practices open a plastic container of bulk gauze, much of which results in waste that too often is inappropriately disposed of as regulated medical waste despite not being saturated in blood/body fluids.
8. Educate on the effects of climate change. Dermatologists and other physicians have the unique opportunity to teach members of their community every day through patient care. Physicians are trusted messengers, and appropriately counseling patients regarding the risks of climate change and its effects on their dermatologic health is in line with both American Medical Association and American College of Physicians guidelines.3,4 For instance, patients with Lyme disease in Canada or Maine were unheard of a few decades ago, but now they are common; flares of atopic dermatitis in regions adjacent to recent wildfires may be attributable to harmful particulate matter resulting from fossil-fueled climate change and record droughts. Educating medical trainees on the impacts of climate change is just as vital, as it is a topic that often is neglected in medical school and residency curricula.33
9. Install water-efficient toilets and faucets. Anthropogenic climate change has been shown to increase the duration and intensity of droughts throughout the world.34 Much of the western United States also is experiencing record droughts. One way in which dermatology practices can work to combat droughts is through the use of water-conserving toilets, faucets, and urinals. Using water fixtures with the US Environmental Protection Agency’s WaterSense label is a convenient way to do so. The WaterSense label helps identify water fixtures certified to use at least 20% less water as well as save energy and decrease water costs.
10. Advocate through local and national organizations. There are numerous ways in which dermatologists can advocate for action against climate change. Joining professional organizations focused on addressing the climate crisis can help you connect with fellow dermatologists and physicians. The Expert Resource Group on Climate Change and Environmental Issues affiliated with the American Academy of Dermatology (AAD) is one such organization with many opportunities to raise awareness within the field of dermatology. The AAD recently joined the Medical Society Consortium on Climate and Health, an organization providing opportunities for policy and media outreach as well as research on climate change. Advocacy also can mean joining your local chapter of Physicians for Social Responsibility or encouraging divestment from fossil fuel companies within your institution. Voicing support for climate change–focused lectures at events such as grand rounds and society meetings at the local, regional, and state-wide levels can help raise awareness. As the dermatologic effects of climate change grow, being knowledgeable of the views of future leaders in our specialty and country on this issue will become increasingly important.
Final Thoughts
In addition to the climate-friendly decisions one can make as a dermatologist, there are many personal lifestyle choices to consider. Small dietary changes such as limiting consumption of beef and minimizing food waste can have large downstream effects. Opting for transportation via train and limiting air travel are both impactful decisions in reducing CO2 emissions. Similarly, switching to an electric vehicle or vehicle with minimal emissions can work to reduce greenhouse gas accumulation. For additional resources, note the AAD has partnered with My Green Doctor, a nonprofit service for health care practices that includes practical cost-saving suggestions to support sustainability in physician practices.
A recent joint publication in more than 200 medical journals described climate change as the greatest threat to global public health.35 Climate change is having devastating effects on dermatologic health and will only continue to do so if not addressed now. Dermatologists have the opportunity to join with our colleagues in the house of medicine and to take action to fight climate change and mitigate the health impacts on our patients, the population, and future generations.
- Santer BD, Bonfils CJW, Fu Q, et al. Celebrating the anniversary of three key events in climate change science. Nat Clim Chang. 2019;9:180-182.
- Lynas M, Houlton BZ, Perry S. Greater than 99% consensus on human caused climate change in the peer-reviewed scientific literature. Environ Res Lett. 2021;16:114005.
- Crowley RA; Health and Public Policy Committee of the American College of Physicians. Climate change and health: a position paper of the American College of Physicians [published online April 19, 2016]. Ann Intern Med. 2016;164:608-610. doi:10.7326/M15-2766
- Global climate change and human health H-135.398. American Medical Association website. Updated 2019. Accessed July 13, 2022. https://policysearch.ama-assn.org/policyfinder/detail/climate%20change?uri=%2FAMADoc%2FHOD.xml-0-309.xml
- Mieczkowska K, Stringer T, Barbieri JS, et al. Surveying the attitudes of dermatologists regarding climate change. Br J Dermatol. 2022;186:748-750.
- Eckelman MJ, Sherman J. Environmental impacts of the U.S. health care system and effects on public health. PLoS One. 2016;11:e0157014. doi:10.1371/journal.pone.0157014
- Karliner J, Slotterback S, Boyd R, et al. Health care’s climate footprint: how the health sector contributes to the global climate crisis and opportunities for action. Health Care Without Harm website. Published September 2019. Accessed July 13, 2022. https://noharm-global.org/sites/default/files/documents-files/5961/HealthCaresClimateFootprint_090619.pdf
- Pichler PP, Jaccard IS, Weisz U, et al. International comparison of health care carbon footprints. Environ Res Lett. 2019;14:064004.
- Solomon CG, LaRocque RC. Climate change—a health emergency. N Engl J Med. 2019;380:209-211. doi:10.1056/NEJMp1817067
- IPCC, 2021: Summary for Policymakers. In: Masson-Delmotte V, Zhai P, Pirani A, et al, eds. Climate Change 2021: The Physical Science Basis. Contribution of Working Group I to the Sixth Assessment Report of the Intergovernmental Panel on Climate Change. Cambridge University Press; 2021:3-32.
- Dzau VJ, Levine R, Barrett G, et al. Decarbonizing the U.S. Health Sector—a call to action [published online October 13, 2021]. N Engl J Med. 2021;385:2117-2119. doi:10.1056/NEJMp2115675
- Silva GS, Rosenbach M. Climate change and dermatology: an introduction to a special topic, for this special issue. Int J Womens Dermatol 2021;7:3-7.
- Coates SJ, Norton SA. The effects of climate change on infectious diseases with cutaneous manifestations. Int J Womens Dermatol. 2021;7:8-16. doi:10.1016/j.ijwd.2020.07.005
- Andersen LK, Davis MD. Climate change and the epidemiology of selected tick-borne and mosquito-borne diseases: update from the International Society of Dermatology Climate Change Task Force [published online October 1, 2016]. Int J Dermatol. 2017;56:252-259. doi:10.1111/ijd.13438
- Fadadu RP, Grimes B, Jewell NP, et al. Association of wildfire air pollution and health care use for atopic dermatitis and itch. JAMA Dermatol. 2021;157:658-666. doi:10.1001/jamadermatol.2021.0179
- Bellinato F, Adami G, Vaienti S, et al. Association between short-term exposure to environmental air pollution and psoriasis flare. JAMA Dermatol. 2022;158:375-381. doi:10.1001/jamadermatol.2021.6019
- Krutmann J, Bouloc A, Sore G, et al. The skin aging exposome [published online September 28, 2016]. J Dermatol Sci. 2017;85:152-161.
- Parker ER. The influence of climate change on skin cancer incidence—a review of the evidence. Int J Womens Dermatol. 2020;7:17-27. doi:10.1016/j.ijwd.2020.07.003
- Eckelman MJ, Huang K, Lagasse R, et al. Health care pollution and public health damage in the United States: an update. Health Aff (Millwood). 2020;39:2071-2079.
- Sheppy M, Pless S, Kung F. Healthcare energy end-use monitoring. US Department of Energy website. Published August 2014. Accessed July 13, 2022. https://www.energy.gov/sites/prod/files/2014/09/f18/61064.pdf
- Feldman D, Ramasamy V, Fu R, et al. U.S. solar photovoltaic system and energy storage cost benchmark: Q1 2020. Published January 2021. Accessed July 7, 2022. https://www.nrel.gov/docs/fy21osti/77324.pdf
- 22. Apostoleris H, Sgouridis S, Stefancich M, et al. Utility solar prices will continue to drop all over the world even without subsidies. Nat Energy. 2019;4:833-834.
- Prasanna PM, Siegel E, Kunce A. Greening radiology. J Am Coll Radiol. 2011;8:780-784. doi:10.1016/j.jacr.2011.07.017
- Bawaneh K, Nezami FG, Rasheduzzaman MD, et al. Energy consumption analysis and characterization of healthcare facilities in the United States. Energies. 2019;12:1-20. doi:10.3390/en12193775
- Blum S, Buckland M, Sack TL, et al. Greening the office: saving resources, saving money, and educating our patients [published online July 4, 2020]. Int J Womens Dermatol. 2020;7:112-116.
- Maintaining your air conditioner. US Department of Energy website. Accessed July 13, 2022. https://www.energy.gov/energysaver/maintaining-your-air-conditioner
- Choma EF, Evans JS, Hammitt JK, et al. Assessing the health impacts of electric vehicles through air pollution in the United States [published online August 25, 2020]. Environ Int. 2020;144:106015.
- Windfeld ES, Brooks MS. Medical waste management—a review [published online August 22, 2015]. J Environ Manage. 2015;1;163:98-108. doi:10.1016/j.jenvman.2015.08.013
- Fathy R, Nelson CA, Barbieri JS. Combating climate change in the clinic: cost-effective strategies to decrease the carbon footprint of outpatient dermatologic practice. Int J Womens Dermatol. 2020;7:107-111.
- Pulsipher KJ, Presley CL, Rundle CW, et al. Teledermatology application use in the COVID-19 era. Dermatol Online J. 2020;26:13030/qt1fs0m0tp.
- O’Connell G, O’Connor C, Murphy M. Every cloud has a silver lining: the environmental benefit of teledermatology during the COVID-19 pandemic [published online July 9, 2021]. Clin Exp Dermatol. 2021;46:1589-1590. doi:10.1111/ced.14795
- Vozzola E, Overcash M, Griffing E. Environmental considerations in the selection of isolation gowns: a life cycle assessment of reusable and disposable alternatives [published online April 11, 2018]. Am J Infect Control. 2018;46:881-886. doi:10.1016/j.ajic.2018.02.002
- Rabin BM, Laney EB, Philipsborn RP. The unique role of medical students in catalyzing climate change education [published online October 14, 2020]. J Med Educ Curric Dev. doi:10.1177/2382120520957653
- Chiang F, Mazdiyasni O, AghaKouchak A. Evidence of anthropogenic impacts on global drought frequency, duration, and intensity [published online May 12, 2021]. Nat Commun. 2021;12:2754. doi:10.1038/s41467-021-22314-w
- Atwoli L, Baqui AH, Benfield T, et al. Call for emergency action to limit global temperature increases, restore biodiversity, and protect health [published online September 5, 2021]. N Engl J Med. 2021;385:1134-1137. doi:10.1056/NEJMe2113200

White House declares monkeypox a public health emergency
There have been more than 6,600 reported cases of the disease in the United States, up from less than 5,000 cases reported last week.
“This public health emergency will allow us to explore additional strategies to get vaccines and treatments more quickly out in the affected communities. And it will allow us to get more data from jurisdictions so we can effectively track and attack this outbreak,” Robert Fenton, who was named as the national monkeypox response coordinator this week, said at a news briefing Aug. 4.
Those who catch the virus usually have fever-like symptoms, followed by red lesions on the body that can raise and develop pus. Those at highest risk of monkeypox are gay and bisexual men, as well as men who have sex with other men. There are between 1.6 million and 1.7 million Americans in this high-risk group, Health and Human Services Secretary Xavier Becerra said at the briefing.
The Jynneos vaccine is being distributed to protect against monkeypox and can prevent severe symptoms. It’s mostly going to those with the greatest risk of catching the virus.
Last week, the Biden administration made over 1.1 million doses of the Jynneos vaccine available – of which over 600,000 doses have already been distributed across the country – and have secured over 6.9 million Jynneos doses altogether.
Around 786,000 vaccines have already been allocated, and the first doses were shipped this week. States will be able to order more doses beginning Aug. 15. If a state has used 90% or more of its vaccine supply, it will be eligible to order more doses before Aug. 15, according to Dawn O’Connell, JD, assistant secretary for preparedness and response at the U.S. Department of Health and Human Services.
An additional 150,000 doses will be added to the national stockpile in September, with more doses to come later this year, Ms. O’Connell says.
The administration is also stressing the importance of monkeypox testing and says it can now distribute 80,000 monkeypox tests per week.
An antiviral drug – known as TPOXX – is also available to treat severe cases of monkeypox. Around 1,700,000 doses are available in the Strategic National Stockpile, public health officials say.
“We are prepared to take our response to the next level, and we urge every American to take this seriously and to take responsibility to help us tackle this virus,” Secretary Becerra told reporters.
The White House says it will continue reaching out to doctors, public health partners, LGBTQ advocates, and other impacted communities.
“The public health emergency further raises awareness about monkeypox, which will encourage clinicians to test for it,” Rochelle Walensky, MD, director of the Centers for Disease Control and Prevention, said at the briefing.
This week, President Joe Biden appointed a new White House monkeypox response team. Besides Mr. Fenton as the response coordinator, Demetre Daskalakis, MD, will serve as the White House national monkeypox response deputy coordinator. He is the director of the CDC’s Division of HIV Prevention.
“This virus is moving fast. This is a unique outbreak that is spreading faster than previous outbreaks,” Mr. Fenton told reporters Aug. 4. “That’s why the president asked me to explore everything we can do to combat monkeypox and protect communities at risk.”
This article was updated 8/4/22.
Medical assistants identify strategies and barriers to clinic efficiency
ABSTRACT
Background: Medical assistant (MA) roles have expanded rapidly as primary care has evolved and MAs take on new patient care duties. Research that looks at the MA experience and factors that enhance or reduce efficiency among MAs is limited.
Methods: We surveyed all MAs working in 6 clinics run by a large academic family medicine department in Ann Arbor, Michigan. MAs deemed by peers as “most efficient” were selected for follow-up interviews. We evaluated personal strategies for efficiency, barriers to efficient care, impact of physician actions on efficiency, and satisfaction.
Results: A total of 75/86 MAs (87%) responded to at least some survey questions and 61/86 (71%) completed the full survey. We interviewed 18 MAs face to face. Most saw their role as essential to clinic functioning and viewed health care as a personal calling. MAs identified common strategies to improve efficiency and described the MA role to orchestrate the flow of the clinic day. Staff recognized differing priorities of patients, staff, and physicians and articulated frustrations with hierarchy and competing priorities as well as behaviors that impeded clinic efficiency. Respondents emphasized the importance of feeling valued by others on their team.
Conclusions: With the evolving demands made on MAs’ time, it is critical to understand how the most effective staff members manage their role and highlight the strategies they employ to provide efficient clinical care. Understanding factors that increase or decrease MA job satisfaction can help identify high-efficiency practices and promote a clinic culture that values and supports all staff.
As primary care continues to evolve into more team-based practice, the role of the medical assistant (MA) has rapidly transformed.1 Staff may assist with patient management, documentation in the electronic medical record, order entry, pre-visit planning, and fulfillment of quality metrics, particularly in a Primary Care Medical Home (PCMH).2 From 2012 through 2014, MA job postings per graduate increased from 1.3 to 2.3, suggesting twice as many job postings as graduates.3 As the demand for experienced MAs increases, the ability to recruit and retain high-performing staff members will be critical.
MAs are referenced in medical literature as early as the 1800s.4 The American Association of Medical Assistants was founded in 1956, which led to educational standardization and certifications.5 Despite the important role that MAs have long played in the proper functioning of a medical clinic—and the knowledge that team configurations impact a clinic’s efficiency and quality6,7—few investigations have sought out the MA’s perspective.8,9 Given the increasing clinical demands placed on all members of the primary care team (and the burnout that often results), it seems that MA insights into clinic efficiency could be valuable.
Continue to: Methods...
METHODS
This cross-sectional study was conducted from February to April 2019 at a large academic institution with 6 regional ambulatory care family medicine clinics, each one with 11,000 to 18,000 patient visits annually. Faculty work at all 6 clinics and residents at 2 of them. All MAs are hired, paid, and managed by a central administrative department rather than by the family medicine department. The family medicine clinics are currently PCMH certified, with a mix of fee-for-service and capitated reimbursement.
We developed and piloted a voluntary, anonymous 39-question (29 closed-ended and 10 brief open-ended) online Qualtrics survey, which we distributed via an email link to all the MAs in the department. The survey included clinic site, years as an MA, perceptions of the clinic environment, perception of teamwork at their site, identification of efficient practices, and feedback for physicians to improve efficiency and flow. Most questions were Likert-style with 5 choices ranging from “strongly agree” to “strongly disagree” or short answer. Age and gender were omitted to protect confidentiality, as most MAs in the department are female. Participants could opt to enter in a drawing for three $25 gift cards. The survey was reviewed by the University of Michigan Institutional Review Board and deemed exempt.
We asked MAs to nominate peers in their clinic who were “especially efficient and do their jobs well—people that others can learn from.” The staff members who were nominated most frequently by their peers were invited to share additional perspectives via a 10- to 30-minute semi-structured interview with the first author. Interviews covered highly efficient practices, barriers and facilitators to efficient care, and physician behaviors that impaired efficiency. We interviewed a minimum of 2 MAs per clinic and increased the number of interviews through snowball sampling, as needed, to reach data saturation (eg, the point at which we were no longer hearing new content). MAs were assured that all comments would be anonymized. There was no monetary incentive for the interviews. The interviewer had previously met only 3 of the 18 MAs interviewed.
Analysis. Summary statistics were calculated for quantitative data. To compare subgroups (such as individual clinics), a chi-square test was used. In cases when there were small cell sizes (< 5 subjects), we used the Fisher’s Exact test. Qualitative data was collected with real-time typewritten notes during the interviews to capture ideas and verbatim quotes when possible. We also included open-ended comments shared on the Qualtrics survey. Data were organized by theme using a deductive coding approach. Both authors reviewed and discussed observations, and coding was conducted by the first author. Reporting followed the STROBE Statement checklist for cross-sectional studies.10 Results were shared with MAs, supervisory staff, and physicians, which allowed for feedback and comments and served as “member-checking.” MAs reported that the data reflected their lived experiences.
Continue to: RESULTS...
RESULTS
Surveys were distributed to all 86 MAs working in family medicine clinics. A total of 75 (87%) responded to at least some questions (typically just demographics). We used those who completed the full survey (n = 61; 71%) for data analysis. Eighteen MAs participated in face-to-face interviews. Among respondents, 35 (47%) had worked at least 10 years as an MA and 21 (28%) had worked at least a decade in the family medicine department.
Perception of role
All respondents (n = 61; 100%) somewhat or strongly agreed that the MA role was “very important to keep the clinic functioning” and 58 (95%) reported that working in health care was “a calling” for them. Only 7 (11%) agreed that family medicine was an easier environment for MAs compared to a specialty clinic; 30 (49%) disagreed with this. Among respondents, 32 (53%) strongly or somewhat agreed that their work was very stressful and just half (n = 28; 46%) agreed there were adequate MA staff at their clinic.
Efficiency and competing priorities
MAs described important work values that increased their efficiency. These included clinic culture (good communication and strong teamwork), as well as individual strategies such as multitasking, limiting patient conversations, and doing tasks in a consistent way to improve accuracy. (See TABLE 1.) They identified ways physicians bolster or hurt efficiency and ways in which the relationship between the physician and the MA shapes the MA’s perception of their value in clinic.
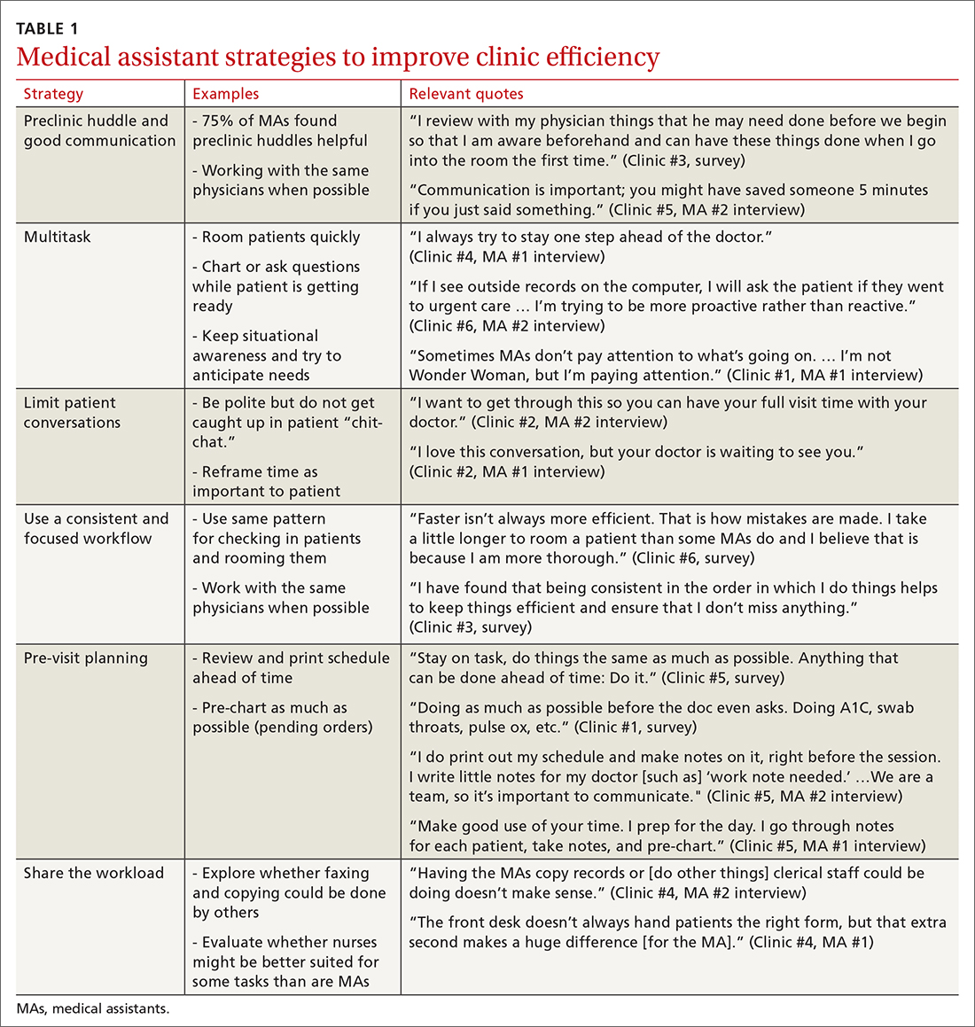
Communication was emphasized as critical for efficient care, and MAs encouraged the use of preclinic huddles and communication as priorities. Seventy-five percent of MAs reported preclinic huddles to plan for patient care were helpful, but only half said huddles took place “always” or “most of the time.” Many described reviewing the schedule and completing tasks ahead of patient arrival as critical to efficiency.
Participants described the tension between their identified role of orchestrating clinic flow and responding to directives by others that disrupted the flow. Several MAs found it challenging when physicians agreed to see very late patients and felt frustrated when decisions that changed the flow were made by the physician or front desk staff without including the MA. MAs were also able to articulate how they managed competing priorities within the clinic, such as when a patient- or physician-driven need to extend appointments was at odds with maintaining a timely schedule. They were eager to share personal tips for time management and prided themselves on careful and accurate performance and skills they had learned on the job. MAs also described how efficiency could be adversely affected by the behaviors or attitudes of physicians. (See TABLE 2.)
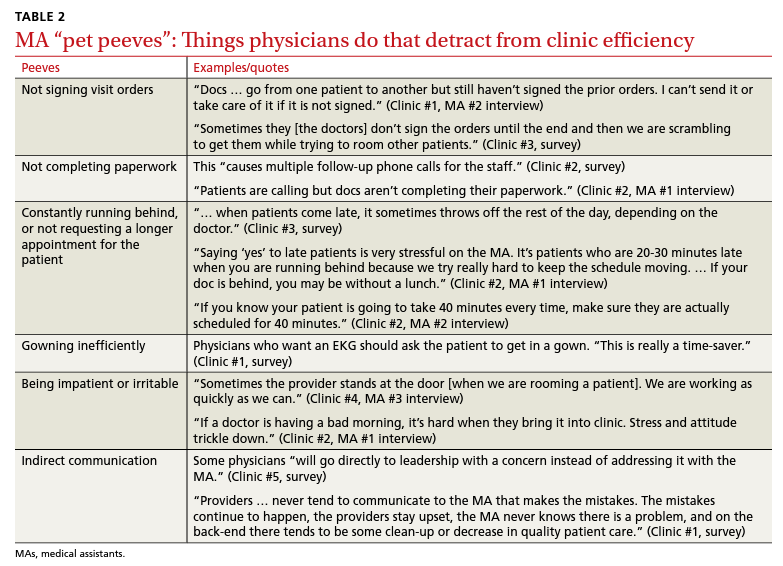
Continue to: Clinic environment...
Clinic environment
Thirty-six MAs (59%) reported that other MAs on their team were willing to help them out in clinic “a great deal” or “a lot” of the time, by helping to room a patient, acting as a chaperone for an exam, or doing a point-of-care lab. This sense of support varied across clinics (38% to 91% reported good support), suggesting that cultures vary by site. Some MAs expressed frustration at peers they saw as resistant to helping, exemplified by this verbatim quote from an interview:
“Some don’t want to help out. They may sigh. It’s how they react—you just know.” (Clinic #1, MA #2 interview)
Efficient MAs stressed the need for situational awareness to recognize when co-workers need help:
“[Peers often] are not aware that another MA is drowning. There’s 5 people who could have done that, and here I am running around and nobody budged.” (Clinic #5, MA #2 interview)
A minority of staff used the open-ended survey sections to describe clinic hierarchy. When asked about “pet peeves,” a few advised that physicians should not “talk down” to staff and should try to teach rather than criticize. Another asked that physicians not “bark orders” or have “low gratitude” for staff work. MAs found micromanaging stressful—particularly when the physician prompted the MA about patient arrivals:
“[I don’t like] when providers will make a comment about a patient arriving when you already know this information. You then rush to put [the] patient in [a] room, then [the] provider ends up making [the] patient wait an extensive amount of time. I’m perfectly capable of knowing when a patient arrives.” (Clinic #6, survey)
MAs did not like physicians “talking bad about us” or blaming the MA if the clinic is running behind.
Despite these concerns, most MAs reported feeling appreciated for the job they do. Only 10 (16%) reported that the people they work with rarely say “thank you,” and 2 (3%) stated they were not well supported by the physicians in clinic. Most (n = 38; 62%) strongly agreed or agreed that they felt part of the team and that their opinions matter. In the interviews, many expanded on this idea:
“I really feel like I’m valued, so I want to do everything I can to make [my doctor’s] day go better. If you want a good clinic, the best thing a doc can do is make the MA feel valued.” (Clinic #1, MA #1 interview)
Continue to: DISCUSSION...
DISCUSSION
Participants described their role much as an orchestra director, with MAs as the key to clinic flow and timeliness.9 Respondents articulated multiple common strategies used to increase their own efficiency and clinic flow; these may be considered best practices and incorporated as part of the basic training. Most MAs reported their day-to-day jobs were stressful and believed this was underrecognized, so efficiency strategies are critical. With staff completing multiple time-sensitive tasks during clinic, consistent co-worker support is crucial and may impact efficiency.8 Proper training of managers to provide that support and ensure equitable workloads may be one strategy to ensure that staff members feel the workplace is fair and collegial.
Several comments reflected the power differential within medical offices. One study reported that MAs and physicians “occupy roles at opposite ends of social and occupational hierarchies.”11 It’s important for physicians to be cognizant of these patterns and clinic culture, as reducing a hierarchy-based environment will be appreciated by MAs.9 Prior research has found that MAs have higher perceptions of their own competence than do the physicians working with them.12 If there is a fundamental lack of trust between the 2 groups, this will undoubtedly hinder team-building. Attention to this issue is key to a more favorable work environment.
Almost all respondents reported health care was a “calling,” which mirrors physician research that suggests seeing work as a “calling” is protective against burnout.13,14 Open-ended comments indicated great pride in contributions, and most staff members felt appreciated by their teams. Many described the working relationships with physicians as critical to their satisfaction at work and indicated that strong partnerships motivated them to do their best to make the physician’s day easier. Staff job satisfaction is linked to improved quality of care, so treating staff well contributes to high-value care for patients.15 We also uncovered some MA “pet peeves” that hinder efficiency and could be shared with physicians to emphasize the importance of patience and civility.
One barrier to expansion of MA roles within PCMH practices is the limited pay and career ladder for MAs who adopt new job responsibilities that require advanced skills or training.1,2 The mean MA salary at our institution ($37,372) is higher than in our state overall ($33,760), which may impact satisfaction.16 In addition, 93% of MAs are women; thus, they may continue to struggle more with lower pay than do workers in male- dominated professions.17,18 Expected job growth from 2018-2028 is predicted at 23%, which may help to boost salaries. 19 Prior studies describe the lack of a job ladder or promotion opportunities as a challenge1,20; this was not formally assessed in our study.
MAs see work in family medicine as much harder than it is in other specialty clinics. Being trusted with more responsibility, greater autonomy,21-23 and expanded patient care roles can boost MA self-efficacy, which can reduce burnout for both physicians and MAs. 8,24 However, new responsibilities should include appropriate training, support, and compensation, and match staff interests.7
Study limitations. The study was limited to 6 clinics in 1 department at a large academic medical center. Interviewed participants were selected by convenience and snowball sampling and thus, the results cannot be generalized to the population of MAs as a whole. As the initial interview goal was simply to gather efficiency tips, the project was not designed to be formal qualitative research. However, the discussions built on open-ended comments from the written survey helped contextualize our quantitative findings about efficiency. Notes were documented in real time by a single interviewer with rapid typing skills, which allowed capture of quotes verbatim. Subsequent studies would benefit from more formal qualitative research methods (recording and transcribing interviews, multiple coders to reduce risk of bias, and more complex thematic analysis).
Our research demonstrated how MAs perceive their roles in primary care and the facilitators and barriers to high efficiency in the workplace, which begins to fill an important knowledge gap in primary care. Disseminating practices that staff members themselves have identified as effective, and being attentive to how staff members are treated, may increase individual efficiency while improving staff retention and satisfaction.
CORRESPONDENCE Katherine J. Gold, MD, MSW, MS, Department of Family Medicine and Department of Obstetrics and Gynecology, University of Michigan, 1018 Fuller Street, Ann Arbor, MI 48104-1213; ktgold@umich.edu
- Chapman SA, Blash LK. New roles for medical assistants in innovative primary care practices. Health Serv Res. 2017;52(suppl 1):383-406.
- Ferrante JM, Shaw EK, Bayly JE, et al. Barriers and facilitators to expanding roles of medical assistants in patient-centered medical homes (PCMHs). J Am Board Fam Med. 2018;31:226-235.
- Atkins B. The outlook for medical assisting in 2016 and beyond. Accessed January 27, 2022. www.medicalassistantdegrees.net/ articles/medical-assisting-trends/
- Unqualified medical “assistants.” Hospital (Lond 1886). 1897;23:163-164.
- Ameritech College of Healthcare. The origins of the AAMA. Accessed January 27, 2022. www.ameritech.edu/blog/medicalassisting-history/
- Dai M, Willard-Grace R, Knox M, et al. Team configurations, efficiency, and family physician burnout. J Am Board Fam Med. 2020;33:368-377.
- Harper PG, Van Riper K, Ramer T, et al. Team-based care: an expanded medical assistant role—enhanced rooming and visit assistance. J Interprof Care. 2018:1-7.
- Sheridan B, Chien AT, Peters AS, et al. Team-based primary care: the medical assistant perspective. Health Care Manage Rev. 2018;43:115-125.
- Tache S, Hill-Sakurai L. Medical assistants: the invisible “glue” of primary health care practices in the United States? J Health Organ Manag. 2010;24:288-305.
- STROBE checklist for cohort, case-control, and cross-sectional studies. Accessed January 27, 2022. www.strobe-statement.org/ fileadmin/Strobe/uploads/checklists/STROBE_checklist_v4_ combined.pdf
- Gray CP, Harrison MI, Hung D. Medical assistants as flow managers in primary care: challenges and recommendations. J Healthc Manag. 2016;61:181-191.
- Elder NC, Jacobson CJ, Bolon SK, et al. Patterns of relating between physicians and medical assistants in small family medicine offices. Ann Fam Med. 2014;12:150-157.
- Jager AJ, Tutty MA, Kao AC. Association between physician burnout and identification with medicine as a calling. Mayo Clinic Proc. 2017;92:415-422.
- Yoon JD, Daley BM, Curlin FA. The association between a sense of calling and physician well-being: a national study of primary care physicians and psychiatrists. Acad Psychiatry. 2017;41:167-173.
- Mohr DC, Young GJ, Meterko M, et al. Job satisfaction of primary care team members and quality of care. Am J Med Qual. 2011;26:18-25.
- US Bureau of Labor Statistics. Occupational employment and wage statistics. Accessed January 27, 2022. https://www.bls.gov/ oes/current/oes319092.htm
- Chapman SA, Marks A, Dower C. Positioning medical assistants for a greater role in the era of health reform. Acad Med. 2015;90:1347-1352.
- Mandel H. The role of occupational attributes in gender earnings inequality, 1970-2010. Soc Sci Res. 2016;55:122-138.
- US Bureau of Labor Statistics. Occupational outlook handbook: medical assistants. Accessed January 27, 2022. www.bls.gov/ooh/ healthcare/medical-assistants.htm
- Skillman SM, Dahal A, Frogner BK, et al. Frontline workers’ career pathways: a detailed look at Washington state’s medical assistant workforce. Med Care Res Rev. 2018:1077558718812950.
- Morse G, Salyers MP, Rollins AL, et al. Burnout in mental health services: a review of the problem and its remediation. Adm Policy Ment Health. 2012;39:341-352.
- Dubois CA, Bentein K, Ben Mansour JB, et al. Why some employees adopt or resist reorganization of work practices in health care: associations between perceived loss of resources, burnout, and attitudes to change. Int J Environ Res Pub Health. 2014;11: 187-201.
- Aronsson G, Theorell T, Grape T, et al. A systematic review including meta-analysis of work environment and burnout symptoms. BMC Public Health. 2017;17:264.
- O’Malley AS, Gourevitch R, Draper K, et al. Overcoming challenges to teamwork in patient-centered medical homes: a qualitative study. J Gen Intern Med. 2015;30:183-192.
ABSTRACT
Background: Medical assistant (MA) roles have expanded rapidly as primary care has evolved and MAs take on new patient care duties. Research that looks at the MA experience and factors that enhance or reduce efficiency among MAs is limited.
Methods: We surveyed all MAs working in 6 clinics run by a large academic family medicine department in Ann Arbor, Michigan. MAs deemed by peers as “most efficient” were selected for follow-up interviews. We evaluated personal strategies for efficiency, barriers to efficient care, impact of physician actions on efficiency, and satisfaction.
Results: A total of 75/86 MAs (87%) responded to at least some survey questions and 61/86 (71%) completed the full survey. We interviewed 18 MAs face to face. Most saw their role as essential to clinic functioning and viewed health care as a personal calling. MAs identified common strategies to improve efficiency and described the MA role to orchestrate the flow of the clinic day. Staff recognized differing priorities of patients, staff, and physicians and articulated frustrations with hierarchy and competing priorities as well as behaviors that impeded clinic efficiency. Respondents emphasized the importance of feeling valued by others on their team.
Conclusions: With the evolving demands made on MAs’ time, it is critical to understand how the most effective staff members manage their role and highlight the strategies they employ to provide efficient clinical care. Understanding factors that increase or decrease MA job satisfaction can help identify high-efficiency practices and promote a clinic culture that values and supports all staff.
As primary care continues to evolve into more team-based practice, the role of the medical assistant (MA) has rapidly transformed.1 Staff may assist with patient management, documentation in the electronic medical record, order entry, pre-visit planning, and fulfillment of quality metrics, particularly in a Primary Care Medical Home (PCMH).2 From 2012 through 2014, MA job postings per graduate increased from 1.3 to 2.3, suggesting twice as many job postings as graduates.3 As the demand for experienced MAs increases, the ability to recruit and retain high-performing staff members will be critical.
MAs are referenced in medical literature as early as the 1800s.4 The American Association of Medical Assistants was founded in 1956, which led to educational standardization and certifications.5 Despite the important role that MAs have long played in the proper functioning of a medical clinic—and the knowledge that team configurations impact a clinic’s efficiency and quality6,7—few investigations have sought out the MA’s perspective.8,9 Given the increasing clinical demands placed on all members of the primary care team (and the burnout that often results), it seems that MA insights into clinic efficiency could be valuable.
Continue to: Methods...
METHODS
This cross-sectional study was conducted from February to April 2019 at a large academic institution with 6 regional ambulatory care family medicine clinics, each one with 11,000 to 18,000 patient visits annually. Faculty work at all 6 clinics and residents at 2 of them. All MAs are hired, paid, and managed by a central administrative department rather than by the family medicine department. The family medicine clinics are currently PCMH certified, with a mix of fee-for-service and capitated reimbursement.
We developed and piloted a voluntary, anonymous 39-question (29 closed-ended and 10 brief open-ended) online Qualtrics survey, which we distributed via an email link to all the MAs in the department. The survey included clinic site, years as an MA, perceptions of the clinic environment, perception of teamwork at their site, identification of efficient practices, and feedback for physicians to improve efficiency and flow. Most questions were Likert-style with 5 choices ranging from “strongly agree” to “strongly disagree” or short answer. Age and gender were omitted to protect confidentiality, as most MAs in the department are female. Participants could opt to enter in a drawing for three $25 gift cards. The survey was reviewed by the University of Michigan Institutional Review Board and deemed exempt.
We asked MAs to nominate peers in their clinic who were “especially efficient and do their jobs well—people that others can learn from.” The staff members who were nominated most frequently by their peers were invited to share additional perspectives via a 10- to 30-minute semi-structured interview with the first author. Interviews covered highly efficient practices, barriers and facilitators to efficient care, and physician behaviors that impaired efficiency. We interviewed a minimum of 2 MAs per clinic and increased the number of interviews through snowball sampling, as needed, to reach data saturation (eg, the point at which we were no longer hearing new content). MAs were assured that all comments would be anonymized. There was no monetary incentive for the interviews. The interviewer had previously met only 3 of the 18 MAs interviewed.
Analysis. Summary statistics were calculated for quantitative data. To compare subgroups (such as individual clinics), a chi-square test was used. In cases when there were small cell sizes (< 5 subjects), we used the Fisher’s Exact test. Qualitative data was collected with real-time typewritten notes during the interviews to capture ideas and verbatim quotes when possible. We also included open-ended comments shared on the Qualtrics survey. Data were organized by theme using a deductive coding approach. Both authors reviewed and discussed observations, and coding was conducted by the first author. Reporting followed the STROBE Statement checklist for cross-sectional studies.10 Results were shared with MAs, supervisory staff, and physicians, which allowed for feedback and comments and served as “member-checking.” MAs reported that the data reflected their lived experiences.
Continue to: RESULTS...
RESULTS
Surveys were distributed to all 86 MAs working in family medicine clinics. A total of 75 (87%) responded to at least some questions (typically just demographics). We used those who completed the full survey (n = 61; 71%) for data analysis. Eighteen MAs participated in face-to-face interviews. Among respondents, 35 (47%) had worked at least 10 years as an MA and 21 (28%) had worked at least a decade in the family medicine department.
Perception of role
All respondents (n = 61; 100%) somewhat or strongly agreed that the MA role was “very important to keep the clinic functioning” and 58 (95%) reported that working in health care was “a calling” for them. Only 7 (11%) agreed that family medicine was an easier environment for MAs compared to a specialty clinic; 30 (49%) disagreed with this. Among respondents, 32 (53%) strongly or somewhat agreed that their work was very stressful and just half (n = 28; 46%) agreed there were adequate MA staff at their clinic.
Efficiency and competing priorities
MAs described important work values that increased their efficiency. These included clinic culture (good communication and strong teamwork), as well as individual strategies such as multitasking, limiting patient conversations, and doing tasks in a consistent way to improve accuracy. (See TABLE 1.) They identified ways physicians bolster or hurt efficiency and ways in which the relationship between the physician and the MA shapes the MA’s perception of their value in clinic.
Communication was emphasized as critical for efficient care, and MAs encouraged the use of preclinic huddles and communication as priorities. Seventy-five percent of MAs reported preclinic huddles to plan for patient care were helpful, but only half said huddles took place “always” or “most of the time.” Many described reviewing the schedule and completing tasks ahead of patient arrival as critical to efficiency.
Participants described the tension between their identified role of orchestrating clinic flow and responding to directives by others that disrupted the flow. Several MAs found it challenging when physicians agreed to see very late patients and felt frustrated when decisions that changed the flow were made by the physician or front desk staff without including the MA. MAs were also able to articulate how they managed competing priorities within the clinic, such as when a patient- or physician-driven need to extend appointments was at odds with maintaining a timely schedule. They were eager to share personal tips for time management and prided themselves on careful and accurate performance and skills they had learned on the job. MAs also described how efficiency could be adversely affected by the behaviors or attitudes of physicians. (See TABLE 2.)
Continue to: Clinic environment...
Clinic environment
Thirty-six MAs (59%) reported that other MAs on their team were willing to help them out in clinic “a great deal” or “a lot” of the time, by helping to room a patient, acting as a chaperone for an exam, or doing a point-of-care lab. This sense of support varied across clinics (38% to 91% reported good support), suggesting that cultures vary by site. Some MAs expressed frustration at peers they saw as resistant to helping, exemplified by this verbatim quote from an interview:
“Some don’t want to help out. They may sigh. It’s how they react—you just know.” (Clinic #1, MA #2 interview)
Efficient MAs stressed the need for situational awareness to recognize when co-workers need help:
“[Peers often] are not aware that another MA is drowning. There’s 5 people who could have done that, and here I am running around and nobody budged.” (Clinic #5, MA #2 interview)
A minority of staff used the open-ended survey sections to describe clinic hierarchy. When asked about “pet peeves,” a few advised that physicians should not “talk down” to staff and should try to teach rather than criticize. Another asked that physicians not “bark orders” or have “low gratitude” for staff work. MAs found micromanaging stressful—particularly when the physician prompted the MA about patient arrivals:
“[I don’t like] when providers will make a comment about a patient arriving when you already know this information. You then rush to put [the] patient in [a] room, then [the] provider ends up making [the] patient wait an extensive amount of time. I’m perfectly capable of knowing when a patient arrives.” (Clinic #6, survey)
MAs did not like physicians “talking bad about us” or blaming the MA if the clinic is running behind.
Despite these concerns, most MAs reported feeling appreciated for the job they do. Only 10 (16%) reported that the people they work with rarely say “thank you,” and 2 (3%) stated they were not well supported by the physicians in clinic. Most (n = 38; 62%) strongly agreed or agreed that they felt part of the team and that their opinions matter. In the interviews, many expanded on this idea:
“I really feel like I’m valued, so I want to do everything I can to make [my doctor’s] day go better. If you want a good clinic, the best thing a doc can do is make the MA feel valued.” (Clinic #1, MA #1 interview)
Continue to: DISCUSSION...
DISCUSSION
Participants described their role much as an orchestra director, with MAs as the key to clinic flow and timeliness.9 Respondents articulated multiple common strategies used to increase their own efficiency and clinic flow; these may be considered best practices and incorporated as part of the basic training. Most MAs reported their day-to-day jobs were stressful and believed this was underrecognized, so efficiency strategies are critical. With staff completing multiple time-sensitive tasks during clinic, consistent co-worker support is crucial and may impact efficiency.8 Proper training of managers to provide that support and ensure equitable workloads may be one strategy to ensure that staff members feel the workplace is fair and collegial.
Several comments reflected the power differential within medical offices. One study reported that MAs and physicians “occupy roles at opposite ends of social and occupational hierarchies.”11 It’s important for physicians to be cognizant of these patterns and clinic culture, as reducing a hierarchy-based environment will be appreciated by MAs.9 Prior research has found that MAs have higher perceptions of their own competence than do the physicians working with them.12 If there is a fundamental lack of trust between the 2 groups, this will undoubtedly hinder team-building. Attention to this issue is key to a more favorable work environment.
Almost all respondents reported health care was a “calling,” which mirrors physician research that suggests seeing work as a “calling” is protective against burnout.13,14 Open-ended comments indicated great pride in contributions, and most staff members felt appreciated by their teams. Many described the working relationships with physicians as critical to their satisfaction at work and indicated that strong partnerships motivated them to do their best to make the physician’s day easier. Staff job satisfaction is linked to improved quality of care, so treating staff well contributes to high-value care for patients.15 We also uncovered some MA “pet peeves” that hinder efficiency and could be shared with physicians to emphasize the importance of patience and civility.
One barrier to expansion of MA roles within PCMH practices is the limited pay and career ladder for MAs who adopt new job responsibilities that require advanced skills or training.1,2 The mean MA salary at our institution ($37,372) is higher than in our state overall ($33,760), which may impact satisfaction.16 In addition, 93% of MAs are women; thus, they may continue to struggle more with lower pay than do workers in male- dominated professions.17,18 Expected job growth from 2018-2028 is predicted at 23%, which may help to boost salaries. 19 Prior studies describe the lack of a job ladder or promotion opportunities as a challenge1,20; this was not formally assessed in our study.
MAs see work in family medicine as much harder than it is in other specialty clinics. Being trusted with more responsibility, greater autonomy,21-23 and expanded patient care roles can boost MA self-efficacy, which can reduce burnout for both physicians and MAs. 8,24 However, new responsibilities should include appropriate training, support, and compensation, and match staff interests.7
Study limitations. The study was limited to 6 clinics in 1 department at a large academic medical center. Interviewed participants were selected by convenience and snowball sampling and thus, the results cannot be generalized to the population of MAs as a whole. As the initial interview goal was simply to gather efficiency tips, the project was not designed to be formal qualitative research. However, the discussions built on open-ended comments from the written survey helped contextualize our quantitative findings about efficiency. Notes were documented in real time by a single interviewer with rapid typing skills, which allowed capture of quotes verbatim. Subsequent studies would benefit from more formal qualitative research methods (recording and transcribing interviews, multiple coders to reduce risk of bias, and more complex thematic analysis).
Our research demonstrated how MAs perceive their roles in primary care and the facilitators and barriers to high efficiency in the workplace, which begins to fill an important knowledge gap in primary care. Disseminating practices that staff members themselves have identified as effective, and being attentive to how staff members are treated, may increase individual efficiency while improving staff retention and satisfaction.
CORRESPONDENCE Katherine J. Gold, MD, MSW, MS, Department of Family Medicine and Department of Obstetrics and Gynecology, University of Michigan, 1018 Fuller Street, Ann Arbor, MI 48104-1213; ktgold@umich.edu
- Chapman SA, Blash LK. New roles for medical assistants in innovative primary care practices. Health Serv Res. 2017;52(suppl 1):383-406.
- Ferrante JM, Shaw EK, Bayly JE, et al. Barriers and facilitators to expanding roles of medical assistants in patient-centered medical homes (PCMHs). J Am Board Fam Med. 2018;31:226-235.
- Atkins B. The outlook for medical assisting in 2016 and beyond. Accessed January 27, 2022. www.medicalassistantdegrees.net/ articles/medical-assisting-trends/
- Unqualified medical “assistants.” Hospital (Lond 1886). 1897;23:163-164.
- Ameritech College of Healthcare. The origins of the AAMA. Accessed January 27, 2022. www.ameritech.edu/blog/medicalassisting-history/
- Dai M, Willard-Grace R, Knox M, et al. Team configurations, efficiency, and family physician burnout. J Am Board Fam Med. 2020;33:368-377.
- Harper PG, Van Riper K, Ramer T, et al. Team-based care: an expanded medical assistant role—enhanced rooming and visit assistance. J Interprof Care. 2018:1-7.
- Sheridan B, Chien AT, Peters AS, et al. Team-based primary care: the medical assistant perspective. Health Care Manage Rev. 2018;43:115-125.
- Tache S, Hill-Sakurai L. Medical assistants: the invisible “glue” of primary health care practices in the United States? J Health Organ Manag. 2010;24:288-305.
- STROBE checklist for cohort, case-control, and cross-sectional studies. Accessed January 27, 2022. www.strobe-statement.org/ fileadmin/Strobe/uploads/checklists/STROBE_checklist_v4_ combined.pdf
- Gray CP, Harrison MI, Hung D. Medical assistants as flow managers in primary care: challenges and recommendations. J Healthc Manag. 2016;61:181-191.
- Elder NC, Jacobson CJ, Bolon SK, et al. Patterns of relating between physicians and medical assistants in small family medicine offices. Ann Fam Med. 2014;12:150-157.
- Jager AJ, Tutty MA, Kao AC. Association between physician burnout and identification with medicine as a calling. Mayo Clinic Proc. 2017;92:415-422.
- Yoon JD, Daley BM, Curlin FA. The association between a sense of calling and physician well-being: a national study of primary care physicians and psychiatrists. Acad Psychiatry. 2017;41:167-173.
- Mohr DC, Young GJ, Meterko M, et al. Job satisfaction of primary care team members and quality of care. Am J Med Qual. 2011;26:18-25.
- US Bureau of Labor Statistics. Occupational employment and wage statistics. Accessed January 27, 2022. https://www.bls.gov/ oes/current/oes319092.htm
- Chapman SA, Marks A, Dower C. Positioning medical assistants for a greater role in the era of health reform. Acad Med. 2015;90:1347-1352.
- Mandel H. The role of occupational attributes in gender earnings inequality, 1970-2010. Soc Sci Res. 2016;55:122-138.
- US Bureau of Labor Statistics. Occupational outlook handbook: medical assistants. Accessed January 27, 2022. www.bls.gov/ooh/ healthcare/medical-assistants.htm
- Skillman SM, Dahal A, Frogner BK, et al. Frontline workers’ career pathways: a detailed look at Washington state’s medical assistant workforce. Med Care Res Rev. 2018:1077558718812950.
- Morse G, Salyers MP, Rollins AL, et al. Burnout in mental health services: a review of the problem and its remediation. Adm Policy Ment Health. 2012;39:341-352.
- Dubois CA, Bentein K, Ben Mansour JB, et al. Why some employees adopt or resist reorganization of work practices in health care: associations between perceived loss of resources, burnout, and attitudes to change. Int J Environ Res Pub Health. 2014;11: 187-201.
- Aronsson G, Theorell T, Grape T, et al. A systematic review including meta-analysis of work environment and burnout symptoms. BMC Public Health. 2017;17:264.
- O’Malley AS, Gourevitch R, Draper K, et al. Overcoming challenges to teamwork in patient-centered medical homes: a qualitative study. J Gen Intern Med. 2015;30:183-192.
Author Q&A: Intravenous Immunoglobulin for Treatment of COVID-19 in Select Patients
Dr. George Sakoulas is an infectious diseases clinician at Sharp Memorial Hospital in San Diego and professor of pediatrics at the University of California, San Diego School of Medicine. He was the lead investigator in a study published in the May/June 2022 issue of JCOM that found that, when allocated to the appropriate patient type, intravenous immunoglobulin can reduce hospital costs for COVID-19 care. 1 He joined JCOM’s Editor-in-Chief, Dr. Ebrahim Barkoudah, to discuss the study’s background and highlight its main findings.
The following has been edited for length and clarity.
Dr. Barkoudah Dr. Sakoulas is an investigator and a clinician, bridging both worlds to bring the best evidence to our patients. We’re discussing his new article regarding intravenous immunoglobulin in treating nonventilated COVID-19 patients with moderate-to-severe hypoxia. Dr. Sakoulas, could you please share with our readers the clinical question your study addressed and what your work around COVID-19 management means for clinical practice?
Dr. Sakoulas Thank you. I’m an infectious disease physician. I’ve been treating patients with viral acute respiratory distress syndrome for almost 20 years as an ID doctor. Most of these cases are due to influenza or other viruses. And from time to time, anecdotally and supported by some literature, we’ve been using IVIG, or intravenous immunoglobulin, in some of these cases. And again, I can report anecdotal success with that over the years.
So when COVID emerged in March of 2020, we deployed IVIG in a couple of patients early who were heading downhill. Remember, in March of 2020, we didn’t have the knowledge of steroids helping, patients being ventilated very promptly, and we saw some patients who made a turnaround after treatment with IVIG. We were able to get some support from an industry sponsor and perform and publish a pilot study, enrolling patients early in the pandemic. That study actually showed benefits, which then led the sponsor to fund a phase 3 multicenter clinical trial. Unfortunately, a couple of things happened. First, the trial was designed with the knowledge we had in April of 2020, and again, this is before steroids, before we incorporated proning patients in the ICU, or started ventilating people early. So there were some management changes and evolutions and improvements that happened. And second, the trial was enrolling a very broad repertoire of patients. There were no age limitations, and the trial, ultimately a phase 3 multicenter trial, failed to meet its endpoint.
There were some trends for benefit in younger patients, and as the trial was ongoing, we continued to evolve our knowledge, and we really honed it down to seeing a benefit of using IVIG in patients with COVID with specific criteria in mind. They had to be relatively younger patients, under 65, and not have any major comorbidities. In other words, they weren’t dialysis patients or end-stage disease patients, heart failure patients, cancer or malignancy patients. So, you know, we’re looking at the patients under 65 with obesity, diabetes, and hypertension, who are rapidly declining, going from room air to BiPAP or high-flow oxygen in a short amount of time. And we learned that when using IVIG early, we actually saw patients improve and turn around.
What this article in JCOM highlighted was, number one, incorporating that outcome or that patient type and then looking at the cost of hospitalization of patients who received IVIG versus those that did not. There were 2 groups that were studied. One was the group of patients in that original pilot trial that I discussed who were randomized to receive 1 or the other prospectively; it was an unblinded randomized study. And the second group was a matched case-control study where we had patients treated with IVIG matched by age and comorbidity status and level of hypoxia to patients that did not receive IVIG. We saw a financial benefit in shortening or reducing hospitalizations, really coming down to getting rid of that 20% tail of patients that wound up going to the ICU, getting intubated, and using a high amount of hospital resources that would ramp up the cost of hospitalization. We saw great mitigation of that with IVIG, and even with a small subset of patients, we were able to show a benefit.
Dr. Barkoudah Any thoughts on where we can implement the new findings from your article in our practice at the moment, knowing we now have practice guidelines and protocols to treat COVID-19? There was a tangible benefit in treating the patients the way you approached it in your important work. Could you share with us what would be implementable at the moment?
Dr. Sakoulas I think, fortunately, with the increasing host immunity in the population and decreased virulence of the virus, perhaps we won’t see as many patients of the type that were in these trials going forward, but I suspect we will perhaps in the unvaccinated patients that remain. I believe one-third of the United States is not vaccinated. So there is certainly a vulnerable group of people out there. Potentially, an unvaccinated patient who winds up getting very sick, the patient who is relatively young—what I’m looking at is the 30- to 65-year-old obese, hypertensive, or diabetic patient who comes in and, despite the steroids and the antivirals, rapidly deteriorates into requiring high-flow oxygen. I think implementing IVIG in that patient type would be helpful. I don’t think it’s going to be as helpful in patients who are very elderly, because I think the mechanism of the disease is different in an 80-year-old versus a 50-year-old patient. So again, hopefully, it will not amount to a lot of patients, but I still suspect hospitals are going to see, perhaps in the fall, when they’re expecting a greater number of cases, a trickling of patients that do meet the criteria that I described.
Dr. Barkoudah JCOM’s audience are the QI implementers and hospital leadership. And what caught my eye in your article is your perspective on the pharmacoeconomics of treating COVID-19, and I really appreciate your looking at the cost aspect. Would you talk about the economics of inpatient care, the total care that we provide now that we’re in the age of tocilizumab, and the current state of multiple layers of therapy?
Dr. Sakoulas The reason to look at the economics of it is because IVIG—which is actually not a drug, it’s a blood product—is very expensive. So, we received a considerable amount of administrative pushback implementing this treatment at the beginning outside of the clinical trial setting because it hadn’t been studied on a large scale and because the cost was so high, even though, as a clinician at the bedside, I was seeing a benefit in patients. This study came out of my trying to demonstrate to the folks that are keeping the economics of medicine in mind that, in fact, investing several thousand dollars of treatment in IVIG will save you cost of care, the cost of an ICU bed, the cost of a ventilator, and the cost even of ECMO, which is hugely expensive.
If you look at the numbers in the study, for two-thirds or three-quarters of the patients, your cost of care is actually greater than the controls because you’re giving them IVIG, and it’s increasing the cost of their care, even though three-quarters of the patients are going to do just as well without it. It’s that 20% to 25% of patients that really are going to benefit from it, where you’re reducing your cost of care so much, and you’re getting rid of that very, very expensive 20%, that there’s a cost savings across the board per patient. So, it’s hard to understand when you say you’re losing money on three-quarters of the patients, you’re only saving money on a quarter of the patients, but that cost of saving on that small subset is so substantial it’s really impacting all numbers.
Also, abandoning the outlier principle is sort of an underlying theme in how we think of things. We tend to ignore outliers, not consider them, but I think we really have to pay attention to the more extreme cases because those patients are the ones that drive not just the financial cost of care. Remember, if you’re down to 1 ventilator and you can cut down the use of scarce ICU resources, the cost is sort of even beyond the cost of money. It’s the cost of resources that may become scarce in some settings. So, I think it speaks to that as well.
A lot of the drugs that we use, for example, tocilizumab, were able to be studied in thousands of patients. If you look at the absolute numbers, the benefit of tocilizumab from a magnitude standpoint—low to mid twenties to high twenties—you know, reducing mortality from 29% to 24%. I mean, just take a step back and think about that. Even though it’s statistically significant, try telling a patient, “Well, I’m going to give you this treatment that’s going to reduce mortality from 29% to 24%.” You know, that doesn’t really change anything from a clinical significance standpoint. But they have a P value less than .05, which is our standard, and they were able to do a study with thousands of patients. We didn’t have that luxury with IVIG. No one studied thousands of patients, only retrospectively, and those retrospective studies don’t get the attention because they’re considered biased with all their limitations. But I think one of the difficulties we have here is the balance between statistical and clinical significance. For example, in our pilot study, our ventilation rate was 58% with the non-IVIG patients versus 14% for IVIG patients. So you might say, magnitude-wise, that’s a big number, but the statistical significance of it is borderline because of small numbers.
Anyway, that’s a challenge that we have as clinicians trying to incorporate what’s published—the balancing of statistics, absolute numbers, and practicalities of delivering care. And I think this study highlights some of the nuances that go into that incorporation and those clinical decisions.
Dr. Barkoudah Would you mind sharing with our audience how we can make the connection between the medical outcomes and pharmacoeconomics findings from your article and link it to the bedside and treatment of our patients?
Dr. Sakoulas One of the points this article brings out is the importance of bringing together not just level 1A data, but also small studies with data such as this, where the magnitude of the effect is pretty big but you lose the statistics because of the small numbers. And then also the patients’ aspects of things. I think, as a bedside clinician, you appreciate things, the nuances, much sooner than what percolates out from a level 1A study. Case in point, in the sponsored phase 3 study that we did, and in some other studies that were prospectively done as well, these studies of IVIG simply had an enrollment of patients that was very broad, and not every patient benefits from the same therapy. A great example of this is the sepsis trials with Xigris and those types of agents that failed. You know, there are clinicians to this day who believe that there is a subset of patients that benefit from agents like this. The IVIG story falls a little bit into that category. It comes down to trying to identify the subset of patients that might benefit. And I think we’ve outlined this subset pretty well in our study: the younger, obese diabetic or hypertensive patient who’s rapidly declining.
It really brings together the need to not necessarily toss out these smaller studies, but kind of summarize everything together, and clinicians who are bedside, who are more in tune with the nuances of individual decisions at the individual patient level, might better appreciate these kinds of data. But I think we all have to put it together. IVIG does not make treatment guidelines at national levels and so forth. It’s not even listed in many of them. But there are patients out there who, if you ask them specifically how they felt, including a friend of mine who received the medication, there’s no question from their end, how they felt about this treatment option. Now, some people will get it and will not benefit. We just have to be really tuned into the fact that the same drug does not have the same result for every patient. And just to consider this in the high-risk patients that we talked about in our study.
Dr. Barkoudah While we were prepping for this interview, you made an analogy regarding clinical evidence along the lines of, “Do we need randomized clinical trials to do a parachute-type of experiment,” and we chatted about clinical wisdom. Would you mind sharing with our readers your thoughts on that?
Dr. Sakoulas Sometimes, we try a treatment and it’s very obvious for that particular patient that it helped them. Then you study the treatment in a large trial setting and it doesn’t work. For us bedside clinicians, there are some interventions sometimes that do appear as beneficial as a parachute would be, but yet, there has never been a randomized clinical trial proving that parachutes work. Again, a part of the challenge we have is patients are so different, their immunology is different, the pathogen infecting them is different, the time they present is different. Some present early, some present late. There are just so many moving parts to treating an infection that only a subset of people are going to benefit. And sometimes as clinicians, we’re so nuanced, that we identify a specific subset of patients where we know we can help them. And it’s so obvious for us, like a parachute would be, but to people who are looking at the world from 30,000 feet, they don’t necessarily grasp that because, when you look at all comers, it doesn’t show a benefit.
So the problem is that now those treatments that might help a subset of patients are being denied, and the subset of patients that are going to benefit never get the treatment. Now we have to balance that with a lot of stuff that went on during the pandemic with, you know, ivermectin, hydroxychloroquine, and people pushing those things. Someone asked me once what I thought about hydroxychloroquine, and I said, “Well, somebody in the lab probably showed that it was beneficial, analogous to lighting tissue paper on fire on a plate and taking a cup of water and putting the fire out. Well, now, if you take that cup of water to the Caldor fire that’s burning in California on thousands of acres, you’re not going to be able to put the fire out with that cup of water.” So while it might work in the lab, it’s truly not going to work in a clinical setting. We have to balance individualizing care for patients with some information people are pushing out there that may not be necessarily translatable to the clinical setting.
I think there’s nothing better than being at the bedside, though, and being able to implement something and seeing what works. And really, experience goes a long way in being able to individually treat a patient optimally.
Dr. Barkoudah Thank you for everything you do at the bedside and your work on improving the treatment we have and how we can leverage knowledge to treat our patients. Thank you very much for your time and your scholarly contribution. We appreciate it and I hope the work will continue. We will keep working on treating COVID-19 patients with the best knowledge we have.
Q&A participants: George Sakoulas, MD, Sharp Rees-Stealy Medical Group, La Jolla, CA, and University of California San Diego School of Medicine, San Diego, CA; and Ebrahim Barkoudah, MD, MPH, Department of Medicine, Brigham and Women’s Hospital, Boston, MA.
Disclosures: None reported.
1. Poremba M, Dehner M, Perreiter A, et al. Intravenous immunoglobulin in treating nonventilated COVID-19 patients with moderate-to-severe hypoxia: a pharmacoeconomic analysis. J Clin Outcomes Manage. 2022;29(3):123-129. doi:10.12788/jcom.0094
Dr. George Sakoulas is an infectious diseases clinician at Sharp Memorial Hospital in San Diego and professor of pediatrics at the University of California, San Diego School of Medicine. He was the lead investigator in a study published in the May/June 2022 issue of JCOM that found that, when allocated to the appropriate patient type, intravenous immunoglobulin can reduce hospital costs for COVID-19 care. 1 He joined JCOM’s Editor-in-Chief, Dr. Ebrahim Barkoudah, to discuss the study’s background and highlight its main findings.
The following has been edited for length and clarity.
Dr. Barkoudah Dr. Sakoulas is an investigator and a clinician, bridging both worlds to bring the best evidence to our patients. We’re discussing his new article regarding intravenous immunoglobulin in treating nonventilated COVID-19 patients with moderate-to-severe hypoxia. Dr. Sakoulas, could you please share with our readers the clinical question your study addressed and what your work around COVID-19 management means for clinical practice?
Dr. Sakoulas Thank you. I’m an infectious disease physician. I’ve been treating patients with viral acute respiratory distress syndrome for almost 20 years as an ID doctor. Most of these cases are due to influenza or other viruses. And from time to time, anecdotally and supported by some literature, we’ve been using IVIG, or intravenous immunoglobulin, in some of these cases. And again, I can report anecdotal success with that over the years.
So when COVID emerged in March of 2020, we deployed IVIG in a couple of patients early who were heading downhill. Remember, in March of 2020, we didn’t have the knowledge of steroids helping, patients being ventilated very promptly, and we saw some patients who made a turnaround after treatment with IVIG. We were able to get some support from an industry sponsor and perform and publish a pilot study, enrolling patients early in the pandemic. That study actually showed benefits, which then led the sponsor to fund a phase 3 multicenter clinical trial. Unfortunately, a couple of things happened. First, the trial was designed with the knowledge we had in April of 2020, and again, this is before steroids, before we incorporated proning patients in the ICU, or started ventilating people early. So there were some management changes and evolutions and improvements that happened. And second, the trial was enrolling a very broad repertoire of patients. There were no age limitations, and the trial, ultimately a phase 3 multicenter trial, failed to meet its endpoint.
There were some trends for benefit in younger patients, and as the trial was ongoing, we continued to evolve our knowledge, and we really honed it down to seeing a benefit of using IVIG in patients with COVID with specific criteria in mind. They had to be relatively younger patients, under 65, and not have any major comorbidities. In other words, they weren’t dialysis patients or end-stage disease patients, heart failure patients, cancer or malignancy patients. So, you know, we’re looking at the patients under 65 with obesity, diabetes, and hypertension, who are rapidly declining, going from room air to BiPAP or high-flow oxygen in a short amount of time. And we learned that when using IVIG early, we actually saw patients improve and turn around.
What this article in JCOM highlighted was, number one, incorporating that outcome or that patient type and then looking at the cost of hospitalization of patients who received IVIG versus those that did not. There were 2 groups that were studied. One was the group of patients in that original pilot trial that I discussed who were randomized to receive 1 or the other prospectively; it was an unblinded randomized study. And the second group was a matched case-control study where we had patients treated with IVIG matched by age and comorbidity status and level of hypoxia to patients that did not receive IVIG. We saw a financial benefit in shortening or reducing hospitalizations, really coming down to getting rid of that 20% tail of patients that wound up going to the ICU, getting intubated, and using a high amount of hospital resources that would ramp up the cost of hospitalization. We saw great mitigation of that with IVIG, and even with a small subset of patients, we were able to show a benefit.
Dr. Barkoudah Any thoughts on where we can implement the new findings from your article in our practice at the moment, knowing we now have practice guidelines and protocols to treat COVID-19? There was a tangible benefit in treating the patients the way you approached it in your important work. Could you share with us what would be implementable at the moment?
Dr. Sakoulas I think, fortunately, with the increasing host immunity in the population and decreased virulence of the virus, perhaps we won’t see as many patients of the type that were in these trials going forward, but I suspect we will perhaps in the unvaccinated patients that remain. I believe one-third of the United States is not vaccinated. So there is certainly a vulnerable group of people out there. Potentially, an unvaccinated patient who winds up getting very sick, the patient who is relatively young—what I’m looking at is the 30- to 65-year-old obese, hypertensive, or diabetic patient who comes in and, despite the steroids and the antivirals, rapidly deteriorates into requiring high-flow oxygen. I think implementing IVIG in that patient type would be helpful. I don’t think it’s going to be as helpful in patients who are very elderly, because I think the mechanism of the disease is different in an 80-year-old versus a 50-year-old patient. So again, hopefully, it will not amount to a lot of patients, but I still suspect hospitals are going to see, perhaps in the fall, when they’re expecting a greater number of cases, a trickling of patients that do meet the criteria that I described.
Dr. Barkoudah JCOM’s audience are the QI implementers and hospital leadership. And what caught my eye in your article is your perspective on the pharmacoeconomics of treating COVID-19, and I really appreciate your looking at the cost aspect. Would you talk about the economics of inpatient care, the total care that we provide now that we’re in the age of tocilizumab, and the current state of multiple layers of therapy?
Dr. Sakoulas The reason to look at the economics of it is because IVIG—which is actually not a drug, it’s a blood product—is very expensive. So, we received a considerable amount of administrative pushback implementing this treatment at the beginning outside of the clinical trial setting because it hadn’t been studied on a large scale and because the cost was so high, even though, as a clinician at the bedside, I was seeing a benefit in patients. This study came out of my trying to demonstrate to the folks that are keeping the economics of medicine in mind that, in fact, investing several thousand dollars of treatment in IVIG will save you cost of care, the cost of an ICU bed, the cost of a ventilator, and the cost even of ECMO, which is hugely expensive.
If you look at the numbers in the study, for two-thirds or three-quarters of the patients, your cost of care is actually greater than the controls because you’re giving them IVIG, and it’s increasing the cost of their care, even though three-quarters of the patients are going to do just as well without it. It’s that 20% to 25% of patients that really are going to benefit from it, where you’re reducing your cost of care so much, and you’re getting rid of that very, very expensive 20%, that there’s a cost savings across the board per patient. So, it’s hard to understand when you say you’re losing money on three-quarters of the patients, you’re only saving money on a quarter of the patients, but that cost of saving on that small subset is so substantial it’s really impacting all numbers.
Also, abandoning the outlier principle is sort of an underlying theme in how we think of things. We tend to ignore outliers, not consider them, but I think we really have to pay attention to the more extreme cases because those patients are the ones that drive not just the financial cost of care. Remember, if you’re down to 1 ventilator and you can cut down the use of scarce ICU resources, the cost is sort of even beyond the cost of money. It’s the cost of resources that may become scarce in some settings. So, I think it speaks to that as well.
A lot of the drugs that we use, for example, tocilizumab, were able to be studied in thousands of patients. If you look at the absolute numbers, the benefit of tocilizumab from a magnitude standpoint—low to mid twenties to high twenties—you know, reducing mortality from 29% to 24%. I mean, just take a step back and think about that. Even though it’s statistically significant, try telling a patient, “Well, I’m going to give you this treatment that’s going to reduce mortality from 29% to 24%.” You know, that doesn’t really change anything from a clinical significance standpoint. But they have a P value less than .05, which is our standard, and they were able to do a study with thousands of patients. We didn’t have that luxury with IVIG. No one studied thousands of patients, only retrospectively, and those retrospective studies don’t get the attention because they’re considered biased with all their limitations. But I think one of the difficulties we have here is the balance between statistical and clinical significance. For example, in our pilot study, our ventilation rate was 58% with the non-IVIG patients versus 14% for IVIG patients. So you might say, magnitude-wise, that’s a big number, but the statistical significance of it is borderline because of small numbers.
Anyway, that’s a challenge that we have as clinicians trying to incorporate what’s published—the balancing of statistics, absolute numbers, and practicalities of delivering care. And I think this study highlights some of the nuances that go into that incorporation and those clinical decisions.
Dr. Barkoudah Would you mind sharing with our audience how we can make the connection between the medical outcomes and pharmacoeconomics findings from your article and link it to the bedside and treatment of our patients?
Dr. Sakoulas One of the points this article brings out is the importance of bringing together not just level 1A data, but also small studies with data such as this, where the magnitude of the effect is pretty big but you lose the statistics because of the small numbers. And then also the patients’ aspects of things. I think, as a bedside clinician, you appreciate things, the nuances, much sooner than what percolates out from a level 1A study. Case in point, in the sponsored phase 3 study that we did, and in some other studies that were prospectively done as well, these studies of IVIG simply had an enrollment of patients that was very broad, and not every patient benefits from the same therapy. A great example of this is the sepsis trials with Xigris and those types of agents that failed. You know, there are clinicians to this day who believe that there is a subset of patients that benefit from agents like this. The IVIG story falls a little bit into that category. It comes down to trying to identify the subset of patients that might benefit. And I think we’ve outlined this subset pretty well in our study: the younger, obese diabetic or hypertensive patient who’s rapidly declining.
It really brings together the need to not necessarily toss out these smaller studies, but kind of summarize everything together, and clinicians who are bedside, who are more in tune with the nuances of individual decisions at the individual patient level, might better appreciate these kinds of data. But I think we all have to put it together. IVIG does not make treatment guidelines at national levels and so forth. It’s not even listed in many of them. But there are patients out there who, if you ask them specifically how they felt, including a friend of mine who received the medication, there’s no question from their end, how they felt about this treatment option. Now, some people will get it and will not benefit. We just have to be really tuned into the fact that the same drug does not have the same result for every patient. And just to consider this in the high-risk patients that we talked about in our study.
Dr. Barkoudah While we were prepping for this interview, you made an analogy regarding clinical evidence along the lines of, “Do we need randomized clinical trials to do a parachute-type of experiment,” and we chatted about clinical wisdom. Would you mind sharing with our readers your thoughts on that?
Dr. Sakoulas Sometimes, we try a treatment and it’s very obvious for that particular patient that it helped them. Then you study the treatment in a large trial setting and it doesn’t work. For us bedside clinicians, there are some interventions sometimes that do appear as beneficial as a parachute would be, but yet, there has never been a randomized clinical trial proving that parachutes work. Again, a part of the challenge we have is patients are so different, their immunology is different, the pathogen infecting them is different, the time they present is different. Some present early, some present late. There are just so many moving parts to treating an infection that only a subset of people are going to benefit. And sometimes as clinicians, we’re so nuanced, that we identify a specific subset of patients where we know we can help them. And it’s so obvious for us, like a parachute would be, but to people who are looking at the world from 30,000 feet, they don’t necessarily grasp that because, when you look at all comers, it doesn’t show a benefit.
So the problem is that now those treatments that might help a subset of patients are being denied, and the subset of patients that are going to benefit never get the treatment. Now we have to balance that with a lot of stuff that went on during the pandemic with, you know, ivermectin, hydroxychloroquine, and people pushing those things. Someone asked me once what I thought about hydroxychloroquine, and I said, “Well, somebody in the lab probably showed that it was beneficial, analogous to lighting tissue paper on fire on a plate and taking a cup of water and putting the fire out. Well, now, if you take that cup of water to the Caldor fire that’s burning in California on thousands of acres, you’re not going to be able to put the fire out with that cup of water.” So while it might work in the lab, it’s truly not going to work in a clinical setting. We have to balance individualizing care for patients with some information people are pushing out there that may not be necessarily translatable to the clinical setting.
I think there’s nothing better than being at the bedside, though, and being able to implement something and seeing what works. And really, experience goes a long way in being able to individually treat a patient optimally.
Dr. Barkoudah Thank you for everything you do at the bedside and your work on improving the treatment we have and how we can leverage knowledge to treat our patients. Thank you very much for your time and your scholarly contribution. We appreciate it and I hope the work will continue. We will keep working on treating COVID-19 patients with the best knowledge we have.
Q&A participants: George Sakoulas, MD, Sharp Rees-Stealy Medical Group, La Jolla, CA, and University of California San Diego School of Medicine, San Diego, CA; and Ebrahim Barkoudah, MD, MPH, Department of Medicine, Brigham and Women’s Hospital, Boston, MA.
Disclosures: None reported.
1. Poremba M, Dehner M, Perreiter A, et al. Intravenous immunoglobulin in treating nonventilated COVID-19 patients with moderate-to-severe hypoxia: a pharmacoeconomic analysis. J Clin Outcomes Manage. 2022;29(3):123-129. doi:10.12788/jcom.0094
1. Poremba M, Dehner M, Perreiter A, et al. Intravenous immunoglobulin in treating nonventilated COVID-19 patients with moderate-to-severe hypoxia: a pharmacoeconomic analysis. J Clin Outcomes Manage. 2022;29(3):123-129. doi:10.12788/jcom.0094
Comorbidity Coding and Its Impact on Hospital Complexity: Reply
Authors' Response
We agree with the valid comments made by Dr. Kerguelen and will respond to each set of questions in order.
Regarding the first set of questions on how we knew that our CMI was low and our patient acuity was under- represented, the University of Miami Health System is a designated cancer center with a Prospective Payment System exempt model (PPS exempt), and is one of 11 hospitals in the United States excluded for payment under the Inpatient Prospective Payment System. We know, therefore, that we care for a very complex patient population. Additionally, we benchmark ourselves against other academic medical centers (AMCs) with similarly complex patients and had noted that our patients appeared “less complex.” Specifically, our baseline CMI was 1.77 in early 2018 compared with an overall higher CMI for the AMC cohort; also, the total number of diagnoses we captured was lower than that in other AMCs. These 2 facts together alerted us that we likely had coding and clinical documentation improvement (CDI) opportunities. We recognized that our complexity was not being captured both because the clinical information was not documented in a manner readily translatable to ICD-10 codes and codes were missed when the documentation did exist. To remedy these problems, we implemented multiple immediate “fixes,” which included revamping our CDI efforts, re-education, and enhancements to our electronic health record for providers, CDIs, and coders. Since publication of our article, our CMI has continued to increase month over month, up to 2.57 most recently in May 2022, as we have continued to focus on several additional initiatives to impact both better documentation and coding.
The second set of questions asked whether the perceived low CMI was causing problems with payers and about the risk of artificially increasing the CMI through overdiagnosis as well as audit mechanisms to avoid this, and changes in expected mortality and observed mortality. To our knowledge, the lower CMI did not cause any problems with payers, but this is something we are currently tracking. Coding and documentation are constantly audited both internally (by our quality department) and externally (using Inter-Rater Reliability audits and validation), with no noted trend or targeted opportunities. We only include comorbidities that are current, actively monitored/managed, and pertinent to the care of our patients. We have not noted a change in denials, which gives us confidence we are not now overdiagnosing.
Our observed mortality has also increased. We, like all institutions, experienced the confounding factor of the COVID-19 pandemic, which coincided with the higher observed mortality over the course of the past 2 years. While the observed mortality (indicating sicker patients assuming no worsening of care processes) may partly explain our increased coding complexity, our decreasing mortality index (observed:expected mortality) suggests that our efforts to improve documentation and coding likely reflect improved capture of missed complexity (Figure).

We understand the concerns raised by Dr. Kerguelen about potential mis(over)coding. As part of this quality initiative, therefore, we plan long-term evaluations of our processes and metrics to better determine and guide our understanding of the impact of what we have already implemented and future interventions. In fact, we are in the process of analyzing additional interventions and hope to share results from these evaluations soon.
Marie Anne Sosa, MD
Tanira Ferreira, MD
Hayley Gershengorn, MD
Melissa Soto
Estin Kelly
Ameena Shrestha
Julianne Burgos
Sandeep Devabhaktuni
Dipen Parekh, MD
Maritza Suarez, MD
University of Miami Hospital and Clinics, Miami, FL
mxs2157@med.miami.edu
Disclosures: None reported.
Authors' Response
We agree with the valid comments made by Dr. Kerguelen and will respond to each set of questions in order.
Regarding the first set of questions on how we knew that our CMI was low and our patient acuity was under- represented, the University of Miami Health System is a designated cancer center with a Prospective Payment System exempt model (PPS exempt), and is one of 11 hospitals in the United States excluded for payment under the Inpatient Prospective Payment System. We know, therefore, that we care for a very complex patient population. Additionally, we benchmark ourselves against other academic medical centers (AMCs) with similarly complex patients and had noted that our patients appeared “less complex.” Specifically, our baseline CMI was 1.77 in early 2018 compared with an overall higher CMI for the AMC cohort; also, the total number of diagnoses we captured was lower than that in other AMCs. These 2 facts together alerted us that we likely had coding and clinical documentation improvement (CDI) opportunities. We recognized that our complexity was not being captured both because the clinical information was not documented in a manner readily translatable to ICD-10 codes and codes were missed when the documentation did exist. To remedy these problems, we implemented multiple immediate “fixes,” which included revamping our CDI efforts, re-education, and enhancements to our electronic health record for providers, CDIs, and coders. Since publication of our article, our CMI has continued to increase month over month, up to 2.57 most recently in May 2022, as we have continued to focus on several additional initiatives to impact both better documentation and coding.
The second set of questions asked whether the perceived low CMI was causing problems with payers and about the risk of artificially increasing the CMI through overdiagnosis as well as audit mechanisms to avoid this, and changes in expected mortality and observed mortality. To our knowledge, the lower CMI did not cause any problems with payers, but this is something we are currently tracking. Coding and documentation are constantly audited both internally (by our quality department) and externally (using Inter-Rater Reliability audits and validation), with no noted trend or targeted opportunities. We only include comorbidities that are current, actively monitored/managed, and pertinent to the care of our patients. We have not noted a change in denials, which gives us confidence we are not now overdiagnosing.
Our observed mortality has also increased. We, like all institutions, experienced the confounding factor of the COVID-19 pandemic, which coincided with the higher observed mortality over the course of the past 2 years. While the observed mortality (indicating sicker patients assuming no worsening of care processes) may partly explain our increased coding complexity, our decreasing mortality index (observed:expected mortality) suggests that our efforts to improve documentation and coding likely reflect improved capture of missed complexity (Figure).
We understand the concerns raised by Dr. Kerguelen about potential mis(over)coding. As part of this quality initiative, therefore, we plan long-term evaluations of our processes and metrics to better determine and guide our understanding of the impact of what we have already implemented and future interventions. In fact, we are in the process of analyzing additional interventions and hope to share results from these evaluations soon.
Marie Anne Sosa, MD
Tanira Ferreira, MD
Hayley Gershengorn, MD
Melissa Soto
Estin Kelly
Ameena Shrestha
Julianne Burgos
Sandeep Devabhaktuni
Dipen Parekh, MD
Maritza Suarez, MD
University of Miami Hospital and Clinics, Miami, FL
mxs2157@med.miami.edu
Disclosures: None reported.
Comorbidity Coding and Its Impact on Hospital Complexity
To the Editor:
I read with interest the article by Sosa and colleagues1 in which they present some stimulating analyses pertaining to a topic that we have been discussing at my institution for several years. Part of this discussion deals with the complexity of our hospital and how complexity is affected by comorbidity coding.
In 2013, we implemented the International Refined-DRGs (IR-DRGs) system to measure complexity at our hospital in Bogotá, Colombia. Our perception at that time was that the case mix index (CMI) was very low (0.7566), even for a general hospital with a high volume of pathologies with low relative weight (RW). Two medical auditors were assigned to review the medical records in order to improve the quality, quantity, and order of diagnoses. Emphasis was placed on patients with stays longer than 5 days and with only 1 diagnosis coded at admission. Additionally, International Classification of Diseases 10th Revision (World Health Organization version) diagnoses from chapters R (Symptoms and Signs Not Elsewhere Classified) and V through Y (External Causes) were blocked in the electronic health record. With these measures, our CMI increased 74%, reaching 1.3151 by the end of 2021, with a maximum peak of 1.6743 in May 2021, which coincided with the third peak of COVID-19 in Colombia.
However, the article by Sosa and colleagues draws my attention to the following: why do the authors state that their CMI is low and the patient acuity was under-represented? Is this due to a comparison with similar hospitals, or to a recommendation from a regulatory agency? We have found our CMI remains low because of a high volume of nonsurgical care (60%), deliveries, and digestive, respiratory, and urinary pathologies of low RW.
Also, was the perceived low CMI causing problems with payers? And further, how did the authors avoid the risk of artificially increasing the CMI through overdiagnosis of patients, and were there audit mechanisms to avoid this? While there was a clear change in expected mortality, did the observed mortality also change with the strategies implemented? This last question is relevant because, if the observed mortality were maintained, this would provide evidence that a coding problem was the cause of their hospital’s low CMI.
I reiterate my congratulations to the authors for presenting analyses that are very useful to other providers and researchers worldwide interested in addressing management issues related to the correct identification and classification of patients.
Carlos Kerguelen, MD, MA
Fundacion Santa Fe de Bogotá, Bogotá, Colombia
carlos.kerguelen@fsfb.org.co
Disclosures: None reported.
1. Sosa M, Ferreira T, Gershengorn H, et al. Improving hospital metrics through the implementation of a comorbidity capture tool and other quality initiatives. J Clin Outcomes Manage. 2022;29(2):80-87. doi:10.12788/jcom.0088
To the Editor:
I read with interest the article by Sosa and colleagues1 in which they present some stimulating analyses pertaining to a topic that we have been discussing at my institution for several years. Part of this discussion deals with the complexity of our hospital and how complexity is affected by comorbidity coding.
In 2013, we implemented the International Refined-DRGs (IR-DRGs) system to measure complexity at our hospital in Bogotá, Colombia. Our perception at that time was that the case mix index (CMI) was very low (0.7566), even for a general hospital with a high volume of pathologies with low relative weight (RW). Two medical auditors were assigned to review the medical records in order to improve the quality, quantity, and order of diagnoses. Emphasis was placed on patients with stays longer than 5 days and with only 1 diagnosis coded at admission. Additionally, International Classification of Diseases 10th Revision (World Health Organization version) diagnoses from chapters R (Symptoms and Signs Not Elsewhere Classified) and V through Y (External Causes) were blocked in the electronic health record. With these measures, our CMI increased 74%, reaching 1.3151 by the end of 2021, with a maximum peak of 1.6743 in May 2021, which coincided with the third peak of COVID-19 in Colombia.
However, the article by Sosa and colleagues draws my attention to the following: why do the authors state that their CMI is low and the patient acuity was under-represented? Is this due to a comparison with similar hospitals, or to a recommendation from a regulatory agency? We have found our CMI remains low because of a high volume of nonsurgical care (60%), deliveries, and digestive, respiratory, and urinary pathologies of low RW.
Also, was the perceived low CMI causing problems with payers? And further, how did the authors avoid the risk of artificially increasing the CMI through overdiagnosis of patients, and were there audit mechanisms to avoid this? While there was a clear change in expected mortality, did the observed mortality also change with the strategies implemented? This last question is relevant because, if the observed mortality were maintained, this would provide evidence that a coding problem was the cause of their hospital’s low CMI.
I reiterate my congratulations to the authors for presenting analyses that are very useful to other providers and researchers worldwide interested in addressing management issues related to the correct identification and classification of patients.
Carlos Kerguelen, MD, MA
Fundacion Santa Fe de Bogotá, Bogotá, Colombia
carlos.kerguelen@fsfb.org.co
Disclosures: None reported.
1. Sosa M, Ferreira T, Gershengorn H, et al. Improving hospital metrics through the implementation of a comorbidity capture tool and other quality initiatives. J Clin Outcomes Manage. 2022;29(2):80-87. doi:10.12788/jcom.0088
1. Sosa M, Ferreira T, Gershengorn H, et al. Improving hospital metrics through the implementation of a comorbidity capture tool and other quality initiatives. J Clin Outcomes Manage. 2022;29(2):80-87. doi:10.12788/jcom.0088
Supporting Patients on Complex Care Journeys: How Technology Can Bridge the Gaps
From Memora Health (Dr. Flyckt and Dr. Colbert), San Francisco, CA; and Harvard Medical School (Dr. Colbert), Boston, MA.
A close relative was recently diagnosed with follicular lymphoma. He was cared for at a high-ranked cancer center by physicians with demonstrated expertise, and even had the support of a care navigator. Still, he was often left feeling overwhelmed and confused, holding an inch-thick stack of papers, instructions, and pamphlets. As he left his treatment planning visit, reeling from the emotional burden of his diagnosis and all the unfamiliar terminology, he didn’t know what to do or what to expect. Later, when he experienced early signs of tumor lysis syndrome, he struggled to reach his care team for triage and guidance. When he went to the emergency room, his oncologist was never informed.
This scenario is unfortunately common, and versions of this scenario play out thousands of times each day across the US health system. Within the clinic and hospital setting, patients receive excellent care from their providers, but a disconnect emerges once the patient leaves these medical settings: patients at home struggle to find guidance and support, while care teams lack the tools to engage patients between visits or monitor their health across care settings, providers, or episodes of care.
Leveraging Technology to Move From Episodes of Care to Complex Care Journeys
The use of automated messaging, artificial intelligence and natural language processing–driven chat experiences, and text-based support is becoming more common. However, health care lags behind other industries in the adoption of these technologies.1,2 The slow pace can be warranted, given that health care is more complicated and higher risk than inquiring about a lost package, ordering groceries, or applying for a mortgage. At the same time, many of the consumer engagement tools used to guide an applicant through the multiple steps and complexities of their home loan process or to prompt viewers to select new shows to binge have applications in health care.
Over the past few years, technologies have emerged that guide patients through complex care journeys and allow care teams to monitor and engage patients between visits. These solutions come in different formats, but generally patients can receive messages on their phones that contain disease-specific educational content, prompts to fill prescriptions and take medications, and reminders and guidance on how to prepare for appointments and procedures. These programs also collect relevant data from patients through survey and electronic patient-reported outcomes instruments, as well as connected patient monitoring devices, that help track patient progress and identify issues as they arise. Many programs also incorporate symptom triage pathways and use natural language processing to respond automatically to patient questions and concerns.3,4
These technology solutions can automate many tasks that in the past required a care team member to spend hours on the phone. Newly freed from such repetitive tasks, care teams can now focus on more in-depth interactions with those patients who are most in need—the types of interactions that are more satisfying and rewarding. Such assistance is particularly needed today with the staffing shortages faced by most health systems.5
In addition, technology allows teams to see the panel of patients they are caring for and to quickly identify and take action on any specific needs or issues. Care teams can focus on any patient and see where they are in their journey. When appropriate, some solutions also allow care teams to engage directly with patients through text-messaging, creating a seamless experience and unified communication channel. Ideally, these solutions should be linked or embedded within the electronic health record or other primary system of record, so that teams can easily access these tools through their existing workflows and avoid creating yet another interface to navigate.
The Impact of Low-Tech Solutions to Deliver High-Touch Support
There is evidence showing that digital patient navigation tools impact patient care. In the oncology setting, patients with a digital navigator have achieved over 95% adherence rates with complex oral chemotherapy regimens (Memora Health Unpublished Data. 2022.). In the postpartum setting, a text message–based program improved screening rates for postpartum depression and did so with very high patient satisfaction ratings.6 Particularly notable is the fact that this depression screening program achieved these results in a population that was predominantly low income, with more than half belonging to underrepresented minority populations.6
We believe these digital patient navigation technologies, specifically low-tech solutions that don’t require app downloads, portal log-ins, or high-speed internet, will transform care delivery over the next 5 to 10 years. Successful management of complex conditions like diabetes or cancer requires more than 3 hours of care each day,7 yet most patients spend only 1 or 2 hours per month directly interacting with their health care providers. However, most patients carry their phones with them at all times, and artificial intelligence–enabled text support is “always on” to provide support, monitoring, and guidance, wherever a patient happens to be when assistance is needed.
Shifting the Model to Support a Lifetime of Care
While still in the early stages of development, these tools have the potential to radically alter the practice of medicine, shifting the focus from episodic interactions to continuous journey-based care delivery. Outside of an acute event bringing a patient into the clinic or emergency room, many patients go a year or more without seeing their primary care providers.8 During that time, an immense amount of information is underreported or completely lost. Capturing this information in real-time and more holistically over a person’s lifetime of care could provide physicians better insight to both better manage and more fully evaluate the success of treatment plans by tracking patient symptoms, pain, and functional status over time. With this more longitudinal view of the patient, we see a pathway towards achieving the Quadruple Aim: patients who are more supported will achieve better outcomes at lower cost, they will have a better experience, and care teams will be empowered to focus their time on more satisfying activities rather than repetitive administrative tasks.
Corresponding author: James A. Colbert, MD, MBA; jamie@memorahealth.com
Disclosures: Dr. Flyckt and Dr. Colbert are employed by Memora Health, an organization that helps health care systems digitize and automate care journeys.
1. Hermes S, Riasanow T, Clemons EK, et al. The digital transformation of the healthcare industry: exploring the rise of emerging platform ecosystems and their influence on the role of patients. Bus Res. 2020;13:1033-1069. doi:10.1007/s40685-020-00125-x
2. Van Velthoven MH, Cordon C. Sustainable adoption of digital health innovations: perspectives from a stakeholder workshop. J Med Internet Res. 2019;21(3):e11922. doi:10.2196/11922
3. Campbell K, Louie P, Levine B, Gililland J. Using patient engagement platforms in the postoperative management of patients. Curr Rev Musculoskelet Med. 2020;13(4):479-484. doi:10.1007/s12178-020-09638-8
4. Xu L, Sanders L, Li K, Chow JCL. Chatbot for health care and oncology applications using artificial intelligence and machine learning: systematic review. JMIR Cancer. 2021;7(4):e27850. doi:10.2196/27850
5. Data brief: health care workforce challenges threaten hospitals’ ability to care for patients. American Hospital Association. Accessed July 24, 2022. www.aha.org/fact-sheets/2021-11-01-data-brief-health-care-workforce-challenges-threaten-hospitals-ability-care
6. Gaulton JS, Leitner K, Hahn L, et al. Healing at home: applying innovation principles to redesign and optimise postpartum care. BMJ Innovations. 2022;8:37-41.
7. Østbye T, Yarnall KS, Krause KM, et al. Is there time for management of patients with chronic diseases in primary care? Ann Fam Med. 2005;3(3):209-214. doi:10.1370/afm.310
8. Ganguli I, Shi Z, E. Orav J, et al. Declining use of primary care among commercially insured adults in the united states, 2008–2016. Ann Intern Med. 2020;172:240-247. doi:10.7326/M19-1834
From Memora Health (Dr. Flyckt and Dr. Colbert), San Francisco, CA; and Harvard Medical School (Dr. Colbert), Boston, MA.
A close relative was recently diagnosed with follicular lymphoma. He was cared for at a high-ranked cancer center by physicians with demonstrated expertise, and even had the support of a care navigator. Still, he was often left feeling overwhelmed and confused, holding an inch-thick stack of papers, instructions, and pamphlets. As he left his treatment planning visit, reeling from the emotional burden of his diagnosis and all the unfamiliar terminology, he didn’t know what to do or what to expect. Later, when he experienced early signs of tumor lysis syndrome, he struggled to reach his care team for triage and guidance. When he went to the emergency room, his oncologist was never informed.
This scenario is unfortunately common, and versions of this scenario play out thousands of times each day across the US health system. Within the clinic and hospital setting, patients receive excellent care from their providers, but a disconnect emerges once the patient leaves these medical settings: patients at home struggle to find guidance and support, while care teams lack the tools to engage patients between visits or monitor their health across care settings, providers, or episodes of care.
Leveraging Technology to Move From Episodes of Care to Complex Care Journeys
The use of automated messaging, artificial intelligence and natural language processing–driven chat experiences, and text-based support is becoming more common. However, health care lags behind other industries in the adoption of these technologies.1,2 The slow pace can be warranted, given that health care is more complicated and higher risk than inquiring about a lost package, ordering groceries, or applying for a mortgage. At the same time, many of the consumer engagement tools used to guide an applicant through the multiple steps and complexities of their home loan process or to prompt viewers to select new shows to binge have applications in health care.
Over the past few years, technologies have emerged that guide patients through complex care journeys and allow care teams to monitor and engage patients between visits. These solutions come in different formats, but generally patients can receive messages on their phones that contain disease-specific educational content, prompts to fill prescriptions and take medications, and reminders and guidance on how to prepare for appointments and procedures. These programs also collect relevant data from patients through survey and electronic patient-reported outcomes instruments, as well as connected patient monitoring devices, that help track patient progress and identify issues as they arise. Many programs also incorporate symptom triage pathways and use natural language processing to respond automatically to patient questions and concerns.3,4
These technology solutions can automate many tasks that in the past required a care team member to spend hours on the phone. Newly freed from such repetitive tasks, care teams can now focus on more in-depth interactions with those patients who are most in need—the types of interactions that are more satisfying and rewarding. Such assistance is particularly needed today with the staffing shortages faced by most health systems.5
In addition, technology allows teams to see the panel of patients they are caring for and to quickly identify and take action on any specific needs or issues. Care teams can focus on any patient and see where they are in their journey. When appropriate, some solutions also allow care teams to engage directly with patients through text-messaging, creating a seamless experience and unified communication channel. Ideally, these solutions should be linked or embedded within the electronic health record or other primary system of record, so that teams can easily access these tools through their existing workflows and avoid creating yet another interface to navigate.
The Impact of Low-Tech Solutions to Deliver High-Touch Support
There is evidence showing that digital patient navigation tools impact patient care. In the oncology setting, patients with a digital navigator have achieved over 95% adherence rates with complex oral chemotherapy regimens (Memora Health Unpublished Data. 2022.). In the postpartum setting, a text message–based program improved screening rates for postpartum depression and did so with very high patient satisfaction ratings.6 Particularly notable is the fact that this depression screening program achieved these results in a population that was predominantly low income, with more than half belonging to underrepresented minority populations.6
We believe these digital patient navigation technologies, specifically low-tech solutions that don’t require app downloads, portal log-ins, or high-speed internet, will transform care delivery over the next 5 to 10 years. Successful management of complex conditions like diabetes or cancer requires more than 3 hours of care each day,7 yet most patients spend only 1 or 2 hours per month directly interacting with their health care providers. However, most patients carry their phones with them at all times, and artificial intelligence–enabled text support is “always on” to provide support, monitoring, and guidance, wherever a patient happens to be when assistance is needed.
Shifting the Model to Support a Lifetime of Care
While still in the early stages of development, these tools have the potential to radically alter the practice of medicine, shifting the focus from episodic interactions to continuous journey-based care delivery. Outside of an acute event bringing a patient into the clinic or emergency room, many patients go a year or more without seeing their primary care providers.8 During that time, an immense amount of information is underreported or completely lost. Capturing this information in real-time and more holistically over a person’s lifetime of care could provide physicians better insight to both better manage and more fully evaluate the success of treatment plans by tracking patient symptoms, pain, and functional status over time. With this more longitudinal view of the patient, we see a pathway towards achieving the Quadruple Aim: patients who are more supported will achieve better outcomes at lower cost, they will have a better experience, and care teams will be empowered to focus their time on more satisfying activities rather than repetitive administrative tasks.
Corresponding author: James A. Colbert, MD, MBA; jamie@memorahealth.com
Disclosures: Dr. Flyckt and Dr. Colbert are employed by Memora Health, an organization that helps health care systems digitize and automate care journeys.
1. Hermes S, Riasanow T, Clemons EK, et al. The digital transformation of the healthcare industry: exploring the rise of emerging platform ecosystems and their influence on the role of patients. Bus Res. 2020;13:1033-1069. doi:10.1007/s40685-020-00125-x
2. Van Velthoven MH, Cordon C. Sustainable adoption of digital health innovations: perspectives from a stakeholder workshop. J Med Internet Res. 2019;21(3):e11922. doi:10.2196/11922
3. Campbell K, Louie P, Levine B, Gililland J. Using patient engagement platforms in the postoperative management of patients. Curr Rev Musculoskelet Med. 2020;13(4):479-484. doi:10.1007/s12178-020-09638-8
4. Xu L, Sanders L, Li K, Chow JCL. Chatbot for health care and oncology applications using artificial intelligence and machine learning: systematic review. JMIR Cancer. 2021;7(4):e27850. doi:10.2196/27850
5. Data brief: health care workforce challenges threaten hospitals’ ability to care for patients. American Hospital Association. Accessed July 24, 2022. www.aha.org/fact-sheets/2021-11-01-data-brief-health-care-workforce-challenges-threaten-hospitals-ability-care
6. Gaulton JS, Leitner K, Hahn L, et al. Healing at home: applying innovation principles to redesign and optimise postpartum care. BMJ Innovations. 2022;8:37-41.
7. Østbye T, Yarnall KS, Krause KM, et al. Is there time for management of patients with chronic diseases in primary care? Ann Fam Med. 2005;3(3):209-214. doi:10.1370/afm.310
8. Ganguli I, Shi Z, E. Orav J, et al. Declining use of primary care among commercially insured adults in the united states, 2008–2016. Ann Intern Med. 2020;172:240-247. doi:10.7326/M19-1834
The Mission of Continuous Improvement in Health Care: A New Era for Clinical Outcomes Management
This issue of the Journal of Clinical Outcomes (JCOM) debuts a new cover design that brings forward the articles and features in each issue. Although the Journal’s cover has a new look, JCOM’s goals remain the same—improving care by disseminating evidence of quality improvement in health care and sharing access to the medical literature with our readers. We continue our mission to promote the best medical practice by providing clinicians with updates and communicating advances that lead to measurable improvement in health care delivery, quality, and outcomes.
As we continue the work of improving health care quality, knowledge gaps and unmet needs in the literature remain. These unmet needs are evident throughout all phases of health care delivery. Moreover, the Institutes of Medicine report that centered on efforts to build a safer health care environment by redesigning health care processes remains salient.1 The journey to continuous improvement in health care, where we achieve threshold change in the quality of each process and across the entire health care system, requires collective effort. Such efforts include establishing clear metrics and measurements for improvement goals throughout the patient’s journey through diagnosis, treatment, transitions of care, and disease management.2,3 To address evidence and knowledge gaps in the literature, JCOM publishes reports of original studies and quality improvement projects as well as reviews, providing its 30,000 readers with new evidence to implement in daily practice. We welcome submissions of original research reports, reports of quality improvement projects that follow the SQUIRE 2.0 standards,4 and perspectives on developments and innovations in health care delivery.
The next chapter in health care delivery improvement will encompass value-based care.5 This new era of clinical outcomes management will dictate the metrics and outcomes reporting6 and how to plan future investments. The value-based phase will increase innovation and shape policies that advance population health, transforming every step in the care delivery journey.7 The next phase in health care delivery will also create a viable financial structure while implementing effective performance measures for optimal outcomes through patient-centered care and optimization of cost and care strategies. In light of health care’s evolution toward a value-based model, JCOM welcomes submissions of manuscripts that explore themes central to this model, including patient-centered care, implementation of best practices, system design, safety, cost-effectiveness, and the balance between cost optimization and quality. For JCOM’s authors and readers, our editorial team remains commited to the highest standards in timely publishing to support our community through our collective expertise and dedication to quality improvement.
Corresponding author: Ebrahim Barkoudah, MD, MPH, Department of Medicine, Brigham and Women’s Hospital, Boston, MA; ebarkoudah@bwh.harvard.edu
1. Institute of Medicine (US) Committee on Quality of Health Care in America. To Err is Human: Building a Safer Health System. Washington (DC): National Academies Press (US); 2000.
2. Singh H, Sittig DF. Advancing the science of measurement of diagnostic errors in healthcare: the Safer Dx framework. BMJ Qual Saf. 2015;24(2):103-10. doi:10.1136/bmjqs-2014-003675
3. Bates DW. Preventing medication errors: a summary. Am J Health Syst Pharm. 2007;64(14 Suppl 9):S3-9. doi:10.2146/ajhp070190
4. Revised Standards for Quality Improvement Reporting Excellence. SQUIRE 2.0. Accessed July 25, 2022. http://squire-statement.org
5. Gray M. Value based healthcare. BMJ. 2017;356:j437. doi:10.1136/bmj.j437
6. What is value-based healthcare? NEJM Catalyst. January 1, 2017. Accessed July 25, 2022. catalyst.nejm.org/doi/full/10.1056/CAT.17.0558
7. Porter ME, Teisberg EO. Redefining Health Care: Creating Value-Based Competition on Results. Harvard Business Press; 2006.
This issue of the Journal of Clinical Outcomes (JCOM) debuts a new cover design that brings forward the articles and features in each issue. Although the Journal’s cover has a new look, JCOM’s goals remain the same—improving care by disseminating evidence of quality improvement in health care and sharing access to the medical literature with our readers. We continue our mission to promote the best medical practice by providing clinicians with updates and communicating advances that lead to measurable improvement in health care delivery, quality, and outcomes.
As we continue the work of improving health care quality, knowledge gaps and unmet needs in the literature remain. These unmet needs are evident throughout all phases of health care delivery. Moreover, the Institutes of Medicine report that centered on efforts to build a safer health care environment by redesigning health care processes remains salient.1 The journey to continuous improvement in health care, where we achieve threshold change in the quality of each process and across the entire health care system, requires collective effort. Such efforts include establishing clear metrics and measurements for improvement goals throughout the patient’s journey through diagnosis, treatment, transitions of care, and disease management.2,3 To address evidence and knowledge gaps in the literature, JCOM publishes reports of original studies and quality improvement projects as well as reviews, providing its 30,000 readers with new evidence to implement in daily practice. We welcome submissions of original research reports, reports of quality improvement projects that follow the SQUIRE 2.0 standards,4 and perspectives on developments and innovations in health care delivery.
The next chapter in health care delivery improvement will encompass value-based care.5 This new era of clinical outcomes management will dictate the metrics and outcomes reporting6 and how to plan future investments. The value-based phase will increase innovation and shape policies that advance population health, transforming every step in the care delivery journey.7 The next phase in health care delivery will also create a viable financial structure while implementing effective performance measures for optimal outcomes through patient-centered care and optimization of cost and care strategies. In light of health care’s evolution toward a value-based model, JCOM welcomes submissions of manuscripts that explore themes central to this model, including patient-centered care, implementation of best practices, system design, safety, cost-effectiveness, and the balance between cost optimization and quality. For JCOM’s authors and readers, our editorial team remains commited to the highest standards in timely publishing to support our community through our collective expertise and dedication to quality improvement.
Corresponding author: Ebrahim Barkoudah, MD, MPH, Department of Medicine, Brigham and Women’s Hospital, Boston, MA; ebarkoudah@bwh.harvard.edu
1. Institute of Medicine (US) Committee on Quality of Health Care in America. To Err is Human: Building a Safer Health System. Washington (DC): National Academies Press (US); 2000.
2. Singh H, Sittig DF. Advancing the science of measurement of diagnostic errors in healthcare: the Safer Dx framework. BMJ Qual Saf. 2015;24(2):103-10. doi:10.1136/bmjqs-2014-003675
3. Bates DW. Preventing medication errors: a summary. Am J Health Syst Pharm. 2007;64(14 Suppl 9):S3-9. doi:10.2146/ajhp070190
4. Revised Standards for Quality Improvement Reporting Excellence. SQUIRE 2.0. Accessed July 25, 2022. http://squire-statement.org
5. Gray M. Value based healthcare. BMJ. 2017;356:j437. doi:10.1136/bmj.j437
6. What is value-based healthcare? NEJM Catalyst. January 1, 2017. Accessed July 25, 2022. catalyst.nejm.org/doi/full/10.1056/CAT.17.0558
7. Porter ME, Teisberg EO. Redefining Health Care: Creating Value-Based Competition on Results. Harvard Business Press; 2006.
VA foster program helps older vets manage COVID challenges
Susan Snead used to live in an apartment complex for older adults. The complex had a nice dayroom, and neighbors would knock on her door every now and then to check in.
But despite not being lonely, Ms. Snead, 89, did live alone in downtown Charleston, S.C. Eventually, that became dangerous.
“I fell a few times,” she says. “I had to call somebody to come and get me up.”
Sometimes help would come from the apartment complex’s office. Sometimes it came with a police escort.
Over time, needing to make those calls became a burden. Making and keeping appointments with her doctor, something she had to do regularly, as she has diabetes, got harder, too.
“It kind of wore me out,” she says. “Like you’re going up a hill.”
As she was beginning to accept she could no longer live alone, Ms. Snead, an Air Force veteran, learned about a program run by the Department of Veterans Affairs called Medical Foster Home.
Caregivers help aging veterans with activities of daily living like bathing, cooking, making and getting to appointments, getting dressed, and taking daily medication.
Caregivers can take care of up to three residents in their home at a time. While most residents are veterans, caregivers sometimes care for non-veteran residents, such as a veteran’s spouse or a caregiver’s family member.
Veterans typically pay about $1,500 to $3,000 out-of-pocket per month for the service, depending on location.
According to the VA, the concept of medical foster homes has been around since 1999, when VA hospitals across the country began reaching out to people willing to provide live-in care for veterans. The option is led by local VA hospitals, which approve caregivers and provide administrative services. There are now 517 medical foster homes, the VA says.
Much like other residential care facilities, medical foster homes get regular inspections for safety, nutrition, and more.
In 2019, Ms. Snead signed up for the program. She expected to be cared for, but she found a sense of family with her caregiver, Wilhelmina Brown, and another veteran in the home.
Ms. Brown started taking care of people – but not necessarily veterans – in 1997 when her grandmother was unable to care for herself, she says.
“My grandmama carried me to church every Sunday, she carried me to the beach – everywhere she went, she took me with her,” Ms. Brown says. As her grandmother got older, “I said, ‘I’m going to take care of her in my home.’ ”
Caring for others must come from the heart, Ms. Brown says.
She cooks her residents’ meals three times a day with dietary restrictions in mind, washes their dishes, does their laundry, remembers birthdays, and plans little parties.
“That’s my family,” Ms. Brown says.
In 2020, the COVID-19 pandemic upended the world – but at the same time, it highlighted the advantages of the medical foster home model.
Home-based primary care keeps veterans out of nursing homes – something that became particularly important as COVID-19 hit nursing homes and long-term care facilities.
Caregivers in the system were also able to help veterans, often living in rural areas, pivot and adapt to telehealth during a time of crisis.
One study, published in the journal Geriatrics, set out to identify how medical foster homes were able to deliver safe, effective health care during the early stages of the pandemic.
Researchers interviewed 37 VA care providers at 16 rural medical foster home programs across the country. The interviews took place between December 2020 and February 2021. They found medical foster home caregivers, coordinators, and health care providers communicated to move office visits to the home, helped veterans navigate telehealth, advocated to get veterans vaccinated in-home, and relied on each other to fight social isolation.
Caregivers also adapted quickly to telehealth, according to Leah Haverhals, PhD, a health research scientist and communications director for the Seattle-Denver Center of Innovation for Veteran Centered and Value Driven Care, who led the study.
Most veterans in the foster home program are older and find new technology difficult to use.
Caregivers, coordinators, and health care providers were largely new to the technology, too.
While the study found that most veterans and caregivers preferred in-person care, they were able to work together to make the best of telehealth.
“That speaks to the nature of the care being given, being able to pivot in a crisis like that,” Dr. Haverhals says.
If caregivers didn’t already have computers or telehealth-compatible devices, the VA provided iPads that would connect to the internet using cellular signals. According to the study, this helped to overcome connectivity issues that may have caused problems in rural areas.
Ms. Snead says Ms. Brown helped a lot with her telehealth calls.
“If we had to do things over the phone or with video, she was able to set that up to work with the person on the other end. She knows a lot about that stuff – about computers and things like that,” Ms. Snead says, adding that she hadn’t worked with computers since retirement in 1998.
Telehealth helped health care providers identify infections and quickly prescribe antibiotics to veterans in rural areas and provide other care that was more safely delivered in private homes.
“The findings from our study highlighted that when working together for the common goal of keeping vulnerable populations like veterans in MFHs [medical foster homes] safe during times of crisis, adaptation and collaboration facilitated the ongoing provision of high-quality care,” Dr. Haverhals’s group wrote. “Such collaboration has been shown to be critical in recent research in the United States on supporting older adults during the pandemic.”
Cari Levy, MD, PhD, a professor at the University of Colorado at Denver, Aurora, and a co-author of the study, specializes in palliative and telenursing home care for the VA.
Dr. Levy, who has worked for the VA for about 20 years, says how medical foster homes provided care during the pandemic carries lessons for civilian clinics. One of the most important lessons, she says, is that medical professionals will need to provide more care where people are, especially in populations that are too sick to get to the clinic.
“For years, there was all this hope that telehealth would expand,” but it took a pandemic to authorize approval from federal agencies to explode, she says. “I shudder to think what would have happened if we didn’t have telehealth. Fortunately, it was the right time to be able to flip a switch.”
Crisis aside, Dr. Levy says her dream would be for health care providers to do more home-based care. The model allows people to preserve the relational aspects of medicine, which can counteract a lot of the moral injury and burnout in the field, she says, adding:
“I see this as the kind of medicine many people intended to do when they got into medicine.”
A version of this article first appeared on WebMD.com.