User login
Improved cancer survival in states with ACA Medicaid expansion
compared with patients in states that did not adopt the expansion.
The finding comes from an American Cancer Society study of more than 2 million patients with newly diagnosed cancer, published online in the Journal of the National Cancer Institute.
The analysis also showed that the evidence was strongest for malignancies with poor prognosis such as lung, pancreatic, and liver cancer, and also for colorectal cancer.
Importantly, improvements in survival were larger in non-Hispanic Black patients and individuals residing in rural areas, suggesting there was a narrowing of disparities in cancer survival by race and rurality.
“Our findings provide further evidence of the importance of expanding Medicaid eligibility in all states, particularly considering the economic crisis and health care disruptions caused by the COVID-19 pandemic,” said lead author Xuesong Han, PhD, scientific director of health services research at the American Cancer Society, in a statement. “What’s encouraging is the American Rescue Plan Act of 2021 provides new incentives for Medicaid expansion in states that have yet to increase eligibility.”
The ACA provided states with incentives to expand Medicaid eligibility to all low-income adults under 138% federal poverty level, regardless of parental status.
As of last month, just 12 states have not yet opted for Medicaid expansion, even though the American Rescue Plan Act of 2021 provides new incentives for those remaining jurisdictions. But to date, none of the remaining states have taken advantage of these new incentives.
An interactive map showing the status of Medicare expansion by state is available here. The 12 states that have not adopted Medicare expansion (as of April) are Alabama, Florida, Georgia, Kansas, Mississippi, North Carolina, South Carolina, South Dakota, Tennessee, Texas, Wisconsin, and Wyoming.
The benefit of Medicaid expansion on cancer outcomes has already been observed in other studies. The first study to show a survival benefit was presented at the 2020 American Society of Clinical Oncology annual meeting. That analysis showed that cancer mortality declined by 29% in states that expanded Medicaid and by 25% in those that did not. The authors also noted that the greatest mortality benefit was observed in Hispanic patients.
Improved survival with expansion
In the current paper, Dr. Han and colleagues used population-based cancer registries from 42 states and compared data on patients aged 18-62 years who were diagnosed with cancer in a period of 2 years before (2010-2012) and after (2014-2016) ACA Medicaid expansion. They were followed through Sept. 30, 2013, and Dec. 31, 2017, respectively.
The analysis involved a total of 2.5 million patients, of whom 1.52 million lived in states that adopted Medicaid expansion and compared with 1 million patients were in states that did not.
Patients with grouped by sex, race and ethnicity, census tract-level poverty, and rurality. The authors note that non-Hispanic Black patients and those from high poverty areas and nonmetropolitan areas were disproportionately represented in nonexpansion states.
During the 2-year follow-up period, a total of 453,487 deaths occurred (257,950 in expansion states and 195,537 in nonexpansion states).
Overall, patients in expansion states generally had better survival versus those in nonexpansion states, the authors comment. However, for most cancer types, overall survival improved after the ACA for both groups of states.
The 2-year overall survival increased from 80.6% before the ACA to 82.2% post ACA in expansion states and from 78.7% to 80% in nonexpansion states.
This extrapolated to net increase of 0.44 percentage points in expansion states after adjusting for sociodemographic factors. By cancer site, the net increase was greater for colorectal cancer, lung cancer, non-Hodgkin’s lymphoma, pancreatic cancer, and liver cancer.
For Hispanic patients, 2-year survival also increased but was similar in expansion and nonexpansion states, and little net change was associated with Medicaid expansion.
“Our study shows that the increase was largely driven by improvements in survival for cancer types with poor prognosis, suggesting improved access to timely and effective treatments,” said Dr. Han. “It adds to accumulating evidence of the multiple benefits of Medicaid expansion.”
A version of this article first appeared on Medscape.com.
FDA authorizes Pfizer’s COVID booster for kids ages 5 to 11
emergency use authorization (EUA), allowing the Pfizer-BioNTech COVID-19 booster shot for children ages 5 to 11 who are at least 5 months out from their first vaccine series.

According to the most recent data from the Centers for Disease Control and Prevention, 28.6% of children in this age group have received both initial doses of Pfizer’s COVID-19 vaccine, and 35.3% have received their first dose.
Pfizer’s vaccine trial involving 4,500 children showed few side effects among children younger than 12 who received a booster, or third dose, according to a company statement.
Pfizer asked the FDA for an amended authorization in April, after submitting data showing that a third dose in children between 5 and 11 raised antibodies targeting the Omicron variant by 36 times.
“While it has largely been the case that COVID-19 tends to be less severe in children than adults, the omicron wave has seen more kids getting sick with the disease and being hospitalized, and children may also experience longer-term effects, even following initially mild disease,” FDA Commissioner Robert M. Califf, MD, said in a news release.
A study done by the New York State Department of Health showed the effectiveness of Pfizer’s two-dose vaccine series fell from 68% to 12% 4-5 months after the second dose was given to children 5 to 11 during the Omicron surge. A CDC study published in March also showed that the Pfizer shot reduced the risk of Omicron by 31% in children 5 to 11, a significantly lower rate than for kids 12 to 15, who had a 59% risk reduction after receiving two doses.
To some experts, this data suggest an even greater need for children under 12 to be eligible for a third dose.
“Since authorizing the vaccine for children down to 5 years of age in October 2021, emerging data suggest that vaccine effectiveness against COVID-19 wanes after the second dose of the vaccine in all authorized populations,” says Peter Marks, MD, PhD, the director of the FDA’s Center for Biologics Evaluation and Research.
The CDC still needs to sign off on the shots before they can be allowed. The agency’s Advisory Committee on Immunization Practices is set to meet on May 19 to discuss boosters in this age group.
FDA advisory panels plan to meet next month to discuss allowing Pfizer’s and Moderna’s COVID-19 vaccines for children under 6 years old.
A version of this article first appeared on WebMD.com.
emergency use authorization (EUA), allowing the Pfizer-BioNTech COVID-19 booster shot for children ages 5 to 11 who are at least 5 months out from their first vaccine series.
According to the most recent data from the Centers for Disease Control and Prevention, 28.6% of children in this age group have received both initial doses of Pfizer’s COVID-19 vaccine, and 35.3% have received their first dose.
Pfizer’s vaccine trial involving 4,500 children showed few side effects among children younger than 12 who received a booster, or third dose, according to a company statement.
Pfizer asked the FDA for an amended authorization in April, after submitting data showing that a third dose in children between 5 and 11 raised antibodies targeting the Omicron variant by 36 times.
“While it has largely been the case that COVID-19 tends to be less severe in children than adults, the omicron wave has seen more kids getting sick with the disease and being hospitalized, and children may also experience longer-term effects, even following initially mild disease,” FDA Commissioner Robert M. Califf, MD, said in a news release.
A study done by the New York State Department of Health showed the effectiveness of Pfizer’s two-dose vaccine series fell from 68% to 12% 4-5 months after the second dose was given to children 5 to 11 during the Omicron surge. A CDC study published in March also showed that the Pfizer shot reduced the risk of Omicron by 31% in children 5 to 11, a significantly lower rate than for kids 12 to 15, who had a 59% risk reduction after receiving two doses.
To some experts, this data suggest an even greater need for children under 12 to be eligible for a third dose.
“Since authorizing the vaccine for children down to 5 years of age in October 2021, emerging data suggest that vaccine effectiveness against COVID-19 wanes after the second dose of the vaccine in all authorized populations,” says Peter Marks, MD, PhD, the director of the FDA’s Center for Biologics Evaluation and Research.
The CDC still needs to sign off on the shots before they can be allowed. The agency’s Advisory Committee on Immunization Practices is set to meet on May 19 to discuss boosters in this age group.
FDA advisory panels plan to meet next month to discuss allowing Pfizer’s and Moderna’s COVID-19 vaccines for children under 6 years old.
A version of this article first appeared on WebMD.com.
FDA working to improve U.S. baby formula supply
The Food and Drug Administration announced on May 10 that it is taking several steps to improve the supply of baby formula in the United States.
The nationwide formula shortage has grown worse in recent weeks due to supply chain issues and a recall of certain Abbott Nutrition products, including major labels such as Similac, Alimentum, and EleCare.
“We recognize that many consumers have been unable to access infant formula and critical medical foods they are accustomed to using and are frustrated by their inability to do so,” FDA Commissioner Robert Califf, MD, said in a statement.
“We are doing everything in our power to ensure there is adequate product available where and when they need it,” he said.
About three-quarters of babies are fed formula for the first 6 months of their lives as a substitute for human milk, Axios reported.
In mid-February, the FDA warned consumers not to use certain powdered infant formula products from Abbott’s facility in Sturgis, Mich. Since then, the FDA has been working with Abbott and other manufacturers to increase the supply in the U.S. market.
“In fact, other infant formula manufacturers are meeting or exceeding capacity levels to meet current demand,” the FDA said in the statement. “Notably, more infant formula was purchased in the month of April than in the month prior to the recall.”
The FDA released a list of steps the agency is taking to increase supply, such as meeting with major infant formula makers to increase output and prioritize product lines in high demand, particularly specialty formulas for infants with allergies or specific diet needs.
But other manufacturers have struggled to quickly increase production because their operations tend to focus on a steady level of supply, according to The New York Times.
“Some industries are very good at ramping up and ramping down,” Rudi Leuschner, PhD, an associate professor of supply chain management at Rutgers Business School, Newark, N.J., told the newspaper.
“You flip a switch and they can produce 10 times as much,” he said. “Baby formula is not that type of a product.”
The FDA is also keeping an eye on the infant formula shortage by using the agency’s 21 Forward food supply chain continuity system. The system was developed during the pandemic to provide a full understanding of how COVID-19 is impacting food supply chains, the FDA said.
The FDA is compiling data on trends for in-stock rates at national and regional levels to understand where infant formula is available and where it should go.
Products are also being brought in from other countries, the FDA said. The agency is trying to speed up the process to get more formula into the U.S. and move it more quickly around the country.
For babies on a special diet, the FDA has decided to release some Abbott products that have been on hold at the Sturgis facility to those who need an urgent supply of metabolic formulas, on a case-by-case basis.
“In these circumstances, the benefit of allowing caregivers, in consultation with their health care providers, to access these products may outweigh the potential risk of bacterial infection,” the FDA said in the statement.
The FDA continues to advise against making homemade infant formulas and recommends talking to the child’s health care provider for recommendations on changing feeding practices or switching to other formulas, if necessary.
A version of this article first appeared on WebMd.com.
Is There a Relationship Between Facility Peer Review Findings and Quality in the Veterans Health Administration?
Hospital leaders report the most common aim of peer review (PR) is to improve quality and patient safety, thus it is a potentially powerful quality improvement (QI) driver.1 “When conducted systematically and credibly, peer review for quality management can result in both short-term and long-term improvements in patient care by revealing areas for improvement in the provision of care,” Veterans Health Administration (VHA) Directive 1190 states. “This ultimately contributes to organizational improvements.” At the same time, there are anecdotal concerns that PR may be used punitively and driven by case outcomes rather than by accepted best practices supporting QI.
Studies of the PR process suggest these concerns are valid. A key tenet of QI is standardization. PR is problematic in that regard; studies show poor interrater reliability for judgments on care, as well as hindsight bias—the fact that raters are strongly influenced by the outcome of care, not the process of care.2-5 There are concerns that case selection or review process when not standardized may be wielded as punitive too.6 In this study, we sought to identify the relationship between PR findings and subsequent institution quality metrics. If PR does lead to an improvement in quality, or if quality concerns are managed within the PR committee, it should be possible to identify a measurable relationship between the PR process and a facility’s subsequent quality measures.
A handful of studies describe the association between PR and quality of care. Itri and colleagues noted that random, not standardized PR in radiology does not achieve reductions in diagnostic error rate.7 However, adoption of just culture principles in PR resulted in a significant improvement in facility leaders’ self-reports of quality measures at surveyed institutions.8 The same author reported that increases in PR standardization and integration with performance improvement activities could explain up to 18% of objective quality measure variation.9
We sought to determine whether a specific aspect of the PR process, the PR committee judgment of quality of care by clinicians, was related to medical center quality in a cross-sectional study of 136 Veterans Health Administration (VHA) medical centers. The VHA is a good source of study because there are standardized PR processes and training for committee members and reviewers. Our hypothesis was that medical centers with a higher number of Level 2 (“most experienced and competent clinicians might have managed the case differently”) and Level 3 (“most experienced and competent providers would have managed the case differently”) PR findings would also have lower quality metric scores for processes and outcomes of care.
Methods
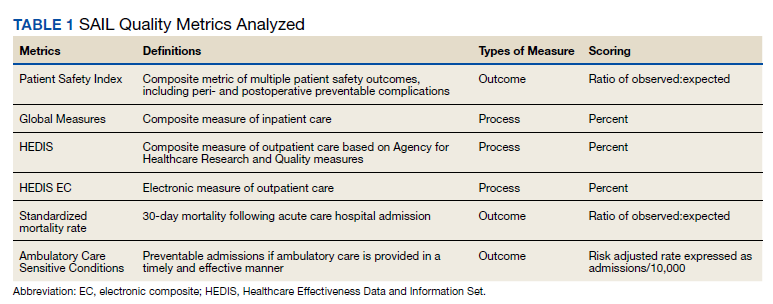
We used PR data from fiscal year 2018 and 2019. VHA PR data are available quarterly and are self-reported by each facility to the VHA Office of Clinical Risk Management. These data are broken down by facility. The following data, when available in both fiscal years 2018 and 2019, were used for this analysis: percent and number of PR that are ranked as level 1, 2, or 3; medical center group (MCG) acuity measure assigned by the VHA (1 is highest, 3 is lowest); and number of PR per 100,000 unique veteran encounters in 2019. Measures of facility quality are drawn from Strategic Analytics for Improvement and Learning (SAIL) data from 2019, which are available quarterly by facility and are rolling for 12 months. SAIL measures processes and outcomes of care. Table 1 indicates which measures are focused on outcomes vs quality processes.
SAS Version 9.2 was used to perform statistical analyses. We used Spearman correlation to estimate the PR and quality relationship.
Results
There were 136 facilities with 2 years of PR data available. The majority of these facilities (89) were highest complexity MCG 1 facilities; 19 were MCG 2, and 28 were MCG 3. Of 13,515 PRs, most of the 9555 PR findings were level 1 (70.7%). The between-facility range of level 2 and 3 findings was large, varying from 3.5% to nearly 70% in 2019 (Table 2). Findings were similar in 2018; facilities level 2 and 3 ratings ranged from 3.6% to 73.5% of all PR findings.
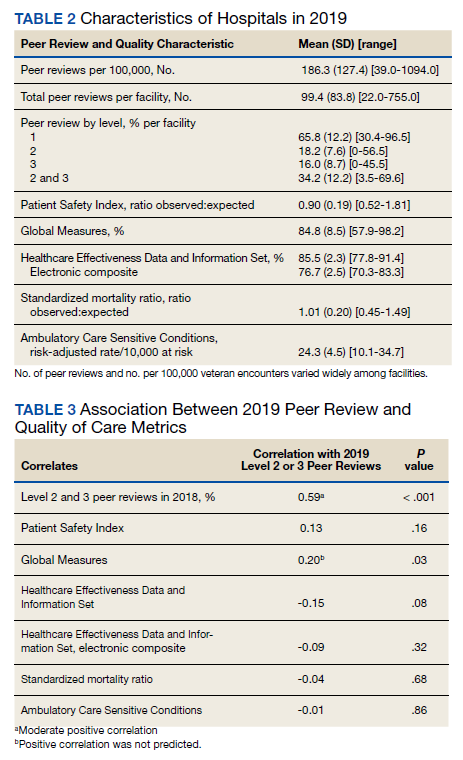
There was no correlation between most quality measures and facility PR findings (Table 3). The only exception was for Global Measures (GM90), an inpatient process of care measure. Unexpectedly, the correlation was positive—facilities with a higher percentage of level 2 and 3 PR findings had better inpatient processes of care SAIL score. The strongest correlation was between 2018 and 2019 PR findings.
Discussion
We hypothesized that a high percentage of level 2 and 3 PR findings would be negatively associated with objective facility measures of care processes in SAIL but we did not see this association. The only quality measure associated with PR findings was GM90, a score of inpatient care processes. However, the association was positive, with better performance associated with more level 2 and 3 PR findings.
The best predictor of the proportion of a facility’s PR findings is the previous year’s PR findings. With an R = 0.59, the previous year findings explain about 35% of the variability in level assignment. Our analysis may describe a new bias in PR, in which committees consistently assign either low or high proportions of level 2 and 3 findings. This correlation could be due to individual PR committee culture or composition, but it does not relate to objective quality measures.
Strengths
For this study we use objective measures of PR processes, the assignment of levels of care.
Limitations
Facilities self-report PR outcomes, so there could be errors in reporting. In addition, this study was cross sectional and not longitudinal and it is possible that change in quality measures over time are correlated with PR findings. Future studies using the VHA PR and SAIL data could evaluate whether changes over time, and perhaps in response to level 2 and 3 findings, would be a more sensitive indicator of the impact of the PR process on quality metrics. Future studies could incorporate the relationship between findings from the All Employee Survey, which is conducted annually, such as psychologic safety, as well as the distance the facility has gone on the high reliability organization journey, with PR findings and SAIL metrics. Finally, PR is focused on the practice of an individual clinician, while SAIL quality metrics reflect facility performance. Interventions possibly stay at the clinician level and do not drive subsequent QI processes.
What does this mean for PR? Since the early 1990s, there have been exhortations from experts to improve PR, by adopting a QI model, or for a deeper integration of PR and QI.1,2,10 Just culture tools, which include QI, are promoted as a means to improve PR.8,11,12 Other studies show PR remains problematic in terms of standardization, incorporation of best practices, redesigning systems of care, or demonstrable improvements to facility safety and care quality.1,4,6,8 Several publications have described interventions to improve PR. Deyo-Svedson discussed a program with standardized training and triggers, much like VHA.13 Itri and colleagues standardized PR in radiology to target areas of known diagnostic error, as well as use the issues assessed in PR to perform QI and education. One example of a successful QI effort involved changing the radiology reporting template to make sure areas that are prone to diagnostic error are addressed.7
Conclusions
Since 35% of PR level variance is correlated with prior year’s results, PR committees should look at increased standardization in reviews and findings. We endorse a strong focus on standardization, application of just culture tools to case reviews, and tighter linkage between process and outcome metrics measured by SAIL and PR case finding. Studies should be performed to pilot interventions to improve the linkage between PR and quality, so that greater and faster gains can be made in quality processes and, leading from this, outcomes. Additionally, future research should investigate why some facilities consistently choose higher or lower PR ratings.
Acknowledgments
We acknowledge Dr. George “Web” Ross for his helpful edits.
1. Edwards MT. In pursuit of quality and safety: an 8-year study of clinical peer review best practices in US hospitals. Int J Qual Health Care. 2018;30(8):602-607. doi:10.1093/intqhc/mzy069
2. Dans PE. Clinical peer Review: burnishing a tarnished icon. Ann Intern Med. 1993;118(7):566-568. doi:10.7326/0003-4819-118-7-199304010-00014
3. Goldman RL. The reliability of peer assessments of quality of care. JAMA. 1992;267(7):958-960. doi:10.1001/jama.1992.03480070074034
4. Swaroop R. Disrupting physician clinical practice peer review. Perm J. 2019;23:18-207. doi:10.7812/TPP/18-207
5. Caplan RA, Posner KL, Cheney FW. Effect of outcome on physician judgments of appropriateness of care. JAMA. 1991;265(15):1957–1960. doi:10.1001/jama.1991.03460150061024
6. Vyas D, Hozain AE. Clinical peer review in the United States: history, legal development and subsequent abuse. World J Gastroenterol. 2014;20(21):6357-6363. doi:10.3748/wjg.v20.i21.6357
7. Itri JN, Donithan A, Patel SH. Random versus nonrandom peer review: a case for more meaningful peer review. J Am Coll Radiol. 2018;15(7):1045-1052. doi:10.1016/j.jacr.2018.03.054
8. Edwards MT. An assessment of the impact of just culture on quality and safety in US hospitals. Am J Med Qual. 2018; 33(5):502-508. doi:10.1177/1062860618768057
9. Edwards MT. The objective impact of clinical peer review on hospital quality and safety. Am J Med Qual. 2011;26(2);110-119. doi:10.1177/1062860610380732
10. Berwick DM. Peer review and quality management: are they compatible?. QRB Qual Rev Bull. 1990;16(7):246-251. doi:10.1016/s0097-5990(16)30377-3
11. Volkar JK, Phrampus P, English D, et al. Institution of just culture physician peer review in an academic medical center. J Patient Saf. 2021;17(7):e689-e693. doi:10.1097/PTS.0000000000000449
12. Burns J, Miller T, Weiss JM, Erdfarb A, Silber D, Goldberg-Stein S. Just culture: practical implementation for radiologist peer review. J Am Coll Radiol. 2019;16(3):384-388. doi:10.1016/j.jacr.2018.10.021
13. Deyo-Svendsen ME, Phillips MR, Albright JK, et al. A systematic approach to clinical peer review in a critical access hospital. Qual Manag Health Care. 2016;25(4):213-218. doi:10.1097/QMH.0000000000000113
Hospital leaders report the most common aim of peer review (PR) is to improve quality and patient safety, thus it is a potentially powerful quality improvement (QI) driver.1 “When conducted systematically and credibly, peer review for quality management can result in both short-term and long-term improvements in patient care by revealing areas for improvement in the provision of care,” Veterans Health Administration (VHA) Directive 1190 states. “This ultimately contributes to organizational improvements.” At the same time, there are anecdotal concerns that PR may be used punitively and driven by case outcomes rather than by accepted best practices supporting QI.
Studies of the PR process suggest these concerns are valid. A key tenet of QI is standardization. PR is problematic in that regard; studies show poor interrater reliability for judgments on care, as well as hindsight bias—the fact that raters are strongly influenced by the outcome of care, not the process of care.2-5 There are concerns that case selection or review process when not standardized may be wielded as punitive too.6 In this study, we sought to identify the relationship between PR findings and subsequent institution quality metrics. If PR does lead to an improvement in quality, or if quality concerns are managed within the PR committee, it should be possible to identify a measurable relationship between the PR process and a facility’s subsequent quality measures.
A handful of studies describe the association between PR and quality of care. Itri and colleagues noted that random, not standardized PR in radiology does not achieve reductions in diagnostic error rate.7 However, adoption of just culture principles in PR resulted in a significant improvement in facility leaders’ self-reports of quality measures at surveyed institutions.8 The same author reported that increases in PR standardization and integration with performance improvement activities could explain up to 18% of objective quality measure variation.9
We sought to determine whether a specific aspect of the PR process, the PR committee judgment of quality of care by clinicians, was related to medical center quality in a cross-sectional study of 136 Veterans Health Administration (VHA) medical centers. The VHA is a good source of study because there are standardized PR processes and training for committee members and reviewers. Our hypothesis was that medical centers with a higher number of Level 2 (“most experienced and competent clinicians might have managed the case differently”) and Level 3 (“most experienced and competent providers would have managed the case differently”) PR findings would also have lower quality metric scores for processes and outcomes of care.
Methods
We used PR data from fiscal year 2018 and 2019. VHA PR data are available quarterly and are self-reported by each facility to the VHA Office of Clinical Risk Management. These data are broken down by facility. The following data, when available in both fiscal years 2018 and 2019, were used for this analysis: percent and number of PR that are ranked as level 1, 2, or 3; medical center group (MCG) acuity measure assigned by the VHA (1 is highest, 3 is lowest); and number of PR per 100,000 unique veteran encounters in 2019. Measures of facility quality are drawn from Strategic Analytics for Improvement and Learning (SAIL) data from 2019, which are available quarterly by facility and are rolling for 12 months. SAIL measures processes and outcomes of care. Table 1 indicates which measures are focused on outcomes vs quality processes.
SAS Version 9.2 was used to perform statistical analyses. We used Spearman correlation to estimate the PR and quality relationship.
Results
There were 136 facilities with 2 years of PR data available. The majority of these facilities (89) were highest complexity MCG 1 facilities; 19 were MCG 2, and 28 were MCG 3. Of 13,515 PRs, most of the 9555 PR findings were level 1 (70.7%). The between-facility range of level 2 and 3 findings was large, varying from 3.5% to nearly 70% in 2019 (Table 2). Findings were similar in 2018; facilities level 2 and 3 ratings ranged from 3.6% to 73.5% of all PR findings.
There was no correlation between most quality measures and facility PR findings (Table 3). The only exception was for Global Measures (GM90), an inpatient process of care measure. Unexpectedly, the correlation was positive—facilities with a higher percentage of level 2 and 3 PR findings had better inpatient processes of care SAIL score. The strongest correlation was between 2018 and 2019 PR findings.
Discussion
We hypothesized that a high percentage of level 2 and 3 PR findings would be negatively associated with objective facility measures of care processes in SAIL but we did not see this association. The only quality measure associated with PR findings was GM90, a score of inpatient care processes. However, the association was positive, with better performance associated with more level 2 and 3 PR findings.
The best predictor of the proportion of a facility’s PR findings is the previous year’s PR findings. With an R = 0.59, the previous year findings explain about 35% of the variability in level assignment. Our analysis may describe a new bias in PR, in which committees consistently assign either low or high proportions of level 2 and 3 findings. This correlation could be due to individual PR committee culture or composition, but it does not relate to objective quality measures.
Strengths
For this study we use objective measures of PR processes, the assignment of levels of care.
Limitations
Facilities self-report PR outcomes, so there could be errors in reporting. In addition, this study was cross sectional and not longitudinal and it is possible that change in quality measures over time are correlated with PR findings. Future studies using the VHA PR and SAIL data could evaluate whether changes over time, and perhaps in response to level 2 and 3 findings, would be a more sensitive indicator of the impact of the PR process on quality metrics. Future studies could incorporate the relationship between findings from the All Employee Survey, which is conducted annually, such as psychologic safety, as well as the distance the facility has gone on the high reliability organization journey, with PR findings and SAIL metrics. Finally, PR is focused on the practice of an individual clinician, while SAIL quality metrics reflect facility performance. Interventions possibly stay at the clinician level and do not drive subsequent QI processes.
What does this mean for PR? Since the early 1990s, there have been exhortations from experts to improve PR, by adopting a QI model, or for a deeper integration of PR and QI.1,2,10 Just culture tools, which include QI, are promoted as a means to improve PR.8,11,12 Other studies show PR remains problematic in terms of standardization, incorporation of best practices, redesigning systems of care, or demonstrable improvements to facility safety and care quality.1,4,6,8 Several publications have described interventions to improve PR. Deyo-Svedson discussed a program with standardized training and triggers, much like VHA.13 Itri and colleagues standardized PR in radiology to target areas of known diagnostic error, as well as use the issues assessed in PR to perform QI and education. One example of a successful QI effort involved changing the radiology reporting template to make sure areas that are prone to diagnostic error are addressed.7
Conclusions
Since 35% of PR level variance is correlated with prior year’s results, PR committees should look at increased standardization in reviews and findings. We endorse a strong focus on standardization, application of just culture tools to case reviews, and tighter linkage between process and outcome metrics measured by SAIL and PR case finding. Studies should be performed to pilot interventions to improve the linkage between PR and quality, so that greater and faster gains can be made in quality processes and, leading from this, outcomes. Additionally, future research should investigate why some facilities consistently choose higher or lower PR ratings.
Acknowledgments
We acknowledge Dr. George “Web” Ross for his helpful edits.
1. Edwards MT. In pursuit of quality and safety: an 8-year study of clinical peer review best practices in US hospitals. Int J Qual Health Care. 2018;30(8):602-607. doi:10.1093/intqhc/mzy069
2. Dans PE. Clinical peer Review: burnishing a tarnished icon. Ann Intern Med. 1993;118(7):566-568. doi:10.7326/0003-4819-118-7-199304010-00014
3. Goldman RL. The reliability of peer assessments of quality of care. JAMA. 1992;267(7):958-960. doi:10.1001/jama.1992.03480070074034
4. Swaroop R. Disrupting physician clinical practice peer review. Perm J. 2019;23:18-207. doi:10.7812/TPP/18-207
5. Caplan RA, Posner KL, Cheney FW. Effect of outcome on physician judgments of appropriateness of care. JAMA. 1991;265(15):1957–1960. doi:10.1001/jama.1991.03460150061024
6. Vyas D, Hozain AE. Clinical peer review in the United States: history, legal development and subsequent abuse. World J Gastroenterol. 2014;20(21):6357-6363. doi:10.3748/wjg.v20.i21.6357
7. Itri JN, Donithan A, Patel SH. Random versus nonrandom peer review: a case for more meaningful peer review. J Am Coll Radiol. 2018;15(7):1045-1052. doi:10.1016/j.jacr.2018.03.054
8. Edwards MT. An assessment of the impact of just culture on quality and safety in US hospitals. Am J Med Qual. 2018; 33(5):502-508. doi:10.1177/1062860618768057
9. Edwards MT. The objective impact of clinical peer review on hospital quality and safety. Am J Med Qual. 2011;26(2);110-119. doi:10.1177/1062860610380732
10. Berwick DM. Peer review and quality management: are they compatible?. QRB Qual Rev Bull. 1990;16(7):246-251. doi:10.1016/s0097-5990(16)30377-3
11. Volkar JK, Phrampus P, English D, et al. Institution of just culture physician peer review in an academic medical center. J Patient Saf. 2021;17(7):e689-e693. doi:10.1097/PTS.0000000000000449
12. Burns J, Miller T, Weiss JM, Erdfarb A, Silber D, Goldberg-Stein S. Just culture: practical implementation for radiologist peer review. J Am Coll Radiol. 2019;16(3):384-388. doi:10.1016/j.jacr.2018.10.021
13. Deyo-Svendsen ME, Phillips MR, Albright JK, et al. A systematic approach to clinical peer review in a critical access hospital. Qual Manag Health Care. 2016;25(4):213-218. doi:10.1097/QMH.0000000000000113
My choice? Unvaccinated pose outsize risk to vaccinated
according to a mathematical modeling study.
The study, which simulated patterns of infection among vaccinated and unvaccinated populations, showed that, as the populations mixed less, attack rates decreased among vaccinated people (from 15% to 10%) and increased among unvaccinated people (from 62% to 79%). The unvaccinated increasingly became the source of infection, however.
“When the vaccinated and unvaccinated mix, indirect protection is conferred upon the unvaccinated by the buffering effect of vaccinated individuals, and by contrast, risk in the vaccinated goes up,” lead author David Fisman, MD, professor of epidemiology at the University of Toronto, told this news organization.
As the groups mix less and less, the size of the epidemic increases among the unvaccinated and decreases among the vaccinated. “But the impact of the unvaccinated on risk in the vaccinated is disproportionate to the numbers of contacts between the two groups,” said Dr. Fisman.
The study was published online in the Canadian Medical Association Journal.
Relative contributions to risk
The researchers used a model of a respiratory viral disease “similar to SARS-CoV-2 infection with Delta variant.” They included reproduction values to capture the dynamics of the Omicron variant, which was emerging at the time. In the study, vaccines ranged in effectiveness from 40% to 80%. The study incorporated various levels of mixing between a partially vaccinated and an unvaccinated population. The mixing ranged from random mixing to like-with-like mixing (“assortativity”). There were three possible “compartments” of people in the model: those considered susceptible to infection, those considered infected and infectious, and those considered immune because of recovery.
The model showed that, as mixing between the vaccinated and the unvaccinated populations increased, case numbers rose, “with cases in the unvaccinated subpopulation accounting for a substantial proportion of infections.” However, as mixing between the populations decreased, the final attack rate decreased among vaccinated people, but the relative “contribution of risk to vaccinated people caused by infection acquired from contact with unvaccinated people ... increased.”
When the vaccination rate was increased in the model, case numbers among the vaccinated declined “as expected, owing to indirect protective effects,” the researchers noted. But this also “further increased the relative contribution to risk in vaccinated people by those who were unvaccinated.”
Self-regarding risk?
The findings show that “choices made by people who forgo vaccination contribute disproportionately to risk among those who do get vaccinated,” the researchers wrote. “Although risk associated with avoiding vaccination during a virulent pandemic accrues chiefly to those who are unvaccinated, the choice of some individuals to refuse vaccination is likely to affect the health and safety of vaccinated people in a manner disproportionate to the fraction of unvaccinated people in the population.”
The fact that like-with-like mixing cannot mitigate the risk to vaccinated people “undermines the assertion that vaccine choice is best left to the individual and supports strong public actions aimed at enhancing vaccine uptake and limiting access to public spaces for unvaccinated people,” they wrote.
Mandates and passports
“Our model provides support for vaccine mandates and passports during epidemics, such that vaccination is required for people to take part in nonessential activities,” said Dr. Fisman. The choice to not be vaccinated against COVID-19 should not be considered “self-regarding,” he added. “Risk is self-regarding when it only impacts the person engaging in the activity. Something like smoking cigarettes (alone, without others around) creates a lot of risk over time, but if nobody is breathing your secondhand smoke, you’re only creating risk for yourself. By contrast, we regulate, in Ontario, your right to smoke in public indoor spaces such as restaurants, because once other people are around, the risk isn’t self-regarding anymore. You’re creating risk for others.”
The authors also noted that the risks created by the unvaccinated extend beyond those of infection by “creating a risk that those around them may not be able to obtain the care they need.” They recommended that considerations of equity and justice for people who do choose to be vaccinated, as well as those who choose not to be, need to be included in formulating vaccination policy.
Illuminating the discussion
Asked to comment on the study, Matthew Oughton, MD, assistant professor of medicine at McGill University, Montreal, said: “It is easy to dismiss a mathematical model as a series of assumptions that leads to an implausible conclusion. ... However, they can serve to illustrate and, to an extent, quantify the results of complex interactions, and this study does just that.” Dr. Oughton was not involved in the research.
During the past 2 years, the scientific press and the general press have often discussed the individual and collective effects of disease-prevention methods, including nonpharmaceutical interventions. “Models like this can help illuminate those discussions by highlighting important consequences of preventive measures,” said Dr. Oughton, who also works in the division of infectious diseases at the Jewish General Hospital, Montreal.
It’s worth noting that the authors modeled vaccine effectiveness against all infection, “rather than the generally greater and more durable effects we have seen for vaccines in prevention of severe infection,” said Dr. Oughton. He added that the authors did not include the effect of vaccination in reducing forward transmission. “Inclusion of this effect would presumably have reduced overall infectious burden in mixed populations and increased the difference between groups at lower levels of mixing between populations.”
The research was supported by a grant from the Canadian Institutes of Health Research. Dr. Fisman has served on advisory boards related to influenza and SARS-CoV-2 vaccines for Seqirus, Pfizer, AstraZeneca, and Sanofi-Pasteur Vaccines and has served as a legal expert on issues related to COVID-19 epidemiology for the Elementary Teachers Federation of Ontario and the Registered Nurses Association of Ontario. Dr. Oughton disclosed no relevant financial relationships.
A version of this article first appeared on Medscape.com.
FROM THE CANADIAN MEDICAL ASSOCIATION JOURNAL
Hospital factors tied to lower maternal morbidity
A new study of hospitals in New York City suggests ways to reduce severe maternal morbidity (SMM). The researchers interviewed health care professionals in four institutions with low performance and four with high performance, and identified various themes associated with good performance.
“Our results raise the hypothesis that hospital learning collaboratives focused on optimizing organizational practices and policies, increasing clinician and staff awareness and education on maternal health disparities, and addressing structural racism may be important tools for improving equity in maternal outcomes,” the authors wrote in the study, published in Obstetrics & Gynecology.
The researchers conducted 50 semistructured interviews with health care professionals at lower-performing and higher-performing New York City hospitals, which were selected based on risk-adjusted morbidity metrics. The interviews explored various topics, including structural characteristics like staffing, organizational characteristics like culture and communication, labor and delivery practices such as teamwork and use of evidence-based practices, and racial and ethnic disparities.
The analysis revealed six broad areas that were stronger in high-performing hospitals: day-to-day involvement of leadership in quality activities, an emphasis on standards and standardized care, good communication and teamwork between nurses and physicians, good staffing and supervision among physicians and nurses, sharing of performance data with health care workers, and acknowledgment of the existence of racial and ethnic disparities and that bias can cause treatment differences.
“I think this qualitative approach is an important lens to pair with the quantitative approach. With such variability in severe maternal morbidity between hospitals in New York, it is not enough to just look at the quantitative data. To understand how to improve you must examine structures and processes. The structures, which are the physical and organizational characteristics in health care, and the process, which is how health care is delivered,” Veronica Gillispie-Bell, MD, wrote in a comment. Dr. Gillispie-Bell is medical director at Louisiana Perinatal Quality Collaborative and the Pregnancy-Associated Mortality Review for the Louisiana Department of Health.
“We know that high reliability organizations are those who are preoccupied with quality and safety. That means accountability from leadership (structure) and stability in standardization of care (processes). However, none of this matters if you do not have a culture that promotes safety. Based on the key findings of the high-performing hospitals, there was a culture that promoted safety and quality evidenced in the nurse-physician communication and the transparency around data through a lens of equity,” wrote Dr. Gillispie-Bell.
She noted that the study should encourage low-performing hospitals, since it illustrates avenues for improvement. Her personal experience reflects that, though she said that hospitals need help. The Louisiana Perinatal Quality Collaborative addressed severe maternal morbidity at birthing centers by implementing evidence-based best practices for management of hypertension and hemorrhage along with health equity measures. The team conducted coaching calls, in-person learning sessions, and in-person visits through a “Listening Tour.”
The result was a 35% reduction in hemorrhage overall and a reduction of 49% in hemorrhage in Black women, as well as hypertension by 12% overall between August 2018 and May 2020. Not all the news was good, as Black women still had an increase in severe maternal morbidity, possibly because of the COVID epidemic, since it is a risk factor for hypertension during pregnancy and infection rates are higher among Black individuals. “We need support for state based perinatal quality collaboratives to do this work and we need accountability as we are now seeing from metrics being implemented by [the Centers for Medicare & Medicaid Services]. Hospitals need to stratify their data by race and ethnicity to see where there are disparities in their outcomes,” said Dr. Gillispie-Bell.
The improvements are needed, given that the United States has the highest rates of maternal mortality and morbidity among developed countries, “most of which is preventable, and we have significant inequities by race and ethnicity,” said Laurie Zephyrin, MD, vice president for advancing health equity at the Commonwealth Fund. The question becomes how to effect change, and “there’s a lot happening in the policy space. Some of this policy change is directed at expanding insurance coverage, including more opportunities, including funding for community health workers and doulas, and thinking about how to incorporate midwives. There’s also work around how do we actually improve the care delivered by our health system.” Dr. Zephyrin added that the Department of Health & Human Services has contracted with the health improvement company Premier to use data and best-practices to improve maternal health.
The new work has the potential to be complementary to such approaches. “It provides some structure around how to approach some of the solutions, none of which I think is rocket science. It’s just something that needs to be focused on more intentionally,” said Dr. Zephyrin.
For example, the report found that high-performing hospitals had leaders who collaborated with frontline clinicians to share performance data, and this occurred in person, at departmental quality meetings, and during grand rounds. In contrast, staff in low-performing hospitals did not mention data feedback and some said that their institution made little effort to communicate performance metrics to frontline staff.
“One of the key lessons from the pandemic is that we need to have better data, and we need to have data around race and ethnicity to be able to understand the impact on marginalized communities. This study highlights that there’s more to be done around data to ensure that we can truly move the needle on advancing health equity,” said Dr. Zephyrin.
The researchers also found that clinicians in low-performing institutions did not acknowledge the presence of structural racism or differences in care associated with race or ethnicity. When they acknowledge differences in care, they attributed them to factors outside of the hospital’s control, such as patients not seeking out health care or not maintaining a healthy weight. Clinicians at high-performing hospitals were more likely to explicitly mention racism and bias and acknowledged that these factors could contribute to differences in care.
Dr. Gillispie-Bell and Dr. Zephyrin have no relevant financial disclosures.
FROM OBSTETRICS & GYNECOLOGY
Experts decry CDC’s long pause on neglected tropical disease testing
The Centers for Disease Control and Prevention has long been the premier reference lab for the United States and, for some diseases, internationally.
In September 2021, the CDC stated on its website that it would stop testing for parasites, herpesvirus encephalitis, human herpesvirus 6 and 7, Epstein-Barr virus, and other viruses, saying, “We are working diligently to implement laboratory system improvements.”
At the time, the CDC said testing would be halted only for a few months.
In response to a query from this news organization, a CDC spokesperson replied, “While at present we are unable to share a detailed timeline, our highest priority is to resume high-quality testing operations in a phased, prioritized approach as soon as possible and to offer the same tests that were available before the pause.”
Several global health clinicians told this news organization that they were not aware of the halt and that they are now uncertain about the specific diagnosis and best treatment for some patients. Other patients have been lost to follow-up.
In response, a group of tropical disease specialists who focus on neglected tropical diseases (NTDs) wrote an editorial, “Neglected Testing for Neglected Tropical Diseases at the CDC,” which recently appeared in the American Journal of Tropical Medicine and Hygiene (AJTMH).
NTDs are caused by viruses, bacteria, and parasites. They include leprosy and worms; many such diseases are disfiguring, such as filariasis (which causes the hugely swollen extremities of elephantiasis) and onchocerciasis (river blindness). They also include some viral and bacterial diseases. Their common denominator is that they are diseases of poverty, primarily in Africa, Asia, and Latin America, so they garner little attention from “first world” countries.
The loss of testing for two devastating parasites – Chagas and Leishmania – was particularly significant. Few other labs in the United States test for these, and the tests can be expensive and of variable quality, experts said.
Norman Beatty, MD, a global health physician at the University of Florida, told this news organization, “Chagas confirmatory testing is only available at the CDC and is the most reliable testing we have access to in the United States. Leishmania species identification is also only available at the CDC and is important in determining which antiparasitic medications we will use.”
Chagas disease is caused by the parasite Trypanosoma cruzi and is transmitted by triatomine bugs, also known as kissing bugs. Chagas is a major cause of an enlarged heart and congestive heart failure, as well as a dramatically enlarged esophagus or colon.
Prior to the cuts and before COVID-19, the CDC reported that they ran 10,000 to 15,000 tests for parasitic diseases annually. Testing requests declined during COVID. In 2021, they ran 1,003 tests for Chagas.
Dr. Beatty said that he first became aware of the CDC’s testing cuts last fall when he sought care for a patient. He was first told the delay would be 2-3 weeks, then another 2-3 weeks. It’s now been 7 months, and only three tests have been resumed.
Dr. Beatty added that for Chagas disease in particular, there is urgency in testing because cardiac complications can be life-threatening. He said that “a lot of these diseases can be considered rare, but they also have a tremendous ability to cause morbidity and mortality.”
Leishmania infections are also serious. Following the bite of an infected sandfly, they can cause disfiguring skin infections, but, more importantly, they can affect the liver, spleen, and bone marrow. Dr. Beatty said that since testing was dropped at the CDC, some colleagues had to send specimens outside of the country.
Dr. Beatty emphasized that the cuts in testing at the CDC highlight disparities in our society. “There are other commercial reference laboratories who may have some of these tests available, but the vast majority of people who suffer from diseases are underserved and vulnerable. [My patients] most definitely will not have access to advanced testing commercial laboratories,” Dr. Beatty said. Those laboratories include Associated Regional University Pathologists laboratories, Quest Diagnostics, and LabCorp Diagnostics. But for some parasitic infections, there will simply be no testing, and patients will not receive appropriate therapy.
The CDC’s website says, “USAID and CDC work together on a shared agenda to advance global progress towards the control and elimination of NTDs that can be addressed with preventive chemotherapy. ... CDC has strong working relationships with WHO, regional reference laboratories/bodies, [and] national NTD programs ... working with these partners through the provision of unique laboratory, diagnostic, and epidemiological technical assistance.”
The WHO Roadmap for 2030 aims to prevent and control many NTDs, in part by “providing new interventions and effective, standardized, and affordable diagnostics.” Last year, the CDC said that they “will continue working with WHO and other global partners to meet the established goals.”
But testing for a number of NTDs is not currently available at the CDC. In response to questions from this news organization, a CDC spokesperson said the agency “supports the development of country capacity for NTD testing required ... but does not perform testing related to the WHO Roadmap.”
A group of CDC officials wrote an editorial response that was published in AJTMH, saying the agency has “three main priorities: reducing parasitic disease-related death, illness, and disability in the United States; reducing the global burden of malaria; and eliminating targeted neglected tropical diseases.”
In response to this news organization’s interview request, a CDC spokesperson wrote, “CDC is unwavering in our commitment to provide the highest quality laboratory diagnostic services for parasitic diseases. We understand the concerns expressed in the editorial and the challenges the pause in testing for parasitic diseases presents for health care providers, particularly those treating people at elevated risk for parasitic diseases.”
Michael Reich, PhD, Dr. Beatty’s co-author, is an international health policy expert at Harvard. He and the physicians had approached CDC about the elimination of services. He said in an interview, “We’re still unable to get clear responses except for something along the lines of, ‘We are working on it. It is complicated. It takes time. We’re doing our best.’”
Dr. Reich added, “For me, this raises troubling issues both of transparency and accountability – transparency about what is going on and what the problems are, and accountability in terms of who’s being held responsible for the closures and the impacts on both public health and patient treatment.”
Dr. Beatty concluded, “I think the goal of our group was to bring more awareness to the importance of having a national laboratory that can service all people, even the most underserved and vulnerable populations.” He added, “Chagas disease is a disease of inequity in Latin Americans. Without having access to an appropriate laboratory such as the CDC, we would be taking a backwards approach to tackle neglected tropical diseases in our country and worldwide.”
Dr. Beatty and Dr. Reich report no relevant financial relationships.
A version of this article first appeared on Medscape.com.
CDC panel lists reasons to get second COVID booster
The Centers for Disease Control and Prevention is considering what to tell the public about second booster shots with mRNA vaccinations for COVID-19.
The U.S. Food and Drug Administration in March authorized a second booster dose of either the Pfizer-BioNTech or the Moderna COVID-19 vaccines for people aged 50 and older and certain immunocompromised adults, even though many top infectious disease experts questioned the need before the agency’s decision.
In a meeting April 20, the CDC asked its Advisory Committee on Immunization Practices to discuss second booster shots, but did not ask the group of experts to vote on formal recommendations.
Instead,
ACIP member Beth Bell, MD, MPH, of the University of Washington, Seattle, said she’s concerned about the potential for “booster fatigue.”
“A vaccination program that’s going to require boosting large proportions of the population every 4-6 months is really not sustainable and probably not something that most people want to participate in,” she said.
The benefit of additional COVID-19 shots for now appears to be smaller than what people get from the initial doses, Dr. Bell said.
Earlier in the meeting, CDC staff presented estimates about how well the COVID-19 vaccines work to prevent one case of hospitalization from the disease over 4 months among people aged 50 and older.
The major gain in preventing hospitalizations occurs with the first vaccination series and then wanes, the CDC said.
It appears that one hospitalization is prevented for every 135 people who get the first round of COVID-19 vaccinations. But it takes 674 people getting a first booster dose to prevent one hospitalization. A second booster prevents one hospitalization for every 1,205 people vaccinated.
Dr. Bell said she’s concerned about considering additional doses for “smaller and smaller return and creating an impression that we don’t have a very effective vaccination program,” even though the CDC’s data show a clear benefit.
Reasons to get a second booster
Elisha Hall, PhD, RD, of the CDC presented slides with some factors to help determine the urgency for a person to get a second booster:
- Having certain underlying medical conditions that increase the risk of severe COVID-19 illness.
- Being moderately or severely immunocompromised.
- Living with someone who is immunocompromised, at increased risk for severe disease, or who cannot be vaccinated because of age or contraindication.
- Being at increased risk of exposure to SARS-CoV-2, the virus that causes COVID-19, such as through occupational, institutional, or other activities (e.g., travel or large gatherings).
- Living or working in an area where there is a medium or high level of COVID-19 in the community.
In contrast, people might want to wait if they had been infected with SARS-CoV-2 within the past 3 months, Dr. Hall said in her presentation. Another reason for delay might be a concern that a booster dose may be more important later in the year.
The experts also addressed public confusion over boosters. For the Pfizer and Moderna mRNA vaccines, a second booster is a fourth dose, but for those who received the one-shot J&J vaccine, the second booster is a third dose.
Going forward, it may be easier to refer to subsequent doses as “annual boosters,” the CDC’s Sara Oliver, MD, MSPH, told the panel. It will be important to keep language about subsequent vaccinations clear and easy for the public to follow, she said.
Dr. Oliver also said there’s already been a drop-off in the acceptance of second rounds of COVID-19 vaccinations. CDC data show that 77% of people in the United States have had at least one dose of a COVID-19 vaccine, but only 66% of the population is fully vaccinated, and only 45% have had a first booster dose.
In her presentation, Dr. Oliver said the top priority in COVID-19 vaccination efforts remains initial vaccinations for people who haven’t gotten them.
Kids younger than 5
During the public comment session of the CDC meeting, several people called on the FDA to move quickly to expand authorization of COVID-19 vaccines to children aged 5 years and younger.
“We know that many parents and caregivers and health care providers are anxious to have COVID vaccines available” for young children, said Doran Fink, MD, PhD, a deputy director of the FDA’s vaccines division.
He said the agency is working to be ready to authorize the shots for young children while it awaits research results from the manufacturers.
A version of this article first appeared on WebMD.com.
FDA warns companies selling OTC skin lighteners
The as the active ingredient, and don’t meet the requirements to be sold legally over the counter. The letters were dated April 13.
The 12 products with hydroquinone are “unapproved drugs and are not generally recognized as safe and effective” (abbreviated as GRASE), the FDA said.
Among the side effects associated with hydroquinone products reported to the FDA are skin rashes, facial swelling, and skin discoloration or ochronosis. The discoloration can be permanent, the FDA said. The lighteners are marketed for use on age or dark spots on the skin associated with melasma.
Tri-Luma, a prescription product for the treatment of moderate to severe melasma of the face, is the only FDA-approved drug containing hydroquinone, according to the FDA. It contains 4% hydroquinone and two other ingredients. It is meant to be used under the supervision of a health care professional. Tri-Luma is indicated for up to 8 weeks of treatment for moderate to severe melasma of the face. The OTC products contain up to 2%. (Generic versions of 4% hydroquinone are available by prescription, dermatologists said.)
“Hydroquinone is a very effective medication, and that’s exactly what it is, a medication,” said Lily Talakoub, MD, a dermatologist in McLean, Va., who supports the FDA action. “It’s very effective and very safe to use in the right hands, but when it is overused or used in the wrong situation, it can cause problems.” Those problems often occur, she said, when there is no health care professional overseeing the use of the OTC products, and when people use them over the long term.
The FDA action to ban the OTC products is “very appropriate,” said dermatologist Pooja Sodha, MD, assistant professor and director of the Center for Laser and Cosmetic Dermatology at George Washington University, Washington. “We know patients pick this up [an OTC product] and use it without physician oversight.” When patients use the products longer than is appropriate, which is also common, it can worsen the initial skin issue, she said.
The action follows reforms finalized under the CARES Act (Coronavirus Aid, Relief and Economic Security Act), which included not only COVID-19 response efforts but also updated the method in which certain OTC drugs are regulated. Manufacturers of the skin lightening products that don’t have FDA approval had been told to remove the products from the market by September 2020.
The recent letters were sent to a dozen companies still marketing their products without an FDA new drug approval. The agency asked the companies to take prompt action and respond with 15 days, stating what they have done to correct the violations.
The 12 companies are AMBI Enterprises, Clinical Formula, Elements Brands Inc., Genomma Lab USA, Intilight/Dr Thomas Balshi, M&M Beauty and Wellness, Neoteric Cosmetics/Scott’s Liquid Gold, Skin Authority, Skin Pro, Skin PS Brands, True Earth Health Products, and Ultimark Products.
Health care professionals and consumers can report adverse reactions associated with these products to the FDA’s MedWatch Adverse Event Reporting program.
A version of this article first appeared on Medscape.com.
FDA to decide by June on future of COVID vaccines
April 6.
But members of the panel also acknowledged that it will be an uphill battle to reach that goal, especially given how quickly the virus continues to change.
The members of the Vaccines and Related Biological Products Advisory Committee said they want to find the balance that makes sure Americans are protected against severe illness and death but doesn’t wear them out with constant recommendations for boosters.
“We don’t feel comfortable with multiple boosters every 8 weeks,” said committee chairman Arnold Monto, MD, professor emeritus of public health at the University of Michigan, Ann Arbor. “We’d love to see an annual vaccination similar to influenza but realize that the evolution of the virus will dictate how we respond in terms of additional vaccine doses.”
The virus itself will dictate vaccination plans, he said.
The government must also keep its focus on convincing Americans who haven’t been vaccinated to join the club, said committee member Henry H. Bernstein, DO, given that “it seems quite obvious that those who are vaccinated do better than those who aren’t vaccinated.”
The government should clearly communicate to the public the goals of vaccination, he said.
“I would suggest that our overall aim is to prevent severe disease, hospitalization, and death more than just infection prevention,” said Dr. Bernstein, professor of pediatrics at Hofstra University, Hempstead, N.Y.
The FDA called the meeting of its advisers to discuss overall booster and vaccine strategy, even though it already authorized a fourth dose of the Pfizer and Moderna vaccines for certain immune compromised adults and for everyone over age 50.
Early in the all-day meeting, temporary committee member James Hildreth, MD, the president of Meharry Medical College, Nashville, Tenn., asked why that authorization was given without the panel’s input. Peter Marks, MD, the director of FDA’s Center for Biologics Evaluation and Research, said the decision was based on data from the United Kingdom and Israel that suggested immunity from a third shot was already waning.
Dr. Marks later said the fourth dose was “authorized as a stopgap measure until we could get something else in place,” because the aim was to protect older Americans who had died at a higher rate than younger individuals.
“I think we’re very much on board that we simply can’t be boosting people as frequently as we are,” said Dr. Marks.
Not enough information to make broader plan
The meeting was meant to be a larger conversation about how to keep pace with the evolving virus and to set up a vaccine selection and development process to better and more quickly respond to changes, such as new variants.
But committee members said they felt stymied by a lack of information. They wanted more data from vaccine manufacturers’ clinical trials. And they noted that so far, there’s no objective, reliable lab-based measurement of COVID-19 vaccine effectiveness – known as a correlate of immunity. Instead, public health officials have looked at rates of hospitalizations and deaths to measure whether the vaccine is still offering protection.
“The question is, what is insufficient protection?” asked H. Cody Meissner, MD, director of pediatric infectious disease at Tufts Medical Center in Boston. “At what point will we say the vaccine isn’t working well enough?”
Centers for Disease Control and Prevention officials presented data showing that a third shot has been more effective than a two-shot regimen in preventing serious disease and death, and that the three shots were significantly more protective than being unvaccinated.
In February, as the Omicron variant continued to rage, unvaccinated Americans aged 5 years and older had an almost three times higher risk of testing positive, and nine times higher risk of dying, compared with those who were considered fully vaccinated, said Heather Scobie, PhD, MPH, a member of the CDC’s COVID-19 Emergency Response team.
But only 98 million Americans – about half of those aged 12 years or older – have received a third dose, Dr. Scobie said.
It’s also still not clear how much more protection a fourth shot adds, or how long it will last. The committee heard data on a just-published study of a fourth dose of the Pfizer vaccine given to some 600,000 Israelis during the Omicron wave from January to March. The rate of severe COVID-19 was 3.5 times lower in the group that received a fourth dose, compared with those who had gotten only three shots, and protection lasted for at least 12 weeks.
Still, study authors said, any protection against infection itself was “short lived.”
More like flu vaccine?
The advisers discussed the possibility of making COVID-19 vaccine development similar to the process for the flu vaccine but acknowledged many difficulties.
The flu predictably hits during the winter in each hemisphere and a global surveillance network helps the World Health Organization decide on the vaccine strains each year. Then each nation’s regulatory and public health officials choose the strains for their shot and vaccine makers begin what is typically a 6-month-long manufacturing process.
COVID outbreaks have happened during all seasons and new variants haven’t always hit every country in a similar fashion. The COVID virus has mutated at five times the speed of the flu virus – producing a new dominant strain in a year, compared with the 3-5 years it takes for the flu virus to do so, said Trevor Bedford, PhD, a professor in the vaccine and infectious disease division at the Fred Hutchinson Cancer Research Center in Seattle.
Global COVID surveillance is patchy and the WHO has not yet created a program to help select strains for a COVID-19 vaccine but is working on a process. Currently, vaccine makers seem to be driving vaccine strain selection, said panelist Paul Offit, MD, professor of paediatrics at Children’s Hospital of Philadelphia. “I feel like to some extent the companies dictate the conversation. It shouldn’t come from them. It should come from us.”
“The important thing is that the public understands how complex this is,” said temporary committee member Oveta A. Fuller, PhD, associate professor of microbiology and immunology at the University of Michigan. “We didn’t get to understand influenza in 2 years. It’s taken years to get an imperfect but useful process to deal with flu.”
A version of this article first appeared on WebMD.com.