User login
White House announces long-COVID action plan
The National Research Action Plan on Long COVID will gather experts from various agencies, including the Department of Defense and the Department of Veterans Affairs, to expand existing long-COVID clinics and broaden research on symptoms of the virus that persist long after infection.
“We’ll collaborate with academic, industry, state and local partners to better understand long COVID,” Health and Human Services Secretary Xavier Becerra said at a White House briefing April 5. “We need to work as aggressively as we can to make sure no American is left behind.”
The plan will build on the RECOVER Initiative, a $1.15 billion effort announced last year that will study long COVID.
The COVID-19 Response Team also announced that the United States will donate tens of millions of pediatric coronavirus vaccines to other countries. More than 20 countries have asked for the donations, the team said.
The United States has delivered more than 500 million vaccine doses to 114 countries.
Meanwhile, national COVID-19 numbers continue to fall. CDC Director Rochelle Walensky, MD, reported that average daily cases are down 4% this week to 25,000; hospitalizations have dropped 17% to 1,400 per day; and daily deaths are down to 570 a day, which is a decrease of about 17%.
New national estimates show that Omicron’s subvariant BA.2 now accounts for 72% of circulating variants nationally, she said.
Top infectious disease expert Anthony Fauci, MD, reported that recent data supports the need for a second booster among certain people 50 and older – a move authorized by the Food and Drug Administration and Centers for Disease Control and Prevention last week.
“The effectiveness of the first booster dose we know wanes over time, and growing evidence shows a second dose can restore vaccine effectiveness for certain populations,” he said.
Dr. Fauci reported findings from an Israeli study of more than 1 million people 60 and older, which showed that an additional booster dose after 4 months lowered the rate of infection by two times and lowered the rate of severe infection by more than four times.
Another study from Israeli scientists showed that out of half a million people 60 and older, a second booster after 4 months brought a 78% reduction in death, compared to those who received only the first boost.
A version of this article first appeared on WebMD.com.
CDC recommends hep B vaccination for most adults
It also added that adults aged 60 years or older without known risk factors for hepatitis B may get vaccinated.
The agency earlier recommended the vaccination for all infants and children under the age of 19 years and for adults aged 60 years or older with known risk factors.
The CDC said it wants to expand vaccinations because, after decades of progress, the number of new hepatitis B infections is increasing among adults. Acute hepatitis B infections among adults lead to chronic hepatitis B disease in an estimated 2%-6% of cases, and can result in cirrhosis, liver cancer, and death.
Among adults aged 40-49 years, the rate of cases increased from 1.9 per 100,000 people in 2011 to 2.7 per 100,000 in 2019. Among adults aged 50-59 years, the rate increased during this period from 1.1 to 1.6 per 100,000.
Most adults aren’t vaccinated. Among adults aged 19 years or older, only 30.0% reported that they’d received at least the three recommended doses of the vaccine. The rate was 40.3% for adults aged 19-49 years, and 19.1% for adults aged 50 years or older.
Hepatitis B infection rates are particularly elevated among African Americans.
Even among adults with chronic liver disease, the vaccination rate is only 33.0%. And, among travelers to countries where the virus has been endemic since 1995, only 38.9% were vaccinated.
In a 2018 survey of internal medicine and family physicians, 68% said their patients had not told them about risk factors, making it difficult to assess whether the patients needed the vaccine according to the recommendations at the time. These risk factors include injection drug use, incarceration, and multiple sex partners, experiences the patients may not have been willing to discuss.
CDC researchers calculated that universal adult hepatitis B vaccination would cost $153,000 for every quality-adjusted life-year (QALY) gained. For adults aged 19-59 years, a QALY would cost $117,000 because infections are more prevalent in that age group.
The CDC specified that it intends its new guidelines to prompt physicians to offer the vaccine to adults aged 60 years or older rather than wait for them to request it.
The Food and Drug Administration has approved both three-dose and two-dose hepatitis B vaccines, with evidence showing similar seroprotection and adverse events.
People who have already completed their vaccination or have a history of hepatitis B infection should only receive additional vaccinations in specific cases, as detailed in the CDC’s 2018 recommendations.
A version of this article first appeared on Medscape.com.
FROM THE MMWR
As FDA OKs another COVID booster, some experts question need
, even though many top infectious disease experts questioned the need before the agency’s decision.
The FDA granted emergency use authorization for both Pfizer and Moderna to offer the second booster – and fourth shot overall – for adults over 50 as well as those over 18 with compromised immune systems.
The Centers for Control and Prevention must still sign off before those doses start reaching American arms. That approval could come at any time.
“The general consensus, certainly the CDC’s consensus, is that the current vaccines are still really quite effective against Omicron and this new BA.2 variant in keeping people out of the hospital, and preventing the development of severe disease,” William Schaffner, MD, an infectious disease specialist at Vanderbilt University in Nashville said prior to the FDA’s announcement March 29.
Of the 217.4 million Americans who are “fully vaccinated,” i.e., received two doses of either Pfizer or Moderna’s vaccines or one dose of the Johnson & Johnson vaccine, only 45% have also received a booster shot, according to the CDC.
“Given that, there’s no need at the moment for the general population to get a fourth inoculation,” Dr. Schaffner says. “Our current focus ought to be on making sure that as many people as possible get that [first] booster who are eligible.”
Monica Gandhi, MD, an infectious disease specialist at the University of California, San Francisco, agreed that another booster for everyone was unnecessary. The only people who would need a fourth shot (or third, if they had the Johnson & Johnson vaccine initially) are those over age 65 or 70 years, Dr. Gandhi says.
“Older people need those antibodies up high because they’re more susceptible to severe breakthroughs,” she said, also before the latest development.
To boost or not to boost
Daniel Kuritzkes, MD, chief of infectious diseases at Brigham & Women’s Hospital in Boston, said the timing of a booster and who should be eligible depends on what the nation is trying to achieve with its vaccination strategy.
“Is the goal to prevent any symptomatic infection with COVID-19, is the goal to prevent the spread of COVID-19, or is the goal to prevent severe disease that requires hospitalization?” asked Dr. Kuritzkes.
The current vaccine — with a booster — has prevented severe disease, he said.
An Israeli study showed, for instance, that a third Pfizer dose was 93% effective against hospitalization, 92% effective against severe illness, and 81% effective against death.
A just-published study in the New England Journal of Medicine found that a booster of the Pfizer vaccine was 95% effective against COVID-19 infection and that it did not raise any new safety issues.
A small Israeli study, also published in NEJM, of a fourth Pfizer dose given to health care workers found that it prevented symptomatic infection and illness, but that it was much less effective than previous doses — maybe 65% effective against symptomatic illness, the authors write.
Giving Americans another booster now — which has been shown to lose some effectiveness after about 4 months — means it might not offer protection this fall and winter, when there could be a seasonal surge of the virus, Dr. Kuritzkes says.
And, even if people receive boosters every few months, they are still likely to get a mild respiratory virus infection, he said.
“I’m pretty convinced that we cannot boost ourselves out of this pandemic,” said Dr. Kuritzkes. “We need to first of all ensure there’s global immunization so that all the people who have not been vaccinated at all get vaccinated. That’s far more important than boosting people a fourth time.”
Booster confusion
The April 6 FDA meeting of the agency’s Vaccines and Related Biological Products Advisory Committee comes as the two major COVID vaccine makers — Pfizer and Moderna — have applied for emergency use authorization for an additional booster.
Pfizer had asked for authorization for a fourth shot in patients over age 65 years, while Moderna wanted a booster to be available to all Americans over 18. The FDA instead granted authorization to both companies for those over 50 and anyone 18 or older who is immunocompromised.
What this means for the committee’s April 6 meeting is not clear. The original agenda says the committee will consider the evidence on safety and effectiveness of the additional vaccine doses and discuss how to set up a process — similar to that used for the influenza vaccine — to be able to determine the makeup of COVID vaccines as new variants emerge. That could lay the groundwork for an annual COVID shot, if needed.
The FDA advisers will not make recommendations nor vote on whether — and which — Americans should get a COVID booster. That is the job of the CDC’s Advisory Committee on Immunization Practices (ACIP).
The last time a booster was considered, CDC Director Rochelle Walensky, MD, overrode the committee and recommended that all Americans — not just older individuals — get an additional COVID shot, which became the first booster.
That past action worries Dr. Gandhi, who calls it confusing, and says it may have contributed to the fact that less than half of Americans have since chosen to get a booster.
Dr. Schaffner says he expects the FDA to authorize emergency use for fourth doses of the Pfizer and Moderna vaccines, but he doesn’t think the CDC committee will recommend routine use. As was seen before, however, the CDC director does not have to follow the committee’s advice.
The members of ACIP “might be more conservative or narrower in scope in terms of recommending who needs to be boosted and when boosting is appropriate,” Dr. Kuritzkes says.
Dr. Gandhi says she’s concerned the FDA’s deliberations could be swayed by Moderna and Pfizer’s influence and that “pharmaceutical companies are going to have more of a say than they should in the scientific process.”
There are similar worries for Dr. Schaffner. He says he’s “a bit grumpy” that the vaccine makers have been using press releases to argue for boosters.
“Press releases are no way to make vaccine recommendations,” Dr. Schaffner said, adding that he “would advise [vaccine makers] to sit down and be quiet and let the FDA and CDC advisory committee do their thing.”
Moderna Chief Medical Officer Paul Burton, MD, however, told WebMD last week that the signs point to why a fourth shot may be needed.
“We see waning of effectiveness, antibody levels come down, and certainly effectiveness against Omicron comes down in 3 to 6 months,” Burton said. “The natural history, from what we’re seeing around the world, is that BA.2 is definitely here, it’s highly transmissible, and I think we are going to get an additional wave of BA.2 here in the United States.”
Another wave is coming, he said, and “I think there will be waning of effectiveness. We need to be prepared for that, so that’s why we need the fourth dose.”
Supply issues?
Meanwhile, the United Kingdom has begun offering boosters to anyone over 75, and Sweden’s health authority has recommended a fourth shot to people over age 80.
That puts pressure on the United States — at least on its politicians and policymakers — to, in a sense, keep up, said the infectious disease specialists.
Indeed, the White House has been keeping fourth shots in the news, warning that it is running out of money to ensure that all Americans would have access to one, if recommended.
On March 23, outgoing White House COVID-19 Response Coordinator Jeff Zients said the federal government had enough vaccine for the immunocompromised to get a fourth dose “and, if authorized in the coming weeks, enough supply for fourth doses for our most vulnerable, including seniors.”
But he warned that without congressional approval of a COVID-19 funding package, “We can’t procure the necessary vaccine supply to support fourth shots for all Americans.”
Mr. Zients also noted that other countries, including Japan, Vietnam, and the Philippines had already secured future booster doses and added, “We should be securing additional supply right now.”
Dr. Schaffner says that while it would be nice to “have a booster on the shelf,” the United States needs to put more effort into creating a globally-coordinated process for ensuring that vaccines match circulating strains and that they are manufactured on a timely basis.
He says he and others “have been reminding the public that the COVID pandemic may indeed be diminishing and moving into the endemic, but that doesn’t mean COVID is over or finished or disappeared.”
Dr. Schaffner says that it may be that “perhaps we’d need a periodic reminder to our immune system to remain protected. In other words, we might have to get boosted perhaps annually like we do with influenza.”
A version of this article first appeared on WebMD.com.
Congress opens investigation into FDA’s handling of a problematic heart device
A congressional oversight subcommittee is investigating the Food and Drug Administration’s regulation of a high-risk heart pump, citing safety issues detailed by ProPublica.
The HeartWare Ventricular Assist Device, created to treat patients with severe heart failure, stopped meeting key federal standards as early as 2014. But the FDA took no decisive action even as those problems persisted, and thousands of Americans continued to be implanted with the pump.
By the end of 2020, the FDA had received more than 3,000 reports of deaths related to the HeartWare device, according to a ProPublica data analysis. A father of four died as his children tried to resuscitate him when his device suddenly stopped. A teenager died after vomiting blood in the middle of the night, while his mother struggled to restart a faulty pump.
“I am concerned by FDA’s slow action, over multiple administrations, to protect patients from this product despite early warning signs,” Rep. Raja Krishnamoorthi, D-Ill., said in a scathing letter sent March 22 to the agency’s commissioner, Robert Califf, MD.
Mr. Krishnamoorthi, the chairman of the U.S. House Committee on Oversight and Reform’s Subcommittee on Economic and Consumer Policy, requested information on how the FDA made regulatory decisions related to the HeartWare device and why it didn’t take further action.
The FDA did not provide comment to ProPublica on the subcommittee’s investigation and said it would respond directly to Mr. Krishnamoorthi. It also reiterated its response to ProPublica’s findings and said the agency had been closely overseeing the HeartWare device since 2012, with patient safety as its “highest priority.”
Medtronic, the company that acquired HeartWare in 2016, took the device off the market in June 2021. The company said that new data showed a competing heart pump had better outcomes. In response to the ProPublica investigation 2 months later, the company said it took the FDA’s inspections seriously and had worked closely with the agency to address issues with the device.
Medtronic declined to comment on the subcommittee’s investigation.
Mr. Krishnamoorthi asked in the letter if any steps were being taken to address how patients, doctors and other federal agencies are notified of problems that the FDA finds with medical devices.
Many patients told ProPublica they were never informed of issues with the HeartWare pump before or after their implants. Some people who still have the device said they weren’t told when it was taken off the market. Medtronic said in December it had confirmed 90% of U.S. patients had received notification of the HeartWare discontinuation, but that it was still working to reach the other 10%.
About 2,000 patients still had HeartWare pumps as of last year. The FDA and Medtronic recommended against removing those devices barring medical necessity because the surgery to do so carries a high risk.
In his letter, Mr. Krishnamoorthi gave the FDA a deadline of April 5 to respond.
This story was originally published on ProPublica. ProPublica is a nonprofit newsroom that investigates abuses of power. Sign up to receive their biggest stories as soon as they’re published.
Evaluation of the Empower Veterans Program for Military Veterans With Chronic Pain
From Neurology/Chronic Pain Management Services, Department of Veterans Affairs (VA) Maryland Health Care System, Baltimore VA Medical Center, Baltimore, MD (Dr. Uche), and School of Nursing, Washburn University, Topeka, KS (Drs. Jamison and Waugh).
Abstract
Objective: The purpose of this quality improvement project was to abstract and analyze previously collected data from veterans with high-impact chronic pain who attended the Empower Veterans Program (EVP) offered by a Veterans Administration facility in the northeastern United States.
Methods: This quality improvement project used data collected from veterans with chronic pain who completed the veterans health care facility’s EVP between August 2017 and August 2019. Pre- and post-intervention data on pain intensity, pain interference, quality of life, and pain catastrophizing were compared using paired t-tests.
Results: Although data were abstracted from 115 patients, the final sample included
Conclusion: Veterans with chronic high-impact noncancer pain who completed the EVP had reduced pain intensity, pain interference, pain catastrophizing as well as improved quality of life and satisfaction with their health.
Keywords: musculoskeletal pain, Veterans Affairs, complementary and integrative health, acceptance and commitment therapy, mind-body therapies, whole health, multidisciplinary pain management.
More than 100 million American adults suffer from chronic pain; costs associated with managing chronic pain are approximately $635 billion
One such program is the Empower Veterans Program (EVP). Originally developed at the Atlanta Veterans Affairs Health Care System, the EVP is a CIH modality based on the biopsychosocial model of pain developed by psychiatrist George Engel in 1977.3 The biopsychosocial model of pain recognizes that pain is a complex, multidimensional, biopsychosocial experience. Under this model, the mind and body work in unison as interconnected entities. Because the model acknowledges biological, psychological, and social components of pain and illness,4 treatment focuses on all aspects of a person’s health, life, and relationships.
The EVP fits into the VHA Pain Management Stepped Care Model and is an adjunctive complement for that model.5-7 The EVP complements care at the first step, where patient/family provide self-care and where care is provided by patient-aligned primary care teams, at the second step, which includes secondary consultation with multidisciplinary pain medicine specialty teams and other specialists, and at the third step, with the addition of tertiary interdisciplinary pain centers.
The VA Maryland Health Care System (VAMHCS) implemented the EVP as part of a quality improvement project for the management of chronic pain. The objectives of the program were to reduce pain intensity, pain catastrophizing, and pain interference, as well as improve functionality and quality of life among veterans with chronic high-impact noncancer pain. More than 2 years after the program was implemented, collected data had not been analyzed. The purpose of this quality improvement project was to abstract and analyze the previously collected data from veterans with high-impact chronic pain who attended an EVP offered by the VAMHCS. The results of the data analysis were used to inform decisions regarding the future of the program.
Methods
This quality improvement project used the Plan-Do-Study-Act (PDSA) process.8 The first 2 phases of the PDSA cycle (Plan and Do) were completed by a team of VA employees from the VAMHCS, who donated their time to establish and implement the program at the project site. This team consisted of psychologists, a physical therapist, a social worker, and a chaplain, and included support from medical administrative staff. This team planned and implemented the EVP at the VA facility based on the model developed at the Atlanta VA Health Care System. During the “Do” phase, the team collected data on pain intensity, pain interference, quality of life, and pain negative cognition (catastrophizing) before the intervention and post intervention. They also collected data on program outcome (patient treatment satisfaction) post intervention. Because these employees did not have time to retrieve and analyze the data, they welcomed the opportunity to have the data analyzed by the investigators during the Study phase of the PDSA cycle. Based on the results of the analysis, recommendations for program changes were made during the Act phase of the cycle.
Intervention
The EVP was developed as a 10-week (30 hours) interdisciplinary CIH approach that coached veterans with chronic pain to live fuller lives based on their individual values and what matters to them. EVP is the “What Else” management modality for the 5% of veterans with high-impact chronic pain.9 The EVP provided functional restoration through its components of whole health, mindfulness training, coaching calls, acceptance and commitment therapy, and mindful movement. It used the Wheel of Health with the 4 key components of me, self-care, professional care, and community.10,11
Veterans who had a diagnosis of chronic nonmalignant pain for 3 months or more and who agreed to participate in the EVP at this facility attended 3-hour classes every Tuesday with a cohort of 8 to 12 peers and engaged in one-on-one coaching with interdisciplinary team members. During the class sessions, veterans were coached to understand and accept their pain and commit to maintaining function despite their pain. Mindful movement by the physical therapist emphasized the pivotal place of exercise in pain management. The therapist used the mantra “Motion is Lotion.”9 The guiding principle of the EVP was that small incremental changes can have a big impact on the individual’s whole life. Emphasis was placed on increasing self-efficacy and mindful awareness for veterans with high-impact pain by giving them “Skills before Pills.”9
Outcome Measures
Outcome measures included the Numerical Pain Rating Scale (NPRS), the Multidimensional Pain Inventory (MPI), the World Health Organization Quality of Life assessment (WHOQOL-BREF), the Pain Catastrophizing Scale (PCS), and the Pain Treatment Satisfaction Scale (PTSS). Cronbach alpha coefficients were calculated to assess internal consistency reliability of these measures in the sample of veterans who completed the EVP.
NPRS. The NPRS is ubiquitous as a screening tool in many health care environments and its use is mandated by the VA health care system.12 The choice of the NPRS as the tool for pain screening in the VA health care system was based on a large body of research that supports the reliability and validity of the NPRS as a single index of pain intensity or severity. Studies suggest that the NPRS is valid for use in the assessment of acute, cancer, or chronic nonmalignant pain and in varied clinical settings.13 The NPRS has 4 items, each on a scale of 0 to 10. For the purpose of this project, only 3 items were used. The 3 items assessed the worst pain, usual pain, and the current pain (right now). The higher the score, the higher the pain intensity. Cronbach alpha coefficients on the NPRS obtained from the current sample of veterans were 0.85 on both pre- and postintervention assessments.
MPI. The MPI is an easily accessible, reliable, and valid self-report questionnaire that measures the impact of pain on an individual’s life, quality of social support, and general activity.14 This instrument is a short version of the West Haven-Yale MPI.15 The MPI contains 9 items rated on a scale from 0 to 6. The higher the score, the greater pain interference a person is experiencing. The MPI produces reliable, valid information for diagnostic purposes and for therapy outcome studies.16 The MPI had a Cronbach alpha of 0.90 on pre-intervention and 0.92 on postintervention assessments in the current sample.
WHOQOL-BREF. The WHOQOL-BREF is a measure of quality of life and is an abbreviated version of the WHOQOL-100. Quality of life is defined by the World Health Organization17 “as an individuals’ perception of their position in life in the context of the culture and value systems in which they live and in relation to their goals, expectations, standards and concerns.” The WHOQOL-BREF contains 26 items. The first 2 items were examined separately; the first item asks individuals to rate their overall quality of life and the second asks individuals how satisfied they are with their health. The remaining 24 items were used to calculate the following 4 domain scores: physical health, psychological health, social relationship, and environment.18 Each item is measured on a scale of 1 to 5. Higher scores denote higher or better quality of life. Domain scores have demonstrated good reliability and validity.19-21 Cronbach alpha coefficients for the domain subscales ranged from 0.63 to 0.84 in the current sample, with the lowest alphas for the 3-item Social Relationships Domain.
PCS. The PCS is a widely used measure of catastrophic thinking related to pain. Catastrophizing has been conceived by Sullivan and colleagues as “an exaggerated negative mental set brought to bear during actual or anticipated painful experience.”22 The PCS provides a total score and scores for the following subscales: rumination, magnification, and helplessness.23 It has been used in a variety of chronic pain populations and has demonstrated good reliability and validity in clinical as well as nonclinical samples.24-26 The PCS has 13 items rated on a scale of 0 to 4. Higher scores mean greater negative pain cognition (catastrophizing). In the current sample, the PCS total scale had a Cronbach alpha coefficient of 0.95 and 0.94 on the 2 assessments. The coefficients for the subscales ranged from 0.81 to 0.90.
PTSS. The PTSS is a 5-item tool that measures patient satisfaction with pain treatment. It includes items that address overall satisfaction, staff warmth, staff skill level, ease of scheduling appointments, and recommendation of the program to other veterans. It was derived from the post-treatment version of The Pain Outcome Questionnaire-VA and has demonstrated reliability and validity.27 The questions are scaled from 0 to 10. High scores on the PTSS denote high patient satisfaction with the EVP. The Cronbach alpha coefficient on the PTSS obtained from the current sample was 0.80.
Data Gathering and Analysis
Prior to starting the Study phase, Washburn University’s Institutional Review Board (IRB) and the VA IRB approved the project. The VA IRB, through its affiliate, gave a Not Human Research Determination and granted a waiver of informed consent and the Health Insurance Portability and Accountability Act authorization. The VA facility’s Research and Development department also approved the quality improvement project.
Once these approvals were obtained, the Study phase began with the abstraction of retrospective data obtained from veterans who participated in the VA health care facility’s EVP between
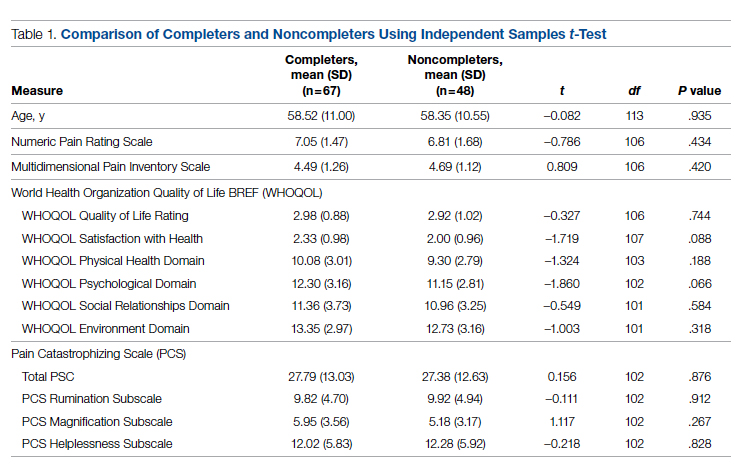
Veterans who completed the program were compared to veterans who did not complete the program on age, gender, and baseline measures. The investigators used independent samples t-tests to compare completers and noncompleters on age, pain intensity, pain interference, quality of life, and pain catastrophizing. They used the chi-square test of independence to analyze the association between gender and program completion.
Data were included in the pre- and postintervention analysis if the veteran completed the NPRS, MPI, WHOQOL-BREF, and PCS pre and post intervention. This became an important eligibility requirement as some of the tools/measures were changed towards the end of the review period in 2019. Pre- and postintervention data on pain intensity, pain interference, quality of life, pain catastrophizing, and patient satisfaction were compared using paired samples t-test at .004 level of significance based on the Bonferroni correction.28 Data on patient satisfaction with pain treatment were collected at program completion (week 8 or 10) and were analyzed using descriptive statistics.
Effect sizes (Cohen’s d) were calculated to determine the substantive significance or magnitude of the mean differences in scores. Effect sizes (expressed as absolute values of Cohen’s d) were calculated as the mean difference divided by the standard deviation. Values of 0.2 were considered a small effect size, 0.5 a medium effect size, and 0.8 a large effect size.29
Results
Data were abstracted for 115 veterans who started the EVP. Of these, 48 left the program, leaving 67 veterans (58%) who completed the program. Completers and noncompleters were similar in age, gender, and baseline measures (Table 1). Fifty-three (79%) completers and 35 (73%) noncompleters were male. A chi-square test of independence showed no significant association between gender and program completion (χ21 [N = 115] = .595, P = .440).
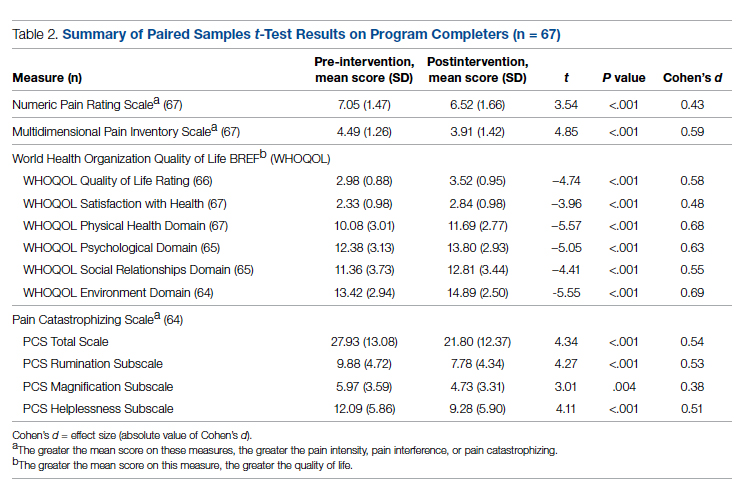
Comparison of pre-and postintervention mean scale scores resulted in statistically significant
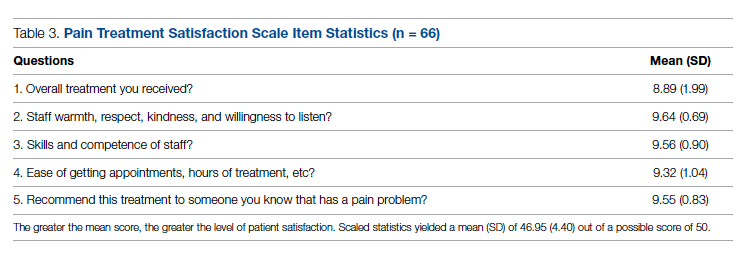
Analysis of data obtained using the PTSS yielded high mean scores for items that focused on patient satisfaction with treatment (Table 3). Scaled statistics yielded a mean (SD) of 46.95 (4.40). These results denoted overall patient satisfaction with the EVP.
Discussion
The purpose of this quality improvement project was to abstract and analyze previously collected data from veterans with high-impact chronic pain who attended the EVP. Comparison of pre-intervention and postintervention data obtained from 67 veterans who completed the program revealed improvements in pain intensity, pain interference, negative cognition (catastrophizing), and quality of life. The differences were statistically significant and clinically meaningful, with medium and large effect sizes. In addition, veterans reported high satisfaction with the EVP.
The EVP includes CIH approaches that have demonstrated effectiveness among veterans and other populations with chronic pain. A wealth of studies, for example, support the effectiveness of CIH approaches among veterans.30-34 Other studies focus on specific CIH approaches that are components of the EVP. Evidence supports, for example, the efficacy of mindfulness-based stress reduction,35-39 acceptance and commitment therapy,40-43 brief peer support intervention,44 and interdisciplinary biopsychosocial rehabilitation.45,46
While empirical evidence supports components of the EVP, only one study focused on the outcomes of the Atlanta VA EVP among veterans with chronic pain. Results of a qualitative study conducted by Penney and Haro47 described the experience of veterans with the EVP. Those veterans reported adopting new self-care or lifestyle practices for pain management and health, accepting pain, being better able to adjust and set boundaries, feeling more in control, participating in life, and changing their medication use.
The mean baseline scores from the current sample were similar to samples of patients with chronic pain in other studies (NPRS,48 MPI,48 and PCS48-51). After converting scores on the WHOQOL-BREF from those that ranged from 4 to 20 to those that ranged from 0 to 100,18 the scores from the current sample were similar to those of other studies of patients with chronic pain.48,52,53Several strengths of the project should be noted. Data were collected using well established measurement tools that had previously demonstrated reliability and validity. All the tools used in data collection demonstrated good internal consistency reliabilities in the current sample of veterans. Weaknesses of the project include the use of a convenience sample of veterans and small sample size. Data were not available on the number of veterans who were offered participation or on how many veterans declined enrollment. The sample of veterans who chose to participate in the EVP may or may not have been representative of the population of veterans with high-impact chronic pain. As a pre- and postintervention design with no comparison group, the results are subject to multiple threats to internal validity, including the Hawthorne effect, maturation in the form of healing, and attrition. Reasons for leaving the program had not been recorded, so the investigators had no way of knowing factors that may have contributed to attrition. Also, data on when veterans left the program were unavailable. Research is needed with a control group to reduce the effect of confounding variables on the outcome measures. This project used data collected at a single VA facility, which limits its generalizability.
While completers and noncompleters of the EVP were similar on age, gender, and baseline measures, there may have been unidentified characteristics that influenced program completion. The investigators noticed the presence of more missing data among noncompleters compared to completers on the pre-intervention PCS; thus, noncompleters may have scored lower than completers on this instrument simply because there were more individual items that were unanswered/missing among this group of noncompleters.
Data were analyzed using a limited number of outcome measures that had previously been collected. Other outcome measures might include whether EVP participants reduced their use of medications, clinical resources, and personnel. Future projects, for example, could determine whether the EVP is effective in reducing opioid analgesic medication use and decreasing primary care and emergency department visits. Cost-benefit analyses could be completed to determine whether EVP is associated with financial savings.
Because no follow-up assessments were made to determine whether improvements were maintained over time, the project focus was limited to an evaluation of the short-term changes in the outcome measures. Future projects could include a follow-up assessment of the veterans 1- or 2-years post completion of the EVP.
Data for the project were collected prior to the COVID-19 pandemic, when the EVP was implemented through face-to-face meetings with participants and their peers. It is not clear how changes to the delivery of the program (such as offering it through telehealth) might impact veterans’ satisfaction with the program, willingness to complete it, and other variables of interest.
The results of this project were made available to stakeholders with recommendations for program expansion both at the current location and at other VA facilities, including the recommendation to hire additional personnel that would implement the program. As the VA network of facilities expand the EVP program and adapt it for telehealth delivery, the investigators recommended a similar analysis of data be performed following telehealth delivery. If delivery through telehealth is shown to improve outcome measures, the EVP could provide pain management treatment options for patients challenged by transportation barriers, including rural veterans.
Conclusion
This quality improvement project provided evidence of improvement in measures of pain severity, pain interference, negative cognition (catastrophizing), quality of life, and patient treatment satisfaction among veterans with chronic high-impact pain. Findings have been well received by the northeastern VA as well as the Veterans Integrated Systems Network 5. The results of the analyses were used to inform decisions regarding the future of the program.
Disclaimer: This material is the result of work supported with resources and the use of facilities at the VA Maryland Health Care System, Baltimore, Maryland. The views expressed are those of the authors and do not necessarily represent the views of the Department of Veterans Affairs or the United States Government.
Acknowledgments: The authors thank Dr. Arianna Perra, the recent past coordinator of the Empower Veterans Program (EVP), who provided initial insights and support that motivated the decision to evaluate the program. We also thank the veterans and VA EVP clinicians who contributed data for the evaluation, and Dr. Michael Saenger (Director, TelePain-EVP: EVP) and Dr. Robert Lavin for their ongoing support, care, and concern for veteran patients. We also thank Dr. Beverly Bradley and the neurology service administrative team for their guidance in the process of obtaining necessary VA approvals for this project.
Corresponding author: Jessica U. Uche, DNP, CRNP-Family; jessica.uche@va.gov
doi:10.12788/jcom.0089
1. Institute of Medicine (US) Committee on Advancing Pain Research, Care, and Education. Relieving Pain in America: A Blueprint for Transforming Prevention, Care, Education, and Research. The National Academies Press (US); 2011.
2. Bastian LA, Heapy A, Becker WC, et al. Understanding pain and pain treatment for veterans: responding to the federal pain research strategy. Pain Med. 2018;19(suppl_1); S1-S4. doi:10.1093/pm/pny1433
3. Engle GL. The need for a new medical model: a challenge for biomedicine. Science. 1977;196(4286):129-136. doi:10.1126/science.847460
4. Bevers K, Watts L, Kishino ND, et al. The biopsychosocial model of the assessment, prevention, and treatment of chronic pain. US Neurology. 2016;12(2):98-104. doi:10.17925/USN.2016.12.02.98
5. Bair MJ, Ang D, Wu J, et al. Evaluation of stepped care for chronic pain (ESCAPE) in veterans of the Iraq and Afghanistan conflicts: A randomized clinical trial. JAMA Intern Med. 2015;175(5):682-689. doi:10.1001/jamainternmed.2015.97
6. Veterans Health Administration. Pain Management. VHA Directive 2009-053. Washington, DC: Department of Veterans Affairs; 2009.https://www.va.gov/painmanagement/docs/vha09paindirective.pdf
7. Moore BA, Anderson D, Dorflinger L, et al. Stepped care model for pain management and quality of pain care in long-term opioid therapy. J Rehabil Res Dev. 2016;53(1):137-146. doi:10.1682/JRRD.2014.10.0254
8. Institute for Healthcare Improvement. How to improve. Accessed March 14, 2022. http://www.ihi.org/resources/Pages/HowtoImprove/default.aspx
9. Saenger M. Empower Veterans Program. APA PCSS-O Webinars. Evidence CAM LBP 2016.
10. Gaudet T, Kligler B. Whole health in the whole system of the Veterans Administration: How will we know we have reached this future state? J Altern Complement Med. 2019;25(S1):S7-S11. doi:10.1089/acm.2018.29061.gau
11. Veterans Health Administration. Whole health: Circle of health. Updated April 1, 2021. Accessed March 14, 2022. https://www.va.gov/WHOLEHEALTH/circle-of-health/index.asp
12. Krebs EE, Carey TS, Weinberger M. Accuracy of the pain numeric rating scale as a screening test in primary care. J Gen Intern Med. 2007;22(10):1453-1458. doi:10.1007/s11606-007-0321-2
13. Veterans Health Administration. Pain as the 5th vital sign toolkit. October 2000, revised edition. Geriatrics and Extended Care Strategic Healthcare Group, National Pain Management Coordinating Committee. https://www.va.gov/PAINMANAGEMENT/docs/Pain_As_the_5th_Vital_Sign_Toolkit.pdf
14. McKillop JM, Nielson WR. Improving the usefulness of the Multidimensional Pain Inventory. Pain Res Manag. 2011;16(4):239-244. doi:10.1155/2011/873424
15. Kerns RD, Turk DC, Rudy TE. The West Haven-Yale Multidimensional Pain Inventory (WHYMPI). Pain.1985;23(4):345-356. doi:10.1016/0304-3959(85)90004-1
16. Verra ML, Angst F, Staal JB, et al. Reliability of the multidimensional pain inventory and stability of the MPI classification system in chronic back pain. BMC Musculoskelet Disord. 2012;13:155. doi:10.1186/1471-2474-13-155
17. Development of the World Health Organization WHOQOL-BREF quality of life assessment. The WHOQOL Group. Psychol Med. 1998;28(3):551-558. doi:10.1017/s0033291798006667
18. World Health Organization. Division of Mental Health. WHOQOL-BREF: introduction, administration, scoring and generic version of the assessment: field trial version, December 1996. Accessed March 14, 2022. https://apps.who.int/iris/handle/10665/63529
19. Guay S, Fortin C, Fikretoglu D, et al. Validation of the WHOQOL-BREF in a sample of male treatment-seeking veterans. Mil Psychol. 2015;27(2):85-92. doi:10.1037/mil0000065
20. Skevington S, Lotfy M, O’Connell K, WHOQOL Group. The World Health Organization’s WHOQOL-BREF quality of life assessment: Psychometric properties and results of the international field trial. A Report from the WHOQOL Group. Qual Life Res. 2004;13(2):299-310. doi:10.1023/B:QURE.0000018486.91360.00
21. Stratton KJ, Bender MC, Cameron JJ, Pickett TC. Development and evaluation of a behavioral pain management treatment program in a Veterans Affairs Medical Center. Mil Med. 2015;180(3):263-268. doi:10.7205/MILMED-D-14-00281.
22. Sullivan MJ, Thorn B, Haythornthwaite JA, et al. Theoretical perspectives on the relation between catastrophizing and pain. Clin J Pain. 2001;17(1):52-64. doi:10.1097/00002508-200103000-00008
23. Sullivan JL. The Pain Catastrophizing Scale: User manual. Accessed March 14, 2022. https://studylib.net/doc/8330191/the-pain-catastrophizing-scale---dr.-michael-sullivan
24. Darnall BD, Sturgeon JA, Cook KF, et al. Development and validation of a daily pain catastrophizing scale. J Pain. 2017;18(9):1139-1149. doi:10.1016/j.jpain.2017.05.003
25. Osman A, Barrios FX, Kopper BA, et al. Factor structure, reliability, and validity of the Pain Catastrophizing Scale. J Behav Med. 1997;20(6):589-605. doi:10.1023/a:1025570508954
26. Sullivan MJL, Bishop S, Pivik J. The Pain Catastrophizing Scale: development and validation. Psychol Assessment. 1995;7(4):524-532. doi:10.1037/1040-3590.7.4.524
27. Walker R, Clark M, Gironda R. Psychometric characteristics of the Pain Treatment Satisfaction Scale. J Pain. 2015;6(3Suppl.):S76.
28. Emerson RW. Bonferroni correction and type I error. J Vis Impair Blind. 2020;114(1):77-78. doi:10.1177/0145482X20901378
29. Cohen J. Statistical power analysis for the behavioral sciences. 2nd ed. Routledge; 1988. doi:10.4324/9780203771587
30. Craner JR, Lake ES, Bancroft KA, George LL. Treatment outcomes and mechanisms for an ACT-based 10-week interdisciplinary chronic pain rehabilitation program. Pain Pract. 2020;20(1):44-54. doi:10.1111/papr.12824
31. Han L, Goulet JL, Skanderson M, et al. Evaluation of complementary and integrative health approaches among US veterans with musculoskeletal pain using propensity score methods. Pain Med. 2019;20(1):90-102. doi:10.1093/pm/pny027
32. Herman PM, Yuan AH, Cefalu MS, et al. The use of complementary and integrative health approaches for chronic musculoskeletal pain in younger US veterans: an economic evaluation. PLoS One. 2019;14(6):e0217831. doi:10.1371/journal.pone.0217831
33. National Academies of Sciences, Engineering, and Medicine; Health and Medicine Division; Board on Global Health; Board on Health Sciences Policy; Global Forum on Innovation in Health Professional Education; Forum on Neuroscience and Nervous System Disorders; Stroud C, Posey Norris SM, Bain L, eds. The Role of Nonpharmacological Approaches to Pain Management: Proceedings of a Workshop. National Academies Press (US); April 12, 2019.
34. Richmond H, Hall AM, Copsey B, et al. The effectiveness of cognitive behavioural treatment for non-specific low back pain: a systematic review and meta-analysis. PLoS One. 2015;10(8):e0134192. doi:10.1371/journal.pone.0134192

35. Kearney DJ, Simpson TL, Malte CA, et al. Mindfulness-based stress reduction in addition to usual care is associated with improvements in pain, fatigue, and cognitive failures among veterans with Gulf War illness. Am J Med. 2016;129(2):204-214. doi:10.1016/j.amjmed.2015.09.015
36. Khoo E, Small R, Cheng W, et al. Comparative evaluation of group-based mindfulness-based stress reduction and cognitive behavioral therapy for the treatment and management of chronic pain: a systematic review and network meta-analysis. Evid Based Ment Health. 2019;22(1):26-35. doi:10.1136/ebmental-2018-300062
37. Khusid MA, Vythilingam M. The emerging role of mindfulness meditation as effective self-management strategy, Part 2: clinical implications for chronic pain, substance misuse, and insomnia. Mil Med. 2016;181(9):969-975. doi:10.7205/MILMED-D-14-00678
38. la Cour P, Petersen M. Effects of mindfulness meditation on chronic pain: A randomized controlled trial. Pain Med. 2015;16(4):641-652. doi:10.1111/pme.12605
39. Zou L, Zhang Y, Yang L, et al. Are mindful exercises safe and beneficial for treating chronic lower back pain? A systematic review and meta-analysis of randomized controlled trials. J Clin Med. 2019;8(5):628. doi:10.3390/jcm8050628
40. Hughes LS, Clark J, Colclough JA, et al. Acceptance and commitment therapy (ACT) for chronic pain: a systematic review and meta-analyses. Clin J Pain. 2017;33(6):552-568. doi:10.1097/AJP.0000000000000425
41. Kemani MK, Olsson GL, Lekander M, et al. Efficacy and cost-effectiveness of acceptance and commitment therapy and applied relaxation for longstanding pain: a randomized controlled trial. Clin J Pain. 2015;31(11):1004-1016. doi:10.1097/AJP.0000000000000203
42. Scott W, Daly A, Yu L, McCracken LM. Treatment of chronic pain for adults 65 and over: analyses of outcomes and changes in psychological flexibility following interdisciplinary acceptance and commitment therapy (ACT). Pain Med. 2017;18(2):252. doi:10.1093/pm/pnw073
43. Veehof MM, Trompetter HR, Bohlmeijer ET, Schreurs KMG. Acceptance- and mindfulness-based interventions for the treatment of chronic pain: a meta-analytic review. Cogn Behav Ther. 2016;45(1):5-31. doi:10.1080/16506073.2015.1098724
44. Matthias MS, McGuire AB, Kukla M, et al. A brief peer support intervention for veterans with chronic musculoskeletal pain: a pilot study of feasibility and effectiveness. Pain Med. 2015;16(1):81-87. doi:10.1111/pme.12571
45. Anamkath NS, Palyo SA, Jacobs SC, et al. An interdisciplinary pain rehabilitation program for veterans with chronic pain: description and initial evaluation of outcomes. Pain Res Manag. 2018;2018(3941682):1-9. doi:10.1155/2018/3941682
46. Kamper SJ, Apeldoorn AT, Chiarotto A, et al. Multidisciplinary biopsychosocial rehabilitation for chronic low back pain. Cochrane Database Syst Rev. 2014;9: CD000963. doi:10.1002/14651858.CD000963.pub3
47. Penney LS, Haro E. Qualitative evaluation of an interdisciplinary chronic pain intervention: Outcomes and barriers and facilitators to ongoing pain management. J Pain Res. 2019;12:865-878. doi:10.2147/JPR.S185652
48. Murphy JL, Cordova MJ, Dedert EA. Cognitive behavioral therapy for chronic pain in veterans; Evidence for clinical effectiveness in a model program. Psychol Serv. 2022;19(1):95-102. doi:10.1037/ser0000506
49. Katz L, Patterson L, Zacharias R. Evaluation of an interdisciplinary chronic pain program and predictors of readiness for change. Can J Pain. 2019;3(1):70-78. doi:10.1080/24740527.2019.1582296
50. Majumder SMM, Ahmed S, Shazzad N, et al. Translation, cross-cultural adaptation and validation of the Pain Catastrophizing Scale (PCS) into Bengali I patients with chronic non-malignant musculoskeletal pain. Int J Rheum Dis. 2020;23:1481-1487. doi:10.1111/1756-185X.13954
51. Margiotta F, Hannigan A, Imran A, et al. Pain, perceived injustice, and pain catastrophizing in chronic pain patients in Ireland. Pain Pract. 2016;17(5):663-668. doi:10.1111/papr.12
52. Bras M, Milunovic V, Boban M, et al. Quality of live in Croatian Homeland war (1991-1995) veterans who suffer from post-traumatic stress disorder and chronic pain. Health Qual Life Out. 2011;9:56. doi:10.1186/1477-7525-9-56
53. Liu C-H, Kung Y-Y, Lin C-L, et al. Therapeutic efficacy and the impact of the “dose” effect of acupuncture to treat sciatica: A randomized controlled pilot study. J Pain Res. 2019;12:3511-3520. doi:10.2147/JPR.S210672
From Neurology/Chronic Pain Management Services, Department of Veterans Affairs (VA) Maryland Health Care System, Baltimore VA Medical Center, Baltimore, MD (Dr. Uche), and School of Nursing, Washburn University, Topeka, KS (Drs. Jamison and Waugh).
Abstract
Objective: The purpose of this quality improvement project was to abstract and analyze previously collected data from veterans with high-impact chronic pain who attended the Empower Veterans Program (EVP) offered by a Veterans Administration facility in the northeastern United States.
Methods: This quality improvement project used data collected from veterans with chronic pain who completed the veterans health care facility’s EVP between August 2017 and August 2019. Pre- and post-intervention data on pain intensity, pain interference, quality of life, and pain catastrophizing were compared using paired t-tests.
Results: Although data were abstracted from 115 patients, the final sample included
Conclusion: Veterans with chronic high-impact noncancer pain who completed the EVP had reduced pain intensity, pain interference, pain catastrophizing as well as improved quality of life and satisfaction with their health.
Keywords: musculoskeletal pain, Veterans Affairs, complementary and integrative health, acceptance and commitment therapy, mind-body therapies, whole health, multidisciplinary pain management.
More than 100 million American adults suffer from chronic pain; costs associated with managing chronic pain are approximately $635 billion
One such program is the Empower Veterans Program (EVP). Originally developed at the Atlanta Veterans Affairs Health Care System, the EVP is a CIH modality based on the biopsychosocial model of pain developed by psychiatrist George Engel in 1977.3 The biopsychosocial model of pain recognizes that pain is a complex, multidimensional, biopsychosocial experience. Under this model, the mind and body work in unison as interconnected entities. Because the model acknowledges biological, psychological, and social components of pain and illness,4 treatment focuses on all aspects of a person’s health, life, and relationships.
The EVP fits into the VHA Pain Management Stepped Care Model and is an adjunctive complement for that model.5-7 The EVP complements care at the first step, where patient/family provide self-care and where care is provided by patient-aligned primary care teams, at the second step, which includes secondary consultation with multidisciplinary pain medicine specialty teams and other specialists, and at the third step, with the addition of tertiary interdisciplinary pain centers.
The VA Maryland Health Care System (VAMHCS) implemented the EVP as part of a quality improvement project for the management of chronic pain. The objectives of the program were to reduce pain intensity, pain catastrophizing, and pain interference, as well as improve functionality and quality of life among veterans with chronic high-impact noncancer pain. More than 2 years after the program was implemented, collected data had not been analyzed. The purpose of this quality improvement project was to abstract and analyze the previously collected data from veterans with high-impact chronic pain who attended an EVP offered by the VAMHCS. The results of the data analysis were used to inform decisions regarding the future of the program.
Methods
This quality improvement project used the Plan-Do-Study-Act (PDSA) process.8 The first 2 phases of the PDSA cycle (Plan and Do) were completed by a team of VA employees from the VAMHCS, who donated their time to establish and implement the program at the project site. This team consisted of psychologists, a physical therapist, a social worker, and a chaplain, and included support from medical administrative staff. This team planned and implemented the EVP at the VA facility based on the model developed at the Atlanta VA Health Care System. During the “Do” phase, the team collected data on pain intensity, pain interference, quality of life, and pain negative cognition (catastrophizing) before the intervention and post intervention. They also collected data on program outcome (patient treatment satisfaction) post intervention. Because these employees did not have time to retrieve and analyze the data, they welcomed the opportunity to have the data analyzed by the investigators during the Study phase of the PDSA cycle. Based on the results of the analysis, recommendations for program changes were made during the Act phase of the cycle.
Intervention
The EVP was developed as a 10-week (30 hours) interdisciplinary CIH approach that coached veterans with chronic pain to live fuller lives based on their individual values and what matters to them. EVP is the “What Else” management modality for the 5% of veterans with high-impact chronic pain.9 The EVP provided functional restoration through its components of whole health, mindfulness training, coaching calls, acceptance and commitment therapy, and mindful movement. It used the Wheel of Health with the 4 key components of me, self-care, professional care, and community.10,11
Veterans who had a diagnosis of chronic nonmalignant pain for 3 months or more and who agreed to participate in the EVP at this facility attended 3-hour classes every Tuesday with a cohort of 8 to 12 peers and engaged in one-on-one coaching with interdisciplinary team members. During the class sessions, veterans were coached to understand and accept their pain and commit to maintaining function despite their pain. Mindful movement by the physical therapist emphasized the pivotal place of exercise in pain management. The therapist used the mantra “Motion is Lotion.”9 The guiding principle of the EVP was that small incremental changes can have a big impact on the individual’s whole life. Emphasis was placed on increasing self-efficacy and mindful awareness for veterans with high-impact pain by giving them “Skills before Pills.”9
Outcome Measures
Outcome measures included the Numerical Pain Rating Scale (NPRS), the Multidimensional Pain Inventory (MPI), the World Health Organization Quality of Life assessment (WHOQOL-BREF), the Pain Catastrophizing Scale (PCS), and the Pain Treatment Satisfaction Scale (PTSS). Cronbach alpha coefficients were calculated to assess internal consistency reliability of these measures in the sample of veterans who completed the EVP.
NPRS. The NPRS is ubiquitous as a screening tool in many health care environments and its use is mandated by the VA health care system.12 The choice of the NPRS as the tool for pain screening in the VA health care system was based on a large body of research that supports the reliability and validity of the NPRS as a single index of pain intensity or severity. Studies suggest that the NPRS is valid for use in the assessment of acute, cancer, or chronic nonmalignant pain and in varied clinical settings.13 The NPRS has 4 items, each on a scale of 0 to 10. For the purpose of this project, only 3 items were used. The 3 items assessed the worst pain, usual pain, and the current pain (right now). The higher the score, the higher the pain intensity. Cronbach alpha coefficients on the NPRS obtained from the current sample of veterans were 0.85 on both pre- and postintervention assessments.
MPI. The MPI is an easily accessible, reliable, and valid self-report questionnaire that measures the impact of pain on an individual’s life, quality of social support, and general activity.14 This instrument is a short version of the West Haven-Yale MPI.15 The MPI contains 9 items rated on a scale from 0 to 6. The higher the score, the greater pain interference a person is experiencing. The MPI produces reliable, valid information for diagnostic purposes and for therapy outcome studies.16 The MPI had a Cronbach alpha of 0.90 on pre-intervention and 0.92 on postintervention assessments in the current sample.
WHOQOL-BREF. The WHOQOL-BREF is a measure of quality of life and is an abbreviated version of the WHOQOL-100. Quality of life is defined by the World Health Organization17 “as an individuals’ perception of their position in life in the context of the culture and value systems in which they live and in relation to their goals, expectations, standards and concerns.” The WHOQOL-BREF contains 26 items. The first 2 items were examined separately; the first item asks individuals to rate their overall quality of life and the second asks individuals how satisfied they are with their health. The remaining 24 items were used to calculate the following 4 domain scores: physical health, psychological health, social relationship, and environment.18 Each item is measured on a scale of 1 to 5. Higher scores denote higher or better quality of life. Domain scores have demonstrated good reliability and validity.19-21 Cronbach alpha coefficients for the domain subscales ranged from 0.63 to 0.84 in the current sample, with the lowest alphas for the 3-item Social Relationships Domain.
PCS. The PCS is a widely used measure of catastrophic thinking related to pain. Catastrophizing has been conceived by Sullivan and colleagues as “an exaggerated negative mental set brought to bear during actual or anticipated painful experience.”22 The PCS provides a total score and scores for the following subscales: rumination, magnification, and helplessness.23 It has been used in a variety of chronic pain populations and has demonstrated good reliability and validity in clinical as well as nonclinical samples.24-26 The PCS has 13 items rated on a scale of 0 to 4. Higher scores mean greater negative pain cognition (catastrophizing). In the current sample, the PCS total scale had a Cronbach alpha coefficient of 0.95 and 0.94 on the 2 assessments. The coefficients for the subscales ranged from 0.81 to 0.90.
PTSS. The PTSS is a 5-item tool that measures patient satisfaction with pain treatment. It includes items that address overall satisfaction, staff warmth, staff skill level, ease of scheduling appointments, and recommendation of the program to other veterans. It was derived from the post-treatment version of The Pain Outcome Questionnaire-VA and has demonstrated reliability and validity.27 The questions are scaled from 0 to 10. High scores on the PTSS denote high patient satisfaction with the EVP. The Cronbach alpha coefficient on the PTSS obtained from the current sample was 0.80.
Data Gathering and Analysis
Prior to starting the Study phase, Washburn University’s Institutional Review Board (IRB) and the VA IRB approved the project. The VA IRB, through its affiliate, gave a Not Human Research Determination and granted a waiver of informed consent and the Health Insurance Portability and Accountability Act authorization. The VA facility’s Research and Development department also approved the quality improvement project.
Once these approvals were obtained, the Study phase began with the abstraction of retrospective data obtained from veterans who participated in the VA health care facility’s EVP between
Veterans who completed the program were compared to veterans who did not complete the program on age, gender, and baseline measures. The investigators used independent samples t-tests to compare completers and noncompleters on age, pain intensity, pain interference, quality of life, and pain catastrophizing. They used the chi-square test of independence to analyze the association between gender and program completion.
Data were included in the pre- and postintervention analysis if the veteran completed the NPRS, MPI, WHOQOL-BREF, and PCS pre and post intervention. This became an important eligibility requirement as some of the tools/measures were changed towards the end of the review period in 2019. Pre- and postintervention data on pain intensity, pain interference, quality of life, pain catastrophizing, and patient satisfaction were compared using paired samples t-test at .004 level of significance based on the Bonferroni correction.28 Data on patient satisfaction with pain treatment were collected at program completion (week 8 or 10) and were analyzed using descriptive statistics.
Effect sizes (Cohen’s d) were calculated to determine the substantive significance or magnitude of the mean differences in scores. Effect sizes (expressed as absolute values of Cohen’s d) were calculated as the mean difference divided by the standard deviation. Values of 0.2 were considered a small effect size, 0.5 a medium effect size, and 0.8 a large effect size.29
Results
Data were abstracted for 115 veterans who started the EVP. Of these, 48 left the program, leaving 67 veterans (58%) who completed the program. Completers and noncompleters were similar in age, gender, and baseline measures (Table 1). Fifty-three (79%) completers and 35 (73%) noncompleters were male. A chi-square test of independence showed no significant association between gender and program completion (χ21 [N = 115] = .595, P = .440).
Comparison of pre-and postintervention mean scale scores resulted in statistically significant
Analysis of data obtained using the PTSS yielded high mean scores for items that focused on patient satisfaction with treatment (Table 3). Scaled statistics yielded a mean (SD) of 46.95 (4.40). These results denoted overall patient satisfaction with the EVP.
Discussion
The purpose of this quality improvement project was to abstract and analyze previously collected data from veterans with high-impact chronic pain who attended the EVP. Comparison of pre-intervention and postintervention data obtained from 67 veterans who completed the program revealed improvements in pain intensity, pain interference, negative cognition (catastrophizing), and quality of life. The differences were statistically significant and clinically meaningful, with medium and large effect sizes. In addition, veterans reported high satisfaction with the EVP.
The EVP includes CIH approaches that have demonstrated effectiveness among veterans and other populations with chronic pain. A wealth of studies, for example, support the effectiveness of CIH approaches among veterans.30-34 Other studies focus on specific CIH approaches that are components of the EVP. Evidence supports, for example, the efficacy of mindfulness-based stress reduction,35-39 acceptance and commitment therapy,40-43 brief peer support intervention,44 and interdisciplinary biopsychosocial rehabilitation.45,46
While empirical evidence supports components of the EVP, only one study focused on the outcomes of the Atlanta VA EVP among veterans with chronic pain. Results of a qualitative study conducted by Penney and Haro47 described the experience of veterans with the EVP. Those veterans reported adopting new self-care or lifestyle practices for pain management and health, accepting pain, being better able to adjust and set boundaries, feeling more in control, participating in life, and changing their medication use.
The mean baseline scores from the current sample were similar to samples of patients with chronic pain in other studies (NPRS,48 MPI,48 and PCS48-51). After converting scores on the WHOQOL-BREF from those that ranged from 4 to 20 to those that ranged from 0 to 100,18 the scores from the current sample were similar to those of other studies of patients with chronic pain.48,52,53Several strengths of the project should be noted. Data were collected using well established measurement tools that had previously demonstrated reliability and validity. All the tools used in data collection demonstrated good internal consistency reliabilities in the current sample of veterans. Weaknesses of the project include the use of a convenience sample of veterans and small sample size. Data were not available on the number of veterans who were offered participation or on how many veterans declined enrollment. The sample of veterans who chose to participate in the EVP may or may not have been representative of the population of veterans with high-impact chronic pain. As a pre- and postintervention design with no comparison group, the results are subject to multiple threats to internal validity, including the Hawthorne effect, maturation in the form of healing, and attrition. Reasons for leaving the program had not been recorded, so the investigators had no way of knowing factors that may have contributed to attrition. Also, data on when veterans left the program were unavailable. Research is needed with a control group to reduce the effect of confounding variables on the outcome measures. This project used data collected at a single VA facility, which limits its generalizability.
While completers and noncompleters of the EVP were similar on age, gender, and baseline measures, there may have been unidentified characteristics that influenced program completion. The investigators noticed the presence of more missing data among noncompleters compared to completers on the pre-intervention PCS; thus, noncompleters may have scored lower than completers on this instrument simply because there were more individual items that were unanswered/missing among this group of noncompleters.
Data were analyzed using a limited number of outcome measures that had previously been collected. Other outcome measures might include whether EVP participants reduced their use of medications, clinical resources, and personnel. Future projects, for example, could determine whether the EVP is effective in reducing opioid analgesic medication use and decreasing primary care and emergency department visits. Cost-benefit analyses could be completed to determine whether EVP is associated with financial savings.
Because no follow-up assessments were made to determine whether improvements were maintained over time, the project focus was limited to an evaluation of the short-term changes in the outcome measures. Future projects could include a follow-up assessment of the veterans 1- or 2-years post completion of the EVP.
Data for the project were collected prior to the COVID-19 pandemic, when the EVP was implemented through face-to-face meetings with participants and their peers. It is not clear how changes to the delivery of the program (such as offering it through telehealth) might impact veterans’ satisfaction with the program, willingness to complete it, and other variables of interest.
The results of this project were made available to stakeholders with recommendations for program expansion both at the current location and at other VA facilities, including the recommendation to hire additional personnel that would implement the program. As the VA network of facilities expand the EVP program and adapt it for telehealth delivery, the investigators recommended a similar analysis of data be performed following telehealth delivery. If delivery through telehealth is shown to improve outcome measures, the EVP could provide pain management treatment options for patients challenged by transportation barriers, including rural veterans.
Conclusion
This quality improvement project provided evidence of improvement in measures of pain severity, pain interference, negative cognition (catastrophizing), quality of life, and patient treatment satisfaction among veterans with chronic high-impact pain. Findings have been well received by the northeastern VA as well as the Veterans Integrated Systems Network 5. The results of the analyses were used to inform decisions regarding the future of the program.
Disclaimer: This material is the result of work supported with resources and the use of facilities at the VA Maryland Health Care System, Baltimore, Maryland. The views expressed are those of the authors and do not necessarily represent the views of the Department of Veterans Affairs or the United States Government.
Acknowledgments: The authors thank Dr. Arianna Perra, the recent past coordinator of the Empower Veterans Program (EVP), who provided initial insights and support that motivated the decision to evaluate the program. We also thank the veterans and VA EVP clinicians who contributed data for the evaluation, and Dr. Michael Saenger (Director, TelePain-EVP: EVP) and Dr. Robert Lavin for their ongoing support, care, and concern for veteran patients. We also thank Dr. Beverly Bradley and the neurology service administrative team for their guidance in the process of obtaining necessary VA approvals for this project.
Corresponding author: Jessica U. Uche, DNP, CRNP-Family; jessica.uche@va.gov
doi:10.12788/jcom.0089
1. Institute of Medicine (US) Committee on Advancing Pain Research, Care, and Education. Relieving Pain in America: A Blueprint for Transforming Prevention, Care, Education, and Research. The National Academies Press (US); 2011.
2. Bastian LA, Heapy A, Becker WC, et al. Understanding pain and pain treatment for veterans: responding to the federal pain research strategy. Pain Med. 2018;19(suppl_1); S1-S4. doi:10.1093/pm/pny1433
3. Engle GL. The need for a new medical model: a challenge for biomedicine. Science. 1977;196(4286):129-136. doi:10.1126/science.847460
4. Bevers K, Watts L, Kishino ND, et al. The biopsychosocial model of the assessment, prevention, and treatment of chronic pain. US Neurology. 2016;12(2):98-104. doi:10.17925/USN.2016.12.02.98
5. Bair MJ, Ang D, Wu J, et al. Evaluation of stepped care for chronic pain (ESCAPE) in veterans of the Iraq and Afghanistan conflicts: A randomized clinical trial. JAMA Intern Med. 2015;175(5):682-689. doi:10.1001/jamainternmed.2015.97
6. Veterans Health Administration. Pain Management. VHA Directive 2009-053. Washington, DC: Department of Veterans Affairs; 2009.https://www.va.gov/painmanagement/docs/vha09paindirective.pdf
7. Moore BA, Anderson D, Dorflinger L, et al. Stepped care model for pain management and quality of pain care in long-term opioid therapy. J Rehabil Res Dev. 2016;53(1):137-146. doi:10.1682/JRRD.2014.10.0254
8. Institute for Healthcare Improvement. How to improve. Accessed March 14, 2022. http://www.ihi.org/resources/Pages/HowtoImprove/default.aspx
9. Saenger M. Empower Veterans Program. APA PCSS-O Webinars. Evidence CAM LBP 2016.
10. Gaudet T, Kligler B. Whole health in the whole system of the Veterans Administration: How will we know we have reached this future state? J Altern Complement Med. 2019;25(S1):S7-S11. doi:10.1089/acm.2018.29061.gau
11. Veterans Health Administration. Whole health: Circle of health. Updated April 1, 2021. Accessed March 14, 2022. https://www.va.gov/WHOLEHEALTH/circle-of-health/index.asp
12. Krebs EE, Carey TS, Weinberger M. Accuracy of the pain numeric rating scale as a screening test in primary care. J Gen Intern Med. 2007;22(10):1453-1458. doi:10.1007/s11606-007-0321-2
13. Veterans Health Administration. Pain as the 5th vital sign toolkit. October 2000, revised edition. Geriatrics and Extended Care Strategic Healthcare Group, National Pain Management Coordinating Committee. https://www.va.gov/PAINMANAGEMENT/docs/Pain_As_the_5th_Vital_Sign_Toolkit.pdf
14. McKillop JM, Nielson WR. Improving the usefulness of the Multidimensional Pain Inventory. Pain Res Manag. 2011;16(4):239-244. doi:10.1155/2011/873424
15. Kerns RD, Turk DC, Rudy TE. The West Haven-Yale Multidimensional Pain Inventory (WHYMPI). Pain.1985;23(4):345-356. doi:10.1016/0304-3959(85)90004-1
16. Verra ML, Angst F, Staal JB, et al. Reliability of the multidimensional pain inventory and stability of the MPI classification system in chronic back pain. BMC Musculoskelet Disord. 2012;13:155. doi:10.1186/1471-2474-13-155
17. Development of the World Health Organization WHOQOL-BREF quality of life assessment. The WHOQOL Group. Psychol Med. 1998;28(3):551-558. doi:10.1017/s0033291798006667
18. World Health Organization. Division of Mental Health. WHOQOL-BREF: introduction, administration, scoring and generic version of the assessment: field trial version, December 1996. Accessed March 14, 2022. https://apps.who.int/iris/handle/10665/63529
19. Guay S, Fortin C, Fikretoglu D, et al. Validation of the WHOQOL-BREF in a sample of male treatment-seeking veterans. Mil Psychol. 2015;27(2):85-92. doi:10.1037/mil0000065
20. Skevington S, Lotfy M, O’Connell K, WHOQOL Group. The World Health Organization’s WHOQOL-BREF quality of life assessment: Psychometric properties and results of the international field trial. A Report from the WHOQOL Group. Qual Life Res. 2004;13(2):299-310. doi:10.1023/B:QURE.0000018486.91360.00
21. Stratton KJ, Bender MC, Cameron JJ, Pickett TC. Development and evaluation of a behavioral pain management treatment program in a Veterans Affairs Medical Center. Mil Med. 2015;180(3):263-268. doi:10.7205/MILMED-D-14-00281.
22. Sullivan MJ, Thorn B, Haythornthwaite JA, et al. Theoretical perspectives on the relation between catastrophizing and pain. Clin J Pain. 2001;17(1):52-64. doi:10.1097/00002508-200103000-00008
23. Sullivan JL. The Pain Catastrophizing Scale: User manual. Accessed March 14, 2022. https://studylib.net/doc/8330191/the-pain-catastrophizing-scale---dr.-michael-sullivan
24. Darnall BD, Sturgeon JA, Cook KF, et al. Development and validation of a daily pain catastrophizing scale. J Pain. 2017;18(9):1139-1149. doi:10.1016/j.jpain.2017.05.003
25. Osman A, Barrios FX, Kopper BA, et al. Factor structure, reliability, and validity of the Pain Catastrophizing Scale. J Behav Med. 1997;20(6):589-605. doi:10.1023/a:1025570508954
26. Sullivan MJL, Bishop S, Pivik J. The Pain Catastrophizing Scale: development and validation. Psychol Assessment. 1995;7(4):524-532. doi:10.1037/1040-3590.7.4.524
27. Walker R, Clark M, Gironda R. Psychometric characteristics of the Pain Treatment Satisfaction Scale. J Pain. 2015;6(3Suppl.):S76.
28. Emerson RW. Bonferroni correction and type I error. J Vis Impair Blind. 2020;114(1):77-78. doi:10.1177/0145482X20901378
29. Cohen J. Statistical power analysis for the behavioral sciences. 2nd ed. Routledge; 1988. doi:10.4324/9780203771587
30. Craner JR, Lake ES, Bancroft KA, George LL. Treatment outcomes and mechanisms for an ACT-based 10-week interdisciplinary chronic pain rehabilitation program. Pain Pract. 2020;20(1):44-54. doi:10.1111/papr.12824
31. Han L, Goulet JL, Skanderson M, et al. Evaluation of complementary and integrative health approaches among US veterans with musculoskeletal pain using propensity score methods. Pain Med. 2019;20(1):90-102. doi:10.1093/pm/pny027
32. Herman PM, Yuan AH, Cefalu MS, et al. The use of complementary and integrative health approaches for chronic musculoskeletal pain in younger US veterans: an economic evaluation. PLoS One. 2019;14(6):e0217831. doi:10.1371/journal.pone.0217831
33. National Academies of Sciences, Engineering, and Medicine; Health and Medicine Division; Board on Global Health; Board on Health Sciences Policy; Global Forum on Innovation in Health Professional Education; Forum on Neuroscience and Nervous System Disorders; Stroud C, Posey Norris SM, Bain L, eds. The Role of Nonpharmacological Approaches to Pain Management: Proceedings of a Workshop. National Academies Press (US); April 12, 2019.
34. Richmond H, Hall AM, Copsey B, et al. The effectiveness of cognitive behavioural treatment for non-specific low back pain: a systematic review and meta-analysis. PLoS One. 2015;10(8):e0134192. doi:10.1371/journal.pone.0134192
35. Kearney DJ, Simpson TL, Malte CA, et al. Mindfulness-based stress reduction in addition to usual care is associated with improvements in pain, fatigue, and cognitive failures among veterans with Gulf War illness. Am J Med. 2016;129(2):204-214. doi:10.1016/j.amjmed.2015.09.015
36. Khoo E, Small R, Cheng W, et al. Comparative evaluation of group-based mindfulness-based stress reduction and cognitive behavioral therapy for the treatment and management of chronic pain: a systematic review and network meta-analysis. Evid Based Ment Health. 2019;22(1):26-35. doi:10.1136/ebmental-2018-300062
37. Khusid MA, Vythilingam M. The emerging role of mindfulness meditation as effective self-management strategy, Part 2: clinical implications for chronic pain, substance misuse, and insomnia. Mil Med. 2016;181(9):969-975. doi:10.7205/MILMED-D-14-00678
38. la Cour P, Petersen M. Effects of mindfulness meditation on chronic pain: A randomized controlled trial. Pain Med. 2015;16(4):641-652. doi:10.1111/pme.12605
39. Zou L, Zhang Y, Yang L, et al. Are mindful exercises safe and beneficial for treating chronic lower back pain? A systematic review and meta-analysis of randomized controlled trials. J Clin Med. 2019;8(5):628. doi:10.3390/jcm8050628
40. Hughes LS, Clark J, Colclough JA, et al. Acceptance and commitment therapy (ACT) for chronic pain: a systematic review and meta-analyses. Clin J Pain. 2017;33(6):552-568. doi:10.1097/AJP.0000000000000425
41. Kemani MK, Olsson GL, Lekander M, et al. Efficacy and cost-effectiveness of acceptance and commitment therapy and applied relaxation for longstanding pain: a randomized controlled trial. Clin J Pain. 2015;31(11):1004-1016. doi:10.1097/AJP.0000000000000203
42. Scott W, Daly A, Yu L, McCracken LM. Treatment of chronic pain for adults 65 and over: analyses of outcomes and changes in psychological flexibility following interdisciplinary acceptance and commitment therapy (ACT). Pain Med. 2017;18(2):252. doi:10.1093/pm/pnw073
43. Veehof MM, Trompetter HR, Bohlmeijer ET, Schreurs KMG. Acceptance- and mindfulness-based interventions for the treatment of chronic pain: a meta-analytic review. Cogn Behav Ther. 2016;45(1):5-31. doi:10.1080/16506073.2015.1098724
44. Matthias MS, McGuire AB, Kukla M, et al. A brief peer support intervention for veterans with chronic musculoskeletal pain: a pilot study of feasibility and effectiveness. Pain Med. 2015;16(1):81-87. doi:10.1111/pme.12571
45. Anamkath NS, Palyo SA, Jacobs SC, et al. An interdisciplinary pain rehabilitation program for veterans with chronic pain: description and initial evaluation of outcomes. Pain Res Manag. 2018;2018(3941682):1-9. doi:10.1155/2018/3941682
46. Kamper SJ, Apeldoorn AT, Chiarotto A, et al. Multidisciplinary biopsychosocial rehabilitation for chronic low back pain. Cochrane Database Syst Rev. 2014;9: CD000963. doi:10.1002/14651858.CD000963.pub3
47. Penney LS, Haro E. Qualitative evaluation of an interdisciplinary chronic pain intervention: Outcomes and barriers and facilitators to ongoing pain management. J Pain Res. 2019;12:865-878. doi:10.2147/JPR.S185652
48. Murphy JL, Cordova MJ, Dedert EA. Cognitive behavioral therapy for chronic pain in veterans; Evidence for clinical effectiveness in a model program. Psychol Serv. 2022;19(1):95-102. doi:10.1037/ser0000506
49. Katz L, Patterson L, Zacharias R. Evaluation of an interdisciplinary chronic pain program and predictors of readiness for change. Can J Pain. 2019;3(1):70-78. doi:10.1080/24740527.2019.1582296
50. Majumder SMM, Ahmed S, Shazzad N, et al. Translation, cross-cultural adaptation and validation of the Pain Catastrophizing Scale (PCS) into Bengali I patients with chronic non-malignant musculoskeletal pain. Int J Rheum Dis. 2020;23:1481-1487. doi:10.1111/1756-185X.13954
51. Margiotta F, Hannigan A, Imran A, et al. Pain, perceived injustice, and pain catastrophizing in chronic pain patients in Ireland. Pain Pract. 2016;17(5):663-668. doi:10.1111/papr.12
52. Bras M, Milunovic V, Boban M, et al. Quality of live in Croatian Homeland war (1991-1995) veterans who suffer from post-traumatic stress disorder and chronic pain. Health Qual Life Out. 2011;9:56. doi:10.1186/1477-7525-9-56
53. Liu C-H, Kung Y-Y, Lin C-L, et al. Therapeutic efficacy and the impact of the “dose” effect of acupuncture to treat sciatica: A randomized controlled pilot study. J Pain Res. 2019;12:3511-3520. doi:10.2147/JPR.S210672
Improving Hospital Metrics Through the Implementation of a Comorbidity Capture Tool and Other Quality Initiatives
From the University of Miami Miller School of Medicine (Drs. Sosa, Ferreira, Gershengorn, Soto, Parekh, and Suarez), and the Quality Department of the University of Miami Hospital and Clinics (Estin Kelly, Ameena Shrestha, Julianne Burgos, and Sandeep Devabhaktuni), Miami, FL.
Abstract
Background: Case mix index (CMI) and expected mortality are determined based on comorbidities. Improving documentation and coding can impact performance indicators. During and prior to 2018, our patient acuity was under-represented, with low expected mortality and CMI. Those metrics motivated our quality team to develop the quality initiatives reported here.
Objectives: We sought to assess the impact of quality initiatives on number of comorbidities, diagnoses, CMI, and expected mortality at the University of Miami Health System.
Design: We conducted an observational study of a series of quality initiatives: (1) education of clinical documentation specialists (CDS) to capture comorbidities (10/2019); (2) facilitating the process for physician query response (2/2020); (3) implementation of computer logic to capture electrolyte disturbances and renal dysfunction (8/2020); (4) development of a tool to capture Elixhauser comorbidities (11/2020); and (5) provider education and electronic health record reviews by the quality team.
Setting and participants: All admissions during 2019 and 2020 at University of Miami Health System. The health system includes 2 academic inpatient facilities, a 560-bed tertiary hospital, and a 40-bed cancer facility. Our hospital is 1 of the 11 PPS-Exempt Cancer Hospitals and is the South Florida’s only NCI-Designated Cancer Center.
Conclusion:
Keywords: PS/QI, coding, case mix index, comorbidities, mortality.
Adoption of comprehensive electronic health record (EHR) systems by US hospitals, defined as an EHR capable of meeting all core meaningful-use metrics including evaluation and tracking of quality metrics, has been steadily increasing.3,4 Many institutions have looked to EHR system transitions as an inflection point to expand clinical documentation improvement (CDI) efforts. Over the past several years, our institution, an academic medical center, has endeavored to fully transition to a comprehensive EHR system (Epic from Epic Systems Corporation). Part of the purpose of this transition was to help study and improve outcomes, reduce readmissions, improve quality of care, and meet performance indicators.
Prior to 2019, our hospital’s patient acuity was low, with a CMI consistently below 2, ranging from 1.81 to 1.99, and an expected mortality consistently below 1.9%, ranging from 1.65% to 1.85%. Our concern that these values underestimated the real severity of illness of our patient population prompted the development of a quality improvement plan. In this report, we describe the processes we undertook to improve documentation and coding of comorbid illness, and report on the impact of these initiatives on performance indicators. We hypothesized that our initiatives would have a significant impact on our ability to capture patient complexity, and thus impact our CMI and expected mortality.
Methods
In the fall of 2019, we embarked on a multifaceted quality improvement project aimed at improving comorbidity capture for patients hospitalized at our institution. The health system includes 2 academic inpatient facilities, a 560-bed tertiary hospital and a 40-bed cancer facility. Since September 2017, we have used Epic as our EHR. In August 2019, we started working with Vizient Clinical Data Base5 to allow benchmarking with peer institutions. We assessed the impact of this initiative with a pre/post study design.
Quality Initiatives
This quality improvement project consisted of a series of 5 targeted interventions coupled with continuous monitoring and education.
1. Comorbidity coding. In October 2019, we met with the clinical documentation specialists (CDS) and the coding team to educate them on the value of coding all comorbidities that have an impact on
2. Physician query. In October 2019, we modified the process for physician query response, allowing physicians to answer queries in the EHR through a reply tool incorporated into the query and accept answers in the body of the Epic message as an active part of the EHR.
3. EHR logic. In August 2020, we developed an EHR smart logic to automatically capture fluid and electrolyte disturbances and renal dysfunction, based on the most recent laboratory values. The logic automatically populated potentially appropriate diagnoses in the assessment and plan of provider notes, which require provider acknowledgment and which providers are able to modify
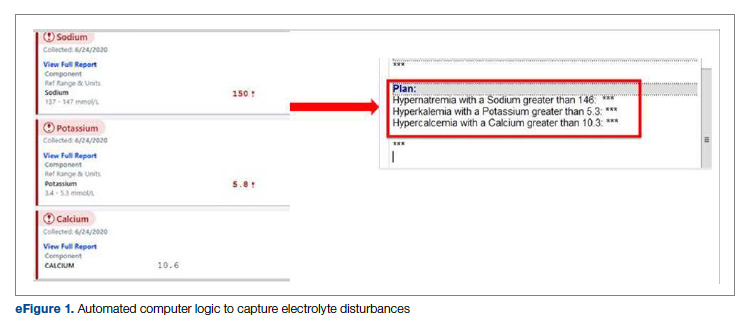
4. Comorbidity capture tool. In November 2020, we developed a standardized tool to allow providers to easily capture Elixhauser comorbidities (eFigure 2). The Elixhauser index is a method for measuring comorbidities based on International Classification of Diseases, Ninth Revision, Clinical Modification and International Classification of Disease, Tenth Revision diagnosis codes found in administrative data1-6 and is used by US News & World Report and Vizient to assess comorbidity burden. Our tool automatically captures diagnoses recorded in previous documentation and allows providers to easily provide the management plan for each; this information is automatically pulled into the provider note.
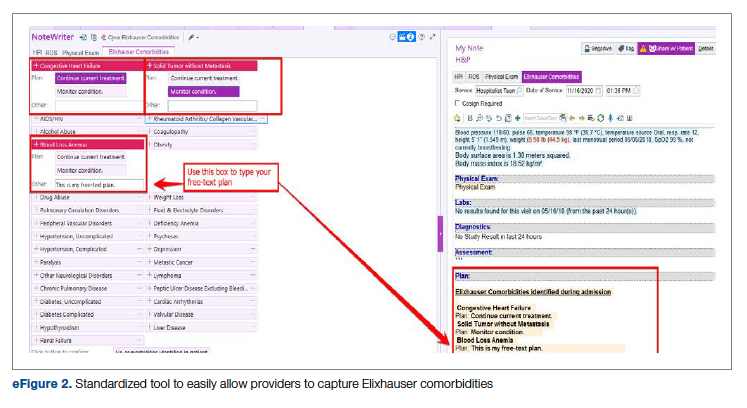
The development of this tool used an existing functionality within the Epic EHR called SmartForms, SmartData Elements, and SmartLinks. The only cost of tool development was the time invested—124 hours inclusive of 4 hours of staff education. Specifically, a panel of experts (including physicians of different specialties, an analyst, and representatives from the quality office) met weekly for 30 minutes per week over 5 weeks to agree on specific clinical criteria and guide the EHR build analyst. Individual panel members confirmed and validated design requirements (in 15 hours over 5 weeks). Our senior clinical analyst II dedicated 80 hours to actual build time, 15 hours to design time, and 25 hours to tailor the function to our institution’s workflow. This tool was introduced in November 2020; completion was optional at the time of hospital admission but mandatory at discharge to ensure compliance.
5. Quality team
Assessment of Quality Initiatives’ Impact
Data on the number of comorbidities and performance indicators were obtained retrospectively. The data included all hospital admissions from 2019 and 2020 divided into 2 periods: pre-intervention from January 1, 2019 through September 30, 2019, and intervention from October 1, 2019 through December 31, 2020. The primary outcome of this observational study was the rate of comorbidity capture during the intervention period. Comorbidity capture was assessed using the Vizient Clinical Data Base (CDB) health care performance tool.5 Vizient CDB uses the Agency for Healthcare Research and Quality Elixhauser index, which includes 29 of the initial 31 comorbidities described by Elixhauser,6 as it combines hypertension with and without complications into one. We secondarily aimed to examine the impact of the quality improvement initiatives on several institutional-level performance indicators, including total number of diagnoses, comorbidities or complications (CC), major comorbidities or complications (MCC), CMI, and expected mortality.
Case mix index is the average Medicare Severity-DRG (MS-DRG) weighted across all hospital discharges (appropriate to their discharge date). The expected mortality represents the average expected number of deaths based on diagnosed conditions, age, and gender within the same time frame, and it is based on coded diagnosis; we obtained the mortality index by dividing the observed mortality by the expected mortality. The Vizient CDB Mortality Risk Adjustment Model was used to assign an expected mortality (0%-100%) to each case based on factors such as demographics, admission type, diagnoses, and procedures.
Standard statistics were used to measure the outcomes. We used Excel to compare pre-intervention and intervention period characteristics and outcomes, using t-testing for continuous variables and Chi-square testing for categorial outcomes. P values <0.05 were considered statistically significant.
The study was reviewed by the institutional review board (IRB) of our institution (IRB ID: 20210070). The IRB determined that the proposed activity was not research involving human subjects, as defined by the Department of Health and Human Services and US Food and Drug Administration regulations, and that IRB review and approval by the organization were not required.
Results
The health system had a total of 33 066 admissions during the study period—13 689 pre-intervention (January 1, 2019 through September 30, 2019) and 19,377 during the intervention period (October 1, 2019 to December 31, 2020). Demographics were similar among the pre-intervention and intervention periods: mean age was 60 years and 61 years, 52% and 51% of patients were male, 72% and 71% were White, and 20% and 19% were Black, respectively (Table 1).
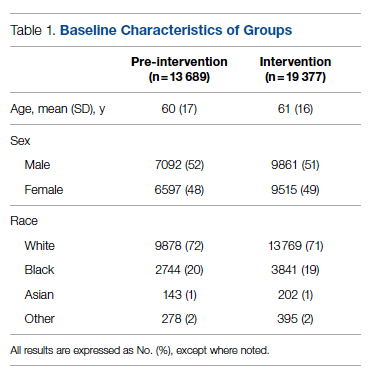
The multifaceted intervention resulted in a significant improvement in the primary outcome: mean comorbidity capture increased from 2.5 (SD, 1.7) before the intervention to 3.1 (SD, 2.0) during the intervention (P < .00001). Secondary outcomes also improved. The mean number of secondary diagnoses for admissions increased from 11.3 (SD, 7.3) prior to the intervention to 18.5 (SD, 10.4) (P < .00001) during the intervention period. The mean CMI increased from 2.1 (SD, 1.9) to 2.4 (SD, 2.2) post intervention (P < .00001), an increase during the intervention period of 14%. The expected mortality increased from 1.8% (SD, 6.1%) to 3.1% (SD, 9.2%) after the intervention (P < .00001) (Table 2).
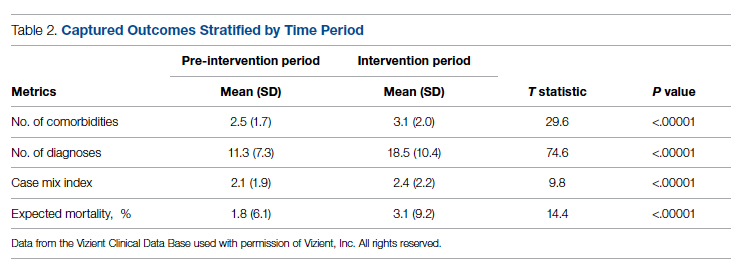
There was an overall observed improvement in percentage of discharges with documented CC and MCC for both surgical and medical specialties. Both CC and MCC increased for surgical specialties, from 54.4% to 68.5%, and for medical specialties, from 68.9% to 76.4%. (Figure 1). The diagnoses that were captured more consistently included deficiency anemia, obesity, diabetes with complications, fluid and electrolyte disorders and renal failure, hypertension, weight loss, depression, and hypothyroidism (Figure 2).
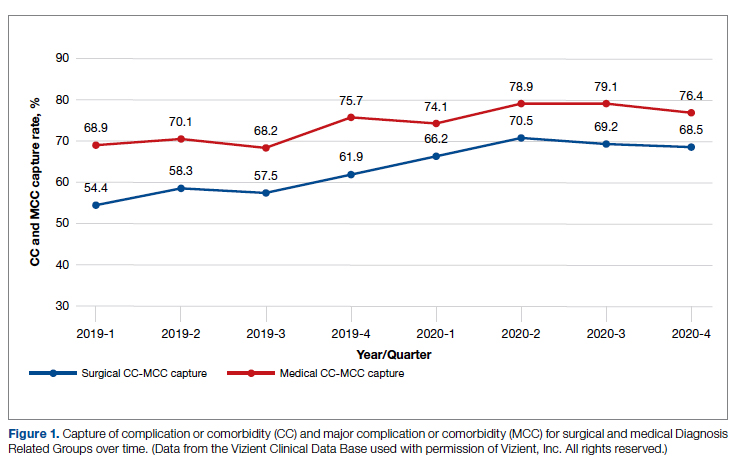
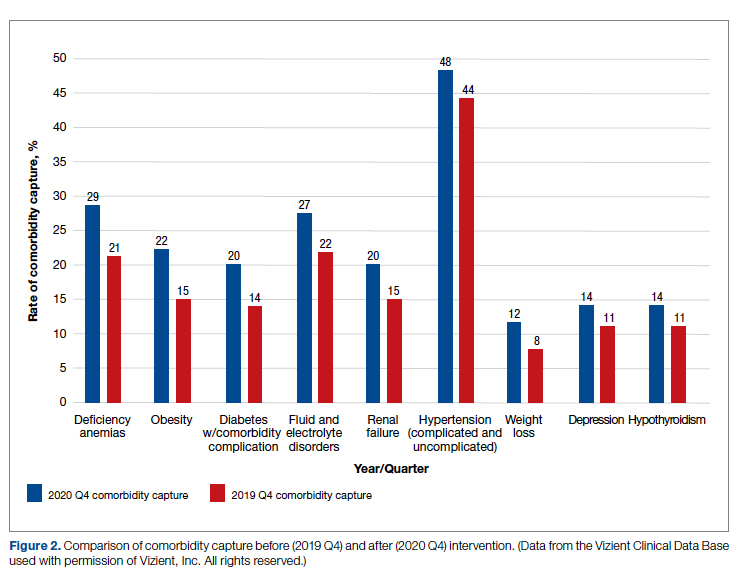
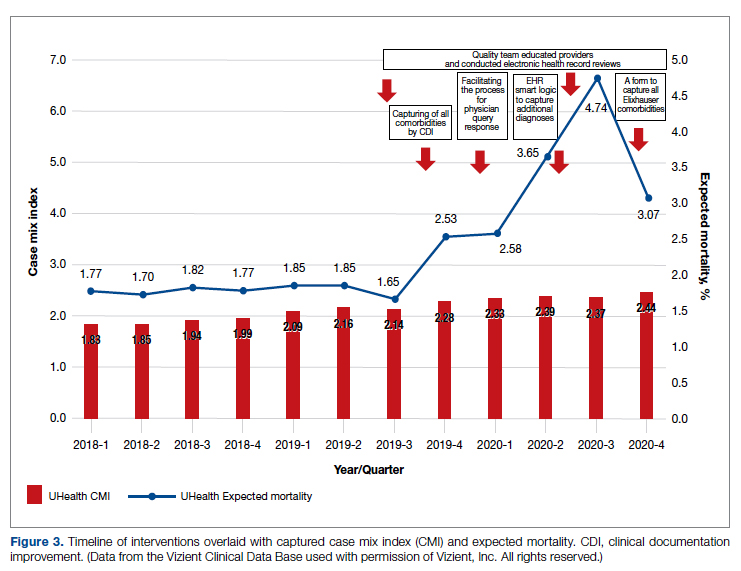
During the 9-month pre-intervention period (January 1 through September 30, 2019), there were 2795 queries, with an agreed volume of 1823; the agreement rate was 65% and the average provider turnaround time was 12.53 days. In the 15-month postintervention period, there were 10 216 queries, with an agreed volume of 6802 at 66%. We created a policy to encourage responses no later than 10 days after the query, and our average turnaround time decreased by more than 50% to 5.86 days. The average number of monthly queries increased by 55%, from an average of 311 monthly queries in the pre-intervention period to an average of 681 per month in the postintervention period. The more common queries that had an impact on CMI included sepsis, antineoplastic chemotherapy–induced pancytopenia, acute posthemorrhagic anemia, malnutrition, hyponatremia, and metabolic encephalopathy.
Discussion
The need for accurate documentation by physicians has been recognized for many years.7
With the growing complexity of the documentation and coding process, it is difficult for clinicians to keep up with the terminology required by the Centers for Medicare and Medicaid Services (CMS). Several different methods to improve documentation have been proposed. Prior interventions to standardize documentation templates in the trauma service have shown improvement in CMI.8 An educational program on coding for internal medicine that included a lecture series and creation of a laminated pocket card listing common CMS diagnoses, CC, and MCC has been implemented, with an improvement in the capture rate of CC and MCC from 42% to 48% and an impact on expected mortality.9 This program resulted in a 30% decrease in the median quarterly mortality index and an increase in CMI from 1.27 to 1.36.
Our results show that there was an increase in comorbidities documentation of admitted patients after all interventions were implemented, more accurately reflecting the complexity of our patient population in a tertiary care academic medical center. Our CMI increased by 14% during the intervention period. The estimated CMI dollar impact increased by 75% from the pre-intervention period (adjusted for PPS-exempt hospital). The hospital-expected mortality increased from 1.77 to 3.07 (peak at 4.74 during third quarter of 2020) during the implementation period, which is a key driver of quality rankings for national outcomes reporting services such as US News & World Report.
There was increased physician satisfaction as a result of the change of functionality of the query response system, and no additional monetary provider incentive for complete documentation was allocated, apart from education and 1:1 support that improved physician engagement. Our next steps include the implementation of an advanced program to concurrently and automatically capture and nudge providers to respond and complete their documentation in real time.
Limitations
The limitations of our study include those inherent to a retrospective review and are associative and observational in nature. Although we used expected mortality and CMI as a surrogate for patient acuity for comparison, there was no way to control for actual changes in patient acuity that contributed to the increase in CMI, although we believe that the population we served and the services provided and their structure did not change significantly during the intervention period. Additionally, the observed increase in CMI during the implementation period may be a result of described variabilities in CMI and would be better studied over a longer period. Also, during the year of our interventions, 2020, we were affected by the COVID-19 pandemic. Patients with COVID-19 are known to carry a lower-than-expected mortality, and that could have had a negative impact on our results. In fact, we did observe a decrease in our expected mortality during the last quarter of 2020, which correlated with one of our regional peaks for COVID-19, and that could be a confounding factor. While the described intervention process is potentially applicable to multiple EHR systems, the exact form to capture the Elixhauser comorbidities was built into the Epic EHR, limiting external applicability of this tool to other EHR software.
Conclusion
A continuous comprehensive series of interventions substantially increased our patient acuity scores. The increased scores have implications for reimbursement and quality comparisons for hospitals and physicians. Our institution can now be stratified more accurately with our peers and other hospitals. Accurate medical record documentation has become increasingly important, but also increasingly complex. Leveraging the EHR through quality initiatives that facilitate the workflow for providers can have an impact on documentation, coding, and ultimately risk-adjusted outcomes data that influence institutional reputation.
Corresponding author: Marie Anne Sosa, MD; 1120 NW 14th St., Suite 809, Miami, FL, 33134; mxs2157@med.miami.edu
Disclosures: None reported.
doi:10.12788/jcom.0088
1. Elixhauser A, Steiner C, Harris DR, Coffey RM. Comorbidity measures for use with administrative data. Med Care. 1998;36(1):8-27. doi:10.1097/00005650-199801000-00004.
2. Sehgal AR. The role of reputation in U.S. News & World Report’s rankings of the top 50 American hospitals. Ann Intern Med. 2010;152(8):521-525. doi:10.7326/0003-4819-152-8-201004200-00009
3. Jha AK, DesRoches CM, Campbell EG, et al. Use of electronic health records in U.S. hospitals. N Engl J Med. 2009;360(16):1628-1638. doi:10.1056/NEJMsa0900592.
4. Adler-Milstein J, DesRoches CM, Kralovec, et al. Electronic health record adoption in US hospitals: progress continues, but challenges persist. Health Aff (Millwood). 2015;34(12):2174-2180. doi:10.1377/hlthaff.2015.0992
5. Vizient Clinical Data Base/Resource ManagerTM. Irving, TX: Vizient, Inc.; 2019. Accessed March 10, 2022. https://www.vizientinc.com
6. Moore BJ, White S, Washington R, Coenen N, Elixhauser A. Identifying increased risk of readmission and in-hospital mortality using hospital administrative data: the AHRQ Elixhauser Comorbidity Index. Med Care. 2017;55(7):698-705. doi:10.1097/MLR.0000000000000735
7. Payne T. Improving clinical documentation in an EMR world. Healthc Financ Manage. 2010;64(2):70-74.
8. Barnes SL, Waterman M, Macintyre D, Coughenour J, Kessel J. Impact of standardized trauma documentation to the hospital’s bottom line. Surgery. 2010;148(4):793-797. doi:10.1016/j.surg.2010.07.040
9. Spellberg B, Harrington D, Black S, Sue D, Stringer W, Witt M. Capturing the diagnosis: an internal medicine education program to improve documentation. Am J Med. 2013;126(8):739-743.e1. doi:10.1016/j.amjmed.2012.11.035
From the University of Miami Miller School of Medicine (Drs. Sosa, Ferreira, Gershengorn, Soto, Parekh, and Suarez), and the Quality Department of the University of Miami Hospital and Clinics (Estin Kelly, Ameena Shrestha, Julianne Burgos, and Sandeep Devabhaktuni), Miami, FL.
Abstract
Background: Case mix index (CMI) and expected mortality are determined based on comorbidities. Improving documentation and coding can impact performance indicators. During and prior to 2018, our patient acuity was under-represented, with low expected mortality and CMI. Those metrics motivated our quality team to develop the quality initiatives reported here.
Objectives: We sought to assess the impact of quality initiatives on number of comorbidities, diagnoses, CMI, and expected mortality at the University of Miami Health System.
Design: We conducted an observational study of a series of quality initiatives: (1) education of clinical documentation specialists (CDS) to capture comorbidities (10/2019); (2) facilitating the process for physician query response (2/2020); (3) implementation of computer logic to capture electrolyte disturbances and renal dysfunction (8/2020); (4) development of a tool to capture Elixhauser comorbidities (11/2020); and (5) provider education and electronic health record reviews by the quality team.
Setting and participants: All admissions during 2019 and 2020 at University of Miami Health System. The health system includes 2 academic inpatient facilities, a 560-bed tertiary hospital, and a 40-bed cancer facility. Our hospital is 1 of the 11 PPS-Exempt Cancer Hospitals and is the South Florida’s only NCI-Designated Cancer Center.
Conclusion:
Keywords: PS/QI, coding, case mix index, comorbidities, mortality.
Adoption of comprehensive electronic health record (EHR) systems by US hospitals, defined as an EHR capable of meeting all core meaningful-use metrics including evaluation and tracking of quality metrics, has been steadily increasing.3,4 Many institutions have looked to EHR system transitions as an inflection point to expand clinical documentation improvement (CDI) efforts. Over the past several years, our institution, an academic medical center, has endeavored to fully transition to a comprehensive EHR system (Epic from Epic Systems Corporation). Part of the purpose of this transition was to help study and improve outcomes, reduce readmissions, improve quality of care, and meet performance indicators.
Prior to 2019, our hospital’s patient acuity was low, with a CMI consistently below 2, ranging from 1.81 to 1.99, and an expected mortality consistently below 1.9%, ranging from 1.65% to 1.85%. Our concern that these values underestimated the real severity of illness of our patient population prompted the development of a quality improvement plan. In this report, we describe the processes we undertook to improve documentation and coding of comorbid illness, and report on the impact of these initiatives on performance indicators. We hypothesized that our initiatives would have a significant impact on our ability to capture patient complexity, and thus impact our CMI and expected mortality.
Methods
In the fall of 2019, we embarked on a multifaceted quality improvement project aimed at improving comorbidity capture for patients hospitalized at our institution. The health system includes 2 academic inpatient facilities, a 560-bed tertiary hospital and a 40-bed cancer facility. Since September 2017, we have used Epic as our EHR. In August 2019, we started working with Vizient Clinical Data Base5 to allow benchmarking with peer institutions. We assessed the impact of this initiative with a pre/post study design.
Quality Initiatives
This quality improvement project consisted of a series of 5 targeted interventions coupled with continuous monitoring and education.
1. Comorbidity coding. In October 2019, we met with the clinical documentation specialists (CDS) and the coding team to educate them on the value of coding all comorbidities that have an impact on
2. Physician query. In October 2019, we modified the process for physician query response, allowing physicians to answer queries in the EHR through a reply tool incorporated into the query and accept answers in the body of the Epic message as an active part of the EHR.
3. EHR logic. In August 2020, we developed an EHR smart logic to automatically capture fluid and electrolyte disturbances and renal dysfunction, based on the most recent laboratory values. The logic automatically populated potentially appropriate diagnoses in the assessment and plan of provider notes, which require provider acknowledgment and which providers are able to modify
4. Comorbidity capture tool. In November 2020, we developed a standardized tool to allow providers to easily capture Elixhauser comorbidities (eFigure 2). The Elixhauser index is a method for measuring comorbidities based on International Classification of Diseases, Ninth Revision, Clinical Modification and International Classification of Disease, Tenth Revision diagnosis codes found in administrative data1-6 and is used by US News & World Report and Vizient to assess comorbidity burden. Our tool automatically captures diagnoses recorded in previous documentation and allows providers to easily provide the management plan for each; this information is automatically pulled into the provider note.
The development of this tool used an existing functionality within the Epic EHR called SmartForms, SmartData Elements, and SmartLinks. The only cost of tool development was the time invested—124 hours inclusive of 4 hours of staff education. Specifically, a panel of experts (including physicians of different specialties, an analyst, and representatives from the quality office) met weekly for 30 minutes per week over 5 weeks to agree on specific clinical criteria and guide the EHR build analyst. Individual panel members confirmed and validated design requirements (in 15 hours over 5 weeks). Our senior clinical analyst II dedicated 80 hours to actual build time, 15 hours to design time, and 25 hours to tailor the function to our institution’s workflow. This tool was introduced in November 2020; completion was optional at the time of hospital admission but mandatory at discharge to ensure compliance.
5. Quality team
Assessment of Quality Initiatives’ Impact
Data on the number of comorbidities and performance indicators were obtained retrospectively. The data included all hospital admissions from 2019 and 2020 divided into 2 periods: pre-intervention from January 1, 2019 through September 30, 2019, and intervention from October 1, 2019 through December 31, 2020. The primary outcome of this observational study was the rate of comorbidity capture during the intervention period. Comorbidity capture was assessed using the Vizient Clinical Data Base (CDB) health care performance tool.5 Vizient CDB uses the Agency for Healthcare Research and Quality Elixhauser index, which includes 29 of the initial 31 comorbidities described by Elixhauser,6 as it combines hypertension with and without complications into one. We secondarily aimed to examine the impact of the quality improvement initiatives on several institutional-level performance indicators, including total number of diagnoses, comorbidities or complications (CC), major comorbidities or complications (MCC), CMI, and expected mortality.
Case mix index is the average Medicare Severity-DRG (MS-DRG) weighted across all hospital discharges (appropriate to their discharge date). The expected mortality represents the average expected number of deaths based on diagnosed conditions, age, and gender within the same time frame, and it is based on coded diagnosis; we obtained the mortality index by dividing the observed mortality by the expected mortality. The Vizient CDB Mortality Risk Adjustment Model was used to assign an expected mortality (0%-100%) to each case based on factors such as demographics, admission type, diagnoses, and procedures.
Standard statistics were used to measure the outcomes. We used Excel to compare pre-intervention and intervention period characteristics and outcomes, using t-testing for continuous variables and Chi-square testing for categorial outcomes. P values <0.05 were considered statistically significant.
The study was reviewed by the institutional review board (IRB) of our institution (IRB ID: 20210070). The IRB determined that the proposed activity was not research involving human subjects, as defined by the Department of Health and Human Services and US Food and Drug Administration regulations, and that IRB review and approval by the organization were not required.
Results
The health system had a total of 33 066 admissions during the study period—13 689 pre-intervention (January 1, 2019 through September 30, 2019) and 19,377 during the intervention period (October 1, 2019 to December 31, 2020). Demographics were similar among the pre-intervention and intervention periods: mean age was 60 years and 61 years, 52% and 51% of patients were male, 72% and 71% were White, and 20% and 19% were Black, respectively (Table 1).
The multifaceted intervention resulted in a significant improvement in the primary outcome: mean comorbidity capture increased from 2.5 (SD, 1.7) before the intervention to 3.1 (SD, 2.0) during the intervention (P < .00001). Secondary outcomes also improved. The mean number of secondary diagnoses for admissions increased from 11.3 (SD, 7.3) prior to the intervention to 18.5 (SD, 10.4) (P < .00001) during the intervention period. The mean CMI increased from 2.1 (SD, 1.9) to 2.4 (SD, 2.2) post intervention (P < .00001), an increase during the intervention period of 14%. The expected mortality increased from 1.8% (SD, 6.1%) to 3.1% (SD, 9.2%) after the intervention (P < .00001) (Table 2).
There was an overall observed improvement in percentage of discharges with documented CC and MCC for both surgical and medical specialties. Both CC and MCC increased for surgical specialties, from 54.4% to 68.5%, and for medical specialties, from 68.9% to 76.4%. (Figure 1). The diagnoses that were captured more consistently included deficiency anemia, obesity, diabetes with complications, fluid and electrolyte disorders and renal failure, hypertension, weight loss, depression, and hypothyroidism (Figure 2).
During the 9-month pre-intervention period (January 1 through September 30, 2019), there were 2795 queries, with an agreed volume of 1823; the agreement rate was 65% and the average provider turnaround time was 12.53 days. In the 15-month postintervention period, there were 10 216 queries, with an agreed volume of 6802 at 66%. We created a policy to encourage responses no later than 10 days after the query, and our average turnaround time decreased by more than 50% to 5.86 days. The average number of monthly queries increased by 55%, from an average of 311 monthly queries in the pre-intervention period to an average of 681 per month in the postintervention period. The more common queries that had an impact on CMI included sepsis, antineoplastic chemotherapy–induced pancytopenia, acute posthemorrhagic anemia, malnutrition, hyponatremia, and metabolic encephalopathy.
Discussion
The need for accurate documentation by physicians has been recognized for many years.7
With the growing complexity of the documentation and coding process, it is difficult for clinicians to keep up with the terminology required by the Centers for Medicare and Medicaid Services (CMS). Several different methods to improve documentation have been proposed. Prior interventions to standardize documentation templates in the trauma service have shown improvement in CMI.8 An educational program on coding for internal medicine that included a lecture series and creation of a laminated pocket card listing common CMS diagnoses, CC, and MCC has been implemented, with an improvement in the capture rate of CC and MCC from 42% to 48% and an impact on expected mortality.9 This program resulted in a 30% decrease in the median quarterly mortality index and an increase in CMI from 1.27 to 1.36.
Our results show that there was an increase in comorbidities documentation of admitted patients after all interventions were implemented, more accurately reflecting the complexity of our patient population in a tertiary care academic medical center. Our CMI increased by 14% during the intervention period. The estimated CMI dollar impact increased by 75% from the pre-intervention period (adjusted for PPS-exempt hospital). The hospital-expected mortality increased from 1.77 to 3.07 (peak at 4.74 during third quarter of 2020) during the implementation period, which is a key driver of quality rankings for national outcomes reporting services such as US News & World Report.
There was increased physician satisfaction as a result of the change of functionality of the query response system, and no additional monetary provider incentive for complete documentation was allocated, apart from education and 1:1 support that improved physician engagement. Our next steps include the implementation of an advanced program to concurrently and automatically capture and nudge providers to respond and complete their documentation in real time.
Limitations
The limitations of our study include those inherent to a retrospective review and are associative and observational in nature. Although we used expected mortality and CMI as a surrogate for patient acuity for comparison, there was no way to control for actual changes in patient acuity that contributed to the increase in CMI, although we believe that the population we served and the services provided and their structure did not change significantly during the intervention period. Additionally, the observed increase in CMI during the implementation period may be a result of described variabilities in CMI and would be better studied over a longer period. Also, during the year of our interventions, 2020, we were affected by the COVID-19 pandemic. Patients with COVID-19 are known to carry a lower-than-expected mortality, and that could have had a negative impact on our results. In fact, we did observe a decrease in our expected mortality during the last quarter of 2020, which correlated with one of our regional peaks for COVID-19, and that could be a confounding factor. While the described intervention process is potentially applicable to multiple EHR systems, the exact form to capture the Elixhauser comorbidities was built into the Epic EHR, limiting external applicability of this tool to other EHR software.
Conclusion
A continuous comprehensive series of interventions substantially increased our patient acuity scores. The increased scores have implications for reimbursement and quality comparisons for hospitals and physicians. Our institution can now be stratified more accurately with our peers and other hospitals. Accurate medical record documentation has become increasingly important, but also increasingly complex. Leveraging the EHR through quality initiatives that facilitate the workflow for providers can have an impact on documentation, coding, and ultimately risk-adjusted outcomes data that influence institutional reputation.
Corresponding author: Marie Anne Sosa, MD; 1120 NW 14th St., Suite 809, Miami, FL, 33134; mxs2157@med.miami.edu
Disclosures: None reported.
doi:10.12788/jcom.0088
1. Elixhauser A, Steiner C, Harris DR, Coffey RM. Comorbidity measures for use with administrative data. Med Care. 1998;36(1):8-27. doi:10.1097/00005650-199801000-00004.
2. Sehgal AR. The role of reputation in U.S. News & World Report’s rankings of the top 50 American hospitals. Ann Intern Med. 2010;152(8):521-525. doi:10.7326/0003-4819-152-8-201004200-00009
3. Jha AK, DesRoches CM, Campbell EG, et al. Use of electronic health records in U.S. hospitals. N Engl J Med. 2009;360(16):1628-1638. doi:10.1056/NEJMsa0900592.
4. Adler-Milstein J, DesRoches CM, Kralovec, et al. Electronic health record adoption in US hospitals: progress continues, but challenges persist. Health Aff (Millwood). 2015;34(12):2174-2180. doi:10.1377/hlthaff.2015.0992
5. Vizient Clinical Data Base/Resource ManagerTM. Irving, TX: Vizient, Inc.; 2019. Accessed March 10, 2022. https://www.vizientinc.com
6. Moore BJ, White S, Washington R, Coenen N, Elixhauser A. Identifying increased risk of readmission and in-hospital mortality using hospital administrative data: the AHRQ Elixhauser Comorbidity Index. Med Care. 2017;55(7):698-705. doi:10.1097/MLR.0000000000000735
7. Payne T. Improving clinical documentation in an EMR world. Healthc Financ Manage. 2010;64(2):70-74.
8. Barnes SL, Waterman M, Macintyre D, Coughenour J, Kessel J. Impact of standardized trauma documentation to the hospital’s bottom line. Surgery. 2010;148(4):793-797. doi:10.1016/j.surg.2010.07.040
9. Spellberg B, Harrington D, Black S, Sue D, Stringer W, Witt M. Capturing the diagnosis: an internal medicine education program to improve documentation. Am J Med. 2013;126(8):739-743.e1. doi:10.1016/j.amjmed.2012.11.035
Using a Real-Time Prediction Algorithm to Improve Sleep in the Hospital
Study Overview
Objective: This study evaluated whether a clinical-decision-support (CDS) tool that utilizes a real-time algorithm incorporating patient vital sign data can identify hospitalized patients who can forgo overnight vital sign checks and thus reduce delirium incidence.
Design: This was a parallel randomized clinical trial of adult inpatients admitted to the general medical service of a tertiary care academic medical center in the United States. The trial intervention consisted of a CDS notification in the electronic health record (EHR) that informed the physician if a patient had a high likelihood of nighttime vital signs within the reference ranges based on a logistic regression model of real-time patient data input. This notification provided the physician an opportunity to discontinue nighttime vital sign checks, dismiss the notification for 1 hour, or dismiss the notification until the next day.
Setting and participants: This clinical trial was conducted at the University of California, San Francisco Medical Center from March 11 to November 24, 2019. Participants included physicians who served on the primary team (eg, attending, resident) of 1699 patients on the general medical service who were outside of the intensive care unit (ICU). The hospital encounters were randomized (allocation ratio of 1:1) to sleep promotion vitals CDS (SPV CDS) intervention or usual care.
Main outcome and measures: The primary outcome was delirium as determined by bedside nurse assessment using the Nursing Delirium Screening Scale (Nu-DESC) recorded once per nursing shift. The Nu-DESC is a standardized delirium screening tool that defines delirium with a score ≥2. Secondary outcomes included sleep opportunity (ie, EHR-based sleep metrics that reflected the maximum time between iatrogenic interruptions, such as nighttime vital sign checks) and patient satisfaction (ie, patient satisfaction measured by standardized Hospital Consumer Assessment of Healthcare Providers and Systems [HCAHPS] survey). Potential balancing outcomes were assessed to ensure that reduced vital sign checks were not causing harms; these included ICU transfers, rapid response calls, and code blue alarms. All analyses were conducted on the basis of intention-to-treat.
Main results: A total of 3025 inpatient encounters were screened and 1930 encounters were randomized (966 SPV CDS intervention; 964 usual care). The randomized encounters consisted of 1699 patients; demographic factors between the 2 trial arms were similar. Specifically, the intervention arm included 566 men (59%) and mean (SD) age was 53 (15) years. The incidence of delirium was similar between the intervention and usual care arms: 108 (11%) vs 123 (13%) (P = .32). Compared to the usual care arm, the intervention arm had a higher mean (SD) number of sleep opportunity hours per night (4.95 [1.45] vs 4.57 [1.30], P < .001) and fewer nighttime vital sign checks (0.97 [0.95] vs 1.41 [0.86], P < .001). The post-discharge HCAHPS survey measuring patient satisfaction was completed by only 5% of patients (53 intervention, 49 usual care), and survey results were similar between the 2 arms (P = .86). In addition, safety outcomes including ICU transfers (49 [5%] vs 47 [5%], P = .92), rapid response calls (68 [7%] vs 55 [6%], P = .27), and code blue alarms (2 [0.2%] vs 9 [0.9%], P = .07) were similar between the study arms.
Conclusion: In this randomized clinical trial, a CDS tool utilizing a real-time prediction algorithm embedded in EHR did not reduce the incidence of delirium in hospitalized patients. However, this SPV CDS intervention helped physicians identify clinically stable patients who can forgo routine nighttime vital sign checks and facilitated greater opportunity for patients to sleep. These findings suggest that augmenting physician judgment using a real-time prediction algorithm can help to improve sleep opportunity without an accompanying increased risk of clinical decompensation during acute care.
Commentary
High-quality sleep is fundamental to health and well-being. Sleep deprivation and disorders are associated with many adverse health outcomes, including increased risks for obesity, diabetes, hypertension, myocardial infarction, and depression.1 In hospitalized patients who are acutely ill, restorative sleep is critical to facilitating recovery. However, poor sleep is exceedingly common in hospitalized patients and is associated with deleterious outcomes, such as high blood pressure, hyperglycemia, and delirium.2,3 Moreover, some of these adverse sleep-induced cardiometabolic outcomes, as well as sleep disruption itself, may persist after hospital discharge.4 Factors that precipitate interrupted sleep during hospitalization include iatrogenic causes such as frequent vital sign checks, nighttime procedures or early morning blood draws, and environmental factors such as loud ambient noise.3 Thus, a potential intervention to improve sleep quality in the hospital is to reduce nighttime interruptions such as frequent vital sign checks.
In the current study, Najafi and colleagues conducted a randomized trial to evaluate whether a CDS tool embedded in EHR, powered by a real-time prediction algorithm of patient data, can be utilized to identify patients in whom vital sign checks can be safely discontinued at nighttime. The authors found a modest but statistically significant reduction in the number of nighttime vital sign checks in patients who underwent the SPV CDS intervention, and a corresponding higher sleep opportunity per night in those who received the intervention. Importantly, this reduction in nighttime vital sign checks did not cause a higher risk of clinical decompensation as measured by ICU transfers, rapid response calls, or code blue alarms. Thus, the results demonstrated the feasibility of using a real-time, patient data-driven CDS tool to augment physician judgment in managing sleep disruption, an important hospital-associated stressor and a common hazard of hospitalization in older patients.
Delirium is a common clinical problem in hospitalized older patients that is associated with prolonged hospitalization, functional and cognitive decline, institutionalization, death, and increased health care costs.5 Despite a potential benefit of SPV CDS intervention in reducing vital sign checks and increasing sleep opportunity, this intervention did not reduce the incidence of delirium in hospitalized patients. This finding is not surprising given that delirium has a multifactorial etiology (eg, metabolic derangements, infections, medication side effects and drug toxicity, hospital environment). A small modification in nighttime vital sign checks and sleep opportunity may have limited impact on optimizing sleep quality and does not address other risk factors for delirium. As such, a multicomponent nonpharmacologic approach that includes sleep enhancement, early mobilization, feeding assistance, fluid repletion, infection prevention, and other interventions should guide delirium prevention in the hospital setting. The SPV CDS intervention may play a role in the delivery of a multifaceted, nonpharmacologic delirium prevention intervention in high-risk individuals.
Sleep disruption is one of the multiple hazards of hospitalization frequently experience by hospitalized older patients. Other hazards, or hospital-associated stressors, include mobility restriction (eg, physical restraints such as urinary catheters and intravenous lines, bed elevation and rails), malnourishment and dehydration (eg, frequent use of no-food-by-mouth order, lack of easy access to hydration), and pain (eg, poor pain control). Extended exposures to these stressors may lead to a maladaptive state called allostatic overload that transiently increases vulnerability to post-hospitalization adverse events, including emergency department use, hospital readmission, or death (ie, post-hospital syndrome).6 Thus, the optimization of sleep during hospitalization in vulnerable patients may have benefits that extend beyond delirium prevention. It is perceivable that a CDS tool embedded in EHR, powered by a real-time prediction algorithm of patient data, may be applied to reduce some of these hazards of hospitalization in addition to improving sleep opportunity.
Applications for Clinical Practice
Findings from the current study indicate that a CDS tool embedded in EHR that utilizes a real-time prediction algorithm of patient data may help to safely improve sleep opportunity in hospitalized patients. The participants in the current study were relatively young (53 [15] years). Given that age is a risk factor for delirium, the effects of this intervention on delirium prevention in the most susceptible population (ie, those over the age of 65) remain unknown and further investigation is warranted. Additional studies are needed to determine whether this approach yields similar results in geriatric patients and improves clinical outcomes.
—Fred Ko, MD
1. Institute of Medicine (US) Committee on Sleep Medicine and Research. Sleep Disorders and Sleep Deprivation: An Unmet Public Health Problem. Colten HR, Altevogt BM, editors. National Academies Press (US); 2006.
2. Pilkington S. Causes and consequences of sleep deprivation in hospitalised patients. Nurs Stand. 2013;27(49):350-342. doi:10.7748/ns2013.08.27.49.35.e7649
3. Stewart NH, Arora VM. Sleep in hospitalized older adults. Sleep Med Clin. 2018;13(1):127-135. doi:10.1016/j.jsmc.2017.09.012
4. Altman MT, Knauert MP, Pisani MA. Sleep disturbance after hospitalization and critical illness: a systematic review. Ann Am Thorac Soc. 2017;14(9):1457-1468. doi:10.1513/AnnalsATS.201702-148SR
5. Oh ES, Fong TG, Hshieh TT, Inouye SK. Delirium in older persons: advances in diagnosis and treatment. JAMA. 2017;318(12):1161-1174. doi:10.1001/jama.2017.12067
6. Goldwater DS, Dharmarajan K, McEwan BS, Krumholz HM. Is posthospital syndrome a result of hospitalization-induced allostatic overload? J Hosp Med. 2018;13(5). doi:10.12788/jhm.2986
Study Overview
Objective: This study evaluated whether a clinical-decision-support (CDS) tool that utilizes a real-time algorithm incorporating patient vital sign data can identify hospitalized patients who can forgo overnight vital sign checks and thus reduce delirium incidence.
Design: This was a parallel randomized clinical trial of adult inpatients admitted to the general medical service of a tertiary care academic medical center in the United States. The trial intervention consisted of a CDS notification in the electronic health record (EHR) that informed the physician if a patient had a high likelihood of nighttime vital signs within the reference ranges based on a logistic regression model of real-time patient data input. This notification provided the physician an opportunity to discontinue nighttime vital sign checks, dismiss the notification for 1 hour, or dismiss the notification until the next day.
Setting and participants: This clinical trial was conducted at the University of California, San Francisco Medical Center from March 11 to November 24, 2019. Participants included physicians who served on the primary team (eg, attending, resident) of 1699 patients on the general medical service who were outside of the intensive care unit (ICU). The hospital encounters were randomized (allocation ratio of 1:1) to sleep promotion vitals CDS (SPV CDS) intervention or usual care.
Main outcome and measures: The primary outcome was delirium as determined by bedside nurse assessment using the Nursing Delirium Screening Scale (Nu-DESC) recorded once per nursing shift. The Nu-DESC is a standardized delirium screening tool that defines delirium with a score ≥2. Secondary outcomes included sleep opportunity (ie, EHR-based sleep metrics that reflected the maximum time between iatrogenic interruptions, such as nighttime vital sign checks) and patient satisfaction (ie, patient satisfaction measured by standardized Hospital Consumer Assessment of Healthcare Providers and Systems [HCAHPS] survey). Potential balancing outcomes were assessed to ensure that reduced vital sign checks were not causing harms; these included ICU transfers, rapid response calls, and code blue alarms. All analyses were conducted on the basis of intention-to-treat.
Main results: A total of 3025 inpatient encounters were screened and 1930 encounters were randomized (966 SPV CDS intervention; 964 usual care). The randomized encounters consisted of 1699 patients; demographic factors between the 2 trial arms were similar. Specifically, the intervention arm included 566 men (59%) and mean (SD) age was 53 (15) years. The incidence of delirium was similar between the intervention and usual care arms: 108 (11%) vs 123 (13%) (P = .32). Compared to the usual care arm, the intervention arm had a higher mean (SD) number of sleep opportunity hours per night (4.95 [1.45] vs 4.57 [1.30], P < .001) and fewer nighttime vital sign checks (0.97 [0.95] vs 1.41 [0.86], P < .001). The post-discharge HCAHPS survey measuring patient satisfaction was completed by only 5% of patients (53 intervention, 49 usual care), and survey results were similar between the 2 arms (P = .86). In addition, safety outcomes including ICU transfers (49 [5%] vs 47 [5%], P = .92), rapid response calls (68 [7%] vs 55 [6%], P = .27), and code blue alarms (2 [0.2%] vs 9 [0.9%], P = .07) were similar between the study arms.
Conclusion: In this randomized clinical trial, a CDS tool utilizing a real-time prediction algorithm embedded in EHR did not reduce the incidence of delirium in hospitalized patients. However, this SPV CDS intervention helped physicians identify clinically stable patients who can forgo routine nighttime vital sign checks and facilitated greater opportunity for patients to sleep. These findings suggest that augmenting physician judgment using a real-time prediction algorithm can help to improve sleep opportunity without an accompanying increased risk of clinical decompensation during acute care.
Commentary
High-quality sleep is fundamental to health and well-being. Sleep deprivation and disorders are associated with many adverse health outcomes, including increased risks for obesity, diabetes, hypertension, myocardial infarction, and depression.1 In hospitalized patients who are acutely ill, restorative sleep is critical to facilitating recovery. However, poor sleep is exceedingly common in hospitalized patients and is associated with deleterious outcomes, such as high blood pressure, hyperglycemia, and delirium.2,3 Moreover, some of these adverse sleep-induced cardiometabolic outcomes, as well as sleep disruption itself, may persist after hospital discharge.4 Factors that precipitate interrupted sleep during hospitalization include iatrogenic causes such as frequent vital sign checks, nighttime procedures or early morning blood draws, and environmental factors such as loud ambient noise.3 Thus, a potential intervention to improve sleep quality in the hospital is to reduce nighttime interruptions such as frequent vital sign checks.
In the current study, Najafi and colleagues conducted a randomized trial to evaluate whether a CDS tool embedded in EHR, powered by a real-time prediction algorithm of patient data, can be utilized to identify patients in whom vital sign checks can be safely discontinued at nighttime. The authors found a modest but statistically significant reduction in the number of nighttime vital sign checks in patients who underwent the SPV CDS intervention, and a corresponding higher sleep opportunity per night in those who received the intervention. Importantly, this reduction in nighttime vital sign checks did not cause a higher risk of clinical decompensation as measured by ICU transfers, rapid response calls, or code blue alarms. Thus, the results demonstrated the feasibility of using a real-time, patient data-driven CDS tool to augment physician judgment in managing sleep disruption, an important hospital-associated stressor and a common hazard of hospitalization in older patients.
Delirium is a common clinical problem in hospitalized older patients that is associated with prolonged hospitalization, functional and cognitive decline, institutionalization, death, and increased health care costs.5 Despite a potential benefit of SPV CDS intervention in reducing vital sign checks and increasing sleep opportunity, this intervention did not reduce the incidence of delirium in hospitalized patients. This finding is not surprising given that delirium has a multifactorial etiology (eg, metabolic derangements, infections, medication side effects and drug toxicity, hospital environment). A small modification in nighttime vital sign checks and sleep opportunity may have limited impact on optimizing sleep quality and does not address other risk factors for delirium. As such, a multicomponent nonpharmacologic approach that includes sleep enhancement, early mobilization, feeding assistance, fluid repletion, infection prevention, and other interventions should guide delirium prevention in the hospital setting. The SPV CDS intervention may play a role in the delivery of a multifaceted, nonpharmacologic delirium prevention intervention in high-risk individuals.
Sleep disruption is one of the multiple hazards of hospitalization frequently experience by hospitalized older patients. Other hazards, or hospital-associated stressors, include mobility restriction (eg, physical restraints such as urinary catheters and intravenous lines, bed elevation and rails), malnourishment and dehydration (eg, frequent use of no-food-by-mouth order, lack of easy access to hydration), and pain (eg, poor pain control). Extended exposures to these stressors may lead to a maladaptive state called allostatic overload that transiently increases vulnerability to post-hospitalization adverse events, including emergency department use, hospital readmission, or death (ie, post-hospital syndrome).6 Thus, the optimization of sleep during hospitalization in vulnerable patients may have benefits that extend beyond delirium prevention. It is perceivable that a CDS tool embedded in EHR, powered by a real-time prediction algorithm of patient data, may be applied to reduce some of these hazards of hospitalization in addition to improving sleep opportunity.
Applications for Clinical Practice
Findings from the current study indicate that a CDS tool embedded in EHR that utilizes a real-time prediction algorithm of patient data may help to safely improve sleep opportunity in hospitalized patients. The participants in the current study were relatively young (53 [15] years). Given that age is a risk factor for delirium, the effects of this intervention on delirium prevention in the most susceptible population (ie, those over the age of 65) remain unknown and further investigation is warranted. Additional studies are needed to determine whether this approach yields similar results in geriatric patients and improves clinical outcomes.
—Fred Ko, MD
1. Institute of Medicine (US) Committee on Sleep Medicine and Research. Sleep Disorders and Sleep Deprivation: An Unmet Public Health Problem. Colten HR, Altevogt BM, editors. National Academies Press (US); 2006.
2. Pilkington S. Causes and consequences of sleep deprivation in hospitalised patients. Nurs Stand. 2013;27(49):350-342. doi:10.7748/ns2013.08.27.49.35.e7649
3. Stewart NH, Arora VM. Sleep in hospitalized older adults. Sleep Med Clin. 2018;13(1):127-135. doi:10.1016/j.jsmc.2017.09.012
4. Altman MT, Knauert MP, Pisani MA. Sleep disturbance after hospitalization and critical illness: a systematic review. Ann Am Thorac Soc. 2017;14(9):1457-1468. doi:10.1513/AnnalsATS.201702-148SR
5. Oh ES, Fong TG, Hshieh TT, Inouye SK. Delirium in older persons: advances in diagnosis and treatment. JAMA. 2017;318(12):1161-1174. doi:10.1001/jama.2017.12067
6. Goldwater DS, Dharmarajan K, McEwan BS, Krumholz HM. Is posthospital syndrome a result of hospitalization-induced allostatic overload? J Hosp Med. 2018;13(5). doi:10.12788/jhm.2986
Biden’s FDA chief nominee narrowly wins Senate confirmation
On Feb. 15, Robert Califf, MD, narrowly won Senate confirmation to once again serve as the commissioner of the Food and Drug Administration, overcoming protest votes from lawmakers about abortion and opioid issues.
The Senate voted 50-46 in favor of Dr. Califf’s nomination. A cardiologist long affiliated with Duke University and a noted expert on clinical trials, Dr. Califf also led the FDA from February 2016 through January 2017.
In 2016, the Senate confirmed him as FDA chief in an 89-4 vote. At that time, Sen. Joe Manchin, D-WV, and a few other senators said they were concerned that Dr. Califf’s links to the drug industry would hamper his ability to regulate drugmakers, particularly in terms of rules on prescription painkillers.
Sen. Manchin also objected to Dr. Califf’s second nomination as FDA commissioner, as did several fellow Democrats, including Sen. Edward Markey of Massachusetts. In a statement issued after the Feb. 15 vote, Sen. Markey said he has “consistently raised concerns about the FDA’s egregious mishandling of opioid approvals and its role in enabling the current opioid epidemic.”
“To date, the FDA still has not implemented many of the reforms necessary to ensure that it is fulfilling its role as our nation’s top pharmaceutical cop on the beat,” Sen. Markey said. “I have not received any real commitment from Dr. Califf to truly reform the FDA or to learn from the failures that fueled this public health crisis.”
This time, Dr. Califf lost support among Republican senators due to objections raised by groups seeking to end women’s access to abortion. Susan B. Anthony List and National Right to Life asked senators in a January letter to oppose Dr. Califf’s nomination, citing their objections to how the FDA handled reporting of adverse events from abortions by medication during Dr. Califf’s Tenure.
But some Republicans supported Califf in the Tuesday vote. Sens. Roy Blunt of Missouri, Richard Burr of North Carolina, Susan Collins of Maine, Lisa Murkowski of Alaska, Mitt Romney of Utah, and Pat Toomey of Pennsylvania all voted in his favor.
On Feb. 14, Sen. Patty Murray, D-WA, chairwoman of the Senate Health, Education, Labor, and Pensions Committee, urged her colleagues to vote for Dr. Califf to give the FDA strong leadership to tackle urgent health needs such as the opioid crisis, youth tobacco use, antimicrobial resistance, and inequities in health care.
“At this critical moment, we need a trusted hand to lead the FDA,” she said in a floor speech. Dr. Califf’s previous service at the FDA and his years spent as a research scientist “give him the experience to take on this challenge.”
Separately, three former FDA commissioners on Feb. 15 published an opinion article that appeared in The Hill. Republican presidents nominated two of these former FDA chiefs: Scott Gottlieb, MD, and Mark McClellan, MD. The third, Margaret Hamburg, MD, was nominated by President Barack Obama, as was Dr. Califf for his first time as FDA chief.
There’s an urgent need for a confirmed leader at the FDA as the United States seeks to move beyond the pandemic, the former FDA chiefs wrote. The work ahead includes continued efforts with vaccines as well as efforts to bolster medical supply chains, they said.
Dr. Califf “knows how to advance the safe development and use of medical products and to bring a sound, science-based foundation to the FDA’s regulatory actions. Because of this, he has earned the confidence of FDA’s professional career staff, as well as a broad base of patient groups, academic experts, medical professionals, and public health organizations,” Dr. Gottlieb, Dr. Hamburg, and Dr. McClellan wrote.
The article also was signed by former Centers for Medicare and Medicaid Services Administrator Andy Slavitt, who served in the Obama administration.
Support of medical community
The American Heart Association issued a statement on Feb.15, congratulating Dr. Califf on his second confirmation after the Senate vote.
“With a distinguished career in public service and a long-time volunteer leader at the American Heart Association, Dr. Califf has honed his ability to communicate and build trust with diverse constituencies,” CEO Nancy Brown said in the statement. “He will use his experience as a cardiologist to safeguard the health and well-being of people throughout the country, and his background in research to prioritize science and evidence-based policymaking.”
Dr. Califf was also backed by the Association of American Medical Colleges, the American Academy of Pediatrics, the American Academy of Family Physicians, and the American College of Physicians when he was nominated for the role last year by President Joe Biden.
A version of this article first appeared on Medscape.com.
CDC preparing to update mask guidance
, CDC Director Rochelle P. Walensky, MD, said on Feb. 16.
“As we consider future metrics, which will be updated soon, we recognize the importance of not just cases … but critically, medically severe disease that leads to hospitalizations,” Dr. Walensky said at a White House news briefing. “We must consider hospital capacity as an additional important barometer.”![]()
She later added, “We are looking at an overview of much of our guidance, and masking in all settings will be a part of that.”
Coronavirus cases continue to drop nationwide. This week’s 7-day daily average of cases is 147,000, a decrease of 40%. Hospitalizations have dropped 28% to 9,500, and daily deaths are 2,200, a decrease of 9%.
“Omicron cases are declining, and we are all cautiously optimistic about the trajectory we’re on,” Dr. Walensky said. “Things are moving in the right direction, but we want to remain vigilant to do all we can so this trajectory continues.”
Dr. Walensky said public masking remains especially important if someone is symptomatic or not feeling well, or if there has been a COVID-19 exposure. Those who are within 10 days of being diagnosed with the virus should also remain masked in public.
“We all share the same goal: to get to a point where COVID-19 is no longer disrupting our daily lives. A time when it won’t be a constant crisis,” Dr. Walensky said. “Moving from this pandemic will be a process led by science and epidemiological trends, and one that relies on the powerful tools we already have.”
A version of this article first appeared on WebMD.com.
Can cancer patients get approved COVID therapies?
In mid-November, Kevin Billingsley, MD, MBA, chief medical officer at Yale Cancer Center, New Haven, Conn., was keeping a close eye on the new COVID variant sweeping across South Africa. Six weeks later, the Omicron variant had become the dominant strain in the U.S. – and the Yale health system was no exception.
“As we entered January, we had a breathtaking rate of infection in our hospital,” said Dr. Billingsley, who also leads clinical care at the Smilow Cancer Hospital. “Some of the newly authorized COVID agents were available but not widely enough to make a clinically meaningful impact to protect all high-risk individuals during this surge.”
That left the team at Yale with difficult decisions about who would receive these treatments and who wouldn’t.
The health system convened a COVID-19 immunocompromised working group to identify which patients should get priority access to one of the promising drugs authorized to treat the infection – the monoclonal antibody sotrovimab and antiviral pills Paxlovid and molnupiravir – or the sole available option to prevent it, Evusheld.
“Although clinically sound, none of these decisions have been easy,” Dr. Billingsley told this news organization. “We have done a lot of case-by-case reviewing and a lot of handwringing. Omicron has been a wild ride for us all, and we have been doing the best we can with limited resources.”
‘We’re seeing incredible variability’
The team at Yale is not alone. The restricted supply of COVID-19 treatments has led many oncologists and other experts across the U.S. to create carefully curated lists of their most vulnerable patients.
In late December, the National Institutes of Health published broad criteria to help clinicians prioritize patients most likely to benefit from these therapies. A handful of state health departments, including those in Michigan and Minnesota, established their own standards. Patients with cancer – specifically those with hematologic malignancies and receiving oncology therapies that compromise the immune system – appeared at the top of everyone’s list.
But ultimately individual decisions about who receives these drugs and how they’re allocated fell to institutions.
“Overall, what we’re seeing is incredible variability across the country, because there’s no uniform agreement on what comprises best practices on allocating scarce resources,” said Matthew Wynia, MD, MPH, professor of medicine and director of the Center for Bioethics and Humanities at the University of Colorado, Aurora. “There are so many people at the top of most lists, and the drugs are in such short supply, that there’s no guarantee even those in the top tier will get it.”
This news organization spoke to experts across the country about their experiences accessing these treatments during the Omicron surge and their strategies prioritizing patients with cancer.
Dealing with limited supply
Overall, the limited supply of COVID-19 drugs means not every patient who’s eligible to receive a treatment will get one.
A snapshot of the past 2 weeks, for instance, shows that the count of new infections hit almost 4.3 million, while distribution of the two antiviral pills Paxlovid and molnupiravir and the monoclonal antibody sotrovimab reached just over 600,000 courses.
Since receiving emergency use authorization in early December, almost 500,000 courses of the pre-exposure prophylactic agent Evusheld – which offers about 6 months of protection for immunocompromised individuals – have been distributed; however, about 7 million adults in the U.S. could potentially benefit from it.
In addition, the distribution of drugs is uneven. The federal government manages the overall distribution to states, but states then decide how to divvy up these allocations to hospitals, pharmacies, and medical centers. In Ohio, for instance, the antivirals go to providers who already receive monoclonal antibodies, while in Tennessee, the supply of antiviral agents only goes to Walmart pharmacies.
This strategy, Dr. Wynia explained, can leave clinicians at the mercy of where and how much states decide to allocate to each location. “I’ve heard of some hospitals and health systems in Colorado that aren’t using all they’ve got, but most don’t have nearly enough,” Dr. Wynia said. However, he noted, “some of that is inevitable. We will never get a perfect distribution of these drugs when there is such variable need and demand.”
And, according to Nicolette Louissaint, PhD, MBA, senior vice president of policy and strategic planning at the Healthcare Distribution Alliance in Arlington, Virginia, “we can take some comfort that the federal government is actively looking at cases from week to week and working with state and local health departments to see who needs these products, which means the process is constantly being reviewed and adjusted.”
Plus, not every positive COVID-19 case, even among immunocompromised individuals, necessarily warrants treatment. “If, for instance, an individual with cancer has a mild case of COVID-19, their provider may not deem it necessary for them to receive treatment,” Dr. Louissaint noted.
Still, given the limited and unpredictable supply, “we have had to be thoughtful about who gets these drugs,” said Derek Raghavan, MD, PhD, president of the Levine Cancer Institute, part of the 40-hospital Atrium Health system in Charlotte, North Carolina.
Dr. Raghavan said the highest priority goes to patients with hematologic malignancies, those receiving or coming off chemotherapy or experiencing myelosuppression and immune paresis, as well as those who have undergone organ transplants. Age and other comorbidities, such as diabetes or obesity, play into the lineup as well.
To further hone their priority list, the Levine Cancer Institute has implemented a cancer-centered Hospital at Home initiative. The program includes 40 oncology nurse navigators who routinely screen and score all cancer patients who test positive for COVID-19 by their symptoms and risk factors. For a time-sensitive treatment like Paxlovid, this close monitoring allows patients with COVID to access the pills within 5 days of symptom onset.
Ultimately, “the decision regarding who gets these drugs is [made] by a team to overcome any risk of personal bias, and some of it just comes down to the interface between clinical judgment and available data,” Dr. Raghavan told this news organization. “Although we’d like to have more COVID drugs available and fewer patients with COVID, we have been able to get adequate supplies for our most at-risk patients.”
Like Dr. Raghavan, Karen Bloch, MD, MPH, the medical director for the COVID Infusion Clinic at Vanderbilt University Medical Center (VUMC), said the clinic has had to be highly selective about which patients would benefit most from the COVID monoclonal antibodies. For patients with cancer, her team prioritizes individuals who would be least able to develop antibodies through vaccination or natural infection – which includes patients with B cell malignancies, acute myeloid leukemia, or multiple myeloma receiving active treatment, as well as those who recently received an allogeneic or autologous stem cell transplant.
“Since our criteria for treatment with therapies such as sotrovimab and Evusheld are pretty stringent, we have had sufficient supply to treat those who meet our internal ‘category 1’ predetermined criteria,” said Dr. Bloch, professor of medicine and associate division director for clinical affairs at VUMC, Nashville. “More recently, as the supply chain has begun to open up, we’ve been able to loosen our criteria for sotrovimab, though not for Evusheld yet.”
The Yale team described a similar evolution. “Initially, only a small subset of oncology patients could get these drugs,” said Osama (Sam) Abdelghany, PharmD, MHA, associate director of Oncology Pharmacy Services at Smilow Cancer Hospital. But as the caseload has diminished, Dr. Abdelghany noted, “we have been able to reach many more patients with COVID-19.”
An equitable system?
Dr. Wynia, who has written many reports on crisis standards of care, has spent thousands of hours delving into the ethics of allocating scarce resources during a disaster.
A core problem arises when there are too many people who need a scarce resource and no way of differentiating among them.
In response to the limited supply of COVID-19 treatments, some institutions, such as the University of Pittsburgh Medical Center and Massachusetts General Hospital, have created a lottery system. Others, such as Johns Hopkins Medicine, have opted for first come, first served. Each strategy comes with caveats.
“First come, first served prioritization may be quicker, but it gives more well-resourced people an advantage and lends itself to people abusing the system or exacerbating existing disparities,” Dr. Wynia said.
While a lottery system may be more equitable, this strategy often comes at the price of efficiency. “The practicality of doing a lottery when you have to make a decision about whether or not to treat the patient sitting in front of you comes with its own challenges,” Dr. Wynia said.
At the University of Colorado, he explained, the health center constantly scans medical records for patients who have been diagnosed with COVID and fall into a high-risk group. That way clinicians can call or email those most likely to benefit from these drugs.
“It ends up being a bit of a first come, first served strategy,” Dr. Wynia said. “But we also do not have a huge supply coming in each week, so reaching out to the most eligible people when we have the drugs in hand means more privileged patients are less likely to game the system.”
To manage the supply of Evusheld, Timothy Kubal, MD, MBA, and colleagues also reach out to patients most likely to benefit – specifically, those who can’t mount an adequate antibody response after vaccination.
“We screen all of our patients who have been receiving anti-CD20 agents and other chemotherapy agents known to suppress antibody response,” Dr. Kubal, a medical oncologist/hematologist at the Moffitt Institute in Tampa, Florida, said in an interview. “We then test those patients for antibodies and deliver Evusheld if they have no evidence of antibodies.”
Fortunately, in the coming months, distribution of these drugs should improve significantly. Pfizer says it expects to deliver 10 million courses of Paxlovid by the end of June, and another 10 million by the end of September. More than 1 million courses of sotrovimab should be distributed by GlaxoSmithKline through the end of March. And, recently, the Biden administration announced it purchased 1.2 million courses of Evusheld from AstraZeneca.
“Every few weeks, because the COVID picture changes, the demand changes,” said Dr. Louissaint. “With vaccination rates going up and cases going down, fewer patients will need these products.”
Still, the constant barrage of supply shortages over the past 2 years – from COVID tests, ventilators, and personal protective equipment early on to COVID vaccines a year later and more recently health care staff and COVID tests once again – has taken its toll.
“We have faced supply challenge after challenge and have had to be creative in each situation,” said Lisa Barbarotta, MSN, APRN, program director of Oncology Education and Clinical Practice at Smilow Cancer Hospital. “Nothing has been easy about this.”
And, Dr. Bloch cautioned, even with broader access to COVID-19 drugs on the horizon, there is still no substitute for vaccination. “Getting vaccinated is the best and first line of defense for most people,” she said.
A version of this article first appeared on Medscape.com.