User login
CDC officially endorses third dose of mRNA vaccines for immunocompromised
Centers for Disease Control and Prevention Director Rochelle Walensky, MD, has officially signed off on a recommendation by an independent panel of 11 experts to allow people with weakened immune function to get a third dose of certain COVID-19 vaccines.
The decision follows a unanimous vote by the CDC’s Advisory Committee on Immunization Practices (ACIP), which in turn came hours after the U.S. Food and Drug Administration updated its Emergency Use Authorization (EUA) for the Pfizer and Moderna mRNA vaccines.
About 7 million adults in the United States have moderately to severely impaired immune function because of a medical condition they live with or a medication they take to manage a health condition.
People who fall into this category are at higher risk of being hospitalized or dying if they get COVID-19. They are also more likely to transmit the infection. About 40% of vaccinated patients who are hospitalized with breakthrough cases are immunocompromised.
Recent studies have shown that between one-third and one-half of immunocompromised people who didn’t develop antibodies after two doses of a vaccine do get some level of protection after a third dose.
Even then, however, the protection immunocompromised people get from vaccines is not as robust as someone who has healthy immune function, and some panel members were concerned that a third dose might come with a false sense of security.
“My only concern with adding a third dose for the immunocompromised is the impression that our immunocompromised population [will] then be safe,” said ACIP member Helen Talbot, MD, MPH, an associate professor of medicine at Vanderbilt University Medical Center in Nashville, Tenn.
“I think the reality is they’ll be safer but still at incredibly high risk for severe disease and death,” she said.
In updating its EUA, the FDA stressed that, even after a third dose, people who are immunocompromised will still need to wear a mask indoors, socially distance, and avoid large crowds. In addition, family members and other close contacts should be fully vaccinated to protect these vulnerable individuals.
Johnson & Johnson not in the mix
The boosters will be available to children as young as 12 years of age who’ve had a Pfizer vaccine or those ages 18 and older who’ve gotten the Moderna vaccine.
For now, people who’ve had the one-dose Johnson & Johnson vaccine have not been cleared to get a second dose of any vaccine.
FDA experts acknowledged the gap but said that people who had received the Johnson & Johnson vaccine represented a small slice of vaccinated Americans, and said they couldn’t act before the FDA had updated its authorization for that vaccine, which the agency is actively exploring.
“We had to do what we’re doing based on the data we have in hand,” said Peter Marks, MD, director of the Center for Biologics Evaluation and Research at the FDA, the division of the agency that regulates vaccines.
“We think at least there is a solution here for the very large majority of immunocompromised individuals, and we believe we will probably have a solution for the remainder in the not-too-distant future,” Dr. Marks said.
In its updated EUA, the FDA said that the third shots were intended for people who had undergone solid organ transplants or have an “equivalent level of immunocompromise.”
The details
Clinical experts on the CDC panel spent a good deal of time trying to suss out exactly what conditions might fall under the FDA’s umbrella for a third dose.
In a presentation to the committee, Neela Goswami, MD, PhD, an assistant professor of infectious diseases at Emory University School of Medicine and of epidemiology at the Emory Rollins School of Public Health, Atlanta, stressed that the shots are intended for patients who are moderately or severely immunocompromised, in close consultation with their doctors, but that people who should qualify would include those:
- Receiving treatment for solid tumors or blood cancers
- Taking immunosuppressing medications after a solid organ transplant
- Within 2 years of receiving CAR-T therapy or a stem cell transplant
- Who have primary immunodeficiencies – rare genetic disorders that prevent the immune system from working properly
- With advanced or untreated
- Taking high-dose corticosteroids (more than 20 milligrams of or its equivalent daily), alkylating agents, antimetabolites, chemotherapy, TNF blockers, or other immunomodulating or immunosuppressing biologics
- With certain chronic medical conditions, such as or asplenia – living without a spleen
- Receiving dialysis
In discussion, CDC experts clarified that these third doses were not intended for people whose immune function had waned with age, such as elderly residents of long-term care facilities or people with chronic diseases like diabetes.
The idea is to try to get a third dose of the vaccine they’ve already had – Moderna or Pfizer – but if that’s not feasible, it’s fine for the third dose to be different from what someone has had before. The third dose should be given at least 28 days after a second dose, and, ideally, before the initiation of immunosuppressive therapy.
Participants in the meeting said that the CDC would post updated materials on its website to help guide physicians on exactly who should receive third doses.
Ultimately, however, the extra doses will be given on an honor system; no prescriptions or other kinds of clinical documentation will be required for people to get a third dose of these shots.
Tests to measure neutralizing antibodies are also not recommended before the shots are given because of differences in the types of tests used to measure these antibodies and the difficulty in interpreting them. It’s unclear right now what level of neutralizing antibodies is needed for protection.
‘Peace of mind’
In public testimony, Heather Braaten, a 44-year-old being treated for ovarian cancer, said she was grateful to have gotten two shots of the Pfizer vaccine last winter, in between rounds of chemotherapy, but she knew she was probably not well protected. She said she’d become obsessive over the past few months reading medical studies and trying to understand her risk.
“I have felt distraught over the situation. My prognosis is poor. I most likely have about two to three years left to live, so everything counts,” Ms. Braaten said.
She said her life ambitions were humble. She wants to visit with friends and family and not have to worry that she’ll be a breakthrough case. She wants to go grocery shopping again and “not panic and leave the store after five minutes.” She’d love to feel free to travel, she said.
“While I understand I still need to be cautious, I am hopeful for the peace of mind and greater freedom a third shot can provide,” Ms. Braaten said.
More boosters on the way?
In the second half of the meeting, the CDC also signaled that it was considering the use of boosters for people whose immunity might have waned in the months since they had completed their vaccine series, particularly seniors. About 75% of people hospitalized with vaccine breakthrough cases are over age 65, according to CDC data.
Those considerations are becoming more urgent as the Delta variant continues to pummel less vaccinated states and counties.
In its presentation to the ACIP, Heather Scobie, PhD, MPH, a member of the CDC’s COVID Response Team, highlighted data from Canada, Israel, Qatar, and the United Kingdom showing that, while the Pfizer vaccine was still highly effective at preventing hospitalizations and death, it’s far less likely when faced with Delta to prevent an infection that causes symptoms.
In Israel, Pfizer’s vaccine prevented symptoms an average of 41% of the time. In Qatar, which is also using the Moderna vaccine, Pfizer’s prevented symptomatic infections with Delta about 54% of the time compared with 85% with Moderna’s.
Dr. Scobie noted that Pfizer’s waning efficacy may have something to do with the fact that it uses a lower dosage than Moderna’s. Pfizer’s recommended dosing interval is also shorter – 3 weeks compared with 4 weeks for Moderna’s. Stretching the time between shots has been shown to boost vaccine effectiveness, she said.
New data from the Mayo clinic, published ahead of peer review, also suggest that Pfizer’s protection may be fading more quickly than Moderna’s.
In February, both shots were nearly 100% effective at preventing the SARS-CoV-2 infection, but by July, against Delta, Pfizer’s efficacy had dropped to somewhere between 13% and 62%, while Moderna’s was still effective at preventing infection between 58% and 87% of the time.
In July, Pfizer’s was between 24% and 94% effective at preventing hospitalization with a COVID-19 infection and Moderna’s was between 33% and 96% effective at preventing hospitalization.
While that may sound like cause for concern, Dr. Scobie noted that, as of August 2, severe COVD-19 outcomes after vaccination are still very rare. Among 164 million fully vaccinated people in the United States there have been about 7,000 hospitalizations and 1,500 deaths; nearly three out of four of these have been in people over the age of 65.
The ACIP will next meet on August 24 to focus solely on the COVID-19 vaccines.
A version of this article first appeared on Medscape.com.
Pathology society first to call for nationwide vaccination mandate
The American Society for Clinical Pathology (ASCP), which represents over 100,000 pathologists and medical laboratory professionals, has called for a nationwide vaccination mandate. It is the first medical specialty society to do so, ASCP chief executive officer Blair Holladay, PhD, said in an interview.
However, the American Lung Association this week said it supports President Biden’s call for businesses to require their employees to be vaccinated. In addition, more than 50 medical societies, including ASCP, recently said they support vaccination mandates for health care workers.
In a position statement released Wednesday, ASCP recommended that every eligible American be vaccinated. “The U.S. Food and Drug Administration is soon expected to fully approve at least one COVID-19 vaccine, and when it does, we urge that vaccination requirements become the norm,” the society said.
Second, ASCP noted that at least 16 states have enacted some form of a ban on COVID-19 vaccine mandates or related requirements. These include blocking employment-based mandates, school vaccination or mask requirements, and vaccine passport requirements.
“These laws prolong the pandemic and threaten the health and safety of every American. They should be repealed or overturned immediately,” the association stated.
Third, ASCP said, it supports the guidance of the Centers for Disease Control and Prevention that masks should be worn indoors in public places in areas of substantial or high COVID-19 transmission.
“Before more people die, our elected leaders need to take serious and aggressive action to ensure that Americans get vaccinated, so we can end the pandemic, end patient and family suffering, end the fatalities, and get back to the lives we had before COVID-19,” the statement concluded.
Laboratories have to focus on COVID again
In his interview, Dr. Holladay noted that the eruption of the Delta variant across the country has again forced laboratories to focus on COVID-19 testing at the expense of necessary tests related to other diseases.
“Because 7 of 10 medical decisions depend on the laboratory, anything that interferes with that interferes with the needs of patient care, including preventive, chronic, and acute care services,” he said.
This is a major reason, he said, for ASCP to support a national vaccination mandate. “People have postponed treatment because of the inability to access medical care [for other conditions],” he noted. The same is true for preventive or diagnostic care such as biopsies for breast cancer and colonoscopies, he added.
“In many parts of the country, the throughput of COVID tests made it difficult for us to focus on tests for other acute conditions. It overwhelmed the laboratory personnel in terms of the number of tests being run.”
Returning to the ‘dark days’
This was a significant issue in the earlier part of the pandemic, Dr. Holladay recalled. The shortage of non-COVID lab capacity eased in the spring and early summer of 2021, when COVID-19 vaccines became widely available.
“But with the Delta variant, we’re going back to those dark days and creating the same bottleneck that we saw in the beginning,” he said.
Although the situation is worse in some states than others, Dr. Holladay added, some of the hardest-hit states like Florida and Texas have very large populations.
“This is not just about doctors, nurses, pathologists, and laboratory personnel being exhausted,” commented Kimberly Sanford, MD, president of ASCP, in a press release. “Laboratory medicine is absolutely necessary for accurate and timely diagnosis of disease, infection control, and effective treatment planning. It is an essential part of the health care system and often overwhelmed by the increasing number of coronavirus tests requiring immediate analysis.
“Such testing takes time and disproportionately consumes scarce equipment and other resources. It means those with cancer and other life-threatening conditions face serious delays in diagnosis and treatment. It delays medical diagnoses, erects barriers to preventative care, and prevents us from focusing on the significant health care needs of the population at large.”
A version of this article first appeared on Medscape.com.
FDA may okay COVID booster for vulnerable adults before weekend: Media
according to multiple media reports.

The agency, along with the Centers for Disease Control and Prevention (CDC) and the National Institutes of Health, is working through the details of how booster doses for this population would work, and could authorize a third dose of both the Pfizer and Moderna vaccines as early as Aug. 12, Politico reports.
About 2.7% of adults in the United States are immunocompromised, according to the CDC. This group includes people who have cancer, have received solid organ or stem cell transplants, have genetic conditions that weaken the immune function, have HIV, or are people with health conditions that require treatment with medications that turn down immune function, such as rheumatoid arthritis.
Immune function also wanes with age, so the FDA could consider boosters for the elderly.
New research shows that between one-third and one-half of immunocompromised patients who didn’t develop detectable levels of virus-fighting antibodies after two doses of a COVID vaccine will respond to a third dose.
A committee of independent experts that advises the CDC on the use of vaccines in the United States had previously signaled its support for giving boosters to those who are immunocompromised, but noted that it couldn’t officially recommend the strategy until the FDA had updated its emergency-use authorization for the shots or granted them a full biologics license, or “full approval.”
It’s unclear which mechanism the FDA might use, or exactly who will be eligible for the shots.
The United States would follow other nations such as Israel, France, the United Kingdom, and Germany in planning for or authorizing boosters for some vulnerable individuals.
The World Health Organization (WHO) has voiced strong opposition to the use of boosters in wealthy countries while much of the world still doesn’t have access to these lifesaving therapies. The WHO has asked wealthy nations to hold off on giving boosters until at least the end of September to give more people the opportunity to get a first dose.
The CDC’s Advisory Committee on Immunization Practices (ACIP) meets again on Aug. 13 and is expected to discuss booster doses for this population of patients. The ACIP officially makes recommendations on the use of vaccines to the nation’s doctors.
The committee’s recommendation ensures that a vaccine will be covered by public and private insurers. Statutory vaccination requirements are also made based on the ACIP’s recommendations.
A version of this article first appeared on Medscape.com.
according to multiple media reports.
The agency, along with the Centers for Disease Control and Prevention (CDC) and the National Institutes of Health, is working through the details of how booster doses for this population would work, and could authorize a third dose of both the Pfizer and Moderna vaccines as early as Aug. 12, Politico reports.
About 2.7% of adults in the United States are immunocompromised, according to the CDC. This group includes people who have cancer, have received solid organ or stem cell transplants, have genetic conditions that weaken the immune function, have HIV, or are people with health conditions that require treatment with medications that turn down immune function, such as rheumatoid arthritis.
Immune function also wanes with age, so the FDA could consider boosters for the elderly.
New research shows that between one-third and one-half of immunocompromised patients who didn’t develop detectable levels of virus-fighting antibodies after two doses of a COVID vaccine will respond to a third dose.
A committee of independent experts that advises the CDC on the use of vaccines in the United States had previously signaled its support for giving boosters to those who are immunocompromised, but noted that it couldn’t officially recommend the strategy until the FDA had updated its emergency-use authorization for the shots or granted them a full biologics license, or “full approval.”
It’s unclear which mechanism the FDA might use, or exactly who will be eligible for the shots.
The United States would follow other nations such as Israel, France, the United Kingdom, and Germany in planning for or authorizing boosters for some vulnerable individuals.
The World Health Organization (WHO) has voiced strong opposition to the use of boosters in wealthy countries while much of the world still doesn’t have access to these lifesaving therapies. The WHO has asked wealthy nations to hold off on giving boosters until at least the end of September to give more people the opportunity to get a first dose.
The CDC’s Advisory Committee on Immunization Practices (ACIP) meets again on Aug. 13 and is expected to discuss booster doses for this population of patients. The ACIP officially makes recommendations on the use of vaccines to the nation’s doctors.
The committee’s recommendation ensures that a vaccine will be covered by public and private insurers. Statutory vaccination requirements are also made based on the ACIP’s recommendations.
A version of this article first appeared on Medscape.com.
Opioid prescribing laws having an impact
State laws capping initial opioid prescriptions to 7 days or less have led to a reduction in opioid prescribing, a new analysis of Medicare data shows.
While overall opioid prescribing has decreased, the reduction in states with legislation restricting opioid prescribing was “significantly greater than in states without such legislation,” study investigator Michael Brenner, MD, University of Michigan, Ann Arbor, said in an interview.
The study was published online August 9 in JAMA Internal Medicine.
Significant but limited effect
Because of rising concern around the opioid crisis, 23 states representing 43% of the U.S. population passed laws from 2016 through 2018 limiting initial opioid prescription to 7 days or less.
Using Medicare data from 2013 through 2018, Dr. Brenner and colleagues conducted a before-and-after study to assess the effect of these laws.
They found that on average, the number of days an opioid was prescribed for each Medicare beneficiary decreased by 11.6 days (from 44.2 days in 2013 to 32.7 days in 2018) in states that imposed duration limits, compared with 10.1 days in states without these laws (from 43.4 days in 2013 to 33.3 days in 2018).
Prior to the start of duration limits in 2016, days an opioid was prescribed were comparable among states.
After adjusting for state-level differences in race, urbanization, median income, tobacco and alcohol use, serious mental illness, and other factors, state laws limiting opioid prescriptions to 7 days or less were associated with a reduction in prescribing of 1.7 days per enrollee, “suggesting a significant but limited outcome” for these laws, the researchers note.
, but this was not significantly different in states with limit laws versus those without. However, state laws limiting duration led to a significant reduction in days of opioid prescribed among surgeons, dentists, pain specialists, and other specialists.
Inadequate pain control?
The researchers note the study was limited to Medicare beneficiaries; however, excess opioid prescribing is prevalent across all patient populations.
In addition, it’s not possible to tell from the data whether acute pain was adequately controlled with fewer pills.
“The question of adequacy of pain control is a crucial one that has been investigated extensively in prior work but was not possible to evaluate in this particular study,” said Dr. Brenner.
However, “ample evidence supports a role for reducing opioid prescribing and that such reduction can be achieved while ensuring that pain is adequately controlled with fewer pills,” he noted.
“A persistent misconception is that opioids are uniquely powerful and effective for controlling pain. Patients may perceive that effective analgesia is being withheld when opioids are not included in a regimen,” Dr. Brenner added.
“Yet, the evidence from meta-analyses derived from large numbers of randomized clinical trials finds that [nonsteroidal anti-inflammatory drugs] NSAIDS combined with acetaminophen provide similar or improved acute pain when compared to commonly prescribed opioid regimens, based on number-needed-to-treat analyses,” he added.
In a related editorial, Deborah Grady, MD, MPH, with University of California, San Francisco, and Mitchell H. Katz, MD, president and CEO of NYC Health + Hospitals, say the decrease in opioid prescribing with duration limits was “small but probably meaningful.”
Restricting initial prescriptions to seven or fewer days is “reasonable because patients with new onset of pain should be re-evaluated in a week if the pain continues,” they write.
However, Dr. Grady and Dr. Katz “worry” that restricting initial prescriptions to shorter periods, such as 3 or 5 days, as has occurred in six states, “may result in patients with acute pain going untreated or having to go to extraordinary effort to obtain adequate pain relief.”
In their view, the data from this study suggest that limiting initial prescriptions to seven or fewer days is “helpful, but we would not restrict any further given that we do not know how it affected patients with acute pain.”
The study had no specific funding. Dr. Brenner, Dr. Grady, and Dr. Katz have disclosed no relevant financial relationships.
A version of this article first appeared on Medscape.com.
Indoor masking needed in almost 70% of U.S. counties: CDC data
In announcing new guidance on July 27, the CDC said vaccinated people should wear face masks in indoor public places with “high” or “substantial” community transmission rates of COVID-19.
Data from the CDC shows that designation covers 69.3% of all counties in the United States – 52.2% (1,680 counties) with high community transmission rates and 17.1% (551 counties) with substantial rates.
A county has “high transmission” if it reports 100 or more weekly cases per 100,000 residents or a 10% or higher test positivity rate in the last 7 days, the CDC said. “Substantial transmission” means a county reports 50-99 weekly cases per 100,000 residents or has a positivity rate between 8% and 9.9% in the last 7 days.
About 23% of U.S. counties had moderate rates of community transmission, and 7.67% had low rates.
To find out the transmission rate in your county, go to the CDC COVID data tracker.
Smithsonian requiring masks again
The Smithsonian now requires all visitors over age 2, regardless of vaccination status, to wear face masks indoors and in all museum spaces.
The Smithsonian said in a news release that fully vaccinated visitors won’t have to wear masks at the National Zoo or outdoor gardens for museums.
The new rule goes into effect Aug. 6. It reverses a rule that said fully vaccinated visitors didn’t have to wear masks indoors beginning June 28.
Indoor face masks will be required throughout the District of Columbia beginning July 31., D.C. Mayor Muriel Bowser.
House Republicans protest face mask policy
About 40 maskless Republican members of the U.S. House of Representatives filed onto the Senate floor on July 29 to protest a new rule requiring House members to wear face masks, the Hill reported.
Congress’s attending doctor said in a memo that the 435 members of the House, plus workers, must wear masks indoors, but not the 100 members of the Senate. The Senate is a smaller body and has had better mask compliance than the House.
Rep. Ronny Jackson (R-Tex.), told the Hill that Republicans wanted to show “what it was like on the floor of the Senate versus the floor of the House. Obviously, it’s vastly different.”
Among the group of Republicans who filed onto the Senate floor were Rep. Lauren Boebert of Colorado, Rep. Matt Gaetz and Rep. Byron Donalds of Florida, Rep. Marjorie Taylor Greene of Georgia, Rep. Chip Roy and Rep. Louie Gohmert of Texas, Rep. Madison Cawthorn of North Carolina, Rep. Warren Davidson of Ohio, and Rep. Andy Biggs of Arizona.
A version of this article first appeared on WebMD.com.
Traumatic Fractures Should Trigger Osteoporosis Assessment in Postmenopausal Women
Study Overview
Objective. To compare the risk of subsequent fractures after an initial traumatic or nontraumatic fracture in postmenopausal women.
Design. A prospective observational study utilizing data from the Women’s Health Initiative (WHI) Study, WHI Clinical Trials (WHI-CT), and WHI Bone Density Substudy to evaluate rates at which patients who suffered a traumatic fracture vs nontraumatic fracture develop a subsequent fracture.
Setting and participants. The WHI study, implemented at 40 United States clinical sites, enrolled 161 808 postmenopausal women aged 50 to 79 years at baseline between 1993 and 1998. The study cohort consisted of 75 335 patients who had self-reported fractures from September 1994 to December 1998 that were confirmed by the WHI Bone Density Substudy and WHI-CT. Of these participants, 253 (0.3%) were excluded because of a lack of follow-up information regarding incident fractures, and 8208 (10.9%) were excluded due to incomplete information on covariates, thus resulting in an analytic sample of 66 874 (88.8%) participants. Prospective fracture ascertainment with participants was conducted at least annually and the mechanism of fracture was assessed to differentiate traumatic vs nontraumatic incident fractures. Traumatic fractures were defined as fractures caused by motor vehicle collisions, falls from a height, falls downstairs, or sports injury. Nontraumatic fractures were defined as fractures caused by a trip and fall.
Main outcome measures. The primary outcome was an incident fracture at an anatomically distinct body part. Fractures were classified as upper extremity (carpal, elbow, lower or upper end of humerus, shaft of humerus, upper radius/ulna, or radius/ulna), lower extremity (ankle, hip, patella, pelvis, shaft of femur, tibia/fibula, or tibial plateau), or spine (lumbar and/or thoracic spine). Self-reported fractures were verified via medical chart review by WHI study physicians; hip fractures were confirmed by review of written reports of radiographic studies; and nonhip fractures were confirmed by review of radiography reports or clinical documentations.
Main results. In total, 66 874 women in the study (mean [SD] age) 63.1 (7.0) years without clinical fracture and 65.3 (7.2) years with clinical fracture at baseline were followed for 8.1 (1.6) years. Of these participants, 7142 (10.7%) experienced incident fracture during the study follow-up period (13.9 per 1000 person-years), and 721 (10.1%) of whom had a subsequent fracture. The adjusted hazard ratio (aHR) of subsequent fracture after an initial fracture was 1.49 (95% CI, 1.38-1.61, P < .001). Covariates adjusted were age, race, ethnicity, body mass index, treated diabetes, frequency of falls in the previous year, and physical function and activity. In women with initial traumatic fracture, the association between initial and subsequent fracture was increased (aHR, 1.25; 95% CI, 1.06-1.48, P = .01). Among women with initial nontraumatic fracture, the association between initial and subsequent fracture was also increased (aHR, 1.52; 95% CI, 1.37-1.68, P < .001). The confidence intervals for the 2 preceding associations for traumatic and nontraumatic initial fracture strata were overlapping.
Conclusion. Fractures, regardless of mechanism of injury, are similarly associated with an increased risk of subsequent fractures in postmenopausal women aged 50 years and older. Findings from this study provide evidence to support reevaluation of current clinical guidelines to include traumatic fracture as a trigger for osteoporosis screening.
Commentary
Osteoporosis is one of the most common age-associated disease that affects 1 in 4 women and 1 in 20 men over the age of 65.1 It increases the risk of fracture, and its clinical sequelae include reduced mobility, health decline, and increased all-cause mortality. The high prevalence of osteoporosis poses a clinical challenge as the global population continues to age. Pharmacological treatments such as bisphosphonates are highly effective in preventing or slowing bone mineral density (BMD) loss and reducing risk of fragility fractures (eg, nontraumatic fractures of the vertebra, hip, and femur) and are commonly used to mitigate adverse effects of degenerative bone changes secondary to osteoporosis.1
The high prevalence of osteoporosis and effectiveness of bisphosphonates raises the question of how to optimally identify adults at risk for osteoporosis so that pharmacologic therapy can be promptly initiated to prevent disease progression. Multiple osteoporosis screening guidelines, including those from the United States Preventive Services Task Force (USPSTF), American Association of Family Physicians, and National Osteoporosis Foundation, are widely used in the clinical setting to address this important clinical question. In general, the prevailing wisdom is to screen osteoporosis in postmenopausal women over the age of 65, women under the age of 65 who have a significant 10-year fracture risk, or women over the age of 50 who have experienced a fragility fracture.1 In the study reported by Crandall et al, it was shown that the risks of having subsequent fractures were similar after an initial traumatic or nontraumatic (fragility) fracture in postmenopausal women aged 50 years and older.2 This finding brings into question whether traumatic fractures should be viewed any differently than nontraumatic fractures in women over the age of 50 in light of evaluation for osteoporosis. Furthermore, these results suggest that most fractures in postmenopausal women may indicate decreased bone integrity, thus adding to the rationale that osteoporosis screening needs to be considered and expanded to include postmenopausal women under the age of 65 who endured a traumatic fracture.
Per current guidelines, a woman under the age of 65 is recommended for osteoporosis screening only if she has an increased 10-year fracture risk compared to women aged 65 years and older. This risk is calculated based on the World Health Organization fracture-risk algorithm (WHO FRAX) tool which uses multiple factors such as age, weight, and history of fragility fractures to predict whether an individual is at risk of developing a fracture in the next 10 years. The WHO FRAX tool does not include traumatic fractures in its risk calculation and current clinical guidelines do not account for traumatic fractures as a red flag to initiate osteoporosis screening. Therefore, postmenopausal women under the age of 65 are less likely to be screened for osteoporosis when they experience a traumatic fracture compared to a fragility fracture, despite being at a demonstrably higher risk for subsequent fracture. As an unintended consequence, this may lead to the under diagnosis of osteoporosis in postmenopausal women under the age of 65. Thus, Crandall et al conclude that a fracture due to any cause warrants follow up evaluation for osteoporosis including BMD testing in women older than 50 years of age.
Older men constitute another population who are commonly under screened for osteoporosis. The current USPSTF guidelines indicate that there is an insufficient body of evidence to screen men for osteoporosis given its lower prevalence.1 However, it is important to note that men have significantly increased mortality after a hip fracture, are less likely to be on pharmacological treatment for osteoporosis, and are under diagnosed for osteoporosis.3 Consistent with findings from the current study, Leslie et al showed that high-trauma and low-trauma fractures have similarly elevated subsequent fracture risk in both men and women over the age of 40 in a Canadian study.4 Moreover, in the same study, BMD was decreased in both men and women who suffered a fracture regardless of the injury mechanism. This finding further underscores a need to consider traumatic fractures as a risk factor for osteoporosis. Taken together, given that men are under screened and treated for osteoporosis but have increased mortality post-fracture, considerations to initiate osteoporosis evaluation should be similarly given to men who endured a traumatic fracture.
The study conducted by Crandall et al has several strengths. It is noteworthy for the large size of the WHI cohort with participants from across the United States which enables the capture of a wider range of age groups as women under the age of 65 are not common participants of osteoporosis studies. Additionally, data ascertainment and outcome adjudication utilizing medical records and physician review assure data quality. A limitation of the study is that the study cohort consists exclusively of women and therefore the findings are not generalizable to men. However, findings from this study echo those from other studies that investigate the relationship between fracture mechanisms and subsequent fracture risk in men and women.3,4 Collectively, these comparable findings highlight the need for additional research to validate traumatic fracture as a risk factor for osteoporosis and to incorporate it into clinical guidelines for osteoporosis screening.
Applications for Clinical Practice
The findings from the current study indicate that traumatic and fragility fractures may be more alike than previously recognized in regards to bone health and subsequent fracture prevention in postmenopausal women. If validated, these results may lead to changes in clinical practice whereby all fractures in postmenopausal women could trigger osteoporosis screening, assessment, and treatment if indicated for the secondary prevention of fractures.
1. US Preventive Services Task Force, Curry SJ, Krist Ah, et al. Screening for Osteoporosis to Prevent Fractures: US Preventive Services Task Force Recommendation Statement. JAMA. 2018;319(24):2521–2531. doi:10.1001/jama.2018.7498
2. Crandall CJ, Larson JC, LaCroix AZ, et al. Risk of Subsequent Fractures in Postmenopausal Women After Nontraumatic vs Traumatic Fractures. JAMA Intern Med. Published online June 7, 2021. doi:10.1001/jamainternmed.2021.2617
3. Mackey DC, Lui L, Cawthon PM, et al. High-Trauma Fractures and Low Bone Mineral Density in Older Women and Men. JAMA. 2007;298(20):2381–2388. doi:10.1001/jama.298.20.2381
4. Leslie WD, Schousboe JT, Morin SN, et al. Fracture risk following high-trauma versus low-trauma fracture: a registry-based cohort study. Osteoporos Int. 2020;31(6):1059–1067. doi:10.1007/s00198-019-05274-2
Study Overview
Objective. To compare the risk of subsequent fractures after an initial traumatic or nontraumatic fracture in postmenopausal women.
Design. A prospective observational study utilizing data from the Women’s Health Initiative (WHI) Study, WHI Clinical Trials (WHI-CT), and WHI Bone Density Substudy to evaluate rates at which patients who suffered a traumatic fracture vs nontraumatic fracture develop a subsequent fracture.
Setting and participants. The WHI study, implemented at 40 United States clinical sites, enrolled 161 808 postmenopausal women aged 50 to 79 years at baseline between 1993 and 1998. The study cohort consisted of 75 335 patients who had self-reported fractures from September 1994 to December 1998 that were confirmed by the WHI Bone Density Substudy and WHI-CT. Of these participants, 253 (0.3%) were excluded because of a lack of follow-up information regarding incident fractures, and 8208 (10.9%) were excluded due to incomplete information on covariates, thus resulting in an analytic sample of 66 874 (88.8%) participants. Prospective fracture ascertainment with participants was conducted at least annually and the mechanism of fracture was assessed to differentiate traumatic vs nontraumatic incident fractures. Traumatic fractures were defined as fractures caused by motor vehicle collisions, falls from a height, falls downstairs, or sports injury. Nontraumatic fractures were defined as fractures caused by a trip and fall.
Main outcome measures. The primary outcome was an incident fracture at an anatomically distinct body part. Fractures were classified as upper extremity (carpal, elbow, lower or upper end of humerus, shaft of humerus, upper radius/ulna, or radius/ulna), lower extremity (ankle, hip, patella, pelvis, shaft of femur, tibia/fibula, or tibial plateau), or spine (lumbar and/or thoracic spine). Self-reported fractures were verified via medical chart review by WHI study physicians; hip fractures were confirmed by review of written reports of radiographic studies; and nonhip fractures were confirmed by review of radiography reports or clinical documentations.
Main results. In total, 66 874 women in the study (mean [SD] age) 63.1 (7.0) years without clinical fracture and 65.3 (7.2) years with clinical fracture at baseline were followed for 8.1 (1.6) years. Of these participants, 7142 (10.7%) experienced incident fracture during the study follow-up period (13.9 per 1000 person-years), and 721 (10.1%) of whom had a subsequent fracture. The adjusted hazard ratio (aHR) of subsequent fracture after an initial fracture was 1.49 (95% CI, 1.38-1.61, P < .001). Covariates adjusted were age, race, ethnicity, body mass index, treated diabetes, frequency of falls in the previous year, and physical function and activity. In women with initial traumatic fracture, the association between initial and subsequent fracture was increased (aHR, 1.25; 95% CI, 1.06-1.48, P = .01). Among women with initial nontraumatic fracture, the association between initial and subsequent fracture was also increased (aHR, 1.52; 95% CI, 1.37-1.68, P < .001). The confidence intervals for the 2 preceding associations for traumatic and nontraumatic initial fracture strata were overlapping.
Conclusion. Fractures, regardless of mechanism of injury, are similarly associated with an increased risk of subsequent fractures in postmenopausal women aged 50 years and older. Findings from this study provide evidence to support reevaluation of current clinical guidelines to include traumatic fracture as a trigger for osteoporosis screening.
Commentary
Osteoporosis is one of the most common age-associated disease that affects 1 in 4 women and 1 in 20 men over the age of 65.1 It increases the risk of fracture, and its clinical sequelae include reduced mobility, health decline, and increased all-cause mortality. The high prevalence of osteoporosis poses a clinical challenge as the global population continues to age. Pharmacological treatments such as bisphosphonates are highly effective in preventing or slowing bone mineral density (BMD) loss and reducing risk of fragility fractures (eg, nontraumatic fractures of the vertebra, hip, and femur) and are commonly used to mitigate adverse effects of degenerative bone changes secondary to osteoporosis.1
The high prevalence of osteoporosis and effectiveness of bisphosphonates raises the question of how to optimally identify adults at risk for osteoporosis so that pharmacologic therapy can be promptly initiated to prevent disease progression. Multiple osteoporosis screening guidelines, including those from the United States Preventive Services Task Force (USPSTF), American Association of Family Physicians, and National Osteoporosis Foundation, are widely used in the clinical setting to address this important clinical question. In general, the prevailing wisdom is to screen osteoporosis in postmenopausal women over the age of 65, women under the age of 65 who have a significant 10-year fracture risk, or women over the age of 50 who have experienced a fragility fracture.1 In the study reported by Crandall et al, it was shown that the risks of having subsequent fractures were similar after an initial traumatic or nontraumatic (fragility) fracture in postmenopausal women aged 50 years and older.2 This finding brings into question whether traumatic fractures should be viewed any differently than nontraumatic fractures in women over the age of 50 in light of evaluation for osteoporosis. Furthermore, these results suggest that most fractures in postmenopausal women may indicate decreased bone integrity, thus adding to the rationale that osteoporosis screening needs to be considered and expanded to include postmenopausal women under the age of 65 who endured a traumatic fracture.
Per current guidelines, a woman under the age of 65 is recommended for osteoporosis screening only if she has an increased 10-year fracture risk compared to women aged 65 years and older. This risk is calculated based on the World Health Organization fracture-risk algorithm (WHO FRAX) tool which uses multiple factors such as age, weight, and history of fragility fractures to predict whether an individual is at risk of developing a fracture in the next 10 years. The WHO FRAX tool does not include traumatic fractures in its risk calculation and current clinical guidelines do not account for traumatic fractures as a red flag to initiate osteoporosis screening. Therefore, postmenopausal women under the age of 65 are less likely to be screened for osteoporosis when they experience a traumatic fracture compared to a fragility fracture, despite being at a demonstrably higher risk for subsequent fracture. As an unintended consequence, this may lead to the under diagnosis of osteoporosis in postmenopausal women under the age of 65. Thus, Crandall et al conclude that a fracture due to any cause warrants follow up evaluation for osteoporosis including BMD testing in women older than 50 years of age.
Older men constitute another population who are commonly under screened for osteoporosis. The current USPSTF guidelines indicate that there is an insufficient body of evidence to screen men for osteoporosis given its lower prevalence.1 However, it is important to note that men have significantly increased mortality after a hip fracture, are less likely to be on pharmacological treatment for osteoporosis, and are under diagnosed for osteoporosis.3 Consistent with findings from the current study, Leslie et al showed that high-trauma and low-trauma fractures have similarly elevated subsequent fracture risk in both men and women over the age of 40 in a Canadian study.4 Moreover, in the same study, BMD was decreased in both men and women who suffered a fracture regardless of the injury mechanism. This finding further underscores a need to consider traumatic fractures as a risk factor for osteoporosis. Taken together, given that men are under screened and treated for osteoporosis but have increased mortality post-fracture, considerations to initiate osteoporosis evaluation should be similarly given to men who endured a traumatic fracture.
The study conducted by Crandall et al has several strengths. It is noteworthy for the large size of the WHI cohort with participants from across the United States which enables the capture of a wider range of age groups as women under the age of 65 are not common participants of osteoporosis studies. Additionally, data ascertainment and outcome adjudication utilizing medical records and physician review assure data quality. A limitation of the study is that the study cohort consists exclusively of women and therefore the findings are not generalizable to men. However, findings from this study echo those from other studies that investigate the relationship between fracture mechanisms and subsequent fracture risk in men and women.3,4 Collectively, these comparable findings highlight the need for additional research to validate traumatic fracture as a risk factor for osteoporosis and to incorporate it into clinical guidelines for osteoporosis screening.
Applications for Clinical Practice
The findings from the current study indicate that traumatic and fragility fractures may be more alike than previously recognized in regards to bone health and subsequent fracture prevention in postmenopausal women. If validated, these results may lead to changes in clinical practice whereby all fractures in postmenopausal women could trigger osteoporosis screening, assessment, and treatment if indicated for the secondary prevention of fractures.
1. US Preventive Services Task Force, Curry SJ, Krist Ah, et al. Screening for Osteoporosis to Prevent Fractures: US Preventive Services Task Force Recommendation Statement. JAMA. 2018;319(24):2521–2531. doi:10.1001/jama.2018.7498
2. Crandall CJ, Larson JC, LaCroix AZ, et al. Risk of Subsequent Fractures in Postmenopausal Women After Nontraumatic vs Traumatic Fractures. JAMA Intern Med. Published online June 7, 2021. doi:10.1001/jamainternmed.2021.2617
3. Mackey DC, Lui L, Cawthon PM, et al. High-Trauma Fractures and Low Bone Mineral Density in Older Women and Men. JAMA. 2007;298(20):2381–2388. doi:10.1001/jama.298.20.2381
4. Leslie WD, Schousboe JT, Morin SN, et al. Fracture risk following high-trauma versus low-trauma fracture: a registry-based cohort study. Osteoporos Int. 2020;31(6):1059–1067. doi:10.1007/s00198-019-05274-2
Impact of Diagnostic Testing on Pediatric Patients With Pharyngitis: Evidence From a Large Health Plan
From the Department of Pharmaceutical and Health Economics, University of Southern California, Los Angeles, CA, (Drs. Sangha and McCombs), Department of Pediatrics, Keck School of Medicine, and Department of Clinical Pharmacy, School of Pharmacy, University of Southern California, Los Angeles, CA, (Dr. Steinberg), and Leonard Schaeffer Center for Health Policy and Economics, University of Southern California, Los Angeles, CA (Dr. McCombs).
Objective: The recommended treatment for children and adolescents under 18 years of age who have a positive test for group A Streptococcus (GAS) are antibiotics using the “test and treat” strategy to detect and treat GAS for pediatric pharyngitis. This study used paid claims data to document the extent to which real-world treatment patterns are consistent with these recommendations. We document the factors correlated with testing and treatment, then examine the effects of receiving a GAS test and being treated with an antibiotic impact the likelihood of a revisit for an acute respiratory tract infection within 28 days.
Methods: This retrospective cohort study used Optum Insight Clinformatics data for medical and pharmacy claims from 2011-2013 to identify episodes of care for children and adolescents with pharyngitis around their index visit (± 6 months). The sample population included children and adolescents under 18 years of age with a diagnosis of pharyngitis. Multivariable logistic regression analyses were used to document factors associated with receipt of GAS test and antibiotic treatment. Next, we used logistic regression models to estimate the impact of test and treat recommendation on revisit risk.
Results: There were 24 685 treatment episodes for children and adolescents diagnosed with pharyngitis. Nearly 47% of these episodes included a GAS test and 48% of tested patients were prescribed an antibiotic prescription. Failing to perform a GAS test increased the risk of a revisit within 28 days by 44%. The use of antibiotics by tested and untested patients had no impact on revisit risk.
Conclusion: While the judicious use of antibiotics is important in managing pharyngitis infections and managing complications, the use of rapid diagnostic tools was found to be the determining factor in reducing revisits for pediatric patients with pharyngitis.
Keywords: pediatrics; pharyngitis; respiratory infections; acute infections; diagnostic tests; group A Streptococcus; antibiotics; revisits.
Acute pharyngitis is a common acute respiratory tract infection (ARTI) in children. Group A β-hemolytic streptococci (GABHS) is the most common bacterial etiology for pediatric pharyngitis, accounting for 15% to 30% of cases.1
Beyond clinical assessment, laboratory diagnostic testing generally plays a limited role in guiding appropriate antibiotic prescribing for patients with an ARTI.2,3 Most diagnostic tests require 2 or 3 days to result, incur additional costs, and may delay treatment.4 While these tests do not provide clear and timely guidance on which specific antibiotic is appropriate for ARTI patients, this is not the case for patients with pharyngitis.5,6,7 A rapid diagnostic test exists to identify pharyngitis patients with GABHS which accounts for 1 in 4 children with acute sore throat.1,4,6 Both the American Academy of Pediatrics and the Infectious Diseases Society of America recommend antibiotic treatment for children and adolescents under 18 years of age who have a positive test for group A Streptococcus (GAS).8,9 This “test and treat” protocol has been consistently included in the Healthcare Effectiveness Data and Information Set (HEDIS) standards over time for pediatric pharyngitis patients aged 3 to 18 years before dispensing an antibiotic.10
Sinusitis, pneumonia, and acute otitis media are considered ARTIs where antibiotic treatment is justified. Therefore, pharyngitis of unclear etiology seen with these comorbid infections may not always undergo GAS testing but move directly to the patient being prescribed antibiotics. This analysis enumerates ARTI-related comorbidities present together with the initial coded pharyngitis diagnosis to evaluate their impact on the provider’s decision to test and treat, and on revisit risk.
Antibiotic treatment for GAS patients is likely to eradicate the acute GABHS infection within 10 days. Penicillin and amoxicillin are commonly recommended because of their narrow spectrum of activity, few adverse effects, established efficacy, and modest cost. Alternative antibiotics for patients with penicillin allergy, or with polymicrobial infection seen on culture results, include a first-generation cephalosporin, clindamycin, clarithromycin (Biaxin), or azithromycin (Zithromax).1,8,11 However, while compliance with these HEDIS guidelines has been evaluated, the outcome effects of following the HEDIS “test and treat” recommendations for children with pharyngitis have not been adequately evaluated.
These outcome evaluations have increasing importance as the latest HEDIS survey has shown testing rates in commercial Preferred Provider Organizations (PPO) falling from 86.4% in 2018 to 75.9% in 2019, the lowest rate of testing since 2009, with similar reductions under 80% for Health Maintenance Organizations (HMO).10 While health plans may execute cost-benefit analyses and algorithms to forge best practices for GAS testing in children and adolescents presenting with symptoms of pharyngitis, it is important to regard the wasteful resource utilization and additional cost of revisits that may offset any gains accrued by more focused GAS testing outside the existing clinical guidelines and HEDIS measures. This may be of particular importance in documenting infection and sparing antibiotic therapy in toddlers and younger.
The objective of this study was to investigate the correlation between testing and antibiotic use on the likelihood of a revisit for an acute respiratory tract infection within 28 days. To achieve this objective, this investigation consists of 3 sequential analyses. First, we document the factors associated with the decision to test the patient for a GABHS infection using the GAS test. Next, we document the factors associated with the decision to use an antibiotic to treat the patient as a function of having tested the patient. Finally, we investigate the impact of the testing and treatment decisions on the likelihood of a revisit within 28 days.
Methods
Study design
This was a retrospective cohort study of episodes of treatment for pediatric patients with pharyngitis. Episodes were identified using data derived from the Optum Insight Clinformatics claims database provided to the University of Southern California to facilitate the training of graduate students. These data cover commercially insured patients with both medical and pharmacy benefits. Data were retrieved from the 3-year period spanning 2011-2013. An episode of care was identified based on date of the first (index) outpatient visit for a pharyngitis diagnosis (International Classification of Diseases, Ninth Revision [ICD-9]: 462, 463, 034.0). Outpatient visits were defined by visit setting: ambulatory clinics, physician offices, emergency rooms, and urgent care facilities. Each pharyngitis treatment episode was then screened for at least a 6-month enrollment in a health insurance plan prior and subsequent to the index visit using Optum enrollment data. Finally, eligible treatment episodes were restricted to children and adolescents under 18 years of age, who had an index outpatient visit for a primary diagnosis of acute pharyngitis.
A diagnostic profile was created for each episode using the diagnoses recorded for the index visit. Up to 3 diagnoses may be recorded for any outpatient visit and the first recorded diagnosis was assumed to be the primary diagnosis for that episode. Any secondary diagnoses recorded on the index visit were used to define comorbidities present at the index visit. ARTI-related comorbidities included: acute otitis media (AOM), bronchitis, sinusitis, pneumonia, and upper respiratory infection (URI). Other comorbid medical diagnoses were documented using diagnostic data from the pre-index period. Dichotomous variables for the following categories were created: mental disorders, nervous system disorders, respiratory symptoms, fever, injury and poisoning, other, or no diseases.
Prior visits for other respiratory infections in the previous 90 days were also identified for patients based on their index visit for pharyngitis. Similarly, any subsequent visits, within 28 days of the index visit, were also recorded to measure the health outcome for analysis. Practice settings include physician offices and federally qualified health centers, state and local health clinics, outpatient hospitals facilities, emergency departments, and other outpatient settings such as walk-in retail health clinic or ambulatory centers. Providers include primary care physicians (family practice, pediatricians, internal medicine), specialty care physicians (emergency medicine, preventive medicine), nonphysician providers (nurse practitioners, physician assistants) and other providers (urgent care, acute outpatient care, ambulatory care centers). Seasons of the year were determined based on the index date of the episode to account for possible seasonality in pharyngitis treatment. Lastly, a previous visits variable was created to identify whether the child had nonpharyngitis ARTI visits in the 3 months prior to the index visit.
Demographic variables were created based on enrollment and the socioeconomic data available in the Optum socioeconomic status file. These variables include patient age, race, sex, household income, geographic location, practice setting type, provider specialty, and type of insurance. An estimate of patient household income was based on algorithms using census block groups. Income categories were informed by the federal guidelines for a family of 4. A low-income family was defined as earning less than $50 000; a middle-income family earned between $50 000 and $75 000, and a high-income family earned $75 000 and above.12 Patient insurance type was categorized as HMO, Exclusive Provider Organization (EPO), Point of Service (POS), and PPO. Race was identified as White, Black, Hispanic, and Asian. Patient location was defined according to national census regions.
Outcomes
GAS test
The HEDIS measures for pharyngitis recommend using the GAS test to identify the bacterial etiology of the pharyngitis infection. Patients who received the test were identified based on Current Procedural Terminology (CPT) codes 87070-71, 87081, 87430, 87650-52, and 87880.10
Antibiotic treatment
The pharmacy administrative claims dataset was used to identify study patients who filled a prescription for an antibiotic during their pharyngitis treatment episode. Optum pharmacy data identify the medications received, specifies the date of prescription filling, National Drug Codes, and American Hospital Formulary Service (AHFS) Classification System codes for each medication. We used the AHFS Pharmacologic-Therapeutic classification of antibiotics to create dichotomous variables documenting the antibacterial used by each patient.13 These are categorized under antibacterial including penicillins, cephalosporins (first, second, third, fourth generation cephalosporins), macrolides (first generation and others), tetracyclines, sulfonamides, fluoroquinolones (ciprofloxacin, levofloxacin, moxifloxacin), cephamycin, carbapenems, and β-lactam antibiotics (amoxicillin, amoxicillin/clavulanate, cephalexin, cefuroxime, cefdinir).
Revisits to physician or other provider
Revisits within 28 days were used as the measure of patient outcomes related to testing and filling of an antibiotic prescription for acute pharyngitis. Revisits may also be due to a patient returning for a follow-up, alternative treatment, worsening pharyngitis, or for another ARTI. An ARTI-related revisit also increases total resources used to treat pediatric pharyngitis patients.
Statistical analysis
Logistic regression was used for all 3 analyses conducted in this study. First, we determined the patient and treating physician characteristics that impact the decision to use GAS testing for pharyngitis. Second, we identified those factors that impact the decision to use antibiotic prescriptions among children who were diagnosed with pharyngitis adding in the dichotomous variable indicating if the patient had received a GAS test. Third, we used a logit regression analysis to document if receiving a GAS test and/or an antibiotic impacted the likelihood of a revisit by comparing revisit risk. To estimate the effect of testing and/or antibiotic use, we divided patients into 4 groups based on whether the patient received a GAS test and/or an antibiotic prescription. This specification of the analysis of revisits as an outcome focuses on adherence to HEDIS “test and treat” guidelines10:
- Patients who were not tested yet filled an antibiotic prescription. This decision was likely based on the clinician’s judgment of the patient’s signs and symptoms, and confirmational testing not performed.
- Patients who were not tested and did not fill an antibiotic prescription. Apparently, in the clinician’s judgment the patient’s signs and symptoms were such that the infection did not warrant treatment and the clinical presentation did not necessitate the GAS test to confirm the recorded diagnosis of pharyngitis.
- Patients who were tested and received antibiotic prescription, likely because the test was positive for GABHS.
- Patients who were tested and did not receive antibiotic prescription.
We tested for statistically significant differences in baseline characteristics across these 4 patient groups using t tests for continuous variables and χ2 tests for categorical variables. Odds ratios (OR) and CI were computed for the influential variables included the regression analyses.
We conducted a sensitivity analysis using a model specification which included the dichotomous variables for testing and for treatment, and the interaction term between these variables to assess if treatment effects varied in tested and untested patients. We also estimated this model of revisit risk using revisits within 7 days as the outcome variable.
All analyses were completed using STATA/IC 13 (StataCorp, College Station, TX).
Results
There were 24 685 treatment episodes for children diagnosed with pharyngitis. Nearly 47% of these episodes included GAS testing and 47% of the tested patients filled an antibiotic prescription. Similarly, 53% of patients were not tested and 49% of untested patients filled an antibiotic prescription. As a result, the 4 groups identified for analysis were evenly distributed: untested and no prescription (26.9%), untested and prescription (26.3%), tested and prescription (21.9%), and tested and no prescription (24.9%) (Figure).
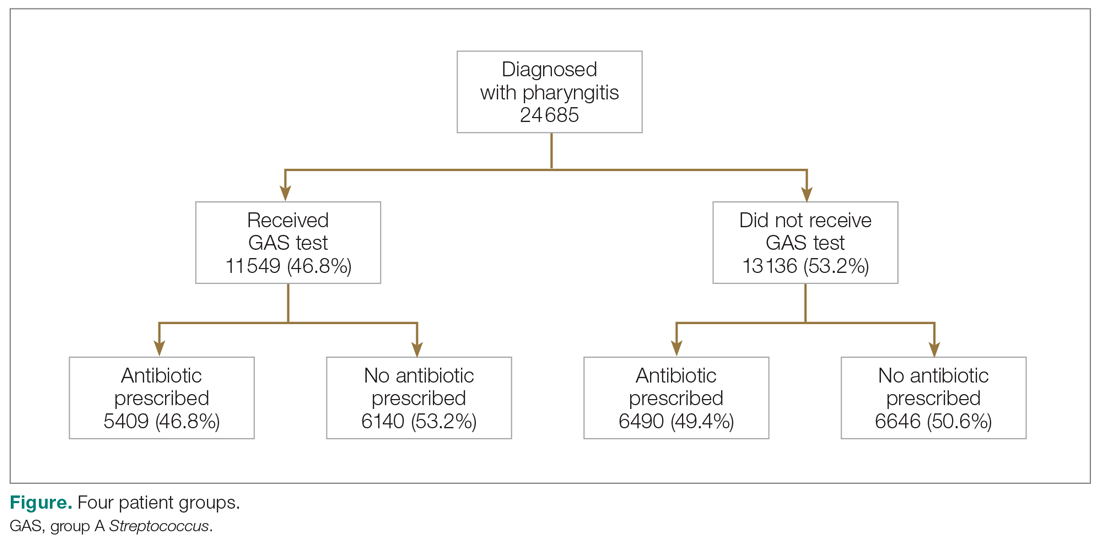
Table 1 presents the descriptive statistics for these 4 patient groups. Note first that the rate of revisits within 28 days is under 5% across all groups. Second, the 2 tested groups have a lower revisit rate than the untested groups: the tested and treated have a revisit rate of 3.3%, and the tested and untreated have a revisit rate of 2.4%, while both the untested groups have a revisit rate of nearly 5%. These small absolute differences in revisit rates across groups were statistically significant.
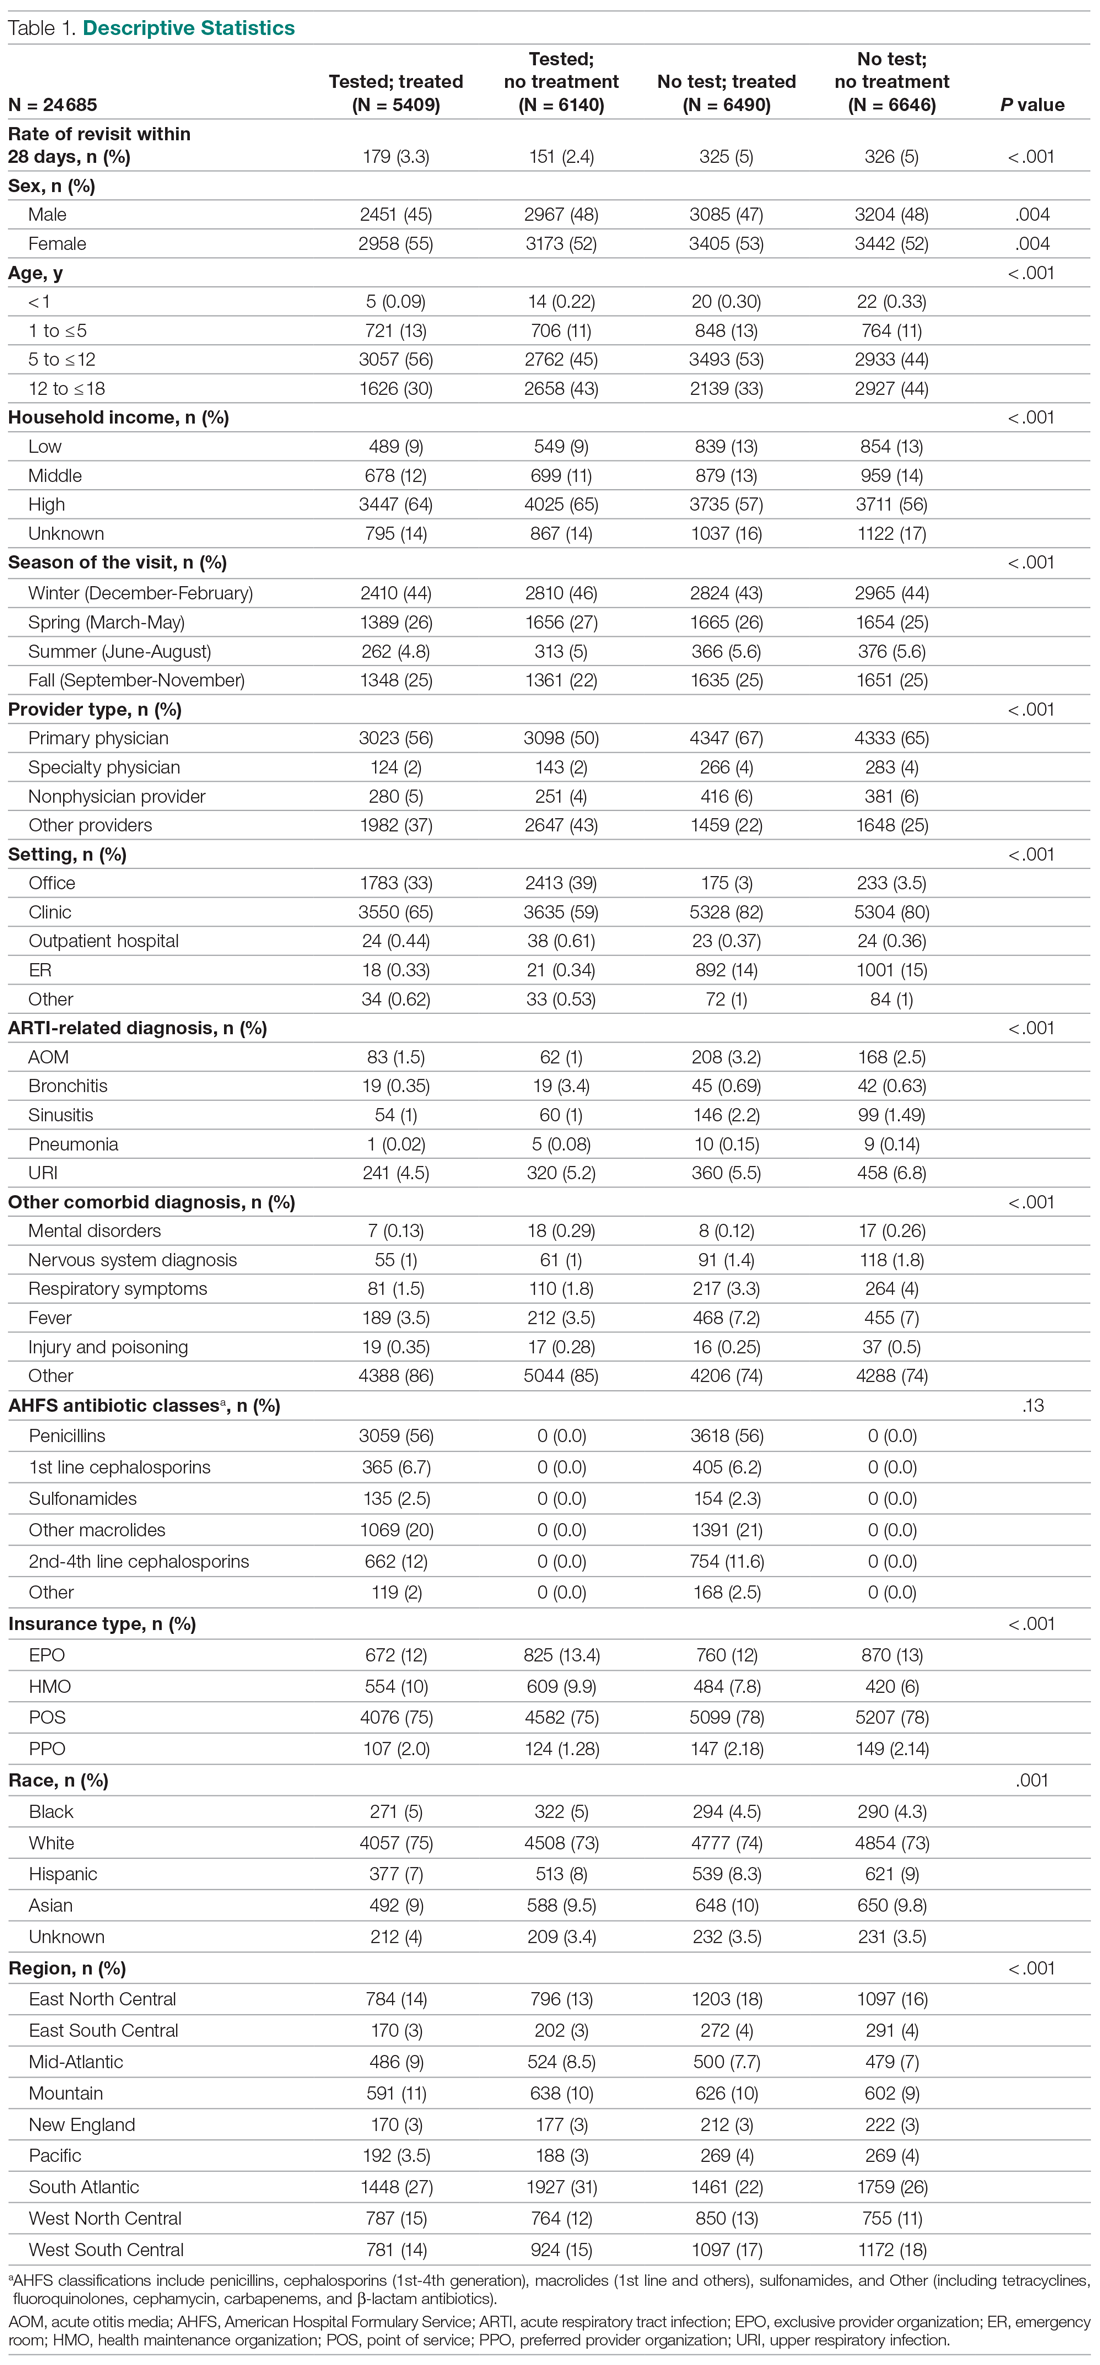
Factors associated with receiving GAS test
Several factors were found to impact the decision to test (Table 2). Only 9.7% of children were reported to have any ARTI coinfection. As expected, these comorbidities resulted in a significantly lower likelihood of receiving the GAS test: AOM, bronchitis, sinusitis, pneumonia, and URI as comorbid infections had a 48%, 41%, 37%, 63%, and 13% lower likelihood of receiving the GAS test, respectively, than those with no comorbidities. Similarly, children with fever and respiratory symptoms were 35% and 45% less likely to receiving the GAS test, respectively. This is consistent with our expectation that comorbid ARTI infections will lead many providers to forgo testing.
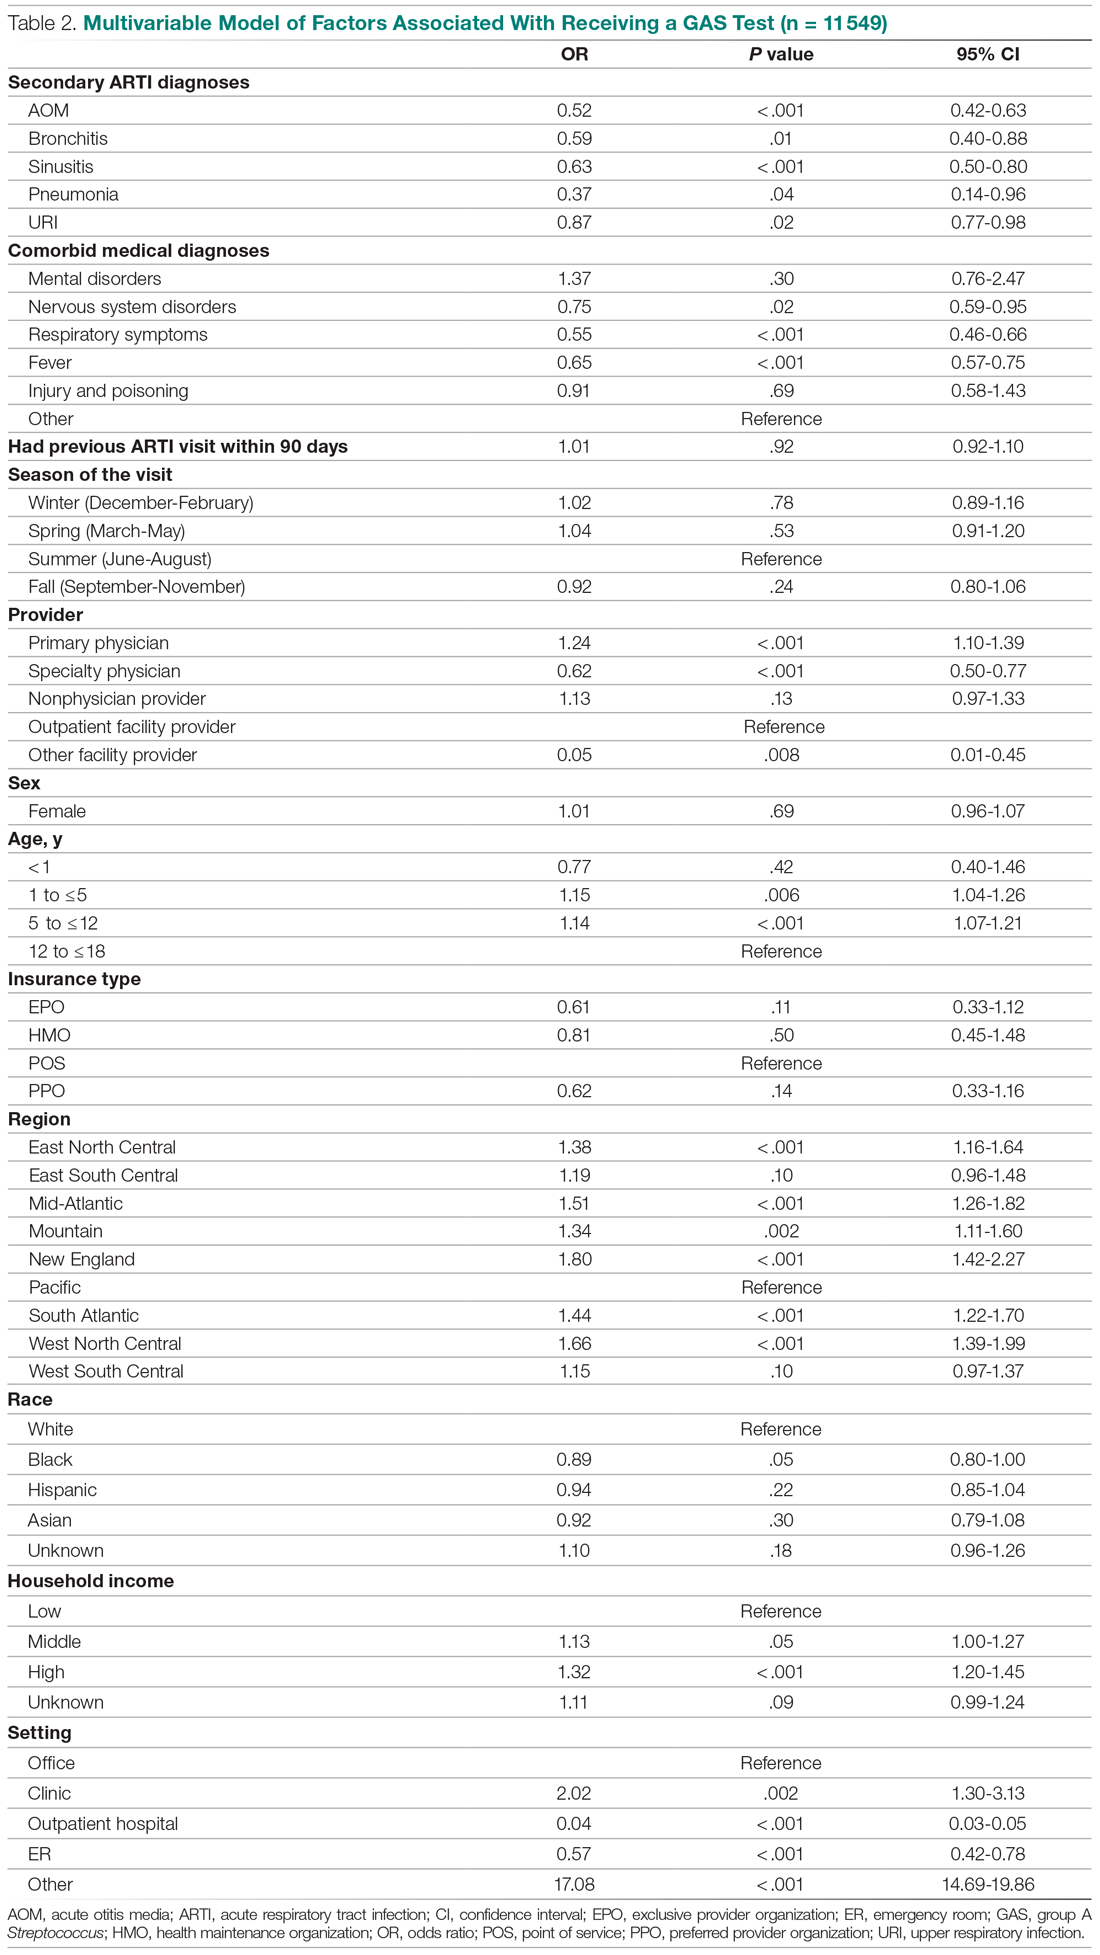
Provider type and patient age also plays a role in receipt of the GAS test. Relative to outpatient facility providers, primary care physicians were 24% more likely and specialty physicians were 38% less likely of employing the GAS test. The child’s age played a significant role in receipt of the GAS test. Children aged 1 to 5 years and 5 to 12 years were 15% and 14% more likely to receive the test compared to children older than 12 years.
Pharyngitis patients have disproportionately higher odds of receiving a GAS test in most regions of the country compared to the Pacific region. For instance, children in the Mid-Atlantic region have 51% higher odds of receiving a GAS test while children in New England have 80% higher odds of receiving the same test.
Black children have 11% lower odds of receiving the GAS test compared to White children. Both middle-income and high-income children have 12% and 32% higher odds of receiving the test compared to low-income children. Compared to office-based visits, children visiting a clinic were twice as likely to receive a GAS test while those seen in the emergency room have 43% lower odds of receiving a GAS test. Hospital outpatient departments, which account for less than 1% of all visits, rarely used a GAS test which could be a statistical artifact due to small sample size. Lastly, insurance and season of the year had no significant impact of receipt of a GAS test.
Factors associated with receiving antibiotic prescription
Surprisingly, receiving the GAS test has a small but insignificant impact on the likelihood that the patient will receive an antibiotic prescription (Table 3) (Adjusted OR = 1.055, P = .07). After controlling for receipt of a GAS test, children with AOM and sinusitis comorbidities have an increased likelihood of being prescribed an antibiotic. Children with URI have a lower likelihood of being prescribed an antibiotic. Additionally, relative to primary care physicians, children visiting nonphysician providers for pharyngitis were more likely to be prescribed an antibiotic.
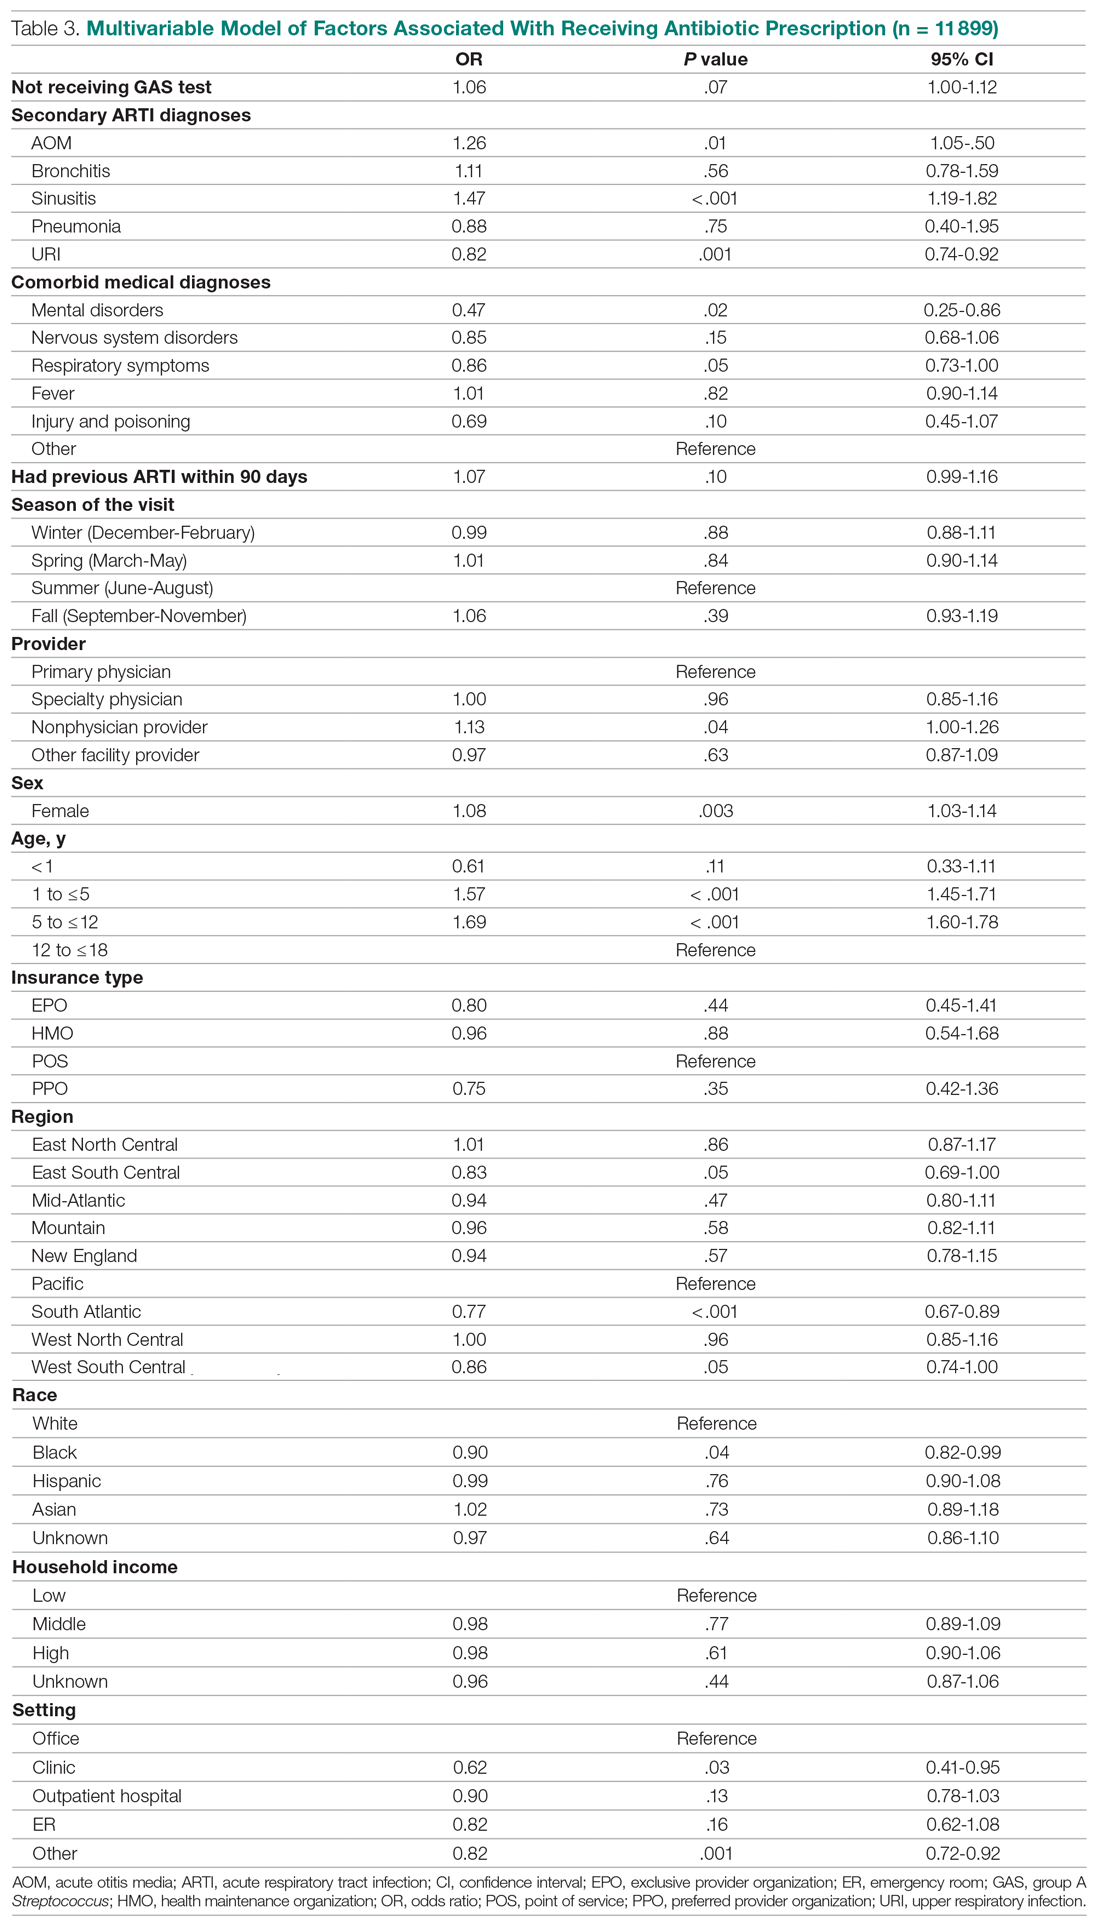
Children under 12 years of age were more likely to use an antibiotic compared to children 12 years and older. Geographically, there is some evidence of regional variation in antibiotic use as well. Children in the south Atlantic, west-south central, and southeast central regions had a significantly lower odds of being prescribed an antibiotic respectively than pharyngitis patients in the Pacific region. Black children had a 10% lower likelihood of being prescribed an antibiotic compared to White children, possibly related to their lower rate of GAS testing. Compared to office-based visits, children visiting a clinic were less likely to use an antibiotic. Household income, insurance type, and season had no significant impact on revisit risk.
Effects of GAS test and antibiotic prescriptions on likelihood of revisits
The multivariate analysis of the risk of a revisit within 28 days is presented in Table 4. Children with pharyngitis who tested and did not receive an antibiotic serve as the reference comparison group for this analysis to illustrate the impact of using the GAS test and treatment with an antibiotic. The results in Table 4 are quite clear: patients who receive the GAS test were significantly less likely to have a revisit within 28 days. Moreover, within the group of patients who were tested, those not receiving an antibiotic, presumedly because their GAS test was negative, experienced the lowest risk of a revisit. This result is consistent with the data in Table 1. Moreover, using an antibiotic had no impact on the likelihood of a revisit in patients not receiving the GAS test. This result is also consistent with Table 1.
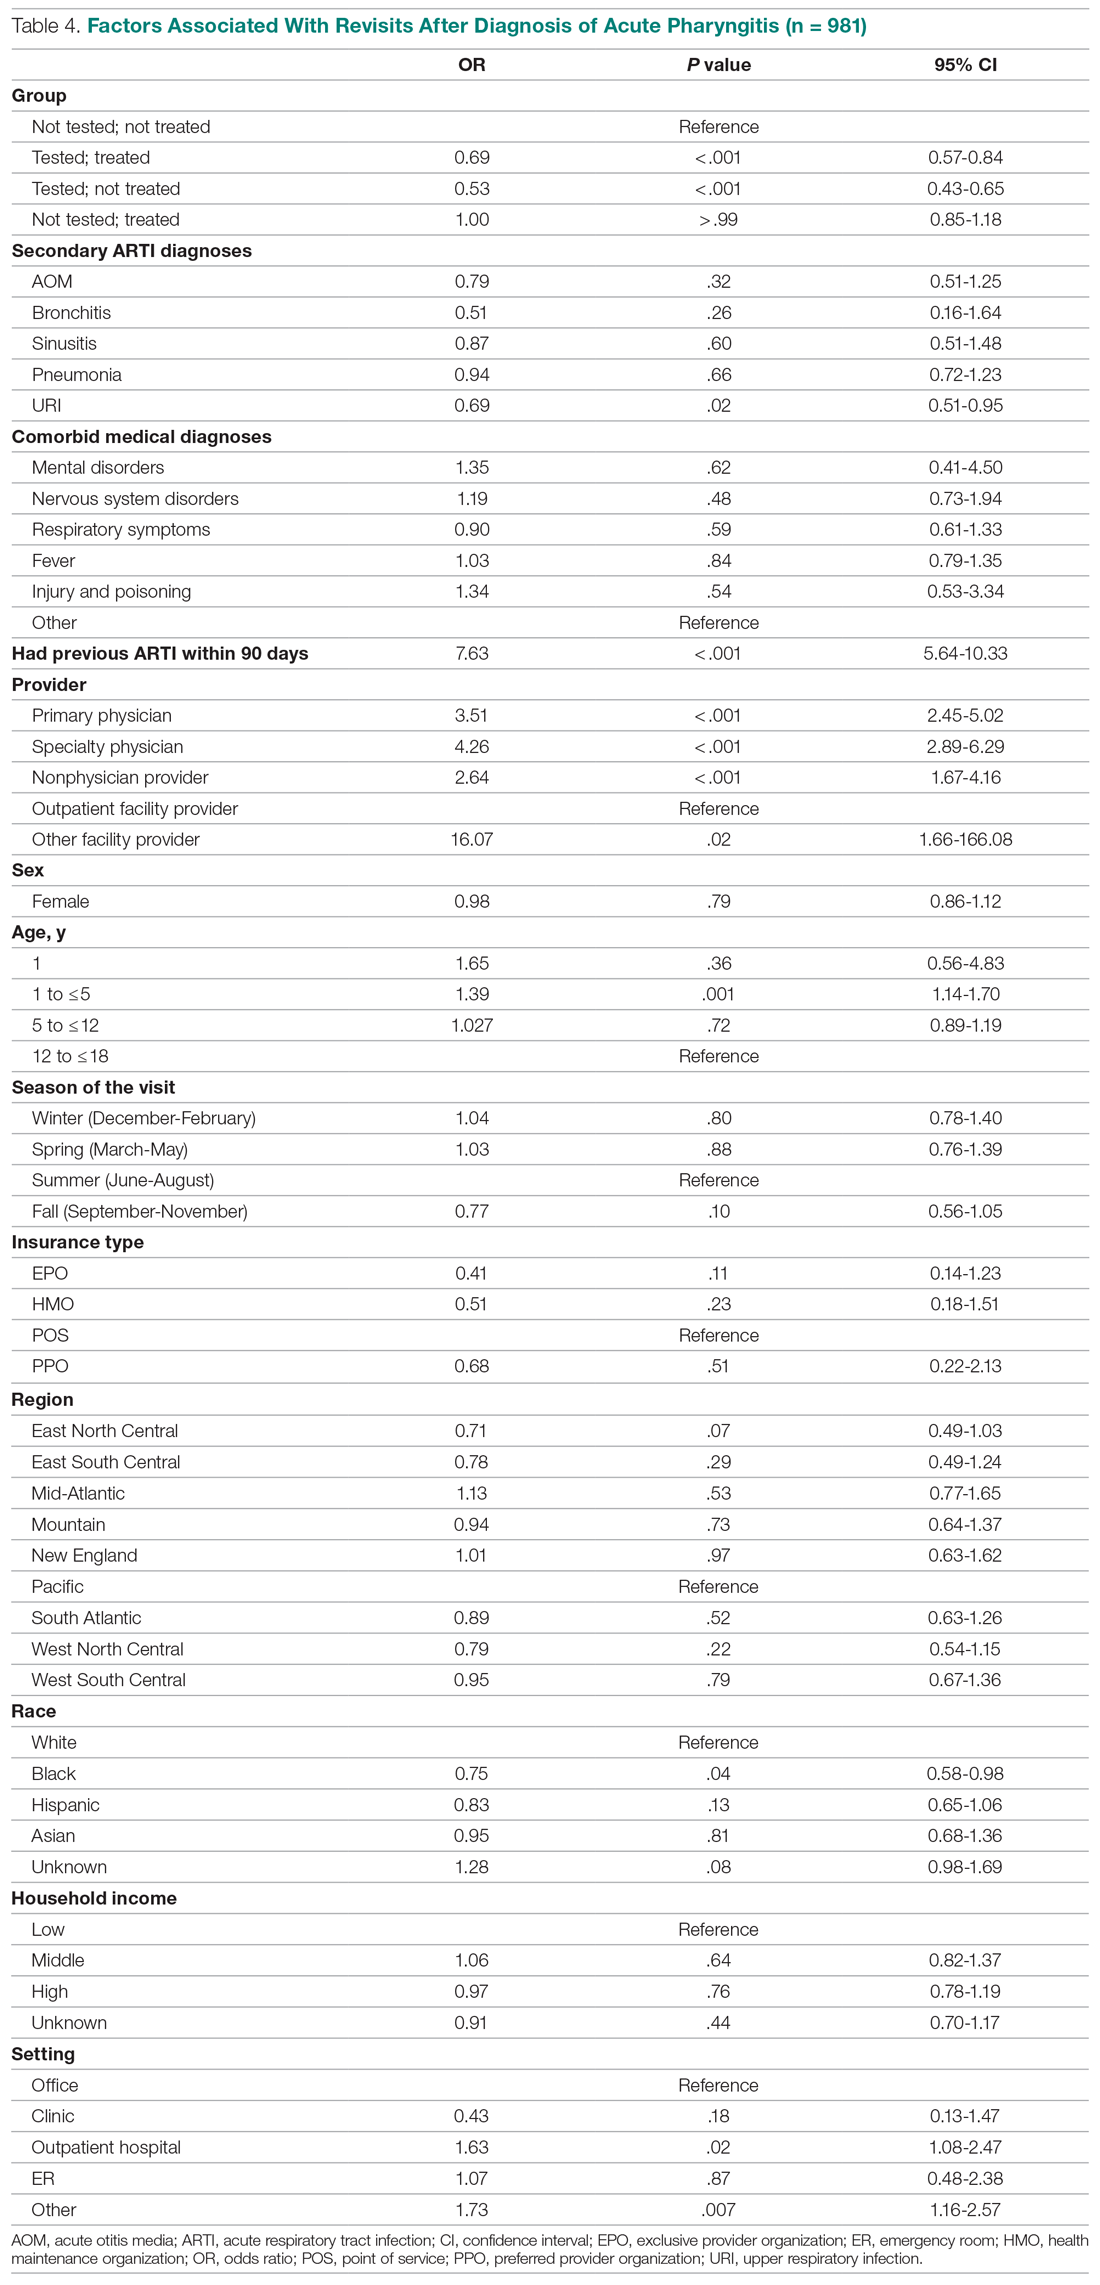
Other results from the analysis of revisit risk may be of interest to clinicians. Pharyngitis patients with a prior episode of treatment within 90 days for an acute respiratory tract infection were more than 7 times more likely to experience a revisit within 28 days of the pharyngitis diagnosis than patients without a history of recent ARTI infections. Age is also a risk factor in likelihood of initiating a revisit. Children under 1 year and children aged 1 to 5 years were more likely to have a revisit than children aged more than 12 years. Compared to White children, Black children were 25% (P = .04) less likely to have a revisit. The care setting also has a significant impact on revisit risk. Children visiting outpatient hospital and other care settings had a significantly higher revisit risk than those visiting a physician’s office. Lastly, household income, geographic region, season, medical comorbidities, gender, and insurance type have no significant impact on revisit risk.
Sensitivity analysis
The results from the analysis of 7-day and 28-day revisit risk are summarized in Table 5. These results indicate that patients who were tested had a more significant decrease in revisit risk at 7 days (72%) than was evident at 28 days (47% reduction). Receiving an antibiotic, with or without the test, had no impact on revisit risk.
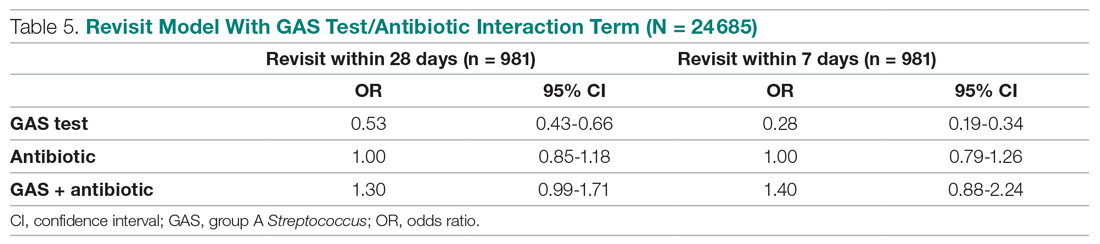
Discussion
Published data on revisits for pharyngitis are lacking with the concentration of prior research focused more on systemic complications of undertreated GABHS disease or on identifying carrier status. Our study results suggest that GAS testing is the most important factor in reducing revisit risk. Being prescribed an antibiotic, on its own, does not have a significant impact on the risk of a revisit. However, once the GAS test is used, the decision not to use an antibiotic was correlated with the lowest revisit rate, likely because the source of the pharyngitis infection was viral and more likely to resolve without a revisit. Prior studies have reported variable rates of testing among children with pharyngitis prescribed an antibiotic, ranging from 23% to 91%,14,15 with testing important toward more appropriate antibiotic use.16 More recently, among more than 67 000 patients aged 3 to 21 years presenting with sore throat and receiving a GAS test, 32.6% were positive.17
Our analysis found that more than 46% of pediatric pharyngitis patients were given the rapid GAS test. While this testing rate is substantially lower than HEDIS recommendations and lower than testing rates achieved by several health maintenance organizations,10 it is similar to the 53% of children receiving such testing in a recent National Ambulatory Medical Care Survey.18 Furthermore, we found that when antibiotics are prescribed following a GAS test, the revisit risk is not significantly reduced, possibly because antibiotics lower revisit risk when informed by diagnostic testing tools that determine the infectious organism. This is supported by a similar population analysis in which we observed reduced revisit rates in children with AOM managed with antibiotics within 3 days of index diagnosis.19
Several other factors also affect the likelihood of a child receiving the GAS test. Children aged 1 to 12 years were significantly more likely to receive the GAS test than children over the age of 12. This included children in the 1 to 5 years old bracket who had a 15% higher likelihood of undergoing a GAS test, despite children less than 3 years of age as not recommended targets for GAS testing.20 As expected, children with reported ARTI-associated comorbidities were also less likely to receive a GAS test. Additionally, specialty care physicians were less inclined to implement the GAS test, possibly because of diagnostic confidence without testing or referral after GAS was ruled out. Black and low-income children had statistically lower odds of receiving the test, even after controlling for other factors, and yet were less likely to consume a revisit. As the overall data suggested more revisits in those not tested, further study is needed to examine if race or income discrepancies are equity based. Finally, children in the Pacific region, compared to the rest of the nation, were the least likely to receive a GAS test and yet there were no significant differences in revisit rates by region. Regional differences in antibiotic use were also observed in our study, as has been seen by others.21
After statistically controlling for having received the diagnostic GAS test and filled a prescription for an antibiotic, there are multitude of factors that independently affect the revisit risk, the most important of which if which was a history of an ARTI infection in the prior 90 days. While prior visit history had no impact on the likelihood of being tested or filling an antibiotic, patients with prior visits were more than 7 times more likely to consume a revisit. This was not reflected in nor related to comorbid ARTIs as these patients did not have statistically higher revisits than those with pharyngitis as the sole-coded diagnosis. Moreover, speculation for bacterial etiology of primary or superinfection based on a recent history of ARTI accounting for revisits seems unlikely as it did not yield greater antibiotic use in that group. Further analysis is required to determine the clinical and behavioral factors that promote for prior ARTI history as a major factor in revisit risk after an index visit for pharyngitis.
Children aged between 1 and 5 years, though 15% more likely to be tested than those aged 12 through 17 years, were also 39% more likely to initiate a revisit compared to older children when statistically controlling for other covariates. This perhaps suggests longer illness, wrong diagnosis, delay in appropriate treatment, or more caution by parents and providers in this age group. Justification for testing children less than 3 years of age who are outside of the HEDIS suggested age group, when clinical judgement does not point to another infection source, can result in positivity rates between 22% and 30% as previously observed.22,23 Patients visiting nonphysician providers and outpatient facility providers were less likely to have a revisit than those visiting primary and specialty care physicians, though slightly higher propensity for antibiotic prescriptions was seen for nonphysician providers. Pediatricians have been noted to be less likely to prescribe antibiotics without GAS testing than nonpediatric providers, and more guidelines-compliant in prescribing.24
Recommendations to not test children under 3 years of age are based on the lack of acute rheumatic fever and other complications in this age group together with more frequent viral syndromes. Selectivity in applying clinical criteria to testing can be attempted to separate bacterial from viral illness. Postnasal drainage/rhinorrhea, hoarse voice, and cough have been used successfully to identify those with viral illness and less need for testing, with greater certainty of low risk for GABHS in those over 11 years of age without tonsillar exudates, cervical adenopathy, or fever.17 However, the marginal benefits of those who have all 3 features of viral illness versus none in identifying GAS positivity was 23.3% vs 37.6% - helpful, but certainly not diminishing the need for testing. These constitutional findings of viral URI also do not exclude the GAS carrier state that features these symptoms.25 Others have reinforced the doubt of pharyngeal exudates as the premier diagnostic finding for test-positive GAS.26
This study had several limitations. The Optum claims dataset only contains ICD-9 codes for diagnoses. It does not include data on infection severity and clinical findings related to symptoms, thus empiric treatment warranted based in clinical severity is not assessed. Antibiotics are commonly available as generics and very inexpensive. Patients may fill and pay for these prescriptions directly, in which case, a claim for payment may not be filed with Optum. This could result in an undercount of treated patients in our study.
There is no corresponding problem of missing medical claims for GAS testing which were obtained from the CPT codes within the Optum claims data set. However, we elected not to verify the test results due to these data being missing for 75% of the study population. Nevertheless, this study’s focus was less about justifying antibiotic treatment, but dealt with the outcomes generated by testing and treatment. Toward that end, we used CPT codes to identify a revisit, and while those can at times be affected by financial reimbursement incentives, differences related to revisits in the 4 patient groups should not be subject to bias.
Conclusion
This study used data from real world practices to document the patterns of GAS testing and antibiotic use in pediatric pharyngitis patients. Revisit rates were under 5% for all patient groups and the use of rapid diagnostic tools were found to be the determining factor in further reducing the risk of revisits. This supports the need for compliance with the HEDIS quality metric for pharyngitis to the recommended levels of rapid testing which have been falling in recent years. Use of more accurate antigen and newer molecular detection testing methods may help further delineate important factors in determining pediatric pharyngitis treatment and need for revisits.27
Corresponding author: Jeffrey McCombs, MD, University of Southern California School of Pharmacy, Department of Pharmaceutical and Health Economics, Leonard D. Schaeffer Center for Health Policy & Economics, 635 Downey Way, Verna & Peter Dauterive Hall 310, Los Angeles, CA 90089-3333; jmccombs@usc.edu.
Financial disclosures: None.
1. Choby BA. Diagnosis and treatment of streptococcal pharyngitis. Am Fam Physician. 2009;79(5):383-390.
2. Briel M, Schuetz P, Mueller B, et al. Procalcitonin-guided antibiotic use vs a standard approach for acute respiratory tract infections in primary care. Arch of Intern Med. 2008;168(18):2000-2008. doi: 10.1001/archinte.168.18.2000
3. Maltezou HC, Tsagris V, Antoniadou A, et al. Evaluation of a rapid antigen detection test in the diagnosis of streptococcal pharyngitis in children and its impact on antibiotic prescription. J Antimicrob Chemother. 2008;62(6):1407-1412. doi: 10.1093/jac/dkn376
4. Neuner JM, Hamel MB, Phillips RS, et al. Diagnosis and management of adults with pharyngitis: a cost-effectiveness analysis. Ann Intern Med. 2003;139(2):113-122. doi:10.7326/0003-4819-139-2-200307150-00011
5. Gerber MA, Baltimore RS, Eaton CB, et al. Prevention of rheumatic fever and diagnosis and treatment of acute Streptococcal pharyngitis: a scientific statement from the American Heart Association Rheumatic Fever, Endocarditis, and Kawasaki Disease Committee of the Council on Cardiovascular Disease in the Young, the Interdisciplinary Council on Functional Genomics and Translational Biology, and the Interdisciplinary Council on Quality of Care and Outcomes Research: endorsed by the American Academy of Pediatrics. Circulation. 2009;119(11):1541-1551. doi: 10.1161/CIRCULATIONAHA.109.191959
6. Gieseker KE, Roe MH, MacKenzie T, Todd JK. Evaluating the American Academy of Pediatrics diagnostic standard for Streptococcus pyogenes pharyngitis: backup culture versus repeat rapid antigen testing. Pediatrics. 2003;111(6):e666-e670. doi: 10.1542/peds.111.6.e666
7. Shapiro DJ, Lindgren CE, Neuman MI, Fine AM. Viral features and testing for Streptococcal pharyngitis. Pediatrics. 2017;139(5):e20163403. doi: 10.1542/peds.2016-3403
8. Shulman ST, Bisno AL, Clegg H, et al. Clinical practice guideline for the diagnosis and management of group A Streptococcal pharyngitis: 2012 update by the Infectious Diseases Society of America. Clin Infect Dis. 2012;55(10):e86–e102. doi: 10.1093/cid/cis629
9. Mangione-Smith R, McGlynn EA, Elliott MN, et al. Parent expectations for antibiotics, physician-parent communication, and satisfaction. Arch Pediatr Adolesc Med. 2001;155(7):800–806. doi: 10.1001/archpedi.155.7.800
10. Appropriate Testing for Children with Pharyngitis. HEDIS Measures and Technical Resources. National Committee for Quality Assurance. Accessed February 12, 2021. https://www.ncqa.org/hedis/measures/appropriate-testing-for-children-with-pharyngitis/
11. Linder JA, Bates DW, Lee GM, Finkelstein JA. Antibiotic treatment of children with sore throat. JAMA. 2005;294(18):2315-2322. doi: 10.1001/jama.294.18.2315
12. Crimmel BL. Health Insurance Coverage and Income Levels for the US Noninstitutionalized Population Under Age 65, 2001. Medical Expenditure Panel Survey, Agency for Healthcare Research and Quality. 2004. https://meps.ahrq.gov/data_files/publications/st40/stat40.pd
13. AHFS/ASHP. American Hospital Formulary Service Drug Information. 2012. AHFS drug information. 00--. Accessed January 4, 2021.
14. Mainous AG 3rd, Zoorob, RJ, Kohrs FP, Hagen MD. Streptococcal diagnostic testing and antibiotics prescribed for pediatric tonsillopharyngitis. Pediatr Infect Dis J. 1996;15(9):806-810. doi: 10.1097/00006454-199609000-00014
15. Benin AL, Vitkauskas G, Thornquist E, et al. Improving diagnostic testing and reducing overuse of antibiotics for children with pharyngitis: a useful role for the electronic medical record. Pediatr Infect Dis J. 2003;22(12):1043-1047. doi: 10.1097/01.inf.0000100577.76542.af
16. Luo R, Sickler J, Vahidnia F, et al. Diagnosis and Management of Group a Streptococcal Pharyngitis in the United States, 2011-2015. BMC Infect Dis. 2019;19(1):193-201. doi: 10.1186/s12879-019-3835-4
17. Shapiro DJ, Barak-Corren Y, Neuman MI, et al. Identifying Patients at Lowest Risk for Streptococcal Pharyngitis: A National Validation Study. J Pediatr. 2020;220:132-138.e2. doi: 10.1016/j.jpeds.2020.01.030. Epub 2020 Feb 14
18. Shapiro DJ, King LM, Fleming-Dutra KE, et al. Association between use of diagnostic tests and antibiotic prescribing for pharyngitis in the United States. Infect Control Hosp Epidemiol. 2020;41(4):479-481. doi: 10.1017/ice.2020.29
19. Sangha K, Steinberg I, McCombs JS. The impact of antibiotic treatment time and class of antibiotic for acute otitis media infections on the risk of revisits. Abs PDG4. Value in Health. 2019; 22:S163.
20. Ahluwalia T, Jain S, Norton L, Meade J, et al. Reducing Streptococcal Testing in Patients < 3 Years Old in an Emergency Department. Pediatrics. 2019;144(4):e20190174. doi: 10.1542/peds.2019-0174
21. McKay R, Mah A, Law MR, et al. Systematic Review of Factors Associated with Antibiotic Prescribing for Respiratory Tract Infections. Antimicrob Agents Chemother. 2016;60(7):4106-4118. doi: 10.1128/AAC.00209-16
22. Woods WA, Carter CT, Schlager TA. Detection of group A streptococci in children under 3 years of age with pharyngitis. Pediatr Emerg Care. 1999;15(5):338-340. doi: 10.1097/00006565-199910000-00011
23. Mendes N, Miguéis C, Lindo J, et al. Retrospective study of group A Streptococcus oropharyngeal infection diagnosis using a rapid antigenic detection test in a paediatric population from the central region of Portugal. Eur J Clin Microbiol Infect Dis. 2021;40(6):1235-1243. doi: 10.1007/s10096-021-04157-x
24. Frost HM, McLean HQ, Chow BDW. Variability in Antibiotic Prescribing for Upper Respiratory Illnesses by Provider Specialty. J Pediatr. 2018;203:76-85.e8. doi: 10.1016/j.jpeds.2018.07.044.
25. Rick AM, Zaheer HA, Martin JM. Clinical Features of Group A Streptococcus in Children With Pharyngitis: Carriers versus Acute Infection. Pediatr Infect Dis J. 2020;39(6):483-488. doi: 10.1097/INF.0000000000002602
26. Nadeau NL, Fine AM, Kimia A. Improving the prediction of streptococcal pharyngitis; time to move past exudate alone [published online ahead of print, 2020 Aug 16]. Am J Emerg Med. 2020;S0735-6757(20)30709-9. doi: 10.1016/j.ajem.2020.08.023
27. Mustafa Z, Ghaffari M. Diagnostic Methods, Clinical Guidelines, and Antibiotic Treatment for Group A Streptococcal Pharyngitis: A Narrative Review. Front Cell Infect Microbiol. 2020;10:563627. doi: 10.3389/fcimb.2020.563627
From the Department of Pharmaceutical and Health Economics, University of Southern California, Los Angeles, CA, (Drs. Sangha and McCombs), Department of Pediatrics, Keck School of Medicine, and Department of Clinical Pharmacy, School of Pharmacy, University of Southern California, Los Angeles, CA, (Dr. Steinberg), and Leonard Schaeffer Center for Health Policy and Economics, University of Southern California, Los Angeles, CA (Dr. McCombs).
Objective: The recommended treatment for children and adolescents under 18 years of age who have a positive test for group A Streptococcus (GAS) are antibiotics using the “test and treat” strategy to detect and treat GAS for pediatric pharyngitis. This study used paid claims data to document the extent to which real-world treatment patterns are consistent with these recommendations. We document the factors correlated with testing and treatment, then examine the effects of receiving a GAS test and being treated with an antibiotic impact the likelihood of a revisit for an acute respiratory tract infection within 28 days.
Methods: This retrospective cohort study used Optum Insight Clinformatics data for medical and pharmacy claims from 2011-2013 to identify episodes of care for children and adolescents with pharyngitis around their index visit (± 6 months). The sample population included children and adolescents under 18 years of age with a diagnosis of pharyngitis. Multivariable logistic regression analyses were used to document factors associated with receipt of GAS test and antibiotic treatment. Next, we used logistic regression models to estimate the impact of test and treat recommendation on revisit risk.
Results: There were 24 685 treatment episodes for children and adolescents diagnosed with pharyngitis. Nearly 47% of these episodes included a GAS test and 48% of tested patients were prescribed an antibiotic prescription. Failing to perform a GAS test increased the risk of a revisit within 28 days by 44%. The use of antibiotics by tested and untested patients had no impact on revisit risk.
Conclusion: While the judicious use of antibiotics is important in managing pharyngitis infections and managing complications, the use of rapid diagnostic tools was found to be the determining factor in reducing revisits for pediatric patients with pharyngitis.
Keywords: pediatrics; pharyngitis; respiratory infections; acute infections; diagnostic tests; group A Streptococcus; antibiotics; revisits.
Acute pharyngitis is a common acute respiratory tract infection (ARTI) in children. Group A β-hemolytic streptococci (GABHS) is the most common bacterial etiology for pediatric pharyngitis, accounting for 15% to 30% of cases.1
Beyond clinical assessment, laboratory diagnostic testing generally plays a limited role in guiding appropriate antibiotic prescribing for patients with an ARTI.2,3 Most diagnostic tests require 2 or 3 days to result, incur additional costs, and may delay treatment.4 While these tests do not provide clear and timely guidance on which specific antibiotic is appropriate for ARTI patients, this is not the case for patients with pharyngitis.5,6,7 A rapid diagnostic test exists to identify pharyngitis patients with GABHS which accounts for 1 in 4 children with acute sore throat.1,4,6 Both the American Academy of Pediatrics and the Infectious Diseases Society of America recommend antibiotic treatment for children and adolescents under 18 years of age who have a positive test for group A Streptococcus (GAS).8,9 This “test and treat” protocol has been consistently included in the Healthcare Effectiveness Data and Information Set (HEDIS) standards over time for pediatric pharyngitis patients aged 3 to 18 years before dispensing an antibiotic.10
Sinusitis, pneumonia, and acute otitis media are considered ARTIs where antibiotic treatment is justified. Therefore, pharyngitis of unclear etiology seen with these comorbid infections may not always undergo GAS testing but move directly to the patient being prescribed antibiotics. This analysis enumerates ARTI-related comorbidities present together with the initial coded pharyngitis diagnosis to evaluate their impact on the provider’s decision to test and treat, and on revisit risk.
Antibiotic treatment for GAS patients is likely to eradicate the acute GABHS infection within 10 days. Penicillin and amoxicillin are commonly recommended because of their narrow spectrum of activity, few adverse effects, established efficacy, and modest cost. Alternative antibiotics for patients with penicillin allergy, or with polymicrobial infection seen on culture results, include a first-generation cephalosporin, clindamycin, clarithromycin (Biaxin), or azithromycin (Zithromax).1,8,11 However, while compliance with these HEDIS guidelines has been evaluated, the outcome effects of following the HEDIS “test and treat” recommendations for children with pharyngitis have not been adequately evaluated.
These outcome evaluations have increasing importance as the latest HEDIS survey has shown testing rates in commercial Preferred Provider Organizations (PPO) falling from 86.4% in 2018 to 75.9% in 2019, the lowest rate of testing since 2009, with similar reductions under 80% for Health Maintenance Organizations (HMO).10 While health plans may execute cost-benefit analyses and algorithms to forge best practices for GAS testing in children and adolescents presenting with symptoms of pharyngitis, it is important to regard the wasteful resource utilization and additional cost of revisits that may offset any gains accrued by more focused GAS testing outside the existing clinical guidelines and HEDIS measures. This may be of particular importance in documenting infection and sparing antibiotic therapy in toddlers and younger.
The objective of this study was to investigate the correlation between testing and antibiotic use on the likelihood of a revisit for an acute respiratory tract infection within 28 days. To achieve this objective, this investigation consists of 3 sequential analyses. First, we document the factors associated with the decision to test the patient for a GABHS infection using the GAS test. Next, we document the factors associated with the decision to use an antibiotic to treat the patient as a function of having tested the patient. Finally, we investigate the impact of the testing and treatment decisions on the likelihood of a revisit within 28 days.
Methods
Study design
This was a retrospective cohort study of episodes of treatment for pediatric patients with pharyngitis. Episodes were identified using data derived from the Optum Insight Clinformatics claims database provided to the University of Southern California to facilitate the training of graduate students. These data cover commercially insured patients with both medical and pharmacy benefits. Data were retrieved from the 3-year period spanning 2011-2013. An episode of care was identified based on date of the first (index) outpatient visit for a pharyngitis diagnosis (International Classification of Diseases, Ninth Revision [ICD-9]: 462, 463, 034.0). Outpatient visits were defined by visit setting: ambulatory clinics, physician offices, emergency rooms, and urgent care facilities. Each pharyngitis treatment episode was then screened for at least a 6-month enrollment in a health insurance plan prior and subsequent to the index visit using Optum enrollment data. Finally, eligible treatment episodes were restricted to children and adolescents under 18 years of age, who had an index outpatient visit for a primary diagnosis of acute pharyngitis.
A diagnostic profile was created for each episode using the diagnoses recorded for the index visit. Up to 3 diagnoses may be recorded for any outpatient visit and the first recorded diagnosis was assumed to be the primary diagnosis for that episode. Any secondary diagnoses recorded on the index visit were used to define comorbidities present at the index visit. ARTI-related comorbidities included: acute otitis media (AOM), bronchitis, sinusitis, pneumonia, and upper respiratory infection (URI). Other comorbid medical diagnoses were documented using diagnostic data from the pre-index period. Dichotomous variables for the following categories were created: mental disorders, nervous system disorders, respiratory symptoms, fever, injury and poisoning, other, or no diseases.
Prior visits for other respiratory infections in the previous 90 days were also identified for patients based on their index visit for pharyngitis. Similarly, any subsequent visits, within 28 days of the index visit, were also recorded to measure the health outcome for analysis. Practice settings include physician offices and federally qualified health centers, state and local health clinics, outpatient hospitals facilities, emergency departments, and other outpatient settings such as walk-in retail health clinic or ambulatory centers. Providers include primary care physicians (family practice, pediatricians, internal medicine), specialty care physicians (emergency medicine, preventive medicine), nonphysician providers (nurse practitioners, physician assistants) and other providers (urgent care, acute outpatient care, ambulatory care centers). Seasons of the year were determined based on the index date of the episode to account for possible seasonality in pharyngitis treatment. Lastly, a previous visits variable was created to identify whether the child had nonpharyngitis ARTI visits in the 3 months prior to the index visit.
Demographic variables were created based on enrollment and the socioeconomic data available in the Optum socioeconomic status file. These variables include patient age, race, sex, household income, geographic location, practice setting type, provider specialty, and type of insurance. An estimate of patient household income was based on algorithms using census block groups. Income categories were informed by the federal guidelines for a family of 4. A low-income family was defined as earning less than $50 000; a middle-income family earned between $50 000 and $75 000, and a high-income family earned $75 000 and above.12 Patient insurance type was categorized as HMO, Exclusive Provider Organization (EPO), Point of Service (POS), and PPO. Race was identified as White, Black, Hispanic, and Asian. Patient location was defined according to national census regions.
Outcomes
GAS test
The HEDIS measures for pharyngitis recommend using the GAS test to identify the bacterial etiology of the pharyngitis infection. Patients who received the test were identified based on Current Procedural Terminology (CPT) codes 87070-71, 87081, 87430, 87650-52, and 87880.10
Antibiotic treatment
The pharmacy administrative claims dataset was used to identify study patients who filled a prescription for an antibiotic during their pharyngitis treatment episode. Optum pharmacy data identify the medications received, specifies the date of prescription filling, National Drug Codes, and American Hospital Formulary Service (AHFS) Classification System codes for each medication. We used the AHFS Pharmacologic-Therapeutic classification of antibiotics to create dichotomous variables documenting the antibacterial used by each patient.13 These are categorized under antibacterial including penicillins, cephalosporins (first, second, third, fourth generation cephalosporins), macrolides (first generation and others), tetracyclines, sulfonamides, fluoroquinolones (ciprofloxacin, levofloxacin, moxifloxacin), cephamycin, carbapenems, and β-lactam antibiotics (amoxicillin, amoxicillin/clavulanate, cephalexin, cefuroxime, cefdinir).
Revisits to physician or other provider
Revisits within 28 days were used as the measure of patient outcomes related to testing and filling of an antibiotic prescription for acute pharyngitis. Revisits may also be due to a patient returning for a follow-up, alternative treatment, worsening pharyngitis, or for another ARTI. An ARTI-related revisit also increases total resources used to treat pediatric pharyngitis patients.
Statistical analysis
Logistic regression was used for all 3 analyses conducted in this study. First, we determined the patient and treating physician characteristics that impact the decision to use GAS testing for pharyngitis. Second, we identified those factors that impact the decision to use antibiotic prescriptions among children who were diagnosed with pharyngitis adding in the dichotomous variable indicating if the patient had received a GAS test. Third, we used a logit regression analysis to document if receiving a GAS test and/or an antibiotic impacted the likelihood of a revisit by comparing revisit risk. To estimate the effect of testing and/or antibiotic use, we divided patients into 4 groups based on whether the patient received a GAS test and/or an antibiotic prescription. This specification of the analysis of revisits as an outcome focuses on adherence to HEDIS “test and treat” guidelines10:
- Patients who were not tested yet filled an antibiotic prescription. This decision was likely based on the clinician’s judgment of the patient’s signs and symptoms, and confirmational testing not performed.
- Patients who were not tested and did not fill an antibiotic prescription. Apparently, in the clinician’s judgment the patient’s signs and symptoms were such that the infection did not warrant treatment and the clinical presentation did not necessitate the GAS test to confirm the recorded diagnosis of pharyngitis.
- Patients who were tested and received antibiotic prescription, likely because the test was positive for GABHS.
- Patients who were tested and did not receive antibiotic prescription.
We tested for statistically significant differences in baseline characteristics across these 4 patient groups using t tests for continuous variables and χ2 tests for categorical variables. Odds ratios (OR) and CI were computed for the influential variables included the regression analyses.
We conducted a sensitivity analysis using a model specification which included the dichotomous variables for testing and for treatment, and the interaction term between these variables to assess if treatment effects varied in tested and untested patients. We also estimated this model of revisit risk using revisits within 7 days as the outcome variable.
All analyses were completed using STATA/IC 13 (StataCorp, College Station, TX).
Results
There were 24 685 treatment episodes for children diagnosed with pharyngitis. Nearly 47% of these episodes included GAS testing and 47% of the tested patients filled an antibiotic prescription. Similarly, 53% of patients were not tested and 49% of untested patients filled an antibiotic prescription. As a result, the 4 groups identified for analysis were evenly distributed: untested and no prescription (26.9%), untested and prescription (26.3%), tested and prescription (21.9%), and tested and no prescription (24.9%) (Figure).
Table 1 presents the descriptive statistics for these 4 patient groups. Note first that the rate of revisits within 28 days is under 5% across all groups. Second, the 2 tested groups have a lower revisit rate than the untested groups: the tested and treated have a revisit rate of 3.3%, and the tested and untreated have a revisit rate of 2.4%, while both the untested groups have a revisit rate of nearly 5%. These small absolute differences in revisit rates across groups were statistically significant.
Factors associated with receiving GAS test
Several factors were found to impact the decision to test (Table 2). Only 9.7% of children were reported to have any ARTI coinfection. As expected, these comorbidities resulted in a significantly lower likelihood of receiving the GAS test: AOM, bronchitis, sinusitis, pneumonia, and URI as comorbid infections had a 48%, 41%, 37%, 63%, and 13% lower likelihood of receiving the GAS test, respectively, than those with no comorbidities. Similarly, children with fever and respiratory symptoms were 35% and 45% less likely to receiving the GAS test, respectively. This is consistent with our expectation that comorbid ARTI infections will lead many providers to forgo testing.
Provider type and patient age also plays a role in receipt of the GAS test. Relative to outpatient facility providers, primary care physicians were 24% more likely and specialty physicians were 38% less likely of employing the GAS test. The child’s age played a significant role in receipt of the GAS test. Children aged 1 to 5 years and 5 to 12 years were 15% and 14% more likely to receive the test compared to children older than 12 years.
Pharyngitis patients have disproportionately higher odds of receiving a GAS test in most regions of the country compared to the Pacific region. For instance, children in the Mid-Atlantic region have 51% higher odds of receiving a GAS test while children in New England have 80% higher odds of receiving the same test.
Black children have 11% lower odds of receiving the GAS test compared to White children. Both middle-income and high-income children have 12% and 32% higher odds of receiving the test compared to low-income children. Compared to office-based visits, children visiting a clinic were twice as likely to receive a GAS test while those seen in the emergency room have 43% lower odds of receiving a GAS test. Hospital outpatient departments, which account for less than 1% of all visits, rarely used a GAS test which could be a statistical artifact due to small sample size. Lastly, insurance and season of the year had no significant impact of receipt of a GAS test.
Factors associated with receiving antibiotic prescription
Surprisingly, receiving the GAS test has a small but insignificant impact on the likelihood that the patient will receive an antibiotic prescription (Table 3) (Adjusted OR = 1.055, P = .07). After controlling for receipt of a GAS test, children with AOM and sinusitis comorbidities have an increased likelihood of being prescribed an antibiotic. Children with URI have a lower likelihood of being prescribed an antibiotic. Additionally, relative to primary care physicians, children visiting nonphysician providers for pharyngitis were more likely to be prescribed an antibiotic.
Children under 12 years of age were more likely to use an antibiotic compared to children 12 years and older. Geographically, there is some evidence of regional variation in antibiotic use as well. Children in the south Atlantic, west-south central, and southeast central regions had a significantly lower odds of being prescribed an antibiotic respectively than pharyngitis patients in the Pacific region. Black children had a 10% lower likelihood of being prescribed an antibiotic compared to White children, possibly related to their lower rate of GAS testing. Compared to office-based visits, children visiting a clinic were less likely to use an antibiotic. Household income, insurance type, and season had no significant impact on revisit risk.
Effects of GAS test and antibiotic prescriptions on likelihood of revisits
The multivariate analysis of the risk of a revisit within 28 days is presented in Table 4. Children with pharyngitis who tested and did not receive an antibiotic serve as the reference comparison group for this analysis to illustrate the impact of using the GAS test and treatment with an antibiotic. The results in Table 4 are quite clear: patients who receive the GAS test were significantly less likely to have a revisit within 28 days. Moreover, within the group of patients who were tested, those not receiving an antibiotic, presumedly because their GAS test was negative, experienced the lowest risk of a revisit. This result is consistent with the data in Table 1. Moreover, using an antibiotic had no impact on the likelihood of a revisit in patients not receiving the GAS test. This result is also consistent with Table 1.
Other results from the analysis of revisit risk may be of interest to clinicians. Pharyngitis patients with a prior episode of treatment within 90 days for an acute respiratory tract infection were more than 7 times more likely to experience a revisit within 28 days of the pharyngitis diagnosis than patients without a history of recent ARTI infections. Age is also a risk factor in likelihood of initiating a revisit. Children under 1 year and children aged 1 to 5 years were more likely to have a revisit than children aged more than 12 years. Compared to White children, Black children were 25% (P = .04) less likely to have a revisit. The care setting also has a significant impact on revisit risk. Children visiting outpatient hospital and other care settings had a significantly higher revisit risk than those visiting a physician’s office. Lastly, household income, geographic region, season, medical comorbidities, gender, and insurance type have no significant impact on revisit risk.
Sensitivity analysis
The results from the analysis of 7-day and 28-day revisit risk are summarized in Table 5. These results indicate that patients who were tested had a more significant decrease in revisit risk at 7 days (72%) than was evident at 28 days (47% reduction). Receiving an antibiotic, with or without the test, had no impact on revisit risk.
Discussion
Published data on revisits for pharyngitis are lacking with the concentration of prior research focused more on systemic complications of undertreated GABHS disease or on identifying carrier status. Our study results suggest that GAS testing is the most important factor in reducing revisit risk. Being prescribed an antibiotic, on its own, does not have a significant impact on the risk of a revisit. However, once the GAS test is used, the decision not to use an antibiotic was correlated with the lowest revisit rate, likely because the source of the pharyngitis infection was viral and more likely to resolve without a revisit. Prior studies have reported variable rates of testing among children with pharyngitis prescribed an antibiotic, ranging from 23% to 91%,14,15 with testing important toward more appropriate antibiotic use.16 More recently, among more than 67 000 patients aged 3 to 21 years presenting with sore throat and receiving a GAS test, 32.6% were positive.17
Our analysis found that more than 46% of pediatric pharyngitis patients were given the rapid GAS test. While this testing rate is substantially lower than HEDIS recommendations and lower than testing rates achieved by several health maintenance organizations,10 it is similar to the 53% of children receiving such testing in a recent National Ambulatory Medical Care Survey.18 Furthermore, we found that when antibiotics are prescribed following a GAS test, the revisit risk is not significantly reduced, possibly because antibiotics lower revisit risk when informed by diagnostic testing tools that determine the infectious organism. This is supported by a similar population analysis in which we observed reduced revisit rates in children with AOM managed with antibiotics within 3 days of index diagnosis.19
Several other factors also affect the likelihood of a child receiving the GAS test. Children aged 1 to 12 years were significantly more likely to receive the GAS test than children over the age of 12. This included children in the 1 to 5 years old bracket who had a 15% higher likelihood of undergoing a GAS test, despite children less than 3 years of age as not recommended targets for GAS testing.20 As expected, children with reported ARTI-associated comorbidities were also less likely to receive a GAS test. Additionally, specialty care physicians were less inclined to implement the GAS test, possibly because of diagnostic confidence without testing or referral after GAS was ruled out. Black and low-income children had statistically lower odds of receiving the test, even after controlling for other factors, and yet were less likely to consume a revisit. As the overall data suggested more revisits in those not tested, further study is needed to examine if race or income discrepancies are equity based. Finally, children in the Pacific region, compared to the rest of the nation, were the least likely to receive a GAS test and yet there were no significant differences in revisit rates by region. Regional differences in antibiotic use were also observed in our study, as has been seen by others.21
After statistically controlling for having received the diagnostic GAS test and filled a prescription for an antibiotic, there are multitude of factors that independently affect the revisit risk, the most important of which if which was a history of an ARTI infection in the prior 90 days. While prior visit history had no impact on the likelihood of being tested or filling an antibiotic, patients with prior visits were more than 7 times more likely to consume a revisit. This was not reflected in nor related to comorbid ARTIs as these patients did not have statistically higher revisits than those with pharyngitis as the sole-coded diagnosis. Moreover, speculation for bacterial etiology of primary or superinfection based on a recent history of ARTI accounting for revisits seems unlikely as it did not yield greater antibiotic use in that group. Further analysis is required to determine the clinical and behavioral factors that promote for prior ARTI history as a major factor in revisit risk after an index visit for pharyngitis.
Children aged between 1 and 5 years, though 15% more likely to be tested than those aged 12 through 17 years, were also 39% more likely to initiate a revisit compared to older children when statistically controlling for other covariates. This perhaps suggests longer illness, wrong diagnosis, delay in appropriate treatment, or more caution by parents and providers in this age group. Justification for testing children less than 3 years of age who are outside of the HEDIS suggested age group, when clinical judgement does not point to another infection source, can result in positivity rates between 22% and 30% as previously observed.22,23 Patients visiting nonphysician providers and outpatient facility providers were less likely to have a revisit than those visiting primary and specialty care physicians, though slightly higher propensity for antibiotic prescriptions was seen for nonphysician providers. Pediatricians have been noted to be less likely to prescribe antibiotics without GAS testing than nonpediatric providers, and more guidelines-compliant in prescribing.24
Recommendations to not test children under 3 years of age are based on the lack of acute rheumatic fever and other complications in this age group together with more frequent viral syndromes. Selectivity in applying clinical criteria to testing can be attempted to separate bacterial from viral illness. Postnasal drainage/rhinorrhea, hoarse voice, and cough have been used successfully to identify those with viral illness and less need for testing, with greater certainty of low risk for GABHS in those over 11 years of age without tonsillar exudates, cervical adenopathy, or fever.17 However, the marginal benefits of those who have all 3 features of viral illness versus none in identifying GAS positivity was 23.3% vs 37.6% - helpful, but certainly not diminishing the need for testing. These constitutional findings of viral URI also do not exclude the GAS carrier state that features these symptoms.25 Others have reinforced the doubt of pharyngeal exudates as the premier diagnostic finding for test-positive GAS.26
This study had several limitations. The Optum claims dataset only contains ICD-9 codes for diagnoses. It does not include data on infection severity and clinical findings related to symptoms, thus empiric treatment warranted based in clinical severity is not assessed. Antibiotics are commonly available as generics and very inexpensive. Patients may fill and pay for these prescriptions directly, in which case, a claim for payment may not be filed with Optum. This could result in an undercount of treated patients in our study.
There is no corresponding problem of missing medical claims for GAS testing which were obtained from the CPT codes within the Optum claims data set. However, we elected not to verify the test results due to these data being missing for 75% of the study population. Nevertheless, this study’s focus was less about justifying antibiotic treatment, but dealt with the outcomes generated by testing and treatment. Toward that end, we used CPT codes to identify a revisit, and while those can at times be affected by financial reimbursement incentives, differences related to revisits in the 4 patient groups should not be subject to bias.
Conclusion
This study used data from real world practices to document the patterns of GAS testing and antibiotic use in pediatric pharyngitis patients. Revisit rates were under 5% for all patient groups and the use of rapid diagnostic tools were found to be the determining factor in further reducing the risk of revisits. This supports the need for compliance with the HEDIS quality metric for pharyngitis to the recommended levels of rapid testing which have been falling in recent years. Use of more accurate antigen and newer molecular detection testing methods may help further delineate important factors in determining pediatric pharyngitis treatment and need for revisits.27
Corresponding author: Jeffrey McCombs, MD, University of Southern California School of Pharmacy, Department of Pharmaceutical and Health Economics, Leonard D. Schaeffer Center for Health Policy & Economics, 635 Downey Way, Verna & Peter Dauterive Hall 310, Los Angeles, CA 90089-3333; jmccombs@usc.edu.
Financial disclosures: None.
1. Choby BA. Diagnosis and treatment of streptococcal pharyngitis. Am Fam Physician. 2009;79(5):383-390.
2. Briel M, Schuetz P, Mueller B, et al. Procalcitonin-guided antibiotic use vs a standard approach for acute respiratory tract infections in primary care. Arch of Intern Med. 2008;168(18):2000-2008. doi: 10.1001/archinte.168.18.2000
3. Maltezou HC, Tsagris V, Antoniadou A, et al. Evaluation of a rapid antigen detection test in the diagnosis of streptococcal pharyngitis in children and its impact on antibiotic prescription. J Antimicrob Chemother. 2008;62(6):1407-1412. doi: 10.1093/jac/dkn376
4. Neuner JM, Hamel MB, Phillips RS, et al. Diagnosis and management of adults with pharyngitis: a cost-effectiveness analysis. Ann Intern Med. 2003;139(2):113-122. doi:10.7326/0003-4819-139-2-200307150-00011
5. Gerber MA, Baltimore RS, Eaton CB, et al. Prevention of rheumatic fever and diagnosis and treatment of acute Streptococcal pharyngitis: a scientific statement from the American Heart Association Rheumatic Fever, Endocarditis, and Kawasaki Disease Committee of the Council on Cardiovascular Disease in the Young, the Interdisciplinary Council on Functional Genomics and Translational Biology, and the Interdisciplinary Council on Quality of Care and Outcomes Research: endorsed by the American Academy of Pediatrics. Circulation. 2009;119(11):1541-1551. doi: 10.1161/CIRCULATIONAHA.109.191959
6. Gieseker KE, Roe MH, MacKenzie T, Todd JK. Evaluating the American Academy of Pediatrics diagnostic standard for Streptococcus pyogenes pharyngitis: backup culture versus repeat rapid antigen testing. Pediatrics. 2003;111(6):e666-e670. doi: 10.1542/peds.111.6.e666
7. Shapiro DJ, Lindgren CE, Neuman MI, Fine AM. Viral features and testing for Streptococcal pharyngitis. Pediatrics. 2017;139(5):e20163403. doi: 10.1542/peds.2016-3403
8. Shulman ST, Bisno AL, Clegg H, et al. Clinical practice guideline for the diagnosis and management of group A Streptococcal pharyngitis: 2012 update by the Infectious Diseases Society of America. Clin Infect Dis. 2012;55(10):e86–e102. doi: 10.1093/cid/cis629
9. Mangione-Smith R, McGlynn EA, Elliott MN, et al. Parent expectations for antibiotics, physician-parent communication, and satisfaction. Arch Pediatr Adolesc Med. 2001;155(7):800–806. doi: 10.1001/archpedi.155.7.800
10. Appropriate Testing for Children with Pharyngitis. HEDIS Measures and Technical Resources. National Committee for Quality Assurance. Accessed February 12, 2021. https://www.ncqa.org/hedis/measures/appropriate-testing-for-children-with-pharyngitis/
11. Linder JA, Bates DW, Lee GM, Finkelstein JA. Antibiotic treatment of children with sore throat. JAMA. 2005;294(18):2315-2322. doi: 10.1001/jama.294.18.2315
12. Crimmel BL. Health Insurance Coverage and Income Levels for the US Noninstitutionalized Population Under Age 65, 2001. Medical Expenditure Panel Survey, Agency for Healthcare Research and Quality. 2004. https://meps.ahrq.gov/data_files/publications/st40/stat40.pd
13. AHFS/ASHP. American Hospital Formulary Service Drug Information. 2012. AHFS drug information. 00--. Accessed January 4, 2021.
14. Mainous AG 3rd, Zoorob, RJ, Kohrs FP, Hagen MD. Streptococcal diagnostic testing and antibiotics prescribed for pediatric tonsillopharyngitis. Pediatr Infect Dis J. 1996;15(9):806-810. doi: 10.1097/00006454-199609000-00014
15. Benin AL, Vitkauskas G, Thornquist E, et al. Improving diagnostic testing and reducing overuse of antibiotics for children with pharyngitis: a useful role for the electronic medical record. Pediatr Infect Dis J. 2003;22(12):1043-1047. doi: 10.1097/01.inf.0000100577.76542.af
16. Luo R, Sickler J, Vahidnia F, et al. Diagnosis and Management of Group a Streptococcal Pharyngitis in the United States, 2011-2015. BMC Infect Dis. 2019;19(1):193-201. doi: 10.1186/s12879-019-3835-4
17. Shapiro DJ, Barak-Corren Y, Neuman MI, et al. Identifying Patients at Lowest Risk for Streptococcal Pharyngitis: A National Validation Study. J Pediatr. 2020;220:132-138.e2. doi: 10.1016/j.jpeds.2020.01.030. Epub 2020 Feb 14
18. Shapiro DJ, King LM, Fleming-Dutra KE, et al. Association between use of diagnostic tests and antibiotic prescribing for pharyngitis in the United States. Infect Control Hosp Epidemiol. 2020;41(4):479-481. doi: 10.1017/ice.2020.29
19. Sangha K, Steinberg I, McCombs JS. The impact of antibiotic treatment time and class of antibiotic for acute otitis media infections on the risk of revisits. Abs PDG4. Value in Health. 2019; 22:S163.
20. Ahluwalia T, Jain S, Norton L, Meade J, et al. Reducing Streptococcal Testing in Patients < 3 Years Old in an Emergency Department. Pediatrics. 2019;144(4):e20190174. doi: 10.1542/peds.2019-0174
21. McKay R, Mah A, Law MR, et al. Systematic Review of Factors Associated with Antibiotic Prescribing for Respiratory Tract Infections. Antimicrob Agents Chemother. 2016;60(7):4106-4118. doi: 10.1128/AAC.00209-16
22. Woods WA, Carter CT, Schlager TA. Detection of group A streptococci in children under 3 years of age with pharyngitis. Pediatr Emerg Care. 1999;15(5):338-340. doi: 10.1097/00006565-199910000-00011
23. Mendes N, Miguéis C, Lindo J, et al. Retrospective study of group A Streptococcus oropharyngeal infection diagnosis using a rapid antigenic detection test in a paediatric population from the central region of Portugal. Eur J Clin Microbiol Infect Dis. 2021;40(6):1235-1243. doi: 10.1007/s10096-021-04157-x
24. Frost HM, McLean HQ, Chow BDW. Variability in Antibiotic Prescribing for Upper Respiratory Illnesses by Provider Specialty. J Pediatr. 2018;203:76-85.e8. doi: 10.1016/j.jpeds.2018.07.044.
25. Rick AM, Zaheer HA, Martin JM. Clinical Features of Group A Streptococcus in Children With Pharyngitis: Carriers versus Acute Infection. Pediatr Infect Dis J. 2020;39(6):483-488. doi: 10.1097/INF.0000000000002602
26. Nadeau NL, Fine AM, Kimia A. Improving the prediction of streptococcal pharyngitis; time to move past exudate alone [published online ahead of print, 2020 Aug 16]. Am J Emerg Med. 2020;S0735-6757(20)30709-9. doi: 10.1016/j.ajem.2020.08.023
27. Mustafa Z, Ghaffari M. Diagnostic Methods, Clinical Guidelines, and Antibiotic Treatment for Group A Streptococcal Pharyngitis: A Narrative Review. Front Cell Infect Microbiol. 2020;10:563627. doi: 10.3389/fcimb.2020.563627
Cost Comparison of 2 Video Laryngoscopes in a Large Academic Center
From the Department of Anesthesiology, Thomas Jefferson University and Hospitals, Sidney Kimmel Medical College, Philadelphia, PA, and Sidney Kimmel Medical College at Thomas Jefferson University, Philadelphia, PA.
Objective: Retrospective study examining hospital cost information of patients requiring endotracheal intubation with video laryngoscopy. Provide a practical cost assessment on use of the McGRATH and GlideScope video laryngoscopes (VLs).
Methods: This study examined 52 hospital locations within a single, large university hospital, with most of those locations being hospital operating rooms. A total of 34 600 endotracheal intubations performed over 24 months, of which 11 345 were video laryngoscopies. Electronic medical records containing demographic data and information related to endotracheal intubation procedures, with monthly breakdowns between GlideScope and McGRATH intubations, were reviewed. Cost information calculated for equipment, blades, batteries, repairs, and subsequent analysis performed to determine cost differences between those 2 instruments during the COVID-19 period.
Results: A total of 5501 video laryngoscopy procedures were performed using the McGRATH VL and 5305 were performed using the GlideScope VL. Costs over 24 months were $181 093 lower (55.5%) for McGRATH compared to GlideScope. The mean (SD) monthly costs for GlideScope blades were $3837 ($1050) and $3236 ($538) for years 1 and 2, respectively, vs $1652 ($663) and $2933 ($585) for McGRATH blades (P < .001). Most total cost differences were attributed to equipment and blade purchases, which were $202 595 (65.0%) higher for GlideScope. During the COVID-19 period, the use of the McGRATH increased to 61% of all video laryngoscopy cases, compared to 37% for GlideScope (P < .001). Blade cost difference for the COVID-19 period was $128 higher for the McGRATH even though 293 more intubations were performed with that device.
Conclusions: Use of the McGRATH resulted in a cost savings of 55% compared to the GlideScope, and its use was highest during the COVID-19 period, which may be explained by its more portable and practical features.
Keywords: video laryngoscope; McGRATH; GlideScope; endotracheal intubation; hospital costs; COVID-19.
Hospitals have come to rely on video laryngoscopes (VLs) for tracheal intubation as necessary tools for better visualization of airways. Modern video laryngoscopy developed in the 2000s1 as a progression from direct laryngoscopy, which began in 1852 when Horace Green used a bent tongue spatula and sunlight to examine a child.2 VLs have seen many improvements and adaptations of their own, resulting in many different styles and types circulating around hospitals. The GlideScope (Verathon Inc, Bothell, WA) and the McGRATH (Medtronic, Minneapolis, MN) are examples of such instruments, which are now widely used in the US and are the 2 VLs of choice at our institution.
A few studies have compared VLs to direct laryngoscopes. In their systematic review, Lewis et al have shown the numerous benefits of using a VL over a direct laryngoscope. Some general conclusions were that the use of video laryngoscopy reduced the number of failed intubations, decreased laryngeal trauma, and provided improved visualizations.3 Other studies have compared the different types of VLs, including the McGRATH and the GlideScope, examining factors such as intubation time and display quality of the image. Two studies found that medical students were equally successful at using both the McGRATH and the GlideScope,4,5 while another study found that care providers using the GlideScope had quicker intubation times.6 Lastly, Savoldelli et al concluded that more providers preferred the McGRATH, which provided better laryngeal views,7 while their subsequent study showed more favorable learning curves of the Airtraq compared to the McGRATH and other VLs.8
Although there have been no reported differences in safety and effectiveness of the McGRATH and GlideScope devices, cost data on the use of these 2 popular laryngoscopes are lacking. Such information is important considering the increasing costs of medical technologies and the significant financial losses experienced by health care systems due to the COVID-19 crisis. The purpose of this retrospective cohort study was to compare the cost efficiency of the McGRATH MAC and GlideScope Core VLs at a large academic center.
Methods
This retrospective study was performed under exemption from the Thomas Jefferson University Institutional Review Board. The primary data sources consisted of hospital electronic patient records (EPIC) and cost information from the device manufacturers and hospital staff. The electronic patient data were provided by the EPIC Enterprise Analytics Business Intelligence group at Thomas Jefferson University Hospital (Center City Campus, Philadelphia, PA), while device costs were obtained from Verathon, Medtronic, and departmental staff responsible for purchasing equipment. Monthly data were obtained over a 24-month period (June 2018 through May 2020) when the McGRATH VL was placed into use in the department of anesthesiology. The 2 types of VLs were made available for use in a total of 52 locations, with the majority being hospital operating rooms.
The following variables were recorded: number of endotracheal intubations performed each month with breakdown between video laryngoscopy and flexible bronchoscopy airways, frequency of use for each type of laryngoscope, blades used, and equipment costs for use of each laryngoscope. Hospital cost estimates for both the McGRATH and GlideScope laryngoscopes included batteries, handles, blades, and the devices themselves. Cost data were also collected on frequency of device failure, maintenance, and replacement of parts and lost equipment.
Analysis
De-identified electronic medical records consisted of nominal and quantitative variables, with demographic data and information related to the endotracheal intubation procedure. All data were in chronological order and sorted by date after which coding was applied, to identify device type and allocate pertinent cost information. Descriptive statistics were reported as mean (SD) and sum for costs; frequency tables were generated for intubation procedures according to device type and time periods. Data were analyzed using the χ2 test, the student t test, and the Wilcoxon Mann-Whitney U test, with a P value set at .05 for statistical significance. SPSS version 26 and GraphPad Prism version 6 were used for all statistical analyses.
Results
A total of 34 600 endotracheal intubations were performed over the 24-month study period, and 11 345 (32.8%) were video laryngoscopy procedures. Out of all video laryngoscopy procedures, 5501 (48.5%) were performed using the McGRATH VL and 5305 (46.8%) were conducted using the GlideScope VL. The difference of 539 (4.8%) cases accounts for flexible bronchoscopy procedures and endotracheal intubations using other video laryngoscopy equipment. The mean (SD) monthly number of video laryngoscopy procedures for the 24 months was 221 (54) and 229 (89) for the GlideScope and McGRATH devices, respectively. Monthly endotracheal intubation distributions over 24 months trended upward for the McGRATH VL and downward for the GlideScope, but there was no statistically significant (P = .71) difference in overall use between the 2 instruments (Figure 1).
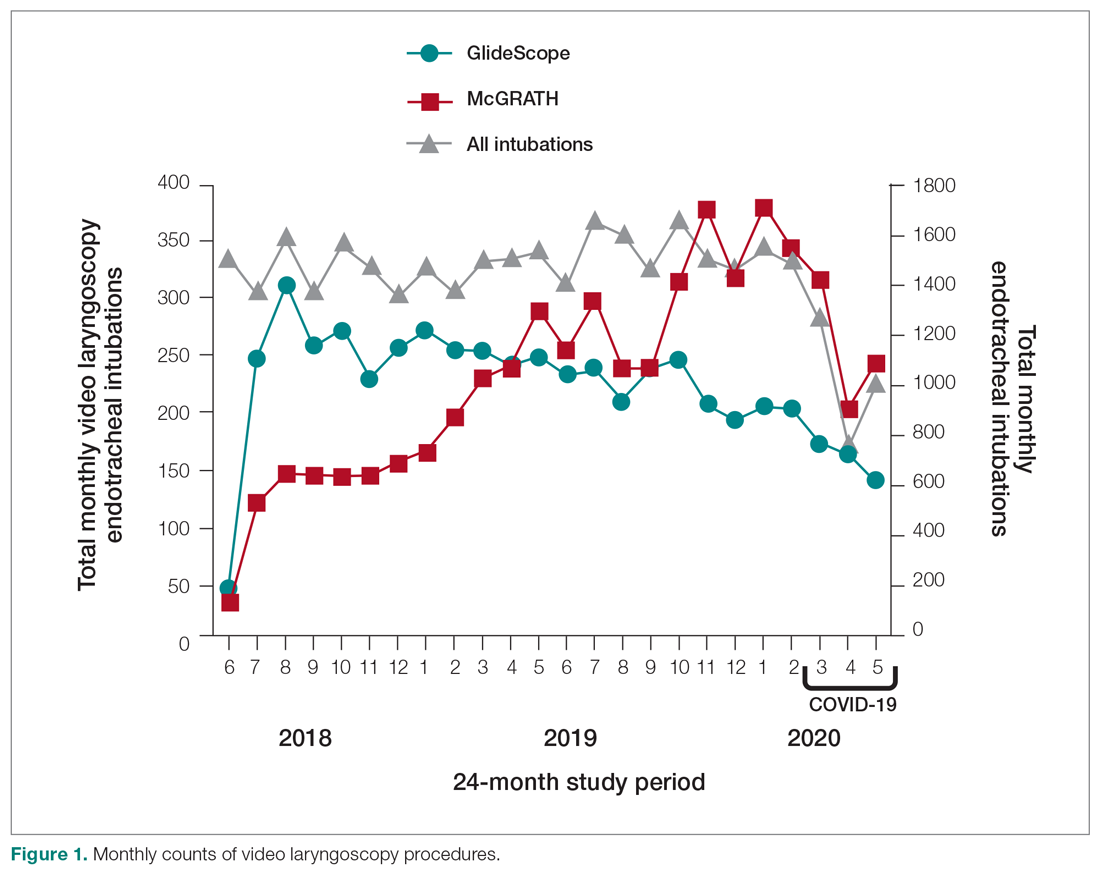
To examine the observed usage trends between the 2 VL during the first and last 12 months, a univariate ANOVA was conducted with the 2 time periods entered as predictors in the model. Video laryngoscopy intubations were performed (P = .001) more frequently with the GlideScope during the first 12 months; however, use of the McGRATH VL increased (P < .001) during the following 12 months compared to GlideScope. The GlideScope accounted for 54% of all VL intubations during the first 12 months, with the McGRATH accounting for 58% of all video laryngoscopy procedures for months 12 to 24. Additionally, the increase in video laryngoscopy procedures with the McGRATH during the last 3 months of the study period was despite an overall reduction in surgical volume due to the COVID-19 crisis, defined for this study as March 1, 2020, to May 31, 2020 (Figure 1). There was a statistically significant (P < .001) difference in the case distribution between use of the McGRATH and GlideScope VL for that period. The anesthesia personnel’s use of the McGRATH VL increased to 61% of all video laryngoscopy cases, compared to 37% for the GlideScope (Figure 2).
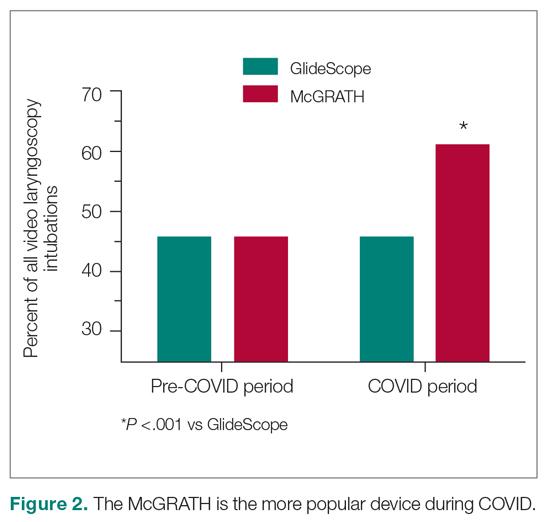
The total costs calculated for equipment, blades, and repairs are presented in Table 1 and yearly total costs are shown in Figure 3. Overall costs were $181 093 lower (55.5%) for the McGRATH VL compared to the GlideScope over the 24-month period. The mean (SD) monthly costs for GlideScope VL blades were $3837 ($1050) and $3236 ($538) for years 1 and 2, respectively, vs $1652 ($663) and $2933 ($585) for the McGRATH VL blades. Most of the total cost differences were attributed to equipment and blade purchases, which were $202 595 (65.0%) higher for the GlideScope compared to the McGRATH VL. The monthly blade costs alone were higher (P < .001) for the GlideScope over the 2-year period; however, the McGRATH VL required use of disposable stylets at a cost of $10 177 for all endotracheal intubations, compared to $700 for the GlideScope device.
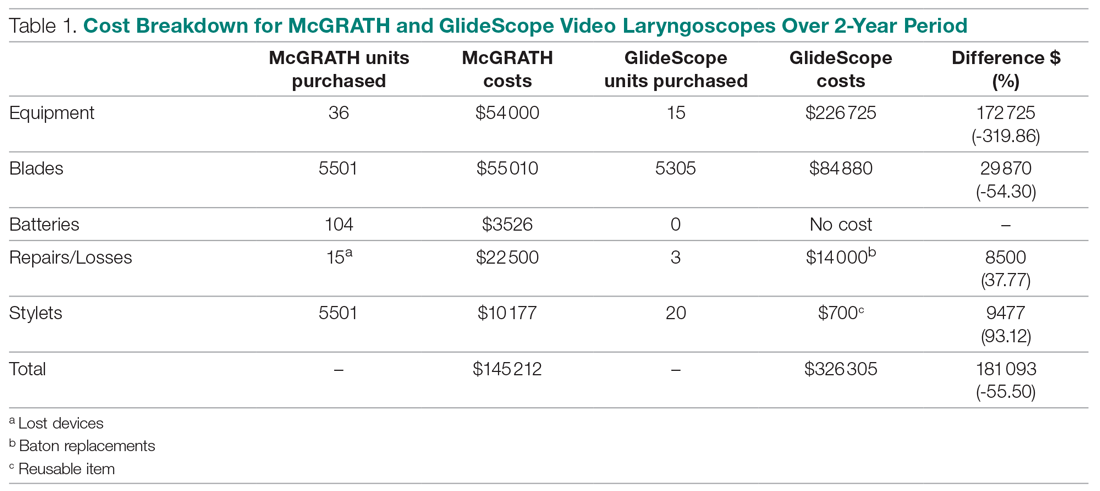
An analysis was performed to determine whether costs differed between those 2 instruments during the COVID-19 period. There was a statistically significant (P < .001) difference in the case distribution between use of the McGRATH and GlideScope VLs during that period. The calculated blade cost difference for the COVID period was $128 higher for the McGRATH even though 293 more intubations were performed with that device (Table 2).
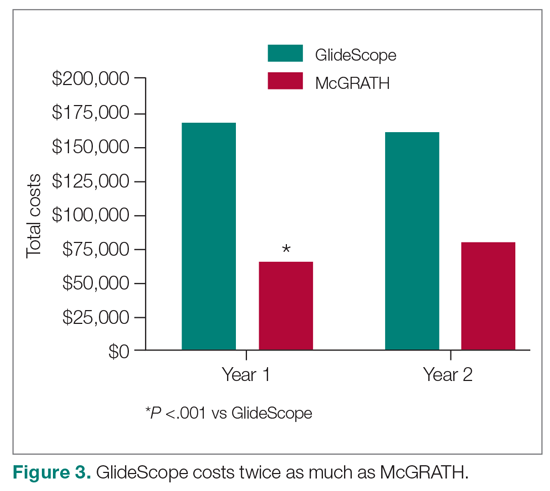
Discussion
We attempted to provide useful cost estimates by presenting pricing data reflecting the approximate cost that most large institutional anesthesia practices would incur for using those 2 specific devices and related peripherals. The main findings of our analysis showed that use of the McGRATH MAC VL resulted in a 55% cost savings compared to the GlideScope, with a similar number of cases performed with each device over the 24-month study period. We believe this represents a substantial savings to the department and institution, which has prompted internal review on the use of video laryngoscopy equipment. None of the McGRATH units failed; however, the GlideScope required 3 baton replacements.
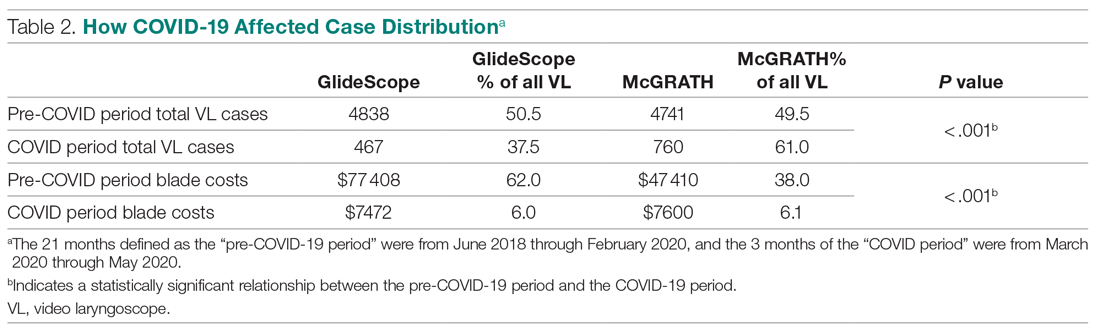
Of note, use of the McGRATH MAC increased during the COVID-19 period, which may be explained by the fact that the operators found it to be a more portable device. Several physicians in the department commented that its smaller size made the McGRATH MAC more practical during the time when a plexiglass box was being used around the patient’s head to shield the intubator from aerosolized viral particles.
Although this study demonstrated the cost-saving value of the McGRATH over the GlideScope, a suggested next step would be to examine resource utilization related to video laryngoscopy use. The more dynamic tracking of the use of these devices should facilitate the assessment of existing related resources and decision making, to optimize the benefits of this initiative. We would anticipate reduced use of anesthesia personnel, such as technicians to assist with the management of this device which could be significant. As new respiratory viruses are appearing each year, video laryngoscopy will continue to gain increasing use in operating rooms and acute care locations. The adding of protective barriers between patients and providers calls for use of the most practical and effective VL devices, to protect personnel who are at high risk of contamination from airway secretions and aerosolized particles.9,10
The COVID-19 pandemic has demonstrated the value of anesthesiology in regards to analyzing and finding solutions to effectively manage infected patients or those suspected of infection in the perioperative environment. Inexpensive products are often avoided because cheaper devices are associated with being of lower quality. However, the association with cost and quality—and the assumption that a higher price is positively correlated with higher quality—is overall inconsistent in the medical literature.11 A more effective or higher quality treatment does not necessarily cost more and may actually end up costing less,12 as was the case in this study. We have been able to directly cut departmental expenses by using a more efficient and cost-effective device for intubations, without compromising safety and efficacy. Future studies should determine whether this significant reduction in costs from video laryngoscopy intubations with the McGRATH VL will be sustained across anesthesiology departments in the Jefferson Health Enterprise Hospitals, or other health systems, as well as its impact on workflow and personnel resources.
This analysis was restricted to one of the campuses of the Jefferson Health Enterprise. However, this is the largest anesthesia practice, encompassing several locations, which should reflect the general practice patterns across other anesthesiology departments in this large institution. The costs for the devices and peripherals may vary across anesthesia practices depending on volume and contracts negotiated with the suppliers. It was not possible to estimate this variability, which could change the total costs by a few percentage points. We recognize that there may be other costs associated with securing the McGRATH VL to prevent loss from theft or misplacement, which were not included in the study. Lastly, the inability to obtain randomized samples for the 2 groups treated with each device opens up the possibility of selection bias. There were, however, multiple intubators who were free to select 1 of the devices for endotracheal intubation, which may have reduced the effect of selection bias.
Conclusion
This study demonstrated that over a 24-month period use of the McGRATH MAC VL resulted in a cost reduction of around 55% compared to using the GlideScope for endotracheal intubation procedures performed at a major academic center. Over the first 3 months of the COVID-19 crisis, which our study included, use of the McGRATH VL increased while GlideScope use decreased. This was most likely related to the portability and smaller size of the McGRATH, which better facilitated intubations of COVID-19 patients.
Acknowledgements: The authors thank Craig Smith, Senior Anesthesia Technician, for his assistance with the cost information and excellent record-keeping related to the use of video laryngoscopes.
Corresponding author: Marc C. Torjman, PhD, Professor, Department of Anesthesiology, Sidney Kimmel Medical College at Thomas Jefferson University, 111 South 11th St, Suite G-8290, Philadelphia, PA 19107; Marc.Torjman@Jefferson.edu.
Financial disclosures: Dr. Thaler has served as a consultant for Medtronic since September 2020. He has participated in 2 webinars on the routine use of video laryngoscopy.
Funding: This study was supported by the Department of Anesthesiology at Thomas Jefferson University.
1. Channa AB. Video laryngoscopes. Saudi J Anaesth. 2011;5(4):357-359.
2. Pieters BM, Eindhoven GB, Acott C, Van Zundert AAJ. Pioneers of laryngoscopy: indirect, direct and video laryngoscopy. Anaesth Intensive Care. 2015;43(suppl):4-11.
3. Lewis SR, Butler AR, Parker J, et al. Videolaryngoscopy versus direct laryngoscopy for adult patients requiring tracheal intubation. Cochrane Database Syst Rev. 2016;11(11):CD011136.
4. Kim W, Choi HJ, Lim T, Kang BS. Can the new McGrath laryngoscope rival the GlideScope Ranger portable video laryngoscope? A randomized manikin study. Am J Emerg Med. 2014;32(10):1225-1229.
5. Kim W, Choi HJ, Lim T, et al. Is McGrath MAC better than Glidescope Ranger for novice providers in the simulated difficult airway? A randomized manikin study. Resuscitation. 2014;85(suppl 1):S32.
6. Jeon WJ, Kim KH, Yeom JH, et al. A comparison of the Glidescope to the McGrath videolaryngoscope in patients. Korean J Anesthesiol. 2011;61(1):19-23.
7. Savoldelli GL, Schiffer E, Abegg C, et al. Comparison of the Glidescope, the McGrath, the Airtraq and the Macintosh laryngoscopes in simulated difficult airways. Anaesthesia. 2008;63(12):1358-1364.
8. Savoldelli GL, Schiffer E, Abegg C, et al. Learning curves of the Glidescope, the McGrath and the Airtraq laryngoscopes: a manikin study. Eur J Anaesthesiol. 2009;26(7):554-558.
9. Schumacher J, Arlidge J, Dudley D, et al. The impact of respiratory protective equipment on difficult airway management: a randomised, crossover, simulation study. Anaesthesia. 2020;75(10):1301-1306.
10. De Jong A, Pardo E, Rolle A, et al. Airway management for COVID-19: a move towards universal videolaryngoscope? Lancet Respir Med. 2020;8(6):555.
11. Hussey PS, Wertheimer S, Mehrotra A. The association between health care quality and cost: a systematic review. Ann Intern Med. 2013;158(1):27-34.
12. Mitton C, Dionne F, Peacock S, Sheps S. Quality and cost in healthcare: a relationship worth examining. Appl Health Econ Health Policy. 2006;5(4):201-208.
From the Department of Anesthesiology, Thomas Jefferson University and Hospitals, Sidney Kimmel Medical College, Philadelphia, PA, and Sidney Kimmel Medical College at Thomas Jefferson University, Philadelphia, PA.
Objective: Retrospective study examining hospital cost information of patients requiring endotracheal intubation with video laryngoscopy. Provide a practical cost assessment on use of the McGRATH and GlideScope video laryngoscopes (VLs).
Methods: This study examined 52 hospital locations within a single, large university hospital, with most of those locations being hospital operating rooms. A total of 34 600 endotracheal intubations performed over 24 months, of which 11 345 were video laryngoscopies. Electronic medical records containing demographic data and information related to endotracheal intubation procedures, with monthly breakdowns between GlideScope and McGRATH intubations, were reviewed. Cost information calculated for equipment, blades, batteries, repairs, and subsequent analysis performed to determine cost differences between those 2 instruments during the COVID-19 period.
Results: A total of 5501 video laryngoscopy procedures were performed using the McGRATH VL and 5305 were performed using the GlideScope VL. Costs over 24 months were $181 093 lower (55.5%) for McGRATH compared to GlideScope. The mean (SD) monthly costs for GlideScope blades were $3837 ($1050) and $3236 ($538) for years 1 and 2, respectively, vs $1652 ($663) and $2933 ($585) for McGRATH blades (P < .001). Most total cost differences were attributed to equipment and blade purchases, which were $202 595 (65.0%) higher for GlideScope. During the COVID-19 period, the use of the McGRATH increased to 61% of all video laryngoscopy cases, compared to 37% for GlideScope (P < .001). Blade cost difference for the COVID-19 period was $128 higher for the McGRATH even though 293 more intubations were performed with that device.
Conclusions: Use of the McGRATH resulted in a cost savings of 55% compared to the GlideScope, and its use was highest during the COVID-19 period, which may be explained by its more portable and practical features.
Keywords: video laryngoscope; McGRATH; GlideScope; endotracheal intubation; hospital costs; COVID-19.
Hospitals have come to rely on video laryngoscopes (VLs) for tracheal intubation as necessary tools for better visualization of airways. Modern video laryngoscopy developed in the 2000s1 as a progression from direct laryngoscopy, which began in 1852 when Horace Green used a bent tongue spatula and sunlight to examine a child.2 VLs have seen many improvements and adaptations of their own, resulting in many different styles and types circulating around hospitals. The GlideScope (Verathon Inc, Bothell, WA) and the McGRATH (Medtronic, Minneapolis, MN) are examples of such instruments, which are now widely used in the US and are the 2 VLs of choice at our institution.
A few studies have compared VLs to direct laryngoscopes. In their systematic review, Lewis et al have shown the numerous benefits of using a VL over a direct laryngoscope. Some general conclusions were that the use of video laryngoscopy reduced the number of failed intubations, decreased laryngeal trauma, and provided improved visualizations.3 Other studies have compared the different types of VLs, including the McGRATH and the GlideScope, examining factors such as intubation time and display quality of the image. Two studies found that medical students were equally successful at using both the McGRATH and the GlideScope,4,5 while another study found that care providers using the GlideScope had quicker intubation times.6 Lastly, Savoldelli et al concluded that more providers preferred the McGRATH, which provided better laryngeal views,7 while their subsequent study showed more favorable learning curves of the Airtraq compared to the McGRATH and other VLs.8
Although there have been no reported differences in safety and effectiveness of the McGRATH and GlideScope devices, cost data on the use of these 2 popular laryngoscopes are lacking. Such information is important considering the increasing costs of medical technologies and the significant financial losses experienced by health care systems due to the COVID-19 crisis. The purpose of this retrospective cohort study was to compare the cost efficiency of the McGRATH MAC and GlideScope Core VLs at a large academic center.
Methods
This retrospective study was performed under exemption from the Thomas Jefferson University Institutional Review Board. The primary data sources consisted of hospital electronic patient records (EPIC) and cost information from the device manufacturers and hospital staff. The electronic patient data were provided by the EPIC Enterprise Analytics Business Intelligence group at Thomas Jefferson University Hospital (Center City Campus, Philadelphia, PA), while device costs were obtained from Verathon, Medtronic, and departmental staff responsible for purchasing equipment. Monthly data were obtained over a 24-month period (June 2018 through May 2020) when the McGRATH VL was placed into use in the department of anesthesiology. The 2 types of VLs were made available for use in a total of 52 locations, with the majority being hospital operating rooms.
The following variables were recorded: number of endotracheal intubations performed each month with breakdown between video laryngoscopy and flexible bronchoscopy airways, frequency of use for each type of laryngoscope, blades used, and equipment costs for use of each laryngoscope. Hospital cost estimates for both the McGRATH and GlideScope laryngoscopes included batteries, handles, blades, and the devices themselves. Cost data were also collected on frequency of device failure, maintenance, and replacement of parts and lost equipment.
Analysis
De-identified electronic medical records consisted of nominal and quantitative variables, with demographic data and information related to the endotracheal intubation procedure. All data were in chronological order and sorted by date after which coding was applied, to identify device type and allocate pertinent cost information. Descriptive statistics were reported as mean (SD) and sum for costs; frequency tables were generated for intubation procedures according to device type and time periods. Data were analyzed using the χ2 test, the student t test, and the Wilcoxon Mann-Whitney U test, with a P value set at .05 for statistical significance. SPSS version 26 and GraphPad Prism version 6 were used for all statistical analyses.
Results
A total of 34 600 endotracheal intubations were performed over the 24-month study period, and 11 345 (32.8%) were video laryngoscopy procedures. Out of all video laryngoscopy procedures, 5501 (48.5%) were performed using the McGRATH VL and 5305 (46.8%) were conducted using the GlideScope VL. The difference of 539 (4.8%) cases accounts for flexible bronchoscopy procedures and endotracheal intubations using other video laryngoscopy equipment. The mean (SD) monthly number of video laryngoscopy procedures for the 24 months was 221 (54) and 229 (89) for the GlideScope and McGRATH devices, respectively. Monthly endotracheal intubation distributions over 24 months trended upward for the McGRATH VL and downward for the GlideScope, but there was no statistically significant (P = .71) difference in overall use between the 2 instruments (Figure 1).
To examine the observed usage trends between the 2 VL during the first and last 12 months, a univariate ANOVA was conducted with the 2 time periods entered as predictors in the model. Video laryngoscopy intubations were performed (P = .001) more frequently with the GlideScope during the first 12 months; however, use of the McGRATH VL increased (P < .001) during the following 12 months compared to GlideScope. The GlideScope accounted for 54% of all VL intubations during the first 12 months, with the McGRATH accounting for 58% of all video laryngoscopy procedures for months 12 to 24. Additionally, the increase in video laryngoscopy procedures with the McGRATH during the last 3 months of the study period was despite an overall reduction in surgical volume due to the COVID-19 crisis, defined for this study as March 1, 2020, to May 31, 2020 (Figure 1). There was a statistically significant (P < .001) difference in the case distribution between use of the McGRATH and GlideScope VL for that period. The anesthesia personnel’s use of the McGRATH VL increased to 61% of all video laryngoscopy cases, compared to 37% for the GlideScope (Figure 2).
The total costs calculated for equipment, blades, and repairs are presented in Table 1 and yearly total costs are shown in Figure 3. Overall costs were $181 093 lower (55.5%) for the McGRATH VL compared to the GlideScope over the 24-month period. The mean (SD) monthly costs for GlideScope VL blades were $3837 ($1050) and $3236 ($538) for years 1 and 2, respectively, vs $1652 ($663) and $2933 ($585) for the McGRATH VL blades. Most of the total cost differences were attributed to equipment and blade purchases, which were $202 595 (65.0%) higher for the GlideScope compared to the McGRATH VL. The monthly blade costs alone were higher (P < .001) for the GlideScope over the 2-year period; however, the McGRATH VL required use of disposable stylets at a cost of $10 177 for all endotracheal intubations, compared to $700 for the GlideScope device.
An analysis was performed to determine whether costs differed between those 2 instruments during the COVID-19 period. There was a statistically significant (P < .001) difference in the case distribution between use of the McGRATH and GlideScope VLs during that period. The calculated blade cost difference for the COVID period was $128 higher for the McGRATH even though 293 more intubations were performed with that device (Table 2).
Discussion
We attempted to provide useful cost estimates by presenting pricing data reflecting the approximate cost that most large institutional anesthesia practices would incur for using those 2 specific devices and related peripherals. The main findings of our analysis showed that use of the McGRATH MAC VL resulted in a 55% cost savings compared to the GlideScope, with a similar number of cases performed with each device over the 24-month study period. We believe this represents a substantial savings to the department and institution, which has prompted internal review on the use of video laryngoscopy equipment. None of the McGRATH units failed; however, the GlideScope required 3 baton replacements.
Of note, use of the McGRATH MAC increased during the COVID-19 period, which may be explained by the fact that the operators found it to be a more portable device. Several physicians in the department commented that its smaller size made the McGRATH MAC more practical during the time when a plexiglass box was being used around the patient’s head to shield the intubator from aerosolized viral particles.
Although this study demonstrated the cost-saving value of the McGRATH over the GlideScope, a suggested next step would be to examine resource utilization related to video laryngoscopy use. The more dynamic tracking of the use of these devices should facilitate the assessment of existing related resources and decision making, to optimize the benefits of this initiative. We would anticipate reduced use of anesthesia personnel, such as technicians to assist with the management of this device which could be significant. As new respiratory viruses are appearing each year, video laryngoscopy will continue to gain increasing use in operating rooms and acute care locations. The adding of protective barriers between patients and providers calls for use of the most practical and effective VL devices, to protect personnel who are at high risk of contamination from airway secretions and aerosolized particles.9,10
The COVID-19 pandemic has demonstrated the value of anesthesiology in regards to analyzing and finding solutions to effectively manage infected patients or those suspected of infection in the perioperative environment. Inexpensive products are often avoided because cheaper devices are associated with being of lower quality. However, the association with cost and quality—and the assumption that a higher price is positively correlated with higher quality—is overall inconsistent in the medical literature.11 A more effective or higher quality treatment does not necessarily cost more and may actually end up costing less,12 as was the case in this study. We have been able to directly cut departmental expenses by using a more efficient and cost-effective device for intubations, without compromising safety and efficacy. Future studies should determine whether this significant reduction in costs from video laryngoscopy intubations with the McGRATH VL will be sustained across anesthesiology departments in the Jefferson Health Enterprise Hospitals, or other health systems, as well as its impact on workflow and personnel resources.
This analysis was restricted to one of the campuses of the Jefferson Health Enterprise. However, this is the largest anesthesia practice, encompassing several locations, which should reflect the general practice patterns across other anesthesiology departments in this large institution. The costs for the devices and peripherals may vary across anesthesia practices depending on volume and contracts negotiated with the suppliers. It was not possible to estimate this variability, which could change the total costs by a few percentage points. We recognize that there may be other costs associated with securing the McGRATH VL to prevent loss from theft or misplacement, which were not included in the study. Lastly, the inability to obtain randomized samples for the 2 groups treated with each device opens up the possibility of selection bias. There were, however, multiple intubators who were free to select 1 of the devices for endotracheal intubation, which may have reduced the effect of selection bias.
Conclusion
This study demonstrated that over a 24-month period use of the McGRATH MAC VL resulted in a cost reduction of around 55% compared to using the GlideScope for endotracheal intubation procedures performed at a major academic center. Over the first 3 months of the COVID-19 crisis, which our study included, use of the McGRATH VL increased while GlideScope use decreased. This was most likely related to the portability and smaller size of the McGRATH, which better facilitated intubations of COVID-19 patients.
Acknowledgements: The authors thank Craig Smith, Senior Anesthesia Technician, for his assistance with the cost information and excellent record-keeping related to the use of video laryngoscopes.
Corresponding author: Marc C. Torjman, PhD, Professor, Department of Anesthesiology, Sidney Kimmel Medical College at Thomas Jefferson University, 111 South 11th St, Suite G-8290, Philadelphia, PA 19107; Marc.Torjman@Jefferson.edu.
Financial disclosures: Dr. Thaler has served as a consultant for Medtronic since September 2020. He has participated in 2 webinars on the routine use of video laryngoscopy.
Funding: This study was supported by the Department of Anesthesiology at Thomas Jefferson University.
1. Channa AB. Video laryngoscopes. Saudi J Anaesth. 2011;5(4):357-359.
2. Pieters BM, Eindhoven GB, Acott C, Van Zundert AAJ. Pioneers of laryngoscopy: indirect, direct and video laryngoscopy. Anaesth Intensive Care. 2015;43(suppl):4-11.
3. Lewis SR, Butler AR, Parker J, et al. Videolaryngoscopy versus direct laryngoscopy for adult patients requiring tracheal intubation. Cochrane Database Syst Rev. 2016;11(11):CD011136.
4. Kim W, Choi HJ, Lim T, Kang BS. Can the new McGrath laryngoscope rival the GlideScope Ranger portable video laryngoscope? A randomized manikin study. Am J Emerg Med. 2014;32(10):1225-1229.
5. Kim W, Choi HJ, Lim T, et al. Is McGrath MAC better than Glidescope Ranger for novice providers in the simulated difficult airway? A randomized manikin study. Resuscitation. 2014;85(suppl 1):S32.
6. Jeon WJ, Kim KH, Yeom JH, et al. A comparison of the Glidescope to the McGrath videolaryngoscope in patients. Korean J Anesthesiol. 2011;61(1):19-23.
7. Savoldelli GL, Schiffer E, Abegg C, et al. Comparison of the Glidescope, the McGrath, the Airtraq and the Macintosh laryngoscopes in simulated difficult airways. Anaesthesia. 2008;63(12):1358-1364.
8. Savoldelli GL, Schiffer E, Abegg C, et al. Learning curves of the Glidescope, the McGrath and the Airtraq laryngoscopes: a manikin study. Eur J Anaesthesiol. 2009;26(7):554-558.
9. Schumacher J, Arlidge J, Dudley D, et al. The impact of respiratory protective equipment on difficult airway management: a randomised, crossover, simulation study. Anaesthesia. 2020;75(10):1301-1306.
10. De Jong A, Pardo E, Rolle A, et al. Airway management for COVID-19: a move towards universal videolaryngoscope? Lancet Respir Med. 2020;8(6):555.
11. Hussey PS, Wertheimer S, Mehrotra A. The association between health care quality and cost: a systematic review. Ann Intern Med. 2013;158(1):27-34.
12. Mitton C, Dionne F, Peacock S, Sheps S. Quality and cost in healthcare: a relationship worth examining. Appl Health Econ Health Policy. 2006;5(4):201-208.
Practical Application of Self-Determination Theory to Achieve a Reduction in Postoperative Hypothermia Rate: A Quality Improvement Project
From Children’s Health System of Texas, Division of Pediatric Anesthesiology, Dallas, TX (Drs. Sakhai, Bocanegra, Chandran, Kimatian, and Kiss), UT Southwestern Medical Center, Department of Anesthesiology and Pain Management, Dallas, TX (Drs. Bocanegra, Chandran, Kimatian, and Kiss), and UT Southwestern Medical Center, Department of Population and Data Sciences, Dallas, TX (Dr. Reisch).
Objective: Policy-driven changes in medical practice have long been the norm. Seldom are changes in clinical practice sought to be brought about by a person’s tendency toward growth or self‐actualization. Many hospitals have instituted hypothermia bundles to help reduce the incidence of unanticipated postoperative hypothermia. Although successful in the short-term, sustained changes are difficult to maintain. We implemented a quality-improvement project focused on addressing the affective components of self-determination theory (SDT) to create sustainable behavioral change while satisfying providers’ basic psychological needs for autonomy, competence, and relatedness.
Methods: A total of 3 Plan-Do-Study-Act (PDSA) cycles were enacted over the span of 14 months at a major tertiary care pediatric hospital to recruit and motivate anesthesia providers and perioperative team members to reduce the percentage of hypothermic postsurgical patients by 50%. As an optional initial incentive for participation, anesthesiologists would qualify for American Board of Anesthesiology Maintenance of Certification in Anesthesiology (MOCA) Part 4 Quality Improvement credits for monitoring their own temperature data and participating in project-related meetings. Providers were given autonomy to develop a personal plan for achieving the desired goals.
Results: The median rate of hypothermia was reduced from 6.9% to 1.6% in July 2019 and was reduced again in July 2020 to 1.3%, an 81% reduction overall. A low hypothermia rate was successfully maintained for at least 21 subsequent months after participants received their MOCA credits in July 2019.
Conclusions: Using an approach that focused on the elements of competency, autonomy, and relatedness central to the principles of SDT, we observed the development of a new culture of vigilance for prevention of hypothermia that successfully endured beyond the project end date.
Keywords: postoperative hypothermia; self-determination theory; motivation; quality improvement.
Perioperative hypothermia, generally accepted as a core temperature less than 36 °C in clinical practice, is a common complication in the pediatric surgical population and is associated with poor postoperative outcomes.1 Hypothermic patients may develop respiratory depression, hypoglycemia, and metabolic acidosis that may lead to decreased oxygen delivery and end organ tissue hypoxia.2-4 Other potential detrimental effects of failing to maintain normal body temperature are impaired clotting factor enzyme function and platelet dysfunction, increasing the risk for postoperative bleeding.5,6 In addition, there are financial implications when hypothermic patients require care and resources postoperatively because of delayed emergence or shivering.7
The American Society of Anesthesiologists recommends intraoperative temperature monitoring for procedures when clinically significant changes in body temperature are anticipated.8 Maintenance of normothermia in the pediatric population is especially challenging owing to a larger skin-surface area compared with body mass ratio and less subcutaneous fat content than in adults. Preventing postoperative hypothermia starts preoperatively with parental education and can be as simple as covering the child with a blanket and setting the preoperative room to an acceptably warm temperature.9,10 Intraoperatively, maintaining operating room (OR) temperatures at or above 21.1 °C and using active warming devices and radiant warmers when appropriate are important techniques to preserve the child’s body temperature.11,12
Despite the knowledge of these risks and vigilant avoidance of hypothermia, unplanned perioperative hypothermia can occur in up to 70% of surgical patients.1 Beyond the clinical benefits, as health care marches toward a value-based payment methodology, quality indicators such as avoiding hypothermia may be linked directly to payment.
Self-determination theory (SDT) was first developed in 1980 by Deci and Ryan.13 The central premise of the theory states that people develop their full potential if circumstances allow them to satisfy their basic psychological needs: autonomy, competence, and relatedness. Under these conditions, people’s natural inclination toward growth can be realized, and they are more likely to internalize external goals. Under an extrinsic reward system, motivation can waver, as people may perceive rewards as controlling.
Many institutions have implemented hypothermia bundles to help decrease the rate of hypothermic patients, but while initially successful, the effectiveness of these interventions tends to fade over time as participants settle into old, comfortable routines.14 With SDT in mind, we designed our quality-improvement (QI) project with interventions to allow clinicians autonomy without instituting rigid guidelines or punitive actions. We aimed to directly address the affective components central to motivation and engagement so that we could bring about long-term meaningful changes in our practice.
Methods
Setting
The hypothermia QI intervention was instituted at a major tertiary care children’s hospital that performs more than 40 000 pediatric general anesthetics annually. Our division of pediatric anesthesiology consists of 66 fellowship-trained pediatric anesthesiologists, 15 or more rotating trainees per month, 13 anesthesiology assistants, 15 anesthesia technicians, and more than 50 perioperative nurses.
The most frequent pediatric surgeries include, but are not limited to, general surgery, otolaryngology, urology, gastroenterology, plastic surgery, neurosurgery, and dentistry. The surgeries are conducted in the hospital’s main operative floor, which consists of 15 ORs and 2 gastroenterology procedure rooms. Although the implementation of the QI project included several operating sites, we focused on collecting temperature data from surgical patients at our main campus recovery unit. We obtained the patients’ initial temperatures upon arrival to the recovery unit from a retrospective electronic health record review of all patients who underwent anesthesia from January 2016 through April 2021.
Postoperative hypothermia was identified as an area of potential improvement after several patients were reported to be hypothermic upon arrival to the recovery unit in the later part of 2018. Further review revealed significant heterogeneity of practices and lack of standardization of patient-warming methods. By comparing the temperatures pre- and postintervention, we could measure the effectiveness of the QI initiative. Prior to the start of our project, the hypothermia rate in our patient population was not actively tracked, and the effectiveness of our variable practice was not measured.
The cutoff for hypothermia for our QI project was defined as body temperature below 36 °C, since this value has been previously used in the literature and is commonly accepted in anesthesia practice as the delineation for hypothermia in patients undergoing general anesthesia.1
Interventions
This QI project was designed and modeled after the Institute for Healthcare Improvement Model for Improvement.15 Three cycles of Plan-Do-Study-Act (PDSA) were developed and instituted over a 14-month period until December 2019 (Table 1).
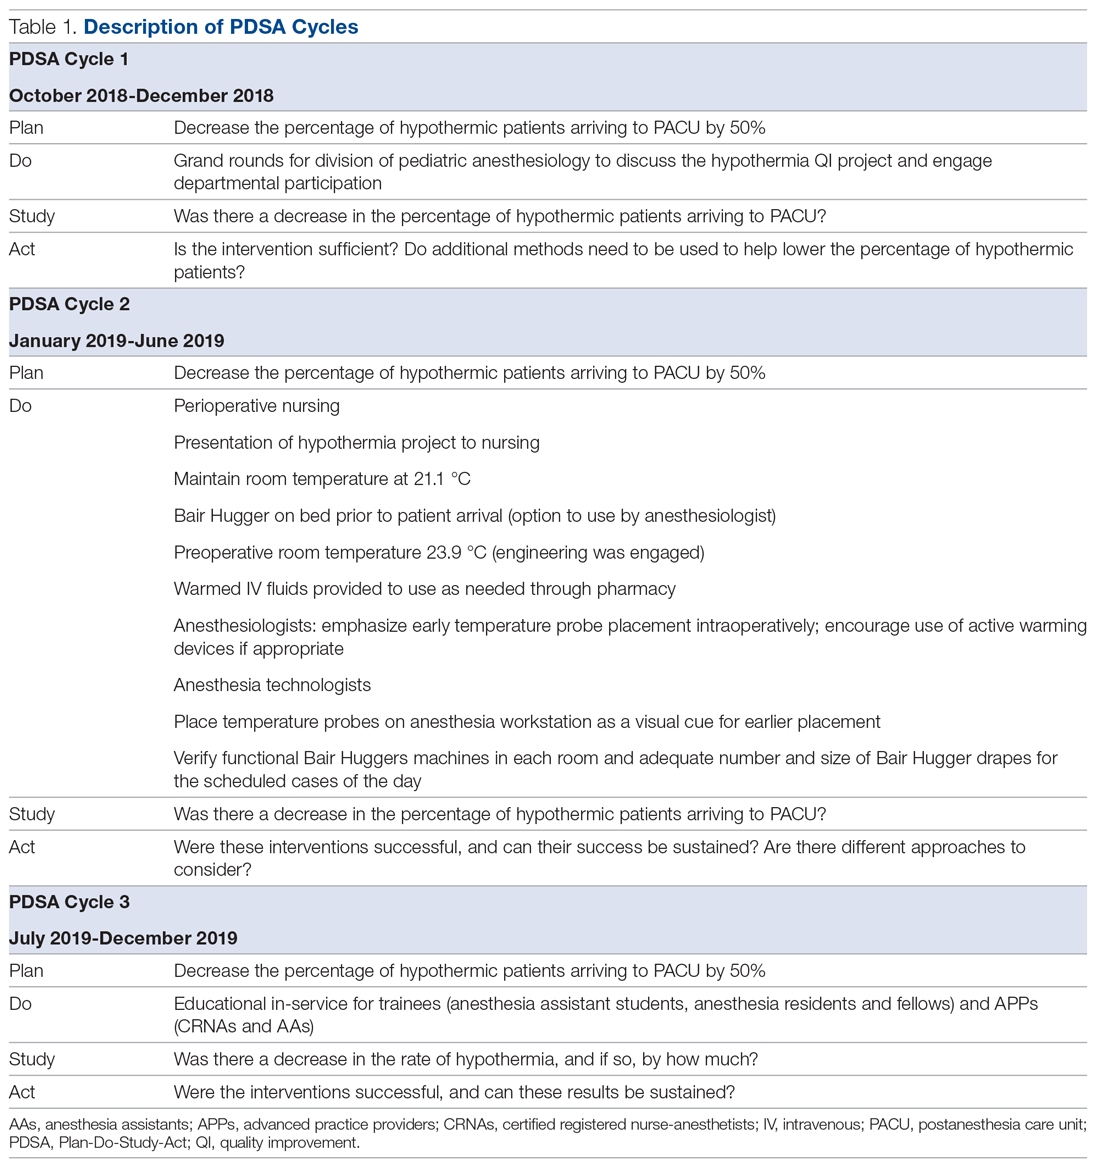
A retrospective review was conducted to determine the percentage of surgical patients arriving to our recovery units with an initial temperature reading of less than 36 °C. A project key driver diagram and smart aim were created and approved by the hospital’s continuing medical education (CME) committee for credit via the American Board of Medical Specialties (ABMS) Multi-Specialty Portfolio Program, Maintenance of Certification in Anesthesiology (MOCA) Part 4.
The first PDSA cycle involved introducing the QI project and sharing the aims of the project at a department grand rounds in the latter part of October 2018. Enrollment to participate in the project was open to all anesthesiologists in the division, and participants could earn up to 20 hours of MOCA Part 4 credits. A spreadsheet was developed and maintained to track each anesthesiologist’s monthly percentage of hypothermic patients. The de-identified patient data were shared with the division via monthly emails. In addition, individual providers with a hypothermic patient in the recovery room received a notification email.
The anesthesiologists participated in the QI project by reviewing their personal percentage of hypothermic patients on an ongoing basis to earn the credit. There was no explicit requirement to decrease their own rate of patients with body temperature less than 36 °C or expectation to achieve a predetermined goal, so the participants could not “fail.”
Because of the large interest in this project, a hypothermia committee was formed that consisted of 36 anesthesiologists. This group reviewed the data and exchanged ideas for improvement in November 2018 as part of the first PDSA cycle. The committee met monthly and was responsible for actively engaging other members of the department and perioperative staff to help in this multidisciplinary effort of combating hypothermia in our surgical pediatric population.
PDSA cycle 2 involved several major initiatives, including direct incorporation of the rest of the perioperative team. The perioperative nursing team was educated on the risks of hypothermia and engaged to take an active role by maintaining the operating suite temperature at 21.1 °C and turning on the Bair Hugger (3M) blanket to 43 °C on the OR bed prior to patient arrival to the OR. Additionally, anesthesia technicians (ATs) were tasked with ensuring an adequate supply of Bair Hugger drapes for all cases of the day. The facility’s engineering team was engaged to move the preoperative room temperature controls away from families (who frequently made the rooms cold) and instead set it at a consistent temperature of 23.9 °C. ATs were also asked to place axillary and nasal temperature probes on the anesthesia workstations as a visual reminder to facilitate temperature monitoring closer to the start of anesthesia (instead of the anesthesia provider having to remember to retrieve a temperature probe out of a drawer and place it on the patient). Furthermore, anesthesiologists were instructed via the aforementioned monthly emails and at monthly department meetings to place the temperature probes as early as possible in order to recognize and respond to intraoperative hypothermia in a timelier manner. Finally, supply chain leaders were informed of our expected increase in the use of the blankets and probes and proportionally increased ordering of these supplies to make sure availability would not present an obstacle.
In PDSA cycle 3, trainees (anesthesia assistant students, anesthesia residents and fellows) and advanced practice providers (APPs) (certified registered nurse-anesthetists [CRNAs] and certified anesthesia assistants [C-AAs]) were informed of the QI project. This initiative was guided toward improving vigilance for hypothermia in the rest of the anesthesia team members. The trainees and APPs usually set up the anesthesia area prior to patient arrival, so their recruitment in support of this effort would ensure appropriate OR temperature, active warming device deployment, and the availability and early placement of the correct temperature probe for the case. To facilitate personal accountability, the trainees and APPs were also emailed their own patients’ rate of hypothermia.
Along the course of the project, quarterly committee meetings and departmental monthly meetings served as venues to express concerns and look for areas of improvement, such as specific patterns or trends leading to hypothermic patients. One specific example was the identification of the gastrointestinal endoscopic patients having a rate of hypothermia that was 2% higher than average. Directed education on the importance of Bair Hugger blankets and using warm intravenous fluids worked well to decrease the rate of hypothermia in these patients. This collection of data was shared at regular intervals during monthly department meetings as well and more frequently using departmental emails. The hospital’s secure intranet SharePoint (Microsoft) site was used to share the data among providers.
Study of the interventions and measures
To study the effectiveness and impact of the project to motivate our anesthesiologists and other team members, we compared the first temperatures obtained in the recovery unit prior to the start of the intervention with those collected after the start of the QI project in November 2018. Because of the variability of temperature monitoring intraoperatively (nasal, axillary, rectal), we decided to use the temperature obtained by the nurse in the recovery room upon the patient’s arrival. Over the years analyzed, the nurse’s technique of measuring the temperature remained consistent. All patient temperature measurements were performed using the TAT-5000 (Exergen Corporation). This temporal artery thermometer has been previously shown to correlate well with bladder temperatures (70% of measurements differ by no more than 0.5 °C, as reported by Langham et al16).
Admittedly, we could not measure the degree of motivation or internalization of the project goals by our cohort, but we could measure the reduction in the rate of hypothermia and subjectively gauge engagement in the project by the various groups of participants and the sustainability of the results. In addition, all participating anesthesiologists received MOCA Part 4 credits in July 2019. We continued our data collection until April 2021 to determine if our project had brought about sustainable changes in practice that would continue past the initial motivator of obtaining CME credit.
Analysis
Data analysis was performed using Excel (Microsoft) and SAS, version 9.4 (SAS Institute).
The median of the monthly percentage of patients with a temperature of less than 36.0 °C was also determined for the preintervention time frame. This served as our baseline hypothermia rate, and we aimed to lower it by 50%. Run charts, a well-described methodology to gauge the effectiveness of the QI project, were constructed with the collected data.17
We performed additional analysis to adjust for different time periods throughout the year. The time period between January 2016 and October 2018 was considered preintervention. We considered November 2018 the start of our intervention, or more specifically, the start of our PDSA cycles. October 2018 was analyzed as part of the preintervention data. To account for seasonal temperature variations, the statistical analysis focused on the comparisons of the same calendar quarters for before and after starting intervention using Wilcoxon Mann-Whitney U tests. To reach an overall conclusion, the probabilities for the 4 quarters were combined for each criterion separately utilizing the Fisher χ2 combined probability method.
The hypothermia QI project was reviewed by the institutional review board and determined to be exempt.
Results
The temperatures of 40 875 patients were available for analysis for the preintervention period between January 2016 and October 2018. The median percentage of patients with temperatures less than 36.0 °C was 6.9% (interquartile range [IQR], 5.8%-8.4%). The highest percentage was in February 2016 (9.9%), and the lowest was in March 2018 (3.4%). Following the start of the first PDSA cycle, the next 6 consecutive rates of hypothermia were below the median preintervention value, and a new median for these percentages was calculated at 3.4% (IQR, 2.6%-4.3%). In July 2019, the proportion of hypothermic patients decreased once more for 6 consecutive months, yielding a new median of 1.6% (IQR, 1.2%-1.8%) and again in July 2020, to yield a median of 1.3% (IQR, 1.2%-1.5%) (Figure). In all, 33 799 patients were analyzed after the start of the project from November 2018 to the end of the data collection period through April 2021.
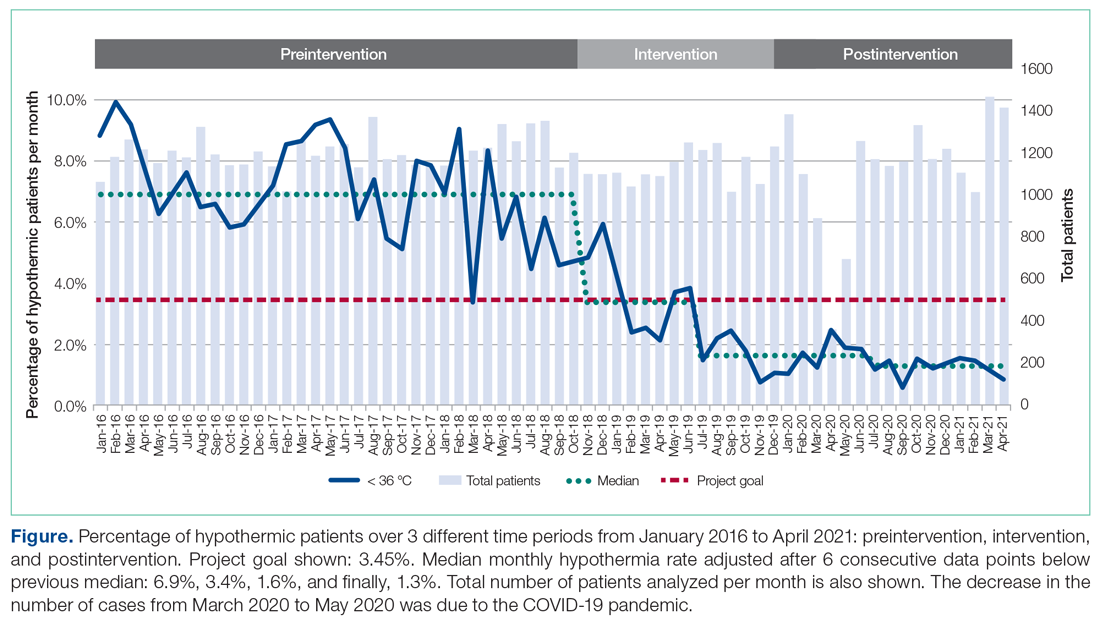
The preintervention monthly rates of hypothermia were compared, quarter to quarter, with those starting in November 2018 using the Wilcoxon Mann-Whitney U test. The decrease in proportion of hypothermic patients after the start of the intervention was statistically significant (P < .001). In addition, the percentage of patients with temperatures greater than 38 °C was not significantly different between the pre- and postintervention time periods (P < .25) (Table 2). The decrease in the number of patients available for analysis from March 2020 to May 2020 was due to the COVID-19 pandemic.
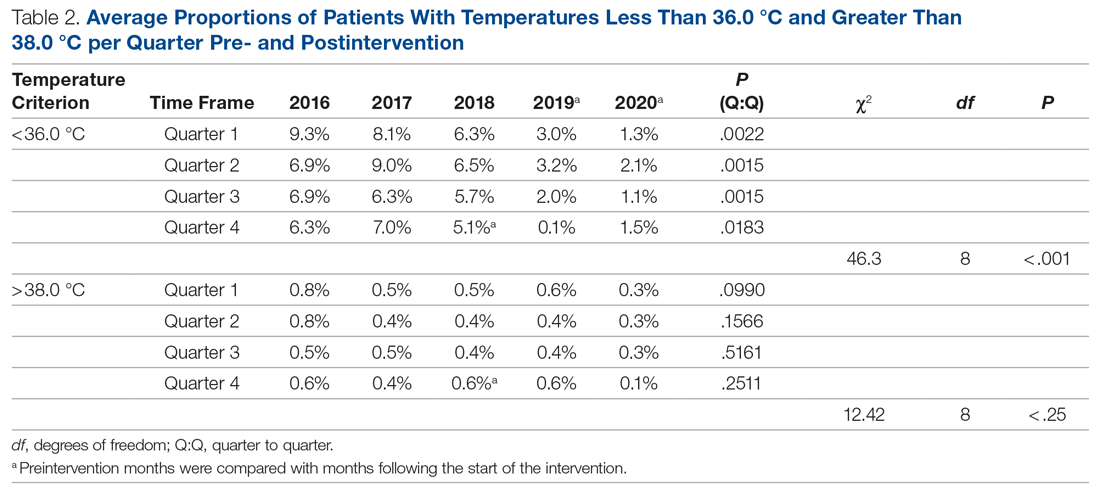
Subjectively, we did not experience any notable resistance to our efforts, and the experience was largely positive for everyone involved. Clinicians identified as having high monthly rates of hypothermia (5% or higher) corrected their numbers the following month after being notified via email or in person.
Discussion
To achieve changes in practice, the health care industry has relied on instituting guidelines, regulations, and policies, often with punitive consequences. We call into question this long-standing framework and propose a novel approach to help evolve the field of QI. Studies in human psychology have long demonstrated the demotivation power of a reward system and the negative response to attempts by authority to use incentives to control or coerce. In our QI project, we instituted 3 PDSA cycles and applied elements from SDT to motivate people’s behaviors. We demonstrate how a new culture focused on maintaining intraoperative normothermia was developed and brought about a measurable and significant decrease in the rate of hypothermia. The relevance of SDT, a widely accepted unifying theory that bridges and links social and personality psychology, should not be understated in health care. Authorities wishing to have long-standing influence should consider a person’s right to make their own decisions and, if possible, a unique way of doing things.
Positively reinforcing behavior has been shown to have a paradoxical effect by dampening an individual’s intrinsic motivation or desire to perform certain tasks.18 Deadlines, surveillance, and authoritative commands are also deterrents.19,20 We focused on providing the tools and information to the clinicians and relied on their innate need for autonomy, growth, and self-actualization to bring about change in clinical practice.21 Group meetings served as a construct for exchanging ideas and to encourage participation, but without the implementation of rigid guidelines or policies. Intraoperative active warming devices and temperature probes were made available, but their use was not mandated. The use of these devices was intentionally not audited to avoid any overbearing control. Providers were, however, given monthly temperature data to help individually assess the effectiveness of their interventions. We did not impose any negative or punitive actions for those clinicians who had high rates of hypothermic patients, and we did not reward those who had low rates of hypothermia. We wanted the participants to feel that the inner self was the source of their behavior, and this was in parallel with their own interests and values. If providers could feel their need for competency could be realized, we hoped they would continue to adhere to the measures we provided to maintain a low rate of hypothermia.
The effectiveness of our efforts was demonstrated by a decrease in the prevalence of postoperative hypothermia in our surgical patients. The initial decrease of the median rate of hypothermia from 6.9% to 3.4% occurred shortly into the start of the first PDSA cycle. The second PDSA cycle started in January 2019 with a multimodal approach and included almost all parties involved in the perioperative care of our surgical patients. Not only was this intervention responsible for a continued downward trend in the percentage of hypothermic patients, but it set the stage for the third and final PDSA cycle, which started in July 2019. The architecture was in place to integrate trainees and APPs to reinforce our initiative. Subsequently, the new median percentage of hypothermic patients was further decreased to an all-time low of 1.6% per month, satisfying and surpassing the goal of the QI project of decreasing the rate of hypothermia by only 50%. Our organization thereafter maintained a monthly hypothermia rate below 2%, except for April 2020, when it reached 2.5%. Our lowest median percentage was obtained after July 2020, reaching 1.3%.
To account for seasonal variations in temperatures and types of surgeries performed, we compared the percentage of hypothermic patients before and after the start of intervention, quarter by quarter. The decrease in the proportion of hypothermic patients after the start of intervention was statistically significant (P < .001). In addition, the data failed to prove any statistical difference for temperatures above 38 °C between the 2 periods, indicating that our interventions did not result in significant overwarming of patients. The clinical implications of decreasing the percentage of hypothermic patients from 6.9% to 1.3% is likely clinically important when considering the large number of patients who undergo surgery at large tertiary care pediatric centers. Even if simple interventions reduce hypothermia in only a handful of patients, routine applications of simple measures to keep patients normothermic is likely best clinical practice.
Anesthesiologists who participated in the hypothermia QI project by tracking the incidence of hypothermia in their patients were able to collect MOCA Part 4 credits in July 2019. There was no requirement for the individual anesthesiologist to reduce the rate of hypothermia or apply any of the encouraged strategies to obtain credit. As previously stated, there were also no rewards for obtaining low hypothermia rates for the providers. The temperature data continued to be collected through April 2021, 21 months after the credits were distributed, to demonstrate a continued, meaningful change, at least in the short-term. While the MOCA Part 4 credits likely served as an initial motivating factor to encourage participation in the QI project, they certainly were not responsible for the sustained low hypothermia rate after July 2019. We showed that the low rate of hypothermia was successfully maintained, indicating that the change in providers’ behavior was independent of the external motivator of obtaining the credit hours. Mere participation in the project by reviewing one’s temperature data was all that was required to obtain the credit. The Organismic Integration Theory, a mini-theory within SDT, best explains this phenomenon by describing any motivated behavior on a continuum ranging from controlled to autonomous.22 Do people perform the task resentfully, on their own volition because they believe it is the correct action, or somewhere in between? We explain the sustained low rates of hypothermia after the MOCA credits were distributed due to a shift to the autonomous end of the continuum with the clinician’s active willingness to meet the challenges and apply intrinsically motivated behaviors to lower the rate of hypothermia. The internalization of external motivators is difficult to prove, but the evidence supports that the methods we used to motivate individuals were effective and have resulted in a significant downward trend in our hypothermia rate.
There are several limitations to our QI project. The first involves the measuring of postoperative temperature in the recovery units. The temperatures were obtained using the same medical-grade infrared thermometer for all the patients, but other variables, such as timing and techniques, were not standardized. Secondly, overall surgical outcomes related to hypothermia were not tracked because we were unable to control for other confounding variables in our large cohort of patients, so we cannot say if the drop in the hypothermia rate had a clinically significant outcome. Thirdly, we propose that SDT offers a compellingly fitting explanation of the psychology of motivation in our efforts, but it may be possible that other theories may offer equally fitting explanations. The ability to measure the degree of motivation is lacking, and we did not explicitly ask participants what their specific source of motivation was. Aside from SDT, the reduction in hypothermia rate could also be attributed to the ease and availability of warming equipment that was made in each OR. This QI project was successfully applied to only 1 institution, so its ability to be widely applicable remains uncertain. In addition, data collection continued during the COVID-19 pandemic when case volumes decreased. However, by June 2020, the number of surgical cases at our institution had largely returned to prepandemic levels. Additional data collection beyond April 2021 would be helpful to determine if the reduction in hypothermia rates is truly sustained.
Conclusion
Overall, the importance of maintaining perioperative normothermia was well disseminated and agreed upon by all departments involved. Despite the limitations of the project, there was a significant reduction in rates of hypothermia, and sustainability of outcomes was consistently demonstrated in the poststudy period.
Using 3 cycles of the PDSA method, we successfully decreased the median rate of postoperative hypothermia in our pediatric surgical population from a preintervention value of 6.9% to 1.3%—a reduction of more than 81.2%. We provided motivation for members of our anesthesiology staff to participate by offering MOCA 2.0 Part 4 credits, but the lower rate of hypothermic patients was maintained for 15 months after the credits were distributed. Over the course of the project, there was a shift in culture, and extra vigilance was given to temperature monitoring and assessment. We attribute this sustained cultural change to the deliberate incorporation of the principles of competency, autonomy, and relatedness central to SDT to the structure of the interventions, avoiding rigid guidelines and pathways in favor of affective engagement to establish intrinsic motivation.
Acknowledgements: The authors thank Joan Reisch, PhD, for her assistance with the statistical analysis.
Corresponding author: Edgar Erold Kiss, MD, 1935 Medical District Dr, Dallas, TX 75235; edgar.kiss@UTSouthwestern.edu.
Financial disclosures: None.
1. Leslie K, Sessler DI. Perioperative hypothermia in the high-risk surgical patient. Best Pract Res Clin Anaesthesiol. 2003;17(4):485-498.
2. Sessler DI. Forced-air warming in infants and children. Paediatr Anaesth. 2013;23(6):467-468.
3. Wetzel RC. Evaluation of children. In: Longnecker DE, Tinker JH, Morgan Jr GE, eds. Principles and Practice of Anesthesiology. 2nd ed. Mosby Publishers; 1999:445-447.
4. Witt L, Dennhardt N, Eich C, et al. Prevention of intraoperative hypothermia in neonates and infants: results of a prospective multicenter observational study with a new forced-air warming system with increased warm air flow. Paediatr Anaesth. 2013;23(6):469-474.
5. Blum R, Cote C. Pediatric equipment. In: Blum R, Cote C, eds. A Practice of Anaesthesia for Infants and Children. Saunders Elsevier; 2009:1099-1101.
6. Doufas AG. Consequences of inadvertent perioperative hypothermia. Best Pract Res Clin Anaesthesiol. 2003;17(4):535-549.
7. Mahoney CB, Odom J. Maintaining intraoperative normothermia: a meta-analysis of outcomes with costs. AANA J. 1999;67(2):155-163.
8. American Society of Anesthesiologists Committee on Standards and Practice Parameters. Standards for Basic Anesthetic Monitoring. Approved by the ASA House of Delegates October 21, 1986; last amended October 20, 2010; last affirmed October 28, 2015.
9. Horn E-P, Bein B, Böhm R, et al. The effect of short time periods of pre-operative warming in the prevention of peri-operative hypothermia. Anaesthesia. 2012;67(6):612-617.
10. Andrzejowski J, Hoyle J, Eapen G, Turnbull D. Effect of prewarming on post-induction core temperature and the incidence of inadvertent perioperative hypothermia in patients undergoing general anaesthesia. Br J Anaesth. 2008;101(5):627-631.
11. Sessler DI. Complications and treatment of mild hypothermia. Anesthesiology. 2001;95(2):531-543.
12. Bräuer A, English MJM, Steinmetz N, et al. Efficacy of forced-air warming systems with full body blankets. Can J Anaesth. 2007;54(1):34-41.
13. Deci EL, Ryan RM. The “what” and “why” of goal pursuits: human needs and the self‐determination of behavior. Psychol Inquiry. 2000;11(4):227-268.
14. Al-Shamari M, Puttha R, Yuen S, et al. G9 Can introduction of a hypothermia bundle reduce hypothermia in the newborns? Arch Dis Childhood. 2019;104(suppl 2):A4.1-A4.
15. Institute for Healthcare Improvement. How to improve. Accessed May 12, 2021. http://www.ihi.org/resources/Pages/HowtoImprove/default.aspx
16. Langham GE, Meheshwari A, You J, et al. Noninvasive temperature monitoring in postanesthesia care units. Anesthesiology. 2009;111(1):90-96.
17. Perla RJ, Provost LP, Murray SK. The run chart: a simple analytical tool for learning from variation in healthcare processes. BMJ Qual Saf. 2011;20(1):46-51.
18. Deci EL. Effects of externally mediated rewards on intrinsic motivation. J Pers Soc Psychol. 1971;18(1):105-115.
19. Deci EL, Koestner R, Ryan RM. A meta-analytic review of experiments examining the effects of extrinsic rewards on intrinsic motivation. Psychol Bull. 1999;125(6):627-668.
20. Deci EL, Koestner R, Ryan RM. The undermining effect is a reality after all—extrinsic rewards, task interest, and self-determination: Reply to Eisenberger, Pierce, and Cameron (1999) and Lepper, Henderlong, and Gingras (1999). Psychol Bull. 1999;125(6):692-700.
21. Maslow A. The Farther Reaches of Human Nature. Viking Press; 1971.
22. Sheldon KM, Prentice M. Self-determination theory as a foundation for personality researchers. J Pers. 2019;87(1):5-14.
From Children’s Health System of Texas, Division of Pediatric Anesthesiology, Dallas, TX (Drs. Sakhai, Bocanegra, Chandran, Kimatian, and Kiss), UT Southwestern Medical Center, Department of Anesthesiology and Pain Management, Dallas, TX (Drs. Bocanegra, Chandran, Kimatian, and Kiss), and UT Southwestern Medical Center, Department of Population and Data Sciences, Dallas, TX (Dr. Reisch).
Objective: Policy-driven changes in medical practice have long been the norm. Seldom are changes in clinical practice sought to be brought about by a person’s tendency toward growth or self‐actualization. Many hospitals have instituted hypothermia bundles to help reduce the incidence of unanticipated postoperative hypothermia. Although successful in the short-term, sustained changes are difficult to maintain. We implemented a quality-improvement project focused on addressing the affective components of self-determination theory (SDT) to create sustainable behavioral change while satisfying providers’ basic psychological needs for autonomy, competence, and relatedness.
Methods: A total of 3 Plan-Do-Study-Act (PDSA) cycles were enacted over the span of 14 months at a major tertiary care pediatric hospital to recruit and motivate anesthesia providers and perioperative team members to reduce the percentage of hypothermic postsurgical patients by 50%. As an optional initial incentive for participation, anesthesiologists would qualify for American Board of Anesthesiology Maintenance of Certification in Anesthesiology (MOCA) Part 4 Quality Improvement credits for monitoring their own temperature data and participating in project-related meetings. Providers were given autonomy to develop a personal plan for achieving the desired goals.
Results: The median rate of hypothermia was reduced from 6.9% to 1.6% in July 2019 and was reduced again in July 2020 to 1.3%, an 81% reduction overall. A low hypothermia rate was successfully maintained for at least 21 subsequent months after participants received their MOCA credits in July 2019.
Conclusions: Using an approach that focused on the elements of competency, autonomy, and relatedness central to the principles of SDT, we observed the development of a new culture of vigilance for prevention of hypothermia that successfully endured beyond the project end date.
Keywords: postoperative hypothermia; self-determination theory; motivation; quality improvement.
Perioperative hypothermia, generally accepted as a core temperature less than 36 °C in clinical practice, is a common complication in the pediatric surgical population and is associated with poor postoperative outcomes.1 Hypothermic patients may develop respiratory depression, hypoglycemia, and metabolic acidosis that may lead to decreased oxygen delivery and end organ tissue hypoxia.2-4 Other potential detrimental effects of failing to maintain normal body temperature are impaired clotting factor enzyme function and platelet dysfunction, increasing the risk for postoperative bleeding.5,6 In addition, there are financial implications when hypothermic patients require care and resources postoperatively because of delayed emergence or shivering.7
The American Society of Anesthesiologists recommends intraoperative temperature monitoring for procedures when clinically significant changes in body temperature are anticipated.8 Maintenance of normothermia in the pediatric population is especially challenging owing to a larger skin-surface area compared with body mass ratio and less subcutaneous fat content than in adults. Preventing postoperative hypothermia starts preoperatively with parental education and can be as simple as covering the child with a blanket and setting the preoperative room to an acceptably warm temperature.9,10 Intraoperatively, maintaining operating room (OR) temperatures at or above 21.1 °C and using active warming devices and radiant warmers when appropriate are important techniques to preserve the child’s body temperature.11,12
Despite the knowledge of these risks and vigilant avoidance of hypothermia, unplanned perioperative hypothermia can occur in up to 70% of surgical patients.1 Beyond the clinical benefits, as health care marches toward a value-based payment methodology, quality indicators such as avoiding hypothermia may be linked directly to payment.
Self-determination theory (SDT) was first developed in 1980 by Deci and Ryan.13 The central premise of the theory states that people develop their full potential if circumstances allow them to satisfy their basic psychological needs: autonomy, competence, and relatedness. Under these conditions, people’s natural inclination toward growth can be realized, and they are more likely to internalize external goals. Under an extrinsic reward system, motivation can waver, as people may perceive rewards as controlling.
Many institutions have implemented hypothermia bundles to help decrease the rate of hypothermic patients, but while initially successful, the effectiveness of these interventions tends to fade over time as participants settle into old, comfortable routines.14 With SDT in mind, we designed our quality-improvement (QI) project with interventions to allow clinicians autonomy without instituting rigid guidelines or punitive actions. We aimed to directly address the affective components central to motivation and engagement so that we could bring about long-term meaningful changes in our practice.
Methods
Setting
The hypothermia QI intervention was instituted at a major tertiary care children’s hospital that performs more than 40 000 pediatric general anesthetics annually. Our division of pediatric anesthesiology consists of 66 fellowship-trained pediatric anesthesiologists, 15 or more rotating trainees per month, 13 anesthesiology assistants, 15 anesthesia technicians, and more than 50 perioperative nurses.
The most frequent pediatric surgeries include, but are not limited to, general surgery, otolaryngology, urology, gastroenterology, plastic surgery, neurosurgery, and dentistry. The surgeries are conducted in the hospital’s main operative floor, which consists of 15 ORs and 2 gastroenterology procedure rooms. Although the implementation of the QI project included several operating sites, we focused on collecting temperature data from surgical patients at our main campus recovery unit. We obtained the patients’ initial temperatures upon arrival to the recovery unit from a retrospective electronic health record review of all patients who underwent anesthesia from January 2016 through April 2021.
Postoperative hypothermia was identified as an area of potential improvement after several patients were reported to be hypothermic upon arrival to the recovery unit in the later part of 2018. Further review revealed significant heterogeneity of practices and lack of standardization of patient-warming methods. By comparing the temperatures pre- and postintervention, we could measure the effectiveness of the QI initiative. Prior to the start of our project, the hypothermia rate in our patient population was not actively tracked, and the effectiveness of our variable practice was not measured.
The cutoff for hypothermia for our QI project was defined as body temperature below 36 °C, since this value has been previously used in the literature and is commonly accepted in anesthesia practice as the delineation for hypothermia in patients undergoing general anesthesia.1
Interventions
This QI project was designed and modeled after the Institute for Healthcare Improvement Model for Improvement.15 Three cycles of Plan-Do-Study-Act (PDSA) were developed and instituted over a 14-month period until December 2019 (Table 1).
A retrospective review was conducted to determine the percentage of surgical patients arriving to our recovery units with an initial temperature reading of less than 36 °C. A project key driver diagram and smart aim were created and approved by the hospital’s continuing medical education (CME) committee for credit via the American Board of Medical Specialties (ABMS) Multi-Specialty Portfolio Program, Maintenance of Certification in Anesthesiology (MOCA) Part 4.
The first PDSA cycle involved introducing the QI project and sharing the aims of the project at a department grand rounds in the latter part of October 2018. Enrollment to participate in the project was open to all anesthesiologists in the division, and participants could earn up to 20 hours of MOCA Part 4 credits. A spreadsheet was developed and maintained to track each anesthesiologist’s monthly percentage of hypothermic patients. The de-identified patient data were shared with the division via monthly emails. In addition, individual providers with a hypothermic patient in the recovery room received a notification email.
The anesthesiologists participated in the QI project by reviewing their personal percentage of hypothermic patients on an ongoing basis to earn the credit. There was no explicit requirement to decrease their own rate of patients with body temperature less than 36 °C or expectation to achieve a predetermined goal, so the participants could not “fail.”
Because of the large interest in this project, a hypothermia committee was formed that consisted of 36 anesthesiologists. This group reviewed the data and exchanged ideas for improvement in November 2018 as part of the first PDSA cycle. The committee met monthly and was responsible for actively engaging other members of the department and perioperative staff to help in this multidisciplinary effort of combating hypothermia in our surgical pediatric population.
PDSA cycle 2 involved several major initiatives, including direct incorporation of the rest of the perioperative team. The perioperative nursing team was educated on the risks of hypothermia and engaged to take an active role by maintaining the operating suite temperature at 21.1 °C and turning on the Bair Hugger (3M) blanket to 43 °C on the OR bed prior to patient arrival to the OR. Additionally, anesthesia technicians (ATs) were tasked with ensuring an adequate supply of Bair Hugger drapes for all cases of the day. The facility’s engineering team was engaged to move the preoperative room temperature controls away from families (who frequently made the rooms cold) and instead set it at a consistent temperature of 23.9 °C. ATs were also asked to place axillary and nasal temperature probes on the anesthesia workstations as a visual reminder to facilitate temperature monitoring closer to the start of anesthesia (instead of the anesthesia provider having to remember to retrieve a temperature probe out of a drawer and place it on the patient). Furthermore, anesthesiologists were instructed via the aforementioned monthly emails and at monthly department meetings to place the temperature probes as early as possible in order to recognize and respond to intraoperative hypothermia in a timelier manner. Finally, supply chain leaders were informed of our expected increase in the use of the blankets and probes and proportionally increased ordering of these supplies to make sure availability would not present an obstacle.
In PDSA cycle 3, trainees (anesthesia assistant students, anesthesia residents and fellows) and advanced practice providers (APPs) (certified registered nurse-anesthetists [CRNAs] and certified anesthesia assistants [C-AAs]) were informed of the QI project. This initiative was guided toward improving vigilance for hypothermia in the rest of the anesthesia team members. The trainees and APPs usually set up the anesthesia area prior to patient arrival, so their recruitment in support of this effort would ensure appropriate OR temperature, active warming device deployment, and the availability and early placement of the correct temperature probe for the case. To facilitate personal accountability, the trainees and APPs were also emailed their own patients’ rate of hypothermia.
Along the course of the project, quarterly committee meetings and departmental monthly meetings served as venues to express concerns and look for areas of improvement, such as specific patterns or trends leading to hypothermic patients. One specific example was the identification of the gastrointestinal endoscopic patients having a rate of hypothermia that was 2% higher than average. Directed education on the importance of Bair Hugger blankets and using warm intravenous fluids worked well to decrease the rate of hypothermia in these patients. This collection of data was shared at regular intervals during monthly department meetings as well and more frequently using departmental emails. The hospital’s secure intranet SharePoint (Microsoft) site was used to share the data among providers.
Study of the interventions and measures
To study the effectiveness and impact of the project to motivate our anesthesiologists and other team members, we compared the first temperatures obtained in the recovery unit prior to the start of the intervention with those collected after the start of the QI project in November 2018. Because of the variability of temperature monitoring intraoperatively (nasal, axillary, rectal), we decided to use the temperature obtained by the nurse in the recovery room upon the patient’s arrival. Over the years analyzed, the nurse’s technique of measuring the temperature remained consistent. All patient temperature measurements were performed using the TAT-5000 (Exergen Corporation). This temporal artery thermometer has been previously shown to correlate well with bladder temperatures (70% of measurements differ by no more than 0.5 °C, as reported by Langham et al16).
Admittedly, we could not measure the degree of motivation or internalization of the project goals by our cohort, but we could measure the reduction in the rate of hypothermia and subjectively gauge engagement in the project by the various groups of participants and the sustainability of the results. In addition, all participating anesthesiologists received MOCA Part 4 credits in July 2019. We continued our data collection until April 2021 to determine if our project had brought about sustainable changes in practice that would continue past the initial motivator of obtaining CME credit.
Analysis
Data analysis was performed using Excel (Microsoft) and SAS, version 9.4 (SAS Institute).
The median of the monthly percentage of patients with a temperature of less than 36.0 °C was also determined for the preintervention time frame. This served as our baseline hypothermia rate, and we aimed to lower it by 50%. Run charts, a well-described methodology to gauge the effectiveness of the QI project, were constructed with the collected data.17
We performed additional analysis to adjust for different time periods throughout the year. The time period between January 2016 and October 2018 was considered preintervention. We considered November 2018 the start of our intervention, or more specifically, the start of our PDSA cycles. October 2018 was analyzed as part of the preintervention data. To account for seasonal temperature variations, the statistical analysis focused on the comparisons of the same calendar quarters for before and after starting intervention using Wilcoxon Mann-Whitney U tests. To reach an overall conclusion, the probabilities for the 4 quarters were combined for each criterion separately utilizing the Fisher χ2 combined probability method.
The hypothermia QI project was reviewed by the institutional review board and determined to be exempt.
Results
The temperatures of 40 875 patients were available for analysis for the preintervention period between January 2016 and October 2018. The median percentage of patients with temperatures less than 36.0 °C was 6.9% (interquartile range [IQR], 5.8%-8.4%). The highest percentage was in February 2016 (9.9%), and the lowest was in March 2018 (3.4%). Following the start of the first PDSA cycle, the next 6 consecutive rates of hypothermia were below the median preintervention value, and a new median for these percentages was calculated at 3.4% (IQR, 2.6%-4.3%). In July 2019, the proportion of hypothermic patients decreased once more for 6 consecutive months, yielding a new median of 1.6% (IQR, 1.2%-1.8%) and again in July 2020, to yield a median of 1.3% (IQR, 1.2%-1.5%) (Figure). In all, 33 799 patients were analyzed after the start of the project from November 2018 to the end of the data collection period through April 2021.
The preintervention monthly rates of hypothermia were compared, quarter to quarter, with those starting in November 2018 using the Wilcoxon Mann-Whitney U test. The decrease in proportion of hypothermic patients after the start of the intervention was statistically significant (P < .001). In addition, the percentage of patients with temperatures greater than 38 °C was not significantly different between the pre- and postintervention time periods (P < .25) (Table 2). The decrease in the number of patients available for analysis from March 2020 to May 2020 was due to the COVID-19 pandemic.
Subjectively, we did not experience any notable resistance to our efforts, and the experience was largely positive for everyone involved. Clinicians identified as having high monthly rates of hypothermia (5% or higher) corrected their numbers the following month after being notified via email or in person.
Discussion
To achieve changes in practice, the health care industry has relied on instituting guidelines, regulations, and policies, often with punitive consequences. We call into question this long-standing framework and propose a novel approach to help evolve the field of QI. Studies in human psychology have long demonstrated the demotivation power of a reward system and the negative response to attempts by authority to use incentives to control or coerce. In our QI project, we instituted 3 PDSA cycles and applied elements from SDT to motivate people’s behaviors. We demonstrate how a new culture focused on maintaining intraoperative normothermia was developed and brought about a measurable and significant decrease in the rate of hypothermia. The relevance of SDT, a widely accepted unifying theory that bridges and links social and personality psychology, should not be understated in health care. Authorities wishing to have long-standing influence should consider a person’s right to make their own decisions and, if possible, a unique way of doing things.
Positively reinforcing behavior has been shown to have a paradoxical effect by dampening an individual’s intrinsic motivation or desire to perform certain tasks.18 Deadlines, surveillance, and authoritative commands are also deterrents.19,20 We focused on providing the tools and information to the clinicians and relied on their innate need for autonomy, growth, and self-actualization to bring about change in clinical practice.21 Group meetings served as a construct for exchanging ideas and to encourage participation, but without the implementation of rigid guidelines or policies. Intraoperative active warming devices and temperature probes were made available, but their use was not mandated. The use of these devices was intentionally not audited to avoid any overbearing control. Providers were, however, given monthly temperature data to help individually assess the effectiveness of their interventions. We did not impose any negative or punitive actions for those clinicians who had high rates of hypothermic patients, and we did not reward those who had low rates of hypothermia. We wanted the participants to feel that the inner self was the source of their behavior, and this was in parallel with their own interests and values. If providers could feel their need for competency could be realized, we hoped they would continue to adhere to the measures we provided to maintain a low rate of hypothermia.
The effectiveness of our efforts was demonstrated by a decrease in the prevalence of postoperative hypothermia in our surgical patients. The initial decrease of the median rate of hypothermia from 6.9% to 3.4% occurred shortly into the start of the first PDSA cycle. The second PDSA cycle started in January 2019 with a multimodal approach and included almost all parties involved in the perioperative care of our surgical patients. Not only was this intervention responsible for a continued downward trend in the percentage of hypothermic patients, but it set the stage for the third and final PDSA cycle, which started in July 2019. The architecture was in place to integrate trainees and APPs to reinforce our initiative. Subsequently, the new median percentage of hypothermic patients was further decreased to an all-time low of 1.6% per month, satisfying and surpassing the goal of the QI project of decreasing the rate of hypothermia by only 50%. Our organization thereafter maintained a monthly hypothermia rate below 2%, except for April 2020, when it reached 2.5%. Our lowest median percentage was obtained after July 2020, reaching 1.3%.
To account for seasonal variations in temperatures and types of surgeries performed, we compared the percentage of hypothermic patients before and after the start of intervention, quarter by quarter. The decrease in the proportion of hypothermic patients after the start of intervention was statistically significant (P < .001). In addition, the data failed to prove any statistical difference for temperatures above 38 °C between the 2 periods, indicating that our interventions did not result in significant overwarming of patients. The clinical implications of decreasing the percentage of hypothermic patients from 6.9% to 1.3% is likely clinically important when considering the large number of patients who undergo surgery at large tertiary care pediatric centers. Even if simple interventions reduce hypothermia in only a handful of patients, routine applications of simple measures to keep patients normothermic is likely best clinical practice.
Anesthesiologists who participated in the hypothermia QI project by tracking the incidence of hypothermia in their patients were able to collect MOCA Part 4 credits in July 2019. There was no requirement for the individual anesthesiologist to reduce the rate of hypothermia or apply any of the encouraged strategies to obtain credit. As previously stated, there were also no rewards for obtaining low hypothermia rates for the providers. The temperature data continued to be collected through April 2021, 21 months after the credits were distributed, to demonstrate a continued, meaningful change, at least in the short-term. While the MOCA Part 4 credits likely served as an initial motivating factor to encourage participation in the QI project, they certainly were not responsible for the sustained low hypothermia rate after July 2019. We showed that the low rate of hypothermia was successfully maintained, indicating that the change in providers’ behavior was independent of the external motivator of obtaining the credit hours. Mere participation in the project by reviewing one’s temperature data was all that was required to obtain the credit. The Organismic Integration Theory, a mini-theory within SDT, best explains this phenomenon by describing any motivated behavior on a continuum ranging from controlled to autonomous.22 Do people perform the task resentfully, on their own volition because they believe it is the correct action, or somewhere in between? We explain the sustained low rates of hypothermia after the MOCA credits were distributed due to a shift to the autonomous end of the continuum with the clinician’s active willingness to meet the challenges and apply intrinsically motivated behaviors to lower the rate of hypothermia. The internalization of external motivators is difficult to prove, but the evidence supports that the methods we used to motivate individuals were effective and have resulted in a significant downward trend in our hypothermia rate.
There are several limitations to our QI project. The first involves the measuring of postoperative temperature in the recovery units. The temperatures were obtained using the same medical-grade infrared thermometer for all the patients, but other variables, such as timing and techniques, were not standardized. Secondly, overall surgical outcomes related to hypothermia were not tracked because we were unable to control for other confounding variables in our large cohort of patients, so we cannot say if the drop in the hypothermia rate had a clinically significant outcome. Thirdly, we propose that SDT offers a compellingly fitting explanation of the psychology of motivation in our efforts, but it may be possible that other theories may offer equally fitting explanations. The ability to measure the degree of motivation is lacking, and we did not explicitly ask participants what their specific source of motivation was. Aside from SDT, the reduction in hypothermia rate could also be attributed to the ease and availability of warming equipment that was made in each OR. This QI project was successfully applied to only 1 institution, so its ability to be widely applicable remains uncertain. In addition, data collection continued during the COVID-19 pandemic when case volumes decreased. However, by June 2020, the number of surgical cases at our institution had largely returned to prepandemic levels. Additional data collection beyond April 2021 would be helpful to determine if the reduction in hypothermia rates is truly sustained.
Conclusion
Overall, the importance of maintaining perioperative normothermia was well disseminated and agreed upon by all departments involved. Despite the limitations of the project, there was a significant reduction in rates of hypothermia, and sustainability of outcomes was consistently demonstrated in the poststudy period.
Using 3 cycles of the PDSA method, we successfully decreased the median rate of postoperative hypothermia in our pediatric surgical population from a preintervention value of 6.9% to 1.3%—a reduction of more than 81.2%. We provided motivation for members of our anesthesiology staff to participate by offering MOCA 2.0 Part 4 credits, but the lower rate of hypothermic patients was maintained for 15 months after the credits were distributed. Over the course of the project, there was a shift in culture, and extra vigilance was given to temperature monitoring and assessment. We attribute this sustained cultural change to the deliberate incorporation of the principles of competency, autonomy, and relatedness central to SDT to the structure of the interventions, avoiding rigid guidelines and pathways in favor of affective engagement to establish intrinsic motivation.
Acknowledgements: The authors thank Joan Reisch, PhD, for her assistance with the statistical analysis.
Corresponding author: Edgar Erold Kiss, MD, 1935 Medical District Dr, Dallas, TX 75235; edgar.kiss@UTSouthwestern.edu.
Financial disclosures: None.
1. Leslie K, Sessler DI. Perioperative hypothermia in the high-risk surgical patient. Best Pract Res Clin Anaesthesiol. 2003;17(4):485-498.
2. Sessler DI. Forced-air warming in infants and children. Paediatr Anaesth. 2013;23(6):467-468.
3. Wetzel RC. Evaluation of children. In: Longnecker DE, Tinker JH, Morgan Jr GE, eds. Principles and Practice of Anesthesiology. 2nd ed. Mosby Publishers; 1999:445-447.
4. Witt L, Dennhardt N, Eich C, et al. Prevention of intraoperative hypothermia in neonates and infants: results of a prospective multicenter observational study with a new forced-air warming system with increased warm air flow. Paediatr Anaesth. 2013;23(6):469-474.
5. Blum R, Cote C. Pediatric equipment. In: Blum R, Cote C, eds. A Practice of Anaesthesia for Infants and Children. Saunders Elsevier; 2009:1099-1101.
6. Doufas AG. Consequences of inadvertent perioperative hypothermia. Best Pract Res Clin Anaesthesiol. 2003;17(4):535-549.
7. Mahoney CB, Odom J. Maintaining intraoperative normothermia: a meta-analysis of outcomes with costs. AANA J. 1999;67(2):155-163.
8. American Society of Anesthesiologists Committee on Standards and Practice Parameters. Standards for Basic Anesthetic Monitoring. Approved by the ASA House of Delegates October 21, 1986; last amended October 20, 2010; last affirmed October 28, 2015.
9. Horn E-P, Bein B, Böhm R, et al. The effect of short time periods of pre-operative warming in the prevention of peri-operative hypothermia. Anaesthesia. 2012;67(6):612-617.
10. Andrzejowski J, Hoyle J, Eapen G, Turnbull D. Effect of prewarming on post-induction core temperature and the incidence of inadvertent perioperative hypothermia in patients undergoing general anaesthesia. Br J Anaesth. 2008;101(5):627-631.
11. Sessler DI. Complications and treatment of mild hypothermia. Anesthesiology. 2001;95(2):531-543.
12. Bräuer A, English MJM, Steinmetz N, et al. Efficacy of forced-air warming systems with full body blankets. Can J Anaesth. 2007;54(1):34-41.
13. Deci EL, Ryan RM. The “what” and “why” of goal pursuits: human needs and the self‐determination of behavior. Psychol Inquiry. 2000;11(4):227-268.
14. Al-Shamari M, Puttha R, Yuen S, et al. G9 Can introduction of a hypothermia bundle reduce hypothermia in the newborns? Arch Dis Childhood. 2019;104(suppl 2):A4.1-A4.
15. Institute for Healthcare Improvement. How to improve. Accessed May 12, 2021. http://www.ihi.org/resources/Pages/HowtoImprove/default.aspx
16. Langham GE, Meheshwari A, You J, et al. Noninvasive temperature monitoring in postanesthesia care units. Anesthesiology. 2009;111(1):90-96.
17. Perla RJ, Provost LP, Murray SK. The run chart: a simple analytical tool for learning from variation in healthcare processes. BMJ Qual Saf. 2011;20(1):46-51.
18. Deci EL. Effects of externally mediated rewards on intrinsic motivation. J Pers Soc Psychol. 1971;18(1):105-115.
19. Deci EL, Koestner R, Ryan RM. A meta-analytic review of experiments examining the effects of extrinsic rewards on intrinsic motivation. Psychol Bull. 1999;125(6):627-668.
20. Deci EL, Koestner R, Ryan RM. The undermining effect is a reality after all—extrinsic rewards, task interest, and self-determination: Reply to Eisenberger, Pierce, and Cameron (1999) and Lepper, Henderlong, and Gingras (1999). Psychol Bull. 1999;125(6):692-700.
21. Maslow A. The Farther Reaches of Human Nature. Viking Press; 1971.
22. Sheldon KM, Prentice M. Self-determination theory as a foundation for personality researchers. J Pers. 2019;87(1):5-14.
Many pandemic-driven changes to cancer clinical trials should remain
Many of the changes to cancer clinical trials forced through by the COVID-19 pandemic should remain, as they have made trials “more patient centered and efficient,” according to a group of thought leaders in oncology.
Among the potential improvements were more efficient study enrollment through secure electronic platforms, direct shipment of oral drugs to patients, remote assessment of adverse events, and streamlined data collection.
These changes should be implemented on a permanent basis, the group argues in a commentary published online July 21, 2021, in Cancer Discovery, a journal of the American Association for Cancer Research.
“The ability to distribute oral investigational drugs by mail to patients at their home has probably been the single most impactful change to clinical trial conduct, linked with virtual visits with patients to assess side effects and symptoms,” commented lead author Keith Flaherty, MD, who is director of clinical research at Massachusetts General Hospital, a professor at Harvard Medical School, Boston, and a member of the AACR board of directors.
“This has made it more feasible for patients for whom participation in clinical trials poses a disruption of their ability to work or provide care for family members to participate in trials,” he added in a press statement issued by the AACR.
Pandemic halted many clinical trials
A survey of cancer programs in early 2020 showed that nearly 60% halted screening and/or enrollment for at least some trials because of COVID-19.
“In the spring of 2020, clinical trial conduct halted and then restarted focusing on the bare minimum procedures that first allowed patients continued access to their experimental therapies, and then allowed clinical trial sites and sponsors to collect information on the effects of the therapies,” the authors said.
“The COVID-19–induced changes to clinical trials were a big challenge, probably the largest change in clinical trial conduct since the start of modern oncology clinical testing,” they commented.
“But it also represents an opportunity to rethink the key aspects of clinical trial conduct that are strictly necessary to reach the goal of testing the effectiveness of cancer therapies, and which others are dispensable or provide only minor additional contributions,” they added.
As previously reported at the time by this news organization, efforts to find alternative approaches to conducting trials amid the pandemic led to the emergence of a few “silver linings.”
Key adaptations made to clinical trials and highlighted by the authors include:
- Uptake of remote consenting and telemedicine
- Use of alternative laboratories and imaging centers
- Delivery or administration of investigational drugs at patients’ homes or local clinics
- Commercial attainment of study drugs already approved for other indications
Indeed, the restrictions encountered during the pandemic underscore the importance of designing patient-centered trials versus study site–centered trials, added Antoni Ribas, MD, commentary coauthor and immediate past president of the AACR.
Many of the changes implemented during the pandemic could help increase access for patients living in underserved communities who are underrepresented in clinical trials, he explained.
Harnessing the lessons learned
The authors also recommended the following additional adaptations, which they believe will enhance efficiency and further expand access to clinical trials:
- Incorporating patient-reported outcomes and alternative endpoints in efficacy assessments
- Aiming for 100% remote drug infusions and monitoring
- Increasing funding for clinical trials conducted in underserved communities
- Expanding clinical trial eligibility to include patients with a wide range of comorbidities
- Reducing collection of low-grade adverse events and allowing minor protocol deviations
The group’s recommendations are based on discussions by the AACR COVID-19 and Cancer Task Force, in which they participated.
The American Society of Clinical Oncology is also working to leverage pandemic-related lessons to streamline care and trial planning.
ASCO’s “Road to Recovery” recommendations, published in December 2020, aim to “ensure lessons learned from the COVID-19 experience are used to craft a more equitable, accessible, and efficient clinical research system that protects patient safety, ensures scientific integrity, and maintains data quality,” the authors explained.
Dr. Flaherty and colleagues further underscore the importance of focusing on improvements going forward.
“Guided by lessons learned, many of the remote assessments and trial efficiencies deployed during the pandemic can be preserved and improved upon. We strongly encourage use of these streamlined procedures where appropriate in future prospectively designed cancer clinical trials,” they wrote.
Dr. Flaherty reported receiving personal fees from numerous pharmaceutical companies. Dr. Ribas reported receiving grants from Agilent and Bristol Myers Squibb.
A version of this article first appeared on Medscape.com.