User login
Meet the JCOM Author with Dr. Barkoudah: Teaching Quality Improvement to Internal Medicine Residents

FDA wants annual COVID boosters, just like annual flu shots
The U.S. Food and Drug Administration is suggesting a single annual shot. The formulation would be selected in June targeting the most threatening COVID-19 strains, and then people could get a shot in the fall when people begin spending more time indoors and exposure increases.
Some people, such as those who are older or immunocompromised, may need more than one dose.
A national advisory committee is expected to vote on the proposal at a meeting Jan. 26.
People in the United States have been much less likely to get an updated COVID-19 booster shot, compared with widespread uptake of the primary vaccine series. In its proposal, the FDA indicated it hoped a single annual shot would overcome challenges created by the complexity of the process – both in messaging and administration – attributed to that low booster rate. Nine in 10 people age 12 or older got the primary vaccine series in the United States, but only 15% got the latest booster shot for COVID-19.
About half of children and adults in the U.S. get an annual flu shot, according to Centers for Disease Control and Prevention data.
The FDA also wants to move to a single COVID-19 vaccine formulation that would be used for primary vaccine series and for booster shots.
COVID-19 cases, hospitalizations, and deaths are trending downward, according to the data tracker from the New York Times. Cases are down 28%, with 47,290 tallied daily. Hospitalizations are down 22%, with 37,474 daily. Deaths are down 4%, with an average of 489 per day as of Jan. 22.
A version of this article originally appeared on WebMD.com.
Development of a Safety Awards Program at a Veterans Affairs Health Care System: A Quality Improvement Initiative
ABSTRACT
Objective: Promoting a culture of safety is a critical component of improving health care quality. Recognizing staff who stop the line for safety can positively impact the growth of a culture of safety. The purpose of this initiative was to demonstrate to staff the importance of speaking up for safety and being acknowledged for doing so.
Methods: Following a review of the literature on safety awards programs and their role in promoting a culture of safety in health care covering the period 2017 to 2020, a formal process was developed and implemented to disseminate safety awards to employees.
Results: During the initial 18 months of the initiative, a total of 59 awards were presented. The awards were well received by the recipients and other staff members. Within this period, adjustments were made to enhance the scope and reach of the program.
Conclusion: Recognizing staff behaviors that support a culture of safety is important for improving health care quality and employee engagement. Future research should focus on a formal evaluation of the impact of safety awards programs on patient safety outcomes.
Keywords: patient safety, culture of safety, incident reporting, near miss.
A key aspect of improving health care quality is promoting and sustaining a culture of safety in the workplace. Improving the quality of health care services and systems involves making informed choices regarding the types of strategies to implement.1 An essential aspect of supporting a safety culture is safety-event reporting. To approach the goal of zero harm, all safety events, whether they result in actual harm or are considered near misses, need to be reported. Near-miss events are errors that occur while care is being provided but are detected and corrected before harm reaches the patient.1-3 Near-miss reporting plays a critical role in helping to identify and correct weaknesses in health care delivery systems and processes.4 However, evidence shows that there are a multitude of barriers to the reporting of near-miss events, such as fear of punitive actions, additional workload, unsupportive work environments, a culture with poor psychological safety, knowledge deficit, and lack of recognition of staff who do report near misses.4-11
According to The Joint Commission (TJC), acknowledging health care team members who recognize and report unsafe conditions that provide insight for improving patient safety is a key method for promoting the reporting of near-miss events.6 As a result, some health care organizations and patient safety agencies have started to institute some form of recognition for their employees in the realm of safety.8-10 The Pennsylvania Patient Safety Authority offers exceptional guidance for creating a safety awards program to promote a culture of safety.12 Furthermore, TJC supports recognizing individuals and health care teams who identify and report near misses, or who have suggestions for initiatives to promote patient safety, with “good catch” awards. Individuals or teams working to promote and sustain a culture of safety should be recognized for their efforts. Acknowledging “good catches” to reward the identification, communication, and resolution of safety issues is an effective strategy for improving patient safety and health care quality.6,8
This quality improvement (QI) initiative was undertaken to demonstrate to staff that, in building an organizational culture of safety, it is important that staff be encouraged to speak up for safety and be acknowledged for doing so. If health care organizations want staff to be motivated to report near misses and improve safety and health care quality, the culture needs to shift from focusing on blame to incentivizing individuals and teams to speak up when they have concerns.8-10 Although deciding which safety actions are worthy of recognition can be challenging, recognizing all safe acts, regardless of how big or small they are perceived to be, is important. This QI initiative aimed to establish a tiered approach to recognize staff members for various categories of safety acts.
METHODS
A review of the literature from January 2017 to May 2020 for peer-reviewed publications regarding how other organizations implemented safety award programs to promote a culture of safety resulted in a dearth of evidence. This prompted us at the Veterans Affairs Connecticut Healthcare System to develop and implement a formal program to disseminate safety awards to employees.
Program Launch and Promotion
In 2020, our institution embarked on a journey to high reliability with the goal of approaching zero harm. As part of efforts to promote a culture of safety, the hospital’s High Reliability Organization (HRO) team worked to develop a safety awards recognition program. Prior to the launch, the hospital’s patient safety committee recognized staff members through the medical center safety event reporting system (the Joint Patient Safety Reporting system [JPSR]) or through direct communication with staff members on safety actions they were engaged in. JPSR is the Veterans Health Administration National Center for Patient Safety incident reporting system for reporting, tracking, and trending of patient incidents in a national database. The award consisted of a certificate presented by the patient safety committee chairpersons to the employee in front of their peers in their respective work area. Hospital leadership was not involved in the safety awards recognition program at that time. No nomination process existed prior to our QI launch.
Once the QI initiative was launched and marketed heavily at staff meetings, we started to receive nominations for actions that were truly exceptional, while many others were submitted for behaviors that were within the day-to-day scope of practice of the staff member. For those early nominations that did not meet criteria for an award, we thanked staff for their submissions with a gentle statement that their nomination did not meet the criteria for an award. After following this practice for a few weeks, we became concerned that if we did not acknowledge the staff who came forward to request recognition for their routine work that supported safety, we could risk losing their engagement in a culture of safety. As such, we decided to create 3 levels of awards to recognize behaviors that went above and beyond while also acknowledging staff for actions within their scope of practice. Additionally, hospital leadership wanted to ensure that all staff recognize that their safety efforts are valued by leadership and that that sense of value will hopefully contribute to a culture of safety over time.
Initially, the single award system was called the “Good Catch Award” to acknowledge staff who go above and beyond to speak up and take action when they have safety concerns. This particular recognition includes a certificate, an encased baseball card that has been personalized by including the staff member’s picture and safety event identified, a stress-release baseball, and a stick of Bazooka gum (similar to what used to come in baseball cards packs). The award is presented to employees in their work area by the HRO and patient safety teams and includes representatives from the executive leadership team (ELT). The safety event identified is described by an ELT member, and all items are presented to the employee. Participation by the leadership team communicates how much the work being done to promote a culture of safety and advance quality health care is appreciated. This action also encourages others in the organization to identify and report safety concerns.13
With the rollout of the QI initiative, the volume of nominations submitted quickly increased (eg, approximately 1 every 2 months before to 3 per month following implementation). Frequently, nominations were for actions believed to be within the scope of the employee’s responsibilities. Our institution’s leadership team quickly recognized that, as an organization, not diminishing the importance of the “Good Catch Award” was important. However, the
The original Good Catch Award was labelled as a Level 1 award. The Level 2 safety recognition award, named the HRO Safety Champion Award, is given to employees who stop the line for a safety concern within their scope of practice and also participate as part of a team to investigate and improve processes to avoid recurring safety concerns in the future. For the Level Two award, a certificate is presented to an employee by the hospital’s HRO lead, HRO physician champion, patient safety manager, immediate supervisor, and peers. With the Level 3 award, the Culture of Safety Appreciation Award, individuals are recognized for addressing safety concerns within their assigned scope of responsibilities. Recognition is bestowed by an email of appreciation sent to the employee, acknowledging their commitment to promoting a culture of safety and quality health care. The recipient’s direct supervisor and other hospital leaders are copied on the message.14 See Table 1 for a

Our institution’s HRO and patient safety teams utilized many additional venues to disseminate information regarding awardees and their actions. These included our monthly HRO newsletter, monthly safety forums, and biweekly Team Connecticut Healthcare system-wide huddles.
Nomination Process
Awards nominations are submitted via the hospital intranet homepage, where there is an “HRO Safety Award Nomination” icon. Once a staff member clicks the icon, a template opens asking for information, such as the reason for the nomination submission, and then walks them through the template using the CAR (C-context, A-actions, and R-results)15 format for describing the situation, identifying actions taken, and specifying the outcome of the action. Emails with award nominations can also be sent to the HRO lead, HRO champion, or Patient Safety Committee co-chairs. Calls for nominations are made at several venues attended by employees as well as supervisors. These include monthly safety forums, biweekly Team Connecticut Healthcare system-wide huddles, supervisory staff meetings, department and unit-based staff meetings, and many other formal and informal settings. This QI initiative has allowed us to capture potential awardees through several avenues, including self-nominations. All nominations are reviewed by a safety awards committee. Each committee member ranks the nomination as a Level 1, 2, or 3 award. For nominations where conflicting scores are obtained, the committee discusses the nomination together to resolve discrepancies.
Needed Resources
Material resources required for this QI initiative include certificate paper, plastic baseball card sleeves, stress-release baseballs, and Bazooka gum. The largest resource investment was the time needed to support the initiative. This included the time spent scheduling the Level 1 and 2 award presentations with staff and leadership. Time was also required to put the individual award packages together, which included printing the paper certificates, obtaining awardee pictures, placing them with their safety stories in a plastic baseball card sleeve, and arranging for the hospital photographer to take pictures of the awardees with their peers and leaders.
RESULTS
Prior to this QI initiative launch, 14 awards were given out over the preceding 2-year period. During the initial 18 months of the initiative (December 2020 to June 2022), 59 awards were presented (Level 1, n = 26; Level 2, n = 22; and Level 3, n = 11). Looking further into the Level 1 awards presented, 25 awardees worked in clinical roles and 1 in a nonclinical position (Table 2). The awardees represented multidisciplinary areas, including medical/surgical (med/surg) inpatient units, anesthesia, operating room, pharmacy, mental health clinics, surgical intensive care, specialty care clinics, and nutrition and food services. With the Level 2 awards, 18 clinical staff and 4 nonclinical staff received awards from the areas of med/surg inpatient, outpatient surgical suites, the medical center director’s office, radiology, pharmacy, primary care, facilities management, environmental management, infection prevention, and emergency services. All Level 3 awardees were from clinical areas, including primary care, hospital education, sterile processing, pharmacies, operating rooms, and med/surg inpatient units.

With the inception of this QI initiative, our organization has begun to see trends reflecting increased reporting of both actual and close-call events in JPSR (Figure 1). 
With the inclusion of information regarding awardees and their actions in monthly safety forums, attendance at these forums has increased from an average of 64 attendees per month in 2021 to an average of 131 attendees per month in 2022 (Figure 2).

Finally, our organization’s annual All-Employee Survey results have shown incremental increases in staff reporting feeling psychologically safe and not fearing reprisal (Figure 3). It is important to note that there may be other contributing factors to these incremental changes.

Level 1 – Good Catch Award. M.S. was assigned as a continuous safety monitor, or “sitter,” on one of the med/surg inpatient units. M.S. arrived at the bedside and asked for a report on the patient at a change in shift. The report stated that the patient was sleeping and had not moved in a while. M.S. set about to perform the functions of a sitter and did her usual tasks in cleaning and tidying the room for the patient for breakfast and taking care of all items in the room, in general. M.S. introduced herself to the patient, who she thought might wake up because of her speaking to him. She thought the patient was in an odd position, and knowing that a patient should be a little further up in the bed, she tried with touch to awaken him to adjust his position. M.S. found that the patient was rather chilly to the touch and immediately became concerned. She continued to attempt to rouse the patient. M.S. called for the nurse and began to adjust the patient’s position. M.S. insisted that the patient was cold and “something was wrong.” A set of vitals was taken and a rapid response team code was called. The patient was immediately transferred to the intensive care unit to receive a higher level of care. If not for the diligence and caring attitude of M.S., this patient may have had a very poor outcome.
Reason for criteria being met: The scope of practice of a sitter is to be present in a patient’s room to monitor for falls and overall safety. This employee noticed that the patient was not responsive to verbal or tactile stimuli. Her immediate reporting of her concern to the nurse resulted in prompt intervention. If she had let the patient be, the patient could have died. The staff member went above and beyond by speaking up and taking action when she had a patient safety concern.
Level 2 – HRO Safety Champion Award. A patient presented to an outpatient clinic for monoclonal antibody (mAb) therapy for a COVID-19 infection; the treatment has been scheduled by the patient’s primary care provider. At that time, outpatient mAb therapy was the recommended care option for patients stable enough to receive treatment in this setting, but it is contraindicated in patients who are too unstable to receive mAb therapy in an outpatient setting, such as those with increased oxygen demands. R.L., a staff nurse, assessed the patient on arrival and found that his vital signs were stable, except for a slightly elevated respiratory rate. Upon questioning, the patient reported that he had increased his oxygen use at home from 2 to 4 L via a nasal cannula. R.L. assessed that the patient was too high-risk for outpatient mAb therapy and had the patient checked into the emergency department (ED) to receive a full diagnostic workup and evaluation by Dr. W., an ED provider. The patient required admission to the hospital for a higher level of care in an inpatient unit because of severe COVID-19 infection. Within 48 hours of admission, the patient’s condition further declined, requiring an upgrade to the medical intensive care unit with progressive interventions. Owing to the clinical assessment skills and prompt action of R.L., the patient was admitted to the hospital instead of receiving treatment in a suboptimal care setting and returning home. Had the patient gone home, his rapid decline could have had serious consequences.
Reason for criteria being met: On a cursory look, the patient may have passed as someone sufficiently stable to undergo outpatient treatment. However, the nurse stopped the line, paid close attention, and picked up on an abnormal vital sign and the projected consequences. The nurse brought the patient to a higher level of care in the ED so that he could get the attention he needed. If this patient was given mAb therapy in the outpatient setting, he would have been discharged and become sicker with the COVID-19 illness. As a result of this incident, R.L. is working with the outpatient clinic and ED staff to enahance triage and evaluation of patients referred for outpatient therapy for COVID-19 infections to prevent a similar event from recurring.
Level 3 – Culture of Safety Appreciation Award. While C.C. was reviewing the hazardous item
Reason for criteria being met: The employee works in the hospital education department. It is within her scope of responsibilities to provide ongoing education to staff in order to address potential safety concerns.
DISCUSSION
This QI initiative was undertaken to demonstrate to staff that, in building an organizational culture of safety and advancing quality health care, it is important that staff be encouraged to speak up for safety and be acknowledged for doing so. As part of efforts to continuously build on a safety-first culture, transparency and celebration of successes were demonstrated. This QI initiative demonstrated that a diverse and wide range of employees were reached, from clinical to nonclinical staff, and frontline to supervisory staff, as all were included in the recognition process. While many award nominations were received through the submission of safety concerns to the high-reliability team and patient safety office, several came directly from staff who wanted to recognize their peers for their work, supporting a culture of safety. This showed that staff felt that taking the time to submit a write-up to recognize a peer was an important task. Achieving zero harm for patients and staff alike is a top priority for our institution and guides all decisions, which reinforces that everyone has a responsibility to ensure that safety is always the first consideration. A culture of safety is enhanced by staff recognition. This QI initiative also showed that staff felt valued when they were acknowledged, regardless of the level of recognition they received. The theme of feeling valued came from unsolicited feedback. For example, some direct comments from awardees are presented in the Box.

In addition to endorsing the importance of safe practices to staff, safety award programs can identify gaps in existing standard procedures that can be updated quickly and shared broadly across a health care organization. The authors observed that the existence of the award program gives staff permission to use their voice to speak up when they have questions or concerns related to safety and to proactively engage in safety practices; a cultural shift of this kind informs safety practices and procedures and contributes to a more inspiring workplace. Staff at our organization who have received any of the safety awards, and those who are aware of these awards, have embraced the program readily. At the time of submission of this manuscript, there was a relative paucity of published literature on the details, performance, and impact of such programs. This initiative aims to share a road map highlighting the various dimensions of staff recognition and how the program supports our health care system in fostering a strong, sustainable culture of safety and health care quality. A next step is to formally assess the impact of the awards program on our culture of safety and quality using a psychometrically sound measurement tool, as recommended by TJC,16 such as the
CONCLUSION
A health care organization safety awards program is a strategy for building and sustaining a culture of safety. This QI initiative may be valuable to other organizations in the process of establishing a safety awards program of their own. Future research should focus on a formal evaluation of the impact of safety awards programs on patient safety outcomes.
Corresponding author: John S. Murray, PhD, MPH, MSGH, RN, FAAN, 20 Chapel Street, Unit A502, Brookline, MA 02446; JMurray325@aol.com
Disclosures: None reported.
1. National Center for Biotechnology Information. Improving healthcare quality in Europe: Characteristics, effectiveness and implementation of different strategies. National Library of Medicine; 2019.
2.
3. Agency for Healthcare Research and Quality. Implementing near-miss reporting and improvement tracking in primary care practices: lessons learned. Agency for Healthcare Research and Quality; 2017.
4. Hamed M, Konstantinidis S. Barriers to incident reporting among nurses: a qualitative systematic review. West J Nurs Res. 2022;44(5):506-523. doi:10.1177/0193945921999449
5. Mohamed M, Abubeker IY, Al-Mohanadi D, et al. Perceived barriers of incident reporting among internists: results from Hamad medical corporation in Qatar. Avicenna J Med. 2021;11(3):139-144. doi:10.1055/s-0041-1734386
6. The Joint Commission. The essential role of leadership in developing a safety culture. The Joint Commission; 2017.
7. Yali G, Nzala S. Healthcare providers’ perspective on barriers to patient safety incident reporting in Lusaka District. J Prev Rehabil Med. 2022;4:44-52. doi:10.21617/jprm2022.417
8. Herzer KR, Mirrer M, Xie Y, et al. Patient safety reporting systems: sustained quality improvement using a multidisciplinary team and “good catch” awards. Jt Comm J Qual Patient Saf. 2012;38(8):339-347. doi:10.1016/s1553-7250(12)38044-6
9. Rogers E, Griffin E, Carnie W, et al. A just culture approach to managing medication errors. Hosp Pharm. 2017;52(4):308-315. doi:10.1310/hpj5204-308
10. Murray JS, Clifford J, Larson S, et al. Implementing just culture to improve patient safety. Mil Med. 2022;0: 1. doi:10.1093/milmed/usac115
11. Paradiso L, Sweeney N. Just culture: it’s more than policy. Nurs Manag. 2019;50(6):38–45. doi:10.1097/01.NUMA.0000558482.07815.ae
12. Wallace S, Mamrol M, Finley E; Pennsylvania Patient Safety Authority. Promote a culture of safety with good catch reports. PA Patient Saf Advis. 2017;14(3).
13. Tan KH, Pang NL, Siau C, et al: Building an organizational culture of patient safety. J Patient Saf Risk Manag. 2019;24:253-261. doi.10.1177/251604351987897
14. Merchant N, O’Neal J, Dealino-Perez C, et al: A high reliability mindset. Am J Med Qual. 2022;37(6):504-510. doi:10.1097/JMQ.0000000000000086
15. Behavioral interview questions and answers. Hudson. Accessed December 23, 2022. https://au.hudson.com/insights/career-advice/job-interviews/behavioural-interview-questions-and-answers/
16. The Joint Commission. Safety culture assessment: Improving the survey process. Accessed December 26, 2022. https://www.jointcommission.org/-/media/tjc/documents/accred-and-cert/safety_culture_assessment_improving_the_survey_process.pdf
17. Reis CT, Paiva SG, Sousa P. The patient safety culture: a systematic review by characteristics of hospital survey on patient safety culture dimensions. Int J Qual Heal Care. 2018;30(9):660-677. doi:10.1093/intqhc/mzy080
18. Fourar YO, Benhassine W, Boughaba A, et al. Contribution to the assessment of patient safety culture in Algerian healthcare settings: the ASCO project. Int J Healthc Manag. 2022;15:52-61. doi.org/10.1080/20479700.2020.1836736
ABSTRACT
Objective: Promoting a culture of safety is a critical component of improving health care quality. Recognizing staff who stop the line for safety can positively impact the growth of a culture of safety. The purpose of this initiative was to demonstrate to staff the importance of speaking up for safety and being acknowledged for doing so.
Methods: Following a review of the literature on safety awards programs and their role in promoting a culture of safety in health care covering the period 2017 to 2020, a formal process was developed and implemented to disseminate safety awards to employees.
Results: During the initial 18 months of the initiative, a total of 59 awards were presented. The awards were well received by the recipients and other staff members. Within this period, adjustments were made to enhance the scope and reach of the program.
Conclusion: Recognizing staff behaviors that support a culture of safety is important for improving health care quality and employee engagement. Future research should focus on a formal evaluation of the impact of safety awards programs on patient safety outcomes.
Keywords: patient safety, culture of safety, incident reporting, near miss.
A key aspect of improving health care quality is promoting and sustaining a culture of safety in the workplace. Improving the quality of health care services and systems involves making informed choices regarding the types of strategies to implement.1 An essential aspect of supporting a safety culture is safety-event reporting. To approach the goal of zero harm, all safety events, whether they result in actual harm or are considered near misses, need to be reported. Near-miss events are errors that occur while care is being provided but are detected and corrected before harm reaches the patient.1-3 Near-miss reporting plays a critical role in helping to identify and correct weaknesses in health care delivery systems and processes.4 However, evidence shows that there are a multitude of barriers to the reporting of near-miss events, such as fear of punitive actions, additional workload, unsupportive work environments, a culture with poor psychological safety, knowledge deficit, and lack of recognition of staff who do report near misses.4-11
According to The Joint Commission (TJC), acknowledging health care team members who recognize and report unsafe conditions that provide insight for improving patient safety is a key method for promoting the reporting of near-miss events.6 As a result, some health care organizations and patient safety agencies have started to institute some form of recognition for their employees in the realm of safety.8-10 The Pennsylvania Patient Safety Authority offers exceptional guidance for creating a safety awards program to promote a culture of safety.12 Furthermore, TJC supports recognizing individuals and health care teams who identify and report near misses, or who have suggestions for initiatives to promote patient safety, with “good catch” awards. Individuals or teams working to promote and sustain a culture of safety should be recognized for their efforts. Acknowledging “good catches” to reward the identification, communication, and resolution of safety issues is an effective strategy for improving patient safety and health care quality.6,8
This quality improvement (QI) initiative was undertaken to demonstrate to staff that, in building an organizational culture of safety, it is important that staff be encouraged to speak up for safety and be acknowledged for doing so. If health care organizations want staff to be motivated to report near misses and improve safety and health care quality, the culture needs to shift from focusing on blame to incentivizing individuals and teams to speak up when they have concerns.8-10 Although deciding which safety actions are worthy of recognition can be challenging, recognizing all safe acts, regardless of how big or small they are perceived to be, is important. This QI initiative aimed to establish a tiered approach to recognize staff members for various categories of safety acts.
METHODS
A review of the literature from January 2017 to May 2020 for peer-reviewed publications regarding how other organizations implemented safety award programs to promote a culture of safety resulted in a dearth of evidence. This prompted us at the Veterans Affairs Connecticut Healthcare System to develop and implement a formal program to disseminate safety awards to employees.
Program Launch and Promotion
In 2020, our institution embarked on a journey to high reliability with the goal of approaching zero harm. As part of efforts to promote a culture of safety, the hospital’s High Reliability Organization (HRO) team worked to develop a safety awards recognition program. Prior to the launch, the hospital’s patient safety committee recognized staff members through the medical center safety event reporting system (the Joint Patient Safety Reporting system [JPSR]) or through direct communication with staff members on safety actions they were engaged in. JPSR is the Veterans Health Administration National Center for Patient Safety incident reporting system for reporting, tracking, and trending of patient incidents in a national database. The award consisted of a certificate presented by the patient safety committee chairpersons to the employee in front of their peers in their respective work area. Hospital leadership was not involved in the safety awards recognition program at that time. No nomination process existed prior to our QI launch.
Once the QI initiative was launched and marketed heavily at staff meetings, we started to receive nominations for actions that were truly exceptional, while many others were submitted for behaviors that were within the day-to-day scope of practice of the staff member. For those early nominations that did not meet criteria for an award, we thanked staff for their submissions with a gentle statement that their nomination did not meet the criteria for an award. After following this practice for a few weeks, we became concerned that if we did not acknowledge the staff who came forward to request recognition for their routine work that supported safety, we could risk losing their engagement in a culture of safety. As such, we decided to create 3 levels of awards to recognize behaviors that went above and beyond while also acknowledging staff for actions within their scope of practice. Additionally, hospital leadership wanted to ensure that all staff recognize that their safety efforts are valued by leadership and that that sense of value will hopefully contribute to a culture of safety over time.
Initially, the single award system was called the “Good Catch Award” to acknowledge staff who go above and beyond to speak up and take action when they have safety concerns. This particular recognition includes a certificate, an encased baseball card that has been personalized by including the staff member’s picture and safety event identified, a stress-release baseball, and a stick of Bazooka gum (similar to what used to come in baseball cards packs). The award is presented to employees in their work area by the HRO and patient safety teams and includes representatives from the executive leadership team (ELT). The safety event identified is described by an ELT member, and all items are presented to the employee. Participation by the leadership team communicates how much the work being done to promote a culture of safety and advance quality health care is appreciated. This action also encourages others in the organization to identify and report safety concerns.13
With the rollout of the QI initiative, the volume of nominations submitted quickly increased (eg, approximately 1 every 2 months before to 3 per month following implementation). Frequently, nominations were for actions believed to be within the scope of the employee’s responsibilities. Our institution’s leadership team quickly recognized that, as an organization, not diminishing the importance of the “Good Catch Award” was important. However, the
The original Good Catch Award was labelled as a Level 1 award. The Level 2 safety recognition award, named the HRO Safety Champion Award, is given to employees who stop the line for a safety concern within their scope of practice and also participate as part of a team to investigate and improve processes to avoid recurring safety concerns in the future. For the Level Two award, a certificate is presented to an employee by the hospital’s HRO lead, HRO physician champion, patient safety manager, immediate supervisor, and peers. With the Level 3 award, the Culture of Safety Appreciation Award, individuals are recognized for addressing safety concerns within their assigned scope of responsibilities. Recognition is bestowed by an email of appreciation sent to the employee, acknowledging their commitment to promoting a culture of safety and quality health care. The recipient’s direct supervisor and other hospital leaders are copied on the message.14 See Table 1 for a
Our institution’s HRO and patient safety teams utilized many additional venues to disseminate information regarding awardees and their actions. These included our monthly HRO newsletter, monthly safety forums, and biweekly Team Connecticut Healthcare system-wide huddles.
Nomination Process
Awards nominations are submitted via the hospital intranet homepage, where there is an “HRO Safety Award Nomination” icon. Once a staff member clicks the icon, a template opens asking for information, such as the reason for the nomination submission, and then walks them through the template using the CAR (C-context, A-actions, and R-results)15 format for describing the situation, identifying actions taken, and specifying the outcome of the action. Emails with award nominations can also be sent to the HRO lead, HRO champion, or Patient Safety Committee co-chairs. Calls for nominations are made at several venues attended by employees as well as supervisors. These include monthly safety forums, biweekly Team Connecticut Healthcare system-wide huddles, supervisory staff meetings, department and unit-based staff meetings, and many other formal and informal settings. This QI initiative has allowed us to capture potential awardees through several avenues, including self-nominations. All nominations are reviewed by a safety awards committee. Each committee member ranks the nomination as a Level 1, 2, or 3 award. For nominations where conflicting scores are obtained, the committee discusses the nomination together to resolve discrepancies.
Needed Resources
Material resources required for this QI initiative include certificate paper, plastic baseball card sleeves, stress-release baseballs, and Bazooka gum. The largest resource investment was the time needed to support the initiative. This included the time spent scheduling the Level 1 and 2 award presentations with staff and leadership. Time was also required to put the individual award packages together, which included printing the paper certificates, obtaining awardee pictures, placing them with their safety stories in a plastic baseball card sleeve, and arranging for the hospital photographer to take pictures of the awardees with their peers and leaders.
RESULTS
Prior to this QI initiative launch, 14 awards were given out over the preceding 2-year period. During the initial 18 months of the initiative (December 2020 to June 2022), 59 awards were presented (Level 1, n = 26; Level 2, n = 22; and Level 3, n = 11). Looking further into the Level 1 awards presented, 25 awardees worked in clinical roles and 1 in a nonclinical position (Table 2). The awardees represented multidisciplinary areas, including medical/surgical (med/surg) inpatient units, anesthesia, operating room, pharmacy, mental health clinics, surgical intensive care, specialty care clinics, and nutrition and food services. With the Level 2 awards, 18 clinical staff and 4 nonclinical staff received awards from the areas of med/surg inpatient, outpatient surgical suites, the medical center director’s office, radiology, pharmacy, primary care, facilities management, environmental management, infection prevention, and emergency services. All Level 3 awardees were from clinical areas, including primary care, hospital education, sterile processing, pharmacies, operating rooms, and med/surg inpatient units.
With the inception of this QI initiative, our organization has begun to see trends reflecting increased reporting of both actual and close-call events in JPSR (Figure 1).
With the inclusion of information regarding awardees and their actions in monthly safety forums, attendance at these forums has increased from an average of 64 attendees per month in 2021 to an average of 131 attendees per month in 2022 (Figure 2).
Finally, our organization’s annual All-Employee Survey results have shown incremental increases in staff reporting feeling psychologically safe and not fearing reprisal (Figure 3). It is important to note that there may be other contributing factors to these incremental changes.
Level 1 – Good Catch Award. M.S. was assigned as a continuous safety monitor, or “sitter,” on one of the med/surg inpatient units. M.S. arrived at the bedside and asked for a report on the patient at a change in shift. The report stated that the patient was sleeping and had not moved in a while. M.S. set about to perform the functions of a sitter and did her usual tasks in cleaning and tidying the room for the patient for breakfast and taking care of all items in the room, in general. M.S. introduced herself to the patient, who she thought might wake up because of her speaking to him. She thought the patient was in an odd position, and knowing that a patient should be a little further up in the bed, she tried with touch to awaken him to adjust his position. M.S. found that the patient was rather chilly to the touch and immediately became concerned. She continued to attempt to rouse the patient. M.S. called for the nurse and began to adjust the patient’s position. M.S. insisted that the patient was cold and “something was wrong.” A set of vitals was taken and a rapid response team code was called. The patient was immediately transferred to the intensive care unit to receive a higher level of care. If not for the diligence and caring attitude of M.S., this patient may have had a very poor outcome.
Reason for criteria being met: The scope of practice of a sitter is to be present in a patient’s room to monitor for falls and overall safety. This employee noticed that the patient was not responsive to verbal or tactile stimuli. Her immediate reporting of her concern to the nurse resulted in prompt intervention. If she had let the patient be, the patient could have died. The staff member went above and beyond by speaking up and taking action when she had a patient safety concern.
Level 2 – HRO Safety Champion Award. A patient presented to an outpatient clinic for monoclonal antibody (mAb) therapy for a COVID-19 infection; the treatment has been scheduled by the patient’s primary care provider. At that time, outpatient mAb therapy was the recommended care option for patients stable enough to receive treatment in this setting, but it is contraindicated in patients who are too unstable to receive mAb therapy in an outpatient setting, such as those with increased oxygen demands. R.L., a staff nurse, assessed the patient on arrival and found that his vital signs were stable, except for a slightly elevated respiratory rate. Upon questioning, the patient reported that he had increased his oxygen use at home from 2 to 4 L via a nasal cannula. R.L. assessed that the patient was too high-risk for outpatient mAb therapy and had the patient checked into the emergency department (ED) to receive a full diagnostic workup and evaluation by Dr. W., an ED provider. The patient required admission to the hospital for a higher level of care in an inpatient unit because of severe COVID-19 infection. Within 48 hours of admission, the patient’s condition further declined, requiring an upgrade to the medical intensive care unit with progressive interventions. Owing to the clinical assessment skills and prompt action of R.L., the patient was admitted to the hospital instead of receiving treatment in a suboptimal care setting and returning home. Had the patient gone home, his rapid decline could have had serious consequences.
Reason for criteria being met: On a cursory look, the patient may have passed as someone sufficiently stable to undergo outpatient treatment. However, the nurse stopped the line, paid close attention, and picked up on an abnormal vital sign and the projected consequences. The nurse brought the patient to a higher level of care in the ED so that he could get the attention he needed. If this patient was given mAb therapy in the outpatient setting, he would have been discharged and become sicker with the COVID-19 illness. As a result of this incident, R.L. is working with the outpatient clinic and ED staff to enahance triage and evaluation of patients referred for outpatient therapy for COVID-19 infections to prevent a similar event from recurring.
Level 3 – Culture of Safety Appreciation Award. While C.C. was reviewing the hazardous item
Reason for criteria being met: The employee works in the hospital education department. It is within her scope of responsibilities to provide ongoing education to staff in order to address potential safety concerns.
DISCUSSION
This QI initiative was undertaken to demonstrate to staff that, in building an organizational culture of safety and advancing quality health care, it is important that staff be encouraged to speak up for safety and be acknowledged for doing so. As part of efforts to continuously build on a safety-first culture, transparency and celebration of successes were demonstrated. This QI initiative demonstrated that a diverse and wide range of employees were reached, from clinical to nonclinical staff, and frontline to supervisory staff, as all were included in the recognition process. While many award nominations were received through the submission of safety concerns to the high-reliability team and patient safety office, several came directly from staff who wanted to recognize their peers for their work, supporting a culture of safety. This showed that staff felt that taking the time to submit a write-up to recognize a peer was an important task. Achieving zero harm for patients and staff alike is a top priority for our institution and guides all decisions, which reinforces that everyone has a responsibility to ensure that safety is always the first consideration. A culture of safety is enhanced by staff recognition. This QI initiative also showed that staff felt valued when they were acknowledged, regardless of the level of recognition they received. The theme of feeling valued came from unsolicited feedback. For example, some direct comments from awardees are presented in the Box.
In addition to endorsing the importance of safe practices to staff, safety award programs can identify gaps in existing standard procedures that can be updated quickly and shared broadly across a health care organization. The authors observed that the existence of the award program gives staff permission to use their voice to speak up when they have questions or concerns related to safety and to proactively engage in safety practices; a cultural shift of this kind informs safety practices and procedures and contributes to a more inspiring workplace. Staff at our organization who have received any of the safety awards, and those who are aware of these awards, have embraced the program readily. At the time of submission of this manuscript, there was a relative paucity of published literature on the details, performance, and impact of such programs. This initiative aims to share a road map highlighting the various dimensions of staff recognition and how the program supports our health care system in fostering a strong, sustainable culture of safety and health care quality. A next step is to formally assess the impact of the awards program on our culture of safety and quality using a psychometrically sound measurement tool, as recommended by TJC,16 such as the
CONCLUSION
A health care organization safety awards program is a strategy for building and sustaining a culture of safety. This QI initiative may be valuable to other organizations in the process of establishing a safety awards program of their own. Future research should focus on a formal evaluation of the impact of safety awards programs on patient safety outcomes.
Corresponding author: John S. Murray, PhD, MPH, MSGH, RN, FAAN, 20 Chapel Street, Unit A502, Brookline, MA 02446; JMurray325@aol.com
Disclosures: None reported.
1. National Center for Biotechnology Information. Improving healthcare quality in Europe: Characteristics, effectiveness and implementation of different strategies. National Library of Medicine; 2019.
2.
3. Agency for Healthcare Research and Quality. Implementing near-miss reporting and improvement tracking in primary care practices: lessons learned. Agency for Healthcare Research and Quality; 2017.
4. Hamed M, Konstantinidis S. Barriers to incident reporting among nurses: a qualitative systematic review. West J Nurs Res. 2022;44(5):506-523. doi:10.1177/0193945921999449
5. Mohamed M, Abubeker IY, Al-Mohanadi D, et al. Perceived barriers of incident reporting among internists: results from Hamad medical corporation in Qatar. Avicenna J Med. 2021;11(3):139-144. doi:10.1055/s-0041-1734386
6. The Joint Commission. The essential role of leadership in developing a safety culture. The Joint Commission; 2017.
7. Yali G, Nzala S. Healthcare providers’ perspective on barriers to patient safety incident reporting in Lusaka District. J Prev Rehabil Med. 2022;4:44-52. doi:10.21617/jprm2022.417
8. Herzer KR, Mirrer M, Xie Y, et al. Patient safety reporting systems: sustained quality improvement using a multidisciplinary team and “good catch” awards. Jt Comm J Qual Patient Saf. 2012;38(8):339-347. doi:10.1016/s1553-7250(12)38044-6
9. Rogers E, Griffin E, Carnie W, et al. A just culture approach to managing medication errors. Hosp Pharm. 2017;52(4):308-315. doi:10.1310/hpj5204-308
10. Murray JS, Clifford J, Larson S, et al. Implementing just culture to improve patient safety. Mil Med. 2022;0: 1. doi:10.1093/milmed/usac115
11. Paradiso L, Sweeney N. Just culture: it’s more than policy. Nurs Manag. 2019;50(6):38–45. doi:10.1097/01.NUMA.0000558482.07815.ae
12. Wallace S, Mamrol M, Finley E; Pennsylvania Patient Safety Authority. Promote a culture of safety with good catch reports. PA Patient Saf Advis. 2017;14(3).
13. Tan KH, Pang NL, Siau C, et al: Building an organizational culture of patient safety. J Patient Saf Risk Manag. 2019;24:253-261. doi.10.1177/251604351987897
14. Merchant N, O’Neal J, Dealino-Perez C, et al: A high reliability mindset. Am J Med Qual. 2022;37(6):504-510. doi:10.1097/JMQ.0000000000000086
15. Behavioral interview questions and answers. Hudson. Accessed December 23, 2022. https://au.hudson.com/insights/career-advice/job-interviews/behavioural-interview-questions-and-answers/
16. The Joint Commission. Safety culture assessment: Improving the survey process. Accessed December 26, 2022. https://www.jointcommission.org/-/media/tjc/documents/accred-and-cert/safety_culture_assessment_improving_the_survey_process.pdf
17. Reis CT, Paiva SG, Sousa P. The patient safety culture: a systematic review by characteristics of hospital survey on patient safety culture dimensions. Int J Qual Heal Care. 2018;30(9):660-677. doi:10.1093/intqhc/mzy080
18. Fourar YO, Benhassine W, Boughaba A, et al. Contribution to the assessment of patient safety culture in Algerian healthcare settings: the ASCO project. Int J Healthc Manag. 2022;15:52-61. doi.org/10.1080/20479700.2020.1836736
Teaching Quality Improvement to Internal Medicine Residents to Address Patient Care Gaps in Ambulatory Quality Metrics
ABSTRACT
Objective: To teach internal medicine residents quality improvement (QI) principles in an effort to improve resident knowledge and comfort with QI, as well as address quality care gaps in resident clinic primary care patient panels.
Design: A QI curriculum was implemented for all residents rotating through a primary care block over a 6-month period. Residents completed Institute for Healthcare Improvement (IHI) modules, participated in a QI workshop, and received panel data reports, ultimately completing a plan-do-study-act (PDSA) cycle to improve colorectal cancer screening and hypertension control.
Setting and participants: This project was undertaken at Tufts Medical Center Primary Care, Boston, Massachusetts, the primary care teaching practice for all 75 internal medicine residents at Tufts Medical Center. All internal medicine residents were included, with 55 (73%) of the 75 residents completing the presurvey, and 39 (52%) completing the postsurvey.
Measurements: We administered a 10-question pre- and postsurvey looking at resident attitudes toward and comfort with QI and familiarity with their panel data as well as measured rates of colorectal cancer screening and hypertension control in resident panels.
Results: There was an increase in the numbers of residents who performed a PDSA cycle (P = .002), completed outreach based on their panel data (P = .02), and felt comfortable in both creating aim statements and designing and implementing PDSA cycles (P < .0001). The residents’ knowledge of their panel data significantly increased. There was no significant improvement in hypertension control, but there was an increase in colorectal cancer screening rates (P < .0001).
Conclusion: Providing panel data and performing targeted QI interventions can improve resident comfort with QI, translating to improvement in patient outcomes.
Keywords: quality improvement, resident education, medical education, care gaps, quality metrics.
As quality improvement (QI) has become an integral part of clinical practice, residency training programs have continued to evolve in how best to teach QI. The Accreditation Council for Graduate Medical Education (ACGME) Common Program requirements mandate that core competencies in residency programs include practice-based learning and improvement and systems-based practice.1 Residents should receive education in QI, receive data on quality metrics and benchmarks related to their patient population, and participate in QI activities. The Clinical Learning Environment Review (CLER) program was established to provide feedback to institutions on 6 focused areas, including patient safety and health care quality. In visits to institutions across the United States, the CLER committees found that many residents had limited knowledge of QI concepts and limited access to data on quality metrics and benchmarks.2
There are many barriers to implementing a QI curriculum in residency programs, and creating and maintaining successful strategies has proven challenging.3 Many QI curricula for internal medicine residents have been described in the literature, but the results of many of these studies focus on resident self-assessment of QI knowledge and numbers of projects rather than on patient outcomes.4-13 As there is some evidence suggesting that patients treated by residents have worse outcomes on ambulatory quality measures when compared with patients treated by staff physicians,14,15 it is important to also look at patient outcomes when evaluating a QI curriculum. Experts in education recommend the following to optimize learning: exposure to both didactic and experiential opportunities, connection to health system improvement efforts, and assessment of patient outcomes in addition to learner feedback.16,17 A study also found that providing panel data to residents could improve quality metrics.18
In this study, we sought to investigate the effects of a resident QI intervention during an ambulatory block on both residents’ self-assessments of QI knowledge and attitudes as well as on patient quality metrics.
Methods
Curriculum
We implemented this educational initiative at Tufts Medical Center Primary Care, Boston, Massachusetts, the primary care teaching practice for all 75 internal medicine residents at Tufts Medical Center. Co-located with the 415-bed academic medical center in downtown Boston, the practice serves more than 40,000 patients, approximately 7000 of whom are cared for by resident primary care physicians (PCPs). The internal medicine residents rotate through the primary care clinic as part of continuity clinic during ambulatory or elective blocks. In addition to continuity clinic, the residents have 2 dedicated 3-week primary care rotations during the course of an academic year. Primary care rotations consist of 5 clinic sessions a week as well as structured teaching sessions. Each resident inherits a panel of patients from an outgoing senior resident, with an average panel size of 96 patients per resident.
Prior to this study intervention, we did not do any formal QI teaching to our residents as part of their primary care curriculum, and previous panel management had focused more on chart reviews of patients whom residents perceived to be higher risk. Residents from all 3 years were included in the intervention. We taught a QI curriculum to our residents from January 2018 to June 2018 during the 3-week primary care rotation, which consisted of the following components:
- Institute for Healthcare Improvement (IHI) module QI 102 completed independently online.
- A 2-hour QI workshop led by 1 of 2 primary care faculty with backgrounds in QI, during which residents were taught basic principles of QI, including how to craft aim statements and design plan-do-study-act (PDSA) cycles, and participated in a hands-on QI activity designed to model rapid cycle improvement (the Paper Airplane Factory19).
- Distribution of individualized reports of residents’ patient panel data by email at the start of the primary care block that detailed patients’ overall rates of colorectal cancer screening and hypertension (HTN) control, along with the average resident panel rates and the average attending panel rates. The reports also included a list of all residents’ patients who were overdue for colorectal cancer screening or whose last blood pressure (BP) was uncontrolled (systolic BP ≥ 140 mm Hg or diastolic BP ≥ 90 mm Hg). These reports were originally designed by our practice’s QI team and run and exported in Microsoft Excel format monthly by our information technology (IT) administrator.
- Instruction on aim statements as a group, followed by the expectation that each resident create an individualized aim statement tailored to each resident’s patient panel rates, with the PDSA cycle to be implemented during the remainder of the primary care rotation, focusing on improvement of colorectal cancer screening and HTN control (see supplementary eFigure 1 online for the worksheet used for the workshop).
- Residents were held accountable for their interventions by various check-ins. At the end of the primary care block, residents were required to submit their completed worksheets showing the intervention they had undertaken and when it was performed. The 2 primary care attendings primarily responsible for QI education would review the resident’s work approximately 1 to 2 months after they submitted their worksheets describing their intervention. These attendings sent the residents personalized feedback based on whether the intervention had been completed or successful as evidenced by documentation in the chart, including direct patient outreach by phone, letter, or portal; outreach to the resident coordinator; scheduled follow-up appointment; or booking or completion of colorectal cancer screening. Along with this feedback, residents were also sent suggestions for next steps. Resident preceptors were copied on the email to facilitate reinforcement of the goals and plans. Finally, the resident preceptors also helped with accountability by going through the residents’ worksheets and patient panel metrics with the residents during biannual evaluations.

Evaluation
Residents were surveyed with a 10-item questionnaire pre and post intervention regarding their attitudes toward QI, understanding of QI principles, and familiarity with their patient panel data. Surveys were anonymous and distributed via the SurveyMonkey platform (see supplementary eFigure 2 online). Residents were asked if they had ever performed a PDSA cycle, performed patient outreach, or performed an intervention and whether they knew the rates of diabetes, HTN, and colorectal cancer screening in their patient panels. Questions rated on a 5-point Likert scale were used to assess comfort with panel management, developing an aim statement, designing and implementing a PDSA cycle, as well as interest in pursuing QI as a career. For the purposes of analysis, these questions were dichotomized into “somewhat comfortable” and “very comfortable” vs “neutral,” “somewhat uncomfortable,” and “very uncomfortable.” Similarly, we dichotomized the question about interest in QI as a career into “somewhat interested” and “very interested” vs “neutral,” “somewhat disinterested,” and “very disinterested.” As the surveys were anonymous, we were unable to pair the pre- and postintervention surveys and used a chi-square test to evaluate whether there was an association between survey assessments pre intervention vs post intervention and a positive or negative response to the question.

We also examined rates of HTN control and colorectal cancer screening in all 75 resident panels pre and post intervention. The paired t-test was used to determine whether the mean change from pre to post intervention was significant. SAS 9.4 (SAS Institute Inc.) was used for all analyses. Institutional Review Board exemption was obtained from the Tufts Medical Center IRB. There was no funding received for this study.
Results
Respondents
Of the 75 residents, 55 (73%) completed the survey prior to the intervention, and 39 (52%) completed the survey after the intervention.
Panel Knowledge and Intervention
Prior to the intervention, 45% of residents had performed a PDSA cycle, compared with 77% post intervention, which was a significant increase (P = .002) (Table 1). Sixty-two percent of residents had performed outreach or an intervention based on their patient panel reports prior to the intervention, compared with 85% of residents post intervention, which was also a significant increase (P = .02). The increase post intervention was not 100%, as there were residents who either missed the initial workshop or who did not follow through with their planned intervention. Common interventions included the residents giving their coordinators a list of patients to call to schedule appointments, utilizing fellow team members (eg, pharmacists, social workers) for targeted patient outreach, or calling patients themselves to reestablish a connection.

In terms of knowledge of their patient panels, prior to the intervention, 55%, 62%, and 62% of residents knew the rates of patients in their panel with diabetes, HTN, and colorectal cancer screening, respectively. After the intervention, the residents’ knowledge of these rates increased significantly, to 85% for diabetes (P = .002), 97% for HTN (P < .0001), and 97% for colorectal cancer screening (P < .0001).
Comfort With QI Approaches
Prior to the intervention, 82% of residents were comfortable managing their primary care panel, which did not change significantly post intervention (Table 2). The residents’ comfort with designing an aim statement did significantly increase, from 55% to 95% (P < .0001). The residents also had a significant increase in comfort with both designing and implementing a PDSA cycle. Prior to the intervention, 22% felt comfortable designing a PDSA cycle, which increased to 79% (P < .0001) post intervention, and 24% felt comfortable implementing a PDSA cycle, which increased to 77% (P < .0001) post intervention.

Patient Outcome Measures
The rate of HTN control in the residents' patient panels did not change significantly pre and post intervention (Table 3). The rate of resident patients who were up to date with colorectal cancer screening increased by 6.5% post intervention (P < .0001).

Interest in QI as a Career
As part of the survey, residents were asked how interested they were in making QI a part of their career. Fifty percent of residents indicated an interest in QI pre intervention, and 54% indicated an interest post intervention, which was not a significant difference (P = .72).
Discussion
In this study, we found that integration of a QI curriculum into a primary care rotation improved both residents’ knowledge of their patient panels and comfort with QI approaches, which translated to improvement in patient outcomes. Several previous studies have found improvements in resident self-assessment or knowledge after implementation of a QI curriculum.4-13 Liao et al implemented a longitudinal curriculum including both didactic and experiential components and found an improvement in both QI confidence and knowledge.3 Similarly, Duello et al8 found that a curriculum including both didactic lectures and QI projects improved subjective QI knowledge and comfort. Interestingly, Fok and Wong9 found that resident knowledge could be sustained post curriculum after completion of a QI project, suggesting that experiential learning may be helpful in maintaining knowledge.
Studies also have looked at providing performance data to residents. Hwang et al18 found that providing audit and feedback in the form of individual panel performance data to residents compared with practice targets led to statistically significant improvement in cancer screening rates and composite quality score, indicating that there is tremendous potential in providing residents with their data. While the ACGME mandates that residents should receive data on their quality metrics, on CLER visits, many residents interviewed noted limited access to data on their metrics and benchmarks.1,2
Though previous studies have individually looked at teaching QI concepts, providing panel data, or targeting select metrics, our study was unique in that it reviewed both self-reported resident outcomes data as well as actual patient outcomes. In addition to finding increased knowledge of patient panels and comfort with QI approaches, we found a significant increase in colorectal cancer screening rates post intervention. We thought this finding was particularly important given some data that residents' patients have been found to have worse outcomes on quality metrics compared with patients cared for by staff physicians.14,15 Given that having a resident physician as a PCP has been associated with failing to meet quality measures, it is especially important to focus targeted quality improvement initiatives in this patient population to reduce disparities in care.
We found that residents had improved knowledge on their patient panels as a result of this initiative. The residents were noted to have a higher knowledge of their HTN and colorectal cancer screening rates in comparison to their diabetes metrics. We suspect this is because residents are provided with multiple metrics related to diabetes, including process measures such as A1c testing, as well as outcome measures such as A1c control, so it may be harder for them to elucidate exactly how they are doing with their diabetes patients, whereas in HTN control and colorectal cancer screening, there is only 1 associated metric. Interestingly, even though HTN and colorectal cancer screening were the 2 measures focused on in the study, the residents had a significant improvement in knowledge of the rates of diabetes in their panel as well. This suggests that even just receiving data alone is valuable, hopefully translating to better outcomes with better baseline understanding of panels. We believe that our intervention was successful because it included both a didactic and an experiential component, as well as the use of individual panel performance data.
There were several limitations to our study. It was performed at a single institution, translating to a small sample size. Our data analysis was limited because we were unable to pair our pre- and postintervention survey responses because we used an anonymous survey. We also did not have full participation in postintervention surveys from all residents, which may have biased the study in favor of high performers. Another limitation was that our survey relied on self-reported outcomes for the questions about the residents knowing their patient panels.
This study required a 2-hour workshop every 3 weeks led by a faculty member trained in QI. Given the amount of time needed for the curriculum, this study may be difficult to replicate at other institutions, especially if faculty with an interest or training in QI are not available. Given our finding that residents had increased knowledge of their patient panels after receiving panel metrics, simply providing data with the goal of smaller, focused interventions may be easier to implement. At our institution, we discontinued the longer 2-hour QI workshops designed to teach QI approaches more broadly. We continue to provide individualized panel data to all residents during their primary care rotations and conduct half-hour, small group workshops with the interns that focus on drafting aim statements and planning interventions. All residents are required to submit worksheets to us at the end of their primary care blocks listing their current rates of each predetermined metric and laying out their aim statements and planned interventions. Residents also continue to receive feedback from our faculty with expertise in QI afterward on their plans and evidence of follow-through in the chart, with their preceptors included on the feedback emails. Even without the larger QI workshop, this approach has continued to be successful and appreciated. In fact, it does appear as though improvement in colorectal cancer screening has been sustained over several years. At the end of our study period, the resident patient colorectal cancer screening rate rose from 34% to 43%, and for the 2021-2022 academic year, the rate rose further, from 46% to 50%.
Given that the resident clinic patient population is at higher risk overall, targeted outreach and approaches to improve quality must be continued. Future areas of research include looking at which interventions, whether QI curriculum, provision of panel data, or required panel management interventions, translate to the greatest improvements in patient outcomes in this vulnerable population.
Conclusion
Our study showed that a dedicated QI curriculum for the residents and access to quality metric data improved both resident knowledge and comfort with QI approaches. Beyond resident-centered outcomes, there was also translation to improved patient outcomes, with a significant increase in colon cancer screening rates post intervention.
Corresponding author: Kinjalika Sathi, MD, 800 Washington St., Boston, MA 02111; ksathi@tuftsmedicalcenter.org
Disclosures: None reported.
1. Accreditation Council for Graduate Medical Education. ACGME Common Program Requirements (Residency). Approved June 13, 2021. Updated July 1, 2022. Accessed December 29, 2022. https://www.acgme.org/globalassets/pfassets/programrequirements/cprresidency_2022v3.pdf
2. Koh NJ, Wagner R, Newton RC, et al; on behalf of the CLER Evaluation Committee and the CLER Program. CLER National Report of Findings 2021. Accreditation Council for Graduate Medical Education; 2021. Accessed December 29, 2022. https://www.acgme.org/globalassets/pdfs/cler/2021clernationalreportoffindings.pdf
3. Liao JM, Co JP, Kachalia A. Providing educational content and context for training the next generation of physicians in quality improvement. Acad Med. 2015;90(9):1241-1245. doi:10.1097/ACM.0000000000000799
4. Johnson KM, Fiordellisi W, Kuperman E, et al. X + Y = time for QI: meaningful engagement of residents in quality improvement during the ambulatory block. J Grad Med Educ. 2018;10(3):316-324. doi:10.4300/JGME-D-17-00761.1
5. Kesari K, Ali S, Smith S. Integrating residents with institutional quality improvement teams. Med Educ. 2017;51(11):1173. doi:10.1111/medu.13431
6. Ogrinc G, Cohen ES, van Aalst R, et al. Clinical and educational outcomes of an integrated inpatient quality improvement curriculum for internal medicine residents. J Grad Med Educ. 2016;8(4):563-568. doi:10.4300/JGME-D-15-00412.1
7. Malayala SV, Qazi KJ, Samdani AJ, et al. A multidisciplinary performance improvement rotation in an internal medicine training program. Int J Med Educ. 2016;7:212-213. doi:10.5116/ijme.5765.0bda
8. Duello K, Louh I, Greig H, et al. Residents’ knowledge of quality improvement: the impact of using a group project curriculum. Postgrad Med J. 2015;91(1078):431-435. doi:10.1136/postgradmedj-2014-132886
9. Fok MC, Wong RY. Impact of a competency based curriculum on quality improvement among internal medicine residents. BMC Med Educ. 2014;14:252. doi:10.1186/s12909-014-0252-7
10. Wilper AP, Smith CS, Weppner W. Instituting systems-based practice and practice-based learning and improvement: a curriculum of inquiry. Med Educ Online. 2013;18:21612. doi:10.3402/meo.v18i0.21612
11. Weigel C, Suen W, Gupte G. Using lean methodology to teach quality improvement to internal medicine residents at a safety net hospital. Am J Med Qual. 2013;28(5):392-399. doi:10.1177/1062860612474062
12. Tomolo AM, Lawrence RH, Watts B, et al. Pilot study evaluating a practice-based learning and improvement curriculum focusing on the development of system-level quality improvement skills. J Grad Med Educ. 2011;3(1):49-58. doi:10.4300/JGME-D-10-00104.1
13. Djuricich AM, Ciccarelli M, Swigonski NL. A continuous quality improvement curriculum for residents: addressing core competency, improving systems. Acad Med. 2004;79(10 Suppl):S65-S67. doi:10.1097/00001888-200410001-00020
14. Essien UR, He W, Ray A, et al. Disparities in quality of primary care by resident and staff physicians: is there a conflict between training and equity? J Gen Intern Med. 2019;34(7):1184-1191. doi:10.1007/s11606-019-04960-5
15. Amat M, Norian E, Graham KL. Unmasking a vulnerable patient care process: a qualitative study describing the current state of resident continuity clinic in a nationwide cohort of internal medicine residency programs. Am J Med. 2022;135(6):783-786. doi:10.1016/j.amjmed.2022.02.007
16. Wong BM, Etchells EE, Kuper A, et al. Teaching quality improvement and patient safety to trainees: a systematic review. Acad Med. 2010;85(9):1425-1439. doi:10.1097/ACM.0b013e3181e2d0c6
17. Armstrong G, Headrick L, Madigosky W, et al. Designing education to improve care. Jt Comm J Qual Patient Saf. 2012;38:5-14. doi:10.1016/s1553-7250(12)38002-1
18. Hwang AS, Harding AS, Chang Y, et al. An audit and feedback intervention to improve internal medicine residents’ performance on ambulatory quality measures: a randomized controlled trial. Popul Health Manag. 2019;22(6):529-535. doi:10.1089/pop.2018.0217
19. Institute for Healthcare Improvement. Open school. The paper airplane factory. Accessed December 29, 2022. https://www.ihi.org/education/IHIOpenSchool/resources/Pages/Activities/PaperAirplaneFactory.aspx
ABSTRACT
Objective: To teach internal medicine residents quality improvement (QI) principles in an effort to improve resident knowledge and comfort with QI, as well as address quality care gaps in resident clinic primary care patient panels.
Design: A QI curriculum was implemented for all residents rotating through a primary care block over a 6-month period. Residents completed Institute for Healthcare Improvement (IHI) modules, participated in a QI workshop, and received panel data reports, ultimately completing a plan-do-study-act (PDSA) cycle to improve colorectal cancer screening and hypertension control.
Setting and participants: This project was undertaken at Tufts Medical Center Primary Care, Boston, Massachusetts, the primary care teaching practice for all 75 internal medicine residents at Tufts Medical Center. All internal medicine residents were included, with 55 (73%) of the 75 residents completing the presurvey, and 39 (52%) completing the postsurvey.
Measurements: We administered a 10-question pre- and postsurvey looking at resident attitudes toward and comfort with QI and familiarity with their panel data as well as measured rates of colorectal cancer screening and hypertension control in resident panels.
Results: There was an increase in the numbers of residents who performed a PDSA cycle (P = .002), completed outreach based on their panel data (P = .02), and felt comfortable in both creating aim statements and designing and implementing PDSA cycles (P < .0001). The residents’ knowledge of their panel data significantly increased. There was no significant improvement in hypertension control, but there was an increase in colorectal cancer screening rates (P < .0001).
Conclusion: Providing panel data and performing targeted QI interventions can improve resident comfort with QI, translating to improvement in patient outcomes.
Keywords: quality improvement, resident education, medical education, care gaps, quality metrics.
As quality improvement (QI) has become an integral part of clinical practice, residency training programs have continued to evolve in how best to teach QI. The Accreditation Council for Graduate Medical Education (ACGME) Common Program requirements mandate that core competencies in residency programs include practice-based learning and improvement and systems-based practice.1 Residents should receive education in QI, receive data on quality metrics and benchmarks related to their patient population, and participate in QI activities. The Clinical Learning Environment Review (CLER) program was established to provide feedback to institutions on 6 focused areas, including patient safety and health care quality. In visits to institutions across the United States, the CLER committees found that many residents had limited knowledge of QI concepts and limited access to data on quality metrics and benchmarks.2
There are many barriers to implementing a QI curriculum in residency programs, and creating and maintaining successful strategies has proven challenging.3 Many QI curricula for internal medicine residents have been described in the literature, but the results of many of these studies focus on resident self-assessment of QI knowledge and numbers of projects rather than on patient outcomes.4-13 As there is some evidence suggesting that patients treated by residents have worse outcomes on ambulatory quality measures when compared with patients treated by staff physicians,14,15 it is important to also look at patient outcomes when evaluating a QI curriculum. Experts in education recommend the following to optimize learning: exposure to both didactic and experiential opportunities, connection to health system improvement efforts, and assessment of patient outcomes in addition to learner feedback.16,17 A study also found that providing panel data to residents could improve quality metrics.18
In this study, we sought to investigate the effects of a resident QI intervention during an ambulatory block on both residents’ self-assessments of QI knowledge and attitudes as well as on patient quality metrics.
Methods
Curriculum
We implemented this educational initiative at Tufts Medical Center Primary Care, Boston, Massachusetts, the primary care teaching practice for all 75 internal medicine residents at Tufts Medical Center. Co-located with the 415-bed academic medical center in downtown Boston, the practice serves more than 40,000 patients, approximately 7000 of whom are cared for by resident primary care physicians (PCPs). The internal medicine residents rotate through the primary care clinic as part of continuity clinic during ambulatory or elective blocks. In addition to continuity clinic, the residents have 2 dedicated 3-week primary care rotations during the course of an academic year. Primary care rotations consist of 5 clinic sessions a week as well as structured teaching sessions. Each resident inherits a panel of patients from an outgoing senior resident, with an average panel size of 96 patients per resident.
Prior to this study intervention, we did not do any formal QI teaching to our residents as part of their primary care curriculum, and previous panel management had focused more on chart reviews of patients whom residents perceived to be higher risk. Residents from all 3 years were included in the intervention. We taught a QI curriculum to our residents from January 2018 to June 2018 during the 3-week primary care rotation, which consisted of the following components:
- Institute for Healthcare Improvement (IHI) module QI 102 completed independently online.
- A 2-hour QI workshop led by 1 of 2 primary care faculty with backgrounds in QI, during which residents were taught basic principles of QI, including how to craft aim statements and design plan-do-study-act (PDSA) cycles, and participated in a hands-on QI activity designed to model rapid cycle improvement (the Paper Airplane Factory19).
- Distribution of individualized reports of residents’ patient panel data by email at the start of the primary care block that detailed patients’ overall rates of colorectal cancer screening and hypertension (HTN) control, along with the average resident panel rates and the average attending panel rates. The reports also included a list of all residents’ patients who were overdue for colorectal cancer screening or whose last blood pressure (BP) was uncontrolled (systolic BP ≥ 140 mm Hg or diastolic BP ≥ 90 mm Hg). These reports were originally designed by our practice’s QI team and run and exported in Microsoft Excel format monthly by our information technology (IT) administrator.
- Instruction on aim statements as a group, followed by the expectation that each resident create an individualized aim statement tailored to each resident’s patient panel rates, with the PDSA cycle to be implemented during the remainder of the primary care rotation, focusing on improvement of colorectal cancer screening and HTN control (see supplementary eFigure 1 online for the worksheet used for the workshop).
- Residents were held accountable for their interventions by various check-ins. At the end of the primary care block, residents were required to submit their completed worksheets showing the intervention they had undertaken and when it was performed. The 2 primary care attendings primarily responsible for QI education would review the resident’s work approximately 1 to 2 months after they submitted their worksheets describing their intervention. These attendings sent the residents personalized feedback based on whether the intervention had been completed or successful as evidenced by documentation in the chart, including direct patient outreach by phone, letter, or portal; outreach to the resident coordinator; scheduled follow-up appointment; or booking or completion of colorectal cancer screening. Along with this feedback, residents were also sent suggestions for next steps. Resident preceptors were copied on the email to facilitate reinforcement of the goals and plans. Finally, the resident preceptors also helped with accountability by going through the residents’ worksheets and patient panel metrics with the residents during biannual evaluations.
Evaluation
Residents were surveyed with a 10-item questionnaire pre and post intervention regarding their attitudes toward QI, understanding of QI principles, and familiarity with their patient panel data. Surveys were anonymous and distributed via the SurveyMonkey platform (see supplementary eFigure 2 online). Residents were asked if they had ever performed a PDSA cycle, performed patient outreach, or performed an intervention and whether they knew the rates of diabetes, HTN, and colorectal cancer screening in their patient panels. Questions rated on a 5-point Likert scale were used to assess comfort with panel management, developing an aim statement, designing and implementing a PDSA cycle, as well as interest in pursuing QI as a career. For the purposes of analysis, these questions were dichotomized into “somewhat comfortable” and “very comfortable” vs “neutral,” “somewhat uncomfortable,” and “very uncomfortable.” Similarly, we dichotomized the question about interest in QI as a career into “somewhat interested” and “very interested” vs “neutral,” “somewhat disinterested,” and “very disinterested.” As the surveys were anonymous, we were unable to pair the pre- and postintervention surveys and used a chi-square test to evaluate whether there was an association between survey assessments pre intervention vs post intervention and a positive or negative response to the question.
We also examined rates of HTN control and colorectal cancer screening in all 75 resident panels pre and post intervention. The paired t-test was used to determine whether the mean change from pre to post intervention was significant. SAS 9.4 (SAS Institute Inc.) was used for all analyses. Institutional Review Board exemption was obtained from the Tufts Medical Center IRB. There was no funding received for this study.
Results
Respondents
Of the 75 residents, 55 (73%) completed the survey prior to the intervention, and 39 (52%) completed the survey after the intervention.
Panel Knowledge and Intervention
Prior to the intervention, 45% of residents had performed a PDSA cycle, compared with 77% post intervention, which was a significant increase (P = .002) (Table 1). Sixty-two percent of residents had performed outreach or an intervention based on their patient panel reports prior to the intervention, compared with 85% of residents post intervention, which was also a significant increase (P = .02). The increase post intervention was not 100%, as there were residents who either missed the initial workshop or who did not follow through with their planned intervention. Common interventions included the residents giving their coordinators a list of patients to call to schedule appointments, utilizing fellow team members (eg, pharmacists, social workers) for targeted patient outreach, or calling patients themselves to reestablish a connection.
In terms of knowledge of their patient panels, prior to the intervention, 55%, 62%, and 62% of residents knew the rates of patients in their panel with diabetes, HTN, and colorectal cancer screening, respectively. After the intervention, the residents’ knowledge of these rates increased significantly, to 85% for diabetes (P = .002), 97% for HTN (P < .0001), and 97% for colorectal cancer screening (P < .0001).
Comfort With QI Approaches
Prior to the intervention, 82% of residents were comfortable managing their primary care panel, which did not change significantly post intervention (Table 2). The residents’ comfort with designing an aim statement did significantly increase, from 55% to 95% (P < .0001). The residents also had a significant increase in comfort with both designing and implementing a PDSA cycle. Prior to the intervention, 22% felt comfortable designing a PDSA cycle, which increased to 79% (P < .0001) post intervention, and 24% felt comfortable implementing a PDSA cycle, which increased to 77% (P < .0001) post intervention.
Patient Outcome Measures
The rate of HTN control in the residents' patient panels did not change significantly pre and post intervention (Table 3). The rate of resident patients who were up to date with colorectal cancer screening increased by 6.5% post intervention (P < .0001).
Interest in QI as a Career
As part of the survey, residents were asked how interested they were in making QI a part of their career. Fifty percent of residents indicated an interest in QI pre intervention, and 54% indicated an interest post intervention, which was not a significant difference (P = .72).
Discussion
In this study, we found that integration of a QI curriculum into a primary care rotation improved both residents’ knowledge of their patient panels and comfort with QI approaches, which translated to improvement in patient outcomes. Several previous studies have found improvements in resident self-assessment or knowledge after implementation of a QI curriculum.4-13 Liao et al implemented a longitudinal curriculum including both didactic and experiential components and found an improvement in both QI confidence and knowledge.3 Similarly, Duello et al8 found that a curriculum including both didactic lectures and QI projects improved subjective QI knowledge and comfort. Interestingly, Fok and Wong9 found that resident knowledge could be sustained post curriculum after completion of a QI project, suggesting that experiential learning may be helpful in maintaining knowledge.
Studies also have looked at providing performance data to residents. Hwang et al18 found that providing audit and feedback in the form of individual panel performance data to residents compared with practice targets led to statistically significant improvement in cancer screening rates and composite quality score, indicating that there is tremendous potential in providing residents with their data. While the ACGME mandates that residents should receive data on their quality metrics, on CLER visits, many residents interviewed noted limited access to data on their metrics and benchmarks.1,2
Though previous studies have individually looked at teaching QI concepts, providing panel data, or targeting select metrics, our study was unique in that it reviewed both self-reported resident outcomes data as well as actual patient outcomes. In addition to finding increased knowledge of patient panels and comfort with QI approaches, we found a significant increase in colorectal cancer screening rates post intervention. We thought this finding was particularly important given some data that residents' patients have been found to have worse outcomes on quality metrics compared with patients cared for by staff physicians.14,15 Given that having a resident physician as a PCP has been associated with failing to meet quality measures, it is especially important to focus targeted quality improvement initiatives in this patient population to reduce disparities in care.
We found that residents had improved knowledge on their patient panels as a result of this initiative. The residents were noted to have a higher knowledge of their HTN and colorectal cancer screening rates in comparison to their diabetes metrics. We suspect this is because residents are provided with multiple metrics related to diabetes, including process measures such as A1c testing, as well as outcome measures such as A1c control, so it may be harder for them to elucidate exactly how they are doing with their diabetes patients, whereas in HTN control and colorectal cancer screening, there is only 1 associated metric. Interestingly, even though HTN and colorectal cancer screening were the 2 measures focused on in the study, the residents had a significant improvement in knowledge of the rates of diabetes in their panel as well. This suggests that even just receiving data alone is valuable, hopefully translating to better outcomes with better baseline understanding of panels. We believe that our intervention was successful because it included both a didactic and an experiential component, as well as the use of individual panel performance data.
There were several limitations to our study. It was performed at a single institution, translating to a small sample size. Our data analysis was limited because we were unable to pair our pre- and postintervention survey responses because we used an anonymous survey. We also did not have full participation in postintervention surveys from all residents, which may have biased the study in favor of high performers. Another limitation was that our survey relied on self-reported outcomes for the questions about the residents knowing their patient panels.
This study required a 2-hour workshop every 3 weeks led by a faculty member trained in QI. Given the amount of time needed for the curriculum, this study may be difficult to replicate at other institutions, especially if faculty with an interest or training in QI are not available. Given our finding that residents had increased knowledge of their patient panels after receiving panel metrics, simply providing data with the goal of smaller, focused interventions may be easier to implement. At our institution, we discontinued the longer 2-hour QI workshops designed to teach QI approaches more broadly. We continue to provide individualized panel data to all residents during their primary care rotations and conduct half-hour, small group workshops with the interns that focus on drafting aim statements and planning interventions. All residents are required to submit worksheets to us at the end of their primary care blocks listing their current rates of each predetermined metric and laying out their aim statements and planned interventions. Residents also continue to receive feedback from our faculty with expertise in QI afterward on their plans and evidence of follow-through in the chart, with their preceptors included on the feedback emails. Even without the larger QI workshop, this approach has continued to be successful and appreciated. In fact, it does appear as though improvement in colorectal cancer screening has been sustained over several years. At the end of our study period, the resident patient colorectal cancer screening rate rose from 34% to 43%, and for the 2021-2022 academic year, the rate rose further, from 46% to 50%.
Given that the resident clinic patient population is at higher risk overall, targeted outreach and approaches to improve quality must be continued. Future areas of research include looking at which interventions, whether QI curriculum, provision of panel data, or required panel management interventions, translate to the greatest improvements in patient outcomes in this vulnerable population.
Conclusion
Our study showed that a dedicated QI curriculum for the residents and access to quality metric data improved both resident knowledge and comfort with QI approaches. Beyond resident-centered outcomes, there was also translation to improved patient outcomes, with a significant increase in colon cancer screening rates post intervention.
Corresponding author: Kinjalika Sathi, MD, 800 Washington St., Boston, MA 02111; ksathi@tuftsmedicalcenter.org
Disclosures: None reported.
1. Accreditation Council for Graduate Medical Education. ACGME Common Program Requirements (Residency). Approved June 13, 2021. Updated July 1, 2022. Accessed December 29, 2022. https://www.acgme.org/globalassets/pfassets/programrequirements/cprresidency_2022v3.pdf
2. Koh NJ, Wagner R, Newton RC, et al; on behalf of the CLER Evaluation Committee and the CLER Program. CLER National Report of Findings 2021. Accreditation Council for Graduate Medical Education; 2021. Accessed December 29, 2022. https://www.acgme.org/globalassets/pdfs/cler/2021clernationalreportoffindings.pdf
3. Liao JM, Co JP, Kachalia A. Providing educational content and context for training the next generation of physicians in quality improvement. Acad Med. 2015;90(9):1241-1245. doi:10.1097/ACM.0000000000000799
4. Johnson KM, Fiordellisi W, Kuperman E, et al. X + Y = time for QI: meaningful engagement of residents in quality improvement during the ambulatory block. J Grad Med Educ. 2018;10(3):316-324. doi:10.4300/JGME-D-17-00761.1
5. Kesari K, Ali S, Smith S. Integrating residents with institutional quality improvement teams. Med Educ. 2017;51(11):1173. doi:10.1111/medu.13431
6. Ogrinc G, Cohen ES, van Aalst R, et al. Clinical and educational outcomes of an integrated inpatient quality improvement curriculum for internal medicine residents. J Grad Med Educ. 2016;8(4):563-568. doi:10.4300/JGME-D-15-00412.1
7. Malayala SV, Qazi KJ, Samdani AJ, et al. A multidisciplinary performance improvement rotation in an internal medicine training program. Int J Med Educ. 2016;7:212-213. doi:10.5116/ijme.5765.0bda
8. Duello K, Louh I, Greig H, et al. Residents’ knowledge of quality improvement: the impact of using a group project curriculum. Postgrad Med J. 2015;91(1078):431-435. doi:10.1136/postgradmedj-2014-132886
9. Fok MC, Wong RY. Impact of a competency based curriculum on quality improvement among internal medicine residents. BMC Med Educ. 2014;14:252. doi:10.1186/s12909-014-0252-7
10. Wilper AP, Smith CS, Weppner W. Instituting systems-based practice and practice-based learning and improvement: a curriculum of inquiry. Med Educ Online. 2013;18:21612. doi:10.3402/meo.v18i0.21612
11. Weigel C, Suen W, Gupte G. Using lean methodology to teach quality improvement to internal medicine residents at a safety net hospital. Am J Med Qual. 2013;28(5):392-399. doi:10.1177/1062860612474062
12. Tomolo AM, Lawrence RH, Watts B, et al. Pilot study evaluating a practice-based learning and improvement curriculum focusing on the development of system-level quality improvement skills. J Grad Med Educ. 2011;3(1):49-58. doi:10.4300/JGME-D-10-00104.1
13. Djuricich AM, Ciccarelli M, Swigonski NL. A continuous quality improvement curriculum for residents: addressing core competency, improving systems. Acad Med. 2004;79(10 Suppl):S65-S67. doi:10.1097/00001888-200410001-00020
14. Essien UR, He W, Ray A, et al. Disparities in quality of primary care by resident and staff physicians: is there a conflict between training and equity? J Gen Intern Med. 2019;34(7):1184-1191. doi:10.1007/s11606-019-04960-5
15. Amat M, Norian E, Graham KL. Unmasking a vulnerable patient care process: a qualitative study describing the current state of resident continuity clinic in a nationwide cohort of internal medicine residency programs. Am J Med. 2022;135(6):783-786. doi:10.1016/j.amjmed.2022.02.007
16. Wong BM, Etchells EE, Kuper A, et al. Teaching quality improvement and patient safety to trainees: a systematic review. Acad Med. 2010;85(9):1425-1439. doi:10.1097/ACM.0b013e3181e2d0c6
17. Armstrong G, Headrick L, Madigosky W, et al. Designing education to improve care. Jt Comm J Qual Patient Saf. 2012;38:5-14. doi:10.1016/s1553-7250(12)38002-1
18. Hwang AS, Harding AS, Chang Y, et al. An audit and feedback intervention to improve internal medicine residents’ performance on ambulatory quality measures: a randomized controlled trial. Popul Health Manag. 2019;22(6):529-535. doi:10.1089/pop.2018.0217
19. Institute for Healthcare Improvement. Open school. The paper airplane factory. Accessed December 29, 2022. https://www.ihi.org/education/IHIOpenSchool/resources/Pages/Activities/PaperAirplaneFactory.aspx
Diagnostic Errors in Hospitalized Patients
Abstract
Diagnostic errors in hospitalized patients are a leading cause of preventable morbidity and mortality. Significant challenges in defining and measuring diagnostic errors and underlying process failure points have led to considerable variability in reported rates of diagnostic errors and adverse outcomes. In this article, we explore the diagnostic process and its discrete components, emphasizing the centrality of the patient in decision-making as well as the continuous nature of the process. We review the incidence of diagnostic errors in hospitalized patients and different methodological approaches that have been used to arrive at these estimates. We discuss different but interdependent provider- and system-related process-failure points that lead to diagnostic errors. We examine specific challenges related to measurement of diagnostic errors and describe traditional and novel approaches that are being used to obtain the most precise estimates. Finally, we examine various patient-, provider-, and organizational-level interventions that have been proposed to improve diagnostic safety in hospitalized patients.
Keywords: diagnostic error, hospital medicine, patient safety.
Diagnosis is defined as a “pre-existing set of categories agreed upon by the medical profession to designate a specific condition.”1 The diagnostic process involves obtaining a clinical history, performing a physical examination, conducting diagnostic testing, and consulting with other clinical providers to gather data that are relevant to understanding the underlying disease processes. This exercise involves generating hypotheses and updating prior probabilities as more information and evidence become available. Throughout this process of information gathering, integration, and interpretation, there is an ongoing assessment of whether sufficient and necessary knowledge has been obtained to make an accurate diagnosis and provide appropriate treatment.2
Diagnostic error is defined as a missed opportunity to make a timely diagnosis as part of this iterative process, including the failure of communicating the diagnosis to the patient in a timely manner.3 It can be categorized as a missed, delayed, or incorrect diagnosis based on available evidence at the time. Establishing the correct diagnosis has important implications. A timely and precise diagnosis ensures the patient the highest probability of having a positive health outcome that reflects an appropriate understanding of underlying disease processes and is consistent with their overall goals of care.3 When diagnostic errors occur, they can cause patient harm. Adverse events due to medical errors, including diagnostic errors, are estimated to be the third leading cause of death in the United States.4 Most people will experience at least 1 diagnostic error in their lifetime. In the 2015 National Academy of Medicine report Improving Diagnosis in Healthcare, diagnostic errors were identified as a major hazard as well as an opportunity to improve patient outcomes.2
Diagnostic errors during hospitalizations are especially concerning, as they are more likely to be implicated in a wider spectrum of harm, including permanent disability and death. This has become even more relevant for hospital medicine physicians and other clinical providers as they encounter increasing cognitive and administrative workloads, rising dissatisfaction and burnout, and unique obstacles such as night-time scheduling.5
Incidence of Diagnostic Errors in Hospitalized Patients
Several methodological approaches have been used to estimate the incidence of diagnostic errors in hospitalized patients. These include retrospective reviews of a sample of all hospital admissions, evaluations of selected adverse outcomes including autopsy studies, patient and provider surveys, and malpractice claims. Laboratory testing audits and secondary reviews in other diagnostic subspecialities (eg, radiology, pathology, and microbiology) are also essential to improving diagnostic performance in these specialized fields, which in turn affects overall hospital diagnostic error rates.6-8 These diverse approaches provide unique insights regarding our ability to assess the degree to which potential harms, ranging from temporary impairment to permanent disability, to death, are attributable to different failure points in the diagnostic process.
Large retrospective chart reviews of random hospital admissions remain the most accurate way to determine the overall incidence of diagnostic errors in hospitalized patients.9 The Harvard Medical Practice Study, published in 1991, laid the groundwork for measuring the incidence of adverse events in hospitalized patients and assessing their relation to medical error, negligence, and disability. Reviewing 30,121 randomly selected records from 51 randomly selected acute care hospitals in New York State, the study found that adverse events occurred in 3.7% of hospitalizations, diagnostic errors accounted for 13.8% of these events, and these errors were likely attributable to negligence in 74.7% of cases. The study not only outlined individual-level process failures, but also focused attention on some of the systemic causes, setting the agenda for quality improvement research in hospital-based care for years to come.10-12 A recent systematic review and meta-analysis of 22 hospital admission studies found a pooled rate of 0.7% (95% CI, 0.5%-1.1%) for harmful diagnostic errors.9 It found significant variations in the rates of adverse events, diagnostic errors, and range of diagnoses that were missed. This was primarily because of variabilities in pre-test probabilities in detecting diagnostic errors in these specific cohorts, as well as due to heterogeneity in study definitions and methodologies, especially regarding how they defined and measured “diagnostic error.” The analysis, however, did not account for diagnostic errors that were not related to patient harm (missed opportunities); therefore, it likely significantly underestimated the true incidence of diagnostic errors in these study populations. Table 1 summarizes some of key studies that have examined the incidence of harmful diagnostic errors in hospitalized patients.9-21

The chief limitation of reviewing random hospital admissions is that, since overall rates of diagnostic errors are still relatively low, a large number of case reviews are required to identify a sufficient sample of adverse outcomes to gain a meaningful understanding of the underlying process failure points and develop tools for remediation. Patient and provider surveys or data from malpractice claims can be high-yield starting points for research on process errors.22,23 Reviews of enriched cohorts of adverse outcomes, such as rapid-response events, intensive care unit (ICU) transfers, deaths, and hospital readmissions, can be an efficient way to identify process failures that lead to greatest harm. Depending on the research approach and the types of underlying patient populations sampled, rates of diagnostic errors in these high-risk groups have been estimated to be approximately 5% to 20%, or even higher.6,24-31 For example, a retrospective study of 391 cases of unplanned 7-day readmissions found that 5.6% of cases contained at least 1 diagnostic error during the index admission.32 In a study conducted at 6 Belgian acute-care hospitals, 56% of patients requiring an unplanned transfer to a higher level of care were determined to have had an adverse event, and of these adverse events, 12.4% of cases were associated with errors in diagnosis.29 A systematic review of 16 hospital-based studies estimated that 3.1% of all inpatient deaths were likely preventable, which corresponded to 22,165 deaths annually in the United States.30 Another such review of 31 autopsy studies reported that 28% of autopsied ICU patients had at least 1 misdiagnosis; of these diagnostic errors, 8% were classified as potentially lethal, and 15% were considered major but not lethal.31 Significant drawbacks of such enriched cohort studies, however, are their poor generalizability and inability to detect failure points that do not lead to patient harm (near-miss events).33
Causes of Diagnostic Errors in Hospitalized Patients
All aspects of the diagnostic process are susceptible to errors. These errors stem from a variety of faulty processes, including failure of the patient to engage with the health care system (eg, due to lack of insurance or transportation, or delay in seeking care); failure in information gathering (eg, missed history or exam findings, ordering wrong tests, laboratory errors); failure in information interpretation (eg, exam finding or test result misinterpretation); inaccurate hypothesis generation (eg, due to suboptimal prioritization or weighing of supporting evidence); and failure in communication (eg, with other team members or with the patient).2,34 Reasons for diagnostic process failures vary widely across different health care settings. While clinician assessment errors (eg, failure to consider or alternatively overweigh competing diagnoses) and errors in testing and the monitoring phase (eg, failure to order or follow up diagnostic tests) can lead to a majority of diagnostic errors in some patient populations, in other settings, social (eg, poor health literacy, punitive cultural practices) and economic factors (eg, lack of access to appropriate diagnostic tests or to specialty expertise) play a more prominent role.34,35
The Figure describes the relationship between components of the diagnostic process and subsequent outcomes, including diagnostic process failures, diagnostic errors, and absence or presence of patient harm.2,36,37 It reemphasizes the centrality of the patient in decision-making and the continuous nature of the process. The Figure also illustrates that only a minority of process failures result in diagnostic errors, and a smaller proportion of diagnostic errors actually lead to patient harm. Conversely, it also shows that diagnostic errors can happen without any obvious process-failure points, and, similarly, patient harm can take place in the absence of any evident diagnostic errors.36-38 Finally, it highlights the need to incorporate feedback from process failures, diagnostic errors, and favorable and unfavorable patient outcomes in order to inform future quality improvement efforts and research.

A significant proportion of diagnostic errors are due to system-related vulnerabilities, such as limitations in availability, adoption or quality of work force training, health informatics resources, and diagnostic capabilities. Lack of institutional culture that promotes safety and transparency also predisposes to diagnostic errors.39,40 The other major domain of process failures is related to cognitive errors in clinician decision-making. Anchoring, confirmation bias, availability bias, and base-rate neglect are some of the common cognitive biases that, along with personality traits (aversion to risk or ambiguity, overconfidence) and affective biases (influence of emotion on decision-making), often determine the degree of utilization of resources and the possibility of suboptimal diagnostic performance.41,42 Further, implicit biases related to age, race, gender, and sexual orientation contribute to disparities in access to health care and outcomes.43 In a large number of cases of preventable adverse outcomes, however, there are multiple interdependent individual and system-related failure points that lead to diagnostic error and patient harm.6,32
Challenges in Defining and Measuring Diagnostic Errors
In order to develop effective, evidence-based interventions to reduce diagnostic errors in hospitalized patients, it is essential to be able to first operationally define, and then accurately measure, diagnostic errors and the process failures that contribute to these errors in a standardized way that is reproducible across different settings.6,44 There are a number of obstacles in this endeavor.
A fundamental problem is that establishing a diagnosis is not a single act but a process. Patterns of symptoms and clinical presentations often differ for the same disease. Information required to make a diagnosis is usually gathered in stages, where the clinician obtains additional data, while considering many possibilities, of which 1 may be ultimately correct. Diagnoses evolve over time and in different care settings. “The most likely diagnosis” is not always the same as “the final correct diagnosis.” Moreover, the diagnostic process is influenced by patients’ individual clinical courses and preferences over time. This makes determination of missed, delayed, or incorrect diagnoses challenging.45,46
For hospitalized patients, generally the goal is to first rule out more serious and acute conditions (eg, pulmonary embolism or stroke), even if their probability is rather low. Conversely, a diagnosis that appears less consequential if delayed (eg, chronic anemia of unclear etiology) might not be pursued on an urgent basis, and is often left to outpatient providers to examine, but still may manifest in downstream harm (eg, delayed diagnosis of gastrointestinal malignancy or recurrent admissions for heart failure due to missed iron-deficiency anemia). Therefore, coming up with disease diagnosis likelihoods in hindsight may turn out to be highly subjective and not always accurate. This can be particularly difficult when clinician and other team deliberations are not recorded in their entirety.47
Another hurdle in the practice of diagnostic medicine is to preserve the balance between underdiagnosing versus pursuing overly aggressive diagnostic approaches. Conducting laboratory, imaging, or other diagnostic studies without a clear shared understanding of how they would affect clinical decision-making (eg, use of prostate-specific antigen to detect prostate cancer) not only leads to increased costs but can also delay appropriate care. Worse, subsequent unnecessary diagnostic tests and treatments can sometimes lead to serious harm.48,49
Finally, retrospective reviews by clinicians are subject to multiple potential limitations that include failure to create well-defined research questions, poorly developed inclusion and exclusion criteria, and issues related to inter- and intra-rater reliability.50 These methodological deficiencies can occur despite following "best practice" guidelines during the study planning, execution, and analysis phases. They further add to the challenge of defining and measuring diagnostic errors.47
Strategies to Improve Measurement of Diagnostic Errors
Development of new methodologies to reliably measure diagnostic errors is an area of active research. The advancement of uniform and universally agreed-upon frameworks to define and identify process failure points and diagnostic errors would help reduce measurement error and support development and testing of interventions that could be generalizable across different health care settings. To more accurately define and measure diagnostic errors, several novel approaches have been proposed (Table 2).

The Safer Dx framework is an all-round tool developed to advance the discipline of measuring diagnostic errors. For an episode of care under review, the instrument scores various items to determine the likelihood of a diagnostic error. These items evaluate multiple dimensions affecting diagnostic performance and measurements across 3 broad domains: structure (provider and organizational characteristics—from everyone involved with patient care, to computing infrastructure, to policies and regulations), process (elements of the patient-provider encounter, diagnostic test performance and follow-up, and subspecialty- and referral-specific factors), and outcome (establishing accurate and timely diagnosis as opposed to missed, delayed, or incorrect diagnosis). This instrument has been revised and can be further modified by a variety of stakeholders, including clinicians, health care organizations, and policymakers, to identify potential diagnostic errors in a standardized way for patient safety and quality improvement research.51,52
Use of standardized tools, such as the Diagnosis Error Evaluation and Research (DEER) taxonomy, can help to identify and classify specific failure points across different diagnostic process dimensions.37 These failure points can be classified into: issues related to patient presentation or access to health care; failure to obtain or misinterpretation of history or physical exam findings; errors in use of diagnostics tests due to technical or clinician-related factors; failures in appropriate weighing of evidence and hypothesis generation; errors associated with referral or consultation process; and failure to monitor the patient or obtain timely follow-up.34 The DEER taxonomy can also be modified based on specific research questions and study populations. Further, it can be recategorized to correspond to Safer Dx framework diagnostic process dimensions to provide insights into reasons for specific process failures and to develop new interventions to mitigate errors and patient harm.6
Since a majority of diagnostic errors do not lead to actual harm, use of “triggers” or clues (eg, procedure-related complications, patient falls, transfers to a higher level of care, readmissions within 30 days) can be a more efficient method to identify diagnostic errors and adverse events that do cause harm. The Global Trigger Tool, developed by the Institute for Healthcare Improvement, uses this strategy. This tool has been shown to identify a significantly higher number of serious adverse events than comparable methods.53 This facilitates selection and development of strategies at the institutional level that are most likely to improve patient outcomes.24
Encouraging and facilitating voluntary or prompted reporting from patients and clinicians can also play an important role in capturing diagnostic errors. Patients and clinicians are not only the key stakeholders but are also uniquely placed within the diagnostic process to detect and report potential errors.25,54 Patient-safety-event reporting systems, such as RL6, play a vital role in reporting near-misses and adverse events. These systems provide a mechanism for team members at all levels within the hospital to contribute toward reporting patient adverse events, including those arising from diagnostic errors.55 The Hospital Consumer Assessment of Healthcare Providers and Systems (HCAHPS) survey is the first standardized, nationally reported patient survey designed to measure patients’ perceptions of their hospital experience. The US Centers for Medicare and Medicaid Services (CMS) publishes HCAHPS results on its website 4 times a year, which serves as an important incentive for hospitals to improve patient safety and quality of health care delivery.56
Another novel approach links multiple symptoms to a range of target diseases using the Symptom-Disease Pair Analysis of Diagnostic Error (SPADE) framework. Using “big data” technologies, this technique can help discover otherwise hidden symptom-disease links and improve overall diagnostic performance. This approach is proposed for both case-control (look-back) and cohort (look-forward) studies assessing diagnostic errors and misdiagnosis-related harms. For example, starting with a known diagnosis with high potential for harm (eg, stroke), the “look-back” approach can be used to identify high-risk symptoms (eg, dizziness, vertigo). In the “look-forward” approach, a single symptom or exposure risk factor known to be frequently misdiagnosed (eg, dizziness) can be analyzed to identify potential adverse disease outcomes (eg, stroke, migraine).57
Many large ongoing studies looking at diagnostic errors among hospitalized patients, such as Utility of Predictive Systems to identify Inpatient Diagnostic Errors (UPSIDE),58Patient Safety Learning Lab (PSLL),59 and Achieving Diagnostic Excellence through Prevention and Teamwork (ADEPT),60 are using structured chart review methodologies incorporating many of the above strategies in combination. Cases triggered by certain events (eg, ICU transfer, death, rapid response event, new or worsening acute kidney injury) are reviewed using validated tools, including Safer Dx framework and DEER taxonomy, to provide the most precise estimates of the burden of diagnostic errors in hospitalized patients. These estimates may be much higher than previously predicted using traditional chart review approaches.6,24 For example, a recently published study of 2809 random admissions in 11 Massachusetts hospitals identified 978 adverse events but only 10 diagnostic errors (diagnostic error rate, 0.4%).19 This was likely because the trigger method used in the study did not specifically examine the diagnostic process as critically as done by the Safer Dx framework and DEER taxonomy tools, thereby underestimating the total number of diagnostic errors. Further, these ongoing studies (eg, UPSIDE, ADEPT) aim to employ new and upcoming advanced machine-learning methods to create models that can improve overall diagnostic performance. This would pave the way to test and build novel, efficient, and scalable interventions to reduce diagnostic errors and improve patient outcomes.
Strategies to Improve Diagnostic Safety in Hospitalized Patients
Disease-specific biomedical research, as well as advances in laboratory, imaging, and other technologies, play a critical role in improving diagnostic accuracy. However, these technical approaches do not address many of the broader clinician- and system-level failure points and opportunities for improvement. Various patient-, provider-, and organizational-level interventions that could make diagnostic processes more resilient and reduce the risk of error and patient harm have been proposed.61
Among these strategies are approaches to empower patients and their families. Fostering therapeutic relationships between patients and members of the care team is essential to reducing diagnostic errors.62 Facilitating timely access to health records, ensuring transparency in decision making, and tailoring communication strategies to patients’ cultural and educational backgrounds can reduce harm.63 Similarly, at the system level, enhancing communication among different providers by use of tools such as structured handoffs can prevent communication breakdowns and facilitate positive outcomes.64
Interventions targeted at individual health care providers, such as educational programs to improve content-specific knowledge, can enhance diagnostic performance. Regular feedback, strategies to enhance equity, and fostering an environment where all providers are actively encouraged to think critically and participate in the diagnostic process (training programs to use “diagnostic time-outs” and making it a “team sport”) can improve clinical reasoning.65,66 Use of standardized patients can help identify individual-level cognitive failure points and facilitate creation of new interventions to improve clinical decision-making processes.67
Novel health information technologies can further augment these efforts. These include effective documentation by maintaining dynamic and accurate patient histories, problem lists, and medication lists68-70; use of electronic health record–based algorithms to identify potential diagnostic delays for serious conditions71,72; use of telemedicine technologies to improve accessibility and coordination73;application of mobile health and wearable technologies to facilitate data-gathering and care delivery74,75; and use of computerized decision-support tools, including applications to interpret electrocardiograms, imaging studies, and other diagnostic tests.76
Use of precision medicine, powered by new artificial intelligence (AI) tools, is becoming more widespread. Algorithms powered by AI can augment and sometimes even outperform clinician decision-making in areas such as oncology, radiology, and primary care.77 Creation of large biobanks like the All of Us research program can be used to study thousands of environmental and genetic risk factors and health conditions simultaneously, and help identify specific treatments that work best for people of different backgrounds.78 Active research in these areas holds great promise in terms of how and when we diagnose diseases and make appropriate preventative and treatment decisions. Significant scientific, ethical, and regulatory challenges will need to be overcome before these technologies can address some of the most complex problems in health care.79
Finally, diagnostic performance is affected by the external environment, including the functioning of the medical liability system. Diagnostic errors that lead to patient harm are a leading cause of malpractice claims.80 Developing a legal environment, in collaboration with patient advocacy groups and health care organizations, that promotes and facilitates timely disclosure of diagnostic errors could decrease the incentive to hide errors, advance care processes, and improve outcomes.81,82
Conclusion
The burden of diagnostic errors in hospitalized patients is unacceptably high and remains an underemphasized cause of preventable morbidity and mortality. Diagnostic errors often result from a breakdown in multiple interdependent processes that involve patient-, provider-, and system-level factors. Significant challenges remain in defining and identifying diagnostic errors as well as underlying process-failure points. The most effective interventions to reduce diagnostic errors will require greater patient participation in the diagnostic process and a mix of evidence-based interventions that promote individual-provider excellence as well as system-level changes. Further research and collaboration among various stakeholders should help improve diagnostic safety for hospitalized patients.
Corresponding author: Abhishek Goyal, MD, MPH; agoyal4@bwh.harvard.edu
Disclosures: Dr. Dalal disclosed receiving income ≥ $250 from MayaMD.
1. Graber ML, Franklin N, Gordon R. Diagnostic error in internal medicine. Arch Intern Med. 2005;165(13):1493-1499. doi:10.1001/archinte.165.13.1493
2. National Academies of Sciences, Engineering, and Medicine. 2015. Improving Diagnosis in Health Care. The National Academies Press. doi:10.17226/21794
3. Singh H, Graber ML. Improving diagnosis in health care—the next imperative for patient safety. N Engl J Med. 2015;373(26):2493-2495. doi:10.1056/NEJMp1512241
4. Makary MA, Daniel M. Medical error—the third leading cause of death in the US. BMJ. 2016;353:i2139. doi:10.1136/bmj.i2139
5. Flanders SA, Centor B, Weber V, McGinn T, Desalvo K, Auerbach A. Challenges and opportunities in academic hospital medicine: report from the academic hospital medicine summit. J Gen Intern Med. 2009;24(5):636-641. doi:10.1007/s11606-009-0944-6
6. Griffin JA, Carr K, Bersani K, et al. Analyzing diagnostic errors in the acute setting: a process-driven approach. Diagnosis (Berl). 2021;9(1):77-88. doi:10.1515/dx-2021-0033
7. Itri JN, Tappouni RR, McEachern RO, Pesch AJ, Patel SH. Fundamentals of diagnostic error in imaging. RadioGraphics. 2018;38(6):1845-1865. doi:10.1148/rg.2018180021
8. Hammerling JA. A Review of medical errors in laboratory diagnostics and where we are today. Lab Med. 2012;43(2):41-44. doi:10.1309/LM6ER9WJR1IHQAUY
9. Gunderson CG, Bilan VP, Holleck JL, et al. Prevalence of harmful diagnostic errors in hospitalised adults: a systematic review and meta-analysis. BMJ Qual Saf. 2020;29(12):1008-1018. doi:10.1136/bmjqs-2019-010822
10. Brennan TA, Leape LL, Laird NM, et al. Incidence of adverse events and negligence in hospitalized patients. Results of the Harvard Medical Practice Study I. N Engl J Med. 1991;324(6):370-376. doi:10.1056/NEJM199102073240604
11. Leape LL, Brennan TA, Laird N, et al. The nature of adverse events in hospitalized patients. Results of the Harvard Medical Practice Study II. N Engl J Med. 1991;324(6):377-384. doi:10.1056/NEJM199102073240605
12. Localio AR, Lawthers AG, Brennan TA, et al. Relation between malpractice claims and adverse events due to negligence. Results of the Harvard Medical Practice Study III. N Engl J Med. 1991;325(4):245-251. doi:10.1056/NEJM199107253250405
13. Wilson RM, Michel P, Olsen S, et al. Patient safety in developing countries: retrospective estimation of scale and nature of harm to patients in hospital. BMJ. 2012;344:e832. doi:10.1136/bmj.e832
14. Wilson RM, Runciman WB, Gibberd RW, Harrison BT, Newby L, Hamilton JD. The Quality in Australian Health Care Study. Med J Aust. 1995;163(9):458-471. doi:10.5694/j.1326-5377.1995.tb124691.x
15. Thomas EJ, Studdert DM, Burstin HR, et al. Incidence and types of adverse events and negligent care in Utah and Colorado. Med Care. 2000;38(3):261-271. doi:10.1097/00005650-200003000-00003
16. Baker GR, Norton PG, Flintoft V, et al. The Canadian Adverse Events Study: the incidence of adverse events among hospital patients in Canada. CMAJ. 2004;170(11):1678-1686. doi:10.1503/cmaj.1040498
17. Davis P, Lay-Yee R, Briant R, Ali W, Scott A, Schug S. Adverse events in New Zealand public hospitals II: preventability and clinical context. N Z Med J. 2003;116(1183):U624.
18. Aranaz-Andrés JM, Aibar-Remón C, Vitaller-Murillo J, et al. Incidence of adverse events related to health care in Spain: results of the Spanish National Study of Adverse Events. J Epidemiol Community Health. 2008;62(12):1022-1029. doi:10.1136/jech.2007.065227
19. Bates DW, Levine DM, Salmasian H, et al. The safety of inpatient health care. N Engl J Med. 2023;388(2):142-153. doi:10.1056/NEJMsa2206117
20. Soop M, Fryksmark U, Köster M, Haglund B. The incidence of adverse events in Swedish hospitals: a retrospective medical record review study. Int J Qual Health Care. 2009;21(4):285-291. doi:10.1093/intqhc/mzp025
21. Rafter N, Hickey A, Conroy RM, et al. The Irish National Adverse Events Study (INAES): the frequency and nature of adverse events in Irish hospitals—a retrospective record review study. BMJ Qual Saf. 2017;26(2):111-119. doi:10.1136/bmjqs-2015-004828
22. Blendon RJ, DesRoches CM, Brodie M, et al. Views of practicing physicians and the public on medical errors. N Engl J Med. 2002;347(24):1933-1940. doi:10.1056/NEJMsa022151
23. Saber Tehrani AS, Lee H, Mathews SC, et al. 25-year summary of US malpractice claims for diagnostic errors 1986-2010: an analysis from the National Practitioner Data Bank. BMJ Qual Saf. 2013;22(8):672-680. doi:10.1136/bmjqs-2012-001550
24. Malik MA, Motta-Calderon D, Piniella N, et al. A structured approach to EHR surveillance of diagnostic error in acute care: an exploratory analysis of two institutionally-defined case cohorts. Diagnosis (Berl). 2022;9(4):446-457. doi:10.1515/dx-2022-0032
25. Graber ML. The incidence of diagnostic error in medicine. BMJ Qual Saf. 2013;22(suppl 2):ii21-ii27. doi:10.1136/bmjqs-2012-001615
26. Bergl PA, Taneja A, El-Kareh R, Singh H, Nanchal RS. Frequency, risk factors, causes, and consequences of diagnostic errors in critically ill medical patients: a retrospective cohort study. Crit Care Med. 2019;47(11):e902-e910. doi:10.1097/CCM.0000000000003976
27. Hogan H, Healey F, Neale G, Thomson R, Vincent C, Black N. Preventable deaths due to problems in care in English acute hospitals: a retrospective case record review study. BMJ Qual Saf. 2012;21(9):737-745. doi:10.1136/bmjqs-2011-001159
28. Bergl PA, Nanchal RS, Singh H. Diagnostic error in the critically ill: defining the problem and exploring next steps to advance intensive care unit safety. Ann Am Thorac Soc. 2018;15(8):903-907. doi:10.1513/AnnalsATS.201801-068PS
29. Marquet K, Claes N, De Troy E, et al. One fourth of unplanned transfers to a higher level of care are associated with a highly preventable adverse event: a patient record review in six Belgian hospitals. Crit Care Med. 2015;43(5):1053-1061. doi:10.1097/CCM.0000000000000932
30. Rodwin BA, Bilan VP, Merchant NB, et al. Rate of preventable mortality in hospitalized patients: a systematic review and meta-analysis. J Gen Intern Med. 2020;35(7):2099-2106. doi:10.1007/s11606-019-05592-5
31. Winters B, Custer J, Galvagno SM, et al. Diagnostic errors in the intensive care unit: a systematic review of autopsy studies. BMJ Qual Saf. 2012;21(11):894-902. doi:10.1136/bmjqs-2012-000803
32. Raffel KE, Kantor MA, Barish P, et al. Prevalence and characterisation of diagnostic error among 7-day all-cause hospital medicine readmissions: a retrospective cohort study. BMJ Qual Saf. 2020;29(12):971-979. doi:10.1136/bmjqs-2020-010896
33. Weingart SN, Pagovich O, Sands DZ, et al. What can hospitalized patients tell us about adverse events? learning from patient-reported incidents. J Gen Intern Med. 2005;20(9):830-836. doi:10.1111/j.1525-1497.2005.0180.x
34. Schiff GD, Hasan O, Kim S, et al. Diagnostic error in medicine: analysis of 583 physician-reported errors. Arch Intern Med. 2009;169(20):1881-1887. doi:10.1001/archinternmed.2009.333
35. Singh H, Schiff GD, Graber ML, Onakpoya I, Thompson MJ. The global burden of diagnostic errors in primary care. BMJ Qual Saf. 2017;26(6):484-494. doi:10.1136/bmjqs-2016-005401
36. Schiff GD, Leape LL. Commentary: how can we make diagnosis safer? Acad Med J Assoc Am Med Coll. 2012;87(2):135-138. doi:10.1097/ACM.0b013e31823f711c
37. Schiff GD, Kim S, Abrams R, et al. Diagnosing diagnosis errors: lessons from a multi-institutional collaborative project. In: Henriksen K, Battles JB, Marks ES, Lewin DI, eds. Advances in Patient Safety: From Research to Implementation. Volume 2: Concepts and Methodology. AHRQ Publication No. 05-0021-2. Agency for Healthcare Research and Quality (US); 2005. Accessed January 16, 2023. http://www.ncbi.nlm.nih.gov/books/NBK20492/
38. Newman-Toker DE. A unified conceptual model for diagnostic errors: underdiagnosis, overdiagnosis, and misdiagnosis. Diagnosis (Berl). 2014;1(1):43-48. doi:10.1515/dx-2013-0027
39. Abimanyi-Ochom J, Bohingamu Mudiyanselage S, Catchpool M, Firipis M, Wanni Arachchige Dona S, Watts JJ. Strategies to reduce diagnostic errors: a systematic review. BMC Med Inform Decis Mak. 2019;19(1):174. doi:10.1186/s12911-019-0901-1
40. Gupta A, Harrod M, Quinn M, et al. Mind the overlap: how system problems contribute to cognitive failure and diagnostic errors. Diagnosis (Berl). 2018;5(3):151-156. doi:10.1515/dx-2018-0014
41. Saposnik G, Redelmeier D, Ruff CC, Tobler PN. Cognitive biases associated with medical decisions: a systematic review. BMC Med Inform Decis Mak. 2016;16:138. doi:10.1186/s12911-016-0377-1
42. Croskerry P. The importance of cognitive errors in diagnosis and strategies to minimize them. Acad Med. 2003;78(8):775-780. doi: 10.1097/00001888-200308000-00003
43. Chapman EN, Kaatz A, Carnes M. Physicians and implicit bias: how doctors may unwittingly perpetuate health care disparities. J Gen Intern Med. 2013;28(11):1504-1510. doi:10.1007/s11606-013-2441-1
44. Zwaan L, Singh H. The challenges in defining and measuring diagnostic error. Diagnosis (Ber). 2015;2(2):97-103. doi:10.1515/dx-2014-0069
45. Arkes HR, Wortmann RL, Saville PD, Harkness AR. Hindsight bias among physicians weighing the likelihood of diagnoses. J Appl Psychol. 1981;66(2):252-254.
46. Singh H. Editorial: Helping health care organizations to define diagnostic errors as missed opportunities in diagnosis. Jt Comm J Qual Patient Saf. 2014;40(3):99-101. doi:10.1016/s1553-7250(14)40012-6
47. Vassar M, Holzmann M. The retrospective chart review: important methodological considerations. J Educ Eval Health Prof. 2013;10:12. doi:10.3352/jeehp.2013.10.12
48. Welch HG, Black WC. Overdiagnosis in cancer. J Natl Cancer Inst. 2010;102(9):605-613. doi:10.1093/jnci/djq099
49. Moynihan R, Doust J, Henry D. Preventing overdiagnosis: how to stop harming the healthy. BMJ. 2012;344:e3502. doi:10.1136/bmj.e3502
50. Hayward RA, Hofer TP. Estimating hospital deaths due to medical errors: preventability is in the eye of the reviewer. JAMA. 2001;286(4):415-420. doi:10.1001/jama.286.4.415
51. Singh H, Sittig DF. Advancing the science of measurement of diagnostic errors in healthcare: the Safer Dx framework. BMJ Qual Saf. 2015;24(2):103-110. doi:10.1136/bmjqs-2014-003675
52. Singh H, Khanna A, Spitzmueller C, Meyer AND. Recommendations for using the Revised Safer Dx Instrument to help measure and improve diagnostic safety. Diagnosis (Berl). 2019;6(4):315-323. doi:10.1515/dx-2019-0012
53. Classen DC, Resar R, Griffin F, et al. “Global trigger tool” shows that adverse events in hospitals may be ten times greater than previously measured. Health Aff (Millwood). 2011;30(4):581-589. doi:10.1377/hlthaff.2011.0190
54. Schiff GD. Minimizing diagnostic error: the importance of follow-up and feedback. Am J Med. 2008;121(5 suppl):S38-S42. doi:10.1016/j.amjmed.2008.02.004
55. Mitchell I, Schuster A, Smith K, Pronovost P, Wu A. Patient safety incident reporting: a qualitative study of thoughts and perceptions of experts 15 years after “To Err is Human.” BMJ Qual Saf. 2016;25(2):92-99. doi:10.1136/bmjqs-2015-004405
56. Mazurenko O, Collum T, Ferdinand A, Menachemi N. Predictors of hospital patient satisfaction as measured by HCAHPS: a systematic review. J Healthc Manag. 2017;62(4):272-283. doi:10.1097/JHM-D-15-00050
57. Liberman AL, Newman-Toker DE. Symptom-Disease Pair Analysis of Diagnostic Error (SPADE): a conceptual framework and methodological approach for unearthing misdiagnosis-related harms using big data. BMJ Qual Saf. 2018;27(7):557-566. doi:10.1136/bmjqs-2017-007032
58. Utility of Predictive Systems to Identify Inpatient Diagnostic Errors: the UPSIDE study. NIH RePort/RePORTER. Accessed January 14, 2023. https://reporter.nih.gov/search/rpoHXlEAcEudQV3B9ld8iw/project-details/10020962
59. Overview of Patient Safety Learning Laboratory (PSLL) Projects. Agency for Healthcare Research and Quality. Accessed January 14, 2023. https://www.ahrq.gov/patient-safety/resources/learning-lab/index.html
60. Achieving Diagnostic Excellence through Prevention and Teamwork (ADEPT). NIH RePort/RePORTER. Accessed January 14, 2023. https://reporter.nih.gov/project-details/10642576
61. Zwaan L, Singh H. Diagnostic error in hospitals: finding forests not just the big trees. BMJ Qual Saf. 2020;29(12):961-964. doi:10.1136/bmjqs-2020-011099
62. Longtin Y, Sax H, Leape LL, Sheridan SE, Donaldson L, Pittet D. Patient participation: current knowledge and applicability to patient safety. Mayo Clin Proc. 2010;85(1):53-62. doi:10.4065/mcp.2009.0248
63. Murphy DR, Singh H, Berlin L. Communication breakdowns and diagnostic errors: a radiology perspective. Diagnosis (Berl). 2014;1(4):253-261. doi:10.1515/dx-2014-0035
64. Singh H, Naik AD, Rao R, Petersen LA. Reducing diagnostic errors through effective communication: harnessing the power of information technology. J Gen Intern Med. 2008;23(4):489-494. doi:10.1007/s11606-007-0393-z
65. Singh H, Connor DM, Dhaliwal G. Five strategies for clinicians to advance diagnostic excellence. BMJ. 2022;376:e068044. doi:10.1136/bmj-2021-068044
66. Yale S, Cohen S, Bordini BJ. Diagnostic time-outs to improve diagnosis. Crit Care Clin. 2022;38(2):185-194. doi:10.1016/j.ccc.2021.11.008
67. Schwartz A, Peskin S, Spiro A, Weiner SJ. Impact of unannounced standardized patient audit and feedback on care, documentation, and costs: an experiment and claims analysis. J Gen Intern Med. 2021;36(1):27-34. doi:10.1007/s11606-020-05965-1
68. Carpenter JD, Gorman PN. Using medication list—problem list mismatches as markers of potential error. Proc AMIA Symp. 2002:106-110.
69. Hron JD, Manzi S, Dionne R, et al. Electronic medication reconciliation and medication errors. Int J Qual Health Care. 2015;27(4):314-319. doi:10.1093/intqhc/mzv046
70. Graber ML, Siegal D, Riah H, Johnston D, Kenyon K. Electronic health record–related events in medical malpractice claims. J Patient Saf. 2019;15(2):77-85. doi:10.1097/PTS.0000000000000240
71. Murphy DR, Wu L, Thomas EJ, Forjuoh SN, Meyer AND, Singh H. Electronic trigger-based intervention to reduce delays in diagnostic evaluation for cancer: a cluster randomized controlled trial. J Clin Oncol. 2015;33(31):3560-3567. doi:10.1200/JCO.2015.61.1301
72. Singh H, Giardina TD, Forjuoh SN, et al. Electronic health record-based surveillance of diagnostic errors in primary care. BMJ Qual Saf. 2012;21(2):93-100. doi:10.1136/bmjqs-2011-000304
73. Armaignac DL, Saxena A, Rubens M, et al. Impact of telemedicine on mortality, length of stay, and cost among patients in progressive care units: experience from a large healthcare system. Crit Care Med. 2018;46(5):728-735. doi:10.1097/CCM.0000000000002994
74. MacKinnon GE, Brittain EL. Mobile health technologies in cardiopulmonary disease. Chest. 2020;157(3):654-664. doi:10.1016/j.chest.2019.10.015
75. DeVore AD, Wosik J, Hernandez AF. The future of wearables in heart failure patients. JACC Heart Fail. 2019;7(11):922-932. doi:10.1016/j.jchf.2019.08.008
76. Tsai TL, Fridsma DB, Gatti G. Computer decision support as a source of interpretation error: the case of electrocardiograms. J Am Med Inform Assoc. 2003;10(5):478-483. doi:10.1197/jamia.M1279
77. Lin SY, Mahoney MR, Sinsky CA. Ten ways artificial intelligence will transform primary care. J Gen Intern Med. 2019;34(8):1626-1630. doi:10.1007/s11606-019-05035-1
78. Ramirez AH, Gebo KA, Harris PA. Progress with the All Of Us research program: opening access for researchers. JAMA. 2021;325(24):2441-2442. doi:10.1001/jama.2021.7702
79. Johnson KB, Wei W, Weeraratne D, et al. Precision medicine, AI, and the future of personalized health care. Clin Transl Sci. 2021;14(1):86-93. doi:10.1111/cts.12884
80. Gupta A, Snyder A, Kachalia A, Flanders S, Saint S, Chopra V. Malpractice claims related to diagnostic errors in the hospital. BMJ Qual Saf. 2017;27(1):bmjqs-2017-006774. doi:10.1136/bmjqs-2017-006774
81. Renkema E, Broekhuis M, Ahaus K. Conditions that influence the impact of malpractice litigation risk on physicians’ behavior regarding patient safety. BMC Health Serv Res. 2014;14(1):38. doi:10.1186/1472-6963-14-38
82. Kachalia A, Mello MM, Nallamothu BK, Studdert DM. Legal and policy interventions to improve patient safety. Circulation. 2016;133(7):661-671. doi:10.1161/CIRCULATIONAHA.115.015880
Abstract
Diagnostic errors in hospitalized patients are a leading cause of preventable morbidity and mortality. Significant challenges in defining and measuring diagnostic errors and underlying process failure points have led to considerable variability in reported rates of diagnostic errors and adverse outcomes. In this article, we explore the diagnostic process and its discrete components, emphasizing the centrality of the patient in decision-making as well as the continuous nature of the process. We review the incidence of diagnostic errors in hospitalized patients and different methodological approaches that have been used to arrive at these estimates. We discuss different but interdependent provider- and system-related process-failure points that lead to diagnostic errors. We examine specific challenges related to measurement of diagnostic errors and describe traditional and novel approaches that are being used to obtain the most precise estimates. Finally, we examine various patient-, provider-, and organizational-level interventions that have been proposed to improve diagnostic safety in hospitalized patients.
Keywords: diagnostic error, hospital medicine, patient safety.
Diagnosis is defined as a “pre-existing set of categories agreed upon by the medical profession to designate a specific condition.”1 The diagnostic process involves obtaining a clinical history, performing a physical examination, conducting diagnostic testing, and consulting with other clinical providers to gather data that are relevant to understanding the underlying disease processes. This exercise involves generating hypotheses and updating prior probabilities as more information and evidence become available. Throughout this process of information gathering, integration, and interpretation, there is an ongoing assessment of whether sufficient and necessary knowledge has been obtained to make an accurate diagnosis and provide appropriate treatment.2
Diagnostic error is defined as a missed opportunity to make a timely diagnosis as part of this iterative process, including the failure of communicating the diagnosis to the patient in a timely manner.3 It can be categorized as a missed, delayed, or incorrect diagnosis based on available evidence at the time. Establishing the correct diagnosis has important implications. A timely and precise diagnosis ensures the patient the highest probability of having a positive health outcome that reflects an appropriate understanding of underlying disease processes and is consistent with their overall goals of care.3 When diagnostic errors occur, they can cause patient harm. Adverse events due to medical errors, including diagnostic errors, are estimated to be the third leading cause of death in the United States.4 Most people will experience at least 1 diagnostic error in their lifetime. In the 2015 National Academy of Medicine report Improving Diagnosis in Healthcare, diagnostic errors were identified as a major hazard as well as an opportunity to improve patient outcomes.2
Diagnostic errors during hospitalizations are especially concerning, as they are more likely to be implicated in a wider spectrum of harm, including permanent disability and death. This has become even more relevant for hospital medicine physicians and other clinical providers as they encounter increasing cognitive and administrative workloads, rising dissatisfaction and burnout, and unique obstacles such as night-time scheduling.5
Incidence of Diagnostic Errors in Hospitalized Patients
Several methodological approaches have been used to estimate the incidence of diagnostic errors in hospitalized patients. These include retrospective reviews of a sample of all hospital admissions, evaluations of selected adverse outcomes including autopsy studies, patient and provider surveys, and malpractice claims. Laboratory testing audits and secondary reviews in other diagnostic subspecialities (eg, radiology, pathology, and microbiology) are also essential to improving diagnostic performance in these specialized fields, which in turn affects overall hospital diagnostic error rates.6-8 These diverse approaches provide unique insights regarding our ability to assess the degree to which potential harms, ranging from temporary impairment to permanent disability, to death, are attributable to different failure points in the diagnostic process.
Large retrospective chart reviews of random hospital admissions remain the most accurate way to determine the overall incidence of diagnostic errors in hospitalized patients.9 The Harvard Medical Practice Study, published in 1991, laid the groundwork for measuring the incidence of adverse events in hospitalized patients and assessing their relation to medical error, negligence, and disability. Reviewing 30,121 randomly selected records from 51 randomly selected acute care hospitals in New York State, the study found that adverse events occurred in 3.7% of hospitalizations, diagnostic errors accounted for 13.8% of these events, and these errors were likely attributable to negligence in 74.7% of cases. The study not only outlined individual-level process failures, but also focused attention on some of the systemic causes, setting the agenda for quality improvement research in hospital-based care for years to come.10-12 A recent systematic review and meta-analysis of 22 hospital admission studies found a pooled rate of 0.7% (95% CI, 0.5%-1.1%) for harmful diagnostic errors.9 It found significant variations in the rates of adverse events, diagnostic errors, and range of diagnoses that were missed. This was primarily because of variabilities in pre-test probabilities in detecting diagnostic errors in these specific cohorts, as well as due to heterogeneity in study definitions and methodologies, especially regarding how they defined and measured “diagnostic error.” The analysis, however, did not account for diagnostic errors that were not related to patient harm (missed opportunities); therefore, it likely significantly underestimated the true incidence of diagnostic errors in these study populations. Table 1 summarizes some of key studies that have examined the incidence of harmful diagnostic errors in hospitalized patients.9-21
The chief limitation of reviewing random hospital admissions is that, since overall rates of diagnostic errors are still relatively low, a large number of case reviews are required to identify a sufficient sample of adverse outcomes to gain a meaningful understanding of the underlying process failure points and develop tools for remediation. Patient and provider surveys or data from malpractice claims can be high-yield starting points for research on process errors.22,23 Reviews of enriched cohorts of adverse outcomes, such as rapid-response events, intensive care unit (ICU) transfers, deaths, and hospital readmissions, can be an efficient way to identify process failures that lead to greatest harm. Depending on the research approach and the types of underlying patient populations sampled, rates of diagnostic errors in these high-risk groups have been estimated to be approximately 5% to 20%, or even higher.6,24-31 For example, a retrospective study of 391 cases of unplanned 7-day readmissions found that 5.6% of cases contained at least 1 diagnostic error during the index admission.32 In a study conducted at 6 Belgian acute-care hospitals, 56% of patients requiring an unplanned transfer to a higher level of care were determined to have had an adverse event, and of these adverse events, 12.4% of cases were associated with errors in diagnosis.29 A systematic review of 16 hospital-based studies estimated that 3.1% of all inpatient deaths were likely preventable, which corresponded to 22,165 deaths annually in the United States.30 Another such review of 31 autopsy studies reported that 28% of autopsied ICU patients had at least 1 misdiagnosis; of these diagnostic errors, 8% were classified as potentially lethal, and 15% were considered major but not lethal.31 Significant drawbacks of such enriched cohort studies, however, are their poor generalizability and inability to detect failure points that do not lead to patient harm (near-miss events).33
Causes of Diagnostic Errors in Hospitalized Patients
All aspects of the diagnostic process are susceptible to errors. These errors stem from a variety of faulty processes, including failure of the patient to engage with the health care system (eg, due to lack of insurance or transportation, or delay in seeking care); failure in information gathering (eg, missed history or exam findings, ordering wrong tests, laboratory errors); failure in information interpretation (eg, exam finding or test result misinterpretation); inaccurate hypothesis generation (eg, due to suboptimal prioritization or weighing of supporting evidence); and failure in communication (eg, with other team members or with the patient).2,34 Reasons for diagnostic process failures vary widely across different health care settings. While clinician assessment errors (eg, failure to consider or alternatively overweigh competing diagnoses) and errors in testing and the monitoring phase (eg, failure to order or follow up diagnostic tests) can lead to a majority of diagnostic errors in some patient populations, in other settings, social (eg, poor health literacy, punitive cultural practices) and economic factors (eg, lack of access to appropriate diagnostic tests or to specialty expertise) play a more prominent role.34,35
The Figure describes the relationship between components of the diagnostic process and subsequent outcomes, including diagnostic process failures, diagnostic errors, and absence or presence of patient harm.2,36,37 It reemphasizes the centrality of the patient in decision-making and the continuous nature of the process. The Figure also illustrates that only a minority of process failures result in diagnostic errors, and a smaller proportion of diagnostic errors actually lead to patient harm. Conversely, it also shows that diagnostic errors can happen without any obvious process-failure points, and, similarly, patient harm can take place in the absence of any evident diagnostic errors.36-38 Finally, it highlights the need to incorporate feedback from process failures, diagnostic errors, and favorable and unfavorable patient outcomes in order to inform future quality improvement efforts and research.
A significant proportion of diagnostic errors are due to system-related vulnerabilities, such as limitations in availability, adoption or quality of work force training, health informatics resources, and diagnostic capabilities. Lack of institutional culture that promotes safety and transparency also predisposes to diagnostic errors.39,40 The other major domain of process failures is related to cognitive errors in clinician decision-making. Anchoring, confirmation bias, availability bias, and base-rate neglect are some of the common cognitive biases that, along with personality traits (aversion to risk or ambiguity, overconfidence) and affective biases (influence of emotion on decision-making), often determine the degree of utilization of resources and the possibility of suboptimal diagnostic performance.41,42 Further, implicit biases related to age, race, gender, and sexual orientation contribute to disparities in access to health care and outcomes.43 In a large number of cases of preventable adverse outcomes, however, there are multiple interdependent individual and system-related failure points that lead to diagnostic error and patient harm.6,32
Challenges in Defining and Measuring Diagnostic Errors
In order to develop effective, evidence-based interventions to reduce diagnostic errors in hospitalized patients, it is essential to be able to first operationally define, and then accurately measure, diagnostic errors and the process failures that contribute to these errors in a standardized way that is reproducible across different settings.6,44 There are a number of obstacles in this endeavor.
A fundamental problem is that establishing a diagnosis is not a single act but a process. Patterns of symptoms and clinical presentations often differ for the same disease. Information required to make a diagnosis is usually gathered in stages, where the clinician obtains additional data, while considering many possibilities, of which 1 may be ultimately correct. Diagnoses evolve over time and in different care settings. “The most likely diagnosis” is not always the same as “the final correct diagnosis.” Moreover, the diagnostic process is influenced by patients’ individual clinical courses and preferences over time. This makes determination of missed, delayed, or incorrect diagnoses challenging.45,46
For hospitalized patients, generally the goal is to first rule out more serious and acute conditions (eg, pulmonary embolism or stroke), even if their probability is rather low. Conversely, a diagnosis that appears less consequential if delayed (eg, chronic anemia of unclear etiology) might not be pursued on an urgent basis, and is often left to outpatient providers to examine, but still may manifest in downstream harm (eg, delayed diagnosis of gastrointestinal malignancy or recurrent admissions for heart failure due to missed iron-deficiency anemia). Therefore, coming up with disease diagnosis likelihoods in hindsight may turn out to be highly subjective and not always accurate. This can be particularly difficult when clinician and other team deliberations are not recorded in their entirety.47
Another hurdle in the practice of diagnostic medicine is to preserve the balance between underdiagnosing versus pursuing overly aggressive diagnostic approaches. Conducting laboratory, imaging, or other diagnostic studies without a clear shared understanding of how they would affect clinical decision-making (eg, use of prostate-specific antigen to detect prostate cancer) not only leads to increased costs but can also delay appropriate care. Worse, subsequent unnecessary diagnostic tests and treatments can sometimes lead to serious harm.48,49
Finally, retrospective reviews by clinicians are subject to multiple potential limitations that include failure to create well-defined research questions, poorly developed inclusion and exclusion criteria, and issues related to inter- and intra-rater reliability.50 These methodological deficiencies can occur despite following "best practice" guidelines during the study planning, execution, and analysis phases. They further add to the challenge of defining and measuring diagnostic errors.47
Strategies to Improve Measurement of Diagnostic Errors
Development of new methodologies to reliably measure diagnostic errors is an area of active research. The advancement of uniform and universally agreed-upon frameworks to define and identify process failure points and diagnostic errors would help reduce measurement error and support development and testing of interventions that could be generalizable across different health care settings. To more accurately define and measure diagnostic errors, several novel approaches have been proposed (Table 2).
The Safer Dx framework is an all-round tool developed to advance the discipline of measuring diagnostic errors. For an episode of care under review, the instrument scores various items to determine the likelihood of a diagnostic error. These items evaluate multiple dimensions affecting diagnostic performance and measurements across 3 broad domains: structure (provider and organizational characteristics—from everyone involved with patient care, to computing infrastructure, to policies and regulations), process (elements of the patient-provider encounter, diagnostic test performance and follow-up, and subspecialty- and referral-specific factors), and outcome (establishing accurate and timely diagnosis as opposed to missed, delayed, or incorrect diagnosis). This instrument has been revised and can be further modified by a variety of stakeholders, including clinicians, health care organizations, and policymakers, to identify potential diagnostic errors in a standardized way for patient safety and quality improvement research.51,52
Use of standardized tools, such as the Diagnosis Error Evaluation and Research (DEER) taxonomy, can help to identify and classify specific failure points across different diagnostic process dimensions.37 These failure points can be classified into: issues related to patient presentation or access to health care; failure to obtain or misinterpretation of history or physical exam findings; errors in use of diagnostics tests due to technical or clinician-related factors; failures in appropriate weighing of evidence and hypothesis generation; errors associated with referral or consultation process; and failure to monitor the patient or obtain timely follow-up.34 The DEER taxonomy can also be modified based on specific research questions and study populations. Further, it can be recategorized to correspond to Safer Dx framework diagnostic process dimensions to provide insights into reasons for specific process failures and to develop new interventions to mitigate errors and patient harm.6
Since a majority of diagnostic errors do not lead to actual harm, use of “triggers” or clues (eg, procedure-related complications, patient falls, transfers to a higher level of care, readmissions within 30 days) can be a more efficient method to identify diagnostic errors and adverse events that do cause harm. The Global Trigger Tool, developed by the Institute for Healthcare Improvement, uses this strategy. This tool has been shown to identify a significantly higher number of serious adverse events than comparable methods.53 This facilitates selection and development of strategies at the institutional level that are most likely to improve patient outcomes.24
Encouraging and facilitating voluntary or prompted reporting from patients and clinicians can also play an important role in capturing diagnostic errors. Patients and clinicians are not only the key stakeholders but are also uniquely placed within the diagnostic process to detect and report potential errors.25,54 Patient-safety-event reporting systems, such as RL6, play a vital role in reporting near-misses and adverse events. These systems provide a mechanism for team members at all levels within the hospital to contribute toward reporting patient adverse events, including those arising from diagnostic errors.55 The Hospital Consumer Assessment of Healthcare Providers and Systems (HCAHPS) survey is the first standardized, nationally reported patient survey designed to measure patients’ perceptions of their hospital experience. The US Centers for Medicare and Medicaid Services (CMS) publishes HCAHPS results on its website 4 times a year, which serves as an important incentive for hospitals to improve patient safety and quality of health care delivery.56
Another novel approach links multiple symptoms to a range of target diseases using the Symptom-Disease Pair Analysis of Diagnostic Error (SPADE) framework. Using “big data” technologies, this technique can help discover otherwise hidden symptom-disease links and improve overall diagnostic performance. This approach is proposed for both case-control (look-back) and cohort (look-forward) studies assessing diagnostic errors and misdiagnosis-related harms. For example, starting with a known diagnosis with high potential for harm (eg, stroke), the “look-back” approach can be used to identify high-risk symptoms (eg, dizziness, vertigo). In the “look-forward” approach, a single symptom or exposure risk factor known to be frequently misdiagnosed (eg, dizziness) can be analyzed to identify potential adverse disease outcomes (eg, stroke, migraine).57
Many large ongoing studies looking at diagnostic errors among hospitalized patients, such as Utility of Predictive Systems to identify Inpatient Diagnostic Errors (UPSIDE),58Patient Safety Learning Lab (PSLL),59 and Achieving Diagnostic Excellence through Prevention and Teamwork (ADEPT),60 are using structured chart review methodologies incorporating many of the above strategies in combination. Cases triggered by certain events (eg, ICU transfer, death, rapid response event, new or worsening acute kidney injury) are reviewed using validated tools, including Safer Dx framework and DEER taxonomy, to provide the most precise estimates of the burden of diagnostic errors in hospitalized patients. These estimates may be much higher than previously predicted using traditional chart review approaches.6,24 For example, a recently published study of 2809 random admissions in 11 Massachusetts hospitals identified 978 adverse events but only 10 diagnostic errors (diagnostic error rate, 0.4%).19 This was likely because the trigger method used in the study did not specifically examine the diagnostic process as critically as done by the Safer Dx framework and DEER taxonomy tools, thereby underestimating the total number of diagnostic errors. Further, these ongoing studies (eg, UPSIDE, ADEPT) aim to employ new and upcoming advanced machine-learning methods to create models that can improve overall diagnostic performance. This would pave the way to test and build novel, efficient, and scalable interventions to reduce diagnostic errors and improve patient outcomes.
Strategies to Improve Diagnostic Safety in Hospitalized Patients
Disease-specific biomedical research, as well as advances in laboratory, imaging, and other technologies, play a critical role in improving diagnostic accuracy. However, these technical approaches do not address many of the broader clinician- and system-level failure points and opportunities for improvement. Various patient-, provider-, and organizational-level interventions that could make diagnostic processes more resilient and reduce the risk of error and patient harm have been proposed.61
Among these strategies are approaches to empower patients and their families. Fostering therapeutic relationships between patients and members of the care team is essential to reducing diagnostic errors.62 Facilitating timely access to health records, ensuring transparency in decision making, and tailoring communication strategies to patients’ cultural and educational backgrounds can reduce harm.63 Similarly, at the system level, enhancing communication among different providers by use of tools such as structured handoffs can prevent communication breakdowns and facilitate positive outcomes.64
Interventions targeted at individual health care providers, such as educational programs to improve content-specific knowledge, can enhance diagnostic performance. Regular feedback, strategies to enhance equity, and fostering an environment where all providers are actively encouraged to think critically and participate in the diagnostic process (training programs to use “diagnostic time-outs” and making it a “team sport”) can improve clinical reasoning.65,66 Use of standardized patients can help identify individual-level cognitive failure points and facilitate creation of new interventions to improve clinical decision-making processes.67
Novel health information technologies can further augment these efforts. These include effective documentation by maintaining dynamic and accurate patient histories, problem lists, and medication lists68-70; use of electronic health record–based algorithms to identify potential diagnostic delays for serious conditions71,72; use of telemedicine technologies to improve accessibility and coordination73;application of mobile health and wearable technologies to facilitate data-gathering and care delivery74,75; and use of computerized decision-support tools, including applications to interpret electrocardiograms, imaging studies, and other diagnostic tests.76
Use of precision medicine, powered by new artificial intelligence (AI) tools, is becoming more widespread. Algorithms powered by AI can augment and sometimes even outperform clinician decision-making in areas such as oncology, radiology, and primary care.77 Creation of large biobanks like the All of Us research program can be used to study thousands of environmental and genetic risk factors and health conditions simultaneously, and help identify specific treatments that work best for people of different backgrounds.78 Active research in these areas holds great promise in terms of how and when we diagnose diseases and make appropriate preventative and treatment decisions. Significant scientific, ethical, and regulatory challenges will need to be overcome before these technologies can address some of the most complex problems in health care.79
Finally, diagnostic performance is affected by the external environment, including the functioning of the medical liability system. Diagnostic errors that lead to patient harm are a leading cause of malpractice claims.80 Developing a legal environment, in collaboration with patient advocacy groups and health care organizations, that promotes and facilitates timely disclosure of diagnostic errors could decrease the incentive to hide errors, advance care processes, and improve outcomes.81,82
Conclusion
The burden of diagnostic errors in hospitalized patients is unacceptably high and remains an underemphasized cause of preventable morbidity and mortality. Diagnostic errors often result from a breakdown in multiple interdependent processes that involve patient-, provider-, and system-level factors. Significant challenges remain in defining and identifying diagnostic errors as well as underlying process-failure points. The most effective interventions to reduce diagnostic errors will require greater patient participation in the diagnostic process and a mix of evidence-based interventions that promote individual-provider excellence as well as system-level changes. Further research and collaboration among various stakeholders should help improve diagnostic safety for hospitalized patients.
Corresponding author: Abhishek Goyal, MD, MPH; agoyal4@bwh.harvard.edu
Disclosures: Dr. Dalal disclosed receiving income ≥ $250 from MayaMD.
1. Graber ML, Franklin N, Gordon R. Diagnostic error in internal medicine. Arch Intern Med. 2005;165(13):1493-1499. doi:10.1001/archinte.165.13.1493
2. National Academies of Sciences, Engineering, and Medicine. 2015. Improving Diagnosis in Health Care. The National Academies Press. doi:10.17226/21794
3. Singh H, Graber ML. Improving diagnosis in health care—the next imperative for patient safety. N Engl J Med. 2015;373(26):2493-2495. doi:10.1056/NEJMp1512241
4. Makary MA, Daniel M. Medical error—the third leading cause of death in the US. BMJ. 2016;353:i2139. doi:10.1136/bmj.i2139
5. Flanders SA, Centor B, Weber V, McGinn T, Desalvo K, Auerbach A. Challenges and opportunities in academic hospital medicine: report from the academic hospital medicine summit. J Gen Intern Med. 2009;24(5):636-641. doi:10.1007/s11606-009-0944-6
6. Griffin JA, Carr K, Bersani K, et al. Analyzing diagnostic errors in the acute setting: a process-driven approach. Diagnosis (Berl). 2021;9(1):77-88. doi:10.1515/dx-2021-0033
7. Itri JN, Tappouni RR, McEachern RO, Pesch AJ, Patel SH. Fundamentals of diagnostic error in imaging. RadioGraphics. 2018;38(6):1845-1865. doi:10.1148/rg.2018180021
8. Hammerling JA. A Review of medical errors in laboratory diagnostics and where we are today. Lab Med. 2012;43(2):41-44. doi:10.1309/LM6ER9WJR1IHQAUY
9. Gunderson CG, Bilan VP, Holleck JL, et al. Prevalence of harmful diagnostic errors in hospitalised adults: a systematic review and meta-analysis. BMJ Qual Saf. 2020;29(12):1008-1018. doi:10.1136/bmjqs-2019-010822
10. Brennan TA, Leape LL, Laird NM, et al. Incidence of adverse events and negligence in hospitalized patients. Results of the Harvard Medical Practice Study I. N Engl J Med. 1991;324(6):370-376. doi:10.1056/NEJM199102073240604
11. Leape LL, Brennan TA, Laird N, et al. The nature of adverse events in hospitalized patients. Results of the Harvard Medical Practice Study II. N Engl J Med. 1991;324(6):377-384. doi:10.1056/NEJM199102073240605
12. Localio AR, Lawthers AG, Brennan TA, et al. Relation between malpractice claims and adverse events due to negligence. Results of the Harvard Medical Practice Study III. N Engl J Med. 1991;325(4):245-251. doi:10.1056/NEJM199107253250405
13. Wilson RM, Michel P, Olsen S, et al. Patient safety in developing countries: retrospective estimation of scale and nature of harm to patients in hospital. BMJ. 2012;344:e832. doi:10.1136/bmj.e832
14. Wilson RM, Runciman WB, Gibberd RW, Harrison BT, Newby L, Hamilton JD. The Quality in Australian Health Care Study. Med J Aust. 1995;163(9):458-471. doi:10.5694/j.1326-5377.1995.tb124691.x
15. Thomas EJ, Studdert DM, Burstin HR, et al. Incidence and types of adverse events and negligent care in Utah and Colorado. Med Care. 2000;38(3):261-271. doi:10.1097/00005650-200003000-00003
16. Baker GR, Norton PG, Flintoft V, et al. The Canadian Adverse Events Study: the incidence of adverse events among hospital patients in Canada. CMAJ. 2004;170(11):1678-1686. doi:10.1503/cmaj.1040498
17. Davis P, Lay-Yee R, Briant R, Ali W, Scott A, Schug S. Adverse events in New Zealand public hospitals II: preventability and clinical context. N Z Med J. 2003;116(1183):U624.
18. Aranaz-Andrés JM, Aibar-Remón C, Vitaller-Murillo J, et al. Incidence of adverse events related to health care in Spain: results of the Spanish National Study of Adverse Events. J Epidemiol Community Health. 2008;62(12):1022-1029. doi:10.1136/jech.2007.065227
19. Bates DW, Levine DM, Salmasian H, et al. The safety of inpatient health care. N Engl J Med. 2023;388(2):142-153. doi:10.1056/NEJMsa2206117
20. Soop M, Fryksmark U, Köster M, Haglund B. The incidence of adverse events in Swedish hospitals: a retrospective medical record review study. Int J Qual Health Care. 2009;21(4):285-291. doi:10.1093/intqhc/mzp025
21. Rafter N, Hickey A, Conroy RM, et al. The Irish National Adverse Events Study (INAES): the frequency and nature of adverse events in Irish hospitals—a retrospective record review study. BMJ Qual Saf. 2017;26(2):111-119. doi:10.1136/bmjqs-2015-004828
22. Blendon RJ, DesRoches CM, Brodie M, et al. Views of practicing physicians and the public on medical errors. N Engl J Med. 2002;347(24):1933-1940. doi:10.1056/NEJMsa022151
23. Saber Tehrani AS, Lee H, Mathews SC, et al. 25-year summary of US malpractice claims for diagnostic errors 1986-2010: an analysis from the National Practitioner Data Bank. BMJ Qual Saf. 2013;22(8):672-680. doi:10.1136/bmjqs-2012-001550
24. Malik MA, Motta-Calderon D, Piniella N, et al. A structured approach to EHR surveillance of diagnostic error in acute care: an exploratory analysis of two institutionally-defined case cohorts. Diagnosis (Berl). 2022;9(4):446-457. doi:10.1515/dx-2022-0032
25. Graber ML. The incidence of diagnostic error in medicine. BMJ Qual Saf. 2013;22(suppl 2):ii21-ii27. doi:10.1136/bmjqs-2012-001615
26. Bergl PA, Taneja A, El-Kareh R, Singh H, Nanchal RS. Frequency, risk factors, causes, and consequences of diagnostic errors in critically ill medical patients: a retrospective cohort study. Crit Care Med. 2019;47(11):e902-e910. doi:10.1097/CCM.0000000000003976
27. Hogan H, Healey F, Neale G, Thomson R, Vincent C, Black N. Preventable deaths due to problems in care in English acute hospitals: a retrospective case record review study. BMJ Qual Saf. 2012;21(9):737-745. doi:10.1136/bmjqs-2011-001159
28. Bergl PA, Nanchal RS, Singh H. Diagnostic error in the critically ill: defining the problem and exploring next steps to advance intensive care unit safety. Ann Am Thorac Soc. 2018;15(8):903-907. doi:10.1513/AnnalsATS.201801-068PS
29. Marquet K, Claes N, De Troy E, et al. One fourth of unplanned transfers to a higher level of care are associated with a highly preventable adverse event: a patient record review in six Belgian hospitals. Crit Care Med. 2015;43(5):1053-1061. doi:10.1097/CCM.0000000000000932
30. Rodwin BA, Bilan VP, Merchant NB, et al. Rate of preventable mortality in hospitalized patients: a systematic review and meta-analysis. J Gen Intern Med. 2020;35(7):2099-2106. doi:10.1007/s11606-019-05592-5
31. Winters B, Custer J, Galvagno SM, et al. Diagnostic errors in the intensive care unit: a systematic review of autopsy studies. BMJ Qual Saf. 2012;21(11):894-902. doi:10.1136/bmjqs-2012-000803
32. Raffel KE, Kantor MA, Barish P, et al. Prevalence and characterisation of diagnostic error among 7-day all-cause hospital medicine readmissions: a retrospective cohort study. BMJ Qual Saf. 2020;29(12):971-979. doi:10.1136/bmjqs-2020-010896
33. Weingart SN, Pagovich O, Sands DZ, et al. What can hospitalized patients tell us about adverse events? learning from patient-reported incidents. J Gen Intern Med. 2005;20(9):830-836. doi:10.1111/j.1525-1497.2005.0180.x
34. Schiff GD, Hasan O, Kim S, et al. Diagnostic error in medicine: analysis of 583 physician-reported errors. Arch Intern Med. 2009;169(20):1881-1887. doi:10.1001/archinternmed.2009.333
35. Singh H, Schiff GD, Graber ML, Onakpoya I, Thompson MJ. The global burden of diagnostic errors in primary care. BMJ Qual Saf. 2017;26(6):484-494. doi:10.1136/bmjqs-2016-005401
36. Schiff GD, Leape LL. Commentary: how can we make diagnosis safer? Acad Med J Assoc Am Med Coll. 2012;87(2):135-138. doi:10.1097/ACM.0b013e31823f711c
37. Schiff GD, Kim S, Abrams R, et al. Diagnosing diagnosis errors: lessons from a multi-institutional collaborative project. In: Henriksen K, Battles JB, Marks ES, Lewin DI, eds. Advances in Patient Safety: From Research to Implementation. Volume 2: Concepts and Methodology. AHRQ Publication No. 05-0021-2. Agency for Healthcare Research and Quality (US); 2005. Accessed January 16, 2023. http://www.ncbi.nlm.nih.gov/books/NBK20492/
38. Newman-Toker DE. A unified conceptual model for diagnostic errors: underdiagnosis, overdiagnosis, and misdiagnosis. Diagnosis (Berl). 2014;1(1):43-48. doi:10.1515/dx-2013-0027
39. Abimanyi-Ochom J, Bohingamu Mudiyanselage S, Catchpool M, Firipis M, Wanni Arachchige Dona S, Watts JJ. Strategies to reduce diagnostic errors: a systematic review. BMC Med Inform Decis Mak. 2019;19(1):174. doi:10.1186/s12911-019-0901-1
40. Gupta A, Harrod M, Quinn M, et al. Mind the overlap: how system problems contribute to cognitive failure and diagnostic errors. Diagnosis (Berl). 2018;5(3):151-156. doi:10.1515/dx-2018-0014
41. Saposnik G, Redelmeier D, Ruff CC, Tobler PN. Cognitive biases associated with medical decisions: a systematic review. BMC Med Inform Decis Mak. 2016;16:138. doi:10.1186/s12911-016-0377-1
42. Croskerry P. The importance of cognitive errors in diagnosis and strategies to minimize them. Acad Med. 2003;78(8):775-780. doi: 10.1097/00001888-200308000-00003
43. Chapman EN, Kaatz A, Carnes M. Physicians and implicit bias: how doctors may unwittingly perpetuate health care disparities. J Gen Intern Med. 2013;28(11):1504-1510. doi:10.1007/s11606-013-2441-1
44. Zwaan L, Singh H. The challenges in defining and measuring diagnostic error. Diagnosis (Ber). 2015;2(2):97-103. doi:10.1515/dx-2014-0069
45. Arkes HR, Wortmann RL, Saville PD, Harkness AR. Hindsight bias among physicians weighing the likelihood of diagnoses. J Appl Psychol. 1981;66(2):252-254.
46. Singh H. Editorial: Helping health care organizations to define diagnostic errors as missed opportunities in diagnosis. Jt Comm J Qual Patient Saf. 2014;40(3):99-101. doi:10.1016/s1553-7250(14)40012-6
47. Vassar M, Holzmann M. The retrospective chart review: important methodological considerations. J Educ Eval Health Prof. 2013;10:12. doi:10.3352/jeehp.2013.10.12
48. Welch HG, Black WC. Overdiagnosis in cancer. J Natl Cancer Inst. 2010;102(9):605-613. doi:10.1093/jnci/djq099
49. Moynihan R, Doust J, Henry D. Preventing overdiagnosis: how to stop harming the healthy. BMJ. 2012;344:e3502. doi:10.1136/bmj.e3502
50. Hayward RA, Hofer TP. Estimating hospital deaths due to medical errors: preventability is in the eye of the reviewer. JAMA. 2001;286(4):415-420. doi:10.1001/jama.286.4.415
51. Singh H, Sittig DF. Advancing the science of measurement of diagnostic errors in healthcare: the Safer Dx framework. BMJ Qual Saf. 2015;24(2):103-110. doi:10.1136/bmjqs-2014-003675
52. Singh H, Khanna A, Spitzmueller C, Meyer AND. Recommendations for using the Revised Safer Dx Instrument to help measure and improve diagnostic safety. Diagnosis (Berl). 2019;6(4):315-323. doi:10.1515/dx-2019-0012
53. Classen DC, Resar R, Griffin F, et al. “Global trigger tool” shows that adverse events in hospitals may be ten times greater than previously measured. Health Aff (Millwood). 2011;30(4):581-589. doi:10.1377/hlthaff.2011.0190
54. Schiff GD. Minimizing diagnostic error: the importance of follow-up and feedback. Am J Med. 2008;121(5 suppl):S38-S42. doi:10.1016/j.amjmed.2008.02.004
55. Mitchell I, Schuster A, Smith K, Pronovost P, Wu A. Patient safety incident reporting: a qualitative study of thoughts and perceptions of experts 15 years after “To Err is Human.” BMJ Qual Saf. 2016;25(2):92-99. doi:10.1136/bmjqs-2015-004405
56. Mazurenko O, Collum T, Ferdinand A, Menachemi N. Predictors of hospital patient satisfaction as measured by HCAHPS: a systematic review. J Healthc Manag. 2017;62(4):272-283. doi:10.1097/JHM-D-15-00050
57. Liberman AL, Newman-Toker DE. Symptom-Disease Pair Analysis of Diagnostic Error (SPADE): a conceptual framework and methodological approach for unearthing misdiagnosis-related harms using big data. BMJ Qual Saf. 2018;27(7):557-566. doi:10.1136/bmjqs-2017-007032
58. Utility of Predictive Systems to Identify Inpatient Diagnostic Errors: the UPSIDE study. NIH RePort/RePORTER. Accessed January 14, 2023. https://reporter.nih.gov/search/rpoHXlEAcEudQV3B9ld8iw/project-details/10020962
59. Overview of Patient Safety Learning Laboratory (PSLL) Projects. Agency for Healthcare Research and Quality. Accessed January 14, 2023. https://www.ahrq.gov/patient-safety/resources/learning-lab/index.html
60. Achieving Diagnostic Excellence through Prevention and Teamwork (ADEPT). NIH RePort/RePORTER. Accessed January 14, 2023. https://reporter.nih.gov/project-details/10642576
61. Zwaan L, Singh H. Diagnostic error in hospitals: finding forests not just the big trees. BMJ Qual Saf. 2020;29(12):961-964. doi:10.1136/bmjqs-2020-011099
62. Longtin Y, Sax H, Leape LL, Sheridan SE, Donaldson L, Pittet D. Patient participation: current knowledge and applicability to patient safety. Mayo Clin Proc. 2010;85(1):53-62. doi:10.4065/mcp.2009.0248
63. Murphy DR, Singh H, Berlin L. Communication breakdowns and diagnostic errors: a radiology perspective. Diagnosis (Berl). 2014;1(4):253-261. doi:10.1515/dx-2014-0035
64. Singh H, Naik AD, Rao R, Petersen LA. Reducing diagnostic errors through effective communication: harnessing the power of information technology. J Gen Intern Med. 2008;23(4):489-494. doi:10.1007/s11606-007-0393-z
65. Singh H, Connor DM, Dhaliwal G. Five strategies for clinicians to advance diagnostic excellence. BMJ. 2022;376:e068044. doi:10.1136/bmj-2021-068044
66. Yale S, Cohen S, Bordini BJ. Diagnostic time-outs to improve diagnosis. Crit Care Clin. 2022;38(2):185-194. doi:10.1016/j.ccc.2021.11.008
67. Schwartz A, Peskin S, Spiro A, Weiner SJ. Impact of unannounced standardized patient audit and feedback on care, documentation, and costs: an experiment and claims analysis. J Gen Intern Med. 2021;36(1):27-34. doi:10.1007/s11606-020-05965-1
68. Carpenter JD, Gorman PN. Using medication list—problem list mismatches as markers of potential error. Proc AMIA Symp. 2002:106-110.
69. Hron JD, Manzi S, Dionne R, et al. Electronic medication reconciliation and medication errors. Int J Qual Health Care. 2015;27(4):314-319. doi:10.1093/intqhc/mzv046
70. Graber ML, Siegal D, Riah H, Johnston D, Kenyon K. Electronic health record–related events in medical malpractice claims. J Patient Saf. 2019;15(2):77-85. doi:10.1097/PTS.0000000000000240
71. Murphy DR, Wu L, Thomas EJ, Forjuoh SN, Meyer AND, Singh H. Electronic trigger-based intervention to reduce delays in diagnostic evaluation for cancer: a cluster randomized controlled trial. J Clin Oncol. 2015;33(31):3560-3567. doi:10.1200/JCO.2015.61.1301
72. Singh H, Giardina TD, Forjuoh SN, et al. Electronic health record-based surveillance of diagnostic errors in primary care. BMJ Qual Saf. 2012;21(2):93-100. doi:10.1136/bmjqs-2011-000304
73. Armaignac DL, Saxena A, Rubens M, et al. Impact of telemedicine on mortality, length of stay, and cost among patients in progressive care units: experience from a large healthcare system. Crit Care Med. 2018;46(5):728-735. doi:10.1097/CCM.0000000000002994
74. MacKinnon GE, Brittain EL. Mobile health technologies in cardiopulmonary disease. Chest. 2020;157(3):654-664. doi:10.1016/j.chest.2019.10.015
75. DeVore AD, Wosik J, Hernandez AF. The future of wearables in heart failure patients. JACC Heart Fail. 2019;7(11):922-932. doi:10.1016/j.jchf.2019.08.008
76. Tsai TL, Fridsma DB, Gatti G. Computer decision support as a source of interpretation error: the case of electrocardiograms. J Am Med Inform Assoc. 2003;10(5):478-483. doi:10.1197/jamia.M1279
77. Lin SY, Mahoney MR, Sinsky CA. Ten ways artificial intelligence will transform primary care. J Gen Intern Med. 2019;34(8):1626-1630. doi:10.1007/s11606-019-05035-1
78. Ramirez AH, Gebo KA, Harris PA. Progress with the All Of Us research program: opening access for researchers. JAMA. 2021;325(24):2441-2442. doi:10.1001/jama.2021.7702
79. Johnson KB, Wei W, Weeraratne D, et al. Precision medicine, AI, and the future of personalized health care. Clin Transl Sci. 2021;14(1):86-93. doi:10.1111/cts.12884
80. Gupta A, Snyder A, Kachalia A, Flanders S, Saint S, Chopra V. Malpractice claims related to diagnostic errors in the hospital. BMJ Qual Saf. 2017;27(1):bmjqs-2017-006774. doi:10.1136/bmjqs-2017-006774
81. Renkema E, Broekhuis M, Ahaus K. Conditions that influence the impact of malpractice litigation risk on physicians’ behavior regarding patient safety. BMC Health Serv Res. 2014;14(1):38. doi:10.1186/1472-6963-14-38
82. Kachalia A, Mello MM, Nallamothu BK, Studdert DM. Legal and policy interventions to improve patient safety. Circulation. 2016;133(7):661-671. doi:10.1161/CIRCULATIONAHA.115.015880
Safety in Health Care: An Essential Pillar of Quality
Each year, 40,000 to 98,000 deaths occur due to medical errors.1 The Harvard Medical Practice Study (HMPS), published in 1991, found that 3.7% of hospitalized patients were harmed by adverse events and 1% were harmed by adverse events due to negligence.2 The latest HMPS showed that, despite significant improvements in patient safety over the past 3 decades, patient safety challenges persist. This study found that inpatient care leads to harm in nearly a quarter of patients, and that 1 in 4 of these adverse events are preventable.3
Since the first HMPS study was published, efforts to improve patient safety have focused on identifying causes of medical error and the design and implementation of interventions to mitigate errors. Factors contributing to medical errors have been well documented: the complexity of care delivery from inpatient to outpatient settings, with transitions of care and extensive use of medications; multiple comorbidities; and the fragmentation of care across multiple systems and specialties. Although most errors are related to process or system failure, accountability of each practitioner and clinician is essential to promoting a culture of safety. Many medical errors are preventable through multifaceted approaches employed throughout the phases of the care,4 with medication errors, both prescribing and administration, and diagnostic and treatment errors encompassing most risk prevention areas. Broadly, safety efforts should emphasize building a culture of safety where all safety events are reported, including near-miss events.
Two articles in this issue of JCOM address key elements of patient safety: building a safety culture and diagnostic error. Merchant et al5 report on an initiative designed to promote a safety culture by recognizing and rewarding staff who identify and report near misses. The tiered awards program they designed led to significantly increased staff participation in the safety awards nomination process and was associated with increased reporting of actual and close-call events and greater attendance at monthly safety forums. Goyal et al,6 noting that diagnostic error rates in hospitalized patients remain unacceptably high, provide a concise update on diagnostic error among inpatients, focusing on issues related to defining and measuring diagnostic errors and current strategies to improve diagnostic safety in hospitalized patients. In a third article, Sathi et al report on efforts to teach quality improvement (QI) methods to internal medicine trainees; their project increased residents’ knowledge of their patient panels and comfort with QI approaches and led to improved patient outcomes.
Major progress has been made to improve health care safety since the first HMPS was published. However, the latest HMPS shows that patient safety efforts must continue, given the persistent risk for patient harm in the current health care delivery system. Safety, along with clear accountability for identifying, reporting, and addressing errors, should be a top priority for health care systems throughout the preventive, diagnostic, and therapeutic phases of care.
Corresponding author: Ebrahim Barkoudah, MD, MPH; ebarkoudah@bwh.harvard.edu
1. Clancy C, Munier W, Brady J. National healthcare quality report. Agency for Healthcare Research and Quality; 2013.
2. Brennan TA, Leape LL, Laird NM, et al. Incidence of adverse events and negligence in hospitalized patients. Results of the Harvard Medical Practice Study I. N Engl J Med. 1991;324(6):370-376. doi:10.1056/NEJM199102073240604
3. Bates DW, Levine DM, Salmasian H, et al. The safety of inpatient health care. N Engl J Med. 2023;388(2):142-153. doi:10.1056/NEJMsa2206117
4. Bates DW, Cullen DJ, Laird N, et al. Incidence of adverse drug events and potential adverse drug events: implications for prevention. JAMA. 1995;274(1):29-34.
5. Merchant NB, O’Neal J, Murray JS. Development of a safety awards program at a Veterans Affairs health care system: a quality improvement initiative. J Clin Outcome Manag. 2023;30(1):9-16. doi:10.12788/jcom.0120
6. Goyal A, Martin-Doyle W, Dalal AK. Diagnostic errors in hospitalized patients. J Clin Outcome Manag. 2023;30(1):17-27. doi:10.12788/jcom.0121
7. Sathi K, Huang KTL, Chandler DM, et al. Teaching quality improvement to internal medicine residents to address patient care gaps in ambulatory quality metrics. J Clin Outcome Manag. 2023;30(1):1-6.doi:10.12788/jcom.0119
Each year, 40,000 to 98,000 deaths occur due to medical errors.1 The Harvard Medical Practice Study (HMPS), published in 1991, found that 3.7% of hospitalized patients were harmed by adverse events and 1% were harmed by adverse events due to negligence.2 The latest HMPS showed that, despite significant improvements in patient safety over the past 3 decades, patient safety challenges persist. This study found that inpatient care leads to harm in nearly a quarter of patients, and that 1 in 4 of these adverse events are preventable.3
Since the first HMPS study was published, efforts to improve patient safety have focused on identifying causes of medical error and the design and implementation of interventions to mitigate errors. Factors contributing to medical errors have been well documented: the complexity of care delivery from inpatient to outpatient settings, with transitions of care and extensive use of medications; multiple comorbidities; and the fragmentation of care across multiple systems and specialties. Although most errors are related to process or system failure, accountability of each practitioner and clinician is essential to promoting a culture of safety. Many medical errors are preventable through multifaceted approaches employed throughout the phases of the care,4 with medication errors, both prescribing and administration, and diagnostic and treatment errors encompassing most risk prevention areas. Broadly, safety efforts should emphasize building a culture of safety where all safety events are reported, including near-miss events.
Two articles in this issue of JCOM address key elements of patient safety: building a safety culture and diagnostic error. Merchant et al5 report on an initiative designed to promote a safety culture by recognizing and rewarding staff who identify and report near misses. The tiered awards program they designed led to significantly increased staff participation in the safety awards nomination process and was associated with increased reporting of actual and close-call events and greater attendance at monthly safety forums. Goyal et al,6 noting that diagnostic error rates in hospitalized patients remain unacceptably high, provide a concise update on diagnostic error among inpatients, focusing on issues related to defining and measuring diagnostic errors and current strategies to improve diagnostic safety in hospitalized patients. In a third article, Sathi et al report on efforts to teach quality improvement (QI) methods to internal medicine trainees; their project increased residents’ knowledge of their patient panels and comfort with QI approaches and led to improved patient outcomes.
Major progress has been made to improve health care safety since the first HMPS was published. However, the latest HMPS shows that patient safety efforts must continue, given the persistent risk for patient harm in the current health care delivery system. Safety, along with clear accountability for identifying, reporting, and addressing errors, should be a top priority for health care systems throughout the preventive, diagnostic, and therapeutic phases of care.
Corresponding author: Ebrahim Barkoudah, MD, MPH; ebarkoudah@bwh.harvard.edu
1. Clancy C, Munier W, Brady J. National healthcare quality report. Agency for Healthcare Research and Quality; 2013.
2. Brennan TA, Leape LL, Laird NM, et al. Incidence of adverse events and negligence in hospitalized patients. Results of the Harvard Medical Practice Study I. N Engl J Med. 1991;324(6):370-376. doi:10.1056/NEJM199102073240604
3. Bates DW, Levine DM, Salmasian H, et al. The safety of inpatient health care. N Engl J Med. 2023;388(2):142-153. doi:10.1056/NEJMsa2206117
4. Bates DW, Cullen DJ, Laird N, et al. Incidence of adverse drug events and potential adverse drug events: implications for prevention. JAMA. 1995;274(1):29-34.
5. Merchant NB, O’Neal J, Murray JS. Development of a safety awards program at a Veterans Affairs health care system: a quality improvement initiative. J Clin Outcome Manag. 2023;30(1):9-16. doi:10.12788/jcom.0120
6. Goyal A, Martin-Doyle W, Dalal AK. Diagnostic errors in hospitalized patients. J Clin Outcome Manag. 2023;30(1):17-27. doi:10.12788/jcom.0121
7. Sathi K, Huang KTL, Chandler DM, et al. Teaching quality improvement to internal medicine residents to address patient care gaps in ambulatory quality metrics. J Clin Outcome Manag. 2023;30(1):1-6.doi:10.12788/jcom.0119
Best Practice Implementation and Clinical Inertia
From the Department of Medicine, Brigham and Women’s Hospital, and Harvard Medical School, Boston, MA.
Clinical inertia is defined as the failure of clinicians to initiate or escalate guideline-directed medical therapy to achieve treatment goals for well-defined clinical conditions.1,2 Evidence-based guidelines recommend optimal disease management with readily available medical therapies throughout the phases of clinical care. Unfortunately, the care provided to individual patients undergoes multiple modifications throughout the disease course, resulting in divergent pathways, significant deviations from treatment guidelines, and failure of “safeguard” checkpoints to reinstate, initiate, optimize, or stop treatments. Clinical inertia generally describes rigidity or resistance to change around implementing evidence-based guidelines. Furthermore, this term describes treatment behavior on the part of an individual clinician, not organizational inertia, which generally encompasses both internal (immediate clinical practice settings) and external factors (national and international guidelines and recommendations), eventually leading to resistance to optimizing disease treatment and therapeutic regimens. Individual clinicians’ clinical inertia in the form of resistance to guideline implementation and evidence-based principles can be one factor that drives organizational inertia. In turn, such individual behavior can be dictated by personal beliefs, knowledge, interpretation, skills, management principles, and biases. The terms therapeutic inertia or clinical inertia should not be confused with nonadherence from the patient’s standpoint when the clinician follows the best practice guidelines.3
Clinical inertia has been described in several clinical domains, including diabetes,4,5 hypertension,6,7 heart failure,8 depression,9 pulmonary medicine,10 and complex disease management.11 Clinicians can set suboptimal treatment goals due to specific beliefs and attitudes around optimal therapeutic goals. For example, when treating a patient with a chronic disease that is presently stable, a clinician could elect to initiate suboptimal treatment, as escalation of treatment might not be the priority in stable disease; they also may have concerns about overtreatment. Other factors that can contribute to clinical inertia (ie, undertreatment in the presence of indications for treatment) include those related to the patient, the clinical setting, and the organization, along with the importance of individualizing therapies in specific patients. Organizational inertia is the initial global resistance by the system to implementation, which can slow the dissemination and adaptation of best practices but eventually declines over time. Individual clinical inertia, on the other hand, will likely persist after the system-level rollout of guideline-based approaches.
The trajectory of dissemination, implementation, and adaptation of innovations and best practices is illustrated in the Figure. When the guidelines and medical societies endorse the adaptation of innovations or practice change after the benefits of such innovations/change have been established by the regulatory bodies, uptake can be hindered by both organizational and clinical inertia. Overcoming inertia to system-level changes requires addressing individual clinicians, along with practice and organizational factors, in order to ensure systematic adaptations. From the clinicians’ view, training and cognitive interventions to improve the adaptation and coping skills can improve understanding of treatment options through standardized educational and behavioral modification tools, direct and indirect feedback around performance, and decision support through a continuous improvement approach on both individual and system levels.

Addressing inertia in clinical practice requires a deep understanding of the individual and organizational elements that foster resistance to adapting best practice models. Research that explores tools and approaches to overcome inertia in managing complex diseases is a key step in advancing clinical innovation and disseminating best practices.
Corresponding author: Ebrahim Barkoudah, MD, MPH; ebarkoudah@bwh.harvard.edu
Disclosures: None reported.
1. Phillips LS, Branch WT, Cook CB, et al. Clinical inertia. Ann Intern Med. 2001;135(9):825-834. doi:10.7326/0003-4819-135-9-200111060-00012
2. Allen JD, Curtiss FR, Fairman KA. Nonadherence, clinical inertia, or therapeutic inertia? J Manag Care Pharm. 2009;15(8):690-695. doi:10.18553/jmcp.2009.15.8.690
3. Zafar A, Davies M, Azhar A, Khunti K. Clinical inertia in management of T2DM. Prim Care Diabetes. 2010;4(4):203-207. doi:10.1016/j.pcd.2010.07.003
4. Khunti K, Davies MJ. Clinical inertia—time to reappraise the terminology? Prim Care Diabetes. 2017;11(2):105-106. doi:10.1016/j.pcd.2017.01.007
5. O’Connor PJ. Overcome clinical inertia to control systolic blood pressure. Arch Intern Med. 2003;163(22):2677-2678. doi:10.1001/archinte.163.22.2677
6. Faria C, Wenzel M, Lee KW, et al. A narrative review of clinical inertia: focus on hypertension. J Am Soc Hypertens. 2009;3(4):267-276. doi:10.1016/j.jash.2009.03.001
7. Jarjour M, Henri C, de Denus S, et al. Care gaps in adherence to heart failure guidelines: clinical inertia or physiological limitations? JACC Heart Fail. 2020;8(9):725-738. doi:10.1016/j.jchf.2020.04.019
8. Henke RM, Zaslavsky AM, McGuire TG, et al. Clinical inertia in depression treatment. Med Care. 2009;47(9):959-67. doi:10.1097/MLR.0b013e31819a5da0
9. Cooke CE, Sidel M, Belletti DA, Fuhlbrigge AL. Clinical inertia in the management of chronic obstructive pulmonary disease. COPD. 2012;9(1):73-80. doi:10.3109/15412555.2011.631957
10. Whitford DL, Al-Anjawi HA, Al-Baharna MM. Impact of clinical inertia on cardiovascular risk factors in patients with diabetes. Prim Care Diabetes. 2014;8(2):133-138. doi:10.1016/j.pcd.2013.10.007
From the Department of Medicine, Brigham and Women’s Hospital, and Harvard Medical School, Boston, MA.
Clinical inertia is defined as the failure of clinicians to initiate or escalate guideline-directed medical therapy to achieve treatment goals for well-defined clinical conditions.1,2 Evidence-based guidelines recommend optimal disease management with readily available medical therapies throughout the phases of clinical care. Unfortunately, the care provided to individual patients undergoes multiple modifications throughout the disease course, resulting in divergent pathways, significant deviations from treatment guidelines, and failure of “safeguard” checkpoints to reinstate, initiate, optimize, or stop treatments. Clinical inertia generally describes rigidity or resistance to change around implementing evidence-based guidelines. Furthermore, this term describes treatment behavior on the part of an individual clinician, not organizational inertia, which generally encompasses both internal (immediate clinical practice settings) and external factors (national and international guidelines and recommendations), eventually leading to resistance to optimizing disease treatment and therapeutic regimens. Individual clinicians’ clinical inertia in the form of resistance to guideline implementation and evidence-based principles can be one factor that drives organizational inertia. In turn, such individual behavior can be dictated by personal beliefs, knowledge, interpretation, skills, management principles, and biases. The terms therapeutic inertia or clinical inertia should not be confused with nonadherence from the patient’s standpoint when the clinician follows the best practice guidelines.3
Clinical inertia has been described in several clinical domains, including diabetes,4,5 hypertension,6,7 heart failure,8 depression,9 pulmonary medicine,10 and complex disease management.11 Clinicians can set suboptimal treatment goals due to specific beliefs and attitudes around optimal therapeutic goals. For example, when treating a patient with a chronic disease that is presently stable, a clinician could elect to initiate suboptimal treatment, as escalation of treatment might not be the priority in stable disease; they also may have concerns about overtreatment. Other factors that can contribute to clinical inertia (ie, undertreatment in the presence of indications for treatment) include those related to the patient, the clinical setting, and the organization, along with the importance of individualizing therapies in specific patients. Organizational inertia is the initial global resistance by the system to implementation, which can slow the dissemination and adaptation of best practices but eventually declines over time. Individual clinical inertia, on the other hand, will likely persist after the system-level rollout of guideline-based approaches.
The trajectory of dissemination, implementation, and adaptation of innovations and best practices is illustrated in the Figure. When the guidelines and medical societies endorse the adaptation of innovations or practice change after the benefits of such innovations/change have been established by the regulatory bodies, uptake can be hindered by both organizational and clinical inertia. Overcoming inertia to system-level changes requires addressing individual clinicians, along with practice and organizational factors, in order to ensure systematic adaptations. From the clinicians’ view, training and cognitive interventions to improve the adaptation and coping skills can improve understanding of treatment options through standardized educational and behavioral modification tools, direct and indirect feedback around performance, and decision support through a continuous improvement approach on both individual and system levels.
Addressing inertia in clinical practice requires a deep understanding of the individual and organizational elements that foster resistance to adapting best practice models. Research that explores tools and approaches to overcome inertia in managing complex diseases is a key step in advancing clinical innovation and disseminating best practices.
Corresponding author: Ebrahim Barkoudah, MD, MPH; ebarkoudah@bwh.harvard.edu
Disclosures: None reported.
1. Phillips LS, Branch WT, Cook CB, et al. Clinical inertia. Ann Intern Med. 2001;135(9):825-834. doi:10.7326/0003-4819-135-9-200111060-00012
2. Allen JD, Curtiss FR, Fairman KA. Nonadherence, clinical inertia, or therapeutic inertia? J Manag Care Pharm. 2009;15(8):690-695. doi:10.18553/jmcp.2009.15.8.690
3. Zafar A, Davies M, Azhar A, Khunti K. Clinical inertia in management of T2DM. Prim Care Diabetes. 2010;4(4):203-207. doi:10.1016/j.pcd.2010.07.003
4. Khunti K, Davies MJ. Clinical inertia—time to reappraise the terminology? Prim Care Diabetes. 2017;11(2):105-106. doi:10.1016/j.pcd.2017.01.007
5. O’Connor PJ. Overcome clinical inertia to control systolic blood pressure. Arch Intern Med. 2003;163(22):2677-2678. doi:10.1001/archinte.163.22.2677
6. Faria C, Wenzel M, Lee KW, et al. A narrative review of clinical inertia: focus on hypertension. J Am Soc Hypertens. 2009;3(4):267-276. doi:10.1016/j.jash.2009.03.001
7. Jarjour M, Henri C, de Denus S, et al. Care gaps in adherence to heart failure guidelines: clinical inertia or physiological limitations? JACC Heart Fail. 2020;8(9):725-738. doi:10.1016/j.jchf.2020.04.019
8. Henke RM, Zaslavsky AM, McGuire TG, et al. Clinical inertia in depression treatment. Med Care. 2009;47(9):959-67. doi:10.1097/MLR.0b013e31819a5da0
9. Cooke CE, Sidel M, Belletti DA, Fuhlbrigge AL. Clinical inertia in the management of chronic obstructive pulmonary disease. COPD. 2012;9(1):73-80. doi:10.3109/15412555.2011.631957
10. Whitford DL, Al-Anjawi HA, Al-Baharna MM. Impact of clinical inertia on cardiovascular risk factors in patients with diabetes. Prim Care Diabetes. 2014;8(2):133-138. doi:10.1016/j.pcd.2013.10.007
Effectiveness of Colonoscopy for Colorectal Cancer Screening in Reducing Cancer-Related Mortality: Interpreting the Results From Two Ongoing Randomized Trials
Study 1 Overview (Bretthauer et al)
Objective: To evaluate the impact of screening colonoscopy on colon cancer–related death.
Design: Randomized trial conducted in 4 European countries.
Setting and participants: Presumptively healthy men and women between the ages of 55 and 64 years were selected from population registries in Poland, Norway, Sweden, and the Netherlands between 2009 and 2014. Eligible participants had not previously undergone screening. Patients with a diagnosis of colon cancer before trial entry were excluded.
Intervention: Participants were randomly assigned in a 1:2 ratio to undergo colonoscopy screening by invitation or to no invitation and no screening. Participants were randomized using a computer-generated allocation algorithm. Patients were stratified by age, sex, and municipality.
Main outcome measures: The primary endpoint of the study was risk of colorectal cancer and related death after a median follow-up of 10 to 15 years. The main secondary endpoint was death from any cause.
Main results: The study reported follow-up data from 84,585 participants (89.1% of all participants originally included in the trial). The remaining participants were either excluded or data could not be included due to lack of follow-up data from the usual-care group. Men (50.1%) and women (49.9%) were equally represented. The median age at entry was 59 years. The median follow-up was 10 years. Characteristics were otherwise balanced. Good bowel preparation was reported in 91% of all participants. Cecal intubation was achieved in 96.8% of all participants. The percentage of patients who underwent screening was 42% for the group, but screening rates varied by country (33%-60%). Colorectal cancer was diagnosed at screening in 62 participants (0.5% of screening group). Adenomas were detected in 30.7% of participants; 15 patients had polypectomy-related major bleeding. There were no perforations.
The risk of colorectal cancer at 10 years was 0.98% in the invited-to-screen group and 1.2% in the usual-care group (risk ratio, 0.82; 95% CI, 0.7-0.93). The reported number needed to invite to prevent 1 case of colon cancer in a 10-year period was 455. The risk of colorectal cancer–related death at 10 years was 0.28% in the invited-to-screen group and 0.31% in the usual-care group (risk ratio, 0.9; 95% CI, 0.64-1.16). An adjusted per-protocol analysis was performed to account for the estimated effect of screening if all participants assigned to the screening group underwent screening. In this analysis, the risk of colorectal cancer at 10 years was decreased from 1.22% to 0.84% (risk ratio, 0.69; 95% CI, 0.66-0.83).
Conclusion: Based on the results of this European randomized trial, the risk of colorectal cancer at 10 years was lower among those who were invited to undergo screening.
Study 2 Overview (Forsberg et al)
Objective: To investigate the effect of colorectal cancer screening with once-only colonoscopy or fecal immunochemical testing (FIT) on colorectal cancer mortality and incidence.
Design: Randomized controlled trial in Sweden utilizing a population registry.
Setting and participants: Patients aged 60 years at the time of entry were identified from a population-based registry from the Swedish Tax Agency.
Intervention: Individuals were assigned by an independent statistician to once-only colonoscopy, 2 rounds of FIT 2 years apart, or a control group in which no intervention was performed. Patients were assigned in a 1:6 ratio for colonoscopy vs control and a 1:2 ratio for FIT vs control.
Main outcome measures: The primary endpoint of the trial was colorectal cancer incidence and mortality.
Main results: A total of 278,280 participants were included in the study from March 1, 2014, through December 31, 2020 (31,140 in the colonoscopy group, 60,300 in the FIT group, and 186,840 in the control group). Of those in the colonoscopy group, 35% underwent colonoscopy, and 55% of those in the FIT group participated in testing. Colorectal cancer was detected in 0.16% (49) of people in the colonoscopy group and 0.2% (121) of people in the FIT test group (relative risk, 0.78; 95% CI, 0.56-1.09). The advanced adenoma detection rate was 2.05% in the colonoscopy group and 1.61% in the FIT group (relative risk, 1.27; 95% CI, 1.15-1.41). There were 2 perforations noted in the colonoscopy group and 15 major bleeding events. More right-sided adenomas were detected in the colonoscopy group.
Conclusion: The results of the current study highlight similar detection rates in the colonoscopy and FIT group. Should further follow-up show a benefit in disease-specific mortality, such screening strategies could be translated into population-based screening programs.
Commentary
The first colonoscopy screening recommendations were established in the mid 1990s in the United States, and over the subsequent 2 decades colonoscopy has been the recommended method and main modality for colorectal cancer screening in this country. The advantage of colonoscopy over other screening modalities (sigmoidoscopy and fecal-based testing) is that it can examine the entire large bowel and allow for removal of potential precancerous lesions. However, data to support colonoscopy as a screening modality for colorectal cancer are largely based on cohort studies.1,2 These studies have reported a significant reduction in the incidence of colon cancer. Additionally, colorectal cancer mortality was notably lower in the screened populations. For example, one study among health professionals found a nearly 70% reduction in colorectal cancer mortality in those who underwent at least 1 screening colonoscopy.3
There has been a lack of randomized clinical data to validate the efficacy of colonoscopy screening for reducing colorectal cancer–related deaths. The current study by Bretthauer et al addresses an important need and enhances our understanding of the efficacy of colorectal cancer screening with colonoscopy. In this randomized trial involving more than 84,000 participants from Poland, Norway, Sweden, and the Netherlands, there was a noted 18% decrease in the risk of colorectal cancer over a 10-year period in the intention-to-screen population. The reduction in the risk of death from colorectal cancer was not statistically significant (risk ratio, 0.90; 95% CI, 0.64-1.16). These results are surprising and certainly raise the question as to whether previous studies overestimated the effectiveness of colonoscopy in reducing the risk of colorectal cancer–related deaths. There are several limitations to the Bretthauer et al study, however.
Perhaps the most important limitation is the fact that only 42% of participants in the invited-to-screen cohort underwent screening colonoscopy. Therefore, this raises the question of whether the efficacy noted is simply due to a lack of participation in the screening protocol. In the adjusted per-protocol analysis, colonoscopy was estimated to reduce the risk of colorectal cancer by 31% and the risk of colorectal cancer–related death by around 50%. These findings are more in line with prior published studies regarding the efficacy of colorectal cancer screening. The authors plan to repeat this analysis at 15 years, and it is possible that the risk of colorectal cancer and colorectal cancer–related death can be reduced on subsequent follow-up.
While the results of the Bretthauer et al trial are important, randomized trials that directly compare the effectiveness of different colorectal cancer screening strategies are lacking. The Forsberg et al trial, also an ongoing study, seeks to address this vitally important gap in our current data. The SCREESCO trial is a study that compares the efficacy of colonoscopy with FIT every 2 years or no screening. The currently reported data are preliminary but show a similarly low rate of colonoscopy screening in those invited to do so (35%). This is a similar limitation to that noted in the Bretthauer et al study. Furthermore, there is some question regarding colonoscopy quality in this study, which had a very low reported adenoma detection rate.
While the current studies are important and provide quality randomized data on the effect of colorectal cancer screening, there remain many unanswered questions. Should the results presented by Bretthauer et al represent the current real-world scenario, then colonoscopy screening may not be viewed as an effective screening tool compared to simpler, less-invasive modalities (ie, FIT). Further follow-up from the SCREESCO trial will help shed light on this question. However, there are concerns with this study, including a very low participation rate, which could greatly underestimate the effectiveness of screening. Additional analysis and longer follow-up will be vital to fully understand the benefits of screening colonoscopy. In the meantime, screening remains an important tool for early detection of colorectal cancer and remains a category A recommendation by the United States Preventive Services Task Force.4
Applications for Clinical Practice and System Implementation
Current guidelines continue to strongly recommend screening for colorectal cancer for persons between 45 and 75 years of age (category B recommendation for those aged 45 to 49 years per the United States Preventive Services Task Force). Stool-based tests and direct visualization tests are both endorsed as screening options. Further follow-up from the presented studies is needed to help shed light on the magnitude of benefit of these modalities.
Practice Points
- Current guidelines continue to strongly recommend screening for colon cancer in those aged 45 to 75 years.
- The optimal modality for screening and the impact of screening on cancer-related mortality requires longer- term follow-up from these ongoing studies.
–Daniel Isaac, DO, MS
1. Lin JS, Perdue LA, Henrikson NB, Bean SI, Blasi PR. Screening for Colorectal Cancer: An Evidence Update for the U.S. Preventive Services Task Force [Internet]. Rockville (MD): Agency for Healthcare Research and Quality (US); 2021 May. Report No.: 20-05271-EF-1.
2. Lin JS, Perdue LA, Henrikson NB, Bean SI, Blasi PR. Screening for colorectal cancer: updated evidence report and systematic review for the US Preventive Services Task Force. JAMA. 2021;325(19):1978-1998. doi:10.1001/jama.2021.4417
3. Nishihara R, Wu K, Lochhead P, et al. Long-term colorectal-cancer incidence and mortality after lower endoscopy. N Engl J Med. 2013;369(12):1095-1105. doi:10.1056/NEJMoa1301969
4. U.S. Preventive Services Task Force. Colorectal cancer: screening. Published May 18, 2021. Accessed November 8, 2022. https://uspreventiveservicestaskforce.org/uspstf/recommendation/colorectal-cancer-screening
Study 1 Overview (Bretthauer et al)
Objective: To evaluate the impact of screening colonoscopy on colon cancer–related death.
Design: Randomized trial conducted in 4 European countries.
Setting and participants: Presumptively healthy men and women between the ages of 55 and 64 years were selected from population registries in Poland, Norway, Sweden, and the Netherlands between 2009 and 2014. Eligible participants had not previously undergone screening. Patients with a diagnosis of colon cancer before trial entry were excluded.
Intervention: Participants were randomly assigned in a 1:2 ratio to undergo colonoscopy screening by invitation or to no invitation and no screening. Participants were randomized using a computer-generated allocation algorithm. Patients were stratified by age, sex, and municipality.
Main outcome measures: The primary endpoint of the study was risk of colorectal cancer and related death after a median follow-up of 10 to 15 years. The main secondary endpoint was death from any cause.
Main results: The study reported follow-up data from 84,585 participants (89.1% of all participants originally included in the trial). The remaining participants were either excluded or data could not be included due to lack of follow-up data from the usual-care group. Men (50.1%) and women (49.9%) were equally represented. The median age at entry was 59 years. The median follow-up was 10 years. Characteristics were otherwise balanced. Good bowel preparation was reported in 91% of all participants. Cecal intubation was achieved in 96.8% of all participants. The percentage of patients who underwent screening was 42% for the group, but screening rates varied by country (33%-60%). Colorectal cancer was diagnosed at screening in 62 participants (0.5% of screening group). Adenomas were detected in 30.7% of participants; 15 patients had polypectomy-related major bleeding. There were no perforations.
The risk of colorectal cancer at 10 years was 0.98% in the invited-to-screen group and 1.2% in the usual-care group (risk ratio, 0.82; 95% CI, 0.7-0.93). The reported number needed to invite to prevent 1 case of colon cancer in a 10-year period was 455. The risk of colorectal cancer–related death at 10 years was 0.28% in the invited-to-screen group and 0.31% in the usual-care group (risk ratio, 0.9; 95% CI, 0.64-1.16). An adjusted per-protocol analysis was performed to account for the estimated effect of screening if all participants assigned to the screening group underwent screening. In this analysis, the risk of colorectal cancer at 10 years was decreased from 1.22% to 0.84% (risk ratio, 0.69; 95% CI, 0.66-0.83).
Conclusion: Based on the results of this European randomized trial, the risk of colorectal cancer at 10 years was lower among those who were invited to undergo screening.
Study 2 Overview (Forsberg et al)
Objective: To investigate the effect of colorectal cancer screening with once-only colonoscopy or fecal immunochemical testing (FIT) on colorectal cancer mortality and incidence.
Design: Randomized controlled trial in Sweden utilizing a population registry.
Setting and participants: Patients aged 60 years at the time of entry were identified from a population-based registry from the Swedish Tax Agency.
Intervention: Individuals were assigned by an independent statistician to once-only colonoscopy, 2 rounds of FIT 2 years apart, or a control group in which no intervention was performed. Patients were assigned in a 1:6 ratio for colonoscopy vs control and a 1:2 ratio for FIT vs control.
Main outcome measures: The primary endpoint of the trial was colorectal cancer incidence and mortality.
Main results: A total of 278,280 participants were included in the study from March 1, 2014, through December 31, 2020 (31,140 in the colonoscopy group, 60,300 in the FIT group, and 186,840 in the control group). Of those in the colonoscopy group, 35% underwent colonoscopy, and 55% of those in the FIT group participated in testing. Colorectal cancer was detected in 0.16% (49) of people in the colonoscopy group and 0.2% (121) of people in the FIT test group (relative risk, 0.78; 95% CI, 0.56-1.09). The advanced adenoma detection rate was 2.05% in the colonoscopy group and 1.61% in the FIT group (relative risk, 1.27; 95% CI, 1.15-1.41). There were 2 perforations noted in the colonoscopy group and 15 major bleeding events. More right-sided adenomas were detected in the colonoscopy group.
Conclusion: The results of the current study highlight similar detection rates in the colonoscopy and FIT group. Should further follow-up show a benefit in disease-specific mortality, such screening strategies could be translated into population-based screening programs.
Commentary
The first colonoscopy screening recommendations were established in the mid 1990s in the United States, and over the subsequent 2 decades colonoscopy has been the recommended method and main modality for colorectal cancer screening in this country. The advantage of colonoscopy over other screening modalities (sigmoidoscopy and fecal-based testing) is that it can examine the entire large bowel and allow for removal of potential precancerous lesions. However, data to support colonoscopy as a screening modality for colorectal cancer are largely based on cohort studies.1,2 These studies have reported a significant reduction in the incidence of colon cancer. Additionally, colorectal cancer mortality was notably lower in the screened populations. For example, one study among health professionals found a nearly 70% reduction in colorectal cancer mortality in those who underwent at least 1 screening colonoscopy.3
There has been a lack of randomized clinical data to validate the efficacy of colonoscopy screening for reducing colorectal cancer–related deaths. The current study by Bretthauer et al addresses an important need and enhances our understanding of the efficacy of colorectal cancer screening with colonoscopy. In this randomized trial involving more than 84,000 participants from Poland, Norway, Sweden, and the Netherlands, there was a noted 18% decrease in the risk of colorectal cancer over a 10-year period in the intention-to-screen population. The reduction in the risk of death from colorectal cancer was not statistically significant (risk ratio, 0.90; 95% CI, 0.64-1.16). These results are surprising and certainly raise the question as to whether previous studies overestimated the effectiveness of colonoscopy in reducing the risk of colorectal cancer–related deaths. There are several limitations to the Bretthauer et al study, however.
Perhaps the most important limitation is the fact that only 42% of participants in the invited-to-screen cohort underwent screening colonoscopy. Therefore, this raises the question of whether the efficacy noted is simply due to a lack of participation in the screening protocol. In the adjusted per-protocol analysis, colonoscopy was estimated to reduce the risk of colorectal cancer by 31% and the risk of colorectal cancer–related death by around 50%. These findings are more in line with prior published studies regarding the efficacy of colorectal cancer screening. The authors plan to repeat this analysis at 15 years, and it is possible that the risk of colorectal cancer and colorectal cancer–related death can be reduced on subsequent follow-up.
While the results of the Bretthauer et al trial are important, randomized trials that directly compare the effectiveness of different colorectal cancer screening strategies are lacking. The Forsberg et al trial, also an ongoing study, seeks to address this vitally important gap in our current data. The SCREESCO trial is a study that compares the efficacy of colonoscopy with FIT every 2 years or no screening. The currently reported data are preliminary but show a similarly low rate of colonoscopy screening in those invited to do so (35%). This is a similar limitation to that noted in the Bretthauer et al study. Furthermore, there is some question regarding colonoscopy quality in this study, which had a very low reported adenoma detection rate.
While the current studies are important and provide quality randomized data on the effect of colorectal cancer screening, there remain many unanswered questions. Should the results presented by Bretthauer et al represent the current real-world scenario, then colonoscopy screening may not be viewed as an effective screening tool compared to simpler, less-invasive modalities (ie, FIT). Further follow-up from the SCREESCO trial will help shed light on this question. However, there are concerns with this study, including a very low participation rate, which could greatly underestimate the effectiveness of screening. Additional analysis and longer follow-up will be vital to fully understand the benefits of screening colonoscopy. In the meantime, screening remains an important tool for early detection of colorectal cancer and remains a category A recommendation by the United States Preventive Services Task Force.4
Applications for Clinical Practice and System Implementation
Current guidelines continue to strongly recommend screening for colorectal cancer for persons between 45 and 75 years of age (category B recommendation for those aged 45 to 49 years per the United States Preventive Services Task Force). Stool-based tests and direct visualization tests are both endorsed as screening options. Further follow-up from the presented studies is needed to help shed light on the magnitude of benefit of these modalities.
Practice Points
- Current guidelines continue to strongly recommend screening for colon cancer in those aged 45 to 75 years.
- The optimal modality for screening and the impact of screening on cancer-related mortality requires longer- term follow-up from these ongoing studies.
–Daniel Isaac, DO, MS
1. Lin JS, Perdue LA, Henrikson NB, Bean SI, Blasi PR. Screening for Colorectal Cancer: An Evidence Update for the U.S. Preventive Services Task Force [Internet]. Rockville (MD): Agency for Healthcare Research and Quality (US); 2021 May. Report No.: 20-05271-EF-1.
2. Lin JS, Perdue LA, Henrikson NB, Bean SI, Blasi PR. Screening for colorectal cancer: updated evidence report and systematic review for the US Preventive Services Task Force. JAMA. 2021;325(19):1978-1998. doi:10.1001/jama.2021.4417
3. Nishihara R, Wu K, Lochhead P, et al. Long-term colorectal-cancer incidence and mortality after lower endoscopy. N Engl J Med. 2013;369(12):1095-1105. doi:10.1056/NEJMoa1301969
4. U.S. Preventive Services Task Force. Colorectal cancer: screening. Published May 18, 2021. Accessed November 8, 2022. https://uspreventiveservicestaskforce.org/uspstf/recommendation/colorectal-cancer-screening
The Long Arc of Justice for Veteran Benefits
This Veterans Day we honor the passing of the largest expansion of veterans benefits and services in history. On August 10, 2022, President Biden signed the Sergeant First Class Heath Robinson Honoring our Promise to Address Comprehensive Toxics (PACT) Act. This act was named for a combat medic who died of a rare form of lung cancer believed to be the result of a toxic military exposure. His widow was present during the President's State of the Union address that urged Congress to pass the legislation.2
Like all other congressional bills and government regulations, the PACT Act is complex in its details and still a work in progress. Simply put, the PACT Act expands and/or extends enrollment for a group of previously ineligible veterans. Eligibility will no longer require that veterans demonstrate a service-connected disability due to toxic exposure, including those from burn pits. This has long been a barrier for many veterans seeking benefits and not just related to toxic exposures. Logistical barriers and documentary losses have prevented many service members from establishing a clean chain of evidence for the injuries or illnesses they sustained while in uniform.
The new process is a massive step forward by the US Department of Veterans Affairs (VA) to establish high standards of procedural justice for settling beneficiary claims. The PACT Act removes the burden from the shoulders of the veteran and places it squarely on the VA to demonstrate that > 20 different medical conditions--primarily cancers and respiratory illnesses--are linked to toxic exposure. The VA must establish that exposure occurred to cohorts of service members in specific theaters and time frames. A veteran who served in that area and period and has one of the indexed illnesses is presumed to have been exposed in the line of duty.3,4
As a result, the VA instituted a new screening process to determine that toxic military exposures (a) led to illness; and (b) both exposure and illness are connected to service. According to the VA, the new process is evidence based, transparent, and allows the VA to fast-track policy decisions related to exposures. The PACT Act includes a provision intended to promote sustained implementation and prevent the program from succumbing as so many new initiatives have to inadequate adoption. VA is required to deploy its considerable internal research capacity to collaborate with external partners in and outside government to study military members with toxic exposures.4
Congress had initially proposed that the provisions of the PACT ACT would take effect in 2026, providing time to ramp up the process. The White House and VA telescoped that time line so veterans can begin now to apply for benefits that they could foreseeably receive in 2023. However, a long-standing problem for the VA has been unfunded agency or congressional mandates. These have often end in undermining the legislative intention or policy purpose of the program undermining their legislative intention or policy purpose through staffing shortages, leading to lack of or delayed access. The PACT Act promises to eschew the infamous Phoenix problem by providing increased personnel, training infrastructure, and technology resources for both the Veterans Benefit Administration and the Veterans Health Administration. Ironically, many seasoned VA observers expect the PACT expansion will lead to even larger backlogs of claims as hundreds of newly eligible veterans are added to the extant rolls of those seeking benefits.5
An estimated 1 in 5 veterans may be entitled to PACT benefits. The PACT Act is the latest of a long uneven movement toward distributive justice for veteran benefits and services. It is fitting in the month of Veterans Day 2022 to trace that trajectory. Congress first passed veteran benefits legislation in 1917, focused on soldiers with disabilities. This resulted in a massive investment in building hospitals. Ironically, part of the impetus for VA health care was an earlier toxic military exposure. World War I service members suffered from the detrimental effects of mustard gas among other chemical byproducts. In 1924, VA benefits and services underwent a momentous opening to include individuals with non-service-connected disabilities. Four years later, the VA tent became even bigger, welcoming women, National Guard, and militia members to receive care under its auspices.6
The PACT Act is a fitting memorial for Veterans Day as an increasingly divided country presents a unified response to veterans and their survivors exposed to a variety of toxins across multiple wars. The PACT Act was hard won with veterans and their advocates having to fight years of political bickering, government abdication of accountability, and scientific sparring before this bipartisan legislation passed.7 It covers Vietnam War veterans with several conditions due to Agent Orange exposure; Gulf War and post-9/11 veterans with cancer and respiratory conditions; and the service members deployed to Afghanistan and Iraq afflicted with illnesses due to the smoke of burn pits and other toxins.
As many areas of the country roll back LGBTQ+ rights to health care and social services, the VA has emerged as a leader in the movement for diversity and inclusion. VA Secretary McDonough provided a pathway to VA eligibility for other than honorably discharged veterans, including those LGBTQ+ persons discharged under Don't Ask, Don't Tell.8 Lest we take this new inclusivity for granted, we should never forget that this journey toward equity for the military and VA has been long, slow, and uneven. There are many difficult miles yet to travel if we are to achieve liberty and justice for veteran members of racial minorities, women, and other marginalized populations. Even the PACT Act does not cover all putative exposures to toxins.9 Yet it is a significant step closer to fulfilling the motto of the VA LGBTQ+ program: to serve all who served.10
- Parker T. Of justice and the conscience. In: Ten Sermons of Religion. Crosby, Nichols and Company; 1853:66-85.
- The White House. Fact sheet: President Biden signs the PACT Act and delivers on his promise to America's veterans. August 9, 2022. Accessed October 24, 2022. https://www.whitehouse.gov/briefing-room/statements-releases/2022/08/10/fact-sheet-president-biden-signs-the-pact-act-and-delivers-on-his-promise-to-americas-veterans
- Shane L. Vets can apply for all PACT benefits now after VA speeds up law. Military Times. September 1, 2022. Accessed October 24, 2022. https://www.militarytimes.com/news/burn-pits/2022/09/01/vets-can-apply-for-all-pact-act-benefits-now-after-va-speeds-up-law
- US Department of Veterans Affairs. The PACT Act and your VA benefits. Updated September 28, 2022. Accessed October 24, 2022. https://www.va.gov/resources/the-pact-act-and-your-va-benefits
- Wentling N. Discharged LGBTQ+ veterans now eligible for benefits under new guidance issued by VA. Stars & Stripes. September 20, 2021. Accessed October 24, 2022. https://www.stripes.com/veterans/2021-09-20/veterans-affairs-dont-ask-dont-tell-benefits-lgbt-discharges-2956761.html
- US Department of Veterans Affairs, VA History Office. History--Department of Veterans Affairs (VA). Updated May 27, 2021. Accessed October 24, 2022. https://www.va.gov/HISTORY/VA_History/Overview.asp
- Atkins D, Kilbourne A, Lipson L. Health equity research in the Veterans Health Administration: we've come far but aren't there yet. Am J Public Health. 2014;104(suppl 4):S525-S526. doi:10.2105/AJPH.2014.302216
- Stack MK. The soldiers came home sick. The government denied it was responsible. New York Times. Updated January 16, 2022. Accessed October 24, 2022. https://www.nytimes.com/2022/01/11/magazine/military-burn-pits.html
- Namaz A, Sagalyn D. VA secretary discusses health care overhaul helping veterans exposed to toxic burn pits. PBS NewsHour. September 1, 2022. Accessed October 24, 2022. https://www.pbs.org/newshour/show/va-secretary-discusses-health-care-overhaul-helping-veterans-exposed-to-toxic-burn-pits
- US Department of Veterans Affairs, Patient Care Services. VHA LGBTQ+ health program. Updated September 13, 2022. Accessed October 31, 2022. https://www.patientcare.va.gov/lgbt
This Veterans Day we honor the passing of the largest expansion of veterans benefits and services in history. On August 10, 2022, President Biden signed the Sergeant First Class Heath Robinson Honoring our Promise to Address Comprehensive Toxics (PACT) Act. This act was named for a combat medic who died of a rare form of lung cancer believed to be the result of a toxic military exposure. His widow was present during the President's State of the Union address that urged Congress to pass the legislation.2
Like all other congressional bills and government regulations, the PACT Act is complex in its details and still a work in progress. Simply put, the PACT Act expands and/or extends enrollment for a group of previously ineligible veterans. Eligibility will no longer require that veterans demonstrate a service-connected disability due to toxic exposure, including those from burn pits. This has long been a barrier for many veterans seeking benefits and not just related to toxic exposures. Logistical barriers and documentary losses have prevented many service members from establishing a clean chain of evidence for the injuries or illnesses they sustained while in uniform.
The new process is a massive step forward by the US Department of Veterans Affairs (VA) to establish high standards of procedural justice for settling beneficiary claims. The PACT Act removes the burden from the shoulders of the veteran and places it squarely on the VA to demonstrate that > 20 different medical conditions--primarily cancers and respiratory illnesses--are linked to toxic exposure. The VA must establish that exposure occurred to cohorts of service members in specific theaters and time frames. A veteran who served in that area and period and has one of the indexed illnesses is presumed to have been exposed in the line of duty.3,4
As a result, the VA instituted a new screening process to determine that toxic military exposures (a) led to illness; and (b) both exposure and illness are connected to service. According to the VA, the new process is evidence based, transparent, and allows the VA to fast-track policy decisions related to exposures. The PACT Act includes a provision intended to promote sustained implementation and prevent the program from succumbing as so many new initiatives have to inadequate adoption. VA is required to deploy its considerable internal research capacity to collaborate with external partners in and outside government to study military members with toxic exposures.4
Congress had initially proposed that the provisions of the PACT ACT would take effect in 2026, providing time to ramp up the process. The White House and VA telescoped that time line so veterans can begin now to apply for benefits that they could foreseeably receive in 2023. However, a long-standing problem for the VA has been unfunded agency or congressional mandates. These have often end in undermining the legislative intention or policy purpose of the program undermining their legislative intention or policy purpose through staffing shortages, leading to lack of or delayed access. The PACT Act promises to eschew the infamous Phoenix problem by providing increased personnel, training infrastructure, and technology resources for both the Veterans Benefit Administration and the Veterans Health Administration. Ironically, many seasoned VA observers expect the PACT expansion will lead to even larger backlogs of claims as hundreds of newly eligible veterans are added to the extant rolls of those seeking benefits.5
An estimated 1 in 5 veterans may be entitled to PACT benefits. The PACT Act is the latest of a long uneven movement toward distributive justice for veteran benefits and services. It is fitting in the month of Veterans Day 2022 to trace that trajectory. Congress first passed veteran benefits legislation in 1917, focused on soldiers with disabilities. This resulted in a massive investment in building hospitals. Ironically, part of the impetus for VA health care was an earlier toxic military exposure. World War I service members suffered from the detrimental effects of mustard gas among other chemical byproducts. In 1924, VA benefits and services underwent a momentous opening to include individuals with non-service-connected disabilities. Four years later, the VA tent became even bigger, welcoming women, National Guard, and militia members to receive care under its auspices.6
The PACT Act is a fitting memorial for Veterans Day as an increasingly divided country presents a unified response to veterans and their survivors exposed to a variety of toxins across multiple wars. The PACT Act was hard won with veterans and their advocates having to fight years of political bickering, government abdication of accountability, and scientific sparring before this bipartisan legislation passed.7 It covers Vietnam War veterans with several conditions due to Agent Orange exposure; Gulf War and post-9/11 veterans with cancer and respiratory conditions; and the service members deployed to Afghanistan and Iraq afflicted with illnesses due to the smoke of burn pits and other toxins.
As many areas of the country roll back LGBTQ+ rights to health care and social services, the VA has emerged as a leader in the movement for diversity and inclusion. VA Secretary McDonough provided a pathway to VA eligibility for other than honorably discharged veterans, including those LGBTQ+ persons discharged under Don't Ask, Don't Tell.8 Lest we take this new inclusivity for granted, we should never forget that this journey toward equity for the military and VA has been long, slow, and uneven. There are many difficult miles yet to travel if we are to achieve liberty and justice for veteran members of racial minorities, women, and other marginalized populations. Even the PACT Act does not cover all putative exposures to toxins.9 Yet it is a significant step closer to fulfilling the motto of the VA LGBTQ+ program: to serve all who served.10
- Parker T. Of justice and the conscience. In: Ten Sermons of Religion. Crosby, Nichols and Company; 1853:66-85.
- The White House. Fact sheet: President Biden signs the PACT Act and delivers on his promise to America's veterans. August 9, 2022. Accessed October 24, 2022. https://www.whitehouse.gov/briefing-room/statements-releases/2022/08/10/fact-sheet-president-biden-signs-the-pact-act-and-delivers-on-his-promise-to-americas-veterans
- Shane L. Vets can apply for all PACT benefits now after VA speeds up law. Military Times. September 1, 2022. Accessed October 24, 2022. https://www.militarytimes.com/news/burn-pits/2022/09/01/vets-can-apply-for-all-pact-act-benefits-now-after-va-speeds-up-law
- US Department of Veterans Affairs. The PACT Act and your VA benefits. Updated September 28, 2022. Accessed October 24, 2022. https://www.va.gov/resources/the-pact-act-and-your-va-benefits
- Wentling N. Discharged LGBTQ+ veterans now eligible for benefits under new guidance issued by VA. Stars & Stripes. September 20, 2021. Accessed October 24, 2022. https://www.stripes.com/veterans/2021-09-20/veterans-affairs-dont-ask-dont-tell-benefits-lgbt-discharges-2956761.html
- US Department of Veterans Affairs, VA History Office. History--Department of Veterans Affairs (VA). Updated May 27, 2021. Accessed October 24, 2022. https://www.va.gov/HISTORY/VA_History/Overview.asp
- Atkins D, Kilbourne A, Lipson L. Health equity research in the Veterans Health Administration: we've come far but aren't there yet. Am J Public Health. 2014;104(suppl 4):S525-S526. doi:10.2105/AJPH.2014.302216
- Stack MK. The soldiers came home sick. The government denied it was responsible. New York Times. Updated January 16, 2022. Accessed October 24, 2022. https://www.nytimes.com/2022/01/11/magazine/military-burn-pits.html
- Namaz A, Sagalyn D. VA secretary discusses health care overhaul helping veterans exposed to toxic burn pits. PBS NewsHour. September 1, 2022. Accessed October 24, 2022. https://www.pbs.org/newshour/show/va-secretary-discusses-health-care-overhaul-helping-veterans-exposed-to-toxic-burn-pits
- US Department of Veterans Affairs, Patient Care Services. VHA LGBTQ+ health program. Updated September 13, 2022. Accessed October 31, 2022. https://www.patientcare.va.gov/lgbt
Medicaid Expansion and Veterans’ Reliance on the VA for Depression Care
The US Department of Veterans Affairs (VA) is the largest integrated health care system in the United States, providing care for more than 9 million veterans.1 With veterans experiencing mental health conditions like posttraumatic stress disorder (PTSD), substance use disorders, and other serious mental illnesses (SMI) at higher rates compared with the general population, the VA plays an important role in the provision of mental health services.2-5 Since the implementation of its Mental Health Strategic Plan in 2004, the VA has overseen the development of a wide array of mental health programs geared toward the complex needs of veterans. Research has demonstrated VA care outperforming Medicaid-reimbursed services in terms of the percentage of veterans filling antidepressants for at least 12 weeks after initiation of treatment for major depressive disorder (MDD), as well as posthospitalization follow-up.6
Eligible veterans enrolled in the VA often also seek non-VA care. Medicaid covers nearly 10% of all nonelderly veterans, and of these veterans, 39% rely solely on Medicaid for health care access.7 Today, Medicaid is the largest payer for mental health services in the US, providing coverage for approximately 27% of Americans who have SMI and helping fulfill unmet mental health needs.8,9 Understanding which of these systems veterans choose to use, and under which circumstances, is essential in guiding the allocation of limited health care resources.10
Beyond Medicaid, alternatives to VA care may include TRICARE, Medicare, Indian Health Services, and employer-based or self-purchased private insurance. While these options potentially increase convenience, choice, and access to health care practitioners (HCPs) and services not available at local VA systems, cross-system utilization with poor integration may cause care coordination and continuity problems, such as medication mismanagement and opioid overdose, unnecessary duplicate utilization, and possible increased mortality.11-15 As recent national legislative changes, such as the Patient Protection and Affordable Care Act (ACA), Veterans Access, Choice and Accountability Act, and the VA MISSION Act, continue to shift the health care landscape for veterans, questions surrounding how veterans are changing their health care use become significant.16,17
Here, we approach the impacts of Medicaid expansion on veterans’ reliance on the VA for mental health services with a unique lens. We leverage a difference-in-difference design to study 2 historical Medicaid expansions in Arizona (AZ) and New York (NY), which extended eligibility to childless adults in 2001. Prior Medicaid dual-eligible mental health research investigated reliance shifts during the immediate postenrollment year in a subset of veterans newly enrolled in Medicaid.18 However, this study took place in a period of relative policy stability. In contrast, we investigate the potential effects of a broad policy shift by analyzing state-level changes in veterans’ reliance over 6 years after a statewide Medicaid expansion. We match expansion states with demographically similar nonexpansion states to account for unobserved trends and confounding effects. Prior studies have used this method to evaluate post-Medicaid expansion mortality changes and changes in veteran dual enrollment and hospitalizations.10,19 While a study of ACA Medicaid expansion states would be ideal, Medicaid data from most states were only available through 2014 at the time of this analysis. Our study offers a quasi-experimental framework leveraging longitudinal data that can be applied as more post-ACA data become available.
Given the rising incidence of suicide among veterans, understanding care-seeking behaviors for depression among veterans is important as it is the most common psychiatric condition found in those who died by suicide.20,21 Furthermore, depression may be useful as a clinical proxy for mental health policy impacts, given that the Patient Health Questionnaire-9 (PHQ-9) screening tool is well validated and increasingly research accessible, and it is a chronic condition responsive to both well-managed pharmacologic treatment and psychotherapeutic interventions.22,23
In this study, we quantify the change in care-seeking behavior for depression among veterans after Medicaid expansion, using a quasi-experimental design. We hypothesize that new access to Medicaid would be associated with a shift away from using VA services for depression. Given the income-dependent eligibility requirements of Medicaid, we also hypothesize that veterans who qualified for VA coverage due to low income, determined by a regional means test (Priority group 5, “income-eligible”), would be more likely to shift care compared with those whose serviced-connected conditions related to their military service (Priority groups 1-4, “service-connected”) provide VA access.
Methods
To investigate the relative changes in veterans’ reliance on the VA for depression care after the 2001 NY and AZ Medicaid expansions We used a retrospective, difference-in-difference analysis. Our comparison pairings, based on prior demographic analyses were as follows: NY with Pennsylvania(PA); AZ with New Mexico and Nevada (NM/NV).19 The time frame of our analysis was 1999 to 2006, with pre- and postexpansion periods defined as 1999 to 2000 and 2001 to 2006, respectively.
Data
We included veterans aged 18 to 64 years, seeking care for depression from 1999 to 2006, who were also VA-enrolled and residing in our states of interest. We counted veterans as enrolled in Medicaid if they were enrolled at least 1 month in a given year.
Using similar methods like those used in prior studies, we selected patients with encounters documenting depression as the primary outpatient or inpatient diagnosis using International Classification of Diseases, Ninth Revision, Clinical Modification (ICD-9-CM) codes: 296.2x for a single episode of major depressive disorder, 296.3x for a recurrent episode of MDD, 300.4 for dysthymia, and 311.0 for depression not otherwise specified.18,24 We used data from the Medicaid Analytic eXtract files (MAX) for Medicaid data and the VA Corporate Data Warehouse (CDW) for VA data. We chose 1999 as the first study year because it was the earliest year MAX data were available.
Our final sample included 1833 person-years pre-expansion and 7157 postexpansion in our inpatient analysis, as well as 31,767 person-years pre-expansion and 130,382 postexpansion in our outpatient analysis.
Outcomes and Variables
Our primary outcomes were comparative shifts in VA reliance between expansion and nonexpansion states after Medicaid expansion for both inpatient and outpatient depression care. For each year of study, we calculated a veteran’s VA reliance by aggregating the number of days with depression-related encounters at the VA and dividing by the total number of days with a VA or Medicaid depression-related encounters for the year. To provide context to these shifts in VA reliance, we further analyzed the changes in the proportion of annual VA-Medicaid dual users and annual per capita utilization of depression care across the VA and Medicaid.
We conducted subanalyses by income-eligible and service-connected veterans and adjusted our models for age, non-White race, sex, distances to the nearest inpatient and outpatient VA facilities, and VA Relative Risk Score, which is a measure of disease burden and clinical complexity validated specifically for veterans.25
Statistical Analysis
We used fractional logistic regression to model the adjusted effect of Medicaid expansion on VA reliance for depression care. In parallel, we leveraged ordered logit regression and negative binomial regression models to examine the proportion of VA-Medicaid dual users and the per capita utilization of Medicaid and VA depression care, respectively. To estimate the difference-in-difference effects, we used the interaction term of 2 categorical variables—expansion vs nonexpansion states and pre- vs postexpansion status—as the independent variable. We then calculated the average marginal effects with 95% CIs to estimate the differences in outcomes between expansion and nonexpansion states from pre- to postexpansion periods, as well as year-by-year shifts as a robustness check. We conducted these analyses using Stata MP, version 15.
Results
Baseline and postexpansion characteristics 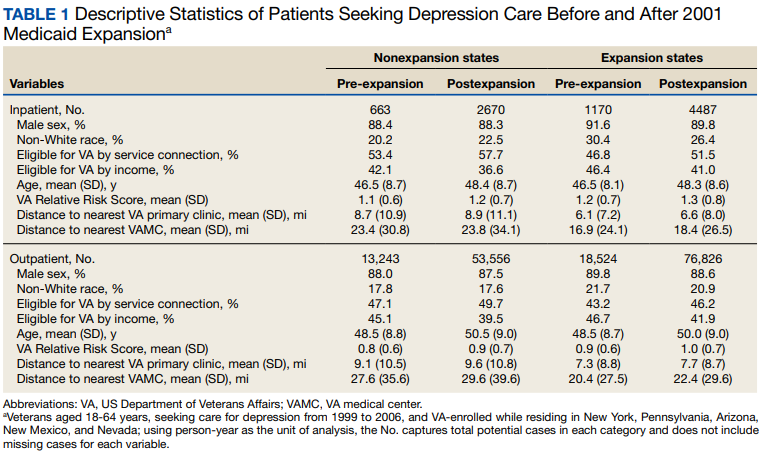
VA Reliance
Overall, we observed postexpansion decreases in VA reliance for depression care 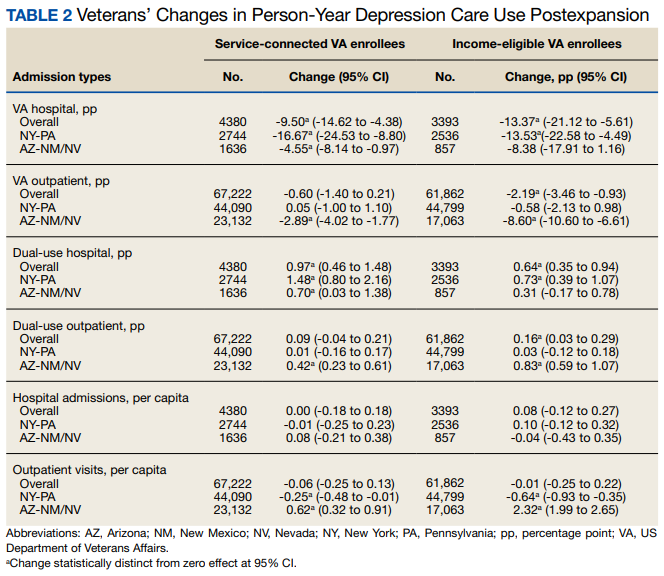
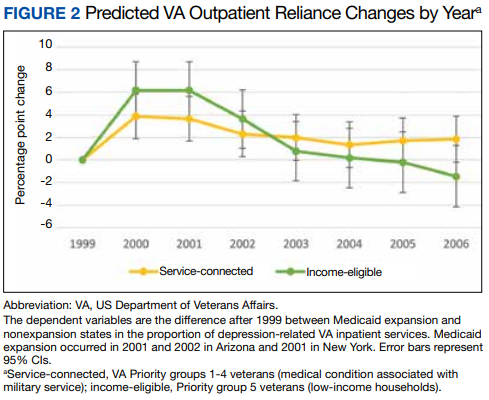
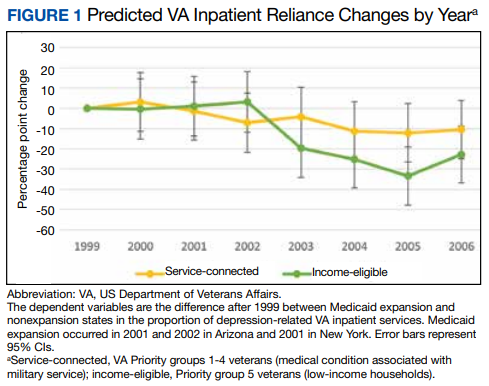
At the state level, reliance on the VA for inpatient depression care in NY decreased by 13.53 pp (95% CI, -22.58 to -4.49) for income-eligible veterans and 16.67 pp (95% CI, -24.53 to -8.80) for service-connected veterans. No relative differences were observed in the outpatient comparisons for both income-eligible (-0.58 pp; 95% CI, -2.13 to 0.98) and service-connected (0.05 pp; 95% CI, -1.00 to 1.10) veterans. In AZ, Medicaid expansion was associated with decreased VA reliance for outpatient depression care among income-eligible veterans (-8.60 pp; 95% CI, -10.60 to -6.61), greater than that for service-connected veterans (-2.89 pp; 95% CI, -4.02 to -1.77). This decrease in VA reliance was significant in the inpatient context only for service-connected veterans (-4.55 pp; 95% CI, -8.14 to -0.97), not income-eligible veterans (-8.38 pp; 95% CI, -17.91 to 1.16).
By applying the aggregate pp changes toward the postexpansion number of visits across both expansion and nonexpansion states, we found that expansion of Medicaid across all our study states would have resulted in 996 fewer hospitalizations and 10,109 fewer outpatient visits for depression at VA in the postexpansion period vs if no states had chosen to expand Medicaid.
Dual Use/Per Capita Utilization
Overall, Medicaid expansion was associated with greater dual use for inpatient depression care—a 0.97-pp (95% CI, 0.46 to 1.48) increase among service-connected veterans and a 0.64-pp (95% CI, 0.35 to 0.94) increase among income-eligible veterans.
At the state level, NY similarly showed increases in dual use among both service-connected (1.48 pp; 95% CI, 0.80 to 2.16) and income-eligible veterans (0.73 pp; 95% CI, 0.39 to 1.07) after Medicaid expansion. However, dual use in AZ increased significantly only among service-connected veterans (0.70 pp; 95% CI, 0.03 to 1.38), not income-eligible veterans (0.31 pp; 95% CI, -0.17 to 0.78).
Among outpatient visits, Medicaid expansion was associated with increased dual use only for income-eligible veterans (0.16 pp; 95% CI, 0.03-0.29), and not service-connected veterans (0.09 pp; 95% CI, -0.04 to 0.21). State-level analyses showed that Medicaid expansion in NY was not associated with changes in dual use for either service-connected (0.01 pp; 95% CI, -0.16 to 0.17) or income-eligible veterans (0.03 pp; 95% CI, -0.12 to 0.18), while expansion in AZ was associated with increases in dual use among both service-connected (0.42 pp; 95% CI, 0.23 to 0.61) and income-eligible veterans (0.83 pp; 95% CI, 0.59 to 1.07).
Concerning per capita utilization of depression care after Medicaid expansion, analyses showed no detectable changes for either inpatient or outpatient services, among both service-connected and income-eligible veterans. However, while this pattern held at the state level among hospitalizations, outpatient visit results showed divergent trends between AZ and NY. In NY, Medicaid expansion was associated with decreased per capita utilization of outpatient depression care among both service-connected (-0.25 visits annually; 95% CI, -0.48 to -0.01) and income-eligible veterans (-0.64 visits annually; 95% CI, -0.93 to -0.35). In AZ, Medicaid expansion was associated with increased per capita utilization of outpatient depression care among both service-connected (0.62 visits annually; 95% CI, 0.32-0.91) and income-eligible veterans (2.32 visits annually; 95% CI, 1.99-2.65).
Discussion
Our study quantified changes in depression-related health care utilization after Medicaid expansions in NY and AZ in 2001. Overall, the balance of evidence indicated that Medicaid expansion was associated with decreased reliance on the VA for depression-related services. There was an exception: income-eligible veterans in AZ did not shift their hospital care away from the VA in a statistically discernible way, although the point estimate was lower. More broadly, these findings concerning veterans’ reliance varied not only in inpatient vs outpatient services and income- vs service-connected eligibility, but also in the state-level contexts of veteran dual users and per capita utilization.
Given that the overall per capita utilization of depression care was unchanged from pre- to postexpansion periods, one might interpret the decreases in VA reliance and increases in Medicaid-VA dual users as a substitution effect from VA care to non-VA care. This could be plausible for hospitalizations where state-level analyses showed similarly stable levels of per capita utilization. However, state-level trends in our outpatient utilization analysis, especially with a substantial 2.32 pp increase in annual per capita visits among income-eligible veterans in AZ, leave open the possibility that in some cases veterans may be complementing VA care with Medicaid-reimbursed services.
The causes underlying these differences in reliance shifts between NY and AZ are likely also influenced by the policy contexts of their respective Medicaid expansions. For example, in 1999, NY passed Kendra’s Law, which established a procedure for obtaining court orders for assisted outpatient mental health treatment for individuals deemed unlikely to survive safely in the community.26 A reasonable inference is that there was less unfulfilled outpatient mental health need in NY under the existing accessibility provisioned by Kendra’s Law. In addition, while both states extended coverage to childless adults under 100% of the Federal Poverty level (FPL), the AZ Medicaid expansion was via a voters’ initiative and extended family coverage to 200% FPL vs 150% FPL for families in NY. Given that the AZ Medicaid expansion enjoyed both broader public participation and generosity in terms of eligibility, its uptake and therefore effect size may have been larger than in NY for nonacute outpatient care.
Our findings contribute to the growing body of literature surrounding the changes in health care utilization after Medicaid expansion, specifically for a newly dual-eligible population of veterans seeking mental health services for depression. While prior research concerning Medicare dual-enrolled veterans has shown high reliance on the VA for both mental health diagnoses and services, scholars have established the association of Medicaid enrollment with decreased VA reliance.27-29 Our analysis is the first to investigate state-level effects of Medicaid expansion on VA reliance for a single mental health condition using a natural experimental framework. We focus on a population that includes a large portion of veterans who are newly Medicaid-eligible due to a sweeping policy change and use demographically matched nonexpansion states to draw comparisons in VA reliance for depression care. Our findings of Medicaid expansion–associated decreases in VA reliance for depression care complement prior literature that describe Medicaid enrollment–associated decreases in VA reliance for overall mental health care.
Implications
From a systems-level perspective, the implications of shifting services away from the VA are complex and incompletely understood. The VA lacks interoperability with the electronic health records (EHRs) used by Medicaid clinicians. Consequently, significant issues of service duplication and incomplete clinical data exist for veterans seeking treatment outside of the VA system, posing health care quality and safety concerns.30 On one hand, Medicaid access is associated with increased health care utilization attributed to filling unmet needs for Medicare dual enrollees, as well as increased prescription filling for psychiatric medications.31,32 Furthermore, the only randomized control trial of Medicaid expansion to date was associated with a 9-pp decrease in positive screening rates for depression among those who received access at around 2 years postexpansion.33 On the other hand, the VA has developed a mental health system tailored to the particular needs of veterans, and health care practitioners at the VA have significantly greater rates of military cultural competency compared to those in nonmilitary settings (70% vs 24% in the TRICARE network and 8% among those with no military or TRICARE affiliation).34 Compared to individuals seeking mental health services with private insurance plans, veterans were about twice as likely to receive appropriate treatment for schizophrenia and depression at the VA.35 These documented strengths of VA mental health care may together help explain the small absolute number of visits that were associated with shifts away from VA overall after Medicaid expansion.
Finally, it is worth considering extrinsic factors that influence utilization among newly dual-eligible veterans. For example, hospitalizations are less likely to be planned than outpatient services, translating to a greater importance of proximity to a nearby medical facility than a veteran’s preference of where to seek care. In the same vein, major VA medical centers are fewer and more distant on average than VA outpatient clinics, therefore reducing the advantage of a Medicaid-reimbursed outpatient clinic in terms of distance.36 These realities may partially explain the proportionally larger shifts away from the VA for hospitalizations compared to outpatient care for depression.
Limitations and Future Directions
Our results should be interpreted within methodological and data limitations. With only 2 states in our sample, NY demonstrably skewed overall results, contributing 1.7 to 3 times more observations than AZ across subanalyses—a challenge also cited by Sommers and colleagues.19 Our veteran groupings were also unable to distinguish those veterans classified as service-connected who may also have qualified by income-eligible criteria (which would tend to understate the size of results) and those veterans who gained and then lost Medicaid coverage in a given year. Our study also faces limitations in generalizability and establishing causality. First, we included only 2 historical state Medicaid expansions, compared with the 38 states and Washington, DC, that have now expanded Medicaid to date under the ACA. Just in the 2 states from our study, we noted significant heterogeneity in the shifts associated with Medicaid expansion, which makes extrapolating specific trends difficult. Differences in underlying health care resources, legislation, and other external factors may limit the applicability of Medicaid expansion in the era of the ACA, as well as the Veterans Choice and MISSION acts. Second, while we leveraged a difference-in-difference analysis using demographically matched, neighboring comparison states, our findings are nevertheless drawn from observational data obviating causality. VA data for other sources of coverage such as private insurance are limited and not included in our study, and MAX datasets vary by quality across states, translating to potential gaps in our study cohort.28
Moving forward, our study demonstrates the potential for applying a natural experimental approach to studying dual-eligible veterans at the interface of Medicaid expansion. We focused on changes in VA reliance for the specific condition of depression and, in doing so, invite further inquiry into the impact of state mental health policy on outcomes more proximate to veterans’ outcomes. Clinical indicators, such as rates of antidepressant filling, utilization and duration of psychotherapy, and PHQ-9 scores, can similarly be investigated by natural experimental design. While current limits of administrative data and the siloing of EHRs may pose barriers to some of these avenues of research, multidisciplinary methodologies and data querying innovations such as natural language processing algorithms for clinical notes hold exciting opportunities to bridge the gap between policy and clinical efficacy.
Conclusions
This study applied a difference-in-difference analysis and found that Medicaid expansion is associated with decreases in VA reliance for both inpatient and outpatient services for depression. As additional data are generated from the Medicaid expansions of the ACA, similarly robust methods should be applied to further explore the impacts associated with such policy shifts and open the door to a better understanding of implications at the clinical level.
Acknowledgments
We acknowledge the efforts of Janine Wong, who proofread and formatted the manuscript.
1. US Department of Veterans Affairs, Veterans Health Administration. About VA. 2019. Updated September 27, 2022. Accessed September 29, 2022. https://www.va.gov/health/
2. Richardson LK, Frueh BC, Acierno R. Prevalence estimates of combat-related post-traumatic stress disorder: critical review. Aust N Z J Psychiatry. 2010;44(1):4-19. doi:10.3109/00048670903393597
3. Lan CW, Fiellin DA, Barry DT, et al. The epidemiology of substance use disorders in US veterans: a systematic review and analysis of assessment methods. Am J Addict. 2016;25(1):7-24. doi:10.1111/ajad.12319
4. Grant BF, Saha TD, June Ruan W, et al. Epidemiology of DSM-5 drug use disorder results from the national epidemiologic survey on alcohol and related conditions-III. JAMA Psychiat. 2016;73(1):39-47. doi:10.1001/jamapsychiatry.015.2132
5. Pemberton MR, Forman-Hoffman VL, Lipari RN, Ashley OS, Heller DC, Williams MR. Prevalence of past year substance use and mental illness by veteran status in a nationally representative sample. CBHSQ Data Review. Published November 9, 2016. Accessed October 6, 2022. https://www.samhsa.gov/data/report/prevalence-past-year-substance-use-and-mental-illness-veteran-status-nationally
6. Watkins KE, Pincus HA, Smith B, et al. Veterans Health Administration Mental Health Program Evaluation: Capstone Report. 2011. Accessed September 29, 2022. https://www.rand.org/pubs/technical_reports/TR956.html
7. Henry J. Kaiser Family Foundation. Medicaid’s role in covering veterans. June 29, 2017. Accessed September 29, 2022. https://www.kff.org/infographic/medicaids-role-in-covering-veterans
8. Substance Abuse and Mental Health Services Administration. Results from the 2016 National Survey on Drug Use and Health: detailed tables. September 7, 2017. Accessed September 29, 2022. https://www.samhsa.gov/data/sites/default/files/NSDUH-DetTabs-2016/NSDUH-DetTabs-2016.pdf
9. Wen H, Druss BG, Cummings JR. Effect of Medicaid expansions on health insurance coverage and access to care among low-income adults with behavioral health conditions. Health Serv Res. 2015;50:1787-1809. doi:10.1111/1475-6773.12411
10. O’Mahen PN, Petersen LA. Effects of state-level Medicaid expansion on Veterans Health Administration dual enrollment and utilization: potential implications for future coverage expansions. Med Care. 2020;58(6):526-533. doi:10.1097/MLR.0000000000001327
11. Ono SS, Dziak KM, Wittrock SM, et al. Treating dual-use patients across two health care systems: a qualitative study. Fed Pract. 2015;32(8):32-37.
12. Weeks WB, Mahar PJ, Wright SM. Utilization of VA and Medicare services by Medicare-eligible veterans: the impact of additional access points in a rural setting. J Healthc Manag. 2005;50(2):95-106.
13. Gellad WF, Thorpe JM, Zhao X, et al. Impact of dual use of Department of Veterans Affairs and Medicare part d drug benefits on potentially unsafe opioid use. Am J Public Health. 2018;108(2):248-255. doi:10.2105/AJPH.2017.304174
14. Coughlin SS, Young L. A review of dual health care system use by veterans with cardiometabolic disease. J Hosp Manag Health Policy. 2018;2:39. doi:10.21037/jhmhp.2018.07.05
15. Radomski TR, Zhao X, Thorpe CT, et al. The impact of medication-based risk adjustment on the association between veteran health outcomes and dual health system use. J Gen Intern Med. 2017;32(9):967-973. doi:10.1007/s11606-017-4064-4
16. Kullgren JT, Fagerlin A, Kerr EA. Completing the MISSION: a blueprint for helping veterans make the most of new choices. J Gen Intern Med. 2020;35(5):1567-1570. doi:10.1007/s11606-019-05404-w
17. VA MISSION Act of 2018, 38 USC §101 (2018). https://www.govinfo.gov/app/details/USCODE-2018-title38/USCODE-2018-title38-partI-chap1-sec101
18. Vanneman ME, Phibbs CS, Dally SK, Trivedi AN, Yoon J. The impact of Medicaid enrollment on Veterans Health Administration enrollees’ behavioral health services use. Health Serv Res. 2018;53(suppl 3):5238-5259. doi:10.1111/1475-6773.13062
19. Sommers BD, Baicker K, Epstein AM. Mortality and access to care among adults after state Medicaid expansions. N Engl J Med. 2012;367(11):1025-1034. doi:10.1056/NEJMsa1202099
20. US Department of Veterans Affairs Office of Mental Health. 2019 national veteran suicide prevention annual report. 2019. Accessed September 29, 2022. https://www.mentalhealth.va.gov/docs/data-sheets/2019/2019_National_Veteran_Suicide_Prevention_Annual_Report_508.pdf
21. Hawton K, Casañas I Comabella C, Haw C, Saunders K. Risk factors for suicide in individuals with depression: a systematic review. J Affect Disord. 2013;147(1-3):17-28. doi:10.1016/j.jad.2013.01.004
22. Adekkanattu P, Sholle ET, DeFerio J, Pathak J, Johnson SB, Campion TR Jr. Ascertaining depression severity by extracting Patient Health Questionnaire-9 (PHQ-9) scores from clinical notes. AMIA Annu Symp Proc. 2018;2018:147-156.
23. DeRubeis RJ, Siegle GJ, Hollon SD. Cognitive therapy versus medication for depression: treatment outcomes and neural mechanisms. Nat Rev Neurosci. 2008;9(10):788-796. doi:10.1038/nrn2345
24. Cully JA, Zimmer M, Khan MM, Petersen LA. Quality of depression care and its impact on health service use and mortality among veterans. Psychiatr Serv. 2008;59(12):1399-1405. doi:10.1176/ps.2008.59.12.1399
25. Byrne MM, Kuebeler M, Pietz K, Petersen LA. Effect of using information from only one system for dually eligible health care users. Med Care. 2006;44(8):768-773. doi:10.1097/01.mlr.0000218786.44722.14
26. Watkins KE, Smith B, Akincigil A, et al. The quality of medication treatment for mental disorders in the Department of Veterans Affairs and in private-sector plans. Psychiatr Serv. 2016;67(4):391-396. doi:10.1176/appi.ps.201400537
27. Petersen LA, Byrne MM, Daw CN, Hasche J, Reis B, Pietz K. Relationship between clinical conditions and use of Veterans Affairs health care among Medicare-enrolled veterans. Health Serv Res. 2010;45(3):762-791. doi:10.1111/j.1475-6773.2010.01107.x
28. Yoon J, Vanneman ME, Dally SK, Trivedi AN, Phibbs Ciaran S. Use of Veterans Affairs and Medicaid services for dually enrolled veterans. Health Serv Res. 2018;53(3):1539-1561. doi:10.1111/1475-6773.12727
29. Yoon J, Vanneman ME, Dally SK, Trivedi AN, Phibbs Ciaran S. Veterans’ reliance on VA care by type of service and distance to VA for nonelderly VA-Medicaid dual enrollees. Med Care. 2019;57(3):225-229. doi:10.1097/MLR.0000000000001066
30. Gaglioti A, Cozad A, Wittrock S, et al. Non-VA primary care providers’ perspectives on comanagement for rural veterans. Mil Med. 2014;179(11):1236-1243. doi:10.7205/MILMED-D-13-00342
31. Moon S, Shin J. Health care utilization among Medicare-Medicaid dual eligibles: a count data analysis. BMC Public Health. 2006;6(1):88. doi:10.1186/1471-2458-6-88
32. Henry J. Kaiser Family Foundation. Facilitating access to mental health services: a look at Medicaid, private insurance, and the uninsured. November 27, 2017. Accessed September 29, 2022. https://www.kff.org/medicaid/fact-sheet/facilitating-access-to-mental-health-services-a-look-at-medicaid-private-insurance-and-the-uninsured
33. Baicker K, Taubman SL, Allen HL, et al. The Oregon experiment - effects of Medicaid on clinical outcomes. N Engl J Med. 2013;368(18):1713-1722. doi:10.1056/NEJMsa1212321
34. Tanielian T, Farris C, Batka C, et al. Ready to serve: community-based provider capacity to deliver culturally competent, quality mental health care to veterans and their families. 2014. Accessed September 29, 2022. https://www.rand.org/content/dam/rand/pubs/research_reports/RR800/RR806/RAND_RR806.pdf
35. Kizer KW, Dudley RA. Extreme makeover: transformation of the Veterans Health Care System. Annu Rev Public Health. 2009;30(1):313-339. doi:10.1146/annurev.publhealth.29.020907.090940
36. Brennan KJ. Kendra’s Law: final report on the status of assisted outpatient treatment, appendix 2. 2002. Accessed September 29, 2022. https://omh.ny.gov/omhweb/kendra_web/finalreport/appendix2.htm
The US Department of Veterans Affairs (VA) is the largest integrated health care system in the United States, providing care for more than 9 million veterans.1 With veterans experiencing mental health conditions like posttraumatic stress disorder (PTSD), substance use disorders, and other serious mental illnesses (SMI) at higher rates compared with the general population, the VA plays an important role in the provision of mental health services.2-5 Since the implementation of its Mental Health Strategic Plan in 2004, the VA has overseen the development of a wide array of mental health programs geared toward the complex needs of veterans. Research has demonstrated VA care outperforming Medicaid-reimbursed services in terms of the percentage of veterans filling antidepressants for at least 12 weeks after initiation of treatment for major depressive disorder (MDD), as well as posthospitalization follow-up.6
Eligible veterans enrolled in the VA often also seek non-VA care. Medicaid covers nearly 10% of all nonelderly veterans, and of these veterans, 39% rely solely on Medicaid for health care access.7 Today, Medicaid is the largest payer for mental health services in the US, providing coverage for approximately 27% of Americans who have SMI and helping fulfill unmet mental health needs.8,9 Understanding which of these systems veterans choose to use, and under which circumstances, is essential in guiding the allocation of limited health care resources.10
Beyond Medicaid, alternatives to VA care may include TRICARE, Medicare, Indian Health Services, and employer-based or self-purchased private insurance. While these options potentially increase convenience, choice, and access to health care practitioners (HCPs) and services not available at local VA systems, cross-system utilization with poor integration may cause care coordination and continuity problems, such as medication mismanagement and opioid overdose, unnecessary duplicate utilization, and possible increased mortality.11-15 As recent national legislative changes, such as the Patient Protection and Affordable Care Act (ACA), Veterans Access, Choice and Accountability Act, and the VA MISSION Act, continue to shift the health care landscape for veterans, questions surrounding how veterans are changing their health care use become significant.16,17
Here, we approach the impacts of Medicaid expansion on veterans’ reliance on the VA for mental health services with a unique lens. We leverage a difference-in-difference design to study 2 historical Medicaid expansions in Arizona (AZ) and New York (NY), which extended eligibility to childless adults in 2001. Prior Medicaid dual-eligible mental health research investigated reliance shifts during the immediate postenrollment year in a subset of veterans newly enrolled in Medicaid.18 However, this study took place in a period of relative policy stability. In contrast, we investigate the potential effects of a broad policy shift by analyzing state-level changes in veterans’ reliance over 6 years after a statewide Medicaid expansion. We match expansion states with demographically similar nonexpansion states to account for unobserved trends and confounding effects. Prior studies have used this method to evaluate post-Medicaid expansion mortality changes and changes in veteran dual enrollment and hospitalizations.10,19 While a study of ACA Medicaid expansion states would be ideal, Medicaid data from most states were only available through 2014 at the time of this analysis. Our study offers a quasi-experimental framework leveraging longitudinal data that can be applied as more post-ACA data become available.
Given the rising incidence of suicide among veterans, understanding care-seeking behaviors for depression among veterans is important as it is the most common psychiatric condition found in those who died by suicide.20,21 Furthermore, depression may be useful as a clinical proxy for mental health policy impacts, given that the Patient Health Questionnaire-9 (PHQ-9) screening tool is well validated and increasingly research accessible, and it is a chronic condition responsive to both well-managed pharmacologic treatment and psychotherapeutic interventions.22,23
In this study, we quantify the change in care-seeking behavior for depression among veterans after Medicaid expansion, using a quasi-experimental design. We hypothesize that new access to Medicaid would be associated with a shift away from using VA services for depression. Given the income-dependent eligibility requirements of Medicaid, we also hypothesize that veterans who qualified for VA coverage due to low income, determined by a regional means test (Priority group 5, “income-eligible”), would be more likely to shift care compared with those whose serviced-connected conditions related to their military service (Priority groups 1-4, “service-connected”) provide VA access.
Methods
To investigate the relative changes in veterans’ reliance on the VA for depression care after the 2001 NY and AZ Medicaid expansions We used a retrospective, difference-in-difference analysis. Our comparison pairings, based on prior demographic analyses were as follows: NY with Pennsylvania(PA); AZ with New Mexico and Nevada (NM/NV).19 The time frame of our analysis was 1999 to 2006, with pre- and postexpansion periods defined as 1999 to 2000 and 2001 to 2006, respectively.
Data
We included veterans aged 18 to 64 years, seeking care for depression from 1999 to 2006, who were also VA-enrolled and residing in our states of interest. We counted veterans as enrolled in Medicaid if they were enrolled at least 1 month in a given year.
Using similar methods like those used in prior studies, we selected patients with encounters documenting depression as the primary outpatient or inpatient diagnosis using International Classification of Diseases, Ninth Revision, Clinical Modification (ICD-9-CM) codes: 296.2x for a single episode of major depressive disorder, 296.3x for a recurrent episode of MDD, 300.4 for dysthymia, and 311.0 for depression not otherwise specified.18,24 We used data from the Medicaid Analytic eXtract files (MAX) for Medicaid data and the VA Corporate Data Warehouse (CDW) for VA data. We chose 1999 as the first study year because it was the earliest year MAX data were available.
Our final sample included 1833 person-years pre-expansion and 7157 postexpansion in our inpatient analysis, as well as 31,767 person-years pre-expansion and 130,382 postexpansion in our outpatient analysis.
Outcomes and Variables
Our primary outcomes were comparative shifts in VA reliance between expansion and nonexpansion states after Medicaid expansion for both inpatient and outpatient depression care. For each year of study, we calculated a veteran’s VA reliance by aggregating the number of days with depression-related encounters at the VA and dividing by the total number of days with a VA or Medicaid depression-related encounters for the year. To provide context to these shifts in VA reliance, we further analyzed the changes in the proportion of annual VA-Medicaid dual users and annual per capita utilization of depression care across the VA and Medicaid.
We conducted subanalyses by income-eligible and service-connected veterans and adjusted our models for age, non-White race, sex, distances to the nearest inpatient and outpatient VA facilities, and VA Relative Risk Score, which is a measure of disease burden and clinical complexity validated specifically for veterans.25
Statistical Analysis
We used fractional logistic regression to model the adjusted effect of Medicaid expansion on VA reliance for depression care. In parallel, we leveraged ordered logit regression and negative binomial regression models to examine the proportion of VA-Medicaid dual users and the per capita utilization of Medicaid and VA depression care, respectively. To estimate the difference-in-difference effects, we used the interaction term of 2 categorical variables—expansion vs nonexpansion states and pre- vs postexpansion status—as the independent variable. We then calculated the average marginal effects with 95% CIs to estimate the differences in outcomes between expansion and nonexpansion states from pre- to postexpansion periods, as well as year-by-year shifts as a robustness check. We conducted these analyses using Stata MP, version 15.
Results
Baseline and postexpansion characteristics
VA Reliance
Overall, we observed postexpansion decreases in VA reliance for depression care
At the state level, reliance on the VA for inpatient depression care in NY decreased by 13.53 pp (95% CI, -22.58 to -4.49) for income-eligible veterans and 16.67 pp (95% CI, -24.53 to -8.80) for service-connected veterans. No relative differences were observed in the outpatient comparisons for both income-eligible (-0.58 pp; 95% CI, -2.13 to 0.98) and service-connected (0.05 pp; 95% CI, -1.00 to 1.10) veterans. In AZ, Medicaid expansion was associated with decreased VA reliance for outpatient depression care among income-eligible veterans (-8.60 pp; 95% CI, -10.60 to -6.61), greater than that for service-connected veterans (-2.89 pp; 95% CI, -4.02 to -1.77). This decrease in VA reliance was significant in the inpatient context only for service-connected veterans (-4.55 pp; 95% CI, -8.14 to -0.97), not income-eligible veterans (-8.38 pp; 95% CI, -17.91 to 1.16).
By applying the aggregate pp changes toward the postexpansion number of visits across both expansion and nonexpansion states, we found that expansion of Medicaid across all our study states would have resulted in 996 fewer hospitalizations and 10,109 fewer outpatient visits for depression at VA in the postexpansion period vs if no states had chosen to expand Medicaid.
Dual Use/Per Capita Utilization
Overall, Medicaid expansion was associated with greater dual use for inpatient depression care—a 0.97-pp (95% CI, 0.46 to 1.48) increase among service-connected veterans and a 0.64-pp (95% CI, 0.35 to 0.94) increase among income-eligible veterans.
At the state level, NY similarly showed increases in dual use among both service-connected (1.48 pp; 95% CI, 0.80 to 2.16) and income-eligible veterans (0.73 pp; 95% CI, 0.39 to 1.07) after Medicaid expansion. However, dual use in AZ increased significantly only among service-connected veterans (0.70 pp; 95% CI, 0.03 to 1.38), not income-eligible veterans (0.31 pp; 95% CI, -0.17 to 0.78).
Among outpatient visits, Medicaid expansion was associated with increased dual use only for income-eligible veterans (0.16 pp; 95% CI, 0.03-0.29), and not service-connected veterans (0.09 pp; 95% CI, -0.04 to 0.21). State-level analyses showed that Medicaid expansion in NY was not associated with changes in dual use for either service-connected (0.01 pp; 95% CI, -0.16 to 0.17) or income-eligible veterans (0.03 pp; 95% CI, -0.12 to 0.18), while expansion in AZ was associated with increases in dual use among both service-connected (0.42 pp; 95% CI, 0.23 to 0.61) and income-eligible veterans (0.83 pp; 95% CI, 0.59 to 1.07).
Concerning per capita utilization of depression care after Medicaid expansion, analyses showed no detectable changes for either inpatient or outpatient services, among both service-connected and income-eligible veterans. However, while this pattern held at the state level among hospitalizations, outpatient visit results showed divergent trends between AZ and NY. In NY, Medicaid expansion was associated with decreased per capita utilization of outpatient depression care among both service-connected (-0.25 visits annually; 95% CI, -0.48 to -0.01) and income-eligible veterans (-0.64 visits annually; 95% CI, -0.93 to -0.35). In AZ, Medicaid expansion was associated with increased per capita utilization of outpatient depression care among both service-connected (0.62 visits annually; 95% CI, 0.32-0.91) and income-eligible veterans (2.32 visits annually; 95% CI, 1.99-2.65).
Discussion
Our study quantified changes in depression-related health care utilization after Medicaid expansions in NY and AZ in 2001. Overall, the balance of evidence indicated that Medicaid expansion was associated with decreased reliance on the VA for depression-related services. There was an exception: income-eligible veterans in AZ did not shift their hospital care away from the VA in a statistically discernible way, although the point estimate was lower. More broadly, these findings concerning veterans’ reliance varied not only in inpatient vs outpatient services and income- vs service-connected eligibility, but also in the state-level contexts of veteran dual users and per capita utilization.
Given that the overall per capita utilization of depression care was unchanged from pre- to postexpansion periods, one might interpret the decreases in VA reliance and increases in Medicaid-VA dual users as a substitution effect from VA care to non-VA care. This could be plausible for hospitalizations where state-level analyses showed similarly stable levels of per capita utilization. However, state-level trends in our outpatient utilization analysis, especially with a substantial 2.32 pp increase in annual per capita visits among income-eligible veterans in AZ, leave open the possibility that in some cases veterans may be complementing VA care with Medicaid-reimbursed services.
The causes underlying these differences in reliance shifts between NY and AZ are likely also influenced by the policy contexts of their respective Medicaid expansions. For example, in 1999, NY passed Kendra’s Law, which established a procedure for obtaining court orders for assisted outpatient mental health treatment for individuals deemed unlikely to survive safely in the community.26 A reasonable inference is that there was less unfulfilled outpatient mental health need in NY under the existing accessibility provisioned by Kendra’s Law. In addition, while both states extended coverage to childless adults under 100% of the Federal Poverty level (FPL), the AZ Medicaid expansion was via a voters’ initiative and extended family coverage to 200% FPL vs 150% FPL for families in NY. Given that the AZ Medicaid expansion enjoyed both broader public participation and generosity in terms of eligibility, its uptake and therefore effect size may have been larger than in NY for nonacute outpatient care.
Our findings contribute to the growing body of literature surrounding the changes in health care utilization after Medicaid expansion, specifically for a newly dual-eligible population of veterans seeking mental health services for depression. While prior research concerning Medicare dual-enrolled veterans has shown high reliance on the VA for both mental health diagnoses and services, scholars have established the association of Medicaid enrollment with decreased VA reliance.27-29 Our analysis is the first to investigate state-level effects of Medicaid expansion on VA reliance for a single mental health condition using a natural experimental framework. We focus on a population that includes a large portion of veterans who are newly Medicaid-eligible due to a sweeping policy change and use demographically matched nonexpansion states to draw comparisons in VA reliance for depression care. Our findings of Medicaid expansion–associated decreases in VA reliance for depression care complement prior literature that describe Medicaid enrollment–associated decreases in VA reliance for overall mental health care.
Implications
From a systems-level perspective, the implications of shifting services away from the VA are complex and incompletely understood. The VA lacks interoperability with the electronic health records (EHRs) used by Medicaid clinicians. Consequently, significant issues of service duplication and incomplete clinical data exist for veterans seeking treatment outside of the VA system, posing health care quality and safety concerns.30 On one hand, Medicaid access is associated with increased health care utilization attributed to filling unmet needs for Medicare dual enrollees, as well as increased prescription filling for psychiatric medications.31,32 Furthermore, the only randomized control trial of Medicaid expansion to date was associated with a 9-pp decrease in positive screening rates for depression among those who received access at around 2 years postexpansion.33 On the other hand, the VA has developed a mental health system tailored to the particular needs of veterans, and health care practitioners at the VA have significantly greater rates of military cultural competency compared to those in nonmilitary settings (70% vs 24% in the TRICARE network and 8% among those with no military or TRICARE affiliation).34 Compared to individuals seeking mental health services with private insurance plans, veterans were about twice as likely to receive appropriate treatment for schizophrenia and depression at the VA.35 These documented strengths of VA mental health care may together help explain the small absolute number of visits that were associated with shifts away from VA overall after Medicaid expansion.
Finally, it is worth considering extrinsic factors that influence utilization among newly dual-eligible veterans. For example, hospitalizations are less likely to be planned than outpatient services, translating to a greater importance of proximity to a nearby medical facility than a veteran’s preference of where to seek care. In the same vein, major VA medical centers are fewer and more distant on average than VA outpatient clinics, therefore reducing the advantage of a Medicaid-reimbursed outpatient clinic in terms of distance.36 These realities may partially explain the proportionally larger shifts away from the VA for hospitalizations compared to outpatient care for depression.
Limitations and Future Directions
Our results should be interpreted within methodological and data limitations. With only 2 states in our sample, NY demonstrably skewed overall results, contributing 1.7 to 3 times more observations than AZ across subanalyses—a challenge also cited by Sommers and colleagues.19 Our veteran groupings were also unable to distinguish those veterans classified as service-connected who may also have qualified by income-eligible criteria (which would tend to understate the size of results) and those veterans who gained and then lost Medicaid coverage in a given year. Our study also faces limitations in generalizability and establishing causality. First, we included only 2 historical state Medicaid expansions, compared with the 38 states and Washington, DC, that have now expanded Medicaid to date under the ACA. Just in the 2 states from our study, we noted significant heterogeneity in the shifts associated with Medicaid expansion, which makes extrapolating specific trends difficult. Differences in underlying health care resources, legislation, and other external factors may limit the applicability of Medicaid expansion in the era of the ACA, as well as the Veterans Choice and MISSION acts. Second, while we leveraged a difference-in-difference analysis using demographically matched, neighboring comparison states, our findings are nevertheless drawn from observational data obviating causality. VA data for other sources of coverage such as private insurance are limited and not included in our study, and MAX datasets vary by quality across states, translating to potential gaps in our study cohort.28
Moving forward, our study demonstrates the potential for applying a natural experimental approach to studying dual-eligible veterans at the interface of Medicaid expansion. We focused on changes in VA reliance for the specific condition of depression and, in doing so, invite further inquiry into the impact of state mental health policy on outcomes more proximate to veterans’ outcomes. Clinical indicators, such as rates of antidepressant filling, utilization and duration of psychotherapy, and PHQ-9 scores, can similarly be investigated by natural experimental design. While current limits of administrative data and the siloing of EHRs may pose barriers to some of these avenues of research, multidisciplinary methodologies and data querying innovations such as natural language processing algorithms for clinical notes hold exciting opportunities to bridge the gap between policy and clinical efficacy.
Conclusions
This study applied a difference-in-difference analysis and found that Medicaid expansion is associated with decreases in VA reliance for both inpatient and outpatient services for depression. As additional data are generated from the Medicaid expansions of the ACA, similarly robust methods should be applied to further explore the impacts associated with such policy shifts and open the door to a better understanding of implications at the clinical level.
Acknowledgments
We acknowledge the efforts of Janine Wong, who proofread and formatted the manuscript.
1. US Department of Veterans Affairs, Veterans Health Administration. About VA. 2019. Updated September 27, 2022. Accessed September 29, 2022. https://www.va.gov/health/
2. Richardson LK, Frueh BC, Acierno R. Prevalence estimates of combat-related post-traumatic stress disorder: critical review. Aust N Z J Psychiatry. 2010;44(1):4-19. doi:10.3109/00048670903393597
3. Lan CW, Fiellin DA, Barry DT, et al. The epidemiology of substance use disorders in US veterans: a systematic review and analysis of assessment methods. Am J Addict. 2016;25(1):7-24. doi:10.1111/ajad.12319
4. Grant BF, Saha TD, June Ruan W, et al. Epidemiology of DSM-5 drug use disorder results from the national epidemiologic survey on alcohol and related conditions-III. JAMA Psychiat. 2016;73(1):39-47. doi:10.1001/jamapsychiatry.015.2132
5. Pemberton MR, Forman-Hoffman VL, Lipari RN, Ashley OS, Heller DC, Williams MR. Prevalence of past year substance use and mental illness by veteran status in a nationally representative sample. CBHSQ Data Review. Published November 9, 2016. Accessed October 6, 2022. https://www.samhsa.gov/data/report/prevalence-past-year-substance-use-and-mental-illness-veteran-status-nationally
6. Watkins KE, Pincus HA, Smith B, et al. Veterans Health Administration Mental Health Program Evaluation: Capstone Report. 2011. Accessed September 29, 2022. https://www.rand.org/pubs/technical_reports/TR956.html
7. Henry J. Kaiser Family Foundation. Medicaid’s role in covering veterans. June 29, 2017. Accessed September 29, 2022. https://www.kff.org/infographic/medicaids-role-in-covering-veterans
8. Substance Abuse and Mental Health Services Administration. Results from the 2016 National Survey on Drug Use and Health: detailed tables. September 7, 2017. Accessed September 29, 2022. https://www.samhsa.gov/data/sites/default/files/NSDUH-DetTabs-2016/NSDUH-DetTabs-2016.pdf
9. Wen H, Druss BG, Cummings JR. Effect of Medicaid expansions on health insurance coverage and access to care among low-income adults with behavioral health conditions. Health Serv Res. 2015;50:1787-1809. doi:10.1111/1475-6773.12411
10. O’Mahen PN, Petersen LA. Effects of state-level Medicaid expansion on Veterans Health Administration dual enrollment and utilization: potential implications for future coverage expansions. Med Care. 2020;58(6):526-533. doi:10.1097/MLR.0000000000001327
11. Ono SS, Dziak KM, Wittrock SM, et al. Treating dual-use patients across two health care systems: a qualitative study. Fed Pract. 2015;32(8):32-37.
12. Weeks WB, Mahar PJ, Wright SM. Utilization of VA and Medicare services by Medicare-eligible veterans: the impact of additional access points in a rural setting. J Healthc Manag. 2005;50(2):95-106.
13. Gellad WF, Thorpe JM, Zhao X, et al. Impact of dual use of Department of Veterans Affairs and Medicare part d drug benefits on potentially unsafe opioid use. Am J Public Health. 2018;108(2):248-255. doi:10.2105/AJPH.2017.304174
14. Coughlin SS, Young L. A review of dual health care system use by veterans with cardiometabolic disease. J Hosp Manag Health Policy. 2018;2:39. doi:10.21037/jhmhp.2018.07.05
15. Radomski TR, Zhao X, Thorpe CT, et al. The impact of medication-based risk adjustment on the association between veteran health outcomes and dual health system use. J Gen Intern Med. 2017;32(9):967-973. doi:10.1007/s11606-017-4064-4
16. Kullgren JT, Fagerlin A, Kerr EA. Completing the MISSION: a blueprint for helping veterans make the most of new choices. J Gen Intern Med. 2020;35(5):1567-1570. doi:10.1007/s11606-019-05404-w
17. VA MISSION Act of 2018, 38 USC §101 (2018). https://www.govinfo.gov/app/details/USCODE-2018-title38/USCODE-2018-title38-partI-chap1-sec101
18. Vanneman ME, Phibbs CS, Dally SK, Trivedi AN, Yoon J. The impact of Medicaid enrollment on Veterans Health Administration enrollees’ behavioral health services use. Health Serv Res. 2018;53(suppl 3):5238-5259. doi:10.1111/1475-6773.13062
19. Sommers BD, Baicker K, Epstein AM. Mortality and access to care among adults after state Medicaid expansions. N Engl J Med. 2012;367(11):1025-1034. doi:10.1056/NEJMsa1202099
20. US Department of Veterans Affairs Office of Mental Health. 2019 national veteran suicide prevention annual report. 2019. Accessed September 29, 2022. https://www.mentalhealth.va.gov/docs/data-sheets/2019/2019_National_Veteran_Suicide_Prevention_Annual_Report_508.pdf
21. Hawton K, Casañas I Comabella C, Haw C, Saunders K. Risk factors for suicide in individuals with depression: a systematic review. J Affect Disord. 2013;147(1-3):17-28. doi:10.1016/j.jad.2013.01.004
22. Adekkanattu P, Sholle ET, DeFerio J, Pathak J, Johnson SB, Campion TR Jr. Ascertaining depression severity by extracting Patient Health Questionnaire-9 (PHQ-9) scores from clinical notes. AMIA Annu Symp Proc. 2018;2018:147-156.
23. DeRubeis RJ, Siegle GJ, Hollon SD. Cognitive therapy versus medication for depression: treatment outcomes and neural mechanisms. Nat Rev Neurosci. 2008;9(10):788-796. doi:10.1038/nrn2345
24. Cully JA, Zimmer M, Khan MM, Petersen LA. Quality of depression care and its impact on health service use and mortality among veterans. Psychiatr Serv. 2008;59(12):1399-1405. doi:10.1176/ps.2008.59.12.1399
25. Byrne MM, Kuebeler M, Pietz K, Petersen LA. Effect of using information from only one system for dually eligible health care users. Med Care. 2006;44(8):768-773. doi:10.1097/01.mlr.0000218786.44722.14
26. Watkins KE, Smith B, Akincigil A, et al. The quality of medication treatment for mental disorders in the Department of Veterans Affairs and in private-sector plans. Psychiatr Serv. 2016;67(4):391-396. doi:10.1176/appi.ps.201400537
27. Petersen LA, Byrne MM, Daw CN, Hasche J, Reis B, Pietz K. Relationship between clinical conditions and use of Veterans Affairs health care among Medicare-enrolled veterans. Health Serv Res. 2010;45(3):762-791. doi:10.1111/j.1475-6773.2010.01107.x
28. Yoon J, Vanneman ME, Dally SK, Trivedi AN, Phibbs Ciaran S. Use of Veterans Affairs and Medicaid services for dually enrolled veterans. Health Serv Res. 2018;53(3):1539-1561. doi:10.1111/1475-6773.12727
29. Yoon J, Vanneman ME, Dally SK, Trivedi AN, Phibbs Ciaran S. Veterans’ reliance on VA care by type of service and distance to VA for nonelderly VA-Medicaid dual enrollees. Med Care. 2019;57(3):225-229. doi:10.1097/MLR.0000000000001066
30. Gaglioti A, Cozad A, Wittrock S, et al. Non-VA primary care providers’ perspectives on comanagement for rural veterans. Mil Med. 2014;179(11):1236-1243. doi:10.7205/MILMED-D-13-00342
31. Moon S, Shin J. Health care utilization among Medicare-Medicaid dual eligibles: a count data analysis. BMC Public Health. 2006;6(1):88. doi:10.1186/1471-2458-6-88
32. Henry J. Kaiser Family Foundation. Facilitating access to mental health services: a look at Medicaid, private insurance, and the uninsured. November 27, 2017. Accessed September 29, 2022. https://www.kff.org/medicaid/fact-sheet/facilitating-access-to-mental-health-services-a-look-at-medicaid-private-insurance-and-the-uninsured
33. Baicker K, Taubman SL, Allen HL, et al. The Oregon experiment - effects of Medicaid on clinical outcomes. N Engl J Med. 2013;368(18):1713-1722. doi:10.1056/NEJMsa1212321
34. Tanielian T, Farris C, Batka C, et al. Ready to serve: community-based provider capacity to deliver culturally competent, quality mental health care to veterans and their families. 2014. Accessed September 29, 2022. https://www.rand.org/content/dam/rand/pubs/research_reports/RR800/RR806/RAND_RR806.pdf
35. Kizer KW, Dudley RA. Extreme makeover: transformation of the Veterans Health Care System. Annu Rev Public Health. 2009;30(1):313-339. doi:10.1146/annurev.publhealth.29.020907.090940
36. Brennan KJ. Kendra’s Law: final report on the status of assisted outpatient treatment, appendix 2. 2002. Accessed September 29, 2022. https://omh.ny.gov/omhweb/kendra_web/finalreport/appendix2.htm