User login
ACC/AHA issues updated guidance on aortic disease
focusing on surgical intervention considerations, consistent imaging practices, genetic and familial screenings, and the importance of multidisciplinary care.
“There has been a host of new evidence-based research available for clinicians in the past decade when it comes to aortic disease. It was time to reevaluate and update the previous, existing guidelines,” Eric M. Isselbacher, MD, MSc, chair of the writing committee, said in a statement.
“We hope this new guideline can inform clinical practices with up-to-date and synthesized recommendations, targeted toward a full multidisciplinary aortic team working to provide the best possible care for this vulnerable patient population,” added Dr. Isselbacher, codirector of the Thoracic Aortic Center at Massachusetts General Hospital, Boston.
The 2022 ACC/AHA Guideline for the Diagnosis and Management of Aortic Disease was simultaneously published online in the Journal of the American College of Cardiology and Circulation.
The new guideline replaces the 2010 ACCF/AHA Guidelines for the Diagnosis and Management of Patients With Thoracic Aortic Disease and the 2015 Surgery for Aortic Dilation in Patients With Bicuspid Aortic Valves: A Statement of Clarification From the ACC/AHA Task Force on Clinical Practice Guidelines.
The new guideline is intended to be used with the 2020 ACC/AHA Guideline for the Management of Patients With Valvular Heart Disease.
It brings together guidelines for both the thoracic and abdominal aorta and is targeted to cardiovascular clinicians involved in the care of people with aortic disease, including general cardiovascular care clinicians and emergency medicine clinicians, the writing group says.
Among the key recommendations in the new guideline are the following:
- Screen first-degree relatives of individuals diagnosed with aneurysms of the aortic root or ascending thoracic aorta, or those with aortic dissection to identify individuals most at risk for aortic disease. Screening would include genetic testing and imaging.
- Be consistent in the way CT or MRI are obtained and reported; in the measurement of aortic size and features; and in how often images are used for monitoring before and after repair surgery or other intervention. Ideally, all surveillance imaging for an individual should be done using the same modality and in the same lab, the guideline notes.
- For individuals who require aortic intervention, know that outcomes are optimized when surgery is performed by an experienced surgeon working in a multidisciplinary aortic team. The new guideline recommends “a specialized hospital team with expertise in the evaluation and management of aortic disease, in which care is delivered in a comprehensive, multidisciplinary manner.”
- At centers with multidisciplinary aortic teams and experienced surgeons, the threshold for surgical intervention for sporadic aortic root and ascending aortic aneurysms has been lowered from 5.5 cm to 5.0 cm in select individuals, and even lower in specific scenarios among patients with heritable thoracic aortic aneurysms.
- In patients who are significantly smaller or taller than average, surgical thresholds may incorporate indexing of the aortic root or ascending aortic diameter to either patient body surface area or height, or aortic cross-sectional area to patient height.
- Rapid aortic growth is a risk factor for rupture and the definition for rapid aneurysm growth rate has been updated. Surgery is now recommended for patients with aneurysms of aortic root and ascending thoracic aorta with a confirmed growth rate of ≥ 0.3 cm per year across 2 consecutive years or ≥ 0.5 cm in 1 year.
- In patients undergoing aortic root replacement surgery, valve-sparing aortic root replacement is reasonable if the valve is suitable for repair and when performed by experienced surgeons in a multidisciplinary aortic team.
- Patients with acute type A aortic dissection, if clinically stable, should be considered for transfer to a high-volume aortic center to improve survival. The operative repair of type A aortic dissection should entail at least an open distal anastomosis rather than just a simple supracoronary interposition graft.
- For management of uncomplicated type B aortic dissection, there is an increasing role for . Clinical trials of repair of thoracoabdominal aortic aneurysms with endografts are reporting results that suggest endovascular repair is an option for patients with suitable anatomy.
- Shared decision-making between the patient and multidisciplinary aortic team is highly encouraged, especially when the patient is on the borderline of thresholds for repair or eligible for different types of surgical repair.
- Shared decision-making should also be used with individuals who are pregnant or may become pregnant to consider the risks of pregnancy in individuals with aortic disease.
The guideline was developed in collaboration with and endorsed by the American Association for Thoracic Surgery, the American College of Radiology, the Society of Cardiovascular Anesthesiologists, the Society for Cardiovascular Angiography and Interventions, the Society of Thoracic Surgeons, and the Society for Vascular Medicine.
It has been endorsed by the Society of Interventional Radiology and the Society for Vascular Surgery.
A version of this article first appeared on Medscape.com.
FROM CIRCULATION
Amulet, Watchman 2.5 LAAO outcomes neck and neck at 3 years
The Amplatzer Amulet (Abbott) and first-generation Watchman 2.5 (Boston Scientific) devices provide relatively comparable results out to 3 years after left atrial appendage occlusion (LAAO), longer follow-up from the Amplatzer Amulet Left Atrial Appendage Occluder Versus Watchman Device for Stroke Prophylaxis (Amulet IDE) trial shows.

“The dual-seal Amplatzer Amulet left atrial appendage occluder continued to demonstrate safety and effectiveness through 3 years,” principal investigator Dhanunjaya Lakkireddy, MD, said in a late-breaking session at the recent Transcatheter Cardiovascular Therapeutics annual meeting.
Preliminary results, reported last year, showed that procedural complications were higher with the Amplatzer but that it provided superior closure of the left atrial appendage (LAA) at 45 days and was noninferior with respect to safety at 12 months and efficacy at 18 months.
Amulet IDE is the largest head-to-head comparison of the two devices, enrolling 1,878 high-risk patients with nonvalvular atrial fibrillation undergoing LAA closure to reduce the risk of stroke.
Three-year follow-up was higher with the Amulet device than with the Watchman, at 721 vs. 659 patients, driven by increased deaths (85 vs. 63) and withdrawals (50 vs. 23) in the Watchman group within 18 months, noted Dr. Lakkireddy, Kansas City Heart Rhythm Institute and Research Foundation, Overland Park, Kan.
Use of oral anticoagulation was higher in the Watchman group at 6 months (2.8% vs. 4.7%; P = .04), 18 months (3.1% vs. 5.6%; P = .01), and 3 years (3.7% vs. 7.3%; P < .01).
This was primarily driven by more late device-related thrombus (DRT) after 6 months with the Watchman device than with the Amulet occluder (23 vs. 10). “Perhaps the dual-closure mechanism of the Amulet explains this fundamental difference, where you have a nice smooth disc that covers the ostium,” he posited.
At 3 years, rates of cardiovascular death trended lower with Amulet than with Watchman (6.6% vs. 8.5%; P = .14), as did all-cause deaths (14.6% vs. 17.9%; P = .07).
Most cardiovascular deaths in the Amulet group were not preceded by a device factor, whereas DRT (1 vs. 4) and peridevice leak 3 mm or more (5 vs. 15) frequently preceded these deaths in the Watchman group, Dr. Lakkireddy observed. No pericardial effusion-related deaths occurred in either group.
Major bleeding, however, trended higher for the Amulet, at 16.1%, compared with 14.7% for the Watchman (P = .46). Ischemic stroke and systemic embolic rates also trended higher for Amulet, at 5%, and 4.6% for Watchman.
The protocol recommended aspirin only for both groups after 6 months. None of the 29 Amulet and 3 of the 29 Watchman patients with an ischemic stroke were on oral anticoagulation at the time of the stroke.
Device factors, however, frequently preceded ischemic strokes in the Watchman group, Dr. Lakkireddy said. DRT occurred in 1 patient with Amulet and 2 patients with Watchman and peridevice leak in 3 with Amulet and 15 with Watchman. “Again, the peridevice leak issue really stands out as an important factor,” he said at the meeting, which was sponsored by the Cardiovascular Research Foundation.
Based on “data from the large trials, it’s clearly evident that the presence of peridevice leak significantly raises the risk of stroke in follow-up,” he said. “So, attention has to be paid to the choice of the device and how we can mitigate the risk of peridevice leaks in these patients.”
The composite of stroke, systemic embolism, and cardiovascular death occurred in 11.1% of patients with Amulet and 12.7% with Watchman (P = .31).
Asked following the formal presentation whether the results justify use of one device over the other for LAA occlusion, Dr. Lakkireddy said he likes the dual closure mechanism of the Amulet and is more likely to use it in patients with proximal lobes, very large appendages, or a relatively shallow appendage. “In the rest of the cases, I think it’s a toss-up.”
As for how generalizable the results are, he noted that the study tested the Amulet against the legacy Watchman 2.5 but that the second-generation Watchman FLX is available in a larger size and has shown improved performance.
The Amplatzer Amulet does not require oral anticoagulants at discharge. However, the indication for the Watchman FLX was recently expanded to include 45-day dual antiplatelet therapy as a postprocedure alternative to oral anticoagulation plus aspirin.
Going forward, the “next evolution” is to test the Watchman FLX and Amulet on either single antiplatelet or a dual antiplatelet regimen without oral anticoagulation, he suggested.
Results from SWISS APERO, the first randomized trial to compare the Amulet and Watchman FLX (and a handful of 2.5 devices) in 221 patients, showed that the devices are not interchangeable for rates of complications or leaks.
During a press conference prior to the presentation, discussant Federico Asch, MD, MedStar Health Research Institute, Washington, said, “the most exciting thing here is that we have good options. We now can start to tease out which patients will benefit best from one or the other because we actually have two options.”
The Amulet IDE trial was funded by Abbott. Dr. Lakkireddy reports that he or his spouse/partner have received grant/research support from Abbott, AtriCure, Alta Thera, Medtronic, Biosense Webster, Biotronik, and Boston Scientific; and speaker honoraria from Abbott, Medtronic, Biotronik, and Boston Scientific.
A version of this article first appeared on Medscape.com.
The Amplatzer Amulet (Abbott) and first-generation Watchman 2.5 (Boston Scientific) devices provide relatively comparable results out to 3 years after left atrial appendage occlusion (LAAO), longer follow-up from the Amplatzer Amulet Left Atrial Appendage Occluder Versus Watchman Device for Stroke Prophylaxis (Amulet IDE) trial shows.
“The dual-seal Amplatzer Amulet left atrial appendage occluder continued to demonstrate safety and effectiveness through 3 years,” principal investigator Dhanunjaya Lakkireddy, MD, said in a late-breaking session at the recent Transcatheter Cardiovascular Therapeutics annual meeting.
Preliminary results, reported last year, showed that procedural complications were higher with the Amplatzer but that it provided superior closure of the left atrial appendage (LAA) at 45 days and was noninferior with respect to safety at 12 months and efficacy at 18 months.
Amulet IDE is the largest head-to-head comparison of the two devices, enrolling 1,878 high-risk patients with nonvalvular atrial fibrillation undergoing LAA closure to reduce the risk of stroke.
Three-year follow-up was higher with the Amulet device than with the Watchman, at 721 vs. 659 patients, driven by increased deaths (85 vs. 63) and withdrawals (50 vs. 23) in the Watchman group within 18 months, noted Dr. Lakkireddy, Kansas City Heart Rhythm Institute and Research Foundation, Overland Park, Kan.
Use of oral anticoagulation was higher in the Watchman group at 6 months (2.8% vs. 4.7%; P = .04), 18 months (3.1% vs. 5.6%; P = .01), and 3 years (3.7% vs. 7.3%; P < .01).
This was primarily driven by more late device-related thrombus (DRT) after 6 months with the Watchman device than with the Amulet occluder (23 vs. 10). “Perhaps the dual-closure mechanism of the Amulet explains this fundamental difference, where you have a nice smooth disc that covers the ostium,” he posited.
At 3 years, rates of cardiovascular death trended lower with Amulet than with Watchman (6.6% vs. 8.5%; P = .14), as did all-cause deaths (14.6% vs. 17.9%; P = .07).
Most cardiovascular deaths in the Amulet group were not preceded by a device factor, whereas DRT (1 vs. 4) and peridevice leak 3 mm or more (5 vs. 15) frequently preceded these deaths in the Watchman group, Dr. Lakkireddy observed. No pericardial effusion-related deaths occurred in either group.
Major bleeding, however, trended higher for the Amulet, at 16.1%, compared with 14.7% for the Watchman (P = .46). Ischemic stroke and systemic embolic rates also trended higher for Amulet, at 5%, and 4.6% for Watchman.
The protocol recommended aspirin only for both groups after 6 months. None of the 29 Amulet and 3 of the 29 Watchman patients with an ischemic stroke were on oral anticoagulation at the time of the stroke.
Device factors, however, frequently preceded ischemic strokes in the Watchman group, Dr. Lakkireddy said. DRT occurred in 1 patient with Amulet and 2 patients with Watchman and peridevice leak in 3 with Amulet and 15 with Watchman. “Again, the peridevice leak issue really stands out as an important factor,” he said at the meeting, which was sponsored by the Cardiovascular Research Foundation.
Based on “data from the large trials, it’s clearly evident that the presence of peridevice leak significantly raises the risk of stroke in follow-up,” he said. “So, attention has to be paid to the choice of the device and how we can mitigate the risk of peridevice leaks in these patients.”
The composite of stroke, systemic embolism, and cardiovascular death occurred in 11.1% of patients with Amulet and 12.7% with Watchman (P = .31).
Asked following the formal presentation whether the results justify use of one device over the other for LAA occlusion, Dr. Lakkireddy said he likes the dual closure mechanism of the Amulet and is more likely to use it in patients with proximal lobes, very large appendages, or a relatively shallow appendage. “In the rest of the cases, I think it’s a toss-up.”
As for how generalizable the results are, he noted that the study tested the Amulet against the legacy Watchman 2.5 but that the second-generation Watchman FLX is available in a larger size and has shown improved performance.
The Amplatzer Amulet does not require oral anticoagulants at discharge. However, the indication for the Watchman FLX was recently expanded to include 45-day dual antiplatelet therapy as a postprocedure alternative to oral anticoagulation plus aspirin.
Going forward, the “next evolution” is to test the Watchman FLX and Amulet on either single antiplatelet or a dual antiplatelet regimen without oral anticoagulation, he suggested.
Results from SWISS APERO, the first randomized trial to compare the Amulet and Watchman FLX (and a handful of 2.5 devices) in 221 patients, showed that the devices are not interchangeable for rates of complications or leaks.
During a press conference prior to the presentation, discussant Federico Asch, MD, MedStar Health Research Institute, Washington, said, “the most exciting thing here is that we have good options. We now can start to tease out which patients will benefit best from one or the other because we actually have two options.”
The Amulet IDE trial was funded by Abbott. Dr. Lakkireddy reports that he or his spouse/partner have received grant/research support from Abbott, AtriCure, Alta Thera, Medtronic, Biosense Webster, Biotronik, and Boston Scientific; and speaker honoraria from Abbott, Medtronic, Biotronik, and Boston Scientific.
A version of this article first appeared on Medscape.com.
FROM TCT 2022
Diabetes Population Health Innovations in the Age of COVID-19: Insights From the T1D Exchange Quality Improvement Collaborative
From the T1D Exchange, Boston, MA (Ann Mungmode, Nicole Rioles, Jesse Cases, Dr. Ebekozien); The Leona M. and Harry B. Hemsley Charitable Trust, New York, NY (Laurel Koester); and the University of Mississippi School of Population Health, Jackson, MS (Dr. Ebekozien).
Abstract
There have been remarkable innovations in diabetes management since the start of the COVID-19 pandemic, but these groundbreaking innovations are drawing limited focus as the field focuses on the adverse impact of the pandemic on patients with diabetes. This article reviews select population health innovations in diabetes management that have become available over the past 2 years of the COVID-19 pandemic from the perspective of the T1D Exchange Quality Improvement Collaborative, a learning health network that focuses on improving care and outcomes for individuals with type 1 diabetes (T1D). Such innovations include expanded telemedicine access, collection of real-world data, machine learning and artificial intelligence, and new diabetes medications and devices. In addition, multiple innovative studies have been undertaken to explore contributors to health inequities in diabetes, and advocacy efforts for specific populations have been successful. Looking to the future, work is required to explore additional health equity successes that do not further exacerbate inequities and to look for additional innovative ways to engage people with T1D in their health care through conversations on social determinants of health and societal structures.
Keywords: type 1 diabetes, learning health network, continuous glucose monitoring, health equity
One in 10 people in the United States has diabetes.1 Diabetes is the nation’s second leading cause of death, costing the US health system more than $300 billion annually.2 The COVID-19 pandemic presented additional health burdens for people living with diabetes. For example, preexisting diabetes was identified as a risk factor for COVID-19–associated morbidity and mortality.3,4 Over the past 2 years, there have been remarkable innovations in diabetes management, including stem cell therapy and new medication options. Additionally, improved technology solutions have aided in diabetes management through continuous glucose monitors (CGM), smart insulin pens, advanced hybrid closed-loop systems, and continuous subcutaneous insulin injections.5,6 Unfortunately, these groundbreaking innovations are drawing limited focus, as the field is rightfully focused on the adverse impact of the pandemic on patients with diabetes.

Learning health networks like the T1D Exchange Quality Improvement Collaborative (T1DX-QI) have implemented some of these innovative solutions to improve care for people with diabetes.7 T1DX-QI has more than 50 data-sharing endocrinology centers that care for over 75,000 people with diabetes across the United States (Figure 1). Centers participating in the T1DX-QI use quality improvement (QI) and implementation science methods to quickly translate research into evidence-based clinical practice. T1DX-QI leads diabetes population health and health system research and supports widespread transferability across health care organizations through regular collaborative calls, conferences, and case study documentation.8

In this review, we summarize impactful population health innovations in diabetes management that have become available over the past 2 years of the COVID-19 pandemic from the perspective of T1DX-QI (see Figure 2 for relevant definitions). This review is limited in scope and is not meant to be an exhaustive list of innovations. The review also reflects significant changes from the perspective of academic diabetes centers, which may not apply to rural or primary care diabetes practices.
Methods
The first (A.M.), second (H.H.), and senior (O.E.) authors conducted a scoping review of published literature using terms related to diabetes, population health, and innovation on PubMed Central and Google Scholar for the period March 2020 to June 2022. To complement the review, A.M. and O.E. also reviewed abstracts from presentations at major international diabetes conferences, including the American Diabetes Association (ADA), the International Society for Pediatric and Adolescent Diabetes (ISPAD), the T1DX-QI Learning Session Conference, and the Advanced Technologies & Treatments for Diabetes (ATTD) 2020 to 2022 conferences.9-14 The authors also searched FDA.gov and ClinicalTrials.gov for relevant insights. A.M. and O.E. sorted the reviewed literature into major themes (Figure 3) from the population health improvement perspective of the T1DX-QI.

Population Health Innovations in Diabetes Management
Expansion of Telemedicine Access
Telemedicine is cost-effective for patients with diabetes,15 including those with complex cases.16 Before the COVID-19 pandemic, telemedicine and virtual care were rare in diabetes management. However, the pandemic offered a new opportunity to expand the practice of telemedicine in diabetes management. A study from the T1DX-QI showed that telemedicine visits grew from comprising <1% of visits pre-pandemic (December 2019) to 95.2% during the pandemic (August 2020).17 Additional studies, like those conducted by Phillip et al,18 confirmed the noninferiority of telemedicine practice for patients with diabetes.Telemedicine was also found to be an effective strategy to educate patients on the use of diabetes technologies.19
Real-World Data and Disease Surveillance
As the COVID-19 pandemic exacerbated outcomes for people with type 1 diabetes (T1D), a need arose to understand the immediate effects of the pandemic on people with T1D through real-world data and disease surveillance. In April 2020, the T1DX-QI initiated a multicenter surveillance study to collect data and analyze the impact of COVID-19 on people with T1D. The existing health collaborative served as a springboard for robust surveillance study, documenting numerous works on the effects of COVID-19.3,4,20-28 Other investigators also embraced the power of real-world surveillance and real-world data.29,30
Big Data, Machine Learning, and Artificial Intelligence
The past 2 years have seen a shift toward embracing the incredible opportunity to tap the large volume of data generated from routine care for practical insights.31 In particular, researchers have demonstrated the widespread application of machine learning and artificial intelligence to improve diabetes management.32 The T1DX-QI also harnessed the growing power of big data by expanding the functionality of innovative benchmarking software. The T1DX QI Portal uses electronic medical record data of diabetes patients for clinic-to-clinic benchmarking and data analysis, using business intelligence solutions.33
Health Equity
While inequities across various health outcomes have been well documented for years,34 the COVID-19 pandemic further exaggerated racial/ethnic health inequities in T1D.23,35 In response, several organizations have outlined specific strategies to address these health inequities. Emboldened by the pandemic, the T1DX-QI announced a multipronged approach to address health inequities among patients with T1D through the Health Equity Advancement Lab (HEAL).36 One of HEAL’s main components is using real-world data to champion population-level insights and demonstrate progress in QI efforts.
Multiple innovative studies have been undertaken to explore contributors to health inequities in diabetes, and these studies are expanding our understanding of the chasm.37 There have also been innovative solutions to addressing these inequities, with multiple studies published over the past 2 years.38 A source of inequity among patients with T1D is the lack of representation of racial/ethnic minorities with T1D in clinical trials.39 The T1DX-QI suggests that the equity-adapted framework for QI can be applied by research leaders to support trial diversity and representation, ensuring future device innovations are meaningful for all people with T1D.40
Diabetes Devices
Glucose monitoring and insulin therapy are vital tools to support individuals living with T1D, and devices such as CGM and insulin pumps have become the standard of care for diabetes management (Table).41 Innovations in diabetes technology and device access are imperative for a chronic disease with no cure.

The COVID-19 pandemic created an opportunity to increase access to diabetes devices in inpatient settings. In 2020, the US Food and Drug Administration expanded the use of CGM to support remote monitoring of patients in inpatient hospital settings, simultaneously supporting the glucose monitoring needs of patients with T1D and reducing COVID-19 transmission through reduced patient-clinician contact.42 This effort has been expanded and will continue in 2022 and beyond,43 and aligns with the growing consensus that supports patients wearing both CGMs and insulin pumps in ambulatory settings to improve patient health outcomes.44
Since 2020, innovations in diabetes technology have improved and increased the variety of options available to people with T1D and made them easier to use (Table). New, advanced hybrid closed-loop systems have progressed to offer Bluetooth features, including automatic software upgrades, tubeless systems, and the ability to allow parents to use their smartphones to bolus for children.45-47 The next big step in insulin delivery innovation is the release of functioning, fully closed loop systems, of which several are currently in clinical trials.48 These systems support reduced hypoglycemia and improved time in range.49
Additional innovations in insulin delivery have improved the user experience and expanded therapeutic options, including a variety of smart insulin pens complete with dosing logs50,51 and even a patch to deliver insulin without the burden of injections.52 As barriers to diabetes technology persist,53 innovations in alternate insulin delivery provide people with T1D more options to align with their personal access and technology preferences.
Innovations in CGM address cited barriers to their use, including size or overall wear.53-55 CGMs released in the past few years are smaller in physical size, have longer durations of time between changings, are more accurate, and do not require calibrations for accuracy.
New Diabetes Medications
Many new medications and therapeutic advances have become available in the past 2 years.56 Additionally, more medications are being tested as adjunct therapies to support glycemic management in patients with T1D, including metformin, sodium-glucose cotransporter 1 and 2 inhibitors, pramlintide, glucagon-like polypeptide-1 analogs, and glucagon receptor agonists.57 Other recent advances include stem cell replacement therapy for patients with T1D.58 The ultra-long-acting biosimilar insulins are one medical innovation that has been stalled, rather than propelled, during the COVID-19 pandemic.59
Diabetes Policy Advocacy
People with T1D require insulin to survive. The cost of insulin has increased in recent years, with some studies citing a 64% to 100% increase in the past decade.60,61 In fact, 1 in 4 insulin users report that cost has impacted their insulin use, including rationing their insulin.62 Lockdowns during the COVID-19 pandemic stressed US families financially, increasing the urgency for insulin cost caps.
Although the COVID-19 pandemic halted national conversations on drug financing,63 advocacy efforts have succeeded for specific populations. The new Medicare Part D Senior Savings Model will cap the cost of insulin at $35 for a 30-day supply,64 and 20 states passed legislation capping insulin pricing.62 Efforts to codify national cost caps are under debate, including the passage of the Affordable Insulin Now Act, which passed the House in March 2022 and is currently under review in the Senate.65
Perspective: The Role of Private Philanthropy in Supporting Population Health Innovations
Funders and industry partners play a crucial role in leading and supporting innovations that improve the lives of people with T1D and reduce society’s costs of living with the disease. Data infrastructure is critical to supporting population health. While building the data infrastructure to support population health is both time- and resource-intensive, private foundations such as Helmsley are uniquely positioned—and have a responsibility—to take large, informed risks to help reach all communities with T1D.
The T1DX-QI is the largest source of population health data on T1D in the United States and is becoming the premiere data authority on its incidence, prevalence, and outcomes. The T1DX-QI enables a robust understanding of T1D-related health trends at the population level, as well as trends among clinics and providers. Pilot centers in the T1DX-QI have reported reductions in patients’ A1c and acute diabetes-related events, as well as improvements in device usage and depression screening. The ability to capture changes speaks to the promise and power of these data to demonstrate the clinical impact of QI interventions and to support the spread of best practices and learnings across health systems.
Additional philanthropic efforts have supported innovation in the last 2 years. For example, the JDRF, a nonprofit philanthropic equity firm, has supported efforts in developing artificial pancreas systems and cell therapies currently in clinical trials like teplizumab, a drug that has demonstrated delayed onset of T1D through JDRF’s T1D Fund.66 Industry partners also have an opportunity for significant influence in this area, as they continue to fund meaningful projects to advance care for people with T1D.67
Conclusion
We are optimistic that the innovations summarized here describe a shift in the tide of equitable T1D outcomes; however, future work is required to explore additional health equity successes that do not further exacerbate inequities. We also see further opportunities for innovative ways to engage people with T1D in their health care through conversations on social determinants of health and societal structures.
Corresponding author: Ann Mungmode, MPH, T1D Exchange, 11 Avenue de Lafayette, Boston, MA 02111; Email: amungmode@t1dexchange.org
Disclosures: Dr. Ebekozien serve(d) as a director, officer, partner, employee, advisor, consultant, or trustee for the Medtronic Advisory Board and received research grants from Medtronic Diabetes, Eli Lilly, and Dexcom.
Funding: The T1DX-QI is funded by The Leona M. and Harry B. Hemsley Charitable Trust.
1. Centers for Disease Control and Prevention. National diabetes statistics report. Accessed August 30, 2022. www.cdc.gov/diabetes/data/statistics-report/index.html
2. Centers for Disease Control and Prevention. Diabetes fast facts. Accessed August 30, 2022. www.cdc.gov/diabetes/basics/quick-facts.html
3. O’Malley G, Ebekozien O, Desimone M, et al. COVID-19 hospitalization in adults with type 1 diabetes: results from the T1D Exchange Multicenter Surveillance Study. J Clin Endocrinol Metab. 2020;106(2):e936-e942. doi:10.1210/clinem/dgaa825
4. Ebekozien OA, Noor N, Gallagher MP, Alonso GT. Type 1 diabetes and COVID-19: preliminary findings from a multicenter surveillance study in the U.S. Diabetes Care. 2020;43(8):e83-e85. doi:10.2337/dc20-1088
5. Zimmerman C, Albanese-O’Neill A, Haller MJ. Advances in type 1 diabetes technology over the last decade. Eur Endocrinol. 2019;15(2):70-76. doi:10.17925/ee.2019.15.2.70
6. Wake DJ, Gibb FW, Kar P, et al. Endocrinology in the time of COVID-19: remodelling diabetes services and emerging innovation. Eur J Endocrinol. 2020;183(2):G67-G77. doi:10.1530/eje-20-0377
7. Alonso GT, Corathers S, Shah A, et al. Establishment of the T1D Exchange Quality Improvement Collaborative (T1DX-QI). Clin Diabetes. 2020;38(2):141-151. doi:10.2337/cd19-0032
8. Ginnard OZB, Alonso GT, Corathers SD, et al. Quality improvement in diabetes care: a review of initiatives and outcomes in the T1D Exchange Quality Improvement Collaborative. Clin Diabetes. 2021;39(3):256-263. doi:10.2337/cd21-0029
9. ATTD 2021 invited speaker abstracts. Diabetes Technol Ther. 2021;23(S2):A1-A206. doi:10.1089/dia.2021.2525.abstracts
10. Rompicherla SN, Edelen N, Gallagher R, et al. Children and adolescent patients with pre-existing type 1 diabetes and additional comorbidities have an increased risk of hospitalization from COVID-19; data from the T1D Exchange COVID Registry. Pediatr Diabetes. 2021;22(S30):3-32. doi:10.1111/pedi.13268
11. Abstracts for the T1D Exchange QI Collaborative (T1DX-QI) Learning Session 2021. November 8-9, 2021. J Diabetes. 2021;13(S1):3-17. doi:10.1111/1753-0407.13227
12. The Official Journal of ATTD Advanced Technologies & Treatments for Diabetes conference 27-30 April 2022. Barcelona and online. Diabetes Technol Ther. 2022;24(S1):A1-A237. doi:10.1089/dia.2022.2525.abstracts
13. Ebekozien ON, Kamboj N, Odugbesan MK, et al. Inequities in glycemic outcomes for patients with type 1 diabetes: six-year (2016-2021) longitudinal follow-up by race and ethnicity of 36,390 patients in the T1DX-QI Collaborative. Diabetes. 2022;71(suppl 1). doi:10.2337/db22-167-OR
14. Narayan KA, Noor M, Rompicherla N, et al. No BMI increase during the COVID-pandemic in children and adults with T1D in three continents: joint analysis of ADDN, T1DX, and DPV registries. Diabetes. 2022;71(suppl 1). doi:10.2337/db22-269-OR
15. Lee JY, Lee SWH. Telemedicine cost-effectiveness for diabetes management: a systematic review. Diabetes Technol Ther. 2018;20(7):492-500. doi:10.1089/dia.2018.0098
16. McDonnell ME. Telemedicine in complex diabetes management. Curr Diab Rep. 2018;18(7):42. doi:10.1007/s11892-018-1015-3
17. Lee JM, Carlson E, Albanese-O’Neill A, et al. Adoption of telemedicine for type 1 diabetes care during the COVID-19 pandemic. Diabetes Technol Ther. 2021;23(9):642-651. doi:10.1089/dia.2021.0080
18. Phillip M, Bergenstal RM, Close KL, et al. The digital/virtual diabetes clinic: the future is now–recommendations from an international panel on diabetes digital technologies introduction. Diabetes Technol Ther. 2021;23(2):146-154. doi:10.1089/dia.2020.0375
19. Garg SK, Rodriguez E. COVID‐19 pandemic and diabetes care. Diabetes Technol Ther. 2022;24(S1):S2-S20. doi:10.1089/dia.2022.2501
20. Beliard K, Ebekozien O, Demeterco-Berggren C, et al. Increased DKA at presentation among newly diagnosed type 1 diabetes patients with or without COVID-19: data from a multi-site surveillance registry. J Diabetes. 2021;13(3):270-272. doi:10.1111/1753-0407.13141
21. Ebekozien O, Agarwal S, Noor N, et al. Inequities in diabetic ketoacidosis among patients with type 1 diabetes and COVID-19: data from 52 US clinical centers. J Clin Endocrinol Metab. 2020;106(4):1755-1762. doi:10.1210/clinem/dgaa920
22. Alonso GT, Ebekozien O, Gallagher MP, et al. Diabetic ketoacidosis drives COVID-19 related hospitalizations in children with type 1 diabetes. J Diabetes. 2021;13(8):681-687. doi:10.1111/1753-0407.13184
23. Noor N, Ebekozien O, Levin L, et al. Diabetes technology use for management of type 1 diabetes is associated with fewer adverse COVID-19 outcomes: findings from the T1D Exchange COVID-19 Surveillance Registry. Diabetes Care. 2021;44(8):e160-e162. doi:10.2337/dc21-0074
24. Demeterco-Berggren C, Ebekozien O, Rompicherla S, et al. Age and hospitalization risk in people with type 1 diabetes and COVID-19: data from the T1D Exchange Surveillance Study. J Clin Endocrinol Metab. 2021;107(2):410-418. doi:10.1210/clinem/dgab668
25. DeSalvo DJ, Noor N, Xie C, et al. Patient demographics and clinical outcomes among type 1 diabetes patients using continuous glucose monitors: data from T1D Exchange real-world observational study. J Diabetes Sci Technol. 2021 Oct 9. [Epub ahead of print] doi:10.1177/19322968211049783
26. Gallagher MP, Rompicherla S, Ebekozien O, et al. Differences in COVID-19 outcomes among patients with type 1 diabetes: first vs later surges. J Clin Outcomes Manage. 2022;29(1):27-31. doi:10.12788/jcom.0084
27. Wolf RM, Noor N, Izquierdo R, et al. Increase in newly diagnosed type 1 diabetes in youth during the COVID-19 pandemic in the United States: a multi-center analysis. Pediatr Diabetes. 2022;23(4):433-438. doi:10.1111/pedi.13328
28. Lavik AR, Ebekozien O, Noor N, et al. Trends in type 1 diabetic ketoacidosis during COVID-19 surges at 7 US centers: highest burden on non-Hispanic Black patients. J Clin Endocrinol Metab. 2022;107(7):1948-1955. doi:10.1210/clinem/dgac158
29. van der Linden J, Welsh JB, Hirsch IB, Garg SK. Real-time continuous glucose monitoring during the coronavirus disease 2019 pandemic and its impact on time in range. Diabetes Technol Ther. 2021;23(S1):S1-S7. doi:10.1089/dia.2020.0649
30. Nwosu BU, Al-Halbouni L, Parajuli S, et al. COVID-19 pandemic and pediatric type 1 diabetes: no significant change in glycemic control during the pandemic lockdown of 2020. Front Endocrinol (Lausanne). 2021;12:703905. doi:10.3389/fendo.2021.703905
31. Ellahham S. Artificial intelligence: the future for diabetes care. Am J Med. 2020;133(8):895-900. doi:10.1016/j.amjmed.2020.03.033
32. Nomura A, Noguchi M, Kometani M, et al. Artificial intelligence in current diabetes management and prediction. Curr Diab Rep. 2021;21(12):61. doi:10.1007/s11892-021-01423-2
33. Mungmode A, Noor N, Weinstock RS, et al. Making diabetes electronic medical record data actionable: promoting benchmarking and population health using the T1D Exchange Quality Improvement Portal. Clin Diabetes. Forthcoming 2022.
34. Lavizzo-Mourey RJ, Besser RE, Williams DR. Understanding and mitigating health inequities—past, current, and future directions. N Engl J Med. 2021;384(18):1681-1684. doi:10.1056/NEJMp2008628
35. Majidi S, Ebekozien O, Noor N, et al. Inequities in health outcomes in children and adults with type 1 diabetes: data from the T1D Exchange Quality Improvement Collaborative. Clin Diabetes. 2021;39(3):278-283. doi:10.2337/cd21-0028
36. Ebekozien O, Mungmode A, Odugbesan O, et al. Addressing type 1 diabetes health inequities in the United States: approaches from the T1D Exchange QI Collaborative. J Diabetes. 2022;14(1):79-82. doi:10.1111/1753-0407.13235
37. Odugbesan O, Addala A, Nelson G, et al. Implicit racial-ethnic and insurance-mediated bias to recommending diabetes technology: insights from T1D Exchange multicenter pediatric and adult diabetes provider cohort. Diabetes Technol Ther. 2022 Jun 13. [Epub ahead of print] doi:10.1089/dia.2022.0042
38. Schmitt J, Fogle K, Scott ML, Iyer P. Improving equitable access to continuous glucose monitors for Alabama’s children with type 1 diabetes: a quality improvement project. Diabetes Technol Ther. 2022;24(7):481-491. doi:10.1089/dia.2021.0511
39. Akturk HK, Agarwal S, Hoffecker L, Shah VN. Inequity in racial-ethnic representation in randomized controlled trials of diabetes technologies in type 1 diabetes: critical need for new standards. Diabetes Care. 2021;44(6):e121-e123. doi:10.2337/dc20-3063
40. Ebekozien O, Mungmode A, Buckingham D, et al. Achieving equity in diabetes research: borrowing from the field of quality improvement using a practical framework and improvement tools. Diabetes Spectr. 2022;35(3):304-312. doi:10.2237/dsi22-0002
41. Zhang J, Xu J, Lim J, et al. Wearable glucose monitoring and implantable drug delivery systems for diabetes management. Adv Healthc Mater. 2021;10(17):e2100194. doi:10.1002/adhm.202100194
42. FDA expands remote patient monitoring in hospitals for people with diabetes during COVID-19; manufacturers donate CGM supplies. News release. April 21, 2020. Accessed August 30, 2022. https://www.diabetes.org/newsroom/press-releases/2020/fda-remote-patient-monitoring-cgm
43. Campbell P. FDA grants Dexcom CGM breakthrough designation for in-hospital use. March 2, 2022. Accessed August 30, 2022. https://www.endocrinologynetwork.com/view/fda-grants-dexcom-cgm-breakthrough-designation-for-in-hospital-use
44. Yeh T, Yeung M, Mendelsohn Curanaj FA. Managing patients with insulin pumps and continuous glucose monitors in the hospital: to wear or not to wear. Curr Diab Rep. 2021;21(2):7. doi:10.1007/s11892-021-01375-7
45. Medtronic announces FDA approval for MiniMed 770G insulin pump system. News release. September 21, 2020. Accessed August 30, 2022. https://bit.ly/3TyEna4
46. Tandem Diabetes Care announces commercial launch of the t:slim X2 insulin pump with Control-IQ technology in the United States. News release. January 15, 2020. Accessed August 30, 2022. https://investor.tandemdiabetes.com/news-releases/news-release-details/tandem-diabetes-care-announces-commercial-launch-tslim-x2-0
47. Garza M, Gutow H, Mahoney K. Omnipod 5 cleared by the FDA. Updated August 22, 2022. Accessed August 30, 2022.https://diatribe.org/omnipod-5-approved-fda
48. Boughton CK. Fully closed-loop insulin delivery—are we nearly there yet? Lancet Digit Health. 2021;3(11):e689-e690. doi:10.1016/s2589-7500(21)00218-1
49. Noor N, Kamboj MK, Triolo T, et al. Hybrid closed-loop systems and glycemic outcomes in children and adults with type 1 diabetes: real-world evidence from a U.S.-based multicenter collaborative. Diabetes Care. 2022;45(8):e118-e119. doi:10.2337/dc22-0329
50. Medtronic launches InPen with real-time Guardian Connect CGM data--the first integrated smart insulin pen for people with diabetes on MDI. News release. November 12, 2020. Accessed August 30, 2022. https://bit.ly/3CTSWPL
51. Bigfoot Biomedical receives FDA clearance for Bigfoot Unity Diabetes Management System, featuring first-of-its-kind smart pen caps for insulin pens used to treat type 1 and type 2 diabetes. News release. May 10, 2021. Accessed August 30, 2022. https://bit.ly/3BeyoAh
52. Vieira G. All about the CeQur Simplicity insulin patch. Updated May 24, 2022. Accessed August 30, 2022. https://beyondtype1.org/cequr-simplicity-insulin-patch/.
53. Messer LH, Tanenbaum ML, Cook PF, et al. Cost, hassle, and on-body experience: barriers to diabetes device use in adolescents and potential intervention targets. Diabetes Technol Ther. 2020;22(10):760-767. doi:10.1089/dia.2019.0509
54. Hilliard ME, Levy W, Anderson BJ, et al. Benefits and barriers of continuous glucose monitoring in young children with type 1 diabetes. Diabetes Technol Ther. 2019;21(9):493-498. doi:10.1089/dia.2019.0142
55. Dexcom G7 Release Delayed Until Late 2022. News release. August 8, 2022. Accessed September 7, 2022. https://diatribe.org/dexcom-g7-release-delayed-until-late-2022
56. Drucker DJ. Transforming type 1 diabetes: the next wave of innovation. Diabetologia. 2021;64(5):1059-1065. doi:10.1007/s00125-021-05396-5
57. Garg SK, Rodriguez E, Shah VN, Hirsch IB. New medications for the treatment of diabetes. Diabetes Technol Ther. 2022;24(S1):S190-S208. doi:10.1089/dia.2022.2513
58. Melton D. The promise of stem cell-derived islet replacement therapy. Diabetologia. 2021;64(5):1030-1036. doi:10.1007/s00125-020-05367-2
59. Danne T, Heinemann L, Bolinder J. New insulins, biosimilars, and insulin therapy. Diabetes Technol Ther. 2022;24(S1):S35-S57. doi:10.1089/dia.2022.2503
60. Kenney J. Insulin copay caps–a path to affordability. July 6, 2021. Accessed August 30, 2022.https://diatribechange.org/news/insulin-copay-caps-path-affordability
61. Glied SA, Zhu B. Not so sweet: insulin affordability over time. September 25, 2020. Accessed August 30, 2022. https://www.commonwealthfund.org/publications/issue-briefs/2020/sep/not-so-sweet-insulin-affordability-over-time
62. American Diabetes Association. Insulin and drug affordability. Accessed August 30, 2022. https://www.diabetes.org/advocacy/insulin-and-drug-affordability
63. Sullivan P. Chances for drug pricing, surprise billing action fade until November. March 24, 2020. Accessed August 30, 2022. https://thehill.com/policy/healthcare/489334-chances-for-drug-pricing-surprise-billing-action-fade-until-november/
64. Brown TD. How Medicare’s new Senior Savings Model makes insulin more affordable. June 4, 2020. Accessed August 30, 2022. https://www.diabetes.org/blog/how-medicares-new-senior-savings-model-makes-insulin-more-affordable
65. American Diabetes Association. ADA applauds the U.S. House of Representatives passage of the Affordable Insulin Now Act. News release. April 1, 2022. https://www.diabetes.org/newsroom/official-statement/2022/ada-applauds-us-house-of-representatives-passage-of-the-affordable-insulin-now-act
66. JDRF. Driving T1D cures during challenging times. 2022.
67. Medtronic announces ongoing initiatives to address health equity for people of color living with diabetes. News release. April 7, 2021. Access August 30, 2022. https://bit.ly/3KGTOZU
From the T1D Exchange, Boston, MA (Ann Mungmode, Nicole Rioles, Jesse Cases, Dr. Ebekozien); The Leona M. and Harry B. Hemsley Charitable Trust, New York, NY (Laurel Koester); and the University of Mississippi School of Population Health, Jackson, MS (Dr. Ebekozien).
Abstract
There have been remarkable innovations in diabetes management since the start of the COVID-19 pandemic, but these groundbreaking innovations are drawing limited focus as the field focuses on the adverse impact of the pandemic on patients with diabetes. This article reviews select population health innovations in diabetes management that have become available over the past 2 years of the COVID-19 pandemic from the perspective of the T1D Exchange Quality Improvement Collaborative, a learning health network that focuses on improving care and outcomes for individuals with type 1 diabetes (T1D). Such innovations include expanded telemedicine access, collection of real-world data, machine learning and artificial intelligence, and new diabetes medications and devices. In addition, multiple innovative studies have been undertaken to explore contributors to health inequities in diabetes, and advocacy efforts for specific populations have been successful. Looking to the future, work is required to explore additional health equity successes that do not further exacerbate inequities and to look for additional innovative ways to engage people with T1D in their health care through conversations on social determinants of health and societal structures.
Keywords: type 1 diabetes, learning health network, continuous glucose monitoring, health equity
One in 10 people in the United States has diabetes.1 Diabetes is the nation’s second leading cause of death, costing the US health system more than $300 billion annually.2 The COVID-19 pandemic presented additional health burdens for people living with diabetes. For example, preexisting diabetes was identified as a risk factor for COVID-19–associated morbidity and mortality.3,4 Over the past 2 years, there have been remarkable innovations in diabetes management, including stem cell therapy and new medication options. Additionally, improved technology solutions have aided in diabetes management through continuous glucose monitors (CGM), smart insulin pens, advanced hybrid closed-loop systems, and continuous subcutaneous insulin injections.5,6 Unfortunately, these groundbreaking innovations are drawing limited focus, as the field is rightfully focused on the adverse impact of the pandemic on patients with diabetes.
Learning health networks like the T1D Exchange Quality Improvement Collaborative (T1DX-QI) have implemented some of these innovative solutions to improve care for people with diabetes.7 T1DX-QI has more than 50 data-sharing endocrinology centers that care for over 75,000 people with diabetes across the United States (Figure 1). Centers participating in the T1DX-QI use quality improvement (QI) and implementation science methods to quickly translate research into evidence-based clinical practice. T1DX-QI leads diabetes population health and health system research and supports widespread transferability across health care organizations through regular collaborative calls, conferences, and case study documentation.8
In this review, we summarize impactful population health innovations in diabetes management that have become available over the past 2 years of the COVID-19 pandemic from the perspective of T1DX-QI (see Figure 2 for relevant definitions). This review is limited in scope and is not meant to be an exhaustive list of innovations. The review also reflects significant changes from the perspective of academic diabetes centers, which may not apply to rural or primary care diabetes practices.
Methods
The first (A.M.), second (H.H.), and senior (O.E.) authors conducted a scoping review of published literature using terms related to diabetes, population health, and innovation on PubMed Central and Google Scholar for the period March 2020 to June 2022. To complement the review, A.M. and O.E. also reviewed abstracts from presentations at major international diabetes conferences, including the American Diabetes Association (ADA), the International Society for Pediatric and Adolescent Diabetes (ISPAD), the T1DX-QI Learning Session Conference, and the Advanced Technologies & Treatments for Diabetes (ATTD) 2020 to 2022 conferences.9-14 The authors also searched FDA.gov and ClinicalTrials.gov for relevant insights. A.M. and O.E. sorted the reviewed literature into major themes (Figure 3) from the population health improvement perspective of the T1DX-QI.
Population Health Innovations in Diabetes Management
Expansion of Telemedicine Access
Telemedicine is cost-effective for patients with diabetes,15 including those with complex cases.16 Before the COVID-19 pandemic, telemedicine and virtual care were rare in diabetes management. However, the pandemic offered a new opportunity to expand the practice of telemedicine in diabetes management. A study from the T1DX-QI showed that telemedicine visits grew from comprising <1% of visits pre-pandemic (December 2019) to 95.2% during the pandemic (August 2020).17 Additional studies, like those conducted by Phillip et al,18 confirmed the noninferiority of telemedicine practice for patients with diabetes.Telemedicine was also found to be an effective strategy to educate patients on the use of diabetes technologies.19
Real-World Data and Disease Surveillance
As the COVID-19 pandemic exacerbated outcomes for people with type 1 diabetes (T1D), a need arose to understand the immediate effects of the pandemic on people with T1D through real-world data and disease surveillance. In April 2020, the T1DX-QI initiated a multicenter surveillance study to collect data and analyze the impact of COVID-19 on people with T1D. The existing health collaborative served as a springboard for robust surveillance study, documenting numerous works on the effects of COVID-19.3,4,20-28 Other investigators also embraced the power of real-world surveillance and real-world data.29,30
Big Data, Machine Learning, and Artificial Intelligence
The past 2 years have seen a shift toward embracing the incredible opportunity to tap the large volume of data generated from routine care for practical insights.31 In particular, researchers have demonstrated the widespread application of machine learning and artificial intelligence to improve diabetes management.32 The T1DX-QI also harnessed the growing power of big data by expanding the functionality of innovative benchmarking software. The T1DX QI Portal uses electronic medical record data of diabetes patients for clinic-to-clinic benchmarking and data analysis, using business intelligence solutions.33
Health Equity
While inequities across various health outcomes have been well documented for years,34 the COVID-19 pandemic further exaggerated racial/ethnic health inequities in T1D.23,35 In response, several organizations have outlined specific strategies to address these health inequities. Emboldened by the pandemic, the T1DX-QI announced a multipronged approach to address health inequities among patients with T1D through the Health Equity Advancement Lab (HEAL).36 One of HEAL’s main components is using real-world data to champion population-level insights and demonstrate progress in QI efforts.
Multiple innovative studies have been undertaken to explore contributors to health inequities in diabetes, and these studies are expanding our understanding of the chasm.37 There have also been innovative solutions to addressing these inequities, with multiple studies published over the past 2 years.38 A source of inequity among patients with T1D is the lack of representation of racial/ethnic minorities with T1D in clinical trials.39 The T1DX-QI suggests that the equity-adapted framework for QI can be applied by research leaders to support trial diversity and representation, ensuring future device innovations are meaningful for all people with T1D.40
Diabetes Devices
Glucose monitoring and insulin therapy are vital tools to support individuals living with T1D, and devices such as CGM and insulin pumps have become the standard of care for diabetes management (Table).41 Innovations in diabetes technology and device access are imperative for a chronic disease with no cure.
The COVID-19 pandemic created an opportunity to increase access to diabetes devices in inpatient settings. In 2020, the US Food and Drug Administration expanded the use of CGM to support remote monitoring of patients in inpatient hospital settings, simultaneously supporting the glucose monitoring needs of patients with T1D and reducing COVID-19 transmission through reduced patient-clinician contact.42 This effort has been expanded and will continue in 2022 and beyond,43 and aligns with the growing consensus that supports patients wearing both CGMs and insulin pumps in ambulatory settings to improve patient health outcomes.44
Since 2020, innovations in diabetes technology have improved and increased the variety of options available to people with T1D and made them easier to use (Table). New, advanced hybrid closed-loop systems have progressed to offer Bluetooth features, including automatic software upgrades, tubeless systems, and the ability to allow parents to use their smartphones to bolus for children.45-47 The next big step in insulin delivery innovation is the release of functioning, fully closed loop systems, of which several are currently in clinical trials.48 These systems support reduced hypoglycemia and improved time in range.49
Additional innovations in insulin delivery have improved the user experience and expanded therapeutic options, including a variety of smart insulin pens complete with dosing logs50,51 and even a patch to deliver insulin without the burden of injections.52 As barriers to diabetes technology persist,53 innovations in alternate insulin delivery provide people with T1D more options to align with their personal access and technology preferences.
Innovations in CGM address cited barriers to their use, including size or overall wear.53-55 CGMs released in the past few years are smaller in physical size, have longer durations of time between changings, are more accurate, and do not require calibrations for accuracy.
New Diabetes Medications
Many new medications and therapeutic advances have become available in the past 2 years.56 Additionally, more medications are being tested as adjunct therapies to support glycemic management in patients with T1D, including metformin, sodium-glucose cotransporter 1 and 2 inhibitors, pramlintide, glucagon-like polypeptide-1 analogs, and glucagon receptor agonists.57 Other recent advances include stem cell replacement therapy for patients with T1D.58 The ultra-long-acting biosimilar insulins are one medical innovation that has been stalled, rather than propelled, during the COVID-19 pandemic.59
Diabetes Policy Advocacy
People with T1D require insulin to survive. The cost of insulin has increased in recent years, with some studies citing a 64% to 100% increase in the past decade.60,61 In fact, 1 in 4 insulin users report that cost has impacted their insulin use, including rationing their insulin.62 Lockdowns during the COVID-19 pandemic stressed US families financially, increasing the urgency for insulin cost caps.
Although the COVID-19 pandemic halted national conversations on drug financing,63 advocacy efforts have succeeded for specific populations. The new Medicare Part D Senior Savings Model will cap the cost of insulin at $35 for a 30-day supply,64 and 20 states passed legislation capping insulin pricing.62 Efforts to codify national cost caps are under debate, including the passage of the Affordable Insulin Now Act, which passed the House in March 2022 and is currently under review in the Senate.65
Perspective: The Role of Private Philanthropy in Supporting Population Health Innovations
Funders and industry partners play a crucial role in leading and supporting innovations that improve the lives of people with T1D and reduce society’s costs of living with the disease. Data infrastructure is critical to supporting population health. While building the data infrastructure to support population health is both time- and resource-intensive, private foundations such as Helmsley are uniquely positioned—and have a responsibility—to take large, informed risks to help reach all communities with T1D.
The T1DX-QI is the largest source of population health data on T1D in the United States and is becoming the premiere data authority on its incidence, prevalence, and outcomes. The T1DX-QI enables a robust understanding of T1D-related health trends at the population level, as well as trends among clinics and providers. Pilot centers in the T1DX-QI have reported reductions in patients’ A1c and acute diabetes-related events, as well as improvements in device usage and depression screening. The ability to capture changes speaks to the promise and power of these data to demonstrate the clinical impact of QI interventions and to support the spread of best practices and learnings across health systems.
Additional philanthropic efforts have supported innovation in the last 2 years. For example, the JDRF, a nonprofit philanthropic equity firm, has supported efforts in developing artificial pancreas systems and cell therapies currently in clinical trials like teplizumab, a drug that has demonstrated delayed onset of T1D through JDRF’s T1D Fund.66 Industry partners also have an opportunity for significant influence in this area, as they continue to fund meaningful projects to advance care for people with T1D.67
Conclusion
We are optimistic that the innovations summarized here describe a shift in the tide of equitable T1D outcomes; however, future work is required to explore additional health equity successes that do not further exacerbate inequities. We also see further opportunities for innovative ways to engage people with T1D in their health care through conversations on social determinants of health and societal structures.
Corresponding author: Ann Mungmode, MPH, T1D Exchange, 11 Avenue de Lafayette, Boston, MA 02111; Email: amungmode@t1dexchange.org
Disclosures: Dr. Ebekozien serve(d) as a director, officer, partner, employee, advisor, consultant, or trustee for the Medtronic Advisory Board and received research grants from Medtronic Diabetes, Eli Lilly, and Dexcom.
Funding: The T1DX-QI is funded by The Leona M. and Harry B. Hemsley Charitable Trust.
1. Centers for Disease Control and Prevention. National diabetes statistics report. Accessed August 30, 2022. www.cdc.gov/diabetes/data/statistics-report/index.html
2. Centers for Disease Control and Prevention. Diabetes fast facts. Accessed August 30, 2022. www.cdc.gov/diabetes/basics/quick-facts.html
3. O’Malley G, Ebekozien O, Desimone M, et al. COVID-19 hospitalization in adults with type 1 diabetes: results from the T1D Exchange Multicenter Surveillance Study. J Clin Endocrinol Metab. 2020;106(2):e936-e942. doi:10.1210/clinem/dgaa825
4. Ebekozien OA, Noor N, Gallagher MP, Alonso GT. Type 1 diabetes and COVID-19: preliminary findings from a multicenter surveillance study in the U.S. Diabetes Care. 2020;43(8):e83-e85. doi:10.2337/dc20-1088
5. Zimmerman C, Albanese-O’Neill A, Haller MJ. Advances in type 1 diabetes technology over the last decade. Eur Endocrinol. 2019;15(2):70-76. doi:10.17925/ee.2019.15.2.70
6. Wake DJ, Gibb FW, Kar P, et al. Endocrinology in the time of COVID-19: remodelling diabetes services and emerging innovation. Eur J Endocrinol. 2020;183(2):G67-G77. doi:10.1530/eje-20-0377
7. Alonso GT, Corathers S, Shah A, et al. Establishment of the T1D Exchange Quality Improvement Collaborative (T1DX-QI). Clin Diabetes. 2020;38(2):141-151. doi:10.2337/cd19-0032
8. Ginnard OZB, Alonso GT, Corathers SD, et al. Quality improvement in diabetes care: a review of initiatives and outcomes in the T1D Exchange Quality Improvement Collaborative. Clin Diabetes. 2021;39(3):256-263. doi:10.2337/cd21-0029
9. ATTD 2021 invited speaker abstracts. Diabetes Technol Ther. 2021;23(S2):A1-A206. doi:10.1089/dia.2021.2525.abstracts
10. Rompicherla SN, Edelen N, Gallagher R, et al. Children and adolescent patients with pre-existing type 1 diabetes and additional comorbidities have an increased risk of hospitalization from COVID-19; data from the T1D Exchange COVID Registry. Pediatr Diabetes. 2021;22(S30):3-32. doi:10.1111/pedi.13268
11. Abstracts for the T1D Exchange QI Collaborative (T1DX-QI) Learning Session 2021. November 8-9, 2021. J Diabetes. 2021;13(S1):3-17. doi:10.1111/1753-0407.13227
12. The Official Journal of ATTD Advanced Technologies & Treatments for Diabetes conference 27-30 April 2022. Barcelona and online. Diabetes Technol Ther. 2022;24(S1):A1-A237. doi:10.1089/dia.2022.2525.abstracts
13. Ebekozien ON, Kamboj N, Odugbesan MK, et al. Inequities in glycemic outcomes for patients with type 1 diabetes: six-year (2016-2021) longitudinal follow-up by race and ethnicity of 36,390 patients in the T1DX-QI Collaborative. Diabetes. 2022;71(suppl 1). doi:10.2337/db22-167-OR
14. Narayan KA, Noor M, Rompicherla N, et al. No BMI increase during the COVID-pandemic in children and adults with T1D in three continents: joint analysis of ADDN, T1DX, and DPV registries. Diabetes. 2022;71(suppl 1). doi:10.2337/db22-269-OR
15. Lee JY, Lee SWH. Telemedicine cost-effectiveness for diabetes management: a systematic review. Diabetes Technol Ther. 2018;20(7):492-500. doi:10.1089/dia.2018.0098
16. McDonnell ME. Telemedicine in complex diabetes management. Curr Diab Rep. 2018;18(7):42. doi:10.1007/s11892-018-1015-3
17. Lee JM, Carlson E, Albanese-O’Neill A, et al. Adoption of telemedicine for type 1 diabetes care during the COVID-19 pandemic. Diabetes Technol Ther. 2021;23(9):642-651. doi:10.1089/dia.2021.0080
18. Phillip M, Bergenstal RM, Close KL, et al. The digital/virtual diabetes clinic: the future is now–recommendations from an international panel on diabetes digital technologies introduction. Diabetes Technol Ther. 2021;23(2):146-154. doi:10.1089/dia.2020.0375
19. Garg SK, Rodriguez E. COVID‐19 pandemic and diabetes care. Diabetes Technol Ther. 2022;24(S1):S2-S20. doi:10.1089/dia.2022.2501
20. Beliard K, Ebekozien O, Demeterco-Berggren C, et al. Increased DKA at presentation among newly diagnosed type 1 diabetes patients with or without COVID-19: data from a multi-site surveillance registry. J Diabetes. 2021;13(3):270-272. doi:10.1111/1753-0407.13141
21. Ebekozien O, Agarwal S, Noor N, et al. Inequities in diabetic ketoacidosis among patients with type 1 diabetes and COVID-19: data from 52 US clinical centers. J Clin Endocrinol Metab. 2020;106(4):1755-1762. doi:10.1210/clinem/dgaa920
22. Alonso GT, Ebekozien O, Gallagher MP, et al. Diabetic ketoacidosis drives COVID-19 related hospitalizations in children with type 1 diabetes. J Diabetes. 2021;13(8):681-687. doi:10.1111/1753-0407.13184
23. Noor N, Ebekozien O, Levin L, et al. Diabetes technology use for management of type 1 diabetes is associated with fewer adverse COVID-19 outcomes: findings from the T1D Exchange COVID-19 Surveillance Registry. Diabetes Care. 2021;44(8):e160-e162. doi:10.2337/dc21-0074
24. Demeterco-Berggren C, Ebekozien O, Rompicherla S, et al. Age and hospitalization risk in people with type 1 diabetes and COVID-19: data from the T1D Exchange Surveillance Study. J Clin Endocrinol Metab. 2021;107(2):410-418. doi:10.1210/clinem/dgab668
25. DeSalvo DJ, Noor N, Xie C, et al. Patient demographics and clinical outcomes among type 1 diabetes patients using continuous glucose monitors: data from T1D Exchange real-world observational study. J Diabetes Sci Technol. 2021 Oct 9. [Epub ahead of print] doi:10.1177/19322968211049783
26. Gallagher MP, Rompicherla S, Ebekozien O, et al. Differences in COVID-19 outcomes among patients with type 1 diabetes: first vs later surges. J Clin Outcomes Manage. 2022;29(1):27-31. doi:10.12788/jcom.0084
27. Wolf RM, Noor N, Izquierdo R, et al. Increase in newly diagnosed type 1 diabetes in youth during the COVID-19 pandemic in the United States: a multi-center analysis. Pediatr Diabetes. 2022;23(4):433-438. doi:10.1111/pedi.13328
28. Lavik AR, Ebekozien O, Noor N, et al. Trends in type 1 diabetic ketoacidosis during COVID-19 surges at 7 US centers: highest burden on non-Hispanic Black patients. J Clin Endocrinol Metab. 2022;107(7):1948-1955. doi:10.1210/clinem/dgac158
29. van der Linden J, Welsh JB, Hirsch IB, Garg SK. Real-time continuous glucose monitoring during the coronavirus disease 2019 pandemic and its impact on time in range. Diabetes Technol Ther. 2021;23(S1):S1-S7. doi:10.1089/dia.2020.0649
30. Nwosu BU, Al-Halbouni L, Parajuli S, et al. COVID-19 pandemic and pediatric type 1 diabetes: no significant change in glycemic control during the pandemic lockdown of 2020. Front Endocrinol (Lausanne). 2021;12:703905. doi:10.3389/fendo.2021.703905
31. Ellahham S. Artificial intelligence: the future for diabetes care. Am J Med. 2020;133(8):895-900. doi:10.1016/j.amjmed.2020.03.033
32. Nomura A, Noguchi M, Kometani M, et al. Artificial intelligence in current diabetes management and prediction. Curr Diab Rep. 2021;21(12):61. doi:10.1007/s11892-021-01423-2
33. Mungmode A, Noor N, Weinstock RS, et al. Making diabetes electronic medical record data actionable: promoting benchmarking and population health using the T1D Exchange Quality Improvement Portal. Clin Diabetes. Forthcoming 2022.
34. Lavizzo-Mourey RJ, Besser RE, Williams DR. Understanding and mitigating health inequities—past, current, and future directions. N Engl J Med. 2021;384(18):1681-1684. doi:10.1056/NEJMp2008628
35. Majidi S, Ebekozien O, Noor N, et al. Inequities in health outcomes in children and adults with type 1 diabetes: data from the T1D Exchange Quality Improvement Collaborative. Clin Diabetes. 2021;39(3):278-283. doi:10.2337/cd21-0028
36. Ebekozien O, Mungmode A, Odugbesan O, et al. Addressing type 1 diabetes health inequities in the United States: approaches from the T1D Exchange QI Collaborative. J Diabetes. 2022;14(1):79-82. doi:10.1111/1753-0407.13235
37. Odugbesan O, Addala A, Nelson G, et al. Implicit racial-ethnic and insurance-mediated bias to recommending diabetes technology: insights from T1D Exchange multicenter pediatric and adult diabetes provider cohort. Diabetes Technol Ther. 2022 Jun 13. [Epub ahead of print] doi:10.1089/dia.2022.0042
38. Schmitt J, Fogle K, Scott ML, Iyer P. Improving equitable access to continuous glucose monitors for Alabama’s children with type 1 diabetes: a quality improvement project. Diabetes Technol Ther. 2022;24(7):481-491. doi:10.1089/dia.2021.0511
39. Akturk HK, Agarwal S, Hoffecker L, Shah VN. Inequity in racial-ethnic representation in randomized controlled trials of diabetes technologies in type 1 diabetes: critical need for new standards. Diabetes Care. 2021;44(6):e121-e123. doi:10.2337/dc20-3063
40. Ebekozien O, Mungmode A, Buckingham D, et al. Achieving equity in diabetes research: borrowing from the field of quality improvement using a practical framework and improvement tools. Diabetes Spectr. 2022;35(3):304-312. doi:10.2237/dsi22-0002
41. Zhang J, Xu J, Lim J, et al. Wearable glucose monitoring and implantable drug delivery systems for diabetes management. Adv Healthc Mater. 2021;10(17):e2100194. doi:10.1002/adhm.202100194
42. FDA expands remote patient monitoring in hospitals for people with diabetes during COVID-19; manufacturers donate CGM supplies. News release. April 21, 2020. Accessed August 30, 2022. https://www.diabetes.org/newsroom/press-releases/2020/fda-remote-patient-monitoring-cgm
43. Campbell P. FDA grants Dexcom CGM breakthrough designation for in-hospital use. March 2, 2022. Accessed August 30, 2022. https://www.endocrinologynetwork.com/view/fda-grants-dexcom-cgm-breakthrough-designation-for-in-hospital-use
44. Yeh T, Yeung M, Mendelsohn Curanaj FA. Managing patients with insulin pumps and continuous glucose monitors in the hospital: to wear or not to wear. Curr Diab Rep. 2021;21(2):7. doi:10.1007/s11892-021-01375-7
45. Medtronic announces FDA approval for MiniMed 770G insulin pump system. News release. September 21, 2020. Accessed August 30, 2022. https://bit.ly/3TyEna4
46. Tandem Diabetes Care announces commercial launch of the t:slim X2 insulin pump with Control-IQ technology in the United States. News release. January 15, 2020. Accessed August 30, 2022. https://investor.tandemdiabetes.com/news-releases/news-release-details/tandem-diabetes-care-announces-commercial-launch-tslim-x2-0
47. Garza M, Gutow H, Mahoney K. Omnipod 5 cleared by the FDA. Updated August 22, 2022. Accessed August 30, 2022.https://diatribe.org/omnipod-5-approved-fda
48. Boughton CK. Fully closed-loop insulin delivery—are we nearly there yet? Lancet Digit Health. 2021;3(11):e689-e690. doi:10.1016/s2589-7500(21)00218-1
49. Noor N, Kamboj MK, Triolo T, et al. Hybrid closed-loop systems and glycemic outcomes in children and adults with type 1 diabetes: real-world evidence from a U.S.-based multicenter collaborative. Diabetes Care. 2022;45(8):e118-e119. doi:10.2337/dc22-0329
50. Medtronic launches InPen with real-time Guardian Connect CGM data--the first integrated smart insulin pen for people with diabetes on MDI. News release. November 12, 2020. Accessed August 30, 2022. https://bit.ly/3CTSWPL
51. Bigfoot Biomedical receives FDA clearance for Bigfoot Unity Diabetes Management System, featuring first-of-its-kind smart pen caps for insulin pens used to treat type 1 and type 2 diabetes. News release. May 10, 2021. Accessed August 30, 2022. https://bit.ly/3BeyoAh
52. Vieira G. All about the CeQur Simplicity insulin patch. Updated May 24, 2022. Accessed August 30, 2022. https://beyondtype1.org/cequr-simplicity-insulin-patch/.
53. Messer LH, Tanenbaum ML, Cook PF, et al. Cost, hassle, and on-body experience: barriers to diabetes device use in adolescents and potential intervention targets. Diabetes Technol Ther. 2020;22(10):760-767. doi:10.1089/dia.2019.0509
54. Hilliard ME, Levy W, Anderson BJ, et al. Benefits and barriers of continuous glucose monitoring in young children with type 1 diabetes. Diabetes Technol Ther. 2019;21(9):493-498. doi:10.1089/dia.2019.0142
55. Dexcom G7 Release Delayed Until Late 2022. News release. August 8, 2022. Accessed September 7, 2022. https://diatribe.org/dexcom-g7-release-delayed-until-late-2022
56. Drucker DJ. Transforming type 1 diabetes: the next wave of innovation. Diabetologia. 2021;64(5):1059-1065. doi:10.1007/s00125-021-05396-5
57. Garg SK, Rodriguez E, Shah VN, Hirsch IB. New medications for the treatment of diabetes. Diabetes Technol Ther. 2022;24(S1):S190-S208. doi:10.1089/dia.2022.2513
58. Melton D. The promise of stem cell-derived islet replacement therapy. Diabetologia. 2021;64(5):1030-1036. doi:10.1007/s00125-020-05367-2
59. Danne T, Heinemann L, Bolinder J. New insulins, biosimilars, and insulin therapy. Diabetes Technol Ther. 2022;24(S1):S35-S57. doi:10.1089/dia.2022.2503
60. Kenney J. Insulin copay caps–a path to affordability. July 6, 2021. Accessed August 30, 2022.https://diatribechange.org/news/insulin-copay-caps-path-affordability
61. Glied SA, Zhu B. Not so sweet: insulin affordability over time. September 25, 2020. Accessed August 30, 2022. https://www.commonwealthfund.org/publications/issue-briefs/2020/sep/not-so-sweet-insulin-affordability-over-time
62. American Diabetes Association. Insulin and drug affordability. Accessed August 30, 2022. https://www.diabetes.org/advocacy/insulin-and-drug-affordability
63. Sullivan P. Chances for drug pricing, surprise billing action fade until November. March 24, 2020. Accessed August 30, 2022. https://thehill.com/policy/healthcare/489334-chances-for-drug-pricing-surprise-billing-action-fade-until-november/
64. Brown TD. How Medicare’s new Senior Savings Model makes insulin more affordable. June 4, 2020. Accessed August 30, 2022. https://www.diabetes.org/blog/how-medicares-new-senior-savings-model-makes-insulin-more-affordable
65. American Diabetes Association. ADA applauds the U.S. House of Representatives passage of the Affordable Insulin Now Act. News release. April 1, 2022. https://www.diabetes.org/newsroom/official-statement/2022/ada-applauds-us-house-of-representatives-passage-of-the-affordable-insulin-now-act
66. JDRF. Driving T1D cures during challenging times. 2022.
67. Medtronic announces ongoing initiatives to address health equity for people of color living with diabetes. News release. April 7, 2021. Access August 30, 2022. https://bit.ly/3KGTOZU
Add AFib to noncardiac surgery risk evaluation: New support
Practice has gone back and forth on whether atrial fibrillation (AFib) should be considered in the preoperative cardiovascular risk (CV) evaluation of patients slated for noncardiac surgery, and the Revised Cardiac Risk Index (RCRI), currently widely used as an assessment tool, doesn’t include the arrhythmia.
But consideration of preexisting AFib along with the RCRI predicted 30-day mortality more sharply than the RCRI alone in an analysis of data covering several million patients slated for such procedures.

Indeed, AFib emerged as a significant, independent risk factor for a number of bad postoperative outcomes. Mortality within a month of the procedure climbed about 30% for patients with AFib before the noncardiac surgery. Their 30-day risks for stroke and for heart failure hospitalization went up similarly.
The addition of AFib to the RCRI significantly improved its ability to discriminate 30-day postoperative risk levels regardless of age, sex, and type of noncardiac surgery, Amgad Mentias, MD, Cleveland Clinic, told this news organization. And “it was able to correctly up-classify patients to high risk, if AFib was there, and it was able to down-classify some patients to lower risk if it wasn’t there.”
“I think [the findings] are convincing evidence that atrial fib should at least be part of the thought process for the surgical team and the medical team taking care of the patient,” said Dr. Mentias, who is senior author on the study published in the Journal of the American College of Cardiology, with lead author Sameer Prasada, MD, also of the Cleveland Clinic.
The results “call for incorporating AFib as a risk factor in perioperative risk scores for cardiovascular morbidity and mortality,” the published report states.
Supraventricular arrhythmias had been part of the Goldman Risk Index once widely used preoperatively to assess cardiac risk before practice adopted the RCRI in the past decade, observe Anne B. Curtis, MD, and Sai Krishna C. Korada, MD, University at Buffalo, New York, in an accompanying editorial.
The current findings “demonstrate improved prediction of adverse postsurgical outcomes” from supplementing the RCRI with AFib, they write. Given associations between preexisting AFib and serious cardiac events, “it is time to ‘re-revise’ the RCRI and acknowledge the importance of AFib in predicting adverse outcomes” after noncardiac surgery.
The new findings, however, aren’t all straightforward. In one result that remains a bit of a head-scratcher, postoperative risk of myocardial infarction (MI) in patients with preexisting AFib went in the opposite direction of risk for death and other CV outcomes, falling by almost 20%.
That is “hard to explain with the available data,” the report states, but “the use of anticoagulation, whether oral or parenteral (as a bridge therapy in the perioperative period), is a plausible explanation” given the frequent role of thrombosis in triggering MIs.
Consistent with such a mechanism, the group argues, the MI risk reduction was seen primarily among patients with AFib and a CHA2DS2-VASc score of 2 or higher – that is, those at highest risk for stroke and therefore most likely to be on oral anticoagulation. The MI risk reduction wasn’t seen in such patients with a CHA2DS2-VASc score of 0 or 1.
“I think that’s part of the explanation, that anticoagulation can reduce risk of MI. But it’s not the whole explanation,” Dr. Mentias said in an interview. If it were the sole mechanism, he said, then the same oral anticoagulation that protected against MI should have also cut the postoperative stroke risk. Yet that risk climbed 40% among patients with preexisting AFib.
The analysis started with 8.6 million Medicare patients with planned noncardiac surgery, seen from 2015 to 2019, of whom 16.4% had preexisting AFib. Propensity matching for demographics, urgency and type of surgery, CHA2DS2-VASc score, and RCRI index created two cohorts for comparison: 1.13 million patients with and 1.92 million without preexisting AFib.
Preexisting AFib was associated with a higher 30-day risk for death from any cause, the primary endpoint being 8.3% versus 5.8% for those without such AFib (P < .001), for an odds ratio of 1.31 (95% confidence interval, 1.30-1.32).
Corresponding 30-day ORs for other events, all significant at P < .001, were:
- 1.31 (95% CI, 1.30-1.33) for heart failure
- 1.40 (95% CI, 1.37-1.43) for stroke
- 1.59 (95% CI, 1.43-1.75) for systemic embolism
- 1.14 (95% CI, 1.13-1.16) for major bleeding
- 0.81 (95% CI, 0.79-0.82) for MI
Those with preexisting AFib also had longer hospitalizations at a median 5 days, compared with 4 days for those without such AFib (P < .001).
The study has the limitations of most any retrospective cohort analysis. Other limitations, the report notes, include lack of information on any antiarrhythmic meds given during hospitalization or type of AFib.
For example, AFib that is permanent – compared with paroxysmal or persistent – may be associated with more atrial fibrosis, greater atrial dilatation, “and probably higher pressures inside the heart,” Dr. Mentias observed.
“That’s not always the case, but that’s the notion. So presumably people with persistent or permanent atrial fib would have more advanced heart disease, and that could imply more risk. But we did not have that kind of data.”
Dr. Mentias and Dr. Prasada report no relevant financial relationships; disclosures for the other authors are in the report. Dr. Curtis discloses serving on advisory boards for Abbott, Janssen Pharmaceuticals, Sanofi, and Milestone Pharmaceuticals; receiving honoraria for speaking from Medtronic and Zoll; and serving on a data-monitoring board for Medtronic. Dr. Korada reports he has no relevant financial relationships.
A version of this article first appeared on Medscape.com.
Practice has gone back and forth on whether atrial fibrillation (AFib) should be considered in the preoperative cardiovascular risk (CV) evaluation of patients slated for noncardiac surgery, and the Revised Cardiac Risk Index (RCRI), currently widely used as an assessment tool, doesn’t include the arrhythmia.
But consideration of preexisting AFib along with the RCRI predicted 30-day mortality more sharply than the RCRI alone in an analysis of data covering several million patients slated for such procedures.
Indeed, AFib emerged as a significant, independent risk factor for a number of bad postoperative outcomes. Mortality within a month of the procedure climbed about 30% for patients with AFib before the noncardiac surgery. Their 30-day risks for stroke and for heart failure hospitalization went up similarly.
The addition of AFib to the RCRI significantly improved its ability to discriminate 30-day postoperative risk levels regardless of age, sex, and type of noncardiac surgery, Amgad Mentias, MD, Cleveland Clinic, told this news organization. And “it was able to correctly up-classify patients to high risk, if AFib was there, and it was able to down-classify some patients to lower risk if it wasn’t there.”
“I think [the findings] are convincing evidence that atrial fib should at least be part of the thought process for the surgical team and the medical team taking care of the patient,” said Dr. Mentias, who is senior author on the study published in the Journal of the American College of Cardiology, with lead author Sameer Prasada, MD, also of the Cleveland Clinic.
The results “call for incorporating AFib as a risk factor in perioperative risk scores for cardiovascular morbidity and mortality,” the published report states.
Supraventricular arrhythmias had been part of the Goldman Risk Index once widely used preoperatively to assess cardiac risk before practice adopted the RCRI in the past decade, observe Anne B. Curtis, MD, and Sai Krishna C. Korada, MD, University at Buffalo, New York, in an accompanying editorial.
The current findings “demonstrate improved prediction of adverse postsurgical outcomes” from supplementing the RCRI with AFib, they write. Given associations between preexisting AFib and serious cardiac events, “it is time to ‘re-revise’ the RCRI and acknowledge the importance of AFib in predicting adverse outcomes” after noncardiac surgery.
The new findings, however, aren’t all straightforward. In one result that remains a bit of a head-scratcher, postoperative risk of myocardial infarction (MI) in patients with preexisting AFib went in the opposite direction of risk for death and other CV outcomes, falling by almost 20%.
That is “hard to explain with the available data,” the report states, but “the use of anticoagulation, whether oral or parenteral (as a bridge therapy in the perioperative period), is a plausible explanation” given the frequent role of thrombosis in triggering MIs.
Consistent with such a mechanism, the group argues, the MI risk reduction was seen primarily among patients with AFib and a CHA2DS2-VASc score of 2 or higher – that is, those at highest risk for stroke and therefore most likely to be on oral anticoagulation. The MI risk reduction wasn’t seen in such patients with a CHA2DS2-VASc score of 0 or 1.
“I think that’s part of the explanation, that anticoagulation can reduce risk of MI. But it’s not the whole explanation,” Dr. Mentias said in an interview. If it were the sole mechanism, he said, then the same oral anticoagulation that protected against MI should have also cut the postoperative stroke risk. Yet that risk climbed 40% among patients with preexisting AFib.
The analysis started with 8.6 million Medicare patients with planned noncardiac surgery, seen from 2015 to 2019, of whom 16.4% had preexisting AFib. Propensity matching for demographics, urgency and type of surgery, CHA2DS2-VASc score, and RCRI index created two cohorts for comparison: 1.13 million patients with and 1.92 million without preexisting AFib.
Preexisting AFib was associated with a higher 30-day risk for death from any cause, the primary endpoint being 8.3% versus 5.8% for those without such AFib (P < .001), for an odds ratio of 1.31 (95% confidence interval, 1.30-1.32).
Corresponding 30-day ORs for other events, all significant at P < .001, were:
- 1.31 (95% CI, 1.30-1.33) for heart failure
- 1.40 (95% CI, 1.37-1.43) for stroke
- 1.59 (95% CI, 1.43-1.75) for systemic embolism
- 1.14 (95% CI, 1.13-1.16) for major bleeding
- 0.81 (95% CI, 0.79-0.82) for MI
Those with preexisting AFib also had longer hospitalizations at a median 5 days, compared with 4 days for those without such AFib (P < .001).
The study has the limitations of most any retrospective cohort analysis. Other limitations, the report notes, include lack of information on any antiarrhythmic meds given during hospitalization or type of AFib.
For example, AFib that is permanent – compared with paroxysmal or persistent – may be associated with more atrial fibrosis, greater atrial dilatation, “and probably higher pressures inside the heart,” Dr. Mentias observed.
“That’s not always the case, but that’s the notion. So presumably people with persistent or permanent atrial fib would have more advanced heart disease, and that could imply more risk. But we did not have that kind of data.”
Dr. Mentias and Dr. Prasada report no relevant financial relationships; disclosures for the other authors are in the report. Dr. Curtis discloses serving on advisory boards for Abbott, Janssen Pharmaceuticals, Sanofi, and Milestone Pharmaceuticals; receiving honoraria for speaking from Medtronic and Zoll; and serving on a data-monitoring board for Medtronic. Dr. Korada reports he has no relevant financial relationships.
A version of this article first appeared on Medscape.com.
A Quantification Method to Compare the Value of Surgery and Palliative Care in Patients With Complex Cardiac Disease: A Concept
From the Department of Cardiothoracic Surgery, Stanford University, Stanford, CA.
Abstract
Complex cardiac patients are often referred for surgery or palliative care based on the risk of perioperative mortality. This decision ignores factors such as quality of life or duration of life in either surgery or the palliative path. Here, we propose a model to numerically assess and compare the value of surgery vs palliation. This model includes quality and duration of life, as well as risk of perioperative mortality, and involves a patient’s preferences in the decision-making process.
For each pathway, surgery or palliative care, a value is calculated and compared to a normal life value (no disease symptoms and normal life expectancy). The formula is adjusted for the risk of operative mortality. The model produces a ratio of the value of surgery to the value of palliative care that signifies the superiority of one or another. This model calculation presents an objective estimated numerical value to compare the value of surgery and palliative care. It can be applied to every decision-making process before surgery. In general, if a procedure has the potential to significantly extend life in a patient who otherwise has a very short life expectancy with palliation only, performing high-risk surgery would be a reasonable option. A model that provides a numerical value for surgery vs palliative care and includes quality and duration of life in each pathway could be a useful tool for cardiac surgeons in decision making regarding high-risk surgery.
Keywords: high-risk surgery, palliative care, quality of life, life expectancy.
Patients with complex cardiovascular disease are occasionally considered inoperable due to the high risk of surgical mortality. When the risk of perioperative mortality (POM) is predicted to be too high, surgical intervention is denied, and patients are often referred to palliative care. The risk of POM in cardiac surgery is often calculated using large-scale databases, such as the Society of Thoracic Surgeons (STS) records. The STS risk models, which are regularly updated, are based on large data sets and incorporate precise statistical methods for risk adjustment.1 In general, these calculators provide a percentage value that defines the magnitude of the risk of death, and then an arbitrary range is selected to categorize the procedure as low, medium, or high risk or inoperable status. The STS database does not set a cutoff point or range to define “operability.” Assigning inoperable status to a certain risk rate is problematic, with many ethical, legal, and moral implications, and for this reason, it has mostly remained undefined. In contrast, the low- and medium-risk ranges are easier to define. Another limitation encountered in the STS database is the lack of risk data for less common but very high-risk procedures, such as a triple valve replacement.
A common example where risk classification has been defined is in patients who are candidates for surgical vs transcatheter aortic valve replacement. Some groups have described a risk of <4% as low risk, 4% to 8% as intermediate risk, >8% as high risk, and >15% as inoperable2; for some other groups, a risk of POM >50% is considered extreme risk or inoperable.3,4 This procedure-specific classification is a useful decision-making tool and helps the surgeon perform an initial risk assessment to allocate a specific patient to a group—operable or nonoperable—only by calculating the risk of surgical death. However, this allocation method does not provide any information on how and when death occurs in either group. These 2 parameters of how and when death occurs define the quality of life (QOL) and the duration of life (DOL), respectively, and together could be considered as the value of life in each pathway. A survivor of a high-risk surgery may benefit from good quality and extended life (a high value), or, on the other end of the spectrum, a high-risk patient who does not undergo surgery is spared the mortality risk of the surgery but dies sooner (low value) with symptoms due to the natural course of the untreated disease.
The central question is, if a surgery is high risk but has the potential of providing a good value (for those who survive it), what QOL and DOL values are acceptable to risk or to justify accepting and proceeding with a risky surgery? Or how high a POM risk is justified to proceed with surgery rather than the alternative palliative care with a certain quality and duration? It is obvious that a decision-making process that is based on POM cannot compare the value of surgery (Vs) and the value of palliation (Vp). Furthermore, it ignores patient preferences and their input, as these are excluded from this decision-making process.
To be able to include QOL and DOL in any decision making, one must precisely describe these parameters. Both QOL and DOL are used for estimation of disease burden by health care administrators, public health experts, insurance agencies, and others. Multiple models have been proposed and used to estimate the overall burden of the disease. Most of the models for this purpose are created for large-scale economic purposes and not for decision making in individual cases.
An important measure is the quality-adjusted life year (QALY). This is an important parameter since it includes both measures of quality and quantity of life.5,6 QALY is a simplified measure to assess the value of health outcomes, and it has been used in economic calculations to assess mainly the cost-effectiveness of various interventions. We sought to evaluate the utility of a similar method in adding further insight into the surgical decision-making process. In this article, we propose a simple model to compare the value of surgery vs palliative care, similar to QALY. This model includes and adjusts for the quality and the quantity of life, in addition to the risk of POM, in the decision-making process for high-risk patients.
The Model
The 2 decision pathways, surgery and palliative care, are compared for their value. We define the value as the product of QOL and DOL in each pathway and use the severity of the symptoms as a surrogate for QOL. If duration and quality were depicted on the x and y axes of a graph (Figure 1), then the area under the curve would represent the collective value in each situation. Figure 2 shows the timeline and the different pathways with each decision. The value in each situation is calculated in relation to the full value, which is represented as the value of normal life (Vn), that is, life without disease and with normal life expectancy. The values of each decision pathway, the value of surgery (Vs) and the value of palliation (Vp), are then compared to define the benefit for each decision as follows:
If Vs/Vp > 1, the benefit is toward surgery;
If Vs/Vp < 1, the benefit is for palliative care.
 and in different disease pathways taken from a single sample")

Definitions
Both quality and duration of life are presented on a 1-10 scale, 1 being the lowest and 10 the highest value, to yield a product with a value of 100 in normal, disease-free life. Any lower value is presented as a percentage to represent the comparison to the full value. QOL is determined by degradation of full quality with the average level of symptoms. DOL is calculated as a lost time (
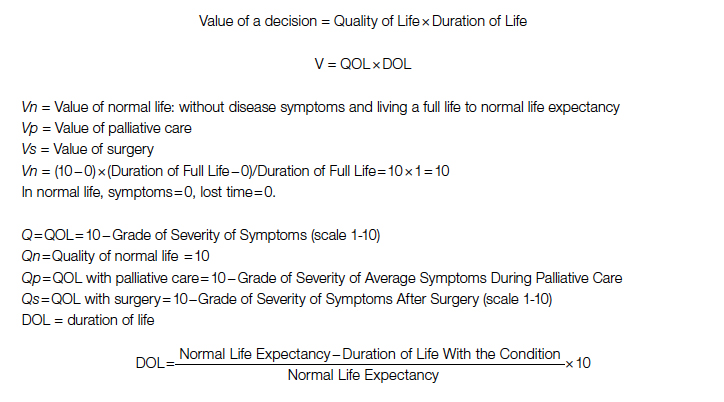
For the DOL under any condition, a 10-year survival rate could be used as a surrogate in this formula. Compared to life expectancy value, using the 10-year survival rate simplifies the calculation since cardiac diseases are more prevalent in older age, close to or beyond the average life expectancy value.
Using the time intervals from the timeline in Figure 2:
dh = time interval from diagnosis to death at life expectancy
dg = time interval from diagnosis to death after successful surgery
df = time interval from diagnosis to death after palliative care
Duration for palliative care:
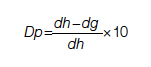
Duration for surgery:
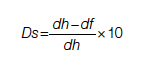
Adjustment: This value is calculated for those who survive the surgery. To adjust for the POM, it is multiplied by the 100 − POM risk.
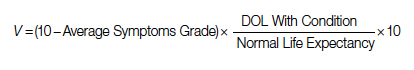
Since value is the base for comparison in this model, and it is the product of 2 equally important factors in the formula (
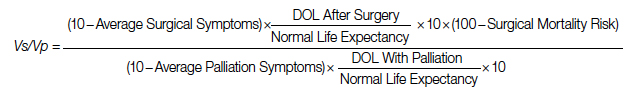
After elimination of normal life expectancy, form the numerator and denominator:
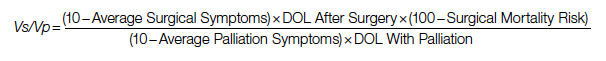
To adjust for surgical outcomes in special circumstances where less than optimal or standard surgical results are expected (eg, in very rare surgeries, limited resource institutions, or suboptimal postoperative surgical care), an optional coefficient R can be added to the numerator (surgical value). This optional coefficient, with values such as 0.8, 0.9 (to degrade the value of surgery) or 1 (standard surgical outcome), adjusts for variability in interinstitutional surgical results or surgeon variability. No coefficient is added to the denominator since palliative care provides minimal differences between clinicians and hospitals. Thus, the final adjusted formula would be as follows:
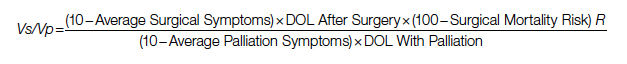
Example
A 60-year-old patient with a 10% POM risk needs to be allocated to surgical or palliative care. With palliative care, if this patient lived 6 years with average symptoms grade 4, the Vp would be 20; that is, 20% of the normal life value (if he lived 18 years instead without the disease).
Using the formula for calculation of value in each pathway:
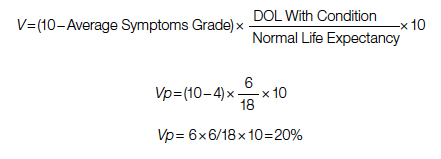
If the same patient undergoes a surgery with a 10% risk of POM, with an average grade 2 related to surgical recovery symptoms for 1 year and then is symptom-free and lives 12 years (instead of 18 years [life expectancy]), his Vs would be 53, or 53% out of the normal life value that is saved if the surgery is 100% successful; adjusted Vs with (chance of survival of 90%) would be 53 × 90% = 48%.
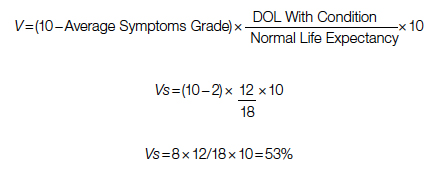
With adjustment of 90% survival chance in surgery, 53 × 90% = 48%. In this example, Vs/Vp = 48/20 = 2.4, showing a significant benefit for surgical care. Notably, the unknown value of normal life expectancy is not needed for the calculation of Vs/Vp, since it is the same in both pathways and it is eliminated by calculation in fraction.
Based on this formula, since the duration of surgical symptoms is short, no matter how severe these are, if the potential duration of life after surgery is high (represented by smaller area under the curve in Figure 1), the numerator becomes larger and the value of the surgery grows. For example, if a patient with a 15% risk of POM, which is generally considered inoperable, lives 5 years, as opposed to 2 years with palliative care with mild symptoms (eg 3/10), Vs/Vp would be 2.7, still showing a significant benefit for surgical care.
Discussion
Any surgical intervention is offered with 2 goals in mind, improving QOL and extending DOL. In a high-risk patient, surgery might be declined due to a high risk of POM, and the patient is offered palliative care, which other than providing symptom relief does not change the course of disease and eventually the patient will die due to the untreated disease. In this decision-making method, mostly completed by a care team only, a potential risk of death due to surgery which possibly could cure the patient is traded for immediate survival; however, the symptomatic course ensues until death. This mostly unilateral decision-making process by a care team, which incorporates minimal input from the patient or ignores patient preferences altogether, is based only on POM risk, and roughly includes a single parameter: years of potential life lost (YPLL). YPLL is a measure of premature mortality, and in the setting of surgical intervention, YPLL is the number of years a patient would lose unless a successful surgery were undertaken. Obviously, patients would live longer if a surgery that was intended to save them failed.
In this article, we proposed a simple method to quantify each decision to decide whether to operate or choose surgical care vs palliative care. Since quality and duration of life are both end factors clinicians and patients aspire to in each decision, they can be considered together as the value of each decision. We believe a numerical framework would provide an objective way to assist both the patient at high risk and the care team in the decision-making process.
The 2 parameters we consider are DOL and QOL. DOL, or survival, can be extracted from large-scale data using statistical methods that have been developed to predict survival under various conditions, such as Kaplan-Meier curves. These methods present the chance of survival in percentages in a defined time frame, such as a 5- or 10-year period.
While the DOL is a numerical parameter and quantifiable, the QOL is a more complex entity. This subjective parameter bears multiple definitions, aspects, and categories, and therefore multiple scales for quantification of QOL have been proposed. These scales have been used extensively for the purpose of health determination in health care policy and economic planning. Most scales acknowledge that QOL is multifactorial and includes interrelated aspects such as mental and socioeconomic factors. We have also noticed that QOL is better determined by the palliative care team than surgeons, so including these care providers in the decision-making process might reduce surgeon bias.
Since our purpose here is only to assist with the decision on medical intervention, we focus on physical QOL. Multiple scales are used to assess health-related QOL, such as the Assessment of Quality of Life (AQoL)-8D,7 EuroQol-5 Dimension (EQ-5D),8 15D,9 and the 36-Item Short Form Survey (SF-36).10 These complex scales are built for systematic reviews, and they are not practical for a clinical user. To simplify and keep this practical, we define QOL by using the severity or grade of symptoms related to the disease the patient has on a scale of 0 to 10. The severity of symptoms can be easily determined using available scales. An applicable scale for this purpose is the Edmonton Symptom Assessment Scale (ESAS), which has been in use for years and has evolved as a useful tool in the medical field.11
Once DOL and QOL are determined on a 1-10 scale, the multiplied value then provides a product that we consider a value. The highest value hoped for in each decision is the achievement of the best QOL and DOL, a value of 100. In Figure 1, a graphic presentation of value in each decision is best seen as the area under the curve. As shown, a successful surgery, even when accompanied by significant symptoms during initial recovery, has a chance (100 – risk of POM%) to gain a larger area under curve (value) by achieving a longer life with no or fewer symptoms. However, in palliative care, progressing disease and even palliated symptoms with a shorter life expectancy impose a large burden on the patient and a much lower value. Note that in this calculation, life expectancy, which is an important but unpredictable factor, is initially included; however, by ratio comparison, it is eliminated, simplifying the calculation further.
Using this formula in different settings reveals that high-risk surgery has a greater potential to reduce YPLL in the general population. Based on this formula, compared to a surgery with potential to significantly extend DOL, a definite shorter and symptomatic life course with palliative care makes it a significantly less favorable option. In fact, in the cardiovascular field, palliative care has minimal or no effect on natural history, as the mechanism of illness is mechanical, such as occlusion of coronary arteries or valve dysfunction, leading eventually to heart failure and death. In a study by Xu et al, although palliative care reduced readmission rates and improved symptoms on a variety of scales, there was no effect on mortality and QOL in patients with heart failure.12
No model in this field has proven to be ideal, and this model bears multiple limitations as well. We have used severity of symptoms as a surrogate for QOL based on the fact that cardiac patients with different pathologies who are untreated will have a common final pathway with development of heart failure symptoms that dictate their QOL. Also, grading QOL is a difficult task at times. Even a model such as QALY, which is one of the most used, is not a perfect model and is not free of problems.6 The difference in surgical results and life expectancy between sexes and ethnic groups might be a source of bias in this formula. Also, multiple factors directly and indirectly affect QOL and DOL and create inaccuracies; therefore, making an exact science from an inexact one naturally relies on multiple assumptions. Although it has previously been shown that most POM occurs in a short period of time after cardiac surgery,13 long-term complications that potentially degrade QOL are not included in this model. By applying this model, one must assume indefinite economic resources. Moreover, applying a single mathematical model in a biologic system and in the general population has intrinsic shortcomings, and it must overlook many other factors (eg, ethical, legal). For example, it will be hard to justify a failed surgery with 15% risk of POM undertaken to eliminate the severe long-lasting symptoms of a disease, while the outcome of a successful surgery with a 20% risk of POM that adds life and quality would be ignored in the current health care system. Thus, regardless of the significant potential, most surgeons would waive a surgery based solely on the percentage rate of POM, perhaps using other terms such as ”peri-nonoperative mortality.”
Conclusion
We have proposed a simple and practical formula for decision making regarding surgical vs palliative care in high-risk patients. By assigning a value that is composed of QOL and DOL in each pathway and including the risk of POM, a ratio of values provides a numerical estimation that can be used to show preference over a specific decision. An advantage of this formula, in addition to presenting an arithmetic value that is easier to understand, is that it can be used in shared decision making with patients. We emphasize that this model is only a preliminary concept at this time and has not been tested or validated for clinical use. Validation of such a model will require extensive work and testing within a large-scale population. We hope that this article will serve as a starting point for the development of other models, and that this formula will become more sophisticated with fewer limitations through larger multidisciplinary efforts in the future.
Corresponding author: Rabin Gerrah, MD, Good Samaritan Regional Medical Center, 3640 NW Samaritan Drive, Suite 100B, Corvallis, OR 97330; rgerrah@stanford.edu.
Disclosures: None reported.
1. O’Brien SM, Feng L, He X, et al. The Society of Thoracic Surgeons 2018 Adult Cardiac Surgery Risk Models: Part 2-statistical methods and results. Ann Thorac Surg. 2018;105(5):1419-1428. doi: 10.1016/j.athoracsur.2018.03.003
2. Hurtado Rendón IS, Bittenbender P, Dunn JM, Firstenberg MS. Chapter 8: Diagnostic workup and evaluation: eligibility, risk assessment, FDA guidelines. In: Transcatheter Heart Valve Handbook: A Surgeons’ and Interventional Council Review. Akron City Hospital, Summa Health System, Akron, OH.
3. Herrmann HC, Thourani VH, Kodali SK, et al; PARTNER Investigators. One-year clinical outcomes with SAPIEN 3 transcatheter aortic valve replacement in high-risk and inoperable patients with severe aortic stenosis. Circulation. 2016;134:130-140. doi:10.1161/CIRCULATIONAHA
4. Ho C, Argáez C. Transcatheter Aortic Valve Implantation for Patients with Severe Aortic Stenosis at Various Levels of Surgical Risk: A Review of Clinical Effectiveness. Ottawa (ON): Canadian Agency for Drugs and Technologies in Health; March 19, 2018.
5. Rios-Diaz AJ, Lam J, Ramos MS, et al. Global patterns of QALY and DALY use in surgical cost-utility analyses: a systematic review. PLoS One. 2016:10;11:e0148304. doi:10.1371/journal.pone.0148304
6. Prieto L, Sacristán JA. Health, Problems and solutions in calculating quality-adjusted life years (QALYs). Qual Life Outcomes. 2003:19;1:80.
7. Centre for Health Economics. Assessment of Quality of Life. 2014. Accessed May 13, 2022. http://www.aqol.com.au/
8. EuroQol Research Foundation. EQ-5D. Accessed May 13, 2022. https://euroqol.org/
9. 15D Instrument. Accessed May 13, 2022. http://www.15d-instrument.net/15d/
10. Rand Corporation. 36-Item Short Form Survey (SF-36).Accessed May 12, 2022. https://www.rand.org/health-care/surveys_tools/mos/36-item-short-form.html
11. Hui D, Bruera E. The Edmonton Symptom Assessment System 25 years later: past, present, and future developments. J Pain Symptom Manage. 2017:53:630-643. doi:10.1016/j.jpainsymman.2016
12. Xu Z, Chen L, Jin S, Yang B, Chen X, Wu Z. Effect of palliative care for patients with heart failure. Int Heart J. 2018:30;59:503-509. doi:10.1536/ihj.17-289
13. Mazzeffi M, Zivot J, Buchman T, Halkos M. In-hospital mortality after cardiac surgery: patient characteristics, timing, and association with postoperative length of intensive care unit and hospital stay. Ann Thorac Surg. 2014;97:1220-1225. doi:10.1016/j.athoracsur.2013.10.040
From the Department of Cardiothoracic Surgery, Stanford University, Stanford, CA.
Abstract
Complex cardiac patients are often referred for surgery or palliative care based on the risk of perioperative mortality. This decision ignores factors such as quality of life or duration of life in either surgery or the palliative path. Here, we propose a model to numerically assess and compare the value of surgery vs palliation. This model includes quality and duration of life, as well as risk of perioperative mortality, and involves a patient’s preferences in the decision-making process.
For each pathway, surgery or palliative care, a value is calculated and compared to a normal life value (no disease symptoms and normal life expectancy). The formula is adjusted for the risk of operative mortality. The model produces a ratio of the value of surgery to the value of palliative care that signifies the superiority of one or another. This model calculation presents an objective estimated numerical value to compare the value of surgery and palliative care. It can be applied to every decision-making process before surgery. In general, if a procedure has the potential to significantly extend life in a patient who otherwise has a very short life expectancy with palliation only, performing high-risk surgery would be a reasonable option. A model that provides a numerical value for surgery vs palliative care and includes quality and duration of life in each pathway could be a useful tool for cardiac surgeons in decision making regarding high-risk surgery.
Keywords: high-risk surgery, palliative care, quality of life, life expectancy.
Patients with complex cardiovascular disease are occasionally considered inoperable due to the high risk of surgical mortality. When the risk of perioperative mortality (POM) is predicted to be too high, surgical intervention is denied, and patients are often referred to palliative care. The risk of POM in cardiac surgery is often calculated using large-scale databases, such as the Society of Thoracic Surgeons (STS) records. The STS risk models, which are regularly updated, are based on large data sets and incorporate precise statistical methods for risk adjustment.1 In general, these calculators provide a percentage value that defines the magnitude of the risk of death, and then an arbitrary range is selected to categorize the procedure as low, medium, or high risk or inoperable status. The STS database does not set a cutoff point or range to define “operability.” Assigning inoperable status to a certain risk rate is problematic, with many ethical, legal, and moral implications, and for this reason, it has mostly remained undefined. In contrast, the low- and medium-risk ranges are easier to define. Another limitation encountered in the STS database is the lack of risk data for less common but very high-risk procedures, such as a triple valve replacement.
A common example where risk classification has been defined is in patients who are candidates for surgical vs transcatheter aortic valve replacement. Some groups have described a risk of <4% as low risk, 4% to 8% as intermediate risk, >8% as high risk, and >15% as inoperable2; for some other groups, a risk of POM >50% is considered extreme risk or inoperable.3,4 This procedure-specific classification is a useful decision-making tool and helps the surgeon perform an initial risk assessment to allocate a specific patient to a group—operable or nonoperable—only by calculating the risk of surgical death. However, this allocation method does not provide any information on how and when death occurs in either group. These 2 parameters of how and when death occurs define the quality of life (QOL) and the duration of life (DOL), respectively, and together could be considered as the value of life in each pathway. A survivor of a high-risk surgery may benefit from good quality and extended life (a high value), or, on the other end of the spectrum, a high-risk patient who does not undergo surgery is spared the mortality risk of the surgery but dies sooner (low value) with symptoms due to the natural course of the untreated disease.
The central question is, if a surgery is high risk but has the potential of providing a good value (for those who survive it), what QOL and DOL values are acceptable to risk or to justify accepting and proceeding with a risky surgery? Or how high a POM risk is justified to proceed with surgery rather than the alternative palliative care with a certain quality and duration? It is obvious that a decision-making process that is based on POM cannot compare the value of surgery (Vs) and the value of palliation (Vp). Furthermore, it ignores patient preferences and their input, as these are excluded from this decision-making process.
To be able to include QOL and DOL in any decision making, one must precisely describe these parameters. Both QOL and DOL are used for estimation of disease burden by health care administrators, public health experts, insurance agencies, and others. Multiple models have been proposed and used to estimate the overall burden of the disease. Most of the models for this purpose are created for large-scale economic purposes and not for decision making in individual cases.
An important measure is the quality-adjusted life year (QALY). This is an important parameter since it includes both measures of quality and quantity of life.5,6 QALY is a simplified measure to assess the value of health outcomes, and it has been used in economic calculations to assess mainly the cost-effectiveness of various interventions. We sought to evaluate the utility of a similar method in adding further insight into the surgical decision-making process. In this article, we propose a simple model to compare the value of surgery vs palliative care, similar to QALY. This model includes and adjusts for the quality and the quantity of life, in addition to the risk of POM, in the decision-making process for high-risk patients.
The Model
The 2 decision pathways, surgery and palliative care, are compared for their value. We define the value as the product of QOL and DOL in each pathway and use the severity of the symptoms as a surrogate for QOL. If duration and quality were depicted on the x and y axes of a graph (Figure 1), then the area under the curve would represent the collective value in each situation. Figure 2 shows the timeline and the different pathways with each decision. The value in each situation is calculated in relation to the full value, which is represented as the value of normal life (Vn), that is, life without disease and with normal life expectancy. The values of each decision pathway, the value of surgery (Vs) and the value of palliation (Vp), are then compared to define the benefit for each decision as follows:
If Vs/Vp > 1, the benefit is toward surgery;
If Vs/Vp < 1, the benefit is for palliative care.
Definitions
Both quality and duration of life are presented on a 1-10 scale, 1 being the lowest and 10 the highest value, to yield a product with a value of 100 in normal, disease-free life. Any lower value is presented as a percentage to represent the comparison to the full value. QOL is determined by degradation of full quality with the average level of symptoms. DOL is calculated as a lost time (
For the DOL under any condition, a 10-year survival rate could be used as a surrogate in this formula. Compared to life expectancy value, using the 10-year survival rate simplifies the calculation since cardiac diseases are more prevalent in older age, close to or beyond the average life expectancy value.
Using the time intervals from the timeline in Figure 2:
dh = time interval from diagnosis to death at life expectancy
dg = time interval from diagnosis to death after successful surgery
df = time interval from diagnosis to death after palliative care
Duration for palliative care:
Duration for surgery:
Adjustment: This value is calculated for those who survive the surgery. To adjust for the POM, it is multiplied by the 100 − POM risk.
Since value is the base for comparison in this model, and it is the product of 2 equally important factors in the formula (
After elimination of normal life expectancy, form the numerator and denominator:
To adjust for surgical outcomes in special circumstances where less than optimal or standard surgical results are expected (eg, in very rare surgeries, limited resource institutions, or suboptimal postoperative surgical care), an optional coefficient R can be added to the numerator (surgical value). This optional coefficient, with values such as 0.8, 0.9 (to degrade the value of surgery) or 1 (standard surgical outcome), adjusts for variability in interinstitutional surgical results or surgeon variability. No coefficient is added to the denominator since palliative care provides minimal differences between clinicians and hospitals. Thus, the final adjusted formula would be as follows:
Example
A 60-year-old patient with a 10% POM risk needs to be allocated to surgical or palliative care. With palliative care, if this patient lived 6 years with average symptoms grade 4, the Vp would be 20; that is, 20% of the normal life value (if he lived 18 years instead without the disease).
Using the formula for calculation of value in each pathway:
If the same patient undergoes a surgery with a 10% risk of POM, with an average grade 2 related to surgical recovery symptoms for 1 year and then is symptom-free and lives 12 years (instead of 18 years [life expectancy]), his Vs would be 53, or 53% out of the normal life value that is saved if the surgery is 100% successful; adjusted Vs with (chance of survival of 90%) would be 53 × 90% = 48%.
With adjustment of 90% survival chance in surgery, 53 × 90% = 48%. In this example, Vs/Vp = 48/20 = 2.4, showing a significant benefit for surgical care. Notably, the unknown value of normal life expectancy is not needed for the calculation of Vs/Vp, since it is the same in both pathways and it is eliminated by calculation in fraction.
Based on this formula, since the duration of surgical symptoms is short, no matter how severe these are, if the potential duration of life after surgery is high (represented by smaller area under the curve in Figure 1), the numerator becomes larger and the value of the surgery grows. For example, if a patient with a 15% risk of POM, which is generally considered inoperable, lives 5 years, as opposed to 2 years with palliative care with mild symptoms (eg 3/10), Vs/Vp would be 2.7, still showing a significant benefit for surgical care.
Discussion
Any surgical intervention is offered with 2 goals in mind, improving QOL and extending DOL. In a high-risk patient, surgery might be declined due to a high risk of POM, and the patient is offered palliative care, which other than providing symptom relief does not change the course of disease and eventually the patient will die due to the untreated disease. In this decision-making method, mostly completed by a care team only, a potential risk of death due to surgery which possibly could cure the patient is traded for immediate survival; however, the symptomatic course ensues until death. This mostly unilateral decision-making process by a care team, which incorporates minimal input from the patient or ignores patient preferences altogether, is based only on POM risk, and roughly includes a single parameter: years of potential life lost (YPLL). YPLL is a measure of premature mortality, and in the setting of surgical intervention, YPLL is the number of years a patient would lose unless a successful surgery were undertaken. Obviously, patients would live longer if a surgery that was intended to save them failed.
In this article, we proposed a simple method to quantify each decision to decide whether to operate or choose surgical care vs palliative care. Since quality and duration of life are both end factors clinicians and patients aspire to in each decision, they can be considered together as the value of each decision. We believe a numerical framework would provide an objective way to assist both the patient at high risk and the care team in the decision-making process.
The 2 parameters we consider are DOL and QOL. DOL, or survival, can be extracted from large-scale data using statistical methods that have been developed to predict survival under various conditions, such as Kaplan-Meier curves. These methods present the chance of survival in percentages in a defined time frame, such as a 5- or 10-year period.
While the DOL is a numerical parameter and quantifiable, the QOL is a more complex entity. This subjective parameter bears multiple definitions, aspects, and categories, and therefore multiple scales for quantification of QOL have been proposed. These scales have been used extensively for the purpose of health determination in health care policy and economic planning. Most scales acknowledge that QOL is multifactorial and includes interrelated aspects such as mental and socioeconomic factors. We have also noticed that QOL is better determined by the palliative care team than surgeons, so including these care providers in the decision-making process might reduce surgeon bias.
Since our purpose here is only to assist with the decision on medical intervention, we focus on physical QOL. Multiple scales are used to assess health-related QOL, such as the Assessment of Quality of Life (AQoL)-8D,7 EuroQol-5 Dimension (EQ-5D),8 15D,9 and the 36-Item Short Form Survey (SF-36).10 These complex scales are built for systematic reviews, and they are not practical for a clinical user. To simplify and keep this practical, we define QOL by using the severity or grade of symptoms related to the disease the patient has on a scale of 0 to 10. The severity of symptoms can be easily determined using available scales. An applicable scale for this purpose is the Edmonton Symptom Assessment Scale (ESAS), which has been in use for years and has evolved as a useful tool in the medical field.11
Once DOL and QOL are determined on a 1-10 scale, the multiplied value then provides a product that we consider a value. The highest value hoped for in each decision is the achievement of the best QOL and DOL, a value of 100. In Figure 1, a graphic presentation of value in each decision is best seen as the area under the curve. As shown, a successful surgery, even when accompanied by significant symptoms during initial recovery, has a chance (100 – risk of POM%) to gain a larger area under curve (value) by achieving a longer life with no or fewer symptoms. However, in palliative care, progressing disease and even palliated symptoms with a shorter life expectancy impose a large burden on the patient and a much lower value. Note that in this calculation, life expectancy, which is an important but unpredictable factor, is initially included; however, by ratio comparison, it is eliminated, simplifying the calculation further.
Using this formula in different settings reveals that high-risk surgery has a greater potential to reduce YPLL in the general population. Based on this formula, compared to a surgery with potential to significantly extend DOL, a definite shorter and symptomatic life course with palliative care makes it a significantly less favorable option. In fact, in the cardiovascular field, palliative care has minimal or no effect on natural history, as the mechanism of illness is mechanical, such as occlusion of coronary arteries or valve dysfunction, leading eventually to heart failure and death. In a study by Xu et al, although palliative care reduced readmission rates and improved symptoms on a variety of scales, there was no effect on mortality and QOL in patients with heart failure.12
No model in this field has proven to be ideal, and this model bears multiple limitations as well. We have used severity of symptoms as a surrogate for QOL based on the fact that cardiac patients with different pathologies who are untreated will have a common final pathway with development of heart failure symptoms that dictate their QOL. Also, grading QOL is a difficult task at times. Even a model such as QALY, which is one of the most used, is not a perfect model and is not free of problems.6 The difference in surgical results and life expectancy between sexes and ethnic groups might be a source of bias in this formula. Also, multiple factors directly and indirectly affect QOL and DOL and create inaccuracies; therefore, making an exact science from an inexact one naturally relies on multiple assumptions. Although it has previously been shown that most POM occurs in a short period of time after cardiac surgery,13 long-term complications that potentially degrade QOL are not included in this model. By applying this model, one must assume indefinite economic resources. Moreover, applying a single mathematical model in a biologic system and in the general population has intrinsic shortcomings, and it must overlook many other factors (eg, ethical, legal). For example, it will be hard to justify a failed surgery with 15% risk of POM undertaken to eliminate the severe long-lasting symptoms of a disease, while the outcome of a successful surgery with a 20% risk of POM that adds life and quality would be ignored in the current health care system. Thus, regardless of the significant potential, most surgeons would waive a surgery based solely on the percentage rate of POM, perhaps using other terms such as ”peri-nonoperative mortality.”
Conclusion
We have proposed a simple and practical formula for decision making regarding surgical vs palliative care in high-risk patients. By assigning a value that is composed of QOL and DOL in each pathway and including the risk of POM, a ratio of values provides a numerical estimation that can be used to show preference over a specific decision. An advantage of this formula, in addition to presenting an arithmetic value that is easier to understand, is that it can be used in shared decision making with patients. We emphasize that this model is only a preliminary concept at this time and has not been tested or validated for clinical use. Validation of such a model will require extensive work and testing within a large-scale population. We hope that this article will serve as a starting point for the development of other models, and that this formula will become more sophisticated with fewer limitations through larger multidisciplinary efforts in the future.
Corresponding author: Rabin Gerrah, MD, Good Samaritan Regional Medical Center, 3640 NW Samaritan Drive, Suite 100B, Corvallis, OR 97330; rgerrah@stanford.edu.
Disclosures: None reported.
1. O’Brien SM, Feng L, He X, et al. The Society of Thoracic Surgeons 2018 Adult Cardiac Surgery Risk Models: Part 2-statistical methods and results. Ann Thorac Surg. 2018;105(5):1419-1428. doi: 10.1016/j.athoracsur.2018.03.003
2. Hurtado Rendón IS, Bittenbender P, Dunn JM, Firstenberg MS. Chapter 8: Diagnostic workup and evaluation: eligibility, risk assessment, FDA guidelines. In: Transcatheter Heart Valve Handbook: A Surgeons’ and Interventional Council Review. Akron City Hospital, Summa Health System, Akron, OH.
3. Herrmann HC, Thourani VH, Kodali SK, et al; PARTNER Investigators. One-year clinical outcomes with SAPIEN 3 transcatheter aortic valve replacement in high-risk and inoperable patients with severe aortic stenosis. Circulation. 2016;134:130-140. doi:10.1161/CIRCULATIONAHA
4. Ho C, Argáez C. Transcatheter Aortic Valve Implantation for Patients with Severe Aortic Stenosis at Various Levels of Surgical Risk: A Review of Clinical Effectiveness. Ottawa (ON): Canadian Agency for Drugs and Technologies in Health; March 19, 2018.
5. Rios-Diaz AJ, Lam J, Ramos MS, et al. Global patterns of QALY and DALY use in surgical cost-utility analyses: a systematic review. PLoS One. 2016:10;11:e0148304. doi:10.1371/journal.pone.0148304
6. Prieto L, Sacristán JA. Health, Problems and solutions in calculating quality-adjusted life years (QALYs). Qual Life Outcomes. 2003:19;1:80.
7. Centre for Health Economics. Assessment of Quality of Life. 2014. Accessed May 13, 2022. http://www.aqol.com.au/
8. EuroQol Research Foundation. EQ-5D. Accessed May 13, 2022. https://euroqol.org/
9. 15D Instrument. Accessed May 13, 2022. http://www.15d-instrument.net/15d/
10. Rand Corporation. 36-Item Short Form Survey (SF-36).Accessed May 12, 2022. https://www.rand.org/health-care/surveys_tools/mos/36-item-short-form.html
11. Hui D, Bruera E. The Edmonton Symptom Assessment System 25 years later: past, present, and future developments. J Pain Symptom Manage. 2017:53:630-643. doi:10.1016/j.jpainsymman.2016
12. Xu Z, Chen L, Jin S, Yang B, Chen X, Wu Z. Effect of palliative care for patients with heart failure. Int Heart J. 2018:30;59:503-509. doi:10.1536/ihj.17-289
13. Mazzeffi M, Zivot J, Buchman T, Halkos M. In-hospital mortality after cardiac surgery: patient characteristics, timing, and association with postoperative length of intensive care unit and hospital stay. Ann Thorac Surg. 2014;97:1220-1225. doi:10.1016/j.athoracsur.2013.10.040
Coronary CT Angiography Compared to Coronary Angiography or Standard of Care in Patients With Intermediate-Risk Stable Chest Pain
Study 1 Overview (SCOT-HEART Investigators)
Objective: To assess cardiovascular mortality and nonfatal myocardial infarction at 5 years in patients with stable chest pain referred to cardiology clinic for management with either standard care plus computed tomography angiography (CTA) or standard care alone.
Design: Multicenter, randomized, open-label prospective study.
Setting and participants: A total of 4146 patients with stable chest pain were randomized to standard care or standard care plus CTA at 12 centers across Scotland and were followed for 5 years.
Main outcome measures: The primary end point was a composite of death from coronary heart disease or nonfatal myocardial infarction. Main secondary end points were nonfatal myocardial infarction, nonfatal stroke, and frequency of invasive coronary angiography (ICA) and coronary revascularization with percutaneous coronary intervention or coronary artery bypass grafting.
Main results: The primary outcome including the composite of cardiovascular death or nonfatal myocardial infarction was lower in the CTA group than in the standard-care group at 2.3% (48 of 2073 patients) vs 3.9% (81 of 2073 patients), respectively (hazard ratio, 0.59; 95% CI, 0.41-0.84; P = .004). Although there was a higher rate of ICA and coronary revascularization in the CTA group than in the standard-care group in the first few months of follow-up, the overall rates were similar at 5 years, with ICA performed in 491 patients and 502 patients in the CTA vs standard-care groups, respectively (hazard ratio, 1.00; 95% CI, 0.88-1.13). Similarly, coronary revascularization was performed in 279 patients in the CTA group and in 267 patients in the standard-care group (hazard ratio, 1.07; 95% CI, 0.91-1.27). There were, however, more preventive therapies initiated in patients in the CTA group than in the standard-care group (odds ratio, 1.40; 95% CI, 1.19-1.65).
Conclusion: In patients with stable chest pain, the use of CTA in addition to standard care resulted in a significantly lower rate of death from coronary heart disease or nonfatal myocardial infarction at 5 years; the main contributor to this outcome was a reduced nonfatal myocardial infarction rate. There was no difference in the rate of coronary angiography or coronary revascularization between the 2 groups at 5 years.
Study 2 Overview (DISCHARGE Trial Group)
Objective: To compare the effectiveness of computed tomography (CT) with ICA as a diagnostic tool in patients with stable chest pain and intermediate pretest probability of coronary artery disease (CAD).
Design: Multicenter, randomized, assessor-blinded pragmatic prospective study.
Setting and participants: A total of 3667 patients with stable chest pain and intermediate pretest probability of CAD were enrolled at 26 centers and randomized into CT or ICA groups. Only 3561 patients were included in the modified intention-to-treat analysis, with 1808 patients and 1753 patients in the CT and ICA groups, respectively.
Main outcome measures: The primary outcome was a composite of cardiovascular death, nonfatal myocardial infarction, and nonfatal stroke over 3.5 years. The main secondary outcomes were major procedure-related complications and patient-reported angina pectoris during the last 4 weeks of follow up.
Main results: The primary outcome occurred in 38 of 1808 patients (2.1%) in the CT group and in 52 of 1753 patients (3.0%) in the ICA group (hazard ratio, 0.70; 95% CI, 0.46-1.07; P = .10). The secondary outcomes showed that major procedure-related complications occurred in 9 patients (0.5%) in the CT group and in 33 patients (1.9%) in the ICA group (hazard ratio, 0.26; 95% CI, 0.13-0.55). Rates of patient-reported angina in the final 4 weeks of follow-up were 8.8% in the CT group and 7.5% in the ICA group (odds ratio, 1.17; 95% CI, 0.92-1.48).
Conclusion: Risk of major adverse cardiovascular events from the primary outcome were similar in both the CT and ICA groups among patients with stable chest pain and intermediate pretest probability of CAD. Patients referred for CT had a lower rate of coronary angiography leading to fewer major procedure-related complications in these patients than in those referred for ICA.
Commentary
Evaluation and treatment of obstructive atherosclerosis is an important part of clinical care in patients presenting with angina symptoms.1 Thus, the initial investigation for patients with suspected obstructive CAD includes ruling out acute coronary syndrome and assessing quality of life.1 The diagnostic test should be tailored to the pretest probability for the diagnosis of obstructive CAD.2
In the United States, stress testing traditionally has been used for the initial assessment in patients with suspected CAD,3 but recently CTA has been utilized more frequently for this purpose. Compared to a stress test, which often helps identify and assess ischemia, CTA can provide anatomical assessment, with higher sensitivity to identify CAD.4 Furthermore, it can distinguish nonobstructive plaques that can be challenging to identify with stress test alone.
Whether CTA is superior to stress testing as the initial assessment for CAD has been debated. The randomized PROMISE trial compared patients with stable angina who underwent functional stress testing or CTA as an initial strategy.5 They reported a similar outcome between the 2 groups at a median follow-up of 2 years. However, in the original SCOT-HEART trial (CT coronary angiography in patients with suspected angina due to coronary heart disease), which was published in the same year as the PROMISE trial, the patients who underwent initial assessment with CTA had a numerically lower composite end point of cardiac death and myocardial infarction at a median follow-up of 1.7 years (1.3% vs 2.0%, P = .053).6
Given this result, the SCOT-HEART investigators extended the follow-up to evaluate the composite end point of death from coronary heart disease or nonfatal myocardial infarction at 5 years.7 This trial enrolled patients who were initially referred to a cardiology clinic for evaluation of chest pain, and they were randomized to standard care plus CTA or standard care alone. At a median duration of 4.8 years, the primary outcome was lower in the CTA group (2.3%, 48 patients) than in the standard-care group (3.9%, 81 patients) (hazard ratio, 0.58; 95% CI, 0.41-0.84; P = .004). Both groups had similar rates of invasive coronary angiography and had similar coronary revascularization rates.
It is hypothesized that this lower rate of nonfatal myocardial infarction in patients with CTA plus standard care is associated with a higher rate of preventive therapies initiated in patients in the CTA-plus-standard-care group compared to standard care alone. However, the difference in the standard-care group should be noted when compared to the PROMISE trial. In the PROMISE trial, the comparator group had predominantly stress imaging (either nuclear stress test or echocardiography), while in the SCOT-HEART trial, the group had predominantly stress electrocardiogram (ECG), and only 10% of the patients underwent stress imaging. It is possible the difference seen in the rate of nonfatal myocardial infarction was due to suboptimal diagnosis of CAD with stress ECG, which has lower sensitivity compared to stress imaging.
The DISCHARGE trial investigated the effectiveness of CTA vs ICA as the initial diagnostic test in the management of patients with stable chest pain and an intermediate pretest probability of obstructive CAD.8 At 3.5 years of follow-up, the primary composite of cardiovascular death, myocardial infarction, or stroke was similar in both groups (2.1% vs 3.0; hazard ratio, 0.70; 95% CI, 0.46-1.07; P = .10). Importantly, as fewer patients underwent ICA, the risk of procedure-related complication was lower in the CTA group than in the ICA group. However, it is important to note that only 25% of the patients diagnosed with obstructive CAD had greater than 50% vessel stenosis, which raises the question of whether an initial invasive strategy is appropriate for this population.
The strengths of these 2 studies include the large number of patients enrolled along with adequate follow-up, 5 years in the SCOT-HEART trial and 3.5 years in the DISCHARGE trial. The 2 studies overall suggest the usefulness of CTA for assessment of CAD. However, the control groups were very different in these 2 trials. In the SCOT-HEART study, the comparator group was primarily assessed by stress ECG, while in the DISCHARGE study, the comparator group was primary assessed by ICA. In the PROMISE trial, the composite end point of death, myocardial infarction, hospitalization for unstable angina, or major procedural complication was similar when the strategy of initial CTA was compared to functional testing with imaging (exercise ECG, nuclear stress testing, or echocardiography).5 Thus, clinical assessment is still needed when clinicians are selecting the appropriate diagnostic test for patients with suspected CAD. The most recent guidelines give similar recommendations for CTA compared to stress imaging.9 Whether further improvement in CTA acquisition or the addition of CT fractional flow reserve can further improve outcomes requires additional study.
Applications for Clinical Practice and System Implementation
In patients with stable chest pain and intermediate pretest probability of CAD, CTA is useful in diagnosis compared to stress ECG and in reducing utilization of low-yield ICA. Whether CTA is more useful compared to the other noninvasive stress imaging modalities in this population requires further study.
Practice Points
- In patients with stable chest pain and intermediate pretest probability of CAD, CTA is useful compared to stress ECG.
- Use of CTA can potentially reduce the use of low-yield coronary angiography.
–Thai Nguyen, MD, Albert Chan, MD, Taishi Hirai, MD
University of Missouri, Columbia, MO
1. Knuuti J, Wijns W, Saraste A, et al. 2019 ESC Guidelines for the diagnosis and management of chronic coronary syndromes. Eur Heart J. 2020;41(3):407-477. doi:10.1093/eurheartj/ehz425
2. Nakano S, Kohsaka S, Chikamori T et al. JCS 2022 guideline focused update on diagnosis and treatment in patients with stable coronary artery disease. Circ J. 2022;86(5):882-915. doi:10.1253/circj.CJ-21-1041.
3. Fihn SD, Gardin JM, Abrams J, et al. 2012 ACCF/AHA/ACP/AATS/PCNA/SCAI/STS Guideline for the diagnosis and management of patients with stable ischemic heart disease: a report of the American College of Cardiology Foundation/American Heart Association Task Force on Practice Guidelines, and the American College of Physicians, American Association for Thoracic Surgery, Preventive Cardiovascular Nurses Association, Society for Cardiovascular Angiography and Interventions, and Society of Thoracic Surgeons. J Am Coll Cardiol. 2012;60(24):e44-e164. doi:10.1016/j.jacc.2012.07.013
4. Arbab-Zadeh A, Di Carli MF, Cerci R, et al. Accuracy of computed tomographic angiography and single-photon emission computed tomography-acquired myocardial perfusion imaging for the diagnosis of coronary artery disease. Circ Cardiovasc Imaging. 2015;8(10):e003533. doi:10.1161/CIRCIMAGING
5. Douglas PS, Hoffmann U, Patel MR, et al. Outcomes of anatomical versus functional testing for coronary artery disease. N Engl J Med. 2015;372(14):1291-300. doi:10.1056/NEJMoa1415516
6. SCOT-HEART investigators. CT coronary angiography in patients with suspected angina due to coronary heart disease (SCOT-HEART): an open-label, parallel-group, multicentre trial. Lancet. 2015;385:2383-2391. doi:10.1016/S0140-6736(15)60291-4
7. SCOT-HEART Investigators, Newby DE, Adamson PD, et al. Coronary CT angiography and 5-year risk of myocardial infarction. N Engl J Med. 2018;379(10):924-933. doi:10.1056/NEJMoa1805971
8. DISCHARGE Trial Group, Maurovich-Horvat P, Bosserdt M, et al. CT or invasive coronary angiography in stable chest pain. N Engl J Med. 2022;386(17):1591-1602. doi:10.1056/NEJMoa2200963
9. Writing Committee Members, Lawton JS, Tamis-Holland JE, et al. 2021 ACC/AHA/SCAI guideline for coronary artery revascularization: a report of the American College of Cardiology/American Heart Association Joint Committee on Clinical Practice Guidelines. J Am Coll Cardiol. 2022;79(2):e21-e129. doi:10.1016/j.jacc.2021.09.006
Study 1 Overview (SCOT-HEART Investigators)
Objective: To assess cardiovascular mortality and nonfatal myocardial infarction at 5 years in patients with stable chest pain referred to cardiology clinic for management with either standard care plus computed tomography angiography (CTA) or standard care alone.
Design: Multicenter, randomized, open-label prospective study.
Setting and participants: A total of 4146 patients with stable chest pain were randomized to standard care or standard care plus CTA at 12 centers across Scotland and were followed for 5 years.
Main outcome measures: The primary end point was a composite of death from coronary heart disease or nonfatal myocardial infarction. Main secondary end points were nonfatal myocardial infarction, nonfatal stroke, and frequency of invasive coronary angiography (ICA) and coronary revascularization with percutaneous coronary intervention or coronary artery bypass grafting.
Main results: The primary outcome including the composite of cardiovascular death or nonfatal myocardial infarction was lower in the CTA group than in the standard-care group at 2.3% (48 of 2073 patients) vs 3.9% (81 of 2073 patients), respectively (hazard ratio, 0.59; 95% CI, 0.41-0.84; P = .004). Although there was a higher rate of ICA and coronary revascularization in the CTA group than in the standard-care group in the first few months of follow-up, the overall rates were similar at 5 years, with ICA performed in 491 patients and 502 patients in the CTA vs standard-care groups, respectively (hazard ratio, 1.00; 95% CI, 0.88-1.13). Similarly, coronary revascularization was performed in 279 patients in the CTA group and in 267 patients in the standard-care group (hazard ratio, 1.07; 95% CI, 0.91-1.27). There were, however, more preventive therapies initiated in patients in the CTA group than in the standard-care group (odds ratio, 1.40; 95% CI, 1.19-1.65).
Conclusion: In patients with stable chest pain, the use of CTA in addition to standard care resulted in a significantly lower rate of death from coronary heart disease or nonfatal myocardial infarction at 5 years; the main contributor to this outcome was a reduced nonfatal myocardial infarction rate. There was no difference in the rate of coronary angiography or coronary revascularization between the 2 groups at 5 years.
Study 2 Overview (DISCHARGE Trial Group)
Objective: To compare the effectiveness of computed tomography (CT) with ICA as a diagnostic tool in patients with stable chest pain and intermediate pretest probability of coronary artery disease (CAD).
Design: Multicenter, randomized, assessor-blinded pragmatic prospective study.
Setting and participants: A total of 3667 patients with stable chest pain and intermediate pretest probability of CAD were enrolled at 26 centers and randomized into CT or ICA groups. Only 3561 patients were included in the modified intention-to-treat analysis, with 1808 patients and 1753 patients in the CT and ICA groups, respectively.
Main outcome measures: The primary outcome was a composite of cardiovascular death, nonfatal myocardial infarction, and nonfatal stroke over 3.5 years. The main secondary outcomes were major procedure-related complications and patient-reported angina pectoris during the last 4 weeks of follow up.
Main results: The primary outcome occurred in 38 of 1808 patients (2.1%) in the CT group and in 52 of 1753 patients (3.0%) in the ICA group (hazard ratio, 0.70; 95% CI, 0.46-1.07; P = .10). The secondary outcomes showed that major procedure-related complications occurred in 9 patients (0.5%) in the CT group and in 33 patients (1.9%) in the ICA group (hazard ratio, 0.26; 95% CI, 0.13-0.55). Rates of patient-reported angina in the final 4 weeks of follow-up were 8.8% in the CT group and 7.5% in the ICA group (odds ratio, 1.17; 95% CI, 0.92-1.48).
Conclusion: Risk of major adverse cardiovascular events from the primary outcome were similar in both the CT and ICA groups among patients with stable chest pain and intermediate pretest probability of CAD. Patients referred for CT had a lower rate of coronary angiography leading to fewer major procedure-related complications in these patients than in those referred for ICA.
Commentary
Evaluation and treatment of obstructive atherosclerosis is an important part of clinical care in patients presenting with angina symptoms.1 Thus, the initial investigation for patients with suspected obstructive CAD includes ruling out acute coronary syndrome and assessing quality of life.1 The diagnostic test should be tailored to the pretest probability for the diagnosis of obstructive CAD.2
In the United States, stress testing traditionally has been used for the initial assessment in patients with suspected CAD,3 but recently CTA has been utilized more frequently for this purpose. Compared to a stress test, which often helps identify and assess ischemia, CTA can provide anatomical assessment, with higher sensitivity to identify CAD.4 Furthermore, it can distinguish nonobstructive plaques that can be challenging to identify with stress test alone.
Whether CTA is superior to stress testing as the initial assessment for CAD has been debated. The randomized PROMISE trial compared patients with stable angina who underwent functional stress testing or CTA as an initial strategy.5 They reported a similar outcome between the 2 groups at a median follow-up of 2 years. However, in the original SCOT-HEART trial (CT coronary angiography in patients with suspected angina due to coronary heart disease), which was published in the same year as the PROMISE trial, the patients who underwent initial assessment with CTA had a numerically lower composite end point of cardiac death and myocardial infarction at a median follow-up of 1.7 years (1.3% vs 2.0%, P = .053).6
Given this result, the SCOT-HEART investigators extended the follow-up to evaluate the composite end point of death from coronary heart disease or nonfatal myocardial infarction at 5 years.7 This trial enrolled patients who were initially referred to a cardiology clinic for evaluation of chest pain, and they were randomized to standard care plus CTA or standard care alone. At a median duration of 4.8 years, the primary outcome was lower in the CTA group (2.3%, 48 patients) than in the standard-care group (3.9%, 81 patients) (hazard ratio, 0.58; 95% CI, 0.41-0.84; P = .004). Both groups had similar rates of invasive coronary angiography and had similar coronary revascularization rates.
It is hypothesized that this lower rate of nonfatal myocardial infarction in patients with CTA plus standard care is associated with a higher rate of preventive therapies initiated in patients in the CTA-plus-standard-care group compared to standard care alone. However, the difference in the standard-care group should be noted when compared to the PROMISE trial. In the PROMISE trial, the comparator group had predominantly stress imaging (either nuclear stress test or echocardiography), while in the SCOT-HEART trial, the group had predominantly stress electrocardiogram (ECG), and only 10% of the patients underwent stress imaging. It is possible the difference seen in the rate of nonfatal myocardial infarction was due to suboptimal diagnosis of CAD with stress ECG, which has lower sensitivity compared to stress imaging.
The DISCHARGE trial investigated the effectiveness of CTA vs ICA as the initial diagnostic test in the management of patients with stable chest pain and an intermediate pretest probability of obstructive CAD.8 At 3.5 years of follow-up, the primary composite of cardiovascular death, myocardial infarction, or stroke was similar in both groups (2.1% vs 3.0; hazard ratio, 0.70; 95% CI, 0.46-1.07; P = .10). Importantly, as fewer patients underwent ICA, the risk of procedure-related complication was lower in the CTA group than in the ICA group. However, it is important to note that only 25% of the patients diagnosed with obstructive CAD had greater than 50% vessel stenosis, which raises the question of whether an initial invasive strategy is appropriate for this population.
The strengths of these 2 studies include the large number of patients enrolled along with adequate follow-up, 5 years in the SCOT-HEART trial and 3.5 years in the DISCHARGE trial. The 2 studies overall suggest the usefulness of CTA for assessment of CAD. However, the control groups were very different in these 2 trials. In the SCOT-HEART study, the comparator group was primarily assessed by stress ECG, while in the DISCHARGE study, the comparator group was primary assessed by ICA. In the PROMISE trial, the composite end point of death, myocardial infarction, hospitalization for unstable angina, or major procedural complication was similar when the strategy of initial CTA was compared to functional testing with imaging (exercise ECG, nuclear stress testing, or echocardiography).5 Thus, clinical assessment is still needed when clinicians are selecting the appropriate diagnostic test for patients with suspected CAD. The most recent guidelines give similar recommendations for CTA compared to stress imaging.9 Whether further improvement in CTA acquisition or the addition of CT fractional flow reserve can further improve outcomes requires additional study.
Applications for Clinical Practice and System Implementation
In patients with stable chest pain and intermediate pretest probability of CAD, CTA is useful in diagnosis compared to stress ECG and in reducing utilization of low-yield ICA. Whether CTA is more useful compared to the other noninvasive stress imaging modalities in this population requires further study.
Practice Points
- In patients with stable chest pain and intermediate pretest probability of CAD, CTA is useful compared to stress ECG.
- Use of CTA can potentially reduce the use of low-yield coronary angiography.
–Thai Nguyen, MD, Albert Chan, MD, Taishi Hirai, MD
University of Missouri, Columbia, MO
1. Knuuti J, Wijns W, Saraste A, et al. 2019 ESC Guidelines for the diagnosis and management of chronic coronary syndromes. Eur Heart J. 2020;41(3):407-477. doi:10.1093/eurheartj/ehz425
2. Nakano S, Kohsaka S, Chikamori T et al. JCS 2022 guideline focused update on diagnosis and treatment in patients with stable coronary artery disease. Circ J. 2022;86(5):882-915. doi:10.1253/circj.CJ-21-1041.
3. Fihn SD, Gardin JM, Abrams J, et al. 2012 ACCF/AHA/ACP/AATS/PCNA/SCAI/STS Guideline for the diagnosis and management of patients with stable ischemic heart disease: a report of the American College of Cardiology Foundation/American Heart Association Task Force on Practice Guidelines, and the American College of Physicians, American Association for Thoracic Surgery, Preventive Cardiovascular Nurses Association, Society for Cardiovascular Angiography and Interventions, and Society of Thoracic Surgeons. J Am Coll Cardiol. 2012;60(24):e44-e164. doi:10.1016/j.jacc.2012.07.013
4. Arbab-Zadeh A, Di Carli MF, Cerci R, et al. Accuracy of computed tomographic angiography and single-photon emission computed tomography-acquired myocardial perfusion imaging for the diagnosis of coronary artery disease. Circ Cardiovasc Imaging. 2015;8(10):e003533. doi:10.1161/CIRCIMAGING
5. Douglas PS, Hoffmann U, Patel MR, et al. Outcomes of anatomical versus functional testing for coronary artery disease. N Engl J Med. 2015;372(14):1291-300. doi:10.1056/NEJMoa1415516
6. SCOT-HEART investigators. CT coronary angiography in patients with suspected angina due to coronary heart disease (SCOT-HEART): an open-label, parallel-group, multicentre trial. Lancet. 2015;385:2383-2391. doi:10.1016/S0140-6736(15)60291-4
7. SCOT-HEART Investigators, Newby DE, Adamson PD, et al. Coronary CT angiography and 5-year risk of myocardial infarction. N Engl J Med. 2018;379(10):924-933. doi:10.1056/NEJMoa1805971
8. DISCHARGE Trial Group, Maurovich-Horvat P, Bosserdt M, et al. CT or invasive coronary angiography in stable chest pain. N Engl J Med. 2022;386(17):1591-1602. doi:10.1056/NEJMoa2200963
9. Writing Committee Members, Lawton JS, Tamis-Holland JE, et al. 2021 ACC/AHA/SCAI guideline for coronary artery revascularization: a report of the American College of Cardiology/American Heart Association Joint Committee on Clinical Practice Guidelines. J Am Coll Cardiol. 2022;79(2):e21-e129. doi:10.1016/j.jacc.2021.09.006
POISE-3 backs wider use of tranexamic acid in noncardiac surgery
The antifibrinolytic tranexamic acid (TXA) reduced serious bleeding without a significant effect on major vascular outcomes in patients undergoing noncardiac surgery at risk for these complications in the POISE-3 trial.
TXA cut the primary efficacy outcome of life-threatening, major, and critical organ bleeding at 30 days by 24% compared with placebo (9.1% vs. 11.7%; hazard ratio [HR], 0.76; P < .0001).
The primary safety outcome of myocardial injury after noncardiac surgery (MINS), nonhemorrhagic stroke, peripheral arterial thrombosis, and symptomatic proximal venous thromboembolism (VTE) at 30 days occurred in 14.2% vs.. 13.9% of patients, respectively (HR, 1.023). This failed, however, to meet the study›s threshold to prove TXA noninferior to placebo (one-sided P = .044).
There was no increased risk for death or stroke with TXA, according to results published April 2 in the New England Journal of Medicine.
Principal investigator P.J. Devereaux, MD, PhD, Population Health Research Institute and McMaster University, Hamilton, Ontario, Canada, pointed out that there is only a 4.4% probability that the composite vascular outcome hazard ratio was above the noninferiority margin and that just 10 events separated the two groups (649 vs.. 639).
“Healthcare providers and patients will have to weigh a clear beneficial reduction in the composite bleeding outcome, which is an absolute difference of 2.7%, a result that was highly statistically significant, versus a low probability of a small increase in risk of the composite vascular endpoint, with an absolute difference of 0.3%,” a nonsignificant result, Dr. Devereaux said during the formal presentation of the results at the hybrid annual scientific sessions of the American College of Cardiology.
The findings, he said, should also be put in the context that 300 million adults have a major surgery each year worldwide and most don’t receive TXA. At the same time, there’s an annual global shortage of 30 million blood product units, and surgical bleeding accounts for up to 40% of all transfusions.
“POISE-3 identifies that use of TXA could avoid upwards of 8 million bleeding events resulting in transfusion on an annual basis, indicating potential for large public health and clinical benefit if TXA become standard practice in noncardiac surgery,” Dr. Devereaux said during the late-breaking trial session.
TXA is indicated for heavy menstrual bleeding and hemophilia and has been used in cardiac surgery, but it is increasingly being used in noncardiac surgeries. As previously reported, POISE showed that the beta-blocker metoprolol lowered the risk for myocardial infarction (MI) but increased the risk for severe stroke and overall death, whereas in POISE-2, perioperative low-dose aspirin lowered the risk for MI but was linked to more major bleeding.
The cumulative data have not shown an increased risk for thrombotic events in other settings, Dr. Devereaux told this news organization.
“I’m a cardiologist, and I think that we’ve been guilty at times of always only focusing on the thrombotic side of the equation and ignoring that bleeding is a very important aspect of the circulatory system,” he said. “And I think this shows for the first time clear unequivocal evidence that there’s a cheap, very encouraging, safe way to prevent this.”
“An important point is that if you can give tranexamic acid and prevent bleeding in your cardiac patients having noncardiac surgery, then you can prevent the delay of reinitiating their anticoagulants and their antiplatelets after surgery and getting them back on the medications that are important for them to prevent their cardiovascular event,” Dr. Devereaux added.
Discussant Michael J. Mack, MD, commented that TXA, widely used in cardiac surgery, is an old, inexpensive drug that “should be more widely used in noncardiac surgery.” Dr. Mack, from Baylor Scott & White Health, Dallas, added that he would limit it to major noncardiac surgery.
International trial
PeriOperative ISchemic Evaluation-3 (POISE-3) investigators at 114 hospitals in 22 countries (including countries in North and South America, Europe, and Africa; Russia; India; and Australia) randomly assigned 9,535 patients, aged 45 years or older, with or at risk for cardiovascular and bleeding complications to receive a TXA 1-g intravenous bolus or placebo at the start and end of inpatient noncardiac surgery.
Patients taking at least one long-term antihypertensive medication were also randomly assigned to a perioperative hypotension- or hypertension-avoidance strategy, which differ in the use of antihypertensives on the morning of surgery and the first 2 days after surgery, and in the target mean arterial pressure during surgery. Results from these cohorts will be presented in a separate session on April 4.
The study had planned to enroll 10,000 patients but was stopped early by the steering committee because of financial constraints resulting from slow enrollment during the pandemic. The decision was made without knowledge of the trial results but with knowledge that aggregate composite bleeding and vascular outcomes were higher than originally estimated, Dr. Devereaux noted.
Among all participants, the mean age was 70 years, 56% were male, almost a third had coronary artery disease, 15% had peripheral artery disease, and 8% had a prior stroke. About 80% were undergoing major surgery. Adherence to the study medications was 96.3% in both groups.
Secondary bleeding outcomes were lower in the TXA and placebo groups, including bleeding independently associated with mortality after surgery (8.7% vs. 11.3%), life-threatening bleeding (1.6% vs. 1.7%), major bleeding (7.6% vs. 10.4%), and critical organ bleeding (0.3% vs. 0.4%).
Importantly, the TXA group had significantly lower rates of International Society on Thrombosis and Haemostasis major bleeding (6.6% vs. 8.7%; P = .0001) and the need for transfusion of 1 or more units of packed red blood cells (9.4% vs. 12.0%; P <.0001), Dr. Devereaux noted.
In terms of secondary vascular outcomes, there were no significant differences between the TXA and placebo groups in rates of MINS (12.8% vs. 12.6%), MINS not fulfilling definition of MI (both 11.5%), MI (1.4% vs. 1.1%), and the net risk-benefit outcome (a composite of vascular death and nonfatal life-threatening, major, or critical organ bleeding, MINS, stroke, peripheral arterial thrombosis, and symptomatic proximal VTE; 20.7% vs. 21.9%).
The two groups had similar rates of all-cause (1.1% vs. 1.2%) and vascular (0.5% vs. 0.6%) mortality.
There also were no significant differences in other tertiary outcomes, such as acute kidney injury (14.1% vs. 13.7%), rehospitalization for vascular reasons (1.8% vs. 1.6%), or seizures (0.2% vs. <0.1%). The latter has been a concern, with the risk reported to increase with higher doses.
Subgroup analyses
Preplanned subgroup analyses showed a benefit for TXA over placebo for the primary efficacy outcome in orthopedic and nonorthopedic surgery and in patients with hemoglobin level below 120 g/L or 120 g/L or higher, with an estimated glomerular filtration rate less than 45 mL/min/1.73 m 2 or 45 mL/min/1.73 m 2 or higher, or with an N-terminal pro– B-type natriuretic peptide level below 200 ng/L or 200 ng/L or higher.
For the primary safety outcome, the benefit favored placebo but the interaction was not statistically significant for any of the four subgroups.
A post hoc subgroup analysis also showed similar results across the major categories of surgery, including general, vascular, urologic, and gynecologic, Dr. Devereaux told this news organization.
Although TXA is commonly used in orthopedic procedures, Dr. Devereaux noted, in other types of surgeries, “it’s not used at all.” But because TXA “is so cheap, and we can apply it to a broad population, even at an economic level it looks like it’s a winner to give to almost all patients having noncardiac surgery.”
The team also recently published a risk prediction tool that can help estimate a patient’s baseline risk for bleeding.
“So just using a model, which will bring together the patient’s type of surgery and their risk factors, you can look to see, okay, this is enough risk of bleeding, I’m just going to give tranexamic acid,” he said. “We will also be doing economic analyses because blood is also not cheap.”
The study was funded by the Canadian Institutes of Health Research, National Health and Medical Research Council (Australia), and the Research Grant Council (Hong Kong). Dr. Devereaux reports research/research grants from Abbott Diagnostics, Philips Healthcare, Roche Diagnostics, and Siemens. Dr. Mack reports receiving research grants from Abbott Vascular, Edwards Lifesciences, and Medtronic.
A version of this article first appeared on Medscape.com.
FROM ACC 2022
Acute STEMI During the COVID-19 Pandemic at a Regional Hospital: Incidence, Clinical Characteristics, and Outcomes
From the Department of Medicine, Medical College of Georgia at the Augusta University-University of Georgia Medical Partnership, Athens, GA (Syed H. Ali, Syed Hyder, and Dr. Murrow), and the Department of Cardiology, Piedmont Heart Institute, Piedmont Athens Regional, Athens, GA (Dr. Murrow and Mrs. Davis).
Abstract
Objectives: The aim of this study was to describe the characteristics and in-hospital outcomes of patients with acute ST-segment elevation myocardial infarction (STEMI) during the early COVID-19 pandemic at Piedmont Athens Regional (PAR), a 330-bed tertiary referral center in Northeast Georgia.
Methods: A retrospective study was conducted at PAR to evaluate patients with acute STEMI admitted over an 8-week period during the initial COVID-19 outbreak. This study group was compared to patients admitted during the corresponding period in 2019. The primary endpoint of this study was defined as a composite of sustained ventricular arrhythmia, congestive heart failure (CHF) with pulmonary congestion, and/or in-hospital mortality.
Results: This study cohort was composed of 64 patients with acute STEMI; 30 patients (46.9%) were hospitalized during the COVID-19 pandemic. Patients with STEMI in both the COVID-19 and control groups had similar comorbidities, Killip classification score, and clinical presentations. The median (interquartile range) time from symptom onset to reperfusion (total ischemic time) increased from 99.5 minutes (84.8-132) in 2019 to 149 minutes (96.3-231.8; P = .032) in 2020. Hospitalization during the COVID-19 period was associated with an increased risk for combined in-hospital outcome (odds ratio, 3.96; P = .046).
Conclusion: Patients with STEMI admitted during the first wave of the COVID-19 outbreak experienced longer total ischemic time and increased risk for combined in-hospital outcomes compared to patients admitted during the corresponding period in 2019.
Keywords: myocardial infarction, acute coronary syndrome, hospitalization, outcomes.

The emergence of the SARS-Cov-2 virus in December 2019 caused a worldwide shift in resource allocation and the restructuring of health care systems within the span of a few months. With the rapid spread of infection, the World Health Organization officially declared a pandemic in March 2020. The pandemic led to the deferral and cancellation of in-person patient visits, routine diagnostic studies, and nonessential surgeries and procedures. This response occurred secondary to a joint effort to reduce transmission via stay-at-home mandates and appropriate social distancing.1
Alongside the reduction in elective procedures and health care visits, significant reductions in hospitalization rates due to decreases in acute ST-segment elevation myocardial infarction (STEMI) and catheterization laboratory utilization have been reported in many studies from around the world.2-7 Comprehensive data demonstrating the impact of the COVID-19 pandemic on acute STEMI patient characteristics, clinical presentation, and in-hospital outcomes are lacking. Although patients with previously diagnosed cardiovascular disease are more likely to encounter worse outcomes in the setting of COVID-19, there may also be an indirect impact of the pandemic on high-risk patients, including those without the infection.8 Several theories have been hypothesized to explain this phenomenon. One theory postulates that the fear of contracting the virus during hospitalization is great enough to prevent patients from seeking care.2 Another theory suggests that the increased utilization of telemedicine prevents exacerbation of chronic conditions and the need for hospitalization.9 Contrary to this trend, previous studies have shown an increased incidence of acute STEMI following stressful events such as natural disasters.10
The aim of this study was to describe trends pertaining to clinical characteristics and in-hospital outcomes of patients with acute STEMI during the early COVID-19 pandemic at Piedmont Athens Regional (PAR), a 330-bed tertiary referral center in Northeast Georgia.
Methods
A retrospective cohort study was conducted at PAR to evaluate patients with STEMI admitted to the cardiovascular intensive care unit over an 8-week period (March 5 to May 5, 2020) during the COVID-19 outbreak. COVID-19 was declared a national emergency on March 13, 2020, in the United States. The institutional review board at PAR approved the study; the need for individual consent was waived under the condition that participant data would undergo de-identification and be strictly safeguarded.
Data Collection
Because there are seasonal variations in cardiovascular admissions, patient data from a control period (March 9 to May 9, 2019) were obtained to compare with data from the 2020 period. The number of patients with the diagnosis of acute STEMI during the COVID-19 period was recorded. Demographic data, clinical characteristics, and primary angiographic findings were gathered for all patients. Time from symptom onset to hospital admission and time from hospital admission to reperfusion (defined as door-to-balloon time) were documented for each patient. Killip classification was used to assess patients’ clinical status on admission. Length of stay was determined as days from hospital admission to discharge or death (if occurring during the same hospitalization).
Adverse in-hospital complications were also recorded. These were selected based on inclusion of the following categories of acute STEMI complications: ischemic, mechanical, arrhythmic, embolic, and inflammatory. The following complications occurred in our patient cohort: sustained ventricular arrhythmia, congestive heart failure (CHF) defined as congestion requiring intravenous diuretics, re-infarction, mechanical complications (free-wall rupture, ventricular septal defect, or mitral regurgitation), second- or third-degree atrioventricular block, atrial fibrillation, stroke, mechanical ventilation, major bleeding, pericarditis, cardiogenic shock, cardiac arrest, and in-hospital mortality. The primary outcome of this study was defined as a composite of sustained ventricular arrhythmia, CHF with congestion requiring intravenous diuretics, and/or in-hospital mortality. Ventricular arrythmia and CHF were included in the composite outcome because they are defined as the 2 most common causes of sudden cardiac death following acute STEMI.11,12
Statistical Analysis
Normally distributed continuous variables and categorical variables were compared using the paired t-test. A 2-sided P value <.05 was considered to be statistically significant. Mean admission rates for acute STEMI hospitalizations were determined by dividing the number of admissions by the number of days in each time period. The daily rate of COVID-19 cases per 100,000 individuals was obtained from the Centers for Disease Control and Prevention COVID-19 database. All data analyses were performed using Microsoft Excel.
Results
The study cohort consisted of 64 patients, of whom 30 (46.9%) were hospitalized between March 5 and May 5, 2020, and 34 (53.1%) who were admitted during the analogous time period in 2019. This reflected a 6% decrease in STEMI admissions at PAR in the COVID-19 cohort.
Acute STEMI Hospitalization Rates and COVID-19 Incidence
The mean daily acute STEMI admission rate was 0.50 during the study period compared to 0.57 during the control period. During the study period in 2020 in the state of Georgia, the daily rate of newly confirmed COVID-19 cases ranged from 0.194 per 100,000 on March 5 to 8.778 per 100,000 on May 5. Results of COVID-19 testing were available for 9 STEMI patients, and of these 0 tests were positive.
Baseline Characteristics
Baseline characteristics of the acute STEMI cohorts are presented in Table 1. Approximately 75% were male; median (interquartile range [IQR]) age was 60 (51-72) years. There were no significant differences in age and gender between the study periods. Three-quarters of patients had a history of hypertension, and 87.5% had a history of dyslipidemia. There was no significant difference in baseline comorbidity profiles between the 2 study periods; therefore, our sample populations shared similar characteristics.
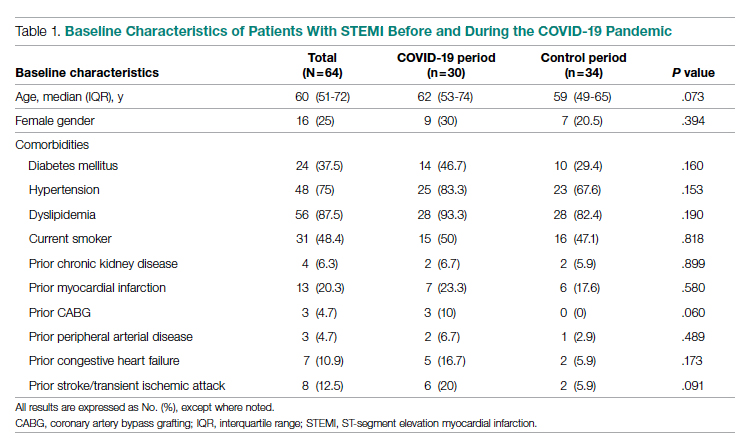
Clinical Presentation
Significant differences were observed regarding the time intervals of STEMI patients in the COVID-19 period and the control period (Table 2). Median time from symptom onset to hospital admission (patient delay) was extended from 57.5 minutes (IQR, 40.3-106) in 2019 to 93 minutes (IQR, 48.8-132) in 2020; however, this difference was not statistically significant (P = .697). Median time from hospital admission to reperfusion (system delay) was prolonged from 45 minutes (IQR, 28-61) in 2019 to 78 minutes (IQR, 50-110) in 2020 (P < .001). Overall time from symptom onset to reperfusion (total ischemic time) increased from 99.5 minutes (IQR, 84.8-132) in 2019 to 149 minutes (IQR, 96.3-231.8) in 2020 (P = .032).
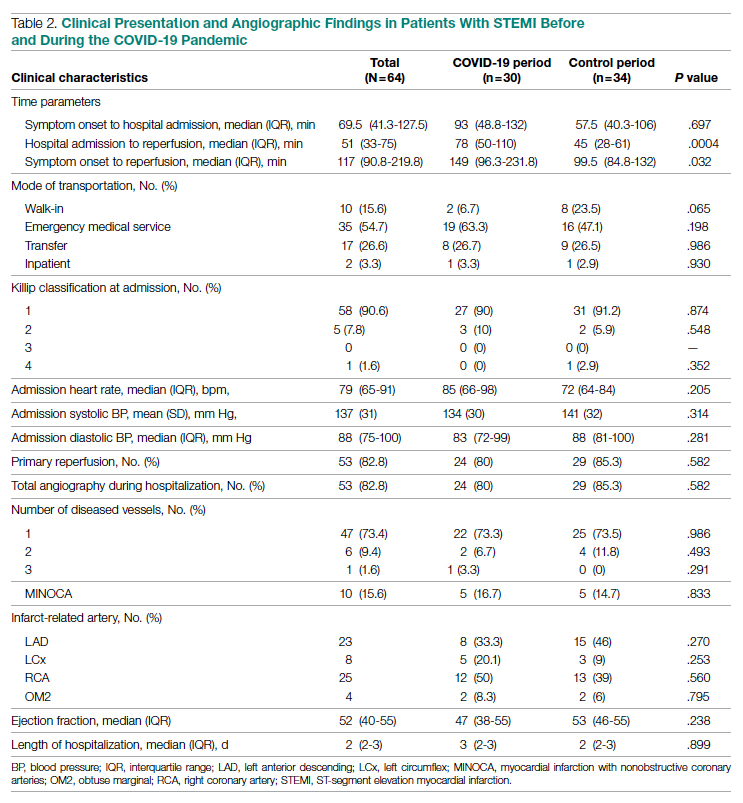
Regarding mode of transportation, 23.5% of patients in 2019 were walk-in admissions to the emergency department. During the COVID-19 period, walk-in admissions decreased to 6.7% (P = .065). There were no significant differences between emergency medical service, transfer, or in-patient admissions for STEMI cases between the 2 study periods.
Killip classification scores were calculated for all patients on admission; 90.6% of patients were classified as Killip Class 1. There was no significant difference between hemodynamic presentations during the COVID-19 period compared to the control period.
Angiographic Data
Overall, 53 (82.8%) patients admitted with acute STEMI underwent coronary angiography during their hospital stay. The proportion of patients who underwent primary reperfusion was greater in the control period than in the COVID-19 period (85.3% vs 80%; P = .582). Angiographic characteristics and findings were similar between the 2 study groups (Table 2).
In-Hospital Outcomes
In-hospital outcome data were available for all patients. As shown in Table 3, hospitalization during the COVID-19 period was independently associated with an increased risk for combined in-hospital outcome (odds ratio, 3.96; P = .046). The rate of in-hospital mortality was greater in the COVID-19 period (P = .013). We found no significant difference when comparing secondary outcomes from admissions during the COVID-19 period and the control period in 2019. For the 5 patients who died during the study period, the primary diagnosis at death was acute STEMI complicated by CHF (3 patients) or cardiogenic shock (2 patients).
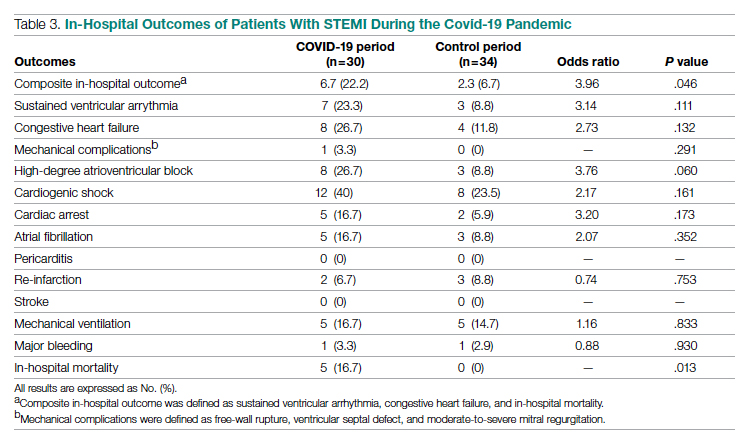
Discussion
This single-center retrospective study at PAR looks at the impact of COVID-19 on hospitalizations for acute STEMI during the initial peak of the pandemic. The key findings of this study show a significant increase in ischemic time parameters (symptom onset to reperfusion, hospital admission to reperfusion), in-hospital mortality, and combined in-hospital outcomes.
There was a 49.5-minute increase in total ischemic time noted in this study (P = .032). Though there was a numerical increase in time of symptom onset to hospital admission by 23.5 minutes, this difference was not statistically significant (P = .697). However, this study observed a statistically significant 33-minute increase in ischemic time from hospital admission to reperfusion (P < .001). Multiple studies globally have found a similar increase in total ischemic times, including those conducted in China and Europe.13-15 Every level of potential delay must be considered, including pre-hospital, triage and emergency department, and/or reperfusion team. Pre-hospital sources of delays that have been suggested include “stay-at-home” orders and apprehension to seek medical care due to concern about contracting the virus or overwhelming the health care facilities. There was a clinically significant 4-fold decrease in the number of walk-in acute STEMI cases in the study period. In 2019, there were 8 walk-in cases compared to 2 cases in 2020 (P = .065). However, this change was not statistically significant. In-hospital/systemic sources of delays have been mentioned in other studies; they include increased time taken to rule out COVID-19 (nasopharyngeal swab/chest x-ray) and increased time due to the need for intensive gowning and gloving procedures by staff. It was difficult to objectively determine the sources of system delay by the reperfusion team due to a lack of quantitative data.
In the current study, we found a significant increase in in-hospital mortality during the COVID-19 period compared to a parallel time frame in 2019. This finding is contrary to a multicenter study from Spain that reported no difference in in-hospital outcomes or mortality rates among all acute coronary syndrome cases.16 The worsening outcomes and prognosis may simply be a result of increased ischemic time; however, the virus that causes COVID-19 itself may play a role as well. Studies have found that SARS-Cov-2 infection places patients at greater risk for cardiovascular conditions such as hypercoagulability, myocarditis, and arrhythmias.17 In our study, however, there were no acute STEMI patients who tested positive for COVID-19. Therefore, we cannot discuss the impact of increased thrombus burden in patients with COVID-19. Piedmont Healthcare published a STEMI treatment protocol in May 2020 that advised increased use of tissue plasminogen activator (tPA) in COVID-19-positive cases; during the study period, however, there were no occasions when tPA use was deemed appropriate based on clinical judgment.
Our findings align with previous studies that describe an increase in combined in-hospital adverse outcomes during the COVID-19 era. Previous studies detected a higher rate of complications in the COVID-19 cohort, but in the current study, the adverse in-hospital course is unrelated to underlying infection.18,19 This study reports a higher incidence of major in-hospital outcomes, including a 65% increase in the rate of combined in-hospital outcomes, which is similar to a multicenter study conducted in Israel.19 There was a 2.3-fold numerical increase in sustained ventricular arrhythmias and a 2.5-fold numerical increase in the incidence of cardiac arrest in the study period. This phenomenon was observed despite a similar rate of reperfusion procedures in both groups.
Acute STEMI is a highly fatal condition with an incidence of 8.5 in 10,000 annually in the United States. While studies across the world have shown a 25% to 40% reduction in the rate of hospitalized acute coronary syndrome cases during the COVID-19 pandemic, the decrease from 34 to 30 STEMI admissions at PAR is not statistically significant.20 Possible reasons for the reduction globally include increased out-of-hospital mortality and decreased incidence of acute STEMI across the general population as a result of improved access to telemedicine or decreased levels of life stressors.20
In summary, there was an increase in ischemic time to reperfusion, in-hospital mortality, and combined in-hospital outcomes for acute STEMI patients at PAR during the COVID period.
Limitations
This study has several limitations. This is a single-center study, so the sample size is small and may not be generalizable to a larger population. This is a retrospective observational study, so causation cannot be inferred. This study analyzed ischemic time parameters as average rates over time rather than in an interrupted time series. Post-reperfusion outcomes were limited to hospital stay. Post-hospital follow-up would provide a better picture of the effects of STEMI intervention. There is no account of patients who died out-of-hospital secondary to acute STEMI. COVID-19 testing was not introduced until midway in our study period. Therefore, we cannot rule out the possibility of the SARS-Cov-2 virus inciting acute STEMI and subsequently leading to worse outcomes and poor prognosis.
Conclusions
This study provides an analysis of the incidence, characteristics, and clinical outcomes of patients presenting with acute STEMI during the early period of the COVID-19 pandemic. In-hospital mortality and ischemic time to reperfusion increased while combined in-hospital outcomes worsened.
Acknowledgment: The authors thank Piedmont Athens Regional IRB for approving this project and allowing access to patient data.
Corresponding author: Syed H. Ali; Department of Medicine, Medical College of Georgia at the Augusta University-University of Georgia Medical Partnership, 30606, Athens, GA; syedha.ali@gmail.com
Disclosures: None reported.
doi:10.12788/jcom.0085
1. Bhatt AS, Moscone A, McElrath EE, et al. Fewer hospitalizations for acute cardiovascular conditions during the COVID-19 pandemic. J Am Coll Cardiol. 2020;76(3):280-288. doi:10.1016/j.jacc.2020.05.038
2. Metzler B, Siostrzonek P, Binder RK, Bauer A, Reinstadler SJR. Decline of acute coronary syndrome admissions in Austria since the outbreak of Covid-19: the pandemic response causes cardiac collateral damage. Eur Heart J. 2020;41:1852-1853. doi:10.1093/eurheartj/ehaa314
3. De Rosa S, Spaccarotella C, Basso C, et al. Reduction of hospitalizations for myocardial infarction in Italy in the Covid-19 era. Eur Heart J. 2020;41(22):2083-2088.
4. Wilson SJ, Connolly MJ, Elghamry Z, et al. Effect of the COVID-19 pandemic on ST-segment-elevation myocardial infarction presentations and in-hospital outcomes. Circ Cardiovasc Interv. 2020; 13(7):e009438. doi:10.1161/CIRCINTERVENTIONS.120.009438
5. Mafham MM, Spata E, Goldacre R, et al. Covid-19 pandemic and admission rates for and management of acute coronary syndromes in England. Lancet. 2020;396 (10248):381-389. doi:10.1016/S0140-6736(20)31356-8
6. Bhatt AS, Moscone A, McElrath EE, et al. Fewer Hospitalizations for acute cardiovascular conditions during the COVID-19 pandemic. J Am Coll Cardiol. 2020;76(3):280-288. doi:10.1016/j.jacc.2020.05.038
7. Tam CF, Cheung KS, Lam S, et al. Impact of Coronavirus disease 2019 (Covid-19) outbreak on ST-segment elevation myocardial infarction care in Hong Kong, China. Circ Cardiovasc Qual Outcomes. 2020;13(4):e006631. doi:10.1161/CIRCOUTCOMES.120.006631
8. Clerkin KJ, Fried JA, Raikhelkar J, et al. Coronavirus disease 2019 (COVID-19) and cardiovascular disease. Circulation. 2020;141:1648-1655. doi:10.1161/CIRCULATIONAHA.120.046941
9. Ebinger JE, Shah PK. Declining admissions for acute cardiovascular illness: The Covid-19 paradox. J Am Coll Cardiol. 2020;76(3):289-291. doi:10.1016/j.jacc.2020.05.039
10 Leor J, Poole WK, Kloner RA. Sudden cardiac death triggered by an earthquake. N Engl J Med. 1996;334(7):413-419. doi:10.1056/NEJM199602153340701
11. Hiramori K. Major causes of death from acute myocardial infarction in a coronary care unit. Jpn Circ J. 1987;51(9):1041-1047. doi:10.1253/jcj.51.1041
12. Bui AH, Waks JW. Risk stratification of sudden cardiac death after acute myocardial infarction. J Innov Card Rhythm Manag. 2018;9(2):3035-3049. doi:10.19102/icrm.2018.090201
13. Xiang D, Xiang X, Zhang W, et al. Management and outcomes of patients with STEMI during the COVID-19 pandemic in China. J Am Coll Cardiol. 2020;76(11):1318-1324. doi:10.1016/j.jacc.2020.06.039
14. Hakim R, Motreff P, Rangé G. COVID-19 and STEMI. [Article in French]. Ann Cardiol Angeiol (Paris). 2020;69(6):355-359. doi:10.1016/j.ancard.2020.09.034
15. Soylu K, Coksevim M, Yanık A, Bugra Cerik I, Aksan G. Effect of Covid-19 pandemic process on STEMI patients timeline. Int J Clin Pract. 2021;75(5):e14005. doi:10.1111/ijcp.14005
16. Salinas P, Travieso A, Vergara-Uzcategui C, et al. Clinical profile and 30-day mortality of invasively managed patients with suspected acute coronary syndrome during the COVID-19 outbreak. Int Heart J. 2021;62(2):274-281. doi:10.1536/ihj.20-574
17. Hu Y, Sun J, Dai Z, et al. Prevalence and severity of corona virus disease 2019 (Covid-19): a systematic review and meta-analysis. J Clin Virol. 2020;127:104371. doi:10.1016/j.jcv.2020.104371
18. Rodriguez-Leor O, Cid Alvarez AB, Perez de Prado A, et al. In-hospital outcomes of COVID-19 ST-elevation myocardial infarction patients. EuroIntervention. 2021;16(17):1426-1433. doi:10.4244/EIJ-D-20-00935
19. Fardman A, Zahger D, Orvin K, et al. Acute myocardial infarction in the Covid-19 era: incidence, clinical characteristics and in-hospital outcomes—A multicenter registry. PLoS ONE. 2021;16(6): e0253524. doi:10.1371/journal.pone.0253524
20. Pessoa-Amorim G, Camm CF, Gajendragadkar P, et al. Admission of patients with STEMI since the outbreak of the COVID-19 pandemic: a survey by the European Society of Cardiology. Eur Heart J Qual Care Clin Outcomes. 2020;6(3):210-216. doi:10.1093/ehjqcco/qcaa046
From the Department of Medicine, Medical College of Georgia at the Augusta University-University of Georgia Medical Partnership, Athens, GA (Syed H. Ali, Syed Hyder, and Dr. Murrow), and the Department of Cardiology, Piedmont Heart Institute, Piedmont Athens Regional, Athens, GA (Dr. Murrow and Mrs. Davis).
Abstract
Objectives: The aim of this study was to describe the characteristics and in-hospital outcomes of patients with acute ST-segment elevation myocardial infarction (STEMI) during the early COVID-19 pandemic at Piedmont Athens Regional (PAR), a 330-bed tertiary referral center in Northeast Georgia.
Methods: A retrospective study was conducted at PAR to evaluate patients with acute STEMI admitted over an 8-week period during the initial COVID-19 outbreak. This study group was compared to patients admitted during the corresponding period in 2019. The primary endpoint of this study was defined as a composite of sustained ventricular arrhythmia, congestive heart failure (CHF) with pulmonary congestion, and/or in-hospital mortality.
Results: This study cohort was composed of 64 patients with acute STEMI; 30 patients (46.9%) were hospitalized during the COVID-19 pandemic. Patients with STEMI in both the COVID-19 and control groups had similar comorbidities, Killip classification score, and clinical presentations. The median (interquartile range) time from symptom onset to reperfusion (total ischemic time) increased from 99.5 minutes (84.8-132) in 2019 to 149 minutes (96.3-231.8; P = .032) in 2020. Hospitalization during the COVID-19 period was associated with an increased risk for combined in-hospital outcome (odds ratio, 3.96; P = .046).
Conclusion: Patients with STEMI admitted during the first wave of the COVID-19 outbreak experienced longer total ischemic time and increased risk for combined in-hospital outcomes compared to patients admitted during the corresponding period in 2019.
Keywords: myocardial infarction, acute coronary syndrome, hospitalization, outcomes.
The emergence of the SARS-Cov-2 virus in December 2019 caused a worldwide shift in resource allocation and the restructuring of health care systems within the span of a few months. With the rapid spread of infection, the World Health Organization officially declared a pandemic in March 2020. The pandemic led to the deferral and cancellation of in-person patient visits, routine diagnostic studies, and nonessential surgeries and procedures. This response occurred secondary to a joint effort to reduce transmission via stay-at-home mandates and appropriate social distancing.1
Alongside the reduction in elective procedures and health care visits, significant reductions in hospitalization rates due to decreases in acute ST-segment elevation myocardial infarction (STEMI) and catheterization laboratory utilization have been reported in many studies from around the world.2-7 Comprehensive data demonstrating the impact of the COVID-19 pandemic on acute STEMI patient characteristics, clinical presentation, and in-hospital outcomes are lacking. Although patients with previously diagnosed cardiovascular disease are more likely to encounter worse outcomes in the setting of COVID-19, there may also be an indirect impact of the pandemic on high-risk patients, including those without the infection.8 Several theories have been hypothesized to explain this phenomenon. One theory postulates that the fear of contracting the virus during hospitalization is great enough to prevent patients from seeking care.2 Another theory suggests that the increased utilization of telemedicine prevents exacerbation of chronic conditions and the need for hospitalization.9 Contrary to this trend, previous studies have shown an increased incidence of acute STEMI following stressful events such as natural disasters.10
The aim of this study was to describe trends pertaining to clinical characteristics and in-hospital outcomes of patients with acute STEMI during the early COVID-19 pandemic at Piedmont Athens Regional (PAR), a 330-bed tertiary referral center in Northeast Georgia.
Methods
A retrospective cohort study was conducted at PAR to evaluate patients with STEMI admitted to the cardiovascular intensive care unit over an 8-week period (March 5 to May 5, 2020) during the COVID-19 outbreak. COVID-19 was declared a national emergency on March 13, 2020, in the United States. The institutional review board at PAR approved the study; the need for individual consent was waived under the condition that participant data would undergo de-identification and be strictly safeguarded.
Data Collection
Because there are seasonal variations in cardiovascular admissions, patient data from a control period (March 9 to May 9, 2019) were obtained to compare with data from the 2020 period. The number of patients with the diagnosis of acute STEMI during the COVID-19 period was recorded. Demographic data, clinical characteristics, and primary angiographic findings were gathered for all patients. Time from symptom onset to hospital admission and time from hospital admission to reperfusion (defined as door-to-balloon time) were documented for each patient. Killip classification was used to assess patients’ clinical status on admission. Length of stay was determined as days from hospital admission to discharge or death (if occurring during the same hospitalization).
Adverse in-hospital complications were also recorded. These were selected based on inclusion of the following categories of acute STEMI complications: ischemic, mechanical, arrhythmic, embolic, and inflammatory. The following complications occurred in our patient cohort: sustained ventricular arrhythmia, congestive heart failure (CHF) defined as congestion requiring intravenous diuretics, re-infarction, mechanical complications (free-wall rupture, ventricular septal defect, or mitral regurgitation), second- or third-degree atrioventricular block, atrial fibrillation, stroke, mechanical ventilation, major bleeding, pericarditis, cardiogenic shock, cardiac arrest, and in-hospital mortality. The primary outcome of this study was defined as a composite of sustained ventricular arrhythmia, CHF with congestion requiring intravenous diuretics, and/or in-hospital mortality. Ventricular arrythmia and CHF were included in the composite outcome because they are defined as the 2 most common causes of sudden cardiac death following acute STEMI.11,12
Statistical Analysis
Normally distributed continuous variables and categorical variables were compared using the paired t-test. A 2-sided P value <.05 was considered to be statistically significant. Mean admission rates for acute STEMI hospitalizations were determined by dividing the number of admissions by the number of days in each time period. The daily rate of COVID-19 cases per 100,000 individuals was obtained from the Centers for Disease Control and Prevention COVID-19 database. All data analyses were performed using Microsoft Excel.
Results
The study cohort consisted of 64 patients, of whom 30 (46.9%) were hospitalized between March 5 and May 5, 2020, and 34 (53.1%) who were admitted during the analogous time period in 2019. This reflected a 6% decrease in STEMI admissions at PAR in the COVID-19 cohort.
Acute STEMI Hospitalization Rates and COVID-19 Incidence
The mean daily acute STEMI admission rate was 0.50 during the study period compared to 0.57 during the control period. During the study period in 2020 in the state of Georgia, the daily rate of newly confirmed COVID-19 cases ranged from 0.194 per 100,000 on March 5 to 8.778 per 100,000 on May 5. Results of COVID-19 testing were available for 9 STEMI patients, and of these 0 tests were positive.
Baseline Characteristics
Baseline characteristics of the acute STEMI cohorts are presented in Table 1. Approximately 75% were male; median (interquartile range [IQR]) age was 60 (51-72) years. There were no significant differences in age and gender between the study periods. Three-quarters of patients had a history of hypertension, and 87.5% had a history of dyslipidemia. There was no significant difference in baseline comorbidity profiles between the 2 study periods; therefore, our sample populations shared similar characteristics.
Clinical Presentation
Significant differences were observed regarding the time intervals of STEMI patients in the COVID-19 period and the control period (Table 2). Median time from symptom onset to hospital admission (patient delay) was extended from 57.5 minutes (IQR, 40.3-106) in 2019 to 93 minutes (IQR, 48.8-132) in 2020; however, this difference was not statistically significant (P = .697). Median time from hospital admission to reperfusion (system delay) was prolonged from 45 minutes (IQR, 28-61) in 2019 to 78 minutes (IQR, 50-110) in 2020 (P < .001). Overall time from symptom onset to reperfusion (total ischemic time) increased from 99.5 minutes (IQR, 84.8-132) in 2019 to 149 minutes (IQR, 96.3-231.8) in 2020 (P = .032).
Regarding mode of transportation, 23.5% of patients in 2019 were walk-in admissions to the emergency department. During the COVID-19 period, walk-in admissions decreased to 6.7% (P = .065). There were no significant differences between emergency medical service, transfer, or in-patient admissions for STEMI cases between the 2 study periods.
Killip classification scores were calculated for all patients on admission; 90.6% of patients were classified as Killip Class 1. There was no significant difference between hemodynamic presentations during the COVID-19 period compared to the control period.
Angiographic Data
Overall, 53 (82.8%) patients admitted with acute STEMI underwent coronary angiography during their hospital stay. The proportion of patients who underwent primary reperfusion was greater in the control period than in the COVID-19 period (85.3% vs 80%; P = .582). Angiographic characteristics and findings were similar between the 2 study groups (Table 2).
In-Hospital Outcomes
In-hospital outcome data were available for all patients. As shown in Table 3, hospitalization during the COVID-19 period was independently associated with an increased risk for combined in-hospital outcome (odds ratio, 3.96; P = .046). The rate of in-hospital mortality was greater in the COVID-19 period (P = .013). We found no significant difference when comparing secondary outcomes from admissions during the COVID-19 period and the control period in 2019. For the 5 patients who died during the study period, the primary diagnosis at death was acute STEMI complicated by CHF (3 patients) or cardiogenic shock (2 patients).
Discussion
This single-center retrospective study at PAR looks at the impact of COVID-19 on hospitalizations for acute STEMI during the initial peak of the pandemic. The key findings of this study show a significant increase in ischemic time parameters (symptom onset to reperfusion, hospital admission to reperfusion), in-hospital mortality, and combined in-hospital outcomes.
There was a 49.5-minute increase in total ischemic time noted in this study (P = .032). Though there was a numerical increase in time of symptom onset to hospital admission by 23.5 minutes, this difference was not statistically significant (P = .697). However, this study observed a statistically significant 33-minute increase in ischemic time from hospital admission to reperfusion (P < .001). Multiple studies globally have found a similar increase in total ischemic times, including those conducted in China and Europe.13-15 Every level of potential delay must be considered, including pre-hospital, triage and emergency department, and/or reperfusion team. Pre-hospital sources of delays that have been suggested include “stay-at-home” orders and apprehension to seek medical care due to concern about contracting the virus or overwhelming the health care facilities. There was a clinically significant 4-fold decrease in the number of walk-in acute STEMI cases in the study period. In 2019, there were 8 walk-in cases compared to 2 cases in 2020 (P = .065). However, this change was not statistically significant. In-hospital/systemic sources of delays have been mentioned in other studies; they include increased time taken to rule out COVID-19 (nasopharyngeal swab/chest x-ray) and increased time due to the need for intensive gowning and gloving procedures by staff. It was difficult to objectively determine the sources of system delay by the reperfusion team due to a lack of quantitative data.
In the current study, we found a significant increase in in-hospital mortality during the COVID-19 period compared to a parallel time frame in 2019. This finding is contrary to a multicenter study from Spain that reported no difference in in-hospital outcomes or mortality rates among all acute coronary syndrome cases.16 The worsening outcomes and prognosis may simply be a result of increased ischemic time; however, the virus that causes COVID-19 itself may play a role as well. Studies have found that SARS-Cov-2 infection places patients at greater risk for cardiovascular conditions such as hypercoagulability, myocarditis, and arrhythmias.17 In our study, however, there were no acute STEMI patients who tested positive for COVID-19. Therefore, we cannot discuss the impact of increased thrombus burden in patients with COVID-19. Piedmont Healthcare published a STEMI treatment protocol in May 2020 that advised increased use of tissue plasminogen activator (tPA) in COVID-19-positive cases; during the study period, however, there were no occasions when tPA use was deemed appropriate based on clinical judgment.
Our findings align with previous studies that describe an increase in combined in-hospital adverse outcomes during the COVID-19 era. Previous studies detected a higher rate of complications in the COVID-19 cohort, but in the current study, the adverse in-hospital course is unrelated to underlying infection.18,19 This study reports a higher incidence of major in-hospital outcomes, including a 65% increase in the rate of combined in-hospital outcomes, which is similar to a multicenter study conducted in Israel.19 There was a 2.3-fold numerical increase in sustained ventricular arrhythmias and a 2.5-fold numerical increase in the incidence of cardiac arrest in the study period. This phenomenon was observed despite a similar rate of reperfusion procedures in both groups.
Acute STEMI is a highly fatal condition with an incidence of 8.5 in 10,000 annually in the United States. While studies across the world have shown a 25% to 40% reduction in the rate of hospitalized acute coronary syndrome cases during the COVID-19 pandemic, the decrease from 34 to 30 STEMI admissions at PAR is not statistically significant.20 Possible reasons for the reduction globally include increased out-of-hospital mortality and decreased incidence of acute STEMI across the general population as a result of improved access to telemedicine or decreased levels of life stressors.20
In summary, there was an increase in ischemic time to reperfusion, in-hospital mortality, and combined in-hospital outcomes for acute STEMI patients at PAR during the COVID period.
Limitations
This study has several limitations. This is a single-center study, so the sample size is small and may not be generalizable to a larger population. This is a retrospective observational study, so causation cannot be inferred. This study analyzed ischemic time parameters as average rates over time rather than in an interrupted time series. Post-reperfusion outcomes were limited to hospital stay. Post-hospital follow-up would provide a better picture of the effects of STEMI intervention. There is no account of patients who died out-of-hospital secondary to acute STEMI. COVID-19 testing was not introduced until midway in our study period. Therefore, we cannot rule out the possibility of the SARS-Cov-2 virus inciting acute STEMI and subsequently leading to worse outcomes and poor prognosis.
Conclusions
This study provides an analysis of the incidence, characteristics, and clinical outcomes of patients presenting with acute STEMI during the early period of the COVID-19 pandemic. In-hospital mortality and ischemic time to reperfusion increased while combined in-hospital outcomes worsened.
Acknowledgment: The authors thank Piedmont Athens Regional IRB for approving this project and allowing access to patient data.
Corresponding author: Syed H. Ali; Department of Medicine, Medical College of Georgia at the Augusta University-University of Georgia Medical Partnership, 30606, Athens, GA; syedha.ali@gmail.com
Disclosures: None reported.
doi:10.12788/jcom.0085
1. Bhatt AS, Moscone A, McElrath EE, et al. Fewer hospitalizations for acute cardiovascular conditions during the COVID-19 pandemic. J Am Coll Cardiol. 2020;76(3):280-288. doi:10.1016/j.jacc.2020.05.038
2. Metzler B, Siostrzonek P, Binder RK, Bauer A, Reinstadler SJR. Decline of acute coronary syndrome admissions in Austria since the outbreak of Covid-19: the pandemic response causes cardiac collateral damage. Eur Heart J. 2020;41:1852-1853. doi:10.1093/eurheartj/ehaa314
3. De Rosa S, Spaccarotella C, Basso C, et al. Reduction of hospitalizations for myocardial infarction in Italy in the Covid-19 era. Eur Heart J. 2020;41(22):2083-2088.
4. Wilson SJ, Connolly MJ, Elghamry Z, et al. Effect of the COVID-19 pandemic on ST-segment-elevation myocardial infarction presentations and in-hospital outcomes. Circ Cardiovasc Interv. 2020; 13(7):e009438. doi:10.1161/CIRCINTERVENTIONS.120.009438
5. Mafham MM, Spata E, Goldacre R, et al. Covid-19 pandemic and admission rates for and management of acute coronary syndromes in England. Lancet. 2020;396 (10248):381-389. doi:10.1016/S0140-6736(20)31356-8
6. Bhatt AS, Moscone A, McElrath EE, et al. Fewer Hospitalizations for acute cardiovascular conditions during the COVID-19 pandemic. J Am Coll Cardiol. 2020;76(3):280-288. doi:10.1016/j.jacc.2020.05.038
7. Tam CF, Cheung KS, Lam S, et al. Impact of Coronavirus disease 2019 (Covid-19) outbreak on ST-segment elevation myocardial infarction care in Hong Kong, China. Circ Cardiovasc Qual Outcomes. 2020;13(4):e006631. doi:10.1161/CIRCOUTCOMES.120.006631
8. Clerkin KJ, Fried JA, Raikhelkar J, et al. Coronavirus disease 2019 (COVID-19) and cardiovascular disease. Circulation. 2020;141:1648-1655. doi:10.1161/CIRCULATIONAHA.120.046941
9. Ebinger JE, Shah PK. Declining admissions for acute cardiovascular illness: The Covid-19 paradox. J Am Coll Cardiol. 2020;76(3):289-291. doi:10.1016/j.jacc.2020.05.039
10 Leor J, Poole WK, Kloner RA. Sudden cardiac death triggered by an earthquake. N Engl J Med. 1996;334(7):413-419. doi:10.1056/NEJM199602153340701
11. Hiramori K. Major causes of death from acute myocardial infarction in a coronary care unit. Jpn Circ J. 1987;51(9):1041-1047. doi:10.1253/jcj.51.1041
12. Bui AH, Waks JW. Risk stratification of sudden cardiac death after acute myocardial infarction. J Innov Card Rhythm Manag. 2018;9(2):3035-3049. doi:10.19102/icrm.2018.090201
13. Xiang D, Xiang X, Zhang W, et al. Management and outcomes of patients with STEMI during the COVID-19 pandemic in China. J Am Coll Cardiol. 2020;76(11):1318-1324. doi:10.1016/j.jacc.2020.06.039
14. Hakim R, Motreff P, Rangé G. COVID-19 and STEMI. [Article in French]. Ann Cardiol Angeiol (Paris). 2020;69(6):355-359. doi:10.1016/j.ancard.2020.09.034
15. Soylu K, Coksevim M, Yanık A, Bugra Cerik I, Aksan G. Effect of Covid-19 pandemic process on STEMI patients timeline. Int J Clin Pract. 2021;75(5):e14005. doi:10.1111/ijcp.14005
16. Salinas P, Travieso A, Vergara-Uzcategui C, et al. Clinical profile and 30-day mortality of invasively managed patients with suspected acute coronary syndrome during the COVID-19 outbreak. Int Heart J. 2021;62(2):274-281. doi:10.1536/ihj.20-574
17. Hu Y, Sun J, Dai Z, et al. Prevalence and severity of corona virus disease 2019 (Covid-19): a systematic review and meta-analysis. J Clin Virol. 2020;127:104371. doi:10.1016/j.jcv.2020.104371
18. Rodriguez-Leor O, Cid Alvarez AB, Perez de Prado A, et al. In-hospital outcomes of COVID-19 ST-elevation myocardial infarction patients. EuroIntervention. 2021;16(17):1426-1433. doi:10.4244/EIJ-D-20-00935
19. Fardman A, Zahger D, Orvin K, et al. Acute myocardial infarction in the Covid-19 era: incidence, clinical characteristics and in-hospital outcomes—A multicenter registry. PLoS ONE. 2021;16(6): e0253524. doi:10.1371/journal.pone.0253524
20. Pessoa-Amorim G, Camm CF, Gajendragadkar P, et al. Admission of patients with STEMI since the outbreak of the COVID-19 pandemic: a survey by the European Society of Cardiology. Eur Heart J Qual Care Clin Outcomes. 2020;6(3):210-216. doi:10.1093/ehjqcco/qcaa046
Comparison of Fractional Flow Reserve–Guided PCI and Coronary Bypass Surgery in 3-Vessel Disease
Study Overview
Objective: To determine whether fractional flow reserve (FFR)–guided percutaneous coronary intervention (PCI) is noninferior to coronary-artery bypass grafting (CABG) in patients with 3-vessel coronary artery disease (CAD).
Design: Investigator-initiated, multicenter, international, randomized, controlled trial conducted at 48 sites.
Setting and participants: A total of 1500 patients with angiographically identified 3-vessel CAD not involving the left main coronary artery were randomly assigned to receive FFR-guided PCI with zotarolimus-eluting stents or CABG in a 1:1 ratio. Randomization was stratified according to trial site and diabetes status.
Main outcome measures: The primary end point was major adverse cardiac or cerebrovascular event, defined as death from any cause, myocardial infarction (MI), stroke, or repeat revascularization. The secondary end point was defined as a composite of death, MI, or stroke.
Results: At 1 year, the incidence of the composite primary end point was 10.6% for patients with FFR-guided PCI and 6.9% for patients with CABG (hazard ratio [HR], 1.5; 95% CI, 1.1-2.2; P = .35 for noninferiority), which was not consistent with noninferiority of FFR-guided PCI compared to CABG. The secondary end point occurred in 7.3% of patients in the FFR-guided PCI group compared with 5.2% in the CABG group (HR, 1.4; 95% CI, 0.9-2.1). Individual findings for the outcomes comprising the primary end point for the FFR-guided PCI group vs the CABG group were as follows: death, 1.6% vs 0.9%; MI, 5.2% vs 3.5%; stroke, 0.9% vs 1.1%; and repeat revascularization, 5.9% vs 3.9%. The CABG group had more extended hospital stays and higher incidences of major bleeding, arrhythmia, acute kidney injury, and rehospitalization within 30 days than the FFR-guided PCI group.
Conclusion: FFR-guided PCI was not found to be noninferior to CABG with respect to the incidence of a composite of death, MI, stroke, or repeat revascularization at 1 year.
Commentary
Revascularization for multivessel CAD can be performed by CABG or PCI. Previous studies have shown superior outcomes in patients with multivessel CAD who were treated with CABG compared to PCI.1-3 The Synergy between PCI with Taxus and Cardiac Surgery (SYNTAX) trial, which compared CABG to PCI in patients with multivessel disease or unprotected left main CAD, stratified the anatomic complexity based on SYNTAX score and found that patients with higher anatomic complexity with a high SYNTAX score derive larger benefit from CABG compared to PCI.4 Therefore, the current guidelines favor CABG over PCI in patients with severe 3-vessel disease, except for patients with a lower SYNTAX score (<22) without diabetes.5,6 However, except for a smaller size study,3 the previous trials that led to this recommendation used mostly first-generation drug-eluting stents and have not evaluated second-generation stents that have lower rates of in-stent restenosis and stent thrombosis. In addition, there have been significant improvements in PCI techniques since the study period, including the adoption of a radial approach and superior adjunct pharmacologic therapy. Furthermore, previous studies have not systematically investigated the use of FFR-guided PCI, which has been shown to be superior to angiography-guided PCI or medical treatment alone.7-9
In this context, Fearon and the FAME-3 trial investigators studied the use of FFR-guided PCI with second-generation zotarolimus drug-eluting stents compared to CABG in patients with 3-vessel CAD. They randomized patients with angiographically identified 3-vessel CAD in a 1:1 ratio to receive FFR-guided PCI or CABG at 48 sites internationally. Patients with left main CAD, recent ST-elevation MI, cardiogenic shock, and left-ventricular ejection fraction <30% were excluded. The study results (composite primary end point incidence of 10.6% for patients with FFR-guided PCI vs 6.9% in the CABG group [HR, 1.5; 95% CI, 1.1-2.2; P = 0.35 for noninferiority]) showed that FFR-guided PCI did not meet the noninferiority criterion.
Although the FAME-3 study is an important study, there are a few points to consider. First, 24% of the lesions had a FFR measured at >0.80. The benefit of FFR-guided PCI lies in the number of lesions that are safely deferred compared to angiography-guided PCI. The small number of deferred lesions could have limited the benefit of FFR guidance compared with angiography. Second, this study did not include all comers who had angiographic 3-vessel disease. Patients who had FFR assessment of moderate lesions at the time of diagnostic angiogram and were found to have FFR >0.80 or were deemed single- or 2-vessel disease were likely treated with PCI. Therefore, as the authors point out, the patients included in this study may have been skewed to a higher-risk population compared to previous studies.
Third, the study may not reflect contemporary interventional practice, as the use of intravascular ultrasound was very low (12%). Intravascular ultrasound–guided PCI has been associated with increased luminal gain and improved outcomes compared to angiography-guided PCI.10 Although 20% of the patients in each arm were found to have chronic total occlusions, the completeness of revascularization has not yet been reported. It is possible that the PCI arm had fewer complete revascularizations, which has been shown in previous observational studies to be associated with worse clinical outcomes.11,12
Although the current guidelines favor CABG over PCI in patients with multivessel disease, this recommendation is stratified by anatomic complexity.6 In fact, in the European guidelines, CABG and PCI are both class I recommendations for the treatment of 3-vessel disease with low SYNTAX score in patients without diabetes.5 Although the FAME-3 study failed to show noninferiority in the overall population, when stratified by the SYNTAX score, the major adverse cardiac event rate for the PCI group was numerically lower than that of the CABG group. The results from the FAME-3 study are overall in line with the previous studies and the current guidelines. Future studies are necessary to assess the outcomes of multivessel PCI compared to CABG using the most contemporary interventional practice and achieving complete revascularization in the PCI arm.
Applications for Clinical Practice
In patients with 3-vessel disease, FFR-guided PCI was not found to be noninferior to CABG; this finding is consistent with previous studies.
—Shubham Kanake, BS, Chirag Bavishi, MD, MPH, and Taishi Hirai, MD, University of Missouri, Columbia, MO
Disclosures: None.
1. Farkouh ME, Domanski M, Sleeper LA, et al; FREEDOM Trial Investigators. Strategies for multivessel revascularization in patients with diabetes. N Engl J Med. 2012;367(25):2375-2384. doi:10.1056/NEJMoa1211585
2. Serruys PW, Morice MC, Kappetein AP, et al; SYNTAX Investigators. Percutaneous coronary intervention versus coronary-artery bypass grafting for severe coronary artery disease. N Engl J Med. 2009;360(10):961-972. doi:10.1056/NEJMoa0804626
3. Park SJ, Ahn JM, Kim YH, et al; BEST Trial Investigators. Trial of everolimus-eluting stents or bypass surgery for coronary disease. N Engl J Med. 2015;372(13):1204-1212. doi:10.1056/NEJMoa1415447
4. Stone GW, Kappetein AP, Sabik JF, et al; EXCEL Trial Investigators. Five-year outcomes after PCI or CABG for left main coronary disease. N Engl J Med. 2019; 381(19):1820-1830. doi:10.1056/NEJMoa1909406
5. Neumann FJ, Sousa-Uva M, Ahlsson A, et al; ESC Scientific Document Group. 2018 ESC/EACTS guidelines on myocardial revascularization. Eur Heart J. 2019;40(2):87-165. doi:10.1093/eurheartj/ehy394
6. Writing Committee Members, Lawton JS, Tamis-Holland JE, Bangalore S, et al. 2021 ACC/AHA/SCAI guideline for coronary artery revascularization: a report of the American College of Cardiology/American Heart Association Joint Committee on Clinical Practice Guidelines. J Am Coll Cardiol. 2022;79(2):e21-e129. doi:10.1016/j.jacc.2021.09.006
7. Tonino PAL, De Bruyne B, Pijls NHJ, et al; FAME Study Investigators. Fractional flow reserve versus angiography for guiding percutaneous coronary intervention. N Engl J Med. 2009;360(3):213-224. doi:10.1056/NEJMoa0807611
8. De Bruyne B, Fearon WF, Pijls NHJ, et al; FAME 2 Trial Investigators. Fractional flow reserve-guided PCI for stable coronary artery disease. N Engl J Med. 2014;371(13):1208-1217. doi:10.1056/NEJMoa1408758
9. Xaplanteris P, Fournier S, Pijls NHJ, et al; FAME 2 Investigators. Five-year outcomes with PCI guided by fractional flow reserve. N Engl J Med. 2018;379(3):250-259. doi:10.1056/NEJMoa1803538
10. Zhang J, Gao X, Kan J, et al. Intravascular ultrasound versus angiography-guided drug-eluting stent implantation: The ULTIMATE trial. J Am Coll Cardiol. 2018;72:3126-3137. doi:10.1016/j.jacc.2018.09.013
11. Garcia S, Sandoval Y, Roukoz H, et al. Outcomes after complete versus incomplete revascularization of patients with multivessel coronary artery disease: a meta-analysis of 89,883 patients enrolled in randomized clinical trials and observational studies. J Am Coll Cardiol. 2013;62:1421-1431. doi:10.1016/j.jacc.2013.05.033
12. Farooq V, Serruys PW, Garcia-Garcia HM et al. The negative impact of incomplete angiographic revascularization on clinical outcomes and its association with total occlusions: the SYNTAX (Synergy Between Percutaneous Coronary Intervention with Taxus and Cardiac Surgery) trial. J Am Coll Cardiol. 2013;61:282-294. doi: 10.1016/j.jacc.2012.10.017
Study Overview
Objective: To determine whether fractional flow reserve (FFR)–guided percutaneous coronary intervention (PCI) is noninferior to coronary-artery bypass grafting (CABG) in patients with 3-vessel coronary artery disease (CAD).
Design: Investigator-initiated, multicenter, international, randomized, controlled trial conducted at 48 sites.
Setting and participants: A total of 1500 patients with angiographically identified 3-vessel CAD not involving the left main coronary artery were randomly assigned to receive FFR-guided PCI with zotarolimus-eluting stents or CABG in a 1:1 ratio. Randomization was stratified according to trial site and diabetes status.
Main outcome measures: The primary end point was major adverse cardiac or cerebrovascular event, defined as death from any cause, myocardial infarction (MI), stroke, or repeat revascularization. The secondary end point was defined as a composite of death, MI, or stroke.
Results: At 1 year, the incidence of the composite primary end point was 10.6% for patients with FFR-guided PCI and 6.9% for patients with CABG (hazard ratio [HR], 1.5; 95% CI, 1.1-2.2; P = .35 for noninferiority), which was not consistent with noninferiority of FFR-guided PCI compared to CABG. The secondary end point occurred in 7.3% of patients in the FFR-guided PCI group compared with 5.2% in the CABG group (HR, 1.4; 95% CI, 0.9-2.1). Individual findings for the outcomes comprising the primary end point for the FFR-guided PCI group vs the CABG group were as follows: death, 1.6% vs 0.9%; MI, 5.2% vs 3.5%; stroke, 0.9% vs 1.1%; and repeat revascularization, 5.9% vs 3.9%. The CABG group had more extended hospital stays and higher incidences of major bleeding, arrhythmia, acute kidney injury, and rehospitalization within 30 days than the FFR-guided PCI group.
Conclusion: FFR-guided PCI was not found to be noninferior to CABG with respect to the incidence of a composite of death, MI, stroke, or repeat revascularization at 1 year.
Commentary
Revascularization for multivessel CAD can be performed by CABG or PCI. Previous studies have shown superior outcomes in patients with multivessel CAD who were treated with CABG compared to PCI.1-3 The Synergy between PCI with Taxus and Cardiac Surgery (SYNTAX) trial, which compared CABG to PCI in patients with multivessel disease or unprotected left main CAD, stratified the anatomic complexity based on SYNTAX score and found that patients with higher anatomic complexity with a high SYNTAX score derive larger benefit from CABG compared to PCI.4 Therefore, the current guidelines favor CABG over PCI in patients with severe 3-vessel disease, except for patients with a lower SYNTAX score (<22) without diabetes.5,6 However, except for a smaller size study,3 the previous trials that led to this recommendation used mostly first-generation drug-eluting stents and have not evaluated second-generation stents that have lower rates of in-stent restenosis and stent thrombosis. In addition, there have been significant improvements in PCI techniques since the study period, including the adoption of a radial approach and superior adjunct pharmacologic therapy. Furthermore, previous studies have not systematically investigated the use of FFR-guided PCI, which has been shown to be superior to angiography-guided PCI or medical treatment alone.7-9
In this context, Fearon and the FAME-3 trial investigators studied the use of FFR-guided PCI with second-generation zotarolimus drug-eluting stents compared to CABG in patients with 3-vessel CAD. They randomized patients with angiographically identified 3-vessel CAD in a 1:1 ratio to receive FFR-guided PCI or CABG at 48 sites internationally. Patients with left main CAD, recent ST-elevation MI, cardiogenic shock, and left-ventricular ejection fraction <30% were excluded. The study results (composite primary end point incidence of 10.6% for patients with FFR-guided PCI vs 6.9% in the CABG group [HR, 1.5; 95% CI, 1.1-2.2; P = 0.35 for noninferiority]) showed that FFR-guided PCI did not meet the noninferiority criterion.
Although the FAME-3 study is an important study, there are a few points to consider. First, 24% of the lesions had a FFR measured at >0.80. The benefit of FFR-guided PCI lies in the number of lesions that are safely deferred compared to angiography-guided PCI. The small number of deferred lesions could have limited the benefit of FFR guidance compared with angiography. Second, this study did not include all comers who had angiographic 3-vessel disease. Patients who had FFR assessment of moderate lesions at the time of diagnostic angiogram and were found to have FFR >0.80 or were deemed single- or 2-vessel disease were likely treated with PCI. Therefore, as the authors point out, the patients included in this study may have been skewed to a higher-risk population compared to previous studies.
Third, the study may not reflect contemporary interventional practice, as the use of intravascular ultrasound was very low (12%). Intravascular ultrasound–guided PCI has been associated with increased luminal gain and improved outcomes compared to angiography-guided PCI.10 Although 20% of the patients in each arm were found to have chronic total occlusions, the completeness of revascularization has not yet been reported. It is possible that the PCI arm had fewer complete revascularizations, which has been shown in previous observational studies to be associated with worse clinical outcomes.11,12
Although the current guidelines favor CABG over PCI in patients with multivessel disease, this recommendation is stratified by anatomic complexity.6 In fact, in the European guidelines, CABG and PCI are both class I recommendations for the treatment of 3-vessel disease with low SYNTAX score in patients without diabetes.5 Although the FAME-3 study failed to show noninferiority in the overall population, when stratified by the SYNTAX score, the major adverse cardiac event rate for the PCI group was numerically lower than that of the CABG group. The results from the FAME-3 study are overall in line with the previous studies and the current guidelines. Future studies are necessary to assess the outcomes of multivessel PCI compared to CABG using the most contemporary interventional practice and achieving complete revascularization in the PCI arm.
Applications for Clinical Practice
In patients with 3-vessel disease, FFR-guided PCI was not found to be noninferior to CABG; this finding is consistent with previous studies.
—Shubham Kanake, BS, Chirag Bavishi, MD, MPH, and Taishi Hirai, MD, University of Missouri, Columbia, MO
Disclosures: None.
1. Farkouh ME, Domanski M, Sleeper LA, et al; FREEDOM Trial Investigators. Strategies for multivessel revascularization in patients with diabetes. N Engl J Med. 2012;367(25):2375-2384. doi:10.1056/NEJMoa1211585
2. Serruys PW, Morice MC, Kappetein AP, et al; SYNTAX Investigators. Percutaneous coronary intervention versus coronary-artery bypass grafting for severe coronary artery disease. N Engl J Med. 2009;360(10):961-972. doi:10.1056/NEJMoa0804626
3. Park SJ, Ahn JM, Kim YH, et al; BEST Trial Investigators. Trial of everolimus-eluting stents or bypass surgery for coronary disease. N Engl J Med. 2015;372(13):1204-1212. doi:10.1056/NEJMoa1415447
4. Stone GW, Kappetein AP, Sabik JF, et al; EXCEL Trial Investigators. Five-year outcomes after PCI or CABG for left main coronary disease. N Engl J Med. 2019; 381(19):1820-1830. doi:10.1056/NEJMoa1909406
5. Neumann FJ, Sousa-Uva M, Ahlsson A, et al; ESC Scientific Document Group. 2018 ESC/EACTS guidelines on myocardial revascularization. Eur Heart J. 2019;40(2):87-165. doi:10.1093/eurheartj/ehy394
6. Writing Committee Members, Lawton JS, Tamis-Holland JE, Bangalore S, et al. 2021 ACC/AHA/SCAI guideline for coronary artery revascularization: a report of the American College of Cardiology/American Heart Association Joint Committee on Clinical Practice Guidelines. J Am Coll Cardiol. 2022;79(2):e21-e129. doi:10.1016/j.jacc.2021.09.006
7. Tonino PAL, De Bruyne B, Pijls NHJ, et al; FAME Study Investigators. Fractional flow reserve versus angiography for guiding percutaneous coronary intervention. N Engl J Med. 2009;360(3):213-224. doi:10.1056/NEJMoa0807611
8. De Bruyne B, Fearon WF, Pijls NHJ, et al; FAME 2 Trial Investigators. Fractional flow reserve-guided PCI for stable coronary artery disease. N Engl J Med. 2014;371(13):1208-1217. doi:10.1056/NEJMoa1408758
9. Xaplanteris P, Fournier S, Pijls NHJ, et al; FAME 2 Investigators. Five-year outcomes with PCI guided by fractional flow reserve. N Engl J Med. 2018;379(3):250-259. doi:10.1056/NEJMoa1803538
10. Zhang J, Gao X, Kan J, et al. Intravascular ultrasound versus angiography-guided drug-eluting stent implantation: The ULTIMATE trial. J Am Coll Cardiol. 2018;72:3126-3137. doi:10.1016/j.jacc.2018.09.013
11. Garcia S, Sandoval Y, Roukoz H, et al. Outcomes after complete versus incomplete revascularization of patients with multivessel coronary artery disease: a meta-analysis of 89,883 patients enrolled in randomized clinical trials and observational studies. J Am Coll Cardiol. 2013;62:1421-1431. doi:10.1016/j.jacc.2013.05.033
12. Farooq V, Serruys PW, Garcia-Garcia HM et al. The negative impact of incomplete angiographic revascularization on clinical outcomes and its association with total occlusions: the SYNTAX (Synergy Between Percutaneous Coronary Intervention with Taxus and Cardiac Surgery) trial. J Am Coll Cardiol. 2013;61:282-294. doi: 10.1016/j.jacc.2012.10.017
Medtronic recalls HawkOne directional atherectomy system
Medtronic has recalled 95,110 HawkOne Directional Atherectomy Systems because of the risk of the guidewire within the catheter moving downward or prolapsing during use, which may damage the tip of the catheter.
The U.S. Food and Drug Administration has identified this as a Class I recall, the most serious type, because of the potential for serious injury or death.
The HawkOne Directional Atherectomy system is used during procedures intended to remove blockage from peripheral arteries and improve blood flow.
If the guideline moves downward or prolapses during use, the “catheter tip may break off or separate, and this could lead to serious adverse events, including a tear along the inside wall of an artery (arterial dissection), a rupture or breakage of an artery (arterial rupture), decrease in blood flow to a part of the body because of a blocked artery (ischemia), and/or blood vessel complications that could require surgical repair and additional procedures to capture and remove the detached and/or migrated (embolized) tip,” the FDA says in a recall notice posted today on its website.
To date, there have been 55 injuries, no deaths, and 163 complaints reported for this device.
The recalled devices were distributed in the United States between Jan. 22, 2018 and Oct. 4, 2021. Product codes and lot numbers pertaining to the devices are listed on the FDA website.
Medtronic sent an urgent field safety notice to customers Dec. 6, 2021, requesting that they alert parties of the defect, review the instructions for use before using the device, and note the warnings and precautions listed in the letter.
Customers were also asked to complete the enclosed confirmation form and email to rs.cfqfca@medtronic.com.
Health care providers can report adverse reactions or quality problems they experience using these devices to the FDA’s MedWatch program.
A version of this article first appeared on Medscape.com.