User login
Patient Acuity Rating
Recently released Accreditation Council for Graduate Medical Education (ACGME) recommendations, set to take effect in 2011, place further limits on resident duty hours, which are expected to result in additional handoffs of patients between inpatient providers.1 The increase in these handoffs following the prior set of ACGME recommendations in 2003 has been cited as a potential etiology for the underwhelming effects of the duty hour restrictions on patient outcomes, whereby the benefits of well‐rested physicians are theorized to be offset by increased harm associated with discontinuous care, especially in high‐risk patients.2 In 2007, an Institute of Medicine committee on the topic recommended improving handovers to make the transfer of patient responsibility and information more effective and less error prone.3
Several strategies have been proposed, but an ideal way to quickly transfer complex medical information on numerous patients remains to be identified. A standardized metric of a patient's risk level, if accurate, has the potential to summarize how stable or unstable a patient might be. We hypothesized that clinicians would be able to quantify their judgments regarding the stability of their inpatients and that this measure would correlate with impending clinical deterioration as determined by cardiac arrest or intensive care unit (ICU) transfer within the next 24 hours.
METHODS
Study Design
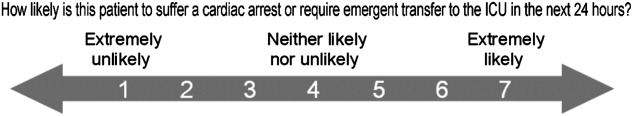
We developed the Patient Acuity Rating (PAR), a 7‐point Likert scale to quantify clinician judgment regarding the stability of inpatients outside the ICU, and conducted a prospective study of its diagnostic accuracy for predicting impending clinical deterioration in an academic tertiary care hospital. Providers were prospectively surveyed once per call‐cycle, on the day after patient admission, and asked to rate each of their patients on their likelihood of suffering a cardiac arrest or being transferred to the ICU. The scale was anchored at both ends, with a PAR of 1 corresponding to extreme unlikelihood of suffering a cardiac arrest or requiring emergent ICU transfer within the next 24 hours, and a PAR of 7 corresponding with extreme likelihood (Figure 1). A score of 4 suggested neither likely nor unlikely to experience an event. No further anchors were provided.
Study Setting and Participants
This study was conducted at The University of Chicago Medical Center, an academic, tertiary care facility with approximately 600 inpatient beds. Subjects involved both the clinicians who provided PAR scores and the patients upon whom the PAR scores and outcomes were based. The clinicians included internal medicine interns, residents, and attending physicians, as well as midlevel providers (nurse practitioners or physician assistants). Clinicians were eligible for inclusion if they cared for patients on one of nine adult ward services between January and June 2008. They were included in the study if they consented to participate. Housestaff, with medicine attending supervision, covered patients on seven general medicine services, while midlevel practitioners, also with medicine attending supervision, covered patients on two hepatology and transplant services.
Providers were independently surveyed once per call‐cycle (every 2 to 4 days depending on the service) by study personnel regarding each of their patients, and instructed not to consult with other members of the team regarding their PAR score assignments. All patients for whom a participating clinician provided a PAR score were included in the analysis. Clinician subjects were carefully surveyed at the end of their work day, just prior to, or immediately following, their handover to the cross‐covering physician, so as to minimize the risk that they might alter their plan and transfer a patient to the ICU based on the PAR score.
Data Analysis
PAR scores were entered into a database (Excel, Microsoft Corporation, Redmond, WA) and then linked to patient demographic and outcome data obtained from hospital administrative databases. Weighted kappa statistics were used to evaluate inter‐rater reliability. Ordinal trend testing was used to correlate the PAR with patient outcomes by provider. In addition, receiver operator characteristics (ROC) curves were constructed, and area under the curve (AUC) calculated and compared among providers using paired chi‐squared statistics. Sensitivities and specificities were determined for each theoretical PAR cutoff. Clustered multivariate logistic regression was used to adjust for provider, service, and individual patient. All calculations were performed using a statistical software application (Stata, College Station, TX).
Approval
The study protocol, consent, and data collection mechanisms were approved by the Institutional Review Board of the University of Chicago Medical Center. Waiver of consent provisions were used for patients on the basis of minimal harm and general impracticability, while a written consent process was used for patient care providers. Collection of patient information was designed to comply with the Health Insurance Portability and Accountability Act of 1996 regulations.
RESULTS
During the study period, 140/159 (88.1%) eligible clinicians consented to participate. Of these clinicians, 45 (32.1%) were intern physicians, 40 (28.6%) were resident physicians, 51 (36.4%) were attending physicians, and 4 (2.9%) were midlevel providers. They provided PAR scores on 1663 distinct patients over the course of 2019 separate admissions. Table 1 shows the patient and admission demographics grouped by the type of medical service: general medicine teaching or multispecialty non‐teaching. Severity of illness assignments were determined using All Patient Refined Diagnosis Related Group (APR‐DRG) methodology, which incorporates features such as principle diagnosis at admission, co‐morbidities, complications during admission, age, and gender.4, 5 The multispecialty patients were more likely to be male, have a higher severity of illness, and die during the hospitalization, when compared to general medicine patients.
| Characteristic | General Medicine Teaching Services | Multispecialty Non‐Teaching Services | P‐Value |
|---|---|---|---|
| |||
| Patients (n) | 1,373 | 290 | NA |
| Admissions (n) | 1,660 | 359 | NA |
| Age, mean (SD) years | 57 (21) | 57 (13) | 0.73 |
| Women, n (%) | 1,006 (61) | 173 (48) | <0.001 |
| Race, n (%) | <0.001 | ||
| White | 203 (12) | 133 (37) | |
| Black | 1,129 (68) | 125 (35) | |
| Hispanic | 26 (2) | 34 (9) | |
| Asian | 11 (1) | 10 (3) | |
| Other/unknown | 291 (18) | 57 (16) | |
| Severity of illness, n (%) | <0.001 | ||
| Minor | 121 (7) | 2 (1) | |
| Moderate | 461 (28) | 44 (12) | |
| Major | 677 (41) | 179 (50) | |
| Extreme | 329 (20) | 123 (34) | |
| N/A | 77 (4) | 11 (3) | |
| Discharged home, n (%) | 1,347 (81) | 282 (79) | 0.25 |
| Expired (not hospice), n (%) | 25 (2) | 28 (8) | <0.001 |
A total of 6034 individual PAR scores from 3419 patient‐days were obtained, which represented a response rate of 74.3%. The average PAR was 2.9 1.4. Table 2 shows the inter‐rater reliability between providers. Weighted kappa statistics ranged from 0.32 (for interns and attendings) to 0.43 (for midlevels and attendings), representing moderate inter‐rater reliability. No comparison was made between midlevel providers and interns or residents, as these participants never cared for the same patients on the same day.
| Provider Pair | Observations (n) | Agreement (%) | Weighted Kappa |
|---|---|---|---|
| Interns vs residents | 1,006 | 87.1 | 0.42 |
| Residents vs attendings | 1,012 | 82.5 | 0.35 |
| Interns vs attendings | 1,026 | 84.4 | 0.32 |
| Midlevels vs attendings | 208 | 85.0 | 0.43 |
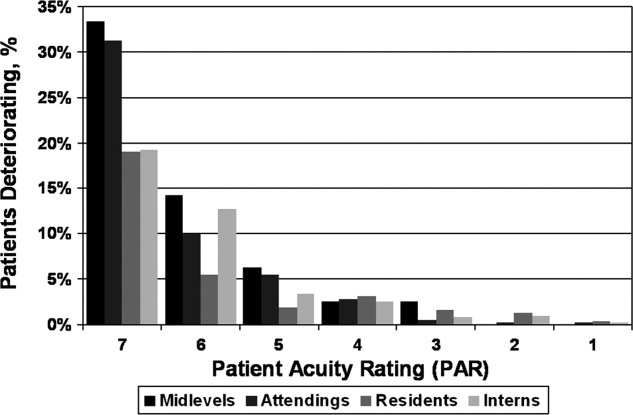
Seventy‐four of the 3419 patient‐days (2.2%) ended in cardiac arrest or unplanned ICU transfer. The distribution of clinical deterioration by average PAR, along with sensitivity and specificity values, are shown in Table 3. Using a cutoff value of 5 yielded a sensitivity of 62.2% and a specificity of 84.6%. Lowering the threshold to 4 increased the sensitivity to 82.4% but decreased the specificity to 68.3%. This corresponded with a combined AUC of 0.82 [95% CI 0.77, 0.87] (Table 4). Provider‐specific AUC values ranged from a low of 0.69 [95% CI 0.59, 0.78] for residents to a high of 0.84 [95% CI 0.78, 0.90] for attendings on general medicine (P = 0.01). The remaining values were not statistically different from one another. Figure 2 shows the provider‐specific percentage of patients deteriorating by PAR. The risk of clinical deterioration decreased in logarithmic fashion as the PAR decreased for all provider types (P < 0.001). These results were confirmed using multivariate logistic regression adjusting for provider, service, and individual patient (data not shown). In addition, we found no significant differences in AUC values between attendings in terms of years in practice or specialty, however, the study was not powered to detect such differences.
| PAR | All Patients (n) | Decompensating Patients (n) | Sensitivity (%) | Specificity (%) |
|---|---|---|---|---|
| 7 | 40 | 12 | 16.2 | 99.2 |
| 6 | 184 | 30 | 40.5 | 95.4 |
| 5 | 561 | 46 | 62.2 | 84.6 |
| 4 | 1,120 | 61 | 82.4 | 68.3 |
| 3 | 2,044 | 69 | 93.2 | 41.0 |
| 2 | 3,005 | 73 | 98.6 | 12.3 |
| 1 | 3,419 | 74 | 100.0 | 0.0 |
| Service | Provider | Observations (n) | PAR, median (IQR) | AUROC (95% CI) |
|---|---|---|---|---|
| ||||
| General medicine | Interns | 1,567 | 3 (2‐4) | 0.79 (0.70, 0.88) |
| General medicine | Residents | 1,611 | 3 (2‐4) | 0.69 (0.59, 0.78)* |
| General medicine | Attendings | 1,791 | 3 (2‐4) | 0.84 (0.78, 0.90)* |
| Multispecialty | Attendings | 823 | 3 (2‐4) | 0.88 (0.79, 0.97) |
| Multispecialty | Midlevels | 242 | 3 (2‐4) | 0.80 (0.64, 0.95) |
| Combined | All | 3,419 | 3 (2‐4) | 0.82 (0.77, 0.87) |
DISCUSSION
Physicians frequently depend on subjective judgments in their decision making.6 However, these judgments are difficult to communicate succinctly and hard to compare among clinicians. We have developed a simple tool for quantifying provider judgment, which yields moderate inter‐rater reliability, and good accuracy in predicting which floor patients may suffer cardiac arrest or emergent ICU transfer in the next 24 hours at an academic medical center.
Physicians routinely use written sign‐outs to convey important information to covering physicians during the handoff process, with the result being loss of information and decreased communication.7, 8 A recent study found that sign‐outs are frequently lacking comprehensive data, with the least commonly conveyed information being the patient's current clinical condition.9 The PAR has the potential to improve clinician handoffs by succinctly summarizing a patient's risk level. This need is made even more pressing by the ACGME's new resident duty hour restrictions and impending further increase in handoffs, a known correlate with inpatient morbidity and mortality.10 The PAR could be added to the sign‐out and updated nightly to readily summarize the judgments of the primary inpatient providers for the covering physician who has little, if any, personal knowledge of the patient at hand.
While ours is the first to examine the correlation between physician judgment and clinical deterioration on the floors, several studies have evaluated the accuracy of clinical judgment in predicting mortality of critically ill hospitalized patients. In the study to understand prognoses and preferences for outcomes and risks of treatments (SUPPORT), for example, physicians accurately predicted 180‐day mortality of ICU patients with an AUC of 0.78.11 Similar studies in the neonatal intensive care setting revealed greater than 80% predictive ability to identify those patients who would be intubated or fail to survive.12 These intuitive judgments have faired well when compared to previously validated ICU‐based physiologic scoring systems, such as the Acute Physiology, Age, Chronic Health Evaluation (APACHE) system. A meta‐analysis of studies which compared physician intuition to various physiologic scoring systems found intuition to be significantly better at predicting ICU mortality with an AUC of 0.85 compared to 0.63, P = 0.002.13
Physiology‐based scoring systems, relying on routine vital signs, have been developed for non‐ICU inpatients. Smith and colleagues14 recently conducted a systematic review and identified 33 distinct scoring systems, which they independently validated on a single data set for the ability of the admission score to predict overall hospital mortality. The resulting AUC values ranged from 0.66 to 0.78.14 In a prospective study, Kho and colleagues used an electronic medical record (EMR) to generate real‐time risk scores for use in surveillance rounds by their Rapid Response Team (RRT).15 Their scoring system relied on systolic blood pressure, heart rate, respiratory rate, temperature, oxygen saturation, age, and body mass index. The resulting score yielded an AUC of 0.72, with a sensitivity of 88% and specificity of 48% using a cutoff of 3, or 34% and 86% using a cutoff of 5, for predicting code call, cardiopulmonary arrest, or transfer to an ICU. Similar to the latter study, using the PAR for RRT surveillance would allow an institution to set its threshold according to available resources. For example, the team could first evaluate all the patients with a PAR score of 7, followed by those who received a score of 6 and so on. Using the data from the current study, evaluating all the patients with scores of 5, 6, or 7 would require assessing 16% of the patients in order to identify 62% of the events. Adding patients with a score of 4 would require assessing one‐third of the floor patients, but would identify 82% of subsequent deteriorations.
Although the objective nature of physiology‐based scoring systems makes them very appealing, they have two significant limitations. The first is that these scoring systems either require manual vital sign data entry and score calculation, which can be labor intensive and impractical, or technological solutions such as an EMR, which are costly and therefore cannot be applied broadly to all hospitalized patients. In fact, in a recent survey of U.S. hospitals, only 1.5% were found to have a comprehensive EMR on all units.16 Additionally, they are limited by the quality of the data input. This is particularly true for the case of respiratory rate and mental status, which are frequently unreliably measured and documented in current practice.17, 18 The PAR score has the benefit of being readily generated in minimal time by a broad range of providers, as we have demonstrated.
Furthermore, it is well known that vital signs do not capture the full clinical picture, which is why most RRT activation criteria include a vague catch‐all trigger for provider worry or concern.19, 20 Interestingly, this trigger is frequently one of the top cited reasons for activating the RRT,21, 22 and is missed by any automated track‐and‐trigger scoring system which relies only on quantitative clinical assessments such as vital signs. The PAR allows this concern to be quantified, either for addition to a physiology‐based track‐and‐trigger system, or for use on its own, as we have done here.
It is interesting to note that, in this study, attending physician judgment was most predictive and resident judgment the least. One explanation may be that clinical judgment optimally requires both experience and at‐the‐bedside data. While attendings have the most experience, the amount of time interns spend at the bedside collecting data may offset their relative inexperience.23, 24 In contrast, residents generally spend less time at the bedside than interns and have only marginally more experience,25 suggesting that either strong clinical experience or a good amount of time at the bedside are required for the best assessments of risk. This is supported by the close agreement between the attendings and midlevels, who likely spend a comparable amount of time at the bedside as interns.
There are several imitations to this study. First, there may be respondent bias in those who chose to participate and the days in which they provided scores. We would expect this bias to work against the null hypothesis if providers with better clinical judgment were more inclined to participate, and were less likely to provide scores when they were very busy, and thus may have had less time to assess patients. However, the enrollment and response rates were quite good (88% and 74%, respectively) which likely mitigates against this bias. Another limitation is that the study was conducted at a single institution, and only on medical patients, which may limit its generalizability to other institutions and patient populations. Also, intern performance during this January through June period may not reflect their performance earlier in their training year. In addition, we did not have physiologic data available for the patients, and thus were not able to compare the PAR directly to a physiology‐based scoring system. Finally, it is theoretically possible that a provider could decide on the PAR and then transfer the patient to the ICU based on their score. However, we carefully surveyed physicians and nurse practitioners at the time of sign‐out, when they had finished their clinical work for the day, to minimize this risk. We also instructed providers not to share their PAR score with the covering physicians to avoid introduction of bias on the part of the cross‐covering physician.
This was a pilot study designed to measure the correlation between PAR scores and patient outcomes. The PAR has the potential to be added to any handoff system as a way to convey individual severity of illness for patients. In addition, it has the potential for use in risk stratifying patients for interventions, such as increased vital sign monitoring or heightened surveillance by cross‐covering physicians or Rapid Response Teams. One could imagine instructing interns to have a low threshold of concern for patients with high PAR scores, and even formalizing procedures for rounding on such patients a second time during the day or overnight, when on call. Future studies will be required to test its use in clinical practice, which would ideally include a randomized‐controlled trial.
We conclude that clinical judgment regarding floor patient stability is quantifiable in a readily obtained, low‐technology score that has moderate inter‐rater reliability and a good ability to distinguish patients who will suffer a cardiac arrest or require ICU transfer within the next 24 hours. Due to its simple and easy to administer nature, the PAR has the potential to be a useful tool for efficiently conveying complex assessments from one member of the healthcare team to another, thereby improving handoffs and identifying patients at risk of clinical deterioration who might benefit from earlier intervention.
Acknowledgements
The authors are grateful for the support and dedication of the residents, faculty, and staff in the Department of Medicine at the University of Chicago, without whom this study would not have been possible. They also thank Trevor C. Yuen for statistical support, David Beiser, MD, MS, and Kenneth Rasinski, PhD, for scientific advice, Kate Weaver for expert administrative support and Deborah Walsh, RN, MS, Jefferson Cua, and Amanda Schmitz for assistance with data collection.
- Accreditation Council for Graduate Medical Education (ACGME).Task Force on Quality Care and Professionalism.Proposed standards: common program requirements.2007. Available at: http://acgme‐2010standards.org/pdf/Proposed_Standards.pdf. Accessed August 16,year="2010"2010.
- ,,, et al.Association of workload of on‐call medical interns with on‐call sleep duration, shift duration, and participation in educational activities.JAMA.2008;300(10):1146–1153.
- Institute of Medicine (IOM).Committee on Optimizing Graduate Medical Trainee (Resident) Hours and Work Schedules to Improve Patient Safety.Report brief on resident duty hours: enhancing sleep, supervision, and safety.Washington, DC:National Academy Press;2008. Available at: http://www.iom.edu/∼/media/Files/Report%20Files/2008/Resident‐Duty‐Hours/residency%20hours%20revised% 20for%20web.pdf. Accessed August 16,year="2010"2010.
- ,,,,.Determining benchmarks for evaluation and management coding in an academic division of general surgery.J Am Coll Surg.2004;199(1):124–130.
- .Applying the 3M all patient refined diagnosis related groups grouper to measure inpatient severity in the VA.Med Care.2003;41(6):103–110.
- ,,.Non‐analytical models of clinical reasoning: the role of experience.Med Educ.2007;41(12):1140–1145.
- ,,,,.Communication failures in patient sign‐out and suggestions for improvement: a critical incident analysis.Qual Saf Health Care.2005;14(6):401–407.
- .Fumbled handoffs: one dropped ball after another.Ann Intern Med.2005;142(5):352–358.
- ,,,,.What are covering doctors told about their patients? Analysis of sign‐out among internal medicine house staff.Qual Saf Health Care.2009;18(4):248–255.
- ,,,,.Does housestaff discontinuity of care increase the risk for preventable adverse events?Ann Intern Med.1994;121(11):866–872.
- ,,, et al.The SUPPORT prognostic model—objective estimates of survival for seriously ill hospitalized adults.Ann Intern Med.1995;122(3):191–203.
- ,,,,,.Serial assessment of mortality in the neonatal intensive care unit by algorithm and intuition: certainty, uncertainty, and informed consent.Pediatrics.2002;109(5):878–886.
- ,,, et al.Mortality predictions in the intensive care unit: comparing physicians with scoring systems.Crit Care Med.2006;34(3):878–885.
- ,,,.Review and performance evaluation of aggregate weighted ‘track and trigger’ systems.Resuscitation.2008;77(2):170–179.
- ,,, et al.Utility of commonly captured data from an EHR to identify hospitalized patients at risk for clinical deterioration.AMIA Annu Symp Proc.2007:404–408.
- ,,, et al.Use of electronic health records in U.S. hospitals.N Engl J Med.2009;360(16):1628–1638.
- ,,,.The vexatious vital: neither clinical measurements by nurses nor an electronic monitor provides accurate measurements of respiratory rate in triage.Ann Emerg Med.2005;45(1):68–76.
- ,,,.Detection and documentation of dementia and delirium in acute geriatric wards.Gen Hosp Psychiatry.2004;26(1):31–35.
- ,,,,.Redefining in‐hospital resuscitation: the concept of the medical emergency team.Resuscitation.2001;48(2):105–110.
- ,,,,.The identification of risk factors for cardiac arrest and formulation of activation criteria to alert a medical emergency team.Resuscitation.2002;54(2):125–131.
- ,,, et al.Implementation of a medical emergency team in a large pediatric teaching hospital prevents respiratory and cardiopulmonary arrests outside the intensive care unit.Pediatr Crit Care Med.2007;8(3):236–246.
- ,,,,.Reduction of paediatric in‐patient cardiac arrest and death with a medical emergency team: preliminary results.Arch Dis Child.2005;90(11):1148–1152.
- ,,.Time analysis of a general medicine service: results from a random work sampling study.J Gen Intern Med.1994;9(5):272–277.
- ,,, et al.The on‐call experience of interns in internal medicine. Medical Education Task Force of Henry Ford Hospital.Arch Intern Med.1990;150(11):2294–2297.
- ,,,,,.Analyzing the time and value of housestaff inpatient work.J Gen Intern Med.1998;13(8):534–540.
Recently released Accreditation Council for Graduate Medical Education (ACGME) recommendations, set to take effect in 2011, place further limits on resident duty hours, which are expected to result in additional handoffs of patients between inpatient providers.1 The increase in these handoffs following the prior set of ACGME recommendations in 2003 has been cited as a potential etiology for the underwhelming effects of the duty hour restrictions on patient outcomes, whereby the benefits of well‐rested physicians are theorized to be offset by increased harm associated with discontinuous care, especially in high‐risk patients.2 In 2007, an Institute of Medicine committee on the topic recommended improving handovers to make the transfer of patient responsibility and information more effective and less error prone.3
Several strategies have been proposed, but an ideal way to quickly transfer complex medical information on numerous patients remains to be identified. A standardized metric of a patient's risk level, if accurate, has the potential to summarize how stable or unstable a patient might be. We hypothesized that clinicians would be able to quantify their judgments regarding the stability of their inpatients and that this measure would correlate with impending clinical deterioration as determined by cardiac arrest or intensive care unit (ICU) transfer within the next 24 hours.
METHODS
Study Design
We developed the Patient Acuity Rating (PAR), a 7‐point Likert scale to quantify clinician judgment regarding the stability of inpatients outside the ICU, and conducted a prospective study of its diagnostic accuracy for predicting impending clinical deterioration in an academic tertiary care hospital. Providers were prospectively surveyed once per call‐cycle, on the day after patient admission, and asked to rate each of their patients on their likelihood of suffering a cardiac arrest or being transferred to the ICU. The scale was anchored at both ends, with a PAR of 1 corresponding to extreme unlikelihood of suffering a cardiac arrest or requiring emergent ICU transfer within the next 24 hours, and a PAR of 7 corresponding with extreme likelihood (Figure 1). A score of 4 suggested neither likely nor unlikely to experience an event. No further anchors were provided.
Study Setting and Participants
This study was conducted at The University of Chicago Medical Center, an academic, tertiary care facility with approximately 600 inpatient beds. Subjects involved both the clinicians who provided PAR scores and the patients upon whom the PAR scores and outcomes were based. The clinicians included internal medicine interns, residents, and attending physicians, as well as midlevel providers (nurse practitioners or physician assistants). Clinicians were eligible for inclusion if they cared for patients on one of nine adult ward services between January and June 2008. They were included in the study if they consented to participate. Housestaff, with medicine attending supervision, covered patients on seven general medicine services, while midlevel practitioners, also with medicine attending supervision, covered patients on two hepatology and transplant services.
Providers were independently surveyed once per call‐cycle (every 2 to 4 days depending on the service) by study personnel regarding each of their patients, and instructed not to consult with other members of the team regarding their PAR score assignments. All patients for whom a participating clinician provided a PAR score were included in the analysis. Clinician subjects were carefully surveyed at the end of their work day, just prior to, or immediately following, their handover to the cross‐covering physician, so as to minimize the risk that they might alter their plan and transfer a patient to the ICU based on the PAR score.
Data Analysis
PAR scores were entered into a database (Excel, Microsoft Corporation, Redmond, WA) and then linked to patient demographic and outcome data obtained from hospital administrative databases. Weighted kappa statistics were used to evaluate inter‐rater reliability. Ordinal trend testing was used to correlate the PAR with patient outcomes by provider. In addition, receiver operator characteristics (ROC) curves were constructed, and area under the curve (AUC) calculated and compared among providers using paired chi‐squared statistics. Sensitivities and specificities were determined for each theoretical PAR cutoff. Clustered multivariate logistic regression was used to adjust for provider, service, and individual patient. All calculations were performed using a statistical software application (Stata, College Station, TX).
Approval
The study protocol, consent, and data collection mechanisms were approved by the Institutional Review Board of the University of Chicago Medical Center. Waiver of consent provisions were used for patients on the basis of minimal harm and general impracticability, while a written consent process was used for patient care providers. Collection of patient information was designed to comply with the Health Insurance Portability and Accountability Act of 1996 regulations.
RESULTS
During the study period, 140/159 (88.1%) eligible clinicians consented to participate. Of these clinicians, 45 (32.1%) were intern physicians, 40 (28.6%) were resident physicians, 51 (36.4%) were attending physicians, and 4 (2.9%) were midlevel providers. They provided PAR scores on 1663 distinct patients over the course of 2019 separate admissions. Table 1 shows the patient and admission demographics grouped by the type of medical service: general medicine teaching or multispecialty non‐teaching. Severity of illness assignments were determined using All Patient Refined Diagnosis Related Group (APR‐DRG) methodology, which incorporates features such as principle diagnosis at admission, co‐morbidities, complications during admission, age, and gender.4, 5 The multispecialty patients were more likely to be male, have a higher severity of illness, and die during the hospitalization, when compared to general medicine patients.
| Characteristic | General Medicine Teaching Services | Multispecialty Non‐Teaching Services | P‐Value |
|---|---|---|---|
| |||
| Patients (n) | 1,373 | 290 | NA |
| Admissions (n) | 1,660 | 359 | NA |
| Age, mean (SD) years | 57 (21) | 57 (13) | 0.73 |
| Women, n (%) | 1,006 (61) | 173 (48) | <0.001 |
| Race, n (%) | <0.001 | ||
| White | 203 (12) | 133 (37) | |
| Black | 1,129 (68) | 125 (35) | |
| Hispanic | 26 (2) | 34 (9) | |
| Asian | 11 (1) | 10 (3) | |
| Other/unknown | 291 (18) | 57 (16) | |
| Severity of illness, n (%) | <0.001 | ||
| Minor | 121 (7) | 2 (1) | |
| Moderate | 461 (28) | 44 (12) | |
| Major | 677 (41) | 179 (50) | |
| Extreme | 329 (20) | 123 (34) | |
| N/A | 77 (4) | 11 (3) | |
| Discharged home, n (%) | 1,347 (81) | 282 (79) | 0.25 |
| Expired (not hospice), n (%) | 25 (2) | 28 (8) | <0.001 |
A total of 6034 individual PAR scores from 3419 patient‐days were obtained, which represented a response rate of 74.3%. The average PAR was 2.9 1.4. Table 2 shows the inter‐rater reliability between providers. Weighted kappa statistics ranged from 0.32 (for interns and attendings) to 0.43 (for midlevels and attendings), representing moderate inter‐rater reliability. No comparison was made between midlevel providers and interns or residents, as these participants never cared for the same patients on the same day.
| Provider Pair | Observations (n) | Agreement (%) | Weighted Kappa |
|---|---|---|---|
| Interns vs residents | 1,006 | 87.1 | 0.42 |
| Residents vs attendings | 1,012 | 82.5 | 0.35 |
| Interns vs attendings | 1,026 | 84.4 | 0.32 |
| Midlevels vs attendings | 208 | 85.0 | 0.43 |
Seventy‐four of the 3419 patient‐days (2.2%) ended in cardiac arrest or unplanned ICU transfer. The distribution of clinical deterioration by average PAR, along with sensitivity and specificity values, are shown in Table 3. Using a cutoff value of 5 yielded a sensitivity of 62.2% and a specificity of 84.6%. Lowering the threshold to 4 increased the sensitivity to 82.4% but decreased the specificity to 68.3%. This corresponded with a combined AUC of 0.82 [95% CI 0.77, 0.87] (Table 4). Provider‐specific AUC values ranged from a low of 0.69 [95% CI 0.59, 0.78] for residents to a high of 0.84 [95% CI 0.78, 0.90] for attendings on general medicine (P = 0.01). The remaining values were not statistically different from one another. Figure 2 shows the provider‐specific percentage of patients deteriorating by PAR. The risk of clinical deterioration decreased in logarithmic fashion as the PAR decreased for all provider types (P < 0.001). These results were confirmed using multivariate logistic regression adjusting for provider, service, and individual patient (data not shown). In addition, we found no significant differences in AUC values between attendings in terms of years in practice or specialty, however, the study was not powered to detect such differences.
| PAR | All Patients (n) | Decompensating Patients (n) | Sensitivity (%) | Specificity (%) |
|---|---|---|---|---|
| 7 | 40 | 12 | 16.2 | 99.2 |
| 6 | 184 | 30 | 40.5 | 95.4 |
| 5 | 561 | 46 | 62.2 | 84.6 |
| 4 | 1,120 | 61 | 82.4 | 68.3 |
| 3 | 2,044 | 69 | 93.2 | 41.0 |
| 2 | 3,005 | 73 | 98.6 | 12.3 |
| 1 | 3,419 | 74 | 100.0 | 0.0 |
| Service | Provider | Observations (n) | PAR, median (IQR) | AUROC (95% CI) |
|---|---|---|---|---|
| ||||
| General medicine | Interns | 1,567 | 3 (2‐4) | 0.79 (0.70, 0.88) |
| General medicine | Residents | 1,611 | 3 (2‐4) | 0.69 (0.59, 0.78)* |
| General medicine | Attendings | 1,791 | 3 (2‐4) | 0.84 (0.78, 0.90)* |
| Multispecialty | Attendings | 823 | 3 (2‐4) | 0.88 (0.79, 0.97) |
| Multispecialty | Midlevels | 242 | 3 (2‐4) | 0.80 (0.64, 0.95) |
| Combined | All | 3,419 | 3 (2‐4) | 0.82 (0.77, 0.87) |
DISCUSSION
Physicians frequently depend on subjective judgments in their decision making.6 However, these judgments are difficult to communicate succinctly and hard to compare among clinicians. We have developed a simple tool for quantifying provider judgment, which yields moderate inter‐rater reliability, and good accuracy in predicting which floor patients may suffer cardiac arrest or emergent ICU transfer in the next 24 hours at an academic medical center.
Physicians routinely use written sign‐outs to convey important information to covering physicians during the handoff process, with the result being loss of information and decreased communication.7, 8 A recent study found that sign‐outs are frequently lacking comprehensive data, with the least commonly conveyed information being the patient's current clinical condition.9 The PAR has the potential to improve clinician handoffs by succinctly summarizing a patient's risk level. This need is made even more pressing by the ACGME's new resident duty hour restrictions and impending further increase in handoffs, a known correlate with inpatient morbidity and mortality.10 The PAR could be added to the sign‐out and updated nightly to readily summarize the judgments of the primary inpatient providers for the covering physician who has little, if any, personal knowledge of the patient at hand.
While ours is the first to examine the correlation between physician judgment and clinical deterioration on the floors, several studies have evaluated the accuracy of clinical judgment in predicting mortality of critically ill hospitalized patients. In the study to understand prognoses and preferences for outcomes and risks of treatments (SUPPORT), for example, physicians accurately predicted 180‐day mortality of ICU patients with an AUC of 0.78.11 Similar studies in the neonatal intensive care setting revealed greater than 80% predictive ability to identify those patients who would be intubated or fail to survive.12 These intuitive judgments have faired well when compared to previously validated ICU‐based physiologic scoring systems, such as the Acute Physiology, Age, Chronic Health Evaluation (APACHE) system. A meta‐analysis of studies which compared physician intuition to various physiologic scoring systems found intuition to be significantly better at predicting ICU mortality with an AUC of 0.85 compared to 0.63, P = 0.002.13
Physiology‐based scoring systems, relying on routine vital signs, have been developed for non‐ICU inpatients. Smith and colleagues14 recently conducted a systematic review and identified 33 distinct scoring systems, which they independently validated on a single data set for the ability of the admission score to predict overall hospital mortality. The resulting AUC values ranged from 0.66 to 0.78.14 In a prospective study, Kho and colleagues used an electronic medical record (EMR) to generate real‐time risk scores for use in surveillance rounds by their Rapid Response Team (RRT).15 Their scoring system relied on systolic blood pressure, heart rate, respiratory rate, temperature, oxygen saturation, age, and body mass index. The resulting score yielded an AUC of 0.72, with a sensitivity of 88% and specificity of 48% using a cutoff of 3, or 34% and 86% using a cutoff of 5, for predicting code call, cardiopulmonary arrest, or transfer to an ICU. Similar to the latter study, using the PAR for RRT surveillance would allow an institution to set its threshold according to available resources. For example, the team could first evaluate all the patients with a PAR score of 7, followed by those who received a score of 6 and so on. Using the data from the current study, evaluating all the patients with scores of 5, 6, or 7 would require assessing 16% of the patients in order to identify 62% of the events. Adding patients with a score of 4 would require assessing one‐third of the floor patients, but would identify 82% of subsequent deteriorations.
Although the objective nature of physiology‐based scoring systems makes them very appealing, they have two significant limitations. The first is that these scoring systems either require manual vital sign data entry and score calculation, which can be labor intensive and impractical, or technological solutions such as an EMR, which are costly and therefore cannot be applied broadly to all hospitalized patients. In fact, in a recent survey of U.S. hospitals, only 1.5% were found to have a comprehensive EMR on all units.16 Additionally, they are limited by the quality of the data input. This is particularly true for the case of respiratory rate and mental status, which are frequently unreliably measured and documented in current practice.17, 18 The PAR score has the benefit of being readily generated in minimal time by a broad range of providers, as we have demonstrated.
Furthermore, it is well known that vital signs do not capture the full clinical picture, which is why most RRT activation criteria include a vague catch‐all trigger for provider worry or concern.19, 20 Interestingly, this trigger is frequently one of the top cited reasons for activating the RRT,21, 22 and is missed by any automated track‐and‐trigger scoring system which relies only on quantitative clinical assessments such as vital signs. The PAR allows this concern to be quantified, either for addition to a physiology‐based track‐and‐trigger system, or for use on its own, as we have done here.
It is interesting to note that, in this study, attending physician judgment was most predictive and resident judgment the least. One explanation may be that clinical judgment optimally requires both experience and at‐the‐bedside data. While attendings have the most experience, the amount of time interns spend at the bedside collecting data may offset their relative inexperience.23, 24 In contrast, residents generally spend less time at the bedside than interns and have only marginally more experience,25 suggesting that either strong clinical experience or a good amount of time at the bedside are required for the best assessments of risk. This is supported by the close agreement between the attendings and midlevels, who likely spend a comparable amount of time at the bedside as interns.
There are several imitations to this study. First, there may be respondent bias in those who chose to participate and the days in which they provided scores. We would expect this bias to work against the null hypothesis if providers with better clinical judgment were more inclined to participate, and were less likely to provide scores when they were very busy, and thus may have had less time to assess patients. However, the enrollment and response rates were quite good (88% and 74%, respectively) which likely mitigates against this bias. Another limitation is that the study was conducted at a single institution, and only on medical patients, which may limit its generalizability to other institutions and patient populations. Also, intern performance during this January through June period may not reflect their performance earlier in their training year. In addition, we did not have physiologic data available for the patients, and thus were not able to compare the PAR directly to a physiology‐based scoring system. Finally, it is theoretically possible that a provider could decide on the PAR and then transfer the patient to the ICU based on their score. However, we carefully surveyed physicians and nurse practitioners at the time of sign‐out, when they had finished their clinical work for the day, to minimize this risk. We also instructed providers not to share their PAR score with the covering physicians to avoid introduction of bias on the part of the cross‐covering physician.
This was a pilot study designed to measure the correlation between PAR scores and patient outcomes. The PAR has the potential to be added to any handoff system as a way to convey individual severity of illness for patients. In addition, it has the potential for use in risk stratifying patients for interventions, such as increased vital sign monitoring or heightened surveillance by cross‐covering physicians or Rapid Response Teams. One could imagine instructing interns to have a low threshold of concern for patients with high PAR scores, and even formalizing procedures for rounding on such patients a second time during the day or overnight, when on call. Future studies will be required to test its use in clinical practice, which would ideally include a randomized‐controlled trial.
We conclude that clinical judgment regarding floor patient stability is quantifiable in a readily obtained, low‐technology score that has moderate inter‐rater reliability and a good ability to distinguish patients who will suffer a cardiac arrest or require ICU transfer within the next 24 hours. Due to its simple and easy to administer nature, the PAR has the potential to be a useful tool for efficiently conveying complex assessments from one member of the healthcare team to another, thereby improving handoffs and identifying patients at risk of clinical deterioration who might benefit from earlier intervention.
Acknowledgements
The authors are grateful for the support and dedication of the residents, faculty, and staff in the Department of Medicine at the University of Chicago, without whom this study would not have been possible. They also thank Trevor C. Yuen for statistical support, David Beiser, MD, MS, and Kenneth Rasinski, PhD, for scientific advice, Kate Weaver for expert administrative support and Deborah Walsh, RN, MS, Jefferson Cua, and Amanda Schmitz for assistance with data collection.
- Accreditation Council for Graduate Medical Education (ACGME).Task Force on Quality Care and Professionalism.Proposed standards: common program requirements.2007. Available at: http://acgme‐2010standards.org/pdf/Proposed_Standards.pdf. Accessed August 16,year="2010"2010.
- ,,, et al.Association of workload of on‐call medical interns with on‐call sleep duration, shift duration, and participation in educational activities.JAMA.2008;300(10):1146–1153.
- Institute of Medicine (IOM).Committee on Optimizing Graduate Medical Trainee (Resident) Hours and Work Schedules to Improve Patient Safety.Report brief on resident duty hours: enhancing sleep, supervision, and safety.Washington, DC:National Academy Press;2008. Available at: http://www.iom.edu/∼/media/Files/Report%20Files/2008/Resident‐Duty‐Hours/residency%20hours%20revised% 20for%20web.pdf. Accessed August 16,year="2010"2010.
- ,,,,.Determining benchmarks for evaluation and management coding in an academic division of general surgery.J Am Coll Surg.2004;199(1):124–130.
- .Applying the 3M all patient refined diagnosis related groups grouper to measure inpatient severity in the VA.Med Care.2003;41(6):103–110.
- ,,.Non‐analytical models of clinical reasoning: the role of experience.Med Educ.2007;41(12):1140–1145.
- ,,,,.Communication failures in patient sign‐out and suggestions for improvement: a critical incident analysis.Qual Saf Health Care.2005;14(6):401–407.
- .Fumbled handoffs: one dropped ball after another.Ann Intern Med.2005;142(5):352–358.
- ,,,,.What are covering doctors told about their patients? Analysis of sign‐out among internal medicine house staff.Qual Saf Health Care.2009;18(4):248–255.
- ,,,,.Does housestaff discontinuity of care increase the risk for preventable adverse events?Ann Intern Med.1994;121(11):866–872.
- ,,, et al.The SUPPORT prognostic model—objective estimates of survival for seriously ill hospitalized adults.Ann Intern Med.1995;122(3):191–203.
- ,,,,,.Serial assessment of mortality in the neonatal intensive care unit by algorithm and intuition: certainty, uncertainty, and informed consent.Pediatrics.2002;109(5):878–886.
- ,,, et al.Mortality predictions in the intensive care unit: comparing physicians with scoring systems.Crit Care Med.2006;34(3):878–885.
- ,,,.Review and performance evaluation of aggregate weighted ‘track and trigger’ systems.Resuscitation.2008;77(2):170–179.
- ,,, et al.Utility of commonly captured data from an EHR to identify hospitalized patients at risk for clinical deterioration.AMIA Annu Symp Proc.2007:404–408.
- ,,, et al.Use of electronic health records in U.S. hospitals.N Engl J Med.2009;360(16):1628–1638.
- ,,,.The vexatious vital: neither clinical measurements by nurses nor an electronic monitor provides accurate measurements of respiratory rate in triage.Ann Emerg Med.2005;45(1):68–76.
- ,,,.Detection and documentation of dementia and delirium in acute geriatric wards.Gen Hosp Psychiatry.2004;26(1):31–35.
- ,,,,.Redefining in‐hospital resuscitation: the concept of the medical emergency team.Resuscitation.2001;48(2):105–110.
- ,,,,.The identification of risk factors for cardiac arrest and formulation of activation criteria to alert a medical emergency team.Resuscitation.2002;54(2):125–131.
- ,,, et al.Implementation of a medical emergency team in a large pediatric teaching hospital prevents respiratory and cardiopulmonary arrests outside the intensive care unit.Pediatr Crit Care Med.2007;8(3):236–246.
- ,,,,.Reduction of paediatric in‐patient cardiac arrest and death with a medical emergency team: preliminary results.Arch Dis Child.2005;90(11):1148–1152.
- ,,.Time analysis of a general medicine service: results from a random work sampling study.J Gen Intern Med.1994;9(5):272–277.
- ,,, et al.The on‐call experience of interns in internal medicine. Medical Education Task Force of Henry Ford Hospital.Arch Intern Med.1990;150(11):2294–2297.
- ,,,,,.Analyzing the time and value of housestaff inpatient work.J Gen Intern Med.1998;13(8):534–540.
Copyright © 2011 Society of Hospital Medicine

Care Coordination Under Comanagement
Technological advances drive medical providers to specialize through the need for proficiency around increasingly focused areas of expertise.1 But the benefits of specialization are attained only by balancing the advantages of increasing expertise and the costs of coordinating care that must be borne as specialization increases.2 Integrating experts into modern medical delivery systems requires attention to the coordinating mechanisms that govern team‐based care.3
Coordination, defined as the management of task interdependencies,4 is a central component and a useful measure of teamwork.5 Several studies demonstrate the patient‐level impact of coordination among providers.69 Gittell et al.8 demonstrated that orthopedic hospitals whose staff had better relational coordination (RC) measures had shorter lengths of stay and better post‐operative pain control for patients undergoing surgery. In medical intensive care units (ICUs), Wheelan et al.9 showed that staff members of units with lower mortality rates perceived their teams as functioning at higher stages of group development and perceived their team members as less dependent and more trusting.
Communication is the cornerstone of effective team coordination.10, 11 As such, practice model interventions that facilitate frequent communication of higher quality are associated with lower error rates10 and better teamwork.11 The use of hospitalists, for example, is shown to capitalize on this advantage by improving coordination through physician availability that facilitates communication and relational interactions among hospital‐based staff.12 While system‐level interventions such as this have received significant attention from experts in organizations, empirical studies that explore the contribution of team member characteristics to overall coordination are lacking.13
Inpatient comanagement services offer a unique model for studying teamwork. While the label is used to describe a variety of arrangements,1416 comanagement broadly describes a practice model wherein providers of various specialties deliver direct care to patients, in contrast to the traditional generalist‐consultant model in which specialists lend expertise.17 Many recent comanagement practices involve hospitalists in partnership with surgeons in the care of patients with concurrent medical and surgical needs,18 but similar arrangements between hospitalists and medical subspecialists are being adopted in some medical centers for the care of complex patients with conditions such as heart failure, cancer, stroke, and solid organ transplantations. Coordination among providers has not been studied in this context.
The goals of this study are: (1) to measure the input of individual providers to the overall coordination of care on a highly interdependent medical comanagement service, (2) to characterize high and low coordinators, and (3) to explore the relationship between coordination and patient outcomes. The main hypothesis is that the quality of team coordination is determined partly by the attributes of its members such that their individual contributions to the coordination of care affect the outcomes of vulnerable hospitalized patients.
Materials and Methods
Setting
The study was conducted at the University of Chicago Medical Center, Chicago, IL, an urban 572‐bed tertiary care hospital. The comanaged multidisciplinary inpatient service serves hospitalized patients with complex medical needs. This study focused on providers and patients from a subset of the comanaged multidisciplinary inpatient service that involved the collaboration of medical hepatologists with hospitalists. A hepatology team, composed of an attending hepatologist and a fellow, comanaged with 2 hospitalist teams, each composed of an attending hospitalist and 1 or 2 nonphysician providers (NPPs). Attending physicians rotated on the service in 1‐week to 3‐week rotations, while fellows rotated in 4‐week stretches. NPPs worked nonuniform 3‐day or 4‐day weeks excluding weekends and holidays. The hepatology team was responsible for arranging admissions, developing a care plan with a specialty focus, coordinating care with transplant surgeons when necessary, and managing post‐discharge care. The hospitalist teams were responsible for admitting patients, managing routine and emergent inpatient issues, coordinating care with ancillary and consultative staff, and discharging patients. Dedicated evening and night hospitalists, who were not part of the comanaging day‐time teams, provided after‐hours care. Outside of these areas, there was no instruction or education about how responsibilities should be shared among providers on the service.
Subjects and Study Design
Baseline Survey of Providers
All hospitalists, NPPs, hepatologists, and fellows scheduled to rotate on the comanaged multidisciplinary inpatient service signed a written consent to participate. In April 2008 a nonanonymous baseline 17‐item paper survey was administered.
Items of the Baseline Survey (supporting information Appendix A) were generated from a consideration of the most salient issues around the management structure of comanagement models from a comprehensive review the literature. Two items addressed the respondents' experience and intent to leave their role. Twelve items addressed their preferences about the provider management structure of an ideally comanaged inpatient service, specifically soliciting their preferences about a single physician leader, consensus seeking, and their preferred degree of information, participation, and decision making under the model. Included in this set of items was a single item assessment of the provider's sense of patient ownership on an ideally comanaged service. The final 3 items addressed the perceived assignment of responsibilities. Each of these items presented a clinical objective followed by up to 7 contingent tasks on whose completion the successful execution of the objective depended. Each respondent was asked to indicate one or more of the 4 provider types that should be responsible for completing each task.
Repeated Survey of Providers
From April to October 2008, providers who rotated on the comanaged liver service were surveyed repeatedly to give information about the actual management structure and coordination within teams, which consisted of combinations of randomly assigned providers. Physicians were surveyed on the day when any 1 of the 3 physician types ended his or her rotation. NPPs were surveyed every Wednesday except on the weeks when none of the physicians had changed since the previous survey. One investigator (KH) hand‐delivered the surveys, usually during the first minutes of the joint daily rounds and collected them immediately upon completion. Surveys that could not be completed immediately were collected on daily rounds on subsequent days within 1 week. The primary reason for nonresponse was lost surveys that were not immediately completed.
The 14‐item Repeated Survey (supporting information Appendix B) consisted of 2 parts. The first 7 items reprised items from the Baseline Survey that addressed management structures, but were rephrased to allow respondents to report their experiences on their immediate rotation. The second part of the Repeated Survey addressed RC, which is described below.
The study protocols, consents, and data collection mechanisms were approved by the institutional review board of the University of Chicago Medical Center. Collection of patient information was designed to comply with the Health Insurance Portability and Accountability Act of 1996.
Patients
Patients were admitted to 1 of the 2 hospitalist teams on the comanaged service on alternating days, which allowed patients to be assigned to providers pseudo‐randomly. Consent to use clinical data was obtained during their stay or by telephone after discharge. If patients were unable to provide consent due to cognitive impairment, consent was sought through designated proxies.19
Main Measurements
Relational Care Coordination
The survey instrument used to measure individual contributions to overall coordination was adapted from the Relational Coordination tool developed by Gittell.20 This instrument was chosen because it has already been validated in various clinical contexts8, 12, 21 and the theoretical assumptions about the independent relational and communication components of coordination are applicable to our context. RC is characterized by the 7 domains of frequent, timely, accurate, and problem‐solving communications; shared goals, shared knowledge, and mutual respect. Respondents rated, on a 5‐point scale (1 = negative, 5 = positive), team members of the other 3 provider types during each rotation on all of the 7 domains. The mean across the domains yielded the RC score. Although the instrument was originally developed to measure the coordination in groups of individuals, the RC for a single provider was calculated by taking the mean of all the RC directed at that individual across team members who worked with him or her during the study period. Because some providers worked more rotations than others, a nonuniform number of observations contributed to the calculation of individual RC (Table 1). For each provider type, individuals were ranked on their RC and categorized in tertiles representing high, middle, and low coordinators.
| Baseline Survey (%) | Repeated Surveys (%) | % Female | Years Experience Median (range) | # RC Evaluations of Each Provider Median (range) | RC Mean (range) | |
|---|---|---|---|---|---|---|
| ||||||
| Hospitalists | 15/15 (100) | 36/43 (84) | 42 | 1 (0‐10) | 6 (3‐21) | 4.71 (4.33‐4.94) |
| NPPs | 5/5 (100) | 92/97 (95) | 100 | 4 (2‐15) | 30 (23‐34) | 4.60 (4.48‐4.71) |
| Hepatologists | 6/6 (100) | 26/42 (62) | 33 | 7 (1‐25) | 16 (5‐51) | 4.37 (4.03‐4.59) |
| GI fellows | 6/6 (100) | 23/42 (55) | 48 | 1 (0‐1) | 19 (8‐37) | 4.28 (3.88‐4.53) |
| Total | 32/32 (100) | 177/223 (79) | 55 | 2 (0‐25) | 12.5 (3‐51) | 4.57 (3.88‐4.94) |
Statistical Analysis
The discriminating ability of the RC for individuals was assessed by comparing the highest and lowest RC of each provider type using the 2‐tailed t‐test. The difference in responses to items from the Baseline and Repeated Surveys by individual RC tertiles was assessed with the Chi‐squared test for categorical data and the 2‐tailed t‐test for comparing means. For each physician type, the frequency of the composite bad outcomes between the highest and lowest RC tertile categories were compared using a 2‐sample Wilcoxon rank‐sum (Mann‐Whitney) test for nonparametric data.
Results
All 32 providers (100%) completed the Baseline Survey and participated in the Repeated Surveys of which 177/224 (79%) were completed. The median number of surveys that contributed to the calculation of individual RC and the mean RC by provider type are summarized in Table 1.
Of the 119 patients managed on the service, the mean age (standard deviation [SD]) was 55 (14) years and 48% were women. Of the 201 hospitalizations, there were 13 floor‐to‐ICU transfers and 5 in‐hospital deaths, however, we excluded from the analysis 1 death of a patient who was admitted under inpatient hospice status.
RC Measures
Individual provider RC ranges were 4.33 to 4.94 (p = 0.05) for hospitalists; 4.48 to 4.71 (p = 0.10) for NP/PAs; 4.03 to 4.59 (p < 0.01) for hepatologists; and 3.88 to 4.52 (p = 0.02) for fellows. The high, middle, and low coordinator categories for each provider type were shown to be durable through time by demonstrating that the coordination ranking of individuals was essentially preserved even when using partial data from each half of the study period. Thus, RC appears to reflect a stable attribute of the provider as opposed to specific circumstances of the rotation. The categories were shown to be durable to the influences of bad outcomes (inpatient deaths and ICU transfers) by demonstrating that the placement of individuals into 1 of the 3 coordination categories were preserved even when data from rotations involving a bad outcome were removed. Nonetheless, in order to address the possibility of bad outcomes negatively affecting perception of coordination, all analysis involving RC used the values that excluded data from these rotations.
Characteristics of Good and Poor Coordinators
Patient Ownership
The single‐item measure of patient ownership in the Baseline Survey reads: I have as much a sense of ownership of my patients on the comanaged service as on a non‐comanaged service. The majority of providers of every type in the high and middle coordinator categories agreed, while providers in the low coordinator category generally disagreed with the statement. The aggregated responses of all the provider types are shown in Table 2.
| Agree | Somewhat Agree | Somewhat Disagree | Disagree | |
|---|---|---|---|---|
| High | 4 | 6 | 0 | 1 |
| Middle | 5 | 4 | 0 | 2 |
| Low | 2 | 0 | 4 | 4 |
| p < 0.01 |
Leadership
Hepatologists are the potential leader of the comanaged team because of their content expertise in liver diseases. Their responses to the 3 items in the Baseline Survey that addressed perceived assignment of responsibilities are shown in Table 3. The high compared to the low coordinator hepatologists delegated the responsibility of completing necessary tasks to more providers, overall, such that an average of 3 providers were redundantly held responsible for the completion of each task by the high coordinators while only 1 provider was held responsible by the low coordinators. Furthermore, the high coordinators delegated the responsibility of completing more tasks to themselves compared to the low coordinators.
| Hepatologists | Mean # of Tasks Delegated Overall, n (SD) | Mean # of Providers Delegated to Each Task, n (SD) | Mean # of Tasks Delegated to Self, n (SD) |
|---|---|---|---|
| |||
| High (n = 2) | 56 (0.0) | 2.9 (0.0) | 11.5 (2.1) |
| Middle (n = 2) | 35 (2.8) | 1.8 (0.2) | 9.5 (3.5) |
| Low (n = 2) | 19 (1.4) | 1.0 (0.1) | 4.5 (2.1) |
| p value(high vs. low) | <0.01 | <0.01 | 0.08 |
According to responses to the management structure items of the Repeated Surveys, more providers of every type indicated that a single physician leader directed the overall management of every patient when a high or middle coordinator hospitalist was on service as opposed to a service with a low coordinator hospitalist (high 76% vs. middle 73% vs. low 58%, P = 0.06). Furthermore, a low coordinator hospitalist on service was more likely to indicate a desire for greater influence in directing the management of patients (desire influence 93% vs. not 7%, P < 0.01). This pattern was also seen with low coordinator NPPs, who more often indicated a desire for greater influence in directing patient management (desire influence 100% vs. not 0%, P < 0.01).
Experience
Age, years in practice, years at the institution, and time spent on the comanaged service were not associated with RC in our small sample of providers.
Outcomes by Provider Coordination
The unit of analysis in this section is the team‐patient encounter, which is the consecutive days during which a unique assortment of physicians managed a patient's hospitalization. NPPs could not be associated with any single team due to their nonuniform work patterns. The 201 hospitalizations in this study were composed of 351 team‐patient encounters. Table 4 displays the unadjusted frequency of inpatient deaths and ICU transfers that occurred during these encounters by RC tertiles. In each of the 3 physician types, composite bad outcomes are most frequent among the lowest coordinators. The pattern is statistically significant for hospitalists.
| Team‐Patient Encounters, n | Mean Length of Encounter, n (days) | ICU Transfer, n (%) | Hospital Death, n (%) | Bad Outcome, n (%) | |
|---|---|---|---|---|---|
| |||||
| Hospitalists | |||||
| High (n = 5) | 92 | 3.1 | 1 (1.1) | 1 (1.1) | 1 (1.1) |
| Middle (n = 5) | 119 | 3.2 | 1 (0.8) | 1 (0.8) | 1 (0.8) |
| Low (n = 5) | 140 | 3.2 | 11 (7.9) | 2 (1.4) | 12 (8.6) |
| p value (high vs. low) | NA | 0.70 | 0.02 | 0.82 | 0.02 |
| Hepatologists | |||||
| High (n = 2) | 99 | 3.2 | (2.0) | 0 (0.0) | 2 (2.0) |
| Middle (n = 2) | 79 | 3.4 | 3 (3.0) | 1 (1.3) | 3 (3.0) |
| Low (n = 2) | 173 | 3.0 | 8 (4.6) | 3 (1.7) | 9 (5.2) |
| p value (high vs. low) | NA | 0.52 | 0.27 | 0.19 | 0.20 |
| GI fellows | |||||
| High (n = 2) | 111 | 3.1 | 2 (1.8) | 0 (0.0) | 2 (1.8) |
| Middle (n = 2) | 67 | 3.3 | 2 (3.0) | 1 (1.5) | 2 (3.0) |
| Low (n = 2) | 173 | 3.2 | 9 (5.2) | 3 (1.7) | 10 (5.8) |
| p value (high vs. low) | NA | 0.74 | 0.15 | 0.16 | 0.10 |
Another interesting observation is the largest number of encounters in the lowest coordination tertile of each physician type. While the reason for this finding is not clear, associations between work‐load and poor coordination evoke issues related to burnout. In order to address the possibility of an artifactually elevated probability of a bad outcome among providers who rotated through the service more often, we calculated the correlation between the number of encounter‐days and the frequency of bad outcomes for the 15 providers who were associated with at last one such event. If these events occurred by chance, we should find a positive correlation between its frequency and the number of encounters. The Pearson's correlation coefficient of 0.38 suggests that bad outcomes do not occur more frequently with providers who work more rotations by chance alone.
Discussion
By adapting Gittell's RC instrument to focus on individual providers, we found that their characteristic attributes such as preference for particular management styles, leadership quality, and patient ownership are associated with their externally perceived contributions to the overall coordination of care. In an unadjusted analysis, we also observed an intriguing trend towards more frequent major hospital complications when the worst coordinators of each physician type were on service.
Existing evidence22, 23 mostly summarized in a recent RAND Health report shows a weak association between clinical teamwork quality and patient mortality. While our data also support this association, it does so with limitations. Most importantly, the small sample size limited our ability to rigorously account for potential confounders that may have contributed to this apparent association. Further studies may better address whether or not bad outcomes are indeed associated with poor coordinators in highly interdependent clinical teams. In addition to confounding, the small sample size of providers makes the analysis vulnerable to type 1 errors. We addressed this issue by intensively surveying providers repeatedly to achieve a high resolution of the coordination and management structure measures from each comanaged team. The potential for omitted variables and reverse causality in that the coordination scores may be negatively influenced by particularly complex patients and bad outcomes remains a valid concern. We addressed this by confirming the stability of provider RC over time and excluding the RC data from rotations with a bad outcome, but the negative perception of an individual tied to past bad outcomes may persist beyond a particular rotation. Survey responses are subject to recall and hindsight biases, which we attempted to minimize by surveying respondents immediately after each team rotation. Finally, all of our findings may be not be generalizable to other comanagement settings. However, the important correlations between coordination and quality have been observed in other contexts.24, 25
In our study, in‐hospital deaths and ICU transfers are treated as consequences of uncoordinated care. This interpretation may be problematic for circumstances when death is inevitable no matter how well coordinated the care, or when transfer to a higher level of care is appropriate. The rationale for grouping the 2 events into 1 composite bad outcome is based on the assumption that both death and the escalation of care can be delayed to an extent, if not wholly prevented, with the coordinated utilization of a modern hospital's resources. The attribution of these events to poor coordinators may indicate the unraveling of coordination that normally must be maintained to help patients overcome decompensating events that are particularly common in the course of patients with severe liver diseases. Due to the exploratory nature of this analysis, additional studies are necessary to fully characterize the relationship between care coordination and care transfers.
An important implication of this study is that the communication skill and ethical disposition of each individual provider is relevant to the coordination that is sought in multi‐provider teams. Training medical professionals to be better team members may have direct impact on the patients they serve. Our finding about patient ownership suggests that commitment to patients in the framework of care is not merely tradition but a characteristic of competent physicians. Moreover, physicians' commitment to patients is a possible factor, not just in achieving patients' satisfaction, but in securing better outcomes. To that end, the teaching of this and other humanistic principles must remain a vital part of medical education at all levels of training.
Several implications about team leadership and hierarchy are apparent from the data. Findings around the perceived assignment of responsibilities show that high coordinator hepatologists acknowledge the advantages of overlapping task boundaries to prevent critical tasks from being missed and risking bad outcomes. High RC hepatologists in our study adopted a more participatory than supervisory role which presumably facilitated better coordination by transmitting organizational goals to other team members. The function of a comanaged team is likely to be enhanced by a fluid assignment of roles to better handle tasks with high uncertainty. Accordingly, comanagement models of care may not be appropriate in settings where tasks are not interdependent.26 Inherent hierarchy appears to be a feature of well coordinated teams. One possible interpretation of our data is that hospitalists who yield the leadership role to the hepatologist are perceived to be better coordinators and that those who insist on exerting more influence in team decisions are perceived to be poor coordinators.
Existing evidence around care coordination predicts that comanagement designs improve provider coordination through stage‐based and site‐based specialization.12 However, the mechanisms that mediate coordination and patient outcomes are not clear. Moreover, the mechanisms of coordinating multi‐disciplinary teams may be specific to each clinical setting. The role of individual provider characteristics on coordination deserves more attention. Similarly, the impact of organizational culture under which favorable provider characteristics thrive is unknown. Finally, a detailed exposition of patient ownership and the role patients play in affecting the coordination of healthcare resources needs further exploration.
- .Technology, specialization, and the allied health professions.J Allied Health.1983;12(3):177–182.
- .Hospitalists and the doctor‐patient relationship.J Legal Stud.2001;30:589–606.
- .From Chaos to Care: The Promise of Team‐Based medicine.Cambridge, MA:Perseus;2002.
- ,,.Determinants of coordination modes within organizations.Am Sociol Rev.1976;41:322–338.
- .Teamwork and patient safety in dynamic domains of healthcare: a review of the literature.Acta Anaesthesiol Scand.2009;53(2):143–151.
- ,,,,.The association between interdisciplinary collaboration and patient outcomes in a medical intensive care unit.Heart Lung.1992;21:18–24.
- ,,, et al.Patterns of coordination and clinical outcomes: a study of surgical services.Health Serv Res.1998;22:1211–1236.
- ,,, et al.Impact of relational coordination on quality of care, postoperative pain and functioning, and length of stay: a nine‐hospital study of surgical patients.Med Care.2000;38(8):807–819.
- ,,.The link between teamwork and patients' outcomes in intensive care units.Am J Crit Care.2003;12(6):527–534.
- ,,.Assessing system failures in operating rooms and intensive care units.Qual Saf health Care.2007;16:45–50.
- ,,, et al.Patient handover from surgery to intensive care: using Formula 1 pit‐stop and aviation models to improve safety and quality.Paediatr Anaesth.2007;17(5):470–478.
- ,,,.Is the doctor in? A relational approach to job design and the coordination of work.Hum Resour Manage.2008;47(4):729–755.
- ,,,.Developing a team performance framework for the intensive care unit.Crit Care Med.2009;37(5):1787–1793.
- ,,, et al.Medical and surgical comanagement after elective hip and knee arthroplasty: a randomized, controlled trial.Ann Intern Med.2004;141(1):28–38.
- ,,.Medical/psychiatric comanagement by nurse practitioners in chronic hepatitis C treatment: a case study.Arch Psychiatr Nurs.2007;21(2):87–90.
- ,.Perioperative medicine for the hospitalized patient.Med Clin North Am.2008;92(2):325–348.
- .The place and training of the general practitioner.Calif Med.1949;70(4):265–268.
- ,.Surgical comanagement: a natural evolution of hospitalist practice.J Hosp Med.2008;3(5):394–397.
- ,,,.Validation of a telephone version of the mini‐mental state examination.J Am Geriatr Soc.1992;40(7):697–702.
- .Organizing work to support relational co‐ordination.Int J of Human Resource Management.2000;11(3):517–539.
- ,,,,.Beyond our walls: impact of patient and provider coordination across the continuum on outcomes for surgical patients.Health Serv Res.2007;42:7–24.
- ,,,,.The effect of multidisciplinary care teams on intensive care unit mortality.Arch Intern Med.2010;170(4):369–376.
- ,,,.Outcome measures for effective teamwork in inpatient care: final report.Santa Monica:RAND Health;2008.
- ,,, et al.The performance of intensive care units: does good management make a difference?Med Care.1994;32(5):508–525.
- ,,,.Observational assessment of surgical teamwork: a feasibility study.World J Surg.2006;30(10):1774–1783.
- .Just because you can, doesn't mean that you should: A call for the rational application of hospitalist comanagement.J Hosp Med.2008;3(5):398–3402.
Technological advances drive medical providers to specialize through the need for proficiency around increasingly focused areas of expertise.1 But the benefits of specialization are attained only by balancing the advantages of increasing expertise and the costs of coordinating care that must be borne as specialization increases.2 Integrating experts into modern medical delivery systems requires attention to the coordinating mechanisms that govern team‐based care.3
Coordination, defined as the management of task interdependencies,4 is a central component and a useful measure of teamwork.5 Several studies demonstrate the patient‐level impact of coordination among providers.69 Gittell et al.8 demonstrated that orthopedic hospitals whose staff had better relational coordination (RC) measures had shorter lengths of stay and better post‐operative pain control for patients undergoing surgery. In medical intensive care units (ICUs), Wheelan et al.9 showed that staff members of units with lower mortality rates perceived their teams as functioning at higher stages of group development and perceived their team members as less dependent and more trusting.
Communication is the cornerstone of effective team coordination.10, 11 As such, practice model interventions that facilitate frequent communication of higher quality are associated with lower error rates10 and better teamwork.11 The use of hospitalists, for example, is shown to capitalize on this advantage by improving coordination through physician availability that facilitates communication and relational interactions among hospital‐based staff.12 While system‐level interventions such as this have received significant attention from experts in organizations, empirical studies that explore the contribution of team member characteristics to overall coordination are lacking.13
Inpatient comanagement services offer a unique model for studying teamwork. While the label is used to describe a variety of arrangements,1416 comanagement broadly describes a practice model wherein providers of various specialties deliver direct care to patients, in contrast to the traditional generalist‐consultant model in which specialists lend expertise.17 Many recent comanagement practices involve hospitalists in partnership with surgeons in the care of patients with concurrent medical and surgical needs,18 but similar arrangements between hospitalists and medical subspecialists are being adopted in some medical centers for the care of complex patients with conditions such as heart failure, cancer, stroke, and solid organ transplantations. Coordination among providers has not been studied in this context.
The goals of this study are: (1) to measure the input of individual providers to the overall coordination of care on a highly interdependent medical comanagement service, (2) to characterize high and low coordinators, and (3) to explore the relationship between coordination and patient outcomes. The main hypothesis is that the quality of team coordination is determined partly by the attributes of its members such that their individual contributions to the coordination of care affect the outcomes of vulnerable hospitalized patients.
Materials and Methods
Setting
The study was conducted at the University of Chicago Medical Center, Chicago, IL, an urban 572‐bed tertiary care hospital. The comanaged multidisciplinary inpatient service serves hospitalized patients with complex medical needs. This study focused on providers and patients from a subset of the comanaged multidisciplinary inpatient service that involved the collaboration of medical hepatologists with hospitalists. A hepatology team, composed of an attending hepatologist and a fellow, comanaged with 2 hospitalist teams, each composed of an attending hospitalist and 1 or 2 nonphysician providers (NPPs). Attending physicians rotated on the service in 1‐week to 3‐week rotations, while fellows rotated in 4‐week stretches. NPPs worked nonuniform 3‐day or 4‐day weeks excluding weekends and holidays. The hepatology team was responsible for arranging admissions, developing a care plan with a specialty focus, coordinating care with transplant surgeons when necessary, and managing post‐discharge care. The hospitalist teams were responsible for admitting patients, managing routine and emergent inpatient issues, coordinating care with ancillary and consultative staff, and discharging patients. Dedicated evening and night hospitalists, who were not part of the comanaging day‐time teams, provided after‐hours care. Outside of these areas, there was no instruction or education about how responsibilities should be shared among providers on the service.
Subjects and Study Design
Baseline Survey of Providers
All hospitalists, NPPs, hepatologists, and fellows scheduled to rotate on the comanaged multidisciplinary inpatient service signed a written consent to participate. In April 2008 a nonanonymous baseline 17‐item paper survey was administered.
Items of the Baseline Survey (supporting information Appendix A) were generated from a consideration of the most salient issues around the management structure of comanagement models from a comprehensive review the literature. Two items addressed the respondents' experience and intent to leave their role. Twelve items addressed their preferences about the provider management structure of an ideally comanaged inpatient service, specifically soliciting their preferences about a single physician leader, consensus seeking, and their preferred degree of information, participation, and decision making under the model. Included in this set of items was a single item assessment of the provider's sense of patient ownership on an ideally comanaged service. The final 3 items addressed the perceived assignment of responsibilities. Each of these items presented a clinical objective followed by up to 7 contingent tasks on whose completion the successful execution of the objective depended. Each respondent was asked to indicate one or more of the 4 provider types that should be responsible for completing each task.
Repeated Survey of Providers
From April to October 2008, providers who rotated on the comanaged liver service were surveyed repeatedly to give information about the actual management structure and coordination within teams, which consisted of combinations of randomly assigned providers. Physicians were surveyed on the day when any 1 of the 3 physician types ended his or her rotation. NPPs were surveyed every Wednesday except on the weeks when none of the physicians had changed since the previous survey. One investigator (KH) hand‐delivered the surveys, usually during the first minutes of the joint daily rounds and collected them immediately upon completion. Surveys that could not be completed immediately were collected on daily rounds on subsequent days within 1 week. The primary reason for nonresponse was lost surveys that were not immediately completed.
The 14‐item Repeated Survey (supporting information Appendix B) consisted of 2 parts. The first 7 items reprised items from the Baseline Survey that addressed management structures, but were rephrased to allow respondents to report their experiences on their immediate rotation. The second part of the Repeated Survey addressed RC, which is described below.
The study protocols, consents, and data collection mechanisms were approved by the institutional review board of the University of Chicago Medical Center. Collection of patient information was designed to comply with the Health Insurance Portability and Accountability Act of 1996.
Patients
Patients were admitted to 1 of the 2 hospitalist teams on the comanaged service on alternating days, which allowed patients to be assigned to providers pseudo‐randomly. Consent to use clinical data was obtained during their stay or by telephone after discharge. If patients were unable to provide consent due to cognitive impairment, consent was sought through designated proxies.19
Main Measurements
Relational Care Coordination
The survey instrument used to measure individual contributions to overall coordination was adapted from the Relational Coordination tool developed by Gittell.20 This instrument was chosen because it has already been validated in various clinical contexts8, 12, 21 and the theoretical assumptions about the independent relational and communication components of coordination are applicable to our context. RC is characterized by the 7 domains of frequent, timely, accurate, and problem‐solving communications; shared goals, shared knowledge, and mutual respect. Respondents rated, on a 5‐point scale (1 = negative, 5 = positive), team members of the other 3 provider types during each rotation on all of the 7 domains. The mean across the domains yielded the RC score. Although the instrument was originally developed to measure the coordination in groups of individuals, the RC for a single provider was calculated by taking the mean of all the RC directed at that individual across team members who worked with him or her during the study period. Because some providers worked more rotations than others, a nonuniform number of observations contributed to the calculation of individual RC (Table 1). For each provider type, individuals were ranked on their RC and categorized in tertiles representing high, middle, and low coordinators.
| Baseline Survey (%) | Repeated Surveys (%) | % Female | Years Experience Median (range) | # RC Evaluations of Each Provider Median (range) | RC Mean (range) | |
|---|---|---|---|---|---|---|
| ||||||
| Hospitalists | 15/15 (100) | 36/43 (84) | 42 | 1 (0‐10) | 6 (3‐21) | 4.71 (4.33‐4.94) |
| NPPs | 5/5 (100) | 92/97 (95) | 100 | 4 (2‐15) | 30 (23‐34) | 4.60 (4.48‐4.71) |
| Hepatologists | 6/6 (100) | 26/42 (62) | 33 | 7 (1‐25) | 16 (5‐51) | 4.37 (4.03‐4.59) |
| GI fellows | 6/6 (100) | 23/42 (55) | 48 | 1 (0‐1) | 19 (8‐37) | 4.28 (3.88‐4.53) |
| Total | 32/32 (100) | 177/223 (79) | 55 | 2 (0‐25) | 12.5 (3‐51) | 4.57 (3.88‐4.94) |
Statistical Analysis
The discriminating ability of the RC for individuals was assessed by comparing the highest and lowest RC of each provider type using the 2‐tailed t‐test. The difference in responses to items from the Baseline and Repeated Surveys by individual RC tertiles was assessed with the Chi‐squared test for categorical data and the 2‐tailed t‐test for comparing means. For each physician type, the frequency of the composite bad outcomes between the highest and lowest RC tertile categories were compared using a 2‐sample Wilcoxon rank‐sum (Mann‐Whitney) test for nonparametric data.
Results
All 32 providers (100%) completed the Baseline Survey and participated in the Repeated Surveys of which 177/224 (79%) were completed. The median number of surveys that contributed to the calculation of individual RC and the mean RC by provider type are summarized in Table 1.
Of the 119 patients managed on the service, the mean age (standard deviation [SD]) was 55 (14) years and 48% were women. Of the 201 hospitalizations, there were 13 floor‐to‐ICU transfers and 5 in‐hospital deaths, however, we excluded from the analysis 1 death of a patient who was admitted under inpatient hospice status.
RC Measures
Individual provider RC ranges were 4.33 to 4.94 (p = 0.05) for hospitalists; 4.48 to 4.71 (p = 0.10) for NP/PAs; 4.03 to 4.59 (p < 0.01) for hepatologists; and 3.88 to 4.52 (p = 0.02) for fellows. The high, middle, and low coordinator categories for each provider type were shown to be durable through time by demonstrating that the coordination ranking of individuals was essentially preserved even when using partial data from each half of the study period. Thus, RC appears to reflect a stable attribute of the provider as opposed to specific circumstances of the rotation. The categories were shown to be durable to the influences of bad outcomes (inpatient deaths and ICU transfers) by demonstrating that the placement of individuals into 1 of the 3 coordination categories were preserved even when data from rotations involving a bad outcome were removed. Nonetheless, in order to address the possibility of bad outcomes negatively affecting perception of coordination, all analysis involving RC used the values that excluded data from these rotations.
Characteristics of Good and Poor Coordinators
Patient Ownership
The single‐item measure of patient ownership in the Baseline Survey reads: I have as much a sense of ownership of my patients on the comanaged service as on a non‐comanaged service. The majority of providers of every type in the high and middle coordinator categories agreed, while providers in the low coordinator category generally disagreed with the statement. The aggregated responses of all the provider types are shown in Table 2.
| Agree | Somewhat Agree | Somewhat Disagree | Disagree | |
|---|---|---|---|---|
| High | 4 | 6 | 0 | 1 |
| Middle | 5 | 4 | 0 | 2 |
| Low | 2 | 0 | 4 | 4 |
| p < 0.01 |
Leadership
Hepatologists are the potential leader of the comanaged team because of their content expertise in liver diseases. Their responses to the 3 items in the Baseline Survey that addressed perceived assignment of responsibilities are shown in Table 3. The high compared to the low coordinator hepatologists delegated the responsibility of completing necessary tasks to more providers, overall, such that an average of 3 providers were redundantly held responsible for the completion of each task by the high coordinators while only 1 provider was held responsible by the low coordinators. Furthermore, the high coordinators delegated the responsibility of completing more tasks to themselves compared to the low coordinators.
| Hepatologists | Mean # of Tasks Delegated Overall, n (SD) | Mean # of Providers Delegated to Each Task, n (SD) | Mean # of Tasks Delegated to Self, n (SD) |
|---|---|---|---|
| |||
| High (n = 2) | 56 (0.0) | 2.9 (0.0) | 11.5 (2.1) |
| Middle (n = 2) | 35 (2.8) | 1.8 (0.2) | 9.5 (3.5) |
| Low (n = 2) | 19 (1.4) | 1.0 (0.1) | 4.5 (2.1) |
| p value(high vs. low) | <0.01 | <0.01 | 0.08 |
According to responses to the management structure items of the Repeated Surveys, more providers of every type indicated that a single physician leader directed the overall management of every patient when a high or middle coordinator hospitalist was on service as opposed to a service with a low coordinator hospitalist (high 76% vs. middle 73% vs. low 58%, P = 0.06). Furthermore, a low coordinator hospitalist on service was more likely to indicate a desire for greater influence in directing the management of patients (desire influence 93% vs. not 7%, P < 0.01). This pattern was also seen with low coordinator NPPs, who more often indicated a desire for greater influence in directing patient management (desire influence 100% vs. not 0%, P < 0.01).
Experience
Age, years in practice, years at the institution, and time spent on the comanaged service were not associated with RC in our small sample of providers.
Outcomes by Provider Coordination
The unit of analysis in this section is the team‐patient encounter, which is the consecutive days during which a unique assortment of physicians managed a patient's hospitalization. NPPs could not be associated with any single team due to their nonuniform work patterns. The 201 hospitalizations in this study were composed of 351 team‐patient encounters. Table 4 displays the unadjusted frequency of inpatient deaths and ICU transfers that occurred during these encounters by RC tertiles. In each of the 3 physician types, composite bad outcomes are most frequent among the lowest coordinators. The pattern is statistically significant for hospitalists.
| Team‐Patient Encounters, n | Mean Length of Encounter, n (days) | ICU Transfer, n (%) | Hospital Death, n (%) | Bad Outcome, n (%) | |
|---|---|---|---|---|---|
| |||||
| Hospitalists | |||||
| High (n = 5) | 92 | 3.1 | 1 (1.1) | 1 (1.1) | 1 (1.1) |
| Middle (n = 5) | 119 | 3.2 | 1 (0.8) | 1 (0.8) | 1 (0.8) |
| Low (n = 5) | 140 | 3.2 | 11 (7.9) | 2 (1.4) | 12 (8.6) |
| p value (high vs. low) | NA | 0.70 | 0.02 | 0.82 | 0.02 |
| Hepatologists | |||||
| High (n = 2) | 99 | 3.2 | (2.0) | 0 (0.0) | 2 (2.0) |
| Middle (n = 2) | 79 | 3.4 | 3 (3.0) | 1 (1.3) | 3 (3.0) |
| Low (n = 2) | 173 | 3.0 | 8 (4.6) | 3 (1.7) | 9 (5.2) |
| p value (high vs. low) | NA | 0.52 | 0.27 | 0.19 | 0.20 |
| GI fellows | |||||
| High (n = 2) | 111 | 3.1 | 2 (1.8) | 0 (0.0) | 2 (1.8) |
| Middle (n = 2) | 67 | 3.3 | 2 (3.0) | 1 (1.5) | 2 (3.0) |
| Low (n = 2) | 173 | 3.2 | 9 (5.2) | 3 (1.7) | 10 (5.8) |
| p value (high vs. low) | NA | 0.74 | 0.15 | 0.16 | 0.10 |
Another interesting observation is the largest number of encounters in the lowest coordination tertile of each physician type. While the reason for this finding is not clear, associations between work‐load and poor coordination evoke issues related to burnout. In order to address the possibility of an artifactually elevated probability of a bad outcome among providers who rotated through the service more often, we calculated the correlation between the number of encounter‐days and the frequency of bad outcomes for the 15 providers who were associated with at last one such event. If these events occurred by chance, we should find a positive correlation between its frequency and the number of encounters. The Pearson's correlation coefficient of 0.38 suggests that bad outcomes do not occur more frequently with providers who work more rotations by chance alone.
Discussion
By adapting Gittell's RC instrument to focus on individual providers, we found that their characteristic attributes such as preference for particular management styles, leadership quality, and patient ownership are associated with their externally perceived contributions to the overall coordination of care. In an unadjusted analysis, we also observed an intriguing trend towards more frequent major hospital complications when the worst coordinators of each physician type were on service.
Existing evidence22, 23 mostly summarized in a recent RAND Health report shows a weak association between clinical teamwork quality and patient mortality. While our data also support this association, it does so with limitations. Most importantly, the small sample size limited our ability to rigorously account for potential confounders that may have contributed to this apparent association. Further studies may better address whether or not bad outcomes are indeed associated with poor coordinators in highly interdependent clinical teams. In addition to confounding, the small sample size of providers makes the analysis vulnerable to type 1 errors. We addressed this issue by intensively surveying providers repeatedly to achieve a high resolution of the coordination and management structure measures from each comanaged team. The potential for omitted variables and reverse causality in that the coordination scores may be negatively influenced by particularly complex patients and bad outcomes remains a valid concern. We addressed this by confirming the stability of provider RC over time and excluding the RC data from rotations with a bad outcome, but the negative perception of an individual tied to past bad outcomes may persist beyond a particular rotation. Survey responses are subject to recall and hindsight biases, which we attempted to minimize by surveying respondents immediately after each team rotation. Finally, all of our findings may be not be generalizable to other comanagement settings. However, the important correlations between coordination and quality have been observed in other contexts.24, 25
In our study, in‐hospital deaths and ICU transfers are treated as consequences of uncoordinated care. This interpretation may be problematic for circumstances when death is inevitable no matter how well coordinated the care, or when transfer to a higher level of care is appropriate. The rationale for grouping the 2 events into 1 composite bad outcome is based on the assumption that both death and the escalation of care can be delayed to an extent, if not wholly prevented, with the coordinated utilization of a modern hospital's resources. The attribution of these events to poor coordinators may indicate the unraveling of coordination that normally must be maintained to help patients overcome decompensating events that are particularly common in the course of patients with severe liver diseases. Due to the exploratory nature of this analysis, additional studies are necessary to fully characterize the relationship between care coordination and care transfers.
An important implication of this study is that the communication skill and ethical disposition of each individual provider is relevant to the coordination that is sought in multi‐provider teams. Training medical professionals to be better team members may have direct impact on the patients they serve. Our finding about patient ownership suggests that commitment to patients in the framework of care is not merely tradition but a characteristic of competent physicians. Moreover, physicians' commitment to patients is a possible factor, not just in achieving patients' satisfaction, but in securing better outcomes. To that end, the teaching of this and other humanistic principles must remain a vital part of medical education at all levels of training.
Several implications about team leadership and hierarchy are apparent from the data. Findings around the perceived assignment of responsibilities show that high coordinator hepatologists acknowledge the advantages of overlapping task boundaries to prevent critical tasks from being missed and risking bad outcomes. High RC hepatologists in our study adopted a more participatory than supervisory role which presumably facilitated better coordination by transmitting organizational goals to other team members. The function of a comanaged team is likely to be enhanced by a fluid assignment of roles to better handle tasks with high uncertainty. Accordingly, comanagement models of care may not be appropriate in settings where tasks are not interdependent.26 Inherent hierarchy appears to be a feature of well coordinated teams. One possible interpretation of our data is that hospitalists who yield the leadership role to the hepatologist are perceived to be better coordinators and that those who insist on exerting more influence in team decisions are perceived to be poor coordinators.
Existing evidence around care coordination predicts that comanagement designs improve provider coordination through stage‐based and site‐based specialization.12 However, the mechanisms that mediate coordination and patient outcomes are not clear. Moreover, the mechanisms of coordinating multi‐disciplinary teams may be specific to each clinical setting. The role of individual provider characteristics on coordination deserves more attention. Similarly, the impact of organizational culture under which favorable provider characteristics thrive is unknown. Finally, a detailed exposition of patient ownership and the role patients play in affecting the coordination of healthcare resources needs further exploration.
- .Technology, specialization, and the allied health professions.J Allied Health.1983;12(3):177–182.
- .Hospitalists and the doctor‐patient relationship.J Legal Stud.2001;30:589–606.
- .From Chaos to Care: The Promise of Team‐Based medicine.Cambridge, MA:Perseus;2002.
- ,,.Determinants of coordination modes within organizations.Am Sociol Rev.1976;41:322–338.
- .Teamwork and patient safety in dynamic domains of healthcare: a review of the literature.Acta Anaesthesiol Scand.2009;53(2):143–151.
- ,,,,.The association between interdisciplinary collaboration and patient outcomes in a medical intensive care unit.Heart Lung.1992;21:18–24.
- ,,, et al.Patterns of coordination and clinical outcomes: a study of surgical services.Health Serv Res.1998;22:1211–1236.
- ,,, et al.Impact of relational coordination on quality of care, postoperative pain and functioning, and length of stay: a nine‐hospital study of surgical patients.Med Care.2000;38(8):807–819.
- ,,.The link between teamwork and patients' outcomes in intensive care units.Am J Crit Care.2003;12(6):527–534.
- ,,.Assessing system failures in operating rooms and intensive care units.Qual Saf health Care.2007;16:45–50.
- ,,, et al.Patient handover from surgery to intensive care: using Formula 1 pit‐stop and aviation models to improve safety and quality.Paediatr Anaesth.2007;17(5):470–478.
- ,,,.Is the doctor in? A relational approach to job design and the coordination of work.Hum Resour Manage.2008;47(4):729–755.
- ,,,.Developing a team performance framework for the intensive care unit.Crit Care Med.2009;37(5):1787–1793.
- ,,, et al.Medical and surgical comanagement after elective hip and knee arthroplasty: a randomized, controlled trial.Ann Intern Med.2004;141(1):28–38.
- ,,.Medical/psychiatric comanagement by nurse practitioners in chronic hepatitis C treatment: a case study.Arch Psychiatr Nurs.2007;21(2):87–90.
- ,.Perioperative medicine for the hospitalized patient.Med Clin North Am.2008;92(2):325–348.
- .The place and training of the general practitioner.Calif Med.1949;70(4):265–268.
- ,.Surgical comanagement: a natural evolution of hospitalist practice.J Hosp Med.2008;3(5):394–397.
- ,,,.Validation of a telephone version of the mini‐mental state examination.J Am Geriatr Soc.1992;40(7):697–702.
- .Organizing work to support relational co‐ordination.Int J of Human Resource Management.2000;11(3):517–539.
- ,,,,.Beyond our walls: impact of patient and provider coordination across the continuum on outcomes for surgical patients.Health Serv Res.2007;42:7–24.
- ,,,,.The effect of multidisciplinary care teams on intensive care unit mortality.Arch Intern Med.2010;170(4):369–376.
- ,,,.Outcome measures for effective teamwork in inpatient care: final report.Santa Monica:RAND Health;2008.
- ,,, et al.The performance of intensive care units: does good management make a difference?Med Care.1994;32(5):508–525.
- ,,,.Observational assessment of surgical teamwork: a feasibility study.World J Surg.2006;30(10):1774–1783.
- .Just because you can, doesn't mean that you should: A call for the rational application of hospitalist comanagement.J Hosp Med.2008;3(5):398–3402.
Copyright © 2010 Society of Hospital Medicine
Seniors Report Post‐Discharge Problems
Recently, there has been an increased focus on improving communication during care transitions for older patients as they leave the hospital. One reason for this focus is the increasing utilization of hospitalists, or hospital‐based physicians, caring for patients in the United States.1 As a result, many primary care physicians (PCPs) no longer care for their patients while in the hospital and may not be informed of their patients' hospitalization.2 Additionally, with an emphasis on shorter lengths of hospital stay, more extensive post‐discharge follow‐up is often warranted for patients, which often becomes the responsibility of a patient's PCP. Recently 6 societies (American College of Physicians, Society of General Internal Medicine, Society of Hospital Medicine, American Geriatrics Society, American College of Emergency Physicians, and Society of Academic Emergency Medicine) have recommended that a patient's PCP is notified during all steps in care transitions and that patient‐centered approaches are employed.3 Despite the increased need for improved inpatient‐ambulatory care transitions, the communication between hospitalists and PCPs has been characterized as being poor and ineffective.4 Prior studies have shown that PCPs are not aware of test results that require follow‐up, may not receive timely or high quality discharge materials, and have an overall poor perception of the quality of communication.46 Ensuring adequate communication is considered important due to the increased risk of adverse events that patients experience after discharge from the hospital.79 Furthermore, recent studies have shown that patients are often able to identify and report adverse events that would not be detected by medical record review alone.10, 11 Eliciting patient perspectives on their experiences after discharge and their expectations of communication between PCPs and hospital physicians can help clinical teams design more patient‐centered solutions for care transitions.
The aim of this study is to report older patients' experiences with problems after hospital discharge and their understanding and expectation of communication between hospital physicians and their PCP. We also explored the relationship between patient experiences and whether their PCPs were aware of their hospitalization.
Methods
Study Design
Patients were recruited for this study from February 2008 to July 2008 using the University of Chicago Hospitalist Study, a large ongoing study that interviews hospitalized patients regarding quality of care.1 Two enrollment strategies were used; in order to oversample frail elders, all patients who were defined to be vulnerable elders using the VES‐13, based on age, self‐rated health, and physical function are asked to consent to surveying their PCP about their admission.12 In addition, every tenth hospitalized patient (with medical record number ending in 5) was asked to consent to have his or her PCP surveyed about communication regarding their admission. Patients who could not name a PCP or those patients who named a physician who denied caring for that patient were excluded. The study was approved by the University of Chicago Institutional Review Board.
Inpatient Interview and Chart Review
Within 48 hours of hospitalization, patients were approached by trained research assistants and first asked to complete the telephone version of the Mini‐Mental Status Exam.13 For those patients who scored a 17 or below on this 22‐point instrument, a proxy was approached to consent to the study and complete the interview protocol. Patients or their proxies then completed an inpatient interview to ascertain age, sex, self‐reported race, income, education and place of residence (home, nursing home). Patients were also asked if their PCP is affiliated with the University of Chicago and whether they had been hospitalized in the year prior to admission. Chart reviews were conducted for calculation of length of stay and location of discharge was also obtained (ie, rehabilitation, home, nursing home).
Two‐Week Post‐Discharge Phone Interview
To ascertain patient reports of problems after discharge, we conducted telephone interviews of eligible patients and/or their proxies 2 weeks after discharge. During the telephone interviews, each patient was asked 12 open‐ended questions to facilitate the reporting of events. Interviews were conducted by trained research assistants, who were blinded to whether the PCP was aware of a patient's hospitalization. Questions focused on the patient's perception of the quality and extent of communication that occurred between his or her identified PCP and the inpatient physician who provided his or her care while hospitalized. For example, the patient was asked if his or her PCP was aware of the hospitalization and if so, the patient was also asked: Do you know who told your regular doctor? Patients were asked about their perception of their PCP's knowledge of their clinical course.
Because we were interested in understanding problems after discharge, we used critical incident technique to solicit the patient's experience with these events. This technique was initially developed to study aviation accidents and can broaden our understanding of rare and poorly observed events by using subjective reports of an individual's own experience.14, 15 From the literature, we a priori identified post‐discharge problems including difficulties with follow‐up tests or appointments, medication changes, and readmission. Thus, we asked each patient, Did anything bad or inconvenient happen following your hospital stay, such as problems with new medications, missing a test, going back to the hospital. The interviews were audio‐taped and transcribed for analysis.
PCP Surveys
To supplement the patient‐reported data and to complete our understanding of what communication did or did not take place, the PCP of each enrolled patient was faxed a survey that ascertained PCP awareness of the hospitalization using the yes or no response to the question Were you aware that your patient had been hospitalized? For those patients who successfully completed the interview, PCPs who had not responded to the fax were also called by telephone to ascertain whether they were aware of the hospitalization, when they became aware (during or post hospitalization) and how they came to be aware.
Data Analysis
The qualitative analysis of the patient interview data was performed using Atlas.ti 5.2 (Berlin) software program. The deductive approach was used for post‐discharge problems that had been characterized in prior literature, such as problems with follow up tests, medications, medical errors, and risk of rehospitalization.2, 16 The constant comparative method was used for the emergence of new codes.17 With this inductive method, the interviews were coded with no a priori assumptions, and each incident was characterized during the initial coding process. The incidents were then compared between the interviews to integrate them into themes and categories. This initial coding scheme was developed by a team (VA, JF, MP) from a sample of 5 transcripts. Using these newly emerged codes, the scheme was then applied to the rest of the transcripts (MP). Two new codes emerged from the deductive approach, negative emotions and patient empowerment, which are discussed in detail in the results.
Quantitative data were analyzed using Stata 10.0 (College Station, TX) software. Descriptive statistics were used to tabulate the frequency and percentage that patients reported a post‐discharge problem. A post‐discharge problem was defined by the patient reporting confusion or having problems at discharge with medications, follow‐up tests or appointments. The frequency and percentage for PCP‐reported awareness of the hospitalization was also tabulated. A Fisher's exact test was used to examine the association between post‐discharge problems and PCP awareness of hospitalization. Similar tests were performed to assess the association between new codes and post‐discharge problems. To assess for responder bias, responders and nonresponders were compared using chi‐square tests and t‐tests, where appropriate, to assess for differences in age, race, gender, education, income, admission in the past 12 months, residence, PCP location, mental status, length of stay, and discharge status.
Results
Of the 114 eligible patients recruited between February and July 2008, 64 patient interviews were completed (56%). The average patient age was 73 years. Most patients were female (69%), African American (70%), live at home (75%), and have a PCP located at the University of Chicago (70%). There were also several who were low income (23% below a median yearly income of $15,000), and did not attend any college (52%). These patients had an average length of stay of 5.3 days, nearly half (48%) having been hospitalized in the past year, and 6 patients (9%) required a proxy to complete the interview (Table 1). There were no significant differences between responders and nonresponders with respect to race, gender, education, income, admission in the past 12 months, residence, PCP location, mental status, length of stay, or discharge status. Responders were more likely to be older than nonresponders (73 years [95% confidence interval {CI} 6976 years] vs. 63 years for nonresponders [95% CI 5769 years]; [P < 0.01]).
Forty‐two percent (27) of patients reported experiencing a post‐discharge problem. These 27 patients reported 42 distinct problems, each of which fell into 1 of 5 broad categories (Table 2). The most common of these were patients having difficulty obtaining follow‐up tests or appointments. These patients either had delay in getting, or were unable to get, follow‐up appointments, or follow‐up tests and test results. There were also many patients who needed reevaluation and thus, were either readmitted to the hospital or had to return to the Emergency Department. Another major category was those who had problems getting medication or therapy. For example, one of (the patients) treatment medswas very hard to find and it delayed us giving her her meds. Others reported they were not properly prepared for discharge. Most of these patients did not receive proper discharge materials which then caused other issues. As one proxy reported, The services were supposed to be provided for (the patient) through her social worker, no one has been informed to her being discharged or her being sent home. We have not gotten any services. Lastly, a few patients reported having hospital complications, such as post‐procedural complications, or questions, such as diagnosis questions.0
| Patient Characteristics (n = 64) | n (%) |
|---|---|
| |
| Mean age (year), mean (SD) | 73 15 |
| Female sex | 44 (69) |
| African American | 45 (70) |
| Mini Mental Status Exam score, mean (SD) | 19 5.8 |
| Proxy used for interview | 6 (9) |
| Length of Stay, mean days (SD) | 5.3 6.1 |
| On‐site PCP (University of Chicago) | 45 (70) |
| Hospitalized in the year prior to admission | 31(48) |
| Income | |
| <$15,000 | 15 (23) |
| >$15,000 | 15 (23) |
| Don't know or refused | 34 (53) |
| Residence | |
| Own house or apartment | 48 (75) |
| Relative or friend house or apartment | 6 (9) |
| Nursing home, group home, long term care home | 10 (16) |
| Education | |
| No college | 33 (52) |
| At least some college | 25 (39) |
| Not sure or do not know | 6 (9) |
| Category (n) | Sub‐Category (n) | Representative Incident (Patient) |
|---|---|---|
| ||
| Difficulty obtaining follow‐up (12) | Appointment issues (8) | I had an earlier (follow‐up appointment) with (my PCP) but by me staying at my daughter's I didn't have access to a car. |
| Test issues (4) | I was in a very weakened state, so I was scared to get on the bus by myself (for the appointment for the chest x‐ray)..I'm going to try (to reschedule), because I can't seem to get the phone number. | |
| Needed re‐evaluation (10) | Readmission (7) | They let me come home, and then that morning they said when I got my house I was on the floor. And so that's why I had to go back to the hospital. |
| Return to ER or clinic (3) | I went back to the emergency room after a few weeks of course. | |
| Problems getting treatments (8) | Medication (7) | I had problems getting my medications because they tell me that the medication was so high, but anyway, I didn't get some of my medications. |
| Therapy (1) | I gave (my insurance company) the information sent the information they wanted to them and we thought everything was settledwe wasn't having any problems until I got hospitalized and came home and started trying to get my oxygen. | |
| Not prepared for discharge (8) | Discharge material issues (6) | I needed a copy of his discharge papers from the hospital for insurance purposesThey didn't give me a discharge paper. |
| Not ready to go home (2) | I told them I wasn't ready to leave, they told me I had to go. | |
| Ongoing problem or question after hospitalization (4) | Post‐procedural problem (3) | Now they're finding out all this bleeding but they don't know where I'm bleeding from. |
| Diagnosis questions (1) | I was diagnoseda long time ago and I went 8 years with this death sentence hanging over my headshe ran a battery of tests and they all came up negativenow they're coming up with the fact that I do have hepatitis C. | |
Patients were often uncertain of whether and how communication between the inpatient physician and PCP (Table 3) took place. One patient said, I don't know what the procedure is as far as giving him the message. Does she fax it to him? I don't know She told me that she was going to call and inform him on everything that happened. I don't know anything from there. The second most commonly expressed perception was from patients who assumed good communication had taken place between his or her physicians. This assumption was grounded in a belief that good communication naturally occurred between physicians. For example 1 patient expressed: (doctors) let the other doctors in too. That's the way to take care of stuff. Lastly, many patients expressed the feeling that their physicians were obligated to communicate with each other. As 1 patient reported, I think that they should have let (my PCP) know that I was in the hospital.
| Category (n) | Sub‐Category (n) | Representative Incident (Patient) |
|---|---|---|
| ||
| Patient Perceptions of inpatient physician communication with PCP (80) | Uncertainty or confusion about the communication (63) | I don't know if they spoke to each other over the phone or if they had any kind of communication. |
| Assumption of good communication (24) | Well I thought by me going to the hospital the doctors would let them know I was there because they all doctors. | |
| Obligation to communicate with PCP (16) | I think they should because there are two doctors who are attending me and they should have communication with each other. | |
Two new themes emerged from the inductive analysis (Table 4). Forty‐five percent of patients reported experiencing negative emotions. These negative emotions were most often expressed as frustration or confusion. For example, 1 patient expressed confusion by saying, When I usually have lab work done I have prescription signedmaybe they changed the way of doing it. Now the pharmacy called me. But I'm supposed to have a note or something. Patients who reported a post‐discharge problem were more likely to report negative emotions (67% vs. 26%, P < 0.01). Feelings of empowerment were reported by 31% of patients. Empowerment was expressed most often as the patient being proactive in communicating with the PCP. One patient reported, We informed (my PCP) and we filled in all of the information that we wanted him to know about. Empowerment was also expressed as being proactive in advocating for communication between the inpatient team and the PCP (Table 3). Some patients expressed feeling empowered through the support of a third party, such as a home nurse. In addition, patients who have a third party advocate are more likely to report being empowered. Empowerment was expressed by 26% of patients with no third party advocate compared with 71% of patients with a third party advocate (P = 0.02).
| Category (n) | Sub‐Category (n) | Representative Incident (Patient) |
|---|---|---|
| ||
| Negative emotions (43) | Frustration (28) | you don't have any decision in your own healthcare at all. I think that's terrible. |
| Confusion (15) | there were all sorts of other tests that different doctors whom I never even knew why they wanted to do these things. | |
| Patient empowerment (24) | Patient proactive in physician communication (19) | I made certain that everybody let (PCP) know exactly what I was doing the whole time I was in and out and all of that (63457) I took it upon myself to call (PCP). |
| Has a third party advocate (8) | The only reason [home follow‐up services] found out is because her nurse was concerned enough to call and keep inquiring about how she was doing. | |
| Patient proactive in his or her own healthcare (5) | I am not scared of the doctors and scared to speak up, especially when it comes to my body and my health. | |
From our sample of patients who completed a 2‐week post‐discharge interview, we were able to obtain PCP surveys for 40 (63%) of these patients (Figure 1). Thirty percent (12) of PCPs reported being unaware of the hospitalization. In all but 4 cases, PCPs had communicated with the medical team during hospitalization. Examining the association between PCP knowledge and patient reported post‐discharge problems showed that patients whose PCPs were not aware of the hospitalization were 2 times more likely to report a post‐discharge problem. A post‐discharge problem was reported by 67% of patients whose PCP was not aware of the hospitalization, while a post‐discharge problem was reported by 32% of patients whose PCP was aware (P < 0.05). Six patients reported returning to the ED or being readmitted. Four patients (33%) of PCPs who were unaware of hospitalization reported returning for reevaluation whereas 7% (n = 2) of patients whose PCP was aware of hospitalization reported returning for evaluation (P = 0.055). Interestingly, patients whose PCPs were not aware of the hospitalization reported feeling more empowered (58%) than those patients whose PCP were aware of the hospitalization (21%, P = 0.03). Because of possible confounding (patient report of problems post‐discharge problems may be affected by PCP awareness of hospitalization), we examined whether patients whose PCPs were aware of their hospitalization differed from those that did not. Patients whose PCPs were aware of their hospitalization were often older (75 vs. 69 years old), white (80% white vs. 65% nonwhite) and female (75% female vs. 54% male). While this small sample size prohibits examining for statistical significance, the magnitude of these differences suggests the need for a larger study to examine patient predictors of PCP awareness of hospitalization.
Discussion
In this sample of frail, older hospitalized patients, nearly half reported at least 1 post‐discharge problem. Most patients have perceptions of what communication did or did not take place between their physicians. While most do not understand the communication process, many expect good communication to occur, and feel that physicians are obligated to communicate with each other. However, patients' perceptions of communication highlight that patient expectations are far from the actual practice in some cases. Nearly half of patients reported feeling negative emotions, such as confusion and frustration, and patients were more likely to experience negative emotions when they also reported a post‐discharge problem. One‐third of patients reported feeling empowered. Empowerment was associated with having a third party who helped advocate for them. Paradoxically, patients whose PCP were not aware of their hospitalization were more likely to feel empowered. Lastly, more patients reported a post‐discharge problem when their PCP was not aware of the hospitalization.
Because this is predominantly a qualitative observational study, it is important to consider the mechanism for these findings since we cannot assume causal relationships. The association of negative emotions, like confusion and frustration, with post‐discharge problems could be explained due to additional stress of the problem itself or that a distressed frame of mind is associated with reporting more problems that may have been overlooked otherwise. In addition, the association between patient empowerment and lack of PCP awareness could be due to the fact that patients are forced to assume a more proactive role in contacting their PCP if they feel that their PCP was not aware. It is equally possible that PCP communication is selectively initiated by hospital physicians when the patients are least empowered. For example, our comparison of demographics for patients whose PCP was aware versus those that were not do suggest that patient characteristics might play a role in whether a patient's PCP is contacted. The association between a third party advocate and patient empowerment is likely explained as the third party is able to keep the patient informed and empowered.
This study has implications for efforts to design a more patient‐centered care transition for hospitalized older patients. First, patients and their proxies should be advocates for good communication to avoid the risks of care transitions. Prior interventions such as use of coaches to boost patient empowerment have had positive results for hospitalized older patients. Moreover, hospitals should keep in mind that problems after discharge are common and are linked to negative emotions, which may lower patient satisfaction or increase liability risk. Similarly, these findings also highlight the importance of keeping PCPs aware of patient hospitalization. For example, PCPs that are aware of hospitalization are better prepared to properly follow‐up on medications, tests, and appointments. The PCP can also help to better prepare the patient for discharge and ease the transition for the patient.
There are several limitations to our study. First and foremost, our small sample size limits our ability to examine statistical significance. This study was part of a short planning grant to design interventions to improve communication with PCPs during hospitalization. Efforts are currently underway to design a communication solution and educational intervention to highlight the importance of contacting PCPs during hospitalization. Because these patients were hospitalized on the teaching service, the resident with the guidance of the teaching attending is responsible for communicating with the PCP. The teaching attending was either a generalist, hospitalist, or specialist who routinely had no a priori relationship with patients prior to the hospitalization. Only 53% of patients were reached by telephone which raises the concern for nonresponse bias. Our low response rate highlights the challenge of doing this type of work with recently discharge patients in low income, underserved areas. In comparing responders and nonresponders, the only difference between the 2 groups was that responders were more likely to be older. One possible reason for this difference may be that older people are more likely to be at home and easier to contact over the phone. Similarly, since data were collected through interviews and adverse events were discussed, these results are subject to recall bias. Efforts were made to reduce this by calling within 2 to 3 weeks after discharge. Lastly, these findings are limited by generalizability. All the patients included in this study were from the University of Chicago Medical Center, which serves largely underserved, African American patients. The experiences of these patients may be unique to this site. In addition, we only studied patients who had a PCP, excluding a population of patients that are at inherent risk due to lack of a coordinating physician to guide ongoing care.
In conclusion, this study suggests that many frail, older patients reported experiencing a post‐discharge problem and patients whose PCPs did not know about their admission were more likely to report a post‐discharge problem. Systematic interventions to improve communications with PCPs during patient care transitions in and out of the hospital are needed.
Acknowledgements
The authors thank Ms. Meryl Prochaska for her research assistance and manuscript preparation.
- , , , et al.Effects of physician experience on costs and outcomes on an academic general medicine service: results of a trial of hospitalists.Ann Intern Med.2002;137(11):866–874.
- , .The Hospitalist Movement 5 Years Later.JAMA.2002;287(4):487–494.
- , , , et al.Transitions of Care Consensus Policy Statement American College of Physicians‐Society of General Internal Medicine‐Society of Hospital Medicine‐American Geriatrics Society‐American College of Emergency Physicians‐Society of Academic Emergency Medicine.J Gen Intern Med.2009;24(8):971–976.
- , , , , , .Deficits in Communication and information transfer between hospital‐based and primary care physicians: implications for patient safety and continuity of care.JAMA.2007;297(8):831–841.
- , , , et al.Patient safety concerns arising from test results that return after hospital discharge.Ann Intern Med.2005;143(2):121–131.
- , , , .Maintaining continuity of care: a look at the quality of communication between Ontario emergency departments and community physicians.CJEM.2005;7(3):155–161.
- , , , , .Adverse drug events occuring following hospital discharge.J Gen Intern Med.2005;20(4):317–323.
- , , , , , .Electronically screening discharge summaries for adverse medical events.J Am Med Infrom Assoc.2003;10(4):339–350.
- , , , , .The incidence and severity of adverse events affecting patients after discharge from the hospital.Ann Intern Med.2003;138:161–167.
- , , , et al.Comparing patient‐reported hospital adverse events with the medical record review: do patients know something that hospitals do not?Ann Intern Med.2005;149(2):100–108.
- , , , et al.What can hospitalized patients tell us about adverse events? Learning from the patient‐reported incidents.J Gen Intern Med.2005;20(9):830–836.
- , , , et al.The Vulnerable Elders Survey: a tool for identifying vulnerable older people in the community.J Am Geriatr Soc.2001;49:1691–1699.
- , , , .Validation of a telephone version of the mini‐mental state examination.J Am Geriatr Soc.1992;40(7):697–702.
- .The critical incident technique.Psychol Bull.1954;51(4):327–359.
- .The critical incident technique in service research.J Serv Res.2004;7:65–89.
- , , , .Medical errors related to discontinuity of care from an inpatient to an outpatient setting.J Gen Intern Med.2003;18:646–651.
- .A Purposeful approach to the constant comparative method in the analysis of qualitative interviews.Qual Quant2002;36:3392–3340.
Recently, there has been an increased focus on improving communication during care transitions for older patients as they leave the hospital. One reason for this focus is the increasing utilization of hospitalists, or hospital‐based physicians, caring for patients in the United States.1 As a result, many primary care physicians (PCPs) no longer care for their patients while in the hospital and may not be informed of their patients' hospitalization.2 Additionally, with an emphasis on shorter lengths of hospital stay, more extensive post‐discharge follow‐up is often warranted for patients, which often becomes the responsibility of a patient's PCP. Recently 6 societies (American College of Physicians, Society of General Internal Medicine, Society of Hospital Medicine, American Geriatrics Society, American College of Emergency Physicians, and Society of Academic Emergency Medicine) have recommended that a patient's PCP is notified during all steps in care transitions and that patient‐centered approaches are employed.3 Despite the increased need for improved inpatient‐ambulatory care transitions, the communication between hospitalists and PCPs has been characterized as being poor and ineffective.4 Prior studies have shown that PCPs are not aware of test results that require follow‐up, may not receive timely or high quality discharge materials, and have an overall poor perception of the quality of communication.46 Ensuring adequate communication is considered important due to the increased risk of adverse events that patients experience after discharge from the hospital.79 Furthermore, recent studies have shown that patients are often able to identify and report adverse events that would not be detected by medical record review alone.10, 11 Eliciting patient perspectives on their experiences after discharge and their expectations of communication between PCPs and hospital physicians can help clinical teams design more patient‐centered solutions for care transitions.
The aim of this study is to report older patients' experiences with problems after hospital discharge and their understanding and expectation of communication between hospital physicians and their PCP. We also explored the relationship between patient experiences and whether their PCPs were aware of their hospitalization.
Methods
Study Design
Patients were recruited for this study from February 2008 to July 2008 using the University of Chicago Hospitalist Study, a large ongoing study that interviews hospitalized patients regarding quality of care.1 Two enrollment strategies were used; in order to oversample frail elders, all patients who were defined to be vulnerable elders using the VES‐13, based on age, self‐rated health, and physical function are asked to consent to surveying their PCP about their admission.12 In addition, every tenth hospitalized patient (with medical record number ending in 5) was asked to consent to have his or her PCP surveyed about communication regarding their admission. Patients who could not name a PCP or those patients who named a physician who denied caring for that patient were excluded. The study was approved by the University of Chicago Institutional Review Board.
Inpatient Interview and Chart Review
Within 48 hours of hospitalization, patients were approached by trained research assistants and first asked to complete the telephone version of the Mini‐Mental Status Exam.13 For those patients who scored a 17 or below on this 22‐point instrument, a proxy was approached to consent to the study and complete the interview protocol. Patients or their proxies then completed an inpatient interview to ascertain age, sex, self‐reported race, income, education and place of residence (home, nursing home). Patients were also asked if their PCP is affiliated with the University of Chicago and whether they had been hospitalized in the year prior to admission. Chart reviews were conducted for calculation of length of stay and location of discharge was also obtained (ie, rehabilitation, home, nursing home).
Two‐Week Post‐Discharge Phone Interview
To ascertain patient reports of problems after discharge, we conducted telephone interviews of eligible patients and/or their proxies 2 weeks after discharge. During the telephone interviews, each patient was asked 12 open‐ended questions to facilitate the reporting of events. Interviews were conducted by trained research assistants, who were blinded to whether the PCP was aware of a patient's hospitalization. Questions focused on the patient's perception of the quality and extent of communication that occurred between his or her identified PCP and the inpatient physician who provided his or her care while hospitalized. For example, the patient was asked if his or her PCP was aware of the hospitalization and if so, the patient was also asked: Do you know who told your regular doctor? Patients were asked about their perception of their PCP's knowledge of their clinical course.
Because we were interested in understanding problems after discharge, we used critical incident technique to solicit the patient's experience with these events. This technique was initially developed to study aviation accidents and can broaden our understanding of rare and poorly observed events by using subjective reports of an individual's own experience.14, 15 From the literature, we a priori identified post‐discharge problems including difficulties with follow‐up tests or appointments, medication changes, and readmission. Thus, we asked each patient, Did anything bad or inconvenient happen following your hospital stay, such as problems with new medications, missing a test, going back to the hospital. The interviews were audio‐taped and transcribed for analysis.
PCP Surveys
To supplement the patient‐reported data and to complete our understanding of what communication did or did not take place, the PCP of each enrolled patient was faxed a survey that ascertained PCP awareness of the hospitalization using the yes or no response to the question Were you aware that your patient had been hospitalized? For those patients who successfully completed the interview, PCPs who had not responded to the fax were also called by telephone to ascertain whether they were aware of the hospitalization, when they became aware (during or post hospitalization) and how they came to be aware.
Data Analysis
The qualitative analysis of the patient interview data was performed using Atlas.ti 5.2 (Berlin) software program. The deductive approach was used for post‐discharge problems that had been characterized in prior literature, such as problems with follow up tests, medications, medical errors, and risk of rehospitalization.2, 16 The constant comparative method was used for the emergence of new codes.17 With this inductive method, the interviews were coded with no a priori assumptions, and each incident was characterized during the initial coding process. The incidents were then compared between the interviews to integrate them into themes and categories. This initial coding scheme was developed by a team (VA, JF, MP) from a sample of 5 transcripts. Using these newly emerged codes, the scheme was then applied to the rest of the transcripts (MP). Two new codes emerged from the deductive approach, negative emotions and patient empowerment, which are discussed in detail in the results.
Quantitative data were analyzed using Stata 10.0 (College Station, TX) software. Descriptive statistics were used to tabulate the frequency and percentage that patients reported a post‐discharge problem. A post‐discharge problem was defined by the patient reporting confusion or having problems at discharge with medications, follow‐up tests or appointments. The frequency and percentage for PCP‐reported awareness of the hospitalization was also tabulated. A Fisher's exact test was used to examine the association between post‐discharge problems and PCP awareness of hospitalization. Similar tests were performed to assess the association between new codes and post‐discharge problems. To assess for responder bias, responders and nonresponders were compared using chi‐square tests and t‐tests, where appropriate, to assess for differences in age, race, gender, education, income, admission in the past 12 months, residence, PCP location, mental status, length of stay, and discharge status.
Results
Of the 114 eligible patients recruited between February and July 2008, 64 patient interviews were completed (56%). The average patient age was 73 years. Most patients were female (69%), African American (70%), live at home (75%), and have a PCP located at the University of Chicago (70%). There were also several who were low income (23% below a median yearly income of $15,000), and did not attend any college (52%). These patients had an average length of stay of 5.3 days, nearly half (48%) having been hospitalized in the past year, and 6 patients (9%) required a proxy to complete the interview (Table 1). There were no significant differences between responders and nonresponders with respect to race, gender, education, income, admission in the past 12 months, residence, PCP location, mental status, length of stay, or discharge status. Responders were more likely to be older than nonresponders (73 years [95% confidence interval {CI} 6976 years] vs. 63 years for nonresponders [95% CI 5769 years]; [P < 0.01]).
Forty‐two percent (27) of patients reported experiencing a post‐discharge problem. These 27 patients reported 42 distinct problems, each of which fell into 1 of 5 broad categories (Table 2). The most common of these were patients having difficulty obtaining follow‐up tests or appointments. These patients either had delay in getting, or were unable to get, follow‐up appointments, or follow‐up tests and test results. There were also many patients who needed reevaluation and thus, were either readmitted to the hospital or had to return to the Emergency Department. Another major category was those who had problems getting medication or therapy. For example, one of (the patients) treatment medswas very hard to find and it delayed us giving her her meds. Others reported they were not properly prepared for discharge. Most of these patients did not receive proper discharge materials which then caused other issues. As one proxy reported, The services were supposed to be provided for (the patient) through her social worker, no one has been informed to her being discharged or her being sent home. We have not gotten any services. Lastly, a few patients reported having hospital complications, such as post‐procedural complications, or questions, such as diagnosis questions.0
| Patient Characteristics (n = 64) | n (%) |
|---|---|
| |
| Mean age (year), mean (SD) | 73 15 |
| Female sex | 44 (69) |
| African American | 45 (70) |
| Mini Mental Status Exam score, mean (SD) | 19 5.8 |
| Proxy used for interview | 6 (9) |
| Length of Stay, mean days (SD) | 5.3 6.1 |
| On‐site PCP (University of Chicago) | 45 (70) |
| Hospitalized in the year prior to admission | 31(48) |
| Income | |
| <$15,000 | 15 (23) |
| >$15,000 | 15 (23) |
| Don't know or refused | 34 (53) |
| Residence | |
| Own house or apartment | 48 (75) |
| Relative or friend house or apartment | 6 (9) |
| Nursing home, group home, long term care home | 10 (16) |
| Education | |
| No college | 33 (52) |
| At least some college | 25 (39) |
| Not sure or do not know | 6 (9) |
| Category (n) | Sub‐Category (n) | Representative Incident (Patient) |
|---|---|---|
| ||
| Difficulty obtaining follow‐up (12) | Appointment issues (8) | I had an earlier (follow‐up appointment) with (my PCP) but by me staying at my daughter's I didn't have access to a car. |
| Test issues (4) | I was in a very weakened state, so I was scared to get on the bus by myself (for the appointment for the chest x‐ray)..I'm going to try (to reschedule), because I can't seem to get the phone number. | |
| Needed re‐evaluation (10) | Readmission (7) | They let me come home, and then that morning they said when I got my house I was on the floor. And so that's why I had to go back to the hospital. |
| Return to ER or clinic (3) | I went back to the emergency room after a few weeks of course. | |
| Problems getting treatments (8) | Medication (7) | I had problems getting my medications because they tell me that the medication was so high, but anyway, I didn't get some of my medications. |
| Therapy (1) | I gave (my insurance company) the information sent the information they wanted to them and we thought everything was settledwe wasn't having any problems until I got hospitalized and came home and started trying to get my oxygen. | |
| Not prepared for discharge (8) | Discharge material issues (6) | I needed a copy of his discharge papers from the hospital for insurance purposesThey didn't give me a discharge paper. |
| Not ready to go home (2) | I told them I wasn't ready to leave, they told me I had to go. | |
| Ongoing problem or question after hospitalization (4) | Post‐procedural problem (3) | Now they're finding out all this bleeding but they don't know where I'm bleeding from. |
| Diagnosis questions (1) | I was diagnoseda long time ago and I went 8 years with this death sentence hanging over my headshe ran a battery of tests and they all came up negativenow they're coming up with the fact that I do have hepatitis C. | |
Patients were often uncertain of whether and how communication between the inpatient physician and PCP (Table 3) took place. One patient said, I don't know what the procedure is as far as giving him the message. Does she fax it to him? I don't know She told me that she was going to call and inform him on everything that happened. I don't know anything from there. The second most commonly expressed perception was from patients who assumed good communication had taken place between his or her physicians. This assumption was grounded in a belief that good communication naturally occurred between physicians. For example 1 patient expressed: (doctors) let the other doctors in too. That's the way to take care of stuff. Lastly, many patients expressed the feeling that their physicians were obligated to communicate with each other. As 1 patient reported, I think that they should have let (my PCP) know that I was in the hospital.
| Category (n) | Sub‐Category (n) | Representative Incident (Patient) |
|---|---|---|
| ||
| Patient Perceptions of inpatient physician communication with PCP (80) | Uncertainty or confusion about the communication (63) | I don't know if they spoke to each other over the phone or if they had any kind of communication. |
| Assumption of good communication (24) | Well I thought by me going to the hospital the doctors would let them know I was there because they all doctors. | |
| Obligation to communicate with PCP (16) | I think they should because there are two doctors who are attending me and they should have communication with each other. | |
Two new themes emerged from the inductive analysis (Table 4). Forty‐five percent of patients reported experiencing negative emotions. These negative emotions were most often expressed as frustration or confusion. For example, 1 patient expressed confusion by saying, When I usually have lab work done I have prescription signedmaybe they changed the way of doing it. Now the pharmacy called me. But I'm supposed to have a note or something. Patients who reported a post‐discharge problem were more likely to report negative emotions (67% vs. 26%, P < 0.01). Feelings of empowerment were reported by 31% of patients. Empowerment was expressed most often as the patient being proactive in communicating with the PCP. One patient reported, We informed (my PCP) and we filled in all of the information that we wanted him to know about. Empowerment was also expressed as being proactive in advocating for communication between the inpatient team and the PCP (Table 3). Some patients expressed feeling empowered through the support of a third party, such as a home nurse. In addition, patients who have a third party advocate are more likely to report being empowered. Empowerment was expressed by 26% of patients with no third party advocate compared with 71% of patients with a third party advocate (P = 0.02).
| Category (n) | Sub‐Category (n) | Representative Incident (Patient) |
|---|---|---|
| ||
| Negative emotions (43) | Frustration (28) | you don't have any decision in your own healthcare at all. I think that's terrible. |
| Confusion (15) | there were all sorts of other tests that different doctors whom I never even knew why they wanted to do these things. | |
| Patient empowerment (24) | Patient proactive in physician communication (19) | I made certain that everybody let (PCP) know exactly what I was doing the whole time I was in and out and all of that (63457) I took it upon myself to call (PCP). |
| Has a third party advocate (8) | The only reason [home follow‐up services] found out is because her nurse was concerned enough to call and keep inquiring about how she was doing. | |
| Patient proactive in his or her own healthcare (5) | I am not scared of the doctors and scared to speak up, especially when it comes to my body and my health. | |
From our sample of patients who completed a 2‐week post‐discharge interview, we were able to obtain PCP surveys for 40 (63%) of these patients (Figure 1). Thirty percent (12) of PCPs reported being unaware of the hospitalization. In all but 4 cases, PCPs had communicated with the medical team during hospitalization. Examining the association between PCP knowledge and patient reported post‐discharge problems showed that patients whose PCPs were not aware of the hospitalization were 2 times more likely to report a post‐discharge problem. A post‐discharge problem was reported by 67% of patients whose PCP was not aware of the hospitalization, while a post‐discharge problem was reported by 32% of patients whose PCP was aware (P < 0.05). Six patients reported returning to the ED or being readmitted. Four patients (33%) of PCPs who were unaware of hospitalization reported returning for reevaluation whereas 7% (n = 2) of patients whose PCP was aware of hospitalization reported returning for evaluation (P = 0.055). Interestingly, patients whose PCPs were not aware of the hospitalization reported feeling more empowered (58%) than those patients whose PCP were aware of the hospitalization (21%, P = 0.03). Because of possible confounding (patient report of problems post‐discharge problems may be affected by PCP awareness of hospitalization), we examined whether patients whose PCPs were aware of their hospitalization differed from those that did not. Patients whose PCPs were aware of their hospitalization were often older (75 vs. 69 years old), white (80% white vs. 65% nonwhite) and female (75% female vs. 54% male). While this small sample size prohibits examining for statistical significance, the magnitude of these differences suggests the need for a larger study to examine patient predictors of PCP awareness of hospitalization.
Discussion
In this sample of frail, older hospitalized patients, nearly half reported at least 1 post‐discharge problem. Most patients have perceptions of what communication did or did not take place between their physicians. While most do not understand the communication process, many expect good communication to occur, and feel that physicians are obligated to communicate with each other. However, patients' perceptions of communication highlight that patient expectations are far from the actual practice in some cases. Nearly half of patients reported feeling negative emotions, such as confusion and frustration, and patients were more likely to experience negative emotions when they also reported a post‐discharge problem. One‐third of patients reported feeling empowered. Empowerment was associated with having a third party who helped advocate for them. Paradoxically, patients whose PCP were not aware of their hospitalization were more likely to feel empowered. Lastly, more patients reported a post‐discharge problem when their PCP was not aware of the hospitalization.
Because this is predominantly a qualitative observational study, it is important to consider the mechanism for these findings since we cannot assume causal relationships. The association of negative emotions, like confusion and frustration, with post‐discharge problems could be explained due to additional stress of the problem itself or that a distressed frame of mind is associated with reporting more problems that may have been overlooked otherwise. In addition, the association between patient empowerment and lack of PCP awareness could be due to the fact that patients are forced to assume a more proactive role in contacting their PCP if they feel that their PCP was not aware. It is equally possible that PCP communication is selectively initiated by hospital physicians when the patients are least empowered. For example, our comparison of demographics for patients whose PCP was aware versus those that were not do suggest that patient characteristics might play a role in whether a patient's PCP is contacted. The association between a third party advocate and patient empowerment is likely explained as the third party is able to keep the patient informed and empowered.
This study has implications for efforts to design a more patient‐centered care transition for hospitalized older patients. First, patients and their proxies should be advocates for good communication to avoid the risks of care transitions. Prior interventions such as use of coaches to boost patient empowerment have had positive results for hospitalized older patients. Moreover, hospitals should keep in mind that problems after discharge are common and are linked to negative emotions, which may lower patient satisfaction or increase liability risk. Similarly, these findings also highlight the importance of keeping PCPs aware of patient hospitalization. For example, PCPs that are aware of hospitalization are better prepared to properly follow‐up on medications, tests, and appointments. The PCP can also help to better prepare the patient for discharge and ease the transition for the patient.
There are several limitations to our study. First and foremost, our small sample size limits our ability to examine statistical significance. This study was part of a short planning grant to design interventions to improve communication with PCPs during hospitalization. Efforts are currently underway to design a communication solution and educational intervention to highlight the importance of contacting PCPs during hospitalization. Because these patients were hospitalized on the teaching service, the resident with the guidance of the teaching attending is responsible for communicating with the PCP. The teaching attending was either a generalist, hospitalist, or specialist who routinely had no a priori relationship with patients prior to the hospitalization. Only 53% of patients were reached by telephone which raises the concern for nonresponse bias. Our low response rate highlights the challenge of doing this type of work with recently discharge patients in low income, underserved areas. In comparing responders and nonresponders, the only difference between the 2 groups was that responders were more likely to be older. One possible reason for this difference may be that older people are more likely to be at home and easier to contact over the phone. Similarly, since data were collected through interviews and adverse events were discussed, these results are subject to recall bias. Efforts were made to reduce this by calling within 2 to 3 weeks after discharge. Lastly, these findings are limited by generalizability. All the patients included in this study were from the University of Chicago Medical Center, which serves largely underserved, African American patients. The experiences of these patients may be unique to this site. In addition, we only studied patients who had a PCP, excluding a population of patients that are at inherent risk due to lack of a coordinating physician to guide ongoing care.
In conclusion, this study suggests that many frail, older patients reported experiencing a post‐discharge problem and patients whose PCPs did not know about their admission were more likely to report a post‐discharge problem. Systematic interventions to improve communications with PCPs during patient care transitions in and out of the hospital are needed.
Acknowledgements
The authors thank Ms. Meryl Prochaska for her research assistance and manuscript preparation.
- , , , et al.Effects of physician experience on costs and outcomes on an academic general medicine service: results of a trial of hospitalists.Ann Intern Med.2002;137(11):866–874.
- , .The Hospitalist Movement 5 Years Later.JAMA.2002;287(4):487–494.
- , , , et al.Transitions of Care Consensus Policy Statement American College of Physicians‐Society of General Internal Medicine‐Society of Hospital Medicine‐American Geriatrics Society‐American College of Emergency Physicians‐Society of Academic Emergency Medicine.J Gen Intern Med.2009;24(8):971–976.
- , , , , , .Deficits in Communication and information transfer between hospital‐based and primary care physicians: implications for patient safety and continuity of care.JAMA.2007;297(8):831–841.
- , , , et al.Patient safety concerns arising from test results that return after hospital discharge.Ann Intern Med.2005;143(2):121–131.
- , , , .Maintaining continuity of care: a look at the quality of communication between Ontario emergency departments and community physicians.CJEM.2005;7(3):155–161.
- , , , , .Adverse drug events occuring following hospital discharge.J Gen Intern Med.2005;20(4):317–323.
- , , , , , .Electronically screening discharge summaries for adverse medical events.J Am Med Infrom Assoc.2003;10(4):339–350.
- , , , , .The incidence and severity of adverse events affecting patients after discharge from the hospital.Ann Intern Med.2003;138:161–167.
- , , , et al.Comparing patient‐reported hospital adverse events with the medical record review: do patients know something that hospitals do not?Ann Intern Med.2005;149(2):100–108.
- , , , et al.What can hospitalized patients tell us about adverse events? Learning from the patient‐reported incidents.J Gen Intern Med.2005;20(9):830–836.
- , , , et al.The Vulnerable Elders Survey: a tool for identifying vulnerable older people in the community.J Am Geriatr Soc.2001;49:1691–1699.
- , , , .Validation of a telephone version of the mini‐mental state examination.J Am Geriatr Soc.1992;40(7):697–702.
- .The critical incident technique.Psychol Bull.1954;51(4):327–359.
- .The critical incident technique in service research.J Serv Res.2004;7:65–89.
- , , , .Medical errors related to discontinuity of care from an inpatient to an outpatient setting.J Gen Intern Med.2003;18:646–651.
- .A Purposeful approach to the constant comparative method in the analysis of qualitative interviews.Qual Quant2002;36:3392–3340.
Copyright © 2010 Society of Hospital Medicine

Language Barriers and Hospital Care
Forty‐five‐million Americans speak a language other than English and more than 19 million of these speak English less than very wellor are limited English proficient (LEP).1 The number of non‐English‐speaking and LEP people in the US has risen in recent decades, presenting a challenge to healthcare systems to provide high‐quality, patient‐centered care for these patients.2
For outpatients, language barriers are a fundamental contributor to gaps in health care. In the clinic setting, patients who do not speak English well have less access to a usual source of care and lower rates of physician visits and preventive services.36 Even when patients with language barriers do have access to care, they have poorer adherence, decreased comprehension of their diagnoses, decreased satisfaction with care, and increased medication complications.710
Few studies, however, have examined how language influences outcomes of hospital care. Compared to English‐speakers, patients who do not speak English well may experience longer lengths of stay,11 and have more adverse events while in the hospital.12 However, these previous studies have not investigated outcomes immediately post‐hospitalization, such as readmission rates and mortality, nor have they directly addressed the interaction between ethnicity and language.
To understand these questions, we analyzed data collected from a university‐based teaching hospital which cares for patients of diverse cultural and language backgrounds. Using these data, we examined how patients' primary language influenced hospital costs, length of stay (LOS), 30‐day readmission, and 30‐day mortality risk.
Patients and Methods
Patient Population and Setting
Our study examined patients admitted to the General Medicine Service at the University of California, San Francisco Medical Center (UCSF) between July 1, 2001 and June 30th, 2003, the time period during which UCSF participated in the Multicenter Hospitalist Trial (MHT) a prospective quasi‐randomized trial of hospitalist care for general medicine patients.13, 14
UCSF Moffitt‐Long Hospital is a 400‐bed urban academic medical center which provides services to the City and County of San Francisco, an ethnically and linguistically diverse area. UCSF employs staff language interpreters in Spanish, Chinese and Russian who travel to its many outpatient clinics, Comprehensive Cancer Center, Children's Hospital, as well as to Moffitt‐Long Hospital upon request; phone interpretation is also available when in‐person interpreters are not available, for off hours needs and for less common languages. During the period of this study there were no specific inpatient guidelines in place for use of interpretation services at UCSF, nor were there any specific interventions targeting LEP or non‐English speaking inpatients.
Patients were eligible for the MHT if they were 18 years of age or older and admitted at random to a hospitalist or non‐hospitalist physician (eg, outpatient general internist attending on average 1‐month/year); a minority of patients were cared for directly by their primary care physician while in the hospital, and were excluded. For purposes of our study, which merged MHT data with hospital administrative data on primary language, we further excluded all admissions for patients for whom primary language was missing (n = 5), whose listing was unknown or other language (n = 78), sign language (n = 3) or whose language was listed but was not one of the included languages (n = 258). Included languages were English, Chinese, Russian and Spanish. Because LOS and cost data were skewed, we excluded those admissions with the top 1% longest stays and the top 1% highest cost (n = 176); these exclusions did not alter the proportion of admissions across language and ethnicity. In addition, we excluded 102 admissions that were missing data on cost and 11 with costs <$500 and which were likely to be erroneous. Our research was approved by the UCSF Institutional Review Board.
Data Sources
We collected administrative data from Transition Systems Inc (TSI, Boston, MA) billing databases at UCSF as part of the MHT. These data include patient demographics, insurance, costs, ICD‐9CM diagnostic codes, admission and discharge dates in Uniform Bill 92 format. Patient mortality information was collected as part of the MHT using the National Death Index.14
Language data were collected from a separate patient‐registration database (STOR) at UCSF. Information on a patient's primary language is entered at the time each patient first registers at UCSF, whether for the index hospitalization or for prior clinic visits, and is based generally on patient self report. As part of our validation step, we cross‐checked 829 STOR language entries against patient reports and found 91% agreement with the majority of the errors classifying non‐English speakers as English‐speakers.
Measures
Predictor
Our primary language variable was derived using language designations collected from patient registration databases described above. Using these data we specified our key language groups as English, Chinese (Cantonese or Mandarin), Russian, or Spanish.
Outcomes
LOS and total cost of hospital stay for each hospitalization derived from administrative data sources. Readmissions were identified at the time patients were readmitted to UCSF (eg, flagged in administrative data). Mortality was determined by whether an individual patient with an admission in the database was recorded in the National Death Index as dead within 30‐days of admission.
Covariates
Additional covariates included age at admission, gender, ethnicity as recorded in registration databases (White, African American, Asian, Latino, Other), insurance, principal billing diagnosis, whether or not a patient received intensive care unit (ICU) care, type of admitting attending physician (Hospitalist/non‐Hospitalist), and an administrative Charlson comorbidity score.15 To collapse the principal diagnoses into categories, we used the Healthcare Cost and Utilization Project (HCUP)'s Clinical Classification System, which allowed us to classify each diagnosis in 1 of 14 generally accepted categories.16
Analysis
Statistical analyses were performed using STATA statistical software (STATACorp, Version 9, College Station, TX). We examined descriptive means and proportions for all variables, including sociodemographic, hospitalization, comorbidity and outcome variables. We compared English and non‐English speakers on all covariate and outcome variables using t‐tests for comparison of means and chi‐square for comparison of categorical variables.
It was not possible to fully test the language‐by‐ethnicity interactionwhether or not the impact of language varied by ethnic groupbecause many cells of the joint distribution were very sparse (eg, the sample contained very few non‐English‐speaking African Americans). Therefore, to better understand the influence of English vs. non‐English language usage across different ethnic groups, we created a combined language‐ethnicity predictor variable which categorized each subject first by language and then for the English‐speakers by ethnicity. For example, a Chinese, Spanish or Russian speaker would be categorized as such, and an English‐speaker could fall into the English‐White, English‐African American, English‐Asian or English‐Latino group. This allowed us to test whether there were any differences in language effects across the White, Asian, and Latino ethnicities, and any difference in ethnicity effects among English‐speakers.
Because cost and LOS were skewed, we used negative binomial models for LOS and log transformed costs. We performed a sensitivity analysis testing whether our results were robust to the exclusion of the admissions with the top 1% LOS and top 1% cost. We used logistic regression for the 30‐day readmission and mortality outcomes.
Our primary predictor was the language‐ethnicity variable described above. To determine the independent association between this predictor and our key outcomes, we then built models which included additional potential confounders selected either for face validity or because of observed confounding with other covariates. Our inclusion of potential confounders was limited by the variables available in the administrative database; thus, we were not able to pursue detailed analyses of communication and literacy factors and their interaction with our predictor or their independent impact on outcomes. Models also included a linear spline with a single knot at age 65 years as a further adjustment for age in Medicare recipients.1719 For the 30‐day readmission outcome model, we excluded those admissions for which the patient either died in the hospital or was discharged to hospice care. Within each model we tested the impact of a language barrier using custom contrasts. This allowed us to examine the language‐ethnicity effect aggregating all non‐English speakers compared to all English‐speakers, comparing each non‐English speaking group to all English‐speakers, comparing Chinese speakers to English‐speaking Asians and Spanish speakers to English‐speaking‐Latinos, as well as to test whether the effect of English language is the same across ethnicities.
Results
Admission Characteristics of the Sample
A total of 7023 patients were admitted to the General Medicine service, 5877 (84%) of whom were English‐speakers and 1146 (16%) non‐English‐speakers (Table 1). Overall, half of the admitted patients were women (50%), and the vast majority was insured (93%). The most common principal diagnoses were respiratory and gastrointestinal disorders. Only a small number of non‐English speakers 164 (14%) were recorded in the UCSF Interpreter Services database as having had any interaction with a professional staff interpreter during their hospitalization.
| English (n = 5877) n (%) | Non‐English (n = 1146) n (%) | |
|---|---|---|
| ||
| Socio‐economic variables | ||
| Language‐ethnicity | ||
| English | ||
| White | 3066 (52.2) | |
| African American | 1351 (23.0) | |
| Asian | 544 (9.3) | |
| Latino | 298 (5.1) | |
| Other | 618 (10.5) | |
| Chinese speakers | 584 (51.0) | |
| Spanish speakers | 272 (25.3) | |
| Russian speakers | 290 (23.7) | |
| Age mean (SD) (range 18‐105) | 58.8 (20.3) | 72.3 (15.5) |
| Gender | ||
| Male | 2967 (50.5) | 514 (44.8) |
| Female | 2910 (49.5) | 632 (55.2) |
| Insurance | ||
| Medicare | 2878 (49.0) | 800 (69.8) |
| Medicaid | 1201 (20.4) | 193 (16.8) |
| Commercial | 1358 (23.1) | 106 (9.3) |
| Charity/other | 440 (7.5) | 47 (4.1) |
| Hospitalization variables | ||
| Admitted to ICU | ||
| Yes | 721 (12.3) | 149 (13.0) |
| Attending physician | ||
| Hospitalist | 3950 (67.2) | 781 (68.2) |
| Comorbidity variables | ||
| Principal Diagnosis | ||
| Respiratory disorder | 1061 (18.1) | 225 (19.6) |
| Gastrointestinal disorder | 963 (16.4) | 205 (17.9) |
| Circulatory disorder | 613 (10.4) | 140 (12.2) |
| Endocrine/metabolism | 671 (11.4) | 80 (7.0) |
| Injury/poisoning | 475 (8.1) | 64 (5.6) |
| Malignancy | 395 (6.7) | 107 (9.3) |
| Renal/urinary disorder | 383 (6.5) | 108 (9.4) |
| Skin disorder | 278 (4.7) | 28 (2.9) |
| Infection/fatigue NOS | 206 (3.5) | 45 (3.4) |
| Blood disorder (non‐malignant) | 189 (3.2) | 38 (3.3) |
| Musculoskeletal/connective tissue disorder | 164 (2.8) | 33 (2.9) |
| Mental disorder/substance abuse | 171 (2.9) | 7 (0.6) |
| Nervous system/brain infection | 137 (2.3) | 26 (2.3) |
| Unclassified | 171 (2.9) | 40 (3.5) |
| Charlson Index score mean (SD) | 0.97 1.33 | 1.10 1.42 |
Among English speakers, Whites and African Americans were the most common ethnicities; however, more than 500 admissions were categorized as Asian ethnicity, and more than 600 as patients of other ethnicity. Close to 300 admissions were for Latinos. Among non‐English speakers, Chinese speakers had the largest number of admissions (n = 584), while Spanish and Russian speakers had similar numbers (n = 272 and 290 respectively).
Non‐English speakers were older, more likely to be female, more likely to be insured by Medicare, and more likely to have a higher comorbidity index score. While comorbidity scores were similar among non‐English speakers (Chinese 1.13 1.50; Russian 1.09 1.37; Spanish 1.06 1.30), they differed considerably among English speakers (White 0.94 1.29; African American 1.05 1.40; Asian 1.04 1.45; Latino 0.89 1.23; Other 0.91 1.29).
Hospital Outcome by Language‐Ethnicity Group (Table 2)
When aggregated together, non‐English speakers were somewhat more likely to be dead at 30‐days and have lower cost admissions; however, they did not differ from English speakers on LOS or readmission rates. While differences among disaggregated language‐ethnicity groups were not all statistically significant, English‐speaking Whites had the longest LOS (mean = 4.9 days) and highest costs (mean = $10,530). English‐speaking African Americans, Chinese and Spanish speakers had the highest 30‐day readmission rates; whereas, English‐speaking Latinos and Russian speakers had markedly lower 30‐day readmission rates (2.5% and 6.4%, respectively). Chinese speakers had the highest 30‐day mortality, followed by English speaking Whites and Asians.
| Language‐Ethnicity Groups | LOS* Mean #Days (SD) | Cost Mean Cost $ (SD) | 30‐Day Readmission, n (%) | 30‐Day Mortality, n (%) |
|---|---|---|---|---|
| ||||
| English speakers (all) | 4.7 (4.5) | 10,035 (15,041) | 648 (11.9) | 613 (10.4) |
| White | 4.9 (5.1) | 10,530 (15,894) | 322 (11.4) | 377 (12.3) |
| African American | 4.5 (4.8) | 9107 (13,314) | 227 (17.5) | 91 (6.7) |
| Asian | 4.3 (4.5) | 9933 (15,607) | 43 (8.8) | 67 (12.3) |
| Latino | 4.6 (4.8) | 9823 (14,113) | 7 (2.5) | 18 (6.0) |
| Other | 4.5 (4.8) | 9662 (14,016) | 49 (8.5) | 60 (9.7) |
| Non‐English speakers (all) | 4.5 (4.5) | 9515 (13,213) | 117 (11.0) | 147 (12.8) |
| Chinese speakers | 4.5 (4.6) | 9505 (12,841) | 69 (12.8) | 85 (14.6) |
| Spanish speakers | 4.5 (4.5) | 9115 (13,846) | 31 (12.0) | 28 (10.3) |
| Russian speakers | 4.7 (4.2) | 9846 (13,360) | 17 (6.4) | 34 (11.7) |
We further investigated differences among English speakers to better understand the very high rate of readmission for African Americans and the very low rate for English‐speaking Latinos. African Americans were on average younger than other English speakers (55 19 years vs. 60 21 years; P < 0.001); but, they had higher comorbidity scores than other English speakers (1.05 1.40 vs. 0.94 1.31; P = 0.008), and were more likely to be admitted for non‐malignant blood disorders (eg, sickle cell disease), endocrine disorders (eg, diabetes mellitus), and circulatory disorders (eg, stroke). In contrast, English‐speaking Latinos were also younger than other English speakers (53 21 years vs. 59 20 years; P < 0.001), but they trended toward lower comorbidity scores (0.87 1.23 vs. 0.97 1.33; P = 0.2), and were more likely to be admitted for gastrointestinal and musculoskeletal disorders, and less likely to be admitted for malignancy and endocrine disorders.
Multivariate Analyses: Association of Aggregated and Disaggregated Language‐Ethnicity Groups With Hospital Outcomes (Table 3)
In multivariate models examining aggregated language‐ethnicity groups, non‐English speakers had a trend toward higher odds of readmission at 30‐days post‐discharge than the English‐speaking group (odds ratio [OR], 1.3; 95% confidence interval [CI], 1.0‐1.7). There were no significant differences for LOS, cost, or 30‐day mortality. Compared to English speakers, Chinese and Spanish speakers had 70% and 50% higher adjusted odds of readmission at 30‐days post‐discharge respectively, while Russian speakers' odds of readmission was not increased. Additionally, Chinese speakers had 7% shorter LOS than English‐speakers. There were no significant differences among any of the language‐ethnicity groups for 30‐day mortality. The increased odds of readmission for Chinese and Spanish speakers compared to English speakers was robust to reinclusion of the admissions with the top 1% LOS and top 1% cost.
| Language Categorization | LOS, % Difference (95% CI) | Total Cost, % Difference (95% CI) | 30‐Day Readmission,* OR (95% CI) | Mortality, OR (95% CI) |
|---|---|---|---|---|
| ||||
| All English speakers | Reference | Reference | Reference | Reference |
| Non‐English speakers | 3.1 (8.7 to 3.1) | 2.5 (8.3 to 2.1) | 1.3 (1.0 to 1.7) | 0.9 (0.7 to 1.2) |
| All English speakers | Reference | Reference | Reference | Reference |
| Chinese speakers | 7.2 (13.9 to 0) | 5.3 (12.2 to 2.1) | 1.7 (1.2 to 2.3) | 1.0 (0.8 to 1.4) |
| Spanish speakers | 3.0 (12.6 to 7.6) | 3.0 (12.7 to 7.7) | 1.5 (1.0 to 2.3) | 0.9 (0.6 to 1.5) |
| Russian speakers | 1.5 (8.3 to 12.2) | 0.9 (8.9 to 11.8) | 0.8 (0.5 to 1.4) | 0.8 (0.5 to 1.2) |
Multivariate Analyses: Association of Language for Asians and Latinos, and of Ethnicity for English speakers, With Hospital Outcomes (Table 4)
Both Chinese and Spanish speakers had significantly higher odds of 30‐day readmission than their English speaking Asian and Latino counterparts. There were no significant differences in LOS, cost, or 30‐day mortality in this within‐ethnicity analysis. Among English speakers, admissions for patients with Asian ethnicity were 15% shorter and resulted in 9% lower costs than for Whites. While LOS and cost were similar for English‐speaking Latino and White admissions, English‐speaking Latinos had markedly lower odds of 30‐day readmission than their White counterparts. Whereas African‐Americans had 6% shorter LOS, 40% higher odds of readmission and 30% lower odds of mortality at 30‐days than English speaking Whites.
| Language‐Ethnicity Comparisons | LOS, % Difference (95% CI) | Total Cost, % Difference (95% CI) | 30‐Day Readmission,* OR (95% CI) | Mortality, OR (95% CI) |
|---|---|---|---|---|
| ||||
| English speaking Asians | Reference | Reference | Reference | Reference |
| Chinese speakers | 2.2 (7.4 to 12.7) | 0.3 (9.2 to 10.7) | 1.5 (1.0 to 2.3) | 0.8 (0.6 to 1.2) |
| English speaking Latinos | Reference | Reference | Reference | Reference |
| Spanish speakers | 4.5 (16.8 to 9.5) | 1.2 (14.0 to 13.5) | 5.7 (2.4 to 13.2) | 1.2 (0.6 to 2.4) |
| English‐White | Reference | Reference | Reference | Reference |
| English‐African American | 6.2 (11.3 to 0.9) | 4.4 (9.6 to 1.1) | 1.4 (1.1 to 1.7) | 0.6 (0.5 to 0.8) |
| English‐Asian | 14.6 (20.9 to 7.9) | 8.6 (15.4 to 1.4) | 0.8 (0.5 to 1.0) | 1.0 (0.7 to 1.4) |
| English‐Latino | 4.5 (13.5 to 5.4) | 5.0 (14.0 to 5.0) | 0.2 (0.1 to 0.4) | 0.6 (0.4 to 1.0) |
Conclusion/Discussion
Our results indicate that language barriers may contribute to higher readmission rates for non‐English speakers, but that they have less impact on care efficiency or mortality. This finding of an association between language and readmission, without a similar association with efficiency, suggests a potentially communication‐critical step in care.20, 21 Patients with language barriers are more likely to experience adverse events, and those events are often caused by errors in communication.12 It is conceivable that higher readmission risk for Chinese and Spanish speakers in our study was, at least in part, due to gaps in communication that are present in all patient groups, and exacerbated by the presence of a language barrier. This barrier is likely present during hospitalization but magnified at discharge, limiting caregivers' ability to understand patients' needs for home care, while simultaneously limiting patients' understanding of the discharge plan. After discharge, it is also possible that non‐English speakers are less able to communicate their needs as they arise, ormore subtlyfeel less supported by a primarily English speaking healthcare system. As in other clinical arenas,22 it is quite possible that increased access to professional interpreters in the hospital setting, and particularly at the time of discharge, would enhance communication and outcomes for LEP patients. Our interpreter services data showed that the patients in our study had quite limited access to staff professional interpreters.
Our findings differ somewhat from those of John‐Baptiste et al.,11 who found that language barriers contributed to increased LOS for patients with cardiac and major surgical diagnoses. Our study's findings are akin to recent research suggesting that being a monolingual Spanish speaker or receiving interpreter services may not significantly impact LOS or cost of hospitalization,23 and that LOS and in‐hospital mortality do not differ for non‐English speakers and English speakers after acute myocardial infarction.24 These studies, along with our results, suggest that that care efficiency in the hospital may be driven much more by clinical acuity (eg, the need to respond rapidly to urgent clinical signs such as hypotension, fever and respiratory distress) than by adequacy of communication. For example, elderly LEP patients may be even more likely than English speakers to have vigilant family members at the bedside throughout their hospitalization due to their need for communication assistance; these family members can quickly alert hospital staff to concerning changes in the patient's condition.
Our results also suggest the possibility that language and ethnicity are not monolithic concepts, and that even within language and ethnic groups there are potential differences in care pattern. For example, not speaking English may be a surrogate marker for unmeasured factors such as social supports and access to care. Language is intimately associated with culture; it remains plausible that cultural differences between highly acculturated and less acculturated members of a given ethno‐cultural group may have contributed to our observed differences in readmission rates. Differences in culture and associated factors, such as social support or use of multiple hospital systems, may account for lack of higher readmission risk in Russian speakers, while Chinese and Spanish speakers had higher readmission risk.
In addition, our finding that English‐speaking Latinos had lower readmission risk than any other group may be more consistent with their clinical characteristicseg, younger age, fewer comorbiditiesthan with cultural factors. Our finding that African American patients had the highest readmission risk in our hospital was both surprising and concerning. Some of this increased risk may be explained by clinical characteristics, such as higher comorbidities and higher rates of diagnoses leading to frequent admissions (eg, sickle cell disease); however, the reasons for this disparity deserves further investigation.
Our study has limitations. First, our data are administrative, and lack information about patients' educational attainment, social support, acculturation, utilization of other hospital systems, and usual source of care. Despite this, we were able to account for many significant covariates that might contribute to readmission rates, including age, insurance status, gender, comorbidities, and admission to the intensive care unit.2528 Second, our information about patients' English language proficiency is limited. While direct assessments of English proficiency are more accurate ways to determine a patient's ability to communicate with health care providers in English,29 our language validation work conducted in preparation for this study suggests that most of our patients recorded as having a non‐English primary language (87%) also have a low score on a language acculturation scale.
Third, only 14% of our non‐English speaking subjects utilized professional staff interpreters, and we had no information on the use of professional telephonic interpreters, or ad hoc interpretersfamily members, non‐interpreter staff membersand their impact on our results. It is well‐documented that ad hoc interpreters are used frequently in healthcare, particularly in the hospital setting, and thus we can assume this to be true in our study.30, 31 As noted above, it is likely that the advocacy of family members and friends at the bedside helped to minimize potential differences in care efficiency for patients with language barriers. Finally, our study was performed at a single university based hospital and may not produce results which are applicable to other care settings.
Our findings point to several avenues for future research on language barriers and hospitalized patients. First, the field would benefit from an examination of the impact of easy access to professional interpreters during hospitalization on outcomes of hospital care, in particular on readmission rates. Second, there is need for development and assessment of best practices for creating a culture of professional interpreter utilization in the hospital among physicians and nursing staff. Third, investigation of the role of caregiver presence in the hospital room and how this might differ by patient culture, age and language ability may further elucidate some of the differences across language groups observed in our study. Lastly, a more granular investigation of clinician‐patient communication and the importance of interpersonal processes of care on both patient satisfaction and understanding of and adherence to discharge instructions could lead to the development of detailed interventions to enhance this communication and these outcomes as it has done for communication‐sensitive outcomes in the outpatient arena.3234
In summary, our study suggests that higher risk for readmission can be added to the unfortunate list of outcomes which are worsened due to language barriers, pointing to transition from the hospital as a potentially communication‐critical step in care which may be amenable to intervention. Our findings also suggest that this risk can vary even between groups of patients who do not speak English primarily. Whether and to what degree language and communication barriers aloneincluding access to professional interpreters and patient‐centered communicationduring hospitalization, or differences in caregiver social support both during and after hospitalization as well as access to care post‐hospitalization contribute to these findings is a worthy subject of future research.
Acknowledgements
The authors acknowledge Dr. Eliseo J. Prez‐Stable for his mentorship on this project.
- ,. Language Use and English‐Speaking Ability:2000. Available at: http://www.census.gov/prod/2003pubs/c2kbr‐29.pdf. Accessed January 2010.
- U.S. Department of Health and Human Services.2006National Healthcare Disparities Report. AHRQ Publication No. 070012; 2006.
- ,,,.Disparities in health care by race, ethnicity, and language among the insured: findings from a national sample.Med Care.2002;40(1):52–59.
- ,.The effect of physician‐patient communication on mammography utilization by different ethnic groups.Med Care.1991;29(11):1065–1082.
- ,.Language of interview:relevance for research of Southwest Hispanics.Am J Pub Health.1991;81(11):1399–1404.
- ,,,.Is language a barrier to the use of preventive services?J Gen Intern Med.1997;12(8):472–477.
- ,,,.Impact of language barriers on patient satisfaction in an emergency department.JGIM.1999;14:82–87.
- .Patient comprehension of doctor‐patient communication on discharge from the emergency department.J Emerg Med.1997;15(1):1–7.
- ,,, et al.Drug complications in outpatients.J Gen Intern Med.2000;15:149–154.
- .Language concordance as a determinant of patient compliance and emergency room use in patients with asthma.Med Care.1988;26(12):1119–1128.
- ,,,et al.The effect of English language proficiency on length of stay and in‐hospital mortality.J Gen Intern Med.2004;19:221–228.
- ,,,.Language proficiency and adverse events in US hospitals: a pilot study.Int J Qual Health Care.2007;19(2):60–67.
- ,,, et al.Factors associated with discussion of care plans and code status at the time of hospital admission: results from the Multicenter Hospitalist Study.J Hosp Med.2008;3(6):437–445.
- ,,, et al.Quality of care for decompensated heart failure: comparable performance between academic hospitalists and non‐hospitalists.J Gen Intern Med.2008;23(9):1399–1406.
- ,,,.A new method of classifying prognostic comorbidity in longitudinal studies: development and validation.J Chronic Dis.1987;40(5):373–383.
- AHRQ. Healthcare Cost and Utilizlation Project: Tools 132(3):191–200.
- ,,.Free knot splines for logistic models and threshold selection.Comput Methods Programs Biomed.2005;77(1):1–9.
- ,,,,.Statistical methods in epidemiology: a comparison of statistical methods to analyze dose‐response and trend analysis in epidemiologic studies.J Clin Epidemiol.1998;51(12):1223–1233.
- The Care Transitions Project. Health Care Policy and Research, Practitioner Tools. Available at: http://www.caretransitions.org/practitioner_tools.asp.
- AHRQ. Improving safety at the point of care. Available at: http://www.ahrq.gov/qual/pips. Accessed January2010.
- ,,,.Do professional interpreters improve clinical care for patients with limited english proficiency? A systematic review of the literature.Health Serv Res.2007;42(2):727–754.
- ,,.The impact of an enhanced interpreter service intervention on hospital costs and patient satisfaction.J Gen Intern Med.2007;22 Suppl 2:306–311.
- ,,,,.Acute myocardial infarction length of stay and hospital mortality are not associated with language preference.J Gen Intern Med.2008;23(2):190–194.
- ,,.A systematic literature review of factors affecting outcome in older medical patients admitted to hospital.Age Ageing.2004;33(2):110–115.
- ,,,,,.Risk factors and prognostic predictors of unexpected intensive care unit admission within 3 days after ED discharge.Am J Emerg Med.2007;25(9):1009–1014.
- ,.Effect of gender, ethnicity, pulmonary disease, and symptom stability on rehospitalization in patients with heart failure.Am J Cardiol.2007;100(7):1139–1144.
- ,,,.Bouncing back: patterns and predictors of complicated transitions 30 days after hospitalization for acute ischemic stroke.J Am Geriatr Soc.2007;55(3):365–373.
- ,,,,.Identification of limited English proficient patients in clinical care.J Gen Intern Med.2008;23(10):1555–1560.
- ,,,,.Hospital langague services for patients with limited English proficiency: results from a national survey.Health Research October2006.
- ,.Hospitals, Language, and Culture: a Snapshot of the Nation. The Joint Commission and The California Endowment;2007.
- ,,, et al.A randomized controlled trial of interventions to enhance patient‐physician partnership, patient adherence and high blood pressure control among ethnic minorities and poor persons: study protocol NCT00123045.Implement Sci.2009;4:7.
- ,,,,.Interpersonal processes of care and patient satisfaction: do associations differ by race, ethnicity, and language?Health Serv Res.2009;44(4):1326–1344.
- ,,,.Understanding concordance in patient‐physician relationships: personal and ethnic dimensions of shared identity.Ann Fam Med.2008;6(3):198–205.
Forty‐five‐million Americans speak a language other than English and more than 19 million of these speak English less than very wellor are limited English proficient (LEP).1 The number of non‐English‐speaking and LEP people in the US has risen in recent decades, presenting a challenge to healthcare systems to provide high‐quality, patient‐centered care for these patients.2
For outpatients, language barriers are a fundamental contributor to gaps in health care. In the clinic setting, patients who do not speak English well have less access to a usual source of care and lower rates of physician visits and preventive services.36 Even when patients with language barriers do have access to care, they have poorer adherence, decreased comprehension of their diagnoses, decreased satisfaction with care, and increased medication complications.710
Few studies, however, have examined how language influences outcomes of hospital care. Compared to English‐speakers, patients who do not speak English well may experience longer lengths of stay,11 and have more adverse events while in the hospital.12 However, these previous studies have not investigated outcomes immediately post‐hospitalization, such as readmission rates and mortality, nor have they directly addressed the interaction between ethnicity and language.
To understand these questions, we analyzed data collected from a university‐based teaching hospital which cares for patients of diverse cultural and language backgrounds. Using these data, we examined how patients' primary language influenced hospital costs, length of stay (LOS), 30‐day readmission, and 30‐day mortality risk.
Patients and Methods
Patient Population and Setting
Our study examined patients admitted to the General Medicine Service at the University of California, San Francisco Medical Center (UCSF) between July 1, 2001 and June 30th, 2003, the time period during which UCSF participated in the Multicenter Hospitalist Trial (MHT) a prospective quasi‐randomized trial of hospitalist care for general medicine patients.13, 14
UCSF Moffitt‐Long Hospital is a 400‐bed urban academic medical center which provides services to the City and County of San Francisco, an ethnically and linguistically diverse area. UCSF employs staff language interpreters in Spanish, Chinese and Russian who travel to its many outpatient clinics, Comprehensive Cancer Center, Children's Hospital, as well as to Moffitt‐Long Hospital upon request; phone interpretation is also available when in‐person interpreters are not available, for off hours needs and for less common languages. During the period of this study there were no specific inpatient guidelines in place for use of interpretation services at UCSF, nor were there any specific interventions targeting LEP or non‐English speaking inpatients.
Patients were eligible for the MHT if they were 18 years of age or older and admitted at random to a hospitalist or non‐hospitalist physician (eg, outpatient general internist attending on average 1‐month/year); a minority of patients were cared for directly by their primary care physician while in the hospital, and were excluded. For purposes of our study, which merged MHT data with hospital administrative data on primary language, we further excluded all admissions for patients for whom primary language was missing (n = 5), whose listing was unknown or other language (n = 78), sign language (n = 3) or whose language was listed but was not one of the included languages (n = 258). Included languages were English, Chinese, Russian and Spanish. Because LOS and cost data were skewed, we excluded those admissions with the top 1% longest stays and the top 1% highest cost (n = 176); these exclusions did not alter the proportion of admissions across language and ethnicity. In addition, we excluded 102 admissions that were missing data on cost and 11 with costs <$500 and which were likely to be erroneous. Our research was approved by the UCSF Institutional Review Board.
Data Sources
We collected administrative data from Transition Systems Inc (TSI, Boston, MA) billing databases at UCSF as part of the MHT. These data include patient demographics, insurance, costs, ICD‐9CM diagnostic codes, admission and discharge dates in Uniform Bill 92 format. Patient mortality information was collected as part of the MHT using the National Death Index.14
Language data were collected from a separate patient‐registration database (STOR) at UCSF. Information on a patient's primary language is entered at the time each patient first registers at UCSF, whether for the index hospitalization or for prior clinic visits, and is based generally on patient self report. As part of our validation step, we cross‐checked 829 STOR language entries against patient reports and found 91% agreement with the majority of the errors classifying non‐English speakers as English‐speakers.
Measures
Predictor
Our primary language variable was derived using language designations collected from patient registration databases described above. Using these data we specified our key language groups as English, Chinese (Cantonese or Mandarin), Russian, or Spanish.
Outcomes
LOS and total cost of hospital stay for each hospitalization derived from administrative data sources. Readmissions were identified at the time patients were readmitted to UCSF (eg, flagged in administrative data). Mortality was determined by whether an individual patient with an admission in the database was recorded in the National Death Index as dead within 30‐days of admission.
Covariates
Additional covariates included age at admission, gender, ethnicity as recorded in registration databases (White, African American, Asian, Latino, Other), insurance, principal billing diagnosis, whether or not a patient received intensive care unit (ICU) care, type of admitting attending physician (Hospitalist/non‐Hospitalist), and an administrative Charlson comorbidity score.15 To collapse the principal diagnoses into categories, we used the Healthcare Cost and Utilization Project (HCUP)'s Clinical Classification System, which allowed us to classify each diagnosis in 1 of 14 generally accepted categories.16
Analysis
Statistical analyses were performed using STATA statistical software (STATACorp, Version 9, College Station, TX). We examined descriptive means and proportions for all variables, including sociodemographic, hospitalization, comorbidity and outcome variables. We compared English and non‐English speakers on all covariate and outcome variables using t‐tests for comparison of means and chi‐square for comparison of categorical variables.
It was not possible to fully test the language‐by‐ethnicity interactionwhether or not the impact of language varied by ethnic groupbecause many cells of the joint distribution were very sparse (eg, the sample contained very few non‐English‐speaking African Americans). Therefore, to better understand the influence of English vs. non‐English language usage across different ethnic groups, we created a combined language‐ethnicity predictor variable which categorized each subject first by language and then for the English‐speakers by ethnicity. For example, a Chinese, Spanish or Russian speaker would be categorized as such, and an English‐speaker could fall into the English‐White, English‐African American, English‐Asian or English‐Latino group. This allowed us to test whether there were any differences in language effects across the White, Asian, and Latino ethnicities, and any difference in ethnicity effects among English‐speakers.
Because cost and LOS were skewed, we used negative binomial models for LOS and log transformed costs. We performed a sensitivity analysis testing whether our results were robust to the exclusion of the admissions with the top 1% LOS and top 1% cost. We used logistic regression for the 30‐day readmission and mortality outcomes.
Our primary predictor was the language‐ethnicity variable described above. To determine the independent association between this predictor and our key outcomes, we then built models which included additional potential confounders selected either for face validity or because of observed confounding with other covariates. Our inclusion of potential confounders was limited by the variables available in the administrative database; thus, we were not able to pursue detailed analyses of communication and literacy factors and their interaction with our predictor or their independent impact on outcomes. Models also included a linear spline with a single knot at age 65 years as a further adjustment for age in Medicare recipients.1719 For the 30‐day readmission outcome model, we excluded those admissions for which the patient either died in the hospital or was discharged to hospice care. Within each model we tested the impact of a language barrier using custom contrasts. This allowed us to examine the language‐ethnicity effect aggregating all non‐English speakers compared to all English‐speakers, comparing each non‐English speaking group to all English‐speakers, comparing Chinese speakers to English‐speaking Asians and Spanish speakers to English‐speaking‐Latinos, as well as to test whether the effect of English language is the same across ethnicities.
Results
Admission Characteristics of the Sample
A total of 7023 patients were admitted to the General Medicine service, 5877 (84%) of whom were English‐speakers and 1146 (16%) non‐English‐speakers (Table 1). Overall, half of the admitted patients were women (50%), and the vast majority was insured (93%). The most common principal diagnoses were respiratory and gastrointestinal disorders. Only a small number of non‐English speakers 164 (14%) were recorded in the UCSF Interpreter Services database as having had any interaction with a professional staff interpreter during their hospitalization.
| English (n = 5877) n (%) | Non‐English (n = 1146) n (%) | |
|---|---|---|
| ||
| Socio‐economic variables | ||
| Language‐ethnicity | ||
| English | ||
| White | 3066 (52.2) | |
| African American | 1351 (23.0) | |
| Asian | 544 (9.3) | |
| Latino | 298 (5.1) | |
| Other | 618 (10.5) | |
| Chinese speakers | 584 (51.0) | |
| Spanish speakers | 272 (25.3) | |
| Russian speakers | 290 (23.7) | |
| Age mean (SD) (range 18‐105) | 58.8 (20.3) | 72.3 (15.5) |
| Gender | ||
| Male | 2967 (50.5) | 514 (44.8) |
| Female | 2910 (49.5) | 632 (55.2) |
| Insurance | ||
| Medicare | 2878 (49.0) | 800 (69.8) |
| Medicaid | 1201 (20.4) | 193 (16.8) |
| Commercial | 1358 (23.1) | 106 (9.3) |
| Charity/other | 440 (7.5) | 47 (4.1) |
| Hospitalization variables | ||
| Admitted to ICU | ||
| Yes | 721 (12.3) | 149 (13.0) |
| Attending physician | ||
| Hospitalist | 3950 (67.2) | 781 (68.2) |
| Comorbidity variables | ||
| Principal Diagnosis | ||
| Respiratory disorder | 1061 (18.1) | 225 (19.6) |
| Gastrointestinal disorder | 963 (16.4) | 205 (17.9) |
| Circulatory disorder | 613 (10.4) | 140 (12.2) |
| Endocrine/metabolism | 671 (11.4) | 80 (7.0) |
| Injury/poisoning | 475 (8.1) | 64 (5.6) |
| Malignancy | 395 (6.7) | 107 (9.3) |
| Renal/urinary disorder | 383 (6.5) | 108 (9.4) |
| Skin disorder | 278 (4.7) | 28 (2.9) |
| Infection/fatigue NOS | 206 (3.5) | 45 (3.4) |
| Blood disorder (non‐malignant) | 189 (3.2) | 38 (3.3) |
| Musculoskeletal/connective tissue disorder | 164 (2.8) | 33 (2.9) |
| Mental disorder/substance abuse | 171 (2.9) | 7 (0.6) |
| Nervous system/brain infection | 137 (2.3) | 26 (2.3) |
| Unclassified | 171 (2.9) | 40 (3.5) |
| Charlson Index score mean (SD) | 0.97 1.33 | 1.10 1.42 |
Among English speakers, Whites and African Americans were the most common ethnicities; however, more than 500 admissions were categorized as Asian ethnicity, and more than 600 as patients of other ethnicity. Close to 300 admissions were for Latinos. Among non‐English speakers, Chinese speakers had the largest number of admissions (n = 584), while Spanish and Russian speakers had similar numbers (n = 272 and 290 respectively).
Non‐English speakers were older, more likely to be female, more likely to be insured by Medicare, and more likely to have a higher comorbidity index score. While comorbidity scores were similar among non‐English speakers (Chinese 1.13 1.50; Russian 1.09 1.37; Spanish 1.06 1.30), they differed considerably among English speakers (White 0.94 1.29; African American 1.05 1.40; Asian 1.04 1.45; Latino 0.89 1.23; Other 0.91 1.29).
Hospital Outcome by Language‐Ethnicity Group (Table 2)
When aggregated together, non‐English speakers were somewhat more likely to be dead at 30‐days and have lower cost admissions; however, they did not differ from English speakers on LOS or readmission rates. While differences among disaggregated language‐ethnicity groups were not all statistically significant, English‐speaking Whites had the longest LOS (mean = 4.9 days) and highest costs (mean = $10,530). English‐speaking African Americans, Chinese and Spanish speakers had the highest 30‐day readmission rates; whereas, English‐speaking Latinos and Russian speakers had markedly lower 30‐day readmission rates (2.5% and 6.4%, respectively). Chinese speakers had the highest 30‐day mortality, followed by English speaking Whites and Asians.
| Language‐Ethnicity Groups | LOS* Mean #Days (SD) | Cost Mean Cost $ (SD) | 30‐Day Readmission, n (%) | 30‐Day Mortality, n (%) |
|---|---|---|---|---|
| ||||
| English speakers (all) | 4.7 (4.5) | 10,035 (15,041) | 648 (11.9) | 613 (10.4) |
| White | 4.9 (5.1) | 10,530 (15,894) | 322 (11.4) | 377 (12.3) |
| African American | 4.5 (4.8) | 9107 (13,314) | 227 (17.5) | 91 (6.7) |
| Asian | 4.3 (4.5) | 9933 (15,607) | 43 (8.8) | 67 (12.3) |
| Latino | 4.6 (4.8) | 9823 (14,113) | 7 (2.5) | 18 (6.0) |
| Other | 4.5 (4.8) | 9662 (14,016) | 49 (8.5) | 60 (9.7) |
| Non‐English speakers (all) | 4.5 (4.5) | 9515 (13,213) | 117 (11.0) | 147 (12.8) |
| Chinese speakers | 4.5 (4.6) | 9505 (12,841) | 69 (12.8) | 85 (14.6) |
| Spanish speakers | 4.5 (4.5) | 9115 (13,846) | 31 (12.0) | 28 (10.3) |
| Russian speakers | 4.7 (4.2) | 9846 (13,360) | 17 (6.4) | 34 (11.7) |
We further investigated differences among English speakers to better understand the very high rate of readmission for African Americans and the very low rate for English‐speaking Latinos. African Americans were on average younger than other English speakers (55 19 years vs. 60 21 years; P < 0.001); but, they had higher comorbidity scores than other English speakers (1.05 1.40 vs. 0.94 1.31; P = 0.008), and were more likely to be admitted for non‐malignant blood disorders (eg, sickle cell disease), endocrine disorders (eg, diabetes mellitus), and circulatory disorders (eg, stroke). In contrast, English‐speaking Latinos were also younger than other English speakers (53 21 years vs. 59 20 years; P < 0.001), but they trended toward lower comorbidity scores (0.87 1.23 vs. 0.97 1.33; P = 0.2), and were more likely to be admitted for gastrointestinal and musculoskeletal disorders, and less likely to be admitted for malignancy and endocrine disorders.
Multivariate Analyses: Association of Aggregated and Disaggregated Language‐Ethnicity Groups With Hospital Outcomes (Table 3)
In multivariate models examining aggregated language‐ethnicity groups, non‐English speakers had a trend toward higher odds of readmission at 30‐days post‐discharge than the English‐speaking group (odds ratio [OR], 1.3; 95% confidence interval [CI], 1.0‐1.7). There were no significant differences for LOS, cost, or 30‐day mortality. Compared to English speakers, Chinese and Spanish speakers had 70% and 50% higher adjusted odds of readmission at 30‐days post‐discharge respectively, while Russian speakers' odds of readmission was not increased. Additionally, Chinese speakers had 7% shorter LOS than English‐speakers. There were no significant differences among any of the language‐ethnicity groups for 30‐day mortality. The increased odds of readmission for Chinese and Spanish speakers compared to English speakers was robust to reinclusion of the admissions with the top 1% LOS and top 1% cost.
| Language Categorization | LOS, % Difference (95% CI) | Total Cost, % Difference (95% CI) | 30‐Day Readmission,* OR (95% CI) | Mortality, OR (95% CI) |
|---|---|---|---|---|
| ||||
| All English speakers | Reference | Reference | Reference | Reference |
| Non‐English speakers | 3.1 (8.7 to 3.1) | 2.5 (8.3 to 2.1) | 1.3 (1.0 to 1.7) | 0.9 (0.7 to 1.2) |
| All English speakers | Reference | Reference | Reference | Reference |
| Chinese speakers | 7.2 (13.9 to 0) | 5.3 (12.2 to 2.1) | 1.7 (1.2 to 2.3) | 1.0 (0.8 to 1.4) |
| Spanish speakers | 3.0 (12.6 to 7.6) | 3.0 (12.7 to 7.7) | 1.5 (1.0 to 2.3) | 0.9 (0.6 to 1.5) |
| Russian speakers | 1.5 (8.3 to 12.2) | 0.9 (8.9 to 11.8) | 0.8 (0.5 to 1.4) | 0.8 (0.5 to 1.2) |
Multivariate Analyses: Association of Language for Asians and Latinos, and of Ethnicity for English speakers, With Hospital Outcomes (Table 4)
Both Chinese and Spanish speakers had significantly higher odds of 30‐day readmission than their English speaking Asian and Latino counterparts. There were no significant differences in LOS, cost, or 30‐day mortality in this within‐ethnicity analysis. Among English speakers, admissions for patients with Asian ethnicity were 15% shorter and resulted in 9% lower costs than for Whites. While LOS and cost were similar for English‐speaking Latino and White admissions, English‐speaking Latinos had markedly lower odds of 30‐day readmission than their White counterparts. Whereas African‐Americans had 6% shorter LOS, 40% higher odds of readmission and 30% lower odds of mortality at 30‐days than English speaking Whites.
| Language‐Ethnicity Comparisons | LOS, % Difference (95% CI) | Total Cost, % Difference (95% CI) | 30‐Day Readmission,* OR (95% CI) | Mortality, OR (95% CI) |
|---|---|---|---|---|
| ||||
| English speaking Asians | Reference | Reference | Reference | Reference |
| Chinese speakers | 2.2 (7.4 to 12.7) | 0.3 (9.2 to 10.7) | 1.5 (1.0 to 2.3) | 0.8 (0.6 to 1.2) |
| English speaking Latinos | Reference | Reference | Reference | Reference |
| Spanish speakers | 4.5 (16.8 to 9.5) | 1.2 (14.0 to 13.5) | 5.7 (2.4 to 13.2) | 1.2 (0.6 to 2.4) |
| English‐White | Reference | Reference | Reference | Reference |
| English‐African American | 6.2 (11.3 to 0.9) | 4.4 (9.6 to 1.1) | 1.4 (1.1 to 1.7) | 0.6 (0.5 to 0.8) |
| English‐Asian | 14.6 (20.9 to 7.9) | 8.6 (15.4 to 1.4) | 0.8 (0.5 to 1.0) | 1.0 (0.7 to 1.4) |
| English‐Latino | 4.5 (13.5 to 5.4) | 5.0 (14.0 to 5.0) | 0.2 (0.1 to 0.4) | 0.6 (0.4 to 1.0) |
Conclusion/Discussion
Our results indicate that language barriers may contribute to higher readmission rates for non‐English speakers, but that they have less impact on care efficiency or mortality. This finding of an association between language and readmission, without a similar association with efficiency, suggests a potentially communication‐critical step in care.20, 21 Patients with language barriers are more likely to experience adverse events, and those events are often caused by errors in communication.12 It is conceivable that higher readmission risk for Chinese and Spanish speakers in our study was, at least in part, due to gaps in communication that are present in all patient groups, and exacerbated by the presence of a language barrier. This barrier is likely present during hospitalization but magnified at discharge, limiting caregivers' ability to understand patients' needs for home care, while simultaneously limiting patients' understanding of the discharge plan. After discharge, it is also possible that non‐English speakers are less able to communicate their needs as they arise, ormore subtlyfeel less supported by a primarily English speaking healthcare system. As in other clinical arenas,22 it is quite possible that increased access to professional interpreters in the hospital setting, and particularly at the time of discharge, would enhance communication and outcomes for LEP patients. Our interpreter services data showed that the patients in our study had quite limited access to staff professional interpreters.
Our findings differ somewhat from those of John‐Baptiste et al.,11 who found that language barriers contributed to increased LOS for patients with cardiac and major surgical diagnoses. Our study's findings are akin to recent research suggesting that being a monolingual Spanish speaker or receiving interpreter services may not significantly impact LOS or cost of hospitalization,23 and that LOS and in‐hospital mortality do not differ for non‐English speakers and English speakers after acute myocardial infarction.24 These studies, along with our results, suggest that that care efficiency in the hospital may be driven much more by clinical acuity (eg, the need to respond rapidly to urgent clinical signs such as hypotension, fever and respiratory distress) than by adequacy of communication. For example, elderly LEP patients may be even more likely than English speakers to have vigilant family members at the bedside throughout their hospitalization due to their need for communication assistance; these family members can quickly alert hospital staff to concerning changes in the patient's condition.
Our results also suggest the possibility that language and ethnicity are not monolithic concepts, and that even within language and ethnic groups there are potential differences in care pattern. For example, not speaking English may be a surrogate marker for unmeasured factors such as social supports and access to care. Language is intimately associated with culture; it remains plausible that cultural differences between highly acculturated and less acculturated members of a given ethno‐cultural group may have contributed to our observed differences in readmission rates. Differences in culture and associated factors, such as social support or use of multiple hospital systems, may account for lack of higher readmission risk in Russian speakers, while Chinese and Spanish speakers had higher readmission risk.
In addition, our finding that English‐speaking Latinos had lower readmission risk than any other group may be more consistent with their clinical characteristicseg, younger age, fewer comorbiditiesthan with cultural factors. Our finding that African American patients had the highest readmission risk in our hospital was both surprising and concerning. Some of this increased risk may be explained by clinical characteristics, such as higher comorbidities and higher rates of diagnoses leading to frequent admissions (eg, sickle cell disease); however, the reasons for this disparity deserves further investigation.
Our study has limitations. First, our data are administrative, and lack information about patients' educational attainment, social support, acculturation, utilization of other hospital systems, and usual source of care. Despite this, we were able to account for many significant covariates that might contribute to readmission rates, including age, insurance status, gender, comorbidities, and admission to the intensive care unit.2528 Second, our information about patients' English language proficiency is limited. While direct assessments of English proficiency are more accurate ways to determine a patient's ability to communicate with health care providers in English,29 our language validation work conducted in preparation for this study suggests that most of our patients recorded as having a non‐English primary language (87%) also have a low score on a language acculturation scale.
Third, only 14% of our non‐English speaking subjects utilized professional staff interpreters, and we had no information on the use of professional telephonic interpreters, or ad hoc interpretersfamily members, non‐interpreter staff membersand their impact on our results. It is well‐documented that ad hoc interpreters are used frequently in healthcare, particularly in the hospital setting, and thus we can assume this to be true in our study.30, 31 As noted above, it is likely that the advocacy of family members and friends at the bedside helped to minimize potential differences in care efficiency for patients with language barriers. Finally, our study was performed at a single university based hospital and may not produce results which are applicable to other care settings.
Our findings point to several avenues for future research on language barriers and hospitalized patients. First, the field would benefit from an examination of the impact of easy access to professional interpreters during hospitalization on outcomes of hospital care, in particular on readmission rates. Second, there is need for development and assessment of best practices for creating a culture of professional interpreter utilization in the hospital among physicians and nursing staff. Third, investigation of the role of caregiver presence in the hospital room and how this might differ by patient culture, age and language ability may further elucidate some of the differences across language groups observed in our study. Lastly, a more granular investigation of clinician‐patient communication and the importance of interpersonal processes of care on both patient satisfaction and understanding of and adherence to discharge instructions could lead to the development of detailed interventions to enhance this communication and these outcomes as it has done for communication‐sensitive outcomes in the outpatient arena.3234
In summary, our study suggests that higher risk for readmission can be added to the unfortunate list of outcomes which are worsened due to language barriers, pointing to transition from the hospital as a potentially communication‐critical step in care which may be amenable to intervention. Our findings also suggest that this risk can vary even between groups of patients who do not speak English primarily. Whether and to what degree language and communication barriers aloneincluding access to professional interpreters and patient‐centered communicationduring hospitalization, or differences in caregiver social support both during and after hospitalization as well as access to care post‐hospitalization contribute to these findings is a worthy subject of future research.
Acknowledgements
The authors acknowledge Dr. Eliseo J. Prez‐Stable for his mentorship on this project.
- ,. Language Use and English‐Speaking Ability:2000. Available at: http://www.census.gov/prod/2003pubs/c2kbr‐29.pdf. Accessed January 2010.
- U.S. Department of Health and Human Services.2006National Healthcare Disparities Report. AHRQ Publication No. 070012; 2006.
- ,,,.Disparities in health care by race, ethnicity, and language among the insured: findings from a national sample.Med Care.2002;40(1):52–59.
- ,.The effect of physician‐patient communication on mammography utilization by different ethnic groups.Med Care.1991;29(11):1065–1082.
- ,.Language of interview:relevance for research of Southwest Hispanics.Am J Pub Health.1991;81(11):1399–1404.
- ,,,.Is language a barrier to the use of preventive services?J Gen Intern Med.1997;12(8):472–477.
- ,,,.Impact of language barriers on patient satisfaction in an emergency department.JGIM.1999;14:82–87.
- .Patient comprehension of doctor‐patient communication on discharge from the emergency department.J Emerg Med.1997;15(1):1–7.
- ,,, et al.Drug complications in outpatients.J Gen Intern Med.2000;15:149–154.
- .Language concordance as a determinant of patient compliance and emergency room use in patients with asthma.Med Care.1988;26(12):1119–1128.
- ,,,et al.The effect of English language proficiency on length of stay and in‐hospital mortality.J Gen Intern Med.2004;19:221–228.
- ,,,.Language proficiency and adverse events in US hospitals: a pilot study.Int J Qual Health Care.2007;19(2):60–67.
- ,,, et al.Factors associated with discussion of care plans and code status at the time of hospital admission: results from the Multicenter Hospitalist Study.J Hosp Med.2008;3(6):437–445.
- ,,, et al.Quality of care for decompensated heart failure: comparable performance between academic hospitalists and non‐hospitalists.J Gen Intern Med.2008;23(9):1399–1406.
- ,,,.A new method of classifying prognostic comorbidity in longitudinal studies: development and validation.J Chronic Dis.1987;40(5):373–383.
- AHRQ. Healthcare Cost and Utilizlation Project: Tools 132(3):191–200.
- ,,.Free knot splines for logistic models and threshold selection.Comput Methods Programs Biomed.2005;77(1):1–9.
- ,,,,.Statistical methods in epidemiology: a comparison of statistical methods to analyze dose‐response and trend analysis in epidemiologic studies.J Clin Epidemiol.1998;51(12):1223–1233.
- The Care Transitions Project. Health Care Policy and Research, Practitioner Tools. Available at: http://www.caretransitions.org/practitioner_tools.asp.
- AHRQ. Improving safety at the point of care. Available at: http://www.ahrq.gov/qual/pips. Accessed January2010.
- ,,,.Do professional interpreters improve clinical care for patients with limited english proficiency? A systematic review of the literature.Health Serv Res.2007;42(2):727–754.
- ,,.The impact of an enhanced interpreter service intervention on hospital costs and patient satisfaction.J Gen Intern Med.2007;22 Suppl 2:306–311.
- ,,,,.Acute myocardial infarction length of stay and hospital mortality are not associated with language preference.J Gen Intern Med.2008;23(2):190–194.
- ,,.A systematic literature review of factors affecting outcome in older medical patients admitted to hospital.Age Ageing.2004;33(2):110–115.
- ,,,,,.Risk factors and prognostic predictors of unexpected intensive care unit admission within 3 days after ED discharge.Am J Emerg Med.2007;25(9):1009–1014.
- ,.Effect of gender, ethnicity, pulmonary disease, and symptom stability on rehospitalization in patients with heart failure.Am J Cardiol.2007;100(7):1139–1144.
- ,,,.Bouncing back: patterns and predictors of complicated transitions 30 days after hospitalization for acute ischemic stroke.J Am Geriatr Soc.2007;55(3):365–373.
- ,,,,.Identification of limited English proficient patients in clinical care.J Gen Intern Med.2008;23(10):1555–1560.
- ,,,,.Hospital langague services for patients with limited English proficiency: results from a national survey.Health Research October2006.
- ,.Hospitals, Language, and Culture: a Snapshot of the Nation. The Joint Commission and The California Endowment;2007.
- ,,, et al.A randomized controlled trial of interventions to enhance patient‐physician partnership, patient adherence and high blood pressure control among ethnic minorities and poor persons: study protocol NCT00123045.Implement Sci.2009;4:7.
- ,,,,.Interpersonal processes of care and patient satisfaction: do associations differ by race, ethnicity, and language?Health Serv Res.2009;44(4):1326–1344.
- ,,,.Understanding concordance in patient‐physician relationships: personal and ethnic dimensions of shared identity.Ann Fam Med.2008;6(3):198–205.
Copyright © 2010 Society of Hospital Medicine
UGIB vs. LGIB
Gastrointestinal bleeding (GIB) is a frequent reason for acute hospitalization, with estimated rates of hospitalization at 375 per 100,000 per year in the United States.1 GIB is not a specific disease but rather a diverse set of conditions that lead to the clinical manifestations associated with bleeding into the gastrointestinal tract. One of the most commonly used organizing frameworks in gastrointestinal bleeding is the differentiation between upper gastrointestinal bleeding (UGIB) and lower gastrointestinal bleeding (LGIB). There are important differences in the etiologies between the 2 sources. For example, acid‐related disease is a common etiology in UGIB but does not occur in LGIB. While some aspects of the acute management are shared between UGIB and LGIB, important differences exist in the management, including initial endoscopy and medication choice. There have been few direct comparisons of rates, resource use, and clinical outcomes between UGIB and LGIB.
Historically, rates of UGIB have been reported to exceed those of LGIB by 2‐fold to 8‐fold.25 Protocols, clinical practice guidelines, and policy decisions reflect this emphasis on UGIB.68 Among 9 guidelines hosted by National Guideline Clearinghouse addressing GIB, 6 were focused on UGIB, 2 on both UGIB and LGIB, and only 1 on LGIB.9 There are several reasons to believe that these relative incidence rates may not be accurate. First, recent advances in therapy and prevention of UGIB, such as the treatment of Helicobacter pylori infection; proton pump inhibitors (PPIs); and selective cyclooxygenase‐2 (COX‐2) inhibitors, may have affected the epidemiology of gastrointestinal bleeding.1016 Among these therapies, only COX‐2 inhibitors may also reduce the incidence of LGIB.14, 1618 Therefore, these advances may result in a disproportionate drop in UGIB relative to LGIB. In addition, known risk factors for both LGIB and UGIB, including advancing age and renal failure, are increasing in the general population.5, 19, 20 Finally, given the recent increased recommendations for aspirin therapy and systemic anticoagulation, exposure to aspirin and warfarin have increased, both risk factors for LGIB and UGIB.2124 Indeed, recent studies in the epidemiology of UGIB do suggest a changing pattern of etiologies of UGIB reflecting these advances.25 One study examining rates of both UGIB and LGIB demonstrate a decrease in hospitalizations overall for GIB driven by a reduction in UGIB while at the same time reporting an increase in the incidence of hospitalization for LGIB.1
In addition to a changing epidemiology, a second reason for a potential underestimation of LGIB incidence is one of methodology. There are well‐recognized limitations with using purely administrative data due to difficulties in accurately identifying patients with LGIB.26
Studies using large administrative databases may not accurately identify LGIB because of the poor sensitivity and specificity of International Classification of Diseases, Ninth revision, Clinical Modification (ICD‐9) codes for LGIB.5 While there are standard methods of identifying patients with UGIB using ICD‐9 codes,19 there is not an accepted standard for LGIB. Thus, estimates using only ICD‐9 codes may overidentify or underidentify patients with LGIB. Prior studies that have most accurately identified patients with LGIB used a 2‐step method to address this issue. The initial ICD‐9 identification included a high sensitivity/low specificity approach. These identified patient charts undergo chart review to confirm the presence of an LGIB.5 This method is labor intensive and cannot be done using administrative databases. No direct comparison of UGIB to LGIB among hospitalized patients using this 2‐step method has been done recently.
The current emphasis on UGIB as seen in the published guidelines could also be supported if patients with UGIB had greater resource utilization or worse clinical outcomes. Limited direct comparisons for these outcomes are available. However, 1 administrative database study reported similar mortality rates for UGIB (2.7%) and LGIB (2.9%) in 2006.1 No direct comparisons of other clinical outcomes or resource use outcomes are available. Therefore, the emphasis on UGIB in publications and guidelines is best supported by the incidence rates that are, as has already been discussed, problematic.
We conducted a retrospective cohort study to examine the incidences of UGIB and LGIB among patients admitted to an academic medical center over 2 years using methods designed to optimally identify patients with either UGIB or LGIB. Our study also examined differences in clinical outcomes and resource utilization between subjects with UGIB and LGIB to examine the relative severity of these 2 clinical entities. These results may be useful in determining the need to reconsider clinical approaches as well as protocols and guidelines among patients with gastrointestinal bleeding.
Patients and Methods
Patients
This retrospective cohort study evaluated all patients who were admitted with GIB to a large urban academic medical center from July 1, 2001 to June 30, 2003 and who consented to a larger study examining the effects of hospitalists on patient care. Subjects unable to provide consent due to death or lack of decisional capacity were consented via proxy. To identify patients with GIB, all patients were screened for a primary or secondary diagnosis of GIB using ICD 9 codes. These codes were selected for a very high sensitivity threshold to assure that all potential subjects with GIB were identified. All subjects identified using these codes underwent chart abstraction to determine if they met criteria for GIB. These inclusion criteria required documentation in any portion of the chart (including emergency department [ED] clinician documentation, admission note, nursing intake note, etc.) of signs or symptoms of GI hemorrhage upon admission, including: hematemesis, coffee ground emesis, gastrooccult‐positive emesis, melena, hematochezia, maroon stools, and hemoccult‐positive stools interpreted by the treating physician team as an acute GIB. Subjects identified using the ICD‐9 codes and confirmed to have an acute GIB by chart review were included in the study and underwent additional chart abstraction and administrative data analysis.
ICD‐9 codes for GIB included: esophageal varices with hemorrhage (456.0, 456.20), Mallory‐Weiss syndrome (530.7), gastric ulcer with hemorrhage (531.00531.61), duodenal ulcer with hemorrhage (532.00532.61), peptic ulcer, site unspecified, with hemorrhage (533.00533.61), gastrojejunal ulcer with hemorrhage (534.00534.61), gastritis with hemorrhage (535.61), angiodysplasia of stomach/duodenum with hemorrhage (537.83), hematemesis (578.0578.9), diverticular disease (562.00562.9), other disorders of the intestine (569.00569.9), congenital anomalies of the digestive system (751.00), proctocolitis (556.00), hemorrhoids (455.00455.6), nondysenteric colitis (006.2), noninfectious gastroenteritis and colitis (558.0558.9), salmonella gastroenteritis (003.3), malignant neoplasm of colon (153), familial adenomatous polyposis (211.3), and gastric varices (456.8).
Data
Trained research assistants performed chart abstraction with validation by the principal investigators (PIs) of the first 15 charts to ensure accuracy. Subsequently, research assistants consulted with PIs with any questions during abstracting with final decisions being made by PIs. Detailed chart abstraction collected admission medication lists as obtained by the admitting physician team, including the use of PPIs, histamine‐2 (H‐2) blockers, COX‐2 inhibitors, and medications known to increase the risk of GIB, such as nonselective NSAIDs (nsNSAIDs), aspirin, and other anticoagulants. Other clinical data including risk factors, comorbid illnesses, laboratory tests, and vital signs were also abstracted from subjects' charts.
The source (UGIB vs. LGIB) and etiology (peptic ulcer disease [PUD], varices, diverticula, etc.) of bleeding were assessed using endoscopic reports as the primary source. When no clear source was identified on endoscopy or no endoscopy was done, the abstracter would review all progress notes, discharge summaries, and other diagnostic test results such as angiography in order to identify the source of bleeding (UGIB vs. LGIB). Endoscopic reports that identified a patient as having a UGIB or LGIB but no confirmed etiology were classified as undetermined etiology unless review of the other clinical documentation provided a specific etiology.
Tachycardia was defined as pulse greater than 100 beats per minute. Orthostasis was defined by either a drop in systolic blood pressure of 20 mmHg or an increase in pulse of 10 beats per minute. Hospital administrative databases were utilized to obtain resource utilization (ie, length of stay [LOS], total cost of care, intensive care transfers), Charlson comorbidity index,27 30‐day readmission rate, and in‐hospital mortality. Hospital costs were determined using TSI cost accounting software (Transition Systems Incorporated [now Eclypsis Corporation], Boston, MA), a validated system to assess actual direct and indirect costs of care.
Statistical Analysis
Descriptive statistics (means and proportions) were calculated by location of GIB for all variables describing patient characteristics, clinical presentation, clinical outcomes, and resource utilization. Differences in age and Charlson comorbidity index by GIB location were evaluated using t tests. Differences in gender, race, and medication use were evaluated using chi‐squared tests of independence.
We fit generalized linear models to investigate differences by location of bleed for those variables measuring clinical outcomes (inpatient mortality, intensive care unit [ICU] transfer, emergency surgery, 30‐day readmission, change in hemoglobin) and those variables measuring resource outcomes (total cost, LOS, number of procedures, number of correct scopes, repeat scope indicator, incorrect scope indicator, number of red blood cell [RBC] transfusions). The repeat scope indicator was used to denote a repeat scope (either esophagogastroduodenoscopy [EGD] or colonoscopy) and the incorrect scope indicator was used to denote when the initial scope was negative and a follow‐up scope from the other direction was positive (negative EGD followed by positive colonoscopy or negative colonoscopy followed by positive EGD). For each variable we fit 2 regression models, the first model (unadjusted effect) only included location of bleed as a covariate. The second model (adjusted effect) included location of bleed, age, gender, race (black/not black) and Charlson comorbidity index as covariates. Binary outcomes were modeled using logistic regressions. For continuous variables, we determined the distribution and link of the outcome variable using residual diagnostics and by comparing the log likelihood and information criteria of competing models. All analyses were performed using STATA SE Version 9.0 (StataCorp, College Station, TX)
This study was approved by the University of Chicago Institutional Review Board.
Results
During the 2 years of observation, a total of 7741 subjects were admitted to the internal medicine service and enrolled in the hospitalist study. Of these, 1014 had a primary or secondary ICD‐9 code that may be consistent with UGIB or LGIB and underwent chart review to determine if they had an acute GIB. Out of 1014 subjects, 647 were determined not to have an acute GI hemorrhage and were excluded from the remaining analyses; 367 of the 1104 subjects identified by ICD‐9 codes were found to have a clinical presentation consistent with GIB and were included in this study. A total of 180 of these 367 had UGIB and 187 had LGIB. The mean age was 62.4 years, 56.7% were female, 82.6% were African American, 12.7% were Caucasian, and the mean Charlson index was 1.5. (Table 1) Among baseline characteristics, both gender and age were statistically associated with a difference in rates of upper vs. lower source bleeding, with LGIB patients more likely to be female (P = 0.01) and older (P < 0.001). Etiologies of UGIB include erosive disease, peptic ulcer disease, variceal bleeding, arteriovenous malformation, and malignancy. Etiologies of LGIB include: diverticulosis, colitis, arteriovenous malformation, cancer, ischemic colitis, polyp, hemorrhoidal bleed, ulcer, inflammatory bowel disease, other, and not determined (Table 2).
| Upper and Lower GI Bleeding (n = 367) | Upper GI Bleeding (n = 180) | Lower GI Bleeding (n = 187) | P Value | |
|---|---|---|---|---|
| ||||
| Age (years), mean (SD) | 62.4 (18.0) | 58.6 (18.2) | 66.0 (17.1) | <0.001 |
| Female gender (%) | 56.7 | 50.0 | 63.1 | 0.01 |
| Race (%) | ||||
| African American | 82.6 | 85.3 | 80.1 | 0.43 |
| White | 12.7 | 10.7 | 14.5 | |
| Other | 4.7 | 4.0 | 5.4 | |
| Charlson comorbidity index, mean (SD) | 1.5 (1.5) | 1.6 (1.6) | 1.4 (1.5) | 0.44 |
| Lower GI Bleed (n = 187) | Upper GI Bleed (n = 180) | ||||
|---|---|---|---|---|---|
| Etiology | Frequency | Percent of Total (%) | Etiology | Frequency | Percent of Total (%) |
| |||||
| Diverticulosis | 76 | 41 | Erosive disease | 86 | 48 |
| Not identified | 38 | 20 | Peptic ulcer | 51 | 28 |
| Colitis, NOS | 14 | 7 | Not identified | 26 | 14 |
| AVM | 13 | 7 | Mallory Weiss | 17 | 9 |
| Cancer | 11 | 6 | Varices | 8 | 4 |
| Ischemic colitis | 9 | 5 | AVMs | 5 | 3 |
| Polyp | 9 | 5 | Mass/cancer | 5 | 3 |
| Hemorrhoid | 8 | 4 | |||
| Ulcer | 5 | 3 | |||
| Other | 3 | 1 | |||
| IBD | 1 | <1 | |||
Baseline use of medications known to be associated with either increased or decreased risk of GIB was common. Approximately one‐third of subjects with both LGIB and UGIB used aspirin and 10% used warfarin. LGIB subjects were less likely to use an nsNSAID (P < 0.001), but more likely to use a proton pump inhibitor (PPI) (P = 0.06) (Table 3).
| Upper and Lower GI Bleeding (%) (n = 367) | Upper GI Bleeding (%) (n = 180) | Lower GI Bleeding (%) (n = 187) | P Value* | |
|---|---|---|---|---|
| ||||
| Aspirin | 34.9 | 31.8 | 37.4 | 0.28 |
| nsNSAID | 12.9 | 20.8 | 6.4 | < 0.001 |
| COX‐2 selective inhibitor | 8.2 | 6.5 | 9.6 | 0.29 |
| Warfarin | 10.9 | 8.4 | 12.8 | 0.19 |
| PPI | 24.3 | 19.5 | 28.3 | 0.06 |
| nsNSAID + PPI | 1.8 | 1.3 | 2.1 | 0.56 |
| COX‐2 + PPI | 2.9 | 1.3 | 4.3 | 0.11 |
Key initial clinical presentation findings included vital sign abnormalities and admission hemoglobin levels. While hypotension was not common (4.7%), resting tachycardia (37%) and orthostasis (16%) were seen frequently. Subjects with LGIB were significantly less likely than those with UGIB to present with orthostasis (8.8% vs. 21.0%, respectively; P = 0.006) and resting tachycardia (32.3% vs. 42.5%, respectively; P = 0.04). Subjects with LGIB had a higher admission hemoglobin than those with UGIB (10.7 vs. 9.7, respectively; P < 0.001) (Table 4).
| Clinical Finding | Upper and Lower GI Bleeding (n = 367) | Upper GI Bleeding (n = 180) | Lower GI Bleeding (n = 187) | P Value* |
|---|---|---|---|---|
| ||||
| Hypotension (%) | 4.7 | 5.7 | 3.8 | 0.39 |
| Resting tachycardia (%) | 37.3 | 42.5 | 32.3 | 0.04 |
| Orthostatic hypotension (%) | 16.2 | 21.0 | 8.8 | 0.006 |
| Admission hemoglobin (g/dL), mean (SD) | 10.2 (2.6) | 9.7 (2.7) | 10.7 (2.5) | <0.001 |
We also examined several clinical outcomes. When comparing LGIB to UGIB patients for these clinical outcomes using bivariate and multivariate statistics, there was no difference for in‐hospital mortality (1.1% vs. 1.1%), transfer to ICU (16.0% vs. 13.9%), 30‐day readmission (5.9% vs.7.8%), number of red blood cell (RBC) transfusions (2.7 vs. 2.4), or need for GI surgery (1.1% vs. 0.0%). The mean drop in hemoglobin was greater among subjects with LGIB compared to UGIB (1.9 g/dL vs. 1.5 g/dL, respectively) by both bivariate (P = 0.01) and multivariate (P = 0.003) analyses (Table 5).
| Upper GI Bleeding (n = 180) | Lower GI Bleeding (n = 187) | Bivariate P Value | Multivariate P Value | |
|---|---|---|---|---|
| ||||
| In‐hospital mortality (%)* | 1.1 | 1.1 | 0.97 | 0.74 |
| Transfer to ICU (%)* | 13.9 | 16.0 | 0.56 | 0.44 |
| Drop in hemoglobin (g/dL), mean (SD) | 1.5 (1.5) | 1.9 (1.6) | 0.01 | 0.003 |
| Packed RBC transfusions required (units), mean (SD)* | 2.4 (2.9) | 2.7 (3.7) | 0.36 | 0.33 |
| Surgery for GI bleeding (%) | 0.0% | 1.1 | ||
| 30‐day readmission rate (%)* | 7.8 | 5.9 | 0.49 | 0.45 |
Mean costs were $11,892 for LGIB and $14,301 for UGIB and median costs were $7,890 for LGIB and $9,548 for UGIB, but were not statistically different. LOS was also similar between subjects with LGIB (5.1 days) and UGIB (5.7 days). In bivariate and multivariate analyses, UGIB subjects had a similar mean number of endoscopic procedures (1.3) compared to LGIB subjects (1.2). Thirteen percent of subjects with UGIB required a second EGD while only 8% of subjects with LGIB required 2 colonoscopies. In addition, 29% of subjects with LGIB received an EGD while only 16% of subjects with an UGIB received a colonoscopy (P = 0.001) (Table 6).
| Upper GI Bleeding (n = 180) | Lower GI Bleeding (n = 187) | Bivariate P Value | Multivariate P Value | |
|---|---|---|---|---|
| ||||
| Cost ($), mean (SD)* | 14,301 (17,196) | 11,892 (13,100) | 0.13 | 0.21 |
| Cost ($), median | $9,548 | $7,890 | ||
| Length of stay (days), mean (SD)* | 5.7 (7.0) | 5.1 (5.3) | 0.37 | 0.72 |
| Number of endoscopies/ patient, mean (SD) | 1.3 (0.5) | 1.2 (0.9) | 0.18 | 0.20 |
Conclusions
This study represents one of the largest direct comparisons of LGIB to UGIB not based on administrative databases. The most striking finding was the nearly equal rates of LGIB and UGIB. There are 2 likely explanations for this surprising result. First, there may be methodological reasons that we identified a greater proportion of true LGIBs; our study used a highly sensitive search strategy of ICD‐9 coding with confirmatory chart abstraction to ensure that as many LGIB and UGIB cases would be identified as possible while also excluding cases not meeting accepted criteria for GIB. The second possibility is that there is an actual change in epidemiology of GIB. Known risk factors for LGIB are increasing such as advancing age, increased use of chronic aspirin therapy, and renal disease. At the same time, significant advances in the treatment and prevention of UGIB have been made. Recent studies have demonstrated similar trends in admissions for upper and lower GI complications, suggesting that there may be a changing epidemiology due primarily to reductions in upper GI complications.1, 16
Either explanation would have implications for the care of patients with GIB. Clinical decision‐making based on prior literature would support that in ambiguous clinical situations and initial evaluation for an UGIB is appropriate. Most risk stratification literature and clinical guidelines focus on UGIB. If rates of LGIB and UGIB are similar, then existing clinical decision protocols may need to be reevaluated to incorporate the higher likelihood of LGIB. This reevaluation would be less important if the clinical outcomes or resource utilization of UGIB was significantly greater than that for LGIB, but we did not find this was the case. Similarly, if the ability to distinguish between LGIB and UGIB were robust on clinical signs and symptoms, then a reevaluation would be less important. However, we found fairly similar numbers of patients initially receiving evaluation for UGIB then being evaluated for LGIB as we found patients initially receiving evaluation for LGIB then being evaluated for UGIB. This suggests the potential benefit of clinical decision protocols that could better distinguish between UGIB and LGIB and account for the potentially higher incidence of LGIB than previously thought.
In addition to affecting the attention paid to LGIB for acute management, a changed understanding of incidence could also affect the attention paid to prevention of LGIB. Of the recent nonendoscopic advances in the treatment and prevention of GIB, only the use of COX‐2s (when used in place of traditional nsNSAIDs) reduces the risk of both LGIB and UGIB;14, 1618 H .pylori treatment and PPIs only prevent UGIB. Therefore, if the clinical and financial burdens of LGIB are similar to those seen in UGIB, more attention may need to be focused on preventing LGIB.
Baseline medication use was notable primarily for the similarities between UGIB and LGIB. Agents known to affect the rates of GIB were common in both groups. Over one‐third of the population was using aspirin and 10% were taking warfarin. Over 20% of subjects were taking an nsNSAID or a COX‐2 inhibitor. Almost one‐quarter of subjects were taking a PPI, agents known to decrease rates of UGIB and potentially increase LGIB through the risk of C. difficile colitis. Notably, the only statistically significant difference in baseline medication use between subjects with UGIB and LGIB was the more than 3‐fold higher use of nsNSAIDs in patients with UGIB as compared to LGIB. While current guidelines are not clear and consistent about which populations of at‐risk patients should receive GI prophylaxis,2830 these results suggest that patients admitted with GIB are very likely to be taking medications which impact the risk of GIB.
In terms of disease severity, the clinical presentation at admission suggests a greater degree of hemodynamic instability among subjects with UGIB. Rates of orthostatic hypotension and resting tachycardia are higher in UGIB subjects, as well as having a lower mean hemoglobin levels at presentation. However, despite the more severe clinical presentation, clinical outcomes did not differ significantly between the 2 bleeding sources. Thus, the most relevant clinical outcomes suggest that the severity of both LGIB and UGIB are similar. This similarity again suggest that the clinical burden of LGIB is not significantly different than UGIB.
Our results concerning resource utilization demonstrate a similar pattern. While the point estimates for costs and LOS suggest that UGIB may be associated with higher resource utilization, these differences were not significant in either bivariate or multivariate analyses. Those subjects with UGIB did receive more total endoscopic procedures than subjects with LGIB. More interesting though was that 24% of all subjects received an endoscopy of the opposite site (LGIB with EGD and UGIB with colonoscopy). These results suggest that the site of bleeding is not clear in a significant proportion of patients who present with GIB. These additional endoscopies are associated with increased risk, costs, LOS, and discomfort to patients. Improving our ability to accurately predict the source (upper vs. lower) of bleeding would allow us to reduce the number of these excess endoscopies. Additionally, it is interesting that despite the almost universal use of endoscopies, 20% of LGIB and 14% of UGIB subjects could not have a specific etiology identified during endoscopy or subsequent workup.
There are some important limitations to this study. While the sample size is among the largest of its type involving chart abstraction, it may be underpowered to detect some differences. Additionally, our results are from a single urban academic medical center with a patient population that is predominantly African American, which may limit generalizability. This study required consent and therefore only examines a subset of patients admitted to the medical center with GIB, which could potentially introduce bias into the sample. However, it is not clear why there would be systematic differences in subjects who choose to consent vs. those who decide not to consent that would affect the results of this study in substantive ways.
Despite significant efforts at identifying all subjects with GIB admitted during this time period, there were potential methodological reasons that may have resulted in some cases being missed. Only subjects admitted to a medicine service were approached for consent. All subjects in this medical center with GIB are admitted to a medicine service. We captured all subjects who were initially admitted to a medicine service as well as those admitted initially to an ICU and then transferred to the floor at any point prior to discharge. It is possible, though, that a subject would be admitted to an ICU for GIB and die prior to being transferred to the floor. While it is the impression of the director of the ICU that this would be a very unusual event, as most of the patients would be discharged to the floor prior to death (personal communication), given the very low mortality rate seen in this study, small numbers of missed events could have a significant impact on the interpretation of in‐hospital mortality results. It is also important to note that this medical center did not have the ability to perform endoscopy prior to admission for patients with GIB at the time of the study; all patients who presented with GIB would have been admitted and identified for this study. Finally, we were unable to routinely identify the rationale for obtaining an endoscopic exam. We assumed that all endoscopic exams were done for the purpose of evaluating and/or treating the GIB for which the subject was admitted. It is possible that some subjects had additional endoscopies for other reasons, which would have led to our overestimating the rates of additional endoscopies for GIB.
This study highlights the similarities between LGIB and UGIB rather than the differences. There were few significant differences between the 2 bleeding sources in terms of incidence, clinical outcomes, and resource utilization. In fact, the study also suggests that determining the source of bleeding may not be clear, given the high rates of opposite site endoscopies. While this study did reveal several similarities between UGIB and LGIB, it also highlights the need to identify improved strategies to improve the sensitivity and specificity of identification of LGIB compared to UGIB, both for clinical purposes and for research. The value of such improved clinical algorithms have the potential to improve both the cost and outcomes of care, while better algorithms for separating UGIB and LGIB using administrative data might help produce more precise estimates of costs and clinical outcomes, and aid in the development of risk stratification models.
- ,.Hospitalizations for Gastrointestinal Bleeding in 1998 and 2006. HCUP Statistical Brief #65, December 2008.Rockville, MD:Agency for Healthcare Research and Quality.
- ,.Causes and outcome of upper and lower gastrointestinal bleeding: The Grady Hospital Experience.South Med J.1999;92(1):44–50.
- ,,, et al.Acute upper gastrointestinal haemorrhage in west of Scotland: case ascertainment study.BMJ.1997;315:510–540.
- ,.A cost‐effective approach to the patient with peptic ulcer bleeding.Surg Clin North Am.1996;76:83–103.
- .Epidemiology and outcome of patients hospitalized with acute lower gastrointestinal hemorrhage: a population based study.Am J Gastroenterol.1997;92:419–424.
- ,,.Consensus recommendations for managing patients with nonvariceal upper gastrointestinal bleeding.Ann Int Med.2003;139:843–857.
- ,.Incremental value of upper endoscopy for triage of patients with acute non‐variceal upper‐GI hemorrhage.Gastrointest Endosc2004;60:9–14.
- ,,, et al.Upper gastrointestinal hemorrhage clinical guideline‐determining the optimal hospital length of stay.Am J Med.1996;100:313–322.
- National Guideline Clearinghouse. Available at: http://www.guideline.gov. Accessed August2009.
- ,,, et al.Prevention of ulcer recurrence after eradication of Helicobacter pylori: a prospective long‐term follow‐up study.Gastroenterology.1997;113:1082–1086.
- ,,, et al.Treatment of Helicobacter pylori in patients with duodenal ulcer hemorrhage‐a long‐term randomized, controlled study.Am J Gastroenterol.2000;95:2225–2232.
- ,,, et al.Preventing recurrent upper gastrointestinal bleeding in patients with Helicobacter pylori infection who are taking low‐dose aspirin or naproxen.N Engl J Med.2001;344:967–973.
- ,,, et al.Lansoprazole for the prevention of recurrences of ulcer complications from long‐term low‐dose aspirin use.N Engl J Med.2002;346:2033–2038.
- ,,, et al.Comparison of upper gastrointestinal toxicity of rofecoxib and naproxen in patients with rheumatoid arthritis. VIGOR Study Group.N Engl J Med.2000;343:1520–1528.
- ,,, et al.Gastrointestinal toxicity with celecoxib vs nonsteroidal anti‐inflammatory drugs for osteoarthritis and rheumatoid arthritis: the CLASS study: a randomized controlled trial. Celecoxib Long‐Term Arthritis Safety Study.JAMA.2000;284:1247–1255.
- ,,, et al.Time trends and clinical impact of upper and lower gastrointestinal complications. Digestive Disease Week National Meeting,2008. San Diego, CA, May 17–22.
- ,,, et al.Video capsule endoscopy to prospectively assess small bowel injury with celecoxib, naproxen plus omeprazole, and placebo.Clin Gastroenterol Hepatol.2005;3:133–141.
- ,,, et al.Serious lower gastrointestinal clinical events with nonselective NSAID or Coxib use.Gastroenterology.2003;124:288–292.
- ,,, et al.Risk factors for upper gastrointestinal bleeding among end‐stage renal disease patients.Kidney Int.2003;64:1455–1461.
- ,,, et al.Risk factors for hospitalized bleeding among older patients.J Am Geriatr Soc.2001;49:126–133.
- Institute for Clinical Systems Improvement (ICSI). Preventive services in adults. Bloomington, MN: Institute for Clinical Systems Improvement (ICSI).2005. Available at http://www.isci.org/guidelines_and_more/guidelines_order_sets_protocol/for_patients_families/preventive_services_for_adults_for_patients_families_.html. Accessed Month year.
- .NSAID‐associated deaths: the rise and fall of NSAID‐associated GI mortality.Am J Gastroenterol.2005;100:1694–1695.
- ,.Effects of very low doses of daily long‐term aspirin therapy on gastric, duodenal, and rectal prostaglandins on mucosal injury in healthy humans.Gastroenterology. 199;117:17–25.
- ,,, et al.A nationwide study of mortality associated with hospital admission due to severe gastrointestinal events and those associated with nonsteroidal antiinflammatory drug use.Am J Gastroenterol.2005;100:1685–1693.
- ,,, et al.Acute upper GI bleeding: did anything change?Am J Gastroenterol.2003;98:1494–1499.
- ,.Lower intestinal bleeding.Best Pract Res Clin Gastroenterol.2001;15:135–153.
- ,,,.A new method of classifying prognostic comorbidity in longitudinal studies: development and validation.J Chronic Dis.1987;40:373–383.
- AGS Panel on Persistent Pain in Older Persons. The management of persistent pain in older persons.J Am Geriatr Soc.2002;50(6 suppl):S205–S224.
- ,,, et al.Pain in Osteoarthritis, Rheumatoid Arthritis and Juvenile Chronic Arthritis.2nd ed.Clinical practice guideline no. 2.Glenview, IL:American Pain Society (APS);2002:179.
- American College of Rheumatology Subcommittee on Osteoarthritis Guidelines.Recommendations for the Medical Management of Osteoarthritis of the Hip and Knee.Arthritis Rheum.2000;43:1905–1915.
Gastrointestinal bleeding (GIB) is a frequent reason for acute hospitalization, with estimated rates of hospitalization at 375 per 100,000 per year in the United States.1 GIB is not a specific disease but rather a diverse set of conditions that lead to the clinical manifestations associated with bleeding into the gastrointestinal tract. One of the most commonly used organizing frameworks in gastrointestinal bleeding is the differentiation between upper gastrointestinal bleeding (UGIB) and lower gastrointestinal bleeding (LGIB). There are important differences in the etiologies between the 2 sources. For example, acid‐related disease is a common etiology in UGIB but does not occur in LGIB. While some aspects of the acute management are shared between UGIB and LGIB, important differences exist in the management, including initial endoscopy and medication choice. There have been few direct comparisons of rates, resource use, and clinical outcomes between UGIB and LGIB.
Historically, rates of UGIB have been reported to exceed those of LGIB by 2‐fold to 8‐fold.25 Protocols, clinical practice guidelines, and policy decisions reflect this emphasis on UGIB.68 Among 9 guidelines hosted by National Guideline Clearinghouse addressing GIB, 6 were focused on UGIB, 2 on both UGIB and LGIB, and only 1 on LGIB.9 There are several reasons to believe that these relative incidence rates may not be accurate. First, recent advances in therapy and prevention of UGIB, such as the treatment of Helicobacter pylori infection; proton pump inhibitors (PPIs); and selective cyclooxygenase‐2 (COX‐2) inhibitors, may have affected the epidemiology of gastrointestinal bleeding.1016 Among these therapies, only COX‐2 inhibitors may also reduce the incidence of LGIB.14, 1618 Therefore, these advances may result in a disproportionate drop in UGIB relative to LGIB. In addition, known risk factors for both LGIB and UGIB, including advancing age and renal failure, are increasing in the general population.5, 19, 20 Finally, given the recent increased recommendations for aspirin therapy and systemic anticoagulation, exposure to aspirin and warfarin have increased, both risk factors for LGIB and UGIB.2124 Indeed, recent studies in the epidemiology of UGIB do suggest a changing pattern of etiologies of UGIB reflecting these advances.25 One study examining rates of both UGIB and LGIB demonstrate a decrease in hospitalizations overall for GIB driven by a reduction in UGIB while at the same time reporting an increase in the incidence of hospitalization for LGIB.1
In addition to a changing epidemiology, a second reason for a potential underestimation of LGIB incidence is one of methodology. There are well‐recognized limitations with using purely administrative data due to difficulties in accurately identifying patients with LGIB.26
Studies using large administrative databases may not accurately identify LGIB because of the poor sensitivity and specificity of International Classification of Diseases, Ninth revision, Clinical Modification (ICD‐9) codes for LGIB.5 While there are standard methods of identifying patients with UGIB using ICD‐9 codes,19 there is not an accepted standard for LGIB. Thus, estimates using only ICD‐9 codes may overidentify or underidentify patients with LGIB. Prior studies that have most accurately identified patients with LGIB used a 2‐step method to address this issue. The initial ICD‐9 identification included a high sensitivity/low specificity approach. These identified patient charts undergo chart review to confirm the presence of an LGIB.5 This method is labor intensive and cannot be done using administrative databases. No direct comparison of UGIB to LGIB among hospitalized patients using this 2‐step method has been done recently.
The current emphasis on UGIB as seen in the published guidelines could also be supported if patients with UGIB had greater resource utilization or worse clinical outcomes. Limited direct comparisons for these outcomes are available. However, 1 administrative database study reported similar mortality rates for UGIB (2.7%) and LGIB (2.9%) in 2006.1 No direct comparisons of other clinical outcomes or resource use outcomes are available. Therefore, the emphasis on UGIB in publications and guidelines is best supported by the incidence rates that are, as has already been discussed, problematic.
We conducted a retrospective cohort study to examine the incidences of UGIB and LGIB among patients admitted to an academic medical center over 2 years using methods designed to optimally identify patients with either UGIB or LGIB. Our study also examined differences in clinical outcomes and resource utilization between subjects with UGIB and LGIB to examine the relative severity of these 2 clinical entities. These results may be useful in determining the need to reconsider clinical approaches as well as protocols and guidelines among patients with gastrointestinal bleeding.
Patients and Methods
Patients
This retrospective cohort study evaluated all patients who were admitted with GIB to a large urban academic medical center from July 1, 2001 to June 30, 2003 and who consented to a larger study examining the effects of hospitalists on patient care. Subjects unable to provide consent due to death or lack of decisional capacity were consented via proxy. To identify patients with GIB, all patients were screened for a primary or secondary diagnosis of GIB using ICD 9 codes. These codes were selected for a very high sensitivity threshold to assure that all potential subjects with GIB were identified. All subjects identified using these codes underwent chart abstraction to determine if they met criteria for GIB. These inclusion criteria required documentation in any portion of the chart (including emergency department [ED] clinician documentation, admission note, nursing intake note, etc.) of signs or symptoms of GI hemorrhage upon admission, including: hematemesis, coffee ground emesis, gastrooccult‐positive emesis, melena, hematochezia, maroon stools, and hemoccult‐positive stools interpreted by the treating physician team as an acute GIB. Subjects identified using the ICD‐9 codes and confirmed to have an acute GIB by chart review were included in the study and underwent additional chart abstraction and administrative data analysis.
ICD‐9 codes for GIB included: esophageal varices with hemorrhage (456.0, 456.20), Mallory‐Weiss syndrome (530.7), gastric ulcer with hemorrhage (531.00531.61), duodenal ulcer with hemorrhage (532.00532.61), peptic ulcer, site unspecified, with hemorrhage (533.00533.61), gastrojejunal ulcer with hemorrhage (534.00534.61), gastritis with hemorrhage (535.61), angiodysplasia of stomach/duodenum with hemorrhage (537.83), hematemesis (578.0578.9), diverticular disease (562.00562.9), other disorders of the intestine (569.00569.9), congenital anomalies of the digestive system (751.00), proctocolitis (556.00), hemorrhoids (455.00455.6), nondysenteric colitis (006.2), noninfectious gastroenteritis and colitis (558.0558.9), salmonella gastroenteritis (003.3), malignant neoplasm of colon (153), familial adenomatous polyposis (211.3), and gastric varices (456.8).
Data
Trained research assistants performed chart abstraction with validation by the principal investigators (PIs) of the first 15 charts to ensure accuracy. Subsequently, research assistants consulted with PIs with any questions during abstracting with final decisions being made by PIs. Detailed chart abstraction collected admission medication lists as obtained by the admitting physician team, including the use of PPIs, histamine‐2 (H‐2) blockers, COX‐2 inhibitors, and medications known to increase the risk of GIB, such as nonselective NSAIDs (nsNSAIDs), aspirin, and other anticoagulants. Other clinical data including risk factors, comorbid illnesses, laboratory tests, and vital signs were also abstracted from subjects' charts.
The source (UGIB vs. LGIB) and etiology (peptic ulcer disease [PUD], varices, diverticula, etc.) of bleeding were assessed using endoscopic reports as the primary source. When no clear source was identified on endoscopy or no endoscopy was done, the abstracter would review all progress notes, discharge summaries, and other diagnostic test results such as angiography in order to identify the source of bleeding (UGIB vs. LGIB). Endoscopic reports that identified a patient as having a UGIB or LGIB but no confirmed etiology were classified as undetermined etiology unless review of the other clinical documentation provided a specific etiology.
Tachycardia was defined as pulse greater than 100 beats per minute. Orthostasis was defined by either a drop in systolic blood pressure of 20 mmHg or an increase in pulse of 10 beats per minute. Hospital administrative databases were utilized to obtain resource utilization (ie, length of stay [LOS], total cost of care, intensive care transfers), Charlson comorbidity index,27 30‐day readmission rate, and in‐hospital mortality. Hospital costs were determined using TSI cost accounting software (Transition Systems Incorporated [now Eclypsis Corporation], Boston, MA), a validated system to assess actual direct and indirect costs of care.
Statistical Analysis
Descriptive statistics (means and proportions) were calculated by location of GIB for all variables describing patient characteristics, clinical presentation, clinical outcomes, and resource utilization. Differences in age and Charlson comorbidity index by GIB location were evaluated using t tests. Differences in gender, race, and medication use were evaluated using chi‐squared tests of independence.
We fit generalized linear models to investigate differences by location of bleed for those variables measuring clinical outcomes (inpatient mortality, intensive care unit [ICU] transfer, emergency surgery, 30‐day readmission, change in hemoglobin) and those variables measuring resource outcomes (total cost, LOS, number of procedures, number of correct scopes, repeat scope indicator, incorrect scope indicator, number of red blood cell [RBC] transfusions). The repeat scope indicator was used to denote a repeat scope (either esophagogastroduodenoscopy [EGD] or colonoscopy) and the incorrect scope indicator was used to denote when the initial scope was negative and a follow‐up scope from the other direction was positive (negative EGD followed by positive colonoscopy or negative colonoscopy followed by positive EGD). For each variable we fit 2 regression models, the first model (unadjusted effect) only included location of bleed as a covariate. The second model (adjusted effect) included location of bleed, age, gender, race (black/not black) and Charlson comorbidity index as covariates. Binary outcomes were modeled using logistic regressions. For continuous variables, we determined the distribution and link of the outcome variable using residual diagnostics and by comparing the log likelihood and information criteria of competing models. All analyses were performed using STATA SE Version 9.0 (StataCorp, College Station, TX)
This study was approved by the University of Chicago Institutional Review Board.
Results
During the 2 years of observation, a total of 7741 subjects were admitted to the internal medicine service and enrolled in the hospitalist study. Of these, 1014 had a primary or secondary ICD‐9 code that may be consistent with UGIB or LGIB and underwent chart review to determine if they had an acute GIB. Out of 1014 subjects, 647 were determined not to have an acute GI hemorrhage and were excluded from the remaining analyses; 367 of the 1104 subjects identified by ICD‐9 codes were found to have a clinical presentation consistent with GIB and were included in this study. A total of 180 of these 367 had UGIB and 187 had LGIB. The mean age was 62.4 years, 56.7% were female, 82.6% were African American, 12.7% were Caucasian, and the mean Charlson index was 1.5. (Table 1) Among baseline characteristics, both gender and age were statistically associated with a difference in rates of upper vs. lower source bleeding, with LGIB patients more likely to be female (P = 0.01) and older (P < 0.001). Etiologies of UGIB include erosive disease, peptic ulcer disease, variceal bleeding, arteriovenous malformation, and malignancy. Etiologies of LGIB include: diverticulosis, colitis, arteriovenous malformation, cancer, ischemic colitis, polyp, hemorrhoidal bleed, ulcer, inflammatory bowel disease, other, and not determined (Table 2).
| Upper and Lower GI Bleeding (n = 367) | Upper GI Bleeding (n = 180) | Lower GI Bleeding (n = 187) | P Value | |
|---|---|---|---|---|
| ||||
| Age (years), mean (SD) | 62.4 (18.0) | 58.6 (18.2) | 66.0 (17.1) | <0.001 |
| Female gender (%) | 56.7 | 50.0 | 63.1 | 0.01 |
| Race (%) | ||||
| African American | 82.6 | 85.3 | 80.1 | 0.43 |
| White | 12.7 | 10.7 | 14.5 | |
| Other | 4.7 | 4.0 | 5.4 | |
| Charlson comorbidity index, mean (SD) | 1.5 (1.5) | 1.6 (1.6) | 1.4 (1.5) | 0.44 |
| Lower GI Bleed (n = 187) | Upper GI Bleed (n = 180) | ||||
|---|---|---|---|---|---|
| Etiology | Frequency | Percent of Total (%) | Etiology | Frequency | Percent of Total (%) |
| |||||
| Diverticulosis | 76 | 41 | Erosive disease | 86 | 48 |
| Not identified | 38 | 20 | Peptic ulcer | 51 | 28 |
| Colitis, NOS | 14 | 7 | Not identified | 26 | 14 |
| AVM | 13 | 7 | Mallory Weiss | 17 | 9 |
| Cancer | 11 | 6 | Varices | 8 | 4 |
| Ischemic colitis | 9 | 5 | AVMs | 5 | 3 |
| Polyp | 9 | 5 | Mass/cancer | 5 | 3 |
| Hemorrhoid | 8 | 4 | |||
| Ulcer | 5 | 3 | |||
| Other | 3 | 1 | |||
| IBD | 1 | <1 | |||
Baseline use of medications known to be associated with either increased or decreased risk of GIB was common. Approximately one‐third of subjects with both LGIB and UGIB used aspirin and 10% used warfarin. LGIB subjects were less likely to use an nsNSAID (P < 0.001), but more likely to use a proton pump inhibitor (PPI) (P = 0.06) (Table 3).
| Upper and Lower GI Bleeding (%) (n = 367) | Upper GI Bleeding (%) (n = 180) | Lower GI Bleeding (%) (n = 187) | P Value* | |
|---|---|---|---|---|
| ||||
| Aspirin | 34.9 | 31.8 | 37.4 | 0.28 |
| nsNSAID | 12.9 | 20.8 | 6.4 | < 0.001 |
| COX‐2 selective inhibitor | 8.2 | 6.5 | 9.6 | 0.29 |
| Warfarin | 10.9 | 8.4 | 12.8 | 0.19 |
| PPI | 24.3 | 19.5 | 28.3 | 0.06 |
| nsNSAID + PPI | 1.8 | 1.3 | 2.1 | 0.56 |
| COX‐2 + PPI | 2.9 | 1.3 | 4.3 | 0.11 |
Key initial clinical presentation findings included vital sign abnormalities and admission hemoglobin levels. While hypotension was not common (4.7%), resting tachycardia (37%) and orthostasis (16%) were seen frequently. Subjects with LGIB were significantly less likely than those with UGIB to present with orthostasis (8.8% vs. 21.0%, respectively; P = 0.006) and resting tachycardia (32.3% vs. 42.5%, respectively; P = 0.04). Subjects with LGIB had a higher admission hemoglobin than those with UGIB (10.7 vs. 9.7, respectively; P < 0.001) (Table 4).
| Clinical Finding | Upper and Lower GI Bleeding (n = 367) | Upper GI Bleeding (n = 180) | Lower GI Bleeding (n = 187) | P Value* |
|---|---|---|---|---|
| ||||
| Hypotension (%) | 4.7 | 5.7 | 3.8 | 0.39 |
| Resting tachycardia (%) | 37.3 | 42.5 | 32.3 | 0.04 |
| Orthostatic hypotension (%) | 16.2 | 21.0 | 8.8 | 0.006 |
| Admission hemoglobin (g/dL), mean (SD) | 10.2 (2.6) | 9.7 (2.7) | 10.7 (2.5) | <0.001 |
We also examined several clinical outcomes. When comparing LGIB to UGIB patients for these clinical outcomes using bivariate and multivariate statistics, there was no difference for in‐hospital mortality (1.1% vs. 1.1%), transfer to ICU (16.0% vs. 13.9%), 30‐day readmission (5.9% vs.7.8%), number of red blood cell (RBC) transfusions (2.7 vs. 2.4), or need for GI surgery (1.1% vs. 0.0%). The mean drop in hemoglobin was greater among subjects with LGIB compared to UGIB (1.9 g/dL vs. 1.5 g/dL, respectively) by both bivariate (P = 0.01) and multivariate (P = 0.003) analyses (Table 5).
| Upper GI Bleeding (n = 180) | Lower GI Bleeding (n = 187) | Bivariate P Value | Multivariate P Value | |
|---|---|---|---|---|
| ||||
| In‐hospital mortality (%)* | 1.1 | 1.1 | 0.97 | 0.74 |
| Transfer to ICU (%)* | 13.9 | 16.0 | 0.56 | 0.44 |
| Drop in hemoglobin (g/dL), mean (SD) | 1.5 (1.5) | 1.9 (1.6) | 0.01 | 0.003 |
| Packed RBC transfusions required (units), mean (SD)* | 2.4 (2.9) | 2.7 (3.7) | 0.36 | 0.33 |
| Surgery for GI bleeding (%) | 0.0% | 1.1 | ||
| 30‐day readmission rate (%)* | 7.8 | 5.9 | 0.49 | 0.45 |
Mean costs were $11,892 for LGIB and $14,301 for UGIB and median costs were $7,890 for LGIB and $9,548 for UGIB, but were not statistically different. LOS was also similar between subjects with LGIB (5.1 days) and UGIB (5.7 days). In bivariate and multivariate analyses, UGIB subjects had a similar mean number of endoscopic procedures (1.3) compared to LGIB subjects (1.2). Thirteen percent of subjects with UGIB required a second EGD while only 8% of subjects with LGIB required 2 colonoscopies. In addition, 29% of subjects with LGIB received an EGD while only 16% of subjects with an UGIB received a colonoscopy (P = 0.001) (Table 6).
| Upper GI Bleeding (n = 180) | Lower GI Bleeding (n = 187) | Bivariate P Value | Multivariate P Value | |
|---|---|---|---|---|
| ||||
| Cost ($), mean (SD)* | 14,301 (17,196) | 11,892 (13,100) | 0.13 | 0.21 |
| Cost ($), median | $9,548 | $7,890 | ||
| Length of stay (days), mean (SD)* | 5.7 (7.0) | 5.1 (5.3) | 0.37 | 0.72 |
| Number of endoscopies/ patient, mean (SD) | 1.3 (0.5) | 1.2 (0.9) | 0.18 | 0.20 |
Conclusions
This study represents one of the largest direct comparisons of LGIB to UGIB not based on administrative databases. The most striking finding was the nearly equal rates of LGIB and UGIB. There are 2 likely explanations for this surprising result. First, there may be methodological reasons that we identified a greater proportion of true LGIBs; our study used a highly sensitive search strategy of ICD‐9 coding with confirmatory chart abstraction to ensure that as many LGIB and UGIB cases would be identified as possible while also excluding cases not meeting accepted criteria for GIB. The second possibility is that there is an actual change in epidemiology of GIB. Known risk factors for LGIB are increasing such as advancing age, increased use of chronic aspirin therapy, and renal disease. At the same time, significant advances in the treatment and prevention of UGIB have been made. Recent studies have demonstrated similar trends in admissions for upper and lower GI complications, suggesting that there may be a changing epidemiology due primarily to reductions in upper GI complications.1, 16
Either explanation would have implications for the care of patients with GIB. Clinical decision‐making based on prior literature would support that in ambiguous clinical situations and initial evaluation for an UGIB is appropriate. Most risk stratification literature and clinical guidelines focus on UGIB. If rates of LGIB and UGIB are similar, then existing clinical decision protocols may need to be reevaluated to incorporate the higher likelihood of LGIB. This reevaluation would be less important if the clinical outcomes or resource utilization of UGIB was significantly greater than that for LGIB, but we did not find this was the case. Similarly, if the ability to distinguish between LGIB and UGIB were robust on clinical signs and symptoms, then a reevaluation would be less important. However, we found fairly similar numbers of patients initially receiving evaluation for UGIB then being evaluated for LGIB as we found patients initially receiving evaluation for LGIB then being evaluated for UGIB. This suggests the potential benefit of clinical decision protocols that could better distinguish between UGIB and LGIB and account for the potentially higher incidence of LGIB than previously thought.
In addition to affecting the attention paid to LGIB for acute management, a changed understanding of incidence could also affect the attention paid to prevention of LGIB. Of the recent nonendoscopic advances in the treatment and prevention of GIB, only the use of COX‐2s (when used in place of traditional nsNSAIDs) reduces the risk of both LGIB and UGIB;14, 1618 H .pylori treatment and PPIs only prevent UGIB. Therefore, if the clinical and financial burdens of LGIB are similar to those seen in UGIB, more attention may need to be focused on preventing LGIB.
Baseline medication use was notable primarily for the similarities between UGIB and LGIB. Agents known to affect the rates of GIB were common in both groups. Over one‐third of the population was using aspirin and 10% were taking warfarin. Over 20% of subjects were taking an nsNSAID or a COX‐2 inhibitor. Almost one‐quarter of subjects were taking a PPI, agents known to decrease rates of UGIB and potentially increase LGIB through the risk of C. difficile colitis. Notably, the only statistically significant difference in baseline medication use between subjects with UGIB and LGIB was the more than 3‐fold higher use of nsNSAIDs in patients with UGIB as compared to LGIB. While current guidelines are not clear and consistent about which populations of at‐risk patients should receive GI prophylaxis,2830 these results suggest that patients admitted with GIB are very likely to be taking medications which impact the risk of GIB.
In terms of disease severity, the clinical presentation at admission suggests a greater degree of hemodynamic instability among subjects with UGIB. Rates of orthostatic hypotension and resting tachycardia are higher in UGIB subjects, as well as having a lower mean hemoglobin levels at presentation. However, despite the more severe clinical presentation, clinical outcomes did not differ significantly between the 2 bleeding sources. Thus, the most relevant clinical outcomes suggest that the severity of both LGIB and UGIB are similar. This similarity again suggest that the clinical burden of LGIB is not significantly different than UGIB.
Our results concerning resource utilization demonstrate a similar pattern. While the point estimates for costs and LOS suggest that UGIB may be associated with higher resource utilization, these differences were not significant in either bivariate or multivariate analyses. Those subjects with UGIB did receive more total endoscopic procedures than subjects with LGIB. More interesting though was that 24% of all subjects received an endoscopy of the opposite site (LGIB with EGD and UGIB with colonoscopy). These results suggest that the site of bleeding is not clear in a significant proportion of patients who present with GIB. These additional endoscopies are associated with increased risk, costs, LOS, and discomfort to patients. Improving our ability to accurately predict the source (upper vs. lower) of bleeding would allow us to reduce the number of these excess endoscopies. Additionally, it is interesting that despite the almost universal use of endoscopies, 20% of LGIB and 14% of UGIB subjects could not have a specific etiology identified during endoscopy or subsequent workup.
There are some important limitations to this study. While the sample size is among the largest of its type involving chart abstraction, it may be underpowered to detect some differences. Additionally, our results are from a single urban academic medical center with a patient population that is predominantly African American, which may limit generalizability. This study required consent and therefore only examines a subset of patients admitted to the medical center with GIB, which could potentially introduce bias into the sample. However, it is not clear why there would be systematic differences in subjects who choose to consent vs. those who decide not to consent that would affect the results of this study in substantive ways.
Despite significant efforts at identifying all subjects with GIB admitted during this time period, there were potential methodological reasons that may have resulted in some cases being missed. Only subjects admitted to a medicine service were approached for consent. All subjects in this medical center with GIB are admitted to a medicine service. We captured all subjects who were initially admitted to a medicine service as well as those admitted initially to an ICU and then transferred to the floor at any point prior to discharge. It is possible, though, that a subject would be admitted to an ICU for GIB and die prior to being transferred to the floor. While it is the impression of the director of the ICU that this would be a very unusual event, as most of the patients would be discharged to the floor prior to death (personal communication), given the very low mortality rate seen in this study, small numbers of missed events could have a significant impact on the interpretation of in‐hospital mortality results. It is also important to note that this medical center did not have the ability to perform endoscopy prior to admission for patients with GIB at the time of the study; all patients who presented with GIB would have been admitted and identified for this study. Finally, we were unable to routinely identify the rationale for obtaining an endoscopic exam. We assumed that all endoscopic exams were done for the purpose of evaluating and/or treating the GIB for which the subject was admitted. It is possible that some subjects had additional endoscopies for other reasons, which would have led to our overestimating the rates of additional endoscopies for GIB.
This study highlights the similarities between LGIB and UGIB rather than the differences. There were few significant differences between the 2 bleeding sources in terms of incidence, clinical outcomes, and resource utilization. In fact, the study also suggests that determining the source of bleeding may not be clear, given the high rates of opposite site endoscopies. While this study did reveal several similarities between UGIB and LGIB, it also highlights the need to identify improved strategies to improve the sensitivity and specificity of identification of LGIB compared to UGIB, both for clinical purposes and for research. The value of such improved clinical algorithms have the potential to improve both the cost and outcomes of care, while better algorithms for separating UGIB and LGIB using administrative data might help produce more precise estimates of costs and clinical outcomes, and aid in the development of risk stratification models.
- ,.Hospitalizations for Gastrointestinal Bleeding in 1998 and 2006. HCUP Statistical Brief #65, December 2008.Rockville, MD:Agency for Healthcare Research and Quality.
- ,.Causes and outcome of upper and lower gastrointestinal bleeding: The Grady Hospital Experience.South Med J.1999;92(1):44–50.
- ,,, et al.Acute upper gastrointestinal haemorrhage in west of Scotland: case ascertainment study.BMJ.1997;315:510–540.
- ,.A cost‐effective approach to the patient with peptic ulcer bleeding.Surg Clin North Am.1996;76:83–103.
- .Epidemiology and outcome of patients hospitalized with acute lower gastrointestinal hemorrhage: a population based study.Am J Gastroenterol.1997;92:419–424.
- ,,.Consensus recommendations for managing patients with nonvariceal upper gastrointestinal bleeding.Ann Int Med.2003;139:843–857.
- ,.Incremental value of upper endoscopy for triage of patients with acute non‐variceal upper‐GI hemorrhage.Gastrointest Endosc2004;60:9–14.
- ,,, et al.Upper gastrointestinal hemorrhage clinical guideline‐determining the optimal hospital length of stay.Am J Med.1996;100:313–322.
- National Guideline Clearinghouse. Available at: http://www.guideline.gov. Accessed August2009.
- ,,, et al.Prevention of ulcer recurrence after eradication of Helicobacter pylori: a prospective long‐term follow‐up study.Gastroenterology.1997;113:1082–1086.
- ,,, et al.Treatment of Helicobacter pylori in patients with duodenal ulcer hemorrhage‐a long‐term randomized, controlled study.Am J Gastroenterol.2000;95:2225–2232.
- ,,, et al.Preventing recurrent upper gastrointestinal bleeding in patients with Helicobacter pylori infection who are taking low‐dose aspirin or naproxen.N Engl J Med.2001;344:967–973.
- ,,, et al.Lansoprazole for the prevention of recurrences of ulcer complications from long‐term low‐dose aspirin use.N Engl J Med.2002;346:2033–2038.
- ,,, et al.Comparison of upper gastrointestinal toxicity of rofecoxib and naproxen in patients with rheumatoid arthritis. VIGOR Study Group.N Engl J Med.2000;343:1520–1528.
- ,,, et al.Gastrointestinal toxicity with celecoxib vs nonsteroidal anti‐inflammatory drugs for osteoarthritis and rheumatoid arthritis: the CLASS study: a randomized controlled trial. Celecoxib Long‐Term Arthritis Safety Study.JAMA.2000;284:1247–1255.
- ,,, et al.Time trends and clinical impact of upper and lower gastrointestinal complications. Digestive Disease Week National Meeting,2008. San Diego, CA, May 17–22.
- ,,, et al.Video capsule endoscopy to prospectively assess small bowel injury with celecoxib, naproxen plus omeprazole, and placebo.Clin Gastroenterol Hepatol.2005;3:133–141.
- ,,, et al.Serious lower gastrointestinal clinical events with nonselective NSAID or Coxib use.Gastroenterology.2003;124:288–292.
- ,,, et al.Risk factors for upper gastrointestinal bleeding among end‐stage renal disease patients.Kidney Int.2003;64:1455–1461.
- ,,, et al.Risk factors for hospitalized bleeding among older patients.J Am Geriatr Soc.2001;49:126–133.
- Institute for Clinical Systems Improvement (ICSI). Preventive services in adults. Bloomington, MN: Institute for Clinical Systems Improvement (ICSI).2005. Available at http://www.isci.org/guidelines_and_more/guidelines_order_sets_protocol/for_patients_families/preventive_services_for_adults_for_patients_families_.html. Accessed Month year.
- .NSAID‐associated deaths: the rise and fall of NSAID‐associated GI mortality.Am J Gastroenterol.2005;100:1694–1695.
- ,.Effects of very low doses of daily long‐term aspirin therapy on gastric, duodenal, and rectal prostaglandins on mucosal injury in healthy humans.Gastroenterology. 199;117:17–25.
- ,,, et al.A nationwide study of mortality associated with hospital admission due to severe gastrointestinal events and those associated with nonsteroidal antiinflammatory drug use.Am J Gastroenterol.2005;100:1685–1693.
- ,,, et al.Acute upper GI bleeding: did anything change?Am J Gastroenterol.2003;98:1494–1499.
- ,.Lower intestinal bleeding.Best Pract Res Clin Gastroenterol.2001;15:135–153.
- ,,,.A new method of classifying prognostic comorbidity in longitudinal studies: development and validation.J Chronic Dis.1987;40:373–383.
- AGS Panel on Persistent Pain in Older Persons. The management of persistent pain in older persons.J Am Geriatr Soc.2002;50(6 suppl):S205–S224.
- ,,, et al.Pain in Osteoarthritis, Rheumatoid Arthritis and Juvenile Chronic Arthritis.2nd ed.Clinical practice guideline no. 2.Glenview, IL:American Pain Society (APS);2002:179.
- American College of Rheumatology Subcommittee on Osteoarthritis Guidelines.Recommendations for the Medical Management of Osteoarthritis of the Hip and Knee.Arthritis Rheum.2000;43:1905–1915.
Copyright © 2010 Society of Hospital Medicine
Continuing Medical Education Program in
If you wish to receive credit for this activity, which begins on the next page, please refer to the website: www. blackwellpublishing.com/cme.
Accreditation and Designation Statement
Blackwell Futura Media Services designates this educational activity for a 1 AMA PRA Category 1 Credit. Physicians should only claim credit commensurate with the extent of their participation in the activity.
Blackwell Futura Media Services is accredited by the Accreditation Council for Continuing Medical Education to provide continuing medical education for physicians.
Educational Objectives
Continuous participation in the Journal of Hospital Medicine CME program will enable learners to be better able to:
-
Interpret clinical guidelines and their applications for higher quality and more efficient care for all hospitalized patients.
-
Describe the standard of care for common illnesses and conditions treated in the hospital; such as pneumonia, COPD exacerbation, acute coronary syndrome, HF exacerbation, glycemic control, venous thromboembolic disease, stroke, etc.
-
Discuss evidence‐based recommendations involving transitions of care, including the hospital discharge process.
-
Gain insights into the roles of hospitalists as medical educators, researchers, medical ethicists, palliative care providers, and hospital‐based geriatricians.
-
Incorporate best practices for hospitalist administration, including quality improvement, patient safety, practice management, leadership, and demonstrating hospitalist value.
-
Identify evidence‐based best practices and trends for both adult and pediatric hospital medicine.
Instructions on Receiving Credit
For information on applicability and acceptance of continuing medical education credit for this activity, please consult your professional licensing board.
This activity is designed to be completed within the time designated on the title page; physicians should claim only those credits that reflect the time actually spent in the activity. To successfully earn credit, participants must complete the activity during the valid credit period that is noted on the title page.
Follow these steps to earn credit:
-
Log on to www.blackwellpublishing.com/cme.
-
Read the target audience, learning objectives, and author disclosures.
-
Read the article in print or online format.
-
Reflect on the article.
-
Access the CME Exam, and choose the best answer to each question.
-
Complete the required evaluation component of the activity.
Hospitalist Service Change
A growing number of reports indicate that communication failures among physicians at transitions of care are critical to patient safety.16 The practice of physician handoffs at shift and service changes are variable, with no standardized protocol shown to be effective at ensuring complete transmission of information.7 In 2006, the Joint Commission set a National Patient Safety Goal to implement a standardized approach to hand off communications.8 Hospitalists stand to be impacted by this decision due to the frequency of care transitions that are inherent in hospital practice. The Society of Hospital Medicine (SHM) recognizes safe transitions of care as a core competency of hospitalists and is actively exploring standardization of the process.9 While recent attention has focused on improved communication during shift changes, little data exists to guide handoffs among hospitalists at service changes.
Good service change communication is an essential skill of hospital medicine because frequent service handoffs are often unavoidable in hospitalist practices that seek to balance the demand for around‐the‐clock coverage for inpatients and the need to create sustainable schedules to avoid physician burnout.10 But the tradeoff between fewer hours worked and discontinuity of care is well recognized.7 Increasingly fragmented care without corresponding improvements in handoff communication may exacerbate the problem. This study aims to characterize communication practices among hospitalists during service changes and to describe adverse and near miss events that may occur as a result of poor handoffs during these vulnerable care transitions.
Methods
Setting
This study was conducted with Institutional Review Board (IRB) exemption at a single, academic tertiary care institution. The Section of Hospital Medicine at the University of Chicago is comprised of 17 physicians and 5 mid‐level practitioners (Nurse Practitioner and Physician Assistant), and staffs a nonteaching multispecialty service of patients with solid‐organ transplants (excluding heart) or preexisting oncological diagnoses. While hospitalists are the attendings of record, the care of these complex patients often requires the input of subspecialty consultants.
The nonteaching hospitalist service consists of 2 teams, each staffed by 1 hospitalist, and 1 or 2 mid‐level practitioners supporting the hospitalist on weekdays. Hospitalists rotate on the service for 1 or 2 weeks at a time. Mid‐level practitioners work a nonuniform 3 to 4 days per week. The patient census ranges from 2 to 12 patients per team while 3 to 6 new admissions are received every other day. A dedicated nocturnist or moonlighter manages existing patients and new admissions overnight.
At the time of service change, either the incoming or the outgoing physician initiates the communication by pager, telephone, e‐mail, or by face‐to‐face solicitation. A computerized census form on a Microsoft Word template with each patient's identifying information and a summary of the hospital course is updated by the outgoing hospitalist and is accessible to the incoming hospitalist. Mid‐level practitioners, typically, do not participate in service change handoffs because they are not always on duty at the time of service change. Other than through the universal use of the computerized census form, there was no standardized protocol or education on how to perform service changes.
Data Collection
All 17 hospitalists rotating through the nonteaching inpatient service at the University of Chicago Medical Center (UCMC) were recruited to participate. Between May and December 2007, one of the investigators (K.H.) hand‐delivered surveys to the study subjects who usually completed the survey immediately. Those who could not complete the survey on the spot were approached by the investigator a second time a few hours later. The participants were hospitalists who started their duty on the nonteaching service 48 hours earlier. A total of 60 service changes during the study period were the units of analysis in this study.
Eighteen items of the anonymous, paper‐based, self‐administered survey (see Appendix 1) were created to evaluate the characteristics of service change communications found to be salient in previous studies.11, 12 Hospitalists were asked to estimate the time they spent on the handoff communication, and the time they spent dealing with issues that arose as a result of missing information. Responses included <5 minutes, 6‐15 minutes, 16‐30 minutes, 31‐60 minutes, and >60 minutes.
Completeness of the handoff communication and the respondents' certainty about the care‐plans for the patients on the first day of service were rated using 6‐point Likert‐type scales. For example, the possible responses to an item asking respondents to rate the completeness of information in the handoff communication were grossly incomplete, incomplete, somewhat incomplete, somewhat complete, complete, and excessively complete. Respondents were asked to recall how often they encountered consequences of incomplete handoffs such as instances, within the first 48 hours of service, when they required information that should have been discussed at handoff but was not. Another consequence of incomplete handoffs that the survey asked hospitalists to recall was the frequency of near‐miss and adverse events.
Narrative details about missing information from the service change and near misses and adverse events attributable to poor handoffs were solicited using the critical incident technique. This technique is used to elicit open‐ended constructed descriptions of infrequently occurring events through personal observations and experience.13 Respondents were also asked about the frequency and content of any discussions they had with the outgoing hospitalist after the original handoff communication. Finally, suggestions for improving service change handoffs were solicited from each respondent.
Data Analysis
The results of the Likert responses were dichotomized such that incomplete handoffs were defined as response of grossly incomplete, incomplete, or somewhat incomplete. Complete handoffs were defined as response of somewhat complete, complete, or excessively complete. Similarly, certainty about the plan for each patient on the first day of rotation was dichotomized with uncertain defined as response of uncertain, mostly uncertain, or somewhat uncertain, while certain was defined as a response of somewhat certain, mostly certain, or certain. Associations among service change characteristics were compared using chi‐square tests of the dichotomized Likert‐type data.
Narrative responses were analyzed by 3 of the authors (J.F., K.H., V.A.) using the constant comparative method.14 Major categories were created without a priori hypotheses. These categories were compared across surveys to yield integration or refinement into further subcategories. Disagreements were resolved by discussion until 100% agreement was reached.
Results
Service Change Communication
Fifty‐six of 60 (93%) surveys evaluating service changes were completed and returned. All (17) eligible hospitalists participated. All but 1 completed survey indicated that some form of handoff communication took place between the incoming and the outgoing hospitalists. The median time category spent on service change communications was 6 to 15 minutes. Forty‐eight of 55 (87%) respondents who participated in handoff communication reported communicating on the day prior to the transition day, while the remainder communicated 2 or 3 days prior to, or on the transition day. Most communicated verbally, either by telephone (75%) or face to face (16%); 10% of respondents who did not speak with the outgoing physician received e‐mail as the main method of communication. The distribution of time spent on the service change communication is summarized in Figure 1A.

Completeness of Service Changes
Thirteen percent (7/56) of service change communication was described as incomplete. These were associated with consequences of incomplete service changes (see Table 1). Specifically, handoffs characterized as incomplete were more likely to have hospitalists report uncertainty regarding the plan of care (71% incomplete vs. 10% complete, P < 0.01), discover missing information (71% incomplete vs. 24% complete, P = 0.01), and report near‐misses/adverse events (57% incomplete vs. 10% complete, P < 0.01). Completeness was not associated with time spent on the communication (P = 0.77) or with having engaged in verbal communication (88% complete vs. 100% incomplete, P = 0.33). Incomplete handoff communications were also associated with hospitalists spending more than the median time dealing with issues arising from missing or lost information (71% incomplete vs. 22% complete, P < 0.01). The distribution of time spent retrieving missing patient information and resolving issues that arose from it is shown in Figure 1B. The median time category was 6 to 15 minutes per patient.
| Incomplete (n = 7) % | Complete (n = 49) % | P Value | |
|---|---|---|---|
| Uncertainty about the patient care plan (n = 10) | 71 | 10 | <0.01 |
| Discovery of missed information that should have been discussed (n = 17) | 71 | 24 | 0.01 |
| Report of adverse and near miss events (n = 9) | 57 | 10 | <0.01 |
| More than 15 minutes spent dealing with issues arising from missed information (n = 16) | 71 | 22 | <0.01 |
The recovery of missing information involved hospitalists utilizing various sources of information summarized in Table 2. Electronic medical records were used most commonly (86%), followed by the patient chart (82%). 38% of respondents also reported soliciting the outgoing physician to recover information that was missed in the service change. Only 40% reported that patients were aware of the service change and 15% reported that patients' family were aware of the service change. Sixty‐one percent of respondents believe that a more detailed communication at service change can help avoid uncertainty, delays, and adverse events.
| Sources | n (%) |
|---|---|
| |
| Electronic medical records | 48 (86) |
| Patient chart | 46 (82) |
| Consulting physicians | 39 (70) |
| Patients' family | 33 (59) |
| Patients | 32 (57) |
| Outgoing physician (repeat communications) | 21 (38) |
Qualitative Data
Qualitative analyses of omitted information at service change yielded the following major categories: (1) factual patient information; (2) information pertaining to future plan of care; and (3) disagreements about past management (Table 3A). Among the subthemes of the first major category, recommendations by consultants were pointed out as a specific area requiring targeted discussions during the handoff process.
| Major Category | Subtheme | Representative Comment |
|---|---|---|
| ||
| A. Information not discussed at service change that should have been discussed | ||
| Factual patient information | From initial workup | [Was] the preceding MD unaware that the patient had colonic ischemia? |
| Complications during the present hospital course | Would have liked to hear the highlights of previous workup for hyponatremia | |
| Patient family | Would have liked to know how much family members were involved | |
| Consultant recommendation | Consultant recommendations were only partially done and not very well communicated | |
| Future plan of care | Plans to advance hospital course | Plan for dialysis when an existing access catheter was to be removedno explanation of plan |
| Disposition planning | Reasons why home regimen of diuretics were being held and plans to resume or keep holding at discharge | |
| Disagreement about management | Diagnostics | Appropriate surveillance labs not ordered in 12 hours for a patient admitted with a wide anion gap from DKA |
| Therapeutics | No blood transfusion in a patient needing one | |
| B. Adverse and near‐miss events attributable to missed information | ||
| Poor quality of care | Uncoordinated care | Coagulation issue not addressed prior to scheduled procedure leading to delay |
| Deviations from standard care | Patient almost did not receive nephroprotective regimen prior to an angiogram | |
| Stakeholder dissatisfied | Patient dissatisfied | Patient was not placed mainly because of poor communication |
| Consultant dissatisfied | Consultants were unhappy that their [recommendations] were not followed | |
| C. Topics covered in posthandoff communications between physicians | ||
| Clarification of missing information | Medical history | Question regarding patient's baseline mental status |
| Disposition planning | Question about discharge planning and communication with family | |
| Consultant recommendations | Clarification of consult recommendations | |
| Evaluative discussion | Review of medical management | Discussion about antibiotic choice started over the weekend |
| Updates | Preceding physician came and asked me how the patients were doing | |
| D. Suggestions for improving handoff communication | ||
| Techniques to improve the quality of verbal communication | Tension between too much and too little | Maybe it's purely a style issue, but I tend to give a lengthy signout, maybe too detailed but for detail‐oriented person like me a very cursory signout leaves too much uncertainty |
| Focused | The exchange of information should befocused on what are the major vs. minor issues | |
| Systematic | Signout should be more systematictime spent signing out is useless if filled with useless rambling | |
| Techniques to ensure the accurate transmission of information | Read‐back | Read‐back ensures details are correct |
| Transition period | Having the previous hospitalist available to answer questions is enough | |
| Suggested content improvements | Communicate future plan of care | Should focus on the future plan of care and not only on medical problems so that the in‐coming person will have a better idea of what to do on his first day |
| Transmit consultant recommendations | Knowing consult recommendations for patients and plans for procedures | |
| Involving other stakeholders | Inform patients of service change | Preceding MD explained change to all patients and they appreciated it |
| Involve mid‐level practitioners in the communication | Better mid‐level to physician communication would help | |
When asked to describe the nature of near‐miss and adverse events, 2 major categories emerged: (1) poor quality of care; and (2) stakeholder dissatisfaction (Table 3B). Respondents of this study only reported near‐miss events, but included several events that could have resulted in significant patient harm. One respondent wrote, [the] patient almost did not receive nephroprotective regimen prior toangio[gram]. On a service with complicated patients requiring the involvement of multiple subspecialists, the need for coordination through better communication was frequently mentioned.
As previously described, incoming hospitalists who discovered missing information often engaged in discussions with the outgoing hospitalist after the original service change handoff. These repeat communications served to clarify missing information as well as to allow opportunities to review and update information as summarized in Table 3C.
Suggestions for Improving Service Changes
Suggestions for improving service handoff communication yielded four major categories: (1) improve the quality of information relayed; (2) utilization of communication techniques to ensure accurate transmission of data; (3) improve the communication content; and (4) involve other stakeholders (see Table 3D).
The comments around quality of communication highlighted the tension between too much and too little information that may be resolved by organizing the content of the handoff communication without dedicating more time to the process. While some respondents felt that a detailed signout is always helpful, others stressed the need to avoid useless rambling. One respondent, who preferred a minimalist approach, felt that a comprehensive patient summary was difficult to retain and that having the outgoing physician available to answer questions early in the rotation was an effective alternative to a single episodic handoff. Another recommendation included the use of the read‐back technique to ensure accurate transmission of important information.
Discussion
To our knowledge, this is the first study of service changes among hospitalists. The results suggest that hospitalists in an academic medical center face obstacles to effective communication during service changes. A significant number of handoffs were described by hospitalists as incomplete and that missing information were associated with negative outcomes at the patient level. Reports of incomplete handoffs were associated with uncertainty by incoming physicians about the plan of care for patients and with the need to spend more time dealing with issues arising from this uncertainty. Although most of the effects on patients were near‐misses and not adverse events, the details elicited in this study reveal the threats to patient safety that arise from ineffective communication.
Interestingly, verbal communication was not associated with better transmission of information in this study. One reason for this may be the almost universal use of verbal communication in the service change handoffs among hospitalists at the UCMC. The value of verbal communication is supported by other studies that suggest the benefits of verbal exchanges combined with typed information sheets.15
In our study, hospitalists spent a significant amount of time resolving issues that arose from incomplete communication at service change. The need to retrieve missing information from charts and electronic medical records is to be expected, even if the handoffs were complete, but the use of patients and their family as redundant sources of information may lead to delay and stakeholder dissatisfaction. Likewise, consulting physicians were sometimes frustrated by not having their recommendations passed on during hospitalist service changes and of being asked to repeat their recommendations to each new incoming hospitalist. Moreover, many patients and consulting physicians were not informed about upcoming service changes by hospitalists. Informing stakeholders of staffing changes may be an important component of handoffs that requires attention.4, 16
The frequent communication between the outgoing and incoming hospitalists, even after their original handoff communication, points to the possible benefit of an overlap period during which outgoing physicians remain available to fill gaps in information. The willingness of outgoing hospitalists in this study to initiate this interaction reveals an opportunity for an intervention and is contrary to existing concerns that hospitalists, as opposed to primary care physicians, absolve themselves of patient responsibilities when their shift is completed.17, 18
Ensuring that handoff communication is concise and systematic is essential to improving the quality of care provided by hospitalists. An all‐inclusive transmission of unprocessed information, no matter how detailed, does not improve completeness of communication. Instead, we find that the complete transmission of patient information consists of both the discussion of the salient factual information about the case and the outgoing physician's assessment and future plan. A new strategy to improve completeness of service change communication may involve the use of a checklist to ensure a comprehensive review of critical details, as well as the use of narratives to tie together a coherent plan.
Alternative cutpoints for the dichotomized Likert categories for uncertainty about the plan and completeness of the handoff were explored. For example, it is also reasonable to interpret the response somewhat certain, referring to the plan of care on the transition day, as belonging to the dichotomized category uncertain as opposed to certain. A broader definition of uncertain increased the number of responses in that category but the variable's associations with other item responses were not significantly different from the results presented. We chose the symmetrical dichotomization cutpoint to ensure similar number of answers in each category.
There are several limitations with this study. First, the study was limited to self‐reported data without confirmation by direct observation. Additionally, responses to survey questions that ask participants to recollect details of a past handoff communication are subject to recall bias. We tried to minimize this bias effect by adhering to a schedule that surveyed hospitalists almost exactly at 48 hours into their rotation. However, there may still be hindsight bias about the respondents' perceived completeness of the handoffs based on the events of those 48 hours.19 In addition, a service of difficult patients requiring more of the hospitalist's time could influence his or her perception of a poor handoff through reverse causation. The study is not immune to a Hawthorne effect during the 8 months study period.20 This was a single‐center study examining 1 clinical service. The small sample size limits the depth of our analysis, but this is the first work to describe this phenomenon and although the data is not definitive, it may stimulate further work in the area. Although our study focused on completeness as the sole measure of handoff adequacy, additional measures may be explored in future studies. Finally, our findings may not be generalizable because of the unique features of the UCMC's hospitalist program, such as the specialized patient population. An examination of other practice settings is indicated for future studies.
Significant variability exists in the methods used to conduct service changes. Although a previous qualitative study of handoffs at our institution yielded a theme of poor communication around specific individuals,21 consistently poor communicators did not emerge as a theme in this qualitative analysis. We believe that episodes of incomplete communication are not always attributable to individual deficits and suggest that solutions to the communication problem exist at the systems level. The development and implementation of future interventions to improve hospitalist service changes may incorporate some of the elements suggested here.
- ,,.To Err is Human: Building a Safer Health System.Washington, DC:National Academies Press;2000.
- ,.Care transitions for hospitalized patients.Med Clin N Am.2008;92:315–324.
- ,,,,.Communication failures in patient sign‐out and suggestions for improvement: a critical incident analysis.Qual Saf Health Care.2005;14:401–407.
- ,,.Communicating in the “gray zone”: perceptions about emergency physician‐hospitalist handoffs and patient safety.Acad Emerg Med.2007;14:884–894.
- ,,,.Adequacy of information transferred at resident sign‐out (inhospital handover of care): a prospective survey.Qual Saf Health Care.2008;17:6–10.
- ,,,.Lost in translation: challenges and opportunities in physician‐to‐physician communication during patient handoffs.Acad Med.2005;80:1094–1099.
- ,,,,.Managing discontinuity in academic medical centers: strategies for a safe and effective resident sign‐out.J Hosp Med.2006;1(4):257–266.
- National Patient Safety Goals. Available at: http://www.jcaho.com. Accessed May2009.
- ,,,,.Core competencies in hospital medicine: development and methodology.J Hosp Med.2006;1(1):48–56.
- ,,,.Preparing for “diastole”: advanced training opportunities for academic hospitalists.J Hosp Med.2006;1(6):368–377.
- ,,,,.Resident uncertainty in clinical decision making and impact on patient care: a qualitative study.Qual Saf Health Care.2008;17:122–126.
- ,,,.Transfers of patient care between house staff on internal medicine wards: a national survey.Arch Intern Med.2006;166(11):1173–1177.
- .The critical incident technique.Psychol Bull.1954;51:327–358.
- ,.Basics of Qualitative Research.2nd ed.Thousand Oaks, CA:Sage Publications;1998.
- ,,,.Pilot study to show the loss of important data in nursing handover.Br J Nurs.2005;14(20):1090–1093.
- ,,, et al.How do hospitalized patients feel about resident work hours, fatigue, and discontinuity of care.J Gen Intern Med.2008;23(5):623–628.
- ,,.A new doctor in the house: ethical issues in hospitalist systems.JAMA.2000;283(3):336–337.
- ,,,.A theoretical framework and competency‐based approach to improving handoffs.Qual Saf Health Care.2008;17(1):11–14.
- ,.Hindsight bias, outcome knowledge and adaptive learning.Qual Saf Health Care.2003;12(suppl 2):ii46–ii50.
- . Hawthorne and the Western Electric Company.The Social Problems of an Industrial Civilisation.London, UK:Routledge;1949.
- ,.A model for building a standardized hand‐off protocol.Jt Comm J Qual Patient Saf.2006;32(11):646–655.
A growing number of reports indicate that communication failures among physicians at transitions of care are critical to patient safety.16 The practice of physician handoffs at shift and service changes are variable, with no standardized protocol shown to be effective at ensuring complete transmission of information.7 In 2006, the Joint Commission set a National Patient Safety Goal to implement a standardized approach to hand off communications.8 Hospitalists stand to be impacted by this decision due to the frequency of care transitions that are inherent in hospital practice. The Society of Hospital Medicine (SHM) recognizes safe transitions of care as a core competency of hospitalists and is actively exploring standardization of the process.9 While recent attention has focused on improved communication during shift changes, little data exists to guide handoffs among hospitalists at service changes.
Good service change communication is an essential skill of hospital medicine because frequent service handoffs are often unavoidable in hospitalist practices that seek to balance the demand for around‐the‐clock coverage for inpatients and the need to create sustainable schedules to avoid physician burnout.10 But the tradeoff between fewer hours worked and discontinuity of care is well recognized.7 Increasingly fragmented care without corresponding improvements in handoff communication may exacerbate the problem. This study aims to characterize communication practices among hospitalists during service changes and to describe adverse and near miss events that may occur as a result of poor handoffs during these vulnerable care transitions.
Methods
Setting
This study was conducted with Institutional Review Board (IRB) exemption at a single, academic tertiary care institution. The Section of Hospital Medicine at the University of Chicago is comprised of 17 physicians and 5 mid‐level practitioners (Nurse Practitioner and Physician Assistant), and staffs a nonteaching multispecialty service of patients with solid‐organ transplants (excluding heart) or preexisting oncological diagnoses. While hospitalists are the attendings of record, the care of these complex patients often requires the input of subspecialty consultants.
The nonteaching hospitalist service consists of 2 teams, each staffed by 1 hospitalist, and 1 or 2 mid‐level practitioners supporting the hospitalist on weekdays. Hospitalists rotate on the service for 1 or 2 weeks at a time. Mid‐level practitioners work a nonuniform 3 to 4 days per week. The patient census ranges from 2 to 12 patients per team while 3 to 6 new admissions are received every other day. A dedicated nocturnist or moonlighter manages existing patients and new admissions overnight.
At the time of service change, either the incoming or the outgoing physician initiates the communication by pager, telephone, e‐mail, or by face‐to‐face solicitation. A computerized census form on a Microsoft Word template with each patient's identifying information and a summary of the hospital course is updated by the outgoing hospitalist and is accessible to the incoming hospitalist. Mid‐level practitioners, typically, do not participate in service change handoffs because they are not always on duty at the time of service change. Other than through the universal use of the computerized census form, there was no standardized protocol or education on how to perform service changes.
Data Collection
All 17 hospitalists rotating through the nonteaching inpatient service at the University of Chicago Medical Center (UCMC) were recruited to participate. Between May and December 2007, one of the investigators (K.H.) hand‐delivered surveys to the study subjects who usually completed the survey immediately. Those who could not complete the survey on the spot were approached by the investigator a second time a few hours later. The participants were hospitalists who started their duty on the nonteaching service 48 hours earlier. A total of 60 service changes during the study period were the units of analysis in this study.
Eighteen items of the anonymous, paper‐based, self‐administered survey (see Appendix 1) were created to evaluate the characteristics of service change communications found to be salient in previous studies.11, 12 Hospitalists were asked to estimate the time they spent on the handoff communication, and the time they spent dealing with issues that arose as a result of missing information. Responses included <5 minutes, 6‐15 minutes, 16‐30 minutes, 31‐60 minutes, and >60 minutes.
Completeness of the handoff communication and the respondents' certainty about the care‐plans for the patients on the first day of service were rated using 6‐point Likert‐type scales. For example, the possible responses to an item asking respondents to rate the completeness of information in the handoff communication were grossly incomplete, incomplete, somewhat incomplete, somewhat complete, complete, and excessively complete. Respondents were asked to recall how often they encountered consequences of incomplete handoffs such as instances, within the first 48 hours of service, when they required information that should have been discussed at handoff but was not. Another consequence of incomplete handoffs that the survey asked hospitalists to recall was the frequency of near‐miss and adverse events.
Narrative details about missing information from the service change and near misses and adverse events attributable to poor handoffs were solicited using the critical incident technique. This technique is used to elicit open‐ended constructed descriptions of infrequently occurring events through personal observations and experience.13 Respondents were also asked about the frequency and content of any discussions they had with the outgoing hospitalist after the original handoff communication. Finally, suggestions for improving service change handoffs were solicited from each respondent.
Data Analysis
The results of the Likert responses were dichotomized such that incomplete handoffs were defined as response of grossly incomplete, incomplete, or somewhat incomplete. Complete handoffs were defined as response of somewhat complete, complete, or excessively complete. Similarly, certainty about the plan for each patient on the first day of rotation was dichotomized with uncertain defined as response of uncertain, mostly uncertain, or somewhat uncertain, while certain was defined as a response of somewhat certain, mostly certain, or certain. Associations among service change characteristics were compared using chi‐square tests of the dichotomized Likert‐type data.
Narrative responses were analyzed by 3 of the authors (J.F., K.H., V.A.) using the constant comparative method.14 Major categories were created without a priori hypotheses. These categories were compared across surveys to yield integration or refinement into further subcategories. Disagreements were resolved by discussion until 100% agreement was reached.
Results
Service Change Communication
Fifty‐six of 60 (93%) surveys evaluating service changes were completed and returned. All (17) eligible hospitalists participated. All but 1 completed survey indicated that some form of handoff communication took place between the incoming and the outgoing hospitalists. The median time category spent on service change communications was 6 to 15 minutes. Forty‐eight of 55 (87%) respondents who participated in handoff communication reported communicating on the day prior to the transition day, while the remainder communicated 2 or 3 days prior to, or on the transition day. Most communicated verbally, either by telephone (75%) or face to face (16%); 10% of respondents who did not speak with the outgoing physician received e‐mail as the main method of communication. The distribution of time spent on the service change communication is summarized in Figure 1A.
Completeness of Service Changes
Thirteen percent (7/56) of service change communication was described as incomplete. These were associated with consequences of incomplete service changes (see Table 1). Specifically, handoffs characterized as incomplete were more likely to have hospitalists report uncertainty regarding the plan of care (71% incomplete vs. 10% complete, P < 0.01), discover missing information (71% incomplete vs. 24% complete, P = 0.01), and report near‐misses/adverse events (57% incomplete vs. 10% complete, P < 0.01). Completeness was not associated with time spent on the communication (P = 0.77) or with having engaged in verbal communication (88% complete vs. 100% incomplete, P = 0.33). Incomplete handoff communications were also associated with hospitalists spending more than the median time dealing with issues arising from missing or lost information (71% incomplete vs. 22% complete, P < 0.01). The distribution of time spent retrieving missing patient information and resolving issues that arose from it is shown in Figure 1B. The median time category was 6 to 15 minutes per patient.
| Incomplete (n = 7) % | Complete (n = 49) % | P Value | |
|---|---|---|---|
| Uncertainty about the patient care plan (n = 10) | 71 | 10 | <0.01 |
| Discovery of missed information that should have been discussed (n = 17) | 71 | 24 | 0.01 |
| Report of adverse and near miss events (n = 9) | 57 | 10 | <0.01 |
| More than 15 minutes spent dealing with issues arising from missed information (n = 16) | 71 | 22 | <0.01 |
The recovery of missing information involved hospitalists utilizing various sources of information summarized in Table 2. Electronic medical records were used most commonly (86%), followed by the patient chart (82%). 38% of respondents also reported soliciting the outgoing physician to recover information that was missed in the service change. Only 40% reported that patients were aware of the service change and 15% reported that patients' family were aware of the service change. Sixty‐one percent of respondents believe that a more detailed communication at service change can help avoid uncertainty, delays, and adverse events.
| Sources | n (%) |
|---|---|
| |
| Electronic medical records | 48 (86) |
| Patient chart | 46 (82) |
| Consulting physicians | 39 (70) |
| Patients' family | 33 (59) |
| Patients | 32 (57) |
| Outgoing physician (repeat communications) | 21 (38) |
Qualitative Data
Qualitative analyses of omitted information at service change yielded the following major categories: (1) factual patient information; (2) information pertaining to future plan of care; and (3) disagreements about past management (Table 3A). Among the subthemes of the first major category, recommendations by consultants were pointed out as a specific area requiring targeted discussions during the handoff process.
| Major Category | Subtheme | Representative Comment |
|---|---|---|
| ||
| A. Information not discussed at service change that should have been discussed | ||
| Factual patient information | From initial workup | [Was] the preceding MD unaware that the patient had colonic ischemia? |
| Complications during the present hospital course | Would have liked to hear the highlights of previous workup for hyponatremia | |
| Patient family | Would have liked to know how much family members were involved | |
| Consultant recommendation | Consultant recommendations were only partially done and not very well communicated | |
| Future plan of care | Plans to advance hospital course | Plan for dialysis when an existing access catheter was to be removedno explanation of plan |
| Disposition planning | Reasons why home regimen of diuretics were being held and plans to resume or keep holding at discharge | |
| Disagreement about management | Diagnostics | Appropriate surveillance labs not ordered in 12 hours for a patient admitted with a wide anion gap from DKA |
| Therapeutics | No blood transfusion in a patient needing one | |
| B. Adverse and near‐miss events attributable to missed information | ||
| Poor quality of care | Uncoordinated care | Coagulation issue not addressed prior to scheduled procedure leading to delay |
| Deviations from standard care | Patient almost did not receive nephroprotective regimen prior to an angiogram | |
| Stakeholder dissatisfied | Patient dissatisfied | Patient was not placed mainly because of poor communication |
| Consultant dissatisfied | Consultants were unhappy that their [recommendations] were not followed | |
| C. Topics covered in posthandoff communications between physicians | ||
| Clarification of missing information | Medical history | Question regarding patient's baseline mental status |
| Disposition planning | Question about discharge planning and communication with family | |
| Consultant recommendations | Clarification of consult recommendations | |
| Evaluative discussion | Review of medical management | Discussion about antibiotic choice started over the weekend |
| Updates | Preceding physician came and asked me how the patients were doing | |
| D. Suggestions for improving handoff communication | ||
| Techniques to improve the quality of verbal communication | Tension between too much and too little | Maybe it's purely a style issue, but I tend to give a lengthy signout, maybe too detailed but for detail‐oriented person like me a very cursory signout leaves too much uncertainty |
| Focused | The exchange of information should befocused on what are the major vs. minor issues | |
| Systematic | Signout should be more systematictime spent signing out is useless if filled with useless rambling | |
| Techniques to ensure the accurate transmission of information | Read‐back | Read‐back ensures details are correct |
| Transition period | Having the previous hospitalist available to answer questions is enough | |
| Suggested content improvements | Communicate future plan of care | Should focus on the future plan of care and not only on medical problems so that the in‐coming person will have a better idea of what to do on his first day |
| Transmit consultant recommendations | Knowing consult recommendations for patients and plans for procedures | |
| Involving other stakeholders | Inform patients of service change | Preceding MD explained change to all patients and they appreciated it |
| Involve mid‐level practitioners in the communication | Better mid‐level to physician communication would help | |
When asked to describe the nature of near‐miss and adverse events, 2 major categories emerged: (1) poor quality of care; and (2) stakeholder dissatisfaction (Table 3B). Respondents of this study only reported near‐miss events, but included several events that could have resulted in significant patient harm. One respondent wrote, [the] patient almost did not receive nephroprotective regimen prior toangio[gram]. On a service with complicated patients requiring the involvement of multiple subspecialists, the need for coordination through better communication was frequently mentioned.
As previously described, incoming hospitalists who discovered missing information often engaged in discussions with the outgoing hospitalist after the original service change handoff. These repeat communications served to clarify missing information as well as to allow opportunities to review and update information as summarized in Table 3C.
Suggestions for Improving Service Changes
Suggestions for improving service handoff communication yielded four major categories: (1) improve the quality of information relayed; (2) utilization of communication techniques to ensure accurate transmission of data; (3) improve the communication content; and (4) involve other stakeholders (see Table 3D).
The comments around quality of communication highlighted the tension between too much and too little information that may be resolved by organizing the content of the handoff communication without dedicating more time to the process. While some respondents felt that a detailed signout is always helpful, others stressed the need to avoid useless rambling. One respondent, who preferred a minimalist approach, felt that a comprehensive patient summary was difficult to retain and that having the outgoing physician available to answer questions early in the rotation was an effective alternative to a single episodic handoff. Another recommendation included the use of the read‐back technique to ensure accurate transmission of important information.
Discussion
To our knowledge, this is the first study of service changes among hospitalists. The results suggest that hospitalists in an academic medical center face obstacles to effective communication during service changes. A significant number of handoffs were described by hospitalists as incomplete and that missing information were associated with negative outcomes at the patient level. Reports of incomplete handoffs were associated with uncertainty by incoming physicians about the plan of care for patients and with the need to spend more time dealing with issues arising from this uncertainty. Although most of the effects on patients were near‐misses and not adverse events, the details elicited in this study reveal the threats to patient safety that arise from ineffective communication.
Interestingly, verbal communication was not associated with better transmission of information in this study. One reason for this may be the almost universal use of verbal communication in the service change handoffs among hospitalists at the UCMC. The value of verbal communication is supported by other studies that suggest the benefits of verbal exchanges combined with typed information sheets.15
In our study, hospitalists spent a significant amount of time resolving issues that arose from incomplete communication at service change. The need to retrieve missing information from charts and electronic medical records is to be expected, even if the handoffs were complete, but the use of patients and their family as redundant sources of information may lead to delay and stakeholder dissatisfaction. Likewise, consulting physicians were sometimes frustrated by not having their recommendations passed on during hospitalist service changes and of being asked to repeat their recommendations to each new incoming hospitalist. Moreover, many patients and consulting physicians were not informed about upcoming service changes by hospitalists. Informing stakeholders of staffing changes may be an important component of handoffs that requires attention.4, 16
The frequent communication between the outgoing and incoming hospitalists, even after their original handoff communication, points to the possible benefit of an overlap period during which outgoing physicians remain available to fill gaps in information. The willingness of outgoing hospitalists in this study to initiate this interaction reveals an opportunity for an intervention and is contrary to existing concerns that hospitalists, as opposed to primary care physicians, absolve themselves of patient responsibilities when their shift is completed.17, 18
Ensuring that handoff communication is concise and systematic is essential to improving the quality of care provided by hospitalists. An all‐inclusive transmission of unprocessed information, no matter how detailed, does not improve completeness of communication. Instead, we find that the complete transmission of patient information consists of both the discussion of the salient factual information about the case and the outgoing physician's assessment and future plan. A new strategy to improve completeness of service change communication may involve the use of a checklist to ensure a comprehensive review of critical details, as well as the use of narratives to tie together a coherent plan.
Alternative cutpoints for the dichotomized Likert categories for uncertainty about the plan and completeness of the handoff were explored. For example, it is also reasonable to interpret the response somewhat certain, referring to the plan of care on the transition day, as belonging to the dichotomized category uncertain as opposed to certain. A broader definition of uncertain increased the number of responses in that category but the variable's associations with other item responses were not significantly different from the results presented. We chose the symmetrical dichotomization cutpoint to ensure similar number of answers in each category.
There are several limitations with this study. First, the study was limited to self‐reported data without confirmation by direct observation. Additionally, responses to survey questions that ask participants to recollect details of a past handoff communication are subject to recall bias. We tried to minimize this bias effect by adhering to a schedule that surveyed hospitalists almost exactly at 48 hours into their rotation. However, there may still be hindsight bias about the respondents' perceived completeness of the handoffs based on the events of those 48 hours.19 In addition, a service of difficult patients requiring more of the hospitalist's time could influence his or her perception of a poor handoff through reverse causation. The study is not immune to a Hawthorne effect during the 8 months study period.20 This was a single‐center study examining 1 clinical service. The small sample size limits the depth of our analysis, but this is the first work to describe this phenomenon and although the data is not definitive, it may stimulate further work in the area. Although our study focused on completeness as the sole measure of handoff adequacy, additional measures may be explored in future studies. Finally, our findings may not be generalizable because of the unique features of the UCMC's hospitalist program, such as the specialized patient population. An examination of other practice settings is indicated for future studies.
Significant variability exists in the methods used to conduct service changes. Although a previous qualitative study of handoffs at our institution yielded a theme of poor communication around specific individuals,21 consistently poor communicators did not emerge as a theme in this qualitative analysis. We believe that episodes of incomplete communication are not always attributable to individual deficits and suggest that solutions to the communication problem exist at the systems level. The development and implementation of future interventions to improve hospitalist service changes may incorporate some of the elements suggested here.
- ,,.To Err is Human: Building a Safer Health System.Washington, DC:National Academies Press;2000.
- ,.Care transitions for hospitalized patients.Med Clin N Am.2008;92:315–324.
- ,,,,.Communication failures in patient sign‐out and suggestions for improvement: a critical incident analysis.Qual Saf Health Care.2005;14:401–407.
- ,,.Communicating in the “gray zone”: perceptions about emergency physician‐hospitalist handoffs and patient safety.Acad Emerg Med.2007;14:884–894.
- ,,,.Adequacy of information transferred at resident sign‐out (inhospital handover of care): a prospective survey.Qual Saf Health Care.2008;17:6–10.
- ,,,.Lost in translation: challenges and opportunities in physician‐to‐physician communication during patient handoffs.Acad Med.2005;80:1094–1099.
- ,,,,.Managing discontinuity in academic medical centers: strategies for a safe and effective resident sign‐out.J Hosp Med.2006;1(4):257–266.
- National Patient Safety Goals. Available at: http://www.jcaho.com. Accessed May2009.
- ,,,,.Core competencies in hospital medicine: development and methodology.J Hosp Med.2006;1(1):48–56.
- ,,,.Preparing for “diastole”: advanced training opportunities for academic hospitalists.J Hosp Med.2006;1(6):368–377.
- ,,,,.Resident uncertainty in clinical decision making and impact on patient care: a qualitative study.Qual Saf Health Care.2008;17:122–126.
- ,,,.Transfers of patient care between house staff on internal medicine wards: a national survey.Arch Intern Med.2006;166(11):1173–1177.
- .The critical incident technique.Psychol Bull.1954;51:327–358.
- ,.Basics of Qualitative Research.2nd ed.Thousand Oaks, CA:Sage Publications;1998.
- ,,,.Pilot study to show the loss of important data in nursing handover.Br J Nurs.2005;14(20):1090–1093.
- ,,, et al.How do hospitalized patients feel about resident work hours, fatigue, and discontinuity of care.J Gen Intern Med.2008;23(5):623–628.
- ,,.A new doctor in the house: ethical issues in hospitalist systems.JAMA.2000;283(3):336–337.
- ,,,.A theoretical framework and competency‐based approach to improving handoffs.Qual Saf Health Care.2008;17(1):11–14.
- ,.Hindsight bias, outcome knowledge and adaptive learning.Qual Saf Health Care.2003;12(suppl 2):ii46–ii50.
- . Hawthorne and the Western Electric Company.The Social Problems of an Industrial Civilisation.London, UK:Routledge;1949.
- ,.A model for building a standardized hand‐off protocol.Jt Comm J Qual Patient Saf.2006;32(11):646–655.
Copyright © 2009 Society of Hospital Medicine
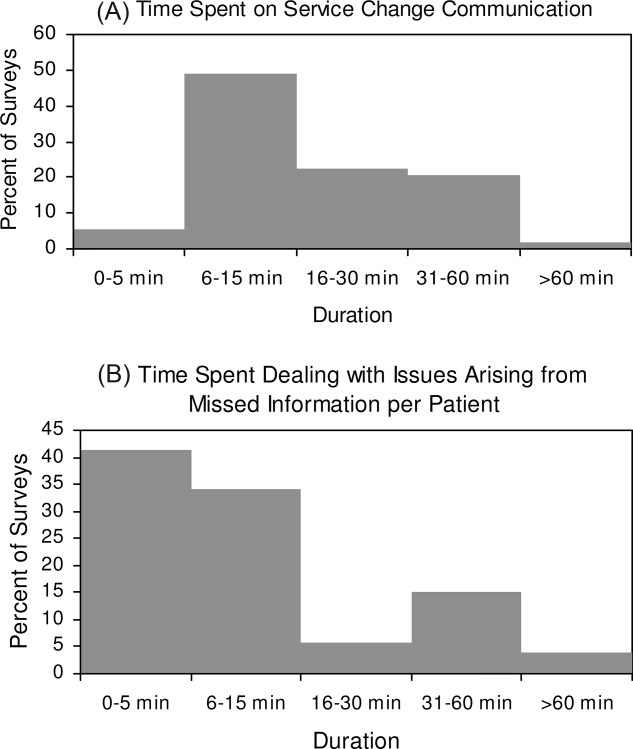
New Therapies for UGH
Upper gastrointestinal hemorrhage (UGH) is a common cause of acute admission for hospitalization.13 However, recent advances in our understanding of erosive disease (ED) and peptic ulcer disease (PUD), 2 of the most common etiologies of UGH, have led to effective strategies to reduce the risk of UGH. Successful implementation of these strategies, such as treatment of Helicobacter pylori (H. pylori) and the use of proton pump inhibitors (PPIs) and selective cyclooxygenase‐2 inhibitors (COX‐2s) in place of traditional nonselective nonsteroidal antiinflammatory drugs (NSAIDs), may be able to significantly reduce rates of UGH caused by ED and PUD.47
Prior to these preventive treatments, PUD and ED, both acid‐related disorders, were the most common causes of UGH requiring admission to the hospital, accounting for 62% and 14% of all UGHs, respectively.2 Given the widespread treatment of H. pylori and use of PPIs and COX‐2s, we might expect that the distribution of etiologies of UGH may have changed. However, there are limited data on the distribution of etiologies of UGH in the era of effective preventive therapy.8 If the distribution of etiologies causing patients to present with UGH has fundamentally changed with these new treatments, established strategies of managing acute UGH may need to be reevaluated. Given that well‐established guidelines exist and that many hospitals use a protocol‐driven management strategy to decide on the need for admission and/or intensive care unit (ICU) admission, changes in the distribution of etiologies since the widespread use of these new pharmacologic approaches may affect the appropriateness of these protocols.9, 10 For example, if the eradication of H. pylori has dramatically reduced the proportion of UGH caused by PUD, then risk stratification studies developed when PUD was far more common may need to be revisited. This would be particularly important if bleeding from PUD was of significantly different severity than bleeding from other causes.
While patients with H. pylori‐related UGH from PUD should be treated for H. pylori eradication, several important questions remain surrounding the use of newer therapeutics that may mitigate the risk of UGH in some patients. It is unclear what proportion of patients admitted with UGH in this new era developed bleeding despite using preventive therapy. These treatment failures are known to occur, but it is not well known how much of the burden of UGH today is due to this breakthrough bleeding.5, 6, 11, 12 Contrastingly, there are also patients who are admitted with UGH who are not on preventive treatment. Current guidelines suggest that high‐risk patients requiring NSAIDs be given COX‐2s or traditional NSAIDs with a PPI.1315 However, there is significant disagreement between these national guidelines about what constitutes a high‐risk profile.1315 For example, some guidelines recommend that elderly patients requiring NSAIDs should be on a PPI while others do not make that recommendation. Similarly, while prior UGH is a well‐recognized risk factor for future bleeding risk even without NSAIDs, current guidelines do not provide guidance toward the use of preventive therapy in these patients. If there are few patients who present with UGH related to acid disease that are not on a preventive therapy, then these unanswered questions or conflicts within current guidelines become less important. However, if a large portion of UGH is due to acid‐related disease in patients not on preventive therapy, then these unanswered questions may become important for future research.
In contrast to previous studies, the current study examines the distribution of etiologies of UGH in the era of widespread use of effective preventive therapy for ED and PUD in 2 U.S. academic medical centers. Prior studies were done before the advent of new therapeutics and did not compare different sites, which may be important.16, 17
PATIENTS AND METHODS
Patients
Consecutive patients admitted with UGH were identified at 2 academic medical centers as part of a larger observational study examining the impact of hospitalist physicians on the care of acute medical patients.18 The sample was selected from the 12,091 consecutive general medical patients admitted from July 2001 to June 2003 with UGH identified by International Classification of Diseases, Ninth revision, Clinical Modification (ICD‐9 CM) codes from administrative data and confirmed by chart abstraction. ICD‐9 CM codes for UGH included: esophageal varices with hemorrhage (456.0 and 456.20), Mallory‐Weiss syndrome (530.7), gastric ulcer with hemorrhage (531.00‐531.61), duodenal ulcer with hemorrhage (532.00‐532.61), peptic ulcer, site unspecified, with hemorrhage (533.00‐533.61), gastrojejunal ulcer with hemorrhage (534.00‐534.61), gastritis with hemorrhage (535.61), angiodysplasia of stomach/duodenum with hemorrhage (537.83), and hematemesis (578.0 and 578.9).19 Finally, the admission diagnoses for all patients in the larger cohort were reviewed and any with gastrointestinal hemorrhage were screened for possible inclusion to account for any missed ICD‐9 codes. Subjects were then included in this analysis if they had observed hematemesis, nasogastric (NG) tube aspirate with gross or hemoccult blood, or history of hematemesis, bloody diarrhea, or melena upon chart review.
Data
The inpatient medical records were abstracted by trained researchers. Etiologies of UGH were assessed by esophagogastroduodenoscopy (EGD) report, which listed findings and etiologies as assessed by the endoscopist. Multiple etiologies were allowed if more than 1 source of bleeding was identified. Prior medical history and preadmission medication use were obtained from 3 sources: (1) the emergency department medical record; (2) nursing admission documentation; and (3) the admission history and physical documentation. Risk factors and preadmission medication use were considered present if documented in any of the 3 sources. Relevant past medical history included known risk factors for UGH, including: end‐stage renal disease, alcohol abuse, prior history of UGH, and steroid use. Prior H. pylori status/testing could not reliably be obtained from these data sources. Preadmission medication use of interest included aspirin, NSAIDS, anticoagulants, antiplatelet agents, as well as PPIs and COX‐2s. Demographics, including age, race, and gender, were obtained from administrative databases.
We defined subjects as at‐risk if they had any of the following risk factors: prior UGH (at any time), use of an NSAID (traditional or selective COX‐2), or use of an aspirin prior to admission. Patients taking COX‐2s were included for 2 reasons. First, while COX‐2 inhibitors are associated with a lower risk of UGH than traditional NSAIDs, it is likely that they still lead to an increased risk of UGH compared to placebo. Second, if a patient required NSAIDs of some type (traditional or selective), preadmission use of a COX‐2 rather than a traditional NSAID may reflect the intention of decreasing the risk of UGH compared to using traditional NSAIDs. In order to use the most conservative estimate of potential missed opportunities for prevention, preadmission use of a PPI or COX‐2 was considered preventive therapy. All preadmission medication use was obtained from chart review. Therefore, duration of and purpose for medication use were not available.
Development of the abstraction tool was performed by the authors. Testing of the tool was performed on a learning set of 20 charts at each center. All additional abstractors were trained with a learning set of at least 20 charts to assure uniform abstraction techniques.
Analysis
For each risk factor and etiology, we calculated the proportion of patients with the risk factor or etiology both overall and by site. Differences in risk factors between sites were assessed using chi‐square tests of association. Differences in etiologies between sites were assessed using unadjusted odds ratios (ORs) as well as ORs from logistic regression models controlling for age, gender, and race (black versus not black). Center 1 was the urban center and center 2 was the rural site.
This study was approved by the Institutional Review Board at the University of Iowa Carver College of Medicine and the University of Chicago.
RESULTS
From the entire cohort of 12,091 admitted to the 2 inpatient medical services, 227 (1.9%) patients were identified as having UGH; 138 (61%) were from center 1, where 87% of patients were black and 89 (39%) were from center 2, where 89% of patients were white. Overall, the mean age was 59 years, 45% were female, and 41% were white (Table 1).
| Characteristic | Total (n = 227) | Center 1 (n = 138) | Center 2 (n = 89) | P Value Center 1 versus 2 |
|---|---|---|---|---|
| ||||
| Mean age (years) | 58.6 | 59.5 | 57.1 | 0.317 |
| % Female | 44.5 | 48.6 | 38.2 | 0.126 |
| % White | 41.2 | 10.2 | 88.8 | <0.001 |
| % African American | 54.0 | 86.9 | 3.4 | <0.001 |
| % Other | 4.9 | 2.9 | 7.9 | <0.001 |
The most common etiologies of UGH were ED (44%), PUD (33%), and varices (17%) in the overall population. These same 3 etiologies were also the most common in both of the medical centers, although there were significant differences in the rates of etiologies between the 2 centers. ED was more common among subjects from center 1 (59%) than from center 2 (19%) (P < 0.001), while variceal bleeding was more common among subjects from center 2 (34%) than from center 1 (6.5%) (P = 0.009) (Table 2).
| Etiology | All n = 227 (%) | Center 1 n = 138 (%) | Center 2 n = 89 (%) | Unadjusted OR (95% CI): Center 1 versus 2 | P Value for Unadjusted OR | Adjusted* OR (95% CI): Center 1 versus 2 | P Value (for Adjusted OR) |
|---|---|---|---|---|---|---|---|
| |||||||
| ED | 43.6 | 59.4 | 19.1 | 6.20 (3.3111.62) | <0.001 | 7.10 (2.4820.31) | <0.001 |
| PUD | 33.0 | 37.0 | 27.0 | 1.59 (0.892.84) | 0.119 | 1.33 (0.483.67) | 0.578 |
| Varices | 17.2 | 6.5 | 33.7 | 0.14 (0.060.31) | <0.001 | 0.12 (0.030.60) | 0.009 |
| AVM | 5.3 | 2.9 | 9.0 | 0.30 (0.091.04) | 0.057 | 0.21 (0.031.69) | 0.141 |
| Mallory Weiss Tear | 4.9 | 4.4 | 5.6 | 0.76 (0.232.58) | 0.664 | 0.34 (0.024.85) | 0.425 |
| Cancer/masses | 2.6 | 2.9 | 2.3 | 1.30 (0.237.24) | 0.766 | 0.62 (0.0312.12) | 0.751 |
In multivariate logistic regression analyses, only age and site remained independent predictors of etiologies. Advancing age was associated with a higher risk of arteriovenous malformations (AVMs) with the odds of AVMs increasing 6% for every additional year of life (P = 0.007). Site was associated with both ED and variceal bleeding. Patients from center 1 were significantly more likely to have UGH caused by ED, with an OR = 7.10 (P < 0.001), compared to subjects from center 2. However, subjects from center 1 had a significantly lower OR (OR = 0.12) than those subjects at center 2 (P = 0.009) of having UGH caused by a variceal bleed (Table 2).
Risk factors for UGH were common among the patients, including use of aspirin (25.1%), NSAIDs (22.9%), COX‐2s (4.9%), or prior history of UGH (43%). Additionally, 6.6% of patients were taking both an NSAID and aspirin. Differences between the 2 sites were seen only in aspirin use, with 34.8% of patients in the center 1 population using aspirin compared to 10.1% in center 2 (P < 0.001) (Table 3).
| Risk Factor | All (%) | Center 1 (%) | Center 2 (%) | P Value |
|---|---|---|---|---|
| ||||
| Previous UGH | 42.7 | 41.3 | 45.2 | 0.586 |
| NSAID use | 22.9 | 21.7 | 24.7 | 0.602 |
| ASA use | 25.1 | 34.8 | 10.1 | <0.001 |
| NSAID + ASA | 6.6 | 6.5 | 6.7 | 0.948 |
| COX‐2 use | 4.9 | 6.5 | 2.3 | 0.143 |
| PPI use | 18.5 | 18.1 | 19.1 | 0.852 |
Among the overall population, 68.7% of patients had identifiable risk factors (prior history of UGH or preadmission use of aspirin, NSAIDs, or COX‐2s). Of all subjects, 18.5% were on PPIs and 4.9% were taking COX‐2s while 21.1% of at risk subjects were on PPIs and 6.5% of these subjects were on a COX‐2.
Finally, we examined the effects of variations in preadmission medication use between the sites on the etiologies of UGH. None of the site‐based differences in etiologies could be explained by differences in preadmission medication patterns.
DISCUSSION
Despite the emergence of effective therapies for lowering the risk of ED and PUD, these remain the most common etiologies of UGH in our cohort of patients. In a dramatic change from historically reported patterns, ED was more common than PUD. In prior studies, PUD accounted for almost two‐thirds of all UGH.2 While some of the newer therapeutics such as PPIs and COX‐2s reduce the risk for acid‐related bleeding of all types, H. pylori eradication is effective primarily for PUD. Therefore, it may be that widespread testing and treatment of H. pylori have dramatically decreased rates of PUD. Unfortunately, this study does not allow us to directly evaluate the effect of H. pylori treatment on the changing epidemiology of UGH, as that would require a population‐based study.
While decreasing rates of PUD could explain a portion of the change in the distribution of etiologies, increasing rates of ED could also be playing a role. Prior studies have suggested that African Americans and the elderly are more susceptible to ED, particularly in the setting of NSAIDs and/or aspirin use, and less susceptible to cirrhosis.13, 16, 17, 2023 Our finding of a higher rate of ED and lower rates of cirrhosis in center 1 with a higher proportion of African Americans and greater aspirin use is consistent with these prior findings. However, in multivariate analyses, neither race nor preadmission medication use patterns explained the differences in etiologies seen. This suggests that some other factors must play a role in the differences between the 2 centers studied. These results emphasize the importance of local site characteristics in the interpretation and implementation of national guidelines and recommendations. This finding may be particularly important in diseases and clinical presentations that rely on protocol‐driven pathways, such as UGH. Current recommendations on implementing clinical pathways derived from national guidelines emphasize the fact that national development and local implementation optimization is probably the best approach for effective pathway utilization.24
It is important to understand why ED and PUD, for which we now have effective pharmacologic therapies, continue to account for such a large percentage of the burden of UGH. In this study, we found that a majority of subjects were known to have significant risk factors for UGH (aspirin use, NSAID use, COX‐2s, or prior UGH) and only 31% of the subjects could not have been identified as at‐risk prior to admission. PPIs or COX‐2s should not be used universally as preventive therapy, and they are not completely effective at preventing UGH in at‐risk patients. In this study, two‐thirds of patients with risk factors were not on preventive therapy, but almost one‐third of patients with risk factors had bleeding despite being on preventive therapy. A better understanding of why these treatment failures (bleeding despite preventive therapy) occur may be helpful in our future ability to prevent UGH. This study was not designed to determine if the two‐thirds of patients not taking preventive therapy were being treated consistent with established guidelines. However, current guidelines have significant variation in recommendations as to which patients are at high enough risk to warrant preventive therapy,1315 and there is no consensus as to which patients are at high enough risk to warrant preventive therapy. Our data suggest that additional studies will be required to determine the optimal recommendations for preventive therapy among at‐risk patients.
There are several limitations to this study. First, it only included 2 academic institutions. However, these institutions represented very different patient populations. Second, the study design is not a population‐based study. This limitation prevents us from addressing questions such as the effectiveness or cost‐effectiveness of interventions to prevent admission for UGH. Although we analyzed preadmission PPI or COX‐2 use in at‐risk patients as preventive therapy, we are unable to determine the actual intent of the physician in prescribing these drugs. Finally, although the mechanisms by which PPIs and COX‐2 affect the risk of UGH are fundamentally different and should not be considered equivalent choices, we chose to analyze either option as representing a preventive strategy in order to provide the most conservative estimate possible of preventive therapy utilization rates. However, our assumptions would generally overestimate the use of preventive therapy (as opposed to PPI use for symptom control), as we assumed all potentially preventive therapy was intended as such.
This study highlights several unanswered questions that may be important in the management of UGH. First, identifying factors that affect local patters of UGH may better inform local implementation of nationally developed guidelines. Second, a more complete understanding of the impact positive and negative risk factors for UGH have on specific patient populations may allow for a more consistent targeted approach to using preventive therapy in at‐risk patients.
Finally, and perhaps most importantly, is to determine if the change in distribution of etiologies is in fact related to a decline in bleeding related to PUD. In addition to this being a marker of the success of the H. pylori story, it may have important implications on our understanding of the acute management of UGH. If PUD is of a different severity than other common causes of UGH, such as ED, current risk stratification prediction models may need to be revalidated. For example, if UGH secondary to PUD results in greater morbidity and mortality than UGH secondary to ED, our current models identifying who requires ICU admission, urgent endoscopy, and other therapeutic interventions may result in overutilization of these resource intensive interventions. However, if larger studies do not confirm this decline in PUD it suggests the need for additional studies to identify why PUD remains so prevalent despite the major advances in treatment and prevention of PUD through H. pylori identification and eradication.
- ,,, et al.Effects of physician experience on costs and outcomes on an academic general medicine service: results of a trial of hospitalists.Ann Int Med.2002;137(11):866–874.
- .Epidemiology of hospitalization for acute upper gastrointestinal hemorrhage: a population‐based study.Am J Gastroenterol.1995;90(2):206–210.
- ,,, et al.Epidemiology and course of acute upper gastro‐intestinal haemorrhage in four French geographical areas.Eur J Gastroenterol Hepatol.2000;12:175–181.
- ,,, et al.Prevention of ulcer recurrence after eradication of Helicobacter pylore: a prospective long‐term follow‐up study.Gastroenterology.1997;113:1082–1086.
- ,,, et al.Treatment of Helicobacter pylore in patients with duodenal ulcer hemorrhage‐a long‐term randomized, controlled study.Am J Gasterenterol.2000;95:2225–2232.
- ,,, et al.Preventing recurrent upper gastrointestinal bleeding in patients with Helicobacter pylori infection who are taking low‐dose aspirin or naproxen.N Engl J Med.2001;344:967–973.
- ,,, et al.Lansoprazole for the prevention of recurrences of ulcer complications from long‐term low‐dose aspirin use.N Engl J Med.2002;346:2033–2038.
- ,,, et al.Acute upper GI bleeding: did anything change?: time trend analysis of incidence and outcome of acute upper GI bleeding between 1993/1994 and 2000.Am J Gastroenterol.2003;98:1494–1499.
- ,,, et al.Upper gastrointestinal hemorrhage clinical guideline‐determining the optimal length of stay.Am J Med.1996;100:313–322.
- ,,.Consensus recommendations for managing patients with nonvariceal upper gastrointestinal bleeding.Ann Intern Med.2003;139:843–857.
- ,,, et al.Comparison of upper gastrointestinal toxicity of rofecoxib and naproxen in patients with rheumatoid arthritis. VIGOR Study Group.N Engl J Med.2000;343:1520–1528.
- ,, et al.Gastrointestinal toxicity with celecoxib vs nonsteroidal anti‐inflammatory drugs for osteoarthritis and rheumatoid arthritis: the CLASS study: a randomized controlled trial. Celecoxib Long‐term Arthritis Safety Study.JAMA.2000;284:1247–1255.
- AGS Panel on Persistent Pain in Older Persons.The management of persistent pain in older persons.J Am Geriatr Soc.2002;50(6 Suppl):S205–S224.
- ,,, et al.Pain in osteoarthritis, rheumatoid arthritis and juvenile chronic arthritis.2nd ed.Clinical practice guideline no. 2.Glenview, IL:American Pain Society (APS);2002:179 p.
- .Recommendations for the medical management of osteoarthritis of the hip and knee.Arthritis Rheum.2000;43:1905–1915.
- ,,, et al.Incidence of and mortality from acute upper gastrointestinal haemorrhage in the United Kingdom.BMJ.1995;311:222–226.
- ,,, et al.Risk factors for hospitalized gastrointestinal bleeding among older persons.J Am Geriatr Soc.2001;49:126–133.
- ,,, et al.Effects of inpatient experience on outcomes and costs in a multicenter trial of academic hospitalists.Society of General Internal Medicine Annual Meeting2005.
- ,,,,,.Early endoscopy in upper gastrointestinal hemorrhage: association with recurrent bleeding, surgery, and length of hospital stay.Gastrointest Endosc.1999;49(2):145–152.
- ,,, et al.A comparison of the spectrum of chronic hepatitis C virus between Caucasians and African Americans.Clin Gastroenterol Hepatol.2004;2:469–473.
- ,,, et al.Gastroesophageal reflux among different racial groups in the United States.Gastroenterology.2004;126:1692–1699.
- ,,,.Risk factors for erosive reflux esophagitis: a case‐control study.Am J Gastroenterol.2001;96:41–46.
- ,.Upper gastrointestinal toxicity of nonsteroidal anti‐inflammatory drugs in African‐American and Hispanic elderly patients.Ethn Dis.2003;13:528–533.
- ,.Evidence‐based quality improvement: the state of the science.Health Aff (Millwood).2005;24(1):138–150.
Upper gastrointestinal hemorrhage (UGH) is a common cause of acute admission for hospitalization.13 However, recent advances in our understanding of erosive disease (ED) and peptic ulcer disease (PUD), 2 of the most common etiologies of UGH, have led to effective strategies to reduce the risk of UGH. Successful implementation of these strategies, such as treatment of Helicobacter pylori (H. pylori) and the use of proton pump inhibitors (PPIs) and selective cyclooxygenase‐2 inhibitors (COX‐2s) in place of traditional nonselective nonsteroidal antiinflammatory drugs (NSAIDs), may be able to significantly reduce rates of UGH caused by ED and PUD.47
Prior to these preventive treatments, PUD and ED, both acid‐related disorders, were the most common causes of UGH requiring admission to the hospital, accounting for 62% and 14% of all UGHs, respectively.2 Given the widespread treatment of H. pylori and use of PPIs and COX‐2s, we might expect that the distribution of etiologies of UGH may have changed. However, there are limited data on the distribution of etiologies of UGH in the era of effective preventive therapy.8 If the distribution of etiologies causing patients to present with UGH has fundamentally changed with these new treatments, established strategies of managing acute UGH may need to be reevaluated. Given that well‐established guidelines exist and that many hospitals use a protocol‐driven management strategy to decide on the need for admission and/or intensive care unit (ICU) admission, changes in the distribution of etiologies since the widespread use of these new pharmacologic approaches may affect the appropriateness of these protocols.9, 10 For example, if the eradication of H. pylori has dramatically reduced the proportion of UGH caused by PUD, then risk stratification studies developed when PUD was far more common may need to be revisited. This would be particularly important if bleeding from PUD was of significantly different severity than bleeding from other causes.
While patients with H. pylori‐related UGH from PUD should be treated for H. pylori eradication, several important questions remain surrounding the use of newer therapeutics that may mitigate the risk of UGH in some patients. It is unclear what proportion of patients admitted with UGH in this new era developed bleeding despite using preventive therapy. These treatment failures are known to occur, but it is not well known how much of the burden of UGH today is due to this breakthrough bleeding.5, 6, 11, 12 Contrastingly, there are also patients who are admitted with UGH who are not on preventive treatment. Current guidelines suggest that high‐risk patients requiring NSAIDs be given COX‐2s or traditional NSAIDs with a PPI.1315 However, there is significant disagreement between these national guidelines about what constitutes a high‐risk profile.1315 For example, some guidelines recommend that elderly patients requiring NSAIDs should be on a PPI while others do not make that recommendation. Similarly, while prior UGH is a well‐recognized risk factor for future bleeding risk even without NSAIDs, current guidelines do not provide guidance toward the use of preventive therapy in these patients. If there are few patients who present with UGH related to acid disease that are not on a preventive therapy, then these unanswered questions or conflicts within current guidelines become less important. However, if a large portion of UGH is due to acid‐related disease in patients not on preventive therapy, then these unanswered questions may become important for future research.
In contrast to previous studies, the current study examines the distribution of etiologies of UGH in the era of widespread use of effective preventive therapy for ED and PUD in 2 U.S. academic medical centers. Prior studies were done before the advent of new therapeutics and did not compare different sites, which may be important.16, 17
PATIENTS AND METHODS
Patients
Consecutive patients admitted with UGH were identified at 2 academic medical centers as part of a larger observational study examining the impact of hospitalist physicians on the care of acute medical patients.18 The sample was selected from the 12,091 consecutive general medical patients admitted from July 2001 to June 2003 with UGH identified by International Classification of Diseases, Ninth revision, Clinical Modification (ICD‐9 CM) codes from administrative data and confirmed by chart abstraction. ICD‐9 CM codes for UGH included: esophageal varices with hemorrhage (456.0 and 456.20), Mallory‐Weiss syndrome (530.7), gastric ulcer with hemorrhage (531.00‐531.61), duodenal ulcer with hemorrhage (532.00‐532.61), peptic ulcer, site unspecified, with hemorrhage (533.00‐533.61), gastrojejunal ulcer with hemorrhage (534.00‐534.61), gastritis with hemorrhage (535.61), angiodysplasia of stomach/duodenum with hemorrhage (537.83), and hematemesis (578.0 and 578.9).19 Finally, the admission diagnoses for all patients in the larger cohort were reviewed and any with gastrointestinal hemorrhage were screened for possible inclusion to account for any missed ICD‐9 codes. Subjects were then included in this analysis if they had observed hematemesis, nasogastric (NG) tube aspirate with gross or hemoccult blood, or history of hematemesis, bloody diarrhea, or melena upon chart review.
Data
The inpatient medical records were abstracted by trained researchers. Etiologies of UGH were assessed by esophagogastroduodenoscopy (EGD) report, which listed findings and etiologies as assessed by the endoscopist. Multiple etiologies were allowed if more than 1 source of bleeding was identified. Prior medical history and preadmission medication use were obtained from 3 sources: (1) the emergency department medical record; (2) nursing admission documentation; and (3) the admission history and physical documentation. Risk factors and preadmission medication use were considered present if documented in any of the 3 sources. Relevant past medical history included known risk factors for UGH, including: end‐stage renal disease, alcohol abuse, prior history of UGH, and steroid use. Prior H. pylori status/testing could not reliably be obtained from these data sources. Preadmission medication use of interest included aspirin, NSAIDS, anticoagulants, antiplatelet agents, as well as PPIs and COX‐2s. Demographics, including age, race, and gender, were obtained from administrative databases.
We defined subjects as at‐risk if they had any of the following risk factors: prior UGH (at any time), use of an NSAID (traditional or selective COX‐2), or use of an aspirin prior to admission. Patients taking COX‐2s were included for 2 reasons. First, while COX‐2 inhibitors are associated with a lower risk of UGH than traditional NSAIDs, it is likely that they still lead to an increased risk of UGH compared to placebo. Second, if a patient required NSAIDs of some type (traditional or selective), preadmission use of a COX‐2 rather than a traditional NSAID may reflect the intention of decreasing the risk of UGH compared to using traditional NSAIDs. In order to use the most conservative estimate of potential missed opportunities for prevention, preadmission use of a PPI or COX‐2 was considered preventive therapy. All preadmission medication use was obtained from chart review. Therefore, duration of and purpose for medication use were not available.
Development of the abstraction tool was performed by the authors. Testing of the tool was performed on a learning set of 20 charts at each center. All additional abstractors were trained with a learning set of at least 20 charts to assure uniform abstraction techniques.
Analysis
For each risk factor and etiology, we calculated the proportion of patients with the risk factor or etiology both overall and by site. Differences in risk factors between sites were assessed using chi‐square tests of association. Differences in etiologies between sites were assessed using unadjusted odds ratios (ORs) as well as ORs from logistic regression models controlling for age, gender, and race (black versus not black). Center 1 was the urban center and center 2 was the rural site.
This study was approved by the Institutional Review Board at the University of Iowa Carver College of Medicine and the University of Chicago.
RESULTS
From the entire cohort of 12,091 admitted to the 2 inpatient medical services, 227 (1.9%) patients were identified as having UGH; 138 (61%) were from center 1, where 87% of patients were black and 89 (39%) were from center 2, where 89% of patients were white. Overall, the mean age was 59 years, 45% were female, and 41% were white (Table 1).
| Characteristic | Total (n = 227) | Center 1 (n = 138) | Center 2 (n = 89) | P Value Center 1 versus 2 |
|---|---|---|---|---|
| ||||
| Mean age (years) | 58.6 | 59.5 | 57.1 | 0.317 |
| % Female | 44.5 | 48.6 | 38.2 | 0.126 |
| % White | 41.2 | 10.2 | 88.8 | <0.001 |
| % African American | 54.0 | 86.9 | 3.4 | <0.001 |
| % Other | 4.9 | 2.9 | 7.9 | <0.001 |
The most common etiologies of UGH were ED (44%), PUD (33%), and varices (17%) in the overall population. These same 3 etiologies were also the most common in both of the medical centers, although there were significant differences in the rates of etiologies between the 2 centers. ED was more common among subjects from center 1 (59%) than from center 2 (19%) (P < 0.001), while variceal bleeding was more common among subjects from center 2 (34%) than from center 1 (6.5%) (P = 0.009) (Table 2).
| Etiology | All n = 227 (%) | Center 1 n = 138 (%) | Center 2 n = 89 (%) | Unadjusted OR (95% CI): Center 1 versus 2 | P Value for Unadjusted OR | Adjusted* OR (95% CI): Center 1 versus 2 | P Value (for Adjusted OR) |
|---|---|---|---|---|---|---|---|
| |||||||
| ED | 43.6 | 59.4 | 19.1 | 6.20 (3.3111.62) | <0.001 | 7.10 (2.4820.31) | <0.001 |
| PUD | 33.0 | 37.0 | 27.0 | 1.59 (0.892.84) | 0.119 | 1.33 (0.483.67) | 0.578 |
| Varices | 17.2 | 6.5 | 33.7 | 0.14 (0.060.31) | <0.001 | 0.12 (0.030.60) | 0.009 |
| AVM | 5.3 | 2.9 | 9.0 | 0.30 (0.091.04) | 0.057 | 0.21 (0.031.69) | 0.141 |
| Mallory Weiss Tear | 4.9 | 4.4 | 5.6 | 0.76 (0.232.58) | 0.664 | 0.34 (0.024.85) | 0.425 |
| Cancer/masses | 2.6 | 2.9 | 2.3 | 1.30 (0.237.24) | 0.766 | 0.62 (0.0312.12) | 0.751 |
In multivariate logistic regression analyses, only age and site remained independent predictors of etiologies. Advancing age was associated with a higher risk of arteriovenous malformations (AVMs) with the odds of AVMs increasing 6% for every additional year of life (P = 0.007). Site was associated with both ED and variceal bleeding. Patients from center 1 were significantly more likely to have UGH caused by ED, with an OR = 7.10 (P < 0.001), compared to subjects from center 2. However, subjects from center 1 had a significantly lower OR (OR = 0.12) than those subjects at center 2 (P = 0.009) of having UGH caused by a variceal bleed (Table 2).
Risk factors for UGH were common among the patients, including use of aspirin (25.1%), NSAIDs (22.9%), COX‐2s (4.9%), or prior history of UGH (43%). Additionally, 6.6% of patients were taking both an NSAID and aspirin. Differences between the 2 sites were seen only in aspirin use, with 34.8% of patients in the center 1 population using aspirin compared to 10.1% in center 2 (P < 0.001) (Table 3).
| Risk Factor | All (%) | Center 1 (%) | Center 2 (%) | P Value |
|---|---|---|---|---|
| ||||
| Previous UGH | 42.7 | 41.3 | 45.2 | 0.586 |
| NSAID use | 22.9 | 21.7 | 24.7 | 0.602 |
| ASA use | 25.1 | 34.8 | 10.1 | <0.001 |
| NSAID + ASA | 6.6 | 6.5 | 6.7 | 0.948 |
| COX‐2 use | 4.9 | 6.5 | 2.3 | 0.143 |
| PPI use | 18.5 | 18.1 | 19.1 | 0.852 |
Among the overall population, 68.7% of patients had identifiable risk factors (prior history of UGH or preadmission use of aspirin, NSAIDs, or COX‐2s). Of all subjects, 18.5% were on PPIs and 4.9% were taking COX‐2s while 21.1% of at risk subjects were on PPIs and 6.5% of these subjects were on a COX‐2.
Finally, we examined the effects of variations in preadmission medication use between the sites on the etiologies of UGH. None of the site‐based differences in etiologies could be explained by differences in preadmission medication patterns.
DISCUSSION
Despite the emergence of effective therapies for lowering the risk of ED and PUD, these remain the most common etiologies of UGH in our cohort of patients. In a dramatic change from historically reported patterns, ED was more common than PUD. In prior studies, PUD accounted for almost two‐thirds of all UGH.2 While some of the newer therapeutics such as PPIs and COX‐2s reduce the risk for acid‐related bleeding of all types, H. pylori eradication is effective primarily for PUD. Therefore, it may be that widespread testing and treatment of H. pylori have dramatically decreased rates of PUD. Unfortunately, this study does not allow us to directly evaluate the effect of H. pylori treatment on the changing epidemiology of UGH, as that would require a population‐based study.
While decreasing rates of PUD could explain a portion of the change in the distribution of etiologies, increasing rates of ED could also be playing a role. Prior studies have suggested that African Americans and the elderly are more susceptible to ED, particularly in the setting of NSAIDs and/or aspirin use, and less susceptible to cirrhosis.13, 16, 17, 2023 Our finding of a higher rate of ED and lower rates of cirrhosis in center 1 with a higher proportion of African Americans and greater aspirin use is consistent with these prior findings. However, in multivariate analyses, neither race nor preadmission medication use patterns explained the differences in etiologies seen. This suggests that some other factors must play a role in the differences between the 2 centers studied. These results emphasize the importance of local site characteristics in the interpretation and implementation of national guidelines and recommendations. This finding may be particularly important in diseases and clinical presentations that rely on protocol‐driven pathways, such as UGH. Current recommendations on implementing clinical pathways derived from national guidelines emphasize the fact that national development and local implementation optimization is probably the best approach for effective pathway utilization.24
It is important to understand why ED and PUD, for which we now have effective pharmacologic therapies, continue to account for such a large percentage of the burden of UGH. In this study, we found that a majority of subjects were known to have significant risk factors for UGH (aspirin use, NSAID use, COX‐2s, or prior UGH) and only 31% of the subjects could not have been identified as at‐risk prior to admission. PPIs or COX‐2s should not be used universally as preventive therapy, and they are not completely effective at preventing UGH in at‐risk patients. In this study, two‐thirds of patients with risk factors were not on preventive therapy, but almost one‐third of patients with risk factors had bleeding despite being on preventive therapy. A better understanding of why these treatment failures (bleeding despite preventive therapy) occur may be helpful in our future ability to prevent UGH. This study was not designed to determine if the two‐thirds of patients not taking preventive therapy were being treated consistent with established guidelines. However, current guidelines have significant variation in recommendations as to which patients are at high enough risk to warrant preventive therapy,1315 and there is no consensus as to which patients are at high enough risk to warrant preventive therapy. Our data suggest that additional studies will be required to determine the optimal recommendations for preventive therapy among at‐risk patients.
There are several limitations to this study. First, it only included 2 academic institutions. However, these institutions represented very different patient populations. Second, the study design is not a population‐based study. This limitation prevents us from addressing questions such as the effectiveness or cost‐effectiveness of interventions to prevent admission for UGH. Although we analyzed preadmission PPI or COX‐2 use in at‐risk patients as preventive therapy, we are unable to determine the actual intent of the physician in prescribing these drugs. Finally, although the mechanisms by which PPIs and COX‐2 affect the risk of UGH are fundamentally different and should not be considered equivalent choices, we chose to analyze either option as representing a preventive strategy in order to provide the most conservative estimate possible of preventive therapy utilization rates. However, our assumptions would generally overestimate the use of preventive therapy (as opposed to PPI use for symptom control), as we assumed all potentially preventive therapy was intended as such.
This study highlights several unanswered questions that may be important in the management of UGH. First, identifying factors that affect local patters of UGH may better inform local implementation of nationally developed guidelines. Second, a more complete understanding of the impact positive and negative risk factors for UGH have on specific patient populations may allow for a more consistent targeted approach to using preventive therapy in at‐risk patients.
Finally, and perhaps most importantly, is to determine if the change in distribution of etiologies is in fact related to a decline in bleeding related to PUD. In addition to this being a marker of the success of the H. pylori story, it may have important implications on our understanding of the acute management of UGH. If PUD is of a different severity than other common causes of UGH, such as ED, current risk stratification prediction models may need to be revalidated. For example, if UGH secondary to PUD results in greater morbidity and mortality than UGH secondary to ED, our current models identifying who requires ICU admission, urgent endoscopy, and other therapeutic interventions may result in overutilization of these resource intensive interventions. However, if larger studies do not confirm this decline in PUD it suggests the need for additional studies to identify why PUD remains so prevalent despite the major advances in treatment and prevention of PUD through H. pylori identification and eradication.
- ,,, et al.Effects of physician experience on costs and outcomes on an academic general medicine service: results of a trial of hospitalists.Ann Int Med.2002;137(11):866–874.
- .Epidemiology of hospitalization for acute upper gastrointestinal hemorrhage: a population‐based study.Am J Gastroenterol.1995;90(2):206–210.
- ,,, et al.Epidemiology and course of acute upper gastro‐intestinal haemorrhage in four French geographical areas.Eur J Gastroenterol Hepatol.2000;12:175–181.
- ,,, et al.Prevention of ulcer recurrence after eradication of Helicobacter pylore: a prospective long‐term follow‐up study.Gastroenterology.1997;113:1082–1086.
- ,,, et al.Treatment of Helicobacter pylore in patients with duodenal ulcer hemorrhage‐a long‐term randomized, controlled study.Am J Gasterenterol.2000;95:2225–2232.
- ,,, et al.Preventing recurrent upper gastrointestinal bleeding in patients with Helicobacter pylori infection who are taking low‐dose aspirin or naproxen.N Engl J Med.2001;344:967–973.
- ,,, et al.Lansoprazole for the prevention of recurrences of ulcer complications from long‐term low‐dose aspirin use.N Engl J Med.2002;346:2033–2038.
- ,,, et al.Acute upper GI bleeding: did anything change?: time trend analysis of incidence and outcome of acute upper GI bleeding between 1993/1994 and 2000.Am J Gastroenterol.2003;98:1494–1499.
- ,,, et al.Upper gastrointestinal hemorrhage clinical guideline‐determining the optimal length of stay.Am J Med.1996;100:313–322.
- ,,.Consensus recommendations for managing patients with nonvariceal upper gastrointestinal bleeding.Ann Intern Med.2003;139:843–857.
- ,,, et al.Comparison of upper gastrointestinal toxicity of rofecoxib and naproxen in patients with rheumatoid arthritis. VIGOR Study Group.N Engl J Med.2000;343:1520–1528.
- ,, et al.Gastrointestinal toxicity with celecoxib vs nonsteroidal anti‐inflammatory drugs for osteoarthritis and rheumatoid arthritis: the CLASS study: a randomized controlled trial. Celecoxib Long‐term Arthritis Safety Study.JAMA.2000;284:1247–1255.
- AGS Panel on Persistent Pain in Older Persons.The management of persistent pain in older persons.J Am Geriatr Soc.2002;50(6 Suppl):S205–S224.
- ,,, et al.Pain in osteoarthritis, rheumatoid arthritis and juvenile chronic arthritis.2nd ed.Clinical practice guideline no. 2.Glenview, IL:American Pain Society (APS);2002:179 p.
- .Recommendations for the medical management of osteoarthritis of the hip and knee.Arthritis Rheum.2000;43:1905–1915.
- ,,, et al.Incidence of and mortality from acute upper gastrointestinal haemorrhage in the United Kingdom.BMJ.1995;311:222–226.
- ,,, et al.Risk factors for hospitalized gastrointestinal bleeding among older persons.J Am Geriatr Soc.2001;49:126–133.
- ,,, et al.Effects of inpatient experience on outcomes and costs in a multicenter trial of academic hospitalists.Society of General Internal Medicine Annual Meeting2005.
- ,,,,,.Early endoscopy in upper gastrointestinal hemorrhage: association with recurrent bleeding, surgery, and length of hospital stay.Gastrointest Endosc.1999;49(2):145–152.
- ,,, et al.A comparison of the spectrum of chronic hepatitis C virus between Caucasians and African Americans.Clin Gastroenterol Hepatol.2004;2:469–473.
- ,,, et al.Gastroesophageal reflux among different racial groups in the United States.Gastroenterology.2004;126:1692–1699.
- ,,,.Risk factors for erosive reflux esophagitis: a case‐control study.Am J Gastroenterol.2001;96:41–46.
- ,.Upper gastrointestinal toxicity of nonsteroidal anti‐inflammatory drugs in African‐American and Hispanic elderly patients.Ethn Dis.2003;13:528–533.
- ,.Evidence‐based quality improvement: the state of the science.Health Aff (Millwood).2005;24(1):138–150.
Copyright © 2009 Society of Hospital Medicine