User login
Readmissions after Pediatric Hospitalization for Suicide Ideation and Suicide Attempt
Suicide is a leading cause of death among 10- to 34-year-olds in the United States.1,2 During the past two decades, the youth suicide death rate has risen by 24%, and more than 5,000 young people die from suicide each year.3 Suicide ideation (SI) and suicide attempts (SAs) are well-established risk factors for suicide death and a source of morbidity for patients and families. One-third of youth with SI attempt suicide at some point in their lifetime.4 Approximately 11% of youth SAs result in suicide death, and 2% of youth who attempt suicide subsequently go on to die from suicide after recovering from a prior SA.5 More than 60,000 youth are hospitalized for SI or SA each year,6 and young people hospitalized for SA are at high short-term risk of repeat SA and suicide death.7 Hospitals need strategies for measuring the quality of SI and SA hospitalizations, monitoring postdischarge outcomes, and identifying the patients at the highest risk of poor outcomes. Readmissions are a useful hospital quality measure that can indicate re-emergence of SI, repeat SA, or inadequate community-based mental health treatment, and interventions designed for patients with readmissions can potentially avert morbidity or mortality.
The National Committee on Quality Assurance recommends measurement of quality metrics for 30-day mental health follow-up after psychiatric hospitalizations, 30-day readmissions after adult (but not pediatric) psychiatric hospitalizations, and 30-day readmissions in pediatric medical and surgical hospitalizations. Readmission measures are not consistently used to evaluate pediatric psychiatric hospitalizations, and psychiatric quality measures are not used to evaluate medical or surgical hospitalizations for SA. Recent research has investigated transfers to postacute care,8 readmission prevalence, variation in hospital readmission performance, and risk factors for readmissions after pediatric psychiatric hospitalizations.9–11 However, no national study has investigated 30-day readmissions in youth hospitalized specifically for SI or SA.
To inform hospital quality measurement and improve hospital and postdischarge care for youth at risk of suicide, more information is needed about the characteristics of and the risk factors for readmissions after index SI/SA hospitalization. To address this knowledge gap, among SI/SA hospitalizations in 6- to 17-year-olds, we examined (1) unplanned 30-day readmissions and characteristics of hospitalizations by 30-day readmission status; (2) patient, hospital, and regional characteristics associated with 30-day readmissions; and (3) characteristics of 30-day readmissions.
METHODS
Study Design and Data Source
We conducted a national, retrospective cohort study of hospitalizations for patients aged 6-17 years using the Agency for Healthcare Research and Quality (AHRQ) 2013 and 2014 Nationwide Readmissions Database (NRD). The combined 2013-2014 NRD includes administrative data from a nationally representative sample of 29 million hospitalizations in 22 states, accounting for 49.3% of all US hospitalizations, and is weighted for national projections. The NRD includes hospital information, patient demographic information, and International Classification of Diseases, Ninth Revision, Clinical Modification (ICD-9-CM) diagnosis, procedure, and external cause of injury codes (E-codes). The database includes one primary diagnosis, up to 24 additional diagnoses, and up to 4 E-codes for each hospitalization. The NRD includes information about hospitalizations in acute-care general hospitals (including their psychiatric units) but not from specialty psychiatric hospitals. The database also includes de-identified, verified patient linkage numbers so that patients can be tracked across multiple hospitalizations at the same institution or different institutions within the same state. This study was considered to be exempt from review by the Children’s Hospital of Philadelphia Institutional Review Board.
Sample
We identified a sample of 181,575 hospitalizations for SI (n = 119,037) or SA (n = 62,538) among 6- to 17-year-olds between January 1, 2013, and December 31, 2014 (Figure). We included children as young as 6 years because validated methods exist to identify SI and SA in this age group,12 and because suicide deaths have recently increased among younger children.3 We excluded patients aged 18 years and older from this study since delivery of mental health services differs for adults.13 To create the sample, we first identified all hospitalizations of patients aged 6-17 years. We then used a validated algorithm relying on ICD-9-CM diagnosis codes for poisonings and E-codes for self-injury (E950-959) to identify hospitalizations related to SA.12 Because E-code completeness varies among states,14 we also used the combination of having both a diagnosis code for injury (800-999) and an ICD-9-CM code for SI (V62.84) as a proxy for SA. Among hospitalizations without SA, we identified hospitalizations with SI using the ICD-9-CM code for SI (V62.84) in any position.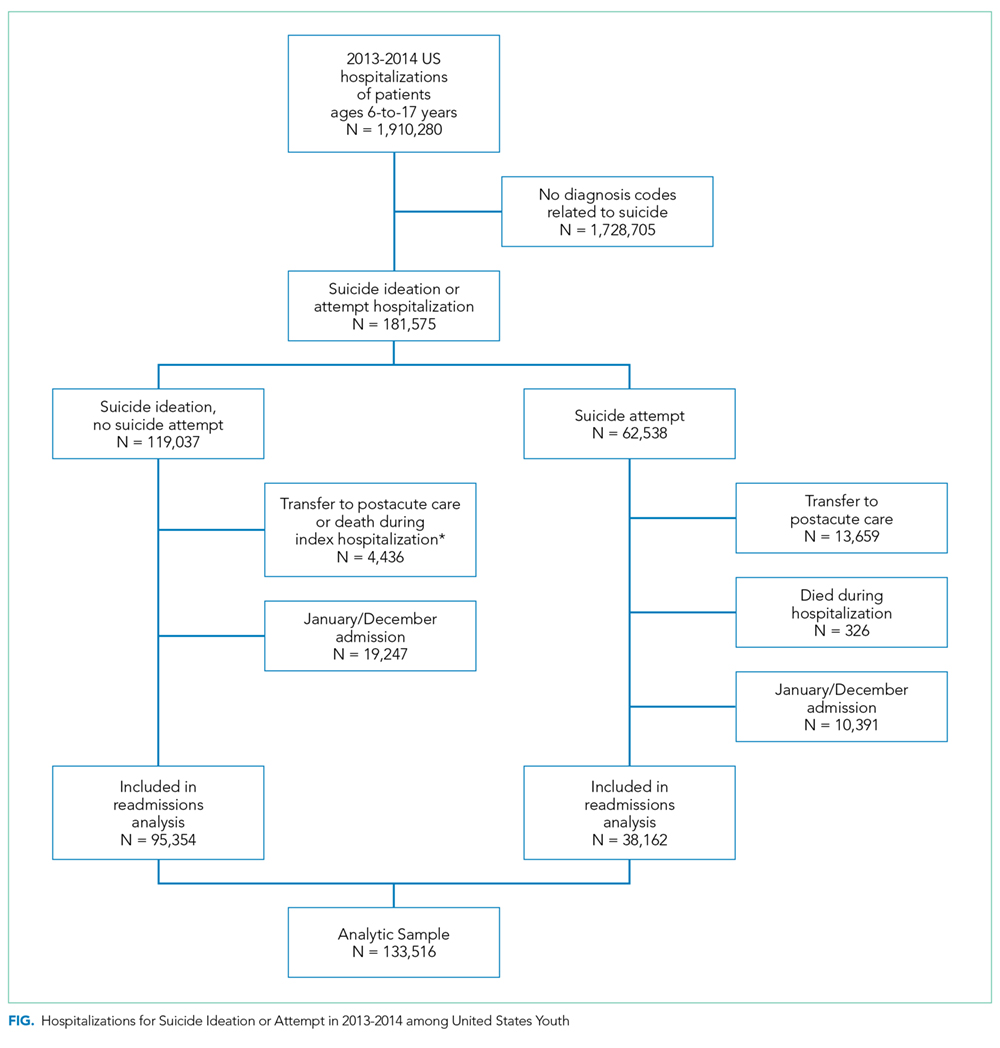
We identified 133,516 index hospitalizations with complete data at risk for an unplanned readmission. Because NRD data cannot be linked between calendar years, we limited the study time period for each calendar year to 10 months. We excluded hospitalizations in January because the full 30-day time frame to determine whether a hospitalization had occurred in the preceding 30 days, a known risk factor for readmissions in other samples,15 was not available. We excluded index hospitalizations occurring in December, because the full 30-day time frame to ascertain readmissions was not available. We excluded hospitalizations resulting in death, since these are not at risk for readmission, and hospitalizations resulting in transfer, since the timing of discharge to the community was not known. Readmission hospitalizations were eligible to be included as index hospitalizations if they met sample inclusion criteria. The final sample for readmission analyses included 95,354 SI hospitalizations and 38,162 SA hospitalizations (Figure).
Primary Outcome
The primary outcome was any unplanned, all-cause readmission within 30 days of index hospitalization for SI or SA. Among 30-day readmissions, we examined readmission timing, whether the readmission was to the same hospital or a different hospital, length of stay, and indication for readmission (medical/surgical or psychiatric, and presence of SI or SA diagnoses). Planned readmissions were identified using measure specifications endorsed by the AHRQ and the National Quality Forum16 and excluded from measurement.
Among index hospitalizations for SI, we specifically examined 30-day readmissions for subsequent SA, since one objective of hospitalization for SI is to prevent progression to SA or death. We could not identify hospitalizations for repeat SA after index hospitalization for SA, because diagnosis codes did not differentiate between readmission for complications of index SA and readmission for repeat SA.
Independent Variables
We analyzed demographic, clinical, and hospital factors associated with readmissions in other samples.17–20 Demographic characteristics included patient gender and age, urban or rural residence, payer, and median national income quartile for a patient’s ZIP code. Race and ethnicity data are not available in the NRD.
Clinical characteristics included hospitalization in the 30-days preceding the index hospitalization, index hospitalization length of stay, and admission via the emergency department (ED) versus direct admission. A patient’s chronic condition profile was determined using index hospitalization diagnosis codes. Complex chronic conditions (eg, cancer, cystic fibrosis) were identified using a classification system used in several prior studies of hospital administrative datasets,21 and other noncomplex chronic medical conditions (eg, asthma, obesity) were identified using the Healthcare Cost and Utilization Project (HCUP) chronic condition indicator system.22 Psychiatric conditions (eg, anxiety disorders, substance abuse, autism) were identified and categorized using a classification system used in studies of hospital administrative datasets.23 The number of psychiatric conditions was determined by counting the number of psychiatric condition categories in which a patient had a diagnosis. SA was categorized as having lower risk of death (eg, medication overdose, injury from cutting or piercing) or higher risk of death (eg, hanging, suffocation, or firearm injury).24
Because of known temporal trends in SI and SA,25,26 the month and year of admission were included as covariates. Hospital characteristics included teaching hospital and children’s hospital designations.
Statistical Analysis
We compared descriptive, summary statistics for characteristics of index hospitalizations with and without a 30-day readmission using Rao-Scott chi-square tests. In multivariable analyses, we derived logistic regression models to measure the associations of patient, hospital, and temporal factors with 30-day hospital readmissions. Analyses were conducted in SAS PROC SURVEYLOGISTIC and were weighted to achieve national estimates, clustered by sample stratum and hospital to account for the complex survey design,27 clustered by patients to account for multiple index visits per patient, and adjusted for clinical, demographic, and hospital characteristics. SAS version 9.4 (SAS Institute, Cary, North Carolina) was used for all analyses. All tests were two-sided, and a P value <.05 was considered as statistically significant.
RESULTS
Sample Characteristics
In the weighted analyses, we identified 133,516 hospitalizations in acute-care hospitals for SI or SA, and 8.5% (n = 11,375) of hospitalizations had at least one unplanned 30-day readmission to an acute-care hospital. Unweighted, the sample included 37,683 patients and 42,198 hospitalizations. Among all patients represented in the sample, 90.5% had only a single SI or SA hospitalization, 7.7% had two hospitalizations, and 1.8% had >2 hospitalizations in one year.
Table 1 summarizes the sample characteristics and displays the demographic, clinical, and hospital characteristics of index hospitalizations by the 30-day readmission status. Patients represented in the index hospitalizations were 64.9% female, 3.6% were aged 6-9 years, 40.1% were aged 10-14 years, and 56.3% were aged 15-17 years. Nearly half of the patients (49.1%) used public insurance. Nearly half (44.9%) lived in metropolitan areas with >1 million residents, 36.1% lived in metropolitan areas with 50,000 to 1 million residents, and 14.7% lived in rural areas.
Median length of stay for the index hospitalization was 5 days (interquartile range [IQR] 3-7). Nearly one-third (32.3%) of patients had a noncomplex chronic medical condition, 7.8% had a complex chronic medical condition, and 98.1% had a psychiatric condition. The most common psychiatric conditions were depressive disorders (60.0%) and anxiety disorders (42.2%). More than half (55.0%) of the patients had >2 psychiatric conditions. Most hospitalizations in the sample had SI only (71.4%). Among patients with SA, 81.0% had a lower lethality mechanism of injury and 19.0% had a higher lethality mechanism.
Patients experiencing a readmission were more likely to be 10-14 years old and use public insurance than patients without a readmission (P < .001 for both). For clinical characteristics, patients with a readmission were more likely to have longer index hospital stays (6 vs. 5 days), >2 psychiatric conditions (SI vs. SA), a prior admission in the 30 days preceding the index hospitalization, and admission via the ED (vs. direct admission) (P < .001 for all).
Association of Patient and Hospital Characteristics with Readmissions
Table 2 displays the patient and hospital characteristics associated with readmissions. Among demographic characteristics, 10- to 14-year-old patients had higher odds of readmission (odds ratio [OR]: 1.18, 95% confidence interval [CI]: 1.07-1.29) than 15- to 17-year-old patients. Having public insurance was associated with higher odds of readmission (OR: 1.14, 95% CI: 1.04-1.25). We found no differences in readmission rates based on sex, urban or rural location, or patient’s ZIP code income quartile.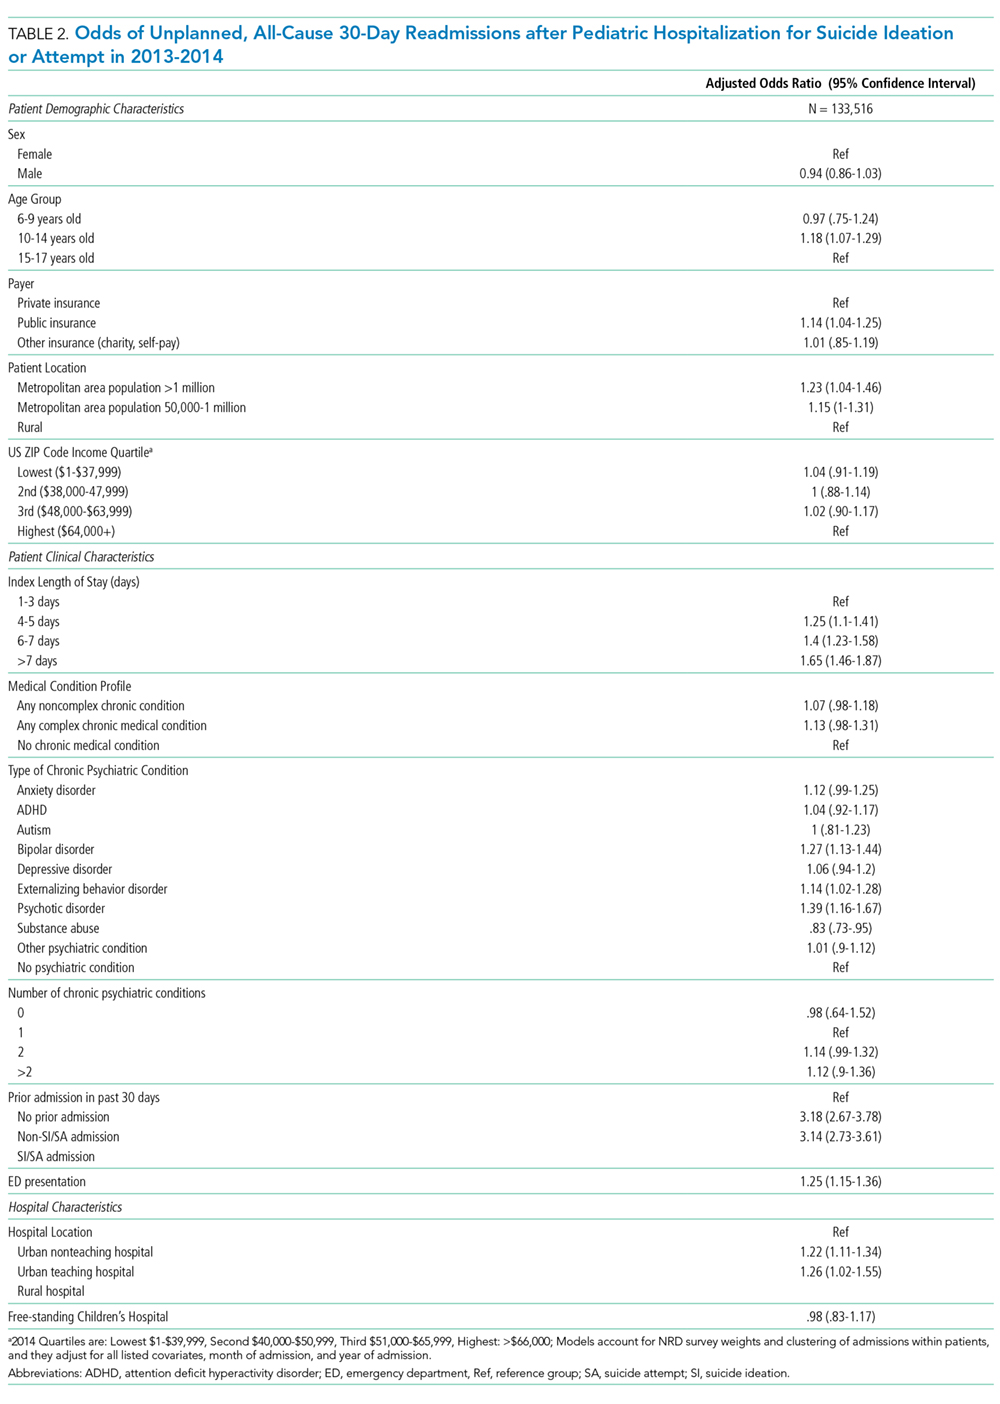
Among clinical characteristics, hospitalizations with an admission for SI or SA in the preceding 30 days, meaning that the index hospitalization itself was a readmission, had the strongest association with readmissions (OR: 3.14, 95% CI: 2.73-3.61). In addition, patients admitted via the ED for the index hospitalization had higher odds of readmission (OR: 1.25, 95% CI: 1.15-1.36). Chronic psychiatric conditions associated with higher odds of readmission included psychotic disorders (OR: 1.39, 95% CI: 1.16-1.67) and bipolar disorder (OR: 1.27, 95% CI: 1.13-1.44).
Characteristics of 30-day Readmissions
Table 3 displays the characteristics of readmissions after SI compared to that after SA. Among the combined sample of 11,375 30-day readmissions, 34.1% occurred within 7 days, and 65.9% in 8-30 days. Eleven percent of patients with any readmission had more than one readmission within 30 days. Among readmissions, 94.5% were for a psychiatric problem and 5.5% were for a medical or surgical problem. A total of 43.9% had a diagnosis of SI and 19.5% a diagnosis of SA. Readmissions were more likely to occur at a different hospital after SI than after SA (48.1% vs. 31.3%, P < .001). Medical and surgical indications for readmission were less common after SI than after SA (4.4% vs. 8.7%, P < .001). Only 1.2% of SI hospitalizations had a readmission for SA within 30 days. Of these cases, 55.6% were aged 15-17 years, 43.3% were aged 10-14 years, and 1.1% were aged 6-9 years; 73.1% of the patients were female, and 49.1% used public insurance.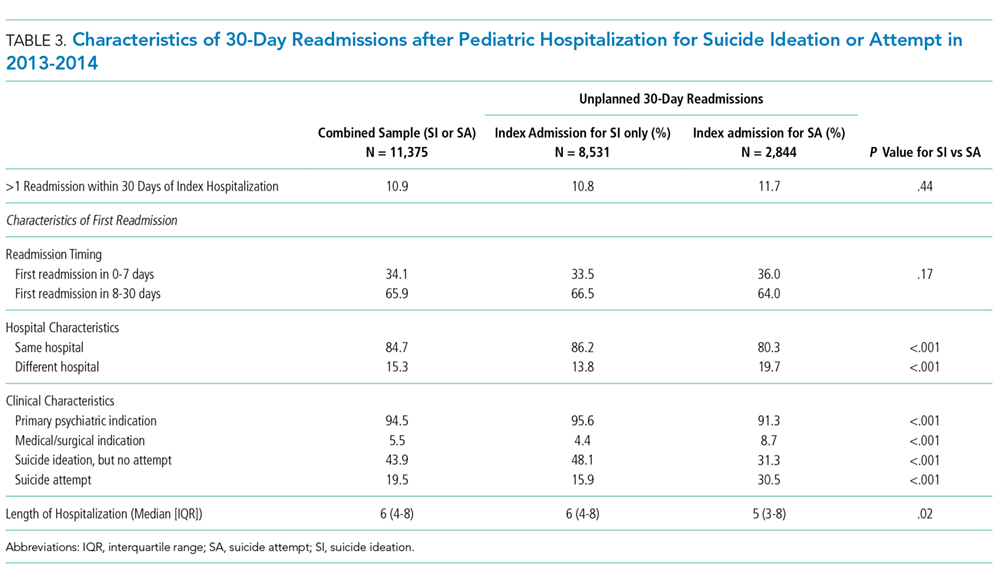
DISCUSSION
SI and SA in children and adolescents are substantial public health problems associated with significant hospital resource utilization. In 2013 and 2014, there were 181,575 pediatric acute-care hospitalizations for SI or SA, accounting for 9.5% of all hospitalizations in 6- to 17-year-old patients nationally. Among acute-care SI and SA hospitalizations, 8.5% had a readmission to an acute-care hospital within 30 days. The study data source did not include psychiatric specialty hospitals, and the number of index hospitalizations is likely substantially higher when psychiatric specialty hospitalizations are included. Readmissions may also be higher if patients were readmitted to psychiatric specialty hospitals after discharge from acute-care hospitals. The strongest risk factor for unplanned 30-day readmissions was a previous hospitalization in the 30 days before the index admission, likely a marker for severity or complexity of psychiatric illness. Other characteristics associated with higher odds of readmission were bipolar disorder, psychotic disorders, and age 10-14 years. More than one-third of readmissions occurred within the first 7 days after hospital discharge. The prevalence of SI and SA hospitalizations and readmissions was similar to findings in previous analyses of mental health hospitalizations.10,28
A patient’s psychiatric illness type and severity, as evidenced by the need for frequent repeat hospitalizations, was highly associated with the risk of 30-day readmission. Any hospitalization in the 30 days preceding the index hospitalization, whether for SI/SA or for another problem, was a strong risk factor for readmissions. We suspect that prior SI/SA hospitalizations reflect a patient’s chronic elevated risk for suicide. Prior hospitalizations not for SI or SA could be hospitalizations for mental illness exacerbations that increase the risk of SI or SA, eg, bipolar disorder with acute mania, or they could represent physical health problems. Chronic physical health problems are a known risk factor for SI and SA.29
A knowledge of those characteristics that increase the readmission risk can inform future resource allocation, research, and policy in several ways. First, longer hospital stays could mitigate readmission risk in some patients with severe psychiatric illness. European studies in older adolescents and adults show that for severe psychiatric illness, a longer hospital stay is associated with a lower risk of hospital readmission.15,30 Second, better access to intensive community-based mental health (MH) services, including evidence-based psychotherapy and medication management, improves symptoms in young people.31 Access to these services likely affects the risk of hospital readmission. We found that readmission risk was highest in 10- to 14-year-olds. Taken in the context of existing evidence that suicide rates are rising in younger patients,1,3 our findings suggest that particular attention to community services for younger patients is needed. Third, care coordination could help patients access beneficial services to reduce readmissions and improve other outcomes. Enhanced discharge care coordination reduced suicide deaths in high-risk populations in Europe32 and Japan33 and improved attendance at mental health follow-up after pediatric ED discharge in a small United States sample.34 Given that one-third of readmissions occurred within seven days, care coordination designed to ensure access to ambulatory services in the immediate postdischarge period may be particularly beneficial.
We found that ZIP code income quartile was not associated with readmissions. We suspect that poverty is not as closely correlated with MH hospitalization outcomes as it is with physical health hospitalization outcomes for several reasons. Medicaid insurance historically has more robust coverage of mental health services than some private insurance plans, which might offset some of the risk of poor mental health outcomes associated with poverty. Low-income families are eligible to use social services, and families accessing social services might have more opportunities to become familiar with community mental health programs. Further, the expectation of high achievement found in some higher income families is associated with MH problems in children and adolescents.35 Therefore, being in a higher income quartile might not be as protective against poor mental health outcomes as it is against poor physical health outcomes.
Although the NRD provides a rich source of readmission data across hospitals nationally, several limitations are inherent to this administrative dataset. First, data from specialty psychiatric hospitals were not included in the NRD. The study underestimates the total number of index hospitalizations and readmissions, since index SI/SA hospitalizations at psychiatric hospitals are not included, and readmissions are not included if they occurred at specialty psychiatric hospitals. Second, because data cannot be linked between calendar years, we excluded January and December hospitalizations, and findings might not generalize to hospitalizations in January and December. Seasonal trends in SI/SA hospitalizations are known to occur.36 Third, race, ethnicity, primary language, gender identity, and sexual orientation are not available in the NRD, and we could not examine the association of these characteristics with the likelihood of readmissions. Fourth, we did not have information about pre- or posthospitalization insurance enrollment or outpatient services that could affect the risk of readmission. Nevertheless, this study offers information on the characteristics of readmissions after hospitalizations for SI and SA in a large nationally representative sample of youth, and the findings can inform resource planning to prevent suicides.
CONCLUSION
Hospital readmissions are common in patients with SI and SA, and patients with a recent previous hospitalization have the highest risk of readmission. More than one-third of readmissions after SI or SA occurred within the first seven days. Due to the dearth of mental health services in the community, hospitals offer an important safety net for youth experiencing acute suicidal crises. Strategies to improve the continuum of care for patients at risk of suicide that solely focus on reducing readmissions are not likely to benefit patients. However, readmissions can identify opportunities for improving hospital discharge processes and outpatient services. Future research and clinical innovation to investigate and improve hospital discharge planning and access to community mental health services is likely to benefit patients and could reduce 30-day hospital readmissions.
Acknowledgments
The authors thank John Lawlor for his assistance with the analysis.
Disclosures
The authors have no potential conflicts of interest to disclose.
Funding
Dr. Zima received funding from the Behavioral Health Centers of Excellence for California (SB852).
1. Sheftall AH, Asti L, Horowitz LM, et al. Suicide in elementary school-aged children and early adolescents. Pediatrics. 2016;138(4):e20160436. doi: 10.1542/peds.2016-0436. PubMed
2. Prevention CNC for I. Suicide facts at a Glance 2015 nonfatal suicidal thoughts and behavior. In: 2015:3-4. https://stacks.cdc.gov/view/cdc/34181/cdc_34181_DS1.pdf. Accessed September 30, 2016.
3. Curtin S, Warner M, Hedegaard H. Increase in Suicide in the United States, 1999-2014. Hyattsville, MD; 2016. http://www.cdc.gov/nchs/data/databriefs/db241.pdf. Accessed November 7, 2016. PubMed
4. Nock MK, Green JG, Hwang I, et al. Prevalence, correlates, and treatment of lifetime suicidal behavior among adolescents: results from the national comorbidity survey replication adolescent supplement. JAMA Psychiatry. 2013;70(3):300. doi: 10.1001/2013.jamapsychiatry.55. PubMed
5. Bostwick JM, Pabbati C, Geske JR, Mckean AJ. Suicide attempt as a risk factor for completed suicide: even more lethal than we knew. Am J Psychiatry. 2016;173(11):1094-1100. doi: 10.1176/appi.ajp.2016.15070854. PubMed
6. Torio CM, Encinosa W, Berdahl T, McCormick MC, Simpson LA. Annual report on health care for children and youth in the united states: national estimates of cost, utilization and expenditures for children with mental health conditions. Acad Pediatr. 2015;15(1):19-35. doi: 10.1016/j.acap.2014.07.007. PubMed
7. Olfson M, Wall M, Wang S, et al. Suicide after deliberate self-harm in adolescents and young adults. Pediatrics. 2018;141(4):e20173517. doi: 10.1542/peds.2017-3517. PubMed
8. Gay JC, Zima BT, Coker TR, et al. Postacute care after pediatric hospitalizations for a primary mental health condition. J Pediatr. 2018;193:222-228.e1. doi: 10.1016/j.jpeds.2017.09.058. PubMed
9. Heslin KC, Weiss AJ. Hospital Readmissions Involving Psychiatric Disorders, 2012. 2015. https://www.ncbi.nlm.nih.gov/books/NBK305353/pdf/Bookshelf_NBK305353.pdf. Accessed September 8, 2017. PubMed
10. Feng JY, Toomey SL, Zaslavsky AM, Nakamura MM, Schuster MA. Readmission after pediatric mental health admissions. Pediatrics. 2017;140(6):e20171571. doi: 10.1542/peds.2017-1571. PubMed
11. Bardach NS, Vittinghoff E, Asteria-Peñaloza R, et al. Measuring hospital quality using pediatric readmission and revisit rates. Pediatrics. 2013;132(3):429-436. doi: 10.1542/peds.2012-3527. PubMed
12. Callahan ST, Fuchs DC, Shelton RC, et al. Identifying suicidal behavior among adolescents using administrative claims data. Pharmacoepidemiol Drug Saf. 2013;22(7):769-775. doi: 10.1002/pds.3421. PubMed
13. SAMHSA, HHS, Synectics for Management Decisions, Mathematica Policy Research. National Mental Health Services Survey: 2010: Data on Mental Health Treatment Facilities. http://media.samhsa.gov/data/DASIS/NMHSS2010D/NMHSS2010_Web.pdf. Accessed November 13, 2015.
14. Patrick AR, Miller M, Barber CW, Wang PS, Canning CF, Schneeweiss S. Identification of hospitalizations for intentional self-harm when E-codes are incompletely recorded. Pharmacoepidemiol Drug Saf. 2010;19(12):1263-1275. doi: 10.1002/pds.2037. PubMed
15. Mellesdal L, Mehlum L, Wentzel-Larsen T, Kroken R, Jørgensen HA. Suicide risk and acute psychiatric readmissions: a prospective cohort study. Psychiatr Serv. 2010;61(1):25-31. doi: 10.1176/appi.ps.61.1.25. PubMed
16. Agency for Healthcare Research and Quality, Centers for Medicare and Medicaid. Measure: Pediatric All-Condition Readmission Measure Measure Developer: Center of Excellence for Pediatric Quality Measurement (CEPQM). https://www.ahrq.gov/sites/default/files/wysiwyg/policymakers/chipra/factsheets/chipra_14-p008-1-ef.pdf. Accessed November 15, 2017.
17. Cancino RS, Culpepper L, Sadikova E, Martin J, Jack BW, Mitchell SE. Dose-response relationship between depressive symptoms and hospital readmission. J Hosp Med. 2014;9(6):358-364. doi: 10.1002/jhm.2180. PubMed
18. Carlisle CE, Mamdani M, Schachar R, To T. Aftercare, emergency department visits, and readmission in adolescents. J Am Acad Child Adolesc Psychiatry. 2012;51(3):283-293. http://www.sciencedirect.com/science/article/pii/S0890856711011002. Accessed November 2, 2015. PubMed
19. Fadum EA, Stanley B, Qin P, Diep LM, Mehlum L. Self-poisoning with medications in adolescents: a national register study of hospital admissions and readmissions. Gen Hosp Psychiatry. 2014;36(6):709-715. doi: 10.1016/j.genhosppsych.2014.09.004. PubMed
20. Bernet AC. Predictors of psychiatric readmission among veterans at high risk of suicide: the impact of post-discharge aftercare. Arch Psychiatr Nurs. 2013;27(5):260-261. doi: 10.1016/j.apnu.2013.07.001. PubMed
21. Feudtner C, Feinstein JA, Zhong W, Hall M, Dai D. Pediatric complex chronic conditions classification system version 2: updated for ICD-10 and complex medical technology dependence and transplantation. BMC Pediatr. 2014;14(1):199. doi: 10.1186/1471-2431-14-199. PubMed
22. HCUP. HCUP-US Tools & Software Page. http://www.hcup-us.ahrq.gov/toolssoftware/chronic/chronic.jsp. Published 2015. Accessed October 30, 2015.
23. Zima BT, Rodean J, Hall M, Bardach NS, Coker TR, Berry JG. Psychiatric disorders and trends in resource use in pediatric hospitals. Pediatrics. 2016;138(5):e20160909-e20160909. doi: 10.1542/peds.2016-0909. PubMed
24. Spicer RS, Miller TR. Suicide acts in 8 states: incidence and case fatality rates by demographics and method. Am J Public Health. 2000;90(12):1885-1891. doi: 10.2105/AJPH.90.12.1885. PubMed
25. Hansen B, Lang M. Back to school blues: Seasonality of youth suicide and the academic calendar. Econ Educ Rev. 2011;30(5):850-861. doi: 10.1016/j.econedurev.2011.04.012.
26. Lueck C, Kearl L, Lam CN, Claudius I. Do emergency pediatric psychiatric visits for danger to self or others correspond to times of school attendance? Am J Emerg Med. 2015;33(5):682-684. doi: 10.1016/J.AJEM.2015.02.055. PubMed
27. Healthcare Cost And Utilization Project. Introduction to the HCUP Nationwide Readmissions Database. Rockville, MD; 2017. https://www.hcup-us.ahrq.gov/db/nation/nrd/Introduction_NRD_2010-2014.pdf. Accessed November 14, 2017.
28. Bardach NS, Coker TR, Zima BT, et al. Common and costly hospitalizations for pediatric mental health disorders. Pediatrics. 2014;133(4):602-609. doi: 10.1542/peds.2013-3165. PubMed
29. Ahmedani BK, Peterson EL, Hu Y, et al. Major physical health conditions and risk of suicide. Am J Prev Med. 2017;53(3):308-315. doi: 10.1016/J.AMEPRE.2017.04.001. PubMed
30. Gunnell D, Hawton K, Ho D, et al. Hospital admissions for self harm after discharge from psychiatric inpatient care: cohort study. BMJ. 2008;337:a2278. doi: 10.1136/bmj.a2278. PubMed
31. The TADS Team. The treatment for adolescents with depression study (TADS). Arch Gen Psychiatry. 2007;64(10):1132. doi: 10.1001/archpsyc.64.10.1132. PubMed
32. While D, Bickley H, Roscoe A, et al. Implementation of mental health service recommendations in England and Wales and suicide rates, 1997-2006: A cross-sectional and before-and-after observational study. Lancet. 2012;379(9820):1005-1012. doi: 10.1016/S0140-6736(11)61712-1. PubMed
33. Kawanishi C, Aruga T, Ishizuka N, et al. Assertive case management versus enhanced usual care for people with mental health problems who had attempted suicide and were admitted to hospital emergency departments in Japan (ACTION-J): a multicentre, randomised controlled trial. Lancet Psychiatry. 2014;1(3):193-201. doi: 10.1016/S2215-0366(14)70259-7. PubMed
34. Grupp-Phelan J, McGuire L, Husky MM, Olfson M. A randomized controlled trial to engage in care of adolescent emergency department patients with mental health problems that increase suicide risk. Pediatr Emerg Care. 2012;28(12):1263-1268. doi: 10.1097/PEC.0b013e3182767ac8. PubMed
35. Ciciolla L, Curlee AS, Karageorge J, Luthar SS. When mothers and fathers are seen as disproportionately valuing achievements: implications for adjustment among upper middle class youth. J Youth Adolesc. 2017;46(5):1057-1075. doi: 10.1007/s10964-016-0596-x. PubMed
36. Plemmons G, Hall M, Doupnik S, et al. Hospitalization for suicide ideation or attempt: 2008–2015. Pediatrics. May 2018:e20172426. doi: 10.1542/peds.2017-2426. PubMed
Suicide is a leading cause of death among 10- to 34-year-olds in the United States.1,2 During the past two decades, the youth suicide death rate has risen by 24%, and more than 5,000 young people die from suicide each year.3 Suicide ideation (SI) and suicide attempts (SAs) are well-established risk factors for suicide death and a source of morbidity for patients and families. One-third of youth with SI attempt suicide at some point in their lifetime.4 Approximately 11% of youth SAs result in suicide death, and 2% of youth who attempt suicide subsequently go on to die from suicide after recovering from a prior SA.5 More than 60,000 youth are hospitalized for SI or SA each year,6 and young people hospitalized for SA are at high short-term risk of repeat SA and suicide death.7 Hospitals need strategies for measuring the quality of SI and SA hospitalizations, monitoring postdischarge outcomes, and identifying the patients at the highest risk of poor outcomes. Readmissions are a useful hospital quality measure that can indicate re-emergence of SI, repeat SA, or inadequate community-based mental health treatment, and interventions designed for patients with readmissions can potentially avert morbidity or mortality.
The National Committee on Quality Assurance recommends measurement of quality metrics for 30-day mental health follow-up after psychiatric hospitalizations, 30-day readmissions after adult (but not pediatric) psychiatric hospitalizations, and 30-day readmissions in pediatric medical and surgical hospitalizations. Readmission measures are not consistently used to evaluate pediatric psychiatric hospitalizations, and psychiatric quality measures are not used to evaluate medical or surgical hospitalizations for SA. Recent research has investigated transfers to postacute care,8 readmission prevalence, variation in hospital readmission performance, and risk factors for readmissions after pediatric psychiatric hospitalizations.9–11 However, no national study has investigated 30-day readmissions in youth hospitalized specifically for SI or SA.
To inform hospital quality measurement and improve hospital and postdischarge care for youth at risk of suicide, more information is needed about the characteristics of and the risk factors for readmissions after index SI/SA hospitalization. To address this knowledge gap, among SI/SA hospitalizations in 6- to 17-year-olds, we examined (1) unplanned 30-day readmissions and characteristics of hospitalizations by 30-day readmission status; (2) patient, hospital, and regional characteristics associated with 30-day readmissions; and (3) characteristics of 30-day readmissions.
METHODS
Study Design and Data Source
We conducted a national, retrospective cohort study of hospitalizations for patients aged 6-17 years using the Agency for Healthcare Research and Quality (AHRQ) 2013 and 2014 Nationwide Readmissions Database (NRD). The combined 2013-2014 NRD includes administrative data from a nationally representative sample of 29 million hospitalizations in 22 states, accounting for 49.3% of all US hospitalizations, and is weighted for national projections. The NRD includes hospital information, patient demographic information, and International Classification of Diseases, Ninth Revision, Clinical Modification (ICD-9-CM) diagnosis, procedure, and external cause of injury codes (E-codes). The database includes one primary diagnosis, up to 24 additional diagnoses, and up to 4 E-codes for each hospitalization. The NRD includes information about hospitalizations in acute-care general hospitals (including their psychiatric units) but not from specialty psychiatric hospitals. The database also includes de-identified, verified patient linkage numbers so that patients can be tracked across multiple hospitalizations at the same institution or different institutions within the same state. This study was considered to be exempt from review by the Children’s Hospital of Philadelphia Institutional Review Board.
Sample
We identified a sample of 181,575 hospitalizations for SI (n = 119,037) or SA (n = 62,538) among 6- to 17-year-olds between January 1, 2013, and December 31, 2014 (Figure). We included children as young as 6 years because validated methods exist to identify SI and SA in this age group,12 and because suicide deaths have recently increased among younger children.3 We excluded patients aged 18 years and older from this study since delivery of mental health services differs for adults.13 To create the sample, we first identified all hospitalizations of patients aged 6-17 years. We then used a validated algorithm relying on ICD-9-CM diagnosis codes for poisonings and E-codes for self-injury (E950-959) to identify hospitalizations related to SA.12 Because E-code completeness varies among states,14 we also used the combination of having both a diagnosis code for injury (800-999) and an ICD-9-CM code for SI (V62.84) as a proxy for SA. Among hospitalizations without SA, we identified hospitalizations with SI using the ICD-9-CM code for SI (V62.84) in any position.
We identified 133,516 index hospitalizations with complete data at risk for an unplanned readmission. Because NRD data cannot be linked between calendar years, we limited the study time period for each calendar year to 10 months. We excluded hospitalizations in January because the full 30-day time frame to determine whether a hospitalization had occurred in the preceding 30 days, a known risk factor for readmissions in other samples,15 was not available. We excluded index hospitalizations occurring in December, because the full 30-day time frame to ascertain readmissions was not available. We excluded hospitalizations resulting in death, since these are not at risk for readmission, and hospitalizations resulting in transfer, since the timing of discharge to the community was not known. Readmission hospitalizations were eligible to be included as index hospitalizations if they met sample inclusion criteria. The final sample for readmission analyses included 95,354 SI hospitalizations and 38,162 SA hospitalizations (Figure).
Primary Outcome
The primary outcome was any unplanned, all-cause readmission within 30 days of index hospitalization for SI or SA. Among 30-day readmissions, we examined readmission timing, whether the readmission was to the same hospital or a different hospital, length of stay, and indication for readmission (medical/surgical or psychiatric, and presence of SI or SA diagnoses). Planned readmissions were identified using measure specifications endorsed by the AHRQ and the National Quality Forum16 and excluded from measurement.
Among index hospitalizations for SI, we specifically examined 30-day readmissions for subsequent SA, since one objective of hospitalization for SI is to prevent progression to SA or death. We could not identify hospitalizations for repeat SA after index hospitalization for SA, because diagnosis codes did not differentiate between readmission for complications of index SA and readmission for repeat SA.
Independent Variables
We analyzed demographic, clinical, and hospital factors associated with readmissions in other samples.17–20 Demographic characteristics included patient gender and age, urban or rural residence, payer, and median national income quartile for a patient’s ZIP code. Race and ethnicity data are not available in the NRD.
Clinical characteristics included hospitalization in the 30-days preceding the index hospitalization, index hospitalization length of stay, and admission via the emergency department (ED) versus direct admission. A patient’s chronic condition profile was determined using index hospitalization diagnosis codes. Complex chronic conditions (eg, cancer, cystic fibrosis) were identified using a classification system used in several prior studies of hospital administrative datasets,21 and other noncomplex chronic medical conditions (eg, asthma, obesity) were identified using the Healthcare Cost and Utilization Project (HCUP) chronic condition indicator system.22 Psychiatric conditions (eg, anxiety disorders, substance abuse, autism) were identified and categorized using a classification system used in studies of hospital administrative datasets.23 The number of psychiatric conditions was determined by counting the number of psychiatric condition categories in which a patient had a diagnosis. SA was categorized as having lower risk of death (eg, medication overdose, injury from cutting or piercing) or higher risk of death (eg, hanging, suffocation, or firearm injury).24
Because of known temporal trends in SI and SA,25,26 the month and year of admission were included as covariates. Hospital characteristics included teaching hospital and children’s hospital designations.
Statistical Analysis
We compared descriptive, summary statistics for characteristics of index hospitalizations with and without a 30-day readmission using Rao-Scott chi-square tests. In multivariable analyses, we derived logistic regression models to measure the associations of patient, hospital, and temporal factors with 30-day hospital readmissions. Analyses were conducted in SAS PROC SURVEYLOGISTIC and were weighted to achieve national estimates, clustered by sample stratum and hospital to account for the complex survey design,27 clustered by patients to account for multiple index visits per patient, and adjusted for clinical, demographic, and hospital characteristics. SAS version 9.4 (SAS Institute, Cary, North Carolina) was used for all analyses. All tests were two-sided, and a P value <.05 was considered as statistically significant.
RESULTS
Sample Characteristics
In the weighted analyses, we identified 133,516 hospitalizations in acute-care hospitals for SI or SA, and 8.5% (n = 11,375) of hospitalizations had at least one unplanned 30-day readmission to an acute-care hospital. Unweighted, the sample included 37,683 patients and 42,198 hospitalizations. Among all patients represented in the sample, 90.5% had only a single SI or SA hospitalization, 7.7% had two hospitalizations, and 1.8% had >2 hospitalizations in one year.
Table 1 summarizes the sample characteristics and displays the demographic, clinical, and hospital characteristics of index hospitalizations by the 30-day readmission status. Patients represented in the index hospitalizations were 64.9% female, 3.6% were aged 6-9 years, 40.1% were aged 10-14 years, and 56.3% were aged 15-17 years. Nearly half of the patients (49.1%) used public insurance. Nearly half (44.9%) lived in metropolitan areas with >1 million residents, 36.1% lived in metropolitan areas with 50,000 to 1 million residents, and 14.7% lived in rural areas.
Median length of stay for the index hospitalization was 5 days (interquartile range [IQR] 3-7). Nearly one-third (32.3%) of patients had a noncomplex chronic medical condition, 7.8% had a complex chronic medical condition, and 98.1% had a psychiatric condition. The most common psychiatric conditions were depressive disorders (60.0%) and anxiety disorders (42.2%). More than half (55.0%) of the patients had >2 psychiatric conditions. Most hospitalizations in the sample had SI only (71.4%). Among patients with SA, 81.0% had a lower lethality mechanism of injury and 19.0% had a higher lethality mechanism.
Patients experiencing a readmission were more likely to be 10-14 years old and use public insurance than patients without a readmission (P < .001 for both). For clinical characteristics, patients with a readmission were more likely to have longer index hospital stays (6 vs. 5 days), >2 psychiatric conditions (SI vs. SA), a prior admission in the 30 days preceding the index hospitalization, and admission via the ED (vs. direct admission) (P < .001 for all).
Association of Patient and Hospital Characteristics with Readmissions
Table 2 displays the patient and hospital characteristics associated with readmissions. Among demographic characteristics, 10- to 14-year-old patients had higher odds of readmission (odds ratio [OR]: 1.18, 95% confidence interval [CI]: 1.07-1.29) than 15- to 17-year-old patients. Having public insurance was associated with higher odds of readmission (OR: 1.14, 95% CI: 1.04-1.25). We found no differences in readmission rates based on sex, urban or rural location, or patient’s ZIP code income quartile.
Among clinical characteristics, hospitalizations with an admission for SI or SA in the preceding 30 days, meaning that the index hospitalization itself was a readmission, had the strongest association with readmissions (OR: 3.14, 95% CI: 2.73-3.61). In addition, patients admitted via the ED for the index hospitalization had higher odds of readmission (OR: 1.25, 95% CI: 1.15-1.36). Chronic psychiatric conditions associated with higher odds of readmission included psychotic disorders (OR: 1.39, 95% CI: 1.16-1.67) and bipolar disorder (OR: 1.27, 95% CI: 1.13-1.44).
Characteristics of 30-day Readmissions
Table 3 displays the characteristics of readmissions after SI compared to that after SA. Among the combined sample of 11,375 30-day readmissions, 34.1% occurred within 7 days, and 65.9% in 8-30 days. Eleven percent of patients with any readmission had more than one readmission within 30 days. Among readmissions, 94.5% were for a psychiatric problem and 5.5% were for a medical or surgical problem. A total of 43.9% had a diagnosis of SI and 19.5% a diagnosis of SA. Readmissions were more likely to occur at a different hospital after SI than after SA (48.1% vs. 31.3%, P < .001). Medical and surgical indications for readmission were less common after SI than after SA (4.4% vs. 8.7%, P < .001). Only 1.2% of SI hospitalizations had a readmission for SA within 30 days. Of these cases, 55.6% were aged 15-17 years, 43.3% were aged 10-14 years, and 1.1% were aged 6-9 years; 73.1% of the patients were female, and 49.1% used public insurance.
DISCUSSION
SI and SA in children and adolescents are substantial public health problems associated with significant hospital resource utilization. In 2013 and 2014, there were 181,575 pediatric acute-care hospitalizations for SI or SA, accounting for 9.5% of all hospitalizations in 6- to 17-year-old patients nationally. Among acute-care SI and SA hospitalizations, 8.5% had a readmission to an acute-care hospital within 30 days. The study data source did not include psychiatric specialty hospitals, and the number of index hospitalizations is likely substantially higher when psychiatric specialty hospitalizations are included. Readmissions may also be higher if patients were readmitted to psychiatric specialty hospitals after discharge from acute-care hospitals. The strongest risk factor for unplanned 30-day readmissions was a previous hospitalization in the 30 days before the index admission, likely a marker for severity or complexity of psychiatric illness. Other characteristics associated with higher odds of readmission were bipolar disorder, psychotic disorders, and age 10-14 years. More than one-third of readmissions occurred within the first 7 days after hospital discharge. The prevalence of SI and SA hospitalizations and readmissions was similar to findings in previous analyses of mental health hospitalizations.10,28
A patient’s psychiatric illness type and severity, as evidenced by the need for frequent repeat hospitalizations, was highly associated with the risk of 30-day readmission. Any hospitalization in the 30 days preceding the index hospitalization, whether for SI/SA or for another problem, was a strong risk factor for readmissions. We suspect that prior SI/SA hospitalizations reflect a patient’s chronic elevated risk for suicide. Prior hospitalizations not for SI or SA could be hospitalizations for mental illness exacerbations that increase the risk of SI or SA, eg, bipolar disorder with acute mania, or they could represent physical health problems. Chronic physical health problems are a known risk factor for SI and SA.29
A knowledge of those characteristics that increase the readmission risk can inform future resource allocation, research, and policy in several ways. First, longer hospital stays could mitigate readmission risk in some patients with severe psychiatric illness. European studies in older adolescents and adults show that for severe psychiatric illness, a longer hospital stay is associated with a lower risk of hospital readmission.15,30 Second, better access to intensive community-based mental health (MH) services, including evidence-based psychotherapy and medication management, improves symptoms in young people.31 Access to these services likely affects the risk of hospital readmission. We found that readmission risk was highest in 10- to 14-year-olds. Taken in the context of existing evidence that suicide rates are rising in younger patients,1,3 our findings suggest that particular attention to community services for younger patients is needed. Third, care coordination could help patients access beneficial services to reduce readmissions and improve other outcomes. Enhanced discharge care coordination reduced suicide deaths in high-risk populations in Europe32 and Japan33 and improved attendance at mental health follow-up after pediatric ED discharge in a small United States sample.34 Given that one-third of readmissions occurred within seven days, care coordination designed to ensure access to ambulatory services in the immediate postdischarge period may be particularly beneficial.
We found that ZIP code income quartile was not associated with readmissions. We suspect that poverty is not as closely correlated with MH hospitalization outcomes as it is with physical health hospitalization outcomes for several reasons. Medicaid insurance historically has more robust coverage of mental health services than some private insurance plans, which might offset some of the risk of poor mental health outcomes associated with poverty. Low-income families are eligible to use social services, and families accessing social services might have more opportunities to become familiar with community mental health programs. Further, the expectation of high achievement found in some higher income families is associated with MH problems in children and adolescents.35 Therefore, being in a higher income quartile might not be as protective against poor mental health outcomes as it is against poor physical health outcomes.
Although the NRD provides a rich source of readmission data across hospitals nationally, several limitations are inherent to this administrative dataset. First, data from specialty psychiatric hospitals were not included in the NRD. The study underestimates the total number of index hospitalizations and readmissions, since index SI/SA hospitalizations at psychiatric hospitals are not included, and readmissions are not included if they occurred at specialty psychiatric hospitals. Second, because data cannot be linked between calendar years, we excluded January and December hospitalizations, and findings might not generalize to hospitalizations in January and December. Seasonal trends in SI/SA hospitalizations are known to occur.36 Third, race, ethnicity, primary language, gender identity, and sexual orientation are not available in the NRD, and we could not examine the association of these characteristics with the likelihood of readmissions. Fourth, we did not have information about pre- or posthospitalization insurance enrollment or outpatient services that could affect the risk of readmission. Nevertheless, this study offers information on the characteristics of readmissions after hospitalizations for SI and SA in a large nationally representative sample of youth, and the findings can inform resource planning to prevent suicides.
CONCLUSION
Hospital readmissions are common in patients with SI and SA, and patients with a recent previous hospitalization have the highest risk of readmission. More than one-third of readmissions after SI or SA occurred within the first seven days. Due to the dearth of mental health services in the community, hospitals offer an important safety net for youth experiencing acute suicidal crises. Strategies to improve the continuum of care for patients at risk of suicide that solely focus on reducing readmissions are not likely to benefit patients. However, readmissions can identify opportunities for improving hospital discharge processes and outpatient services. Future research and clinical innovation to investigate and improve hospital discharge planning and access to community mental health services is likely to benefit patients and could reduce 30-day hospital readmissions.
Acknowledgments
The authors thank John Lawlor for his assistance with the analysis.
Disclosures
The authors have no potential conflicts of interest to disclose.
Funding
Dr. Zima received funding from the Behavioral Health Centers of Excellence for California (SB852).
1. Sheftall AH, Asti L, Horowitz LM, et al. Suicide in elementary school-aged children and early adolescents. Pediatrics. 2016;138(4):e20160436. doi: 10.1542/peds.2016-0436. PubMed
2. Prevention CNC for I. Suicide facts at a Glance 2015 nonfatal suicidal thoughts and behavior. In: 2015:3-4. https://stacks.cdc.gov/view/cdc/34181/cdc_34181_DS1.pdf. Accessed September 30, 2016.
3. Curtin S, Warner M, Hedegaard H. Increase in Suicide in the United States, 1999-2014. Hyattsville, MD; 2016. http://www.cdc.gov/nchs/data/databriefs/db241.pdf. Accessed November 7, 2016. PubMed
4. Nock MK, Green JG, Hwang I, et al. Prevalence, correlates, and treatment of lifetime suicidal behavior among adolescents: results from the national comorbidity survey replication adolescent supplement. JAMA Psychiatry. 2013;70(3):300. doi: 10.1001/2013.jamapsychiatry.55. PubMed
5. Bostwick JM, Pabbati C, Geske JR, Mckean AJ. Suicide attempt as a risk factor for completed suicide: even more lethal than we knew. Am J Psychiatry. 2016;173(11):1094-1100. doi: 10.1176/appi.ajp.2016.15070854. PubMed
6. Torio CM, Encinosa W, Berdahl T, McCormick MC, Simpson LA. Annual report on health care for children and youth in the united states: national estimates of cost, utilization and expenditures for children with mental health conditions. Acad Pediatr. 2015;15(1):19-35. doi: 10.1016/j.acap.2014.07.007. PubMed
7. Olfson M, Wall M, Wang S, et al. Suicide after deliberate self-harm in adolescents and young adults. Pediatrics. 2018;141(4):e20173517. doi: 10.1542/peds.2017-3517. PubMed
8. Gay JC, Zima BT, Coker TR, et al. Postacute care after pediatric hospitalizations for a primary mental health condition. J Pediatr. 2018;193:222-228.e1. doi: 10.1016/j.jpeds.2017.09.058. PubMed
9. Heslin KC, Weiss AJ. Hospital Readmissions Involving Psychiatric Disorders, 2012. 2015. https://www.ncbi.nlm.nih.gov/books/NBK305353/pdf/Bookshelf_NBK305353.pdf. Accessed September 8, 2017. PubMed
10. Feng JY, Toomey SL, Zaslavsky AM, Nakamura MM, Schuster MA. Readmission after pediatric mental health admissions. Pediatrics. 2017;140(6):e20171571. doi: 10.1542/peds.2017-1571. PubMed
11. Bardach NS, Vittinghoff E, Asteria-Peñaloza R, et al. Measuring hospital quality using pediatric readmission and revisit rates. Pediatrics. 2013;132(3):429-436. doi: 10.1542/peds.2012-3527. PubMed
12. Callahan ST, Fuchs DC, Shelton RC, et al. Identifying suicidal behavior among adolescents using administrative claims data. Pharmacoepidemiol Drug Saf. 2013;22(7):769-775. doi: 10.1002/pds.3421. PubMed
13. SAMHSA, HHS, Synectics for Management Decisions, Mathematica Policy Research. National Mental Health Services Survey: 2010: Data on Mental Health Treatment Facilities. http://media.samhsa.gov/data/DASIS/NMHSS2010D/NMHSS2010_Web.pdf. Accessed November 13, 2015.
14. Patrick AR, Miller M, Barber CW, Wang PS, Canning CF, Schneeweiss S. Identification of hospitalizations for intentional self-harm when E-codes are incompletely recorded. Pharmacoepidemiol Drug Saf. 2010;19(12):1263-1275. doi: 10.1002/pds.2037. PubMed
15. Mellesdal L, Mehlum L, Wentzel-Larsen T, Kroken R, Jørgensen HA. Suicide risk and acute psychiatric readmissions: a prospective cohort study. Psychiatr Serv. 2010;61(1):25-31. doi: 10.1176/appi.ps.61.1.25. PubMed
16. Agency for Healthcare Research and Quality, Centers for Medicare and Medicaid. Measure: Pediatric All-Condition Readmission Measure Measure Developer: Center of Excellence for Pediatric Quality Measurement (CEPQM). https://www.ahrq.gov/sites/default/files/wysiwyg/policymakers/chipra/factsheets/chipra_14-p008-1-ef.pdf. Accessed November 15, 2017.
17. Cancino RS, Culpepper L, Sadikova E, Martin J, Jack BW, Mitchell SE. Dose-response relationship between depressive symptoms and hospital readmission. J Hosp Med. 2014;9(6):358-364. doi: 10.1002/jhm.2180. PubMed
18. Carlisle CE, Mamdani M, Schachar R, To T. Aftercare, emergency department visits, and readmission in adolescents. J Am Acad Child Adolesc Psychiatry. 2012;51(3):283-293. http://www.sciencedirect.com/science/article/pii/S0890856711011002. Accessed November 2, 2015. PubMed
19. Fadum EA, Stanley B, Qin P, Diep LM, Mehlum L. Self-poisoning with medications in adolescents: a national register study of hospital admissions and readmissions. Gen Hosp Psychiatry. 2014;36(6):709-715. doi: 10.1016/j.genhosppsych.2014.09.004. PubMed
20. Bernet AC. Predictors of psychiatric readmission among veterans at high risk of suicide: the impact of post-discharge aftercare. Arch Psychiatr Nurs. 2013;27(5):260-261. doi: 10.1016/j.apnu.2013.07.001. PubMed
21. Feudtner C, Feinstein JA, Zhong W, Hall M, Dai D. Pediatric complex chronic conditions classification system version 2: updated for ICD-10 and complex medical technology dependence and transplantation. BMC Pediatr. 2014;14(1):199. doi: 10.1186/1471-2431-14-199. PubMed
22. HCUP. HCUP-US Tools & Software Page. http://www.hcup-us.ahrq.gov/toolssoftware/chronic/chronic.jsp. Published 2015. Accessed October 30, 2015.
23. Zima BT, Rodean J, Hall M, Bardach NS, Coker TR, Berry JG. Psychiatric disorders and trends in resource use in pediatric hospitals. Pediatrics. 2016;138(5):e20160909-e20160909. doi: 10.1542/peds.2016-0909. PubMed
24. Spicer RS, Miller TR. Suicide acts in 8 states: incidence and case fatality rates by demographics and method. Am J Public Health. 2000;90(12):1885-1891. doi: 10.2105/AJPH.90.12.1885. PubMed
25. Hansen B, Lang M. Back to school blues: Seasonality of youth suicide and the academic calendar. Econ Educ Rev. 2011;30(5):850-861. doi: 10.1016/j.econedurev.2011.04.012.
26. Lueck C, Kearl L, Lam CN, Claudius I. Do emergency pediatric psychiatric visits for danger to self or others correspond to times of school attendance? Am J Emerg Med. 2015;33(5):682-684. doi: 10.1016/J.AJEM.2015.02.055. PubMed
27. Healthcare Cost And Utilization Project. Introduction to the HCUP Nationwide Readmissions Database. Rockville, MD; 2017. https://www.hcup-us.ahrq.gov/db/nation/nrd/Introduction_NRD_2010-2014.pdf. Accessed November 14, 2017.
28. Bardach NS, Coker TR, Zima BT, et al. Common and costly hospitalizations for pediatric mental health disorders. Pediatrics. 2014;133(4):602-609. doi: 10.1542/peds.2013-3165. PubMed
29. Ahmedani BK, Peterson EL, Hu Y, et al. Major physical health conditions and risk of suicide. Am J Prev Med. 2017;53(3):308-315. doi: 10.1016/J.AMEPRE.2017.04.001. PubMed
30. Gunnell D, Hawton K, Ho D, et al. Hospital admissions for self harm after discharge from psychiatric inpatient care: cohort study. BMJ. 2008;337:a2278. doi: 10.1136/bmj.a2278. PubMed
31. The TADS Team. The treatment for adolescents with depression study (TADS). Arch Gen Psychiatry. 2007;64(10):1132. doi: 10.1001/archpsyc.64.10.1132. PubMed
32. While D, Bickley H, Roscoe A, et al. Implementation of mental health service recommendations in England and Wales and suicide rates, 1997-2006: A cross-sectional and before-and-after observational study. Lancet. 2012;379(9820):1005-1012. doi: 10.1016/S0140-6736(11)61712-1. PubMed
33. Kawanishi C, Aruga T, Ishizuka N, et al. Assertive case management versus enhanced usual care for people with mental health problems who had attempted suicide and were admitted to hospital emergency departments in Japan (ACTION-J): a multicentre, randomised controlled trial. Lancet Psychiatry. 2014;1(3):193-201. doi: 10.1016/S2215-0366(14)70259-7. PubMed
34. Grupp-Phelan J, McGuire L, Husky MM, Olfson M. A randomized controlled trial to engage in care of adolescent emergency department patients with mental health problems that increase suicide risk. Pediatr Emerg Care. 2012;28(12):1263-1268. doi: 10.1097/PEC.0b013e3182767ac8. PubMed
35. Ciciolla L, Curlee AS, Karageorge J, Luthar SS. When mothers and fathers are seen as disproportionately valuing achievements: implications for adjustment among upper middle class youth. J Youth Adolesc. 2017;46(5):1057-1075. doi: 10.1007/s10964-016-0596-x. PubMed
36. Plemmons G, Hall M, Doupnik S, et al. Hospitalization for suicide ideation or attempt: 2008–2015. Pediatrics. May 2018:e20172426. doi: 10.1542/peds.2017-2426. PubMed
© 2018 Society of Hospital Medicine
Development of Hospitalization Resource Intensity Scores for Kids (H-RISK) and Comparison across Pediatric Populations
Hospitals are increasingly assessed comparatively in terms of costs and quality for benchmarking purposes. These comparisons can be used by patients and families to determine where to seek care, to report compliance and grant certifications by oversight organizations (eg, Leapfrog, Magnet, Joint Commission), and by payers, to determine reimbursement models and/or to assess financial penalty or bonuses for underperforming or overperforming hospitals. As these efforts can cause substantial reputational and financial consequences for hospitals, these metrics must be contextualized within the population of patients that each hospital serves.
In adult Medicare patient populations, methods have been developed to assess the relative severity of a hospital’s full complement of patients.1,2 These methods assume a relationship between severity and hospital resource intensity (ie, cost) and typically assume the form of relative weights (RWs), which are developed for clinically similar groups of patients (eg, Medicare Diagnosis Related Groups; MS-DRG) from a reference population. A RW for each MS-DRG is calculated as the average cost of patients within the group divided by the average cost for all patients in the reference population. These weights are then applied to a hospital’s discharges over a specific time period and averaged to obtain a hospital-level case-mix index (CMI). A value of 1 indicates that a hospital serves a mix of patients with similar severity (or resource intensity) to that of an “average” hospital discharge in the reference population, whereas a value of 1.2 indicates that a hospital serves a population of patients with 20% more severity than that of an “average” hospital discharge. Since 1983, the Centers for Medicare and Medicaid Services (CMS) has used RWs in their inpatient prospective payment system.3
Similar pediatric methods are less developed and necessitate special consideration as the use of existing weights may be inappropriate for a pediatric population. First, MS-DRGs were developed primarily for the Medicare population and lack sufficient granularity for pediatric populations, specifically newborns. Second, a severity stratification which incorporates important patient characteristics, such as age in pediatrics, does not exist in the MS-DRG system . Finally, although the reference populations that are used to develop MS-DRG weights do not explicitly exclude children, children typically account for approximately 15% of hospitalizations (6% excluding neonatal/maternal) and possibly feature different utilization patterns than adults with similar conditions. Thus, weights developed from a combined pediatric/adult reference population primarily reflect an adult population.
With valid pediatric RWs, stakeholders can assess a hospital’s severity mix of patients in a comparable fashion and contextualize outcome metrics. Additionally, these same weights can be used to estimate expected costs for hospitalizations or for risk adjusting various outcomes at the discharge- or hospital-level. Thus, we sought to develop hospitalization resource intensity scores for kids (H-RISK) using pediatric-specific weights and compare hospital-level CMIs across various hospital types and locations as an example of the application of this novel methodology.
METHODS
Dataset
Data for this analysis were obtained from the 2012 Healthcare Cost and Utilization Project (HCUP) Kids’ Inpatient Database (KID).4 KID is the largest publicly available all-payer inpatient administrative database in the United States and is sponsored by the Agency for Healthcare Research and Quality as part of the HCUP. The 2012 KID included a sample of approximately 3.2 million discharge records of children <21 years old from 44 states and 4,179 community, nonrehabilitation hospitals weighted for national estimates.
Hospital discharge costs were estimated from charges using cost-to-charge ratios (CCR) provided by HCUP as a supplement to the 2012 KID.5 Cost estimates associated with a specific discharge were estimated by multiplying the total charges reported in the data by the appropriate hospital-specific CCR and then adjusted for price factors beyond a hospital’s control using the area wage index also provided by HCUP as a supplement.
H-RISK and Case-Mix Index Calculations
We calculated H-RISK as pediatric-specific RWs based on version 30 of 3M’s All Patient Refined DRG (APR-DRG; 3M Health Information Systems, Salt Lake City, Utah) system as a measure of resource intensity. The APR-DRG system classifies hospital discharges into over 300 base DRGs based on demographic, diagnostic, and therapeutic characteristics. Each APR-DRG is further sub-divided into 4 subclasses of severity of illness (SOI; eg, minor, moderate, major, and extreme) to indicate the intensity of resource utilization during hospitalization. However, SOI levels for differing APR-DRGs are not comparable.
For every APR-DRG SOI combinations available in the 2012 KID, calculation of RW was based on the ratio of the mean cost for patients assigned to a particular APR-DRG SOI compared with the mean cost for all patients in the database. Inpatient costs less than $0.50 were set to missing and removed from analysis. Mortalities and discharges with missing CCR and wage index values were also excluded from analysis. We required that estimates for RWs be based on a reasonable set of data (ie, 10 or more discharges) for each APR-DRG SOI, and that estimates across the 4 SOI levels within an APR-DRG be monotonically nondecreasing (ie, as SOI level increases, weights must either be the same or increasing). Winsorized means were used as point estimates for mean cost in both the numerator and denominator of RW computation. Winsorizing refers to an analytic transformation by which the influence of outliers (eg, values beyond a certain threshold) is mitigated by replacing the value of outliers with the value of the threshold. We used the 5th and 95th percentiles as thresholds for Winsorizing our point estimates.
Winsorized point estimates failing to meet the minimum sample size of 10 or nondecreasing monotonicity requirement were modified by one of the two following methods:
- Cost data were modeled using a generalized linear model assuming an exponential distribution. Covariates in the model included APR-DRG and SOI within APR-DRG as a continuous variable. Where applicable, Winsorized estimates of the mean were replaced with modeled estimates.
- Data from an APR-DRG SOI in question were combined with other SOIs within the same APR-DRG with the closest Winsorized mean value. Once data were combined, a common Winsorized value was re-computed and values across SOIs were checked to ensure that nondecreasing monotonicity was maintained. In some APR-DRGs with sparse data, this involved combining pairs of severity levels; in others, it involved combining three or four severity levels together.
For APR-DRGs in which no discharges at any SOI were recorded in the 2012 KID, we used the Winsorized mean of all encounters with a common major diagnostic category (MDC) as the missing APR-DRG as point estimate for all 4 SOI levels.
To calculate the CMI for a set of discharges (eg, discharges at a hospital in a year), RWs were assigned to each discharge based on APR-DRG SOI designation. Consequently, all discharges from a specific APR-DRG SOI were assigned the same RW. Once RWs were assigned, CMI was calculated as the mean RW across all discharges. To compare hospital types based on acute-care hospital stays which are usually considered with the realm of pediatric care, we excluded RWs for normal newborns, defined as APR-DRG 626 (neonate birthweight of 2000–2499 g, normal newborn or neonate with other problems) and 640 (neonate birthweight >2499 g, normal newborn or neonate with other problems), and maternal hospitalizations, defined as APR-DRG 540 (cesarean delivery) and 560 (vaginal delivery), from our CMI calculations.
Statistical Methodology
Categorical variables were summarized using frequencies and percentages; continuous variables were summarized using medians and interquartile ranges. Differences between hospital
types (eg, rural, urban nonteaching, urban teaching, and
free-standing) were assessed using a Chi-square test for association for categorical variables. Differences in continuous variables including comparisons of neonatal (MDC 15) and nonneonatal discharges, and medical versus procedural discharges as defined by the APR-DRG grouper were assessed using a Kruskal–Wallis test. All analyses were performed using SAS, Version 9.4 (SAS Institute, Cary, North Carolina); P values <.05 were considered statistically significant.
This study was considered nonhuman subjects research by the Institutional Review Board of Vanderbilt University Medical Center.
RESULTS
Patient Population
Table 1 summarizes the patient characteristics for all 4 hospital types. All comparisons of patient characteristics across the four hospital types are significant (P < .001). Of the 6,675,222 weighted discharges in HCUP KID 2012, almost two-thirds were less than one year old (4,269,984). Three-quarters of those infant discharges (3,733,760) were in-hospital births. The South was the Census region with the most number of discharges (38.8%), and over half of discharges (53.2%) included patients who lived in metro areas with more than 1 million residents. Patients disproportionately originated from lower-income areas with 30.9% living in zip codes with median incomes in the first quartile.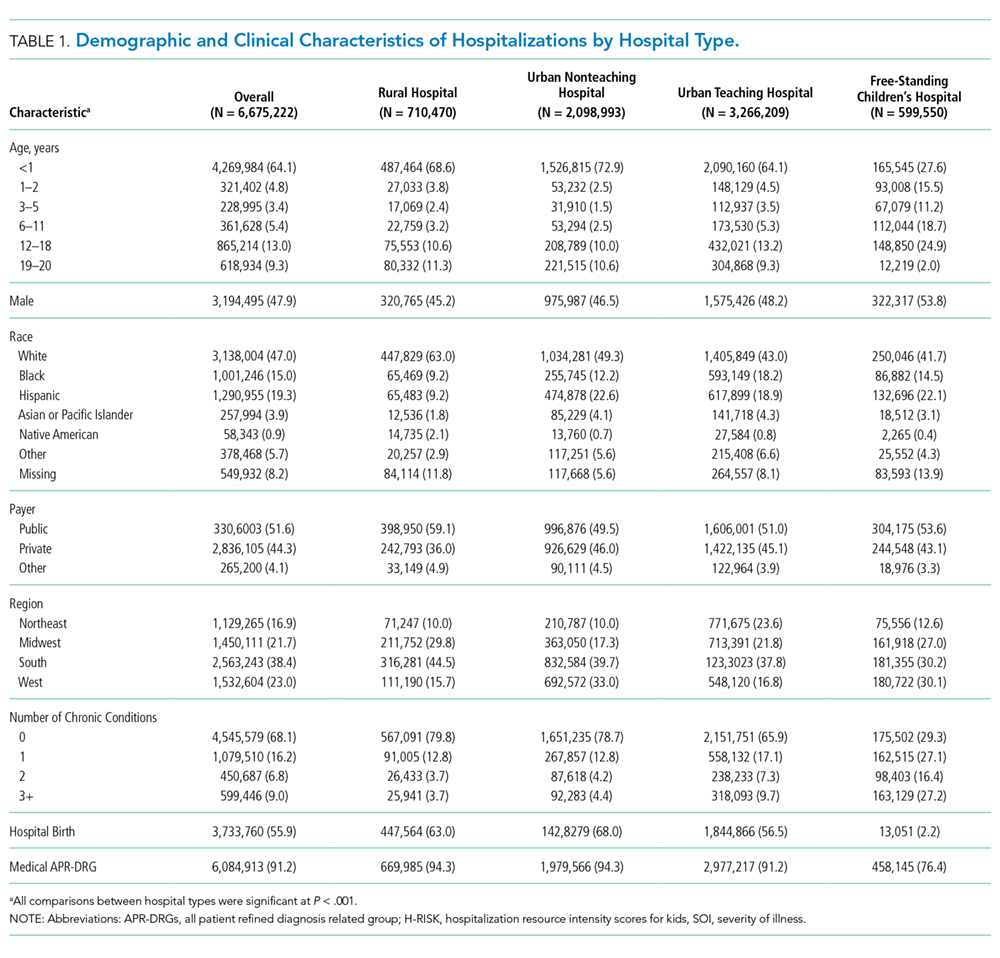
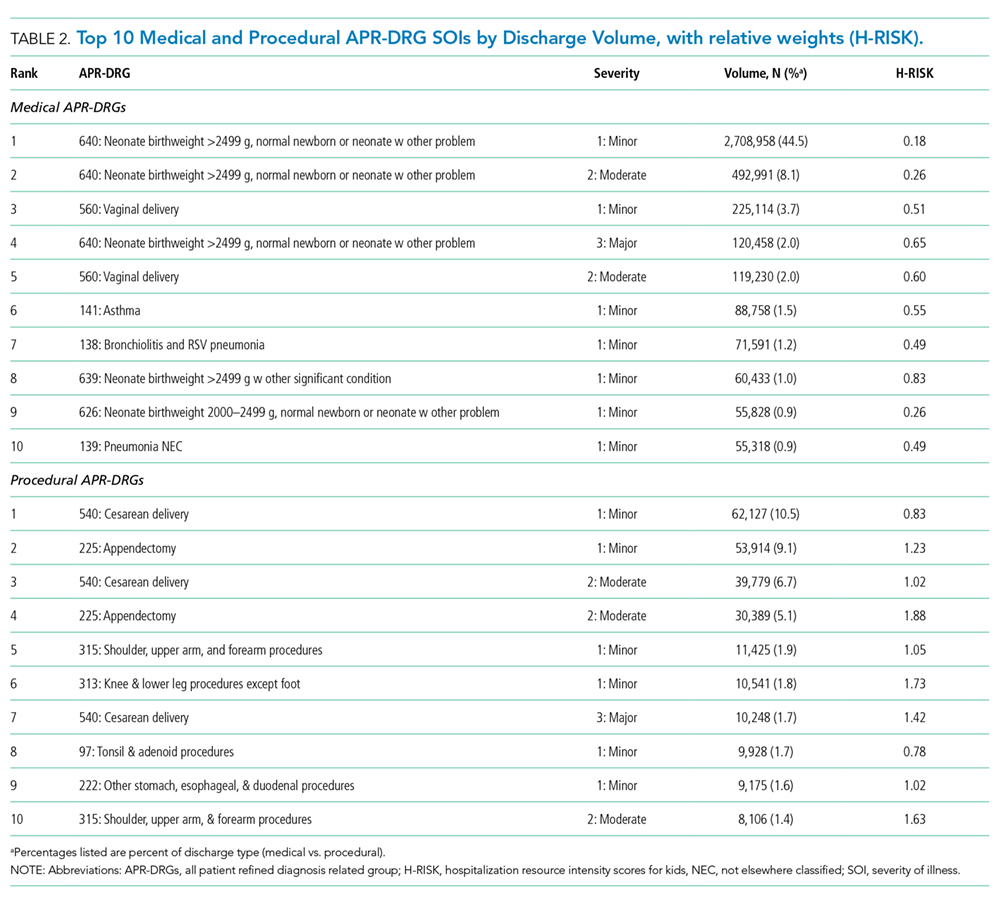
H-RISK Generation
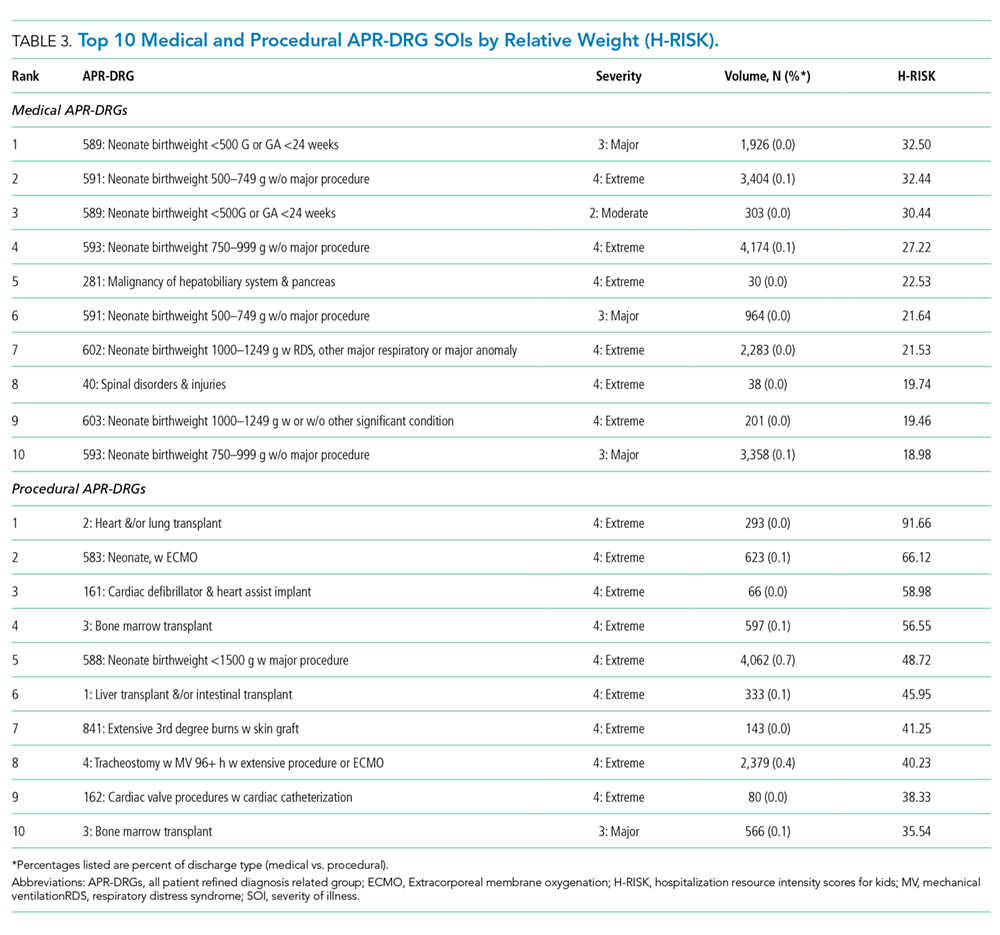
The weighted Winsorized mean cost of all discharges was $6,135 per discharge. The majority of cost-based H-RISK were higher than 1, with 1,038 (82.5%) of APR-DRG SOIs incurring an estimated cost higher than $6,135. Solid organ and bone marrow transplantations represented 4 of the 10 highest cost-based RWs for procedural APR-DRG SOIs (Table 3). Neonatal APR-DRG SOIs accounted for 8 of the 10 highest medical RWs. A list of all APR-DRG SOIs and H-RISK can be found in Appendix A.
Hospital-Level Case-Mix Index for Acute Hospitalizations
After excluding normal newborn and maternal hospitalizations, median CMI of the 3117 hospitals with at least 20 unweighted discharges was 1.0 (interquartile range [IQR]: 0.8, 1.7). CMI varied significantly across hospital types (P < .001). Free-standing children’s hospitals exhibited the highest cost-based CMI (median: 2.7, IQR: 2.2–3.1), followed by urban teaching hospitals (median: 1.8, IQR: 1.3–2.6), urban nonteaching hospitals (median: 1.1, IQR: 0.9–1.5), and rural hospitals (median: 0.9, IQR: 0.7–0.9).
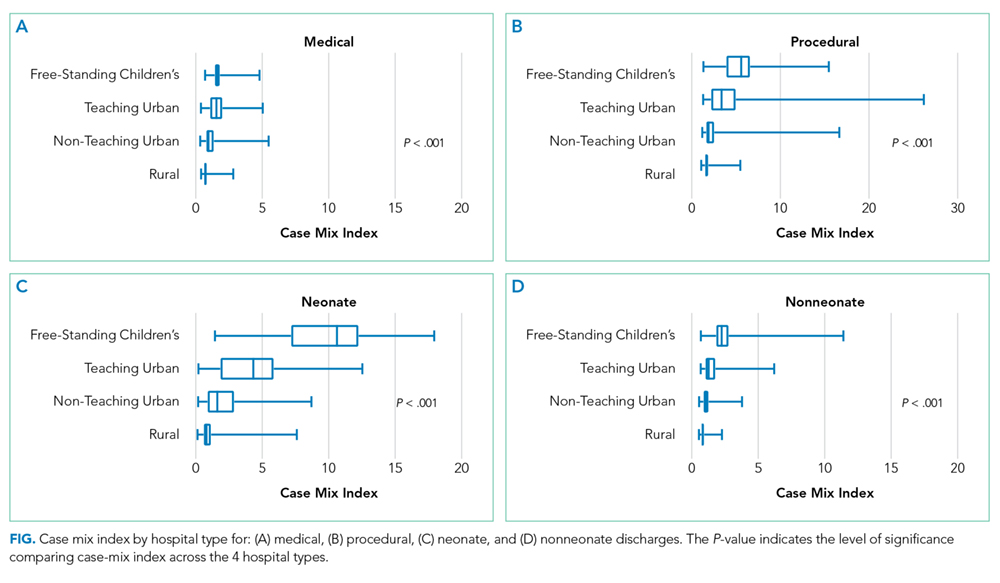
DISCUSSION
Currently, no widely available measures can compare the relative intensity of hospital care specific for inpatient pediatric populations. To meet this important need, we have developed a methodology to determine valid pediatric RWs (H-RISK) which can be used to estimate the intensity of care for applications across entire hospital patient populations and specific subpopulations. H-RISK allow calculation of CMIs for risk adjustment of various outcomes at the discharge- or hospital-level and for comparisons among hospitals and populations. Using this methodology, we demonstrated that the CMI for free-standing children’s hospitals was significantly higher than those of rural, urban, nonteaching and urban teaching hospitals for all discharges and medical or procedural subgroups.
CMS has used RWs based on DRGs since the inception of the prospective payment system in 1983. The sequence of DRGs used by CMS has purposely focused on older adult Medicare population, and CMS itself recommends applying Medicare-focused DRGs (MS-DRGs being the current iteration) only for the >65 year population.6 Nevertheless, many payers, both government and commercial, utilize MS-DRGs and their RWs for payment purposes when reimbursing children’s hospitals. The validity of using weights developed using this grouper in hospitals treating large numbers of pediatric patients and childhood illnesses has been called into question, particularly when such weights are used in reimbursement of children’s hospitals.7
Several factors contribute to the validity of a model for developing RWs. First, the system used to describe patient hospitalizations and illnesses should be appropriate to the population in question. As described above, the original DRG system and its subsequent iterations were designed to describe hospitalizations for adults >65 years of age.8, 9 Over the years, CMS DRGs incorporated rudimentary categories for neonatal and obstetrical hospitalizations. Still, the current MS-DRGs lack sufficient focus on common inpatient pediatric conditions to adequately describe pediatric hospitalizations, particularly those in free-standing children’s hospitals delivering tertiary and quaternary care. Thus, a more appropriate classification schema for developing RWs specific for pediatric hospitalization should include patients across the entire age spectrum. APR-DRGs represent one such classification system.
Once an appropriate patient classification system is selected, then the population of hospitalized patients to be used as the reference group becomes important. For a system targeting a pediatric inpatient population, a hospital discharge database representing a broad sample of pediatric hospitalizations offers the best basis for developing a system of weights applicable to different types of hospitals providing care for children. For this purpose, we selected the 2012 KID database, a nationally representative dataset containing data on newborn and pediatric discharges from the majority of states within the US. This choice assured that the RWs developed were based on and applicable to pediatric hospitalizations across the entire spectrum of SOI and resource intensity.
A number of measures of hospital performance and quality have been developed and are used by various entities, including individual hospitals, CMS, Leapfrog, Magnet, Joint Commission, and payers, for purposes ranging from benchmarking for improvement to payment models to reimbursement penalties. However, SOI of a hospital’s patient population influences not only the intensity of care that a hospital provides but also presents a potential impact on process and outcome measures. Thus, fair and appropriate measures must consider differences in SOI when comparing hospital performances. Using the weights derived in this paper, these adjustments can be possibly made at either the discharge- or hospital-level, depending on the application, and may include comparisons by hospital location, ownership, payer mix, or socioeconomic strata.
It is also common for hospitals to quantitatively express the uniqueness of services that they deliver to payers or the general public. A hospital-level CMI (derived as the average discharge weight for patients within a hospital) is one way that hospitals may differentiate themselves. This can be accomplished by considering the ratio of one hospital’s CMI to another hospital’s (or an average of a group of hospitals) as an expression of the relative intensity of services. For example, if hospital x has a CMI of 2.3, and hospital y has a CMI of 1.4, the population of children hospitalized at hospital x was 64.3% (1–2.3/1.4) more resource intensive than the children seen at hospital y.
This study should be considered in terms of several limitations. We used costs as the basis for determining intensity of service. Thus, the difference in cost structure among children’s hospitals and between children’s hospitals and other hospital types in the KID could have affected the final calculated weights. Also, the RWs calculated in this study rely on hospital discharge data. Thus, complications which were not “present on admission” and occurred during a hospitalization could have reflected poor quality of care yet still increase resource intensity as measured by total costs. Future studies should examine the potential impact of using present-on-admission diagnoses only for the APR-DRG grouping on the values of RWs. Significant variation may have existed among hospitals in resource utilization, and some hospitals may have exhibited significant overutilization of resources for the same conditions. However, as we used Winsorized means, the impact of potential outliers should have been reduced. Some APR-DRG-SOI combinations were seen mainly at children’s hospitals. Thus, cost structure and resource utilization practices of this subset of hospitals would have been the only contributors to weights for these patients. Given that the 2012 KID contained a broad representation of pediatric hospitalizations, with age 0–20 years, newborns accounted for the majority of total cases in the database. While providing a full range of pediatric weights, inclusion of these patients lowered the overall average RW. For this reason, we excluded normal newborn categories and maternal categories from analysis of CMI across hospital types and focused on acute-care hospitalizations. Lastly, as with any study relying on administrative data, there is always the possibility of coding errors or data entry errors in the reference dataset.
CONCLUSIONS
H-RISK can be used to risk adjust measures to account for severity differences across populations. These weights can also be averaged across hospitals’ patient populations to compare relative resource intensities of the patients served.
Disclosures
The authors have nothing to disclose.
1. Pettengill J, Vertrees J. Reliability and Validity in Hospital Case-Mix Measurement. Health Care Financ Rev. 1982; 4(2): 101-128. PubMed
2. Centers for Medicare & Medicaid Services. Details for title: Case Mix Index. https://www.cms.gov/Medicare/Medicare-Fee-for-Service-Payment/AcuteInpatientPPS/Acute-Inpatient-Files-for-Download-Items/CMS022630.html#. Accessed August 30, 2017.
3. Iglehart JK. Medicare begins prospective payment of hospitals. N. Engl. J. Med 1983; 308(23): 1428-1432. PubMed
4. Healthcare Cost Utilization Project. Overview of the Kids’ Inpatient Database (KID). 2017; https://www.hcup-us.ahrq.gov/kidoverview.jsp. Accessed August 30, 2017.
5. Healthcare Cost Utilization Project. Cost-to-Charge Ratio Files: 2012 Kids’ Inpatient Database (KID) User Guide. 2014; https://www.hcup-us.ahrq.gov/db/state/CCR2012KIDUserGuide.pdf. Accessed August 30, 2017.
6. Centers for Medicare & Medicaid Services. Medicare Program; Changes to the Hospital Inpatient Prospective Payment Systems and Fiscal Year 2005 Rates; Final Rule. Federal Register. 2004;69(154):48,939. PubMed
7. Muldoon JH. Structure and performance of different DRG classification systems for neonatal medicine. Pediatrics. 1999; 103(1 Suppl E): 302-318. PubMed
8. Averill R, Goldfield N, Muldoon J, Steinbeck B, Grant T. A Closer Look at All Patient Refined DRGs. J AHIMA. 2002; 73(1): 46-50. PubMed
9. Centers for Medicare & Medicaid Services. Design and development of the Diagnosis Related Group (DRG). https://www.cms.gov/ICD10Manual/version34-fullcode-cms/fullcode_cms/Design_and_development_of_the_Diagnosis_Related_Group_(DRGs)_PBL-038.pdf. Accessed December 6, 2017.
Hospitals are increasingly assessed comparatively in terms of costs and quality for benchmarking purposes. These comparisons can be used by patients and families to determine where to seek care, to report compliance and grant certifications by oversight organizations (eg, Leapfrog, Magnet, Joint Commission), and by payers, to determine reimbursement models and/or to assess financial penalty or bonuses for underperforming or overperforming hospitals. As these efforts can cause substantial reputational and financial consequences for hospitals, these metrics must be contextualized within the population of patients that each hospital serves.
In adult Medicare patient populations, methods have been developed to assess the relative severity of a hospital’s full complement of patients.1,2 These methods assume a relationship between severity and hospital resource intensity (ie, cost) and typically assume the form of relative weights (RWs), which are developed for clinically similar groups of patients (eg, Medicare Diagnosis Related Groups; MS-DRG) from a reference population. A RW for each MS-DRG is calculated as the average cost of patients within the group divided by the average cost for all patients in the reference population. These weights are then applied to a hospital’s discharges over a specific time period and averaged to obtain a hospital-level case-mix index (CMI). A value of 1 indicates that a hospital serves a mix of patients with similar severity (or resource intensity) to that of an “average” hospital discharge in the reference population, whereas a value of 1.2 indicates that a hospital serves a population of patients with 20% more severity than that of an “average” hospital discharge. Since 1983, the Centers for Medicare and Medicaid Services (CMS) has used RWs in their inpatient prospective payment system.3
Similar pediatric methods are less developed and necessitate special consideration as the use of existing weights may be inappropriate for a pediatric population. First, MS-DRGs were developed primarily for the Medicare population and lack sufficient granularity for pediatric populations, specifically newborns. Second, a severity stratification which incorporates important patient characteristics, such as age in pediatrics, does not exist in the MS-DRG system . Finally, although the reference populations that are used to develop MS-DRG weights do not explicitly exclude children, children typically account for approximately 15% of hospitalizations (6% excluding neonatal/maternal) and possibly feature different utilization patterns than adults with similar conditions. Thus, weights developed from a combined pediatric/adult reference population primarily reflect an adult population.
With valid pediatric RWs, stakeholders can assess a hospital’s severity mix of patients in a comparable fashion and contextualize outcome metrics. Additionally, these same weights can be used to estimate expected costs for hospitalizations or for risk adjusting various outcomes at the discharge- or hospital-level. Thus, we sought to develop hospitalization resource intensity scores for kids (H-RISK) using pediatric-specific weights and compare hospital-level CMIs across various hospital types and locations as an example of the application of this novel methodology.
METHODS
Dataset
Data for this analysis were obtained from the 2012 Healthcare Cost and Utilization Project (HCUP) Kids’ Inpatient Database (KID).4 KID is the largest publicly available all-payer inpatient administrative database in the United States and is sponsored by the Agency for Healthcare Research and Quality as part of the HCUP. The 2012 KID included a sample of approximately 3.2 million discharge records of children <21 years old from 44 states and 4,179 community, nonrehabilitation hospitals weighted for national estimates.
Hospital discharge costs were estimated from charges using cost-to-charge ratios (CCR) provided by HCUP as a supplement to the 2012 KID.5 Cost estimates associated with a specific discharge were estimated by multiplying the total charges reported in the data by the appropriate hospital-specific CCR and then adjusted for price factors beyond a hospital’s control using the area wage index also provided by HCUP as a supplement.
H-RISK and Case-Mix Index Calculations
We calculated H-RISK as pediatric-specific RWs based on version 30 of 3M’s All Patient Refined DRG (APR-DRG; 3M Health Information Systems, Salt Lake City, Utah) system as a measure of resource intensity. The APR-DRG system classifies hospital discharges into over 300 base DRGs based on demographic, diagnostic, and therapeutic characteristics. Each APR-DRG is further sub-divided into 4 subclasses of severity of illness (SOI; eg, minor, moderate, major, and extreme) to indicate the intensity of resource utilization during hospitalization. However, SOI levels for differing APR-DRGs are not comparable.
For every APR-DRG SOI combinations available in the 2012 KID, calculation of RW was based on the ratio of the mean cost for patients assigned to a particular APR-DRG SOI compared with the mean cost for all patients in the database. Inpatient costs less than $0.50 were set to missing and removed from analysis. Mortalities and discharges with missing CCR and wage index values were also excluded from analysis. We required that estimates for RWs be based on a reasonable set of data (ie, 10 or more discharges) for each APR-DRG SOI, and that estimates across the 4 SOI levels within an APR-DRG be monotonically nondecreasing (ie, as SOI level increases, weights must either be the same or increasing). Winsorized means were used as point estimates for mean cost in both the numerator and denominator of RW computation. Winsorizing refers to an analytic transformation by which the influence of outliers (eg, values beyond a certain threshold) is mitigated by replacing the value of outliers with the value of the threshold. We used the 5th and 95th percentiles as thresholds for Winsorizing our point estimates.
Winsorized point estimates failing to meet the minimum sample size of 10 or nondecreasing monotonicity requirement were modified by one of the two following methods:
- Cost data were modeled using a generalized linear model assuming an exponential distribution. Covariates in the model included APR-DRG and SOI within APR-DRG as a continuous variable. Where applicable, Winsorized estimates of the mean were replaced with modeled estimates.
- Data from an APR-DRG SOI in question were combined with other SOIs within the same APR-DRG with the closest Winsorized mean value. Once data were combined, a common Winsorized value was re-computed and values across SOIs were checked to ensure that nondecreasing monotonicity was maintained. In some APR-DRGs with sparse data, this involved combining pairs of severity levels; in others, it involved combining three or four severity levels together.
For APR-DRGs in which no discharges at any SOI were recorded in the 2012 KID, we used the Winsorized mean of all encounters with a common major diagnostic category (MDC) as the missing APR-DRG as point estimate for all 4 SOI levels.
To calculate the CMI for a set of discharges (eg, discharges at a hospital in a year), RWs were assigned to each discharge based on APR-DRG SOI designation. Consequently, all discharges from a specific APR-DRG SOI were assigned the same RW. Once RWs were assigned, CMI was calculated as the mean RW across all discharges. To compare hospital types based on acute-care hospital stays which are usually considered with the realm of pediatric care, we excluded RWs for normal newborns, defined as APR-DRG 626 (neonate birthweight of 2000–2499 g, normal newborn or neonate with other problems) and 640 (neonate birthweight >2499 g, normal newborn or neonate with other problems), and maternal hospitalizations, defined as APR-DRG 540 (cesarean delivery) and 560 (vaginal delivery), from our CMI calculations.
Statistical Methodology
Categorical variables were summarized using frequencies and percentages; continuous variables were summarized using medians and interquartile ranges. Differences between hospital
types (eg, rural, urban nonteaching, urban teaching, and
free-standing) were assessed using a Chi-square test for association for categorical variables. Differences in continuous variables including comparisons of neonatal (MDC 15) and nonneonatal discharges, and medical versus procedural discharges as defined by the APR-DRG grouper were assessed using a Kruskal–Wallis test. All analyses were performed using SAS, Version 9.4 (SAS Institute, Cary, North Carolina); P values <.05 were considered statistically significant.
This study was considered nonhuman subjects research by the Institutional Review Board of Vanderbilt University Medical Center.
RESULTS
Patient Population
Table 1 summarizes the patient characteristics for all 4 hospital types. All comparisons of patient characteristics across the four hospital types are significant (P < .001). Of the 6,675,222 weighted discharges in HCUP KID 2012, almost two-thirds were less than one year old (4,269,984). Three-quarters of those infant discharges (3,733,760) were in-hospital births. The South was the Census region with the most number of discharges (38.8%), and over half of discharges (53.2%) included patients who lived in metro areas with more than 1 million residents. Patients disproportionately originated from lower-income areas with 30.9% living in zip codes with median incomes in the first quartile.
H-RISK Generation
The weighted Winsorized mean cost of all discharges was $6,135 per discharge. The majority of cost-based H-RISK were higher than 1, with 1,038 (82.5%) of APR-DRG SOIs incurring an estimated cost higher than $6,135. Solid organ and bone marrow transplantations represented 4 of the 10 highest cost-based RWs for procedural APR-DRG SOIs (Table 3). Neonatal APR-DRG SOIs accounted for 8 of the 10 highest medical RWs. A list of all APR-DRG SOIs and H-RISK can be found in Appendix A.
Hospital-Level Case-Mix Index for Acute Hospitalizations
After excluding normal newborn and maternal hospitalizations, median CMI of the 3117 hospitals with at least 20 unweighted discharges was 1.0 (interquartile range [IQR]: 0.8, 1.7). CMI varied significantly across hospital types (P < .001). Free-standing children’s hospitals exhibited the highest cost-based CMI (median: 2.7, IQR: 2.2–3.1), followed by urban teaching hospitals (median: 1.8, IQR: 1.3–2.6), urban nonteaching hospitals (median: 1.1, IQR: 0.9–1.5), and rural hospitals (median: 0.9, IQR: 0.7–0.9).
DISCUSSION
Currently, no widely available measures can compare the relative intensity of hospital care specific for inpatient pediatric populations. To meet this important need, we have developed a methodology to determine valid pediatric RWs (H-RISK) which can be used to estimate the intensity of care for applications across entire hospital patient populations and specific subpopulations. H-RISK allow calculation of CMIs for risk adjustment of various outcomes at the discharge- or hospital-level and for comparisons among hospitals and populations. Using this methodology, we demonstrated that the CMI for free-standing children’s hospitals was significantly higher than those of rural, urban, nonteaching and urban teaching hospitals for all discharges and medical or procedural subgroups.
CMS has used RWs based on DRGs since the inception of the prospective payment system in 1983. The sequence of DRGs used by CMS has purposely focused on older adult Medicare population, and CMS itself recommends applying Medicare-focused DRGs (MS-DRGs being the current iteration) only for the >65 year population.6 Nevertheless, many payers, both government and commercial, utilize MS-DRGs and their RWs for payment purposes when reimbursing children’s hospitals. The validity of using weights developed using this grouper in hospitals treating large numbers of pediatric patients and childhood illnesses has been called into question, particularly when such weights are used in reimbursement of children’s hospitals.7
Several factors contribute to the validity of a model for developing RWs. First, the system used to describe patient hospitalizations and illnesses should be appropriate to the population in question. As described above, the original DRG system and its subsequent iterations were designed to describe hospitalizations for adults >65 years of age.8, 9 Over the years, CMS DRGs incorporated rudimentary categories for neonatal and obstetrical hospitalizations. Still, the current MS-DRGs lack sufficient focus on common inpatient pediatric conditions to adequately describe pediatric hospitalizations, particularly those in free-standing children’s hospitals delivering tertiary and quaternary care. Thus, a more appropriate classification schema for developing RWs specific for pediatric hospitalization should include patients across the entire age spectrum. APR-DRGs represent one such classification system.
Once an appropriate patient classification system is selected, then the population of hospitalized patients to be used as the reference group becomes important. For a system targeting a pediatric inpatient population, a hospital discharge database representing a broad sample of pediatric hospitalizations offers the best basis for developing a system of weights applicable to different types of hospitals providing care for children. For this purpose, we selected the 2012 KID database, a nationally representative dataset containing data on newborn and pediatric discharges from the majority of states within the US. This choice assured that the RWs developed were based on and applicable to pediatric hospitalizations across the entire spectrum of SOI and resource intensity.
A number of measures of hospital performance and quality have been developed and are used by various entities, including individual hospitals, CMS, Leapfrog, Magnet, Joint Commission, and payers, for purposes ranging from benchmarking for improvement to payment models to reimbursement penalties. However, SOI of a hospital’s patient population influences not only the intensity of care that a hospital provides but also presents a potential impact on process and outcome measures. Thus, fair and appropriate measures must consider differences in SOI when comparing hospital performances. Using the weights derived in this paper, these adjustments can be possibly made at either the discharge- or hospital-level, depending on the application, and may include comparisons by hospital location, ownership, payer mix, or socioeconomic strata.
It is also common for hospitals to quantitatively express the uniqueness of services that they deliver to payers or the general public. A hospital-level CMI (derived as the average discharge weight for patients within a hospital) is one way that hospitals may differentiate themselves. This can be accomplished by considering the ratio of one hospital’s CMI to another hospital’s (or an average of a group of hospitals) as an expression of the relative intensity of services. For example, if hospital x has a CMI of 2.3, and hospital y has a CMI of 1.4, the population of children hospitalized at hospital x was 64.3% (1–2.3/1.4) more resource intensive than the children seen at hospital y.
This study should be considered in terms of several limitations. We used costs as the basis for determining intensity of service. Thus, the difference in cost structure among children’s hospitals and between children’s hospitals and other hospital types in the KID could have affected the final calculated weights. Also, the RWs calculated in this study rely on hospital discharge data. Thus, complications which were not “present on admission” and occurred during a hospitalization could have reflected poor quality of care yet still increase resource intensity as measured by total costs. Future studies should examine the potential impact of using present-on-admission diagnoses only for the APR-DRG grouping on the values of RWs. Significant variation may have existed among hospitals in resource utilization, and some hospitals may have exhibited significant overutilization of resources for the same conditions. However, as we used Winsorized means, the impact of potential outliers should have been reduced. Some APR-DRG-SOI combinations were seen mainly at children’s hospitals. Thus, cost structure and resource utilization practices of this subset of hospitals would have been the only contributors to weights for these patients. Given that the 2012 KID contained a broad representation of pediatric hospitalizations, with age 0–20 years, newborns accounted for the majority of total cases in the database. While providing a full range of pediatric weights, inclusion of these patients lowered the overall average RW. For this reason, we excluded normal newborn categories and maternal categories from analysis of CMI across hospital types and focused on acute-care hospitalizations. Lastly, as with any study relying on administrative data, there is always the possibility of coding errors or data entry errors in the reference dataset.
CONCLUSIONS
H-RISK can be used to risk adjust measures to account for severity differences across populations. These weights can also be averaged across hospitals’ patient populations to compare relative resource intensities of the patients served.
Disclosures
The authors have nothing to disclose.
1. Pettengill J, Vertrees J. Reliability and Validity in Hospital Case-Mix Measurement. Health Care Financ Rev. 1982; 4(2): 101-128. PubMed
2. Centers for Medicare & Medicaid Services. Details for title: Case Mix Index. https://www.cms.gov/Medicare/Medicare-Fee-for-Service-Payment/AcuteInpatientPPS/Acute-Inpatient-Files-for-Download-Items/CMS022630.html#. Accessed August 30, 2017.
3. Iglehart JK. Medicare begins prospective payment of hospitals. N. Engl. J. Med 1983; 308(23): 1428-1432. PubMed
4. Healthcare Cost Utilization Project. Overview of the Kids’ Inpatient Database (KID). 2017; https://www.hcup-us.ahrq.gov/kidoverview.jsp. Accessed August 30, 2017.
5. Healthcare Cost Utilization Project. Cost-to-Charge Ratio Files: 2012 Kids’ Inpatient Database (KID) User Guide. 2014; https://www.hcup-us.ahrq.gov/db/state/CCR2012KIDUserGuide.pdf. Accessed August 30, 2017.
6. Centers for Medicare & Medicaid Services. Medicare Program; Changes to the Hospital Inpatient Prospective Payment Systems and Fiscal Year 2005 Rates; Final Rule. Federal Register. 2004;69(154):48,939. PubMed
7. Muldoon JH. Structure and performance of different DRG classification systems for neonatal medicine. Pediatrics. 1999; 103(1 Suppl E): 302-318. PubMed
8. Averill R, Goldfield N, Muldoon J, Steinbeck B, Grant T. A Closer Look at All Patient Refined DRGs. J AHIMA. 2002; 73(1): 46-50. PubMed
9. Centers for Medicare & Medicaid Services. Design and development of the Diagnosis Related Group (DRG). https://www.cms.gov/ICD10Manual/version34-fullcode-cms/fullcode_cms/Design_and_development_of_the_Diagnosis_Related_Group_(DRGs)_PBL-038.pdf. Accessed December 6, 2017.
© 2018 Society of Hospital Medicine
Mental Health Conditions and Unplanned Hospital Readmissions in Children
Readmission prevention is a focus of national efforts to improve the quality of hospital care for children.1-5 Several factors contribute to the risk of readmission for hospitalized children, including age, race or ethnicity, payer, and the type and number of comorbid health conditions.6-9 Mental health conditions (MHCs) are a prevalent comorbidity in children hospitalized for physical health reasons that could influence their postdischarge health and safety.
MHCs are increasingly common in children hospitalized for physical health indications; a comorbid MHC is currently present in 10% to 25% of hospitalized children ages 3 years and older.10,11 Hospital length of stay (LOS) and cost are higher in children with an MHC.12,13 Increased resource use may occur because MHCs can impede hospital treatment effectiveness and the child’s recovery from physical illness. MHCs are associated with a lower adherence with medications14-16 and a lower ability to cope with health events and problems.17-19 In adults, MHCs are a well-established risk factor for hospital readmission for a variety of physical health conditions.20-24 Although the influence of MHCs on readmissions in children has not been extensively investigated, higher readmission rates have been reported in adolescents hospitalized for diabetes with an MHC compared with those with no MHC.25,26
To our knowledge, no large studies have examined the relationship between the presence of a comorbid MHC and hospital readmissions in children or adolescents hospitalized for a broad array of medical or procedure conditions. Therefore, we conducted this study to (1) assess the likelihood of 30-day hospital readmission in children with versus without MHC who were hospitalized for one of 10 medical or 10 procedure conditions, and (2) to assess which MHCs are associated with the highest likelihood of hospital readmission.
METHODS
Study Design and Setting
We conducted a national, retrospective cohort study of index hospitalizations for children ages 3 to 21 years who were discharged from January 1, 2013, to November 30, 2013, in the Agency for Healthcare Research and Quality’s (AHRQ) Nationwide Readmissions Database (NRD). Admissions occurring in December 2013 were excluded because they did not have a 30-day timeframe available for readmission measurement. The 2013 NRD includes administrative data for a nationally representative sample of 14 million hospitalizations in 21 states, accounting for 49% of all US hospitalizations and weighted to represent 35.6 million hospitalizations. The database includes deidentified, verified patient linkage numbers so that patients can be tracked across multiple hospitalizations at the same institution or different institutions within a state. The NRD includes hospital information, patient demographic information, and the International Classification of Diseases, 9th Revision-Clinical Modification (ICD-9-CM) discharge diagnoses and procedures, with 1 primary diagnosis and up to 24 additional fields for comorbid diagnoses. This study was approved for exemption by the Children’s Hospital of Philadelphia Institutional Review Board.
Index Admissions
We used the methods described below to create a study cohort of the 10 medical and 10 procedure index admissions associated with the highest volume (ie, the greatest absolute number) of 30-day hospital readmissions. Conditions with a high volume of readmissions were chosen in an effort to identify conditions in which readmission-prevention interventions had the greatest potential to reduce the absolute number of readmissions. We first categorized index hospitalizations for medical and procedure conditions by using the All Patient Refined Diagnosis Related Groups (APR-DRGs; 3M Health Information Systems, Wallingford, CT).27 APR-DRGs use all diagnosis and/or procedure ICD-9-CM codes registered for a hospital discharge to assign 1 reason that best explains the need for hospitalization. We then excluded obstetric hospitalizations, psychiatric hospitalizations, and hospitalizations resulting in death or transfer from being considered as index admissions. Afterwards, we ranked each APR-DRG index hospitalization by the total number of 30-day hospital readmissions that occurred afterward and selected the 10 medical and 10 procedure index admissions with the highest number of readmissions. The APR-DRG index admissions are listed in Figures 1 and 2. For the APR-DRG “digestive system diagnoses,” the most common diagnosis was constipation, and we refer to that category as “constipation.” The most common diagnosis for the APR-DRG called “other operating room procedure for neoplasm” was tumor biopsy, and we refer to that category as “tumor biopsy.”
Main Outcome Measure
The primary study outcome was unplanned, all-cause readmission to any hospital within 30 days of index hospitalization. All-cause readmissions include any hospitalization for the same or different condition as the index admission, including conditions not eligible to be considered as index admissions (obstetric, psychiatric, and hospitalizations resulting in death or transfer). Planned readmissions, identified by using pediatric-specific measure specifications endorsed by AHRQ and the National Quality Forum,28 were excluded from measurement. For index admissions with multiple 30-day readmissions, only the first readmission was counted. Each readmission was treated as an index admission.
Main Independent Variable
The main independent variable was the presence of an MHC documented during the index hospitalization. MHCs were identified and classified into diagnosis categories derived from the AHRQ Chronic Condition Indicator system by using ICD-9-CM codes.29 MHC categories included anxiety disorders, attention-deficit/hyperactivity disorder (ADHD), autism, depression, and substance abuse. Less common MHCs included bipolar disorder, schizophrenia, disruptive behavior disorders, somatoform disorders, and eating disorders. These conditions are included in the group with any MHC, but we did not calculate the adjusted odds ratios (AORs) of readmission for these conditions. Children were identified as having multiple MHCs if they had more than 1 MHC.
Other Characteristics of Index Hospitalizations
A priori, we selected for analysis the known demographic, clinical, and hospital factors associated with the risk of readmission.20-24 The demographic characteristics included patient age, gender, payer category, urban or rural residence, and the median income quartile for a patient’s ZIP code. The hospital characteristics included location, ownership, and teaching hospital designation. The clinical characteristics included the number of chronic conditions30 and indicators for the presence of a complex chronic condition in each of 12 organ systems.31
Statistical Analysis
We calculated descriptive summary statistics for the characteristics of index hospitalizations. We compared characteristics in index admissions of children with versus without MHC by using Wilcoxon Rank-Sum tests for continuous variables and Wald χ2 tests for categorical variables. In the multivariable analysis, we derived logistic regression models to assess the relationship of 30-day hospital readmission with each type of MHC, adjusting for index admission demographic, hospital, and clinical characteristics. MHCs were modeled as binary indicator variables with the presence of any MHC, more than 1 MHC, or each of 5 MHC categories (anxiety disorders, ADHD, autism, depression, substance abuse) compared with no MHC. Four types of logistic regression models were derived (1) for the combined sample of all 10 index medical admissions with each MHC category versus no MHC as a primary predictor, (2) for each medical index admission with any MHC versus no MHC as the primary predictor, (3) for the combined sample of all 10 index procedure admissions with each MHC category versus no MHC as a primary predictor, and (4) for each procedure index admission with any MHC versus no MHC as the primary predictor. All analyses were weighted to achieve national estimates and clustered by hospital by using AHRQ-recommended survey procedures. SAS version 9.4 (SAS Institute, Cary, NC) was used for all analyses. All tests were two-sided, and a P < .05 was
considered statistically significant.
RESULTS
Study Population
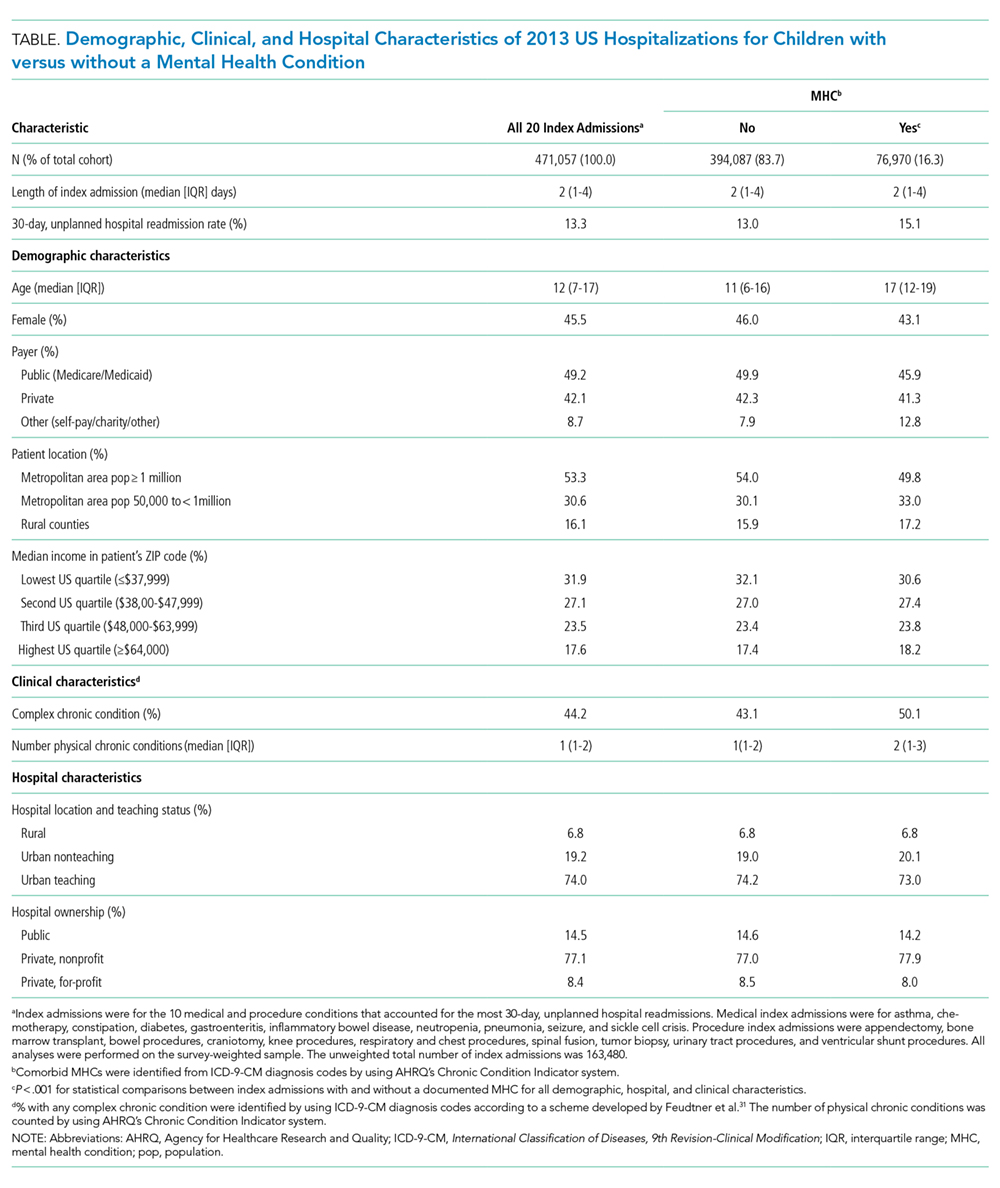
Across all index admissions, 16.3% were for children with an MHC. Overall, children with MHCs were older and more likely to have a chronic30 or complex chronic31 physical health condition than children with no MHCs (Table).
Index Medical Admissions, Mental Health Conditions, and Hospital Readmission
The 10 index medical hospitalizations with the most readmissions for children ages 3 to 20 years were asthma, chemotherapy, constipation, diabetes, gastroenteritis, inflammatory bowel disease, neutropenia, pneumonia, seizure, and sickle cell crisis. Across all index medical hospitalizations, 17.5% were for patients with an MHC (Figure 1). Of index medical admissions with any MHC, 26.3% had ADHD, 22.9% had an anxiety disorder, 14.9% had autism, 18.3% had depression, and 30.9% had substance abuse. Among all admissions with MHCs, 28.9% had 2 or more MHCs.
Index Medical Admissions Combined
For all index medical hospitalizations combined, 17.0% (n = 59,138) had an unplanned, 30-day hospital readmission. The rate of 30-day hospital readmissions was higher with versus without an MHC (17.5 vs 16.8%; P < .001). In a multivariable analysis, presence of an MHC was associated with a higher likelihood of hospital readmission following an index medical admission (AOR, 1.23; 95% confidence interval [CI], 1.19-1.26); Figure 1). All MHCs except autism and ADHD had a higher likelihood of readmission (Figure 3).
Specific Index Medical Admissions
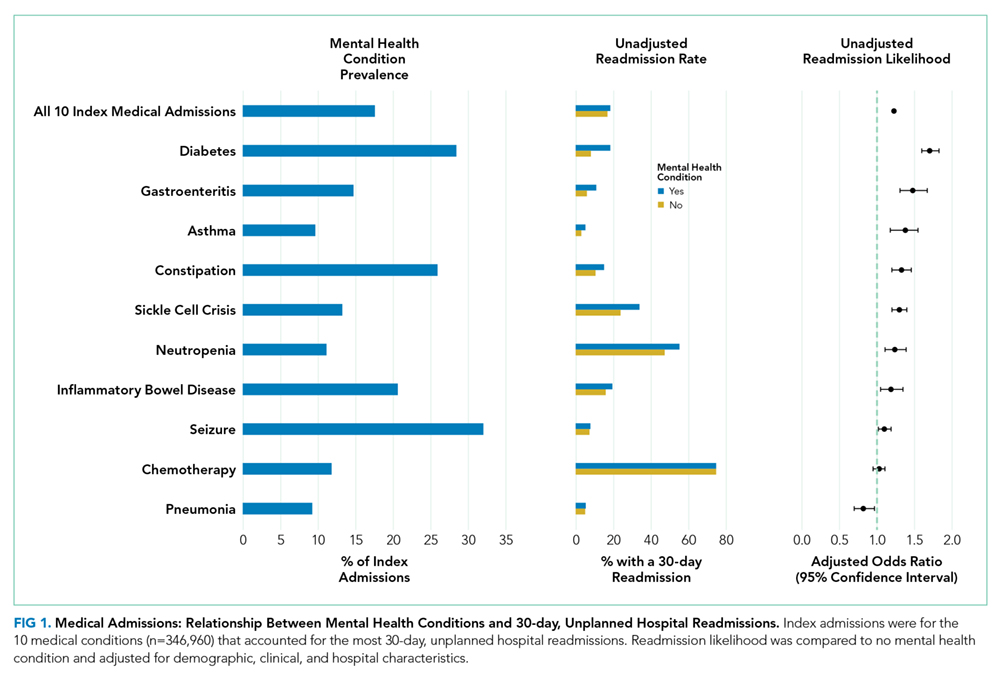
Index Procedure Admissions, Mental Health Conditions, and Hospital Readmission
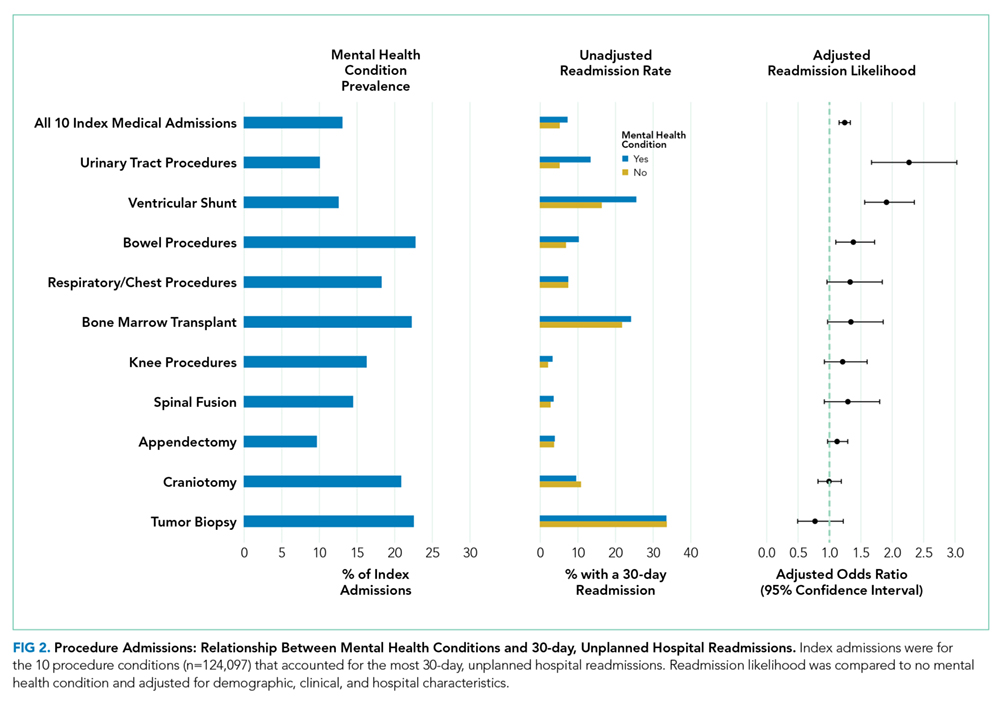
Index Procedure Admissions Combined

Specific Index Procedure Admissions
For specific index procedure admissions, the rate of 30-day hospital readmission ranged from 2.2% for knee procedures to 33.6% for tumor biopsy. For 3 (ie, urinary tract, ventricular shunt, and bowel procedures) of the 10 specific index procedure hospitalizations, having an MHC was associated with higher adjusted odds of 30-day readmission (AOR range, 1.38-2.27; Figure 2).
In total, adjusting for sociodemographic, clinical, and hospital characteristics, MHCs were associated with an additional 2501 medical readmissions and 217 procedure readmissions beyond what would have been expected if MHCs were not associated with readmissions.
DISCUSSION
MHCs are common among pediatric hospitalizations with the highest volume of readmissions; MHCs were present in approximately 1 in 5 medical and 1 in 7 procedure index hospitalizations. Across medical and procedure admissions, the adjusted likelihood of unplanned, all-cause 30-day readmission was 25% higher for children with versus without an MHC. The readmission likelihood varied by the type of medical or procedure admission and by the type of MHC. MHCs had the strongest associations with readmissions following hospitalization for diabetes and urinary tract procedures. The MHC categories associated with the highest readmission likelihood were depression, substance abuse, and multiple MHCs.
The current study complements existing literature by helping establish MHCs as a prevalent and important risk factor for hospital readmission in children. Estimates of the prevalence of MHCs in hospitalized children are between 10% and 25%,10,11,32 and prevalence has increased by as much as 160% over the last 10 years.29 Prior investigations have found that children with an MHC tend to stay longer in the hospital compared with children with no MHC.32 Results from the present study suggest that children with MHCs also experience more inpatient days because of rehospitalizations. Subsequent investigations should strive to understand the mechanisms in the hospital, community, and family environment that are responsible for the increased inpatient utilization in children with MHCs. Understanding how the receipt of mental health services before, during, and after hospitalization influences readmissions could help identify opportunities for practice improvement. Families report the need for better coordination of their child’s medical and mental health care,33 and opportunities exist to improve attendance at mental health visits after acute care encounters.34 Among adults, interventions that address posthospital access to mental healthcare have prevented readmissions.35
Depression was associated with an increased risk of readmission in medical and procedure hospitalizations. As a well-known risk factor for readmission in adult patients,21 depression can adversely affect and exacerbate the physical health recovery of patients experiencing acute and chronic illnesses.14,36,37 Depression is considered a modifiable contributor that, when controlled, may help lower readmission risk. Optimal adherence with behavior and medication treatment for depression is associated with a lower risk of unplanned 30-day readmissions.14-16,19 Emerging evidence demonstrates how multifaceted, psychosocial approaches can improve patients’ adherence with depression treatment plans.38 Increased attention to depression in hospitalized children may uncover new ways to manage symptoms as children transition from hospital to home.
Other MHCs were associated with a different risk of readmission among medical and procedure hospitalizations. For example, ADHD or autism documented during index hospitalization was associated with an increased risk of readmission following procedure hospitalizations and a decreased risk following medical hospitalizations. Perhaps children with ADHD or autism who exhibit hyperactive, impulsive, or repetitive behaviors39,40 are at risk for disrupting their postprocedure wound healing, nutrition recovery, or pain tolerance, which might contribute to increased readmission risk.
MHCs were associated with different readmission risks across specific types of medical or procedure hospitalizations. For example, among medical conditions, the association of readmissions with MHCs was highest for diabetes, which is consistent with prior research.26 Factors that might mediate this relationship include changes in diet and appetite, difficulty with diabetes care plan adherence, and intentional nonadherence as a form of self-harm. Similarly, a higher risk of readmission in chronic medical conditions like asthma, constipation, and sickle cell disease might be mediated by difficulty adhering to medical plans or managing exacerbations at home. In contrast, MHCs had no association with readmission following chemotherapy. In our clinical experience, readmissions following chemotherapy are driven by physiologic problems, such as thrombocytopenia, fever, and/or neutropenia. MHCs might have limited influence over those health issues. For procedure hospitalizations, MHCs had 1 of the strongest associations with ventricular shunt procedures. We hypothesize that MHCs might lead some children to experience general health symptoms that might be associated with shunt malfunction (eg, fatigue, headache, behavior change), which could lead to an increased risk of readmission to evaluate for shunt malfunction. Conversely, we found no relationship between MHCs and readmissions following appendectomy. For appendectomy, MHCs might have limited influence over the development of postsurgical complications (eg, wound infection or ileus). Future research to better elucidate mediators of increased risk of readmission associated with MHCs in certain medical and procedure conditions could help explain these relationships and identify possible future intervention targets to prevent readmissions.
This study has several limitations. The administrative data are not positioned to discover the mechanisms by which MHCs are associated with a higher likelihood of readmission. We used hospital ICD-9-CM codes to identify patients with MHCs. Other methods using more clinically rich data (eg, chart review, prescription medications, etc.) may be preferable to identify patients with MHCs. Although the use of ICD-9-CM codes may have sufficient specificity, some hospitalized children may have an MHC that is not coded. Patients identified by using diagnosis codes could represent patients with a higher severity of illness, patients using medications, or patients whose outpatient records are accessible to make the hospital team aware of the MHC. If documentation of MHCs during hospitalization represents a higher severity of illness, findings may not extrapolate to lower-severity MHCs. As hospitals transition from ICD-9 -CM to ICD-10 coding, and health systems develop more integrated inpatient and outpatient EHRs, diagnostic specificity may improve. We could not analyze the relationships with several potential confounders and explanatory variables that may be related both to the likelihood of having an MHC and the risk of readmission, including medication administration, psychiatric consultation, and parent mental health. Postdischarge health services, including access to a medical home or a usual source of mental healthcare and measures of medication adherence, were not available in the NRD.
Despite these limitations, the current study underscores the importance of MHCs in hospitalized children upon discharge. As subsequent investigations uncover the key drivers explaining the influence of MHCs on hospital readmission risk, hospitals and their local outpatient and community practices may find it useful to consider MHCs when (1) developing contingency plans and establishing follow-up care at discharge,41 (2) exploring opportunities of care integration between mental and physical health care professionals, and (3) devising strategies to reduce hospital readmissions among populations of children.
CONCLUSIONS
MHCs are prevalent in hospitalized children and are associated with an increased risk of 30-day, unplanned hospital readmission. Future readmission prevention efforts may uncover new ways to improve children’s transitions from hospital to home by investigating strategies to address their MHCs.
Acknowledgments
The authors thank Donjo Lau and Troy Richardson for their assistance with the analysis.
Disclosures
Dr. Doupnik was supported by a Ruth L. Kirschstein National Research Service Award institutional training grant (T32-HP010026), funded by the National Institutes of Health. Dr. Zima was supported by the Behavioral Health Centers of Excellence for California (SB852). Dr. Bardach was supported by the National Institute of Child Health and Human Development (K23-HD065836). Dr. Berry was supported by the Agency for Healthcare Research and Quality (R21 HS023092-01). The authors have no financial relationships relevant to this article to disclose. The authors have no potential conflicts of interest to disclose. Dr. Doupnik led the study design and analysis and drafted the initial manuscript. Mr. Lawlor performed the data analysis. Dr. Hall provided statistical consultation. All authors participated in the design of the study, interpretation of the data, revised the manuscript for key intellectual content, and all authors read and approved the final manuscript.
1. Dougherty D, Schiff J, Mangione-Smith R. The Children’s Health Insurance Program Reauthorization Act quality measures initiatives: moving forward to improve measurement, care, and child and adolescent outcomes. Acad Pediatr. 2011;11(3):S1-S10. PubMed
2. Bardach NS, Vittinghoff E, Asteria-Penaloza R, et al. Measuring Hospital Quality Using Pediatric Readmission and Revisit Rates. Pediatrics. 2013;132(3):429-436. doi:10.1542/peds.2012-3527. PubMed
3. Khan A, Nakamura MM, Zaslavsky AM, et al. Same-Hospital Readmission Rates as a Measure of Pediatric Quality of Care. JAMA Pediatr. 2015;169(10):905-912. doi:10.1001/jamapediatrics.2015.1129. PubMed
4. Fassl BA, Nkoy FL, Stone BL, et al. The Joint Commission Children’s Asthma Care quality measures and asthma readmissions. Pediatrics. 2012;130(3):482-491. doi:10.1542/peds.2011-3318. PubMed
5. Hain PD, Gay JC, Berutti TW, Whitney GM, Wang W, Saville BR. Preventability of Early Readmissions at a Children’s Hospital. Pediatrics. 2013;131(1):e171-e181. doi:10.1542/peds.2012-0820. PubMed
6. Nagasako E, Reidhead B, Waterman B, et al. Adding Socioeconomic Data to Hospital Readmissions Calculations May Produce More Useful Results. Health Aff. 2014;33(5):786-791. PubMed
7. Hu J, Gonsahn MD, Nerenz DR. Socioeconomic Status and Readmissions: Evidence from an Urban Teaching Hospital. Health Aff. 2014;33(5):778-785. doi:10.1377/hlthaff.2013.0816. PubMed
8. Sills MR, Hall M, Colvin JD, et al. Association of Social Determinants with Children’s Hospitals’ Preventable Readmissions Performance. JAMA Pediatr. 2016;170(4):350-358. doi:10.1001/jamapediatrics.2015.4440. PubMed
9. Eselius LL, Cleary PD, Zaslavsky AM, Huskamp HA, Busch SH. Case-Mix Adjustment of Consumer Reports about Managed Behavioral Health Care and Health Plans. Health Serv Res. 2008;43(6):2014-2032. doi:10.1111/j.1475-6773.2008.00894.x. PubMed
10. Doupnik SK, Henry MK, Bae H, et al. Mental Health Conditions and Symptoms in Pediatric Hospitalizations: A Single-Center Point Prevalence Study. Acad Pediatr. 2017;17(2):184-190. PubMed
11. Bardach NS, Coker TR, Zima BT, et al. Common and Costly Hospitalizations for Pediatric Mental Health Disorders. Pediatrics. 2014;133(4):602-609. doi:10.1542/peds.2013-3165. PubMed
12. Doupnik SK, Mitra N, Feudtner C, Marcus SC. The Influence of Comorbid Mood and Anxiety Disorders on Outcomes of Pediatric Patients Hospitalized for Pneumonia. Hosp Pediatr. 2016;6(3):135-142. doi:10.1542/hpeds.2015-0177. PubMed
13. Snell C, Fernandes S, Bujoreanu IS, Garcia G. Depression, illness severity, and healthcare utilization in cystic fibrosis. Pediatr Pulmonol. 2014;49(12):1177-1181. doi:10.1002/ppul.22990. PubMed
14. DiMatteo MR, Lepper HS, Croghan TW. Depression Is a Risk Factor for Noncompliance with Medical Treatment: Meta-analysis of the Effects of Anxiety and Depression on Patient Adherence. Arch Intern Med . 2000;160(14):2101-2107. doi:10.1001/archinte.160.14.2101. PubMed
15. Gray WN, Denson LA, Baldassano RN, Hommel KA. Treatment Adherence in Adolescents with Inflammatory Bowel Disease: The Collective Impact of Barriers to Adherence and Anxiety/Depressive Symptoms. J Pediatr Psychol. 2012;37(3):282-291. doi:10.1093/jpepsy/jsr092. PubMed
16. Mosnaim G, Li H, Martin M, et al. Factors associated with levels of adherence to inhaled corticosteroids in minority adolescents with asthma. Ann Allergy Asthma Immunol. 2014;112(2):116-120. doi:10.1016/j.anai.2013.11.021. PubMed
17. Compas BE, Jaser SS, Dunn MJ, Rodriguez EM. Coping with Chronic Illness in Childhood and Adolescence. Ann Rev Clin Psychol. 2012;8(1):455-480. doi:10.1146/annurev-clinpsy-032511-143108. PubMed
18. Graue M, Wentzel-Larsen T, Bru E, Hanestad BR, Søvik O. The coping styles of adolescents with type 1 diabetes are associated with degree of metabolic control. Diabetes Care. 2004;27(6):1313-1317. PubMed
19. Jaser SS, White LE. Coping and resilience in adolescents with type 1 diabetes. Child Care Health Dev. 2011;37(3):335-342. doi:10.1111/j.1365-2214.2010.01184.x. PubMed
20. Cancino RS, Culpepper L, Sadikova E, Martin J, Jack BW, Mitchell SE. Dose-response relationship between depressive symptoms and hospital readmission. J Hosp Med. 2014;9(6):358-364. doi:10.1002/jhm.2180. PubMed
21. Pederson JL, Warkentin LM, Majumdar SR, McAlister FA. Depressive symptoms are associated with higher rates of readmission or mortality after medical hospitalization: A systematic review and meta-analysis. J Hosp Med. 2016;11(5):373-380. doi:10.1002/jhm.2547. PubMed
22. Chwastiak LA, Davydow DS, McKibbin CL, et al. The Effect of Serious Mental Illness on the Risk of Rehospitalization Among Patients with Diabetes. Psychosomatics. 2014;55(2):134-143. PubMed
23. Daratha KB, Barbosa-Leiker C, H Burley M, et al. Co-occurring mood disorders among hospitalized patients and risk for subsequent medical hospitalization. Gen Hosp Psychiatry. 2012;34(5):500-505. doi:10.1016/j.genhosppsych.2012.05.001. PubMed
24. Kartha A, Anthony D, Manasseh CS, et al. Depression is a risk factor for rehospitalization in medical inpatients. Prim Care Companion J Clin Psychiatry. 2007;9(4):256-262. PubMed
25. Myrvik MP, Burks LM, Hoffman RG, Dasgupta M, Panepinto JA. Mental health disorders influence admission rates for pain in children with sickle cell disease. Pediatr Blood Cancer. 2013;60(7):1211-1214. doi:10.1002/pbc.24394. PubMed
26. Garrison MM, Katon WJ, Richardson LP. The impact of psychiatric comorbidities on readmissions for diabetes in youth. Diabetes Care. 2005;28(9):2150-2154. PubMed
27. Averill R, Goldfield N, Hughes JS, et al. All Patient Refined Diagnosis Related Groups (APR-DRGs) Version 20.0: Methodology Overview. https://www.hcup-us.ahrq.gov/db/nation/nis/APR-DRGsV20MethodologyOverviewandBibliography.pdf. Accessed on November 2, 2016.
28. Berry JG, Toomey SL, Zaslavsky AM, et al. Pediatric readmission prevalence and variability across hospitals. JAMA. 2013;309(4):372-380. PubMed
29. Zima BT, Rodean J, Hall M, Bardach NS, Coker TR, Berry JG. Psychiatric Disorders and Trends in Resource Use in Pediatric Hospitals. Pediatrics. 2016;138(5):e20160909-e20160909. doi:10.1542/peds.2016-0909. PubMed
30. Chronic Condition Indicator (CCI) for ICD-9-CM. Healthcare Cost and Utilization Project (HCUP) Tools & Software Page. http://www.hcup-us.ahrq.gov/toolssoftware/chronic/chronic.jsp. Accessed on October 30, 2015.
31. Feudtner C, Feinstein J, Zhong W, Hall M, Dai D. Pediatric complex chronic conditions classification system version 2: updated for ICD-10 and complex medical technology dependence and transplantation. BMC Pediatr. 2014;14(1):199-205. PubMed
32. Doupnik S, Lawlor J, Zima BT, et al. Mental Health Conditions and Medical and Surgical Hospital Utilization. Pediatrics. 2016;138(6):e20162416. doi:10.1542/peds.2016-2416. PubMed
33. Brown NM, Green JC, Desai MM, Weitzman CC, Rosenthal MS. Need and Unmet Need for Care Coordination Among Children with Mental Health Conditions. Pediatrics. 2014;133(3):e530-e537. doi:10.1542/peds.2013-2590. PubMed
34. Sobolewski B, Richey L, Kowatch RA, Grupp-Phelan J. Mental health follow-up among adolescents with suicidal behaviors after emergency department discharge. Arch Suicide Res. 2013;17(4):323-334. doi:10.1080/13811118.2013.801807. PubMed
35. Hansen LO, Greenwald JL, Budnitz T, et al. Project BOOST: Effectiveness of a multihospital effort to reduce rehospitalization. J Hosp Med. 2013;8(8):421-427. doi:10.1002/jhm.2054. PubMed
36. Di Marco F, Verga M, Santus P, et al. Close correlation between anxiety, depression, and asthma control. Respir Med. 2010;104(1):22-28. doi:10.1016/j.rmed.2009.08.005. PubMed
37. Ghose SS, Williams LS, Swindle RW. Depression and other mental health diagnoses after stroke increase inpatient and outpatient medical utilization three years poststroke. Med Care. 2005;43(12):1259-1264. PubMed
38. Szigethy E, Bujoreanu SI, Youk AO, et al. Randomized efficacy trial of two psychotherapies for depression in youth with inflammatory bowel disease. J Am Acad Child Adolesc Psychiatry. 2014;53(7):726-735. PubMed
39. Swensen A, Birnbaum HG, Ben Hamadi R, Greenberg P, Cremieux PY, Secnik K. Incidence and costs of accidents among attention-deficit/hyperactivity disorder patients. J Adolesc Health. 2004;35(4):346.e1-346.e9. doi:10.1016/j.jadohealth.2003.12.003. PubMed
40. Chan E, Zhan C, Homer CJ. Health Care Use and Costs for Children with Attention-Deficit/Hyperactivity Disorder: National Estimates from the Medical Expenditure Panel Survey. Arch Pediatr Adolesc Med. 2002;156(5):504-511. doi:10.1001/archpedi.156.5.504. PubMed
41. Berry JG, Blaine K, Rogers J, et al. A Framework of Pediatric Hospital Discharge Care Informed by Legislation, Research, and Practice. JAMA Pediatr. 2014;168(10):955-962. doi:10.1001/jamapediatrics.2014.891. PubMed
Readmission prevention is a focus of national efforts to improve the quality of hospital care for children.1-5 Several factors contribute to the risk of readmission for hospitalized children, including age, race or ethnicity, payer, and the type and number of comorbid health conditions.6-9 Mental health conditions (MHCs) are a prevalent comorbidity in children hospitalized for physical health reasons that could influence their postdischarge health and safety.
MHCs are increasingly common in children hospitalized for physical health indications; a comorbid MHC is currently present in 10% to 25% of hospitalized children ages 3 years and older.10,11 Hospital length of stay (LOS) and cost are higher in children with an MHC.12,13 Increased resource use may occur because MHCs can impede hospital treatment effectiveness and the child’s recovery from physical illness. MHCs are associated with a lower adherence with medications14-16 and a lower ability to cope with health events and problems.17-19 In adults, MHCs are a well-established risk factor for hospital readmission for a variety of physical health conditions.20-24 Although the influence of MHCs on readmissions in children has not been extensively investigated, higher readmission rates have been reported in adolescents hospitalized for diabetes with an MHC compared with those with no MHC.25,26
To our knowledge, no large studies have examined the relationship between the presence of a comorbid MHC and hospital readmissions in children or adolescents hospitalized for a broad array of medical or procedure conditions. Therefore, we conducted this study to (1) assess the likelihood of 30-day hospital readmission in children with versus without MHC who were hospitalized for one of 10 medical or 10 procedure conditions, and (2) to assess which MHCs are associated with the highest likelihood of hospital readmission.
METHODS
Study Design and Setting
We conducted a national, retrospective cohort study of index hospitalizations for children ages 3 to 21 years who were discharged from January 1, 2013, to November 30, 2013, in the Agency for Healthcare Research and Quality’s (AHRQ) Nationwide Readmissions Database (NRD). Admissions occurring in December 2013 were excluded because they did not have a 30-day timeframe available for readmission measurement. The 2013 NRD includes administrative data for a nationally representative sample of 14 million hospitalizations in 21 states, accounting for 49% of all US hospitalizations and weighted to represent 35.6 million hospitalizations. The database includes deidentified, verified patient linkage numbers so that patients can be tracked across multiple hospitalizations at the same institution or different institutions within a state. The NRD includes hospital information, patient demographic information, and the International Classification of Diseases, 9th Revision-Clinical Modification (ICD-9-CM) discharge diagnoses and procedures, with 1 primary diagnosis and up to 24 additional fields for comorbid diagnoses. This study was approved for exemption by the Children’s Hospital of Philadelphia Institutional Review Board.
Index Admissions
We used the methods described below to create a study cohort of the 10 medical and 10 procedure index admissions associated with the highest volume (ie, the greatest absolute number) of 30-day hospital readmissions. Conditions with a high volume of readmissions were chosen in an effort to identify conditions in which readmission-prevention interventions had the greatest potential to reduce the absolute number of readmissions. We first categorized index hospitalizations for medical and procedure conditions by using the All Patient Refined Diagnosis Related Groups (APR-DRGs; 3M Health Information Systems, Wallingford, CT).27 APR-DRGs use all diagnosis and/or procedure ICD-9-CM codes registered for a hospital discharge to assign 1 reason that best explains the need for hospitalization. We then excluded obstetric hospitalizations, psychiatric hospitalizations, and hospitalizations resulting in death or transfer from being considered as index admissions. Afterwards, we ranked each APR-DRG index hospitalization by the total number of 30-day hospital readmissions that occurred afterward and selected the 10 medical and 10 procedure index admissions with the highest number of readmissions. The APR-DRG index admissions are listed in Figures 1 and 2. For the APR-DRG “digestive system diagnoses,” the most common diagnosis was constipation, and we refer to that category as “constipation.” The most common diagnosis for the APR-DRG called “other operating room procedure for neoplasm” was tumor biopsy, and we refer to that category as “tumor biopsy.”
Main Outcome Measure
The primary study outcome was unplanned, all-cause readmission to any hospital within 30 days of index hospitalization. All-cause readmissions include any hospitalization for the same or different condition as the index admission, including conditions not eligible to be considered as index admissions (obstetric, psychiatric, and hospitalizations resulting in death or transfer). Planned readmissions, identified by using pediatric-specific measure specifications endorsed by AHRQ and the National Quality Forum,28 were excluded from measurement. For index admissions with multiple 30-day readmissions, only the first readmission was counted. Each readmission was treated as an index admission.
Main Independent Variable
The main independent variable was the presence of an MHC documented during the index hospitalization. MHCs were identified and classified into diagnosis categories derived from the AHRQ Chronic Condition Indicator system by using ICD-9-CM codes.29 MHC categories included anxiety disorders, attention-deficit/hyperactivity disorder (ADHD), autism, depression, and substance abuse. Less common MHCs included bipolar disorder, schizophrenia, disruptive behavior disorders, somatoform disorders, and eating disorders. These conditions are included in the group with any MHC, but we did not calculate the adjusted odds ratios (AORs) of readmission for these conditions. Children were identified as having multiple MHCs if they had more than 1 MHC.
Other Characteristics of Index Hospitalizations
A priori, we selected for analysis the known demographic, clinical, and hospital factors associated with the risk of readmission.20-24 The demographic characteristics included patient age, gender, payer category, urban or rural residence, and the median income quartile for a patient’s ZIP code. The hospital characteristics included location, ownership, and teaching hospital designation. The clinical characteristics included the number of chronic conditions30 and indicators for the presence of a complex chronic condition in each of 12 organ systems.31
Statistical Analysis
We calculated descriptive summary statistics for the characteristics of index hospitalizations. We compared characteristics in index admissions of children with versus without MHC by using Wilcoxon Rank-Sum tests for continuous variables and Wald χ2 tests for categorical variables. In the multivariable analysis, we derived logistic regression models to assess the relationship of 30-day hospital readmission with each type of MHC, adjusting for index admission demographic, hospital, and clinical characteristics. MHCs were modeled as binary indicator variables with the presence of any MHC, more than 1 MHC, or each of 5 MHC categories (anxiety disorders, ADHD, autism, depression, substance abuse) compared with no MHC. Four types of logistic regression models were derived (1) for the combined sample of all 10 index medical admissions with each MHC category versus no MHC as a primary predictor, (2) for each medical index admission with any MHC versus no MHC as the primary predictor, (3) for the combined sample of all 10 index procedure admissions with each MHC category versus no MHC as a primary predictor, and (4) for each procedure index admission with any MHC versus no MHC as the primary predictor. All analyses were weighted to achieve national estimates and clustered by hospital by using AHRQ-recommended survey procedures. SAS version 9.4 (SAS Institute, Cary, NC) was used for all analyses. All tests were two-sided, and a P < .05 was
considered statistically significant.
RESULTS
Study Population
Across all index admissions, 16.3% were for children with an MHC. Overall, children with MHCs were older and more likely to have a chronic30 or complex chronic31 physical health condition than children with no MHCs (Table).
Index Medical Admissions, Mental Health Conditions, and Hospital Readmission
The 10 index medical hospitalizations with the most readmissions for children ages 3 to 20 years were asthma, chemotherapy, constipation, diabetes, gastroenteritis, inflammatory bowel disease, neutropenia, pneumonia, seizure, and sickle cell crisis. Across all index medical hospitalizations, 17.5% were for patients with an MHC (Figure 1). Of index medical admissions with any MHC, 26.3% had ADHD, 22.9% had an anxiety disorder, 14.9% had autism, 18.3% had depression, and 30.9% had substance abuse. Among all admissions with MHCs, 28.9% had 2 or more MHCs.
Index Medical Admissions Combined
For all index medical hospitalizations combined, 17.0% (n = 59,138) had an unplanned, 30-day hospital readmission. The rate of 30-day hospital readmissions was higher with versus without an MHC (17.5 vs 16.8%; P < .001). In a multivariable analysis, presence of an MHC was associated with a higher likelihood of hospital readmission following an index medical admission (AOR, 1.23; 95% confidence interval [CI], 1.19-1.26); Figure 1). All MHCs except autism and ADHD had a higher likelihood of readmission (Figure 3).
Specific Index Medical Admissions
Index Procedure Admissions, Mental Health Conditions, and Hospital Readmission
Index Procedure Admissions Combined
Specific Index Procedure Admissions
For specific index procedure admissions, the rate of 30-day hospital readmission ranged from 2.2% for knee procedures to 33.6% for tumor biopsy. For 3 (ie, urinary tract, ventricular shunt, and bowel procedures) of the 10 specific index procedure hospitalizations, having an MHC was associated with higher adjusted odds of 30-day readmission (AOR range, 1.38-2.27; Figure 2).
In total, adjusting for sociodemographic, clinical, and hospital characteristics, MHCs were associated with an additional 2501 medical readmissions and 217 procedure readmissions beyond what would have been expected if MHCs were not associated with readmissions.
DISCUSSION
MHCs are common among pediatric hospitalizations with the highest volume of readmissions; MHCs were present in approximately 1 in 5 medical and 1 in 7 procedure index hospitalizations. Across medical and procedure admissions, the adjusted likelihood of unplanned, all-cause 30-day readmission was 25% higher for children with versus without an MHC. The readmission likelihood varied by the type of medical or procedure admission and by the type of MHC. MHCs had the strongest associations with readmissions following hospitalization for diabetes and urinary tract procedures. The MHC categories associated with the highest readmission likelihood were depression, substance abuse, and multiple MHCs.
The current study complements existing literature by helping establish MHCs as a prevalent and important risk factor for hospital readmission in children. Estimates of the prevalence of MHCs in hospitalized children are between 10% and 25%,10,11,32 and prevalence has increased by as much as 160% over the last 10 years.29 Prior investigations have found that children with an MHC tend to stay longer in the hospital compared with children with no MHC.32 Results from the present study suggest that children with MHCs also experience more inpatient days because of rehospitalizations. Subsequent investigations should strive to understand the mechanisms in the hospital, community, and family environment that are responsible for the increased inpatient utilization in children with MHCs. Understanding how the receipt of mental health services before, during, and after hospitalization influences readmissions could help identify opportunities for practice improvement. Families report the need for better coordination of their child’s medical and mental health care,33 and opportunities exist to improve attendance at mental health visits after acute care encounters.34 Among adults, interventions that address posthospital access to mental healthcare have prevented readmissions.35
Depression was associated with an increased risk of readmission in medical and procedure hospitalizations. As a well-known risk factor for readmission in adult patients,21 depression can adversely affect and exacerbate the physical health recovery of patients experiencing acute and chronic illnesses.14,36,37 Depression is considered a modifiable contributor that, when controlled, may help lower readmission risk. Optimal adherence with behavior and medication treatment for depression is associated with a lower risk of unplanned 30-day readmissions.14-16,19 Emerging evidence demonstrates how multifaceted, psychosocial approaches can improve patients’ adherence with depression treatment plans.38 Increased attention to depression in hospitalized children may uncover new ways to manage symptoms as children transition from hospital to home.
Other MHCs were associated with a different risk of readmission among medical and procedure hospitalizations. For example, ADHD or autism documented during index hospitalization was associated with an increased risk of readmission following procedure hospitalizations and a decreased risk following medical hospitalizations. Perhaps children with ADHD or autism who exhibit hyperactive, impulsive, or repetitive behaviors39,40 are at risk for disrupting their postprocedure wound healing, nutrition recovery, or pain tolerance, which might contribute to increased readmission risk.
MHCs were associated with different readmission risks across specific types of medical or procedure hospitalizations. For example, among medical conditions, the association of readmissions with MHCs was highest for diabetes, which is consistent with prior research.26 Factors that might mediate this relationship include changes in diet and appetite, difficulty with diabetes care plan adherence, and intentional nonadherence as a form of self-harm. Similarly, a higher risk of readmission in chronic medical conditions like asthma, constipation, and sickle cell disease might be mediated by difficulty adhering to medical plans or managing exacerbations at home. In contrast, MHCs had no association with readmission following chemotherapy. In our clinical experience, readmissions following chemotherapy are driven by physiologic problems, such as thrombocytopenia, fever, and/or neutropenia. MHCs might have limited influence over those health issues. For procedure hospitalizations, MHCs had 1 of the strongest associations with ventricular shunt procedures. We hypothesize that MHCs might lead some children to experience general health symptoms that might be associated with shunt malfunction (eg, fatigue, headache, behavior change), which could lead to an increased risk of readmission to evaluate for shunt malfunction. Conversely, we found no relationship between MHCs and readmissions following appendectomy. For appendectomy, MHCs might have limited influence over the development of postsurgical complications (eg, wound infection or ileus). Future research to better elucidate mediators of increased risk of readmission associated with MHCs in certain medical and procedure conditions could help explain these relationships and identify possible future intervention targets to prevent readmissions.
This study has several limitations. The administrative data are not positioned to discover the mechanisms by which MHCs are associated with a higher likelihood of readmission. We used hospital ICD-9-CM codes to identify patients with MHCs. Other methods using more clinically rich data (eg, chart review, prescription medications, etc.) may be preferable to identify patients with MHCs. Although the use of ICD-9-CM codes may have sufficient specificity, some hospitalized children may have an MHC that is not coded. Patients identified by using diagnosis codes could represent patients with a higher severity of illness, patients using medications, or patients whose outpatient records are accessible to make the hospital team aware of the MHC. If documentation of MHCs during hospitalization represents a higher severity of illness, findings may not extrapolate to lower-severity MHCs. As hospitals transition from ICD-9 -CM to ICD-10 coding, and health systems develop more integrated inpatient and outpatient EHRs, diagnostic specificity may improve. We could not analyze the relationships with several potential confounders and explanatory variables that may be related both to the likelihood of having an MHC and the risk of readmission, including medication administration, psychiatric consultation, and parent mental health. Postdischarge health services, including access to a medical home or a usual source of mental healthcare and measures of medication adherence, were not available in the NRD.
Despite these limitations, the current study underscores the importance of MHCs in hospitalized children upon discharge. As subsequent investigations uncover the key drivers explaining the influence of MHCs on hospital readmission risk, hospitals and their local outpatient and community practices may find it useful to consider MHCs when (1) developing contingency plans and establishing follow-up care at discharge,41 (2) exploring opportunities of care integration between mental and physical health care professionals, and (3) devising strategies to reduce hospital readmissions among populations of children.
CONCLUSIONS
MHCs are prevalent in hospitalized children and are associated with an increased risk of 30-day, unplanned hospital readmission. Future readmission prevention efforts may uncover new ways to improve children’s transitions from hospital to home by investigating strategies to address their MHCs.
Acknowledgments
The authors thank Donjo Lau and Troy Richardson for their assistance with the analysis.
Disclosures
Dr. Doupnik was supported by a Ruth L. Kirschstein National Research Service Award institutional training grant (T32-HP010026), funded by the National Institutes of Health. Dr. Zima was supported by the Behavioral Health Centers of Excellence for California (SB852). Dr. Bardach was supported by the National Institute of Child Health and Human Development (K23-HD065836). Dr. Berry was supported by the Agency for Healthcare Research and Quality (R21 HS023092-01). The authors have no financial relationships relevant to this article to disclose. The authors have no potential conflicts of interest to disclose. Dr. Doupnik led the study design and analysis and drafted the initial manuscript. Mr. Lawlor performed the data analysis. Dr. Hall provided statistical consultation. All authors participated in the design of the study, interpretation of the data, revised the manuscript for key intellectual content, and all authors read and approved the final manuscript.
1. Dougherty D, Schiff J, Mangione-Smith R. The Children’s Health Insurance Program Reauthorization Act quality measures initiatives: moving forward to improve measurement, care, and child and adolescent outcomes. Acad Pediatr. 2011;11(3):S1-S10. PubMed
2. Bardach NS, Vittinghoff E, Asteria-Penaloza R, et al. Measuring Hospital Quality Using Pediatric Readmission and Revisit Rates. Pediatrics. 2013;132(3):429-436. doi:10.1542/peds.2012-3527. PubMed
3. Khan A, Nakamura MM, Zaslavsky AM, et al. Same-Hospital Readmission Rates as a Measure of Pediatric Quality of Care. JAMA Pediatr. 2015;169(10):905-912. doi:10.1001/jamapediatrics.2015.1129. PubMed
4. Fassl BA, Nkoy FL, Stone BL, et al. The Joint Commission Children’s Asthma Care quality measures and asthma readmissions. Pediatrics. 2012;130(3):482-491. doi:10.1542/peds.2011-3318. PubMed
5. Hain PD, Gay JC, Berutti TW, Whitney GM, Wang W, Saville BR. Preventability of Early Readmissions at a Children’s Hospital. Pediatrics. 2013;131(1):e171-e181. doi:10.1542/peds.2012-0820. PubMed
6. Nagasako E, Reidhead B, Waterman B, et al. Adding Socioeconomic Data to Hospital Readmissions Calculations May Produce More Useful Results. Health Aff. 2014;33(5):786-791. PubMed
7. Hu J, Gonsahn MD, Nerenz DR. Socioeconomic Status and Readmissions: Evidence from an Urban Teaching Hospital. Health Aff. 2014;33(5):778-785. doi:10.1377/hlthaff.2013.0816. PubMed
8. Sills MR, Hall M, Colvin JD, et al. Association of Social Determinants with Children’s Hospitals’ Preventable Readmissions Performance. JAMA Pediatr. 2016;170(4):350-358. doi:10.1001/jamapediatrics.2015.4440. PubMed
9. Eselius LL, Cleary PD, Zaslavsky AM, Huskamp HA, Busch SH. Case-Mix Adjustment of Consumer Reports about Managed Behavioral Health Care and Health Plans. Health Serv Res. 2008;43(6):2014-2032. doi:10.1111/j.1475-6773.2008.00894.x. PubMed
10. Doupnik SK, Henry MK, Bae H, et al. Mental Health Conditions and Symptoms in Pediatric Hospitalizations: A Single-Center Point Prevalence Study. Acad Pediatr. 2017;17(2):184-190. PubMed
11. Bardach NS, Coker TR, Zima BT, et al. Common and Costly Hospitalizations for Pediatric Mental Health Disorders. Pediatrics. 2014;133(4):602-609. doi:10.1542/peds.2013-3165. PubMed
12. Doupnik SK, Mitra N, Feudtner C, Marcus SC. The Influence of Comorbid Mood and Anxiety Disorders on Outcomes of Pediatric Patients Hospitalized for Pneumonia. Hosp Pediatr. 2016;6(3):135-142. doi:10.1542/hpeds.2015-0177. PubMed
13. Snell C, Fernandes S, Bujoreanu IS, Garcia G. Depression, illness severity, and healthcare utilization in cystic fibrosis. Pediatr Pulmonol. 2014;49(12):1177-1181. doi:10.1002/ppul.22990. PubMed
14. DiMatteo MR, Lepper HS, Croghan TW. Depression Is a Risk Factor for Noncompliance with Medical Treatment: Meta-analysis of the Effects of Anxiety and Depression on Patient Adherence. Arch Intern Med . 2000;160(14):2101-2107. doi:10.1001/archinte.160.14.2101. PubMed
15. Gray WN, Denson LA, Baldassano RN, Hommel KA. Treatment Adherence in Adolescents with Inflammatory Bowel Disease: The Collective Impact of Barriers to Adherence and Anxiety/Depressive Symptoms. J Pediatr Psychol. 2012;37(3):282-291. doi:10.1093/jpepsy/jsr092. PubMed
16. Mosnaim G, Li H, Martin M, et al. Factors associated with levels of adherence to inhaled corticosteroids in minority adolescents with asthma. Ann Allergy Asthma Immunol. 2014;112(2):116-120. doi:10.1016/j.anai.2013.11.021. PubMed
17. Compas BE, Jaser SS, Dunn MJ, Rodriguez EM. Coping with Chronic Illness in Childhood and Adolescence. Ann Rev Clin Psychol. 2012;8(1):455-480. doi:10.1146/annurev-clinpsy-032511-143108. PubMed
18. Graue M, Wentzel-Larsen T, Bru E, Hanestad BR, Søvik O. The coping styles of adolescents with type 1 diabetes are associated with degree of metabolic control. Diabetes Care. 2004;27(6):1313-1317. PubMed
19. Jaser SS, White LE. Coping and resilience in adolescents with type 1 diabetes. Child Care Health Dev. 2011;37(3):335-342. doi:10.1111/j.1365-2214.2010.01184.x. PubMed
20. Cancino RS, Culpepper L, Sadikova E, Martin J, Jack BW, Mitchell SE. Dose-response relationship between depressive symptoms and hospital readmission. J Hosp Med. 2014;9(6):358-364. doi:10.1002/jhm.2180. PubMed
21. Pederson JL, Warkentin LM, Majumdar SR, McAlister FA. Depressive symptoms are associated with higher rates of readmission or mortality after medical hospitalization: A systematic review and meta-analysis. J Hosp Med. 2016;11(5):373-380. doi:10.1002/jhm.2547. PubMed
22. Chwastiak LA, Davydow DS, McKibbin CL, et al. The Effect of Serious Mental Illness on the Risk of Rehospitalization Among Patients with Diabetes. Psychosomatics. 2014;55(2):134-143. PubMed
23. Daratha KB, Barbosa-Leiker C, H Burley M, et al. Co-occurring mood disorders among hospitalized patients and risk for subsequent medical hospitalization. Gen Hosp Psychiatry. 2012;34(5):500-505. doi:10.1016/j.genhosppsych.2012.05.001. PubMed
24. Kartha A, Anthony D, Manasseh CS, et al. Depression is a risk factor for rehospitalization in medical inpatients. Prim Care Companion J Clin Psychiatry. 2007;9(4):256-262. PubMed
25. Myrvik MP, Burks LM, Hoffman RG, Dasgupta M, Panepinto JA. Mental health disorders influence admission rates for pain in children with sickle cell disease. Pediatr Blood Cancer. 2013;60(7):1211-1214. doi:10.1002/pbc.24394. PubMed
26. Garrison MM, Katon WJ, Richardson LP. The impact of psychiatric comorbidities on readmissions for diabetes in youth. Diabetes Care. 2005;28(9):2150-2154. PubMed
27. Averill R, Goldfield N, Hughes JS, et al. All Patient Refined Diagnosis Related Groups (APR-DRGs) Version 20.0: Methodology Overview. https://www.hcup-us.ahrq.gov/db/nation/nis/APR-DRGsV20MethodologyOverviewandBibliography.pdf. Accessed on November 2, 2016.
28. Berry JG, Toomey SL, Zaslavsky AM, et al. Pediatric readmission prevalence and variability across hospitals. JAMA. 2013;309(4):372-380. PubMed
29. Zima BT, Rodean J, Hall M, Bardach NS, Coker TR, Berry JG. Psychiatric Disorders and Trends in Resource Use in Pediatric Hospitals. Pediatrics. 2016;138(5):e20160909-e20160909. doi:10.1542/peds.2016-0909. PubMed
30. Chronic Condition Indicator (CCI) for ICD-9-CM. Healthcare Cost and Utilization Project (HCUP) Tools & Software Page. http://www.hcup-us.ahrq.gov/toolssoftware/chronic/chronic.jsp. Accessed on October 30, 2015.
31. Feudtner C, Feinstein J, Zhong W, Hall M, Dai D. Pediatric complex chronic conditions classification system version 2: updated for ICD-10 and complex medical technology dependence and transplantation. BMC Pediatr. 2014;14(1):199-205. PubMed
32. Doupnik S, Lawlor J, Zima BT, et al. Mental Health Conditions and Medical and Surgical Hospital Utilization. Pediatrics. 2016;138(6):e20162416. doi:10.1542/peds.2016-2416. PubMed
33. Brown NM, Green JC, Desai MM, Weitzman CC, Rosenthal MS. Need and Unmet Need for Care Coordination Among Children with Mental Health Conditions. Pediatrics. 2014;133(3):e530-e537. doi:10.1542/peds.2013-2590. PubMed
34. Sobolewski B, Richey L, Kowatch RA, Grupp-Phelan J. Mental health follow-up among adolescents with suicidal behaviors after emergency department discharge. Arch Suicide Res. 2013;17(4):323-334. doi:10.1080/13811118.2013.801807. PubMed
35. Hansen LO, Greenwald JL, Budnitz T, et al. Project BOOST: Effectiveness of a multihospital effort to reduce rehospitalization. J Hosp Med. 2013;8(8):421-427. doi:10.1002/jhm.2054. PubMed
36. Di Marco F, Verga M, Santus P, et al. Close correlation between anxiety, depression, and asthma control. Respir Med. 2010;104(1):22-28. doi:10.1016/j.rmed.2009.08.005. PubMed
37. Ghose SS, Williams LS, Swindle RW. Depression and other mental health diagnoses after stroke increase inpatient and outpatient medical utilization three years poststroke. Med Care. 2005;43(12):1259-1264. PubMed
38. Szigethy E, Bujoreanu SI, Youk AO, et al. Randomized efficacy trial of two psychotherapies for depression in youth with inflammatory bowel disease. J Am Acad Child Adolesc Psychiatry. 2014;53(7):726-735. PubMed
39. Swensen A, Birnbaum HG, Ben Hamadi R, Greenberg P, Cremieux PY, Secnik K. Incidence and costs of accidents among attention-deficit/hyperactivity disorder patients. J Adolesc Health. 2004;35(4):346.e1-346.e9. doi:10.1016/j.jadohealth.2003.12.003. PubMed
40. Chan E, Zhan C, Homer CJ. Health Care Use and Costs for Children with Attention-Deficit/Hyperactivity Disorder: National Estimates from the Medical Expenditure Panel Survey. Arch Pediatr Adolesc Med. 2002;156(5):504-511. doi:10.1001/archpedi.156.5.504. PubMed
41. Berry JG, Blaine K, Rogers J, et al. A Framework of Pediatric Hospital Discharge Care Informed by Legislation, Research, and Practice. JAMA Pediatr. 2014;168(10):955-962. doi:10.1001/jamapediatrics.2014.891. PubMed
© 2018 Society of Hospital Medicine
Issues Identified by Postdischarge Contact after Pediatric Hospitalization: A Multisite Study
Many hospitals are considering or currently employing initiatives to contact patients after discharge. Whether conducted via telephone or other means, the purpose of the contact is to help patients adhere to discharge plans, fulfill discharge needs, and alleviate postdischarge issues (PDIs). The effectiveness of hospital-initiated postdischarge phone calls has been studied in adult patients after hospitalization, and though some studies report positive outcomes,1-3 a 2006 Cochrane review found insufficient evidence to recommend for or against the practice.4
Little is known about follow-up contact after hospitalization for children.5-11 Rates of PDI vary substantially across hospitals. For example, one single-center study of postdischarge telephone contact after hospitalization on a general pediatric ward identified PDIs in ~20% of patients.10 Another study identified PDIs in 84% of patients discharged from a pediatric rehabilitation facility.11 Telephone follow-up has been associated with reduced health resource utilization and improved patient satisfaction for children discharged after an elective surgical procedure6 and for children discharged home from the emergency department.7-9
More information is needed on the clinical experiences of postdischarge contact in hospitalized children to improve the understanding of how the contact is made, who makes it, and which patients are most likely to report a PDI. These experiences are crucial to understand given the expense and time commitment involved in postdischarge contact, as many hospitals may not be positioned to contact all discharged patients. Therefore, we conducted a pragmatic, retrospective, naturalistic study of differing approaches to postdischarge contact occurring in multiple hospitals. Our main objective was to describe the prevalence and types of PDIs identified by the different approaches for follow-up contact across 4 children’s hospitals. We also assessed the characteristics of children who have the highest likelihood of having a PDI identified from the contact within each hospital.
METHODS
Study Design, Setting, and Population
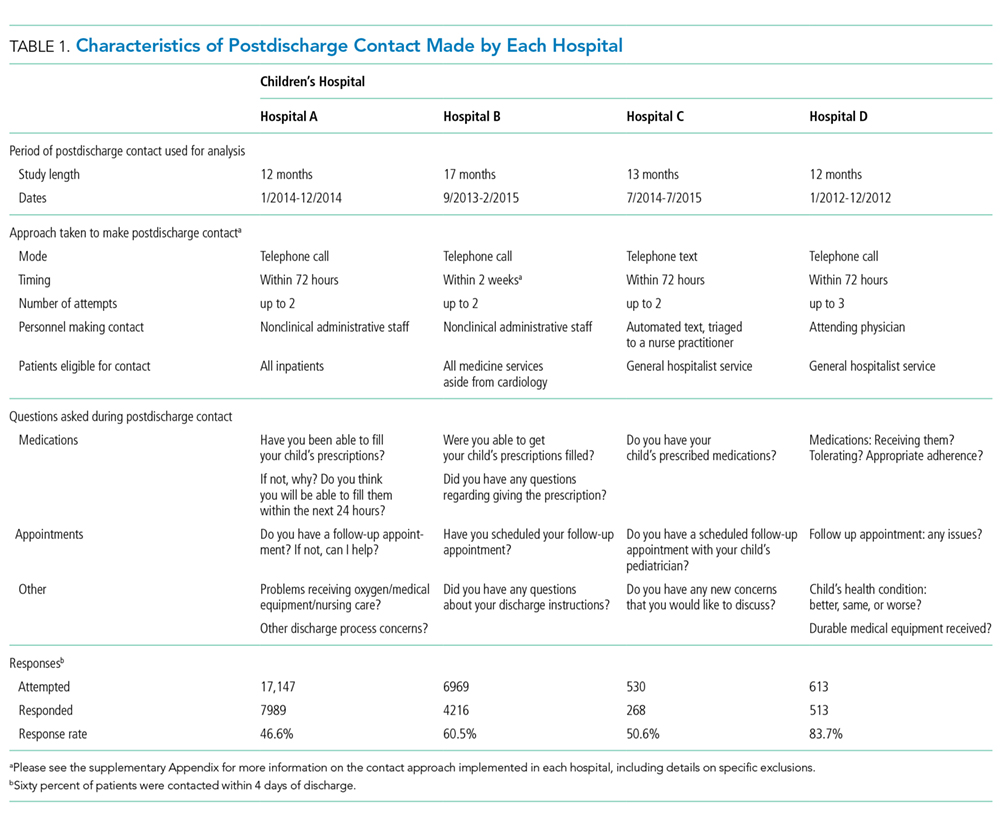
Main Outcome Measures
The main outcome measure was identification of a PDI, defined as a medication, appointment, or other discharge-related issue, that was reported and recorded by the child’s caregiver during conversation from the standardized questions that were asked during follow-up contact as part of routine discharge care (Table 1). Medication PDIs included issues filling prescriptions and tolerating medications. Appointment PDIs included not having a follow-up appointment scheduled. Other PDIs included issues with the child’s health condition, discharge instructions, or any other concerns. All PDIs had been recorded prospectively by hospital contact personnel (hospitals A, B, and D) or through an automated texting system into a database (hospital C). Where available, free text comments that were recorded by contact personnel were reviewed by one of the authors (KB) and categorized via an existing framework of PDI designed by Heath et al.10 in order to further understand the problems that were reported.
Patient Characteristics
Patient hospitalization, demographic, and clinical characteristics were obtained from administrative health data at each institution and compared between children with versus without a PDI. Hospitalization characteristics included length of stay, season of admission, and reason for admission. Reason for admission was categorized by using 3M Health’s All Patient Refined Diagnosis Related Groups (APR-DRG) (3M, Maplewood, MN). Demographic characteristics included age at admission in years, insurance type (eg, public, private, and other), and race/ethnicity (Asian/Pacific Islander, Hispanic, non-Hispanic black, non-Hispanic white, and other).
Clinical characteristics included a count of the different classes of medications (eg, antibiotics, antiepileptic medications, digestive motility medications, etc.) administered to the child during admission, the type and number of chronic conditions, and assistance with medical technology (eg, gastrostomy, tracheostomy, etc.). Except for medications, these characteristics were assessed with International Classification of Diseases, Ninth Revision-Clinical Modification (ICD-9-CM) diagnosis codes.
We used the Agency for Healthcare Research and Quality Chronic Condition Indicator classification system, which categorizes over 14,000 ICD-9-CM diagnosis codes into chronic versus nonchronic conditions to identify the presence and number of chronic conditions.12 Children hospitalized with a chronic condition were further classified as having a complex chronic condition (CCC) by using the ICD-9-CM diagnosis classification scheme of Feudtner et al.13 CCCs represent defined diagnosis groupings of conditions expected to last longer than 12 months and involve either multiple organ systems or a single organ system severely enough to require specialty pediatric care and hospitalization.13,14 Children requiring medical technology were identified by using ICD-9-CM codes indicating their use of a medical device to manage and treat a chronic illness (eg, ventricular shunt to treat hydrocephalus) or to maintain basic body functions necessary for sustaining life (eg a tracheostomy tube for breathing).15,16
Statistical Analysis
Given that the primary purpose for this study was to leverage the natural heterogeneity in the approach to follow-up contact across hospitals, we assessed and reported the prevalence and type of PDIs independently for each hospital. Relatedly, we assessed the relationship between patient characteristics and PDI likelihood independently within each hospital as well rather than pool the data and perform a central analysis across hospitals. Of note, APR-DRG and medication class were not assessed for hospital D, as this information was unavailable. We used χ2 tests for univariable analysis and logistic regression with a backwards elimination derivation process (for variables with P ≥ .05) for multivariable analysis; all patient demographic, clinical, and hospitalization characteristics were entered initially into the models. All statistical analyses were performed using SAS version 9.3 (SAS Institute, Cary, NC), and P < .05 was considered statistically significant. This study was approved by the institutional review board at all hospitals.
RESULTS
Study Population
There were 12,986 (51.4%) of 25,259 patients reached by follow-up contact after discharge across the 4 hospitals. Median age at admission for contacted patients was 4.0 years (interquartile range [IQR] 0-11). Of those contacted, 45.2% were female, 59.9% were non-Hispanic white, 51.0% used Medicaid, and 95.4% were discharged to home. Seventy-one percent had a chronic condition (of any complexity) and 40.8% had a CCC. Eighty percent received a prescribed medication during the hospitalization. Median (IQR) length of stay was 2.0 days (IQR 1-4 days). The top 5 most common reasons for admission were bronchiolitis (6.3%), pneumonia (6.2%), asthma (5.2%), seizure (4.9%), and tonsil and adenoid procedures (4.1%).
PDIs
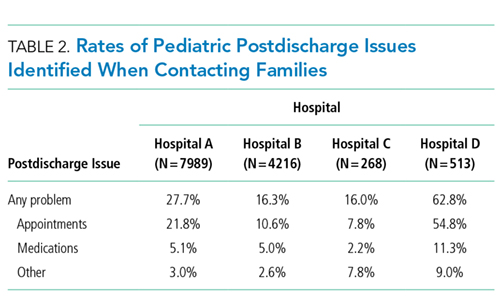
Characteristics Associated with PDIs
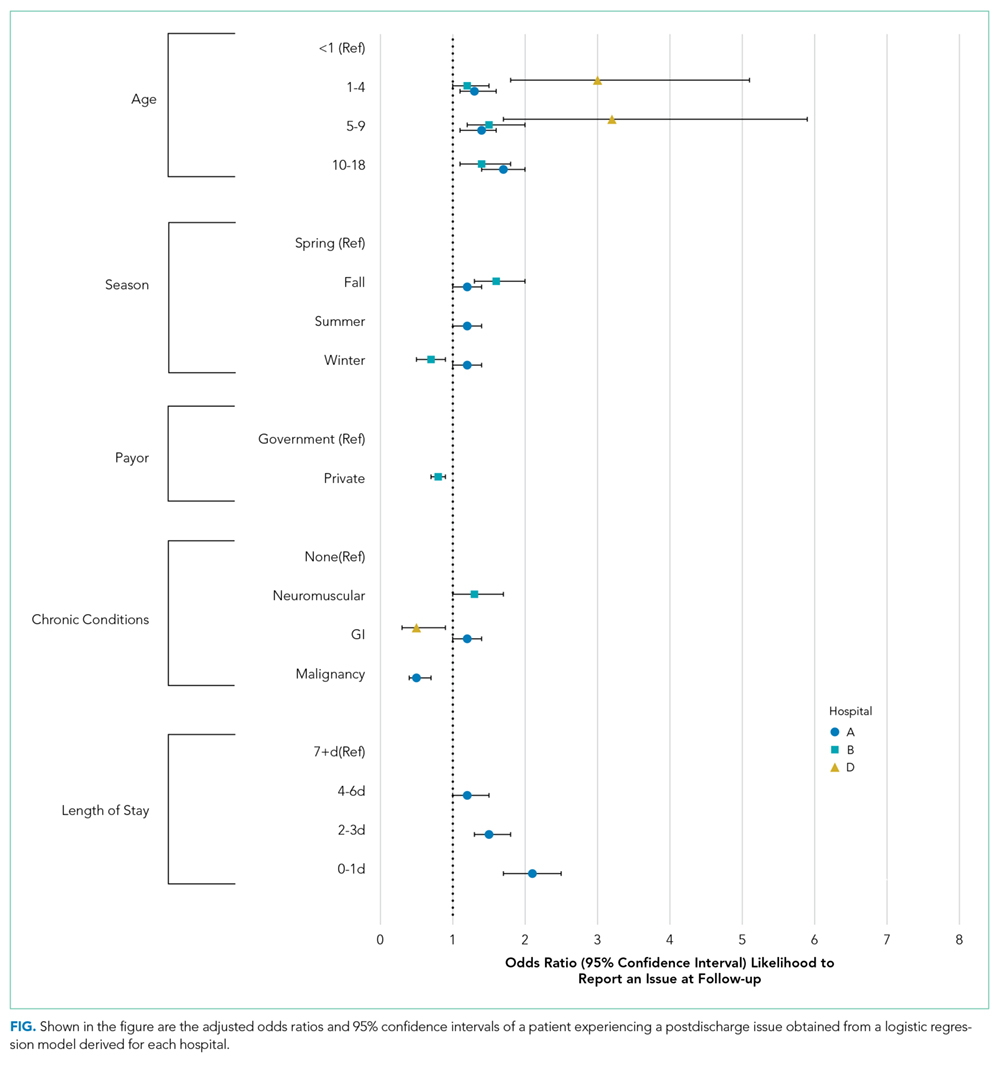
Age
Older age was a consistent characteristic associated with PDIs in 3 hospitals. For example, PDI rates in children 10 to 18 years versus <1 year were 30.8% versus 21.4% (P < .001) in hospital A, 19.4% versus 13.7% (P = .002) in hospital B, and 70.3% versus 62.8% (P < .001) in hospital D. In multivariable analysis, age 10 to 18 years versus <1 year at admission was associated with an increased likelihood of PDI in hospital A (odds ratio [OR] 1.7; 95% CI, 1.4-2.0), hospital B (OR 1.4; 95% CI, 1.1-1.8), and hospital D (OR 1.7; 95% CI, 0.9-3.0) (Table 3 and Figure).
Medications
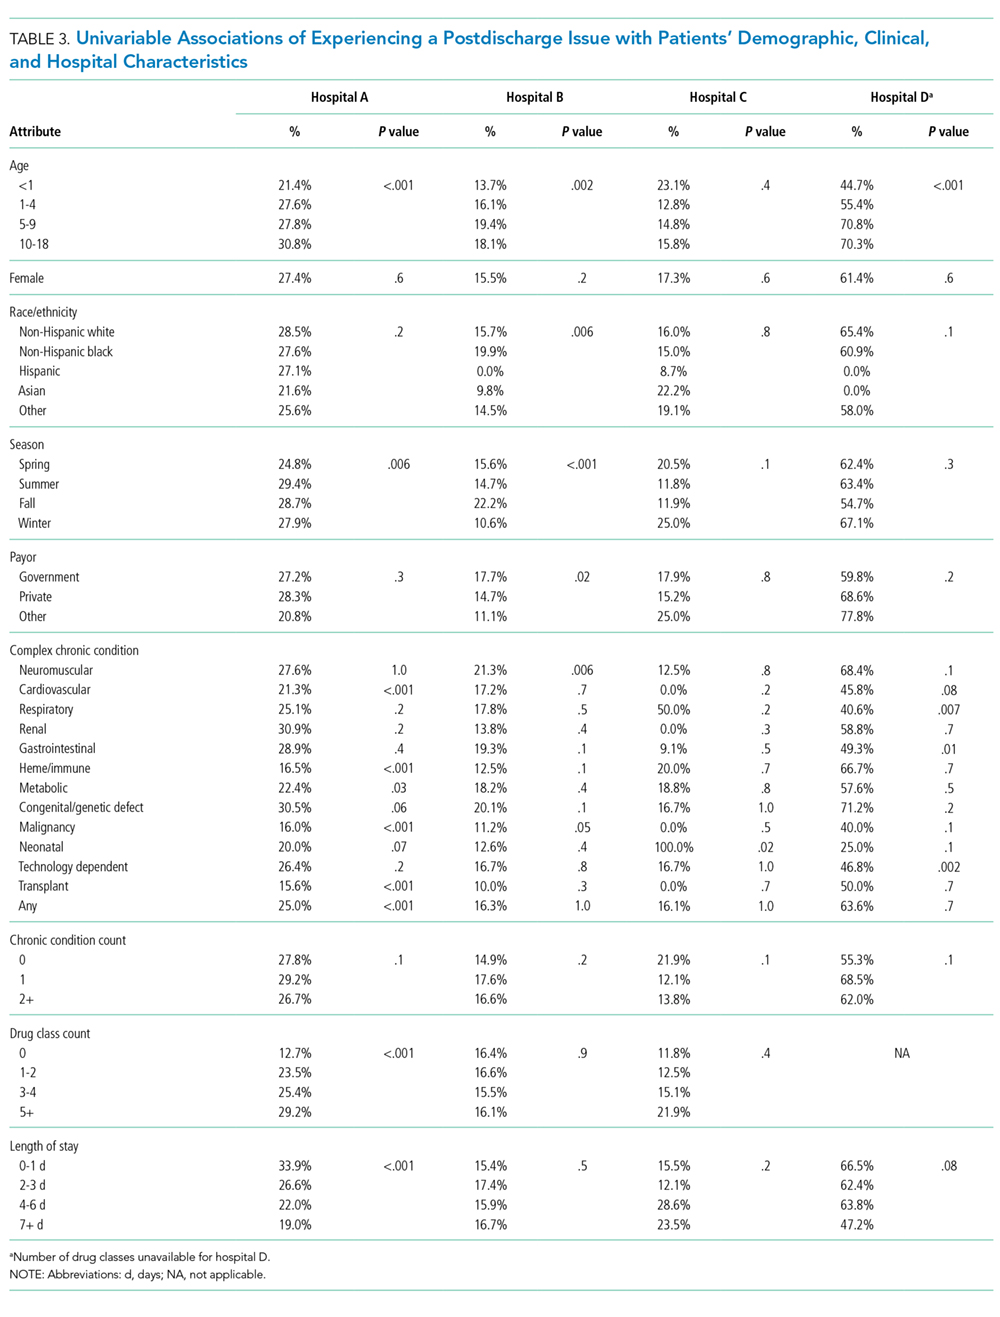
Length of Stay
Shorter length of stay was associated with PDI in 1 hospital. In hospital A, the PDI rate increased significantly (P < .001) from 19.0% to 33.9% as length of stay decreased from ≥7 days to ≤1 day (Table 3). In multivariable analysis, length of stay to ≤1 day versus ≥7 days was associated with increased likelihood of PDI (OR 2.1; 95% CI, 1.7-2.5) in hospital A (Table 3 and Figure).
CCCs
A neuromuscular CCC was associated with PDI in 2 hospitals. In hospital B, the PDI rate was higher in children with a neuromuscular CCC compared with a malignancy CCC (21.3% vs 11.2%). In hospital D, the PDI rates were higher in children with a neuromuscular CCC compared with a respiratory CCC (68.9% vs 40.6%) (Table 3). In multivariable analysis, children with versus without a neuromuscular CCC had an increased likelihood of PDI (OR 1.3; 95% CI, 1.0-1.7) in hospital B (Table 3 and Figure).
DISCUSSION
In this retrospective, pragmatic, multicentered study of follow-up contact with a standardized set of questions asked after discharge for hospitalized children, we found that PDIs were identified often, regardless of who made the contact or how the contact was made. The PDI rates varied substantially across hospitals and were likely influenced by the different follow-up approaches that were used. Most PDIs were related to appointments; fewer PDIs were related to medications and other problems. Older age, shorter length of stay, and neuromuscular CCCs were among the identified risk factors for PDIs.
Our assessment of PDIs was, by design, associated with variation in methods and approach for detection across sites. Further investigation is needed to understand how different approaches for follow-up contact after discharge may influence the identification of PDIs. For example, in the current study, the hospital with the highest PDI rate (hospital D) used hospitalists who provided inpatient care for the patient to make follow-up contact. Although not determined from the current study, this approach could have led the hospitalists to ask questions beyond the standardized ones when assessing for PDIs. Perhaps some of the hospitalists had a better understanding of how to probe for PDIs specific to each patient; this understanding may not have been forthcoming for staff in the other hospitals who were unfamiliar with the patients’ hospitalization course and medical history.
Similar to previous studies in adults, our study reported that appointment PDIs in children may be more common than other types of PDIs.17 Appointment PDIs could have been due to scheduling difficulties, inadequate discharge instructions, lack of adherence to recommended follow-up, or other reasons. Further investigation is needed to elucidate these reasons and to determine how to reduce PDIs related to postdischarge appointments. Some children’s hospitals schedule follow-up appointments prior to discharge to mitigate appointment PDIs that might arise.18 However, doing that for every hospitalized child is challenging, especially for very short admissions or for weekend discharges when many outpatient and community practices are not open to schedule appointments. Additional exploration is necessary to assess whether this might help explain why some children in the current study with a short versus long length of stay had a higher likelihood of PDI.
The rate of medication PDIs (5.2%) observed in the current study is lower than the rate that is reported in prior literature. Dudas et al.1 found that medication PDIs occurred in 21% of hospitalized adult patients. One reason for the lower rate of medication PDIs in children may be that they require the use of postdischarge medications less often than adults. Most medication PDIs in the current study involved problems filling a prescription. There was not enough information in the notes taken from the follow-up contact to distinguish the medication PDI etiologies (eg, a prescription was not sent from the hospital team to the pharmacy, prior authorization from an insurance company for a prescription was not obtained, the pharmacy did not stock the medication). To help overcome medication access barriers, some hospitals fill and deliver discharge medications to the patients’ bedside. One study found that children discharged with medication in hand were less likely to have emergency department revisits within 30 days of discharge.19 Further investigation is needed to assess whether initiatives like these help mitigate medication PDIs in children.
Hospitals may benefit from considering how risk factors for PDIs can be used to prioritize which patients receive follow-up contact, especially in hospitals where contact for all hospitalized patients is not feasible. In the current study, there was variation across hospitals in the profile of risk factors that correlated with increased likelihood of PDI. Some of the risk factors are easier to explain than others. For example, as mentioned above, for some hospitalized children, short length of stay might not permit enough time for hospital staff to set up discharge plans that may sufficiently prevent PDIs. Other risk factors, including older age and neuromuscular CCCs, may require additional assessment (eg, through chart review or in-depth patient and provider interviews) to discover the reasons why they were associated with increased likelihood of PDI. There are additional risk factors that might influence the likelihood of PDI that the current study was not positioned to assess, including health literacy, transportation availability, and language spoken.20-23
This study has several other limitations in addition to the ones already mentioned. Some children may have experienced PDIs that were not reported at contact (eg, the respondent was unaware that an issue was present), which may have led to an undercounting of PDIs. Alternatively, some caregivers may have been more likely to respond to the contact if their child was experiencing a PDI, which may have led to overcounting. PDIs of nonrespondents were not measured. PDIs identified by postdischarge outpatient and community providers or by families outside of contact were not measured. The current study was not positioned to assess the severity of the PDIs or what interventions (including additional health services) were needed to address them. Although we assessed medication use during admission, we were unable to assess the number and type of medications that were prescribed for use postdischarge. Information about the number and type of follow-up visits needed for each child was not assessed. Given the variety of approaches for follow-up contact, the findings may generalize best to individual hospitals by using an approach that best matches to one of them. The current study is not positioned to correlate quality of discharge care with the rate of PDI.
Despite these limitations, the findings from the current study reinforce that PDIs identified through follow-up contact in discharged patients appear to be common. Of PDIs identified, appointment problems were more prevalent than medication or other types of problems. Short length of stay, older age, and other patient and/or hospitalization attributes were associated with an increased likelihood of PDI. Hospitals caring for children may find this information useful as they strive to optimize their processes for follow-up contact after discharge. To help further evaluate the value and importance of contacting patients after discharge, additional study of PDI in children is warranted, including (1) actions taken to resolve PDIs, (2) the impact of identifying and addressing PDIs on hospital readmission, and (3) postdischarge experiences and health outcomes of children who responded versus those who did not respond to the follow-up contact. Moreover, future multisite, comparative effectiveness studies of PDI may wish to consider standardization of follow-up contact procedures with controlled manipulation of key processes (eg, contact by administrator vs nurse vs physician) to assess best practices.
Disclosure
Mr. Blaine, Ms. O’Neill, and Drs. Berry, Brittan, Rehm, and Steiner were supported by the Lucile Packard Foundation for Children’s Health. The authors have no financial relationships relative to this article to disclose. The authors have no conflicts of interest to disclose.
1. Dudas V, Bookwalter T, Kerr KM, Pantilat SZ. The impact of follow-up telephone calls to patients after hospitalization. Dis Mon. 2002;48(4):239-248. PubMed
2. Sanchez GM, Douglass MA, Mancuso MA. Revisiting Project Re-Engineered Discharge (RED): The Impact of a Pharmacist Telephone Intervention on Hospital Readmission Rates. Pharmacotherapy. 2015;35(9):805-812. PubMed
3. Jones J, Clark W, Bradford J, Dougherty J. Efficacy of a telephone follow-up system in the emergency department. J Emerg Med. 1988;6(3):249-254. PubMed
4. Mistiaen P, Poot E. Telephone follow-up, initiated by a hospital-based health professional, for postdischarge problems in patients discharged from hospital to home. Cochrane Database Syst Rev. 2006(4):CD004510. PubMed
5. Lushaj EB, Nelson K, Amond K, Kenny E, Badami A, Anagnostopoulos PV. Timely Post-discharge Telephone Follow-Up is a Useful Tool in Identifying Post-discharge Complications Patients After Congenital Heart Surgery. Pediatr Cardiol. 2016;37(6):1106-1110. PubMed
6. McVay MR, Kelley KR, Mathews DL, Jackson RJ, Kokoska ER, Smith SD. Postoperative follow-up: is a phone call enough? J Pediatr Surg. 2008;43(1):83-86. PubMed
7. Chande VT, Exum V. Follow-up phone calls after an emergency department visit. Pediatrics. 1994;93(3):513-514. PubMed
8. Sutton D, Stanley P, Babl FE, Phillips F. Preventing or accelerating emergency care for children with complex healthcare needs. Arch Dis Child. 2008;93(1):17-22. PubMed
9. Patel PB, Vinson DR. Physician e-mail and telephone contact after emergency department visit improves patient satisfaction: a crossover trial. Ann Emerg Med. 2013;61(6):631-637. PubMed
10. Heath J, Dancel R, Stephens JR. Postdischarge phone calls after pediatric hospitalization: an observational study. Hosp Pediatr. 2015;5(5):241-248. PubMed
11. Biffl SE, Biffl WL. Improving transitions of care for complex pediatric trauma patients from inpatient rehabilitation to home: an observational pilot study. Patient Saf Surg. 2015;9:33-37. PubMed
12. AHRQ. Clinical Classifications Software (CCS) for ICD-9-CM. http://www.hcup-us.ahrq.gov/toolssoftware/ccs/ccs.jsp. Accessed on January 31,2012.
13. Feudtner C, Christakis DA, Connell FA. Pediatric deaths attributable to complex chronic conditions: a population-based study of Washington State, 1980-1997. Pediatrics. 2000;106(1 Pt 2):205-209. PubMed
14. Berry JG, Hall DE, Kuo DZ, et al. Hospital utilization and characteristics of patients experiencing recurrent readmissions within children’s hospitals. JAMA. 2011;305(7):682-690. PubMed
15. Palfrey JS, Walker DK, Haynie M, et al. Technology’s children: report of a statewide census of children dependent on medical supports. Pediatrics. 1991;87(5):611-618. PubMed
16. Feudtner C, Villareale NL, Morray B, Sharp V, Hays RM, Neff JM. Technology-dependency among patients discharged from a children’s hospital: a retrospective cohort study. BMC Pediatr. 2005;5(1):8-15. PubMed
17. Arora VM, Prochaska ML, Farnan JM, et al. Problems after discharge and understanding of communication with their primary care physicians among hospitalized seniors: a mixed methods study. J Hosp Med. 2010;5(7):385-391. PubMed
18. Brittan M, Tyler A, Martin S, et al. A Discharge Planning Template for the Electronic Medical Record Improves Scheduling of Neurology Follow-up for Comanaged Seizure Patients. Hosp Pediatr. 2014;4(6):366-371. PubMed
19. Hatoun J, Bair-Merritt M, Cabral H, Moses J. Increasing Medication Possession at Discharge for Patients With Asthma: The Meds-in-Hand Project. Pediatrics. 2016;137(3):e20150461. doi:10.1542/peds.2015-0461. PubMed
20. Berry JG, Goldmann DA, Mandl KD, et al. Health information management and perceptions of the quality of care for children with tracheotomy: a qualitative study. BMC Health Serv Res. 2011;11:117-125. PubMed
21. Berry JG, Ziniel SI, Freeman L, et al. Hospital readmission and parent perceptions of their child’s hospital discharge. Int J Qual Health Care. 2013;25(5):573-581. PubMed
22. Carusone SC, O’Leary B, McWatt S, Stewart A, Craig S, Brennan DJ. The Lived Experience of the Hospital Discharge “Plan”: A Longitudinal Qualitative Study of Complex Patients. J Hosp Med. 2017;12(1):5-10. PubMed
23. Leyenaar JK, O’Brien ER, Leslie LK, Lindenauer PK, Mangione-Smith RM. Families’ Priorities Regarding Hospital-to-Home Transitions for Children With Medical Complexity. Pediatrics. 2017;139(1):e20161581. doi:10.1542/peds.2016-1581. PubMed
Many hospitals are considering or currently employing initiatives to contact patients after discharge. Whether conducted via telephone or other means, the purpose of the contact is to help patients adhere to discharge plans, fulfill discharge needs, and alleviate postdischarge issues (PDIs). The effectiveness of hospital-initiated postdischarge phone calls has been studied in adult patients after hospitalization, and though some studies report positive outcomes,1-3 a 2006 Cochrane review found insufficient evidence to recommend for or against the practice.4
Little is known about follow-up contact after hospitalization for children.5-11 Rates of PDI vary substantially across hospitals. For example, one single-center study of postdischarge telephone contact after hospitalization on a general pediatric ward identified PDIs in ~20% of patients.10 Another study identified PDIs in 84% of patients discharged from a pediatric rehabilitation facility.11 Telephone follow-up has been associated with reduced health resource utilization and improved patient satisfaction for children discharged after an elective surgical procedure6 and for children discharged home from the emergency department.7-9
More information is needed on the clinical experiences of postdischarge contact in hospitalized children to improve the understanding of how the contact is made, who makes it, and which patients are most likely to report a PDI. These experiences are crucial to understand given the expense and time commitment involved in postdischarge contact, as many hospitals may not be positioned to contact all discharged patients. Therefore, we conducted a pragmatic, retrospective, naturalistic study of differing approaches to postdischarge contact occurring in multiple hospitals. Our main objective was to describe the prevalence and types of PDIs identified by the different approaches for follow-up contact across 4 children’s hospitals. We also assessed the characteristics of children who have the highest likelihood of having a PDI identified from the contact within each hospital.
METHODS
Study Design, Setting, and Population
Main Outcome Measures
The main outcome measure was identification of a PDI, defined as a medication, appointment, or other discharge-related issue, that was reported and recorded by the child’s caregiver during conversation from the standardized questions that were asked during follow-up contact as part of routine discharge care (Table 1). Medication PDIs included issues filling prescriptions and tolerating medications. Appointment PDIs included not having a follow-up appointment scheduled. Other PDIs included issues with the child’s health condition, discharge instructions, or any other concerns. All PDIs had been recorded prospectively by hospital contact personnel (hospitals A, B, and D) or through an automated texting system into a database (hospital C). Where available, free text comments that were recorded by contact personnel were reviewed by one of the authors (KB) and categorized via an existing framework of PDI designed by Heath et al.10 in order to further understand the problems that were reported.
Patient Characteristics
Patient hospitalization, demographic, and clinical characteristics were obtained from administrative health data at each institution and compared between children with versus without a PDI. Hospitalization characteristics included length of stay, season of admission, and reason for admission. Reason for admission was categorized by using 3M Health’s All Patient Refined Diagnosis Related Groups (APR-DRG) (3M, Maplewood, MN). Demographic characteristics included age at admission in years, insurance type (eg, public, private, and other), and race/ethnicity (Asian/Pacific Islander, Hispanic, non-Hispanic black, non-Hispanic white, and other).
Clinical characteristics included a count of the different classes of medications (eg, antibiotics, antiepileptic medications, digestive motility medications, etc.) administered to the child during admission, the type and number of chronic conditions, and assistance with medical technology (eg, gastrostomy, tracheostomy, etc.). Except for medications, these characteristics were assessed with International Classification of Diseases, Ninth Revision-Clinical Modification (ICD-9-CM) diagnosis codes.
We used the Agency for Healthcare Research and Quality Chronic Condition Indicator classification system, which categorizes over 14,000 ICD-9-CM diagnosis codes into chronic versus nonchronic conditions to identify the presence and number of chronic conditions.12 Children hospitalized with a chronic condition were further classified as having a complex chronic condition (CCC) by using the ICD-9-CM diagnosis classification scheme of Feudtner et al.13 CCCs represent defined diagnosis groupings of conditions expected to last longer than 12 months and involve either multiple organ systems or a single organ system severely enough to require specialty pediatric care and hospitalization.13,14 Children requiring medical technology were identified by using ICD-9-CM codes indicating their use of a medical device to manage and treat a chronic illness (eg, ventricular shunt to treat hydrocephalus) or to maintain basic body functions necessary for sustaining life (eg a tracheostomy tube for breathing).15,16
Statistical Analysis
Given that the primary purpose for this study was to leverage the natural heterogeneity in the approach to follow-up contact across hospitals, we assessed and reported the prevalence and type of PDIs independently for each hospital. Relatedly, we assessed the relationship between patient characteristics and PDI likelihood independently within each hospital as well rather than pool the data and perform a central analysis across hospitals. Of note, APR-DRG and medication class were not assessed for hospital D, as this information was unavailable. We used χ2 tests for univariable analysis and logistic regression with a backwards elimination derivation process (for variables with P ≥ .05) for multivariable analysis; all patient demographic, clinical, and hospitalization characteristics were entered initially into the models. All statistical analyses were performed using SAS version 9.3 (SAS Institute, Cary, NC), and P < .05 was considered statistically significant. This study was approved by the institutional review board at all hospitals.
RESULTS
Study Population
There were 12,986 (51.4%) of 25,259 patients reached by follow-up contact after discharge across the 4 hospitals. Median age at admission for contacted patients was 4.0 years (interquartile range [IQR] 0-11). Of those contacted, 45.2% were female, 59.9% were non-Hispanic white, 51.0% used Medicaid, and 95.4% were discharged to home. Seventy-one percent had a chronic condition (of any complexity) and 40.8% had a CCC. Eighty percent received a prescribed medication during the hospitalization. Median (IQR) length of stay was 2.0 days (IQR 1-4 days). The top 5 most common reasons for admission were bronchiolitis (6.3%), pneumonia (6.2%), asthma (5.2%), seizure (4.9%), and tonsil and adenoid procedures (4.1%).
PDIs
Characteristics Associated with PDIs
Age
Older age was a consistent characteristic associated with PDIs in 3 hospitals. For example, PDI rates in children 10 to 18 years versus <1 year were 30.8% versus 21.4% (P < .001) in hospital A, 19.4% versus 13.7% (P = .002) in hospital B, and 70.3% versus 62.8% (P < .001) in hospital D. In multivariable analysis, age 10 to 18 years versus <1 year at admission was associated with an increased likelihood of PDI in hospital A (odds ratio [OR] 1.7; 95% CI, 1.4-2.0), hospital B (OR 1.4; 95% CI, 1.1-1.8), and hospital D (OR 1.7; 95% CI, 0.9-3.0) (Table 3 and Figure).
Medications
Length of Stay
Shorter length of stay was associated with PDI in 1 hospital. In hospital A, the PDI rate increased significantly (P < .001) from 19.0% to 33.9% as length of stay decreased from ≥7 days to ≤1 day (Table 3). In multivariable analysis, length of stay to ≤1 day versus ≥7 days was associated with increased likelihood of PDI (OR 2.1; 95% CI, 1.7-2.5) in hospital A (Table 3 and Figure).
CCCs
A neuromuscular CCC was associated with PDI in 2 hospitals. In hospital B, the PDI rate was higher in children with a neuromuscular CCC compared with a malignancy CCC (21.3% vs 11.2%). In hospital D, the PDI rates were higher in children with a neuromuscular CCC compared with a respiratory CCC (68.9% vs 40.6%) (Table 3). In multivariable analysis, children with versus without a neuromuscular CCC had an increased likelihood of PDI (OR 1.3; 95% CI, 1.0-1.7) in hospital B (Table 3 and Figure).
DISCUSSION
In this retrospective, pragmatic, multicentered study of follow-up contact with a standardized set of questions asked after discharge for hospitalized children, we found that PDIs were identified often, regardless of who made the contact or how the contact was made. The PDI rates varied substantially across hospitals and were likely influenced by the different follow-up approaches that were used. Most PDIs were related to appointments; fewer PDIs were related to medications and other problems. Older age, shorter length of stay, and neuromuscular CCCs were among the identified risk factors for PDIs.
Our assessment of PDIs was, by design, associated with variation in methods and approach for detection across sites. Further investigation is needed to understand how different approaches for follow-up contact after discharge may influence the identification of PDIs. For example, in the current study, the hospital with the highest PDI rate (hospital D) used hospitalists who provided inpatient care for the patient to make follow-up contact. Although not determined from the current study, this approach could have led the hospitalists to ask questions beyond the standardized ones when assessing for PDIs. Perhaps some of the hospitalists had a better understanding of how to probe for PDIs specific to each patient; this understanding may not have been forthcoming for staff in the other hospitals who were unfamiliar with the patients’ hospitalization course and medical history.
Similar to previous studies in adults, our study reported that appointment PDIs in children may be more common than other types of PDIs.17 Appointment PDIs could have been due to scheduling difficulties, inadequate discharge instructions, lack of adherence to recommended follow-up, or other reasons. Further investigation is needed to elucidate these reasons and to determine how to reduce PDIs related to postdischarge appointments. Some children’s hospitals schedule follow-up appointments prior to discharge to mitigate appointment PDIs that might arise.18 However, doing that for every hospitalized child is challenging, especially for very short admissions or for weekend discharges when many outpatient and community practices are not open to schedule appointments. Additional exploration is necessary to assess whether this might help explain why some children in the current study with a short versus long length of stay had a higher likelihood of PDI.
The rate of medication PDIs (5.2%) observed in the current study is lower than the rate that is reported in prior literature. Dudas et al.1 found that medication PDIs occurred in 21% of hospitalized adult patients. One reason for the lower rate of medication PDIs in children may be that they require the use of postdischarge medications less often than adults. Most medication PDIs in the current study involved problems filling a prescription. There was not enough information in the notes taken from the follow-up contact to distinguish the medication PDI etiologies (eg, a prescription was not sent from the hospital team to the pharmacy, prior authorization from an insurance company for a prescription was not obtained, the pharmacy did not stock the medication). To help overcome medication access barriers, some hospitals fill and deliver discharge medications to the patients’ bedside. One study found that children discharged with medication in hand were less likely to have emergency department revisits within 30 days of discharge.19 Further investigation is needed to assess whether initiatives like these help mitigate medication PDIs in children.
Hospitals may benefit from considering how risk factors for PDIs can be used to prioritize which patients receive follow-up contact, especially in hospitals where contact for all hospitalized patients is not feasible. In the current study, there was variation across hospitals in the profile of risk factors that correlated with increased likelihood of PDI. Some of the risk factors are easier to explain than others. For example, as mentioned above, for some hospitalized children, short length of stay might not permit enough time for hospital staff to set up discharge plans that may sufficiently prevent PDIs. Other risk factors, including older age and neuromuscular CCCs, may require additional assessment (eg, through chart review or in-depth patient and provider interviews) to discover the reasons why they were associated with increased likelihood of PDI. There are additional risk factors that might influence the likelihood of PDI that the current study was not positioned to assess, including health literacy, transportation availability, and language spoken.20-23
This study has several other limitations in addition to the ones already mentioned. Some children may have experienced PDIs that were not reported at contact (eg, the respondent was unaware that an issue was present), which may have led to an undercounting of PDIs. Alternatively, some caregivers may have been more likely to respond to the contact if their child was experiencing a PDI, which may have led to overcounting. PDIs of nonrespondents were not measured. PDIs identified by postdischarge outpatient and community providers or by families outside of contact were not measured. The current study was not positioned to assess the severity of the PDIs or what interventions (including additional health services) were needed to address them. Although we assessed medication use during admission, we were unable to assess the number and type of medications that were prescribed for use postdischarge. Information about the number and type of follow-up visits needed for each child was not assessed. Given the variety of approaches for follow-up contact, the findings may generalize best to individual hospitals by using an approach that best matches to one of them. The current study is not positioned to correlate quality of discharge care with the rate of PDI.
Despite these limitations, the findings from the current study reinforce that PDIs identified through follow-up contact in discharged patients appear to be common. Of PDIs identified, appointment problems were more prevalent than medication or other types of problems. Short length of stay, older age, and other patient and/or hospitalization attributes were associated with an increased likelihood of PDI. Hospitals caring for children may find this information useful as they strive to optimize their processes for follow-up contact after discharge. To help further evaluate the value and importance of contacting patients after discharge, additional study of PDI in children is warranted, including (1) actions taken to resolve PDIs, (2) the impact of identifying and addressing PDIs on hospital readmission, and (3) postdischarge experiences and health outcomes of children who responded versus those who did not respond to the follow-up contact. Moreover, future multisite, comparative effectiveness studies of PDI may wish to consider standardization of follow-up contact procedures with controlled manipulation of key processes (eg, contact by administrator vs nurse vs physician) to assess best practices.
Disclosure
Mr. Blaine, Ms. O’Neill, and Drs. Berry, Brittan, Rehm, and Steiner were supported by the Lucile Packard Foundation for Children’s Health. The authors have no financial relationships relative to this article to disclose. The authors have no conflicts of interest to disclose.
1. Dudas V, Bookwalter T, Kerr KM, Pantilat SZ. The impact of follow-up telephone calls to patients after hospitalization. Dis Mon. 2002;48(4):239-248. PubMed
2. Sanchez GM, Douglass MA, Mancuso MA. Revisiting Project Re-Engineered Discharge (RED): The Impact of a Pharmacist Telephone Intervention on Hospital Readmission Rates. Pharmacotherapy. 2015;35(9):805-812. PubMed
3. Jones J, Clark W, Bradford J, Dougherty J. Efficacy of a telephone follow-up system in the emergency department. J Emerg Med. 1988;6(3):249-254. PubMed
4. Mistiaen P, Poot E. Telephone follow-up, initiated by a hospital-based health professional, for postdischarge problems in patients discharged from hospital to home. Cochrane Database Syst Rev. 2006(4):CD004510. PubMed
5. Lushaj EB, Nelson K, Amond K, Kenny E, Badami A, Anagnostopoulos PV. Timely Post-discharge Telephone Follow-Up is a Useful Tool in Identifying Post-discharge Complications Patients After Congenital Heart Surgery. Pediatr Cardiol. 2016;37(6):1106-1110. PubMed
6. McVay MR, Kelley KR, Mathews DL, Jackson RJ, Kokoska ER, Smith SD. Postoperative follow-up: is a phone call enough? J Pediatr Surg. 2008;43(1):83-86. PubMed
7. Chande VT, Exum V. Follow-up phone calls after an emergency department visit. Pediatrics. 1994;93(3):513-514. PubMed
8. Sutton D, Stanley P, Babl FE, Phillips F. Preventing or accelerating emergency care for children with complex healthcare needs. Arch Dis Child. 2008;93(1):17-22. PubMed
9. Patel PB, Vinson DR. Physician e-mail and telephone contact after emergency department visit improves patient satisfaction: a crossover trial. Ann Emerg Med. 2013;61(6):631-637. PubMed
10. Heath J, Dancel R, Stephens JR. Postdischarge phone calls after pediatric hospitalization: an observational study. Hosp Pediatr. 2015;5(5):241-248. PubMed
11. Biffl SE, Biffl WL. Improving transitions of care for complex pediatric trauma patients from inpatient rehabilitation to home: an observational pilot study. Patient Saf Surg. 2015;9:33-37. PubMed
12. AHRQ. Clinical Classifications Software (CCS) for ICD-9-CM. http://www.hcup-us.ahrq.gov/toolssoftware/ccs/ccs.jsp. Accessed on January 31,2012.
13. Feudtner C, Christakis DA, Connell FA. Pediatric deaths attributable to complex chronic conditions: a population-based study of Washington State, 1980-1997. Pediatrics. 2000;106(1 Pt 2):205-209. PubMed
14. Berry JG, Hall DE, Kuo DZ, et al. Hospital utilization and characteristics of patients experiencing recurrent readmissions within children’s hospitals. JAMA. 2011;305(7):682-690. PubMed
15. Palfrey JS, Walker DK, Haynie M, et al. Technology’s children: report of a statewide census of children dependent on medical supports. Pediatrics. 1991;87(5):611-618. PubMed
16. Feudtner C, Villareale NL, Morray B, Sharp V, Hays RM, Neff JM. Technology-dependency among patients discharged from a children’s hospital: a retrospective cohort study. BMC Pediatr. 2005;5(1):8-15. PubMed
17. Arora VM, Prochaska ML, Farnan JM, et al. Problems after discharge and understanding of communication with their primary care physicians among hospitalized seniors: a mixed methods study. J Hosp Med. 2010;5(7):385-391. PubMed
18. Brittan M, Tyler A, Martin S, et al. A Discharge Planning Template for the Electronic Medical Record Improves Scheduling of Neurology Follow-up for Comanaged Seizure Patients. Hosp Pediatr. 2014;4(6):366-371. PubMed
19. Hatoun J, Bair-Merritt M, Cabral H, Moses J. Increasing Medication Possession at Discharge for Patients With Asthma: The Meds-in-Hand Project. Pediatrics. 2016;137(3):e20150461. doi:10.1542/peds.2015-0461. PubMed
20. Berry JG, Goldmann DA, Mandl KD, et al. Health information management and perceptions of the quality of care for children with tracheotomy: a qualitative study. BMC Health Serv Res. 2011;11:117-125. PubMed
21. Berry JG, Ziniel SI, Freeman L, et al. Hospital readmission and parent perceptions of their child’s hospital discharge. Int J Qual Health Care. 2013;25(5):573-581. PubMed
22. Carusone SC, O’Leary B, McWatt S, Stewart A, Craig S, Brennan DJ. The Lived Experience of the Hospital Discharge “Plan”: A Longitudinal Qualitative Study of Complex Patients. J Hosp Med. 2017;12(1):5-10. PubMed
23. Leyenaar JK, O’Brien ER, Leslie LK, Lindenauer PK, Mangione-Smith RM. Families’ Priorities Regarding Hospital-to-Home Transitions for Children With Medical Complexity. Pediatrics. 2017;139(1):e20161581. doi:10.1542/peds.2016-1581. PubMed
© 2018 Society of Hospital Medicine
Use of Post-Acute Facility Care in Children Hospitalized With Acute Respiratory Illness
Respiratory illness (RI) is one of the most common reasons for pediatric hospitalization.1 Examples of RI include acute illness, such as bronchiolitis, bacterial pneumonia, and asthma, as well as chronic conditions, such as obstructive sleep apnea and chronic respiratory insufficiency. Hospital care for RI includes monitoring and treatment to optimize oxygenation, ventilation, hydration, and other body functions. Most previously healthy children hospitalized with RI stay in the hospital for a limited duration (eg, a few days) because the severity of their illness is short lived and they quickly return to their previous healthy status.2 However, hospital care is increasing for children with fragile and tenuous health due to complex medical conditions.3 RI is a common reason for hospitalization among these children as well and recovery of respiratory health and function can be slow and protracted for some of them.4 Weeks, months, or longer periods of time may be necessary for the children to return to their previous respiratory baseline health and function after hospital discharge; other children may not return to their baseline.5,6
Hospitalized older adults with high-severity RI are routinely streamlined for transfer to post-acute facility care (PAC) shortly (eg, a few days) after acute-care hospitalization. Nearly 70% of elderly Medicare beneficiaries use PAC following a brief length of stay (LOS) in the acute-care hospital.7 It is believed that PAC helps optimize the patients’ health and functional status and relieves the family caregiving burden that would have occurred at home.8-10 PAC use also helps to shorten acute-care hospitalization for RI while avoiding readmission.8-10 In contrast with adult patients, use of PAC for hospitalized children is not routine.11 While PAC use in children is infrequent, RI is one of the most common reasons for acute admission among children who use it.12
For some children with RI, PAC might be positioned to offer a safe, therapeutic, and high-value setting for pulmonary rehabilitation, as well as related medical, nutritional, functional, and family cares.6 PAC, by design, could possibly help some of the children transition back into their homes and communities. As studies continue to emerge that assess the value of PAC in children, it is important to learn more about the use of PAC in children hospitalized with RI. The objectives were to (1) assess which children admitted with RI are the most likely to use PAC services for recovery and (2) estimate how many hospitalized children not using PAC had the same characteristics as those who did.
METHODS
Study Design, Setting, and Population
We conducted a retrospective cohort analysis of 609,800 hospitalizations for RI occurring from January 1, 2010 to December 31, 2015, in 43 freestanding children’s hospitals in the Pediatric Health Information Systems (PHIS) dataset. All hospitals participating in PHIS are members of the Children’s Hospital Association.13 The Boston Children’s Hospital Institutional Review Board approved this study with a waiver for informed consent.
RI was identified using the Agency for Healthcare Research and Quality (AHRQ) Clinical Classification System (CCS).14 Using diagnosis CCS category 8 (“Diseases of the Respiratory System”) and the procedure CCS category 6 (“Operations on the Respiratory System”), we identified all hospitalizations from the participating hospitals with a principal diagnosis or procedure International Classification of Diseases, 9th Revision, Clinical Modification (ICD-9-CM) code for an RI.
Main Outcome Measure
Discharge disposition following the acute-care hospitalization for RI was the main outcome measure. We used PHIS uniform disposition coding to classify the discharge disposition as transfer to PAC (ie, rehabilitation facility, skilled nursing facility, etc.) vs all other dispositions (ie, routine to home, against medical advice, etc.).12 The PAC disposition category was derived from the Centers for Medicare & Medicaid Services Patient Discharge Status Codes and Hospital Transfer Policies as informed by the National Uniform Billing Committee Official UB-04 Data Specifications Manual, 2008. PAC transfer included disposition to external PAC facilities, as well as to internal, embedded PAC units residing in a few of the acute-care children’s hospitals included in the cohort.
Demographic and Clinical Characteristics
We assessed patient demographic and clinical characteristics that might correlate with PAC use following acute-care hospitalization for RI. Demographic characteristics included gender, age at admission in years, payer (public, private, and other), and race/ethnicity (Hispanic, non-Hispanic black, non-Hispanic white, other).
Clinical characteristics included chronic conditions (type and number) and assistance with medical technology. Chronic condition and medical technology characteristics were assessed with ICD-9-CM diagnosis codes. PHIS contain up to 41 ICD-9-CM diagnosis codes per hospital discharge record. To identify the presence and number of chronic conditions, we used the AHRQ Chronic Condition Indicator system, which categorizes over 14,000 ICD-9-CM diagnosis codes into chronic vs non-chronic conditions.14,15 Children hospitalized with a chronic condition were further classified as having a complex chronic condition (CCC) using Feudtner and colleagues’ ICD-9-CM diagnosis classification scheme.16 CCCs represent defined diagnosis groupings expected to last longer than 12 months and involving either a single organ system, severe enough to require specialty pediatric care and hospitalization, or multiple organ systems.17,18 Hospitalized children who were assisted with medical technology were identified with ICD-9-CM codes indicating the use of a medical device to manage and treat a chronic illness (eg, ventricular shunt to treat hydrocephalus) or to maintain basic body functions necessary for sustaining life (eg, a tracheostomy tube for breathing).19,20 We distinguished children undergoing tracheotomy during hospitalization using ICD-9-CM procedure codes 31.1 and 31.2.
Acute-Care Hospitalization Characteristics
We also assessed the relationship between acute-care hospitalization characteristics and use of PAC after discharge, including US census region, LOS, use of intensive care, number of medication classes administered, and use of enhanced respiratory support. Enhanced respiratory support was defined as use of continuous or bilevel positive airway pressure (CPAP or BiPAP) or mechanical ventilation during the acute-care hospitalization for RI. These respiratory supports were identified using billing data in PHIS.
Statistical Analysis
In bivariable analysis, we compared demographic, clinical, and hospitalization characteristics of hospitalized children with vs without discharge to PAC using Rao-Scott chi-square tests and Wilcoxon rank-sum tests as appropriate. In multivariable analysis, we derived a generalized linear mix effects model with fixed effects for demographic, clinical, and hospitalization characteristics that were associated with PAC at P < 0.1 in bivariable analysis (ie, age, gender, race/ethnicity, payer, medical technology, use of intensive care unit [ICU], use of positive pressure or mechanical ventilation, hospital region, LOS, new tracheostomy, existing tracheostomy, other technologies, number of medications, number of chronic conditions [of any complexity], and type of complex chronic conditions). We controlled for clustering of patients within hospitals by including a random intercept for each hospital. We also assessed combinations of patient characteristics on the likelihood of PAC use with classification and regression tree (CART) modeling. Using CART, we determined which characteristic combinations were associated with the highest and lowest use of PAC using binary split and post-pruning, goodness of fit rules.21 All statistical analyses were performed using SAS v.9.4 (SAS Institute, Cary, NC), and R v.3.2 (R Foundation for Statistical Computing, Vienna, Austria) using the “party” package. The threshold for statistical significance was set at P < 0.05.
RESULTS
Of the 609,800 hospitalizations for RI, PAC use after discharge occurred for 2660 (0.4%). RI discharges to PAC accounted for 2.1% (n = 67,405) of hospital days and 2.7% ($280 million) of hospital cost of all RI hospitalizations. For discharges to PAC, the most common RI were pneumonia (29.1% [n = 773]), respiratory failure or insufficiency (unspecified reason; 22.0% [n = 584]), and upper respiratory infection (12.2% [n = 323]).
Demographic Characteristics
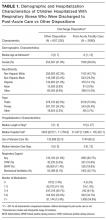

Median age at acute-care admission was higher for PAC vs non-PAC discharges (6 years [interquartile range {IQR} 1-15] vs 2 years [0-7], P < 0.001; Table 1). Hispanic patients accounted for a smaller percentage of RI discharges to PAC vs non-PAC (14.1% vs 21.8%, P < 0.001) and a higher percentage to PAC were for patients with public insurance (75.9% vs 62.5, P < 0.001; Table 1).
Clinical Characteristics
A greater percentage of RI hospitalizations discharged to PAC vs not-PAC had ≥1 CCC (94.9% vs 33.5%), including a neuromuscular CCC (57.5% vs 8.9%) or respiratory CCC (62.5% vs 12.0%), P < 0.001 for all (Table 2). A greater percentage discharged to PAC was assisted with medical technology (83.2% vs 15.1%), including respiratory technology (eg, tracheostomy; 53.8% vs 5.4%) and gastrointestinal technology (eg, gastrostomy; 71.9% vs 11.8%), P < 0.001 for all. Of the children with respiratory technology, 14.8% (n = 394) underwent tracheotomy during the acute-care hospitalization. Children discharged to PAC had a higher percentage of multiple chronic conditions. For example, the percentages of children discharged to PAC vs not with ≥7 conditions were 54.5% vs 7.0% (P < 0.001; Table 2). The most common chronic conditions experienced by children discharged to PAC included epilepsy (41.2%), gastroesophageal reflux (36.6%), cerebral palsy (28.2%), and asthma (18.2%).
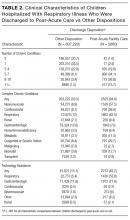
Hospitalization Characteristics

Acute-care RI hospitalization median LOS was longer for discharges to PAC vs non-PAC (10 days [IQR 4-27] vs 2 days [IQR 1-4], P < 0.001; Table 1). A greater percentage of discharges to PAC were administered medications from multiple classes during the acute-care RI admission (eg, 54.8% vs 13.4% used medications from ≥7 classes, P < 0.001). A greater percentage of discharges to PAC used intensive care services during the acute-care admission (65.6% vs 22.4%, P < 0.001). A greater percentage of discharges to PAC received CPAP (10.6 vs 5.0%), BiPAP (19.8% vs 11.4%), or mechanical ventilation (52.7% vs 9.1%) during the acute-care RI hospitalization (P < 0.001 for all; Table 1).
Multivariable Analysis of the Likelihood of Post-Acute Care Use Following Discharge
In multivariable analysis, the patient characteristics associated with the highest likelihood of discharge to PAC included ≥11 vs no chronic conditions (odds ratio [OR] 11.8 , 95% CI, 8.0-17.2), ≥9 classes vs no classes of medications administered during the acute-care hospitalization (OR 4.8 , 95% CI, 1.8-13.0), and existing tracheostomy (OR 3.0, [95% CI, 2.6-3.5; Figure 2 and eTable). Patient characteristics associated with a more modest likelihood of discharge to PAC included public vs private insurance (OR 1.8, 95% CI, 1.6-2.0), neuromuscular complex chronic condition (OR 1.6, 95% CI, 1.5-1.8), new tracheostomy (OR 1.9, 95% CI, 1.7-2.2), and use of any enhanced respiratory support (ie, CPAP/BiPAP/mechanical ventilation) during the acute-care hospitalization (OR 1.4, 95% CI, 1.3-1.6; Figure 2 and Supplementary Table).
Classification and Regression Tree Analysis
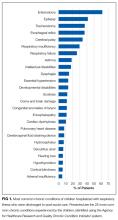

In the CART analysis, the highest percentage (6.3%) of children hospitalized with RI who were discharged to PAC had the following combination of characteristics: ≥6 chronic conditions, ≥7 classes of medications administered, and respiratory technology. Median (IQR) length of acute-care LOS for children with these attributes who were transferred to PAC was 19 (IQR 8-56; range 1-1005) days; LOS remained long (median 13 days [IQR 6-41, range 1-1413]) for children with the same attributes not transferred to PAC (n = 9448). Between these children transferred vs not to PAC, 79.3% vs 65.9% received ICU services; 74.4% vs 73.5% received CPAP, BiPAP, or mechanical ventilation; and 31.0% vs 22.7% underwent tracheotomy during the acute-care hospitalization. Of these children who were not transferred to PAC, 18.9% were discharged to home nursing services.
DISCUSSION
The findings from the present study suggest that patients with RI hospitalization in children’s hospitals who use PAC are medically complex, with high rates of multiple chronic conditions—including cerebral palsy, asthma, chronic respiratory insufficiency, dysphagia, epilepsy, and gastroesophageal reflux—and high rates of technology assistance including enterostomy and tracheostomy. The characteristics of patients most likely to use PAC include long LOS, a large number of chronic conditions, many types of medications administered during the acute-care hospitalization, respiratory technology use, and an underlying neuromuscular condition. Specifically, the highest percentage of children hospitalized with RI who were discharged to PAC had ≥6 chronic conditions, ≥7 classes of medications administered, and respiratory technology. Our analysis suggests that there may be a large population of children with these same characteristics who experienced a prolonged LOS but were not transferred to PAC.
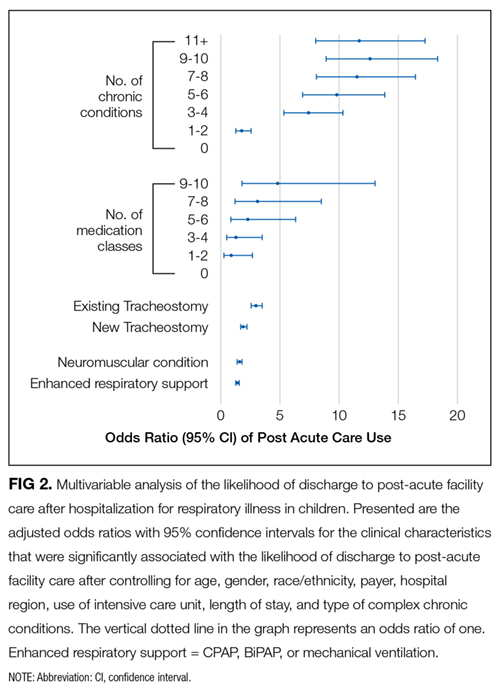
There are several reasons to explain why children hospitalized with RI who rely on medical technology, such as existing tracheostomy, are more likely to use PAC. Tracheostomy often indicates the presence of life-limiting impairment in oxygenation or ventilation, thereby representing a high degree of medical fragility. Tracheostomy, in some cases, offers enhanced ability to assist with RI treatment, including establishment of airway clearance of secretions (ie, suctioning and chest physiotherapy), administration of antimicrobials (eg, nebulized antibiotics), and optimization of ventilation (eg, non-invasive positive airway pressure). However, not all acute-care inpatient clinicians have experience and clinical proficiencies in the care of children with pediatric tracheostomy.23 As a result, a more cautious approach, with prolonged LOS and gradual arrival to hospital discharge, is often taken in the acute-care hospital setting for children with tracheostomy. Tracheostomy care delivered during recovery from RI by trained and experienced teams of providers in the PAC setting may be best positioned to help optimize respiratory health and ensure proper family education and readiness to continue care at home.6
Further investigation is needed of the long LOS in children not transferred to PAC who had similar characteristics to those who were transferred. In hospitalized adult patients with RI, PAC is routinely introduced early in the admission process, with anticipated transfer within a few days into the hospitalization. In the current study, LOS was nearly 2 weeks or longer in many children not transferred to PAC who had similar characteristics to those who were transferred. Perhaps some of the children not transferred experienced long LOS in the acute-care hospital because of a limited number of pediatric PAC beds in their local area. Some families of these children may have been offered but declined use of PAC. PAC may not have been offered to some because illness acuity was too high or there was lack of PAC awareness as a possible setting for recovery.
There are several limitations to this study. PHIS does not contain non-freestanding children’s hospitals; therefore, the study results may generalize best to children’s hospitals. PHIS does not contain information on the amount (eg, number of days used), cost, or treatments provided in PAC. Therefore, we were unable to determine the true reasons why children used PAC services following RI hospitalization (eg, for respiratory rehabilitation vs other reasons, such as epilepsy or nutrition/hydration management). Moreover, we could not assess which children truly used PAC for short-term recovery vs longer-term care because they were unable to reside at home (eg, they were too medically complex). We were unable to assess PAC availability (eg, number of beds) in the surrounding areas of the acute-care hospitals in the PHIS database. Although we assessed use of medical technology, PHIS does not contain data on functional status or activities of daily living, which correlate with the use of PAC in adults. We could not distinguish whether children receiving BiPAP, CPAP, or mechanical ventilation during hospitalization were using it chronically. Although higher PAC use was associated with public insurance, due to absent information on the children’s home, family, and social environment, we were unable to assess whether PAC use was influenced by limited caregiving support or resources.
Data on the type and number of chronic conditions are limited by the ICD-9-CM codes available to distinguish them. Although several patient demographic and clinical characteristics were significantly associated with the use of PAC, significance may have occurred because of the large sample size and consequent robust statistical power. This is why we elected to highlight and discuss the characteristics with the strongest and most clinically meaningful associations (eg, multiple chronic conditions). There may be additional characteristics, including social, familial, and community resources, that are not available to assess in PHIS that could have affected PAC use.
Despite these limitations, the current study suggests that the characteristics of children hospitalized with RI who use PAC for recovery are evident and that there is a large population of children with these characteristics who experienced a prolonged LOS that did not result in transfer to PAC. These findings could be used in subsequent studies to help create the base of a matched cohort of children with similar clinical, demographic, and hospitalization characteristics who used vs didn’t use PAC. Comparison of the functional status, health trajectory, and family and/or social attributes of these 2 groups of children, as well as their post-discharge outcomes and utilization (eg, length of PAC stay, emergency department revisits, and acute-care hospital readmissions), could occur with chart review, clinician and parent interview, and other methods. This body of work might ultimately lead to an assessment of value in PAC and potentially help us understand the need for PAC capacity in various communities. In the meantime, clinicians may find it useful to consider the results of the current study when contemplating PAC use in their hospitalized children with RI, including exploration of health system opportunities of clinical collaboration between acute-care children’s hospitals and PAC facilities. Ultimately, all of this work will generate meaningful knowledge regarding the most appropriate, safe, and cost-effective settings for hospitalized children with RI to regain their health.
Acknowledgments
Dr. Berry was supported by the Agency for Healthcare Research and Quality (R21 HS023092-01), the Lucile Packard Foundation for Children’s Health, and Franciscan Hospital for Children. The funders were not involved in the design and conduct of the study; collection, management, analysis, and interpretation of the data; and preparation, review, or approval of the manuscript; and decision to submit the manuscript for publication.
Disclosure: The authors have no financial relationships relevant to this article to disclose.
1. Friedman B, Berdahl T, Simpson LA, et al. Annual report on health care for children and youth in the United States: focus on trends in hospital use and quality. Acad Pediatr. 2011;11(4):263-279. PubMed
2. Srivastava R, Homer CJ. Length of stay for common pediatric conditions: teaching versus nonteaching hospitals. Pediatrics. 2003;112(2):278-281. PubMed
3. Berry JG, Hall M, Hall DE, et al. Inpatient growth and resource use in 28 children’s hospitals: a longitudinal, multi-institutional study. JAMA Pediatr. 2013;167(2):170-177. PubMed
4. Gold JM, Hall M, Shah SS, et al. Long length of hospital stay in children with medical complexity. J Hosp Med. 2016;11(11):750-756. PubMed
5. Faultner J. Integrating medical plans within family life. JAMA Pediatr. 2014;168(10):891-892. PubMed
6. O’Brien JE, Haley SM, Dumas HM, et al. Outcomes of post-acute hospital episodes for young children requiring airway support. Dev Neurorehabil. 2007;10(3):241-247. PubMed
7. Morley M, Bogasky S, Gage B, et al. Medicare post-acute care episodes and payment bundling. Medicare Medicaid Res Rev. 2014;4(1):mmrr.004.01.b02. PubMed
8. Mentro AM, Steward DK. Caring for medically fragile children in the home: an alternative theoretical approach. Res Theory Nurs Pract. 2002;16(3):161-177. PubMed
9. Thyen U, Kuhlthau K, Perrin JM. Employment, child care, and mental health of mothers caring for children assisted by technology. Pediatrics. 1999;103(6 Pt 1):1235-1242. PubMed
10. Thyen U, Terres NM, Yazdgerdi SR, Perrin JM. Impact of long-term care of children assisted by technology on maternal health. J Dev Behav Pediatr. 1998;19(4):273-282. PubMed
11. O’Brien JE, Berry J, Dumas H. Pediatric Post-acute hospital care: striving for identity and value. Hosp Pediatr. 2015;5(10):548-551. PubMed
12. Berry JG, Hall M, Dumas H, et al. Pediatric hospital discharges to home health and postacute facility care: a national study. JAMA Pediatr. 2016;170(4):326-333. PubMed
13. Children’s Hospital Association. Pediatric Health Information System. https://childrenshospitals.org/Programs-and-Services/Data-Analytics-and-Research/Pediatric-Analytic-Solutions/Pediatric-Health-Information-System. Accessed June 12, 2017.
14. Agency for Healthcare Research and Quality. Chronic Condition Indicator. http://www.hcup-us.ahrq.gov/toolssoftware/chronic/chronic.jsp. Accessed on June 19, 2017.
15. Berry JG, Ash AS, Cohen E, Hasan F, Feudtner C, Hall M. Contributions of children with multiple chronic conditions to pediatric hospitalizations in the United States: A Retrospective Cohort Analysis [published online ahead of print June 20, 2017]. Hosp Pediatr. 2017 Jun 20. doi: 10.1542/hpeds.2016-0179. PubMed
16. Feudtner C, Feinstein JA, Zhong W, Hall M, Dai D. Pediatric complex chronic conditions classification system version 2: updated for ICD-10 and complex medical technology dependence and transplantation. BMC Pediatr. 2014;14:199. PubMed
17. Cohen E, Kuo DZ, Agrawal R, et al. Children with medical complexity: an emerging population for clinical and research initiatives. Pediatrics. 2011;127(3):529-538. PubMed
18. Feudtner C, Christakis DA, Connell FA. Pediatric deaths attributable to complex chronic conditions: a population-based study of Washington State, 1980-1997. Pediatrics. 2000;106(1 Pt 2):205-209. PubMed
19. Palfrey JS, Walker DK, Haynie M, et al. Technology’s children: report of a statewide census of children dependent on medical supports. Pediatrics. 1991;87(5):611-618. PubMed
20. Feudtner C, Villareale NL, Morray B, Sharp V, Hays RM, Neff JM. Technology-dependency among patients discharged from a children’s hospital: a retrospective cohort study. BMC Pediatr. 2005;5(1):8. PubMed
21. Breiman L, Freidman J, Stone CJ, Olshen RA. Classification and Regression Trees. Belmont, CA: Wadsworth International; 1984.
22. Thomson J, Hall M, Ambroggio L, et al. Aspiration and Non-Aspiration Pneumonia in Hospitalized Children With Neurologic Impairment. Pediatrics. 2016;137(2):e20151612. PubMed
23. Berry JG, Goldmann DA, Mandl KD, et al. Health information management and perceptions of the quality of care for children with tracheotomy: a qualitative study. BMC Health Serv Res. 2011;11:117. PubMed
Respiratory illness (RI) is one of the most common reasons for pediatric hospitalization.1 Examples of RI include acute illness, such as bronchiolitis, bacterial pneumonia, and asthma, as well as chronic conditions, such as obstructive sleep apnea and chronic respiratory insufficiency. Hospital care for RI includes monitoring and treatment to optimize oxygenation, ventilation, hydration, and other body functions. Most previously healthy children hospitalized with RI stay in the hospital for a limited duration (eg, a few days) because the severity of their illness is short lived and they quickly return to their previous healthy status.2 However, hospital care is increasing for children with fragile and tenuous health due to complex medical conditions.3 RI is a common reason for hospitalization among these children as well and recovery of respiratory health and function can be slow and protracted for some of them.4 Weeks, months, or longer periods of time may be necessary for the children to return to their previous respiratory baseline health and function after hospital discharge; other children may not return to their baseline.5,6
Hospitalized older adults with high-severity RI are routinely streamlined for transfer to post-acute facility care (PAC) shortly (eg, a few days) after acute-care hospitalization. Nearly 70% of elderly Medicare beneficiaries use PAC following a brief length of stay (LOS) in the acute-care hospital.7 It is believed that PAC helps optimize the patients’ health and functional status and relieves the family caregiving burden that would have occurred at home.8-10 PAC use also helps to shorten acute-care hospitalization for RI while avoiding readmission.8-10 In contrast with adult patients, use of PAC for hospitalized children is not routine.11 While PAC use in children is infrequent, RI is one of the most common reasons for acute admission among children who use it.12
For some children with RI, PAC might be positioned to offer a safe, therapeutic, and high-value setting for pulmonary rehabilitation, as well as related medical, nutritional, functional, and family cares.6 PAC, by design, could possibly help some of the children transition back into their homes and communities. As studies continue to emerge that assess the value of PAC in children, it is important to learn more about the use of PAC in children hospitalized with RI. The objectives were to (1) assess which children admitted with RI are the most likely to use PAC services for recovery and (2) estimate how many hospitalized children not using PAC had the same characteristics as those who did.
METHODS
Study Design, Setting, and Population
We conducted a retrospective cohort analysis of 609,800 hospitalizations for RI occurring from January 1, 2010 to December 31, 2015, in 43 freestanding children’s hospitals in the Pediatric Health Information Systems (PHIS) dataset. All hospitals participating in PHIS are members of the Children’s Hospital Association.13 The Boston Children’s Hospital Institutional Review Board approved this study with a waiver for informed consent.
RI was identified using the Agency for Healthcare Research and Quality (AHRQ) Clinical Classification System (CCS).14 Using diagnosis CCS category 8 (“Diseases of the Respiratory System”) and the procedure CCS category 6 (“Operations on the Respiratory System”), we identified all hospitalizations from the participating hospitals with a principal diagnosis or procedure International Classification of Diseases, 9th Revision, Clinical Modification (ICD-9-CM) code for an RI.
Main Outcome Measure
Discharge disposition following the acute-care hospitalization for RI was the main outcome measure. We used PHIS uniform disposition coding to classify the discharge disposition as transfer to PAC (ie, rehabilitation facility, skilled nursing facility, etc.) vs all other dispositions (ie, routine to home, against medical advice, etc.).12 The PAC disposition category was derived from the Centers for Medicare & Medicaid Services Patient Discharge Status Codes and Hospital Transfer Policies as informed by the National Uniform Billing Committee Official UB-04 Data Specifications Manual, 2008. PAC transfer included disposition to external PAC facilities, as well as to internal, embedded PAC units residing in a few of the acute-care children’s hospitals included in the cohort.
Demographic and Clinical Characteristics
We assessed patient demographic and clinical characteristics that might correlate with PAC use following acute-care hospitalization for RI. Demographic characteristics included gender, age at admission in years, payer (public, private, and other), and race/ethnicity (Hispanic, non-Hispanic black, non-Hispanic white, other).
Clinical characteristics included chronic conditions (type and number) and assistance with medical technology. Chronic condition and medical technology characteristics were assessed with ICD-9-CM diagnosis codes. PHIS contain up to 41 ICD-9-CM diagnosis codes per hospital discharge record. To identify the presence and number of chronic conditions, we used the AHRQ Chronic Condition Indicator system, which categorizes over 14,000 ICD-9-CM diagnosis codes into chronic vs non-chronic conditions.14,15 Children hospitalized with a chronic condition were further classified as having a complex chronic condition (CCC) using Feudtner and colleagues’ ICD-9-CM diagnosis classification scheme.16 CCCs represent defined diagnosis groupings expected to last longer than 12 months and involving either a single organ system, severe enough to require specialty pediatric care and hospitalization, or multiple organ systems.17,18 Hospitalized children who were assisted with medical technology were identified with ICD-9-CM codes indicating the use of a medical device to manage and treat a chronic illness (eg, ventricular shunt to treat hydrocephalus) or to maintain basic body functions necessary for sustaining life (eg, a tracheostomy tube for breathing).19,20 We distinguished children undergoing tracheotomy during hospitalization using ICD-9-CM procedure codes 31.1 and 31.2.
Acute-Care Hospitalization Characteristics
We also assessed the relationship between acute-care hospitalization characteristics and use of PAC after discharge, including US census region, LOS, use of intensive care, number of medication classes administered, and use of enhanced respiratory support. Enhanced respiratory support was defined as use of continuous or bilevel positive airway pressure (CPAP or BiPAP) or mechanical ventilation during the acute-care hospitalization for RI. These respiratory supports were identified using billing data in PHIS.
Statistical Analysis
In bivariable analysis, we compared demographic, clinical, and hospitalization characteristics of hospitalized children with vs without discharge to PAC using Rao-Scott chi-square tests and Wilcoxon rank-sum tests as appropriate. In multivariable analysis, we derived a generalized linear mix effects model with fixed effects for demographic, clinical, and hospitalization characteristics that were associated with PAC at P < 0.1 in bivariable analysis (ie, age, gender, race/ethnicity, payer, medical technology, use of intensive care unit [ICU], use of positive pressure or mechanical ventilation, hospital region, LOS, new tracheostomy, existing tracheostomy, other technologies, number of medications, number of chronic conditions [of any complexity], and type of complex chronic conditions). We controlled for clustering of patients within hospitals by including a random intercept for each hospital. We also assessed combinations of patient characteristics on the likelihood of PAC use with classification and regression tree (CART) modeling. Using CART, we determined which characteristic combinations were associated with the highest and lowest use of PAC using binary split and post-pruning, goodness of fit rules.21 All statistical analyses were performed using SAS v.9.4 (SAS Institute, Cary, NC), and R v.3.2 (R Foundation for Statistical Computing, Vienna, Austria) using the “party” package. The threshold for statistical significance was set at P < 0.05.
RESULTS
Of the 609,800 hospitalizations for RI, PAC use after discharge occurred for 2660 (0.4%). RI discharges to PAC accounted for 2.1% (n = 67,405) of hospital days and 2.7% ($280 million) of hospital cost of all RI hospitalizations. For discharges to PAC, the most common RI were pneumonia (29.1% [n = 773]), respiratory failure or insufficiency (unspecified reason; 22.0% [n = 584]), and upper respiratory infection (12.2% [n = 323]).
Demographic Characteristics
Median age at acute-care admission was higher for PAC vs non-PAC discharges (6 years [interquartile range {IQR} 1-15] vs 2 years [0-7], P < 0.001; Table 1). Hispanic patients accounted for a smaller percentage of RI discharges to PAC vs non-PAC (14.1% vs 21.8%, P < 0.001) and a higher percentage to PAC were for patients with public insurance (75.9% vs 62.5, P < 0.001; Table 1).
Clinical Characteristics
A greater percentage of RI hospitalizations discharged to PAC vs not-PAC had ≥1 CCC (94.9% vs 33.5%), including a neuromuscular CCC (57.5% vs 8.9%) or respiratory CCC (62.5% vs 12.0%), P < 0.001 for all (Table 2). A greater percentage discharged to PAC was assisted with medical technology (83.2% vs 15.1%), including respiratory technology (eg, tracheostomy; 53.8% vs 5.4%) and gastrointestinal technology (eg, gastrostomy; 71.9% vs 11.8%), P < 0.001 for all. Of the children with respiratory technology, 14.8% (n = 394) underwent tracheotomy during the acute-care hospitalization. Children discharged to PAC had a higher percentage of multiple chronic conditions. For example, the percentages of children discharged to PAC vs not with ≥7 conditions were 54.5% vs 7.0% (P < 0.001; Table 2). The most common chronic conditions experienced by children discharged to PAC included epilepsy (41.2%), gastroesophageal reflux (36.6%), cerebral palsy (28.2%), and asthma (18.2%).
Hospitalization Characteristics
Acute-care RI hospitalization median LOS was longer for discharges to PAC vs non-PAC (10 days [IQR 4-27] vs 2 days [IQR 1-4], P < 0.001; Table 1). A greater percentage of discharges to PAC were administered medications from multiple classes during the acute-care RI admission (eg, 54.8% vs 13.4% used medications from ≥7 classes, P < 0.001). A greater percentage of discharges to PAC used intensive care services during the acute-care admission (65.6% vs 22.4%, P < 0.001). A greater percentage of discharges to PAC received CPAP (10.6 vs 5.0%), BiPAP (19.8% vs 11.4%), or mechanical ventilation (52.7% vs 9.1%) during the acute-care RI hospitalization (P < 0.001 for all; Table 1).
Multivariable Analysis of the Likelihood of Post-Acute Care Use Following Discharge
In multivariable analysis, the patient characteristics associated with the highest likelihood of discharge to PAC included ≥11 vs no chronic conditions (odds ratio [OR] 11.8 , 95% CI, 8.0-17.2), ≥9 classes vs no classes of medications administered during the acute-care hospitalization (OR 4.8 , 95% CI, 1.8-13.0), and existing tracheostomy (OR 3.0, [95% CI, 2.6-3.5; Figure 2 and eTable). Patient characteristics associated with a more modest likelihood of discharge to PAC included public vs private insurance (OR 1.8, 95% CI, 1.6-2.0), neuromuscular complex chronic condition (OR 1.6, 95% CI, 1.5-1.8), new tracheostomy (OR 1.9, 95% CI, 1.7-2.2), and use of any enhanced respiratory support (ie, CPAP/BiPAP/mechanical ventilation) during the acute-care hospitalization (OR 1.4, 95% CI, 1.3-1.6; Figure 2 and Supplementary Table).
Classification and Regression Tree Analysis
In the CART analysis, the highest percentage (6.3%) of children hospitalized with RI who were discharged to PAC had the following combination of characteristics: ≥6 chronic conditions, ≥7 classes of medications administered, and respiratory technology. Median (IQR) length of acute-care LOS for children with these attributes who were transferred to PAC was 19 (IQR 8-56; range 1-1005) days; LOS remained long (median 13 days [IQR 6-41, range 1-1413]) for children with the same attributes not transferred to PAC (n = 9448). Between these children transferred vs not to PAC, 79.3% vs 65.9% received ICU services; 74.4% vs 73.5% received CPAP, BiPAP, or mechanical ventilation; and 31.0% vs 22.7% underwent tracheotomy during the acute-care hospitalization. Of these children who were not transferred to PAC, 18.9% were discharged to home nursing services.
DISCUSSION
The findings from the present study suggest that patients with RI hospitalization in children’s hospitals who use PAC are medically complex, with high rates of multiple chronic conditions—including cerebral palsy, asthma, chronic respiratory insufficiency, dysphagia, epilepsy, and gastroesophageal reflux—and high rates of technology assistance including enterostomy and tracheostomy. The characteristics of patients most likely to use PAC include long LOS, a large number of chronic conditions, many types of medications administered during the acute-care hospitalization, respiratory technology use, and an underlying neuromuscular condition. Specifically, the highest percentage of children hospitalized with RI who were discharged to PAC had ≥6 chronic conditions, ≥7 classes of medications administered, and respiratory technology. Our analysis suggests that there may be a large population of children with these same characteristics who experienced a prolonged LOS but were not transferred to PAC.
There are several reasons to explain why children hospitalized with RI who rely on medical technology, such as existing tracheostomy, are more likely to use PAC. Tracheostomy often indicates the presence of life-limiting impairment in oxygenation or ventilation, thereby representing a high degree of medical fragility. Tracheostomy, in some cases, offers enhanced ability to assist with RI treatment, including establishment of airway clearance of secretions (ie, suctioning and chest physiotherapy), administration of antimicrobials (eg, nebulized antibiotics), and optimization of ventilation (eg, non-invasive positive airway pressure). However, not all acute-care inpatient clinicians have experience and clinical proficiencies in the care of children with pediatric tracheostomy.23 As a result, a more cautious approach, with prolonged LOS and gradual arrival to hospital discharge, is often taken in the acute-care hospital setting for children with tracheostomy. Tracheostomy care delivered during recovery from RI by trained and experienced teams of providers in the PAC setting may be best positioned to help optimize respiratory health and ensure proper family education and readiness to continue care at home.6
Further investigation is needed of the long LOS in children not transferred to PAC who had similar characteristics to those who were transferred. In hospitalized adult patients with RI, PAC is routinely introduced early in the admission process, with anticipated transfer within a few days into the hospitalization. In the current study, LOS was nearly 2 weeks or longer in many children not transferred to PAC who had similar characteristics to those who were transferred. Perhaps some of the children not transferred experienced long LOS in the acute-care hospital because of a limited number of pediatric PAC beds in their local area. Some families of these children may have been offered but declined use of PAC. PAC may not have been offered to some because illness acuity was too high or there was lack of PAC awareness as a possible setting for recovery.
There are several limitations to this study. PHIS does not contain non-freestanding children’s hospitals; therefore, the study results may generalize best to children’s hospitals. PHIS does not contain information on the amount (eg, number of days used), cost, or treatments provided in PAC. Therefore, we were unable to determine the true reasons why children used PAC services following RI hospitalization (eg, for respiratory rehabilitation vs other reasons, such as epilepsy or nutrition/hydration management). Moreover, we could not assess which children truly used PAC for short-term recovery vs longer-term care because they were unable to reside at home (eg, they were too medically complex). We were unable to assess PAC availability (eg, number of beds) in the surrounding areas of the acute-care hospitals in the PHIS database. Although we assessed use of medical technology, PHIS does not contain data on functional status or activities of daily living, which correlate with the use of PAC in adults. We could not distinguish whether children receiving BiPAP, CPAP, or mechanical ventilation during hospitalization were using it chronically. Although higher PAC use was associated with public insurance, due to absent information on the children’s home, family, and social environment, we were unable to assess whether PAC use was influenced by limited caregiving support or resources.
Data on the type and number of chronic conditions are limited by the ICD-9-CM codes available to distinguish them. Although several patient demographic and clinical characteristics were significantly associated with the use of PAC, significance may have occurred because of the large sample size and consequent robust statistical power. This is why we elected to highlight and discuss the characteristics with the strongest and most clinically meaningful associations (eg, multiple chronic conditions). There may be additional characteristics, including social, familial, and community resources, that are not available to assess in PHIS that could have affected PAC use.
Despite these limitations, the current study suggests that the characteristics of children hospitalized with RI who use PAC for recovery are evident and that there is a large population of children with these characteristics who experienced a prolonged LOS that did not result in transfer to PAC. These findings could be used in subsequent studies to help create the base of a matched cohort of children with similar clinical, demographic, and hospitalization characteristics who used vs didn’t use PAC. Comparison of the functional status, health trajectory, and family and/or social attributes of these 2 groups of children, as well as their post-discharge outcomes and utilization (eg, length of PAC stay, emergency department revisits, and acute-care hospital readmissions), could occur with chart review, clinician and parent interview, and other methods. This body of work might ultimately lead to an assessment of value in PAC and potentially help us understand the need for PAC capacity in various communities. In the meantime, clinicians may find it useful to consider the results of the current study when contemplating PAC use in their hospitalized children with RI, including exploration of health system opportunities of clinical collaboration between acute-care children’s hospitals and PAC facilities. Ultimately, all of this work will generate meaningful knowledge regarding the most appropriate, safe, and cost-effective settings for hospitalized children with RI to regain their health.
Acknowledgments
Dr. Berry was supported by the Agency for Healthcare Research and Quality (R21 HS023092-01), the Lucile Packard Foundation for Children’s Health, and Franciscan Hospital for Children. The funders were not involved in the design and conduct of the study; collection, management, analysis, and interpretation of the data; and preparation, review, or approval of the manuscript; and decision to submit the manuscript for publication.
Disclosure: The authors have no financial relationships relevant to this article to disclose.
1. Friedman B, Berdahl T, Simpson LA, et al. Annual report on health care for children and youth in the United States: focus on trends in hospital use and quality. Acad Pediatr. 2011;11(4):263-279. PubMed
2. Srivastava R, Homer CJ. Length of stay for common pediatric conditions: teaching versus nonteaching hospitals. Pediatrics. 2003;112(2):278-281. PubMed
3. Berry JG, Hall M, Hall DE, et al. Inpatient growth and resource use in 28 children’s hospitals: a longitudinal, multi-institutional study. JAMA Pediatr. 2013;167(2):170-177. PubMed
4. Gold JM, Hall M, Shah SS, et al. Long length of hospital stay in children with medical complexity. J Hosp Med. 2016;11(11):750-756. PubMed
5. Faultner J. Integrating medical plans within family life. JAMA Pediatr. 2014;168(10):891-892. PubMed
6. O’Brien JE, Haley SM, Dumas HM, et al. Outcomes of post-acute hospital episodes for young children requiring airway support. Dev Neurorehabil. 2007;10(3):241-247. PubMed
7. Morley M, Bogasky S, Gage B, et al. Medicare post-acute care episodes and payment bundling. Medicare Medicaid Res Rev. 2014;4(1):mmrr.004.01.b02. PubMed
8. Mentro AM, Steward DK. Caring for medically fragile children in the home: an alternative theoretical approach. Res Theory Nurs Pract. 2002;16(3):161-177. PubMed
9. Thyen U, Kuhlthau K, Perrin JM. Employment, child care, and mental health of mothers caring for children assisted by technology. Pediatrics. 1999;103(6 Pt 1):1235-1242. PubMed
10. Thyen U, Terres NM, Yazdgerdi SR, Perrin JM. Impact of long-term care of children assisted by technology on maternal health. J Dev Behav Pediatr. 1998;19(4):273-282. PubMed
11. O’Brien JE, Berry J, Dumas H. Pediatric Post-acute hospital care: striving for identity and value. Hosp Pediatr. 2015;5(10):548-551. PubMed
12. Berry JG, Hall M, Dumas H, et al. Pediatric hospital discharges to home health and postacute facility care: a national study. JAMA Pediatr. 2016;170(4):326-333. PubMed
13. Children’s Hospital Association. Pediatric Health Information System. https://childrenshospitals.org/Programs-and-Services/Data-Analytics-and-Research/Pediatric-Analytic-Solutions/Pediatric-Health-Information-System. Accessed June 12, 2017.
14. Agency for Healthcare Research and Quality. Chronic Condition Indicator. http://www.hcup-us.ahrq.gov/toolssoftware/chronic/chronic.jsp. Accessed on June 19, 2017.
15. Berry JG, Ash AS, Cohen E, Hasan F, Feudtner C, Hall M. Contributions of children with multiple chronic conditions to pediatric hospitalizations in the United States: A Retrospective Cohort Analysis [published online ahead of print June 20, 2017]. Hosp Pediatr. 2017 Jun 20. doi: 10.1542/hpeds.2016-0179. PubMed
16. Feudtner C, Feinstein JA, Zhong W, Hall M, Dai D. Pediatric complex chronic conditions classification system version 2: updated for ICD-10 and complex medical technology dependence and transplantation. BMC Pediatr. 2014;14:199. PubMed
17. Cohen E, Kuo DZ, Agrawal R, et al. Children with medical complexity: an emerging population for clinical and research initiatives. Pediatrics. 2011;127(3):529-538. PubMed
18. Feudtner C, Christakis DA, Connell FA. Pediatric deaths attributable to complex chronic conditions: a population-based study of Washington State, 1980-1997. Pediatrics. 2000;106(1 Pt 2):205-209. PubMed
19. Palfrey JS, Walker DK, Haynie M, et al. Technology’s children: report of a statewide census of children dependent on medical supports. Pediatrics. 1991;87(5):611-618. PubMed
20. Feudtner C, Villareale NL, Morray B, Sharp V, Hays RM, Neff JM. Technology-dependency among patients discharged from a children’s hospital: a retrospective cohort study. BMC Pediatr. 2005;5(1):8. PubMed
21. Breiman L, Freidman J, Stone CJ, Olshen RA. Classification and Regression Trees. Belmont, CA: Wadsworth International; 1984.
22. Thomson J, Hall M, Ambroggio L, et al. Aspiration and Non-Aspiration Pneumonia in Hospitalized Children With Neurologic Impairment. Pediatrics. 2016;137(2):e20151612. PubMed
23. Berry JG, Goldmann DA, Mandl KD, et al. Health information management and perceptions of the quality of care for children with tracheotomy: a qualitative study. BMC Health Serv Res. 2011;11:117. PubMed
© 2017 Society of Hospital Medicine
LOS in Children With Medical Complexity
Children with medical complexity (CMC) have complex and chronic health conditions that often involve multiple organ systems and severely affect cognitive and physical functioning. Although the prevalence of CMC is low (1% of all children), they account for nearly one‐fifth of all pediatric admissions and one‐half of all hospital days and charges in the United States.[1] Over the last decade, CMC have had a particularly large and increasing impact in tertiary‐care children's hospitals.[1, 2] The Institute of Medicine has identified CMC as a priority population for a revised healthcare system.[3]
Medical homes, hospitals, health plans, states, federal agencies, and others are striving to reduce excessive hospital use in CMC because of its high cost.[4, 5, 6] Containing length of stay (LOS)an increasingly used indicator of the time sensitiveness and efficiency of hospital careis a common aim across these initiatives. CMC have longer hospitalizations than children without medical complexity. Speculated reasons for this are that CMC tend to have (1) higher severity of acute illnesses (eg, pneumonia, cellulitis), (2) prolonged recovery time in the hospital, and (3) higher risk of adverse events in the hospital. Moreover, hospital clinicians caring for CMC often find it difficult to determine discharge readiness, given that many CMC do not return to a completely healthy baseline.[7]
Little is known about long LOS in CMC, including which CMC have the highest risk of experiencing such stays and which stays might have the greatest opportunity to be shortened. Patient characteristics associated with prolonged length of stay have been studied extensively for many pediatric conditions (eg, asthma).[8, 9, 10, 11, 12, 13, 14] However, most of these studies excluded CMC. Therefore, the objectives of this study were to examine (1) the prevalence of long LOS in CMC, (2) patient characteristics associated with long LOS, and (3) hospital‐to‐hospital variation in prevalence of long LOS hospitalizations.
METHODS
Study Design and Data Source
This study is a multicenter, retrospective cohort analysis of the Pediatric Health Information System (PHIS). PHIS is an administrative database of 44 not for profit, tertiary care pediatric hospitals affiliated with the Children's Hospital Association (CHA) (Overland Park, KS). PHIS contains data regarding patient demographics, diagnoses, and procedures (with International Classification of Diseases, 9th Revision, Clinical Modification [ICD‐9‐CM] codes), All‐Patient Refined Diagnostic Related Groups version 30 (APR‐DRGs) (3M Health Information Systems, Salt Lake City, UT), and service lines that aggregate the APR‐DRGs into 38 distinct groups. Data quality and reliability are assured through CHA and participating hospitals. In accordance with the policies of the Cincinnati Children's Hospital Medical Center Institutional Review Board, this study of deidentified data was not considered human subjects research.
Study Population
Inclusion Criteria
Children discharged following an observation or inpatient admission from a hospital participating in the PHIS database between January 1, 2013 and December 31, 2014 were eligible for inclusion if they were considered medically complex. Medical complexity was defined using Clinical Risk Groups (CRGs) version 1.8, developed by 3M Health Information Systems and the National Association of Children's Hospitals and Related Institutions. CRGs were used to assign each hospitalized patient to 1 of 9 mutually exclusive chronicity groups according to the presence, type, and severity of chronic conditions.[15, 16, 17, 18] Each patient's CRG designation was based on 2 years of previous hospital encounters.
As defined in prior studies and definitional frameworks of CMC,[1] patients belonging to CRG group 6 (significant chronic disease in 2 organ systems), CRG group 7 (dominant chronic disease in 3 organ systems), and CRG group 9 (catastrophic condition) were considered medically complex.[17, 19] Patients with malignancies (CRG group 8) were not included for analysis because they are a unique population with anticipated, long hospital stays. Patients with CRG group 5, representing those with chronic conditions affecting a single body system, were also not included because most do not have attributes consistent with medical complexity.
Exclusion Criteria
We used the APR‐DRG system, which leverages ICD‐9‐CM codes to identify the health problem most responsible for the hospitalization, to refine the study cohort. We excluded hospitalizations that were classified by the APR‐DRG system as neonatal, as we did not wish to focus on LOS in the neonatal intensive care unit (ICU) or for birth admissions. Similarly, hospitalizations for chemotherapy (APR‐DRG 693) or malignancy (identified with previously used ICD‐9‐CM codes)[20] were also excluded because long LOS is anticipated. We also excluded hospitalizations for medical rehabilitation (APR‐DRG 860).
Outcome Measures
The primary outcome measure was long LOS, defined as LOS 10 days. The cut point of LOS 10 days represents the 90th percentile of LOS for all children, with and without medical complexity, hospitalized during 2013 to 2014. LOS 10 days has previously been used as a threshold of long LOS.[21] For hospitalizations involving transfer at admission from another acute care facility, LOS was measured from the date of transfer. We also assessed hospitals' cost attributable to long LOS admissions.
Patient Demographics and Clinical Characteristics
We measured demographic characteristics including age, gender, race/ethnicity, insurance type, and distance traveled (the linear distance between the centroid of the patient's home ZIP code and the centroid of the hospital's ZIP code). Clinical characteristics included CRG classification, complex chronic condition (CCC), and dependence on medical technology. CCCs are defined as any medical condition that can be reasonably expected to last at least 12 months (unless death intervenes) and to involve either several different organ systems or 1 system severely enough to require specialty pediatric care and probably some period of hospitalization in a tertiary care center.[20] Medical technology included devices used to optimize the health and functioning of the child (eg, gastrostomy, tracheostomy, cerebrospinal fluid shunt).[22]
Hospitalization Characteristics
Characteristics of the hospitalization included transfer from an outside facility, ICU admission, surgical procedure (using surgical APR‐DRGs), and discharge disposition (home, skilled nursing facility, home health services, death, other). Cost of the hospitalization was estimated in the PHIS from charges using hospital and year‐specific ratios of cost to charge.
Statistical Analysis
Continuous data (eg, distance from hospital to home residence) were described with median and interquartile ranges (IQR) because they were not normally distributed. Categorical data (eg, type of chronic condition) were described with counts and frequencies. In bivariate analyses, demographic, clinical, and hospitalization characteristics were stratified by LOS (long LOS vs LOS <10 days), and compared using 2 statistics or Wilcoxon rank sum tests as appropriate.
We modeled the likelihood of experiencing a long LOS using generalized linear mixed effects models with a random hospital intercept and discharge‐level fixed effects for age, gender, payor, CCC type, ICU utilization, transfer status, a medical/surgical admission indicator derived from the APR‐DRG, and CRG assigned to each hospitalization. To examine hospital‐to‐hospital variability, we generated hospital risk‐adjusted rates of long LOS from these models. Similar models and hospital risk‐adjusted rates were built for a post hoc correlational analysis of 30‐day all cause readmission, where hospitals' rates and percent of long LOS were compared with a Pearson correlation coefficient. Also, for our multivariable models, we performed a sensitivity analysis using an alternative definition of long LOS as 4 days (the 75th percentile of LOS for all children, with and without medical complexity, hospitalized during 20132014). All analyses were performed using SAS version 9.4 (SAS Institute, Cary, NC), and P values <0.05 were considered statistically significant.
RESULTS
Study Population
There were 954,018 hospitalizations of 217,163 CMC at 44 children's hospitals included for analysis. Forty‐seven percent of hospitalizations were for females, 49.4% for non‐Hispanic whites, and 61.1% for children with government insurance. Fifteen percent (n = 142,082) had a long LOS of 10 days. The median (IQR) LOS of hospitalizations <10 days versus 10 days were 2 (IQR, 14) and 16 days (IQR, 1226), respectively. Long LOS hospitalizations accounted for 61.1% (3.7 million) hospital days and 61.8% ($13.7 billion) of total hospitalization costs for all CMC in the cohort (Table 1).
| Characteristic | Overall (n = 954,018) | Length of Stay | |
|---|---|---|---|
| <10 Days (n = 811,936) | 10 Days (n = 142,082) | ||
| |||
| Age at admission, y, % | |||
| <1 | 14.6 | 12.7 | 25.7 |
| 14 | 27.1 | 27.9 | 22.4 |
| 59 | 20.1 | 21.0 | 14.9 |
| 1018 | 33.6 | 34.0 | 31.7 |
| 18+ | 4.6 | 4.4 | 5.4 |
| Gender, % | |||
| Female | 47.0 | 46.9 | 47.5 |
| Race/ethnicity, % | |||
| Non‐Hispanic white | 49.4 | 49.4 | 49.4 |
| Non‐Hispanic black | 23.1 | 23.8 | 19.3 |
| Hispanic | 18.2 | 17.8 | 20.4 |
| Asian | 2.0 | 1.9 | 2.3 |
| Other | 7.4 | 7.1 | 8.6 |
| Complex chronic condition, % | |||
| Any | 79.5 | 77.3 | 91.8 |
| Technology assistance | 37.1 | 34.1 | 54.2 |
| Gastrointestinal | 30.0 | 27.2 | 45.9 |
| Neuromuscular | 28.2 | 27.7 | 30.9 |
| Cardiovascular | 16.8 | 14.5 | 29.9 |
| Respiratory | 14.1 | 11.5 | 29.4 |
| Congenital/genetic defect | 17.2 | 16.7 | 20.2 |
| Metabolic | 9.9 | 8.9 | 15.4 |
| Renal | 10.1 | 9.5 | 13.8 |
| Hematology/emmmunodeficiency | 11.7 | 12.0 | 10.0 |
| Neonatal | 3.8 | 3.1 | 7.7 |
| Transplantation | 4.5 | 4.2 | 6.7 |
| Clinical risk group, % | |||
| Chronic condition in 2 systems | 68.4 | 71.2 | 53.9 |
| Catastrophic chronic condition | 31.4 | 28.8 | 46.1 |
| Distance from hospital to home residence in miles, median [IQR] | 16.2 [7.440.4] | 15.8 [7.338.7] | 19.1 [8.552.6] |
| Transferred from outside hospital (%) | 6.5 | 5.3 | 13.6 |
| Admitted for surgery, % | 23.4 | 20.7 | 38.7 |
| Use of intensive care, % | 19.6 | 14.9 | 46.5 |
| Discharge disposition, % | |||
| Home | 91.2 | 92.9 | 81.4 |
| Home healthcare | 4.5 | 3.5 | 9.9 |
| Other | 2.9 | 2.6 | 4.5 |
| Postacute care facility | 1.1 | 0.8 | 3.1 |
| Died | 0.4 | 0.3 | 1.1 |
| Payor, % | |||
| Government | 61.1 | 60.6 | 63.5 |
| Private | 33.2 | 33.6 | 30.9 |
| Other | 5.7 | 5.7 | 5.7 |
| Hospital resource use | |||
| Median length of stay [IQR] | 3 [16] | 2 [14] | 16 [1226] |
| Median hospital cost [IQR] | $8,144 [$4,122$18,447] | $6,689 [$3,685$12,395] | $49,207 [$29,444$95,738] |
| Total hospital cost, $, billions | $22.2 | $8.5 | $13.7 |
Demographics and Clinical Characteristics of Children With and Without Long LOS
Compared with hospitalized CMC with LOS <10 days, a higher percentage of hospitalizations with LOS 10 days were CMC age <1 year (25.7% vs 12.7%, P < 0.001) and Hispanic (20.4% vs 17.8%, P < 0.001). CMC hospitalizations with a long LOS had a higher percentage of any CCC (91.8% vs 77.3%, P < 0.001); the most common CCCs were gastrointestinal (45.9%), neuromuscular (30.9%), and cardiovascular (29.9%). Hospitalizations of CMC with a long LOS had a higher percentage of a catastrophic chronic condition (46.1% vs 28.8%, P < 0.001) and technology dependence (46.1% vs 28.8%, P < 0.001) (Table 1).
Hospitalization Characteristics of Children With and Without Long LOS
Compared with hospitalizations of CMC with LOS <10 days, hospitalizations of CMC with a long LOS more often involved transfer in from another hospital at admission (13.6% vs 5.3%, P < 0.001). CMC hospital stays with a long LOS more often involved surgery (38.7% vs 20.7%, P < 0.001) and use of intensive care (46.5% vs 14.9%; P < 0.001). A higher percentage of CMC with long LOS were discharged with home health services (9.9% vs 3.5%; P < 0.001) (Table 1).
The most common admitting diagnoses and CCCs for hospitalizations of CMC with long LOS are presented in Table 2. The two most prevalent APR‐DRGs in CMC hospitalizations lasting 10 days or longer were cystic fibrosis (10.7%) and respiratory system disease with ventilator support (5.5%). The two most common chronic condition characteristics represented among long CMC hospitalizations were gastrointestinal devices (eg, gastrostomy tube) (39.7%) and heart and great vessel malformations (eg, tetralogy of Fallot) (12.8%). The 5 most common CCC subcategories, as listed in Table 2, account for nearly 100% of the patients with long LOS hospitalizations.
| |
| Most common reason for admission* | |
| Cystic fibrosis | 10.7% |
| Respiratory system diagnosis with ventilator support 96+ hours | 5.5% |
| Malfunction, reaction, and complication of cardiac or vascular device or procedure | 2.8% |
| Craniotomy except for trauma | 2.6% |
| Major small and large bowel procedures | 2.3% |
| Most common complex chronic condition | |
| Gastrointestinal devices | 39.7% |
| Heart and great vessel malformations | 12.8% |
| Cystic fibrosis | 12.5% |
| Dysrhythmias | 11.0% |
| Respiratory devices | 10.7% |
Multivariable Analysis of Characteristics Associated With Long LOS
In multivariable analysis, the highest likelihood of long LOS was experienced by children who received care in the ICU (odds ratio [OR]: 3.5, 95% confidence interval [CI]: 3.43.5), who had a respiratory CCC (OR: 2.7, 95% CI: 2.62.7), and who were transferred from another acute care hospital at admission (OR: 2.1, 95% CI: 2.0, 2.1). The likelihood of long LOS was also higher in children <1 year of age (OR: 1.2, 95% CI: 1.21.3), and Hispanic children (OR: 1.1, 95% CI 1.0‐1.10) (Table 3). Similar multivariable findings were observed in sensitivity analysis using the 75th percentile of LOS (4 days) as the model outcome.
| Characteristic | Odds Ratio (95% CI) of LOS 10 Days | P Value |
|---|---|---|
| ||
| Use of intensive care | 3.5 (3.4‐3.5) | <0.001 |
| Transfer from another acute‐care hospital | 2.1 (2.0‐2.1) | <0.001 |
| Procedure/surgery | 1.8 (1.8‐1.9) | <0.001 |
| Complex chronic condition | ||
| Respiratory | 2.7 (2.6‐2.7) | <0.001 |
| Gastrointestinal | 1.8 (1.8‐1.8) | <0.001 |
| Metabolic | 1.7 (1.7‐1.7) | <0.001 |
| Cardiovascular | 1.6 (1.5‐1.6) | <0.001 |
| Neonatal | 1.5 (1.5‐1.5) | <0.001 |
| Renal | 1.4 (1.4‐1.4) | <0.001 |
| Transplant | 1.4 (1.4‐1.4) | <0.001 |
| Hematology and immunodeficiency | 1.3 (1.3‐1.3) | <0.001 |
| Technology assistance | 1.1 (1.1, 1.1) | <0.001 |
| Neuromuscular | 0.9 (0.9‐0.9) | <0.001 |
| Congenital or genetic defect | 0.8 (0.8‐0.8) | <0.001 |
| Age at admission, y | ||
| <1 | 1.2 (1.2‐1.3) | <0.001 |
| 14 | 0.5 (0.5‐0.5) | <0.001 |
| 59 | 0.6 (0.6‐0.6) | <0.001 |
| 1018 | 0.9 (0.9‐0.9) | <0.001 |
| 18+ | Reference | |
| Male | 0.9 (0.9‐0.9) | <0.001 |
| Race/ethnicity | ||
| Non‐Hispanic black | 0.9 (0.9‐0.9) | <0.001 |
| Hispanic | 1.1 (1.0‐1.1) | <0.001 |
| Asian | 1.0 (1.0‐1.1) | 0.3 |
| Other | 1.1 (1.1‐1.1) | <0.001 |
| Non‐Hispanic white | Reference | |
| Payor | ||
| Private | 0.9 (0.8 0.9) | <0.001 |
| Other | 1.0 (1.0‐1.0) | 0.4 |
| Government | Reference | |
| Season | ||
| Spring | 1.0 (1.0 1.0) | <0.001 |
| Summer | 0.9 (0.9‐0.9) | <0.001 |
| Fall | 1.0 (0.9‐1.0) | <0.001 |
| Winter | Reference | |
Variation in the Prevalence of Long LOS Across Children's Hospitals
After controlling for demographic, clinical, and hospital characteristics associated with long LOS, there was significant (P < 0.001) variation in the prevalence of long LOS for CMC across children's hospitals in the cohort (range, 10.3%21.8%) (Figure 1). Twelve (27%) hospitals had a significantly (P < 0.001) higher prevalence of long LOS for their hospitalized CMC, compared to the mean. Eighteen (41%) had a significantly (P < 0.001) lower prevalence of long LOS for their hospitalized CMC. There was also significant variation across hospitals with respect to cost, with 49.7% to 73.7% of all hospital costs of CMC attributed to long LOS hospitalizations. Finally, there was indirect correlation with the prevalence of LOS across hospitals and the hospitals' 30‐day readmission rate ( = 0.3; P = 0.04). As the prevalence of long LOS increased, the readmission rate decreased.
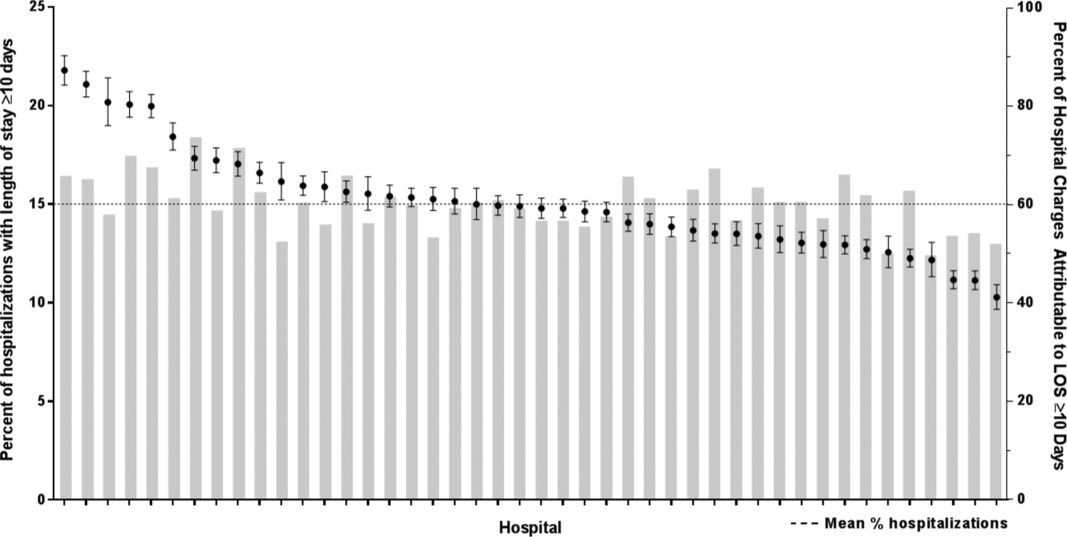
DISCUSSION
The main findings from this study suggest that a small percentage of CMC experiencing long LOS account for the majority of hospital bed days and cost of all hospitalized CMC in children's hospitals. The likelihood of long LOS varies significantly by CMC's age, race/ethnicity, and payor as well as by type and number of chronic conditions. Among CMC with long LOS, the use of gastrointestinal devices such as gastrostomy tubes, as well as congenital heart disease, were highly prevalent. In multivariable analysis, the characteristics most strongly associated with LOS 10 days were use of the ICU, respiratory complex chronic condition, and transfer from another medical facility at admission. After adjusting for these factors, there was significant variation in the prevalence of LOS 10 days for CMC across children's hospitals.
Although it is well known that CMC as a whole have a major impact on resource use in children's hospitals, this study reveals that 15% of hospitalizations of CMC account for 62% of all hospital costs of CMC. That is, a small fraction of hospitalizations of CMC is largely responsible for the significant financial impact of hospital resource use. To date, most clinical efforts and policies striving to reduce hospital use in CMC have focused on avoiding readmissions or index hospital admissions entirely, rather than improving the efficiency of hospital care after admission occurs.[23, 24, 25, 26] In the adult population, the impact of long LOS on hospital costs has been recognized, and several Medicare incentive programs have focused on in‐hospital timeliness and efficiency. As a result, LOS in Medicare beneficiaries has decreased dramatically over the past 2 decades.[27, 28, 29, 30] Optimizing the efficiency of hospital care for CMC may be an important goal to pursue, especially with precedent set in the adult literature.
Perhaps the substantial variation across hospitals in the prevalence of long LOS in CMC indicates opportunity to improve the efficiency of their inpatient care. This variation was not due to differences across hospitals' case mix of CMC. Further investigation is needed to determine how much of it is due to differences in quality of care. Clinical practice guidelines for hospital treatment of common illnesses usually exclude CMC. In our clinical experience across 9 children's hospitals, we have experienced varying approaches to setting discharge goals (ie, parameters on how healthy the child needs to be to ensure a successful hospital discharge) for CMC.[31] When the goals are absent or not clearly articulated, they can contribute to a prolonged hospitalization. Some families of CMC report significant issues when working with pediatric hospital staff to assess their child's discharge readiness.[7, 32, 33] In addition, there is significant variation across states and regions in access to and quality of post‐discharge health services (eg, home nursing, postacute care, durable medical equipment).[34, 35] In some areas, many CMC are not actively involved with their primary care physician.[5] These issues might also influence the ability of some children's hospitals to efficiently discharge CMC to a safe and supportive post‐discharge environment. Further examination of hospital outliersthose with the lowest and highest percentage of CMC hospitalizations with long LOSmay reveal opportunities to identify and spread best practices.
The demographic and clinical factors associated with long LOS in the present study, including age, ICU use, and transfer from another hospital, might help hospitals target which CMC have the greatest risk for experiencing long LOS. We found that infants age <1 year had longer LOS when compared with older children. Similar to our findings, younger‐aged children hospitalized with bronchiolitis have longer LOS.[36] Certainly, infants with medical complexity, in general, are a high‐acuity population with the potential for rapid clinical deterioration during an acute illness. Prolonged hospitalization for treatment and stabilization may be expected for many of them. Additional investigation is warranted to examine ICU use in CMC, and whether ICU admission or duration can be safely prevented or abbreviated. Opportunities to assess the quality of transfers into children's hospitals of CMC admitted to outside hospitals may be necessary. A study of pediatric burn patients reported that patients initially stabilized at a facility that was not a burn center and subsequently transferred to a burn center had a longer LOS than patients solely treated at a designated burn center.[37] Furthermore, events during transport itself may adversely impact the stability of an already fragile patient. Interventions to optimize the quality of care provided by transport teams have resulted in decreased LOS at the receiving hospital.[38]
This study's findings should be considered in the context of several limitations. Absent a gold‐standard definition of long LOS, we used the distribution of LOS across patients to inform our methods; LOS at the 90th percentile was selected as long. Although our sensitivity analysis using LOS at the 75th percentile produced similar findings, other cut points in LOS might be associated with different results. The study is not positioned to determine how much of the reported LOS was excessive, unnecessary, or preventable. The study findings may not generalize to types of hospitals not contained in PHIS (eg, nonchildren's hospitals and community hospitals). We did not focus on the impact of a new diagnosis (eg, new chronic illness) or acute in‐hospital event (eg, nosocomial infection) on prolonged LOS; future studies should investigate these clinical events with LOS.
PHIS does not contain information regarding characteristics that could influence LOS, including the children's social and familial attributes, transportation availability, home equipment needs, and local availability of postacute care facilities. Moreover, PHIS does not contain information about the hospital discharge procedures, process, or personnel across hospitals, which could influence LOS. Future studies on prolonged LOS should consider assessing this information. Because of the large sample size of hospitalizations included, the statistical power for the analyses was strong, rendering it possible that some findings that were statistically significant might have modest clinical significance (eg, relationship of Hispanic ethnicity with prolonged LOS). We could not determine why a positive correlation was not observed between hospitals' long LOS prevalence and their percentage of cost associated with long LOS; future studies should investigate the reasons for this finding.
Despite these limitations, the findings of the present study highlight the significance of long LOS in hospitalized CMC. These long hospitalizations account for a significant proportion of all hospital costs for this important population of children. The prevalence of long LOS for CMC varies considerably across children's hospitals, even after accounting for the case mix. Efforts to curtail hospital resource use and costs for CMC may benefit from focus on long LOS.
- , , , et al. Inpatient growth and resource use in 28 children's hospitals: a longitudinal, multi‐institutional study. JAMA Pediatr. 2013;167(2):170–177.
- , , , et al. Children with complex chronic conditions in inpatient hospital settings in the united states. Pediatrics. 2010;126(4):647–655.
- , . Meeting the health care needs of persons with disabilities. Milbank Q. 2002;80(2):381–391.
- , , , et al. Effect of an enhanced medical home on serious illness and cost of care among high‐risk children with chronic illness: a randomized clinical trial. JAMA. 2014;312(24):2640–2648.
- , , , et al. Children with medical complexity and Medicaid: spending and cost savings. Health Aff Proj Hope. 2014;33(12):2199–2206.
- Children's Hospital Association. CARE Award. Available at: https://www.childrenshospitals.org/Programs‐and‐Services/Quality‐Improvement‐and‐Measurement/CARE‐Award. Accessed December 18, 2015.
- , , , et al. Hospital readmission and parent perceptions of their child's hospital discharge. Int J Qual Health Care. 2013;25(5):573–581.
- , , , et al. Weekend matters: Friday and Saturday admissions are associated with prolonged hospitalization of children. Clin Pediatr (Phila). 2013;52(9):875–878.
- , , , . Attributable cost and length of stay for central line‐associated bloodstream infections. Pediatrics. 2014;133(6):e1525–e1532.
- , , , et al. Effect of healthcare‐acquired infection on length of hospital stay and cost. Infect Control Hosp Epidemiol. 2007;28(3):280–292.
- , , , , . Hospital utilization and costs among children with influenza, 2003. Am J Prev Med. 2009;36(4):292–296.
- , , , . Charges and lengths of stay attributable to adverse patient‐care events using pediatric‐specific quality indicators: a multicenter study of freestanding children's hospitals. Pediatrics. 2008;121(6):e1653–e1659.
- , , , , . Variation in resource utilization for the management of uncomplicated community‐acquired pneumonia across community and children's hospitals. J Pediatr. 2014;165(3):585–591.
- , , , , . Variation and outcomes associated with direct hospital admission among children with pneumonia in the United States. JAMA Pediatr. 2014;168(9):829–836.
- , , , et al. Clinical Risk Groups (CRGs): a classification system for risk‐adjusted capitation‐based payment and health care management. Med Care. 2004;42(1):81–90.
- , , , et al. Identifying children with lifelong chronic conditions for care coordination by using hospital discharge data. Acad Pediatr. 2010;10(6):417–423.
- , , , , . Profile of medical charges for children by health status group and severity level in a Washington State Health Plan. Health Serv Res. 2004;39(1):73–89.
- , , , . Using medical billing data to evaluate chronically ill children over time. J Ambulatory Care Manage. 2006;29(4):283–290.
- , , , , , . Medical complexity and pediatric emergency department and inpatient utilization. Pediatrics. 2013;131(2):e559–e565.
- , , , , . Pediatric complex chronic conditions classification system version 2: updated for ICD‐10 and complex medical technology dependence and transplantation. BMC Pediatr. 2014;14:199.
- . Analyzing intensive care unit length of stay data: problems and possible solutions. Crit Care Med. 1997;25(9):1594–1600.
- , , , et al. Hospital utilization and characteristics of patients experiencing recurrent readmissions within children's hospitals. JAMA. 2011;305(7):682–690.
- . Hospital readmissions and repeat emergency department visits among children with medical complexity: an integrative review. J Pediatr Nurs. 2013;28(4):316–339.
- , , , . Hospital readmission in children with complex chronic conditions discharged from subacute care. Hosp Pediatr. 2014;4(3):153–158.
- , , , et al. Preventing hospitalizations in children with medical complexity: a systematic review. Pediatrics. 2014;134(6):e1628–e1647.
- , , , . Hospital readmissions for newly discharged pediatric home mechanical ventilation patients. Pediatr Pulmonol. 2012;47(4):409–414.
- , , , et al. Clinical characteristics and outcomes of Medicare patients undergoing total hip arthroplasty, 1991–2008. JAMA. 2011;305(15):1560–1567.
- , , , et al. Trends in length of stay and short‐term outcomes among Medicare patients hospitalized for heart failure, 1993–2006. JAMA. 2010;303(21):2141–2147.
- U.S. Department of Health and Human Services. CMS Statistics 2013. Available at: https://www.cms.gov/Research‐Statistics‐Data‐and‐Systems/Statistics‐Trends‐and‐Reports/CMS‐Statistics‐Reference‐Booklet/Downloads/CMS_Stats_2013_final.pdf. Published August 2013. Accessed October 6, 2015.
- Centers for Medicare and Medicaid Services. Evaluation of the premier hospital quality incentive demonstration. Available at: https://www.cms.gov/Research‐Statistics‐Data‐and‐Systems/Statistics‐Trends‐and‐Reports/Reports/downloads/Premier_ExecSum_2010.pdf. Published March 3, 2009. Accessed September 18, 2015.
- , , , et al. A framework of pediatric hospital discharge care informed by legislation, research, and practice. JAMA Pediatr. 2014;168(10):955–962; quiz 965–966.
- , , , , . Parent and provider perspectives on pediatric readmissions: what can we learn about readiness for discharge? Hosp Pediatr. 2015;5(11):559–565.
- , . Preventing readmissions in children: how do we do that? Hosp Pediatr. 2015;5(11):602–604.
- , , . Pediatric post‐acute hospital care: striving for identity and value. Hosp Pediatr. 2015;5(10):548–551.
- , , , et al. Pediatric hospital discharges to home health and postacute facility care: a national study. JAMA Pediatr. 2016;170(4):326–333.
- , , , et al. Bronchiolitis: clinical characteristics associated with hospitalization and length of stay. Pediatr Emerg Care. 2012;28(2):99–103.
- , , , , . The effect of transfers between health care facilities on costs and length of stay for pediatric burn patients. J Burn Care Res. 2015;36(1):178–183.
- , , , et al. Goal‐directed resuscitative interventions during pediatric interfacility transport. Crit Care Med. 2015;43(8):1692–1698.
Children with medical complexity (CMC) have complex and chronic health conditions that often involve multiple organ systems and severely affect cognitive and physical functioning. Although the prevalence of CMC is low (1% of all children), they account for nearly one‐fifth of all pediatric admissions and one‐half of all hospital days and charges in the United States.[1] Over the last decade, CMC have had a particularly large and increasing impact in tertiary‐care children's hospitals.[1, 2] The Institute of Medicine has identified CMC as a priority population for a revised healthcare system.[3]
Medical homes, hospitals, health plans, states, federal agencies, and others are striving to reduce excessive hospital use in CMC because of its high cost.[4, 5, 6] Containing length of stay (LOS)an increasingly used indicator of the time sensitiveness and efficiency of hospital careis a common aim across these initiatives. CMC have longer hospitalizations than children without medical complexity. Speculated reasons for this are that CMC tend to have (1) higher severity of acute illnesses (eg, pneumonia, cellulitis), (2) prolonged recovery time in the hospital, and (3) higher risk of adverse events in the hospital. Moreover, hospital clinicians caring for CMC often find it difficult to determine discharge readiness, given that many CMC do not return to a completely healthy baseline.[7]
Little is known about long LOS in CMC, including which CMC have the highest risk of experiencing such stays and which stays might have the greatest opportunity to be shortened. Patient characteristics associated with prolonged length of stay have been studied extensively for many pediatric conditions (eg, asthma).[8, 9, 10, 11, 12, 13, 14] However, most of these studies excluded CMC. Therefore, the objectives of this study were to examine (1) the prevalence of long LOS in CMC, (2) patient characteristics associated with long LOS, and (3) hospital‐to‐hospital variation in prevalence of long LOS hospitalizations.
METHODS
Study Design and Data Source
This study is a multicenter, retrospective cohort analysis of the Pediatric Health Information System (PHIS). PHIS is an administrative database of 44 not for profit, tertiary care pediatric hospitals affiliated with the Children's Hospital Association (CHA) (Overland Park, KS). PHIS contains data regarding patient demographics, diagnoses, and procedures (with International Classification of Diseases, 9th Revision, Clinical Modification [ICD‐9‐CM] codes), All‐Patient Refined Diagnostic Related Groups version 30 (APR‐DRGs) (3M Health Information Systems, Salt Lake City, UT), and service lines that aggregate the APR‐DRGs into 38 distinct groups. Data quality and reliability are assured through CHA and participating hospitals. In accordance with the policies of the Cincinnati Children's Hospital Medical Center Institutional Review Board, this study of deidentified data was not considered human subjects research.
Study Population
Inclusion Criteria
Children discharged following an observation or inpatient admission from a hospital participating in the PHIS database between January 1, 2013 and December 31, 2014 were eligible for inclusion if they were considered medically complex. Medical complexity was defined using Clinical Risk Groups (CRGs) version 1.8, developed by 3M Health Information Systems and the National Association of Children's Hospitals and Related Institutions. CRGs were used to assign each hospitalized patient to 1 of 9 mutually exclusive chronicity groups according to the presence, type, and severity of chronic conditions.[15, 16, 17, 18] Each patient's CRG designation was based on 2 years of previous hospital encounters.
As defined in prior studies and definitional frameworks of CMC,[1] patients belonging to CRG group 6 (significant chronic disease in 2 organ systems), CRG group 7 (dominant chronic disease in 3 organ systems), and CRG group 9 (catastrophic condition) were considered medically complex.[17, 19] Patients with malignancies (CRG group 8) were not included for analysis because they are a unique population with anticipated, long hospital stays. Patients with CRG group 5, representing those with chronic conditions affecting a single body system, were also not included because most do not have attributes consistent with medical complexity.
Exclusion Criteria
We used the APR‐DRG system, which leverages ICD‐9‐CM codes to identify the health problem most responsible for the hospitalization, to refine the study cohort. We excluded hospitalizations that were classified by the APR‐DRG system as neonatal, as we did not wish to focus on LOS in the neonatal intensive care unit (ICU) or for birth admissions. Similarly, hospitalizations for chemotherapy (APR‐DRG 693) or malignancy (identified with previously used ICD‐9‐CM codes)[20] were also excluded because long LOS is anticipated. We also excluded hospitalizations for medical rehabilitation (APR‐DRG 860).
Outcome Measures
The primary outcome measure was long LOS, defined as LOS 10 days. The cut point of LOS 10 days represents the 90th percentile of LOS for all children, with and without medical complexity, hospitalized during 2013 to 2014. LOS 10 days has previously been used as a threshold of long LOS.[21] For hospitalizations involving transfer at admission from another acute care facility, LOS was measured from the date of transfer. We also assessed hospitals' cost attributable to long LOS admissions.
Patient Demographics and Clinical Characteristics
We measured demographic characteristics including age, gender, race/ethnicity, insurance type, and distance traveled (the linear distance between the centroid of the patient's home ZIP code and the centroid of the hospital's ZIP code). Clinical characteristics included CRG classification, complex chronic condition (CCC), and dependence on medical technology. CCCs are defined as any medical condition that can be reasonably expected to last at least 12 months (unless death intervenes) and to involve either several different organ systems or 1 system severely enough to require specialty pediatric care and probably some period of hospitalization in a tertiary care center.[20] Medical technology included devices used to optimize the health and functioning of the child (eg, gastrostomy, tracheostomy, cerebrospinal fluid shunt).[22]
Hospitalization Characteristics
Characteristics of the hospitalization included transfer from an outside facility, ICU admission, surgical procedure (using surgical APR‐DRGs), and discharge disposition (home, skilled nursing facility, home health services, death, other). Cost of the hospitalization was estimated in the PHIS from charges using hospital and year‐specific ratios of cost to charge.
Statistical Analysis
Continuous data (eg, distance from hospital to home residence) were described with median and interquartile ranges (IQR) because they were not normally distributed. Categorical data (eg, type of chronic condition) were described with counts and frequencies. In bivariate analyses, demographic, clinical, and hospitalization characteristics were stratified by LOS (long LOS vs LOS <10 days), and compared using 2 statistics or Wilcoxon rank sum tests as appropriate.
We modeled the likelihood of experiencing a long LOS using generalized linear mixed effects models with a random hospital intercept and discharge‐level fixed effects for age, gender, payor, CCC type, ICU utilization, transfer status, a medical/surgical admission indicator derived from the APR‐DRG, and CRG assigned to each hospitalization. To examine hospital‐to‐hospital variability, we generated hospital risk‐adjusted rates of long LOS from these models. Similar models and hospital risk‐adjusted rates were built for a post hoc correlational analysis of 30‐day all cause readmission, where hospitals' rates and percent of long LOS were compared with a Pearson correlation coefficient. Also, for our multivariable models, we performed a sensitivity analysis using an alternative definition of long LOS as 4 days (the 75th percentile of LOS for all children, with and without medical complexity, hospitalized during 20132014). All analyses were performed using SAS version 9.4 (SAS Institute, Cary, NC), and P values <0.05 were considered statistically significant.
RESULTS
Study Population
There were 954,018 hospitalizations of 217,163 CMC at 44 children's hospitals included for analysis. Forty‐seven percent of hospitalizations were for females, 49.4% for non‐Hispanic whites, and 61.1% for children with government insurance. Fifteen percent (n = 142,082) had a long LOS of 10 days. The median (IQR) LOS of hospitalizations <10 days versus 10 days were 2 (IQR, 14) and 16 days (IQR, 1226), respectively. Long LOS hospitalizations accounted for 61.1% (3.7 million) hospital days and 61.8% ($13.7 billion) of total hospitalization costs for all CMC in the cohort (Table 1).
| Characteristic | Overall (n = 954,018) | Length of Stay | |
|---|---|---|---|
| <10 Days (n = 811,936) | 10 Days (n = 142,082) | ||
| |||
| Age at admission, y, % | |||
| <1 | 14.6 | 12.7 | 25.7 |
| 14 | 27.1 | 27.9 | 22.4 |
| 59 | 20.1 | 21.0 | 14.9 |
| 1018 | 33.6 | 34.0 | 31.7 |
| 18+ | 4.6 | 4.4 | 5.4 |
| Gender, % | |||
| Female | 47.0 | 46.9 | 47.5 |
| Race/ethnicity, % | |||
| Non‐Hispanic white | 49.4 | 49.4 | 49.4 |
| Non‐Hispanic black | 23.1 | 23.8 | 19.3 |
| Hispanic | 18.2 | 17.8 | 20.4 |
| Asian | 2.0 | 1.9 | 2.3 |
| Other | 7.4 | 7.1 | 8.6 |
| Complex chronic condition, % | |||
| Any | 79.5 | 77.3 | 91.8 |
| Technology assistance | 37.1 | 34.1 | 54.2 |
| Gastrointestinal | 30.0 | 27.2 | 45.9 |
| Neuromuscular | 28.2 | 27.7 | 30.9 |
| Cardiovascular | 16.8 | 14.5 | 29.9 |
| Respiratory | 14.1 | 11.5 | 29.4 |
| Congenital/genetic defect | 17.2 | 16.7 | 20.2 |
| Metabolic | 9.9 | 8.9 | 15.4 |
| Renal | 10.1 | 9.5 | 13.8 |
| Hematology/emmmunodeficiency | 11.7 | 12.0 | 10.0 |
| Neonatal | 3.8 | 3.1 | 7.7 |
| Transplantation | 4.5 | 4.2 | 6.7 |
| Clinical risk group, % | |||
| Chronic condition in 2 systems | 68.4 | 71.2 | 53.9 |
| Catastrophic chronic condition | 31.4 | 28.8 | 46.1 |
| Distance from hospital to home residence in miles, median [IQR] | 16.2 [7.440.4] | 15.8 [7.338.7] | 19.1 [8.552.6] |
| Transferred from outside hospital (%) | 6.5 | 5.3 | 13.6 |
| Admitted for surgery, % | 23.4 | 20.7 | 38.7 |
| Use of intensive care, % | 19.6 | 14.9 | 46.5 |
| Discharge disposition, % | |||
| Home | 91.2 | 92.9 | 81.4 |
| Home healthcare | 4.5 | 3.5 | 9.9 |
| Other | 2.9 | 2.6 | 4.5 |
| Postacute care facility | 1.1 | 0.8 | 3.1 |
| Died | 0.4 | 0.3 | 1.1 |
| Payor, % | |||
| Government | 61.1 | 60.6 | 63.5 |
| Private | 33.2 | 33.6 | 30.9 |
| Other | 5.7 | 5.7 | 5.7 |
| Hospital resource use | |||
| Median length of stay [IQR] | 3 [16] | 2 [14] | 16 [1226] |
| Median hospital cost [IQR] | $8,144 [$4,122$18,447] | $6,689 [$3,685$12,395] | $49,207 [$29,444$95,738] |
| Total hospital cost, $, billions | $22.2 | $8.5 | $13.7 |
Demographics and Clinical Characteristics of Children With and Without Long LOS
Compared with hospitalized CMC with LOS <10 days, a higher percentage of hospitalizations with LOS 10 days were CMC age <1 year (25.7% vs 12.7%, P < 0.001) and Hispanic (20.4% vs 17.8%, P < 0.001). CMC hospitalizations with a long LOS had a higher percentage of any CCC (91.8% vs 77.3%, P < 0.001); the most common CCCs were gastrointestinal (45.9%), neuromuscular (30.9%), and cardiovascular (29.9%). Hospitalizations of CMC with a long LOS had a higher percentage of a catastrophic chronic condition (46.1% vs 28.8%, P < 0.001) and technology dependence (46.1% vs 28.8%, P < 0.001) (Table 1).
Hospitalization Characteristics of Children With and Without Long LOS
Compared with hospitalizations of CMC with LOS <10 days, hospitalizations of CMC with a long LOS more often involved transfer in from another hospital at admission (13.6% vs 5.3%, P < 0.001). CMC hospital stays with a long LOS more often involved surgery (38.7% vs 20.7%, P < 0.001) and use of intensive care (46.5% vs 14.9%; P < 0.001). A higher percentage of CMC with long LOS were discharged with home health services (9.9% vs 3.5%; P < 0.001) (Table 1).
The most common admitting diagnoses and CCCs for hospitalizations of CMC with long LOS are presented in Table 2. The two most prevalent APR‐DRGs in CMC hospitalizations lasting 10 days or longer were cystic fibrosis (10.7%) and respiratory system disease with ventilator support (5.5%). The two most common chronic condition characteristics represented among long CMC hospitalizations were gastrointestinal devices (eg, gastrostomy tube) (39.7%) and heart and great vessel malformations (eg, tetralogy of Fallot) (12.8%). The 5 most common CCC subcategories, as listed in Table 2, account for nearly 100% of the patients with long LOS hospitalizations.
| |
| Most common reason for admission* | |
| Cystic fibrosis | 10.7% |
| Respiratory system diagnosis with ventilator support 96+ hours | 5.5% |
| Malfunction, reaction, and complication of cardiac or vascular device or procedure | 2.8% |
| Craniotomy except for trauma | 2.6% |
| Major small and large bowel procedures | 2.3% |
| Most common complex chronic condition | |
| Gastrointestinal devices | 39.7% |
| Heart and great vessel malformations | 12.8% |
| Cystic fibrosis | 12.5% |
| Dysrhythmias | 11.0% |
| Respiratory devices | 10.7% |
Multivariable Analysis of Characteristics Associated With Long LOS
In multivariable analysis, the highest likelihood of long LOS was experienced by children who received care in the ICU (odds ratio [OR]: 3.5, 95% confidence interval [CI]: 3.43.5), who had a respiratory CCC (OR: 2.7, 95% CI: 2.62.7), and who were transferred from another acute care hospital at admission (OR: 2.1, 95% CI: 2.0, 2.1). The likelihood of long LOS was also higher in children <1 year of age (OR: 1.2, 95% CI: 1.21.3), and Hispanic children (OR: 1.1, 95% CI 1.0‐1.10) (Table 3). Similar multivariable findings were observed in sensitivity analysis using the 75th percentile of LOS (4 days) as the model outcome.
| Characteristic | Odds Ratio (95% CI) of LOS 10 Days | P Value |
|---|---|---|
| ||
| Use of intensive care | 3.5 (3.4‐3.5) | <0.001 |
| Transfer from another acute‐care hospital | 2.1 (2.0‐2.1) | <0.001 |
| Procedure/surgery | 1.8 (1.8‐1.9) | <0.001 |
| Complex chronic condition | ||
| Respiratory | 2.7 (2.6‐2.7) | <0.001 |
| Gastrointestinal | 1.8 (1.8‐1.8) | <0.001 |
| Metabolic | 1.7 (1.7‐1.7) | <0.001 |
| Cardiovascular | 1.6 (1.5‐1.6) | <0.001 |
| Neonatal | 1.5 (1.5‐1.5) | <0.001 |
| Renal | 1.4 (1.4‐1.4) | <0.001 |
| Transplant | 1.4 (1.4‐1.4) | <0.001 |
| Hematology and immunodeficiency | 1.3 (1.3‐1.3) | <0.001 |
| Technology assistance | 1.1 (1.1, 1.1) | <0.001 |
| Neuromuscular | 0.9 (0.9‐0.9) | <0.001 |
| Congenital or genetic defect | 0.8 (0.8‐0.8) | <0.001 |
| Age at admission, y | ||
| <1 | 1.2 (1.2‐1.3) | <0.001 |
| 14 | 0.5 (0.5‐0.5) | <0.001 |
| 59 | 0.6 (0.6‐0.6) | <0.001 |
| 1018 | 0.9 (0.9‐0.9) | <0.001 |
| 18+ | Reference | |
| Male | 0.9 (0.9‐0.9) | <0.001 |
| Race/ethnicity | ||
| Non‐Hispanic black | 0.9 (0.9‐0.9) | <0.001 |
| Hispanic | 1.1 (1.0‐1.1) | <0.001 |
| Asian | 1.0 (1.0‐1.1) | 0.3 |
| Other | 1.1 (1.1‐1.1) | <0.001 |
| Non‐Hispanic white | Reference | |
| Payor | ||
| Private | 0.9 (0.8 0.9) | <0.001 |
| Other | 1.0 (1.0‐1.0) | 0.4 |
| Government | Reference | |
| Season | ||
| Spring | 1.0 (1.0 1.0) | <0.001 |
| Summer | 0.9 (0.9‐0.9) | <0.001 |
| Fall | 1.0 (0.9‐1.0) | <0.001 |
| Winter | Reference | |
Variation in the Prevalence of Long LOS Across Children's Hospitals
After controlling for demographic, clinical, and hospital characteristics associated with long LOS, there was significant (P < 0.001) variation in the prevalence of long LOS for CMC across children's hospitals in the cohort (range, 10.3%21.8%) (Figure 1). Twelve (27%) hospitals had a significantly (P < 0.001) higher prevalence of long LOS for their hospitalized CMC, compared to the mean. Eighteen (41%) had a significantly (P < 0.001) lower prevalence of long LOS for their hospitalized CMC. There was also significant variation across hospitals with respect to cost, with 49.7% to 73.7% of all hospital costs of CMC attributed to long LOS hospitalizations. Finally, there was indirect correlation with the prevalence of LOS across hospitals and the hospitals' 30‐day readmission rate ( = 0.3; P = 0.04). As the prevalence of long LOS increased, the readmission rate decreased.
DISCUSSION
The main findings from this study suggest that a small percentage of CMC experiencing long LOS account for the majority of hospital bed days and cost of all hospitalized CMC in children's hospitals. The likelihood of long LOS varies significantly by CMC's age, race/ethnicity, and payor as well as by type and number of chronic conditions. Among CMC with long LOS, the use of gastrointestinal devices such as gastrostomy tubes, as well as congenital heart disease, were highly prevalent. In multivariable analysis, the characteristics most strongly associated with LOS 10 days were use of the ICU, respiratory complex chronic condition, and transfer from another medical facility at admission. After adjusting for these factors, there was significant variation in the prevalence of LOS 10 days for CMC across children's hospitals.
Although it is well known that CMC as a whole have a major impact on resource use in children's hospitals, this study reveals that 15% of hospitalizations of CMC account for 62% of all hospital costs of CMC. That is, a small fraction of hospitalizations of CMC is largely responsible for the significant financial impact of hospital resource use. To date, most clinical efforts and policies striving to reduce hospital use in CMC have focused on avoiding readmissions or index hospital admissions entirely, rather than improving the efficiency of hospital care after admission occurs.[23, 24, 25, 26] In the adult population, the impact of long LOS on hospital costs has been recognized, and several Medicare incentive programs have focused on in‐hospital timeliness and efficiency. As a result, LOS in Medicare beneficiaries has decreased dramatically over the past 2 decades.[27, 28, 29, 30] Optimizing the efficiency of hospital care for CMC may be an important goal to pursue, especially with precedent set in the adult literature.
Perhaps the substantial variation across hospitals in the prevalence of long LOS in CMC indicates opportunity to improve the efficiency of their inpatient care. This variation was not due to differences across hospitals' case mix of CMC. Further investigation is needed to determine how much of it is due to differences in quality of care. Clinical practice guidelines for hospital treatment of common illnesses usually exclude CMC. In our clinical experience across 9 children's hospitals, we have experienced varying approaches to setting discharge goals (ie, parameters on how healthy the child needs to be to ensure a successful hospital discharge) for CMC.[31] When the goals are absent or not clearly articulated, they can contribute to a prolonged hospitalization. Some families of CMC report significant issues when working with pediatric hospital staff to assess their child's discharge readiness.[7, 32, 33] In addition, there is significant variation across states and regions in access to and quality of post‐discharge health services (eg, home nursing, postacute care, durable medical equipment).[34, 35] In some areas, many CMC are not actively involved with their primary care physician.[5] These issues might also influence the ability of some children's hospitals to efficiently discharge CMC to a safe and supportive post‐discharge environment. Further examination of hospital outliersthose with the lowest and highest percentage of CMC hospitalizations with long LOSmay reveal opportunities to identify and spread best practices.
The demographic and clinical factors associated with long LOS in the present study, including age, ICU use, and transfer from another hospital, might help hospitals target which CMC have the greatest risk for experiencing long LOS. We found that infants age <1 year had longer LOS when compared with older children. Similar to our findings, younger‐aged children hospitalized with bronchiolitis have longer LOS.[36] Certainly, infants with medical complexity, in general, are a high‐acuity population with the potential for rapid clinical deterioration during an acute illness. Prolonged hospitalization for treatment and stabilization may be expected for many of them. Additional investigation is warranted to examine ICU use in CMC, and whether ICU admission or duration can be safely prevented or abbreviated. Opportunities to assess the quality of transfers into children's hospitals of CMC admitted to outside hospitals may be necessary. A study of pediatric burn patients reported that patients initially stabilized at a facility that was not a burn center and subsequently transferred to a burn center had a longer LOS than patients solely treated at a designated burn center.[37] Furthermore, events during transport itself may adversely impact the stability of an already fragile patient. Interventions to optimize the quality of care provided by transport teams have resulted in decreased LOS at the receiving hospital.[38]
This study's findings should be considered in the context of several limitations. Absent a gold‐standard definition of long LOS, we used the distribution of LOS across patients to inform our methods; LOS at the 90th percentile was selected as long. Although our sensitivity analysis using LOS at the 75th percentile produced similar findings, other cut points in LOS might be associated with different results. The study is not positioned to determine how much of the reported LOS was excessive, unnecessary, or preventable. The study findings may not generalize to types of hospitals not contained in PHIS (eg, nonchildren's hospitals and community hospitals). We did not focus on the impact of a new diagnosis (eg, new chronic illness) or acute in‐hospital event (eg, nosocomial infection) on prolonged LOS; future studies should investigate these clinical events with LOS.
PHIS does not contain information regarding characteristics that could influence LOS, including the children's social and familial attributes, transportation availability, home equipment needs, and local availability of postacute care facilities. Moreover, PHIS does not contain information about the hospital discharge procedures, process, or personnel across hospitals, which could influence LOS. Future studies on prolonged LOS should consider assessing this information. Because of the large sample size of hospitalizations included, the statistical power for the analyses was strong, rendering it possible that some findings that were statistically significant might have modest clinical significance (eg, relationship of Hispanic ethnicity with prolonged LOS). We could not determine why a positive correlation was not observed between hospitals' long LOS prevalence and their percentage of cost associated with long LOS; future studies should investigate the reasons for this finding.
Despite these limitations, the findings of the present study highlight the significance of long LOS in hospitalized CMC. These long hospitalizations account for a significant proportion of all hospital costs for this important population of children. The prevalence of long LOS for CMC varies considerably across children's hospitals, even after accounting for the case mix. Efforts to curtail hospital resource use and costs for CMC may benefit from focus on long LOS.
- , , , et al. Inpatient growth and resource use in 28 children's hospitals: a longitudinal, multi‐institutional study. JAMA Pediatr. 2013;167(2):170–177.
- , , , et al. Children with complex chronic conditions in inpatient hospital settings in the united states. Pediatrics. 2010;126(4):647–655.
- , . Meeting the health care needs of persons with disabilities. Milbank Q. 2002;80(2):381–391.
- , , , et al. Effect of an enhanced medical home on serious illness and cost of care among high‐risk children with chronic illness: a randomized clinical trial. JAMA. 2014;312(24):2640–2648.
- , , , et al. Children with medical complexity and Medicaid: spending and cost savings. Health Aff Proj Hope. 2014;33(12):2199–2206.
- Children's Hospital Association. CARE Award. Available at: https://www.childrenshospitals.org/Programs‐and‐Services/Quality‐Improvement‐and‐Measurement/CARE‐Award. Accessed December 18, 2015.
- , , , et al. Hospital readmission and parent perceptions of their child's hospital discharge. Int J Qual Health Care. 2013;25(5):573–581.
- , , , et al. Weekend matters: Friday and Saturday admissions are associated with prolonged hospitalization of children. Clin Pediatr (Phila). 2013;52(9):875–878.
- , , , . Attributable cost and length of stay for central line‐associated bloodstream infections. Pediatrics. 2014;133(6):e1525–e1532.
- , , , et al. Effect of healthcare‐acquired infection on length of hospital stay and cost. Infect Control Hosp Epidemiol. 2007;28(3):280–292.
- , , , , . Hospital utilization and costs among children with influenza, 2003. Am J Prev Med. 2009;36(4):292–296.
- , , , . Charges and lengths of stay attributable to adverse patient‐care events using pediatric‐specific quality indicators: a multicenter study of freestanding children's hospitals. Pediatrics. 2008;121(6):e1653–e1659.
- , , , , . Variation in resource utilization for the management of uncomplicated community‐acquired pneumonia across community and children's hospitals. J Pediatr. 2014;165(3):585–591.
- , , , , . Variation and outcomes associated with direct hospital admission among children with pneumonia in the United States. JAMA Pediatr. 2014;168(9):829–836.
- , , , et al. Clinical Risk Groups (CRGs): a classification system for risk‐adjusted capitation‐based payment and health care management. Med Care. 2004;42(1):81–90.
- , , , et al. Identifying children with lifelong chronic conditions for care coordination by using hospital discharge data. Acad Pediatr. 2010;10(6):417–423.
- , , , , . Profile of medical charges for children by health status group and severity level in a Washington State Health Plan. Health Serv Res. 2004;39(1):73–89.
- , , , . Using medical billing data to evaluate chronically ill children over time. J Ambulatory Care Manage. 2006;29(4):283–290.
- , , , , , . Medical complexity and pediatric emergency department and inpatient utilization. Pediatrics. 2013;131(2):e559–e565.
- , , , , . Pediatric complex chronic conditions classification system version 2: updated for ICD‐10 and complex medical technology dependence and transplantation. BMC Pediatr. 2014;14:199.
- . Analyzing intensive care unit length of stay data: problems and possible solutions. Crit Care Med. 1997;25(9):1594–1600.
- , , , et al. Hospital utilization and characteristics of patients experiencing recurrent readmissions within children's hospitals. JAMA. 2011;305(7):682–690.
- . Hospital readmissions and repeat emergency department visits among children with medical complexity: an integrative review. J Pediatr Nurs. 2013;28(4):316–339.
- , , , . Hospital readmission in children with complex chronic conditions discharged from subacute care. Hosp Pediatr. 2014;4(3):153–158.
- , , , et al. Preventing hospitalizations in children with medical complexity: a systematic review. Pediatrics. 2014;134(6):e1628–e1647.
- , , , . Hospital readmissions for newly discharged pediatric home mechanical ventilation patients. Pediatr Pulmonol. 2012;47(4):409–414.
- , , , et al. Clinical characteristics and outcomes of Medicare patients undergoing total hip arthroplasty, 1991–2008. JAMA. 2011;305(15):1560–1567.
- , , , et al. Trends in length of stay and short‐term outcomes among Medicare patients hospitalized for heart failure, 1993–2006. JAMA. 2010;303(21):2141–2147.
- U.S. Department of Health and Human Services. CMS Statistics 2013. Available at: https://www.cms.gov/Research‐Statistics‐Data‐and‐Systems/Statistics‐Trends‐and‐Reports/CMS‐Statistics‐Reference‐Booklet/Downloads/CMS_Stats_2013_final.pdf. Published August 2013. Accessed October 6, 2015.
- Centers for Medicare and Medicaid Services. Evaluation of the premier hospital quality incentive demonstration. Available at: https://www.cms.gov/Research‐Statistics‐Data‐and‐Systems/Statistics‐Trends‐and‐Reports/Reports/downloads/Premier_ExecSum_2010.pdf. Published March 3, 2009. Accessed September 18, 2015.
- , , , et al. A framework of pediatric hospital discharge care informed by legislation, research, and practice. JAMA Pediatr. 2014;168(10):955–962; quiz 965–966.
- , , , , . Parent and provider perspectives on pediatric readmissions: what can we learn about readiness for discharge? Hosp Pediatr. 2015;5(11):559–565.
- , . Preventing readmissions in children: how do we do that? Hosp Pediatr. 2015;5(11):602–604.
- , , . Pediatric post‐acute hospital care: striving for identity and value. Hosp Pediatr. 2015;5(10):548–551.
- , , , et al. Pediatric hospital discharges to home health and postacute facility care: a national study. JAMA Pediatr. 2016;170(4):326–333.
- , , , et al. Bronchiolitis: clinical characteristics associated with hospitalization and length of stay. Pediatr Emerg Care. 2012;28(2):99–103.
- , , , , . The effect of transfers between health care facilities on costs and length of stay for pediatric burn patients. J Burn Care Res. 2015;36(1):178–183.
- , , , et al. Goal‐directed resuscitative interventions during pediatric interfacility transport. Crit Care Med. 2015;43(8):1692–1698.

Impact of Pneumonia Guidelines
Overutilization of resources is a significant, yet underappreciated, problem in medicine. Many interventions target underutilization (eg, immunizations) or misuse (eg, antibiotic prescribing for viral pharyngitis), yet overutilization remains as a significant contributor to healthcare waste.[1] In an effort to reduce waste, the Choosing Wisely campaign created a work group to highlight areas of overutilization, specifically noting both diagnostic tests and therapies for common pediatric conditions with no proven benefit and possible harm to the patient.[2] Respiratory illnesses have been a target of many quality‐improvement efforts, and pneumonia represents a common diagnosis in pediatrics.[3] The use of diagnostic testing for pneumonia is an area where care can be optimized and aligned with evidence.
Laboratory testing and diagnostic imaging are routinely used for the management of children with community‐acquired pneumonia (CAP). Several studies have documented substantial variability in the use of these resources for pneumonia management, with higher resource use associated with a higher chance of hospitalization after emergency department (ED) evaluation and a longer length of stay among those requiring hospitalization.[4, 5] This variation in diagnostic resource utilization has been attributed, at least in part, to a lack of consensus on the management of pneumonia. There is wide variability in diagnostic testing, and due to potential consequences for patients presenting with pneumonia, efforts to standardize care offer an opportunity to improve healthcare value.
In August 2011, the first national, evidence‐based consensus guidelines for the management of childhood CAP were published jointly by the Pediatric Infectious Diseases Society (PIDS) and the Infectious Diseases Society of America (IDSA).[6] A primary focus of these guidelines was the recommendation for the use of narrow spectrum antibiotics for the management of uncomplicated pneumonia. Previous studies have assessed the impact of the publication of the PIDS/IDSA guidelines on empiric antibiotic selection for the management of pneumonia.[7, 8] In addition, the guidelines provided recommendations regarding diagnostic test utilization, in particular discouraging blood tests (eg, complete blood counts) and radiologic studies for nontoxic, fully immunized children treated as outpatients, as well as repeat testing for children hospitalized with CAP who are improving.
Although single centers have demonstrated changes in utilization patterns based on clinical practice guidelines,[9, 10, 11, 12] whether these guidelines have impacted diagnostic test utilization among US children with CAP in a larger scale remains unknown. Therefore, we sought to determine the impact of the PIDS/IDSA guidelines on the use of diagnostic testing among children with CAP using a national sample of US children's hospitals. Because the guidelines discourage repeat diagnostic testing in patients who are improving, we also evaluated the association between repeat diagnostic studies and severity of illness.
METHODS
This retrospective cohort study used data from the Pediatric Health Information System (PHIS) (Children's Hospital Association, Overland Park, KS). The PHIS database contains deidentified administrative data, detailing demographic, diagnostic, procedure, and billing data from 47 freestanding, tertiary care children's hospitals. This database accounts for approximately 20% of all annual pediatric hospitalizations in the United States. Data quality is ensured through a joint effort between the Children's Hospital Association and participating hospitals.
Patient Population
Data from 32 (of the 47) hospitals included in PHIS with complete inpatient and ED data were used to evaluate hospital‐level resource utilization for children 1 to 18 years of age discharged January 1, 2008 to June 30, 2014 with a diagnosis of pneumonia (International Classification of Diseases, 9th Revision [ICD‐9] codes 480.x‐486.x, 487.0).[13] Our goal was to identify previously healthy children with uncomplicated pneumonia, so we excluded patients with complex chronic conditions,[14] billing charges for intensive care management and/or pleural drainage procedure (IDC‐9 codes 510.0, 510.9, 511.0, 511.1, 511.8, 511.9, 513.x) on day of admission or the next day, or prior pneumonia admission in the last 30 days. We studied 2 mutually exclusive populations: children with pneumonia treated in the ED (ie, patients who were evaluated in the ED and discharged to home), and children hospitalized with pneumonia, including those admitted through the ED.
Guideline Publication and Study Periods
For an exploratory before and after comparison, patients were grouped into 2 cohorts based on a guideline online publication date of August 1, 2011: preguideline (January 1, 2008 to July 31, 2011) and postguideline (August 1, 2011 to June 30, 2014).
Study Outcomes
The measured outcomes were the monthly proportion of pneumonia patients for whom specific diagnostic tests were performed, as determined from billing data. The diagnostic tests evaluated were complete blood count (CBC), blood culture, C‐reactive protein (CRP), and chest radiograph (CXR). Standardized costs were also calculated from PHIS charges as previously described to standardize the cost of the individual tests and remove interhospital cost variation.[3]
Relationship of Repeat Testing and Severity of Illness
Because higher illness severity and clinical deterioration may warrant repeat testing, we also explored the association of repeat diagnostic testing for inpatients with severity of illness by using the following variables as measures of severity: length of stay (LOS), transfer to intensive care unit (ICU), or pleural drainage procedure after admission (>2 calendar days after admission). Repeat diagnostic testing was stratified by number of tests.
Statistical Analysis
The categorical demographic characteristics of the pre‐ and postguideline populations were summarized using frequencies and percentages, and compared using 2 tests. Continuous demographics were summarized with medians and interquartile ranges (IQRs) and compared with the Wilcoxon rank sum test. Segmented regression, clustered by hospital, was used to assess trends in monthly resource utilization as well as associated standardized costs before and after guidelines publication. To estimate the impact of the guidelines overall, we compared the observed diagnostic resource use at the end of the study period with expected use projected from trends in the preguidelines period (ie, if there were no new guidelines). Individual interrupted time series were also built for each hospital. From these models, we assessed which hospitals had a significant difference between the rate observed at the end of the study and that estimated from their preguideline trajectory. To assess the relationship between the number of positive improvements at a hospital and hospital characteristics, we used Spearman's correlation and Kruskal‐Wallis tests. All analyses were performed with SAS version 9.3 (SAS Institute, Inc., Cary, NC), and P values <0.05 were considered statistically significant. In accordance with the policies of the Cincinnati Children's Hospital Medical Center Institutional Review Board, this research, using a deidentified dataset, was not considered human subjects research.
RESULTS
There were 275,288 hospital admissions meeting study inclusion criteria of 1 to 18 years of age with a diagnosis of pneumonia from 2008 to 2014. Of these, 54,749 met exclusion criteria (1874 had pleural drainage procedure on day 0 or 1, 51,306 had complex chronic conditions, 1569 were hospitalized with pneumonia in the last 30 days). Characteristics of the remaining 220,539 patients in the final sample are shown in Table 1. The median age was 4 years (IQR, 27 years); a majority of the children were male (53%) and had public insurance (58%). There were 128,855 patients in the preguideline period (January 1, 2008 to July 31, 2011) and 91,684 in the post guideline period (August 1, 2011June 30, 2014).
| Overall | Preguideline | Postguideline | P | |
|---|---|---|---|---|
| ||||
| No. of discharges | 220,539 | 128,855 | 91,684 | |
| Type of encounter | ||||
| ED only | 150,215 (68.1) | 88,790 (68.9) | 61,425 (67) | <0.001 |
| Inpatient | 70,324 (31.9) | 40,065 (31.1) | 30,259 (33) | |
| Age | ||||
| 14 years | 129,360 (58.7) | 77,802 (60.4) | 51,558 (56.2) | <0.001 |
| 59 years | 58,609 (26.6) | 32,708 (25.4) | 25,901 (28.3) | |
| 1018 years | 32,570 (14.8) | 18,345 (14.2) | 14,225 (15.5) | |
| Median [IQR] | 4 [27] | 3 [27] | 4 [27] | <0.001 |
| Gender | ||||
| Male | 116,718 (52.9) | 68,319 (53) | 48,399 (52.8) | 00.285 |
| Female | 103,813 (47.1) | 60,532 (47) | 43,281 (47.2) | |
| Race | ||||
| Non‐Hispanic white | 84,423 (38.3) | 47,327 (36.7) | 37,096 (40.5) | <0.001 |
| Non‐Hispanic black | 60,062 (27.2) | 35,870 (27.8) | 24,192 (26.4) | |
| Hispanic | 51,184 (23.2) | 31,167 (24.2) | 20,017 (21.8) | |
| Asian | 6,444 (2.9) | 3,691 (2.9) | 2,753 (3) | |
| Other | 18,426 (8.4) | 10,800 (8.4) | 7,626 (8.3) | |
| Payer | ||||
| Government | 128,047 (58.1) | 70,742 (54.9) | 57,305 (62.5) | <0.001 |
| Private | 73,338 (33.3) | 44,410 (34.5) | 28,928 (31.6) | |
| Other | 19,154 (8.7) | 13,703 (10.6) | 5,451 (5.9) | |
| Disposition | ||||
| HHS | 684 (0.3) | 411 (0.3) | 273 (0.3) | <0.001 |
| Home | 209,710 (95.1) | 123,236 (95.6) | 86,474 (94.3) | |
| Other | 9,749 (4.4) | 4,962 (3.9) | 4,787 (5.2) | |
| SNF | 396 (0.2) | 246 (0.2) | 150 (0.2) | |
| Season | ||||
| Spring | 60,171 (27.3) | 36,709 (28.5) | 23,462 (25.6) | <0.001 |
| Summer | 29,891 (13.6) | 17,748 (13.8) | 12,143 (13.2) | |
| Fall | 52,161 (23.7) | 28,332 (22) | 23,829 (26) | |
| Winter | 78,316 (35.5) | 46,066 (35.8) | 32,250 (35.2) | |
| LOS | ||||
| 13 days | 204,812 (92.9) | 119,497 (92.7) | 85,315 (93.1) | <0.001 |
| 46 days | 10,454 (4.7) | 6,148 (4.8) | 4,306 (4.7) | |
| 7+ days | 5,273 (2.4) | 3,210 (2.5) | 2,063 (2.3) | |
| Median [IQR] | 1 [11] | 1 [11] | 1 [11] | 0.144 |
| Admitted patients, median [IQR] | 2 [13] | 2 [13] | 2 [13] | <0.001 |
Discharged From the ED
Throughout the study, utilization of CBC, blood cultures, and CRP was <20%, whereas CXR use was >75%. In segmented regression analysis, CRP utilization was relatively stable before the guidelines publication. However, by the end of the study period, the projected estimate of CRP utilization without guidelines (expected) was 2.9% compared with 4.8% with the guidelines (observed) (P < 0.05) (Figure 1). A similar pattern of higher rates of diagnostic utilization after the guidelines compared with projected estimates without the guidelines was also seen in the ED utilization of CBC, blood cultures, and CXR (Figure 1); however, these trends did not achieve statistical significance. Table 2 provides specific values. Using a standard cost of $19.52 for CRP testing, annual costs across all hospitals increased $11,783 for ED evaluation of CAP.
Baseline (%) | Preguideline Trend | Level Change at Guideline | Change in Trend After Guideline | Estimates at End of Study* | |||
|---|---|---|---|---|---|---|---|
Without Guideline (%) | With Guideline (%) | P | |||||
| |||||||
| ED‐only encounters | |||||||
| Blood culture | 14.6 | 0.1 | 0.8 | 0.1 | 5.5 | 8.6 | NS |
| CBC | 19.2 | 0.1 | 0.4 | 0.1 | 10.7 | 14.0 | NS |
| CRP | 5.4 | 0.0 | 0.6 | 0.1 | 2.9 | 4.8 | <0.05 |
| Chest x‐ray | 85.4 | 0.1 | 0.1 | 0.0 | 80.9 | 81.1 | NS |
| Inpatient encounters | |||||||
| Blood culture | 50.6 | 0.0 | 1.7 | 0.2 | 49.2 | 41.4 | <0.05 |
| Repeat blood culture | 6.5 | 0.0 | 1.0 | 0.1 | 8.9 | 5.8 | NS |
| CBC | 65.2 | 0.0 | 3.1 | 0.0 | 65.0 | 62.2 | NS |
| Repeat CBC | 23.4 | 0.0 | 4.2 | 0.0 | 20.8 | 16.0 | NS |
| CRP | 25.7 | 0.0 | 1.1 | 0.0 | 23.8 | 23.5 | NS |
| Repeat CRP | 12.5 | 0.1 | 2.2 | 0.1 | 7.1 | 7.3 | NS |
| Chest x‐ray | 89.4 | 0.1 | 0.7 | 0.0 | 85.4 | 83.9 | NS |
| Repeat chest x‐ray | 25.5 | 0.0 | 2.0 | 0.1 | 24.1 | 17.7 | <0.05 |
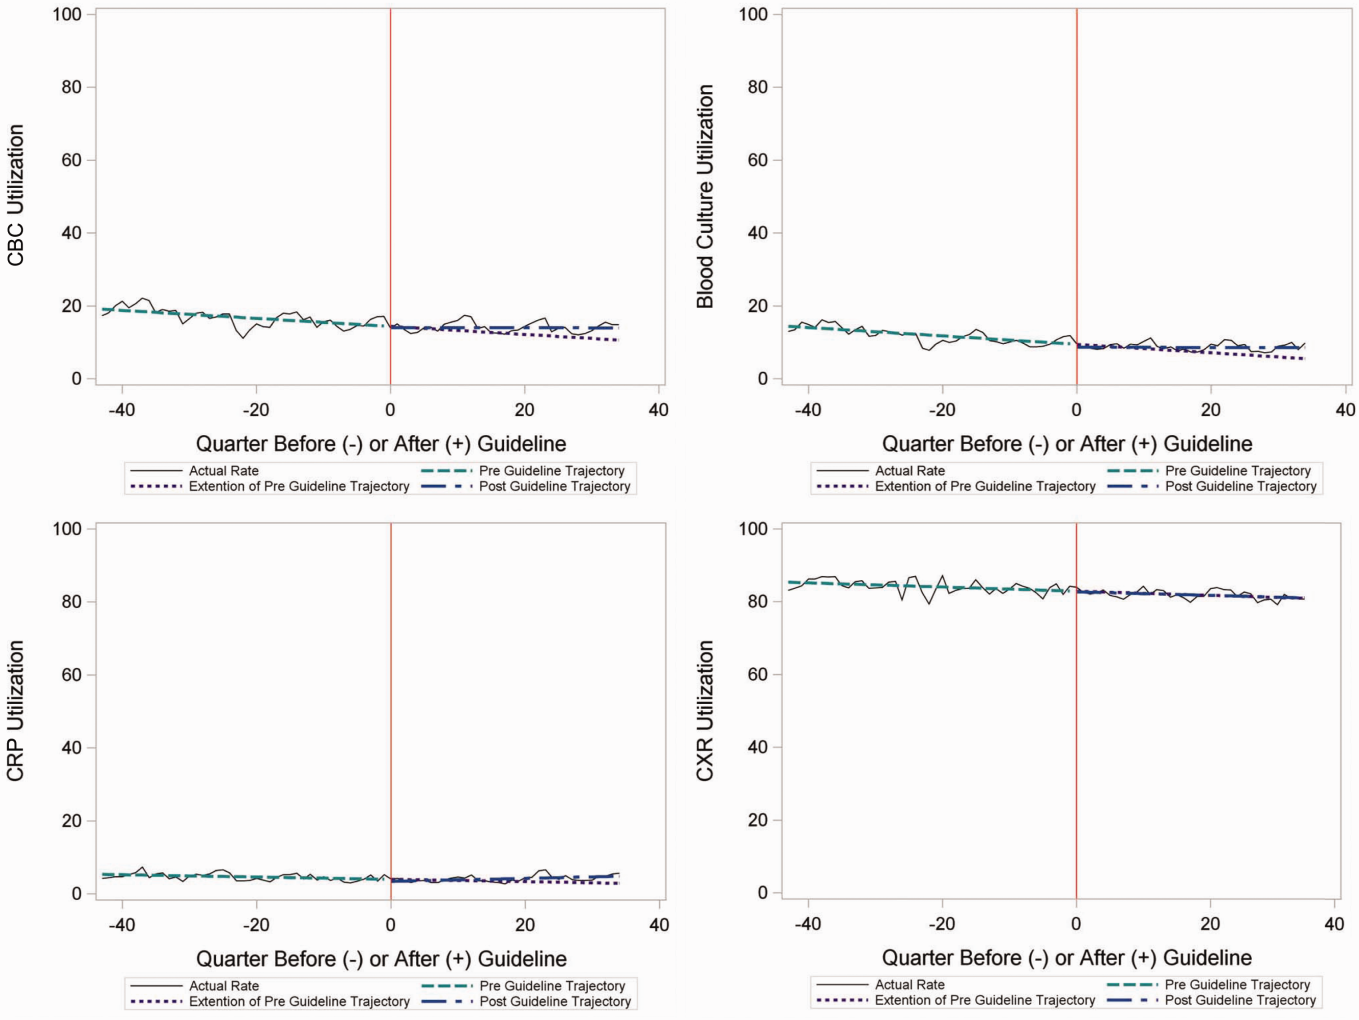
Inpatient Encounters
In the segmented regression analysis of children hospitalized with CAP, guideline publication was associated with changes in the monthly use of some diagnostic tests. For example, by the end of the study period, the use of blood culture was 41.4% (observed), whereas the projected estimated use in the absence of the guidelines was 49.2% (expected) (P < 0.05) (Figure 2). Table 2 includes the data for the other tests, CBC, CRP, and CXR, in which similar patterns are noted with lower utilization rates after the guidelines, compared with expected utilization rates without the guidelines; however, these trends did not achieve statistical significance. Evaluating the utilization of repeat testing for inpatients, only repeat CXR achieved statistical significance (P < 0.05), with utilization rates of 17.7% with the guidelines (actual) compared with 24.1% without the guidelines (predicted).
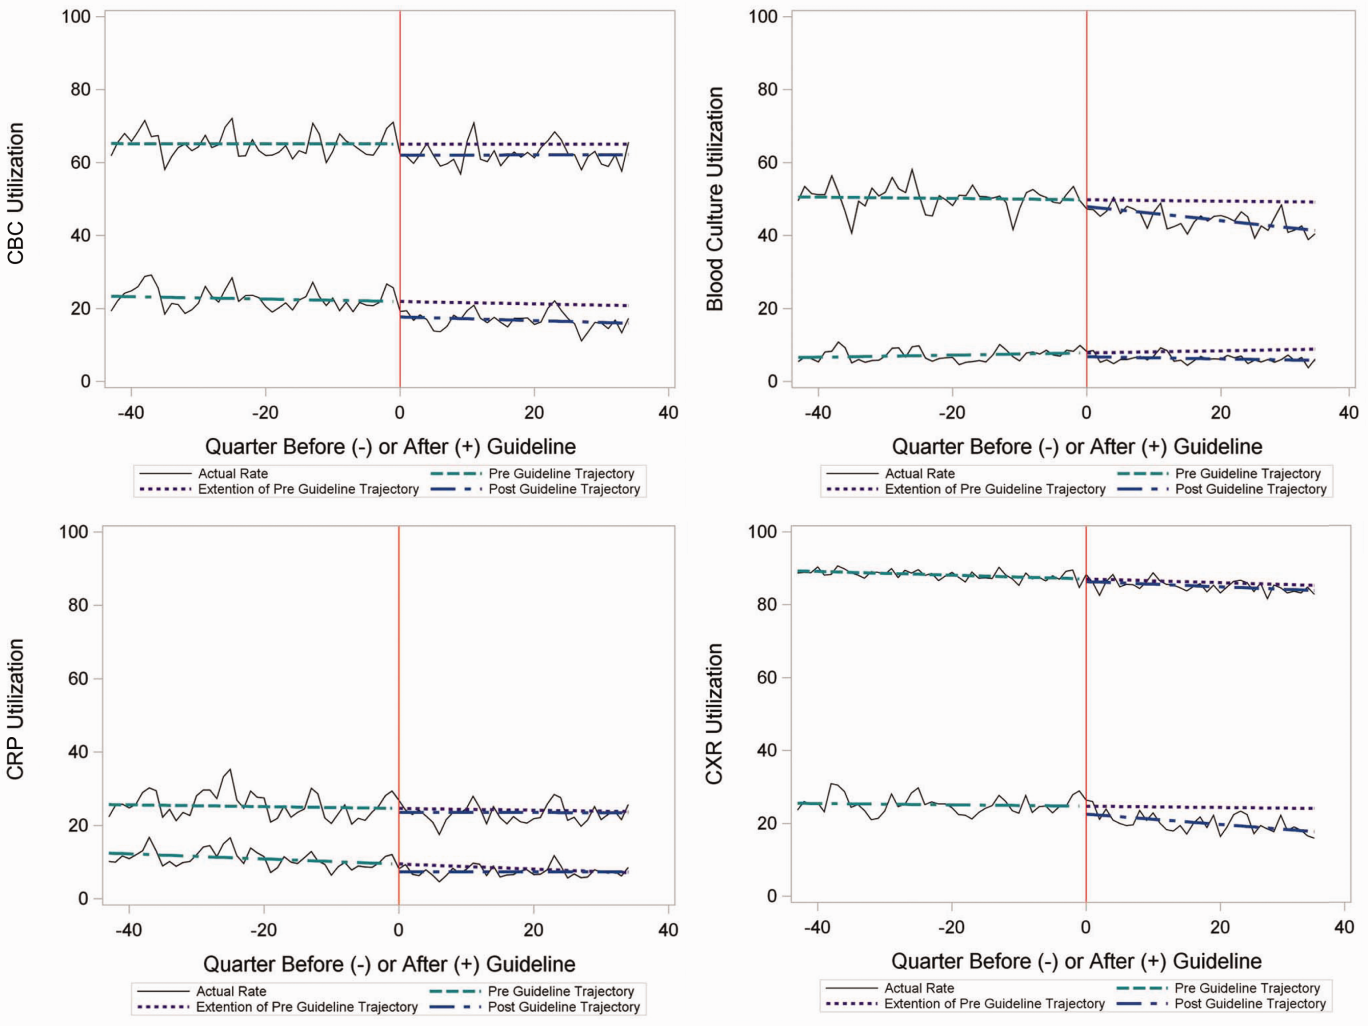
To better understand the use of repeat testing, a comparison of severity outcomesLOS, ICU transfer, and pleural drainage procedureswas performed between patients with no repeat testing (70%) and patients with 1 or more repeat tests (30%). Patients with repeat testing had longer LOS (no repeat testing LOS 1 [IQR, 12]) versus 1 repeat test LOS 3 ([IQR, 24] vs 2+ repeat tests LOS 5 [IQR, 38]), higher rate of ICU transfer (no repeat testing 4.6% vs 1 repeat test 14.6% vs 2+ repeat test 35.6%), and higher rate of pleural drainage (no repeat testing 0% vs 1 repeat test 0.1% vs 2+ repeat test 5.9%] (all P < 0.001).
Using standard costs of $37.57 for blood cultures and $73.28 for CXR, annual costs for children with CAP across all hospitals decreased by $91,512 due to decreased utilization of blood cultures, and by $146,840 due to decreased utilization of CXR.
Hospital‐Level Variation in the Impact of the National Guideline
Figure 3 is a visual representation (heat map) of the impact of the guidelines at the hospital level at the end of the study from the individual interrupted time series. Based on this heat map (Figure 3), there was wide variability between hospitals in the impact of the guideline on each test in different settings (ED or inpatient). By diagnostic testing, 7 hospitals significantly decreased utilization of blood cultures for inpatients, and 5 hospitals significantly decreased utilization for repeat blood cultures and repeat CXR. Correlation between the number of positive improvements at a hospital and region (P = 0.974), number of CAP cases (P = 0.731), or percentage of public insurance (P = 0.241) were all nonsignificant.
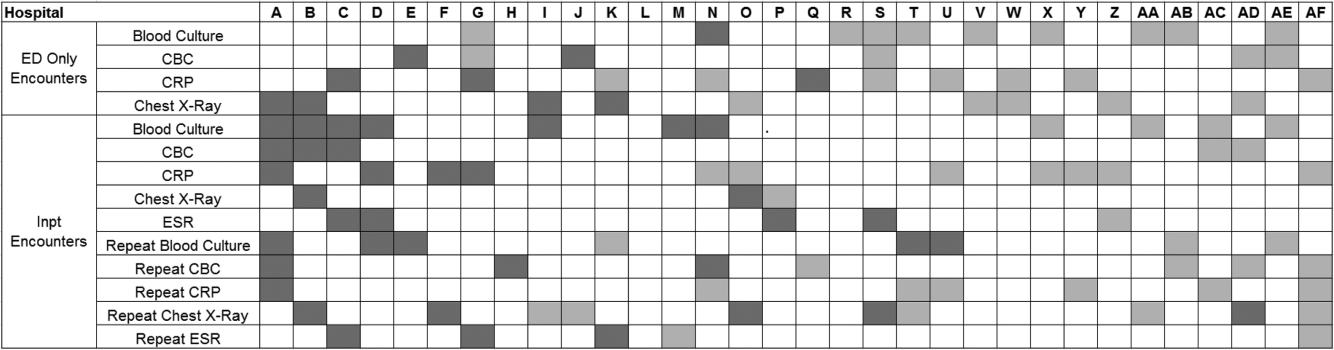
DISCUSSION
This study complements previous assessments by evaluating the impact of the 2011 IDSA/PIDS consensus guidelines on the management of children with CAP cared for at US children's hospitals. Prior studies have shown increased use of narrow‐spectrum antibiotics for children with CAP after the publication of these guidelines.[7] The current study focused on diagnostic testing for CAP before and after the publication of the 2011 guidelines. In the ED setting, use of some diagnostic tests (blood culture, CBC, CXR, CRP) was declining prior to guideline publication, but appeared to plateau and/or increase after 2011. Among children admitted with CAP, use of diagnostic testing was relatively stable prior to 2011, and use of these tests (blood culture, CBC, CXR, CRP) declined after guideline publication. Overall, changes in diagnostic resource utilization 3 years after publication were modest, with few changes achieving statistical significance. There was a large variability in the impact of guidelines on test use between hospitals.
For outpatients, including those managed in the ED, the PIDS/IDSA guidelines recommend limited laboratory testing in nontoxic, fully immunized patients. The guidelines discourage the use of diagnostic testing among outpatients because of their low yield (eg, blood culture), and because test results may not impact management (eg, CBC).[6] In the years prior to guideline publication, there was already a declining trend in testing rates, including blood cultures, CBC, and CRP, for patients in the ED. After guideline publication, the rate of blood cultures, CBC, and CRP increased, but only the increase in CRP utilization achieved statistical significance. We would not expect utilization for common diagnostic tests (eg, CBC for outpatients with CAP) to be at or close to 0% because of the complexity of clinical decision making regarding admission that factors in aspects of patient history, exam findings, and underlying risk.[15] ED utilization of blood cultures was <10%, CBC <15%, and CRP <5% after guideline publication, which may represent the lowest testing limit that could be achieved.
CXRs obtained in the ED did not decrease over the entire study period. The rates of CXR use (close to 80%) seen in our study are similar to prior ED studies.[5, 16] Management of children with CAP in the ED might be different than outpatient primary care management because (1) unlike primary care providers, ED providers do not have an established relationship with their patients and do not have the opportunity for follow‐up and serial exams, making them less likely to tolerate diagnostic uncertainty; and (2) ED providers may see sicker patients. However, use of CXR in the ED does represent an opportunity for further study to understand if decreased utilization is feasible without adversely impacting clinical outcomes.
The CAP guidelines provide a strong recommendation to obtain blood culture in moderate to severe pneumonia. Despite this, blood culture utilization declined after guideline publication. Less than 10% of children hospitalized with uncomplicated CAP have positive blood cultures, which calls into question the utility of blood cultures for all admitted patients.[17, 18, 19] The recent EPIC (Epidemiology of Pneumonia in the Community) study showed that a majority of children hospitalized with pneumonia do not have growth of bacteria in culture, but there may be a role for blood cultures in patients with a strong suspicion of complicated CAP or in the patient with moderate to severe disease.[20] In addition to blood cultures, the guidelines also recommend CBC and CXR in moderate to severely ill children. This observed decline in testing in CBC and CXR may be related to individual physician assessments of which patients are moderately to severely ill, as the guidelines do not recommend testing for children with less severe disease. Our exclusion of patients requiring intensive care management or pleural drainage on admission might have selected children with a milder course of illness, although still requiring admission.
The guidelines discourage repeat diagnostic testing among children hospitalized with CAP who are improving. In this study, repeat CXR and CBC occurred in approximately 20% of patients, but repeat blood culture and CRP was much lower. As with initial diagnostic testing for inpatients with CAP, the rates of some repeat testing decreased with the guidelines. However, those with repeat testing had longer LOS and were more likely to require ICU transfer or a pleural drainage procedure compared to children without repeat testing. This suggests that repeat testing is used more often in children with a severe presentation or a worsening clinical course, and not done routinely on hospitalized patients.
The financial impact of decreased testing is modest, because the tests themselves are relatively inexpensive. However, the lack of substantial cost savings should not preclude efforts to continue to improve adherence to the guidelines. Not only is increased testing associated with higher hospitalization rates,[5] potentially yielding higher costs and family stress, increased testing may also lead to patient discomfort and possibly increased radiation exposure through chest radiography.
Many of the diagnostic testing recommendations in the CAP guidelines are based on weak evidence, which may contribute to the lack of substantial adoption. Nevertheless, adherence to guideline recommendations requires sustained effort on the part of individual physicians that should be encouraged through institutional support.[21] Continuous education and clinical decision support, as well as reminders in the electronic medical record, would make guideline recommendations more visible and may help overcome the inertia of previous practice.[15] The hospital‐level heat map (Figure 3) included in this study demonstrates that the impact of the guidelines was variable across sites. Although a few sites had decreased diagnostic testing in many areas with no increased testing in any category, there were several sites that had no improvement in any diagnostic testing category. In addition, hospital‐level factors like size, geography, and insurance status were not associated with number of improvements. To better understand drivers of change at individual hospitals, future studies should evaluate specific strategies utilized by the rapid guideline adopters.
This study is subject to several limitations. The use of ICD‐9 codes to identify patients with CAP may not capture all patients with this diagnosis; however, these codes have been previously validated.[13] Additionally, because patients were identified using ICD‐9 coding assigned at the time of discharge, testing performed in the ED setting may not reflect care for a child with known pneumonia, but rather may reflect testing for a child with fever or other signs of infection. PHIS collects data from freestanding children's hospitals, which care for a majority of children with CAP in the US, but our findings may not be generalizable to other hospitals. In addition, we did not examine drivers of trends within individual institutions. We did not have detailed information to examine whether the PHIS hospitals in our study had actively worked to adopt the CAP guidelines. We were also unable to assess physician's familiarity with guidelines or the level of disagreement with the recommendations. Furthermore, the PHIS database does not permit detailed correlation of diagnostic testing with clinical parameters. In contrast to the diagnostic testing evaluated in this study, which is primarily discouraged by the IDSA/PIDS guidelines, respiratory viral testing for children with CAP is recommended but could not be evaluated, as data on such testing are not readily available in PHIS.
CONCLUSION
Publication of the IDSA/PIDS evidence‐based guidelines for the management of CAP was associated with modest, variable changes in use of diagnostic testing. Further adoption of the CAP guidelines should reduce variation in care and decrease unnecessary resource utilization in the management of CAP. Our study demonstrates that efforts to promote decreased resource utilization should target specific situations (eg, repeat testing for inpatients who are improving). Adherence to guidelines may be improved by the adoption of local practices that integrate and improve daily workflow, like order sets and clinical decision support tools.
Disclosure: Nothing to report.
- , . Eliminating waste in US health care. JAMA. 2012;307(14):1513–1516.
- , , , et al. Choosing wisely in pediatric hospital medicine: five opportunities for improved healthcare value. J Hosp Med. 2013;8(9):479–485.
- , , , et al.; Pediatric Research in Inpatient Settings (PRIS) Network. Prioritization of comparative effectiveness research topics in hospital pediatrics. Arch Pediatr Adolesc Med. 2012;166(12):1155–1164.
- , , , et al. Variability in processes of care and outcomes among children hospitalized with community‐acquired pneumonia. Pediatr Infect Dis J. 2012;31(10):1036–1041.
- , , , , . Variation in emergency department diagnostic testing and disposition outcomes in pneumonia. Pediatrics. 2013;132(2):237–244.
- , , , et al.; Pediatric Infectious Diseases Society and the Infectious Diseases Society of America. The management of community‐acquired pneumonia in infants and children older than 3 months of age: clinical practice guidelines by the Pediatric Infectious Diseases Society and the Infectious Diseases Society of America. Clin Infect Dis. 2011;53(7):e25–e76.
- , , , et al., Impact of Infectious Diseases Society of America/Pediatric Infectious Diseases Society guidelines on treatment of community‐acquired pneumonia in hospitalized children. Clin Infect Dis. 2014;58(6):834–838.
- , , , et al. Antibiotic choice for children hospitalized with pneumonia and adherence to national guidelines. Pediatrics. 2015;136(1):44–52.
- , , , et al. Quality improvement methods increase appropriate antibiotic prescribing for childhood pneumonia. Pediatrics. 2013;131(5):e1623–e1631.
- , , , et al. Improvement methodology increases guideline recommended blood cultures in children with pneumonia. Pediatrics. 2015;135(4):e1052–e1059.
- , , , , , . Impact of a guideline on management of children hospitalized with community‐acquired pneumonia. Pediatrics. 2012;129(3):e597–e604.
- , , , . Effectiveness of antimicrobial guidelines for community‐acquired pneumonia in children. Pediatrics. 2012;129(5):e1326–e1333.
- , , , et al. Identifying pediatric community‐acquired pneumonia hospitalizations: accuracy of administrative billing codes. JAMA Pediatr. 2013;167(9):851–858.
- , , , , . Pediatric complex chronic conditions classification system version 2: updated for ICD‐10 and complex medical technology dependence and transplantation. BMC Pediatr. 2014;14:199.
- , . Establishing superior benchmarks of care in clinical practice: a proposal to drive achievable health care value. JAMA Pediatr. 2015;169(4):301–302.
- , , , . Emergency department management of childhood pneumonia in the United States prior to publication of national guidelines. Acad Emerg Med. 2013;20(3):240–246.
- , , , et al. Prevalence of bacteremia in hospitalized pediatric patients with community‐acquired pneumonia. Pediatr Infect Dis J. 2013;32(7):736–740.
- , , , , . The prevalence of bacteremia in pediatric patients with community‐acquired pneumonia: guidelines to reduce the frequency of obtaining blood cultures. Hosp Pediatr. 2013;3(2):92–96.
- . Do all children hospitalized with community‐acquired pneumonia require blood cultures? Hosp Pediatr. 2013;3(2):177–179.
- , , , et al.; CDC EPIC Study Team. Community‐acquired pneumonia requiring hospitalization among U.S. children. N Engl J Med. 2015;372(9):835–845.
- , , , et al. Influence of hospital guidelines on management of children hospitalized with pneumonia. Pediatrics. 2012;130(5):e823–e830.
Overutilization of resources is a significant, yet underappreciated, problem in medicine. Many interventions target underutilization (eg, immunizations) or misuse (eg, antibiotic prescribing for viral pharyngitis), yet overutilization remains as a significant contributor to healthcare waste.[1] In an effort to reduce waste, the Choosing Wisely campaign created a work group to highlight areas of overutilization, specifically noting both diagnostic tests and therapies for common pediatric conditions with no proven benefit and possible harm to the patient.[2] Respiratory illnesses have been a target of many quality‐improvement efforts, and pneumonia represents a common diagnosis in pediatrics.[3] The use of diagnostic testing for pneumonia is an area where care can be optimized and aligned with evidence.
Laboratory testing and diagnostic imaging are routinely used for the management of children with community‐acquired pneumonia (CAP). Several studies have documented substantial variability in the use of these resources for pneumonia management, with higher resource use associated with a higher chance of hospitalization after emergency department (ED) evaluation and a longer length of stay among those requiring hospitalization.[4, 5] This variation in diagnostic resource utilization has been attributed, at least in part, to a lack of consensus on the management of pneumonia. There is wide variability in diagnostic testing, and due to potential consequences for patients presenting with pneumonia, efforts to standardize care offer an opportunity to improve healthcare value.
In August 2011, the first national, evidence‐based consensus guidelines for the management of childhood CAP were published jointly by the Pediatric Infectious Diseases Society (PIDS) and the Infectious Diseases Society of America (IDSA).[6] A primary focus of these guidelines was the recommendation for the use of narrow spectrum antibiotics for the management of uncomplicated pneumonia. Previous studies have assessed the impact of the publication of the PIDS/IDSA guidelines on empiric antibiotic selection for the management of pneumonia.[7, 8] In addition, the guidelines provided recommendations regarding diagnostic test utilization, in particular discouraging blood tests (eg, complete blood counts) and radiologic studies for nontoxic, fully immunized children treated as outpatients, as well as repeat testing for children hospitalized with CAP who are improving.
Although single centers have demonstrated changes in utilization patterns based on clinical practice guidelines,[9, 10, 11, 12] whether these guidelines have impacted diagnostic test utilization among US children with CAP in a larger scale remains unknown. Therefore, we sought to determine the impact of the PIDS/IDSA guidelines on the use of diagnostic testing among children with CAP using a national sample of US children's hospitals. Because the guidelines discourage repeat diagnostic testing in patients who are improving, we also evaluated the association between repeat diagnostic studies and severity of illness.
METHODS
This retrospective cohort study used data from the Pediatric Health Information System (PHIS) (Children's Hospital Association, Overland Park, KS). The PHIS database contains deidentified administrative data, detailing demographic, diagnostic, procedure, and billing data from 47 freestanding, tertiary care children's hospitals. This database accounts for approximately 20% of all annual pediatric hospitalizations in the United States. Data quality is ensured through a joint effort between the Children's Hospital Association and participating hospitals.
Patient Population
Data from 32 (of the 47) hospitals included in PHIS with complete inpatient and ED data were used to evaluate hospital‐level resource utilization for children 1 to 18 years of age discharged January 1, 2008 to June 30, 2014 with a diagnosis of pneumonia (International Classification of Diseases, 9th Revision [ICD‐9] codes 480.x‐486.x, 487.0).[13] Our goal was to identify previously healthy children with uncomplicated pneumonia, so we excluded patients with complex chronic conditions,[14] billing charges for intensive care management and/or pleural drainage procedure (IDC‐9 codes 510.0, 510.9, 511.0, 511.1, 511.8, 511.9, 513.x) on day of admission or the next day, or prior pneumonia admission in the last 30 days. We studied 2 mutually exclusive populations: children with pneumonia treated in the ED (ie, patients who were evaluated in the ED and discharged to home), and children hospitalized with pneumonia, including those admitted through the ED.
Guideline Publication and Study Periods
For an exploratory before and after comparison, patients were grouped into 2 cohorts based on a guideline online publication date of August 1, 2011: preguideline (January 1, 2008 to July 31, 2011) and postguideline (August 1, 2011 to June 30, 2014).
Study Outcomes
The measured outcomes were the monthly proportion of pneumonia patients for whom specific diagnostic tests were performed, as determined from billing data. The diagnostic tests evaluated were complete blood count (CBC), blood culture, C‐reactive protein (CRP), and chest radiograph (CXR). Standardized costs were also calculated from PHIS charges as previously described to standardize the cost of the individual tests and remove interhospital cost variation.[3]
Relationship of Repeat Testing and Severity of Illness
Because higher illness severity and clinical deterioration may warrant repeat testing, we also explored the association of repeat diagnostic testing for inpatients with severity of illness by using the following variables as measures of severity: length of stay (LOS), transfer to intensive care unit (ICU), or pleural drainage procedure after admission (>2 calendar days after admission). Repeat diagnostic testing was stratified by number of tests.
Statistical Analysis
The categorical demographic characteristics of the pre‐ and postguideline populations were summarized using frequencies and percentages, and compared using 2 tests. Continuous demographics were summarized with medians and interquartile ranges (IQRs) and compared with the Wilcoxon rank sum test. Segmented regression, clustered by hospital, was used to assess trends in monthly resource utilization as well as associated standardized costs before and after guidelines publication. To estimate the impact of the guidelines overall, we compared the observed diagnostic resource use at the end of the study period with expected use projected from trends in the preguidelines period (ie, if there were no new guidelines). Individual interrupted time series were also built for each hospital. From these models, we assessed which hospitals had a significant difference between the rate observed at the end of the study and that estimated from their preguideline trajectory. To assess the relationship between the number of positive improvements at a hospital and hospital characteristics, we used Spearman's correlation and Kruskal‐Wallis tests. All analyses were performed with SAS version 9.3 (SAS Institute, Inc., Cary, NC), and P values <0.05 were considered statistically significant. In accordance with the policies of the Cincinnati Children's Hospital Medical Center Institutional Review Board, this research, using a deidentified dataset, was not considered human subjects research.
RESULTS
There were 275,288 hospital admissions meeting study inclusion criteria of 1 to 18 years of age with a diagnosis of pneumonia from 2008 to 2014. Of these, 54,749 met exclusion criteria (1874 had pleural drainage procedure on day 0 or 1, 51,306 had complex chronic conditions, 1569 were hospitalized with pneumonia in the last 30 days). Characteristics of the remaining 220,539 patients in the final sample are shown in Table 1. The median age was 4 years (IQR, 27 years); a majority of the children were male (53%) and had public insurance (58%). There were 128,855 patients in the preguideline period (January 1, 2008 to July 31, 2011) and 91,684 in the post guideline period (August 1, 2011June 30, 2014).
| Overall | Preguideline | Postguideline | P | |
|---|---|---|---|---|
| ||||
| No. of discharges | 220,539 | 128,855 | 91,684 | |
| Type of encounter | ||||
| ED only | 150,215 (68.1) | 88,790 (68.9) | 61,425 (67) | <0.001 |
| Inpatient | 70,324 (31.9) | 40,065 (31.1) | 30,259 (33) | |
| Age | ||||
| 14 years | 129,360 (58.7) | 77,802 (60.4) | 51,558 (56.2) | <0.001 |
| 59 years | 58,609 (26.6) | 32,708 (25.4) | 25,901 (28.3) | |
| 1018 years | 32,570 (14.8) | 18,345 (14.2) | 14,225 (15.5) | |
| Median [IQR] | 4 [27] | 3 [27] | 4 [27] | <0.001 |
| Gender | ||||
| Male | 116,718 (52.9) | 68,319 (53) | 48,399 (52.8) | 00.285 |
| Female | 103,813 (47.1) | 60,532 (47) | 43,281 (47.2) | |
| Race | ||||
| Non‐Hispanic white | 84,423 (38.3) | 47,327 (36.7) | 37,096 (40.5) | <0.001 |
| Non‐Hispanic black | 60,062 (27.2) | 35,870 (27.8) | 24,192 (26.4) | |
| Hispanic | 51,184 (23.2) | 31,167 (24.2) | 20,017 (21.8) | |
| Asian | 6,444 (2.9) | 3,691 (2.9) | 2,753 (3) | |
| Other | 18,426 (8.4) | 10,800 (8.4) | 7,626 (8.3) | |
| Payer | ||||
| Government | 128,047 (58.1) | 70,742 (54.9) | 57,305 (62.5) | <0.001 |
| Private | 73,338 (33.3) | 44,410 (34.5) | 28,928 (31.6) | |
| Other | 19,154 (8.7) | 13,703 (10.6) | 5,451 (5.9) | |
| Disposition | ||||
| HHS | 684 (0.3) | 411 (0.3) | 273 (0.3) | <0.001 |
| Home | 209,710 (95.1) | 123,236 (95.6) | 86,474 (94.3) | |
| Other | 9,749 (4.4) | 4,962 (3.9) | 4,787 (5.2) | |
| SNF | 396 (0.2) | 246 (0.2) | 150 (0.2) | |
| Season | ||||
| Spring | 60,171 (27.3) | 36,709 (28.5) | 23,462 (25.6) | <0.001 |
| Summer | 29,891 (13.6) | 17,748 (13.8) | 12,143 (13.2) | |
| Fall | 52,161 (23.7) | 28,332 (22) | 23,829 (26) | |
| Winter | 78,316 (35.5) | 46,066 (35.8) | 32,250 (35.2) | |
| LOS | ||||
| 13 days | 204,812 (92.9) | 119,497 (92.7) | 85,315 (93.1) | <0.001 |
| 46 days | 10,454 (4.7) | 6,148 (4.8) | 4,306 (4.7) | |
| 7+ days | 5,273 (2.4) | 3,210 (2.5) | 2,063 (2.3) | |
| Median [IQR] | 1 [11] | 1 [11] | 1 [11] | 0.144 |
| Admitted patients, median [IQR] | 2 [13] | 2 [13] | 2 [13] | <0.001 |
Discharged From the ED
Throughout the study, utilization of CBC, blood cultures, and CRP was <20%, whereas CXR use was >75%. In segmented regression analysis, CRP utilization was relatively stable before the guidelines publication. However, by the end of the study period, the projected estimate of CRP utilization without guidelines (expected) was 2.9% compared with 4.8% with the guidelines (observed) (P < 0.05) (Figure 1). A similar pattern of higher rates of diagnostic utilization after the guidelines compared with projected estimates without the guidelines was also seen in the ED utilization of CBC, blood cultures, and CXR (Figure 1); however, these trends did not achieve statistical significance. Table 2 provides specific values. Using a standard cost of $19.52 for CRP testing, annual costs across all hospitals increased $11,783 for ED evaluation of CAP.
Baseline (%) | Preguideline Trend | Level Change at Guideline | Change in Trend After Guideline | Estimates at End of Study* | |||
|---|---|---|---|---|---|---|---|
Without Guideline (%) | With Guideline (%) | P | |||||
| |||||||
| ED‐only encounters | |||||||
| Blood culture | 14.6 | 0.1 | 0.8 | 0.1 | 5.5 | 8.6 | NS |
| CBC | 19.2 | 0.1 | 0.4 | 0.1 | 10.7 | 14.0 | NS |
| CRP | 5.4 | 0.0 | 0.6 | 0.1 | 2.9 | 4.8 | <0.05 |
| Chest x‐ray | 85.4 | 0.1 | 0.1 | 0.0 | 80.9 | 81.1 | NS |
| Inpatient encounters | |||||||
| Blood culture | 50.6 | 0.0 | 1.7 | 0.2 | 49.2 | 41.4 | <0.05 |
| Repeat blood culture | 6.5 | 0.0 | 1.0 | 0.1 | 8.9 | 5.8 | NS |
| CBC | 65.2 | 0.0 | 3.1 | 0.0 | 65.0 | 62.2 | NS |
| Repeat CBC | 23.4 | 0.0 | 4.2 | 0.0 | 20.8 | 16.0 | NS |
| CRP | 25.7 | 0.0 | 1.1 | 0.0 | 23.8 | 23.5 | NS |
| Repeat CRP | 12.5 | 0.1 | 2.2 | 0.1 | 7.1 | 7.3 | NS |
| Chest x‐ray | 89.4 | 0.1 | 0.7 | 0.0 | 85.4 | 83.9 | NS |
| Repeat chest x‐ray | 25.5 | 0.0 | 2.0 | 0.1 | 24.1 | 17.7 | <0.05 |
Inpatient Encounters
In the segmented regression analysis of children hospitalized with CAP, guideline publication was associated with changes in the monthly use of some diagnostic tests. For example, by the end of the study period, the use of blood culture was 41.4% (observed), whereas the projected estimated use in the absence of the guidelines was 49.2% (expected) (P < 0.05) (Figure 2). Table 2 includes the data for the other tests, CBC, CRP, and CXR, in which similar patterns are noted with lower utilization rates after the guidelines, compared with expected utilization rates without the guidelines; however, these trends did not achieve statistical significance. Evaluating the utilization of repeat testing for inpatients, only repeat CXR achieved statistical significance (P < 0.05), with utilization rates of 17.7% with the guidelines (actual) compared with 24.1% without the guidelines (predicted).
To better understand the use of repeat testing, a comparison of severity outcomesLOS, ICU transfer, and pleural drainage procedureswas performed between patients with no repeat testing (70%) and patients with 1 or more repeat tests (30%). Patients with repeat testing had longer LOS (no repeat testing LOS 1 [IQR, 12]) versus 1 repeat test LOS 3 ([IQR, 24] vs 2+ repeat tests LOS 5 [IQR, 38]), higher rate of ICU transfer (no repeat testing 4.6% vs 1 repeat test 14.6% vs 2+ repeat test 35.6%), and higher rate of pleural drainage (no repeat testing 0% vs 1 repeat test 0.1% vs 2+ repeat test 5.9%] (all P < 0.001).
Using standard costs of $37.57 for blood cultures and $73.28 for CXR, annual costs for children with CAP across all hospitals decreased by $91,512 due to decreased utilization of blood cultures, and by $146,840 due to decreased utilization of CXR.
Hospital‐Level Variation in the Impact of the National Guideline
Figure 3 is a visual representation (heat map) of the impact of the guidelines at the hospital level at the end of the study from the individual interrupted time series. Based on this heat map (Figure 3), there was wide variability between hospitals in the impact of the guideline on each test in different settings (ED or inpatient). By diagnostic testing, 7 hospitals significantly decreased utilization of blood cultures for inpatients, and 5 hospitals significantly decreased utilization for repeat blood cultures and repeat CXR. Correlation between the number of positive improvements at a hospital and region (P = 0.974), number of CAP cases (P = 0.731), or percentage of public insurance (P = 0.241) were all nonsignificant.
DISCUSSION
This study complements previous assessments by evaluating the impact of the 2011 IDSA/PIDS consensus guidelines on the management of children with CAP cared for at US children's hospitals. Prior studies have shown increased use of narrow‐spectrum antibiotics for children with CAP after the publication of these guidelines.[7] The current study focused on diagnostic testing for CAP before and after the publication of the 2011 guidelines. In the ED setting, use of some diagnostic tests (blood culture, CBC, CXR, CRP) was declining prior to guideline publication, but appeared to plateau and/or increase after 2011. Among children admitted with CAP, use of diagnostic testing was relatively stable prior to 2011, and use of these tests (blood culture, CBC, CXR, CRP) declined after guideline publication. Overall, changes in diagnostic resource utilization 3 years after publication were modest, with few changes achieving statistical significance. There was a large variability in the impact of guidelines on test use between hospitals.
For outpatients, including those managed in the ED, the PIDS/IDSA guidelines recommend limited laboratory testing in nontoxic, fully immunized patients. The guidelines discourage the use of diagnostic testing among outpatients because of their low yield (eg, blood culture), and because test results may not impact management (eg, CBC).[6] In the years prior to guideline publication, there was already a declining trend in testing rates, including blood cultures, CBC, and CRP, for patients in the ED. After guideline publication, the rate of blood cultures, CBC, and CRP increased, but only the increase in CRP utilization achieved statistical significance. We would not expect utilization for common diagnostic tests (eg, CBC for outpatients with CAP) to be at or close to 0% because of the complexity of clinical decision making regarding admission that factors in aspects of patient history, exam findings, and underlying risk.[15] ED utilization of blood cultures was <10%, CBC <15%, and CRP <5% after guideline publication, which may represent the lowest testing limit that could be achieved.
CXRs obtained in the ED did not decrease over the entire study period. The rates of CXR use (close to 80%) seen in our study are similar to prior ED studies.[5, 16] Management of children with CAP in the ED might be different than outpatient primary care management because (1) unlike primary care providers, ED providers do not have an established relationship with their patients and do not have the opportunity for follow‐up and serial exams, making them less likely to tolerate diagnostic uncertainty; and (2) ED providers may see sicker patients. However, use of CXR in the ED does represent an opportunity for further study to understand if decreased utilization is feasible without adversely impacting clinical outcomes.
The CAP guidelines provide a strong recommendation to obtain blood culture in moderate to severe pneumonia. Despite this, blood culture utilization declined after guideline publication. Less than 10% of children hospitalized with uncomplicated CAP have positive blood cultures, which calls into question the utility of blood cultures for all admitted patients.[17, 18, 19] The recent EPIC (Epidemiology of Pneumonia in the Community) study showed that a majority of children hospitalized with pneumonia do not have growth of bacteria in culture, but there may be a role for blood cultures in patients with a strong suspicion of complicated CAP or in the patient with moderate to severe disease.[20] In addition to blood cultures, the guidelines also recommend CBC and CXR in moderate to severely ill children. This observed decline in testing in CBC and CXR may be related to individual physician assessments of which patients are moderately to severely ill, as the guidelines do not recommend testing for children with less severe disease. Our exclusion of patients requiring intensive care management or pleural drainage on admission might have selected children with a milder course of illness, although still requiring admission.
The guidelines discourage repeat diagnostic testing among children hospitalized with CAP who are improving. In this study, repeat CXR and CBC occurred in approximately 20% of patients, but repeat blood culture and CRP was much lower. As with initial diagnostic testing for inpatients with CAP, the rates of some repeat testing decreased with the guidelines. However, those with repeat testing had longer LOS and were more likely to require ICU transfer or a pleural drainage procedure compared to children without repeat testing. This suggests that repeat testing is used more often in children with a severe presentation or a worsening clinical course, and not done routinely on hospitalized patients.
The financial impact of decreased testing is modest, because the tests themselves are relatively inexpensive. However, the lack of substantial cost savings should not preclude efforts to continue to improve adherence to the guidelines. Not only is increased testing associated with higher hospitalization rates,[5] potentially yielding higher costs and family stress, increased testing may also lead to patient discomfort and possibly increased radiation exposure through chest radiography.
Many of the diagnostic testing recommendations in the CAP guidelines are based on weak evidence, which may contribute to the lack of substantial adoption. Nevertheless, adherence to guideline recommendations requires sustained effort on the part of individual physicians that should be encouraged through institutional support.[21] Continuous education and clinical decision support, as well as reminders in the electronic medical record, would make guideline recommendations more visible and may help overcome the inertia of previous practice.[15] The hospital‐level heat map (Figure 3) included in this study demonstrates that the impact of the guidelines was variable across sites. Although a few sites had decreased diagnostic testing in many areas with no increased testing in any category, there were several sites that had no improvement in any diagnostic testing category. In addition, hospital‐level factors like size, geography, and insurance status were not associated with number of improvements. To better understand drivers of change at individual hospitals, future studies should evaluate specific strategies utilized by the rapid guideline adopters.
This study is subject to several limitations. The use of ICD‐9 codes to identify patients with CAP may not capture all patients with this diagnosis; however, these codes have been previously validated.[13] Additionally, because patients were identified using ICD‐9 coding assigned at the time of discharge, testing performed in the ED setting may not reflect care for a child with known pneumonia, but rather may reflect testing for a child with fever or other signs of infection. PHIS collects data from freestanding children's hospitals, which care for a majority of children with CAP in the US, but our findings may not be generalizable to other hospitals. In addition, we did not examine drivers of trends within individual institutions. We did not have detailed information to examine whether the PHIS hospitals in our study had actively worked to adopt the CAP guidelines. We were also unable to assess physician's familiarity with guidelines or the level of disagreement with the recommendations. Furthermore, the PHIS database does not permit detailed correlation of diagnostic testing with clinical parameters. In contrast to the diagnostic testing evaluated in this study, which is primarily discouraged by the IDSA/PIDS guidelines, respiratory viral testing for children with CAP is recommended but could not be evaluated, as data on such testing are not readily available in PHIS.
CONCLUSION
Publication of the IDSA/PIDS evidence‐based guidelines for the management of CAP was associated with modest, variable changes in use of diagnostic testing. Further adoption of the CAP guidelines should reduce variation in care and decrease unnecessary resource utilization in the management of CAP. Our study demonstrates that efforts to promote decreased resource utilization should target specific situations (eg, repeat testing for inpatients who are improving). Adherence to guidelines may be improved by the adoption of local practices that integrate and improve daily workflow, like order sets and clinical decision support tools.
Disclosure: Nothing to report.
- , . Eliminating waste in US health care. JAMA. 2012;307(14):1513–1516.
- , , , et al. Choosing wisely in pediatric hospital medicine: five opportunities for improved healthcare value. J Hosp Med. 2013;8(9):479–485.
- , , , et al.; Pediatric Research in Inpatient Settings (PRIS) Network. Prioritization of comparative effectiveness research topics in hospital pediatrics. Arch Pediatr Adolesc Med. 2012;166(12):1155–1164.
- , , , et al. Variability in processes of care and outcomes among children hospitalized with community‐acquired pneumonia. Pediatr Infect Dis J. 2012;31(10):1036–1041.
- , , , , . Variation in emergency department diagnostic testing and disposition outcomes in pneumonia. Pediatrics. 2013;132(2):237–244.
- , , , et al.; Pediatric Infectious Diseases Society and the Infectious Diseases Society of America. The management of community‐acquired pneumonia in infants and children older than 3 months of age: clinical practice guidelines by the Pediatric Infectious Diseases Society and the Infectious Diseases Society of America. Clin Infect Dis. 2011;53(7):e25–e76.
- , , , et al., Impact of Infectious Diseases Society of America/Pediatric Infectious Diseases Society guidelines on treatment of community‐acquired pneumonia in hospitalized children. Clin Infect Dis. 2014;58(6):834–838.
- , , , et al. Antibiotic choice for children hospitalized with pneumonia and adherence to national guidelines. Pediatrics. 2015;136(1):44–52.
- , , , et al. Quality improvement methods increase appropriate antibiotic prescribing for childhood pneumonia. Pediatrics. 2013;131(5):e1623–e1631.
- , , , et al. Improvement methodology increases guideline recommended blood cultures in children with pneumonia. Pediatrics. 2015;135(4):e1052–e1059.
- , , , , , . Impact of a guideline on management of children hospitalized with community‐acquired pneumonia. Pediatrics. 2012;129(3):e597–e604.
- , , , . Effectiveness of antimicrobial guidelines for community‐acquired pneumonia in children. Pediatrics. 2012;129(5):e1326–e1333.
- , , , et al. Identifying pediatric community‐acquired pneumonia hospitalizations: accuracy of administrative billing codes. JAMA Pediatr. 2013;167(9):851–858.
- , , , , . Pediatric complex chronic conditions classification system version 2: updated for ICD‐10 and complex medical technology dependence and transplantation. BMC Pediatr. 2014;14:199.
- , . Establishing superior benchmarks of care in clinical practice: a proposal to drive achievable health care value. JAMA Pediatr. 2015;169(4):301–302.
- , , , . Emergency department management of childhood pneumonia in the United States prior to publication of national guidelines. Acad Emerg Med. 2013;20(3):240–246.
- , , , et al. Prevalence of bacteremia in hospitalized pediatric patients with community‐acquired pneumonia. Pediatr Infect Dis J. 2013;32(7):736–740.
- , , , , . The prevalence of bacteremia in pediatric patients with community‐acquired pneumonia: guidelines to reduce the frequency of obtaining blood cultures. Hosp Pediatr. 2013;3(2):92–96.
- . Do all children hospitalized with community‐acquired pneumonia require blood cultures? Hosp Pediatr. 2013;3(2):177–179.
- , , , et al.; CDC EPIC Study Team. Community‐acquired pneumonia requiring hospitalization among U.S. children. N Engl J Med. 2015;372(9):835–845.
- , , , et al. Influence of hospital guidelines on management of children hospitalized with pneumonia. Pediatrics. 2012;130(5):e823–e830.
© 2015 Society of Hospital Medicine
