User login
Trends in Industry Payments to Dermatologists: A 5-Year Analysis of Open Payments Data (2017-2021)
Financial relationships between physicians and industry are prevalent and complex and may have implications for patient care. A 2007 study reported that 94% of 3167 physicians surveyed had established some form of paid relationship with companies in the pharmaceutical industry.1 To facilitate increased transparency around these relationships, lawmakers passed the Physician Payments Sunshine Act in 2010, which requires pharmaceutical companies and device manufacturers to report all payments made to physicians.2 Mandatory disclosures include meals, honoraria, travel expenses, grants, and ownership or investment interests greater than $10. The information is displayed publicly in the Open Payments database (OPD)(https://openpayments-data.cms.gov/), a platform run by the Centers for Medicare and Medicaid Services.
The OPD allows for in-depth analyses of industry payments made to physicians. Many medical specialties—including orthopedics,3-5 plastic surgery,6,7 ophthalmology,8 and gastroenterology9—have published extensive literature characterizing the nature of these payments and disparities in the distribution of payments based on sex, geographic distribution, and other factors. After the first full year of OPD data collection for dermatology in 2014, Feng et al10 examined the number, amount, and nature of industry payments to dermatologists, as well as their geographic distribution for that year. As a follow-up to this initial research, Schlager et al11 characterized payments made to dermatologists for the year 2016 and found an increase in the total payments, mean payments, and number of dermatologists receiving payments compared with the 2014 data.
Our study aimed to characterize the last 5 years of available OPD data—from January 1, 2017, to December 31, 2021—to further explore trends in industry payments made to dermatologists. In particular, we examined the effects of the COVID-19 pandemic on payments as well as sex disparities and the distribution of industry payments.
Methods
We performed a retrospective analysis of the OPD for the general payment datasets from January 1, 2017, to December 31, 2021. The results were filtered to include only payments made to dermatologists, excluding physicians from other specialties, physician assistants, and other types of practitioners. Data for each physician were grouped by National Provider Identifier (NPI) for providers included in the set, allowing for analysis at the individual level. Data on sex were extracted from the National Plan & Provider Enumeration System’s monthly data dissemination for NPIs for July 2023 (when the study was conducted) and were joined to the OPD data using the NPI number reported for each physician. All data were extracted, transformed, and analyzed using R software (version 4.2.1). Figures and visualizations were produced using Microsoft Excel 2016.
Results
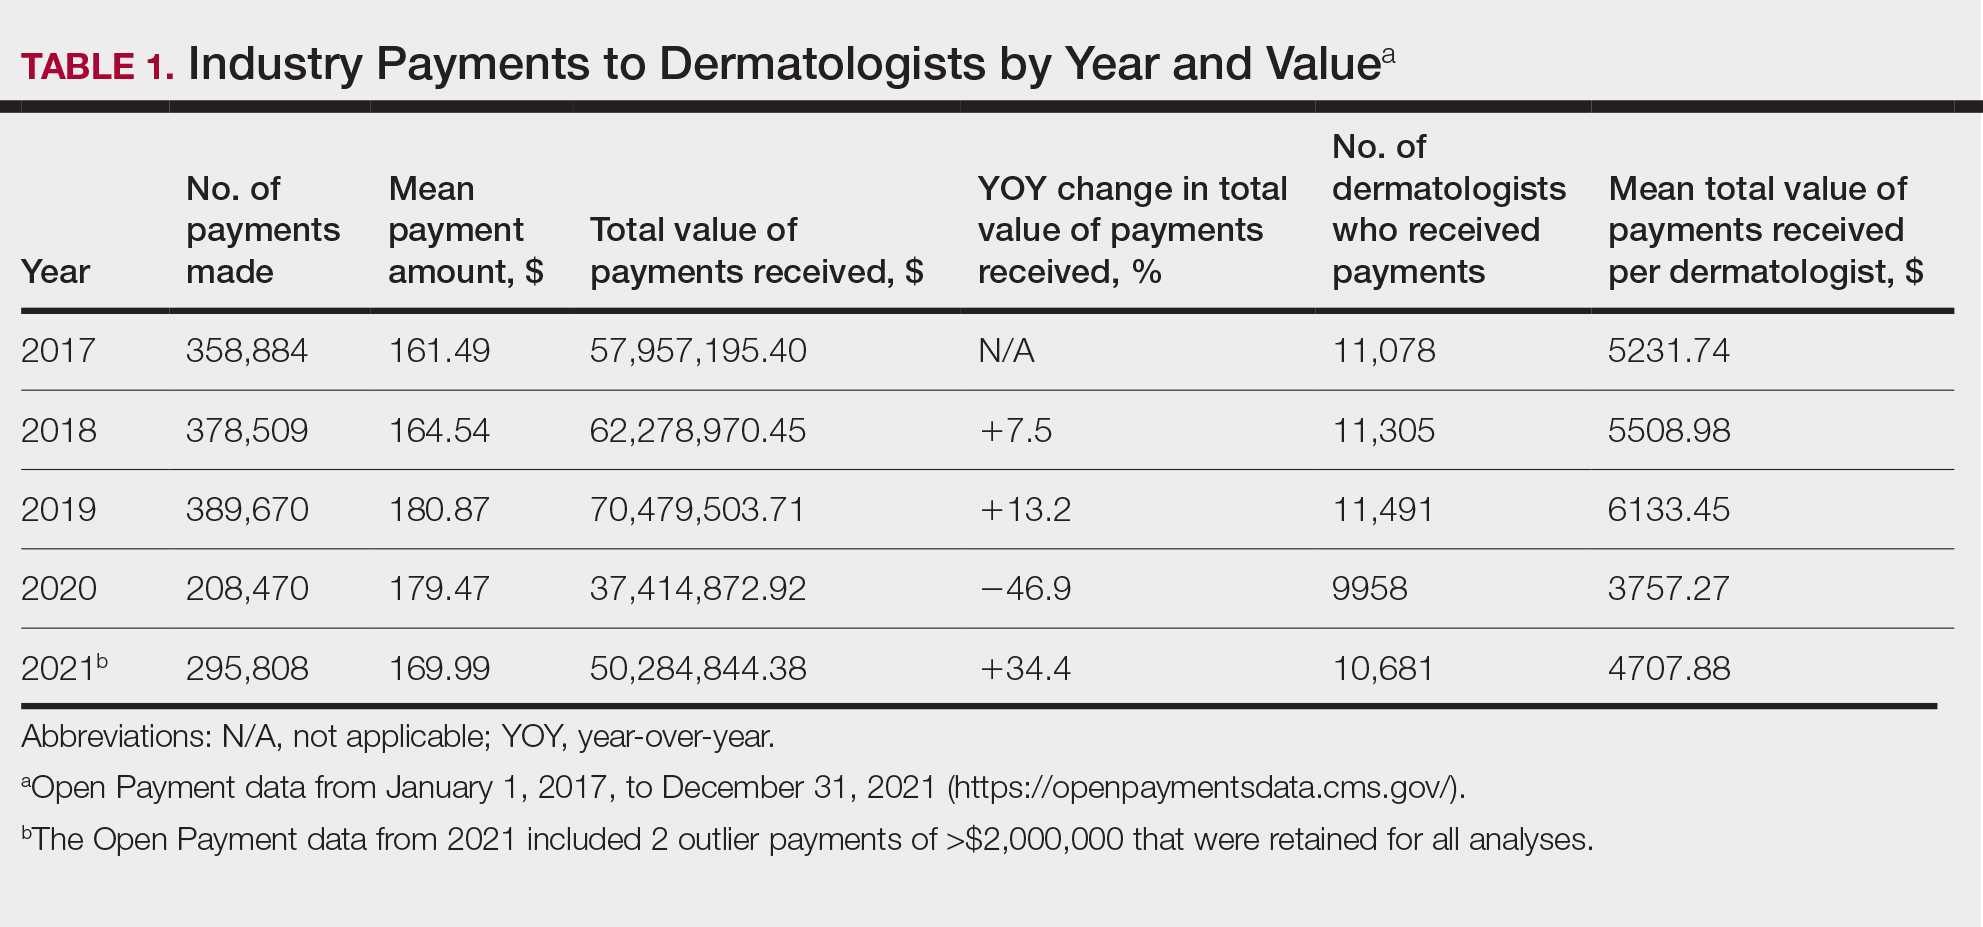
In 2017, a total of 358,884 payments were made by industry to dermatologists, accounting for nearly $58.0 million. The mean total value of payments received per dermatologist was $5231.74, and the mean payment amount was $161.49. In 2018, the total number of payments increased year-over-year by 5.5% (378,509 payments), the total value of payments received increased by 7.5% (approximately $62.3 million), and the mean total value of payments received per dermatologist increased by 5.3% ($5508.98). In 2019, the total number of payments increased by 3.0% (389,670 total payments), the total value of payments recieved increased by 13.2% (approximately $70.5 million), and the mean total value of payments received per dermatologist increased by 11.3% ($6133.45). All of these values decreased in 2020, likely due to COVID-19–related restrictions on travel and meetings (total number of payments, 208,470 [−46.5%]; total value of payments received, approximately $37.5 million [−46.9%], mean total value of payments received per dermatologist, $3757.27 [−38.7%]), but the mean payment amount remained stable at $179.47. In 2021, the total number of payments (295,808 [+41.9%]), total value of payments received (approximately $50.3 million [+34.4%]), and mean total value of payments received per dermatologist ($4707.88 [+25.3%]) all rebounded, but not to pre-2020 levels (Table 1). When looking at the geographic distribution of payments, the top 5 states receiving the highest total value of payments during the study period included California ($41.51 million), New York ($32.26 million), Florida ($21.38 million), Texas ($19.93 million), and Pennsylvania ($11.69 million).
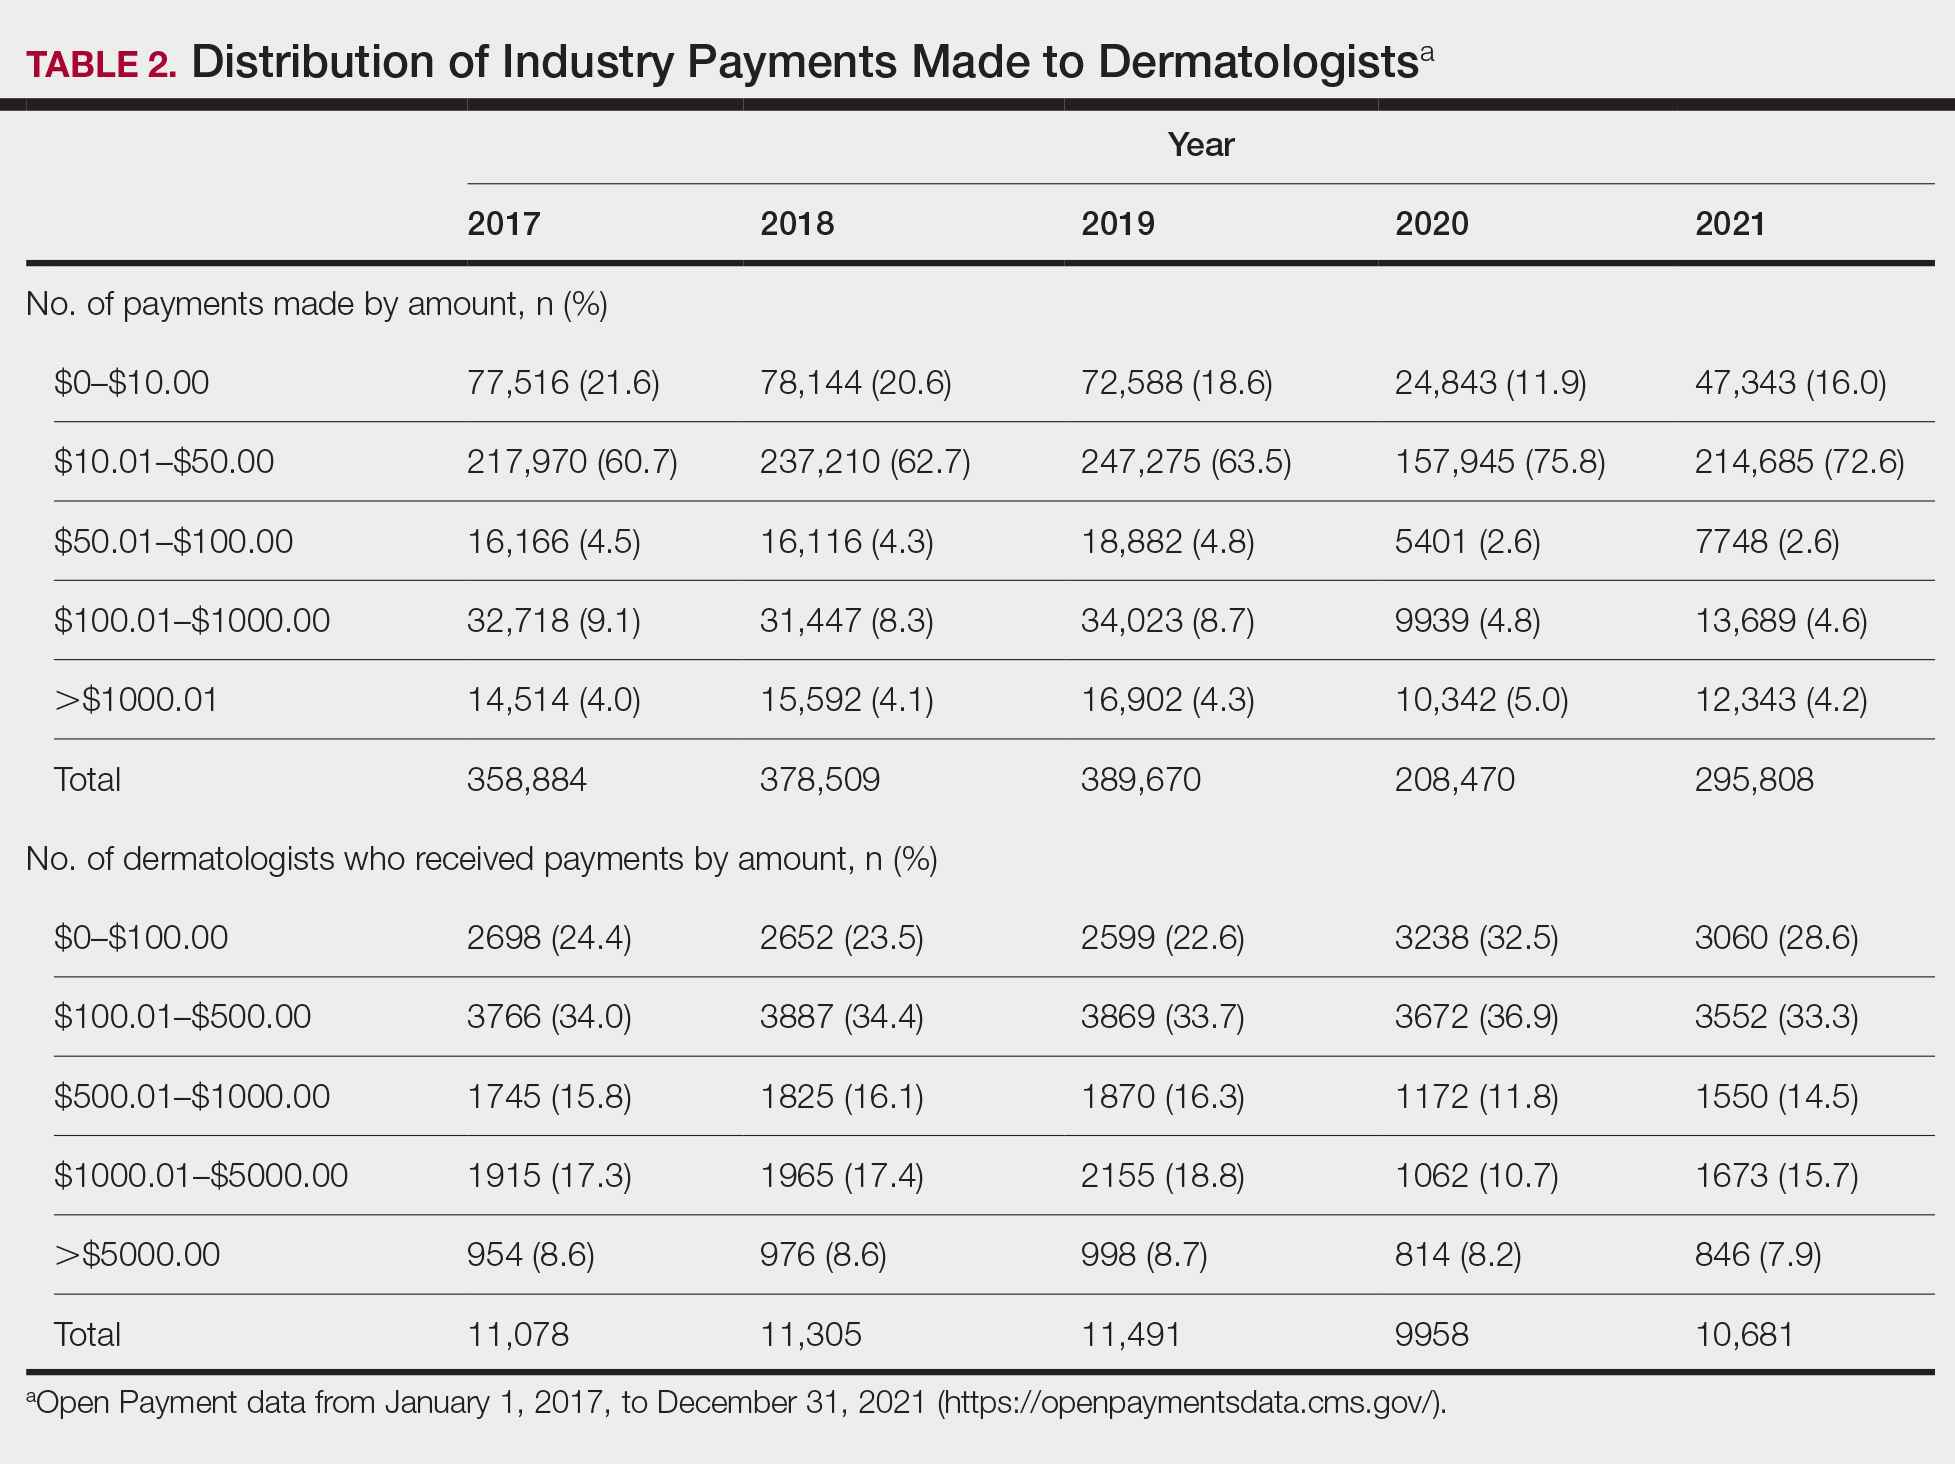
For each year from 2017 to 2021, more than 80% of payments made to dermatologists were less than $50. The majority (60.7%–75.8%) were in the $10 to $50 range. Between 4% and 5% of payments were more than $1000 for each year. Fewer than 10% of dermatologists received more than $5000 in total payments per year. Most dermatologists (33.3%–36.9%) received $100 to $500 per year. The distribution of payments stratified by number of payments made by amount and payment amount per dermatologist is further delineated in Table 2.
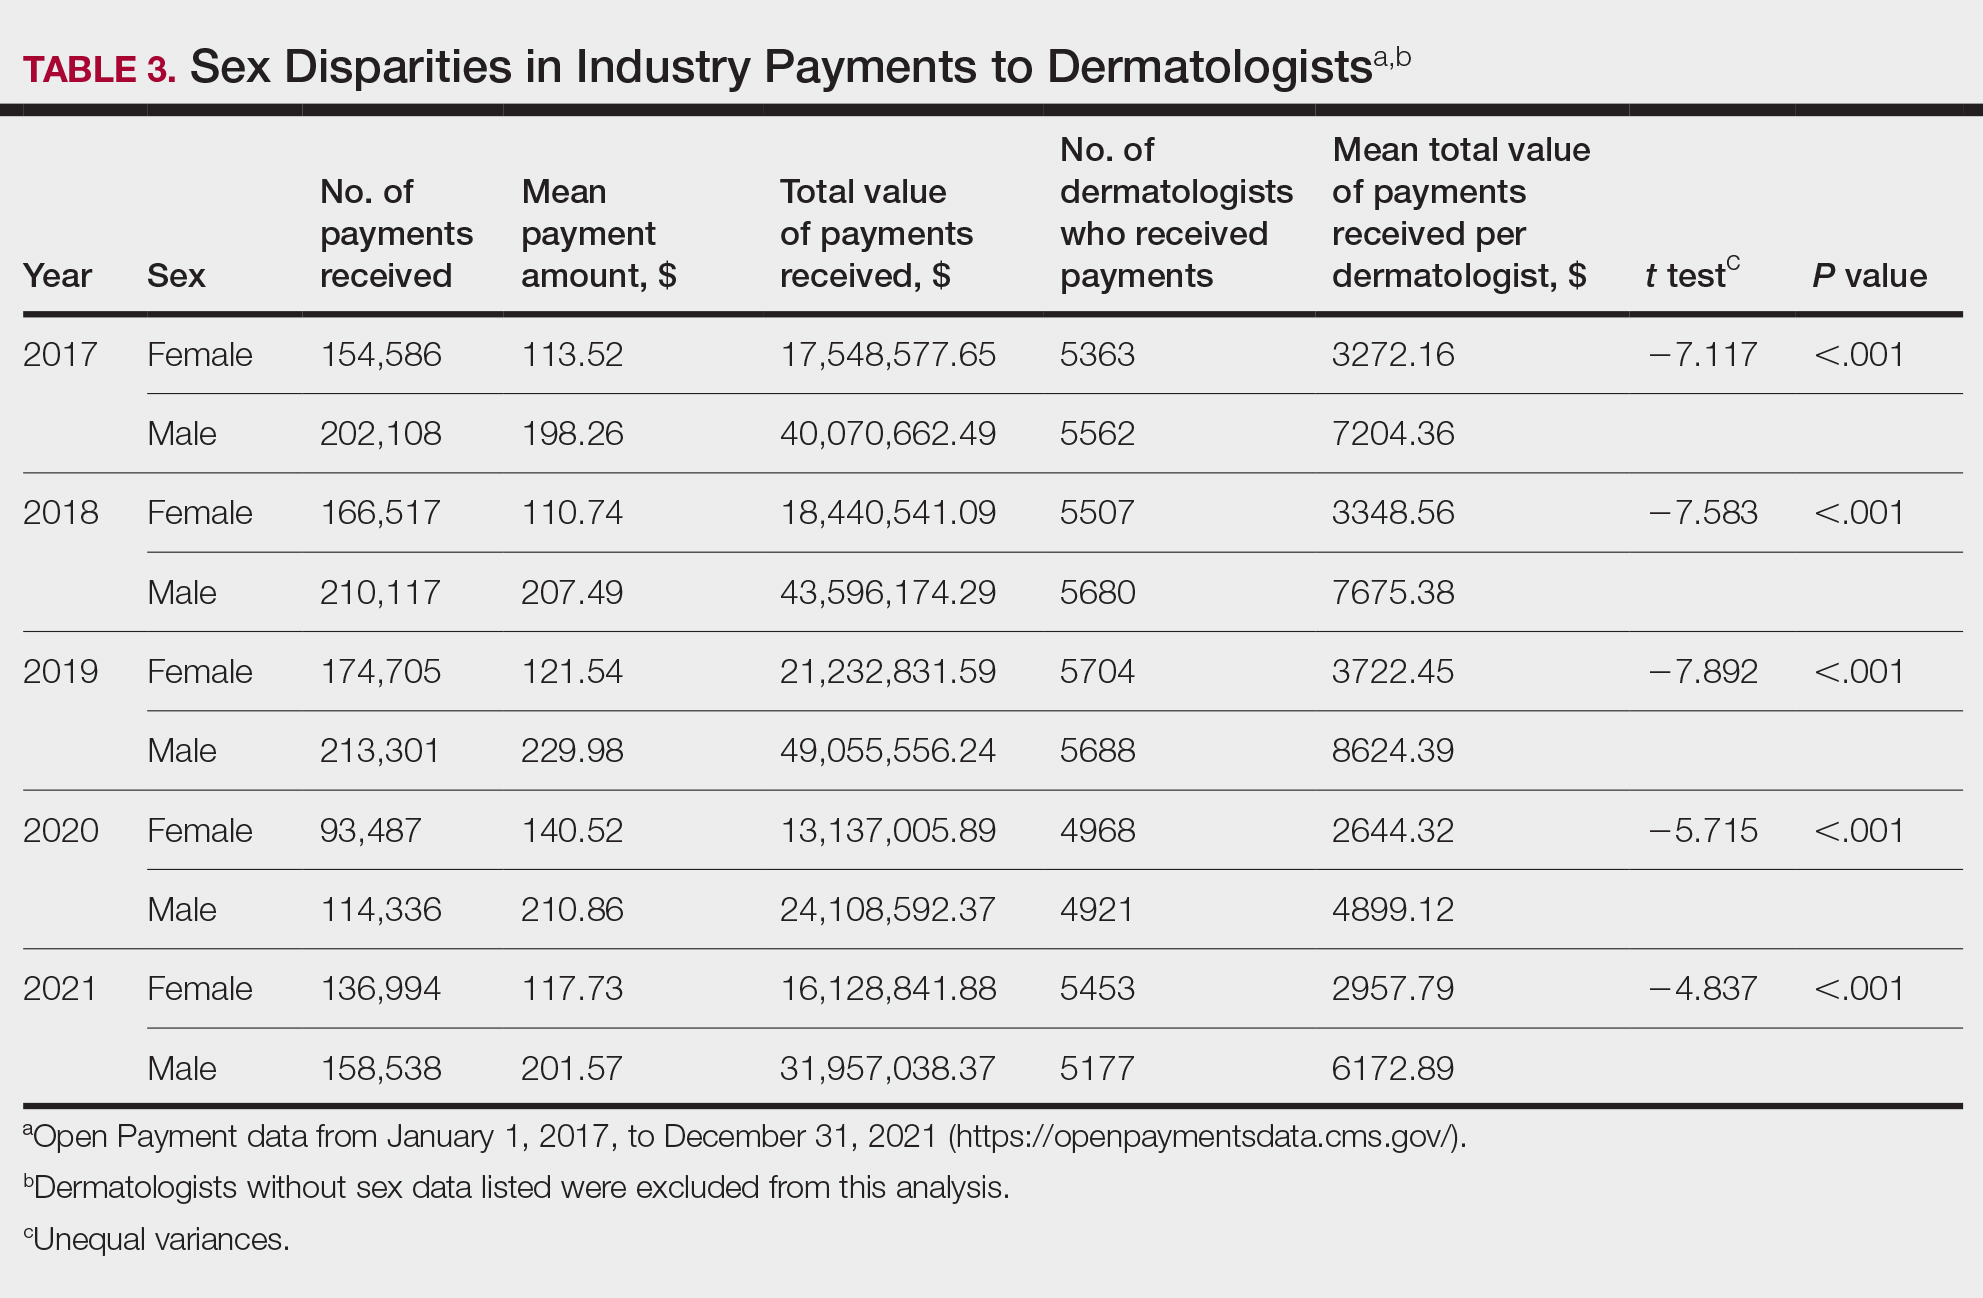
Among dermatologists who received industry payments in 2017, slightly more than half (50.9%) were male; however, male dermatologists accounted for more than $40.1 million of the more than $57.6 million total payments made to dermatologists (69.6%) that year. Male dermatologists received a mean payment amount of $198.26, while female dermatologists received a significantly smaller amount of $113.52 (P<.001). The mean total value of payments received per male dermatologist was $7204.36, while the mean total value for female dermatologists was $3272.16 (P<.001). The same statistically significant disparities in mean payment amount and mean total value of payments received by male vs female dermatologists were observed for every year from 2017 through 2021 (Table 3).
Comment
Benefits of Physician Relationships With Industry—The Physician Payments Sunshine Act increased transparency of industry payments to physicians by creating the OPD through which these relationships can be reported.12 The effects of these relationships on treatment practices have been the subject of many studies in recent years. Some have suggested that industry ties may impact prescription patterns of endorsed medications.13 It also has been reported that the chance of a research study identifying a positive outcome for a particular treatment is higher when the study is funded by a pharmaceutical company compared to other sponsors.14 On the other hand, some researchers have argued that, when established and maintained in an ethical manner, industry-physician relationships may help practitioners stay updated on the newest treatment paradigms and benefit patient care.15 Industry relationships may help drive innovation of new products with direct input from frontline physicians who take care of the patients these products aim to help.
Limitations of the OPD—Critics of the OPD have argued that the reported data lack sufficient context and are not easily interpretable by most patients.16 In addition, many patients might not know about the existence of the database. Indeed, one national survey-based study showed that only 12% of 3542 respondents knew that this information was publicly available, and only 5% knew whether their own physician had received industry payments.17
Increased Payments From Industry—Our analysis builds on previously reported data in dermatology from 2014 to 2016.10,11 We found that the trends of increasing numbers and dollar amounts of payments made by industry to dermatologists continued from 2017 to 2019, which may reflect the intended effects of the Physician Payments Sunshine Act, as more payments are being reported in a transparent manner. It also shows that relationships between industry and dermatologists have become more commonplace over time.
It is important to consider these trends in the context of overall Medicare expenditures and prescription volumes. Between 2008 and 2021, prescription volumes have been increasing at a rate of 1% to 4% per year, with 2020 being an exception as the volume decreased slightly from the year prior due to COVID-19 (−3%). Similarly, total Medicare and Medicaid expenditures have been growing at a rate of almost 5% per year.18 Based on our study results, it appears the total value of payments made between 2017 and 2021 increased at a rate that outpaced prescription volume and expenditures; however, it is difficult to draw conclusions about the relationship between payments made to dermatologists and spending without examining prescriptions specific to dermatologists in the OPD dataset. This relationship could be further explored in future studies.
COVID-19 Restrictions Impacted Payments in 2021—We hypothesize that COVID-19–related restrictions on traveling and in-person meetings led to a decrease in the number of payments, total payment amount, and mean total value of payments received per dermatologist. Notably, compensation for services other than consulting, including speaking fees, had the most precipitous decrease in total payment amount. On the other hand, honoraria and consulting fees were least impacted, as many dermatologists were still able to maintain relationships with industry on an advisory basis without traveling. From 2020 to 2021, the number of total payments and dollar amounts increased with easing of COVID-19 restrictions; however, they had not yet rebounded to 2019 levels during the study period. It will be interesting to continue monitoring these trends once data from future years become available.
Top-Compensated Dermatologists—Our study results also show that for all years from 2017 through 2021, the majority of industry payments were made to a small concentrated percentage of top-compensated dermatologists, which may reflect larger and more frequent payments to those identified by pharmaceutical companies as thought leaders and key opinion leaders in the field or those who are more willing to establish extensive ties with industry. Similarly skewed distributions in payments have been shown in other medical subspecialties including neurosurgery, plastic surgery, otolaryngology, and orthopedics.4,6,19,20 It also is apparent that the majority of compensated dermatologists in the OPD maintain relatively small ties with industry. For every year from 2017 to 2021, more than half of compensated dermatologists received total payments of less than $500 per year, most of which stemmed from the food and beverage category. Interestingly, a prior study showed that patient perceptions of industry-physician ties may be more strongly impacted by the payment category than the amount.21 For example, respondents viewed payments for meals and lodging more negatively, as they were seen more as personal gifts without direct benefit to patients. Conversely, respondents held more positive views of physicians who received free drug samples, which were perceived as benefiting patients, as well as those receiving consulting fees, which were perceived as a signal of physician expertise. Notably, in the same study, physicians who received no payments from industry were seen as honest but also were viewed by some respondents as being inexperienced or uninformed about new treatments.21
The contribution and public perception of dermatologists who conduct investigator-initiated research utilizing other types of funding (eg, government grants) also are important to consider but were not directly assessed within the scope of the current study.
Sex Disparities in Compensation—Multiple studies in the literature have demonstrated that sex inequities exist across medical specialties.22,23 In dermatology, although women make up slightly more than 50% of board-certified dermatologists, they continue to be underrepresented compared with men in leadership positions, academic rank, research funding, and lectureships at national meetings.24-27 In survey-based studies specifically examining gender-based physician compensation, male dermatologists were found to earn higher salaries than their female counterparts in both private practice and academic settings, even after adjusting for work hours, practice characteristics, and academic rank.28,29
Our study contributes to the growing body of evidence suggesting that sex inequities also may exist with regard to financial payments from industry. Our results showed that, although the number of male and female dermatologists with industry relationships was similar each year, the number of payments made and total payment amount were both significantly (P<.001) higher for male dermatologists from 2017 through 2021. In 2021, the mean payment amount ($201.57 for male dermatologists; $117.73 for female dermatologists) and mean total amount of payments received ($6172.89 and $2957.79, respectively) also were significantly higher for male compared with female dermatologists (P<.001). The cause of this disparity likely is multifactorial and warrants additional studies in the future. One hypothesis in the existing literature is that male physicians may be more inclined to seek out relationships with industry; it also is possible that disparities in research funding, academic rank, and speaking opportunities at national conferences detailed previously may contribute to inequities in industry payments as companies seek out perceived leaders in the field.30
Limitations and Future Directions—Several important limitations of our study warrant further consideration. As with any database study, the accuracy of the results presented and the conclusions drawn are highly dependent on the precision of the available data, which is reliant on transparent documentation by pharmaceutical companies and physicians. There are no independent methods of verifying the information reported. There have been reports in the literature questioning the utility of the OPD data and risk for misinterpretation.16,31 Furthermore, the OPD only includes companies whose products are covered by government-sponsored programs, such as Medicare and Medicaid, and therefore does not encompass the totality of industry-dermatologist relationships. We also focused specifically on board-certified dermatologists and did not analyze the extent of industry relationships involving residents, nurses, physician assistants, and other critical members of health care teams that may impact patient care. Differences between academic and private practice payments also could not be examined using the OPD but could present an interesting area for future studies.
Despite these limitations, our study was extensive, using the publicly available OPD to analyze trends and disparities in financial relationships between dermatologists and industry partners from 2017 through 2021. Notably, these findings are not intended to provide judgment or seek to tease out financial relationships that are beneficial for patient care from those that are not; rather, they are intended only to lend additional transparency, provoke thought, and encourage future studies and discussion surrounding this important topic.
Conclusion
Financial relationships between dermatologists and industry are complex and are becoming more prevalent, as shown in our study. These relationships may be critical to facilitate novel patient-centered research and growth in the field of dermatology; however, they also have the potential to be seen as bias in patient care. Transparent reporting of these relationships is an important step in future research regarding the effects of different payment types and serves as the basis for further understanding industry-dermatologist relationships as well as any inequities that exist in the distribution of payments. We encourage all dermatologists to review their public profiles in the OPD. Physicians have the opportunity to review all payment data reported by companies and challenge the accuracy of the data if necessary.
- Campbell EG, Gruen RL, Mountford J, et al. A national survey of physician-industry relationships. N Engl J Med. 2007;356:1742-1750.
- Kirschner NM, Sulmasy LS, Kesselheim AS. Health policy basics: the Physician Payment Sunshine Act and the Open Payments program. Ann Intern Med. 2014;161:519-521.
- Braithwaite J, Frane N, Partan MJ, et al. Review of industry payments to general orthopaedic surgeons reported by the open payments database: 2014 to 2019. J Am Acad Orthop Surg Glob Res Rev. 2021;5:E21.00060.
- Pathak N, Mercier MR, Galivanche AR, et al. Industry payments to orthopedic spine surgeons reported by the open payments database: 2014-2017. Clin Spine Surg. 2020;33:E572-E578.
- Almaguer AM, Wills BW, Robin JX, et al. Open payments reporting of industry compensation for orthopedic residents. J Surg Educ. 2020;77:1632-1637.
- Chao AH, Gangopadhyay N. Industry financial relationships in plastic surgery: analysis of the sunshine act open payments database. Plast Reconstr Surg. 2016;138:341E-348E.
- Khetpal S, Mets EJ, Ahmad M, et al. The open payments sunshine act database revisited: a 5-year analysis of industry payments to plastic surgeons. Plast Reconstr Surg. 2021;148:877E-878E.
- Slentz DH, Nelson CC, Lichter PR. Characteristics of industry payments to ophthalmologists in the open payments database. JAMA Ophthalmol. 2019;137:1038-1044.
- Gangireddy VGR, Amin R, Yu K, et al. Analysis of payments to GI physicians in the United States: open payments data study. JGH Open. 2020;4:1031-1036.
- Feng H, Wu P, Leger M. Exploring the industry-dermatologist financial relationship: insight from the open payment data. JAMA Dermatol. 2016;152:1307-1313.
- Schlager E, Flaten H, St Claire C, et al. Industry payments to dermatologists: updates from the 2016 open payment data. Dermatol Online J. 2018;24:13030/qt8r74w3c4.
- Agrawal S, Brennan N, Budetti P. The Sunshine Act—effects on physicians. N Engl J Med. 2013;368:2054-2057.
- DeJong C, Aguilar T, Tseng CW, et al. Pharmaceutical industry-sponsored meals and physician prescribing patterns for Medicare beneficiaries. JAMA Intern Med. 2016;176:1114-1122.
- Lexchin J, Bero LA, Djulbegovic B, et al. Pharmaceutical industry sponsorship and research outcome and quality: systematic review. BMJ. 2003;326:1167-1170.
- Nakayama DK. In defense of industry-physician relationships. Am Surg. 2010;76:987-994.
- Chimonas S, DeVito NJ, Rothman DJ. Bringing transparency to medicine: exploring physicians’ views and experiences of the sunshine act. Am J Bioeth. 2017;17:4-18.
- Pham-Kanter G, Mello MM, Lehmann LS, et la. Public awareness of and contact with physicians who receive industry payments: a national survey. J Gen Intern Med. 2017;32:767-774.
- National Health Expenditure Fact Sheet. Updated December 13, 2023 Accessed August 9, 2024. https://www.cms.gov/data-research/statistics-trends-and-reports/national-health-expenditure-data/nhe-fact-sheet
- de Lotbiniere-Bassett MP, McDonald PJ. Industry financial relationships in neurosurgery in 2015: analysis of the Sunshine Act Open Payments database. World Neurosurg. 2018;114:E920-E925.
- Pathak N, Fujiwara RJT, Mehra S. Assessment of nonresearch industry payments to otolaryngologists in 2014 and 2015. Otolaryngol Head Neck Surg. 2018;158:1028-1034.
- Perry JE, Cox D, Cox AD. Trust and transparency: patient perceptions of physicians’ financial relationships with pharmaceutical companies. J Law Med Ethics. 2014;42:475-491.
- Freund KM, Raj A, Kaplan SE, et al. Inequities in academic compensation by gender: a follow-up to the national faculty survey cohort study. Acad Med. 2016;91:1068-1073.
- Seabury SA, Chandra A, Jena AB. Trends in the earnings of male and female health care professionals in the United States, 1987 to 2010. JAMA Intern Med. 2013;173:1748-1750.
- Flaten HK, Goodman L, Wong E, et al. Analysis of speaking opportunities by gender at national dermatologic surgery conferences. Dermatol Surg. 2020;46:1195-1201.
- Lobl M, Grinnell M, Higgins S, et al. Representation of women as editors in dermatology journals: a comprehensive review. Int J Womens Dermatol. 2020;6:20-24.
- Stratman H, Stratman EJ. Assessment of percentage of women in the dermatology workforce presenting at American Academy of Dermatology annual meetings, 1992-2017. JAMA Dermatol. 2019;155:384-386.
- Wu AG, Lipner SR. Sex trends in leadership of the American Academy of Dermatology: a cross-sectional study. J Am Acad Dermatol. 2020;83:592-594.
- Weeks WB, Wallace AE. Gender differences in dermatologists’ annual incomes. Cutis. 2007;80:325-332.
- Sachdeva M, Price KN, Hsiao JL, et al. Gender and rank salary trends among academic dermatologists. Int J Womens Dermatol. 2020;6:324-326.
- Rose SL, Sanghani RM, Schmidt C, et al. Gender differences in physicians’ financial ties to industry: a study of national disclosure data. PLoS One. 2015;10:E0129197.
- Santhakumar S, Adashi EY. The physician payment sunshine act: testing the value of transparency. JAMA. 2015;313:23-24.
Financial relationships between physicians and industry are prevalent and complex and may have implications for patient care. A 2007 study reported that 94% of 3167 physicians surveyed had established some form of paid relationship with companies in the pharmaceutical industry.1 To facilitate increased transparency around these relationships, lawmakers passed the Physician Payments Sunshine Act in 2010, which requires pharmaceutical companies and device manufacturers to report all payments made to physicians.2 Mandatory disclosures include meals, honoraria, travel expenses, grants, and ownership or investment interests greater than $10. The information is displayed publicly in the Open Payments database (OPD)(https://openpayments-data.cms.gov/), a platform run by the Centers for Medicare and Medicaid Services.
The OPD allows for in-depth analyses of industry payments made to physicians. Many medical specialties—including orthopedics,3-5 plastic surgery,6,7 ophthalmology,8 and gastroenterology9—have published extensive literature characterizing the nature of these payments and disparities in the distribution of payments based on sex, geographic distribution, and other factors. After the first full year of OPD data collection for dermatology in 2014, Feng et al10 examined the number, amount, and nature of industry payments to dermatologists, as well as their geographic distribution for that year. As a follow-up to this initial research, Schlager et al11 characterized payments made to dermatologists for the year 2016 and found an increase in the total payments, mean payments, and number of dermatologists receiving payments compared with the 2014 data.
Our study aimed to characterize the last 5 years of available OPD data—from January 1, 2017, to December 31, 2021—to further explore trends in industry payments made to dermatologists. In particular, we examined the effects of the COVID-19 pandemic on payments as well as sex disparities and the distribution of industry payments.
Methods
We performed a retrospective analysis of the OPD for the general payment datasets from January 1, 2017, to December 31, 2021. The results were filtered to include only payments made to dermatologists, excluding physicians from other specialties, physician assistants, and other types of practitioners. Data for each physician were grouped by National Provider Identifier (NPI) for providers included in the set, allowing for analysis at the individual level. Data on sex were extracted from the National Plan & Provider Enumeration System’s monthly data dissemination for NPIs for July 2023 (when the study was conducted) and were joined to the OPD data using the NPI number reported for each physician. All data were extracted, transformed, and analyzed using R software (version 4.2.1). Figures and visualizations were produced using Microsoft Excel 2016.
Results
In 2017, a total of 358,884 payments were made by industry to dermatologists, accounting for nearly $58.0 million. The mean total value of payments received per dermatologist was $5231.74, and the mean payment amount was $161.49. In 2018, the total number of payments increased year-over-year by 5.5% (378,509 payments), the total value of payments received increased by 7.5% (approximately $62.3 million), and the mean total value of payments received per dermatologist increased by 5.3% ($5508.98). In 2019, the total number of payments increased by 3.0% (389,670 total payments), the total value of payments recieved increased by 13.2% (approximately $70.5 million), and the mean total value of payments received per dermatologist increased by 11.3% ($6133.45). All of these values decreased in 2020, likely due to COVID-19–related restrictions on travel and meetings (total number of payments, 208,470 [−46.5%]; total value of payments received, approximately $37.5 million [−46.9%], mean total value of payments received per dermatologist, $3757.27 [−38.7%]), but the mean payment amount remained stable at $179.47. In 2021, the total number of payments (295,808 [+41.9%]), total value of payments received (approximately $50.3 million [+34.4%]), and mean total value of payments received per dermatologist ($4707.88 [+25.3%]) all rebounded, but not to pre-2020 levels (Table 1). When looking at the geographic distribution of payments, the top 5 states receiving the highest total value of payments during the study period included California ($41.51 million), New York ($32.26 million), Florida ($21.38 million), Texas ($19.93 million), and Pennsylvania ($11.69 million).
For each year from 2017 to 2021, more than 80% of payments made to dermatologists were less than $50. The majority (60.7%–75.8%) were in the $10 to $50 range. Between 4% and 5% of payments were more than $1000 for each year. Fewer than 10% of dermatologists received more than $5000 in total payments per year. Most dermatologists (33.3%–36.9%) received $100 to $500 per year. The distribution of payments stratified by number of payments made by amount and payment amount per dermatologist is further delineated in Table 2.
Among dermatologists who received industry payments in 2017, slightly more than half (50.9%) were male; however, male dermatologists accounted for more than $40.1 million of the more than $57.6 million total payments made to dermatologists (69.6%) that year. Male dermatologists received a mean payment amount of $198.26, while female dermatologists received a significantly smaller amount of $113.52 (P<.001). The mean total value of payments received per male dermatologist was $7204.36, while the mean total value for female dermatologists was $3272.16 (P<.001). The same statistically significant disparities in mean payment amount and mean total value of payments received by male vs female dermatologists were observed for every year from 2017 through 2021 (Table 3).
Comment
Benefits of Physician Relationships With Industry—The Physician Payments Sunshine Act increased transparency of industry payments to physicians by creating the OPD through which these relationships can be reported.12 The effects of these relationships on treatment practices have been the subject of many studies in recent years. Some have suggested that industry ties may impact prescription patterns of endorsed medications.13 It also has been reported that the chance of a research study identifying a positive outcome for a particular treatment is higher when the study is funded by a pharmaceutical company compared to other sponsors.14 On the other hand, some researchers have argued that, when established and maintained in an ethical manner, industry-physician relationships may help practitioners stay updated on the newest treatment paradigms and benefit patient care.15 Industry relationships may help drive innovation of new products with direct input from frontline physicians who take care of the patients these products aim to help.
Limitations of the OPD—Critics of the OPD have argued that the reported data lack sufficient context and are not easily interpretable by most patients.16 In addition, many patients might not know about the existence of the database. Indeed, one national survey-based study showed that only 12% of 3542 respondents knew that this information was publicly available, and only 5% knew whether their own physician had received industry payments.17
Increased Payments From Industry—Our analysis builds on previously reported data in dermatology from 2014 to 2016.10,11 We found that the trends of increasing numbers and dollar amounts of payments made by industry to dermatologists continued from 2017 to 2019, which may reflect the intended effects of the Physician Payments Sunshine Act, as more payments are being reported in a transparent manner. It also shows that relationships between industry and dermatologists have become more commonplace over time.
It is important to consider these trends in the context of overall Medicare expenditures and prescription volumes. Between 2008 and 2021, prescription volumes have been increasing at a rate of 1% to 4% per year, with 2020 being an exception as the volume decreased slightly from the year prior due to COVID-19 (−3%). Similarly, total Medicare and Medicaid expenditures have been growing at a rate of almost 5% per year.18 Based on our study results, it appears the total value of payments made between 2017 and 2021 increased at a rate that outpaced prescription volume and expenditures; however, it is difficult to draw conclusions about the relationship between payments made to dermatologists and spending without examining prescriptions specific to dermatologists in the OPD dataset. This relationship could be further explored in future studies.
COVID-19 Restrictions Impacted Payments in 2021—We hypothesize that COVID-19–related restrictions on traveling and in-person meetings led to a decrease in the number of payments, total payment amount, and mean total value of payments received per dermatologist. Notably, compensation for services other than consulting, including speaking fees, had the most precipitous decrease in total payment amount. On the other hand, honoraria and consulting fees were least impacted, as many dermatologists were still able to maintain relationships with industry on an advisory basis without traveling. From 2020 to 2021, the number of total payments and dollar amounts increased with easing of COVID-19 restrictions; however, they had not yet rebounded to 2019 levels during the study period. It will be interesting to continue monitoring these trends once data from future years become available.
Top-Compensated Dermatologists—Our study results also show that for all years from 2017 through 2021, the majority of industry payments were made to a small concentrated percentage of top-compensated dermatologists, which may reflect larger and more frequent payments to those identified by pharmaceutical companies as thought leaders and key opinion leaders in the field or those who are more willing to establish extensive ties with industry. Similarly skewed distributions in payments have been shown in other medical subspecialties including neurosurgery, plastic surgery, otolaryngology, and orthopedics.4,6,19,20 It also is apparent that the majority of compensated dermatologists in the OPD maintain relatively small ties with industry. For every year from 2017 to 2021, more than half of compensated dermatologists received total payments of less than $500 per year, most of which stemmed from the food and beverage category. Interestingly, a prior study showed that patient perceptions of industry-physician ties may be more strongly impacted by the payment category than the amount.21 For example, respondents viewed payments for meals and lodging more negatively, as they were seen more as personal gifts without direct benefit to patients. Conversely, respondents held more positive views of physicians who received free drug samples, which were perceived as benefiting patients, as well as those receiving consulting fees, which were perceived as a signal of physician expertise. Notably, in the same study, physicians who received no payments from industry were seen as honest but also were viewed by some respondents as being inexperienced or uninformed about new treatments.21
The contribution and public perception of dermatologists who conduct investigator-initiated research utilizing other types of funding (eg, government grants) also are important to consider but were not directly assessed within the scope of the current study.
Sex Disparities in Compensation—Multiple studies in the literature have demonstrated that sex inequities exist across medical specialties.22,23 In dermatology, although women make up slightly more than 50% of board-certified dermatologists, they continue to be underrepresented compared with men in leadership positions, academic rank, research funding, and lectureships at national meetings.24-27 In survey-based studies specifically examining gender-based physician compensation, male dermatologists were found to earn higher salaries than their female counterparts in both private practice and academic settings, even after adjusting for work hours, practice characteristics, and academic rank.28,29
Our study contributes to the growing body of evidence suggesting that sex inequities also may exist with regard to financial payments from industry. Our results showed that, although the number of male and female dermatologists with industry relationships was similar each year, the number of payments made and total payment amount were both significantly (P<.001) higher for male dermatologists from 2017 through 2021. In 2021, the mean payment amount ($201.57 for male dermatologists; $117.73 for female dermatologists) and mean total amount of payments received ($6172.89 and $2957.79, respectively) also were significantly higher for male compared with female dermatologists (P<.001). The cause of this disparity likely is multifactorial and warrants additional studies in the future. One hypothesis in the existing literature is that male physicians may be more inclined to seek out relationships with industry; it also is possible that disparities in research funding, academic rank, and speaking opportunities at national conferences detailed previously may contribute to inequities in industry payments as companies seek out perceived leaders in the field.30
Limitations and Future Directions—Several important limitations of our study warrant further consideration. As with any database study, the accuracy of the results presented and the conclusions drawn are highly dependent on the precision of the available data, which is reliant on transparent documentation by pharmaceutical companies and physicians. There are no independent methods of verifying the information reported. There have been reports in the literature questioning the utility of the OPD data and risk for misinterpretation.16,31 Furthermore, the OPD only includes companies whose products are covered by government-sponsored programs, such as Medicare and Medicaid, and therefore does not encompass the totality of industry-dermatologist relationships. We also focused specifically on board-certified dermatologists and did not analyze the extent of industry relationships involving residents, nurses, physician assistants, and other critical members of health care teams that may impact patient care. Differences between academic and private practice payments also could not be examined using the OPD but could present an interesting area for future studies.
Despite these limitations, our study was extensive, using the publicly available OPD to analyze trends and disparities in financial relationships between dermatologists and industry partners from 2017 through 2021. Notably, these findings are not intended to provide judgment or seek to tease out financial relationships that are beneficial for patient care from those that are not; rather, they are intended only to lend additional transparency, provoke thought, and encourage future studies and discussion surrounding this important topic.
Conclusion
Financial relationships between dermatologists and industry are complex and are becoming more prevalent, as shown in our study. These relationships may be critical to facilitate novel patient-centered research and growth in the field of dermatology; however, they also have the potential to be seen as bias in patient care. Transparent reporting of these relationships is an important step in future research regarding the effects of different payment types and serves as the basis for further understanding industry-dermatologist relationships as well as any inequities that exist in the distribution of payments. We encourage all dermatologists to review their public profiles in the OPD. Physicians have the opportunity to review all payment data reported by companies and challenge the accuracy of the data if necessary.
- Campbell EG, Gruen RL, Mountford J, et al. A national survey of physician-industry relationships. N Engl J Med. 2007;356:1742-1750.
- Kirschner NM, Sulmasy LS, Kesselheim AS. Health policy basics: the Physician Payment Sunshine Act and the Open Payments program. Ann Intern Med. 2014;161:519-521.
- Braithwaite J, Frane N, Partan MJ, et al. Review of industry payments to general orthopaedic surgeons reported by the open payments database: 2014 to 2019. J Am Acad Orthop Surg Glob Res Rev. 2021;5:E21.00060.
- Pathak N, Mercier MR, Galivanche AR, et al. Industry payments to orthopedic spine surgeons reported by the open payments database: 2014-2017. Clin Spine Surg. 2020;33:E572-E578.
- Almaguer AM, Wills BW, Robin JX, et al. Open payments reporting of industry compensation for orthopedic residents. J Surg Educ. 2020;77:1632-1637.
- Chao AH, Gangopadhyay N. Industry financial relationships in plastic surgery: analysis of the sunshine act open payments database. Plast Reconstr Surg. 2016;138:341E-348E.
- Khetpal S, Mets EJ, Ahmad M, et al. The open payments sunshine act database revisited: a 5-year analysis of industry payments to plastic surgeons. Plast Reconstr Surg. 2021;148:877E-878E.
- Slentz DH, Nelson CC, Lichter PR. Characteristics of industry payments to ophthalmologists in the open payments database. JAMA Ophthalmol. 2019;137:1038-1044.
- Gangireddy VGR, Amin R, Yu K, et al. Analysis of payments to GI physicians in the United States: open payments data study. JGH Open. 2020;4:1031-1036.
- Feng H, Wu P, Leger M. Exploring the industry-dermatologist financial relationship: insight from the open payment data. JAMA Dermatol. 2016;152:1307-1313.
- Schlager E, Flaten H, St Claire C, et al. Industry payments to dermatologists: updates from the 2016 open payment data. Dermatol Online J. 2018;24:13030/qt8r74w3c4.
- Agrawal S, Brennan N, Budetti P. The Sunshine Act—effects on physicians. N Engl J Med. 2013;368:2054-2057.
- DeJong C, Aguilar T, Tseng CW, et al. Pharmaceutical industry-sponsored meals and physician prescribing patterns for Medicare beneficiaries. JAMA Intern Med. 2016;176:1114-1122.
- Lexchin J, Bero LA, Djulbegovic B, et al. Pharmaceutical industry sponsorship and research outcome and quality: systematic review. BMJ. 2003;326:1167-1170.
- Nakayama DK. In defense of industry-physician relationships. Am Surg. 2010;76:987-994.
- Chimonas S, DeVito NJ, Rothman DJ. Bringing transparency to medicine: exploring physicians’ views and experiences of the sunshine act. Am J Bioeth. 2017;17:4-18.
- Pham-Kanter G, Mello MM, Lehmann LS, et la. Public awareness of and contact with physicians who receive industry payments: a national survey. J Gen Intern Med. 2017;32:767-774.
- National Health Expenditure Fact Sheet. Updated December 13, 2023 Accessed August 9, 2024. https://www.cms.gov/data-research/statistics-trends-and-reports/national-health-expenditure-data/nhe-fact-sheet
- de Lotbiniere-Bassett MP, McDonald PJ. Industry financial relationships in neurosurgery in 2015: analysis of the Sunshine Act Open Payments database. World Neurosurg. 2018;114:E920-E925.
- Pathak N, Fujiwara RJT, Mehra S. Assessment of nonresearch industry payments to otolaryngologists in 2014 and 2015. Otolaryngol Head Neck Surg. 2018;158:1028-1034.
- Perry JE, Cox D, Cox AD. Trust and transparency: patient perceptions of physicians’ financial relationships with pharmaceutical companies. J Law Med Ethics. 2014;42:475-491.
- Freund KM, Raj A, Kaplan SE, et al. Inequities in academic compensation by gender: a follow-up to the national faculty survey cohort study. Acad Med. 2016;91:1068-1073.
- Seabury SA, Chandra A, Jena AB. Trends in the earnings of male and female health care professionals in the United States, 1987 to 2010. JAMA Intern Med. 2013;173:1748-1750.
- Flaten HK, Goodman L, Wong E, et al. Analysis of speaking opportunities by gender at national dermatologic surgery conferences. Dermatol Surg. 2020;46:1195-1201.
- Lobl M, Grinnell M, Higgins S, et al. Representation of women as editors in dermatology journals: a comprehensive review. Int J Womens Dermatol. 2020;6:20-24.
- Stratman H, Stratman EJ. Assessment of percentage of women in the dermatology workforce presenting at American Academy of Dermatology annual meetings, 1992-2017. JAMA Dermatol. 2019;155:384-386.
- Wu AG, Lipner SR. Sex trends in leadership of the American Academy of Dermatology: a cross-sectional study. J Am Acad Dermatol. 2020;83:592-594.
- Weeks WB, Wallace AE. Gender differences in dermatologists’ annual incomes. Cutis. 2007;80:325-332.
- Sachdeva M, Price KN, Hsiao JL, et al. Gender and rank salary trends among academic dermatologists. Int J Womens Dermatol. 2020;6:324-326.
- Rose SL, Sanghani RM, Schmidt C, et al. Gender differences in physicians’ financial ties to industry: a study of national disclosure data. PLoS One. 2015;10:E0129197.
- Santhakumar S, Adashi EY. The physician payment sunshine act: testing the value of transparency. JAMA. 2015;313:23-24.
Practice Points
- Industry payments to dermatologists are prevalent and complex and may have implications for patient care.
- To facilitate increased transparency around industry-physician relationships, lawmakers passed the Physician Payments Sunshine Act requiring pharmaceutical companies and device manufacturers to report all payments made to physicians.
- We encourage dermatologists to review their public profiles on the Open Payments database, as physicians have the opportunity to challenge the accuracy of the reported data, if applicable.
Impact of Stewardship Assistance Pilot Program for Veterans on Adherence and Persistence to Oral mCRPC Therapies
Background
Given the poor prognosis of patients with metastatic castration-resistant prostate cancer (mCRPC), interventions aimed at increasing adherence to oral treatments have the potential to improve patient outcomes. This study evaluates the impact of a patient stewardship assistance pilot program (stewardship program) on the adherence and persistence to oral treatments among patients with mCRPC at VA medical centers (VAMCs).
Methods
A non-randomized controlled study design and data from the VA Corporate Data Warehouse were used. The study included patients treated with an oral mCRPC therapy (i.e., abiraterone acetate or enzalutamide) between 08/2018 and 12/2019. Patients participating in the stewardship program formed the intervention arm and patients not participating the controls. Control patients were selected and matched 1:3 based on age, race and index year. The index date was the date of initiation of abiraterone acetate or enzalutamide. Outcomes included persistence (no gap >60 days of supply) and adherence (proportion of days covered [PDC] ≥80%) to oral mCRPC treatment post-index. Persistence and adherence were compared between the two arms using a Cox proportional hazard model and logistic regression model, respectively, adjusted for baseline characteristics.
Results
The study included 108 intervention patients (mean age: 74.6, 19.4% Black or African American, 44.4% from South, mean Quan-CCI: 6.7) and 324 control patients (mean age: 74.6, 19.4% Black or African American, 31.5% from South, mean Quan-CCI: 6.2). There was no statistically significant difference in persistence between the intervention and control arms (hazard ratio [95% confidence interval]: 0.84 [0.66-1.10], p-value: 0.211), with respective median times to discontinuation of 18 and 19 months. Over the first 12 months post-index, the proportion of adherent patients was not significantly different between the intervention arm and the control arm (50.6% vs. 50.9%; odds ratio [95% confidence interval]: 1.05 [0.80-1.38], p-value: 0.729).
Conclusions
In this racially diverse study of patients treated at VAMCs, high levels of persistence and adherence to oral mCRPC therapy were observed. The absence of any significant difference in adherence and persistence from the study intervention suggests that a stewardship assistance program aimed at improving adherence and persistence of patients with mCRPC may not be required at VAMCs.
Registered Dietitian Staffing and Nutrition Practices in High-Risk Cancer Patients Across the Veterans Health Administration
Background
Nutrition disorders, such as sarcopenia, malnutrition, and cachexia are prevalent in cancer patients and correlated with negative outcomes, increased costs, and reduced quality of life (QOL). Registered dietitians (RDs) effectively diagnose and treat nutrition disorders. RD staffing guidelines in outpatient cancer centers are non-specific and unvalidated. This study explored RD staffing ratios to determine trends which may indicate best practices.
Methods
Facility-level measures including full time equivalents (FTE), referral practices, RD participation interdisciplinary round participation, and nutrition referral practices were obtained from survey data of RDs working in oncology clinics and from cancer registries across VHA between 2016-2017. A proactive score was calculated based on interdisciplinary meeting attendances, use of validated screening tools, and standardized protocols for nutrition referrals. Chart review was conducted for 681 Veterans from 13 VHA cancer centers and 207 oncology providers (OPs) to determine weight change, malnutrition, oral nutrition supplement (ONS) use, time to RD referral, and survival. Logistic regression was used for statistical analysis.
Results
Mean and median RD FTE assigned to oncology clinics was 0.5. The total RD:OP ratio ranged from 1:4 to 1:850 with an average of 1 RD to 48.5 OP. An increase in RD:OP ratio from 0:1 to 1:1 was associated with a 16-fold increased odds of weight maintenance during cancer treatment (95% CI: 2.01, 127.53). A 10% increase in the RD:OP ratio increased probability of weight maintenance by 32%. Being seen by an RD was associated with 2.87 times odds of being diagnosed with malnutrition (95% CI: 1.62, 5.08). Each unit increase in a facility’s proactive score was associated with 38% increased odds of a patient being seen by an RD (95% CI: 1.08, 1.76), and 21% reduced odds of being prescribed an ONS (95% CI: 0.63, 0.98).
Conclusions
Few cancer centers employ dedicated fulltime RDs and nutrition practices vary across cancer centers. Improved RD:OP ratios may contribute to improved nutrition outcomes for this population. When RDs are active in interdisciplinary cancer teams, nutrition treatment improves. These efforts support patient complexity, facility funding, and QOL. These data may be used to support cancer care guidelines across VHA.
Telehealth Research and Innovation for Veterans With Cancer (THRIVE): Understanding Experiences of National TeleOncology Service Providers
Background
Currently within the Veterans Health Administration, nearly 38% of VA users reside in rural areas. Approximately 70% of rural areas do not have an oncologist, resulting in a high proportion of Veterans who lack access to specialized cancer services. The National TeleOncology Service (NTO) was designed to increase access to specialty and subspecialty cancer care for Veterans regardless of geographical location, and for those who may experience additional barriers to in-person care due to medical complexity or other social determinants of health. Purpose: THRIVE focuses on health equity for telehealth-delivered cancer care. We are specifically interested in the intersection of poverty, rurality, and race. As part of this inquiry, we examined provider experiences of the NTO to better understand the benefits, drawbacks, facilitators and barriers to implementing NTO care.
Methods
We conducted two focus groups with NTO providers. We developed guides using the Consolidated Framework for Implementation Research (CFIR 2.0) and utilized rapid qualitative analysis. We arrayed data in matrices based on CFIR 2.0-based guide for analysis.
Results
The focus groups included NTO physicians (n=4) and non-physicians (n=19). Providers agreed that NTO provides valuable cancer care to Veterans facing in-person access issues. The technology is easy to use for many patients, but those in rural areas experiencing poverty struggle most. NTO’s technical support resources reduce technical skill and equipment barriers and facilitate connection for both patients and providers. Providers enjoyed the team-based approach of NTO and believed it increases care quality through access to multiple providers and resources within the clinical encounter. The NTO’s work could be strengthened by standardizing technology to facilitate records transfer and enable sharing of documentation and education between NTO and patients. Implications: This study examined providers’ perceived acceptability, feasibility, barriers, and facilitators of NTO-delivered cancer care within VA, demonstrating that NTO service is well-liked and a valuable emerging resource of VA care.
Conclusions
In an era when CMMS shifts away from reimbursing telehealth, VA has committed to continue such care providing a variety of patient-centered approaches. NTO may serve as a model for expanding telehealth-delivered care for other serious and chronic diseases and conditions.
Association Between Pruritus and Fibromyalgia: Results of a Population-Based, Cross-Sectional Study
Pruritus, which is defined as an itching sensation that elicits a desire to scratch, is the most common cutaneous condition. Pruritus is considered chronic when it lasts for more than 6 weeks.1 Etiologies implicated in chronic pruritus include but are not limited to primary skin diseases such as atopic dermatitis, systemic causes, neuropathic disorders, and psychogenic reasons.2 In approximately 8% to 35% of patients, the cause of pruritus remains elusive despite intensive investigation.3 The mechanisms of itch are multifaceted and include complex neural pathways.4 Although itch and pain share many similarities, they have distinct pathways based on their spinal connections.5 Nevertheless, both conditions show a wide overlap of receptors on peripheral nerve endings and activated brain parts.6,7 Fibromyalgia, the third most common musculoskeletal condition, affects 2% to 3% of the population worldwide and is at least 7 times more common in females.8,9 Its pathogenesis is not entirely clear but is thought to involve neurogenic inflammation, aberrations in peripheral nerves, and central pain mechanisms. Fibromyalgia is characterized by a plethora of symptoms including chronic widespread pain, autonomic disturbances, persistent fatigue and sleep disturbances, and hyperalgesia, as well as somatic and psychiatric symptoms.10
Fibromyalgia is accompanied by altered skin features including increased counts of mast cells and excessive degranulation,11 neurogenic inflammation with elevated cytokine expression,12 disrupted collagen metabolism,13 and microcirculation abnormalities.14 There has been limited research exploring the dermatologic manifestations of fibromyalgia. One retrospective study that included 845 patients with fibromyalgia reported increased occurrence of “neurodermatoses,” including pruritus, neurotic excoriations, prurigo nodules, and lichen simplex chronicus (LSC), among other cutaneous comorbidities.15 Another small study demonstrated an increased incidence of xerosis and neurotic excoriations in females with fibromyalgia.16 A paucity of large epidemiologic studies demonstrating the fibromyalgia-pruritus connection may lead to misdiagnosis, misinterpretation, and undertreatment of these patients.
Up to 49% of fibromyalgia patients experience small-fiber neuropathy.17 Electrophysiologic measurements, quantitative sensory testing, pain-related evoked potentials, and skin biopsies showed that patients with fibromyalgia have compromised small-fiber function, impaired pathways carrying fiber pain signals, and reduced skin innervation and regenerating fibers.18,19 Accordingly, pruritus that has been reported in fibromyalgia is believed to be of neuropathic origin.15 Overall, it is suspected that the same mechanism that causes hypersensitivity and pain in fibromyalgia patients also predisposes them to pruritus. Similar systemic treatments (eg, analgesics, antidepressants, anticonvulsants) prescribed for both conditions support this theory.20-25
Our large cross-sectional study sought to establish the association between fibromyalgia and pruritus as well as related pruritic conditions.
Methods
Study Design and Setting—We conducted a cross-sectional retrospective study using data-mining techniques to access information from the Clalit Health Services (CHS) database. Clalit Health Services is the largest health maintenance organization in Israel. It encompasses an extensive database with continuous real-time input from medical, administrative, and pharmaceutical computerized operating systems, which helps facilitate data collection for epidemiologic studies. A chronic disease register is gathered from these data sources and continuously updated and validated through logistic checks. The current study was approved by the institutional review board of the CHS (approval #0212-17-com2). Informed consent was not required because the data were de-identified and this was a noninterventional observational study.
Study Population and Covariates—Medical records of CHS enrollees were screened for the diagnosis of fibromyalgia, and data on prevalent cases of fibromyalgia were retrieved. The diagnosis of fibromyalgia was based on the documentation of a fibromyalgia-specific diagnostic code registered by a board-certified rheumatologist. A control group of individuals without fibromyalgia was selected through 1:2 matching based on age, sex, and primary care clinic. The control group was randomly selected from the list of CHS members frequency-matched to cases, excluding case patients with fibromyalgia. Age matching was grounded on the exact year of birth (1-year strata).
Other covariates in the analysis included pruritus-related skin disorders, including prurigo nodularis, neurotic excoriations, and LSC. There were 3 socioeconomic status categories according to patients' poverty index: low, intermediate, and high.26
Statistical Analysis—The distribution of sociodemographic and clinical features was compared between patients with fibromyalgia and controls using the χ2 test for sex and socioeconomic status and the t test for age. Conditional logistic regression then was used to calculate adjusted odds ratio (OR) and 95% CI to compare patients with fibromyalgia and controls with respect to the presence of pruritic comorbidities. All statistical analyses were performed using SPSS software (version 26). P<.05 was considered statistically significant in all tests.
Results
Our study population comprised 4971 patients with fibromyalgia and 9896 age- and sex-matched controls. Proportional to the reported female predominance among patients with fibromyalgia,27 4479 (90.1%) patients with fibromyalgia were females and a similar proportion was documented among controls (P=.99). There was a slightly higher proportion of unmarried patients among those with fibromyalgia compared with controls (41.9% vs 39.4%; P=.004). Socioeconomic status was matched between patients and controls (P=.99). Descriptive characteristics of the study population are presented in Table 1.
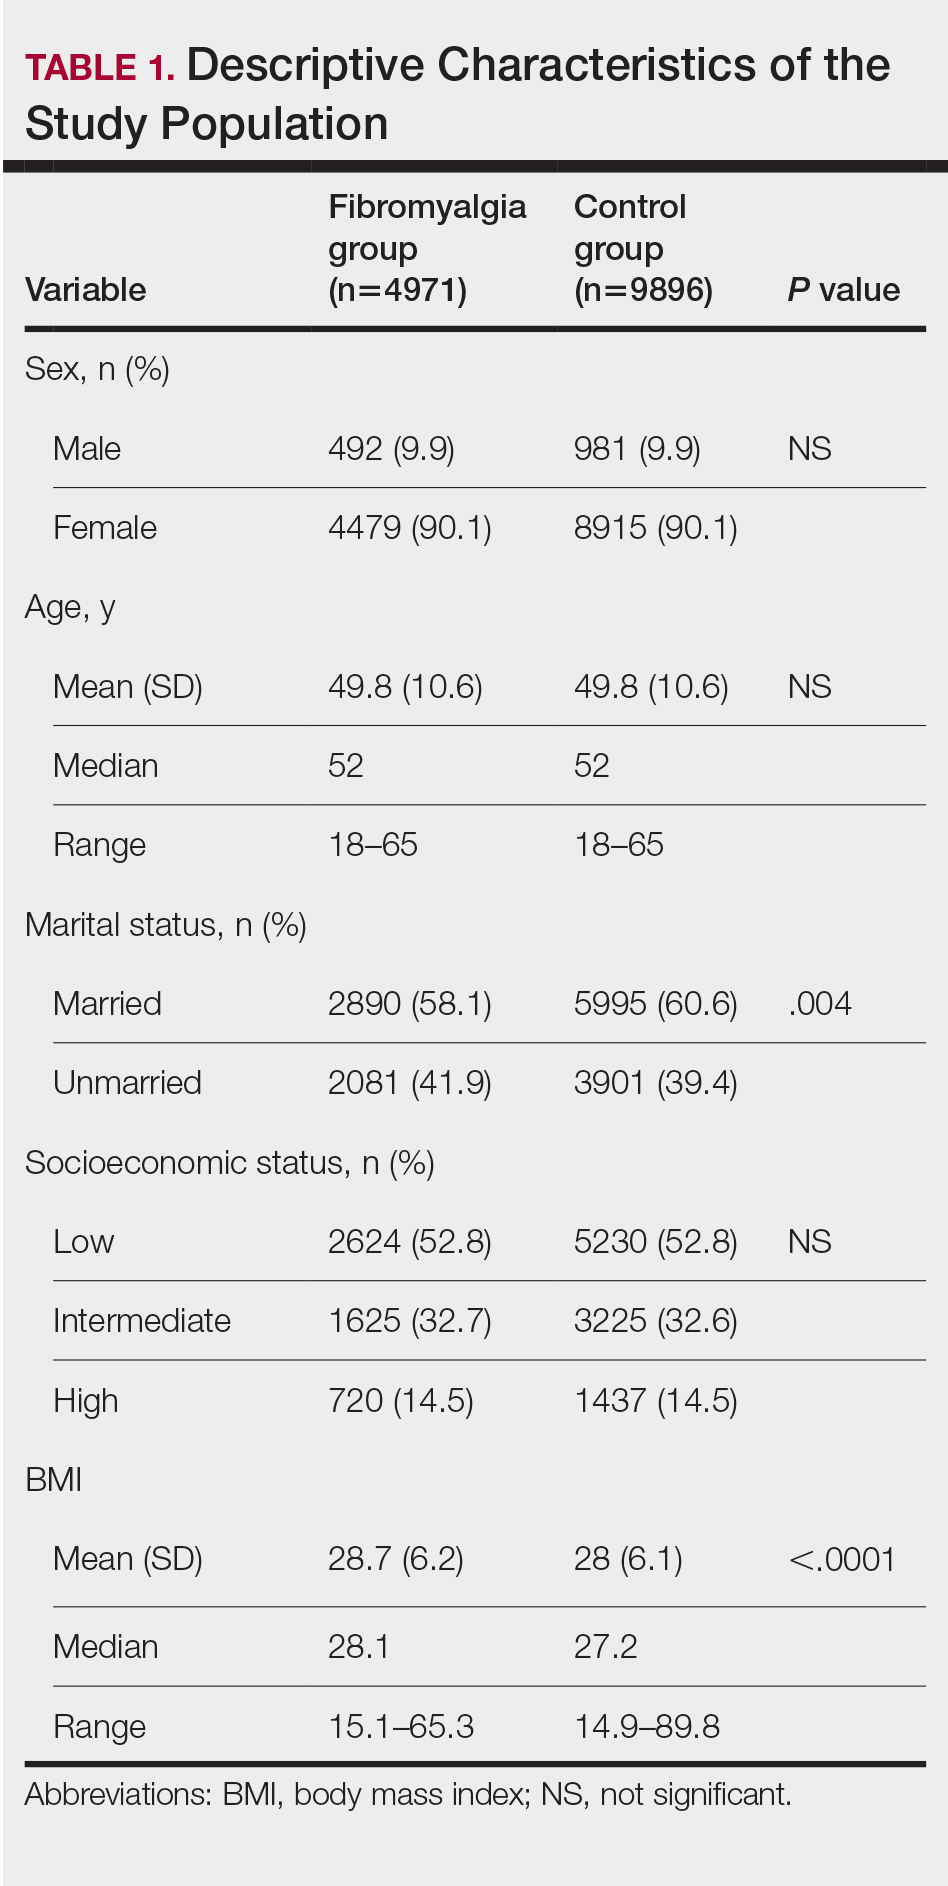
We assessed the presence of pruritus as well as 3 other pruritus-related skin disorders—prurigo nodularis, neurotic excoriations, and LSC—among patients with fibromyalgia and controls. Logistic regression was used to evaluate the independent association between fibromyalgia and pruritus. Table 2 presents the results of multivariate logistic regression models and summarizes the adjusted ORs for pruritic conditions in patients with fibromyalgia and different demographic features across the entire study sample. Fibromyalgia demonstrated strong independent associations with pruritus (OR, 1.8; 95% CI, 1.8-2.4; P<.001), prurigo nodularis (OR, 2.9; 95% CI, 1.1-8.4; P=.038), and LSC (OR, 1.5; 95% CI, 1.1-2.1; P=.01); the association with neurotic excoriations was not significant. Female sex significantly increased the risk for pruritus (OR 1.3; 95% CI, 1.0-1.6; P=.039), while age slightly increased the odds for pruritus (OR, 1.0; 95% CI, 1.0-1.04; P<.001), neurotic excoriations (OR, 1.0; 95% CI, 1.0-1.1; P=.046), and LSC (OR, 1.0; 95% CI, 1.01-1.04; P=.006). Finally, socioeconomic status was inversely correlated with pruritus (OR, 1.1; 95% CI, 1.1-1.5; P=.002).
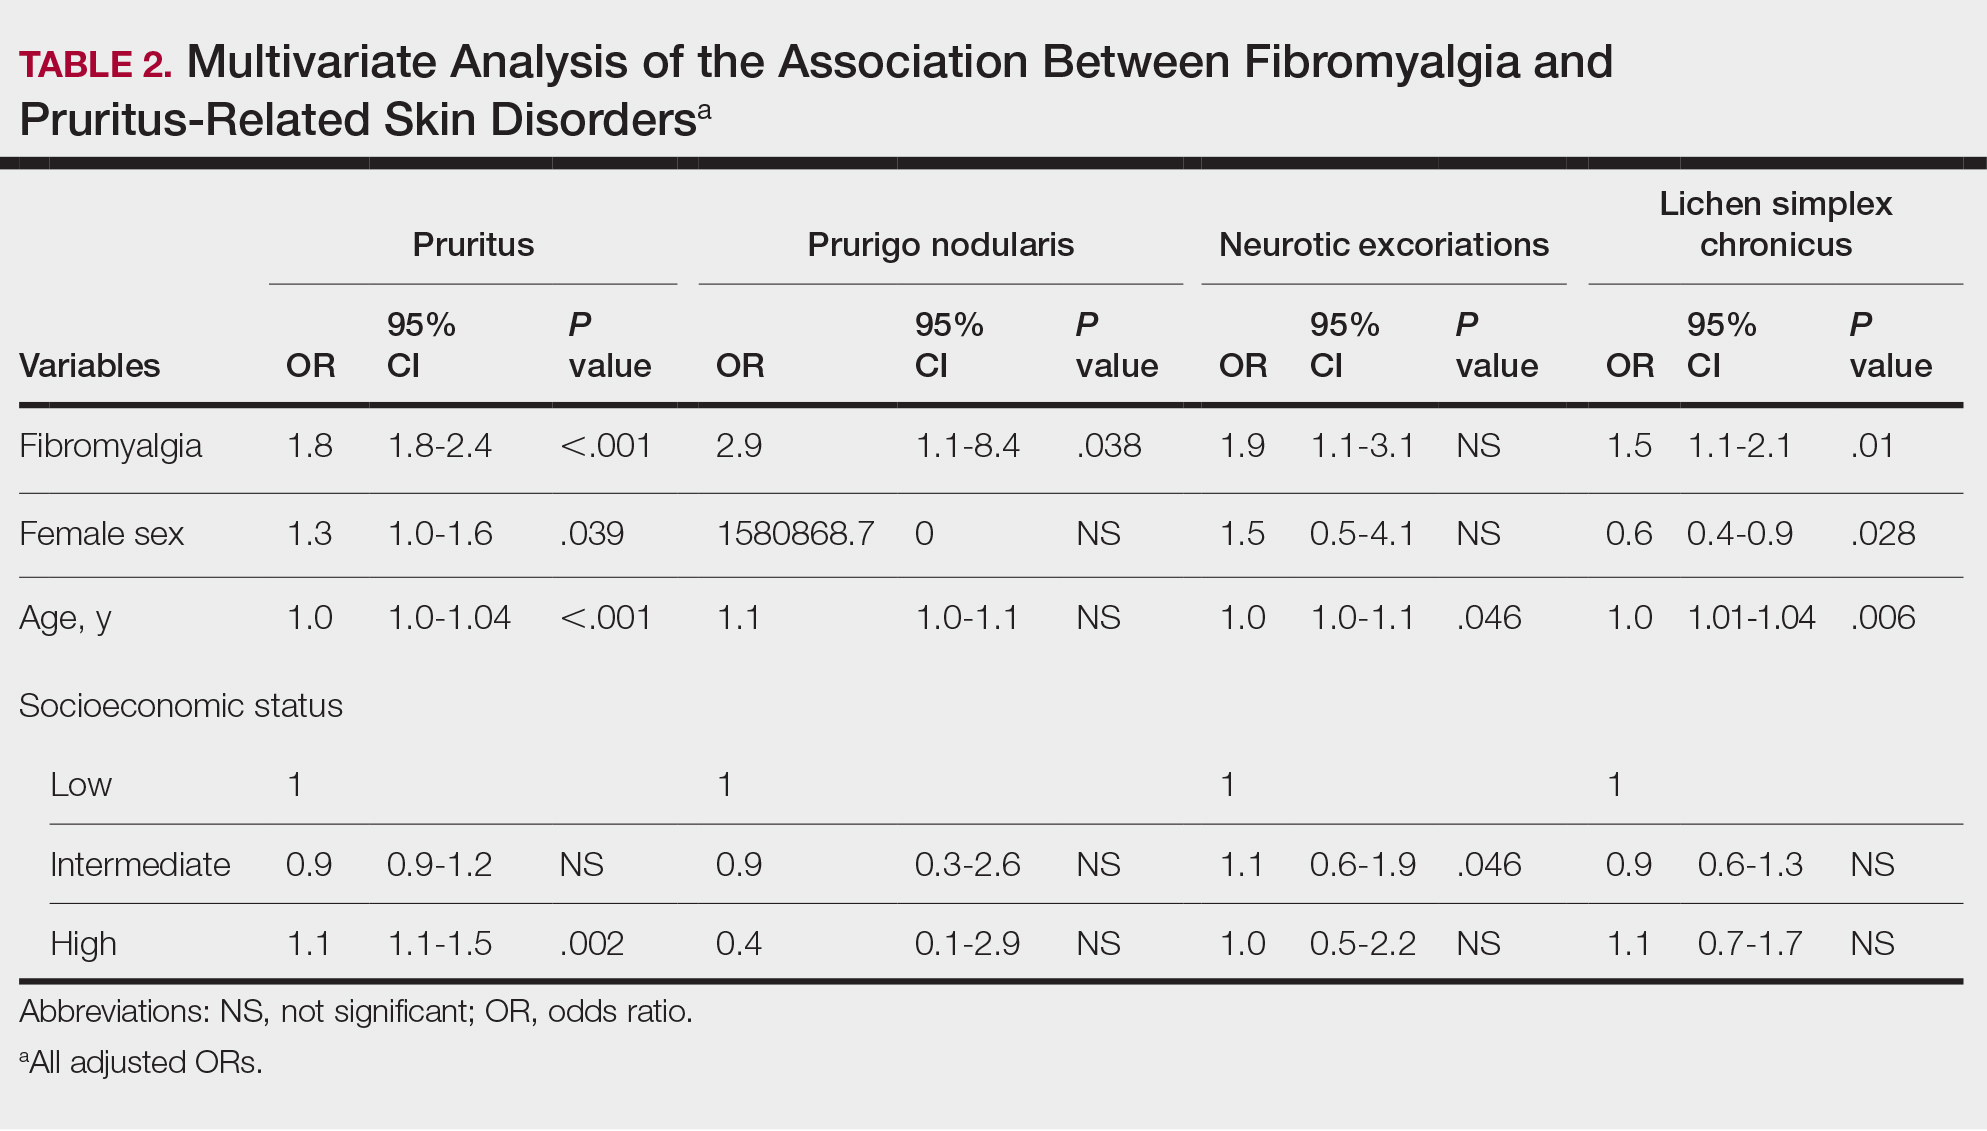
Frequencies and ORs for the association between fibromyalgia and pruritus with associated pruritic disorders stratified by exclusion of pruritic dermatologic and/or systemic diseases that may induce itch are presented in the eTable. Analyzing the entire study cohort, significant increases were observed in the odds of all 4 pruritic disorders analyzed. The frequency of pruritus was almost double in patients with fibromyalgia compared with controls (11.7% vs 6.0%; OR, 2.1; 95% CI, 1.8-2.3; P<.0001). Prurigo nodularis (0.2% vs 0.1%; OR, 2.9; 95% CI, 1.1-8.4; P=.05), neurotic excoriations (0.6% vs 0.3%; OR, 1.9; 95% CI, 1.1-3.1; P=.018), and LSC (1.3% vs 0.8%; OR, 1.5; 95% CI, 1.1-2.1; P=.01) frequencies were all higher in patients with fibromyalgia than controls. When primary skin disorders that may cause itch (eg, pemphigus vulgaris, Darier disease, dermatitis, eczema, ichthyosis, psoriasis, parapsoriasis, urticaria, xerosis, atopic dermatitis, dermatitis herpetiformis, lichen planus) were excluded, the prevalence of pruritus in patients with fibromyalgia was still 1.97 times greater than in the controls (6.9% vs. 3.5%; OR, 2.0; 95% CI, 1.7-2.4; P<.0001). These results remained unchanged even when excluding pruritic dermatologic disorders as well as systemic diseases associated with pruritus (eg, chronic renal failure, dialysis, hyperthyroidism, hyperparathyroidism/hypoparathyroidism, hypothyroidism). Patients with fibromyalgia still displayed a significantly higher prevalence of pruritus compared with the control group (6.6% vs 3.3%; OR, 2.1; 95% CI, 1.7-2.6; P<.0001).
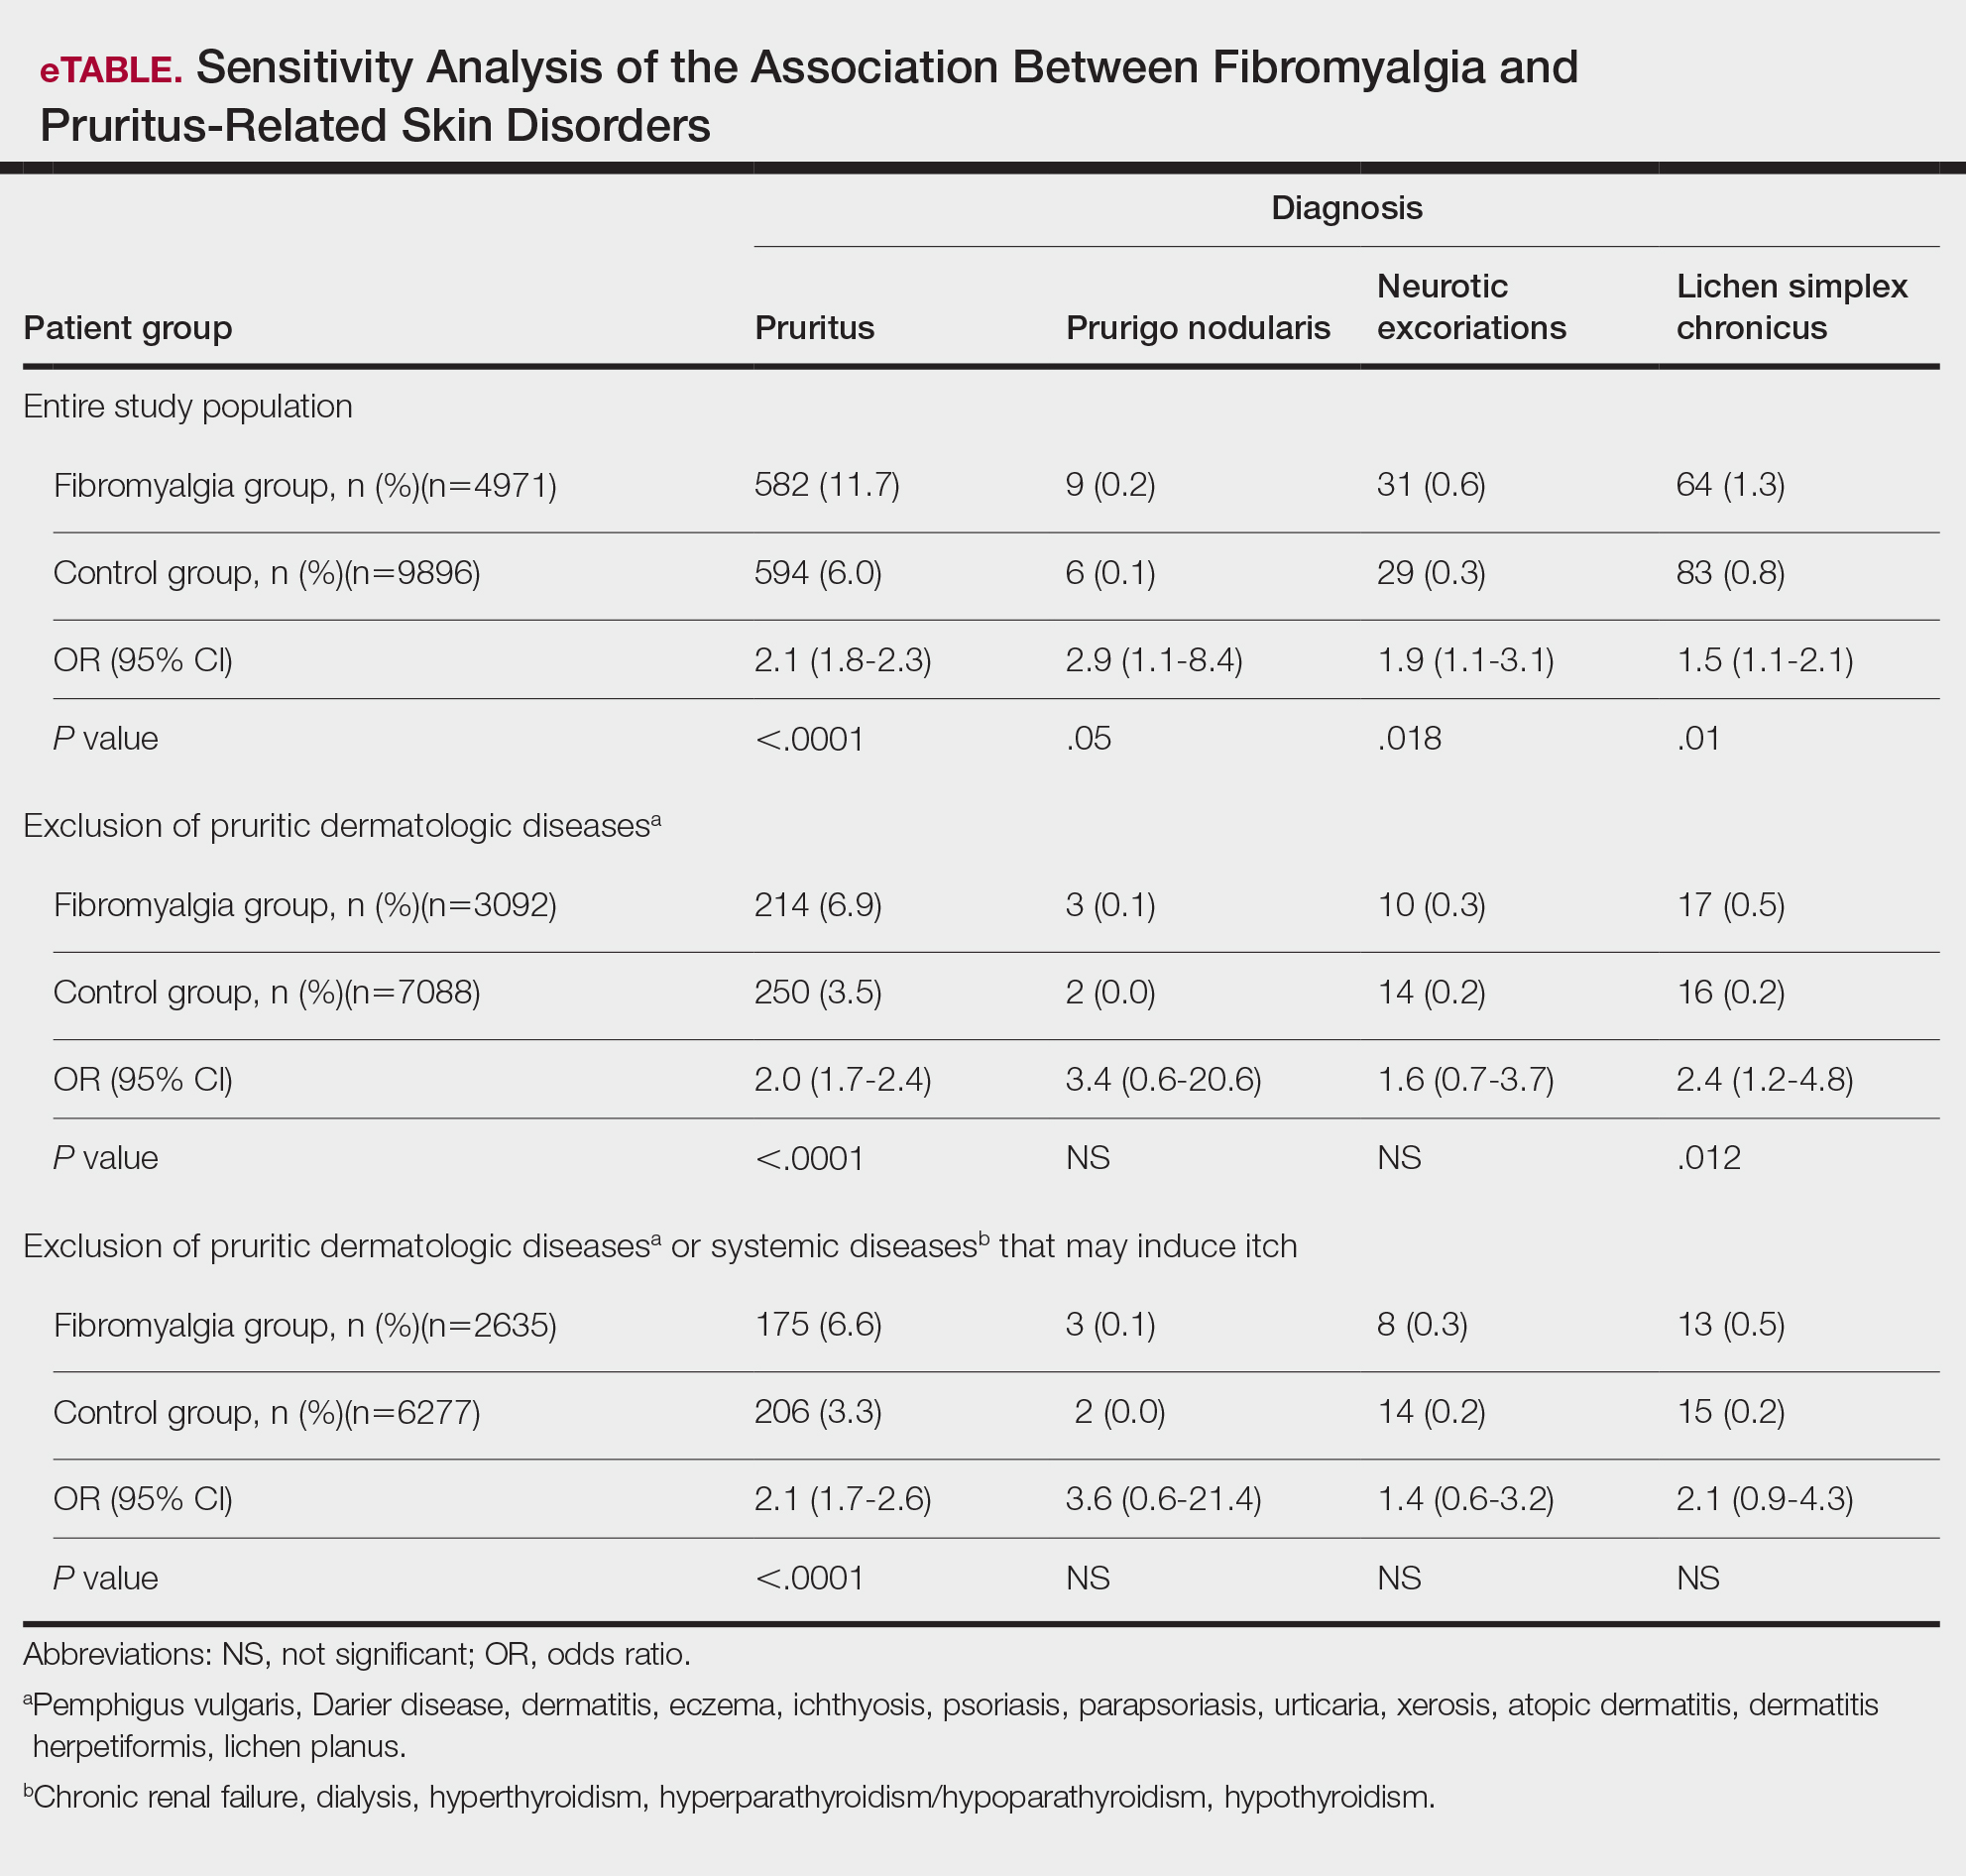
Comment
A wide range of skin manifestations have been associated with fibromyalgia, but the exact mechanisms remain unclear. Nevertheless, it is conceivable that autonomic nervous system dysfunction,28-31 amplified cutaneous opioid receptor activity,32 and an elevated presence of cutaneous mast cells with excessive degranulation may partially explain the frequent occurrence of pruritus and related skin disorders such as neurotic excoriations, prurigo nodularis, and LSC in individuals with fibromyalgia.15,16 In line with these findings, our study—which was based on data from the largest health maintenance organization in Israel—demonstrated an increased prevalence of pruritus and related pruritic disorders among individuals diagnosed with fibromyalgia.
This cross-sectional study links pruritus with fibromyalgia. Few preliminary epidemiologic studies have shown an increased occurrence of cutaneous manifestations in patients with fibromyalgia. One chart review that looked at skin findings in patients with fibromyalgia revealed 32 distinct cutaneous manifestations, and pruritus was the major concern in 3.3% of 845 patients.15
A focused cross-sectional study involving only women (66 with fibromyalgia and 79 healthy controls) discovered 14 skin conditions that were more common in those with fibromyalgia. Notably, xerosis and neurotic excoriations were more prevalent compared to the control group.16
The brain and the skin—both derivatives of the embryonic ectoderm33,34—are linked by pruritus. Although itch has its dedicated neurons, there is a wide-ranging overlap of brain-activated areas between pain and itch,6 and the neural anatomy of pain and itch are closely related in both the peripheral and central nervous systems35-37; for example, diseases of the central nervous system are accompanied by pruritus in as many as 15% of cases, while postherpetic neuralgia can result in chronic pain, itching, or a combination of both.38,39 Other instances include notalgia paresthetica and brachioradial pruritus.38 Additionally, there is a noteworthy psychologic impact associated with both itch and pain,40,41 with both psychosomatic and psychologic factors implicated in chronic pruritus and in fibromyalgia.42 Lastly, the hypothalamic-pituitary-adrenal axis and the sympathetic nervous system are altered in both fibromyalgia and pruritus.43-45
Tey et al45 characterized the itch experienced in fibromyalgia as functional, which is described as pruritus associated with a somatoform disorder. In our study, we found a higher prevalence of pruritus among patients with fibromyalgia, and this association remained significant (P<.05) even when excluding other pruritic skin conditions and systemic diseases that can trigger itching. In addition, our logistic regression analyses revealed independent associations between fibromyalgia and pruritus, prurigo nodularis, and LSC.
According to Twycross et al,46 there are 4 clinical categories of itch, which may coexist7: pruritoceptive (originating in the skin), neuropathic (originating in pathology located along the afferent pathway), neurogenic (central origin but lacks a neural pathology), and psychogenic.47 Skin biopsy findings in patients with fibromyalgia include increased mast cell counts11 and degranulation,48 increased expression of δ and κ opioid receptors,32 vasoconstriction within tender points,49 and elevated IL-1β, IL-6, or tumor necrosis factor α by reverse transcriptase-polymerase chain reaction.12 A case recently was presented by Görg et al50 involving a female patient with fibromyalgia who had been experiencing chronic pruritus, which the authors attributed to small-fiber neuropathy based on evidence from a skin biopsy indicating a reduced number of intraepidermal nerves and the fact that the itching originated around tender points. Altogether, the observed alterations may work together to make patients with fibromyalgia more susceptible to various skin-related comorbidities in general, especially those related to pruritus. Eventually, it might be the case that several itch categories and related pathomechanisms are involved in the pruritus phenotype of patients with fibromyalgia.
Age-related alterations in nerve fibers, lower immune function, xerosis, polypharmacy, and increased frequency of systemic diseases with age are just a few of the factors that may predispose older individuals to pruritus.51,52 Indeed, our logistic regression model showed that age was significantly and independently associated with pruritus (P<.001), neurotic excoriations (P=.046), and LSC (P=.006). Female sex also was significantly linked with pruritus (P=.039). Intriguingly, high socioeconomic status was significantly associated with the diagnosis of pruritus (P=.002), possibly due to easier access to medical care.
There is a considerable overlap between the therapeutic approaches used in pruritus, pruritus-related skin disorders, and fibromyalgia. Antidepressants, anxiolytics, analgesics, and antiepileptics have been used to address both conditions.45 The association between these conditions advocates for a multidisciplinary approach in patients with fibromyalgia and potentially supports the rationale for unified therapeutics for both conditions.
Conclusion
Our findings indicate an association between fibromyalgia and pruritus as well as associated pruritic skin disorders. Given the convoluted and largely undiscovered mechanisms underlying fibromyalgia, managing patients with this condition may present substantial challenges.53 The data presented here support the implementation of a multidisciplinary treatment approach for patients with fibromyalgia. This approach should focus on managing fibromyalgia pain as well as addressing its concurrent skin-related conditions. It is advisable to consider treatments such as antiepileptics (eg, pregabalin, gabapentin) that specifically target neuropathic disorders in affected patients. These treatments may hold promise for alleviating fibromyalgia-related pain54 and mitigating its related cutaneous comorbidities, especially pruritus.
- Stander S, Weisshaar E, Mettang T, et al. Clinical classification of itch: a position paper of the International Forum for the Study of Itch. Acta Derm Venereol. 2007; 87:291-294.
- Yosipovitch G, Bernhard JD. Clinical practice. chronic pruritus. N Engl J Med. 2013;368:1625-1634.
- Song J, Xian D, Yang L, et al. Pruritus: progress toward pathogenesis and treatment. Biomed Res Int. 2018;2018:9625936.
- Potenzieri C, Undem BJ. Basic mechanisms of itch. Clin Exp Allergy. 2012;42:8-19.
- McMahon SB, Koltzenburg M. Itching for an explanation. Trends Neurosci. 1992;15:497-501.
- Drzezga A, Darsow U, Treede RD, et al. Central activation by histamine-induced itch: analogies to pain processing: a correlational analysis of O-15 H2O positron emission tomography studies. Pain. 2001; 92:295-305.
- Yosipovitch G, Greaves MW, Schmelz M. Itch. Lancet. 2003;361:690-694.
- Helmick CG, Felson DT, Lawrence RC, et al. Estimates of the prevalence of arthritis and other rheumatic conditions in the United States. part I. Arthritis Rheum. 2008; 58:15-25.
- Lawrence RC, Felson DT, Helmick CG, et al. Estimates of the prevalence of arthritis and other rheumatic conditions in the United States. part II. Arthritis Rheum. 2008; 58:26-35.
- Sarzi-Puttini P, Giorgi V, Marotto D, et al. Fibromyalgia: an update on clinical characteristics, aetiopathogenesis and treatment. Nat Rev Rheumatol. 2020;16:645-660.
- Blanco I, Beritze N, Arguelles M, et al. Abnormal overexpression of mastocytes in skin biopsies of fibromyalgia patients. Clin Rheumatol. 2010;29:1403-1412.
- Salemi S, Rethage J, Wollina U, et al. Detection of interleukin 1beta (IL-1beta), IL-6, and tumor necrosis factor-alpha in skin of patients with fibromyalgia. J Rheumatol. 2003;30:146-150.
- Sprott H, Muller A, Heine H. Collagen cross-links in fibromyalgia syndrome. Z Rheumatol. 1998;57(suppl 2):52-55.
- Morf S, Amann-Vesti B, Forster A, et al. Microcirculation abnormalities in patients with fibromyalgia—measured by capillary microscopy and laser fluxmetry. Arthritis Res Ther. 2005;7:R209-R216.
- Laniosz V, Wetter DA, Godar DA. Dermatologic manifestations of fibromyalgia. Clin Rheumatol. 2014;33:1009-1013.
- Dogramaci AC, Yalcinkaya EY. Skin problems in fibromyalgia. Nobel Med. 2009;5:50-52.
- Grayston R, Czanner G, Elhadd K, et al. A systematic review and meta-analysis of the prevalence of small fiber pathology in fibromyalgia: implications for a new paradigm in fibromyalgia etiopathogenesis. Semin Arthritis Rheum. 2019;48:933-940.
- Uceyler N, Zeller D, Kahn AK, et al. Small fibre pathology in patients with fibromyalgia syndrome. Brain. 2013;136:1857-1867.
- Devigili G, Tugnoli V, Penza P, et al. The diagnostic criteria for small fibre neuropathy: from symptoms to neuropathology. Brain. 2008; 131:1912- 1925.
- Reed C, Birnbaum HG, Ivanova JI, et al. Real-world role of tricyclic antidepressants in the treatment of fibromyalgia. Pain Pract. 2012; 12:533-540.
- Moret C, Briley M. Antidepressants in the treatment of fibromyalgia. Neuropsychiatr Dis Treat. 2006;2:537-548.
- Arnold LM, Keck PE Jr, Welge JA. Antidepressant treatment of fibromyalgia. a meta-analysis and review. Psychosomatics. 2000;41:104-113.
- Moore A, Wiffen P, Kalso E. Antiepileptic drugs for neuropathic pain and fibromyalgia. JAMA. 2014;312:182-183.
- Shevchenko A, Valdes-Rodriguez R, Yosipovitch G. Causes, pathophysiology, and treatment of pruritus in the mature patient. Clin Dermatol. 2018;36:140-151.
- Scheinfeld N. The role of gabapentin in treating diseases with cutaneous manifestations and pain. Int J Dermatol. 2003;42:491-495.
- Points Location Intelligence. Accessed July 30, 2024. https://points.co.il/en/points-location-intelligence/
- Yunus MB. The role of gender in fibromyalgia syndrome. Curr Rheumatol Rep. 2001;3:128-134.
- Cakir T, Evcik D, Dundar U, et al. Evaluation of sympathetic skin response and f wave in fibromyalgia syndrome patients. Turk J Rheumatol. 2011;26:38-43.
- Ozkan O, Yildiz M, Koklukaya E. The correlation of laboratory tests and sympathetic skin response parameters by using artificial neural networks in fibromyalgia patients. J Med Syst. 2012;36:1841-1848.
- Ozkan O, Yildiz M, Arslan E, et al. A study on the effects of sympathetic skin response parameters in diagnosis of fibromyalgia using artificial neural networks. J Med Syst. 2016;40:54.
- Ulas UH, Unlu E, Hamamcioglu K, et al. Dysautonomia in fibromyalgia syndrome: sympathetic skin responses and RR interval analysis. Rheumatol Int. 2006;26:383-387.
- Salemi S, Aeschlimann A, Wollina U, et al. Up-regulation of delta-opioid receptors and kappa-opioid receptors in the skin of fibromyalgia patients. Arthritis Rheum. 2007;56:2464-2466.
- Elshazzly M, Lopez MJ, Reddy V, et al. Central nervous system. StatPearls. StatPearls Publishing; 2022.
- Hu MS, Borrelli MR, Hong WX, et al. Embryonic skin development and repair. Organogenesis. 2018;14:46-63.
- Davidson S, Zhang X, Yoon CH, et al. The itch-producing agents histamine and cowhage activate separate populations of primate spinothalamic tract neurons. J Neurosci. 2007;27:10007-10014.
- Sikand P, Shimada SG, Green BG, et al. Similar itch and nociceptive sensations evoked by punctate cutaneous application of capsaicin, histamine and cowhage. Pain. 2009;144:66-75.
- Davidson S, Giesler GJ. The multiple pathways for itch and their interactions with pain. Trends Neurosci. 2010;33:550-558.
- Dhand A, Aminoff MJ. The neurology of itch. Brain. 2014;137:313-322.
- Binder A, Koroschetz J, Baron R. Disease mechanisms in neuropathic itch. Nat Clin Pract Neurol. 2008;4:329-337.
- Fjellner B, Arnetz BB. Psychological predictors of pruritus during mental stress. Acta Derm Venereol. 1985;65:504-508.
- Papoiu AD, Wang H, Coghill RC, et al. Contagious itch in humans: a study of visual ‘transmission’ of itch in atopic dermatitis and healthy subjects. Br J Dermatol. 2011;164:1299-1303.
- Stumpf A, Schneider G, Stander S. Psychosomatic and psychiatric disorders and psychologic factors in pruritus. Clin Dermatol. 2018;36:704-708.
- Herman JP, McKlveen JM, Ghosal S, et al. Regulation of the hypothalamic-pituitary-adrenocortical stress response. Compr Physiol. 2016;6:603-621.
- Brown ED, Micozzi MS, Craft NE, et al. Plasma carotenoids in normal men after a single ingestion of vegetables or purified beta-carotene. Am J Clin Nutr. 1989;49:1258-1265.
- Tey HL, Wallengren J, Yosipovitch G. Psychosomatic factors in pruritus. Clin Dermatol. 2013;31:31-40.
- Twycross R, Greaves MW, Handwerker H, et al. Itch: scratching more than the surface. QJM. 2003;96:7-26.
- Bernhard JD. Itch and pruritus: what are they, and how should itches be classified? Dermatol Ther. 2005;18:288-291.
- Enestrom S, Bengtsson A, Frodin T. Dermal IgG deposits and increase of mast cells in patients with fibromyalgia—relevant findings or epiphenomena? Scand J Rheumatol. 1997;26:308-313.
- Jeschonneck M, Grohmann G, Hein G, et al. Abnormal microcirculation and temperature in skin above tender points in patients with fibromyalgia. Rheumatology (Oxford). 2000;39:917-921.
- Görg M, Zeidler C, Pereira MP, et al. Generalized chronic pruritus with fibromyalgia. J Dtsch Dermatol Ges. 2021;19:909-911.
- Garibyan L, Chiou AS, Elmariah SB. Advanced aging skin and itch: addressing an unmet need. Dermatol Ther. 2013;26:92-103.
- Cohen KR, Frank J, Salbu RL, et al. Pruritus in the elderly: clinical approaches to the improvement of quality of life. P T. 2012;37:227-239.
- Tzadok R, Ablin JN. Current and emerging pharmacotherapy for fibromyalgia. Pain Res Manag. 2020; 2020:6541798.
- Wiffen PJ, Derry S, Moore RA, et al. Antiepileptic drugs for neuropathic pain and fibromyalgia—an overview of Cochrane reviews. Cochrane Database Syst Rev. 2013:CD010567.
Pruritus, which is defined as an itching sensation that elicits a desire to scratch, is the most common cutaneous condition. Pruritus is considered chronic when it lasts for more than 6 weeks.1 Etiologies implicated in chronic pruritus include but are not limited to primary skin diseases such as atopic dermatitis, systemic causes, neuropathic disorders, and psychogenic reasons.2 In approximately 8% to 35% of patients, the cause of pruritus remains elusive despite intensive investigation.3 The mechanisms of itch are multifaceted and include complex neural pathways.4 Although itch and pain share many similarities, they have distinct pathways based on their spinal connections.5 Nevertheless, both conditions show a wide overlap of receptors on peripheral nerve endings and activated brain parts.6,7 Fibromyalgia, the third most common musculoskeletal condition, affects 2% to 3% of the population worldwide and is at least 7 times more common in females.8,9 Its pathogenesis is not entirely clear but is thought to involve neurogenic inflammation, aberrations in peripheral nerves, and central pain mechanisms. Fibromyalgia is characterized by a plethora of symptoms including chronic widespread pain, autonomic disturbances, persistent fatigue and sleep disturbances, and hyperalgesia, as well as somatic and psychiatric symptoms.10
Fibromyalgia is accompanied by altered skin features including increased counts of mast cells and excessive degranulation,11 neurogenic inflammation with elevated cytokine expression,12 disrupted collagen metabolism,13 and microcirculation abnormalities.14 There has been limited research exploring the dermatologic manifestations of fibromyalgia. One retrospective study that included 845 patients with fibromyalgia reported increased occurrence of “neurodermatoses,” including pruritus, neurotic excoriations, prurigo nodules, and lichen simplex chronicus (LSC), among other cutaneous comorbidities.15 Another small study demonstrated an increased incidence of xerosis and neurotic excoriations in females with fibromyalgia.16 A paucity of large epidemiologic studies demonstrating the fibromyalgia-pruritus connection may lead to misdiagnosis, misinterpretation, and undertreatment of these patients.
Up to 49% of fibromyalgia patients experience small-fiber neuropathy.17 Electrophysiologic measurements, quantitative sensory testing, pain-related evoked potentials, and skin biopsies showed that patients with fibromyalgia have compromised small-fiber function, impaired pathways carrying fiber pain signals, and reduced skin innervation and regenerating fibers.18,19 Accordingly, pruritus that has been reported in fibromyalgia is believed to be of neuropathic origin.15 Overall, it is suspected that the same mechanism that causes hypersensitivity and pain in fibromyalgia patients also predisposes them to pruritus. Similar systemic treatments (eg, analgesics, antidepressants, anticonvulsants) prescribed for both conditions support this theory.20-25
Our large cross-sectional study sought to establish the association between fibromyalgia and pruritus as well as related pruritic conditions.
Methods
Study Design and Setting—We conducted a cross-sectional retrospective study using data-mining techniques to access information from the Clalit Health Services (CHS) database. Clalit Health Services is the largest health maintenance organization in Israel. It encompasses an extensive database with continuous real-time input from medical, administrative, and pharmaceutical computerized operating systems, which helps facilitate data collection for epidemiologic studies. A chronic disease register is gathered from these data sources and continuously updated and validated through logistic checks. The current study was approved by the institutional review board of the CHS (approval #0212-17-com2). Informed consent was not required because the data were de-identified and this was a noninterventional observational study.
Study Population and Covariates—Medical records of CHS enrollees were screened for the diagnosis of fibromyalgia, and data on prevalent cases of fibromyalgia were retrieved. The diagnosis of fibromyalgia was based on the documentation of a fibromyalgia-specific diagnostic code registered by a board-certified rheumatologist. A control group of individuals without fibromyalgia was selected through 1:2 matching based on age, sex, and primary care clinic. The control group was randomly selected from the list of CHS members frequency-matched to cases, excluding case patients with fibromyalgia. Age matching was grounded on the exact year of birth (1-year strata).
Other covariates in the analysis included pruritus-related skin disorders, including prurigo nodularis, neurotic excoriations, and LSC. There were 3 socioeconomic status categories according to patients' poverty index: low, intermediate, and high.26
Statistical Analysis—The distribution of sociodemographic and clinical features was compared between patients with fibromyalgia and controls using the χ2 test for sex and socioeconomic status and the t test for age. Conditional logistic regression then was used to calculate adjusted odds ratio (OR) and 95% CI to compare patients with fibromyalgia and controls with respect to the presence of pruritic comorbidities. All statistical analyses were performed using SPSS software (version 26). P<.05 was considered statistically significant in all tests.
Results
Our study population comprised 4971 patients with fibromyalgia and 9896 age- and sex-matched controls. Proportional to the reported female predominance among patients with fibromyalgia,27 4479 (90.1%) patients with fibromyalgia were females and a similar proportion was documented among controls (P=.99). There was a slightly higher proportion of unmarried patients among those with fibromyalgia compared with controls (41.9% vs 39.4%; P=.004). Socioeconomic status was matched between patients and controls (P=.99). Descriptive characteristics of the study population are presented in Table 1.
We assessed the presence of pruritus as well as 3 other pruritus-related skin disorders—prurigo nodularis, neurotic excoriations, and LSC—among patients with fibromyalgia and controls. Logistic regression was used to evaluate the independent association between fibromyalgia and pruritus. Table 2 presents the results of multivariate logistic regression models and summarizes the adjusted ORs for pruritic conditions in patients with fibromyalgia and different demographic features across the entire study sample. Fibromyalgia demonstrated strong independent associations with pruritus (OR, 1.8; 95% CI, 1.8-2.4; P<.001), prurigo nodularis (OR, 2.9; 95% CI, 1.1-8.4; P=.038), and LSC (OR, 1.5; 95% CI, 1.1-2.1; P=.01); the association with neurotic excoriations was not significant. Female sex significantly increased the risk for pruritus (OR 1.3; 95% CI, 1.0-1.6; P=.039), while age slightly increased the odds for pruritus (OR, 1.0; 95% CI, 1.0-1.04; P<.001), neurotic excoriations (OR, 1.0; 95% CI, 1.0-1.1; P=.046), and LSC (OR, 1.0; 95% CI, 1.01-1.04; P=.006). Finally, socioeconomic status was inversely correlated with pruritus (OR, 1.1; 95% CI, 1.1-1.5; P=.002).
Frequencies and ORs for the association between fibromyalgia and pruritus with associated pruritic disorders stratified by exclusion of pruritic dermatologic and/or systemic diseases that may induce itch are presented in the eTable. Analyzing the entire study cohort, significant increases were observed in the odds of all 4 pruritic disorders analyzed. The frequency of pruritus was almost double in patients with fibromyalgia compared with controls (11.7% vs 6.0%; OR, 2.1; 95% CI, 1.8-2.3; P<.0001). Prurigo nodularis (0.2% vs 0.1%; OR, 2.9; 95% CI, 1.1-8.4; P=.05), neurotic excoriations (0.6% vs 0.3%; OR, 1.9; 95% CI, 1.1-3.1; P=.018), and LSC (1.3% vs 0.8%; OR, 1.5; 95% CI, 1.1-2.1; P=.01) frequencies were all higher in patients with fibromyalgia than controls. When primary skin disorders that may cause itch (eg, pemphigus vulgaris, Darier disease, dermatitis, eczema, ichthyosis, psoriasis, parapsoriasis, urticaria, xerosis, atopic dermatitis, dermatitis herpetiformis, lichen planus) were excluded, the prevalence of pruritus in patients with fibromyalgia was still 1.97 times greater than in the controls (6.9% vs. 3.5%; OR, 2.0; 95% CI, 1.7-2.4; P<.0001). These results remained unchanged even when excluding pruritic dermatologic disorders as well as systemic diseases associated with pruritus (eg, chronic renal failure, dialysis, hyperthyroidism, hyperparathyroidism/hypoparathyroidism, hypothyroidism). Patients with fibromyalgia still displayed a significantly higher prevalence of pruritus compared with the control group (6.6% vs 3.3%; OR, 2.1; 95% CI, 1.7-2.6; P<.0001).
Comment
A wide range of skin manifestations have been associated with fibromyalgia, but the exact mechanisms remain unclear. Nevertheless, it is conceivable that autonomic nervous system dysfunction,28-31 amplified cutaneous opioid receptor activity,32 and an elevated presence of cutaneous mast cells with excessive degranulation may partially explain the frequent occurrence of pruritus and related skin disorders such as neurotic excoriations, prurigo nodularis, and LSC in individuals with fibromyalgia.15,16 In line with these findings, our study—which was based on data from the largest health maintenance organization in Israel—demonstrated an increased prevalence of pruritus and related pruritic disorders among individuals diagnosed with fibromyalgia.
This cross-sectional study links pruritus with fibromyalgia. Few preliminary epidemiologic studies have shown an increased occurrence of cutaneous manifestations in patients with fibromyalgia. One chart review that looked at skin findings in patients with fibromyalgia revealed 32 distinct cutaneous manifestations, and pruritus was the major concern in 3.3% of 845 patients.15
A focused cross-sectional study involving only women (66 with fibromyalgia and 79 healthy controls) discovered 14 skin conditions that were more common in those with fibromyalgia. Notably, xerosis and neurotic excoriations were more prevalent compared to the control group.16
The brain and the skin—both derivatives of the embryonic ectoderm33,34—are linked by pruritus. Although itch has its dedicated neurons, there is a wide-ranging overlap of brain-activated areas between pain and itch,6 and the neural anatomy of pain and itch are closely related in both the peripheral and central nervous systems35-37; for example, diseases of the central nervous system are accompanied by pruritus in as many as 15% of cases, while postherpetic neuralgia can result in chronic pain, itching, or a combination of both.38,39 Other instances include notalgia paresthetica and brachioradial pruritus.38 Additionally, there is a noteworthy psychologic impact associated with both itch and pain,40,41 with both psychosomatic and psychologic factors implicated in chronic pruritus and in fibromyalgia.42 Lastly, the hypothalamic-pituitary-adrenal axis and the sympathetic nervous system are altered in both fibromyalgia and pruritus.43-45
Tey et al45 characterized the itch experienced in fibromyalgia as functional, which is described as pruritus associated with a somatoform disorder. In our study, we found a higher prevalence of pruritus among patients with fibromyalgia, and this association remained significant (P<.05) even when excluding other pruritic skin conditions and systemic diseases that can trigger itching. In addition, our logistic regression analyses revealed independent associations between fibromyalgia and pruritus, prurigo nodularis, and LSC.
According to Twycross et al,46 there are 4 clinical categories of itch, which may coexist7: pruritoceptive (originating in the skin), neuropathic (originating in pathology located along the afferent pathway), neurogenic (central origin but lacks a neural pathology), and psychogenic.47 Skin biopsy findings in patients with fibromyalgia include increased mast cell counts11 and degranulation,48 increased expression of δ and κ opioid receptors,32 vasoconstriction within tender points,49 and elevated IL-1β, IL-6, or tumor necrosis factor α by reverse transcriptase-polymerase chain reaction.12 A case recently was presented by Görg et al50 involving a female patient with fibromyalgia who had been experiencing chronic pruritus, which the authors attributed to small-fiber neuropathy based on evidence from a skin biopsy indicating a reduced number of intraepidermal nerves and the fact that the itching originated around tender points. Altogether, the observed alterations may work together to make patients with fibromyalgia more susceptible to various skin-related comorbidities in general, especially those related to pruritus. Eventually, it might be the case that several itch categories and related pathomechanisms are involved in the pruritus phenotype of patients with fibromyalgia.
Age-related alterations in nerve fibers, lower immune function, xerosis, polypharmacy, and increased frequency of systemic diseases with age are just a few of the factors that may predispose older individuals to pruritus.51,52 Indeed, our logistic regression model showed that age was significantly and independently associated with pruritus (P<.001), neurotic excoriations (P=.046), and LSC (P=.006). Female sex also was significantly linked with pruritus (P=.039). Intriguingly, high socioeconomic status was significantly associated with the diagnosis of pruritus (P=.002), possibly due to easier access to medical care.
There is a considerable overlap between the therapeutic approaches used in pruritus, pruritus-related skin disorders, and fibromyalgia. Antidepressants, anxiolytics, analgesics, and antiepileptics have been used to address both conditions.45 The association between these conditions advocates for a multidisciplinary approach in patients with fibromyalgia and potentially supports the rationale for unified therapeutics for both conditions.
Conclusion
Our findings indicate an association between fibromyalgia and pruritus as well as associated pruritic skin disorders. Given the convoluted and largely undiscovered mechanisms underlying fibromyalgia, managing patients with this condition may present substantial challenges.53 The data presented here support the implementation of a multidisciplinary treatment approach for patients with fibromyalgia. This approach should focus on managing fibromyalgia pain as well as addressing its concurrent skin-related conditions. It is advisable to consider treatments such as antiepileptics (eg, pregabalin, gabapentin) that specifically target neuropathic disorders in affected patients. These treatments may hold promise for alleviating fibromyalgia-related pain54 and mitigating its related cutaneous comorbidities, especially pruritus.
- Stander S, Weisshaar E, Mettang T, et al. Clinical classification of itch: a position paper of the International Forum for the Study of Itch. Acta Derm Venereol. 2007; 87:291-294.
- Yosipovitch G, Bernhard JD. Clinical practice. chronic pruritus. N Engl J Med. 2013;368:1625-1634.
- Song J, Xian D, Yang L, et al. Pruritus: progress toward pathogenesis and treatment. Biomed Res Int. 2018;2018:9625936.
- Potenzieri C, Undem BJ. Basic mechanisms of itch. Clin Exp Allergy. 2012;42:8-19.
- McMahon SB, Koltzenburg M. Itching for an explanation. Trends Neurosci. 1992;15:497-501.
- Drzezga A, Darsow U, Treede RD, et al. Central activation by histamine-induced itch: analogies to pain processing: a correlational analysis of O-15 H2O positron emission tomography studies. Pain. 2001; 92:295-305.
- Yosipovitch G, Greaves MW, Schmelz M. Itch. Lancet. 2003;361:690-694.
- Helmick CG, Felson DT, Lawrence RC, et al. Estimates of the prevalence of arthritis and other rheumatic conditions in the United States. part I. Arthritis Rheum. 2008; 58:15-25.
- Lawrence RC, Felson DT, Helmick CG, et al. Estimates of the prevalence of arthritis and other rheumatic conditions in the United States. part II. Arthritis Rheum. 2008; 58:26-35.
- Sarzi-Puttini P, Giorgi V, Marotto D, et al. Fibromyalgia: an update on clinical characteristics, aetiopathogenesis and treatment. Nat Rev Rheumatol. 2020;16:645-660.
- Blanco I, Beritze N, Arguelles M, et al. Abnormal overexpression of mastocytes in skin biopsies of fibromyalgia patients. Clin Rheumatol. 2010;29:1403-1412.
- Salemi S, Rethage J, Wollina U, et al. Detection of interleukin 1beta (IL-1beta), IL-6, and tumor necrosis factor-alpha in skin of patients with fibromyalgia. J Rheumatol. 2003;30:146-150.
- Sprott H, Muller A, Heine H. Collagen cross-links in fibromyalgia syndrome. Z Rheumatol. 1998;57(suppl 2):52-55.
- Morf S, Amann-Vesti B, Forster A, et al. Microcirculation abnormalities in patients with fibromyalgia—measured by capillary microscopy and laser fluxmetry. Arthritis Res Ther. 2005;7:R209-R216.
- Laniosz V, Wetter DA, Godar DA. Dermatologic manifestations of fibromyalgia. Clin Rheumatol. 2014;33:1009-1013.
- Dogramaci AC, Yalcinkaya EY. Skin problems in fibromyalgia. Nobel Med. 2009;5:50-52.
- Grayston R, Czanner G, Elhadd K, et al. A systematic review and meta-analysis of the prevalence of small fiber pathology in fibromyalgia: implications for a new paradigm in fibromyalgia etiopathogenesis. Semin Arthritis Rheum. 2019;48:933-940.
- Uceyler N, Zeller D, Kahn AK, et al. Small fibre pathology in patients with fibromyalgia syndrome. Brain. 2013;136:1857-1867.
- Devigili G, Tugnoli V, Penza P, et al. The diagnostic criteria for small fibre neuropathy: from symptoms to neuropathology. Brain. 2008; 131:1912- 1925.
- Reed C, Birnbaum HG, Ivanova JI, et al. Real-world role of tricyclic antidepressants in the treatment of fibromyalgia. Pain Pract. 2012; 12:533-540.
- Moret C, Briley M. Antidepressants in the treatment of fibromyalgia. Neuropsychiatr Dis Treat. 2006;2:537-548.
- Arnold LM, Keck PE Jr, Welge JA. Antidepressant treatment of fibromyalgia. a meta-analysis and review. Psychosomatics. 2000;41:104-113.
- Moore A, Wiffen P, Kalso E. Antiepileptic drugs for neuropathic pain and fibromyalgia. JAMA. 2014;312:182-183.
- Shevchenko A, Valdes-Rodriguez R, Yosipovitch G. Causes, pathophysiology, and treatment of pruritus in the mature patient. Clin Dermatol. 2018;36:140-151.
- Scheinfeld N. The role of gabapentin in treating diseases with cutaneous manifestations and pain. Int J Dermatol. 2003;42:491-495.
- Points Location Intelligence. Accessed July 30, 2024. https://points.co.il/en/points-location-intelligence/
- Yunus MB. The role of gender in fibromyalgia syndrome. Curr Rheumatol Rep. 2001;3:128-134.
- Cakir T, Evcik D, Dundar U, et al. Evaluation of sympathetic skin response and f wave in fibromyalgia syndrome patients. Turk J Rheumatol. 2011;26:38-43.
- Ozkan O, Yildiz M, Koklukaya E. The correlation of laboratory tests and sympathetic skin response parameters by using artificial neural networks in fibromyalgia patients. J Med Syst. 2012;36:1841-1848.
- Ozkan O, Yildiz M, Arslan E, et al. A study on the effects of sympathetic skin response parameters in diagnosis of fibromyalgia using artificial neural networks. J Med Syst. 2016;40:54.
- Ulas UH, Unlu E, Hamamcioglu K, et al. Dysautonomia in fibromyalgia syndrome: sympathetic skin responses and RR interval analysis. Rheumatol Int. 2006;26:383-387.
- Salemi S, Aeschlimann A, Wollina U, et al. Up-regulation of delta-opioid receptors and kappa-opioid receptors in the skin of fibromyalgia patients. Arthritis Rheum. 2007;56:2464-2466.
- Elshazzly M, Lopez MJ, Reddy V, et al. Central nervous system. StatPearls. StatPearls Publishing; 2022.
- Hu MS, Borrelli MR, Hong WX, et al. Embryonic skin development and repair. Organogenesis. 2018;14:46-63.
- Davidson S, Zhang X, Yoon CH, et al. The itch-producing agents histamine and cowhage activate separate populations of primate spinothalamic tract neurons. J Neurosci. 2007;27:10007-10014.
- Sikand P, Shimada SG, Green BG, et al. Similar itch and nociceptive sensations evoked by punctate cutaneous application of capsaicin, histamine and cowhage. Pain. 2009;144:66-75.
- Davidson S, Giesler GJ. The multiple pathways for itch and their interactions with pain. Trends Neurosci. 2010;33:550-558.
- Dhand A, Aminoff MJ. The neurology of itch. Brain. 2014;137:313-322.
- Binder A, Koroschetz J, Baron R. Disease mechanisms in neuropathic itch. Nat Clin Pract Neurol. 2008;4:329-337.
- Fjellner B, Arnetz BB. Psychological predictors of pruritus during mental stress. Acta Derm Venereol. 1985;65:504-508.
- Papoiu AD, Wang H, Coghill RC, et al. Contagious itch in humans: a study of visual ‘transmission’ of itch in atopic dermatitis and healthy subjects. Br J Dermatol. 2011;164:1299-1303.
- Stumpf A, Schneider G, Stander S. Psychosomatic and psychiatric disorders and psychologic factors in pruritus. Clin Dermatol. 2018;36:704-708.
- Herman JP, McKlveen JM, Ghosal S, et al. Regulation of the hypothalamic-pituitary-adrenocortical stress response. Compr Physiol. 2016;6:603-621.
- Brown ED, Micozzi MS, Craft NE, et al. Plasma carotenoids in normal men after a single ingestion of vegetables or purified beta-carotene. Am J Clin Nutr. 1989;49:1258-1265.
- Tey HL, Wallengren J, Yosipovitch G. Psychosomatic factors in pruritus. Clin Dermatol. 2013;31:31-40.
- Twycross R, Greaves MW, Handwerker H, et al. Itch: scratching more than the surface. QJM. 2003;96:7-26.
- Bernhard JD. Itch and pruritus: what are they, and how should itches be classified? Dermatol Ther. 2005;18:288-291.
- Enestrom S, Bengtsson A, Frodin T. Dermal IgG deposits and increase of mast cells in patients with fibromyalgia—relevant findings or epiphenomena? Scand J Rheumatol. 1997;26:308-313.
- Jeschonneck M, Grohmann G, Hein G, et al. Abnormal microcirculation and temperature in skin above tender points in patients with fibromyalgia. Rheumatology (Oxford). 2000;39:917-921.
- Görg M, Zeidler C, Pereira MP, et al. Generalized chronic pruritus with fibromyalgia. J Dtsch Dermatol Ges. 2021;19:909-911.
- Garibyan L, Chiou AS, Elmariah SB. Advanced aging skin and itch: addressing an unmet need. Dermatol Ther. 2013;26:92-103.
- Cohen KR, Frank J, Salbu RL, et al. Pruritus in the elderly: clinical approaches to the improvement of quality of life. P T. 2012;37:227-239.
- Tzadok R, Ablin JN. Current and emerging pharmacotherapy for fibromyalgia. Pain Res Manag. 2020; 2020:6541798.
- Wiffen PJ, Derry S, Moore RA, et al. Antiepileptic drugs for neuropathic pain and fibromyalgia—an overview of Cochrane reviews. Cochrane Database Syst Rev. 2013:CD010567.
Practice Points
- Dermatologists should be aware of the connection between fibromyalgia, pruritus, and related conditions to improve patient care.
- The association between fibromyalgia and pruritus underscores the importance of employing multidisciplinary treatment strategies for managing these conditions.
Distinguishing Generalized Bullous Fixed Drug Eruption From SJS/TEN: A Retrospective Study on Clinical and Demographic Features
To the Editor:
Generalized bullous fixed drug eruption (GBFDE) is a rare subtype of fixed drug eruption (FDE) that manifests as widespread blisters and erosions following exposure to a causative drug.1 Diagnostic criteria include involvement of at least 3 to 6 anatomic sites—head and neck, anterior trunk, posterior trunk, upper extremities, lower extremities, or genitalia—and more than 10% of the body surface area. It can be challenging to differentiate GBFDE from severe drug rashes such as Stevens-Johnson syndrome/toxic epidermal necrolysis (SJS/TEN) due to extensive body surface area involvement of blisters and erosions. Specific features distinguishing GBFDE from SJS/TEN include primary lesions consisting of larger erythematous to dusky, circular plaques that progress to bullae and coalesce into widespread erosions; history of FDE; lack of severe mucosal involvement; and better overall prognosis.2 Treatment typically involves discontinuation of the culprit medication and supportive care; evidence for systemic therapies is not well established.
Our study aimed to characterize the clinical and demographic features of GBFDE in our institution to highlight potential key differences between this diagnosis and SJS/TEN. An electronic medical record search was performed to identify patients who were clinically diagnosed with GBFDE at New York-Presbyterian/Weill Cornell Medical Center (New York, New York) in both outpatient and inpatient settings from January 2015 to December 2022. This retrospective study was approved by the Weill Cornell Medicine institutional review board (#22-05024777).
Ten patients were identified and included in the analysis (eTable). The mean age of the patients was 56 years (range, 39–76 years). Seven (70%) patients had skin of color (non-White) and 6 (60%) were female. The mean body mass index was 35 (range, 20–57), and 7 (70%) patients were clinically obese (body mass index >30). Only 2 (20%) patients had a history of a documented drug eruption (hives and erythema multiforme), and no patients had a history of FDE. Erythematous dusky patches followed by rapid development of blisters were noted within 3 days of drug initiation in 40% (4/10) and within 5 days in 80% (8/10) of patients. Antibiotics were identified as likely inciting agents in 8 (80%) patients. Biopsies were obtained in 3 (30%) patients and all 3 demonstrated cytotoxic CD8+ interface dermatitis with marked epithelial necrosis, neutrophilia, eosinophilia, and melanophage accumulation. Fever was present at initial presentation in only 4 (40%) patients, and only 1 (10%) patient had oral mucosal involvement. All 10 patients had intertriginous involvement (axillae, 90% [9/10]; gluteal cleft, 80% [8/10]; groin, 80% [8/10]; inframammary folds, 20% [2/10]), and there was considerable flank involvement in 9 (90%) patients. All 10 patients had initial erythematous to dusky, circular patches on the trunk and proximal extremities that then denuded most dramatically in the intertriginous areas (Figure). Six (60%) patients received systemic therapy, including 5 patients treated with a single dose of etanercept 50 mg. In patients with continued progression, 1 or 2 additional doses of etanercept 50 mg were administered at 48- to 72-hour intervals until blistering halted. Treatment with etanercept resulted in clinical improvement in all 5 patients, and there were no identifiable adverse events. The mean hospital stay was 19.7 days (range, 1–63 days).
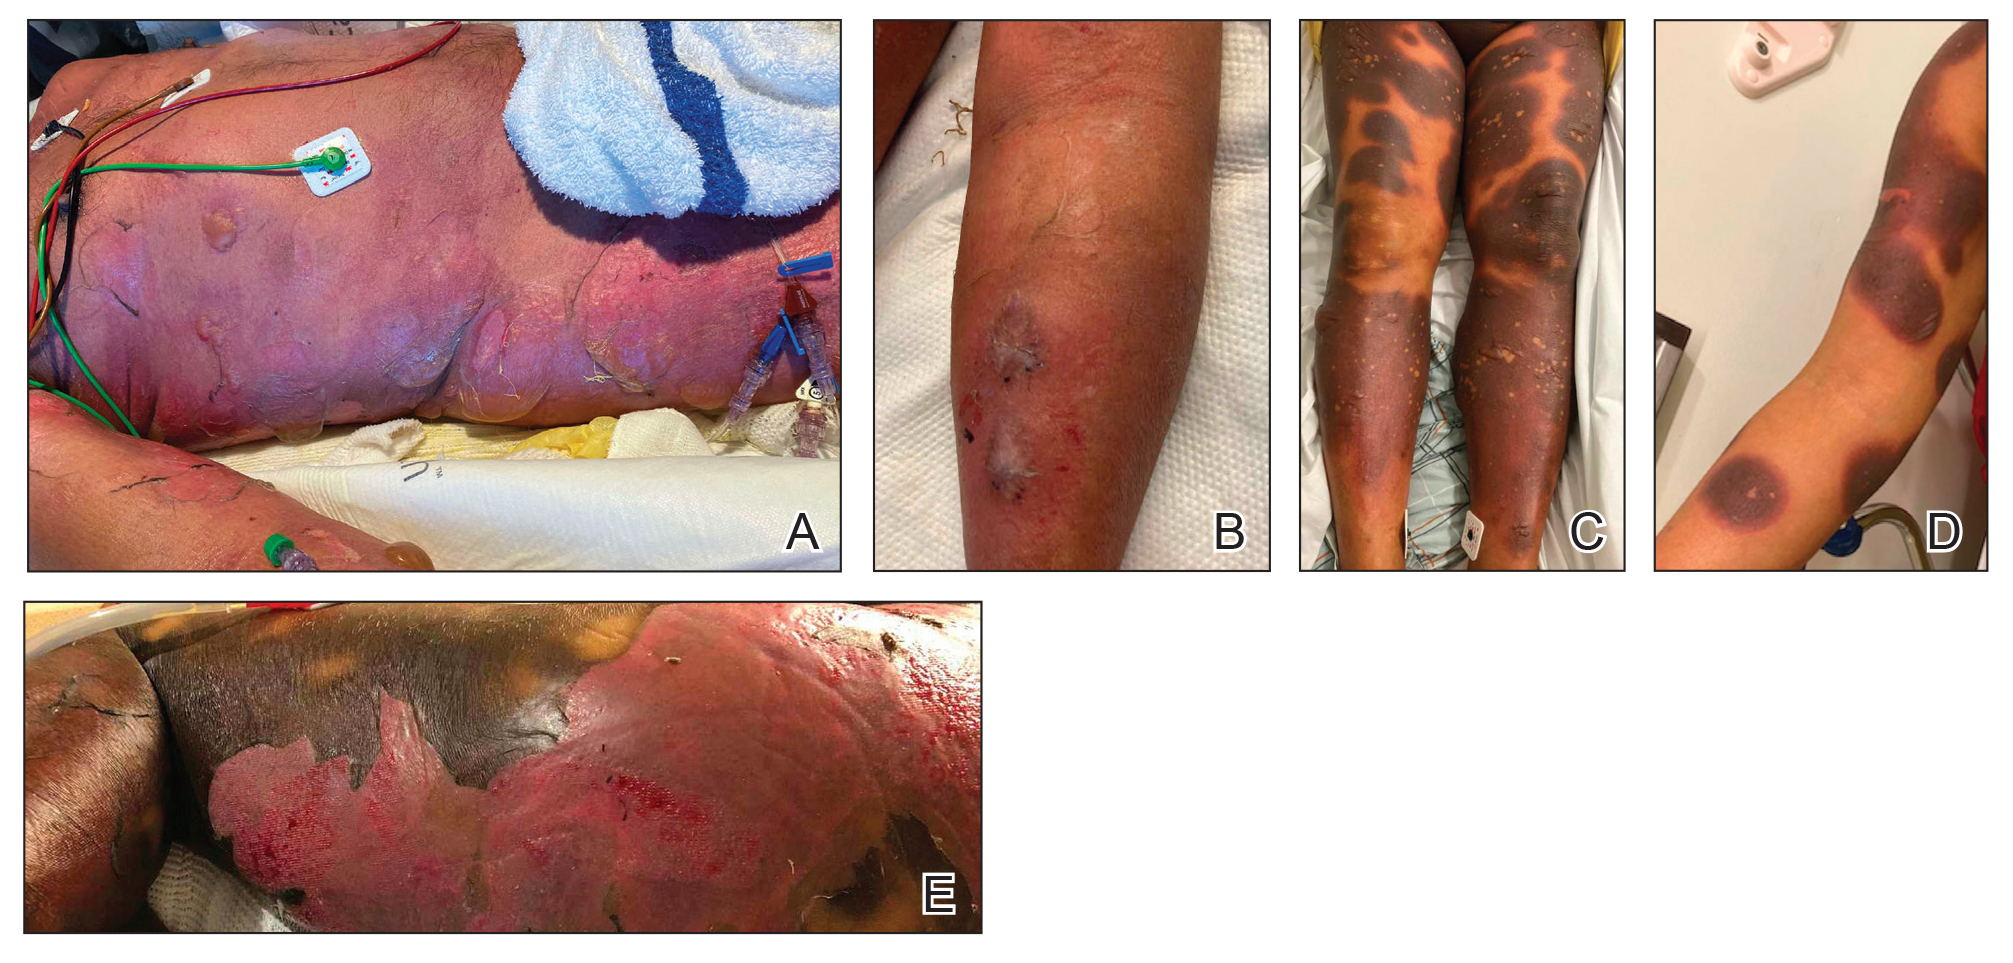
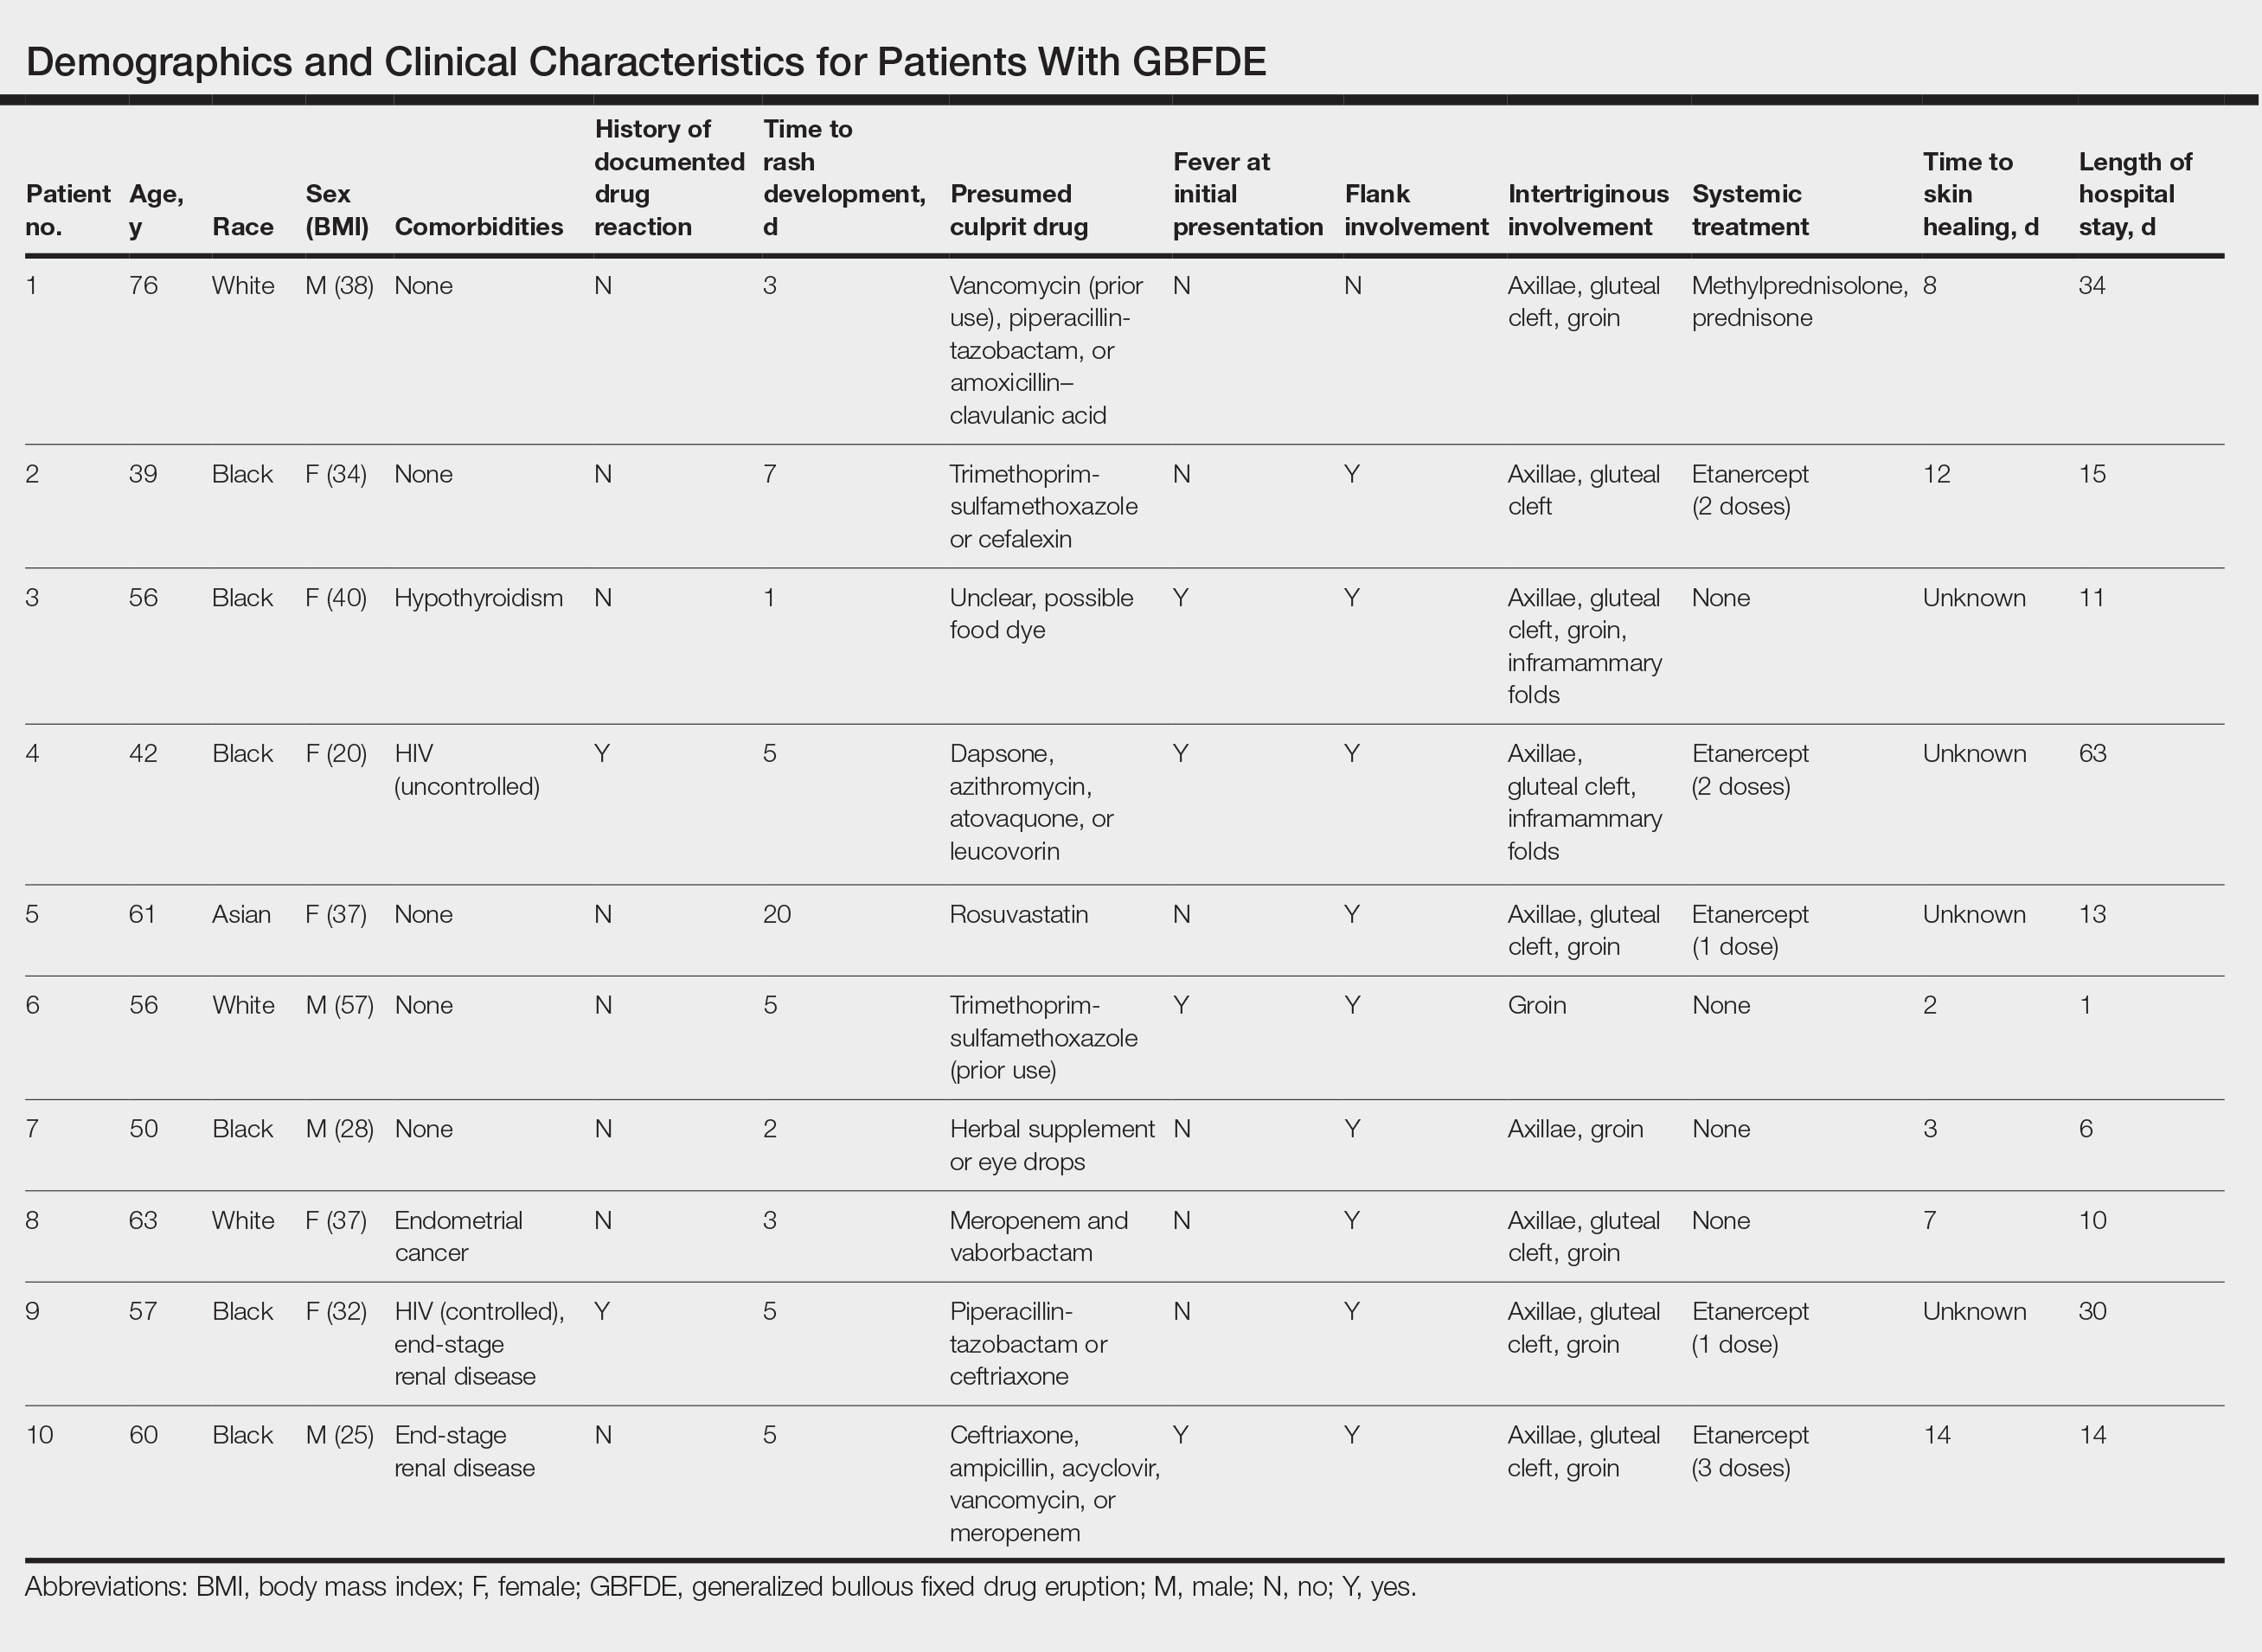
This study highlights notable demographic and clinical features of GBFDE that have not been widely described in the literature. Large erythematous and dusky patches with broad zones of blistering with particular localization to the neck, intertriginous areas, and flanks typically are not described in SJS/TEN and may be helpful in distinguishing these conditions from GBFDE. Mild or complete lack of mucosal and facial involvement as well as more rapid time from drug initiation to rash (as rapid as 1 day) were key factors that aided in distinguishing GBFDE from SJS/TEN in our patients. Although a history of FDE is considered a key characteristic in the diagnosis of GBFDE, none of our patients had a known history of FDE, suggesting GBFDE may be the initial manifestation of FDE in some patients. Histopathology showed similar findings consistent with FDE in the 3 patients in whom a biopsy was performed. The remaining patients were diagnosed clinically based on the presence of distinctive, perfectly circular, dusky plaques present at the periphery of larger denuded areas, which are characteristic of GBFDE. Lower levels of serum granulysin3 have been shown to help distinguish GBFDE from SJS/TEN, but this test is not readily available with time-sensitive results at most institutions, and exact diagnostic ranges for GBFDE vs SJS/TEN are not yet known.
Our study was limited by a small number of patients at a single institution. Another limitation was the retrospective design.
Interestingly, a high proportion of our patients were non-White and clinically obese, which are factors that should be considered for future research. Sixty percent (6/10) of the patients in our study were Black, which is a notable difference from our hospital’s general admission demographics with Black individuals constituting 12% of patients.4 Our study also highlighted the utility of etanercept, which has reported mortality benefits and decreased time to re-epithelialization in other severe blistering cutaneous drug reactions including SJS/TEN,5 as a potential therapeutic option in GBFDE.
It is imperative that clinicians recognize the differences between GBFDE and SJS/TEN, as correct diagnosis is crucial for identifying the most likely causative drug as well as providing accurate prognostic information and may have future therapeutic implications as we further understand the immunologic profiles of these severe blistering drug reactions.
- Patel S, John AM, Handler MZ, et al. Fixed drug eruptions: an update, emphasizing the potentially lethal generalized bullous fixed drug eruption. Am J Clin Dermatol. 2020;21:393-399. doi:10.1007/s40257-020-00505-3
- Anderson HJ, Lee JB. A review of fixed drug eruption with a special focus on generalized bullous fixed drug eruption. Medicina (Kaunas). 2021;57:925. doi:10.3390/medicina57090925
- Cho YT, Lin JW, Chen YC, et al. Generalized bullous fixed drug eruption is distinct from Stevens-Johnson syndrome/toxic epidermal necrolysis by immunohistopathological features. J Am Acad Dermatol. 2014;70:539-548. doi:10.1016/j.jaad.2013.11.015
- Tran T, Shapiro A. New York-Presbyterian 2022 Health Equity Report. New York-Presbyterian; 2023. Accessed July 22, 2024. https://nyp.widen.net/s/jqfbrvrf9p/dalio-center-2022-health-equity-report
- Dreyer SD, Torres J, Stoddard M, et al. Efficacy of etanercept in the treatment of Stevens-Johnson syndrome and toxic epidermal necrolysis. Cutis. 2021;107:E22-E28. doi:10.12788/cutis.0288
To the Editor:
Generalized bullous fixed drug eruption (GBFDE) is a rare subtype of fixed drug eruption (FDE) that manifests as widespread blisters and erosions following exposure to a causative drug.1 Diagnostic criteria include involvement of at least 3 to 6 anatomic sites—head and neck, anterior trunk, posterior trunk, upper extremities, lower extremities, or genitalia—and more than 10% of the body surface area. It can be challenging to differentiate GBFDE from severe drug rashes such as Stevens-Johnson syndrome/toxic epidermal necrolysis (SJS/TEN) due to extensive body surface area involvement of blisters and erosions. Specific features distinguishing GBFDE from SJS/TEN include primary lesions consisting of larger erythematous to dusky, circular plaques that progress to bullae and coalesce into widespread erosions; history of FDE; lack of severe mucosal involvement; and better overall prognosis.2 Treatment typically involves discontinuation of the culprit medication and supportive care; evidence for systemic therapies is not well established.
Our study aimed to characterize the clinical and demographic features of GBFDE in our institution to highlight potential key differences between this diagnosis and SJS/TEN. An electronic medical record search was performed to identify patients who were clinically diagnosed with GBFDE at New York-Presbyterian/Weill Cornell Medical Center (New York, New York) in both outpatient and inpatient settings from January 2015 to December 2022. This retrospective study was approved by the Weill Cornell Medicine institutional review board (#22-05024777).
Ten patients were identified and included in the analysis (eTable). The mean age of the patients was 56 years (range, 39–76 years). Seven (70%) patients had skin of color (non-White) and 6 (60%) were female. The mean body mass index was 35 (range, 20–57), and 7 (70%) patients were clinically obese (body mass index >30). Only 2 (20%) patients had a history of a documented drug eruption (hives and erythema multiforme), and no patients had a history of FDE. Erythematous dusky patches followed by rapid development of blisters were noted within 3 days of drug initiation in 40% (4/10) and within 5 days in 80% (8/10) of patients. Antibiotics were identified as likely inciting agents in 8 (80%) patients. Biopsies were obtained in 3 (30%) patients and all 3 demonstrated cytotoxic CD8+ interface dermatitis with marked epithelial necrosis, neutrophilia, eosinophilia, and melanophage accumulation. Fever was present at initial presentation in only 4 (40%) patients, and only 1 (10%) patient had oral mucosal involvement. All 10 patients had intertriginous involvement (axillae, 90% [9/10]; gluteal cleft, 80% [8/10]; groin, 80% [8/10]; inframammary folds, 20% [2/10]), and there was considerable flank involvement in 9 (90%) patients. All 10 patients had initial erythematous to dusky, circular patches on the trunk and proximal extremities that then denuded most dramatically in the intertriginous areas (Figure). Six (60%) patients received systemic therapy, including 5 patients treated with a single dose of etanercept 50 mg. In patients with continued progression, 1 or 2 additional doses of etanercept 50 mg were administered at 48- to 72-hour intervals until blistering halted. Treatment with etanercept resulted in clinical improvement in all 5 patients, and there were no identifiable adverse events. The mean hospital stay was 19.7 days (range, 1–63 days).
This study highlights notable demographic and clinical features of GBFDE that have not been widely described in the literature. Large erythematous and dusky patches with broad zones of blistering with particular localization to the neck, intertriginous areas, and flanks typically are not described in SJS/TEN and may be helpful in distinguishing these conditions from GBFDE. Mild or complete lack of mucosal and facial involvement as well as more rapid time from drug initiation to rash (as rapid as 1 day) were key factors that aided in distinguishing GBFDE from SJS/TEN in our patients. Although a history of FDE is considered a key characteristic in the diagnosis of GBFDE, none of our patients had a known history of FDE, suggesting GBFDE may be the initial manifestation of FDE in some patients. Histopathology showed similar findings consistent with FDE in the 3 patients in whom a biopsy was performed. The remaining patients were diagnosed clinically based on the presence of distinctive, perfectly circular, dusky plaques present at the periphery of larger denuded areas, which are characteristic of GBFDE. Lower levels of serum granulysin3 have been shown to help distinguish GBFDE from SJS/TEN, but this test is not readily available with time-sensitive results at most institutions, and exact diagnostic ranges for GBFDE vs SJS/TEN are not yet known.
Our study was limited by a small number of patients at a single institution. Another limitation was the retrospective design.
Interestingly, a high proportion of our patients were non-White and clinically obese, which are factors that should be considered for future research. Sixty percent (6/10) of the patients in our study were Black, which is a notable difference from our hospital’s general admission demographics with Black individuals constituting 12% of patients.4 Our study also highlighted the utility of etanercept, which has reported mortality benefits and decreased time to re-epithelialization in other severe blistering cutaneous drug reactions including SJS/TEN,5 as a potential therapeutic option in GBFDE.
It is imperative that clinicians recognize the differences between GBFDE and SJS/TEN, as correct diagnosis is crucial for identifying the most likely causative drug as well as providing accurate prognostic information and may have future therapeutic implications as we further understand the immunologic profiles of these severe blistering drug reactions.
- Patel S, John AM, Handler MZ, et al. Fixed drug eruptions: an update, emphasizing the potentially lethal generalized bullous fixed drug eruption. Am J Clin Dermatol. 2020;21:393-399. doi:10.1007/s40257-020-00505-3
- Anderson HJ, Lee JB. A review of fixed drug eruption with a special focus on generalized bullous fixed drug eruption. Medicina (Kaunas). 2021;57:925. doi:10.3390/medicina57090925
- Cho YT, Lin JW, Chen YC, et al. Generalized bullous fixed drug eruption is distinct from Stevens-Johnson syndrome/toxic epidermal necrolysis by immunohistopathological features. J Am Acad Dermatol. 2014;70:539-548. doi:10.1016/j.jaad.2013.11.015
- Tran T, Shapiro A. New York-Presbyterian 2022 Health Equity Report. New York-Presbyterian; 2023. Accessed July 22, 2024. https://nyp.widen.net/s/jqfbrvrf9p/dalio-center-2022-health-equity-report
- Dreyer SD, Torres J, Stoddard M, et al. Efficacy of etanercept in the treatment of Stevens-Johnson syndrome and toxic epidermal necrolysis. Cutis. 2021;107:E22-E28. doi:10.12788/cutis.0288
PRACTICE POINTS
- Distinguishing features of generalized bullous fixed
drug eruption (GBFDE) may include truncal and proximal predilection with early intertriginous blistering. - Etanercept is a viable treatment option for GBFDE.
A Crisis in Scope: Recruitment and Retention Challenges Reported by VA Gastroenterology Section Chiefs
Veterans have a high burden of digestive diseases, and gastroenterologists are needed for the diagnosis and management of these conditions.1-4 According to the Veterans Health Administration (VHA) Workforce Management and Consulting (WMC) office, the physician specialties with the greatest shortages are psychiatry, primary care, and gastroenterology.5 The VHA estimates it must hire 70 new gastroenterologists annually between fiscal years 2023 and 2027 to provide timely digestive care.5
Filling these positions will be increasingly difficult as competition for gastroenterologists is fierce. A recent Merritt Hawkins review states, “Gastroenterologists were the most in-demand type of provider during the 2022 review period.”6 In 2022, the median annual salary for US gastroenterologists was reported to be $561,375.7 Currently, the US Department of Veterans Affairs (VA) has an aggregate annual pay limit of $400,000 for all federal employees and cannot compete based on salary alone.
Retention of existing VA gastroenterologists also is challenging. The WMC has reported that 21.6% of VA gastroenterologists are eligible to retire, and in 2021, 8.2% left the VA to retire or seek non-VA positions.5 While not specific to the VA, a survey of practicing gastroenterologists conducted by the American College of Gastroenterology found a 49% burnout rate among respondents.8 Factors contributing to burnout at all career stages included administrative nonclinical work and a lack of clinical support staff.8 Burnout is also linked with higher rates of medical errors, interpersonal conflicts, and patient dissatisfaction. Burnout is more common among those with an innate strong sense of purpose and responsibility for their patients, characteristics we have observed in our VA colleagues.9
As members of the Section Chief Subcommittee of the VA Gastroenterology Field Advisory Board (GI FAB), we are passionate about providing outstanding gastroenterology care to US veterans, and we are alarmed at the struggles we are observing with recruiting and retaining a qualified national gastroenterology physician workforce. As such, we set out to survey the VA gastroenterology section chief community to gain insights into recruitment and retention challenges they have faced and identify potential solutions to these problems.
Methods
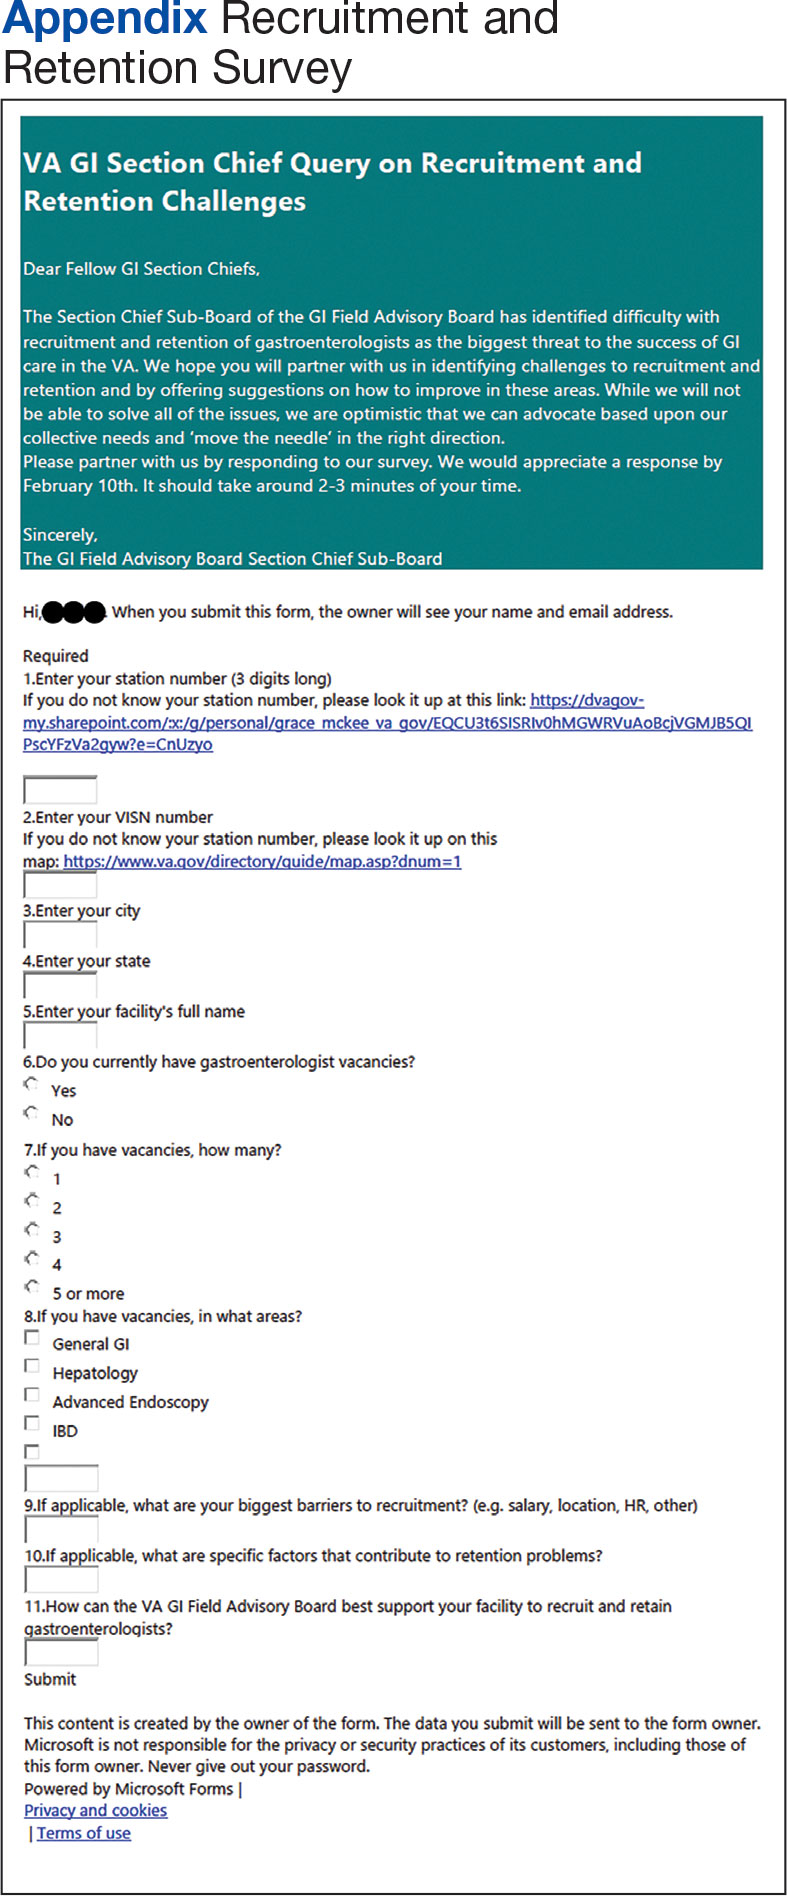
The GI FAB Section Chief Subcommittee developed a survey on gastroenterologist recruitment and retention using Microsoft Forms (Appendix). A link to the survey, which included 11 questions about facility location, current vacancies, and free text responses on barriers to recruitment and retention and potential solutions, was sent via email to all gastroenterology section chiefs on the National Gastroenterology and Hepatology Program Office’s email list of section chiefs on January 31, 2023. A reminder to complete the survey was sent to all section chiefs on February 8, 2023. Survey responses were aggregated and analyzed by the authors using descriptive statistics.
Results
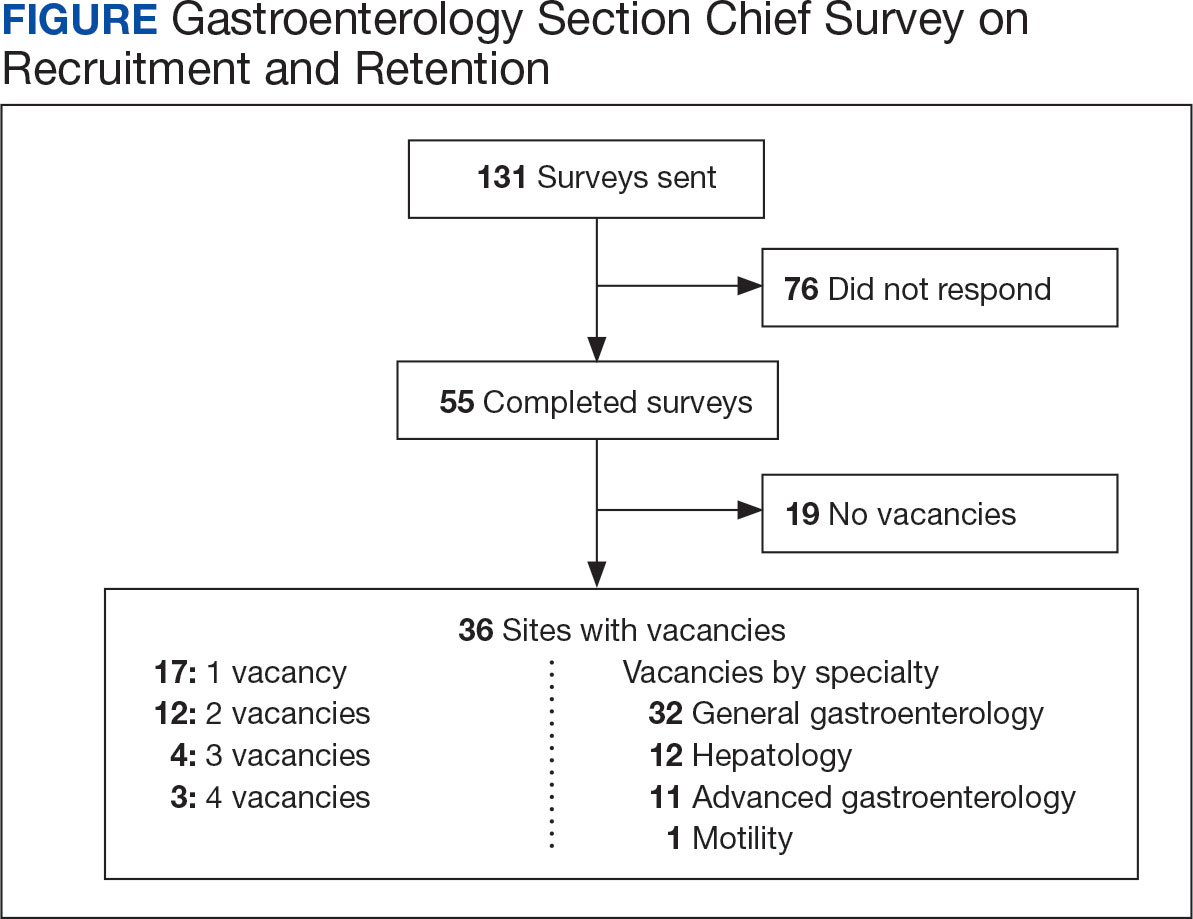
The VA gastroenterologist recruitment and retention survey was emailed to 131 gastroenterology section chiefs and completed by 55 respondents (42%) (Figure). Of the responding section chiefs, 36 (65%) reported gastroenterologist vacancies at their facilities. Seventeen respondents (47%) reported a single vacancy, 12 (33%) reported 2 vacancies, 4 (11%) reported 3 vacancies, and 3 (8%) reported 4 vacancies. Of the sites with reported vacancies, 32 (89%) reported a need for a general gastroenterologist, 12 (33%) reported a need for a hepatologist, 11 (31%) reported a need for an advanced endoscopist, 9 (25%) reported a need for a gastroenterologist with specialized expertise in inflammatory bowel diseases, and 1 (3%) reported a need for a gastrointestinal motility specialist.
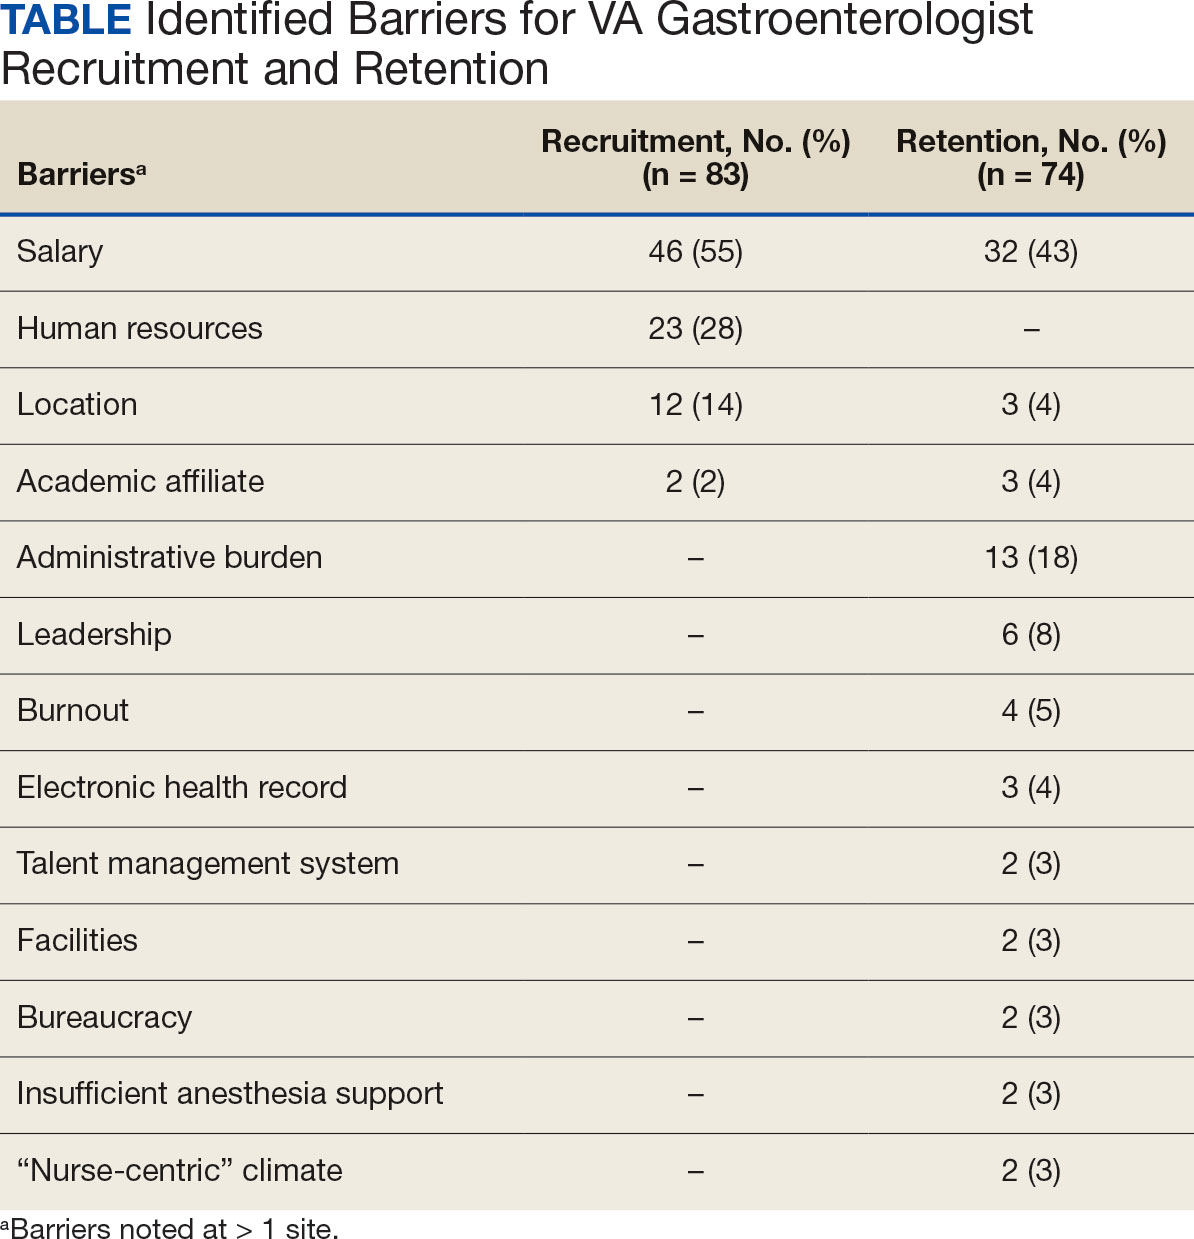
Numerous barriers to the recruitment and retention of gastroenterologists were reported. Given the large number of respondents that reported a unique barrier (ie, being the only respondents to report the barrier), a decision was made to include only barriers to recruitment and retention that were reported by at least 2 sites (Table). While there were some common themes, the reported barriers to retention differed from those to recruitment. The most reported barriers to recruitment were 46 respondents who noted salary, 23 reported human resources-related challenges, and 12 reported location. Respondents also noted various retention barriers, including 32 respondents who reported salary barriers; 13 reported administrative burden barriers, 6 reported medical center leadership, and 4 reported burnout.
Survey respondents provided multiple recommendations on how the VA can best support the recruitment and retention of gastroenterologists. The most frequent recommendations were to increase financial compensation by increasing the current aggregate salary cap to > $400,000, increasing the use of recruitment and retention incentives, and ensuring that gastroenterology is on the national Educational Debt Reduction Program (EDRP) list, which facilitates student loan repayment. It was recommended that a third-party company assist with hiring to overcome perceived issues with human resources. Additionally, there were multiple recommendations for improving administrative and clinical support. These included mandating how many support staff should be assigned to each gastroenterologist and providing best practice recommendations for support staff so that gastroenterologists can focus on physician-level work. Recommendations also included having a dedicated gastroenterology practice manager, nurse care coordinators, a colorectal cancer screening/surveillance coordinator, sufficient medical support assistants, and quality improvement personnel tracking ongoing professional practice evaluation data. Survey respondents also highlighted specific suggestions for recruiting recent graduates. These included offering a 4-day work week, as recent graduates place a premium on work-life balance, and ensuring gastroenterologists have individual offices. One respondent commented that gastroenterology fellows seeing VA gastroenterology attendings in cramped, shared offices, contrasted with private practice gastroenterologists in large private offices, may contribute to choosing private practice over joining the VA.
Discussion
Gastroenterology is currently listed by VHA WMC as 1 of the top 3 medical specialties in the VA with the most physician shortages.5 Working as a physician in the VA has long been recognized to have many benefits. First and foremost, many physicians are motivated by the VA mission to serve veterans, as this offers personal fulfillment and other intangible benefits. In addition, the VA can provide work-life balance, which is often not possible in fee-for-service settings, with patient panels and call volumes typically lower than in comparable private hospital settings. Moreover, VA physicians have outstanding teaching opportunities, as the VA is the largest supporter of medical education, with postgraduate trainees rotating through > 150 VA medical centers. Likewise, the VA offers a variety of student loan repayment programs (eg, the Specialty Education Loan Repayment Program and the EDRP). The VA offers research funding such as the Cooperative Studies Programs or program project funding, and rewards in parallel with the National Institute of Health (eg, career development awards, or merit review awards) and other grants. VA researchers have conducted many landmark studies that continue to shape the practice of gastroenterology and hepatology. From the earliest studies to demonstrate the effectiveness of screening colonoscopy, to the largest ongoing clinical trial in US history to assess the effectiveness of fecal immunochemical testing (FIT) vs screening colonoscopy.10-12 The VA has also led the field in the study of gastroesophageal reflux disease, hepatitis C treatment, and liver cancer screening.13-15 VA physicians also benefit from participation in the Federal Employee Retirement System, including its pension system.
These benefits apply to all medical specialties, making the VA a potentially appealing workplace for gastroenterologists. However, recent trends indicate that recruitment and retention of gastroenterologists is increasingly challenging, as the VA gastroenterology workforce grew by 5.0% in fiscal year (FY) 2020 and 1.8% in FY 2021. However, it was on track to end FY 2022 with a loss (-1.1%).5 It must be noted that this trend is not limited to the VA, and the National Center for Health Workforce Analysis predicts that gastroenterology will remain among the highest projected specialty shortages. Driven by increased demand for digestive health care services, more physicians nearing traditional retirement age, and substantially higher rates of burnout after the COVID-19 pandemic.16 All these factors are likely to result in an increasingly competitive market for gastroenterology, highlight the growing differences between VA and non-VA positions, and may augment the impact of differences for the individual gastroenterologist weighing employment options within and outside the VA.
The survey responses from VA gastroenterology section chiefs help identify potential impediments to the successful recruitment and retention in the specialty. Noncompetitive salary was the most significant barrier to the successful recruitment of gastroenterologists, identified by 46 of 55 respondents. According to a 2022 Medical Group Management Association report, the median annual salary for US gastroenterologists was $561,375.7 According to internal VA WMC data, the median 2022 VA gastroenterologist salary ranged between $287,976 and $346,435, depending on facility complexity level, excluding recruitment, retention, or relocation bonuses; performance pay; or cash awards. The current aggregate salary cap of $400,000 indicates that the VHA will likely be increasingly noncompetitive in the coming years unless novel pay authorizations are implemented.
Suboptimal human resources were the second most commonly cited impediment to recruiting gastroenterologists. Many section chiefs expressed frustration with the inefficient and slow administrative process of onboarding new gastroenterologists, which may take many months and not infrequently results in losing candidates to competing entities. While this issue is specific to recruitment, recurring and long-standing vacancies can increase work burdens, complicate logistics for remaining faculty, and may also negatively impact retention. One potential opportunity to improve VHA competitiveness is to streamline the administrative component of recruitment and optimize human resources support. The use of a third-party hiring company also should be considered.
Survey responses also indicated that administrative burden and insufficient support staff were significant retention challenges. Several respondents described a lack of efficient endoscopy workflow and delegation of simple administrative tasks to gastroenterologists as more likely in units without proper task distribution. Importantly, these shortcomings occur at the expense of workload-generating activities and career-enhancing opportunities.
While burnout rates among VA gastroenterologists have not been documented systematically, they likely correlate with workplace frustration and jeopardizegastroenterologist retention. Successful retention of gastroenterologists as highly trained medical professionals is more likely in workplaces that are vertically organized, efficient, and use physicians at the top of their skill level.
Conclusions
The VA offers the opportunity for a rewarding lifelong career in gastroenterology. The fulfillment of serving veterans, teaching future health care leaders, performing impactful research, and having job security is invaluable. Despite the tremendous benefits, this survey supports improving VA recruitment and retention strategies for the high-demand gastroenterology specialty. Improved salary parity is needed for workforce maintenance and recruitment, as is improved administrative and clinical support to maintain the high level of care our veterans deserve.
1. Shin A, Xu H, Imperiale TF. The prevalence, humanistic burden, and health care impact of irritable bowel syndrome among united states veterans. Clin Gastroenterol Hepatol. 2023;21(4):1061-1069.e1. doi:10.1016/j.cgh.2022.08.005.
2. Kent KG. Prevalence of gastrointestinal disease in US military veterans under outpatient care at the veterans health administration. SAGE Open Med. 2021;9:20503121211049112. doi:10.1177/20503121211049112
3. Beste LA, Leipertz SL, Green PK, Dominitz JA, Ross D, Ioannou GN. Trends in burden of cirrhosis and hepatocellular carcinoma by underlying liver disease in US veterans, 2001-2013. Gastroenterology. 2015;149(6):1471-e18. doi:10.1053/j.gastro.2015.07.056
4. Zullig LL, Sims KJ, McNeil R, et al. Cancer incidence among patients of the U.S. veterans affairs health care system: 2010 update. Mil Med. 2017;182(7):e1883-e1891. doi:10.7205/MILMED-D-16-00371
5. VHA Physician Workforce Resources Blueprint. US Dept of Veterans Affairs. https://dvagov.sharepoint.com/sites/WMCPortal/WFP/Documents/Reports/VHA Physician Workforce Resources Blueprint FY 23-27.pdf [Source not verified]
6. AMN Healthcare. 2022 Review of Physician and Advanced Practitioner Recruiting Incentives. Accessed June 12, 2024. https://www1.amnhealthcare.com/l/123142/2022-07-13/q6ywxg/123142/1657737392vyuONaZZ/mha2022incentivesurgraphic.pdf
7. Medical Group Management Association. MGMA DataDive Provider Compensation Data. Accessed June 12, 2024. https://www.mgma.com/datadive/provider-compensation
8. Anderson JC, Bilal M, Burke CA, et al. Burnout among US gastroenterologists and fellows in training: identifying contributing factors and offering solutions. J Clin Gastroenterol. 2023;57(10):1063-1069. doi:10.1097/MCG.0000000000001781
9. Lacy BE, Chan JL. Physician burnout: the hidden health care crisis. Clin Gastroenterol Hepatol. 2018;16(3):311-317. doi:10.1016/j.cgh.2017.06.043
10. Lieberman DA, Weiss DG, Bond JH, Ahnen DJ, Garewal H, Chejfec G. Use of colonoscopy to screen asymptomatic adults for colorectal cancer. Veterans affairs cooperative study group 380. N Engl J Med. 2000;343(3):162-168. doi:10.1056/NEJM200007203430301
11. Lieberman DA, Weiss DG; Veterans Affairs Cooperative Study Group 380. One-time screening for colorectal cancer with combined fecal occult-blood testing and examination of the distal colon. N Engl J Med. 2001;345(8):555-560. doi:10.1056/NEJMoa010328
12. Robertson DJ, Dominitz JA, Beed A, et al. Baseline features and reasons for nonparticipation in the colonoscopy versus fecal immunochemical test in reducing mortality from colorectal cancer (CONFIRM) study, a colorectal cancer screening trial. JAMA Netw Open. 2023;6(7):e2321730. doi:10.1001/jamanetworkopen.2023.21730
13. Spechler SJ, Hunter JG, Jones KM, et al. Randomized trial of medical versus surgical treatment for refractory heartburn. N Engl J Med. 2019;381(16):1513-1523. doi:10.1056/NEJMoa1811424
14. Beste LA, Green PK, Berry K, Kogut MJ, Allison SK, Ioannou GN. Effectiveness of hepatitis C antiviral treatment in a USA cohort of veteran patients with hepatocellular carcinoma. J Hepatol. 2017;67(1):32-39. doi:10.1016/j.jhep.2017.02.027
15. US Department of Veterans Affairs. Veterans affairs cooperative studies program (CSP). CSP #2023. Updated July 2022. Accessed June 12, 2024. https://www.vacsp.research.va.gov/CSP_2023/CSP_2023.asp
16. US Health Resources & Services Administration. Workforce projections. Accessed June 12, 2024. https://data.hrsa.gov/topics/health-workforce/workforce-projections
Veterans have a high burden of digestive diseases, and gastroenterologists are needed for the diagnosis and management of these conditions.1-4 According to the Veterans Health Administration (VHA) Workforce Management and Consulting (WMC) office, the physician specialties with the greatest shortages are psychiatry, primary care, and gastroenterology.5 The VHA estimates it must hire 70 new gastroenterologists annually between fiscal years 2023 and 2027 to provide timely digestive care.5
Filling these positions will be increasingly difficult as competition for gastroenterologists is fierce. A recent Merritt Hawkins review states, “Gastroenterologists were the most in-demand type of provider during the 2022 review period.”6 In 2022, the median annual salary for US gastroenterologists was reported to be $561,375.7 Currently, the US Department of Veterans Affairs (VA) has an aggregate annual pay limit of $400,000 for all federal employees and cannot compete based on salary alone.
Retention of existing VA gastroenterologists also is challenging. The WMC has reported that 21.6% of VA gastroenterologists are eligible to retire, and in 2021, 8.2% left the VA to retire or seek non-VA positions.5 While not specific to the VA, a survey of practicing gastroenterologists conducted by the American College of Gastroenterology found a 49% burnout rate among respondents.8 Factors contributing to burnout at all career stages included administrative nonclinical work and a lack of clinical support staff.8 Burnout is also linked with higher rates of medical errors, interpersonal conflicts, and patient dissatisfaction. Burnout is more common among those with an innate strong sense of purpose and responsibility for their patients, characteristics we have observed in our VA colleagues.9
As members of the Section Chief Subcommittee of the VA Gastroenterology Field Advisory Board (GI FAB), we are passionate about providing outstanding gastroenterology care to US veterans, and we are alarmed at the struggles we are observing with recruiting and retaining a qualified national gastroenterology physician workforce. As such, we set out to survey the VA gastroenterology section chief community to gain insights into recruitment and retention challenges they have faced and identify potential solutions to these problems.
Methods
The GI FAB Section Chief Subcommittee developed a survey on gastroenterologist recruitment and retention using Microsoft Forms (Appendix). A link to the survey, which included 11 questions about facility location, current vacancies, and free text responses on barriers to recruitment and retention and potential solutions, was sent via email to all gastroenterology section chiefs on the National Gastroenterology and Hepatology Program Office’s email list of section chiefs on January 31, 2023. A reminder to complete the survey was sent to all section chiefs on February 8, 2023. Survey responses were aggregated and analyzed by the authors using descriptive statistics.
Results
The VA gastroenterologist recruitment and retention survey was emailed to 131 gastroenterology section chiefs and completed by 55 respondents (42%) (Figure). Of the responding section chiefs, 36 (65%) reported gastroenterologist vacancies at their facilities. Seventeen respondents (47%) reported a single vacancy, 12 (33%) reported 2 vacancies, 4 (11%) reported 3 vacancies, and 3 (8%) reported 4 vacancies. Of the sites with reported vacancies, 32 (89%) reported a need for a general gastroenterologist, 12 (33%) reported a need for a hepatologist, 11 (31%) reported a need for an advanced endoscopist, 9 (25%) reported a need for a gastroenterologist with specialized expertise in inflammatory bowel diseases, and 1 (3%) reported a need for a gastrointestinal motility specialist.
Numerous barriers to the recruitment and retention of gastroenterologists were reported. Given the large number of respondents that reported a unique barrier (ie, being the only respondents to report the barrier), a decision was made to include only barriers to recruitment and retention that were reported by at least 2 sites (Table). While there were some common themes, the reported barriers to retention differed from those to recruitment. The most reported barriers to recruitment were 46 respondents who noted salary, 23 reported human resources-related challenges, and 12 reported location. Respondents also noted various retention barriers, including 32 respondents who reported salary barriers; 13 reported administrative burden barriers, 6 reported medical center leadership, and 4 reported burnout.
Survey respondents provided multiple recommendations on how the VA can best support the recruitment and retention of gastroenterologists. The most frequent recommendations were to increase financial compensation by increasing the current aggregate salary cap to > $400,000, increasing the use of recruitment and retention incentives, and ensuring that gastroenterology is on the national Educational Debt Reduction Program (EDRP) list, which facilitates student loan repayment. It was recommended that a third-party company assist with hiring to overcome perceived issues with human resources. Additionally, there were multiple recommendations for improving administrative and clinical support. These included mandating how many support staff should be assigned to each gastroenterologist and providing best practice recommendations for support staff so that gastroenterologists can focus on physician-level work. Recommendations also included having a dedicated gastroenterology practice manager, nurse care coordinators, a colorectal cancer screening/surveillance coordinator, sufficient medical support assistants, and quality improvement personnel tracking ongoing professional practice evaluation data. Survey respondents also highlighted specific suggestions for recruiting recent graduates. These included offering a 4-day work week, as recent graduates place a premium on work-life balance, and ensuring gastroenterologists have individual offices. One respondent commented that gastroenterology fellows seeing VA gastroenterology attendings in cramped, shared offices, contrasted with private practice gastroenterologists in large private offices, may contribute to choosing private practice over joining the VA.
Discussion
Gastroenterology is currently listed by VHA WMC as 1 of the top 3 medical specialties in the VA with the most physician shortages.5 Working as a physician in the VA has long been recognized to have many benefits. First and foremost, many physicians are motivated by the VA mission to serve veterans, as this offers personal fulfillment and other intangible benefits. In addition, the VA can provide work-life balance, which is often not possible in fee-for-service settings, with patient panels and call volumes typically lower than in comparable private hospital settings. Moreover, VA physicians have outstanding teaching opportunities, as the VA is the largest supporter of medical education, with postgraduate trainees rotating through > 150 VA medical centers. Likewise, the VA offers a variety of student loan repayment programs (eg, the Specialty Education Loan Repayment Program and the EDRP). The VA offers research funding such as the Cooperative Studies Programs or program project funding, and rewards in parallel with the National Institute of Health (eg, career development awards, or merit review awards) and other grants. VA researchers have conducted many landmark studies that continue to shape the practice of gastroenterology and hepatology. From the earliest studies to demonstrate the effectiveness of screening colonoscopy, to the largest ongoing clinical trial in US history to assess the effectiveness of fecal immunochemical testing (FIT) vs screening colonoscopy.10-12 The VA has also led the field in the study of gastroesophageal reflux disease, hepatitis C treatment, and liver cancer screening.13-15 VA physicians also benefit from participation in the Federal Employee Retirement System, including its pension system.
These benefits apply to all medical specialties, making the VA a potentially appealing workplace for gastroenterologists. However, recent trends indicate that recruitment and retention of gastroenterologists is increasingly challenging, as the VA gastroenterology workforce grew by 5.0% in fiscal year (FY) 2020 and 1.8% in FY 2021. However, it was on track to end FY 2022 with a loss (-1.1%).5 It must be noted that this trend is not limited to the VA, and the National Center for Health Workforce Analysis predicts that gastroenterology will remain among the highest projected specialty shortages. Driven by increased demand for digestive health care services, more physicians nearing traditional retirement age, and substantially higher rates of burnout after the COVID-19 pandemic.16 All these factors are likely to result in an increasingly competitive market for gastroenterology, highlight the growing differences between VA and non-VA positions, and may augment the impact of differences for the individual gastroenterologist weighing employment options within and outside the VA.
The survey responses from VA gastroenterology section chiefs help identify potential impediments to the successful recruitment and retention in the specialty. Noncompetitive salary was the most significant barrier to the successful recruitment of gastroenterologists, identified by 46 of 55 respondents. According to a 2022 Medical Group Management Association report, the median annual salary for US gastroenterologists was $561,375.7 According to internal VA WMC data, the median 2022 VA gastroenterologist salary ranged between $287,976 and $346,435, depending on facility complexity level, excluding recruitment, retention, or relocation bonuses; performance pay; or cash awards. The current aggregate salary cap of $400,000 indicates that the VHA will likely be increasingly noncompetitive in the coming years unless novel pay authorizations are implemented.
Suboptimal human resources were the second most commonly cited impediment to recruiting gastroenterologists. Many section chiefs expressed frustration with the inefficient and slow administrative process of onboarding new gastroenterologists, which may take many months and not infrequently results in losing candidates to competing entities. While this issue is specific to recruitment, recurring and long-standing vacancies can increase work burdens, complicate logistics for remaining faculty, and may also negatively impact retention. One potential opportunity to improve VHA competitiveness is to streamline the administrative component of recruitment and optimize human resources support. The use of a third-party hiring company also should be considered.
Survey responses also indicated that administrative burden and insufficient support staff were significant retention challenges. Several respondents described a lack of efficient endoscopy workflow and delegation of simple administrative tasks to gastroenterologists as more likely in units without proper task distribution. Importantly, these shortcomings occur at the expense of workload-generating activities and career-enhancing opportunities.
While burnout rates among VA gastroenterologists have not been documented systematically, they likely correlate with workplace frustration and jeopardizegastroenterologist retention. Successful retention of gastroenterologists as highly trained medical professionals is more likely in workplaces that are vertically organized, efficient, and use physicians at the top of their skill level.
Conclusions
The VA offers the opportunity for a rewarding lifelong career in gastroenterology. The fulfillment of serving veterans, teaching future health care leaders, performing impactful research, and having job security is invaluable. Despite the tremendous benefits, this survey supports improving VA recruitment and retention strategies for the high-demand gastroenterology specialty. Improved salary parity is needed for workforce maintenance and recruitment, as is improved administrative and clinical support to maintain the high level of care our veterans deserve.
1. Shin A, Xu H, Imperiale TF. The prevalence, humanistic burden, and health care impact of irritable bowel syndrome among united states veterans. Clin Gastroenterol Hepatol. 2023;21(4):1061-1069.e1. doi:10.1016/j.cgh.2022.08.005.
2. Kent KG. Prevalence of gastrointestinal disease in US military veterans under outpatient care at the veterans health administration. SAGE Open Med. 2021;9:20503121211049112. doi:10.1177/20503121211049112
3. Beste LA, Leipertz SL, Green PK, Dominitz JA, Ross D, Ioannou GN. Trends in burden of cirrhosis and hepatocellular carcinoma by underlying liver disease in US veterans, 2001-2013. Gastroenterology. 2015;149(6):1471-e18. doi:10.1053/j.gastro.2015.07.056
4. Zullig LL, Sims KJ, McNeil R, et al. Cancer incidence among patients of the U.S. veterans affairs health care system: 2010 update. Mil Med. 2017;182(7):e1883-e1891. doi:10.7205/MILMED-D-16-00371
5. VHA Physician Workforce Resources Blueprint. US Dept of Veterans Affairs. https://dvagov.sharepoint.com/sites/WMCPortal/WFP/Documents/Reports/VHA Physician Workforce Resources Blueprint FY 23-27.pdf [Source not verified]
6. AMN Healthcare. 2022 Review of Physician and Advanced Practitioner Recruiting Incentives. Accessed June 12, 2024. https://www1.amnhealthcare.com/l/123142/2022-07-13/q6ywxg/123142/1657737392vyuONaZZ/mha2022incentivesurgraphic.pdf
7. Medical Group Management Association. MGMA DataDive Provider Compensation Data. Accessed June 12, 2024. https://www.mgma.com/datadive/provider-compensation
8. Anderson JC, Bilal M, Burke CA, et al. Burnout among US gastroenterologists and fellows in training: identifying contributing factors and offering solutions. J Clin Gastroenterol. 2023;57(10):1063-1069. doi:10.1097/MCG.0000000000001781
9. Lacy BE, Chan JL. Physician burnout: the hidden health care crisis. Clin Gastroenterol Hepatol. 2018;16(3):311-317. doi:10.1016/j.cgh.2017.06.043
10. Lieberman DA, Weiss DG, Bond JH, Ahnen DJ, Garewal H, Chejfec G. Use of colonoscopy to screen asymptomatic adults for colorectal cancer. Veterans affairs cooperative study group 380. N Engl J Med. 2000;343(3):162-168. doi:10.1056/NEJM200007203430301
11. Lieberman DA, Weiss DG; Veterans Affairs Cooperative Study Group 380. One-time screening for colorectal cancer with combined fecal occult-blood testing and examination of the distal colon. N Engl J Med. 2001;345(8):555-560. doi:10.1056/NEJMoa010328
12. Robertson DJ, Dominitz JA, Beed A, et al. Baseline features and reasons for nonparticipation in the colonoscopy versus fecal immunochemical test in reducing mortality from colorectal cancer (CONFIRM) study, a colorectal cancer screening trial. JAMA Netw Open. 2023;6(7):e2321730. doi:10.1001/jamanetworkopen.2023.21730
13. Spechler SJ, Hunter JG, Jones KM, et al. Randomized trial of medical versus surgical treatment for refractory heartburn. N Engl J Med. 2019;381(16):1513-1523. doi:10.1056/NEJMoa1811424
14. Beste LA, Green PK, Berry K, Kogut MJ, Allison SK, Ioannou GN. Effectiveness of hepatitis C antiviral treatment in a USA cohort of veteran patients with hepatocellular carcinoma. J Hepatol. 2017;67(1):32-39. doi:10.1016/j.jhep.2017.02.027
15. US Department of Veterans Affairs. Veterans affairs cooperative studies program (CSP). CSP #2023. Updated July 2022. Accessed June 12, 2024. https://www.vacsp.research.va.gov/CSP_2023/CSP_2023.asp
16. US Health Resources & Services Administration. Workforce projections. Accessed June 12, 2024. https://data.hrsa.gov/topics/health-workforce/workforce-projections
Paclitaxel Drug-Drug Interactions in the Military Health System
Background
Paclitaxel was first derived from the bark of the yew tree (Taxus brevifolia). It was discovered as part of a National Cancer Institute program screen of plants and natural products with putative anticancer activity during the 1960s.1-9 Paclitaxel works by suppressing spindle microtube dynamics, which results in the blockage of the metaphase-anaphase transitions, inhibition of mitosis, and induction of apoptosis in a broad spectrum of cancer cells. Paclitaxel also displayed additional anticancer activities, including the suppression of cell proliferation and antiangiogenic effects. However, since the growth of normal body cells may also be affected, other adverse effects (AEs) will also occur.8-18
Two different chemotherapy drugs contain paclitaxel—paclitaxel and nab-paclitaxel—and the US Food and Drug Administration (FDA) recognizes them as separate entities.19-21 Taxol (paclitaxel) was approved by the FDA in 1992 for treating advanced ovarian cancer.20 It has since been approved for the treatment of metastatic breast cancer, AIDS-related Kaposi sarcoma (as an orphan drug), non-small cell lung cancer (NSCLC), and cervical cancers (in combination withbevacizumab) in 1994, 1997, 1999, and 2014, respectively.21 Since 2002, a generic version of Taxol, known as paclitaxel injectable, has been FDA-approved from different manufacturers. According to the National Cancer Institute, a combination of carboplatin and Taxol is approved to treat carcinoma of unknown primary, cervical, endometrial, NSCLC, ovarian, and thymoma cancers.19 Abraxane (nab-paclitaxel) was FDA-approved to treat metastatic breast cancer in 2005. It was later approved for first-line treatment of advanced NSCLC and late-stage pancreatic cancer in 2012 and 2013, respectively. In 2018 and 2020, both Taxol and Abraxane were approved for first-line treatment of metastatic squamous cell NSCLC in combination with carboplatin and pembrolizumab and metastatic triple-negative breast cancer in combination with pembrolizumab, respectively.22-26 In 2019, Abraxane was approved with atezolizumab to treat metastatic triple-negative breast cancer, but this approval was withdrawn in 2021. In 2022, a generic version of Abraxane, known as paclitaxel protein-bound, was released in the United States. Furthermore, paclitaxel-containing formulations also are being studied in the treatment of other types of cancer.19-32
One of the main limitations of paclitaxel is its low solubility in water, which complicates its drug supply. To distribute this hydrophobic anticancer drug efficiently, paclitaxel is formulated and administered to patients via polyethoxylated castor oil or albumin-bound (nab-paclitaxel). However, polyethoxylated castor oil induces complement activation and is the cause of common hypersensitivity reactions related to paclitaxel use.2,17,33-38 Therefore, many alternatives to polyethoxylated castor oil have been researched.
Since 2000, new paclitaxel formulations have emerged using nanomedicine techniques. The difference between these formulations is the drug vehicle. Different paclitaxel-based nanotechnological vehicles have been developed and approved, such as albumin-based nanoparticles, polymeric lipidic nanoparticles, polymeric micelles, and liposomes, with many others in clinical trial phases.3,37 Albumin-based nanoparticles have a high response rate (33%), whereas the response rate for polyethoxylated castor oil is 25% in patients with metastatic breast cancer.33,39-52 The use of paclitaxel dimer nanoparticles also has been proposed as a method for increasing drug solubility.33,53
Paclitaxel is metabolized by cytochrome P450 (CYP) isoenzymes 2C8 and 3A4. When administering paclitaxel with known inhibitors, inducers, or substrates of CYP2C8 or CYP3A4, caution is required.19-22 Regulations for CYP research were not issued until 2008, so potential interactions between paclitaxel and other drugs have not been extensively evaluated in clinical trials. A study of 12 kinase inhibitors showed strong inhibition of CYP2C8 and/or CYP3A4 pathways by these inhibitors, which could alter the ratio of paclitaxel metabolites in vivo, leading to clinically relevant changes.54 Differential metabolism has been linked to paclitaxel-induced neurotoxicity in patients with cancer.55 Nonetheless, variants in the CYP2C8, CYP3A4, CYP3A5, and ABCB1 genes do not account for significant interindividual variability in paclitaxel pharmacokinetics.56 In liver microsomes, losartan inhibited paclitaxel metabolism when used at concentrations > 50 µmol/L.57 Many drug-drug interaction (DDI) studies of CYP2C8 and CYP3A4 have shown similar results for paclitaxel.58-64
The goals of this study are to investigate prescribed drugs used with paclitaxel and determine patient outcomes through several Military Health System (MHS) databases. The investigation focused on (1) the functions of paclitaxel; (2) identifying AEs that patients experienced; (3) evaluating differences when paclitaxel is used alone vs concomitantly and between the completed vs discontinued treatment groups; (4) identifying all drugs used during paclitaxel treatment; and (5) evaluating DDIs with antidepressants (that have an FDA boxed warning and are known to have DDIs confirmed in previous publications) and other drugs.65-67
The Walter Reed National Military Medical Center in Bethesda, Maryland, institutionalreview board approved the study protocol and ensured compliance with the Health Insurance Portability and Accountability Act as an exempt protocol. The Joint Pathology Center (JPC) of the US Department of Defense (DoD) Cancer Registry Program and MHS data experts from the Comprehensive Ambulatory/Professional Encounter Record (CAPER) and the Pharmacy Data Transaction Service (PDTS) provided data for the analysis.
METHODS
The DoD Cancer Registry Program was established in 1986 and currently contains data from 1998 to 2024. CAPER and PDTS are part of the MHS Data Repository/Management Analysis and Reporting Tool database. Each observation in the CAPER record represents an ambulatory encounter at a military treatment facility (MTF). CAPER includes data from 2003 to 2024.
Each observation in the PDTS record represents a prescription filled for an MHS beneficiary at an MTF through the TRICARE mail-order program or a US retail pharmacy. Missing from this record are prescriptions filled at international civilian pharmacies and inpatient pharmacy prescriptions. The MHS Data Repository PDTS record is available from 2002 to 2024. The legacy Composite Health Care System is being replaced by GENESIS at MTFs.
Data Extraction Design
The study design involved a cross-sectional analysis. We requested data extraction for paclitaxel from 1998 to 2022. Data from the DoD Cancer Registry Program were used to identify patients who received cancer treatment. Once patients were identified, the CAPER database was searched for diagnoses to identify other health conditions, whereas the PDTS database was used to populate a list of prescription medications filled during chemotherapy treatment.
Data collected from the JPC included cancer treatment, cancer information, demographics, and physicians’ comments on AEs. Collected data from the MHS include diagnosis and filled prescription history from initiation to completion of the therapy period (or 2 years after the diagnosis date). For the analysis of the DoD Cancer Registry Program and CAPER databases, we used all collected data without excluding any. When analyzing PDTS data, we excluded patients with PDTS data but without a record of paclitaxel being filled, or medications filled outside the chemotherapy period (by evaluating the dispensed date and day of supply).
Data Extraction Analysis
The Surveillance, Epidemiology, and End Results Program Coding and Staging Manual 2016 and the International Classification of Diseases for Oncology, 3rd edition, 1st revision, were used to decode disease and cancer types.68,69 Data sorting and analysis were performed using Microsoft Excel. The percentage for the total was calculated by using the number of patients or data available within the paclitaxel groups divided by the total number of patients or data variables. The subgroup percentage was calculated by using the number of patients or data available within the subgroup divided by the total number of patients in that subgroup.
In alone vs concomitant and completed vs discontinued treatment groups, a 2-tailed, 2-sample z test was used to statistical significance (P < .05) using a statistics website.70 Concomitant was defined as paclitaxel taken with other antineoplastic agent(s) before, after, or at the same time as cancer therapy. For the retrospective data analysis, physicians’ notes with a period, comma, forward slash, semicolon, or space between medication names were interpreted as concurrent, whereas plus (+), minus/plus (-/+), or “and” between drug names that were dispensed on the same day were interpreted as combined with known common combinations: 2 drugs (DM886 paclitaxel and carboplatin and DM881-TC-1 paclitaxel and cisplatin) or 3 drugs (DM887-ACT doxorubicin, cyclophosphamide, and paclitaxel). Completed treatment was defined as paclitaxel as the last medication the patient took without recorded AEs; switching or experiencing AEs was defined as discontinued treatment.
RESULTS
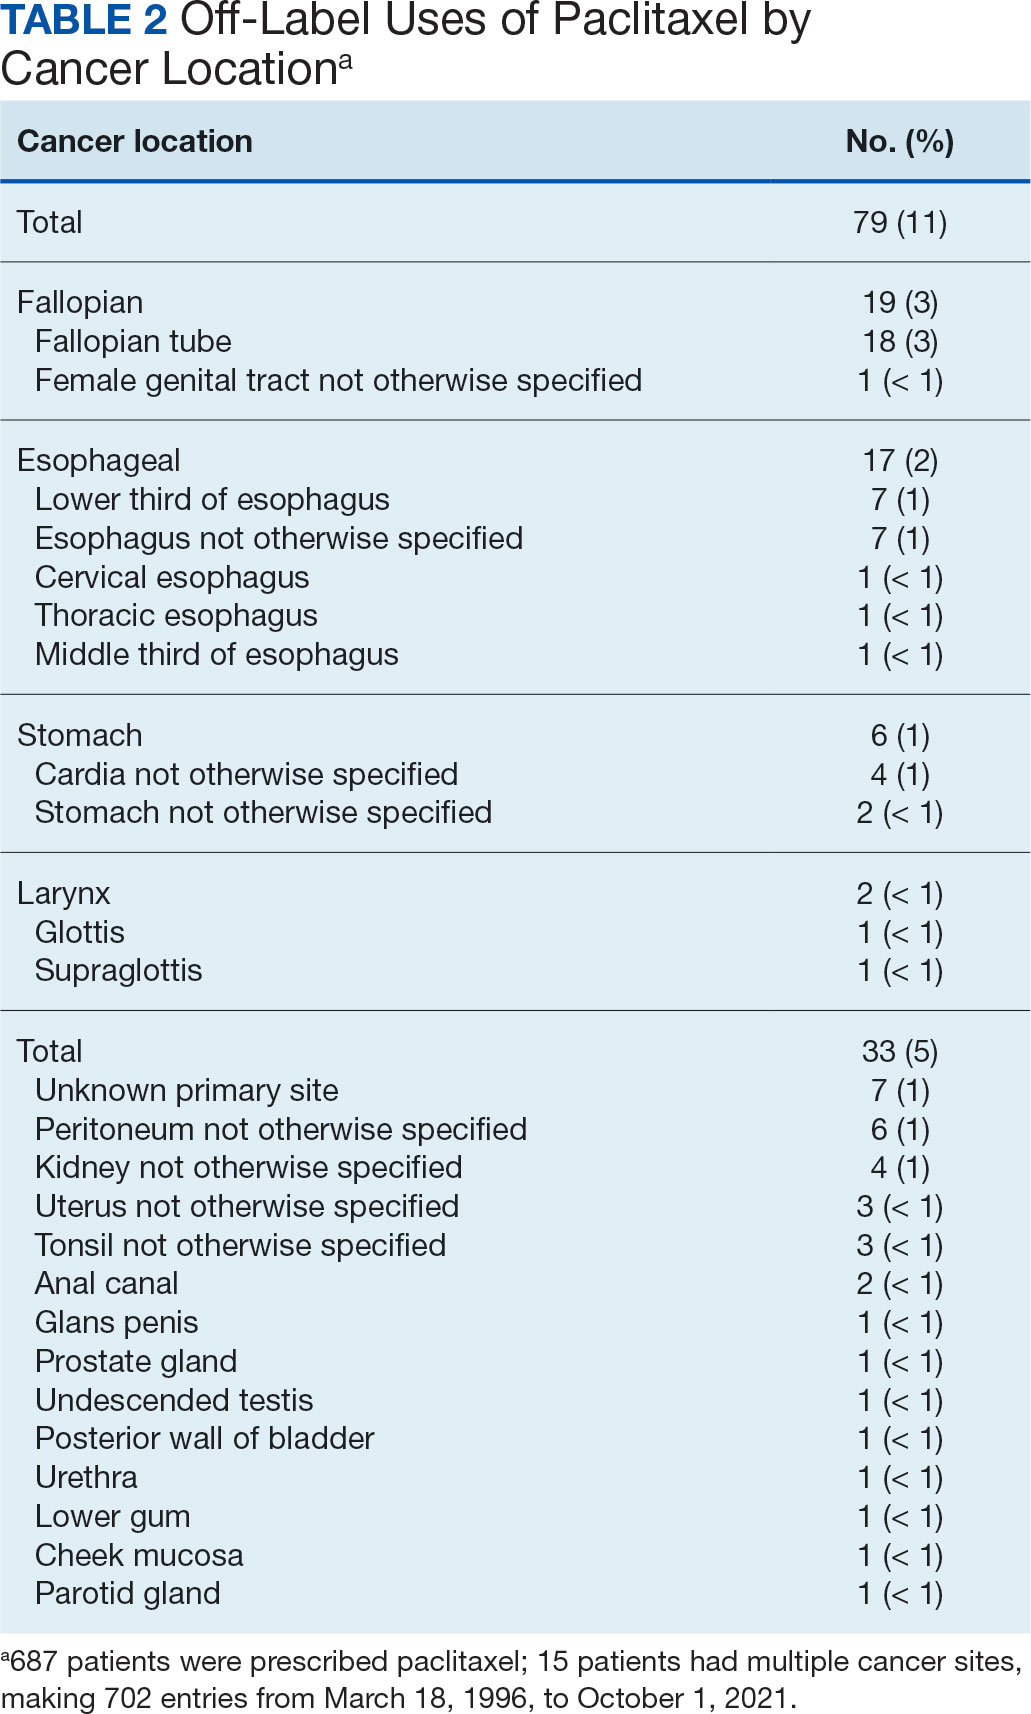
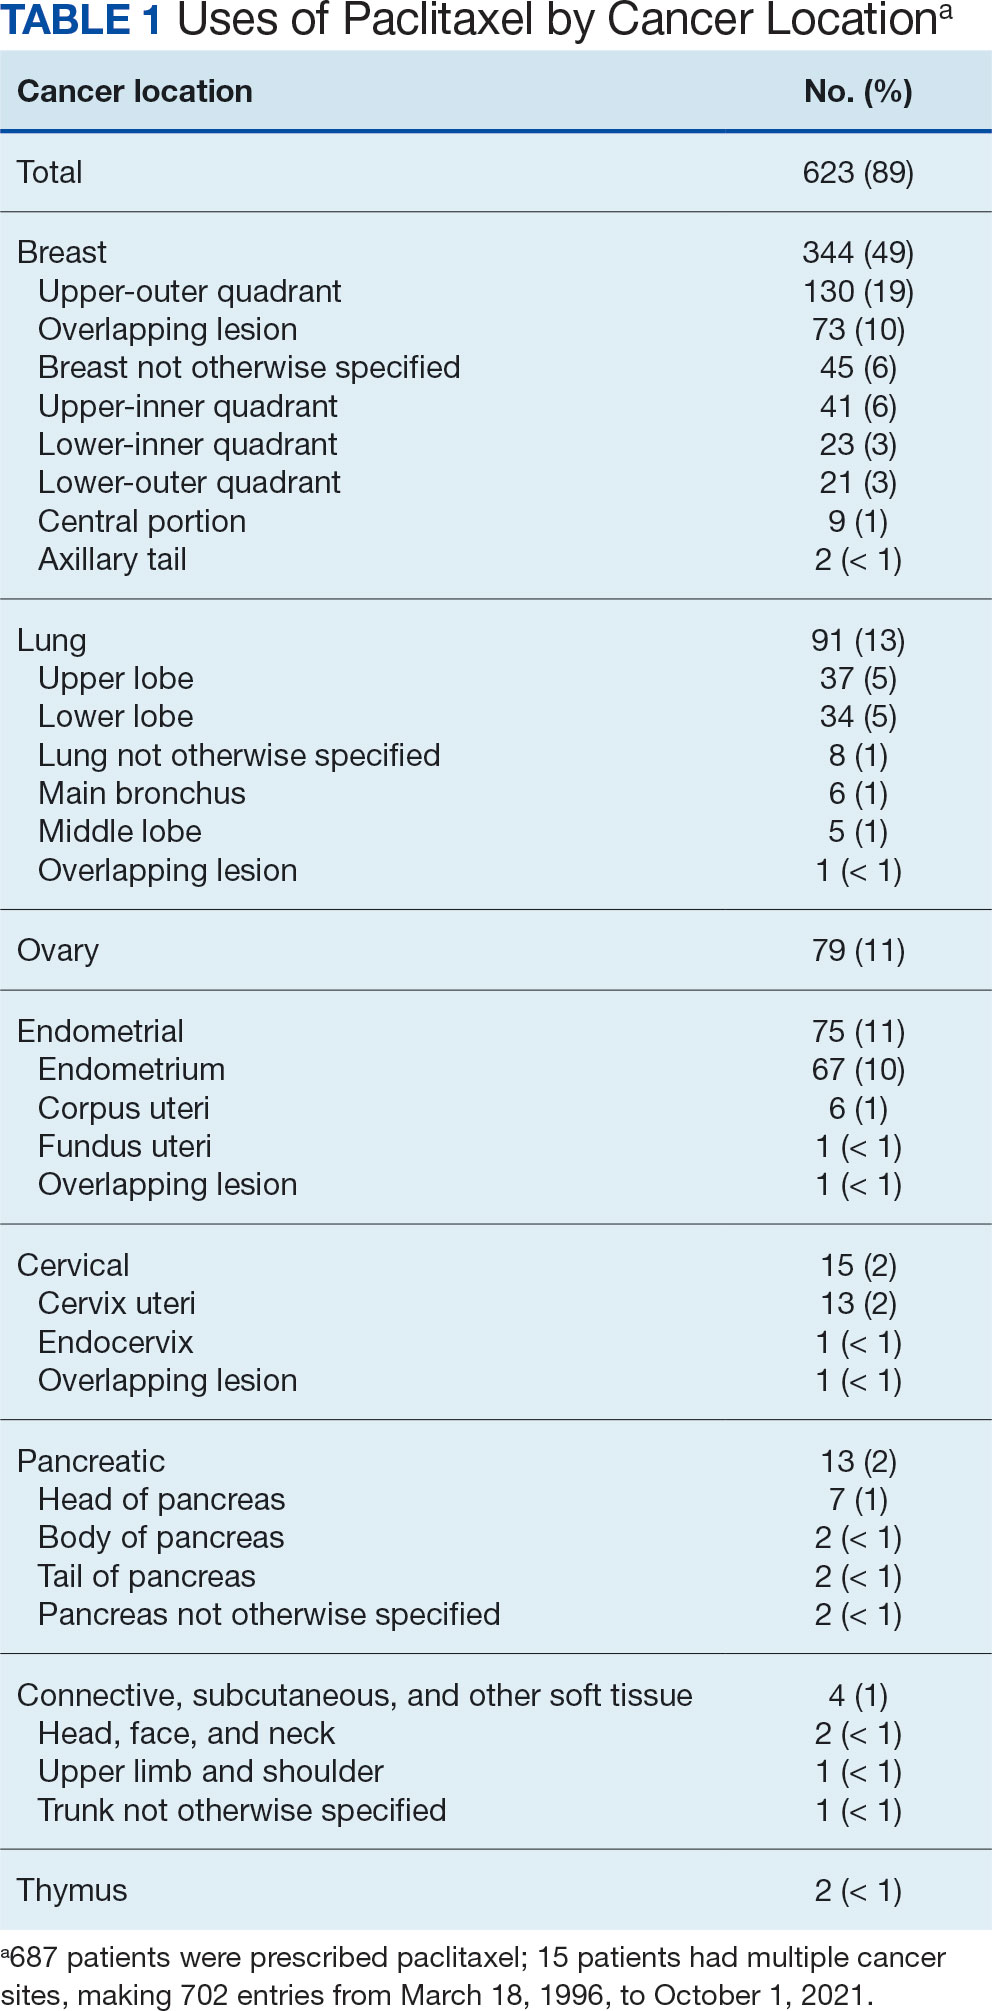
The JPC provided 702 entries for 687 patients with a mean age of 56 years (range, 2 months to 88 years) who were treated with paclitaxel from March 1996 to October 2021. Fifteen patients had duplicate entries because they had multiple cancer sites or occurrences. There were 623 patients (89%) who received paclitaxel for FDA-approved indications. The most common types of cancer identified were 344 patients with breast cancer (49%), 91 patients with lung cancer (13%), 79 patients with ovarian cancer (11%), and 75 patients with endometrial cancer (11%) (Table 1). Seventy-nine patients (11%) received paclitaxel for cancers that were not for FDA-approved indications, including 19 for cancers of the fallopian tube (3%) and 17 for esophageal cancer (2%) (Table 2).
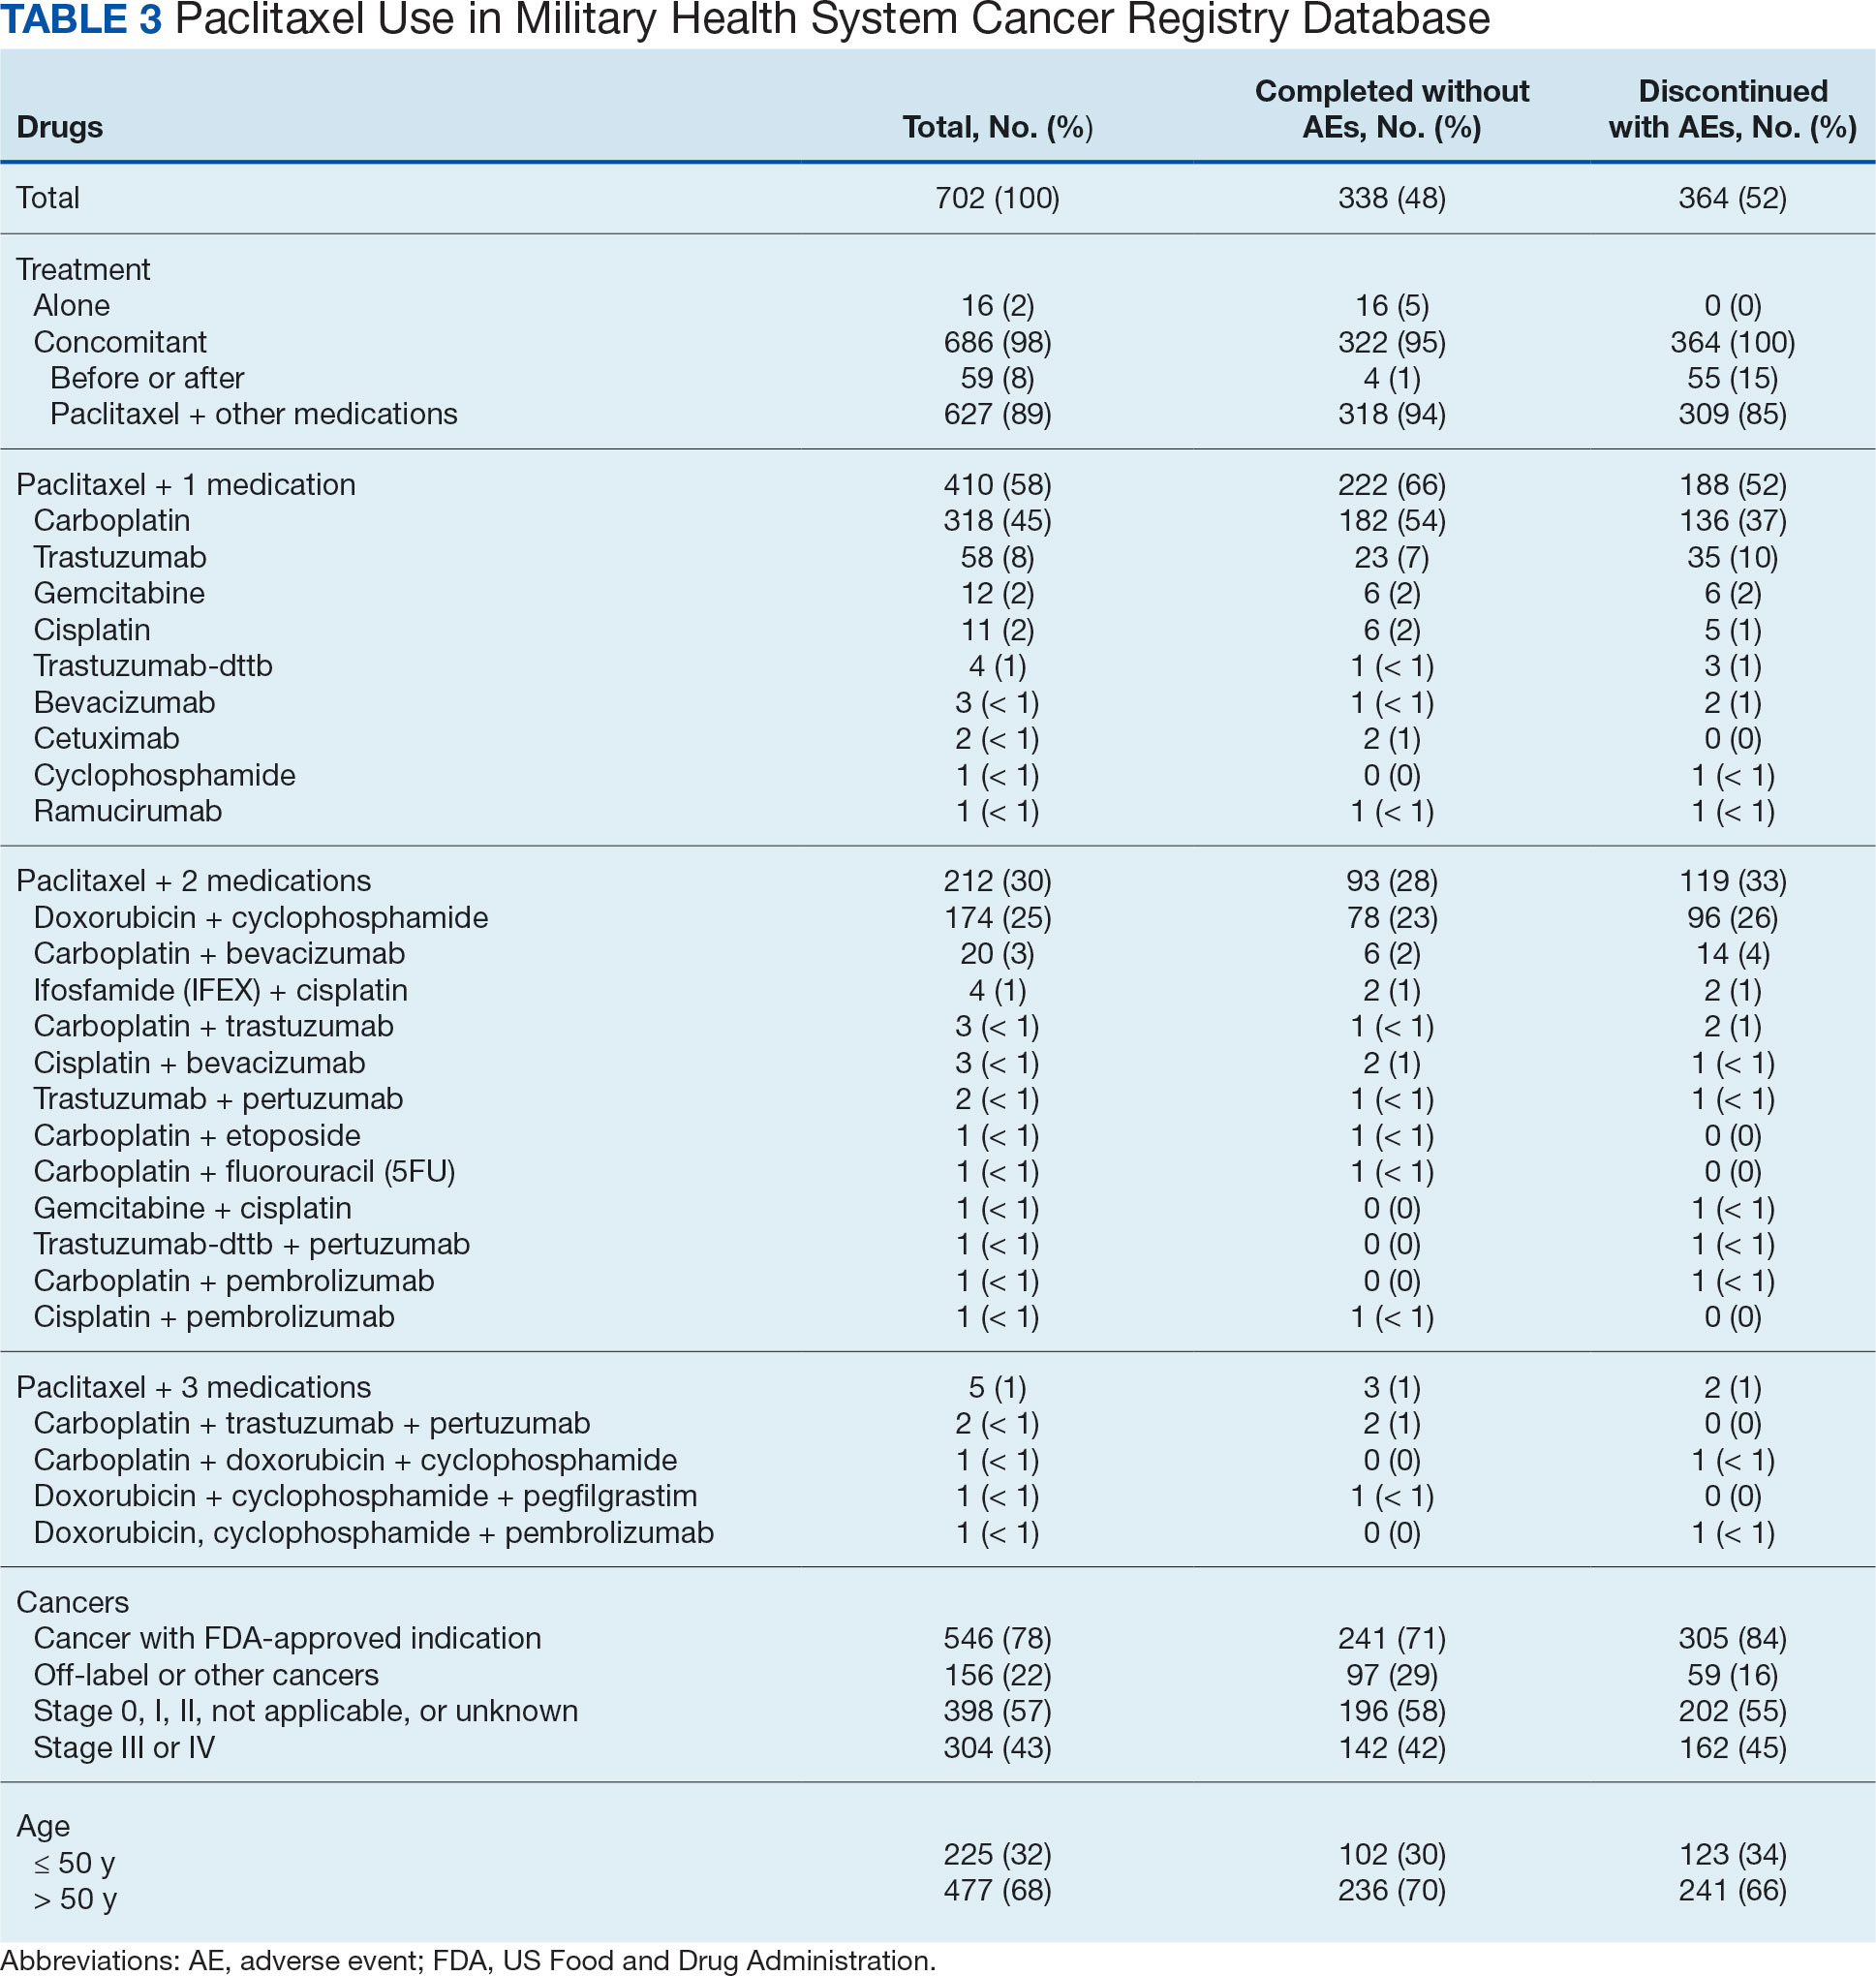
There were 477 patients (68%) aged > 50 years. A total of 304 patients (43%) had a stage III or IV cancer diagnosis and 398 (57%) had stage II or lower (combination of data for stages 0, I, and II; not applicable; and unknown) cancer diagnosis. For systemic treatment, 16 patients (2%) were treated with paclitaxel alone and 686 patients (98%) received paclitaxel concomitantly with additional chemotherapy: 59 patients (9%) in the before or after group, 410 patients (58%) had a 2-drug combination, 212 patients (30%) had a 3-drug combination, and 5 patients (1%) had a 4-drug combination. In addition, for doublet therapies, paclitaxel combined with carboplatin, trastuzumab, gemcitabine, or cisplatin had more patients (318, 58, 12, and 11, respectively) than other combinations (≤ 4 patients). For triplet therapies, paclitaxel combined withdoxorubicin plus cyclophosphamide or carboplatin plus bevacizumab had more patients (174 and 20, respectively) than other combinations, including quadruplet therapies (≤ 4 patients) (Table 3).
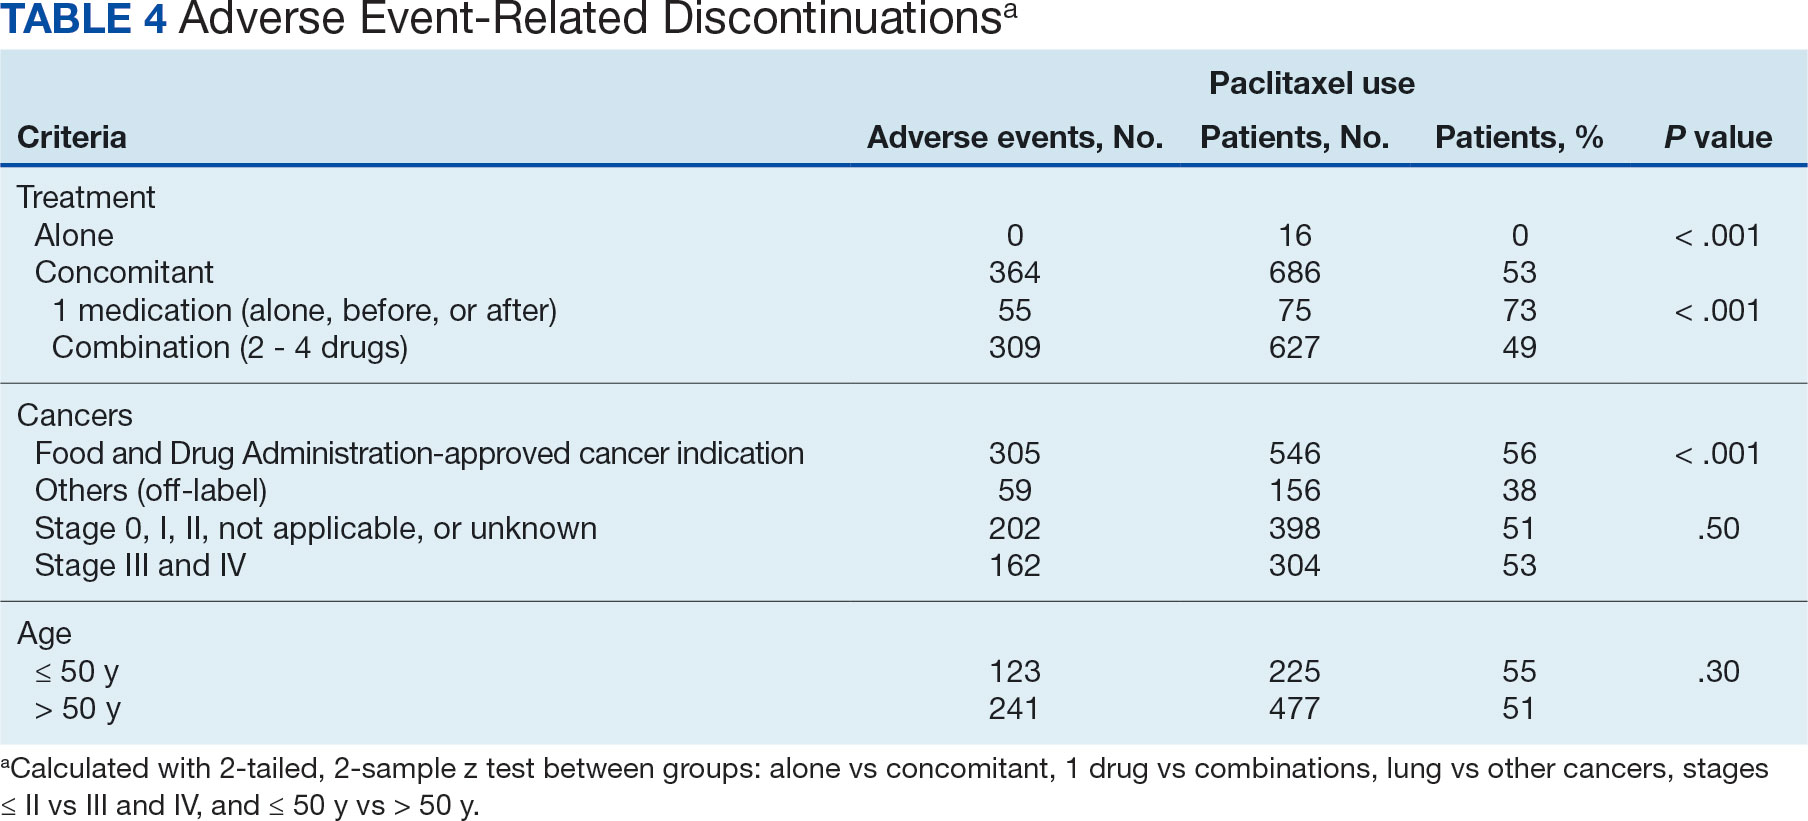
Patients were more likely to discontinue paclitaxel if they received concomitant treatment. None of the 16 patients receiving paclitaxel monotherapy experienced AEs, whereas 364 of 686 patients (53%) treated concomitantly discontinued (P < .001). Comparisons of 1 drug vs combination (2 to 4 drugs) and use for treating cancers that were FDA-approved indications vs off-label use were significant (P < .001), whereas comparisons of stage II or lower vs stage III and IV cancer and of those aged ≤ 50 years vs aged > 50 years were not significant (P = .50 andP = .30, respectively) (Table 4).
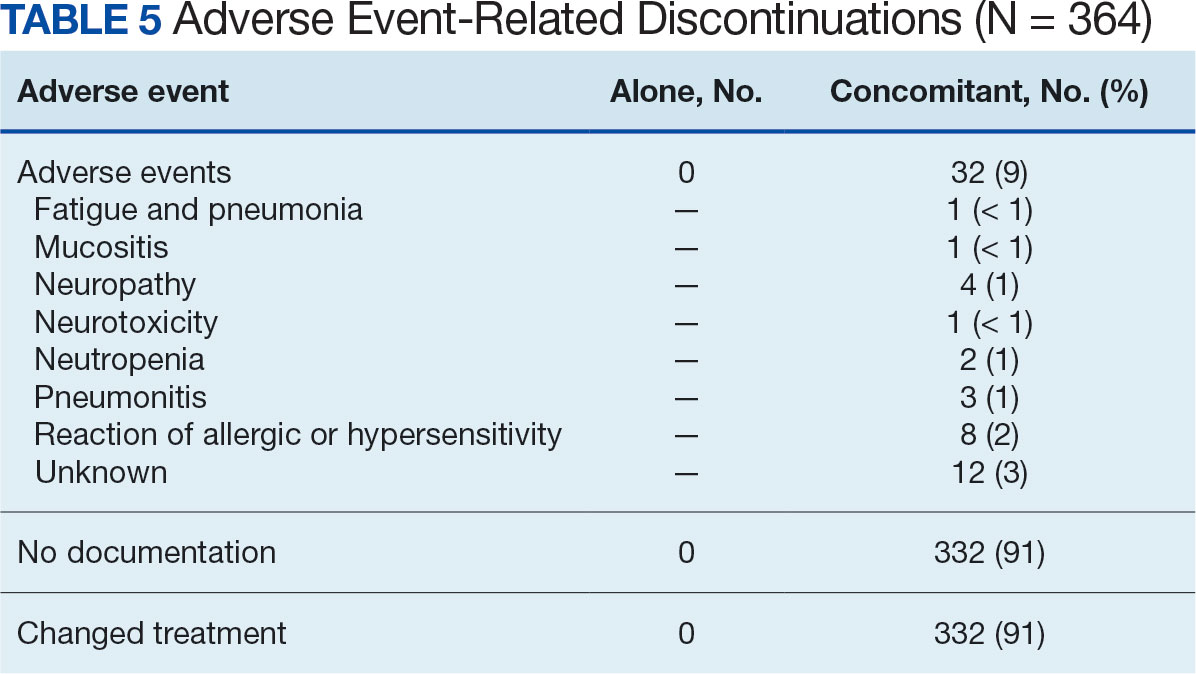
Among the 364 patients who had concomitant treatment and had discontinued their treatment, 332 (91%) switched treatments with no AEs documented and 32 (9%) experienced fatigue with pneumonia, mucositis, neuropathy, neurotoxicity, neutropenia, pneumonitis, allergic or hypersensitivity reaction, or an unknown AE. Patients who discontinued treatment because of unknown AEs had a physician’s note that detailed progressive disease, a significant decline in performance status, and another unknown adverse effect due to a previous sinus tract infection and infectious colitis (Table 5).
Management Analysis and Reporting Tool Database
MHS data analysts provided data on diagnoses for 639 patients among 687 submitteddiagnoses, with 294 patients completing and 345 discontinuing paclitaxel treatment. Patients in the completed treatment group had 3 to 258 unique health conditions documented, while patients in the discontinued treatment group had 4 to 181 unique health conditions documented. The MHS reported 3808 unique diagnosis conditions for the completed group and 3714 for the discontinued group (P = .02).
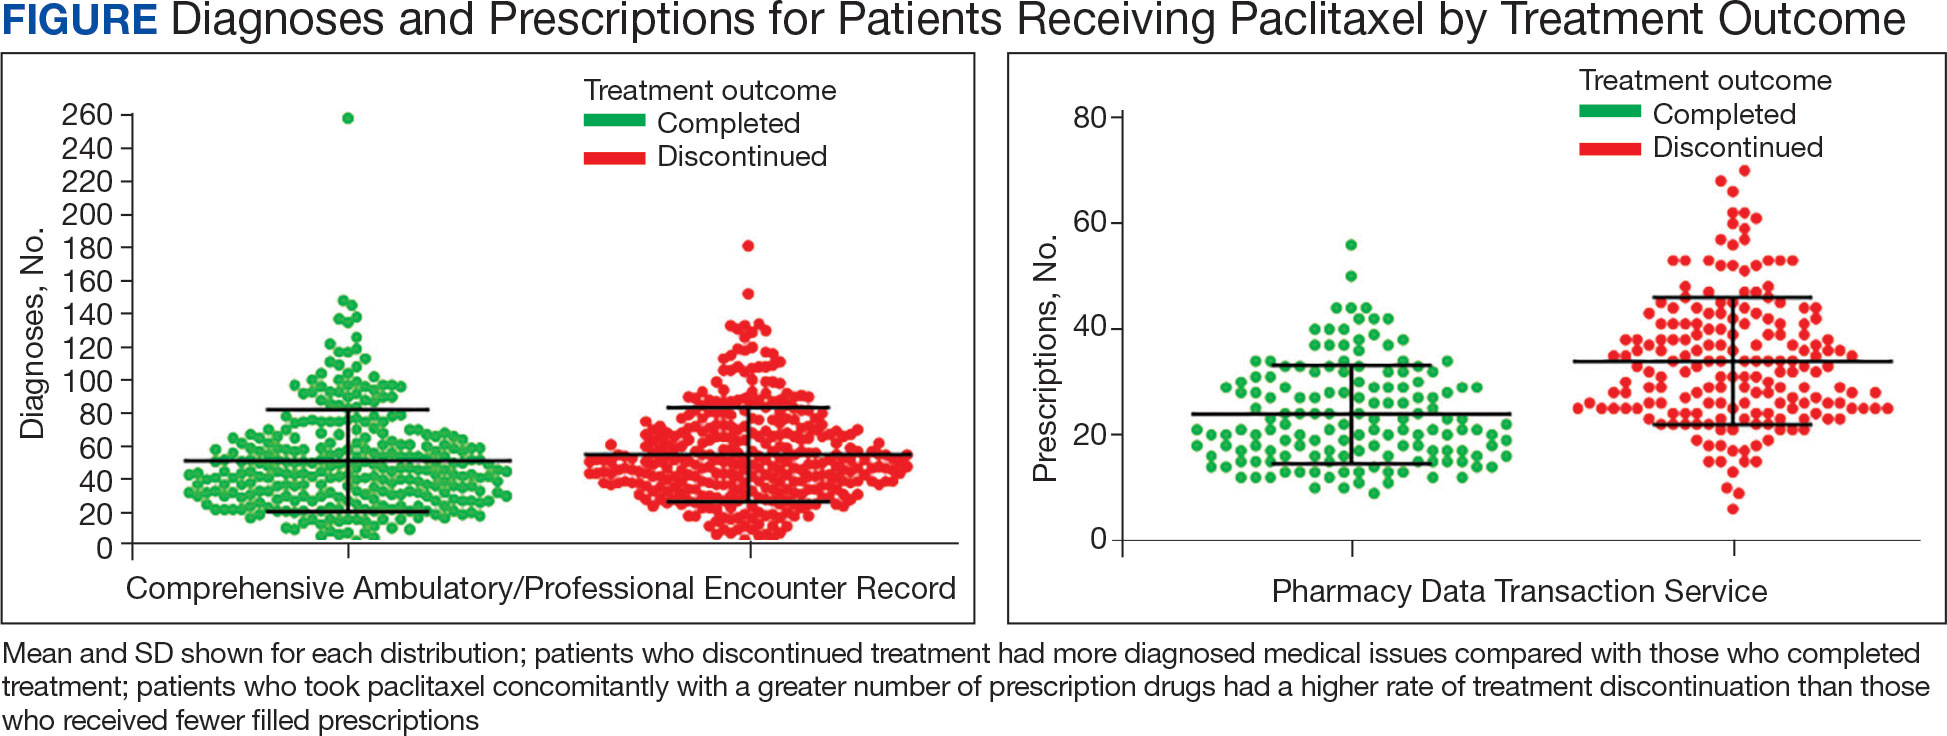
The mean (SD) number of diagnoses was 51 (31) for the completed and 55 (28) for the discontinued treatment groups (Figure). Among 639 patients who received paclitaxel, the top 5 diagnoses were administrative, including encounters for other administrative examinations; antineoplastic chemotherapy; administrative examination for unspecified; other specified counseling; and adjustment and management of vascular access device. The database does not differentiate between administrative and clinically significant diagnoses.
MHS data analysts provided data for 336 of 687 submitted patients who were prescribed paclitaxel; 46 patients had no PDTS data, and 305 patients had PDTS data without paclitaxel, Taxol, or Abraxane dispensed. Medications that were filled outside the chemotherapy period were removed by evaluating the dispensed date and day of supply. Among these 336 patients, 151 completed the treatment and 185 discontinued, with 14 patients experiencing documented AEs. Patients in the completed treatment group filled 9 to 56 prescriptions while patients in the discontinued treatment group filled 6 to 70 prescriptions.Patients in the discontinued group filled more prescriptions than those who completed treatment: 793 vs 591, respectively (P = .34).
The mean (SD) number of filled prescription drugs was 24 (9) for the completed and 34 (12) for the discontinued treatment group. The 5 most filled prescriptions with paclitaxel from 336 patients with PDTS data were dexamethasone (324 prescriptions with 14 recorded AEs), diphenhydramine (296 prescriptions with 12 recorded AEs), ondansetron (277 prescriptions with 11 recorded AEs), prochlorperazine (265 prescriptions with 12 recorded AEs), and sodium chloride (232 prescriptions with 11 recorded AEs).
DISCUSSION
As a retrospective review, this study is more limited in the strength of its conclusions when compared to randomized control trials. The DoD Cancer Registry Program only contains information about cancer types, stages, treatment regimens, and physicians’ notes. Therefore, noncancer drugs are based solely on the PDTS database. In most cases, physicians' notes on AEs were not detailed. There was no distinction between initial vs later lines of therapy and dosage reductions. The change in status or appearance of a new medical condition did not indicate whether paclitaxel caused the changes to develop or directly worsen a pre-existing condition. The PDTS records prescriptions filled, but that may not reflect patients taking prescriptions.
Paclitaxel
Paclitaxel has a long list of both approved and off-label uses in malignancies as a primary agent and in conjunction with other drugs. The FDA prescribing information for Taxol and Abraxane was last updated in April 2011 and September 2020, respectively.20,21 The National Institutes of Health National Library of Medicine has the current update for paclitaxel on July 2023.19,22 Thus, the prescribed information for paclitaxel referenced in the database may not always be up to date. The combinations of paclitaxel with bevacizumab, carboplatin, or carboplatin and pembrolizumab were not in the Taxol prescribing information. Likewise, a combination of nab-paclitaxel with atezolizumab or carboplatin and pembrolizumab is missing in the Abraxane prescribing information.22-27
The generic name is not the same as a generic drug, which may have slight differences from the brand name product.71 The generic drug versions of Taxol and Abraxane have been approved by the FDA as paclitaxel injectable and paclitaxel-protein bound, respectively. There was a global shortage of nab-paclitaxel from October 2021 to June 2022 because of a manufacturing problem.72 During this shortage, data showed similar comments from physician documents that treatment switched to Taxol due to the Abraxane shortage.
Of 336 patients in the PDTS database with dispensed paclitaxel prescriptions, 276 received paclitaxel (year dispensed, 2013-2022), 27 received Abraxane (year dispensed, 2013-2022), 47 received Taxol (year dispensed, 2004-2015), 8 received both Abraxane and paclitaxel, and 6 received both Taxol and paclitaxel. Based on this information, it appears that the distinction between the drugs was not made in the PDTS until after 2015, 10 years after Abraxane received FDA approval. Abraxane was prescribed in the MHS in 2013, 8 years after FDA approval. There were a few comparison studies of Abraxane and Taxol.73-76
Safety and effectiveness in pediatric patients have not been established for paclitaxel. According to the DoD Cancer Registry Program, the youngest patient was aged 2 months. In 2021, this patient was diagnosed with corpus uteri and treated with carboplatin and Taxol in course 1; in course 2, the patient reacted to Taxol; in course 3, Taxol was replaced with Abraxane; in courses 4 to 7, the patient was treated with carboplatin only.
Discontinued Treatment
Ten patients had prescribed Taxol that was changed due to AEs: 1 was switched to Abraxane and atezolizumab, 3 switched to Abraxane, 2 switched to docetaxel, 1 switched to doxorubicin, and 3 switched to pembrolizumab (based on physician’s comments). Of the 10 patients, 7 had Taxol reaction, 2 experienced disease progression, and 1 experienced high programmed death–ligand 1 expression (this patient with breast cancer was switched to Abraxane and atezolizumab during the accelerated FDA approval phase for atezolizumab, which was later revoked). Five patients were treated with carboplatin and Taxol for cancer of the anal canal (changed to pembrolizumab after disease progression), lung not otherwise specified (changed to carboplatin and pembrolizumab due to Taxol reaction), lower inner quadrant of the breast (changed to doxorubicin due to hypersensitivity reaction), corpus uteri (changed to Abraxane due to Taxol reaction), and ovary (changed to docetaxel due to Taxol reaction). Three patients were treated with doxorubicin, cyclophosphamide, and Taxol for breast cancer; 2 patients with breast cancer not otherwise specified switched to Abraxane due to cardiopulmonary hypersensitivity and Taxol reaction and 1 patient with cancer of the upper outer quadrant of the breast changed to docetaxel due to allergic reaction. One patient, who was treated with paclitaxel, ifosfamide, and cisplatin for metastasis of the lower lobe of the lung and kidney cancer, experienced complications due to infectious colitis (treated with ciprofloxacin) and then switched to pembrolizumab after the disease progressed. These AEs are known in paclitaxel medical literature on paclitaxel AEs.19-24,77-81
Combining 2 or more treatments to target cancer-inducing or cell-sustaining pathways is a cornerstone of chemotherapy.82-84 Most combinations are given on the same day, but some are not. For 3- or 4-drug combinations, doxorubicin and cyclophosphamide were given first, followed by paclitaxel with or withouttrastuzumab, carboplatin, or pembrolizumab. Only 16 patients (2%) were treated with paclitaxel alone; therefore, the completed and discontinued treatment groups are mostly concomitant treatment. As a result, the comparisons of the completed and discontinued treatment groups were almost the same for the diagnosis. The PDTS data have a better result because 2 exclusion criteria were applied before narrowing the analysis down to paclitaxel treatment specifically.
Antidepressants and Other Drugs
Drug response can vary from person to person and can lead to treatment failure related to AEs. One major factor in drug metabolism is CYP.85 CYP2C8 is the major pathway for paclitaxel and CYP3A4 is the minor pathway. When evaluating the noncancer drugs, there were no reports of CYP2C8 inhibition or induction.Over the years, many DDI warnings have been issued for paclitaxel with different drugs in various electronic resources.
Oncologists follow guidelines to prevent DDIs, as paclitaxel is known to have severe, moderate, and minor interactions with other drugs. Among 687 patients, 261 (38%) were prescribed any of 14 antidepressants. Eight of these antidepressants (amitriptyline, citalopram, desipramine, doxepin, venlafaxine, escitalopram, nortriptyline, and trazodone) are metabolized, 3 (mirtazapine, sertraline, and fluoxetine) are metabolized and inhibited, 2 (bupropion and duloxetine) are neither metabolized nor inhibited, and 1 (paroxetine) is inhibited by CYP3A4. Duloxetine, venlafaxine, and trazodone were more commonly dispensed (84, 78, and 42 patients, respectively) than others (≤ 33 patients).
Of 32 patients with documented AEs,14 (44%) had 168 dispensed drugs in the PDTS database. Six patients (19%) were treated with doxorubicin and cyclophosphamide followed by paclitaxel for breast cancer; 6 (19%) were treated with carboplatin and paclitaxel for cancer of the lung (n = 3), corpus uteri (n = 2), and ovary (n = 1); 1 patient (3%) was treated with carboplatin and paclitaxel, then switched to carboplatin, bevacizumab, and paclitaxel, and then completed treatment with carboplatin and paclitaxel for an unspecified female genital cancer; and 1 patient (3%) was treated with cisplatin, ifosfamide, and paclitaxel for metastasis of the lower lobe lung and kidney cancer.
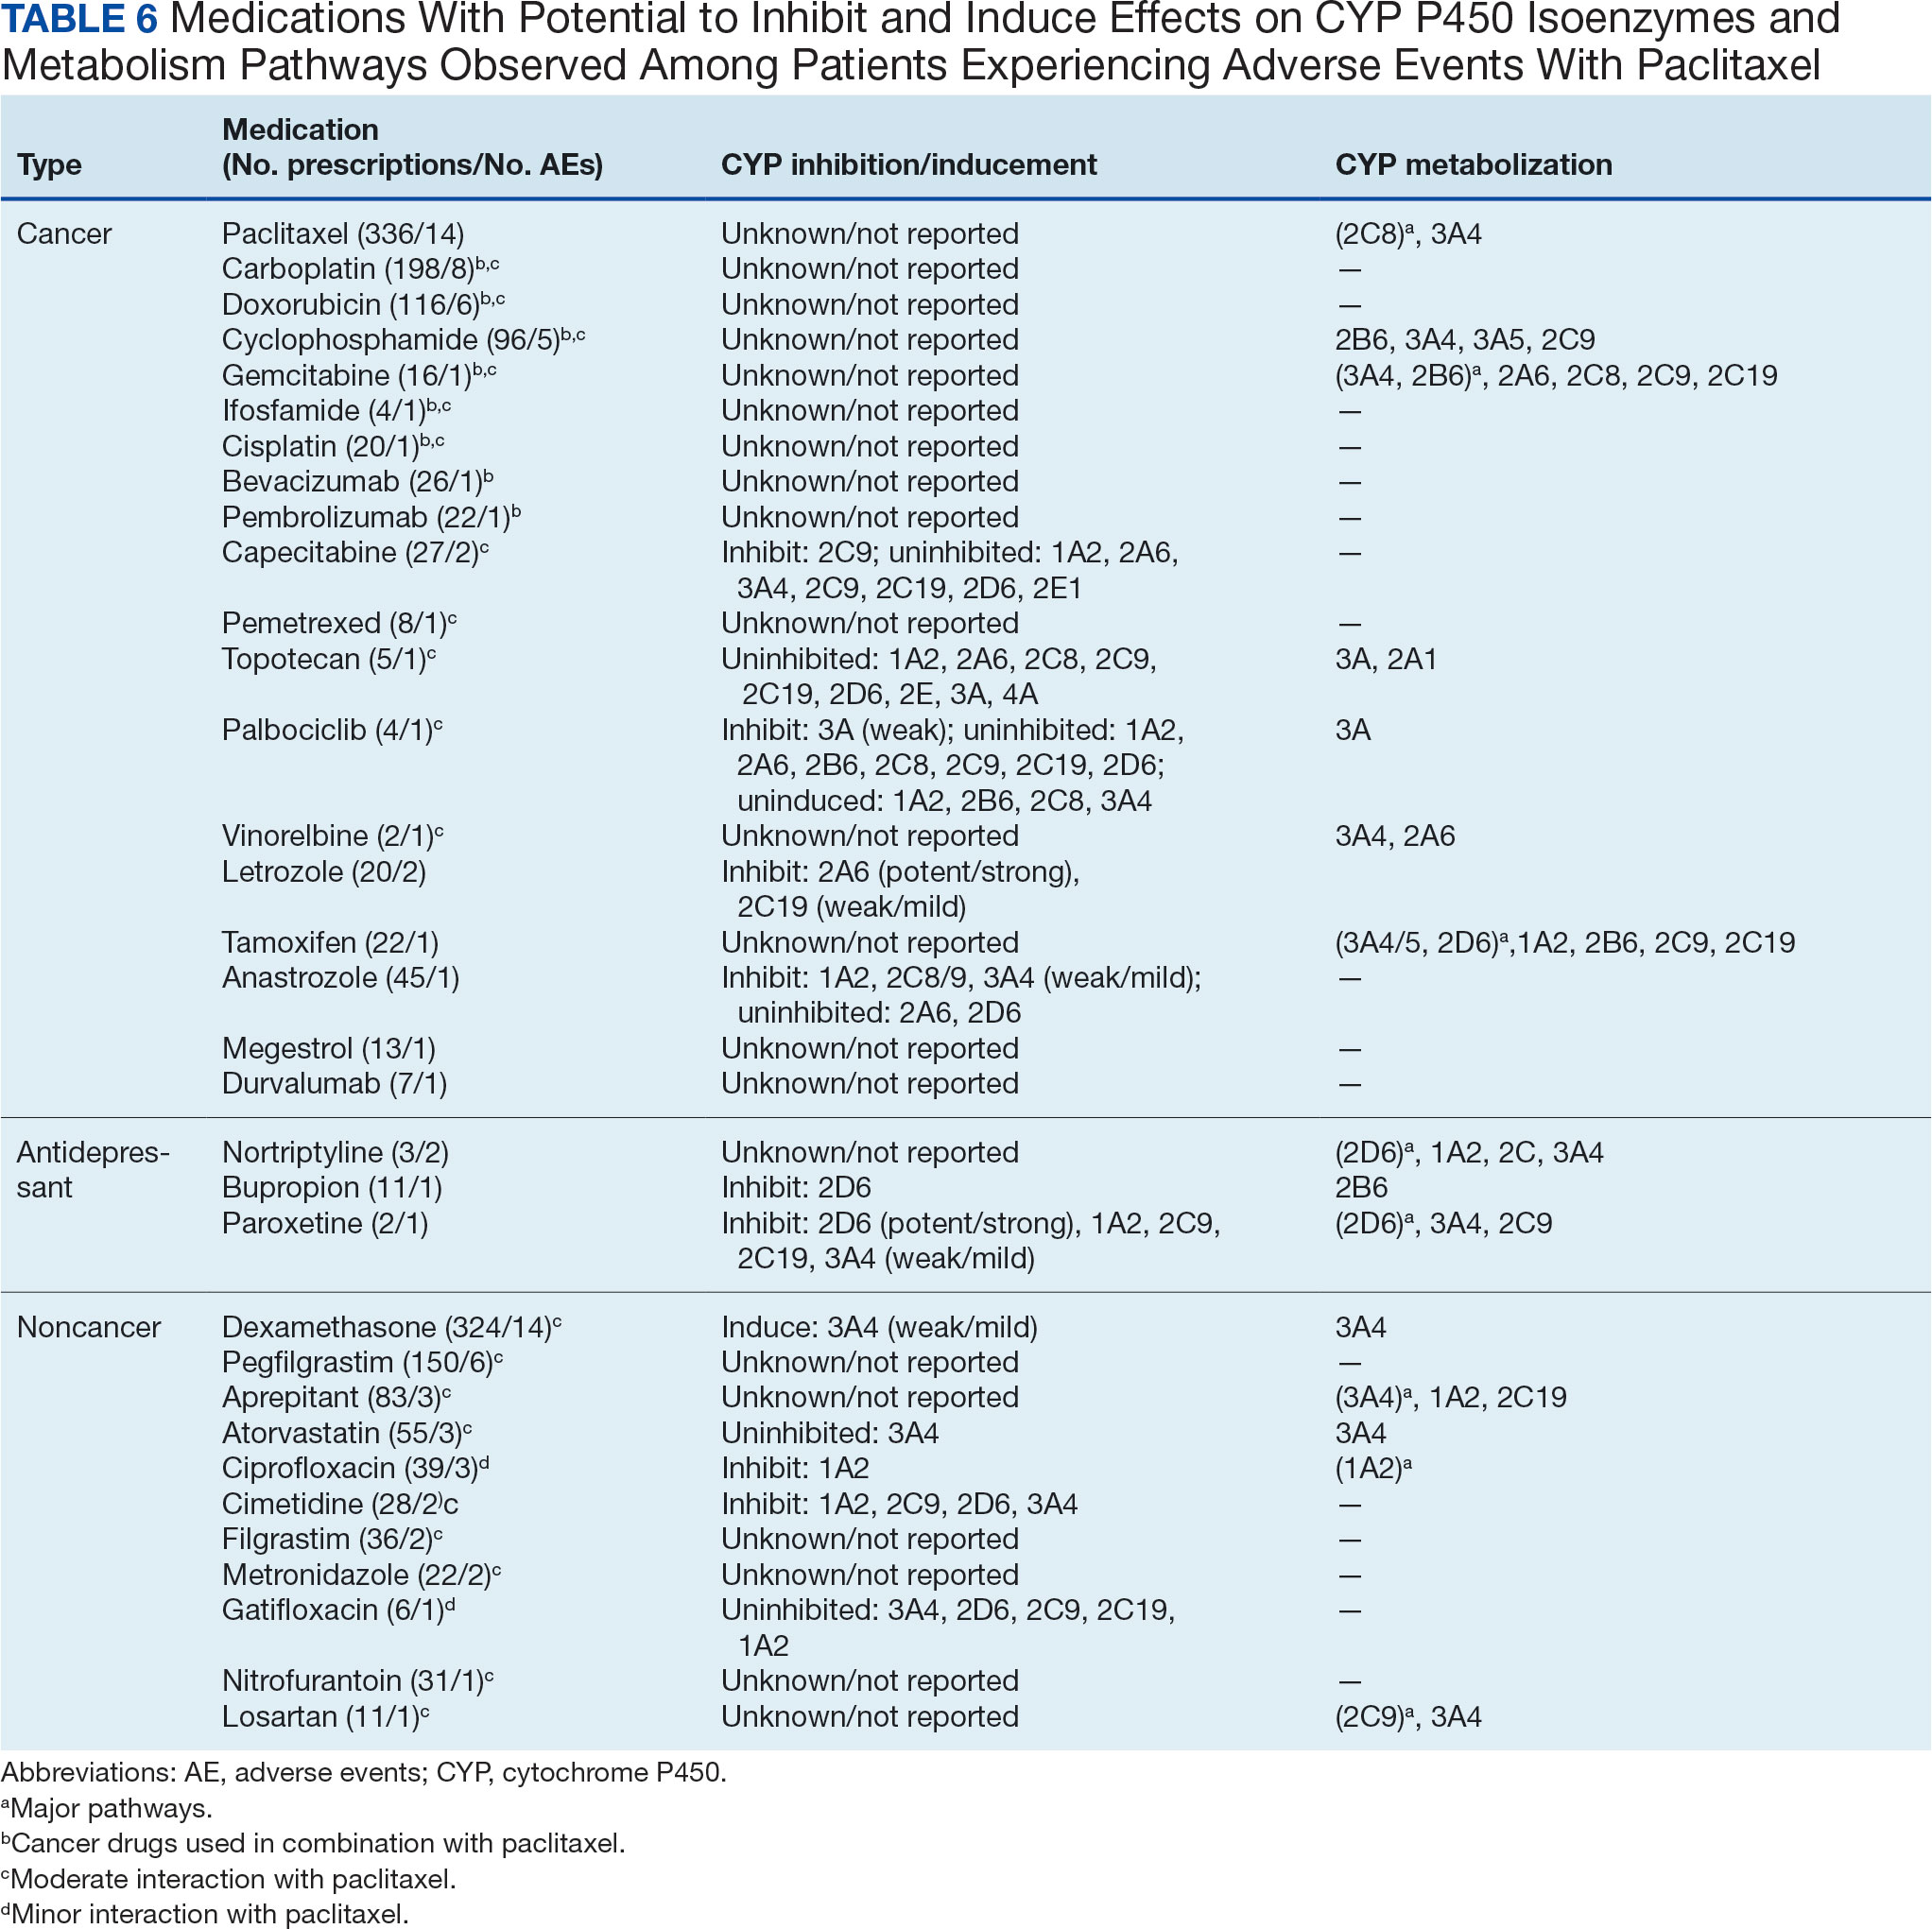
The 14 patients with PDTS data had 18 cancer drugs dispensed. Eleven had moderate interaction reports and 7 had no interaction reports. A total of 165 noncancer drugs were dispensed, of which 3 were antidepressants and had no interactions reported, 8 had moderate interactions reported, and 2 had minor interactions with Taxol and Abraxane, respectively (Table 6).86-129
Of 3 patients who were dispensed bupropion, nortriptyline, or paroxetine, 1 patient with breast cancer was treated with doxorubicin andcyclophosphamide, followed by paclitaxel with bupropion, nortriptyline, pegfilgrastim,dexamethasone, and 17 other noncancer drugs that had no interaction report dispensed during paclitaxel treatment. Of 2 patients with lung cancer, 1 patient was treated with carboplatin and paclitaxel with nortriptyline, dexamethasone, and 13 additional medications, and the second patient was treated with paroxetine, cimetidine, dexamethasone, and 12 other medications. Patients were dispensed up to6 noncancer medications on the same day as paclitaxel administration to control the AEs, not including the prodrugs filled before the treatments. Paroxetine and cimetidine have weak inhibition, and dexamethasone has weak induction of CYP3A4. Therefore, while 1:1 DDIs might have little or no effect with weak inhibit/induce CYP3A4 drugs, 1:1:1 or more combinations could have a different outcome (confirmed in previous publications).65-67
Dispensed on the same day may not mean taken at the same time. One patient experienced an AE with dispensed 50 mg losartan, carboplatin plus paclitaxel, dexamethasone, and 6 other noncancer drugs. Losartan inhibits paclitaxel, which can lead to negative AEs.57,66,67 However, there were no blood or plasma samples taken to confirm the losartan was taken at the same time as the paclitaxel given this was not a clinical trial.
Conclusions
This retrospective study discusses the use of paclitaxel in the MHS and the potential DDIs associated with it. The study population consisted mostly of active-duty personnel, who are required to be healthy or have controlled or nonactive medical diagnoses and be physically fit. This group is mixed with dependents and retirees that are more reflective of the average US population. As a result, this patient population is healthier than the general population, with a lower prevalence of common illnesses such as diabetes and obesity. The study aimed to identify drugs used alongside paclitaxel treatment. While further research is needed to identify potential DDIs among patients who experienced AEs, in vitro testing will need to be conducted before confirming causality. The low number of AEs experienced by only 32 of 702 patients (5%), with no deaths during paclitaxel treatment, indicates that the drug is generally well tolerated. Although this study cannot conclude that concomitant use with noncancer drugs led to the discontinuation of paclitaxel, we can conclude that there seems to be no significant DDIsidentified between paclitaxel and antidepressants. This comprehensive overview provides clinicians with a complete picture of paclitaxel use for 27 years (1996-2022), enabling them to make informed decisions about paclitaxel treatment.
Acknowledgments
The Department of Research Program funds at Walter Reed National Military Medical Center supported this protocol. We sincerely appreciate the contribution of data extraction from the Joint Pathology Center teams (Francisco J. Rentas, John D. McGeeney, Beatriz A. Hallo, and Johnny P. Beason) and the MHS database personnel (Maj Ryan Costantino, Brandon E. Jenkins, and Alexander G. Rittel). We gratefully thank you for the protocol support from the Department of Research programs: CDR Martin L. Boese, CDR Wesley R. Campbell, Maj. Abhimanyu Chandel, CDR Ling Ye, Chelsea N. Powers, Yaling Zhou, Elizabeth Schafer, Micah Stretch, Diane Beaner, and Adrienne Woodard.
1. American Chemical Society. Discovery of camptothecin and taxol. acs.org. Accessed June 4, 2024. https://www.acs.org/education/whatischemistry/landmarks/camptothecintaxol.html
2. Bocci G, Di Paolo A, Danesi R. The pharmacological bases of the antiangiogenic activity of paclitaxel. Angiogenesis. 2013;16(3):481-492. doi:10.1007/s10456-013-9334-0.
3. Meštrovic T. Paclitaxel history. News Medical Life Sciences. Updated March 11, 2023. Accessed June 4, 2024. https://www.news-medical.net/health/Paclitaxel-History.aspx
4. Rowinsky EK, Donehower RC. Paclitaxel (taxol). N Engl J Med. 1995;332(15):1004-1014. doi:10.1056/NEJM199504133321507
5. Walsh V, Goodman J. The billion dollar molecule: Taxol in historical and theoretical perspective. Clio Med. 2002;66:245-267. doi:10.1163/9789004333499_013
6. Perdue RE, Jr, Hartwell JL. The search for plant sources of anticancer drugs. Morris Arboretum Bull. 1969;20:35-53.
7. Wall ME, Wani MC. Camptothecin and taxol: discovery to clinic—thirteenth Bruce F. Cain Memorial Award lecture. Cancer Res. 1995;55:753-760.
8. Wani MC, Taylor HL, Wall ME, Coggon P, McPhail AT. Plant antitumor agents. VI. The isolation and structure of taxol, a novel antileukemic and antitumor agent from taxus brevifolia. J Am Chem Soc. 1971;93(9):2325-2327. doi:10.1021/ja00738a045
9. Weaver BA. How taxol/paclitaxel kills cancer cells. Mol Biol Cell. 2014;25(18):2677-2681. doi:10.1091/mbc.E14-04-0916
10. Chen JG, Horwitz SB. Differential mitotic responses to microtubule-stabilizing and-destabilizing drugs. Cancer Res. 2002;62(7):1935-1938.
11. Singh S, Dash AK. Paclitaxel in cancer treatment: perspectives and prospects of its delivery challenges. Crit Rev Ther Drug Carrier Syst. 2009;26(4):333-372. doi:10.1615/critrevtherdrugcarriersyst.v26.i4.10
12. Schiff PB, Fant J, Horwitz SB. Promotion of microtubule assembly in vitro by taxol. Nature. 1979;277(5698):665-667. doi:10.1038/277665a0
13. Fuchs DA, Johnson RK. Cytologic evidence that taxol, an antineoplastic agent from taxus brevifolia, acts as a mitotic spindle poison. Cancer Treat Rep. 1978;62(8):1219-1222.
14. Walsh V, Goodman J. From taxol to taxol: the changing identities and ownership of an anti-cancer drug. Med Anthropol. 2002;21(3-4):307-336. doi:10.1080/01459740214074
15. Walsh V, Goodman J. Cancer chemotherapy, biodiversity, public and private property: the case of the anti-cancer drug taxol. Soc Sci Med. 1999;49(9):1215-1225. doi:10.1016/s0277-9536(99)00161-6
16. Jordan MA, Wendell K, Gardiner S, Derry WB, Copp H, Wilson L. Mitotic block induced in HeLa cells by low concentrations of paclitaxel (taxol) results in abnormal mitotic exit and apoptotic cell death. Cancer Res. 1996;56(4):816-825.
17. Picard M, Castells MC. Re-visiting hypersensitivity reactions to taxanes: a comprehensive review. Clin Rev Allergy Immunol. 2015;49(2):177-191. doi:10.1007/s12016-014-8416-0
18. Zasadil LM, Andersen KA, Yeum D, et al. Cytotoxicity of paclitaxel in breast cancer is due to chromosome missegregation on multipolar spindles. Sci Transl Med. 2014;6:229ra243. doi:10.1126/scitranslmed.3007965
19. National Cancer Institute. Carboplatin-Taxol. Published May 30, 2012. Updated March 22, 2023. Accessed June 4, 2024. https://www.cancer.gov/about-cancer/treatment/drugs/carboplatin-taxol
20. Taxol (paclitaxel). Prescribing information. Bristol-Myers Squibb; 2011. Accessed June 4, 2024. https://www.accessdata.fda.gov/drugsatfda_docs/label/2011/020262s049lbl.pdf
21. Abraxane (paclitaxel). Prescribing information. Celgene Corporation; 2021. Accessed June 4, 2024. https://www.accessdata.fda.gov/drugsatfda_docs/label/2020/021660s047lbl.pdf
22. Awosika AO, Farrar MC, Jacobs TF. Paclitaxel. StatPearls. Updated November 18, 2023. Accessed June 5, 2024. https://www.ncbi.nlm.nih.gov/books/NBK536917/
23. Gerriets V, Kasi A. Bevacizumab. StatPearls. Updated September 1, 2022. Accessed June 5, 2024. https://www.ncbi.nlm.nih.gov/books/NBK482126/
24. American Cancer Society. Chemotherapy for endometrial cancer. Updated March 27, 2019. Accessed June 4, 2024. https://www.cancer.org/cancer/types/endometrial-cancer/treating/chemotherapy.html
25. US Food and Drug Administration. FDA approves pembrolizumab in combination with chemotherapy for first-line treatment of metastatic squamous NSCLC. October 30, 2018. Updated December 14, 2018. Accessed June 4, 2024. https://www.fda.gov/drugs/fda-approves-pembrolizumab-combination-chemotherapy-first-line-treatment-metastatic-squamous-nsclc
26. US Food and Drug Administration. FDA grants accelerated approval to pembrolizumab for locally recurrent unresectable or metastatic triple negative breast cancer. November 13, 2020. Accessed June 4, 2024. https://www.fda.gov/drugs/resources-information-approved-drugs/fda-grants-accelerated-approval-pembrolizumab-locally-recurrent-unresectable-or-metastatic-triple
27. US Food and Drug Administration. FDA approves atezolizumab for PD-L1 positive unresectable locally advanced or metastatic triple-negative breast. March 8, 2019. Updated March 18, 2019. Accessed June 5, 2024. https://www.fda.gov/drugs/drug-approvals-and-databases/fda-approves-atezolizumab-pd-l1-positive-unresectable-locally-advanced-or-metastatic-triple-negative
28. US Food and Drug Administration. FDA issues alert about efficacy and potential safety concerns with atezolizumab in combination with paclitaxel for treatment of breast cancer. September 8, 2020. Accessed June 5, 2024. https://www.fda.gov/drugs/resources-information-approved-drugs/fda-issues-alert-about-efficacy-and-potential-safety-concerns-atezolizumab-combination-paclitaxel
29. Tan AR. Chemoimmunotherapy: still the standard of care for metastatic triple-negative breast cancer. ASCO Daily News. February 23, 2022. Accessed June 5, 2024. https://dailynews.ascopubs.org/do/chemoimmunotherapy-still-standard-care-metastatic-triple-negative-breast-cancer
30. McGuire WP, Rowinsky EK, Rosenshein NB, et al. Taxol: a unique antineoplastic agent with significant activity in advanced ovarian epithelial neoplasms. Ann Intern Med. 1989;111(4):273-279. doi:10.7326/0003-4819-111-4-273
31. Milas L, Hunter NR, Kurdoglu B, et al. Kinetics of mitotic arrest and apoptosis in murine mammary and ovarian tumors treated with taxol. Cancer Chemother Pharmacol. 1995;35(4):297-303. doi:10.1007/BF00689448
32. Searle J, Collins DJ, Harmon B, Kerr JF. The spontaneous occurrence of apoptosis in squamous carcinomas of the uterine cervix. Pathology. 1973;5(2):163-169. doi:10.3109/00313027309060831
33. Gallego-Jara J, Lozano-Terol G, Sola-Martínez RA, Cánovas-Díaz M, de Diego Puente T. A compressive review about taxol®: history and future challenges. Molecules. 2020;25(24):5986. doi:10.3390/molecules25245986
34. Bernabeu E, Cagel M, Lagomarsino E, Moretton M, Chiappetta DA. Paclitaxel: What has been done and the challenges remain ahead. Int J Pharm. 2017;526(1-2):474-495. doi:10.1016/j.ijpharm.2017.05.016
35. Nehate C, Jain S, Saneja A, et al. Paclitaxel formulations: challenges and novel delivery options. Curr Drug Deliv. 2014;11(6):666-686. doi:10.2174/1567201811666140609154949
36. Gelderblom H, Verweij J, Nooter K, Sparreboom A, Cremophor EL. The drawbacks and advantages of vehicle selection for drug formulation. Eur J Cancer. 2001;37(13):1590-1598. doi:10.1016/S0959-8049(01)00171-x
37. Chowdhury MR, Moshikur RM, Wakabayashi R, et al. In vivo biocompatibility, pharmacokinetics, antitumor efficacy, and hypersensitivity evaluation of ionic liquid-mediated paclitaxel formulations. Int J Pharm. 2019;565:219-226. doi:10.1016/j.ijpharm.2019.05.020
38. Borgå O, Henriksson R, Bjermo H, Lilienberg E, Heldring N, Loman N. Maximum tolerated dose and pharmacokinetics of paclitaxel micellar in patients with recurrent malignant solid tumours: a dose-escalation study. Adv Ther. 2019;36(5):1150-1163. doi:10.1007/s12325-019-00909-6
39. Rouzier R, Rajan R, Wagner P, et al. Microtubule-associated protein tau: a marker of paclitaxel sensitivity in breast cancer. Proc Natl Acad Sci USA. 2005;102(23):8315-8320. doi:10.1073/pnas.0408974102
40. Choudhury H, Gorain B, Tekade RK, Pandey M, Karmakar S, Pal TK. Safety against nephrotoxicity in paclitaxel treatment: oral nanocarrier as an effective tool in preclinical evaluation with marked in vivo antitumor activity. Regul Toxicol Pharmacol. 2017;91:179-189. doi:10.1016/j.yrtph.2017.10.023
41. Barkat MA, Beg S, Pottoo FH, Ahmad FJ. Nanopaclitaxel therapy: an evidence based review on the battle for next-generation formulation challenges. Nanomedicine (Lond). 2019;14(10):1323-1341. doi:10.2217/nnm-2018-0313
42. Sofias AM, Dunne M, Storm G, Allen C. The battle of “nano” paclitaxel. Adv Drug Deliv Rev. 2017;122:20-30. doi:10.1016/j.addr.2017.02.003
43. Yang N, Wang C, Wang J, et al. Aurora inase a stabilizes FOXM1 to enhance paclitaxel resistance in triple-negative breast cancer. J Cell Mol Med. 2019;23(9):6442-6453. doi:10.1111/jcmm.14538
44. Chowdhury MR, Moshikur RM, Wakabayashi R, et al. Ionic-liquid-based paclitaxel preparation: a new potential formulation for cancer treatment. Mol Pharm. 2018;15(16):2484-2488. doi:10.1021/acs.molpharmaceut.8b00305
45. Chung HJ, Kim HJ, Hong ST. Tumor-specific delivery of a paclitaxel-loading HSA-haemin nanoparticle for cancer treatment. Nanomedicine. 2020;23:102089. doi:10.1016/j.nano.2019.102089
46. Ye L, He J, Hu Z, et al. Antitumor effect and toxicity of lipusu in rat ovarian cancer xenografts. Food Chem Toxicol. 2013;52:200-206. doi:10.1016/j.fct.2012.11.004
47. Ma WW, Lam ET, Dy GK, et al. A pharmacokinetic and dose-escalating study of paclitaxel injection concentrate for nano-dispersion (PICN) alone and with arboplatin in patients with advanced solid tumors. J Clin Oncol. 2013;31:2557. doi:10.1200/jco.2013.31.15_suppl.2557
48. Micha JP, Goldstein BH, Birk CL, Rettenmaier MA, Brown JV. Abraxane in the treatment of ovarian cancer: the absence of hypersensitivity reactions. Gynecol Oncol. 2006;100(2):437-438. doi:10.1016/j.ygyno.2005.09.012
49. Ingle SG, Pai RV, Monpara JD, Vavia PR. Liposils: an effective strategy for stabilizing paclitaxel loaded liposomes by surface coating with silica. Eur J Pharm Sci. 2018;122:51-63. doi:10.1016/j.ejps.2018.06.025
50. Abriata JP, Turatti RC, Luiz MT, et al. Development, characterization and biological in vitro assays of paclitaxel-loaded PCL polymeric nanoparticles. Mater Sci Eng C Mater Biol Appl. 2019;96:347-355. doi:10.1016/j.msec.2018.11.035
51. Hu J, Fu S, Peng Q, et al. Paclitaxel-loaded polymeric nanoparticles combined with chronomodulated chemotherapy on lung cancer: in vitro and in vivo evaluation. Int J Pharm. 2017;516(1-2):313-322. doi:10.1016/j.ijpharm.2016.11.047
52. Dranitsaris G, Yu B, Wang L, et al. Abraxane® vs Taxol® for patients with advanced breast cancer: a prospective time and motion analysis from a chinese health care perspective. J Oncol Pharm Pract. 2016;22(2):205-211. doi:10.1177/1078155214556008
53. Pei Q, Hu X, Liu S, Li Y, Xie Z, Jing X. Paclitaxel dimers assembling nanomedicines for treatment of cervix carcinoma. J Control Release. 2017;254:23-33. doi:10.1016/j.jconrel.2017.03.391
54. Wang Y, Wang M, Qi H, et al. Pathway-dependent inhibition of paclitaxel hydroxylation by kinase inhibitors and assessment of drug-drug interaction potentials. Drug Metab Dispos. 2014;42(4):782-795. doi:10.1124/dmd.113.053793
55. Shen F, Jiang G, Philips S, et al. Cytochrome P450 oxidoreductase (POR) associated with severe paclitaxel-induced peripheral neuropathy in patients of european ancestry from ECOG-ACRIN E5103. Clin Cancer Res. 2023;29(13):2494-2500. doi:10.1158/1078-0432.CCR-22-2431
56. Henningsson A, Marsh S, Loos WJ, et al. Association of CYP2C8, CYP3A4, CYP3A5, and ABCB1 polymorphisms with the pharmacokinetics of paclitaxel. Clin Cancer Res. 2005;11(22):8097-8104. doi:10.1158/1078-0432.CCR-05-1152
57. Mukai Y, Senda A, Toda T, et al. Drug-drug interaction between losartan and paclitaxel in human liver microsomes with different CYP2C8 genotypes. Basic Clin Pharmacol Toxicol. 2015;116(6):493-498. doi:10.1111/bcpt.12355
58. Kawahara B, Faull KF, Janzen C, Mascharak PK. Carbon monoxide inhibits cytochrome P450 enzymes CYP3A4/2C8 in human breast cancer cells, increasing sensitivity to paclitaxel. J Med Chem. 2021;64(12):8437-8446. doi:10.1021/acs.jmedchem.1c00404
59. Cresteil T, Monsarrat B, Dubois J, Sonnier M, Alvinerie P, Gueritte F. Regioselective metabolism of taxoids by human CYP3A4 and 2C8: structure-activity relationship. Drug Metab Dispos. 2002;30(4):438-445. doi:10.1124/dmd.30.4.438
60. Taniguchi R, Kumai T, Matsumoto N, et al. Utilization of human liver microsomes to explain individual differences in paclitaxel metabolism by CYP2C8 and CYP3A4. J Pharmacol Sci. 2005;97(1):83-90. doi:10.1254/jphs.fp0040603
61. Nakayama A, Tsuchiya K, Xu L, Matsumoto T, Makino T. Drug-interaction between paclitaxel and goshajinkigan extract and its constituents. J Nat Med. 2022;76(1):59-67. doi:10.1007/s11418-021-01552-8
62. Monsarrat B, Chatelut E, Royer I, et al. Modification of paclitaxel metabolism in a cancer patient by induction of cytochrome P450 3A4. Drug Metab Dispos. 1998;26(3):229-233.
63. Walle T. Assays of CYP2C8- and CYP3A4-mediated metabolism of taxol in vivo and in vitro. Methods Enzymol. 1996;272:145-151. doi:10.1016/s0076-6879(96)72018-9
64. Hanioka N, Matsumoto K, Saito Y, Narimatsu S. Functional characterization of CYP2C8.13 and CYP2C8.14: catalytic activities toward paclitaxel. Basic Clin Pharmacol Toxicol. 2010;107(1):565-569. doi:10.1111/j.1742-7843.2010.00543.x
65. Luong TT, Powers CN, Reinhardt BJ, Weina PJ. Pre-clinical drug-drug interactions (DDIs) of gefitinib with/without losartan and selective serotonin reuptake inhibitors (SSRIs): citalopram, fluoxetine, fluvoxamine, paroxetine, sertraline, and venlafaxine. Curr Res Pharmacol Drug Discov. 2022;3:100112. doi:10.1016/j.crphar.2022.100112
66. Luong TT, McAnulty MJ, Evers DL, Reinhardt BJ, Weina PJ. Pre-clinical drug-drug interaction (DDI) of gefitinib or erlotinib with Cytochrome P450 (CYP) inhibiting drugs, fluoxetine and/or losartan. Curr Res Toxicol. 2021;2:217-224. doi:10.1016/j.crtox.2021.05.006
67. Luong TT, Powers CN, Reinhardt BJ, et al. Retrospective evaluation of drug-drug interactions with erlotinib and gefitinib use in the military health system. Fed Pract. 2023;40(suppl 3):S24-S34. doi:10.12788/fp.0401
68. Adamo M, Dickie L, Ruhl J. SEER program coding and staging manual 2016. National Cancer Institute. Accessed June 5, 2024. https://seer.cancer.gov/archive/manuals/2016/SPCSM_2016_maindoc.pdf
69. World Health Organization. International classification of diseases for oncology (ICD-O) 3rd ed, 1st revision. World Health Organization; 2013. Accessed June 5, 2024. https://apps.who.int/iris/handle/10665/96612
70. Z score calculator for 2 population proportions. Social science statistics. Accessed June 5, 2024. https://www.socscistatistics.com/tests/ztest/default2.aspx
71. US Food and Drug Administration. Generic drugs: question & answers. FDA.gov. Accessed June 5, 2024. https://www.fda.gov/drugs/frequently-asked-questions-popular-topics/generic-drugs-questions-answers
72. Oura M, Saito H, Nishikawa Y. Shortage of nab-paclitaxel in Japan and around the world: issues in global information sharing. JMA J. 2023;6(2):192-195. doi:10.31662/jmaj.2022-0179
73. Yuan H, Guo H, Luan X, et al. Albumin nanoparticle of paclitaxel (abraxane) decreases while taxol increases breast cancer stem cells in treatment of triple negative breast cancer. Mol Pharm. 2020;17(7):2275-2286. doi:10.1021/acs.molpharmaceut.9b01221
74. Dranitsaris G, Yu B, Wang L, et al. Abraxane® versus Taxol® for patients with advanced breast cancer: a prospective time and motion analysis from a Chinese health care perspective. J Oncol Pharm Pract. 2016;22(2):205-211. doi:10.1177/1078155214556008
75. Gradishar WJ, Tjulandin S, Davidson N, et al. Phase III trial of nanoparticle albumin-bound paclitaxel compared with polyethylated castor oil-based paclitaxel in women with breast cancer. J Clin Oncol. 2005;23(31):7794-7803. doi:10.1200/JCO.2005.04.
76. Liu M, Liu S, Yang L, Wang S. Comparison between nab-paclitaxel and solvent-based taxanes as neoadjuvant therapy in breast cancer: a systematic review and meta-analysis. BMC Cancer. 2021;21(1):118. doi:10.1186/s12885-021-07831-7
77. Rowinsky EK, Eisenhauer EA, Chaudhry V, Arbuck SG, Donehower RC. Clinical toxicities encountered with paclitaxel (taxol). Semin Oncol. 1993;20(4 Suppl 3):1-15.
78. Banerji A, Lax T, Guyer A, Hurwitz S, Camargo CA Jr, Long AA. Management of hypersensitivity reactions to carboplatin and paclitaxel in an outpatient oncology infusion center: a 5-year review. J Allergy Clin Immunol Pract. 2014;2(4):428-433. doi:10.1016/j.jaip.2014.04.010
79. Staff NP, Fehrenbacher JC, Caillaud M, Damaj MI, Segal RA, Rieger S. Pathogenesis of paclitaxel-induced peripheral neuropathy: a current review of in vitro and in vivo findings using rodent and human model systems. Exp Neurol. 2020;324:113121. doi:10.1016/j.expneurol.2019.113121
80. Postma TJ, Vermorken JB, Liefting AJ, Pinedo HM, Heimans JJ. Paclitaxel-induced neuropathy. Ann Oncol. 1995;6(5):489-494. doi:10.1093/oxfordjournals.annonc.a059220
81. Liu JM, Chen YM, Chao Y, et al. Paclitaxel-induced severe neuropathy in patients with previous radiotherapy to the head and neck region. J Natl Cancer Inst. 1996;88(14):1000-1002. doi:10.1093/jnci/88.14.1000-a
82. Bayat Mokhtari R, Homayouni TS, Baluch N, et al. Combination therapy in combating cancer. Oncotarget. 2017;8(23):38022-38043. doi:10.18632/oncotarget.16723
83. Blagosklonny MV. Analysis of FDA approved anticancer drugs reveals the future of cancer therapy. Cell Cycle. 2004;3(8):1035-1042.
84. Yap TA, Omlin A, de Bono JS. Development of therapeutic combinations targeting major cancer signaling pathways. J Clin Oncol. 2013;31(12):1592-1605. doi:10.1200/JCO.2011.37.6418
85. Gilani B, Cassagnol M. Biochemistry, Cytochrome P450. StatPearls. Updated April 24, 2023. Accessed June 5, 2024. https://www.ncbi.nlm.nih.gov/books/NBK557698/
86. LiverTox: clinical and research information on drug-induced liver injury; 2012. Carboplatin. Updated September 15, 2020. Accessed June 5, 2024. https://www.ncbi.nlm.nih.gov/books/NBK548565/
87. Carboplatin. Prescribing information. Teva Parenteral Medicines; 2012. Accessed June 5, 204. https://www.accessdata.fda.gov/drugsatfda_docs/label/2012/077139Orig1s016lbl.pdf
88. Johnson-Arbor K, Dubey R. Doxorubicin. StatPearls. Updated August 8, 2023. Accessed June 5, 2024. https://www.ncbi.nlm.nih.gov/books/NBK459232/
89. Doxorubicin hydrochloride injection. Prescribing information. Pfizer; 2019. Accessed June 5, 2024. https://www.accessdata.fda.gov/drugsatfda_docs/label/2020/050467s078,050629s030lbl.pdf
90. Gor, PP, Su, HI, Gray, RJ, et al. Cyclophosphamide-metabolizing enzyme polymorphisms and survival outcomes after adjuvant chemotherapy for node-positive breast cancer: a retrospective cohort study. Breast Cancer Res. 2010;12(3):R26. doi:10.1186/bcr2570
91. Cyclophosphamide. Prescribing information. Ingenus Pharmaceuticals; 2020. Accessed June 5, 2024. https://www.accessdata.fda.gov/drugsatfda_docs/label/2020/212501s000lbl.pdf
92. Gemcitabine. Prescribing information. Hospira; 2019. Accessed June 5, 2024. https://www.accessdata.fda.gov/drugsatfda_docs/label/2019/200795Orig1s010lbl.pdf
93. Ifex (ifosfamide). Prescribing information. Baxter; 2012. Accessed June 5, 2024. https://www.accessdata.fda.gov/drugsatfda_docs/label/2012/019763s017lbl.pdf
94. Cisplatin. Prescribing information. WG Critical Care; 2019. Accessed June 5, 2024. https://www.accessdata.fda.gov/drugsatfda_docs/label/2019/018057s089lbl.pdf
95. Gerriets V, Kasi A. Bevacizumab. StatPearls. Updated August 28, 2023. Accessed June 5, 2024. https://www.ncbi.nlm.nih.gov/books/NBK482126/
96. Avastin (bevacizumab). Prescribing information. Genentech; 2022. Accessed June 5, 2024. https://www.accessdata .fda.gov/drugsatfda_docs/label/2022/125085s340lbl.pdf
 97. Keytruda (pembrolizumab). Prescribing information. Merck; 2021. Accessed June 5, 2024. https://www.accessdata.fda.gov/drugsatfda_docs/label/2021/125514s096lbl.pdf
98. Dean L, Kane M. Capecitabine therapy and DPYD genotype. National Center for Biotechnology Information (US); 2012. Updated November 2, 2020. Accessed June 5, 2024. https://www.ncbi.nlm.nih.gov/books/NBK385155/
99. Xeloda (capecitabine). Prescribing information. Roche; 2000. Accessed June 5, 2024. https://www.accessdata.fda.gov/drugsatfda_docs/label/2000/20896lbl.pdf
100. Pemetrexed injection. Prescribing information. Fareva Unterach; 2022. Accessed June 5, 2024. https://www.accessdata.fda.gov/drugsatfda_docs/label/2022/214657s000lbl.pdf
101. Topotecan Injection. Prescribing information. Zydus Hospira Oncology; 2014. Accessed June 5, 2024. https://www.accessdata.fda.gov/drugsatfda_docs/label/2014/200582s001lbl.pdf
102. Ibrance (palbociclib). Prescribing information. Pfizer; 2019. Accessed June 5, 2024. https://www.accessdata.fda.gov/drugsatfda_docs/label/2019/207103s008lbl.pdf
103. Navelbine (vinorelbine) injection. Prescribing information. Pierre Fabre Médicament; 2020. Accessed June 5, 2024. https://www.accessdata.fda.gov/drugsatfda_docs/label/2020/020388s037lbl.pdf
104. LiverTox: clinical and research information on drug-induced liver injury; 2012. Letrozole. Updated July 25, 2017. Accessed June 5, 2024. https://www.ncbi.nlm.nih.gov/books/NBK548381/
105. Femara (letrozole). Prescribing information. Novartis; 2014. Accessed June 5, 2024. https://www.accessdata.fda.gov/drugsatfda_docs/label/2014/020726s027lbl.pdf
106. Soltamox (tamoxifen citrate). Prescribing information. Rosemont Pharmaceuticals; 2018. Accessed June 5, 2024. https://www.accessdata.fda.gov/drugsatfda_docs/label/2018/021807s005lbl.pdf
107. LiverTox: clinical and research information on drug-induced liver injury; 2012. Anastrozole. Updated July 25, 2017. Accessed June 5, 2024. https://www.ncbi.nlm.nih.gov/books/NBK548189/
108. Grimm SW, Dyroff MC. Inhibition of human drug metabolizing cytochromes P450 by anastrozole, a potent and selective inhibitor of aromatase. Drug Metab Dispos. 1997;25(5):598-602.
109. Arimidex (anastrozole). Prescribing information. AstraZeneca; 2010. Accessed June 5, 2024. https://www.accessdata.fda.gov/drugsatfda_docs/label/2011/020541s026lbl.pdf
110. Megace (megestrol acetate). Prescribing information. Endo Pharmaceuticals; 2018. Accessed June 5, 2024. https://www.accessdata.fda.gov/drugsatfda_docs/label/2018/021778s024lbl.pdf
111. Imfinzi (durvalumab). Prescribing information. AstraZeneca; 2020. Accessed June 5, 2024. https://www.accessdata.fda.gov/drugsatfda_docs/label/2020/761069s018lbl.pdf
112. Merwar G, Gibbons JR, Hosseini SA, et al. Nortriptyline. StatPearls. Updated June 5, 2023. Accessed June 5, 2024. https://www.ncbi.nlm.nih.gov/books/NBK482214/
113. Pamelor (nortriptyline HCl). Prescribing information. Patheon Inc.; 2012. Accessed June 5, 2024. https://www.accessdata.fda.gov/drugsatfda_docs/label/2012/018012s029,018013s061lbl.pdf
114. Wellbutrin (bupropion hydrochloride). Prescribing information. GlaxoSmithKline; 2017. Accessed June 5, 2024. https://www.accessdata.fda.gov/drugsatfda_docs/label/2017/018644s052lbl.pdf
115. Paxil (paroxetine). Prescribing information. Apotex Inc.; 2021. Accessed June 5, 2024. https://www.accessdata.fda.gov/drugsatfda_docs/label/2021/020031s077lbl.pdf
116. Johnson DB, Lopez MJ, Kelley B. Dexamethasone. StatPearls. Updated May 2, 2023. Accessed June 5, 2024. https://www.ncbi.nlm.nih.gov/books/NBK482130/
117. Hemady (dexamethasone). Prescribing information. Dexcel Pharma; 2019. Accessed June 5, 2024. https://www.accessdata.fda.gov/drugsatfda_docs/label/2019/211379s000lbl.pdf
118. Parker SD, King N, Jacobs TF. Pegfilgrastim. StatPearls. Updated May 9, 2024. Accessed June 5, 2024. https://www.ncbi.nlm.nih.gov/books/NBK532893/
119. Fylnetra (pegfilgrastim-pbbk). Prescribing information. Kashiv BioSciences; 2022. Accessed June 5, 2024. https://www.accessdata.fda.gov/drugsatfda_docs/label/2022/761084s000lbl.pdf
120. Emend (aprepitant). Prescribing information. Merck; 2015. Accessed June 5, 2024. https://www.accessdata.fda.gov/drugsatfda_docs/label/2015/207865lbl.pdf
121. Lipitor (atorvastatin calcium). Prescribing information. Viatris Specialty; 2022. Accessed June 5, 2024. https://www.accessdata.fda.gov/drugsatfda_docs/label/2022/020702Orig1s079correctedlbl.pdf
122. Cipro (ciprofloxacin hydrochloride). Prescribing information. Bayer HealthCare Pharmaceuticals Inc.; 2020. Accessed June 5, 2024. https://www.accessdata.fda.gov/drugsatfda_docs/label/2020/019537s090,020780s047lbl.pdf
123. Pino MA, Azer SA. Cimetidine. StatPearls. Updated March 6, 2023. Accessed June 5, 2024. https://www.ncbi.nlm.nih.gov/books/NBK544255/
124. Tagament (Cimetidine). Prescribing information. Mylan; 2020. Accessed June 5, 2024. https://www.accessdata.fda.gov/drugsatfda_docs/label/2020/020238Orig1s024lbl.pdf
125. Neupogen (filgrastim). Prescribing information. Amgen Inc.; 2015. Accessed June 5, 2024. https://www.accessdata.fda.gov/drugsatfda_docs/label/2015/103353s5184lbl.pdf
126. Flagyl (metronidazole). Prescribing information. Pfizer; 2013. Accessed June 5, 2024. https://www.accessdata.fda.gov/drugsatfda_docs/label/2013/020334s008lbl.pdf
127. Zymaxid (gatifloxacin ophthalmic solution). Prescribing information. Allergan; 2016. Accessed June 5, 2024. https://www.accessdata.fda.gov/drugsatfda_docs/label/2016/022548s002lbl.pdf
128. Macrobid (nitrofurantoin monohydrate). Prescribing information. Procter and Gamble Pharmaceutical Inc.; 2009. Accessed June 5, 2024. https://www.accessdata.fda.gov/drugsatfda_docs/label/2009/020064s019lbl.pdf
129. Hyzaar (losartan). Prescribing information. Merck; 2020. Accessed June 5, 2024. https://www.accessdata.fda.gov/drugsatfda_docs/label/2020/020387s067lbl.pdf
Background
Paclitaxel was first derived from the bark of the yew tree (Taxus brevifolia). It was discovered as part of a National Cancer Institute program screen of plants and natural products with putative anticancer activity during the 1960s.1-9 Paclitaxel works by suppressing spindle microtube dynamics, which results in the blockage of the metaphase-anaphase transitions, inhibition of mitosis, and induction of apoptosis in a broad spectrum of cancer cells. Paclitaxel also displayed additional anticancer activities, including the suppression of cell proliferation and antiangiogenic effects. However, since the growth of normal body cells may also be affected, other adverse effects (AEs) will also occur.8-18
Two different chemotherapy drugs contain paclitaxel—paclitaxel and nab-paclitaxel—and the US Food and Drug Administration (FDA) recognizes them as separate entities.19-21 Taxol (paclitaxel) was approved by the FDA in 1992 for treating advanced ovarian cancer.20 It has since been approved for the treatment of metastatic breast cancer, AIDS-related Kaposi sarcoma (as an orphan drug), non-small cell lung cancer (NSCLC), and cervical cancers (in combination withbevacizumab) in 1994, 1997, 1999, and 2014, respectively.21 Since 2002, a generic version of Taxol, known as paclitaxel injectable, has been FDA-approved from different manufacturers. According to the National Cancer Institute, a combination of carboplatin and Taxol is approved to treat carcinoma of unknown primary, cervical, endometrial, NSCLC, ovarian, and thymoma cancers.19 Abraxane (nab-paclitaxel) was FDA-approved to treat metastatic breast cancer in 2005. It was later approved for first-line treatment of advanced NSCLC and late-stage pancreatic cancer in 2012 and 2013, respectively. In 2018 and 2020, both Taxol and Abraxane were approved for first-line treatment of metastatic squamous cell NSCLC in combination with carboplatin and pembrolizumab and metastatic triple-negative breast cancer in combination with pembrolizumab, respectively.22-26 In 2019, Abraxane was approved with atezolizumab to treat metastatic triple-negative breast cancer, but this approval was withdrawn in 2021. In 2022, a generic version of Abraxane, known as paclitaxel protein-bound, was released in the United States. Furthermore, paclitaxel-containing formulations also are being studied in the treatment of other types of cancer.19-32
One of the main limitations of paclitaxel is its low solubility in water, which complicates its drug supply. To distribute this hydrophobic anticancer drug efficiently, paclitaxel is formulated and administered to patients via polyethoxylated castor oil or albumin-bound (nab-paclitaxel). However, polyethoxylated castor oil induces complement activation and is the cause of common hypersensitivity reactions related to paclitaxel use.2,17,33-38 Therefore, many alternatives to polyethoxylated castor oil have been researched.
Since 2000, new paclitaxel formulations have emerged using nanomedicine techniques. The difference between these formulations is the drug vehicle. Different paclitaxel-based nanotechnological vehicles have been developed and approved, such as albumin-based nanoparticles, polymeric lipidic nanoparticles, polymeric micelles, and liposomes, with many others in clinical trial phases.3,37 Albumin-based nanoparticles have a high response rate (33%), whereas the response rate for polyethoxylated castor oil is 25% in patients with metastatic breast cancer.33,39-52 The use of paclitaxel dimer nanoparticles also has been proposed as a method for increasing drug solubility.33,53
Paclitaxel is metabolized by cytochrome P450 (CYP) isoenzymes 2C8 and 3A4. When administering paclitaxel with known inhibitors, inducers, or substrates of CYP2C8 or CYP3A4, caution is required.19-22 Regulations for CYP research were not issued until 2008, so potential interactions between paclitaxel and other drugs have not been extensively evaluated in clinical trials. A study of 12 kinase inhibitors showed strong inhibition of CYP2C8 and/or CYP3A4 pathways by these inhibitors, which could alter the ratio of paclitaxel metabolites in vivo, leading to clinically relevant changes.54 Differential metabolism has been linked to paclitaxel-induced neurotoxicity in patients with cancer.55 Nonetheless, variants in the CYP2C8, CYP3A4, CYP3A5, and ABCB1 genes do not account for significant interindividual variability in paclitaxel pharmacokinetics.56 In liver microsomes, losartan inhibited paclitaxel metabolism when used at concentrations > 50 µmol/L.57 Many drug-drug interaction (DDI) studies of CYP2C8 and CYP3A4 have shown similar results for paclitaxel.58-64
The goals of this study are to investigate prescribed drugs used with paclitaxel and determine patient outcomes through several Military Health System (MHS) databases. The investigation focused on (1) the functions of paclitaxel; (2) identifying AEs that patients experienced; (3) evaluating differences when paclitaxel is used alone vs concomitantly and between the completed vs discontinued treatment groups; (4) identifying all drugs used during paclitaxel treatment; and (5) evaluating DDIs with antidepressants (that have an FDA boxed warning and are known to have DDIs confirmed in previous publications) and other drugs.65-67
The Walter Reed National Military Medical Center in Bethesda, Maryland, institutionalreview board approved the study protocol and ensured compliance with the Health Insurance Portability and Accountability Act as an exempt protocol. The Joint Pathology Center (JPC) of the US Department of Defense (DoD) Cancer Registry Program and MHS data experts from the Comprehensive Ambulatory/Professional Encounter Record (CAPER) and the Pharmacy Data Transaction Service (PDTS) provided data for the analysis.
METHODS
The DoD Cancer Registry Program was established in 1986 and currently contains data from 1998 to 2024. CAPER and PDTS are part of the MHS Data Repository/Management Analysis and Reporting Tool database. Each observation in the CAPER record represents an ambulatory encounter at a military treatment facility (MTF). CAPER includes data from 2003 to 2024.
Each observation in the PDTS record represents a prescription filled for an MHS beneficiary at an MTF through the TRICARE mail-order program or a US retail pharmacy. Missing from this record are prescriptions filled at international civilian pharmacies and inpatient pharmacy prescriptions. The MHS Data Repository PDTS record is available from 2002 to 2024. The legacy Composite Health Care System is being replaced by GENESIS at MTFs.
Data Extraction Design
The study design involved a cross-sectional analysis. We requested data extraction for paclitaxel from 1998 to 2022. Data from the DoD Cancer Registry Program were used to identify patients who received cancer treatment. Once patients were identified, the CAPER database was searched for diagnoses to identify other health conditions, whereas the PDTS database was used to populate a list of prescription medications filled during chemotherapy treatment.
Data collected from the JPC included cancer treatment, cancer information, demographics, and physicians’ comments on AEs. Collected data from the MHS include diagnosis and filled prescription history from initiation to completion of the therapy period (or 2 years after the diagnosis date). For the analysis of the DoD Cancer Registry Program and CAPER databases, we used all collected data without excluding any. When analyzing PDTS data, we excluded patients with PDTS data but without a record of paclitaxel being filled, or medications filled outside the chemotherapy period (by evaluating the dispensed date and day of supply).
Data Extraction Analysis
The Surveillance, Epidemiology, and End Results Program Coding and Staging Manual 2016 and the International Classification of Diseases for Oncology, 3rd edition, 1st revision, were used to decode disease and cancer types.68,69 Data sorting and analysis were performed using Microsoft Excel. The percentage for the total was calculated by using the number of patients or data available within the paclitaxel groups divided by the total number of patients or data variables. The subgroup percentage was calculated by using the number of patients or data available within the subgroup divided by the total number of patients in that subgroup.
In alone vs concomitant and completed vs discontinued treatment groups, a 2-tailed, 2-sample z test was used to statistical significance (P < .05) using a statistics website.70 Concomitant was defined as paclitaxel taken with other antineoplastic agent(s) before, after, or at the same time as cancer therapy. For the retrospective data analysis, physicians’ notes with a period, comma, forward slash, semicolon, or space between medication names were interpreted as concurrent, whereas plus (+), minus/plus (-/+), or “and” between drug names that were dispensed on the same day were interpreted as combined with known common combinations: 2 drugs (DM886 paclitaxel and carboplatin and DM881-TC-1 paclitaxel and cisplatin) or 3 drugs (DM887-ACT doxorubicin, cyclophosphamide, and paclitaxel). Completed treatment was defined as paclitaxel as the last medication the patient took without recorded AEs; switching or experiencing AEs was defined as discontinued treatment.
RESULTS
The JPC provided 702 entries for 687 patients with a mean age of 56 years (range, 2 months to 88 years) who were treated with paclitaxel from March 1996 to October 2021. Fifteen patients had duplicate entries because they had multiple cancer sites or occurrences. There were 623 patients (89%) who received paclitaxel for FDA-approved indications. The most common types of cancer identified were 344 patients with breast cancer (49%), 91 patients with lung cancer (13%), 79 patients with ovarian cancer (11%), and 75 patients with endometrial cancer (11%) (Table 1). Seventy-nine patients (11%) received paclitaxel for cancers that were not for FDA-approved indications, including 19 for cancers of the fallopian tube (3%) and 17 for esophageal cancer (2%) (Table 2).
There were 477 patients (68%) aged > 50 years. A total of 304 patients (43%) had a stage III or IV cancer diagnosis and 398 (57%) had stage II or lower (combination of data for stages 0, I, and II; not applicable; and unknown) cancer diagnosis. For systemic treatment, 16 patients (2%) were treated with paclitaxel alone and 686 patients (98%) received paclitaxel concomitantly with additional chemotherapy: 59 patients (9%) in the before or after group, 410 patients (58%) had a 2-drug combination, 212 patients (30%) had a 3-drug combination, and 5 patients (1%) had a 4-drug combination. In addition, for doublet therapies, paclitaxel combined with carboplatin, trastuzumab, gemcitabine, or cisplatin had more patients (318, 58, 12, and 11, respectively) than other combinations (≤ 4 patients). For triplet therapies, paclitaxel combined withdoxorubicin plus cyclophosphamide or carboplatin plus bevacizumab had more patients (174 and 20, respectively) than other combinations, including quadruplet therapies (≤ 4 patients) (Table 3).
Patients were more likely to discontinue paclitaxel if they received concomitant treatment. None of the 16 patients receiving paclitaxel monotherapy experienced AEs, whereas 364 of 686 patients (53%) treated concomitantly discontinued (P < .001). Comparisons of 1 drug vs combination (2 to 4 drugs) and use for treating cancers that were FDA-approved indications vs off-label use were significant (P < .001), whereas comparisons of stage II or lower vs stage III and IV cancer and of those aged ≤ 50 years vs aged > 50 years were not significant (P = .50 andP = .30, respectively) (Table 4).
Among the 364 patients who had concomitant treatment and had discontinued their treatment, 332 (91%) switched treatments with no AEs documented and 32 (9%) experienced fatigue with pneumonia, mucositis, neuropathy, neurotoxicity, neutropenia, pneumonitis, allergic or hypersensitivity reaction, or an unknown AE. Patients who discontinued treatment because of unknown AEs had a physician’s note that detailed progressive disease, a significant decline in performance status, and another unknown adverse effect due to a previous sinus tract infection and infectious colitis (Table 5).
Management Analysis and Reporting Tool Database
MHS data analysts provided data on diagnoses for 639 patients among 687 submitteddiagnoses, with 294 patients completing and 345 discontinuing paclitaxel treatment. Patients in the completed treatment group had 3 to 258 unique health conditions documented, while patients in the discontinued treatment group had 4 to 181 unique health conditions documented. The MHS reported 3808 unique diagnosis conditions for the completed group and 3714 for the discontinued group (P = .02).
The mean (SD) number of diagnoses was 51 (31) for the completed and 55 (28) for the discontinued treatment groups (Figure). Among 639 patients who received paclitaxel, the top 5 diagnoses were administrative, including encounters for other administrative examinations; antineoplastic chemotherapy; administrative examination for unspecified; other specified counseling; and adjustment and management of vascular access device. The database does not differentiate between administrative and clinically significant diagnoses.
MHS data analysts provided data for 336 of 687 submitted patients who were prescribed paclitaxel; 46 patients had no PDTS data, and 305 patients had PDTS data without paclitaxel, Taxol, or Abraxane dispensed. Medications that were filled outside the chemotherapy period were removed by evaluating the dispensed date and day of supply. Among these 336 patients, 151 completed the treatment and 185 discontinued, with 14 patients experiencing documented AEs. Patients in the completed treatment group filled 9 to 56 prescriptions while patients in the discontinued treatment group filled 6 to 70 prescriptions.Patients in the discontinued group filled more prescriptions than those who completed treatment: 793 vs 591, respectively (P = .34).
The mean (SD) number of filled prescription drugs was 24 (9) for the completed and 34 (12) for the discontinued treatment group. The 5 most filled prescriptions with paclitaxel from 336 patients with PDTS data were dexamethasone (324 prescriptions with 14 recorded AEs), diphenhydramine (296 prescriptions with 12 recorded AEs), ondansetron (277 prescriptions with 11 recorded AEs), prochlorperazine (265 prescriptions with 12 recorded AEs), and sodium chloride (232 prescriptions with 11 recorded AEs).
DISCUSSION
As a retrospective review, this study is more limited in the strength of its conclusions when compared to randomized control trials. The DoD Cancer Registry Program only contains information about cancer types, stages, treatment regimens, and physicians’ notes. Therefore, noncancer drugs are based solely on the PDTS database. In most cases, physicians' notes on AEs were not detailed. There was no distinction between initial vs later lines of therapy and dosage reductions. The change in status or appearance of a new medical condition did not indicate whether paclitaxel caused the changes to develop or directly worsen a pre-existing condition. The PDTS records prescriptions filled, but that may not reflect patients taking prescriptions.
Paclitaxel
Paclitaxel has a long list of both approved and off-label uses in malignancies as a primary agent and in conjunction with other drugs. The FDA prescribing information for Taxol and Abraxane was last updated in April 2011 and September 2020, respectively.20,21 The National Institutes of Health National Library of Medicine has the current update for paclitaxel on July 2023.19,22 Thus, the prescribed information for paclitaxel referenced in the database may not always be up to date. The combinations of paclitaxel with bevacizumab, carboplatin, or carboplatin and pembrolizumab were not in the Taxol prescribing information. Likewise, a combination of nab-paclitaxel with atezolizumab or carboplatin and pembrolizumab is missing in the Abraxane prescribing information.22-27
The generic name is not the same as a generic drug, which may have slight differences from the brand name product.71 The generic drug versions of Taxol and Abraxane have been approved by the FDA as paclitaxel injectable and paclitaxel-protein bound, respectively. There was a global shortage of nab-paclitaxel from October 2021 to June 2022 because of a manufacturing problem.72 During this shortage, data showed similar comments from physician documents that treatment switched to Taxol due to the Abraxane shortage.
Of 336 patients in the PDTS database with dispensed paclitaxel prescriptions, 276 received paclitaxel (year dispensed, 2013-2022), 27 received Abraxane (year dispensed, 2013-2022), 47 received Taxol (year dispensed, 2004-2015), 8 received both Abraxane and paclitaxel, and 6 received both Taxol and paclitaxel. Based on this information, it appears that the distinction between the drugs was not made in the PDTS until after 2015, 10 years after Abraxane received FDA approval. Abraxane was prescribed in the MHS in 2013, 8 years after FDA approval. There were a few comparison studies of Abraxane and Taxol.73-76
Safety and effectiveness in pediatric patients have not been established for paclitaxel. According to the DoD Cancer Registry Program, the youngest patient was aged 2 months. In 2021, this patient was diagnosed with corpus uteri and treated with carboplatin and Taxol in course 1; in course 2, the patient reacted to Taxol; in course 3, Taxol was replaced with Abraxane; in courses 4 to 7, the patient was treated with carboplatin only.
Discontinued Treatment
Ten patients had prescribed Taxol that was changed due to AEs: 1 was switched to Abraxane and atezolizumab, 3 switched to Abraxane, 2 switched to docetaxel, 1 switched to doxorubicin, and 3 switched to pembrolizumab (based on physician’s comments). Of the 10 patients, 7 had Taxol reaction, 2 experienced disease progression, and 1 experienced high programmed death–ligand 1 expression (this patient with breast cancer was switched to Abraxane and atezolizumab during the accelerated FDA approval phase for atezolizumab, which was later revoked). Five patients were treated with carboplatin and Taxol for cancer of the anal canal (changed to pembrolizumab after disease progression), lung not otherwise specified (changed to carboplatin and pembrolizumab due to Taxol reaction), lower inner quadrant of the breast (changed to doxorubicin due to hypersensitivity reaction), corpus uteri (changed to Abraxane due to Taxol reaction), and ovary (changed to docetaxel due to Taxol reaction). Three patients were treated with doxorubicin, cyclophosphamide, and Taxol for breast cancer; 2 patients with breast cancer not otherwise specified switched to Abraxane due to cardiopulmonary hypersensitivity and Taxol reaction and 1 patient with cancer of the upper outer quadrant of the breast changed to docetaxel due to allergic reaction. One patient, who was treated with paclitaxel, ifosfamide, and cisplatin for metastasis of the lower lobe of the lung and kidney cancer, experienced complications due to infectious colitis (treated with ciprofloxacin) and then switched to pembrolizumab after the disease progressed. These AEs are known in paclitaxel medical literature on paclitaxel AEs.19-24,77-81
Combining 2 or more treatments to target cancer-inducing or cell-sustaining pathways is a cornerstone of chemotherapy.82-84 Most combinations are given on the same day, but some are not. For 3- or 4-drug combinations, doxorubicin and cyclophosphamide were given first, followed by paclitaxel with or withouttrastuzumab, carboplatin, or pembrolizumab. Only 16 patients (2%) were treated with paclitaxel alone; therefore, the completed and discontinued treatment groups are mostly concomitant treatment. As a result, the comparisons of the completed and discontinued treatment groups were almost the same for the diagnosis. The PDTS data have a better result because 2 exclusion criteria were applied before narrowing the analysis down to paclitaxel treatment specifically.
Antidepressants and Other Drugs
Drug response can vary from person to person and can lead to treatment failure related to AEs. One major factor in drug metabolism is CYP.85 CYP2C8 is the major pathway for paclitaxel and CYP3A4 is the minor pathway. When evaluating the noncancer drugs, there were no reports of CYP2C8 inhibition or induction.Over the years, many DDI warnings have been issued for paclitaxel with different drugs in various electronic resources.
Oncologists follow guidelines to prevent DDIs, as paclitaxel is known to have severe, moderate, and minor interactions with other drugs. Among 687 patients, 261 (38%) were prescribed any of 14 antidepressants. Eight of these antidepressants (amitriptyline, citalopram, desipramine, doxepin, venlafaxine, escitalopram, nortriptyline, and trazodone) are metabolized, 3 (mirtazapine, sertraline, and fluoxetine) are metabolized and inhibited, 2 (bupropion and duloxetine) are neither metabolized nor inhibited, and 1 (paroxetine) is inhibited by CYP3A4. Duloxetine, venlafaxine, and trazodone were more commonly dispensed (84, 78, and 42 patients, respectively) than others (≤ 33 patients).
Of 32 patients with documented AEs,14 (44%) had 168 dispensed drugs in the PDTS database. Six patients (19%) were treated with doxorubicin and cyclophosphamide followed by paclitaxel for breast cancer; 6 (19%) were treated with carboplatin and paclitaxel for cancer of the lung (n = 3), corpus uteri (n = 2), and ovary (n = 1); 1 patient (3%) was treated with carboplatin and paclitaxel, then switched to carboplatin, bevacizumab, and paclitaxel, and then completed treatment with carboplatin and paclitaxel for an unspecified female genital cancer; and 1 patient (3%) was treated with cisplatin, ifosfamide, and paclitaxel for metastasis of the lower lobe lung and kidney cancer.
The 14 patients with PDTS data had 18 cancer drugs dispensed. Eleven had moderate interaction reports and 7 had no interaction reports. A total of 165 noncancer drugs were dispensed, of which 3 were antidepressants and had no interactions reported, 8 had moderate interactions reported, and 2 had minor interactions with Taxol and Abraxane, respectively (Table 6).86-129
Of 3 patients who were dispensed bupropion, nortriptyline, or paroxetine, 1 patient with breast cancer was treated with doxorubicin andcyclophosphamide, followed by paclitaxel with bupropion, nortriptyline, pegfilgrastim,dexamethasone, and 17 other noncancer drugs that had no interaction report dispensed during paclitaxel treatment. Of 2 patients with lung cancer, 1 patient was treated with carboplatin and paclitaxel with nortriptyline, dexamethasone, and 13 additional medications, and the second patient was treated with paroxetine, cimetidine, dexamethasone, and 12 other medications. Patients were dispensed up to6 noncancer medications on the same day as paclitaxel administration to control the AEs, not including the prodrugs filled before the treatments. Paroxetine and cimetidine have weak inhibition, and dexamethasone has weak induction of CYP3A4. Therefore, while 1:1 DDIs might have little or no effect with weak inhibit/induce CYP3A4 drugs, 1:1:1 or more combinations could have a different outcome (confirmed in previous publications).65-67
Dispensed on the same day may not mean taken at the same time. One patient experienced an AE with dispensed 50 mg losartan, carboplatin plus paclitaxel, dexamethasone, and 6 other noncancer drugs. Losartan inhibits paclitaxel, which can lead to negative AEs.57,66,67 However, there were no blood or plasma samples taken to confirm the losartan was taken at the same time as the paclitaxel given this was not a clinical trial.
Conclusions
This retrospective study discusses the use of paclitaxel in the MHS and the potential DDIs associated with it. The study population consisted mostly of active-duty personnel, who are required to be healthy or have controlled or nonactive medical diagnoses and be physically fit. This group is mixed with dependents and retirees that are more reflective of the average US population. As a result, this patient population is healthier than the general population, with a lower prevalence of common illnesses such as diabetes and obesity. The study aimed to identify drugs used alongside paclitaxel treatment. While further research is needed to identify potential DDIs among patients who experienced AEs, in vitro testing will need to be conducted before confirming causality. The low number of AEs experienced by only 32 of 702 patients (5%), with no deaths during paclitaxel treatment, indicates that the drug is generally well tolerated. Although this study cannot conclude that concomitant use with noncancer drugs led to the discontinuation of paclitaxel, we can conclude that there seems to be no significant DDIsidentified between paclitaxel and antidepressants. This comprehensive overview provides clinicians with a complete picture of paclitaxel use for 27 years (1996-2022), enabling them to make informed decisions about paclitaxel treatment.
Acknowledgments
The Department of Research Program funds at Walter Reed National Military Medical Center supported this protocol. We sincerely appreciate the contribution of data extraction from the Joint Pathology Center teams (Francisco J. Rentas, John D. McGeeney, Beatriz A. Hallo, and Johnny P. Beason) and the MHS database personnel (Maj Ryan Costantino, Brandon E. Jenkins, and Alexander G. Rittel). We gratefully thank you for the protocol support from the Department of Research programs: CDR Martin L. Boese, CDR Wesley R. Campbell, Maj. Abhimanyu Chandel, CDR Ling Ye, Chelsea N. Powers, Yaling Zhou, Elizabeth Schafer, Micah Stretch, Diane Beaner, and Adrienne Woodard.
1. American Chemical Society. Discovery of camptothecin and taxol. acs.org. Accessed June 4, 2024. https://www.acs.org/education/whatischemistry/landmarks/camptothecintaxol.html
2. Bocci G, Di Paolo A, Danesi R. The pharmacological bases of the antiangiogenic activity of paclitaxel. Angiogenesis. 2013;16(3):481-492. doi:10.1007/s10456-013-9334-0.
3. Meštrovic T. Paclitaxel history. News Medical Life Sciences. Updated March 11, 2023. Accessed June 4, 2024. https://www.news-medical.net/health/Paclitaxel-History.aspx
4. Rowinsky EK, Donehower RC. Paclitaxel (taxol). N Engl J Med. 1995;332(15):1004-1014. doi:10.1056/NEJM199504133321507
5. Walsh V, Goodman J. The billion dollar molecule: Taxol in historical and theoretical perspective. Clio Med. 2002;66:245-267. doi:10.1163/9789004333499_013
6. Perdue RE, Jr, Hartwell JL. The search for plant sources of anticancer drugs. Morris Arboretum Bull. 1969;20:35-53.
7. Wall ME, Wani MC. Camptothecin and taxol: discovery to clinic—thirteenth Bruce F. Cain Memorial Award lecture. Cancer Res. 1995;55:753-760.
8. Wani MC, Taylor HL, Wall ME, Coggon P, McPhail AT. Plant antitumor agents. VI. The isolation and structure of taxol, a novel antileukemic and antitumor agent from taxus brevifolia. J Am Chem Soc. 1971;93(9):2325-2327. doi:10.1021/ja00738a045
9. Weaver BA. How taxol/paclitaxel kills cancer cells. Mol Biol Cell. 2014;25(18):2677-2681. doi:10.1091/mbc.E14-04-0916
10. Chen JG, Horwitz SB. Differential mitotic responses to microtubule-stabilizing and-destabilizing drugs. Cancer Res. 2002;62(7):1935-1938.
11. Singh S, Dash AK. Paclitaxel in cancer treatment: perspectives and prospects of its delivery challenges. Crit Rev Ther Drug Carrier Syst. 2009;26(4):333-372. doi:10.1615/critrevtherdrugcarriersyst.v26.i4.10
12. Schiff PB, Fant J, Horwitz SB. Promotion of microtubule assembly in vitro by taxol. Nature. 1979;277(5698):665-667. doi:10.1038/277665a0
13. Fuchs DA, Johnson RK. Cytologic evidence that taxol, an antineoplastic agent from taxus brevifolia, acts as a mitotic spindle poison. Cancer Treat Rep. 1978;62(8):1219-1222.
14. Walsh V, Goodman J. From taxol to taxol: the changing identities and ownership of an anti-cancer drug. Med Anthropol. 2002;21(3-4):307-336. doi:10.1080/01459740214074
15. Walsh V, Goodman J. Cancer chemotherapy, biodiversity, public and private property: the case of the anti-cancer drug taxol. Soc Sci Med. 1999;49(9):1215-1225. doi:10.1016/s0277-9536(99)00161-6
16. Jordan MA, Wendell K, Gardiner S, Derry WB, Copp H, Wilson L. Mitotic block induced in HeLa cells by low concentrations of paclitaxel (taxol) results in abnormal mitotic exit and apoptotic cell death. Cancer Res. 1996;56(4):816-825.
17. Picard M, Castells MC. Re-visiting hypersensitivity reactions to taxanes: a comprehensive review. Clin Rev Allergy Immunol. 2015;49(2):177-191. doi:10.1007/s12016-014-8416-0
18. Zasadil LM, Andersen KA, Yeum D, et al. Cytotoxicity of paclitaxel in breast cancer is due to chromosome missegregation on multipolar spindles. Sci Transl Med. 2014;6:229ra243. doi:10.1126/scitranslmed.3007965
19. National Cancer Institute. Carboplatin-Taxol. Published May 30, 2012. Updated March 22, 2023. Accessed June 4, 2024. https://www.cancer.gov/about-cancer/treatment/drugs/carboplatin-taxol
20. Taxol (paclitaxel). Prescribing information. Bristol-Myers Squibb; 2011. Accessed June 4, 2024. https://www.accessdata.fda.gov/drugsatfda_docs/label/2011/020262s049lbl.pdf
21. Abraxane (paclitaxel). Prescribing information. Celgene Corporation; 2021. Accessed June 4, 2024. https://www.accessdata.fda.gov/drugsatfda_docs/label/2020/021660s047lbl.pdf
22. Awosika AO, Farrar MC, Jacobs TF. Paclitaxel. StatPearls. Updated November 18, 2023. Accessed June 5, 2024. https://www.ncbi.nlm.nih.gov/books/NBK536917/
23. Gerriets V, Kasi A. Bevacizumab. StatPearls. Updated September 1, 2022. Accessed June 5, 2024. https://www.ncbi.nlm.nih.gov/books/NBK482126/
24. American Cancer Society. Chemotherapy for endometrial cancer. Updated March 27, 2019. Accessed June 4, 2024. https://www.cancer.org/cancer/types/endometrial-cancer/treating/chemotherapy.html
25. US Food and Drug Administration. FDA approves pembrolizumab in combination with chemotherapy for first-line treatment of metastatic squamous NSCLC. October 30, 2018. Updated December 14, 2018. Accessed June 4, 2024. https://www.fda.gov/drugs/fda-approves-pembrolizumab-combination-chemotherapy-first-line-treatment-metastatic-squamous-nsclc
26. US Food and Drug Administration. FDA grants accelerated approval to pembrolizumab for locally recurrent unresectable or metastatic triple negative breast cancer. November 13, 2020. Accessed June 4, 2024. https://www.fda.gov/drugs/resources-information-approved-drugs/fda-grants-accelerated-approval-pembrolizumab-locally-recurrent-unresectable-or-metastatic-triple
27. US Food and Drug Administration. FDA approves atezolizumab for PD-L1 positive unresectable locally advanced or metastatic triple-negative breast. March 8, 2019. Updated March 18, 2019. Accessed June 5, 2024. https://www.fda.gov/drugs/drug-approvals-and-databases/fda-approves-atezolizumab-pd-l1-positive-unresectable-locally-advanced-or-metastatic-triple-negative
28. US Food and Drug Administration. FDA issues alert about efficacy and potential safety concerns with atezolizumab in combination with paclitaxel for treatment of breast cancer. September 8, 2020. Accessed June 5, 2024. https://www.fda.gov/drugs/resources-information-approved-drugs/fda-issues-alert-about-efficacy-and-potential-safety-concerns-atezolizumab-combination-paclitaxel
29. Tan AR. Chemoimmunotherapy: still the standard of care for metastatic triple-negative breast cancer. ASCO Daily News. February 23, 2022. Accessed June 5, 2024. https://dailynews.ascopubs.org/do/chemoimmunotherapy-still-standard-care-metastatic-triple-negative-breast-cancer
30. McGuire WP, Rowinsky EK, Rosenshein NB, et al. Taxol: a unique antineoplastic agent with significant activity in advanced ovarian epithelial neoplasms. Ann Intern Med. 1989;111(4):273-279. doi:10.7326/0003-4819-111-4-273
31. Milas L, Hunter NR, Kurdoglu B, et al. Kinetics of mitotic arrest and apoptosis in murine mammary and ovarian tumors treated with taxol. Cancer Chemother Pharmacol. 1995;35(4):297-303. doi:10.1007/BF00689448
32. Searle J, Collins DJ, Harmon B, Kerr JF. The spontaneous occurrence of apoptosis in squamous carcinomas of the uterine cervix. Pathology. 1973;5(2):163-169. doi:10.3109/00313027309060831
33. Gallego-Jara J, Lozano-Terol G, Sola-Martínez RA, Cánovas-Díaz M, de Diego Puente T. A compressive review about taxol®: history and future challenges. Molecules. 2020;25(24):5986. doi:10.3390/molecules25245986
34. Bernabeu E, Cagel M, Lagomarsino E, Moretton M, Chiappetta DA. Paclitaxel: What has been done and the challenges remain ahead. Int J Pharm. 2017;526(1-2):474-495. doi:10.1016/j.ijpharm.2017.05.016
35. Nehate C, Jain S, Saneja A, et al. Paclitaxel formulations: challenges and novel delivery options. Curr Drug Deliv. 2014;11(6):666-686. doi:10.2174/1567201811666140609154949
36. Gelderblom H, Verweij J, Nooter K, Sparreboom A, Cremophor EL. The drawbacks and advantages of vehicle selection for drug formulation. Eur J Cancer. 2001;37(13):1590-1598. doi:10.1016/S0959-8049(01)00171-x
37. Chowdhury MR, Moshikur RM, Wakabayashi R, et al. In vivo biocompatibility, pharmacokinetics, antitumor efficacy, and hypersensitivity evaluation of ionic liquid-mediated paclitaxel formulations. Int J Pharm. 2019;565:219-226. doi:10.1016/j.ijpharm.2019.05.020
38. Borgå O, Henriksson R, Bjermo H, Lilienberg E, Heldring N, Loman N. Maximum tolerated dose and pharmacokinetics of paclitaxel micellar in patients with recurrent malignant solid tumours: a dose-escalation study. Adv Ther. 2019;36(5):1150-1163. doi:10.1007/s12325-019-00909-6
39. Rouzier R, Rajan R, Wagner P, et al. Microtubule-associated protein tau: a marker of paclitaxel sensitivity in breast cancer. Proc Natl Acad Sci USA. 2005;102(23):8315-8320. doi:10.1073/pnas.0408974102
40. Choudhury H, Gorain B, Tekade RK, Pandey M, Karmakar S, Pal TK. Safety against nephrotoxicity in paclitaxel treatment: oral nanocarrier as an effective tool in preclinical evaluation with marked in vivo antitumor activity. Regul Toxicol Pharmacol. 2017;91:179-189. doi:10.1016/j.yrtph.2017.10.023
41. Barkat MA, Beg S, Pottoo FH, Ahmad FJ. Nanopaclitaxel therapy: an evidence based review on the battle for next-generation formulation challenges. Nanomedicine (Lond). 2019;14(10):1323-1341. doi:10.2217/nnm-2018-0313
42. Sofias AM, Dunne M, Storm G, Allen C. The battle of “nano” paclitaxel. Adv Drug Deliv Rev. 2017;122:20-30. doi:10.1016/j.addr.2017.02.003
43. Yang N, Wang C, Wang J, et al. Aurora inase a stabilizes FOXM1 to enhance paclitaxel resistance in triple-negative breast cancer. J Cell Mol Med. 2019;23(9):6442-6453. doi:10.1111/jcmm.14538
44. Chowdhury MR, Moshikur RM, Wakabayashi R, et al. Ionic-liquid-based paclitaxel preparation: a new potential formulation for cancer treatment. Mol Pharm. 2018;15(16):2484-2488. doi:10.1021/acs.molpharmaceut.8b00305
45. Chung HJ, Kim HJ, Hong ST. Tumor-specific delivery of a paclitaxel-loading HSA-haemin nanoparticle for cancer treatment. Nanomedicine. 2020;23:102089. doi:10.1016/j.nano.2019.102089
46. Ye L, He J, Hu Z, et al. Antitumor effect and toxicity of lipusu in rat ovarian cancer xenografts. Food Chem Toxicol. 2013;52:200-206. doi:10.1016/j.fct.2012.11.004
47. Ma WW, Lam ET, Dy GK, et al. A pharmacokinetic and dose-escalating study of paclitaxel injection concentrate for nano-dispersion (PICN) alone and with arboplatin in patients with advanced solid tumors. J Clin Oncol. 2013;31:2557. doi:10.1200/jco.2013.31.15_suppl.2557
48. Micha JP, Goldstein BH, Birk CL, Rettenmaier MA, Brown JV. Abraxane in the treatment of ovarian cancer: the absence of hypersensitivity reactions. Gynecol Oncol. 2006;100(2):437-438. doi:10.1016/j.ygyno.2005.09.012
49. Ingle SG, Pai RV, Monpara JD, Vavia PR. Liposils: an effective strategy for stabilizing paclitaxel loaded liposomes by surface coating with silica. Eur J Pharm Sci. 2018;122:51-63. doi:10.1016/j.ejps.2018.06.025
50. Abriata JP, Turatti RC, Luiz MT, et al. Development, characterization and biological in vitro assays of paclitaxel-loaded PCL polymeric nanoparticles. Mater Sci Eng C Mater Biol Appl. 2019;96:347-355. doi:10.1016/j.msec.2018.11.035
51. Hu J, Fu S, Peng Q, et al. Paclitaxel-loaded polymeric nanoparticles combined with chronomodulated chemotherapy on lung cancer: in vitro and in vivo evaluation. Int J Pharm. 2017;516(1-2):313-322. doi:10.1016/j.ijpharm.2016.11.047
52. Dranitsaris G, Yu B, Wang L, et al. Abraxane® vs Taxol® for patients with advanced breast cancer: a prospective time and motion analysis from a chinese health care perspective. J Oncol Pharm Pract. 2016;22(2):205-211. doi:10.1177/1078155214556008
53. Pei Q, Hu X, Liu S, Li Y, Xie Z, Jing X. Paclitaxel dimers assembling nanomedicines for treatment of cervix carcinoma. J Control Release. 2017;254:23-33. doi:10.1016/j.jconrel.2017.03.391
54. Wang Y, Wang M, Qi H, et al. Pathway-dependent inhibition of paclitaxel hydroxylation by kinase inhibitors and assessment of drug-drug interaction potentials. Drug Metab Dispos. 2014;42(4):782-795. doi:10.1124/dmd.113.053793
55. Shen F, Jiang G, Philips S, et al. Cytochrome P450 oxidoreductase (POR) associated with severe paclitaxel-induced peripheral neuropathy in patients of european ancestry from ECOG-ACRIN E5103. Clin Cancer Res. 2023;29(13):2494-2500. doi:10.1158/1078-0432.CCR-22-2431
56. Henningsson A, Marsh S, Loos WJ, et al. Association of CYP2C8, CYP3A4, CYP3A5, and ABCB1 polymorphisms with the pharmacokinetics of paclitaxel. Clin Cancer Res. 2005;11(22):8097-8104. doi:10.1158/1078-0432.CCR-05-1152
57. Mukai Y, Senda A, Toda T, et al. Drug-drug interaction between losartan and paclitaxel in human liver microsomes with different CYP2C8 genotypes. Basic Clin Pharmacol Toxicol. 2015;116(6):493-498. doi:10.1111/bcpt.12355
58. Kawahara B, Faull KF, Janzen C, Mascharak PK. Carbon monoxide inhibits cytochrome P450 enzymes CYP3A4/2C8 in human breast cancer cells, increasing sensitivity to paclitaxel. J Med Chem. 2021;64(12):8437-8446. doi:10.1021/acs.jmedchem.1c00404
59. Cresteil T, Monsarrat B, Dubois J, Sonnier M, Alvinerie P, Gueritte F. Regioselective metabolism of taxoids by human CYP3A4 and 2C8: structure-activity relationship. Drug Metab Dispos. 2002;30(4):438-445. doi:10.1124/dmd.30.4.438
60. Taniguchi R, Kumai T, Matsumoto N, et al. Utilization of human liver microsomes to explain individual differences in paclitaxel metabolism by CYP2C8 and CYP3A4. J Pharmacol Sci. 2005;97(1):83-90. doi:10.1254/jphs.fp0040603
61. Nakayama A, Tsuchiya K, Xu L, Matsumoto T, Makino T. Drug-interaction between paclitaxel and goshajinkigan extract and its constituents. J Nat Med. 2022;76(1):59-67. doi:10.1007/s11418-021-01552-8
62. Monsarrat B, Chatelut E, Royer I, et al. Modification of paclitaxel metabolism in a cancer patient by induction of cytochrome P450 3A4. Drug Metab Dispos. 1998;26(3):229-233.
63. Walle T. Assays of CYP2C8- and CYP3A4-mediated metabolism of taxol in vivo and in vitro. Methods Enzymol. 1996;272:145-151. doi:10.1016/s0076-6879(96)72018-9
64. Hanioka N, Matsumoto K, Saito Y, Narimatsu S. Functional characterization of CYP2C8.13 and CYP2C8.14: catalytic activities toward paclitaxel. Basic Clin Pharmacol Toxicol. 2010;107(1):565-569. doi:10.1111/j.1742-7843.2010.00543.x
65. Luong TT, Powers CN, Reinhardt BJ, Weina PJ. Pre-clinical drug-drug interactions (DDIs) of gefitinib with/without losartan and selective serotonin reuptake inhibitors (SSRIs): citalopram, fluoxetine, fluvoxamine, paroxetine, sertraline, and venlafaxine. Curr Res Pharmacol Drug Discov. 2022;3:100112. doi:10.1016/j.crphar.2022.100112
66. Luong TT, McAnulty MJ, Evers DL, Reinhardt BJ, Weina PJ. Pre-clinical drug-drug interaction (DDI) of gefitinib or erlotinib with Cytochrome P450 (CYP) inhibiting drugs, fluoxetine and/or losartan. Curr Res Toxicol. 2021;2:217-224. doi:10.1016/j.crtox.2021.05.006
67. Luong TT, Powers CN, Reinhardt BJ, et al. Retrospective evaluation of drug-drug interactions with erlotinib and gefitinib use in the military health system. Fed Pract. 2023;40(suppl 3):S24-S34. doi:10.12788/fp.0401
68. Adamo M, Dickie L, Ruhl J. SEER program coding and staging manual 2016. National Cancer Institute. Accessed June 5, 2024. https://seer.cancer.gov/archive/manuals/2016/SPCSM_2016_maindoc.pdf
69. World Health Organization. International classification of diseases for oncology (ICD-O) 3rd ed, 1st revision. World Health Organization; 2013. Accessed June 5, 2024. https://apps.who.int/iris/handle/10665/96612
70. Z score calculator for 2 population proportions. Social science statistics. Accessed June 5, 2024. https://www.socscistatistics.com/tests/ztest/default2.aspx
71. US Food and Drug Administration. Generic drugs: question & answers. FDA.gov. Accessed June 5, 2024. https://www.fda.gov/drugs/frequently-asked-questions-popular-topics/generic-drugs-questions-answers
72. Oura M, Saito H, Nishikawa Y. Shortage of nab-paclitaxel in Japan and around the world: issues in global information sharing. JMA J. 2023;6(2):192-195. doi:10.31662/jmaj.2022-0179
73. Yuan H, Guo H, Luan X, et al. Albumin nanoparticle of paclitaxel (abraxane) decreases while taxol increases breast cancer stem cells in treatment of triple negative breast cancer. Mol Pharm. 2020;17(7):2275-2286. doi:10.1021/acs.molpharmaceut.9b01221
74. Dranitsaris G, Yu B, Wang L, et al. Abraxane® versus Taxol® for patients with advanced breast cancer: a prospective time and motion analysis from a Chinese health care perspective. J Oncol Pharm Pract. 2016;22(2):205-211. doi:10.1177/1078155214556008
75. Gradishar WJ, Tjulandin S, Davidson N, et al. Phase III trial of nanoparticle albumin-bound paclitaxel compared with polyethylated castor oil-based paclitaxel in women with breast cancer. J Clin Oncol. 2005;23(31):7794-7803. doi:10.1200/JCO.2005.04.
76. Liu M, Liu S, Yang L, Wang S. Comparison between nab-paclitaxel and solvent-based taxanes as neoadjuvant therapy in breast cancer: a systematic review and meta-analysis. BMC Cancer. 2021;21(1):118. doi:10.1186/s12885-021-07831-7
77. Rowinsky EK, Eisenhauer EA, Chaudhry V, Arbuck SG, Donehower RC. Clinical toxicities encountered with paclitaxel (taxol). Semin Oncol. 1993;20(4 Suppl 3):1-15.
78. Banerji A, Lax T, Guyer A, Hurwitz S, Camargo CA Jr, Long AA. Management of hypersensitivity reactions to carboplatin and paclitaxel in an outpatient oncology infusion center: a 5-year review. J Allergy Clin Immunol Pract. 2014;2(4):428-433. doi:10.1016/j.jaip.2014.04.010
79. Staff NP, Fehrenbacher JC, Caillaud M, Damaj MI, Segal RA, Rieger S. Pathogenesis of paclitaxel-induced peripheral neuropathy: a current review of in vitro and in vivo findings using rodent and human model systems. Exp Neurol. 2020;324:113121. doi:10.1016/j.expneurol.2019.113121
80. Postma TJ, Vermorken JB, Liefting AJ, Pinedo HM, Heimans JJ. Paclitaxel-induced neuropathy. Ann Oncol. 1995;6(5):489-494. doi:10.1093/oxfordjournals.annonc.a059220
81. Liu JM, Chen YM, Chao Y, et al. Paclitaxel-induced severe neuropathy in patients with previous radiotherapy to the head and neck region. J Natl Cancer Inst. 1996;88(14):1000-1002. doi:10.1093/jnci/88.14.1000-a
82. Bayat Mokhtari R, Homayouni TS, Baluch N, et al. Combination therapy in combating cancer. Oncotarget. 2017;8(23):38022-38043. doi:10.18632/oncotarget.16723
83. Blagosklonny MV. Analysis of FDA approved anticancer drugs reveals the future of cancer therapy. Cell Cycle. 2004;3(8):1035-1042.
84. Yap TA, Omlin A, de Bono JS. Development of therapeutic combinations targeting major cancer signaling pathways. J Clin Oncol. 2013;31(12):1592-1605. doi:10.1200/JCO.2011.37.6418
85. Gilani B, Cassagnol M. Biochemistry, Cytochrome P450. StatPearls. Updated April 24, 2023. Accessed June 5, 2024. https://www.ncbi.nlm.nih.gov/books/NBK557698/
86. LiverTox: clinical and research information on drug-induced liver injury; 2012. Carboplatin. Updated September 15, 2020. Accessed June 5, 2024. https://www.ncbi.nlm.nih.gov/books/NBK548565/
87. Carboplatin. Prescribing information. Teva Parenteral Medicines; 2012. Accessed June 5, 204. https://www.accessdata.fda.gov/drugsatfda_docs/label/2012/077139Orig1s016lbl.pdf
88. Johnson-Arbor K, Dubey R. Doxorubicin. StatPearls. Updated August 8, 2023. Accessed June 5, 2024. https://www.ncbi.nlm.nih.gov/books/NBK459232/
89. Doxorubicin hydrochloride injection. Prescribing information. Pfizer; 2019. Accessed June 5, 2024. https://www.accessdata.fda.gov/drugsatfda_docs/label/2020/050467s078,050629s030lbl.pdf
90. Gor, PP, Su, HI, Gray, RJ, et al. Cyclophosphamide-metabolizing enzyme polymorphisms and survival outcomes after adjuvant chemotherapy for node-positive breast cancer: a retrospective cohort study. Breast Cancer Res. 2010;12(3):R26. doi:10.1186/bcr2570
91. Cyclophosphamide. Prescribing information. Ingenus Pharmaceuticals; 2020. Accessed June 5, 2024. https://www.accessdata.fda.gov/drugsatfda_docs/label/2020/212501s000lbl.pdf
92. Gemcitabine. Prescribing information. Hospira; 2019. Accessed June 5, 2024. https://www.accessdata.fda.gov/drugsatfda_docs/label/2019/200795Orig1s010lbl.pdf
93. Ifex (ifosfamide). Prescribing information. Baxter; 2012. Accessed June 5, 2024. https://www.accessdata.fda.gov/drugsatfda_docs/label/2012/019763s017lbl.pdf
94. Cisplatin. Prescribing information. WG Critical Care; 2019. Accessed June 5, 2024. https://www.accessdata.fda.gov/drugsatfda_docs/label/2019/018057s089lbl.pdf
95. Gerriets V, Kasi A. Bevacizumab. StatPearls. Updated August 28, 2023. Accessed June 5, 2024. https://www.ncbi.nlm.nih.gov/books/NBK482126/
96. Avastin (bevacizumab). Prescribing information. Genentech; 2022. Accessed June 5, 2024. https://www.accessdata .fda.gov/drugsatfda_docs/label/2022/125085s340lbl.pdf
97. Keytruda (pembrolizumab). Prescribing information. Merck; 2021. Accessed June 5, 2024. https://www.accessdata.fda.gov/drugsatfda_docs/label/2021/125514s096lbl.pdf
98. Dean L, Kane M. Capecitabine therapy and DPYD genotype. National Center for Biotechnology Information (US); 2012. Updated November 2, 2020. Accessed June 5, 2024. https://www.ncbi.nlm.nih.gov/books/NBK385155/
99. Xeloda (capecitabine). Prescribing information. Roche; 2000. Accessed June 5, 2024. https://www.accessdata.fda.gov/drugsatfda_docs/label/2000/20896lbl.pdf
100. Pemetrexed injection. Prescribing information. Fareva Unterach; 2022. Accessed June 5, 2024. https://www.accessdata.fda.gov/drugsatfda_docs/label/2022/214657s000lbl.pdf
101. Topotecan Injection. Prescribing information. Zydus Hospira Oncology; 2014. Accessed June 5, 2024. https://www.accessdata.fda.gov/drugsatfda_docs/label/2014/200582s001lbl.pdf
102. Ibrance (palbociclib). Prescribing information. Pfizer; 2019. Accessed June 5, 2024. https://www.accessdata.fda.gov/drugsatfda_docs/label/2019/207103s008lbl.pdf
103. Navelbine (vinorelbine) injection. Prescribing information. Pierre Fabre Médicament; 2020. Accessed June 5, 2024. https://www.accessdata.fda.gov/drugsatfda_docs/label/2020/020388s037lbl.pdf
104. LiverTox: clinical and research information on drug-induced liver injury; 2012. Letrozole. Updated July 25, 2017. Accessed June 5, 2024. https://www.ncbi.nlm.nih.gov/books/NBK548381/
105. Femara (letrozole). Prescribing information. Novartis; 2014. Accessed June 5, 2024. https://www.accessdata.fda.gov/drugsatfda_docs/label/2014/020726s027lbl.pdf
106. Soltamox (tamoxifen citrate). Prescribing information. Rosemont Pharmaceuticals; 2018. Accessed June 5, 2024. https://www.accessdata.fda.gov/drugsatfda_docs/label/2018/021807s005lbl.pdf
107. LiverTox: clinical and research information on drug-induced liver injury; 2012. Anastrozole. Updated July 25, 2017. Accessed June 5, 2024. https://www.ncbi.nlm.nih.gov/books/NBK548189/
108. Grimm SW, Dyroff MC. Inhibition of human drug metabolizing cytochromes P450 by anastrozole, a potent and selective inhibitor of aromatase. Drug Metab Dispos. 1997;25(5):598-602.
109. Arimidex (anastrozole). Prescribing information. AstraZeneca; 2010. Accessed June 5, 2024. https://www.accessdata.fda.gov/drugsatfda_docs/label/2011/020541s026lbl.pdf
110. Megace (megestrol acetate). Prescribing information. Endo Pharmaceuticals; 2018. Accessed June 5, 2024. https://www.accessdata.fda.gov/drugsatfda_docs/label/2018/021778s024lbl.pdf
111. Imfinzi (durvalumab). Prescribing information. AstraZeneca; 2020. Accessed June 5, 2024. https://www.accessdata.fda.gov/drugsatfda_docs/label/2020/761069s018lbl.pdf
112. Merwar G, Gibbons JR, Hosseini SA, et al. Nortriptyline. StatPearls. Updated June 5, 2023. Accessed June 5, 2024. https://www.ncbi.nlm.nih.gov/books/NBK482214/
113. Pamelor (nortriptyline HCl). Prescribing information. Patheon Inc.; 2012. Accessed June 5, 2024. https://www.accessdata.fda.gov/drugsatfda_docs/label/2012/018012s029,018013s061lbl.pdf
114. Wellbutrin (bupropion hydrochloride). Prescribing information. GlaxoSmithKline; 2017. Accessed June 5, 2024. https://www.accessdata.fda.gov/drugsatfda_docs/label/2017/018644s052lbl.pdf
115. Paxil (paroxetine). Prescribing information. Apotex Inc.; 2021. Accessed June 5, 2024. https://www.accessdata.fda.gov/drugsatfda_docs/label/2021/020031s077lbl.pdf
116. Johnson DB, Lopez MJ, Kelley B. Dexamethasone. StatPearls. Updated May 2, 2023. Accessed June 5, 2024. https://www.ncbi.nlm.nih.gov/books/NBK482130/
117. Hemady (dexamethasone). Prescribing information. Dexcel Pharma; 2019. Accessed June 5, 2024. https://www.accessdata.fda.gov/drugsatfda_docs/label/2019/211379s000lbl.pdf
118. Parker SD, King N, Jacobs TF. Pegfilgrastim. StatPearls. Updated May 9, 2024. Accessed June 5, 2024. https://www.ncbi.nlm.nih.gov/books/NBK532893/
119. Fylnetra (pegfilgrastim-pbbk). Prescribing information. Kashiv BioSciences; 2022. Accessed June 5, 2024. https://www.accessdata.fda.gov/drugsatfda_docs/label/2022/761084s000lbl.pdf
120. Emend (aprepitant). Prescribing information. Merck; 2015. Accessed June 5, 2024. https://www.accessdata.fda.gov/drugsatfda_docs/label/2015/207865lbl.pdf
121. Lipitor (atorvastatin calcium). Prescribing information. Viatris Specialty; 2022. Accessed June 5, 2024. https://www.accessdata.fda.gov/drugsatfda_docs/label/2022/020702Orig1s079correctedlbl.pdf
122. Cipro (ciprofloxacin hydrochloride). Prescribing information. Bayer HealthCare Pharmaceuticals Inc.; 2020. Accessed June 5, 2024. https://www.accessdata.fda.gov/drugsatfda_docs/label/2020/019537s090,020780s047lbl.pdf
123. Pino MA, Azer SA. Cimetidine. StatPearls. Updated March 6, 2023. Accessed June 5, 2024. https://www.ncbi.nlm.nih.gov/books/NBK544255/
124. Tagament (Cimetidine). Prescribing information. Mylan; 2020. Accessed June 5, 2024. https://www.accessdata.fda.gov/drugsatfda_docs/label/2020/020238Orig1s024lbl.pdf
125. Neupogen (filgrastim). Prescribing information. Amgen Inc.; 2015. Accessed June 5, 2024. https://www.accessdata.fda.gov/drugsatfda_docs/label/2015/103353s5184lbl.pdf
126. Flagyl (metronidazole). Prescribing information. Pfizer; 2013. Accessed June 5, 2024. https://www.accessdata.fda.gov/drugsatfda_docs/label/2013/020334s008lbl.pdf
127. Zymaxid (gatifloxacin ophthalmic solution). Prescribing information. Allergan; 2016. Accessed June 5, 2024. https://www.accessdata.fda.gov/drugsatfda_docs/label/2016/022548s002lbl.pdf
128. Macrobid (nitrofurantoin monohydrate). Prescribing information. Procter and Gamble Pharmaceutical Inc.; 2009. Accessed June 5, 2024. https://www.accessdata.fda.gov/drugsatfda_docs/label/2009/020064s019lbl.pdf
129. Hyzaar (losartan). Prescribing information. Merck; 2020. Accessed June 5, 2024. https://www.accessdata.fda.gov/drugsatfda_docs/label/2020/020387s067lbl.pdf
Using Telehealth to Increase Lung Cancer Screening Referrals for At-Risk Veterans in Rural Communities
Annual lung cancer screening (LCS) with low-dose computed tomography (LDCT) of the chest has been shown to reduce mortality rates for individuals at risk for lung cancer.1 Despite the benefits, < 5% of those who were eligible for LCS in the United States were screened in 2022.2 Implementation of a LCS program in rural communities is especially challenging because they are sparsely populated, medically underserved, and located far from urban centers.2-7 It is estimated that 1 in 5 people live in rural areas. Rates of tobacco smoking and cancer are higher in rural communities when compared with urban communities.8,9 The scarcity of physicians in rural areas who are familiar with LCS may further impede individuals who are at risk from accessing this life saving service.5,6 As a result, these individuals may not regularly undergo LCS as recommended.9
Telehealth, or the remote delivery of health care services via telecommunications, is an emerging approach for addressing unmet medical needs in rural communities and is being utilized widely by the US Department of Veterans Affairs (VA).4,10-15 The Veterans Integrated Service Network 12 (Great Lakes Network) has established the Clinical Resource Hub (CRH), a telehealth network comprising of licensed independent physicians, nurse practitioners, registered nurses, and ancillary staff. The CRH offers regular, remote health care services to several community-based outpatient clinics (CBOC) primary care clinics located in rural northern Wisconsin and the Upper Peninsula of Michigan.10,14
The utility of telehealth in promoting LCS among at-risk veterans living in rural communities has not been firmly established.4-6 To address this issue, we conducted a proof-of-principle quality improvement project to determine whether a telehealth intervention would increase referrals among at-risk veterans who reside in rural northern Wisconsin and the Upper Peninsula of Michigan who are self-enrolled in a CBOC smoking cessation program in Green Bay, Wisconsin. The CBOC provides primary health care to veterans residing in rural northern Wisconsin and the Upper Peninsula of Michigan as defined by US Department of Agriculture rural-urban commuting area codes.16 The intervention aimed to refer these individuals to the closest available and centralized LCS program, which is located at the Clement J. Zablocki VA Medical Center (CJZVAMC) in Milwaukee, Wisconsin.
METHODS
We reviewed electronic health records (EHR) of LCS-eligible veterans treated by 2 authors (SH and TB) who were self-enrolled in the smoking cessation program at the Green Bay CBOC between October 1, 2020, and September 30, 2021. The program provides comprehensive evidence-based tobacco use treatment, online self-help resources, behavioral counseling, and medicines for smoking cessation.17 Veterans aged 50 to 80 years with a smoking history of ≥ 20 pack-years, who currently smoke cigarettes or quit within the past 15 years, were considered at risk for lung cancer and eligible for LCS. After confirming eligibility, pertinent demographic data were abstracted from each EHR.
Telehealth Intervention
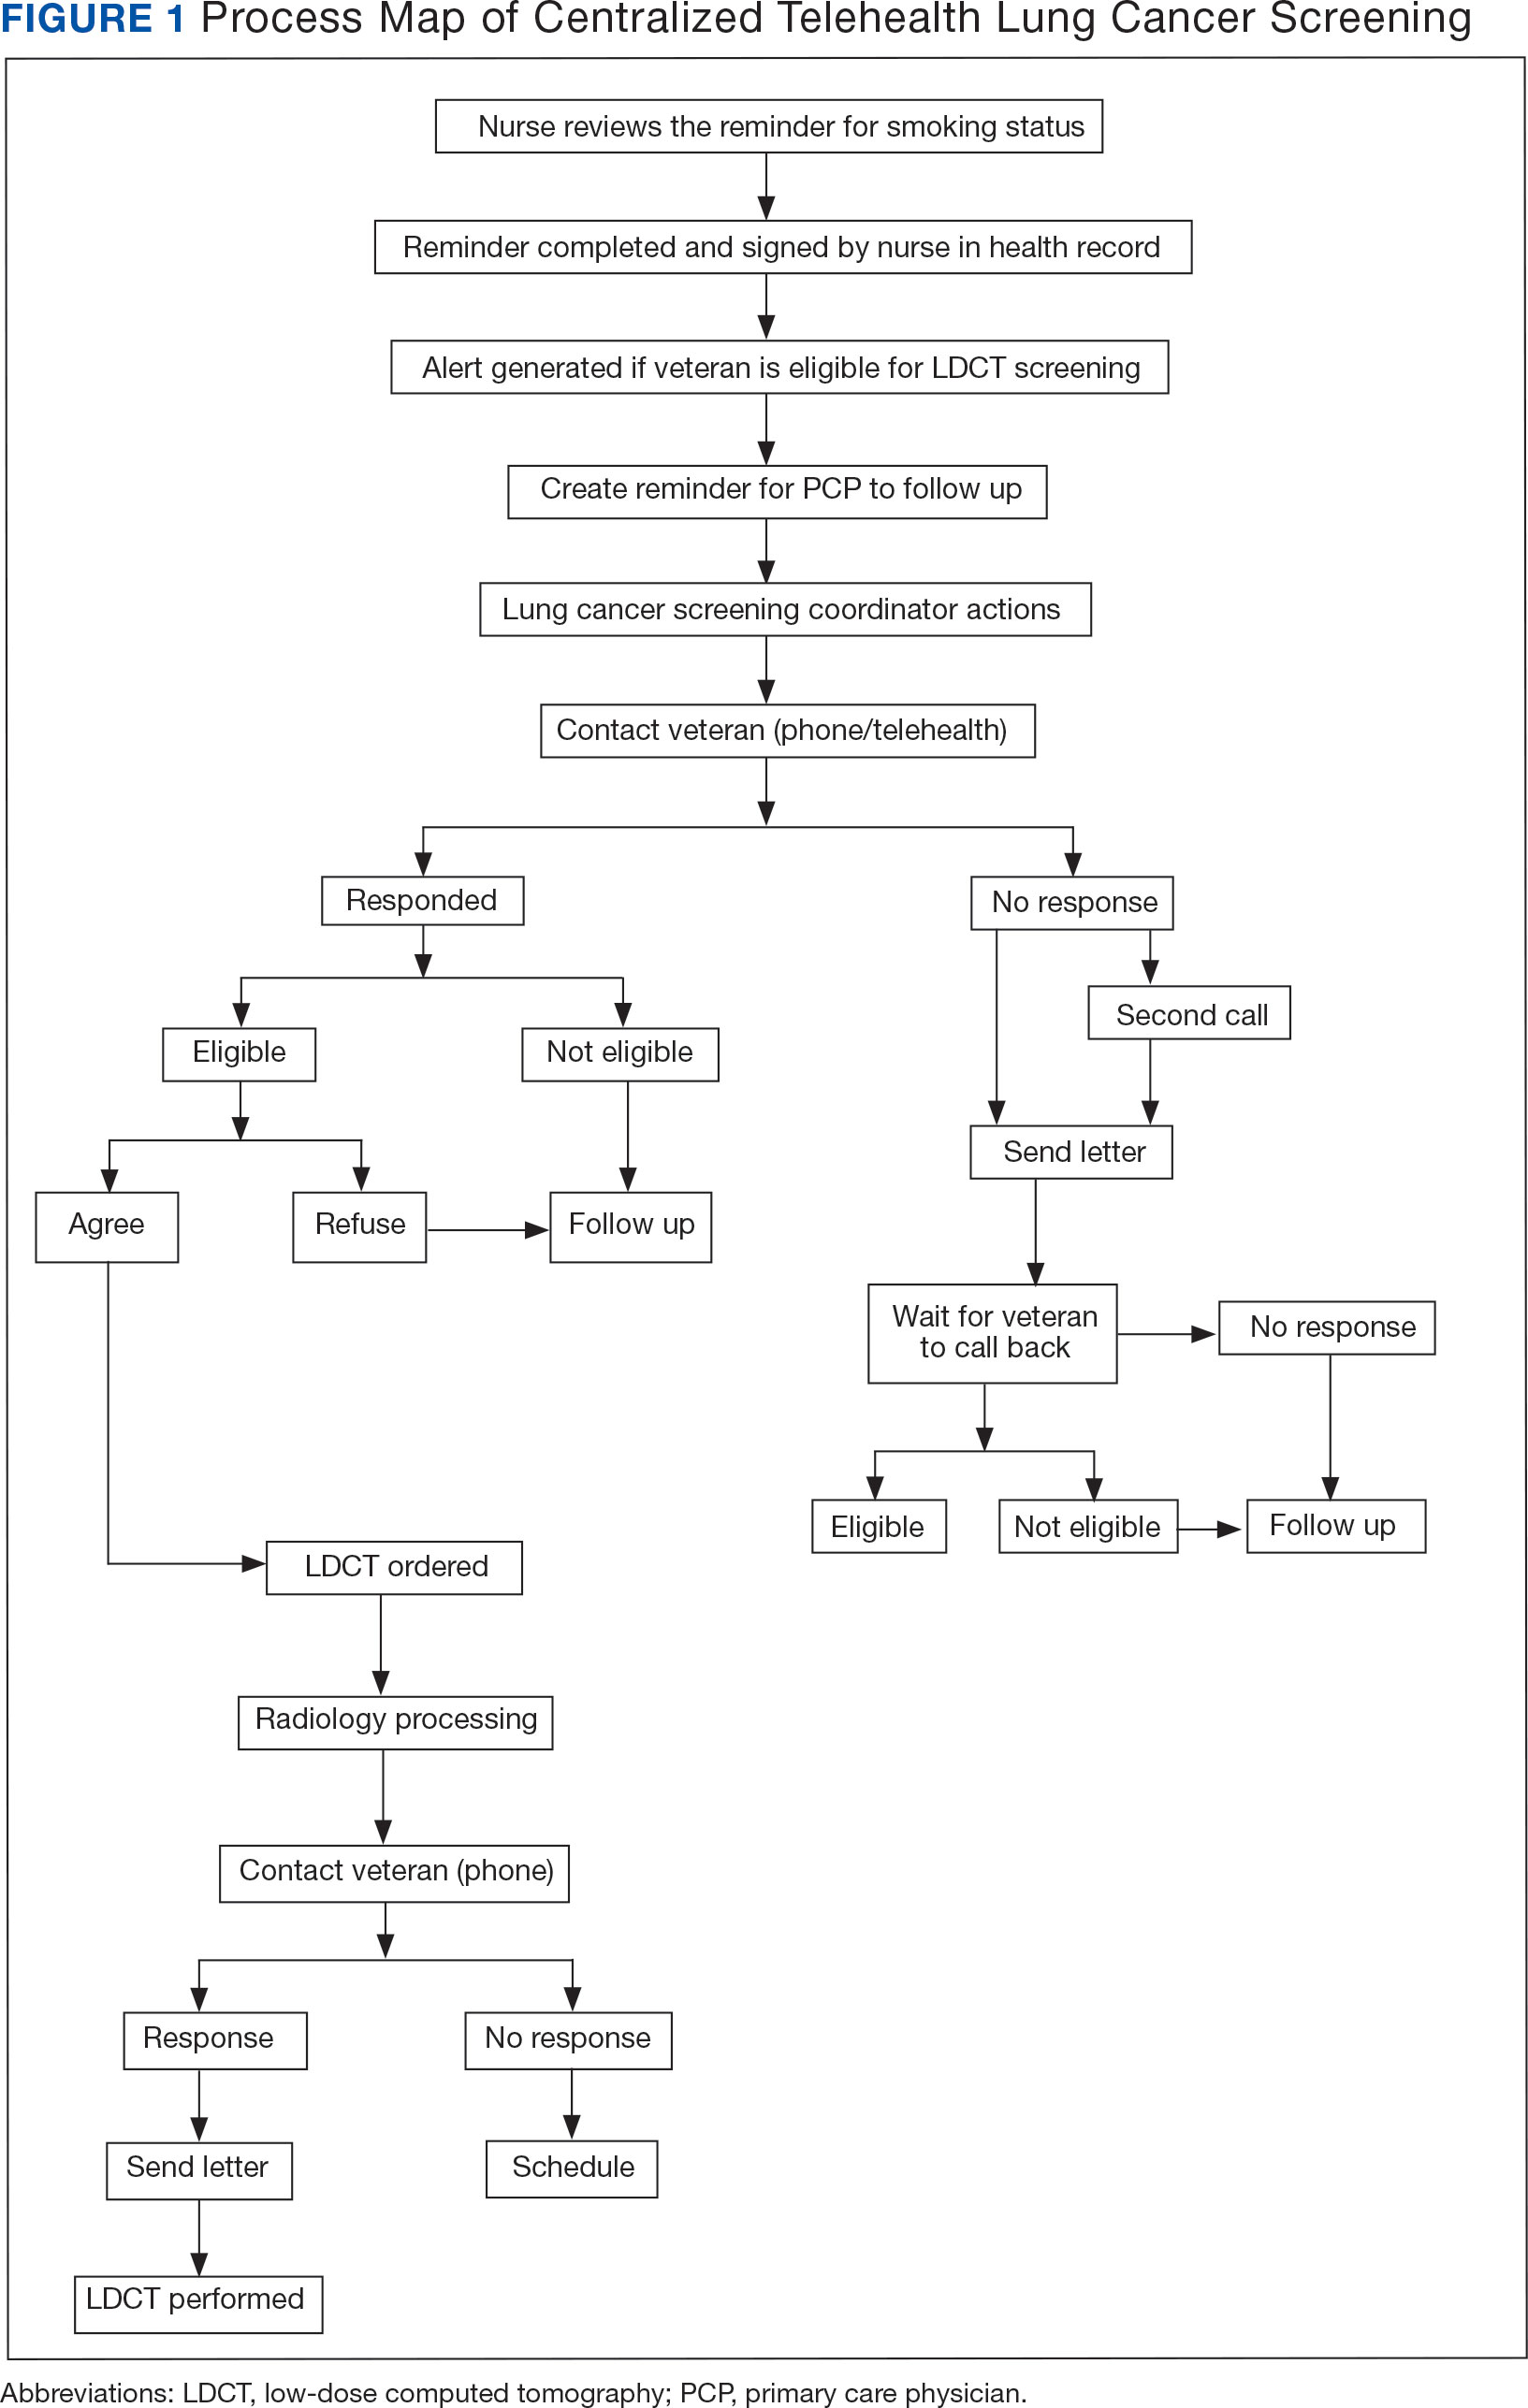
The CJZVAMC centralized LCS program manages all delivery processes and has been previously shown to increase uptake of LCS and improve patient outcomes among veterans as compared to a decentralized approach.18,19 In the centralized approach, eligible veterans were referred by a CBOC primary care practitioner (PCP) to a designated centralized LCS program. The centralized LCS program provides further evaluation and disposition, which includes structured and shared decision making, ordering LDCT of the chest, reporting LDCT results to the patient and PCP, devising a goal-directed care plan, and managing follow-up LDCTs as indicated (Figure 1).18,19
This intervention was initiated before other measures aimed to increase the LCS enrollment for at-risk rural veterans at the CBOC, (eg, mailing LCS education fact sheet to veterans).20 After reviewing prospective veterans’ EHRs, 1 author (TB) contacted LCS-eligible veterans by telephone and left a voicemail if contact could not be established. A second telephone call was placed within 2 months of the initial call if no call back was documented in the EHR. When verbal contact was established, the goals of the centralized LCS program were described and the veteran was invited to participate.21
Veterans were seen at CBOCs affiliated with CJZVAMC. The CJZVAMC LCS coordinator was notified whenever a veteran agreed to enroll into LCS and then ordered LDCT, which was performed and read at CJZVAMC. Once LDCT has been ordered, 1 author (TB) reviewed the veteran’s EHR for LDCT completion over the next 4 months.Upon conclusion of the intervention period, the number of veterans referred for LDCT and the number of LDCTs performed were recorded. Each LDCT was reviewed and coded by medical imaging clinicians according to Lung CT Screening Reporting and Data System (Lung-RADS) version 1.1 and coded as 0, 1, 2, 3, or 4 based on the nodule with the highest degree of suspicion.22 The LDCT and reports were also reviewed by pulmonary physicians at the CJZVAMC Lung Nodule Clinic with recommendations issued and reported to the PCP treating the veteran, such as annual follow-up with LDCT or referral to specialty care for further evaluation as indicated.
RESULTS
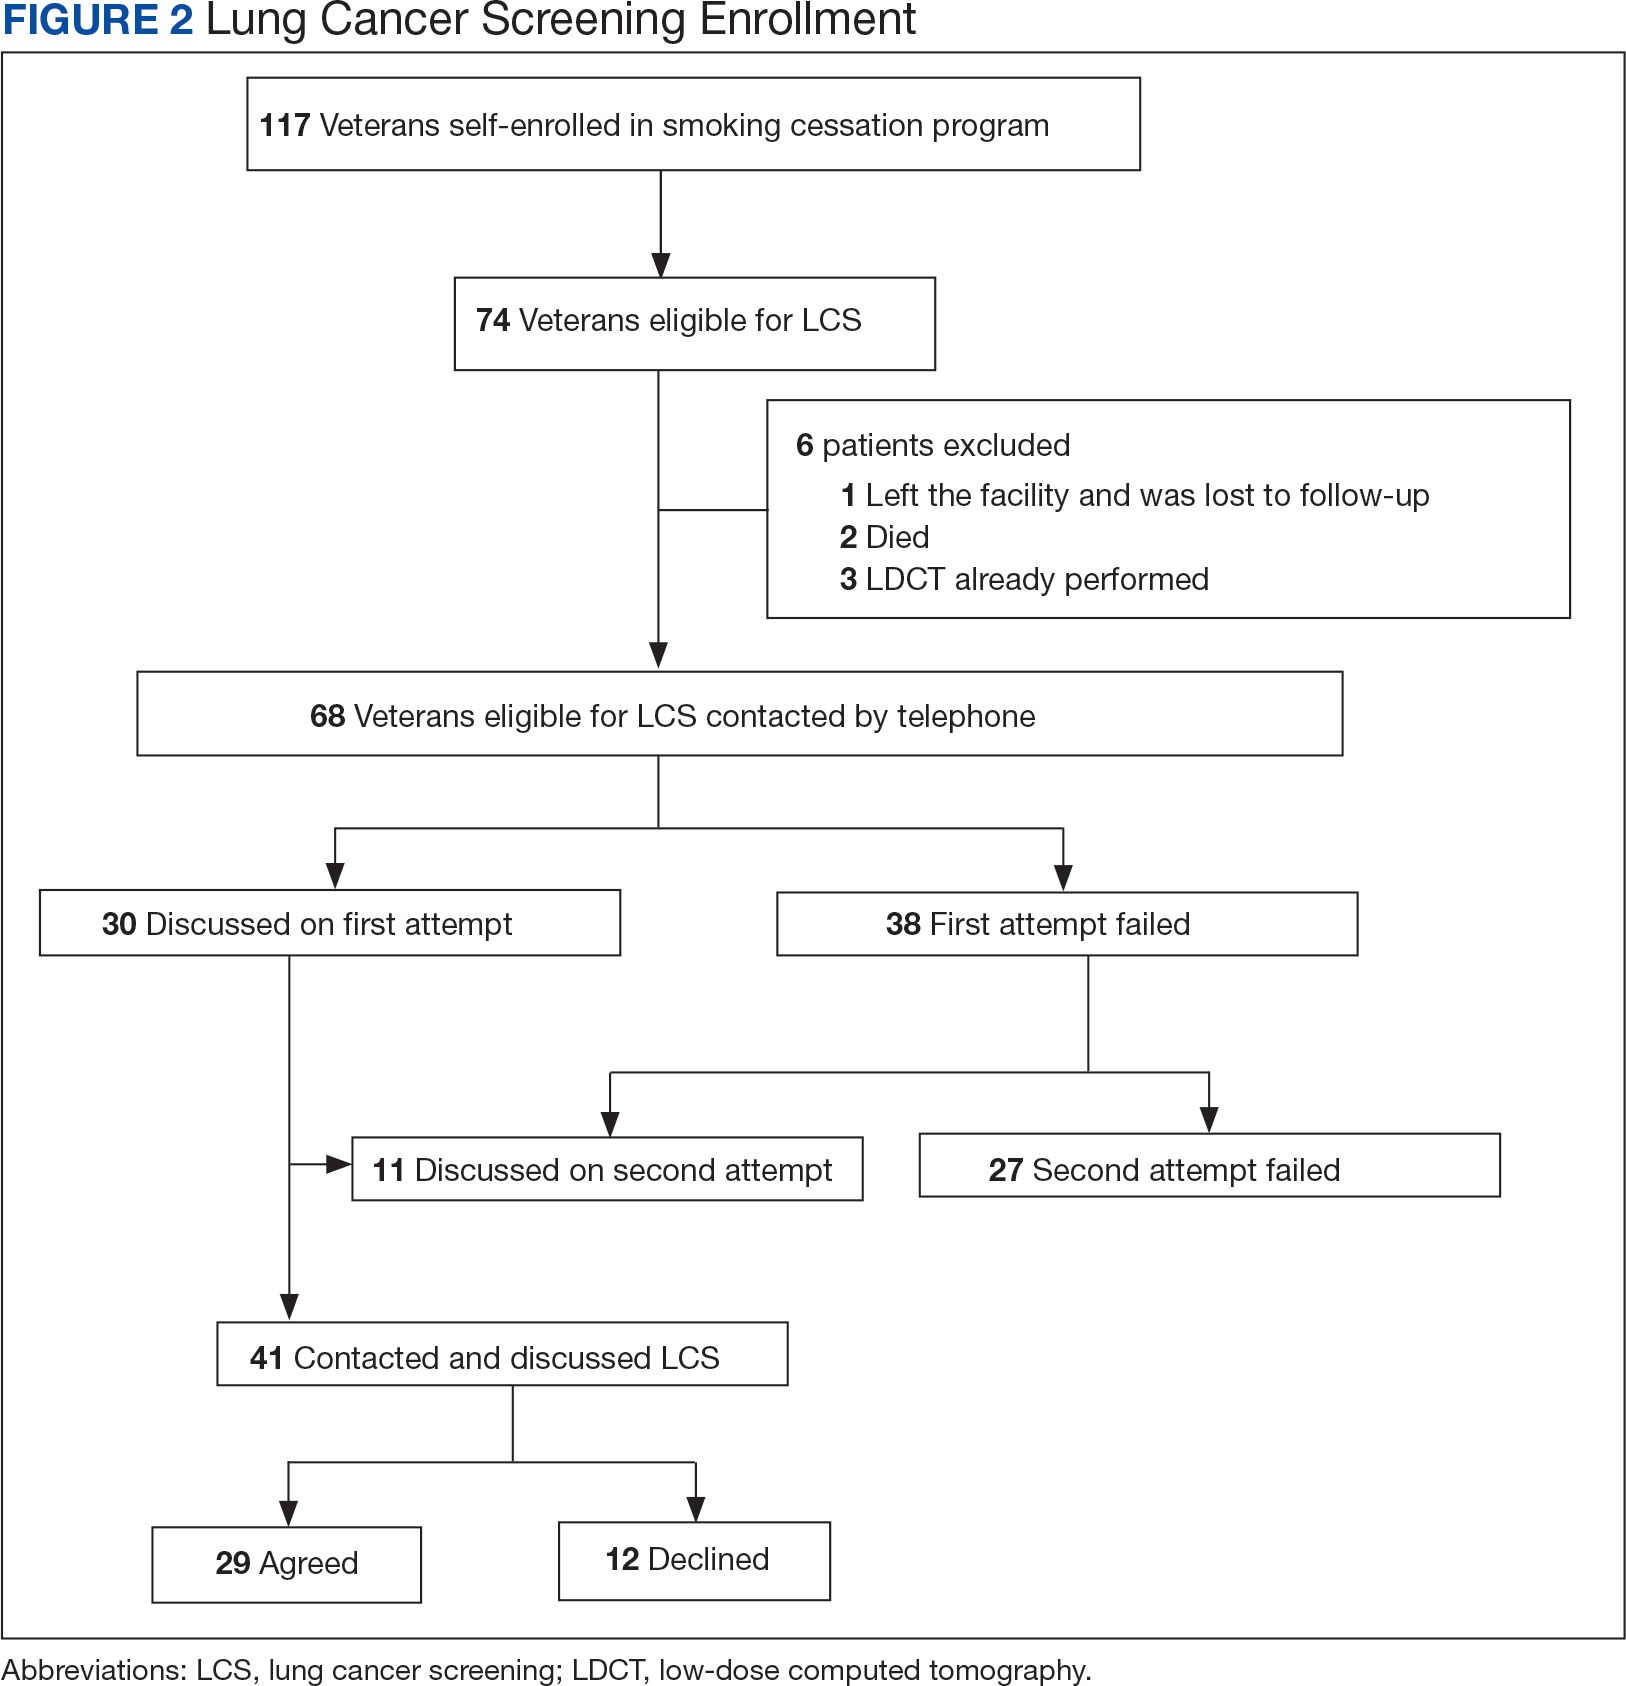
Of 117 veterans enrolled in the smoking cessation program at the CBOC during the intervention period, 74 (63%) were eligible to undergo LCS, and 68 (58%) were contacted by telephone (Figure 2). Eligible patients were primarily White male veterans; their mean (SD) age was 65.0 years (7.6). Participation in LCS was discussed with 41 (60%) veterans either during the initial or second telephone call of which 29 (71%) agreed to enroll and 12 (29%) declined. Veterans did not provide reasons for declining participation at the time of the telephone call.
Among the 74 eligible veterans who attended the smoking cessation program, only 3 had LDCT performed before initiation of this project (4%). At the conclusion of the telehealth intervention period, 19 veterans had LDCT performed (26%). Ten LDCTs were coded Lung-RADS 1, 7 Lung-RADS 2, 1 Lung-RADS 3, and 1 Lung-RADS 4B. In each case, annual follow-up LDCT or referral to a LCS clinician was pursued as indicated.22
DISCUSSION
This proof-of-principle quality improvement project found that a high percentage (66%) of individuals in rural communities who were contacted via telehealth agreed to participate in a regional LCS program. The program reviewed LDCT results, ordered follow-up LDCTs, and recommended further evaluations.18,19 Whether this centralized LCS process could also promote adherence with subsequent annual LDCT and/or scheduled clinic appointments with designated clinicians, if abnormal imaging findings are detected, remains unclear.
It has been well established LDCT LCS reduces lung cancer-specific and overall mortality rates among eligible current and former smokers.1,9,23 The 5-year relative survival rate of veterans diagnosed with localized non-small cell lung cancer is 63%; that number drops to 7% in those with advanced disease attesting to the utility of LCS in detecting early stage lung cancer.2 Despite these favorable observations, however, screening rates with free LDCT remains low in rural communities.3-7
This proof-of-principle quality improvement project found that telehealth intervention may increase referrals of at-risk veterans who reside in rural communities to the closest centralized LCS program located at aregional VAMC. This program is responsible for reviewing the results of the initial LDCT, ordering follow-up LDCT, and recommending further evaluation as indicated.18,19 Whether this centralized LCS process would promote adherence with subsequent annual LDCT and/or scheduled clinic appointments with designated clinicians if abnormal imaging findings are detected is yet to be determined.
We found that among 74 LCS-eligible rural veterans attending a CBOC-based smoking cessation program, only 3 (4%) underwent LDCT screening before this telehealth intervention was launched. This low LCS rate among veterans attempting to quit smoking may have been related, in part, to a lack of awareness of this intervention and/or barriers to LCS access.7,10,21,24 Deploying a telehealth intervention targeting LCS could address this life threatening and unmet medical need in rural communities.25 The results of this proof-of-principle quality improvement project support this contention with the reported increased referrals to and completion of initial LDCT within 4 months of the telehealth encounter.
Limitations
This was a small, single site project composed of predominantly White male rural veterans participating in a smoking cessation program associated with a VA facility.26,27 It is not clear whether similar outcomes would be observed in at-risk veterans who do not participate in a smoking cessation program or in more diverse communities. We were unable to contact 40% of LCS-eligible rural veterans by telephone. Twelve veterans reached by telephone declined to participate in LCS without providing a reason, and only 19 of 68 eligible veterans (28%) underwent LDCT screening during the 4-month telehealth intervention. The reasons underlying this overall low accrual rate and whether rural veterans prefer other means of personal communication regarding LCS were not determined. Lastly, generalizability of our initial observations to other veterans living in rural communities is limited because the project was conducted only in rural northern Wisconsin and the Upper Peninsula of Michigan.
Conclusions
At-risk rural veterans may be willing to participate in a centralized LCS program at a regional VA medical facility when contacted and coordinated using telehealth modalities. These findings offer support for future prospective, multisite, VA telehealth-based studies to be conducted in rural areas. The results of this project also suggest that telehealth intervention could increase referrals of at-risk rural veterans to the closest centralized LCS program located at a regional VA medical facility.
1. National Lung Screening Trial Research Team, Aberle DR, Adams AM, et al. Reduced lung-cancer mortality with low-dose computed tomographic screening. N Engl J Med. 2011;365(5):395-409. doi:10.1056/NEJMoa1102873
2. State of Lung Cancer: 2023 Report. American Lung Association. November 14, 2023. Accessed June 4, 2024. https://www.lung.org/getmedia/186786b6-18c3-46a9-a7e7-810f3ce4deda/SOLC-2023-Print-Report.pdf
3. Okereke IC, Nishi S, Zhou J, Goodwin JS. Trends in lung cancer screening in the United States, 2016-2017. J Thorac Dis. 2019;11(3):873-881. doi:10.21037/jtd.2019.01.105
4. Petraglia AF, Olazagasti JM, Strong A, Dunn B, Anderson RT, Hanley M. Establishing satellite lung cancer screening sites with telehealth to address disparities between high-risk smokers and American College of Radiology-approved Centers of Designation. J Thorac Imaging. 2021;36(1):2-5. doi:10.1097/RTI.0000000000000520
5. Odahowski CL, Zahnd WE, Eberth JM. Challenges and opportunities for lung cancer screening in rural America. J Am Coll Radiol. 2019;16(4 Pt B):590-595. doi:10.1016/j.jacr.2019.01.001
6. Rohatgi KW, Marx CM, Lewis-Thames MW, Liu J, Colditz GA, James AS. Urban-rural disparities in access to low-dose computed tomography lung cancer screening in Missouri and Illinois. Prev Chronic Dis. 2020;17:E140. doi:10.5888/pcd17.200202
7. Boudreau JH, Miller DR, Qian S, Nunez ER, Caverly TJ, Wiener RS. Access to lung cancer screening in the Veterans Health Administration: does geographic distribution match need in the population? Chest. 2021;160(1):358-367. doi:10.1016/j.chest.2021.02.016
8. Howlader N, Noone AM, Krapcho M, et al, eds. SEER Cancer Statistics Review, 1975-2017. National Cancer Institute, US Dept of Health and Human Services; April 15, 2020. Accessed June 4, 2024. https://seer.cancer.gov/archive/csr/1975_2017/index.html
9. US Preventive Services Task Force, Krist AH, Davidson KW, et al. Screening for Lung Cancer: US Preventive Services Task Force Recommendation Statement. JAMA. 2021;325(10):962-970. doi:10.1001/jama.2021.1117
10. Gopal RK, Solanki P, Bokhour BG, et al. Provider, staff, and patient perspectives on medical visits using clinical video telehealth: a foundation for educational initiatives to improve medical care in telehealth. J Nurse Pract. 2021;17(5):582-587. doi:10.1016/j.nurpra.2021.02.020
11. Yacoub JH, Swanson CE, Jay AK, Cooper C, Spies J, Krishnan P. The radiology virtual reading room: during and beyond the COVID-19 pandemic. J Digit Imaging. 2021;34(2):308-319. doi:10.1007/s10278-021-00427-4
12. Beswick DM, Vashi A, Song Y, et al. Consultation via telemedicine and access to operative care for patients with head and neck cancer in a Veterans Health Administration population. Head Neck. 2016;38(6):925-929. doi:10.1002/hed.24386
13. Ruco A, Dossa F, Tinmouth J, et al. Social media and mHealth technology for cancer screening: systematic review and meta-analysis. J Med Internet Res. 2021;23(7):e26759. doi:10.2196/26759
14. Raza T, Joshi M, Schapira RM, Agha Z. Pulmonary telemedicine - a model to access the subspecialist services in underserved rural areas. Int J Med Inform. 2009;78(1):53-59. doi:10.1016/j.ijmedinf.2008.07.010
15. Chen A, Ayub MH, Mishuris RG, et al. Telehealth policy, practice, and education: a position statement of the Society of General Internal Medicine. J Gen Intern Med. 2023;38(11):2613-2620. doi:10.1007/s11606-023-08190-8
16. Rural-Urban Commuting Area Codes. Economic Research Service, US Dept of Agriculture. Updated September 25, 2023. Accessed June 4, 2024. https://www.ers.usda.gov/data-products/rural-urban-commuting-area-codes/
17. VHA Directive 1056: National Smoking and Tobacco Use Cessation Program. Veterans Health Administration, US Dept of Veterans Affairs; September 5, 2019. Accessed June 4, 2024. https://www.va.gov/vhapublications/ViewPublication.asp?pub_ID=8488
18. Smith HB, Ward R, Frazier C, Angotti J, Tanner NT. Guideline-recommended lung cancer screening adherence is superior with a centralized approach. Chest. 2022;161(3):818-825. doi:10.1016/j.chest.2021.09.002
19. Lewis JA, Samuels LR, Denton J, et al. The association of health care system resources with lung cancer screening implementation: a cohort study. Chest. 2022;162(3):701-711. doi:10.1016/j.chest.2022.03.050
20. US Dept of Veterans Affairs. Lung cancer screening: patient education fact sheet. Accessed July 8, 2024. https://www.cancer.va.gov/assets/pdf/survey/LCSflyer.pdf
21. Melzer AC, Golden SE, Ono SS, Datta S, Crothers K, Slatore CG. What exactly is shared decision-making? A qualitative study of shared decision-making in lung cancer screening. J Gen Intern Med. 2020;35(2):546-553. doi:10.1007/s11606-019-05516-3
22. Chelala L, Hossain R, Kazerooni EA, Christensen JD, Dyer DS, White CS. Lung-RADS Version 1.1: challenges and a look ahead, from the AJR special series on radiology reporting and data systems. AJR Am J Roentgenol. 2021;216(6):1411-1422. doi:10.2214/AJR.20.24807
23. Ritzwoller DP, Meza R, Carroll NM, et al. Evaluation of population-level changes associated with the 2021 US Preventive Services Task Force lung cancer screening recommendations in community-based health care systems. JAMA Netw Open. 2021;4(10):e2128176. doi:10.1001/jamanetworkopen.2021.28176
24. Golden SE, Ono SS, Thakurta SG, et al. “I’m putting my trust in their hands”: a qualitative study of patients’ views on clinician initial communication about lung cancer screening. Chest. 2020;158(3):1260-1267. doi:10.1016/j.chest.2020.02.072
25. Park ER, Chiles C, Cinciripini PM, et al. Impact of the COVID-19 pandemic on telehealth research in cancer prevention and care: a call to sustain telehealth advances. Cancer. 2021;127(3):334-338. doi:10.1002/cncr.33227
26. Tremblay A, Taghizadeh N, Huang J, et al. A randomized controlled study of integrated smoking cessation in a lung cancer screening program. J Thorac Oncol. 2019;14(9):1528-1537. doi:10.1016/j.jtho.2019.04.024
27. Neil JM, Marotta C, Gonzalez I, et al. Integrating tobacco treatment into lung cancer screening practices: study protocol for the Screen ASSIST randomized clinical trial. Contemp Clin Trials. 2021;111:106586. doi:10.1016/j.cct.2021.106586
Annual lung cancer screening (LCS) with low-dose computed tomography (LDCT) of the chest has been shown to reduce mortality rates for individuals at risk for lung cancer.1 Despite the benefits, < 5% of those who were eligible for LCS in the United States were screened in 2022.2 Implementation of a LCS program in rural communities is especially challenging because they are sparsely populated, medically underserved, and located far from urban centers.2-7 It is estimated that 1 in 5 people live in rural areas. Rates of tobacco smoking and cancer are higher in rural communities when compared with urban communities.8,9 The scarcity of physicians in rural areas who are familiar with LCS may further impede individuals who are at risk from accessing this life saving service.5,6 As a result, these individuals may not regularly undergo LCS as recommended.9
Telehealth, or the remote delivery of health care services via telecommunications, is an emerging approach for addressing unmet medical needs in rural communities and is being utilized widely by the US Department of Veterans Affairs (VA).4,10-15 The Veterans Integrated Service Network 12 (Great Lakes Network) has established the Clinical Resource Hub (CRH), a telehealth network comprising of licensed independent physicians, nurse practitioners, registered nurses, and ancillary staff. The CRH offers regular, remote health care services to several community-based outpatient clinics (CBOC) primary care clinics located in rural northern Wisconsin and the Upper Peninsula of Michigan.10,14
The utility of telehealth in promoting LCS among at-risk veterans living in rural communities has not been firmly established.4-6 To address this issue, we conducted a proof-of-principle quality improvement project to determine whether a telehealth intervention would increase referrals among at-risk veterans who reside in rural northern Wisconsin and the Upper Peninsula of Michigan who are self-enrolled in a CBOC smoking cessation program in Green Bay, Wisconsin. The CBOC provides primary health care to veterans residing in rural northern Wisconsin and the Upper Peninsula of Michigan as defined by US Department of Agriculture rural-urban commuting area codes.16 The intervention aimed to refer these individuals to the closest available and centralized LCS program, which is located at the Clement J. Zablocki VA Medical Center (CJZVAMC) in Milwaukee, Wisconsin.
METHODS
We reviewed electronic health records (EHR) of LCS-eligible veterans treated by 2 authors (SH and TB) who were self-enrolled in the smoking cessation program at the Green Bay CBOC between October 1, 2020, and September 30, 2021. The program provides comprehensive evidence-based tobacco use treatment, online self-help resources, behavioral counseling, and medicines for smoking cessation.17 Veterans aged 50 to 80 years with a smoking history of ≥ 20 pack-years, who currently smoke cigarettes or quit within the past 15 years, were considered at risk for lung cancer and eligible for LCS. After confirming eligibility, pertinent demographic data were abstracted from each EHR.
Telehealth Intervention
The CJZVAMC centralized LCS program manages all delivery processes and has been previously shown to increase uptake of LCS and improve patient outcomes among veterans as compared to a decentralized approach.18,19 In the centralized approach, eligible veterans were referred by a CBOC primary care practitioner (PCP) to a designated centralized LCS program. The centralized LCS program provides further evaluation and disposition, which includes structured and shared decision making, ordering LDCT of the chest, reporting LDCT results to the patient and PCP, devising a goal-directed care plan, and managing follow-up LDCTs as indicated (Figure 1).18,19
This intervention was initiated before other measures aimed to increase the LCS enrollment for at-risk rural veterans at the CBOC, (eg, mailing LCS education fact sheet to veterans).20 After reviewing prospective veterans’ EHRs, 1 author (TB) contacted LCS-eligible veterans by telephone and left a voicemail if contact could not be established. A second telephone call was placed within 2 months of the initial call if no call back was documented in the EHR. When verbal contact was established, the goals of the centralized LCS program were described and the veteran was invited to participate.21
Veterans were seen at CBOCs affiliated with CJZVAMC. The CJZVAMC LCS coordinator was notified whenever a veteran agreed to enroll into LCS and then ordered LDCT, which was performed and read at CJZVAMC. Once LDCT has been ordered, 1 author (TB) reviewed the veteran’s EHR for LDCT completion over the next 4 months.Upon conclusion of the intervention period, the number of veterans referred for LDCT and the number of LDCTs performed were recorded. Each LDCT was reviewed and coded by medical imaging clinicians according to Lung CT Screening Reporting and Data System (Lung-RADS) version 1.1 and coded as 0, 1, 2, 3, or 4 based on the nodule with the highest degree of suspicion.22 The LDCT and reports were also reviewed by pulmonary physicians at the CJZVAMC Lung Nodule Clinic with recommendations issued and reported to the PCP treating the veteran, such as annual follow-up with LDCT or referral to specialty care for further evaluation as indicated.
RESULTS
Of 117 veterans enrolled in the smoking cessation program at the CBOC during the intervention period, 74 (63%) were eligible to undergo LCS, and 68 (58%) were contacted by telephone (Figure 2). Eligible patients were primarily White male veterans; their mean (SD) age was 65.0 years (7.6). Participation in LCS was discussed with 41 (60%) veterans either during the initial or second telephone call of which 29 (71%) agreed to enroll and 12 (29%) declined. Veterans did not provide reasons for declining participation at the time of the telephone call.
Among the 74 eligible veterans who attended the smoking cessation program, only 3 had LDCT performed before initiation of this project (4%). At the conclusion of the telehealth intervention period, 19 veterans had LDCT performed (26%). Ten LDCTs were coded Lung-RADS 1, 7 Lung-RADS 2, 1 Lung-RADS 3, and 1 Lung-RADS 4B. In each case, annual follow-up LDCT or referral to a LCS clinician was pursued as indicated.22
DISCUSSION
This proof-of-principle quality improvement project found that a high percentage (66%) of individuals in rural communities who were contacted via telehealth agreed to participate in a regional LCS program. The program reviewed LDCT results, ordered follow-up LDCTs, and recommended further evaluations.18,19 Whether this centralized LCS process could also promote adherence with subsequent annual LDCT and/or scheduled clinic appointments with designated clinicians, if abnormal imaging findings are detected, remains unclear.
It has been well established LDCT LCS reduces lung cancer-specific and overall mortality rates among eligible current and former smokers.1,9,23 The 5-year relative survival rate of veterans diagnosed with localized non-small cell lung cancer is 63%; that number drops to 7% in those with advanced disease attesting to the utility of LCS in detecting early stage lung cancer.2 Despite these favorable observations, however, screening rates with free LDCT remains low in rural communities.3-7
This proof-of-principle quality improvement project found that telehealth intervention may increase referrals of at-risk veterans who reside in rural communities to the closest centralized LCS program located at aregional VAMC. This program is responsible for reviewing the results of the initial LDCT, ordering follow-up LDCT, and recommending further evaluation as indicated.18,19 Whether this centralized LCS process would promote adherence with subsequent annual LDCT and/or scheduled clinic appointments with designated clinicians if abnormal imaging findings are detected is yet to be determined.
We found that among 74 LCS-eligible rural veterans attending a CBOC-based smoking cessation program, only 3 (4%) underwent LDCT screening before this telehealth intervention was launched. This low LCS rate among veterans attempting to quit smoking may have been related, in part, to a lack of awareness of this intervention and/or barriers to LCS access.7,10,21,24 Deploying a telehealth intervention targeting LCS could address this life threatening and unmet medical need in rural communities.25 The results of this proof-of-principle quality improvement project support this contention with the reported increased referrals to and completion of initial LDCT within 4 months of the telehealth encounter.
Limitations
This was a small, single site project composed of predominantly White male rural veterans participating in a smoking cessation program associated with a VA facility.26,27 It is not clear whether similar outcomes would be observed in at-risk veterans who do not participate in a smoking cessation program or in more diverse communities. We were unable to contact 40% of LCS-eligible rural veterans by telephone. Twelve veterans reached by telephone declined to participate in LCS without providing a reason, and only 19 of 68 eligible veterans (28%) underwent LDCT screening during the 4-month telehealth intervention. The reasons underlying this overall low accrual rate and whether rural veterans prefer other means of personal communication regarding LCS were not determined. Lastly, generalizability of our initial observations to other veterans living in rural communities is limited because the project was conducted only in rural northern Wisconsin and the Upper Peninsula of Michigan.
Conclusions
At-risk rural veterans may be willing to participate in a centralized LCS program at a regional VA medical facility when contacted and coordinated using telehealth modalities. These findings offer support for future prospective, multisite, VA telehealth-based studies to be conducted in rural areas. The results of this project also suggest that telehealth intervention could increase referrals of at-risk rural veterans to the closest centralized LCS program located at a regional VA medical facility.
1. National Lung Screening Trial Research Team, Aberle DR, Adams AM, et al. Reduced lung-cancer mortality with low-dose computed tomographic screening. N Engl J Med. 2011;365(5):395-409. doi:10.1056/NEJMoa1102873
2. State of Lung Cancer: 2023 Report. American Lung Association. November 14, 2023. Accessed June 4, 2024. https://www.lung.org/getmedia/186786b6-18c3-46a9-a7e7-810f3ce4deda/SOLC-2023-Print-Report.pdf
3. Okereke IC, Nishi S, Zhou J, Goodwin JS. Trends in lung cancer screening in the United States, 2016-2017. J Thorac Dis. 2019;11(3):873-881. doi:10.21037/jtd.2019.01.105
4. Petraglia AF, Olazagasti JM, Strong A, Dunn B, Anderson RT, Hanley M. Establishing satellite lung cancer screening sites with telehealth to address disparities between high-risk smokers and American College of Radiology-approved Centers of Designation. J Thorac Imaging. 2021;36(1):2-5. doi:10.1097/RTI.0000000000000520
5. Odahowski CL, Zahnd WE, Eberth JM. Challenges and opportunities for lung cancer screening in rural America. J Am Coll Radiol. 2019;16(4 Pt B):590-595. doi:10.1016/j.jacr.2019.01.001
6. Rohatgi KW, Marx CM, Lewis-Thames MW, Liu J, Colditz GA, James AS. Urban-rural disparities in access to low-dose computed tomography lung cancer screening in Missouri and Illinois. Prev Chronic Dis. 2020;17:E140. doi:10.5888/pcd17.200202
7. Boudreau JH, Miller DR, Qian S, Nunez ER, Caverly TJ, Wiener RS. Access to lung cancer screening in the Veterans Health Administration: does geographic distribution match need in the population? Chest. 2021;160(1):358-367. doi:10.1016/j.chest.2021.02.016
8. Howlader N, Noone AM, Krapcho M, et al, eds. SEER Cancer Statistics Review, 1975-2017. National Cancer Institute, US Dept of Health and Human Services; April 15, 2020. Accessed June 4, 2024. https://seer.cancer.gov/archive/csr/1975_2017/index.html
9. US Preventive Services Task Force, Krist AH, Davidson KW, et al. Screening for Lung Cancer: US Preventive Services Task Force Recommendation Statement. JAMA. 2021;325(10):962-970. doi:10.1001/jama.2021.1117
10. Gopal RK, Solanki P, Bokhour BG, et al. Provider, staff, and patient perspectives on medical visits using clinical video telehealth: a foundation for educational initiatives to improve medical care in telehealth. J Nurse Pract. 2021;17(5):582-587. doi:10.1016/j.nurpra.2021.02.020
11. Yacoub JH, Swanson CE, Jay AK, Cooper C, Spies J, Krishnan P. The radiology virtual reading room: during and beyond the COVID-19 pandemic. J Digit Imaging. 2021;34(2):308-319. doi:10.1007/s10278-021-00427-4
12. Beswick DM, Vashi A, Song Y, et al. Consultation via telemedicine and access to operative care for patients with head and neck cancer in a Veterans Health Administration population. Head Neck. 2016;38(6):925-929. doi:10.1002/hed.24386
13. Ruco A, Dossa F, Tinmouth J, et al. Social media and mHealth technology for cancer screening: systematic review and meta-analysis. J Med Internet Res. 2021;23(7):e26759. doi:10.2196/26759
14. Raza T, Joshi M, Schapira RM, Agha Z. Pulmonary telemedicine - a model to access the subspecialist services in underserved rural areas. Int J Med Inform. 2009;78(1):53-59. doi:10.1016/j.ijmedinf.2008.07.010
15. Chen A, Ayub MH, Mishuris RG, et al. Telehealth policy, practice, and education: a position statement of the Society of General Internal Medicine. J Gen Intern Med. 2023;38(11):2613-2620. doi:10.1007/s11606-023-08190-8
16. Rural-Urban Commuting Area Codes. Economic Research Service, US Dept of Agriculture. Updated September 25, 2023. Accessed June 4, 2024. https://www.ers.usda.gov/data-products/rural-urban-commuting-area-codes/
17. VHA Directive 1056: National Smoking and Tobacco Use Cessation Program. Veterans Health Administration, US Dept of Veterans Affairs; September 5, 2019. Accessed June 4, 2024. https://www.va.gov/vhapublications/ViewPublication.asp?pub_ID=8488
18. Smith HB, Ward R, Frazier C, Angotti J, Tanner NT. Guideline-recommended lung cancer screening adherence is superior with a centralized approach. Chest. 2022;161(3):818-825. doi:10.1016/j.chest.2021.09.002
19. Lewis JA, Samuels LR, Denton J, et al. The association of health care system resources with lung cancer screening implementation: a cohort study. Chest. 2022;162(3):701-711. doi:10.1016/j.chest.2022.03.050
20. US Dept of Veterans Affairs. Lung cancer screening: patient education fact sheet. Accessed July 8, 2024. https://www.cancer.va.gov/assets/pdf/survey/LCSflyer.pdf
21. Melzer AC, Golden SE, Ono SS, Datta S, Crothers K, Slatore CG. What exactly is shared decision-making? A qualitative study of shared decision-making in lung cancer screening. J Gen Intern Med. 2020;35(2):546-553. doi:10.1007/s11606-019-05516-3
22. Chelala L, Hossain R, Kazerooni EA, Christensen JD, Dyer DS, White CS. Lung-RADS Version 1.1: challenges and a look ahead, from the AJR special series on radiology reporting and data systems. AJR Am J Roentgenol. 2021;216(6):1411-1422. doi:10.2214/AJR.20.24807
23. Ritzwoller DP, Meza R, Carroll NM, et al. Evaluation of population-level changes associated with the 2021 US Preventive Services Task Force lung cancer screening recommendations in community-based health care systems. JAMA Netw Open. 2021;4(10):e2128176. doi:10.1001/jamanetworkopen.2021.28176
24. Golden SE, Ono SS, Thakurta SG, et al. “I’m putting my trust in their hands”: a qualitative study of patients’ views on clinician initial communication about lung cancer screening. Chest. 2020;158(3):1260-1267. doi:10.1016/j.chest.2020.02.072
25. Park ER, Chiles C, Cinciripini PM, et al. Impact of the COVID-19 pandemic on telehealth research in cancer prevention and care: a call to sustain telehealth advances. Cancer. 2021;127(3):334-338. doi:10.1002/cncr.33227
26. Tremblay A, Taghizadeh N, Huang J, et al. A randomized controlled study of integrated smoking cessation in a lung cancer screening program. J Thorac Oncol. 2019;14(9):1528-1537. doi:10.1016/j.jtho.2019.04.024
27. Neil JM, Marotta C, Gonzalez I, et al. Integrating tobacco treatment into lung cancer screening practices: study protocol for the Screen ASSIST randomized clinical trial. Contemp Clin Trials. 2021;111:106586. doi:10.1016/j.cct.2021.106586
Impact of VA Hematology/Oncology Clinical Pharmacy Practitioners in the Review of Community Prescriptions for Specialty Medications
The value of a hematology/oncology clinical pharmacy practitioner (CPP) has been validated in several studies documenting their positive impact on patient outcomes, supportive care management, laboratory monitoring, medication error identification, and drug expenditure.1-6 With> 200 oncology-related US Food and Drug Administration approval notifications published from 2020 to 2023, it is no surprise that national trends in oncology drug clinic expenditures increased from $39.9 billion in 2020 to $44.1 billion in 2021.7,8 With the rapidly changing treatment landscape, new drug approvals, and risk of polypharmacy, oral anticancer agents carry a high risk for medication errors.4 Additional challenges include complex dosing regimens and instructions, adherence issues, drug interactions, adjustments for organ dysfunction, and extensive adverse effect (AE) profiles.
Because of the niche and complexity of oral anticancer agents, trained CPPs havehematology/oncology education and expertise that pharmacists without specialized training lack. A survey of 243 nonspecialized community pharmacists that assessed their knowledge of oral anticancer therapies revealed that only about half of the knowledge questions were answered correctly, illustrating an education gap among these pharmacists.9 The Hematology/Oncology Pharmacist Association's suggests that best practices for managing oral oncology therapy should include comprehensive medication review by an oncology-trained pharmacist for each prescription.10
The US Department of Veterans Affairs (VA) community care network, which was established by the MISSION Act, allows covered access for eligible veterans in the local community outside of the VA network. Unfortunately, this dual-system use of health care could increase the risk of poorly coordinated care and has been associated with the risk of inappropriate prescribing.11,12 It is unclear how many private practices enrolled in the community care program have access to oncology-trained pharmacists. Specialized pharmaceutical reviews of oral anticancer medication prescriptions from these practices are vital for veteran care. This study evaluates the clinical and financial interventions of hematology/oncology CPPs review of specialty hematology/oncology prescriptions from community care health care practitioners (HCPs) at the Veterans Affairs North Texas Health Care System (VANTHCS) in Dallas.
METHODS
This study is a retrospective review of Computerized Patient Record System (CPRS) records of patients at VANTHCS from January 1, 2015, to June 30, 2023. Patients included were aged ≥ 18 years, enrolled in the VA community care program, received a specialty hematology/oncology medication that was dispensed through VA pharmacies or VA-contracted pharmacies, and had an hematology/oncology CPP medication review documented in CPRS. The primary aim of this study was to assess the number and types of clinical interventions performed. A clinical intervention was defined as a documented communication attempt with a community care HCP or direct communication with a patient to address a specific medication-related issue noted during CPP review.
Review of specialty hematology/oncology medications by a hematology/oncology CPP included evaluation of therapy indication, such as whether the prescription meets clinical guidelines, VA criteria for use, or other clinical literature as judged appropriate by the CPP. In some cases, the CPP requested that the community care HCP prescribe a more cost-effective or formulary-preferred agent. Each prescription was reviewed for dosage and formulation appropriateness, drug interactions with available medication lists, baseline laboratory test completion, and recommended supportive care medicines. At times, patient counseling is completed as part of the clinical review. When necessary, CPPs could discuss patient cases with a VA-employed oncologist for further oversight regarding appropriateness and safety. Secondary outcomes included the number of interventions accepted or denied by the prescriber provider and cost savings.
Data collected included the type of malignancy, hematology/oncology specialty medication requested, number and type of interventions sent to the community care prescriber, number of interventions accepted or denied by the community care prescriber, and whether the CPP conducted patient counseling or dispensed or denied the product. Cost savings were calculated for medications that were denied or changed to a formulary preferred or cost-effective agent using pricing data from the National Acquisition Center Contract Catalog or Federal Supply Schedule Service as of April 2024.
RESULTS
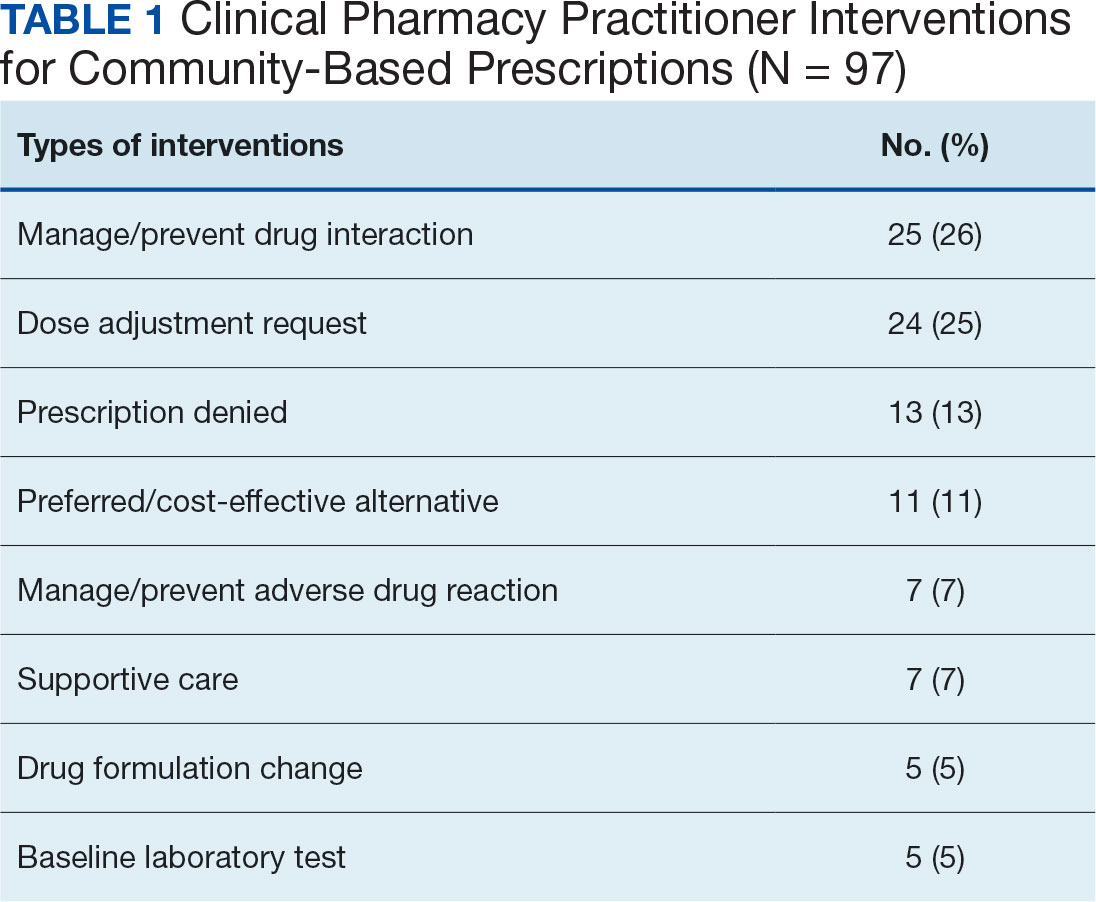
A total of 221 hematology/oncology prescriptions met inclusion criteria. Among patients receiving these prescriptions, the median age was 70 years and 91% were male. The most common malignancies included 31 instances of multiple myeloma (14%), 26 for chronic lymphocytic leukemia (12%), 24 for prostate cancer (11%), 23 for glioblastoma/brain cancer (10%), 18 for renal cell carcinoma (8%), 17 for colorectal cancer (8%), and 15 for acute myeloid leukemia (7%). Clinical interventions by the hematology/oncology CPP were completed for 82 (37%) of the 221 prescriptions. One clinical intervention was communicated directly to the patient, and attempts were made to communicate with the community care HCP for the remaining 81 prescriptions. The CPP documented 97 clinical interventions for the 82 prescriptions (Table 1). The most commonly documented clinical interventions included: 25 for managing/preventing a drug interaction (26%), 24 for dose adjustment request (25%), 13 for prescription denial (13%), and 11 for requesting the use of a preferred or more cost-effective product (11%). Of note, 16 patients (7%) received counseling from the hematology/oncology CPP. Ten patients (5%) received counseling alone with no other intervention and did not meet the definition of a clinical intervention.
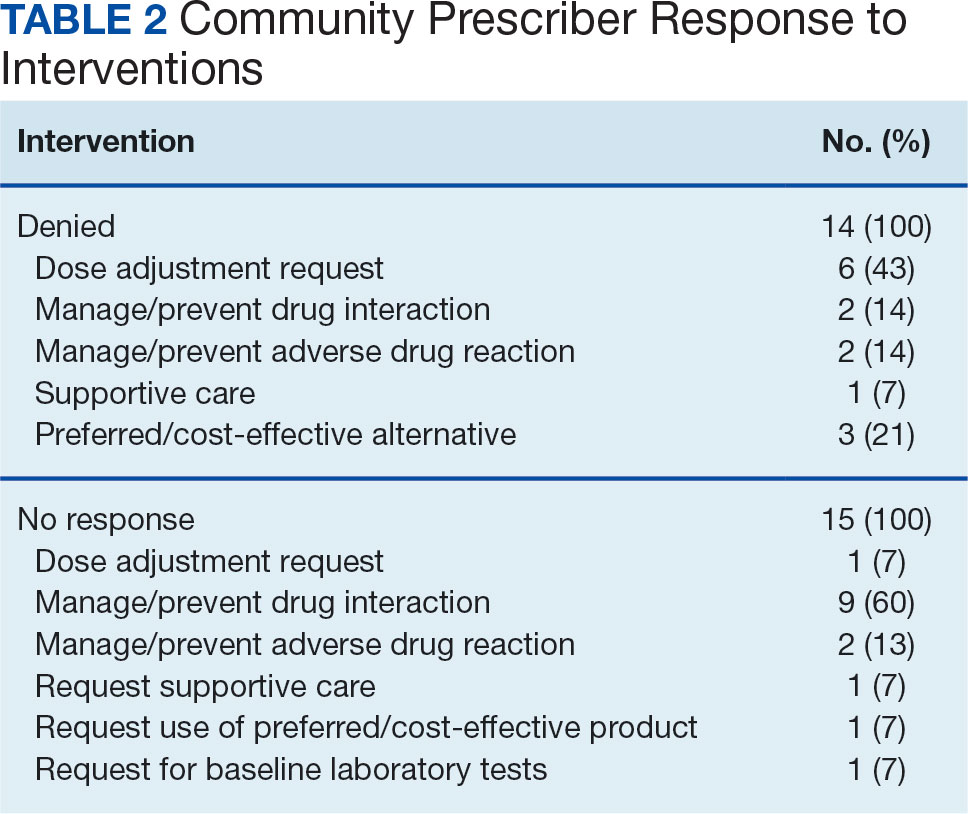
The most frequent prescriptions requiring intervention included 8 for enzalutamide, 7 for venetoclax, 6 for ibrutinib, and 5 each for lenalidomide, cabozantinib, and temozolomide. Among the 97 interventions, 68 were approved (70%), 15 received no response (16%), and 14 were denied by the community care HCP (14%). Despite obtaining no response or intervention denial from the community care HCP, hematology/oncology CPPs could approve these prescriptions if clinically appropriate, and their reasoning was documented. Table 2 further describes the types of interventions that were denied or obtained no response by the community care practitioner. Among the prescriptions denied by the hematology/oncology CPP, 11 were rejected for off-label indications and/or did not have support through primary literature, national guidelines, or VA criteria for use. Only 2 prescriptions were denied for safety concerns.
These documented clinical interventions had financial implications. For drugs with available cost data, requesting the use of a preferred/cost-effective product led to estimated savings of at least $263,536 over the study period with some ongoing cost savings. Prescription denials led to further estimated savings of $186,275 per month, although this is limited by the lack of known costs of alternative therapies the community care physicians chose.
DISCUSSION
More than one-third of prescriptions required clinical interventions, and 70% of these interventions were accepted by the community care prescriber, demonstrating the CPP’s essential role. Results indicate that most CPP clinical interventions involved clarifying and correcting doses, managing pertinent drug interactions, and ensuring appropriate use of medications according to clinical and national VA guidelines. Other studies have examined the impact of CPPs on patient care and cancer treatment.5,6 The randomized, multicenter AMBORA trial found that clinical pharmacist support reduced severe AEs and medication errors related to oral anticancer agents.5 The per-patient mean number of medication errors found by pharmacist review was 1.7 (range, 0 to 9), with most medication errors noted at the prescribing stage.5 Suzuki and colleagues analyzed data from 35,062 chemotherapy regimens and found that 53.1% of the chemotherapy prescriptions were modified because of pharmacist interventions.6 The most common reason for prescription modifications was prescription error.
Most of the clinical interventions in this study were accepted by community HCPs, indicating that these prescribers are receptive to hematology/oncology CPP input. Among those with no response, most were in relation to recommendations regarding drug interactions. In most of these cases, the drug interaction was not clinically concerning enough to require a response before the CPP approved the prescription. Therefore, it is unknown whether the outside HCP implemented the clinical recommendations. The most common types of clinical interventions the community care HCP declined were dose adjustment requests or requests to switch to a more cost-effective/formulary-preferred agent. In these cases, the prescriber’s preference was documented and, if clinically appropriate, approved by the CPP.
Although the financial implications of CPP clinical interventions were only marginally evaluated in this review, results suggest that cost savings by requests to switch to a cost-effective/formulary preferred agent or prescription denials are substantial. Because of changes in prescription costs over time, it is possible that savings from CPP intervention were greater than calculations using current Federal Supply Schedule Service pricing. The total impact of CPP prescription interventions on reducing or preventing hospitalizations or AEs is not known from this review, but other data suggest that cost savings may benefit the system.13,14
Limitations
This study's retrospective design is a limitation because practice patterns at the VANTHCS involving multiple hematology/oncology CPPs review of community care prescriptions might have evolved over time. The total financial implications of CPP interventions cannot fully be elucidated. The cost of alternative therapies used for patients who received a prescription denial is not factored into this review.
Conclusions
VANTHCS CPPs played an essential role in reviewing anticancer medication prescriptions from community care prescribers. In this study, CPP clinical interventions were completed for more than one-third of the prescriptions and the community-based HCP approved most of these interventions. These changes also resulted in financial benefits.
These findings add to the body of literature emphasizing the need for hematology/oncology-trained CPPs to review anticancer prescriptions and treatment plans. Our review could be used to justify CPP involvement in community care specialty medication review at VA facilities that do not currently have CPP involvement.
1. Shah NN, Casella E, Capozzi D, et al. Improving the safety of oral chemotherapy at an academic medical center. J Oncol Pract. 2016;12(1):e71-e76. doi:10.1200/JOP.2015.007260
2. Gatwood J, Gatwood K, Gabre E, Alexander M. Impact of clinical pharmacists in outpatient oncology practices: a review. Am J Health Syst Pharm. 2017;74(19):1549-1557. doi:10.2146/ajhp160475
3. Lankford C, Dura J, Tran A, et al. Effect of clinical pharmacist interventions on cost in an integrated health system specialty pharmacy. J Manag Care Spec Pharm. 2021;27(3):379-384. doi:10.18553/jmcp.2021.27.3.379
4. Schlichtig K, Dürr P, Dörje F, Fromm MF. Medication errors during treatment with new oral anticancer agents: consequences for clinical practice based on the AMBORA Study. Clin Pharmacol Ther. 2021;110(4):1075-1086. doi:10.1002/cpt.2338
5. Dürr P, Schlichtig K, Kelz C, et al. The randomized AMBORA Trial: impact of pharmacological/pharmaceutical care on medication safety and patient-reported outcomes during treatment with new oral anticancer agents. J Clin Oncol. 2021;39(18):1983-1994. doi:10.1200/JCO.20.03088
6. Suzuki S, Chan A, Nomura H, Johnson PE, Endo K, Saito S. Chemotherapy regimen checks performed by pharmacists contribute to safe administration of chemotherapy. J Oncol Pharm Pract. 2017;23(1):18-25. doi:10.1177/1078155215614998
7. Tichy EM, Hoffman JM, Suda KJ, et al. National trends in prescription drug expenditures and projections for 2022. Am J Health Syst Pharm. 2022;79(14):1158-1172. doi:10.1093/ajhp/zxac102
8. US Food and Drug Administration. Oncology (cancer)/hematologic malignancies approval notifications. 2023.
9. O’Bryant CL, Crandell BC. Community pharmacists’ knowledge of and attitudes toward oral chemotherapy. J Am Pharm Assoc (2003). 2008;48(5):632-639. doi:10.1331/JAPhA.2008.07082
10. Mackler E, Segal EM, Muluneh B, Jeffers K, Carmichael J. 2018 hematology/oncology pharmacist association best practices for the management of oral oncolytic therapy: pharmacy practice standard. J Oncol Pract. 2019;15(4):e346-e355. doi:10.1200/JOP.18.00581
11. Thorpe JM, Thorpe CT, Schleiden L, et al. Association between dual use of Department of Veterans Affairs and Medicare part D drug benefits and potentially unsafe prescribing. JAMA Intern Med. 2019;179(11):1584-1586. doi:10.1001/jamainternmed.2019.2788
12. Thorpe JM, Thorpe CT, Gellad WF, et al. Dual health care system use and high-risk prescribing in patients with dementia: a national cohort study. Ann Intern Med. 2017;166(3):157-163. doi:10.7326/M16-0551
13. Chen P-Z, Wu C-C, Huang C-F. Clinical and economic impact of clinical pharmacist intervention in a hematology unit. J Oncol Pharm Pract. 2020;26(4):866-872. doi:10.1177/1078155219875806
14. Dalton K, Byrne S. Role of the pharmacist in reducing healthcare costs: current insights. Integr Pharm Res Pract. 2017;6:37-46. doi:10.2147/IPRP.S108047
The value of a hematology/oncology clinical pharmacy practitioner (CPP) has been validated in several studies documenting their positive impact on patient outcomes, supportive care management, laboratory monitoring, medication error identification, and drug expenditure.1-6 With> 200 oncology-related US Food and Drug Administration approval notifications published from 2020 to 2023, it is no surprise that national trends in oncology drug clinic expenditures increased from $39.9 billion in 2020 to $44.1 billion in 2021.7,8 With the rapidly changing treatment landscape, new drug approvals, and risk of polypharmacy, oral anticancer agents carry a high risk for medication errors.4 Additional challenges include complex dosing regimens and instructions, adherence issues, drug interactions, adjustments for organ dysfunction, and extensive adverse effect (AE) profiles.
Because of the niche and complexity of oral anticancer agents, trained CPPs havehematology/oncology education and expertise that pharmacists without specialized training lack. A survey of 243 nonspecialized community pharmacists that assessed their knowledge of oral anticancer therapies revealed that only about half of the knowledge questions were answered correctly, illustrating an education gap among these pharmacists.9 The Hematology/Oncology Pharmacist Association's suggests that best practices for managing oral oncology therapy should include comprehensive medication review by an oncology-trained pharmacist for each prescription.10
The US Department of Veterans Affairs (VA) community care network, which was established by the MISSION Act, allows covered access for eligible veterans in the local community outside of the VA network. Unfortunately, this dual-system use of health care could increase the risk of poorly coordinated care and has been associated with the risk of inappropriate prescribing.11,12 It is unclear how many private practices enrolled in the community care program have access to oncology-trained pharmacists. Specialized pharmaceutical reviews of oral anticancer medication prescriptions from these practices are vital for veteran care. This study evaluates the clinical and financial interventions of hematology/oncology CPPs review of specialty hematology/oncology prescriptions from community care health care practitioners (HCPs) at the Veterans Affairs North Texas Health Care System (VANTHCS) in Dallas.
METHODS
This study is a retrospective review of Computerized Patient Record System (CPRS) records of patients at VANTHCS from January 1, 2015, to June 30, 2023. Patients included were aged ≥ 18 years, enrolled in the VA community care program, received a specialty hematology/oncology medication that was dispensed through VA pharmacies or VA-contracted pharmacies, and had an hematology/oncology CPP medication review documented in CPRS. The primary aim of this study was to assess the number and types of clinical interventions performed. A clinical intervention was defined as a documented communication attempt with a community care HCP or direct communication with a patient to address a specific medication-related issue noted during CPP review.
Review of specialty hematology/oncology medications by a hematology/oncology CPP included evaluation of therapy indication, such as whether the prescription meets clinical guidelines, VA criteria for use, or other clinical literature as judged appropriate by the CPP. In some cases, the CPP requested that the community care HCP prescribe a more cost-effective or formulary-preferred agent. Each prescription was reviewed for dosage and formulation appropriateness, drug interactions with available medication lists, baseline laboratory test completion, and recommended supportive care medicines. At times, patient counseling is completed as part of the clinical review. When necessary, CPPs could discuss patient cases with a VA-employed oncologist for further oversight regarding appropriateness and safety. Secondary outcomes included the number of interventions accepted or denied by the prescriber provider and cost savings.
Data collected included the type of malignancy, hematology/oncology specialty medication requested, number and type of interventions sent to the community care prescriber, number of interventions accepted or denied by the community care prescriber, and whether the CPP conducted patient counseling or dispensed or denied the product. Cost savings were calculated for medications that were denied or changed to a formulary preferred or cost-effective agent using pricing data from the National Acquisition Center Contract Catalog or Federal Supply Schedule Service as of April 2024.
RESULTS
A total of 221 hematology/oncology prescriptions met inclusion criteria. Among patients receiving these prescriptions, the median age was 70 years and 91% were male. The most common malignancies included 31 instances of multiple myeloma (14%), 26 for chronic lymphocytic leukemia (12%), 24 for prostate cancer (11%), 23 for glioblastoma/brain cancer (10%), 18 for renal cell carcinoma (8%), 17 for colorectal cancer (8%), and 15 for acute myeloid leukemia (7%). Clinical interventions by the hematology/oncology CPP were completed for 82 (37%) of the 221 prescriptions. One clinical intervention was communicated directly to the patient, and attempts were made to communicate with the community care HCP for the remaining 81 prescriptions. The CPP documented 97 clinical interventions for the 82 prescriptions (Table 1). The most commonly documented clinical interventions included: 25 for managing/preventing a drug interaction (26%), 24 for dose adjustment request (25%), 13 for prescription denial (13%), and 11 for requesting the use of a preferred or more cost-effective product (11%). Of note, 16 patients (7%) received counseling from the hematology/oncology CPP. Ten patients (5%) received counseling alone with no other intervention and did not meet the definition of a clinical intervention.
The most frequent prescriptions requiring intervention included 8 for enzalutamide, 7 for venetoclax, 6 for ibrutinib, and 5 each for lenalidomide, cabozantinib, and temozolomide. Among the 97 interventions, 68 were approved (70%), 15 received no response (16%), and 14 were denied by the community care HCP (14%). Despite obtaining no response or intervention denial from the community care HCP, hematology/oncology CPPs could approve these prescriptions if clinically appropriate, and their reasoning was documented. Table 2 further describes the types of interventions that were denied or obtained no response by the community care practitioner. Among the prescriptions denied by the hematology/oncology CPP, 11 were rejected for off-label indications and/or did not have support through primary literature, national guidelines, or VA criteria for use. Only 2 prescriptions were denied for safety concerns.
These documented clinical interventions had financial implications. For drugs with available cost data, requesting the use of a preferred/cost-effective product led to estimated savings of at least $263,536 over the study period with some ongoing cost savings. Prescription denials led to further estimated savings of $186,275 per month, although this is limited by the lack of known costs of alternative therapies the community care physicians chose.
DISCUSSION
More than one-third of prescriptions required clinical interventions, and 70% of these interventions were accepted by the community care prescriber, demonstrating the CPP’s essential role. Results indicate that most CPP clinical interventions involved clarifying and correcting doses, managing pertinent drug interactions, and ensuring appropriate use of medications according to clinical and national VA guidelines. Other studies have examined the impact of CPPs on patient care and cancer treatment.5,6 The randomized, multicenter AMBORA trial found that clinical pharmacist support reduced severe AEs and medication errors related to oral anticancer agents.5 The per-patient mean number of medication errors found by pharmacist review was 1.7 (range, 0 to 9), with most medication errors noted at the prescribing stage.5 Suzuki and colleagues analyzed data from 35,062 chemotherapy regimens and found that 53.1% of the chemotherapy prescriptions were modified because of pharmacist interventions.6 The most common reason for prescription modifications was prescription error.
Most of the clinical interventions in this study were accepted by community HCPs, indicating that these prescribers are receptive to hematology/oncology CPP input. Among those with no response, most were in relation to recommendations regarding drug interactions. In most of these cases, the drug interaction was not clinically concerning enough to require a response before the CPP approved the prescription. Therefore, it is unknown whether the outside HCP implemented the clinical recommendations. The most common types of clinical interventions the community care HCP declined were dose adjustment requests or requests to switch to a more cost-effective/formulary-preferred agent. In these cases, the prescriber’s preference was documented and, if clinically appropriate, approved by the CPP.
Although the financial implications of CPP clinical interventions were only marginally evaluated in this review, results suggest that cost savings by requests to switch to a cost-effective/formulary preferred agent or prescription denials are substantial. Because of changes in prescription costs over time, it is possible that savings from CPP intervention were greater than calculations using current Federal Supply Schedule Service pricing. The total impact of CPP prescription interventions on reducing or preventing hospitalizations or AEs is not known from this review, but other data suggest that cost savings may benefit the system.13,14
Limitations
This study's retrospective design is a limitation because practice patterns at the VANTHCS involving multiple hematology/oncology CPPs review of community care prescriptions might have evolved over time. The total financial implications of CPP interventions cannot fully be elucidated. The cost of alternative therapies used for patients who received a prescription denial is not factored into this review.
Conclusions
VANTHCS CPPs played an essential role in reviewing anticancer medication prescriptions from community care prescribers. In this study, CPP clinical interventions were completed for more than one-third of the prescriptions and the community-based HCP approved most of these interventions. These changes also resulted in financial benefits.
These findings add to the body of literature emphasizing the need for hematology/oncology-trained CPPs to review anticancer prescriptions and treatment plans. Our review could be used to justify CPP involvement in community care specialty medication review at VA facilities that do not currently have CPP involvement.
1. Shah NN, Casella E, Capozzi D, et al. Improving the safety of oral chemotherapy at an academic medical center. J Oncol Pract. 2016;12(1):e71-e76. doi:10.1200/JOP.2015.007260
2. Gatwood J, Gatwood K, Gabre E, Alexander M. Impact of clinical pharmacists in outpatient oncology practices: a review. Am J Health Syst Pharm. 2017;74(19):1549-1557. doi:10.2146/ajhp160475
3. Lankford C, Dura J, Tran A, et al. Effect of clinical pharmacist interventions on cost in an integrated health system specialty pharmacy. J Manag Care Spec Pharm. 2021;27(3):379-384. doi:10.18553/jmcp.2021.27.3.379
4. Schlichtig K, Dürr P, Dörje F, Fromm MF. Medication errors during treatment with new oral anticancer agents: consequences for clinical practice based on the AMBORA Study. Clin Pharmacol Ther. 2021;110(4):1075-1086. doi:10.1002/cpt.2338
5. Dürr P, Schlichtig K, Kelz C, et al. The randomized AMBORA Trial: impact of pharmacological/pharmaceutical care on medication safety and patient-reported outcomes during treatment with new oral anticancer agents. J Clin Oncol. 2021;39(18):1983-1994. doi:10.1200/JCO.20.03088
6. Suzuki S, Chan A, Nomura H, Johnson PE, Endo K, Saito S. Chemotherapy regimen checks performed by pharmacists contribute to safe administration of chemotherapy. J Oncol Pharm Pract. 2017;23(1):18-25. doi:10.1177/1078155215614998
7. Tichy EM, Hoffman JM, Suda KJ, et al. National trends in prescription drug expenditures and projections for 2022. Am J Health Syst Pharm. 2022;79(14):1158-1172. doi:10.1093/ajhp/zxac102
8. US Food and Drug Administration. Oncology (cancer)/hematologic malignancies approval notifications. 2023.
9. O’Bryant CL, Crandell BC. Community pharmacists’ knowledge of and attitudes toward oral chemotherapy. J Am Pharm Assoc (2003). 2008;48(5):632-639. doi:10.1331/JAPhA.2008.07082
10. Mackler E, Segal EM, Muluneh B, Jeffers K, Carmichael J. 2018 hematology/oncology pharmacist association best practices for the management of oral oncolytic therapy: pharmacy practice standard. J Oncol Pract. 2019;15(4):e346-e355. doi:10.1200/JOP.18.00581
11. Thorpe JM, Thorpe CT, Schleiden L, et al. Association between dual use of Department of Veterans Affairs and Medicare part D drug benefits and potentially unsafe prescribing. JAMA Intern Med. 2019;179(11):1584-1586. doi:10.1001/jamainternmed.2019.2788
12. Thorpe JM, Thorpe CT, Gellad WF, et al. Dual health care system use and high-risk prescribing in patients with dementia: a national cohort study. Ann Intern Med. 2017;166(3):157-163. doi:10.7326/M16-0551
13. Chen P-Z, Wu C-C, Huang C-F. Clinical and economic impact of clinical pharmacist intervention in a hematology unit. J Oncol Pharm Pract. 2020;26(4):866-872. doi:10.1177/1078155219875806
14. Dalton K, Byrne S. Role of the pharmacist in reducing healthcare costs: current insights. Integr Pharm Res Pract. 2017;6:37-46. doi:10.2147/IPRP.S108047