User login
Measuring Restrictive Lung Disease Severity Using FEV1 vs TLC
Respiratory diseases have varied clinical presentations and are classified as restrictive, obstructive, mixed, or normal. Restrictive lung diseases have reduced lung volumes, either due to an alteration in lung parenchyma or a disease of the pleura, chest wall, or neuromuscular apparatus. If caused by parenchymal lung disease, restrictive lung disorders are accompanied by reduced gas transfer, which may be portrayed clinically by desaturation after exercise. Based on anatomical structures, the causes of lung volume reduction may be intrinsic or extrinsic. Intrinsic causes correspond to diseases of the lung parenchyma, such as idiopathic fibrotic diseases, connective-tissue diseases, drug-induced lung diseases, and other primary diseases of the lungs. Extrinsic causes refer to disorders outside the lungs or extra-pulmonary diseases such as neuromuscular and nonmuscular diseases of the chest wall.1 For example, obesity and myasthenia gravis can cause restrictive lung diseases, one through mechanical interference of lung expansion and the other through neuromuscular impedance of thoracic cage expansion. All these diseases eventually result in lung restriction, impaired lung function, and respiratory failure. This heterogenicity of disease makes establishing a single severity criterion difficult.
Laboratory testing, imaging studies, and examinations are important for determining the pulmonary disease and its course and progression. The pulmonary function test (PFT), which consists of multiple procedures that are performed depending on the information needed, has been an essential tool in practice for the pulmonologist. The PFT includes spirometry, lung volume measurement, respiratory muscle strength, diffusion capacity, and a broncho-provocation test. Each test has a particular role in assisting the diagnosis and/or follow-up of the patient. Spirometry is frequently used due to its range of dynamic physiological parameters, ease of use, and accessibility. It is used for the diagnosis of pulmonary symptoms, in the assessment of disability, and preoperatory evaluation, including lung resection surgery, assisting in the diagnosis, monitoring, and therapy response of pulmonary diseases.
A systematic approach to PFT interpretation is recommended by several societies, such as the American Thoracic Society (ATS) and the European Respiratory Society (ERS).2 The pulmonary function test results must be reproducible and meet established standards to ensure reliable and consistent clinical outcomes. A restrictive respiratory disease is defined by a decrease in total lung capacity (TLC) (< 5% of predicted value) and a normal forced expiratory volume in 1 second (FEV1)/forced vital capacity (FVC) ratio.2 Although other findings—such as a decrease in vital capacity—should prompt an investigation into whether the patient has a possible restrictive respiratory disease, the sole presence of this parameter is not definitive or diagnostic of a restrictive impairment.2-4 The assessment of severity is typically determined by TLC. Unfortunately, the severity of a restrictive respiratory disease and the degree of patient discomfort do not always correlate when utilizing just TLC. Pulmonary sarcoidosis, for example, is a granulomatous lung disease with a restrictive PFT pattern and a disease burden that may vary over time. Having a more consistent method of grading the severity of the restrictive lung disease may help guide treatment. The modified Medical Research Council (mMRC) scale, a 5-point dyspnea scale, is widely used in assessing the severity of dyspnea in various respiratory conditions, including chronic obstructive pulmonary disease (COPD), where its scores have been associated with patient mortality.1,5 The goal of this study was to document the associations between objective parameters obtained through PFT and other variables, with an established measurement of dyspnea to assess the severity grade of restrictive lung diseases.
Methods
This retrospective record review at the Veterans Affairs Caribbean Healthcare System (VACHS) in San Juan, Puerto Rico, wasconducted using the Veterans Health Information Systems and Technology Architecture to identify patients with a PFT, including spirometry, that indicated a restrictive ventilator pattern based on the current ATS/ERS Task Force on Lung Function Testing.2 Patients were included if they were aged ≥ 21 years, PFT with TLC ≤ 80% predicted, mMRC score documented on PFT, and documented diffusing capacity of the lung for carbon monoxide (DLCO). Patients were excluded if their FEV1/vital capacity (VC) was < 70% predicted using the largest VC, or no mMRC score was available. All patients meeting the inclusion criteria were considered regardless of comorbidities.
The PFT results of all adult patients, including those performed between June 1, 2013, and January 6, 2016, were submitted to spirometry, and lung volume measurements were analyzed. Sociodemographic information was collected, including sex, ethnicity, age, height, weight, and basal metabolic index. Other data found in PFTs, such as smoking status, smoking in packs/year, mMRC score, predicted TLC value, imaging present (chest X-ray, computed tomography), and hospitalizations and exacerbations within 1 year were collected. In addition, we examined the predicted values for FEV1, DLCO, and DLCO/VA (calculated using the Ayer equation), FVC (calculated using the Knudson equation), expiratory reserve volume, inspiratory VC, and slow VC. PaO2, PaCO2, and Alveolar-arterial gradients also were collected.6-9 Information about heart failure status was gathered through medical evaluation of notes and cardiac studies. All categorical variables were correlated with Spearman analysis and quantitative variables with average percentages. P values were calculated with analysis of variance.
Results
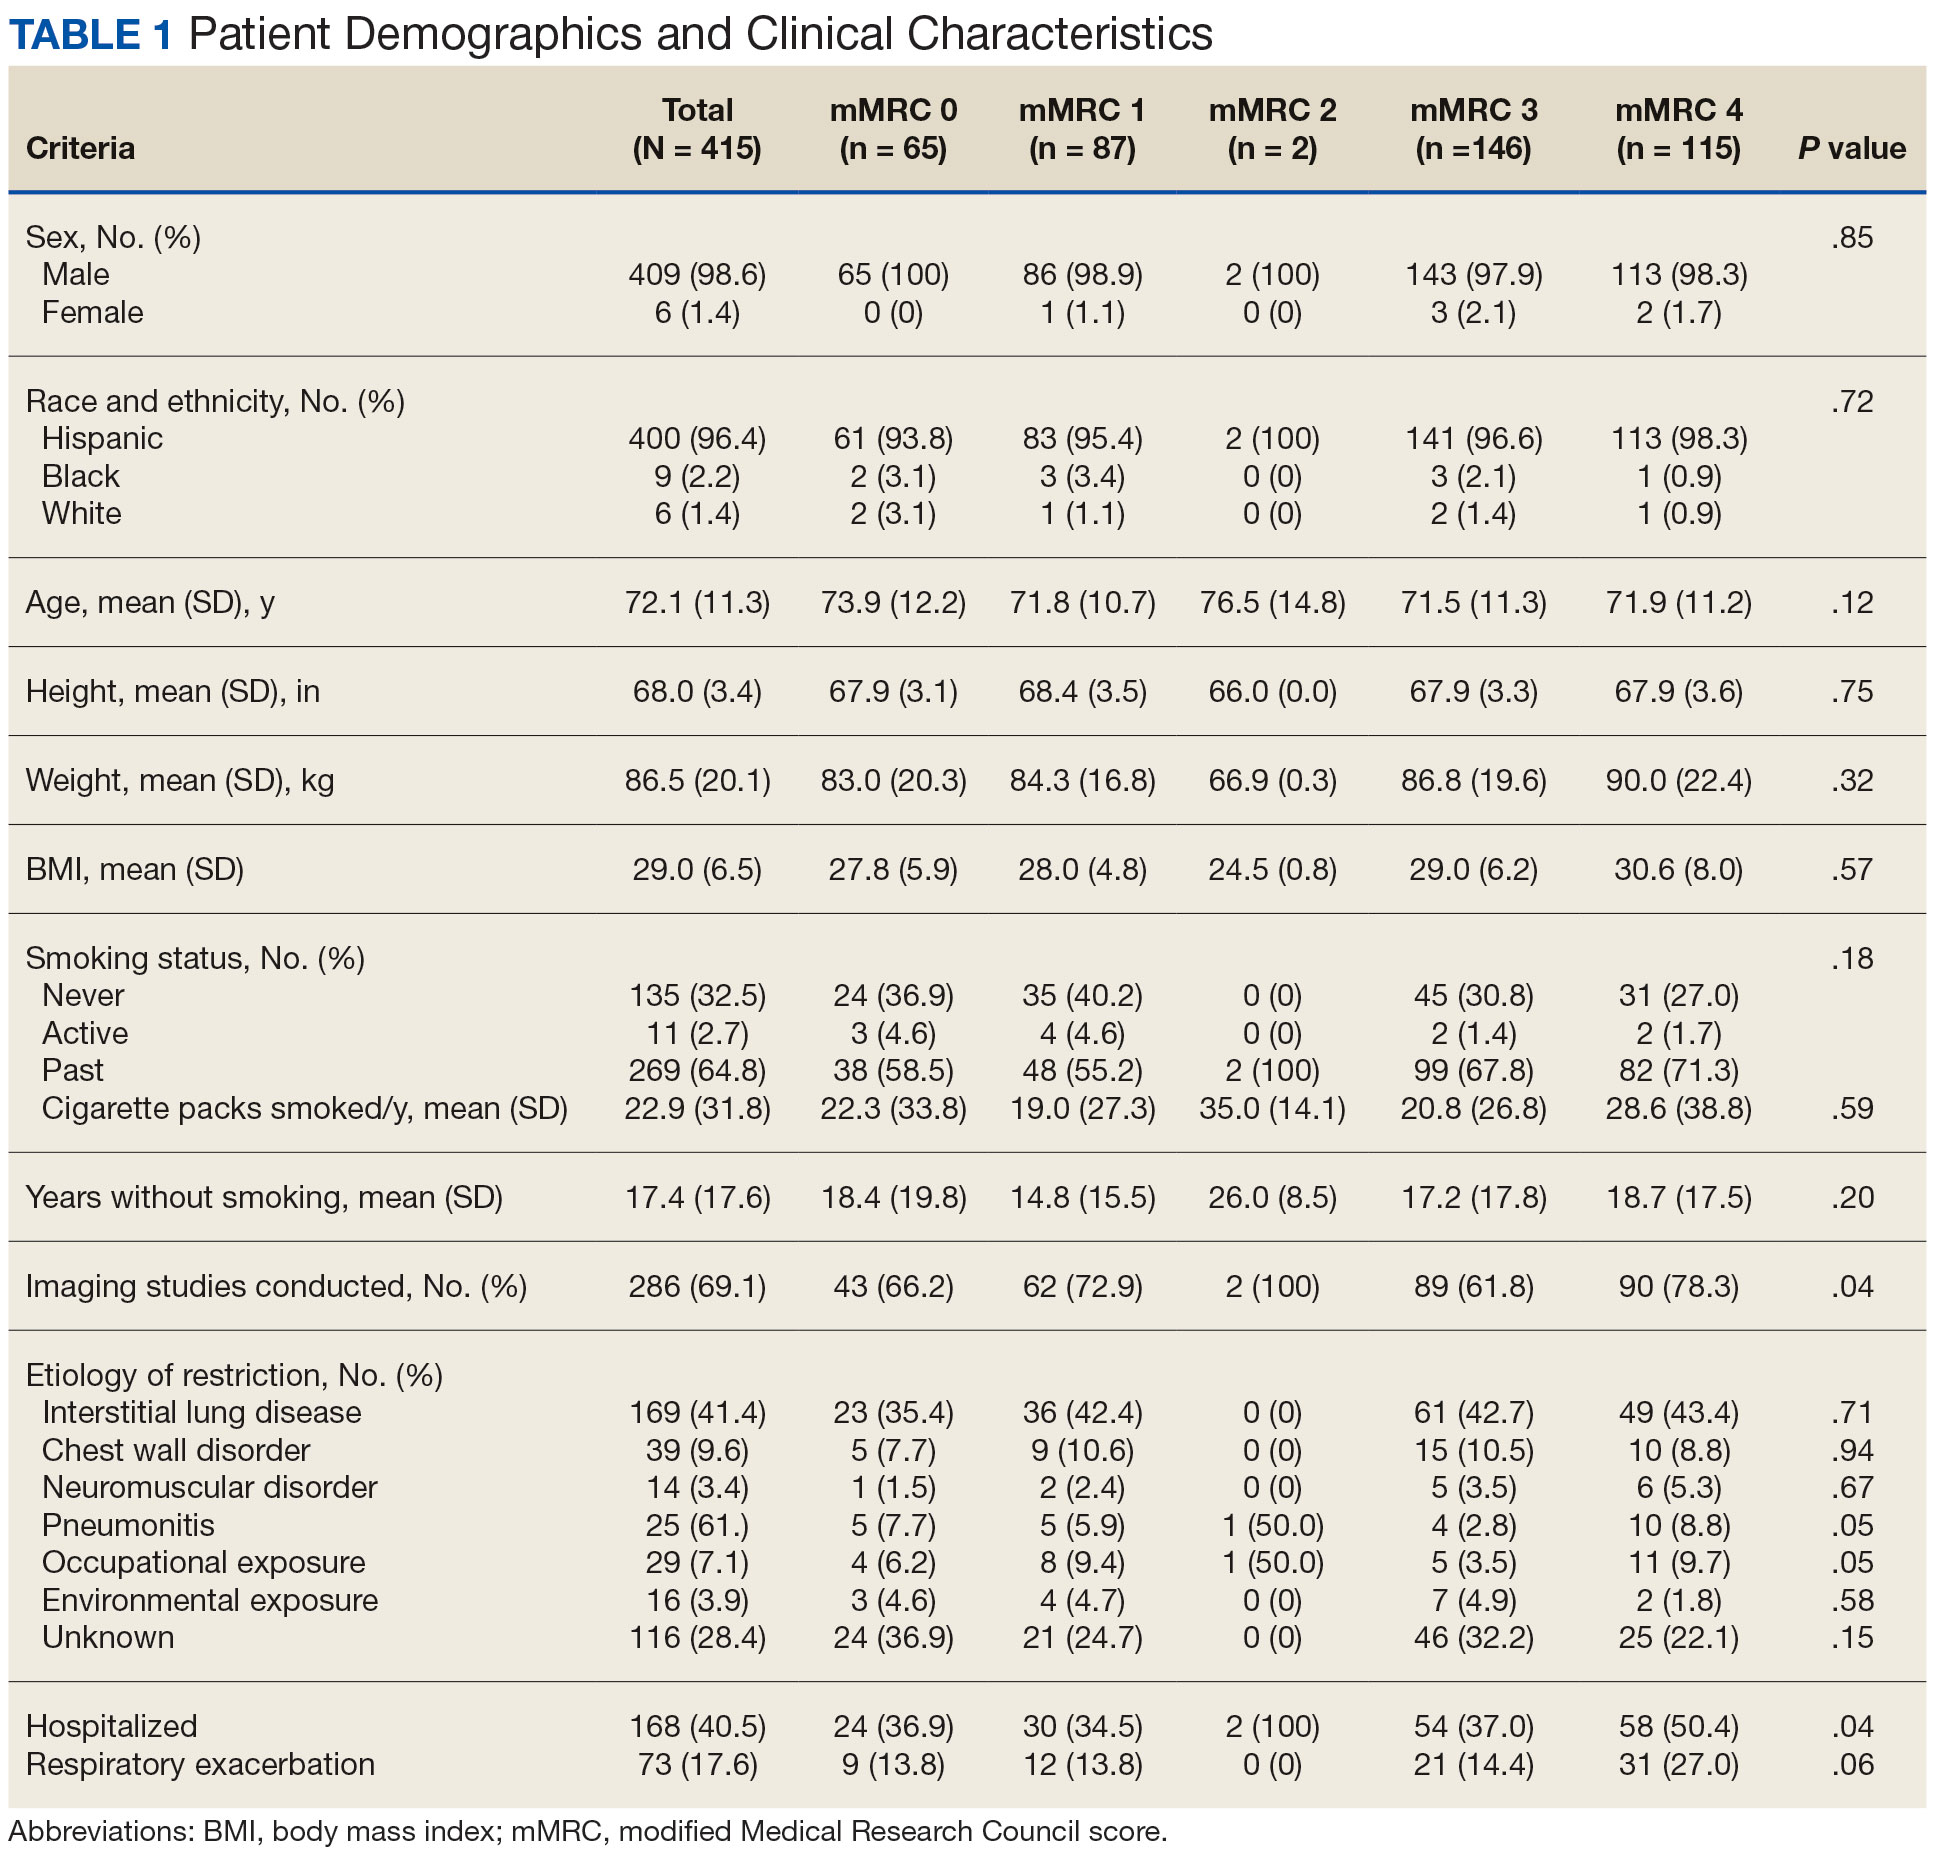
Of 6461 VACHS patient records reviewed, 415 met the inclusion criteria. Patients were divided according to their mMRC score: 65 had mMRC score of 0, 87 had an mMRC score of 1, 2 had an mMRC score of 2, 146 had an mMRC of 3, and 115 had an mMRC score of 4. The population was primarily male (98.6%) and of Hispanic ethnicity (96.4%), with a mean age of 72 years (Table 1). Most patients (n = 269, 64.0%) were prior smokers, while 135 patients (32.5%) had never smoked, and 11 (2.7%) were current smokers. At baseline, 169 patients (41.4%) had interstitial lung disease, 39 (9.6%) had chest wall disorders, 29 (7.1%) had occupational exposure, 25 (6.1%) had pneumonitis, and 14 (3.4%) had neuromuscular disorders.
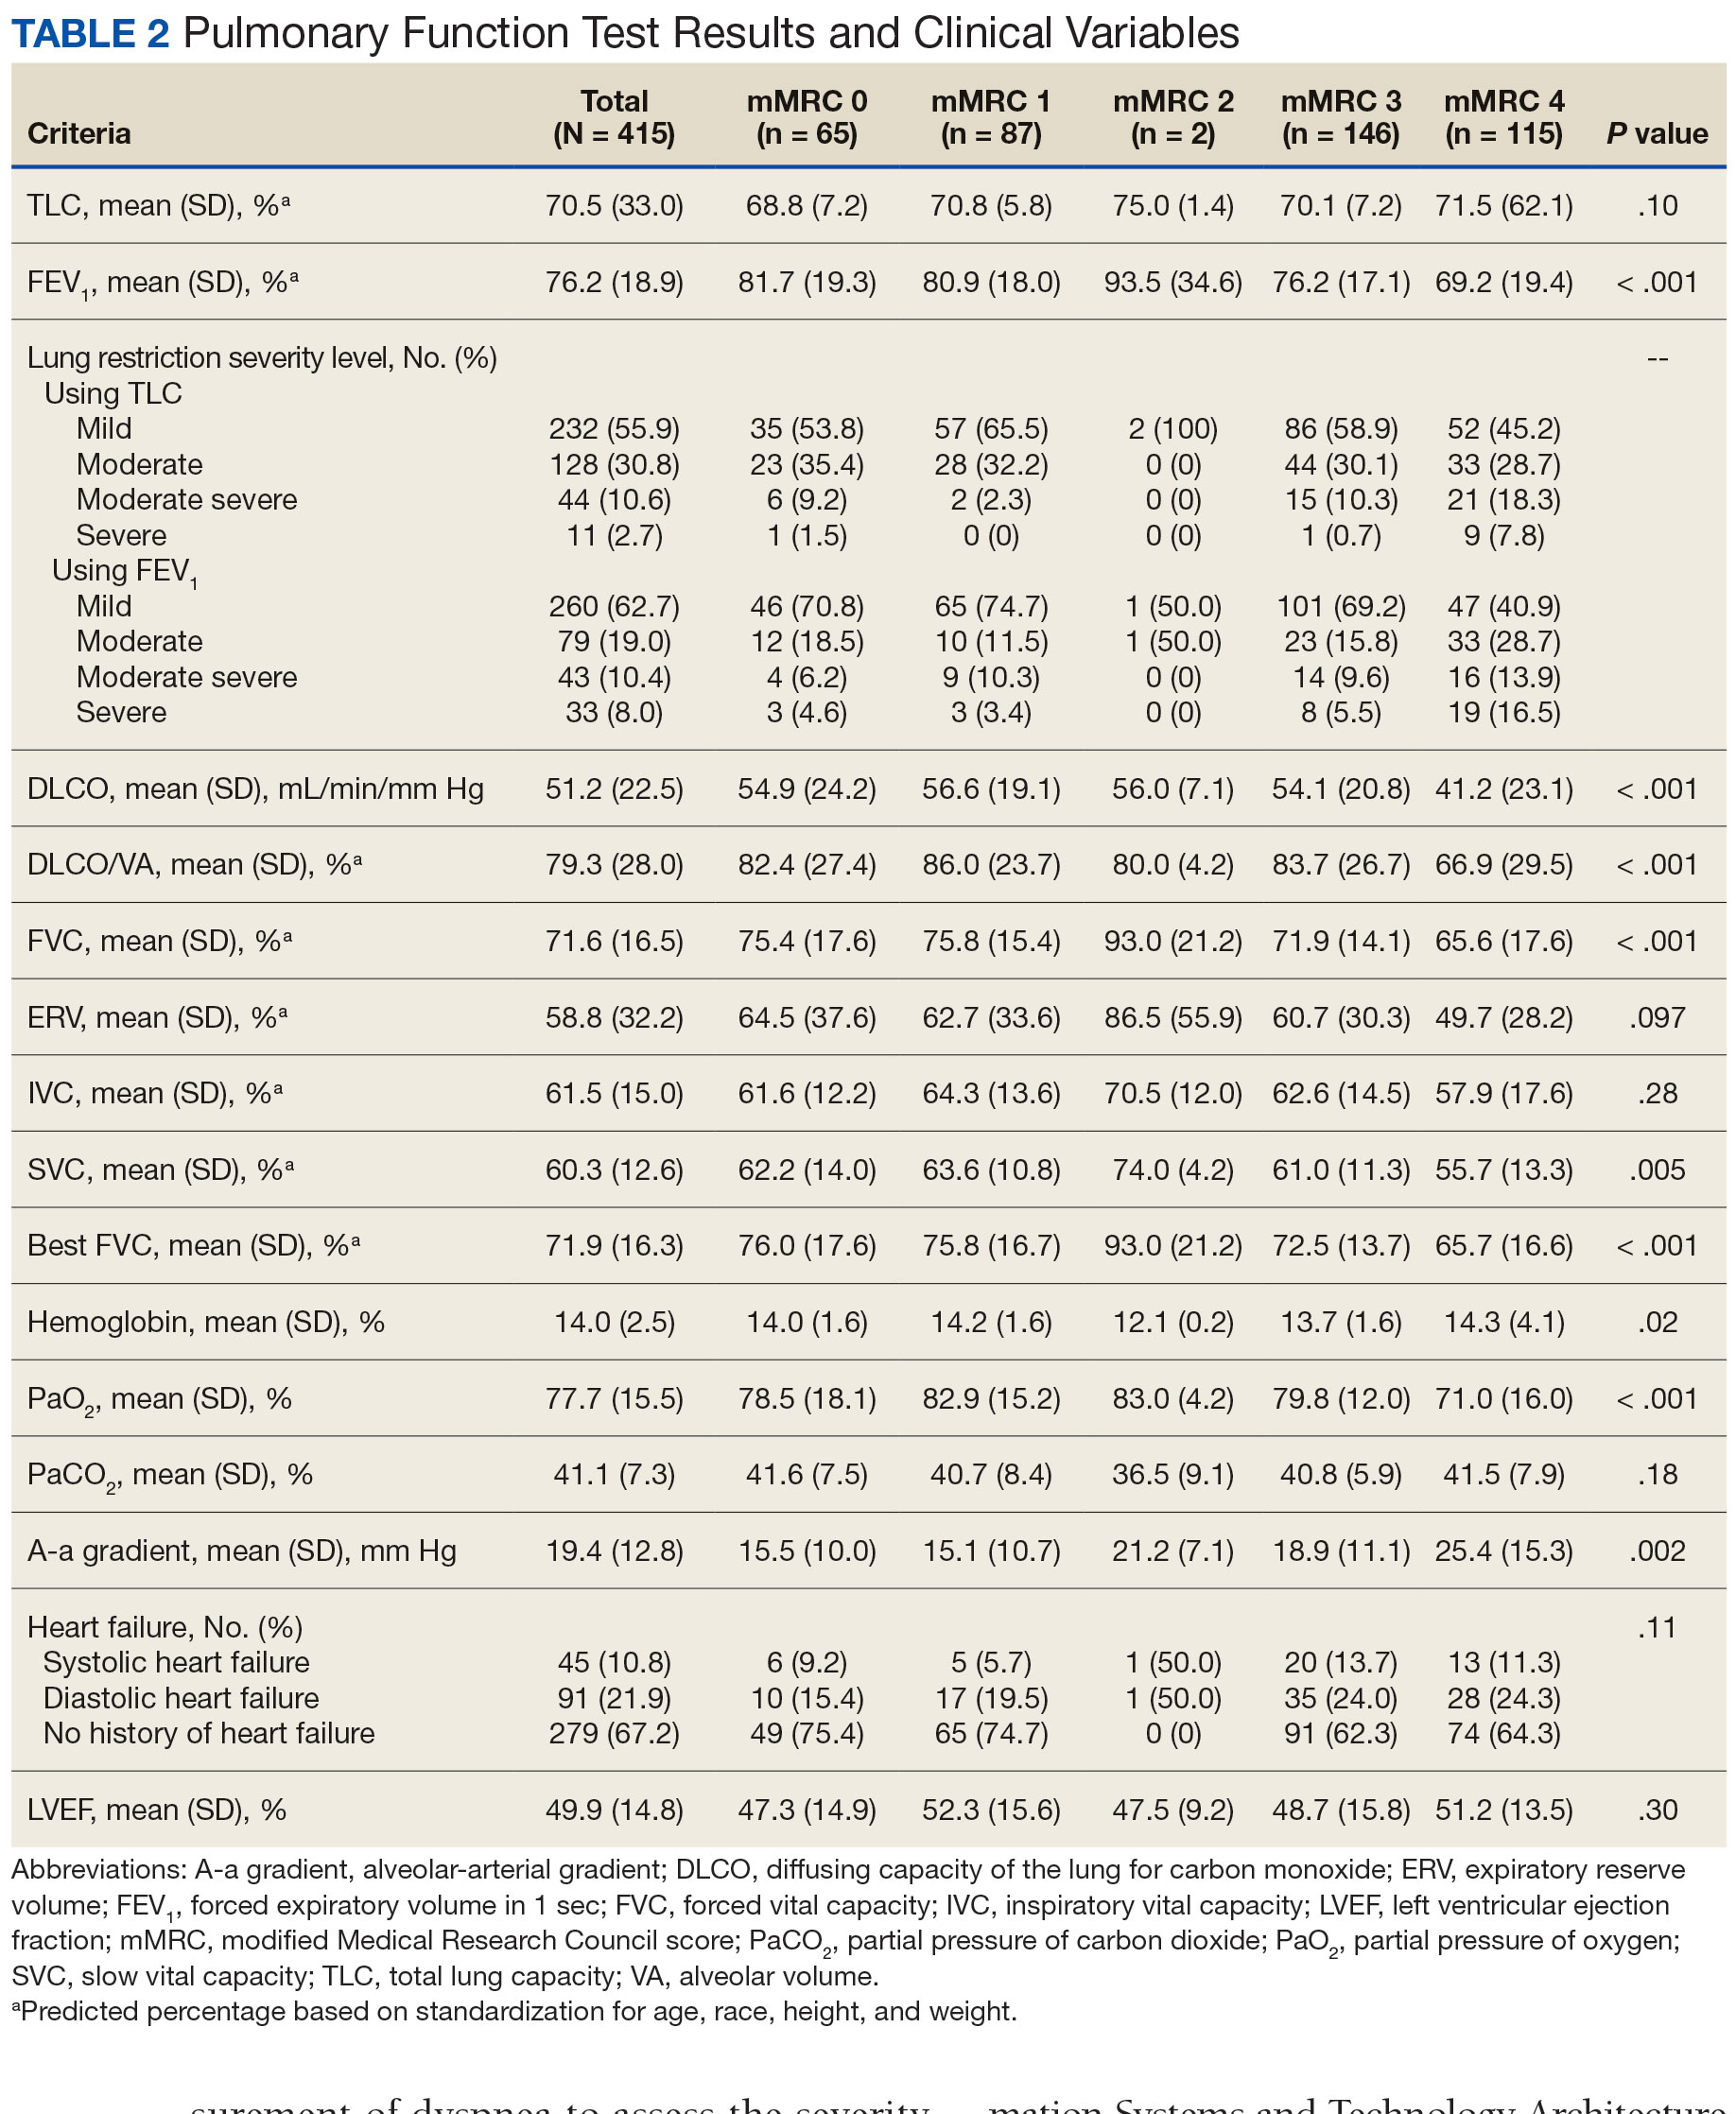
There was a statistically significant relationship between mMRC score and hospitalization and FEV1 but not TLC (Table 2). As mMRC increased, so did hospitalizations: a total of 168 patients (40.5%) were hospitalized; 24 patients (36.9%) had an mMRC score of 0, 30 patients (34.0%) had an mMRC score of 1, 2 patients (100%) had an mMRC score of 2, 54 patients (37.0%) had an mMRC score of 3, and 58 patients (50.0%) had an mMRC score of 4 (P = .04). Mean (SD) TLC values increased as mMRC scores increased. Mean (SD) TLC was 70.5% (33.0) for the entire population; 68.8% (7.2) for patients with an mMRC score of 0, 70.8% (5.8) for patients with an mMRC score of 1, 75.0% (1.4) for patients with an mMRC score of 2, 70.1% (7.2) for patients with an mMRC score of 3, and 71.5% (62.1) for patients with an mMRC score of 4 (P = .10) (Figure 1). There was an associated decrease in mean (SD) FEV1 with mMRC. Mean (SD) FEV1 was 76.2% (18.9) for the entire population; 81.7% (19.3) for patients with an mMRC score of 0, 80.9% (18) for patients with an mMRC score of 1, 93.5% (34.6) for patients with an mMRC score of 2, 76.2% (17.1) for patients with an mMRC score of 3, and 69.2% (19.4) for patients with an mMRC score of 4; (P < .001) (Figure 2).
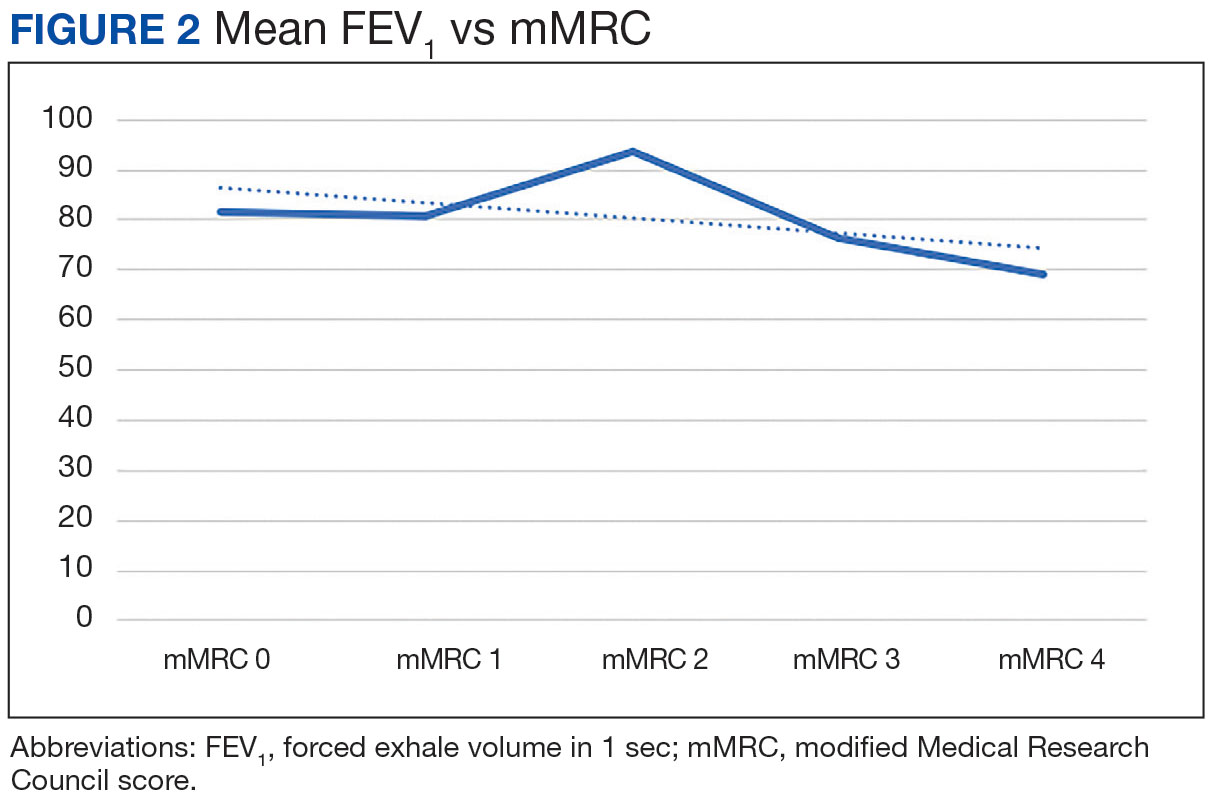
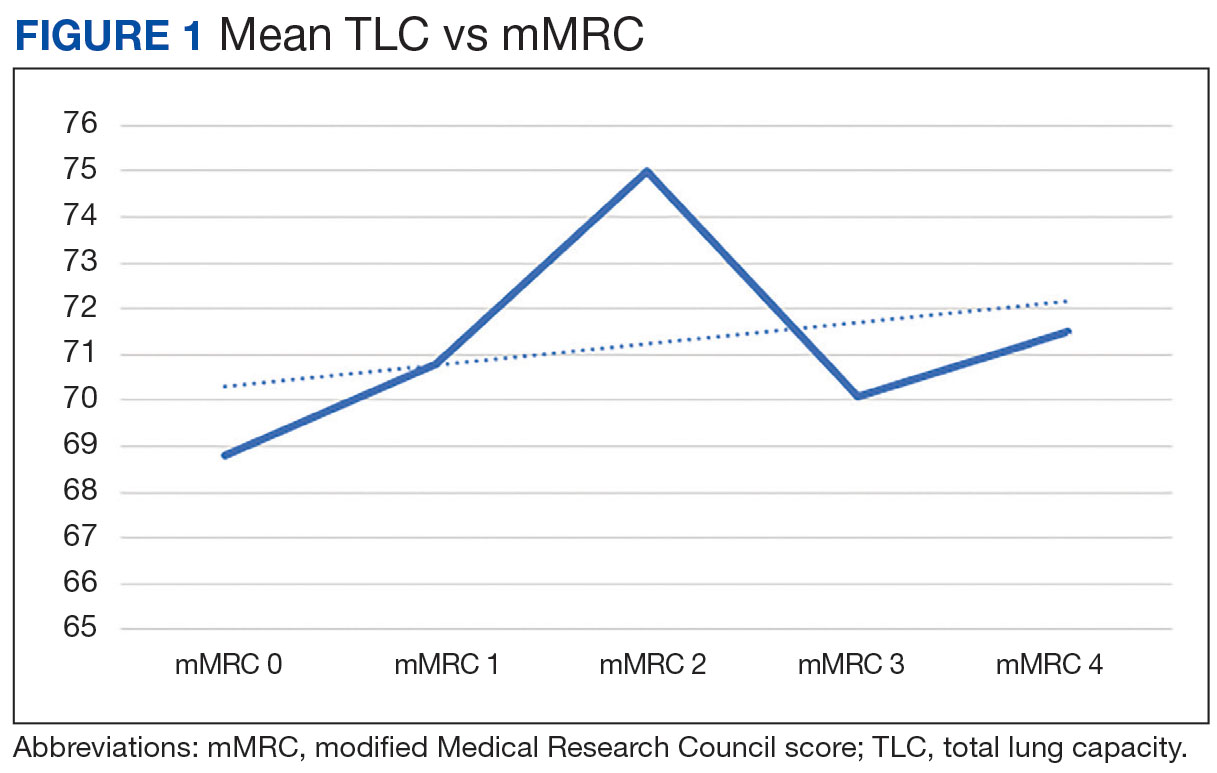
The correlation between mMRC and FEV1 (r = 0.25, P < .001) was stronger than the correlation between mMRC and TLC (r = 0.15, P < .001). The correlations for DLCO (P < .001), DLCO/VA (P < .001), hemoglobin (P < .02), and PaO2 (P < .001) were all statistically significant (P < .005), but with no strong identifiable trend.
Discussion
The patient population of this study was primarily older males of Hispanic ethnicity with a history of smoking. There was no association between body mass index or smoking status with worsening dyspnea as measured with mMRC scores. We observed no significant correlation between mMRC scores and various factors such as comorbidities including heart conditions, and epidemiological factors like the etiology of lung disease, including both intrinsic and extrinsic causes. This lack of association was anticipated, as restrictive lung diseases in our study predominantly arose from intrinsic pulmonary etiologies, such as interstitial lung disease. A difference between more hospitalizations and worsening dyspnea was identified. There was a slightly higher correlation between FEV1 and mMRC scores when compared with TLC and mMRC scores concerning worsening dyspnea, which could indicate that the use of FEV1 should be preferred over previous recommendations to use TLC.10 Other guidelines have utilized exercise capacity via the 6-minute walk test as a marker of severity with spirometry values and found that DLCO was correlated with severity.11
The latest ERS/ATS guidelines recommend z scores for grading the severity of obstructive lung diseases but do not recommend them for the diagnosis of restrictive lung diseases.12 A z score encompasses diverse variables (eg, age, sex, and ethnicity) to provide more uniform and consistent results. Other studies have been done to relate z scores to other spirometry variables with restrictive lung disease. One such study indicates the potential benefit of using FVC alone to grade restrictive lung diseases.13 There continues to be great diversity in the interpretation of pulmonary function tests, and we believe the information gathered can provide valuable insight for managing patients with restrictive lung diseases.
Limitations
Only 2 patients reported an mMRC score of 2 in our study. This may have affected statistical outcomes. It also may reveal possible deficits in the efficacy of patient education on the mMRC scale. This study was also limited by its small sample size, single center location, and the distribution of patients that reported an mMRC favored either low or high values. The patients in this study, who were all veterans, may not be representative of other patient populations.
Conclusions
There continue to be few factors associated with the physiological severity of the defective oxygen delivery and reported dyspnea of a patient with restrictive lung disease that allows for an accurate, repeatable grading of severity. Using FEV1 instead of TLC to determine the severity of a restrictive lung disease should be reconsidered. We could not find any other strong correlation among other factors studied. Further research should be conducted to continue looking for variables that more accurately depict patient dyspnea in restrictive lung disease.
Acknowledgments
This study is based upon work supported by the Veterans Affairs Caribbean Healthcare System in San Juan, Puerto Rico, and is the result of work supported by Pulmonary & Critical Care Medicine service, with resources and the use of its facilities.
1. Hegewald MJ, Crapo RO. Pulmonary function testing. In: Broaddus VC, Ernst JD, King Jr TE, eds. Murray and Nadel’s Textbook of Respiratory Medicine. 5th ed. Saunders; 2010:522-553.
2. Pellegrino R, Viegi G, Brusasco V, et al. Interpretative strategies for lung function tests. Eur Respir J. 2005;26(5):948-968. doi:10.1183/09031936.05.00035205
3. Rabe KF, Beghé B, Luppi F, Fabbri LM. Update in chronic obstructive pulmonary disease 2006. Am J Respir Crit Care Med. 2007;175(12):1222-1232. doi:10.1164/rccm.200704-586UP
4. Global Initiative for Chronic Obstructive Lung Disease (GOLD). Spirometry for health care providers Accessed April 30, 2024. https://goldcopd.org/wp-content/uploads/2016/04/GOLD_Spirometry_2010.pdf
5. Mannino DM, Holguin F, Pavlin BI, Ferdinands JM. Risk factors for prevalence of and mortality related to restriction on spirometry: findings from the First National Health and Nutrition Examination Survey and follow-up. Int J Tuberc Lung Dis. 2005;9(6):613-621.
6. Knudson RJ, Lebowitz MD, Holberg CJ, Burrows B. Changes in the normal maximal expiratory flow-volume curve with growth and aging. Am Rev Respir Dis. 1983;127(6):725-734. doi:10.1164/arrd.1983.127.6.725
7. Knudson RJ, Burrows B, Lebowitz MD. The maximal expiratory flow-volume curve: its use in the detection of ventilatory abnormalities in a population study. Am Rev Respir Dis. 1976;114(5):871-879. doi:10.1164/arrd.1976.114.5.871
8. Knudson RJ, Lebowitz MD, Burton AP, Knudson DE. The closing volume test: evaluation of nitrogen and bolus methods in a random population. Am Rev Respir Dis. 1977;115(3):423-434. doi:10.1164/arrd.1977.115.3.423
9. Ayers LN, Ginsberg ML, Fein J, Wasserman K. Diffusing capacity, specific diffusing capacity and interpretation of diffusion defects. West J Med. 1975;123(4):255-264.
10. Lung function testing: selection of reference values and interpretative strategies. American Thoracic Society. Am Rev Respir Dis. 1991;144(5):1202-1218. doi:10.1164/ajrccm/144.5.1202
11. Larson J, Wrzos K, Corazalla E, Wang Q, Kim HJ, Cho RJ. Should FEV1 be used to grade restrictive impairment? A single-center comparison of lung function parameters to 6-minute walk test in patients with restrictive lung disease. HSOA J Pulm Med Respir Res. 2023;9:082. doi:10.24966/PMRR-0177/100082
12. Stanojevic S, Kaminsky DA, Miller MR, et al. ERS/ATS technical standard on interpretive strategies for routine lung function tests. Eur Respir J. 2022;60(1):2101499. Published 2022 Jul 13. doi:10.1183/13993003.01499-2021
13. Myrberg T, Lindberg A, Eriksson B, et al. Restrictive spirometry versus restrictive lung function using the GLI reference values. Clin Physiol Funct Imaging. 2022;42(3):181-189. doi:10.1111/cpf.12745
Rebeca Vazquez-Nieves, MDa; Vanessa Fonseca-Ferrer, MDa; Juan Irizarry-Nieves, MDa; Edgardo Adorno-Fontanez, MDa; William Rodriguez-Cintron, MDa,b,c
Correspondence: Juan Irizarry-Nieves (juan.irizarry-nieves@va.gov)
aVeterans Affairs Caribbean Healthcare System, San Juan, Puerto Rico
bUniversity of Puerto Rico School of Medicine, San Juan
cUniversidad Central del Caribe School of Medicine, San Juan, Puerto Rico
 Author disclosures
The authors report no actual or potential conflicts of interest or outside sources of funding with regard to this article.
Disclaimer
The opinions expressed herein are those of the authors and do not necessarily reflect those of Federal Practitioner, Frontline Medical Communications Inc., the US Government, or any of its agencies.
Ethics and consent
All documentation was approved by the Veterans Affairs Caribbean Healthcare System institutional review board.Appropriate waivers were obtained and there are no findings of incompliance present.
Rebeca Vazquez-Nieves, MDa; Vanessa Fonseca-Ferrer, MDa; Juan Irizarry-Nieves, MDa; Edgardo Adorno-Fontanez, MDa; William Rodriguez-Cintron, MDa,b,c
Correspondence: Juan Irizarry-Nieves (juan.irizarry-nieves@va.gov)
aVeterans Affairs Caribbean Healthcare System, San Juan, Puerto Rico
bUniversity of Puerto Rico School of Medicine, San Juan
cUniversidad Central del Caribe School of Medicine, San Juan, Puerto Rico
Author disclosures
The authors report no actual or potential conflicts of interest or outside sources of funding with regard to this article.
Disclaimer
The opinions expressed herein are those of the authors and do not necessarily reflect those of Federal Practitioner, Frontline Medical Communications Inc., the US Government, or any of its agencies.
Ethics and consent
All documentation was approved by the Veterans Affairs Caribbean Healthcare System institutional review board.Appropriate waivers were obtained and there are no findings of incompliance present.
Respiratory diseases have varied clinical presentations and are classified as restrictive, obstructive, mixed, or normal. Restrictive lung diseases have reduced lung volumes, either due to an alteration in lung parenchyma or a disease of the pleura, chest wall, or neuromuscular apparatus. If caused by parenchymal lung disease, restrictive lung disorders are accompanied by reduced gas transfer, which may be portrayed clinically by desaturation after exercise. Based on anatomical structures, the causes of lung volume reduction may be intrinsic or extrinsic. Intrinsic causes correspond to diseases of the lung parenchyma, such as idiopathic fibrotic diseases, connective-tissue diseases, drug-induced lung diseases, and other primary diseases of the lungs. Extrinsic causes refer to disorders outside the lungs or extra-pulmonary diseases such as neuromuscular and nonmuscular diseases of the chest wall.1 For example, obesity and myasthenia gravis can cause restrictive lung diseases, one through mechanical interference of lung expansion and the other through neuromuscular impedance of thoracic cage expansion. All these diseases eventually result in lung restriction, impaired lung function, and respiratory failure. This heterogenicity of disease makes establishing a single severity criterion difficult.
Laboratory testing, imaging studies, and examinations are important for determining the pulmonary disease and its course and progression. The pulmonary function test (PFT), which consists of multiple procedures that are performed depending on the information needed, has been an essential tool in practice for the pulmonologist. The PFT includes spirometry, lung volume measurement, respiratory muscle strength, diffusion capacity, and a broncho-provocation test. Each test has a particular role in assisting the diagnosis and/or follow-up of the patient. Spirometry is frequently used due to its range of dynamic physiological parameters, ease of use, and accessibility. It is used for the diagnosis of pulmonary symptoms, in the assessment of disability, and preoperatory evaluation, including lung resection surgery, assisting in the diagnosis, monitoring, and therapy response of pulmonary diseases.
A systematic approach to PFT interpretation is recommended by several societies, such as the American Thoracic Society (ATS) and the European Respiratory Society (ERS).2 The pulmonary function test results must be reproducible and meet established standards to ensure reliable and consistent clinical outcomes. A restrictive respiratory disease is defined by a decrease in total lung capacity (TLC) (< 5% of predicted value) and a normal forced expiratory volume in 1 second (FEV1)/forced vital capacity (FVC) ratio.2 Although other findings—such as a decrease in vital capacity—should prompt an investigation into whether the patient has a possible restrictive respiratory disease, the sole presence of this parameter is not definitive or diagnostic of a restrictive impairment.2-4 The assessment of severity is typically determined by TLC. Unfortunately, the severity of a restrictive respiratory disease and the degree of patient discomfort do not always correlate when utilizing just TLC. Pulmonary sarcoidosis, for example, is a granulomatous lung disease with a restrictive PFT pattern and a disease burden that may vary over time. Having a more consistent method of grading the severity of the restrictive lung disease may help guide treatment. The modified Medical Research Council (mMRC) scale, a 5-point dyspnea scale, is widely used in assessing the severity of dyspnea in various respiratory conditions, including chronic obstructive pulmonary disease (COPD), where its scores have been associated with patient mortality.1,5 The goal of this study was to document the associations between objective parameters obtained through PFT and other variables, with an established measurement of dyspnea to assess the severity grade of restrictive lung diseases.
Methods
This retrospective record review at the Veterans Affairs Caribbean Healthcare System (VACHS) in San Juan, Puerto Rico, wasconducted using the Veterans Health Information Systems and Technology Architecture to identify patients with a PFT, including spirometry, that indicated a restrictive ventilator pattern based on the current ATS/ERS Task Force on Lung Function Testing.2 Patients were included if they were aged ≥ 21 years, PFT with TLC ≤ 80% predicted, mMRC score documented on PFT, and documented diffusing capacity of the lung for carbon monoxide (DLCO). Patients were excluded if their FEV1/vital capacity (VC) was < 70% predicted using the largest VC, or no mMRC score was available. All patients meeting the inclusion criteria were considered regardless of comorbidities.
The PFT results of all adult patients, including those performed between June 1, 2013, and January 6, 2016, were submitted to spirometry, and lung volume measurements were analyzed. Sociodemographic information was collected, including sex, ethnicity, age, height, weight, and basal metabolic index. Other data found in PFTs, such as smoking status, smoking in packs/year, mMRC score, predicted TLC value, imaging present (chest X-ray, computed tomography), and hospitalizations and exacerbations within 1 year were collected. In addition, we examined the predicted values for FEV1, DLCO, and DLCO/VA (calculated using the Ayer equation), FVC (calculated using the Knudson equation), expiratory reserve volume, inspiratory VC, and slow VC. PaO2, PaCO2, and Alveolar-arterial gradients also were collected.6-9 Information about heart failure status was gathered through medical evaluation of notes and cardiac studies. All categorical variables were correlated with Spearman analysis and quantitative variables with average percentages. P values were calculated with analysis of variance.
Results
Of 6461 VACHS patient records reviewed, 415 met the inclusion criteria. Patients were divided according to their mMRC score: 65 had mMRC score of 0, 87 had an mMRC score of 1, 2 had an mMRC score of 2, 146 had an mMRC of 3, and 115 had an mMRC score of 4. The population was primarily male (98.6%) and of Hispanic ethnicity (96.4%), with a mean age of 72 years (Table 1). Most patients (n = 269, 64.0%) were prior smokers, while 135 patients (32.5%) had never smoked, and 11 (2.7%) were current smokers. At baseline, 169 patients (41.4%) had interstitial lung disease, 39 (9.6%) had chest wall disorders, 29 (7.1%) had occupational exposure, 25 (6.1%) had pneumonitis, and 14 (3.4%) had neuromuscular disorders.
There was a statistically significant relationship between mMRC score and hospitalization and FEV1 but not TLC (Table 2). As mMRC increased, so did hospitalizations: a total of 168 patients (40.5%) were hospitalized; 24 patients (36.9%) had an mMRC score of 0, 30 patients (34.0%) had an mMRC score of 1, 2 patients (100%) had an mMRC score of 2, 54 patients (37.0%) had an mMRC score of 3, and 58 patients (50.0%) had an mMRC score of 4 (P = .04). Mean (SD) TLC values increased as mMRC scores increased. Mean (SD) TLC was 70.5% (33.0) for the entire population; 68.8% (7.2) for patients with an mMRC score of 0, 70.8% (5.8) for patients with an mMRC score of 1, 75.0% (1.4) for patients with an mMRC score of 2, 70.1% (7.2) for patients with an mMRC score of 3, and 71.5% (62.1) for patients with an mMRC score of 4 (P = .10) (Figure 1). There was an associated decrease in mean (SD) FEV1 with mMRC. Mean (SD) FEV1 was 76.2% (18.9) for the entire population; 81.7% (19.3) for patients with an mMRC score of 0, 80.9% (18) for patients with an mMRC score of 1, 93.5% (34.6) for patients with an mMRC score of 2, 76.2% (17.1) for patients with an mMRC score of 3, and 69.2% (19.4) for patients with an mMRC score of 4; (P < .001) (Figure 2).
The correlation between mMRC and FEV1 (r = 0.25, P < .001) was stronger than the correlation between mMRC and TLC (r = 0.15, P < .001). The correlations for DLCO (P < .001), DLCO/VA (P < .001), hemoglobin (P < .02), and PaO2 (P < .001) were all statistically significant (P < .005), but with no strong identifiable trend.
Discussion
The patient population of this study was primarily older males of Hispanic ethnicity with a history of smoking. There was no association between body mass index or smoking status with worsening dyspnea as measured with mMRC scores. We observed no significant correlation between mMRC scores and various factors such as comorbidities including heart conditions, and epidemiological factors like the etiology of lung disease, including both intrinsic and extrinsic causes. This lack of association was anticipated, as restrictive lung diseases in our study predominantly arose from intrinsic pulmonary etiologies, such as interstitial lung disease. A difference between more hospitalizations and worsening dyspnea was identified. There was a slightly higher correlation between FEV1 and mMRC scores when compared with TLC and mMRC scores concerning worsening dyspnea, which could indicate that the use of FEV1 should be preferred over previous recommendations to use TLC.10 Other guidelines have utilized exercise capacity via the 6-minute walk test as a marker of severity with spirometry values and found that DLCO was correlated with severity.11
The latest ERS/ATS guidelines recommend z scores for grading the severity of obstructive lung diseases but do not recommend them for the diagnosis of restrictive lung diseases.12 A z score encompasses diverse variables (eg, age, sex, and ethnicity) to provide more uniform and consistent results. Other studies have been done to relate z scores to other spirometry variables with restrictive lung disease. One such study indicates the potential benefit of using FVC alone to grade restrictive lung diseases.13 There continues to be great diversity in the interpretation of pulmonary function tests, and we believe the information gathered can provide valuable insight for managing patients with restrictive lung diseases.
Limitations
Only 2 patients reported an mMRC score of 2 in our study. This may have affected statistical outcomes. It also may reveal possible deficits in the efficacy of patient education on the mMRC scale. This study was also limited by its small sample size, single center location, and the distribution of patients that reported an mMRC favored either low or high values. The patients in this study, who were all veterans, may not be representative of other patient populations.
Conclusions
There continue to be few factors associated with the physiological severity of the defective oxygen delivery and reported dyspnea of a patient with restrictive lung disease that allows for an accurate, repeatable grading of severity. Using FEV1 instead of TLC to determine the severity of a restrictive lung disease should be reconsidered. We could not find any other strong correlation among other factors studied. Further research should be conducted to continue looking for variables that more accurately depict patient dyspnea in restrictive lung disease.
Acknowledgments
This study is based upon work supported by the Veterans Affairs Caribbean Healthcare System in San Juan, Puerto Rico, and is the result of work supported by Pulmonary & Critical Care Medicine service, with resources and the use of its facilities.
1. Hegewald MJ, Crapo RO. Pulmonary function testing. In: Broaddus VC, Ernst JD, King Jr TE, eds. Murray and Nadel’s Textbook of Respiratory Medicine. 5th ed. Saunders; 2010:522-553.
2. Pellegrino R, Viegi G, Brusasco V, et al. Interpretative strategies for lung function tests. Eur Respir J. 2005;26(5):948-968. doi:10.1183/09031936.05.00035205
3. Rabe KF, Beghé B, Luppi F, Fabbri LM. Update in chronic obstructive pulmonary disease 2006. Am J Respir Crit Care Med. 2007;175(12):1222-1232. doi:10.1164/rccm.200704-586UP
4. Global Initiative for Chronic Obstructive Lung Disease (GOLD). Spirometry for health care providers Accessed April 30, 2024. https://goldcopd.org/wp-content/uploads/2016/04/GOLD_Spirometry_2010.pdf
5. Mannino DM, Holguin F, Pavlin BI, Ferdinands JM. Risk factors for prevalence of and mortality related to restriction on spirometry: findings from the First National Health and Nutrition Examination Survey and follow-up. Int J Tuberc Lung Dis. 2005;9(6):613-621.
6. Knudson RJ, Lebowitz MD, Holberg CJ, Burrows B. Changes in the normal maximal expiratory flow-volume curve with growth and aging. Am Rev Respir Dis. 1983;127(6):725-734. doi:10.1164/arrd.1983.127.6.725
7. Knudson RJ, Burrows B, Lebowitz MD. The maximal expiratory flow-volume curve: its use in the detection of ventilatory abnormalities in a population study. Am Rev Respir Dis. 1976;114(5):871-879. doi:10.1164/arrd.1976.114.5.871
8. Knudson RJ, Lebowitz MD, Burton AP, Knudson DE. The closing volume test: evaluation of nitrogen and bolus methods in a random population. Am Rev Respir Dis. 1977;115(3):423-434. doi:10.1164/arrd.1977.115.3.423
9. Ayers LN, Ginsberg ML, Fein J, Wasserman K. Diffusing capacity, specific diffusing capacity and interpretation of diffusion defects. West J Med. 1975;123(4):255-264.
10. Lung function testing: selection of reference values and interpretative strategies. American Thoracic Society. Am Rev Respir Dis. 1991;144(5):1202-1218. doi:10.1164/ajrccm/144.5.1202
11. Larson J, Wrzos K, Corazalla E, Wang Q, Kim HJ, Cho RJ. Should FEV1 be used to grade restrictive impairment? A single-center comparison of lung function parameters to 6-minute walk test in patients with restrictive lung disease. HSOA J Pulm Med Respir Res. 2023;9:082. doi:10.24966/PMRR-0177/100082
12. Stanojevic S, Kaminsky DA, Miller MR, et al. ERS/ATS technical standard on interpretive strategies for routine lung function tests. Eur Respir J. 2022;60(1):2101499. Published 2022 Jul 13. doi:10.1183/13993003.01499-2021
13. Myrberg T, Lindberg A, Eriksson B, et al. Restrictive spirometry versus restrictive lung function using the GLI reference values. Clin Physiol Funct Imaging. 2022;42(3):181-189. doi:10.1111/cpf.12745
Long-Term Assessment of Weight Loss Medications in a Veteran Population
The Centers for Disease Control and Prevention (CDC) classifies individuals with a body mass index (BMI) of 25 to 29.9as overweight and those with a BMI > 30 as obese (obesity classes: I, BMI 30 to 34.9; II, BMI 35 to 39.9; and III, BMI ≥ 40).1 In 2011, the CDC estimated that 27.4% of adults in the United States were obese; less than a decade later, that number increased to 31.9%.1 In that same period, the percentage of adults in Indiana classified as obese increased from 30.8% to 36.8%.1 About 1 in 14 individuals in the US have class III obesity and 86% of veterans are either overweight or obese.2
High medical expenses can likely be attributed to the long-term health consequences of obesity. Compared to those with a healthy weight, individuals who are overweight or obese are at an increased risk for high blood pressure, high low-density lipoprotein cholesterol levels, low high-density lipoprotein cholesterol levels, high triglyceride levels, type 2 diabetes mellitus (T2DM), coronary heart disease, stroke, gallbladder disease, osteoarthritis, sleep apnea, cancer, mental health disorders, body pain, low quality of life, and death.3 Many of these conditions lead to increased health care needs, medication needs, hospitalizations, and overall health care system use.
Guidelines for the prevention and treatment of obesity have been produced by the American Heart Association, American College of Cardiology, and The Obesity Society; the Endocrine Society; the American Diabetes Association; and the US Departments of Veterans Affairs (VA) and Defense. Each follows a general algorithm to manage and prevent adverse effects (AEs) related to obesity. General practice is to assess a patient for elevated BMI (> 25), implement intense lifestyle modifications including calorie restriction and exercise, reassess for a maintained 5% to 10% weight loss for cardiovascular benefits, and potentially assess for pharmacological or surgical intervention to assist in weight loss.2,4-6
While some weight loss medications (eg, phentermine/topiramate, naltrexone/bupropion, orlistat, and lorcaserin) tend to have unfavorable AEs or mixed efficacy, glucagon-like peptide-1 receptor agonists (GLP-1RAs) have provided new options.7-10 Lorcaserin, for example, was removed from the market in 2020 due to its association with cancer risks.11 The GLP-1RAs liraglutide and semaglutide received US Food and Drug Administration (FDA) approval for weight loss in 2014 and 2021, respectively.12,13 GLP-1RAs have shown the greatest efficacy and benefits in reducing hemoglobin A1c (HbA1c); they are the preferred agents for patients who qualify for pharmacologic intervention for weight loss, especially those with T2DM. However, these studies have not evaluated the long-term outcomes of using these medications for weight loss and may not reflect the veteran population.14,15
At Veteran Health Indiana (VHI), clinicians may use several weight loss medications for patients to achieve 5% to 10% weight loss. The medications most often used include liraglutide, phentermine/topiramate, naltrexone/bupropion, orlistat, and phentermine alone. However, more research is needed to determine which weight loss medication is the most beneficial for veterans, particularly following FDA approval of GLP-1RAs. At VHI, phentermine/topiramate is the preferred first-line agent unless patients have contraindications for use, in which case naltrexone/bupropion is recommended. These are considered first-line due to their ease of use in pill form, lower cost, and comparable weight loss to the GLP-1 medication class.2 However, for patients with prediabetes, T2DM, BMI > 40, or BMI > 35 with specific comorbid conditions, liraglutide is preferred because of its beneficial effects for both weight loss and blood glucose control.2
This study aimed to expand on the 2021 Hood and colleagues study that examined total weight loss and weight loss as a percentage of baseline weight in patients with obesity at 3, 6, 12, and > 12 months of pharmacologic therapy by extending the time frame to 48 months.16 This study excluded semaglutide because few patients were prescribed the medication for weight loss during the study.
METHODS
We conducted a single-center, retrospective chart review of patients prescribed weight loss medications at VHI. A patient list was generated based on prescription fills from June 1, 2017, to July 31, 2021. Data were obtained from the Computerized Patient Record System; patients were not contacted. This study was approved by the Indiana University Health Institutional Review Board and VHI Research and Development Committee.
At the time of this study, liraglutide, phentermine/topiramate, naltrexone/bupropion, orlistat, and phentermine alone were available at VHI for patients who met the clinical criteria for use. All patients must have been enrolled in dietary and lifestyle management programs, including the VA MOVE! program, to be approved for these medications. After the MOVE! orientation, patients could participate in group or individual 12-week programs that included weigh-ins, goal-setting strategies, meal planning, and habit modification support. If patients could not meet in person, phone and other telehealth opportunities were available.
Patients were included in the study if they were aged ≥ 18 years, received a prescription for any of the 5 available medications for weight loss during the enrollment period, and were on the medication for ≥ 6 consecutive months. Patients were excluded if they received a prescription, were treated outside the VA system, or were pregnant. The primary indication for the included medication was not weight loss; the primary indication for the GLP-1RA was T2DM, or the weight loss was attributed to another disease. Adherence was not a measured outcome of this study; if patients were filling the medication, it was assumed they were taking it. Data were collected for each instance of medication use; as a result, a few patients were included more than once. Data collection for a failed medication ended when failure was documented. New data points began when new medication was prescribed; all data were per medication, not per patient. This allowed us to account for medication failure and provide accurate weight loss results based on medication choice within VHI.
Primary outcomes included total weight loss and weight loss as a percentage ofbaseline weight during the study period at 3, 6, 12, 24, 36, and 48 months of therapy. Secondary outcomes included the percentage of patients who lost 5% to 10% of their body weight from baseline; the percentage of patients who maintained ≥ 5% weight loss from baseline to 12, 24, 36, and 48 months if maintained on medication for that duration; duration of medication treatment in weeks; medication discontinuation rate; reason for medication discontinuation; enrollment in the MOVE! clinic and the time enrolled; percentage of patients with a BMI of 18 to 24.9 at the end of the study; and change in HbA1c at 3, 6, 12, 24, 36, and 48 months.
Demographic data included race, age, sex, baseline weight, height, baseline BMI, and comorbid conditions (collected based on the most recent primary care clinical note before initiating medication). Medication data collected included medications used to manage comorbidities. Data related to weight management medication included prescribing clinic, maintenance dose of medication, duration of medication during the study period, the reason for medication discontinuation, or bariatric surgery intervention if applicable.
Basic descriptive statistics were used to characterize study participants. For continuous data, analysis of variance tests were used; if those results were not normal, then nonparametric tests were used, followed by pairwise tests between medication groups if the overall test was significant using the Fisher significant differences test. For nominal data, χ2 or Fisher exact tests were used. For comparisons of primary and secondary outcomes, if the analyses needed to include adjustment for confounding variables, analysis of covariance was used for continuous data. A 2-sided 5% significance level was used for all tests.
RESULTS
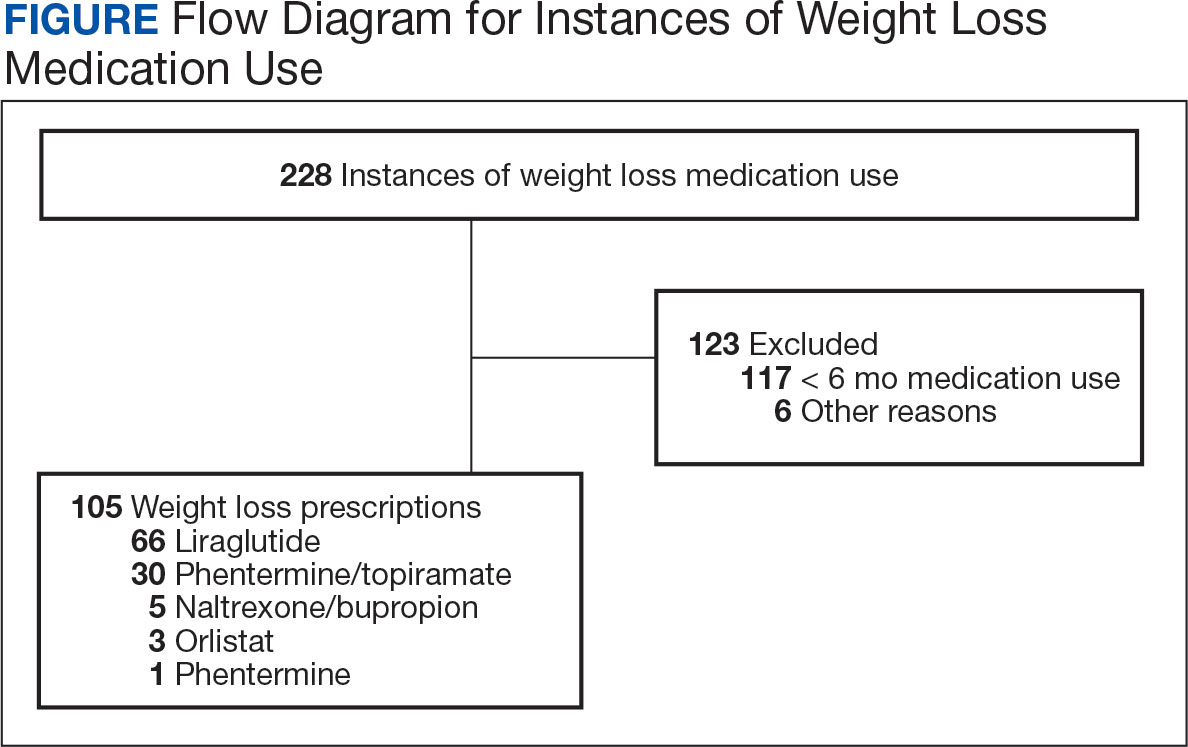
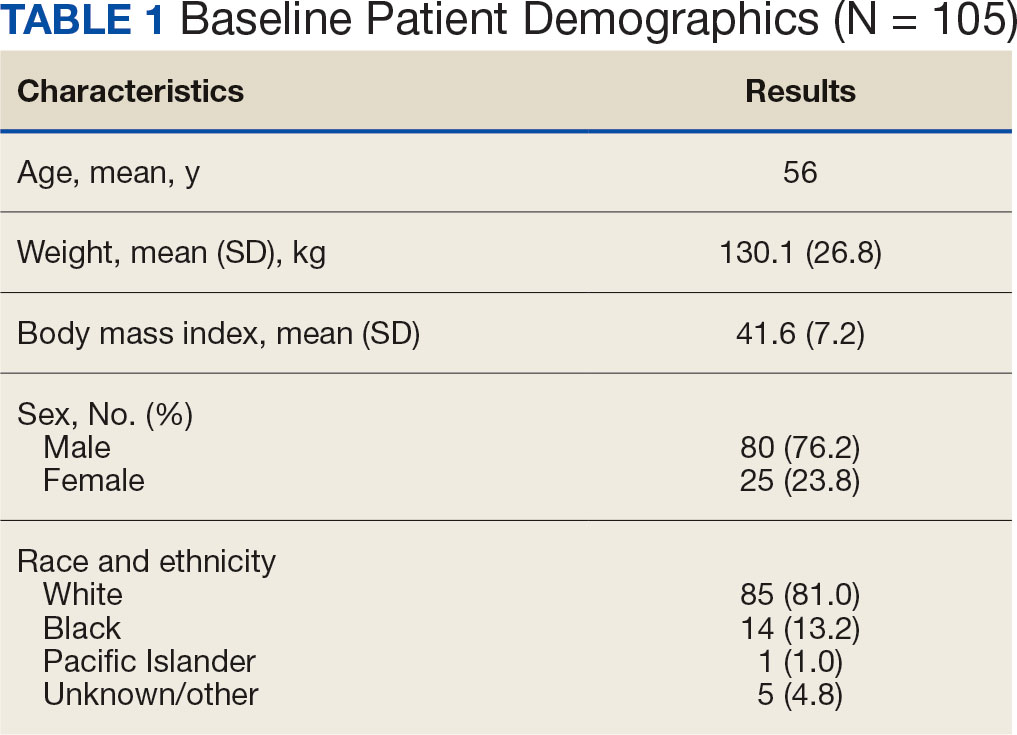
A total of 228 instances of medication use were identified based on prescription fills; 123 did not meet inclusion criteria (117 for < 6 consecutive months of medication use) (Figure). The study included 105 participants with a mean age of 56 years; 80 were male (76.2%), and 85 identified as White race (81.0%). Mean (SD) weight was 130.1 kg (26.8) and BMI was 41.6 (7.2). The most common comorbid disease states among patients included hypertension, dyslipidemia, obstructive sleep apnea, and T2DM (Table 1). The baseline characteristics were comparable to those of Hood and colleagues.16
Most patients at VHI started on liraglutide (63%) or phentermine/topiramate (28%). For primary and secondary outcomes, statistics were calculated to determine whether the results were statistically significant for comparing the liraglutide and phentermine/topiramate subgroups. Sample sizes were too small for statistical analysis for bupropion/naltrexone, phentermine, and orlistat.
Primary Outcomes
The mean (SD) weight of participants dropped 8.1% from 130.1 kg to 119.5 kg over the patient-specific duration of weight management medication therapy for an absolute difference of 10.6 kg (9.7). Duration of individual medication use varied from 6 to 48 months. Weight loss was recorded at 6, 12, 24, 36, and 48 months of weight management therapy. Patient weight was not recorded after the medication was discontinued.
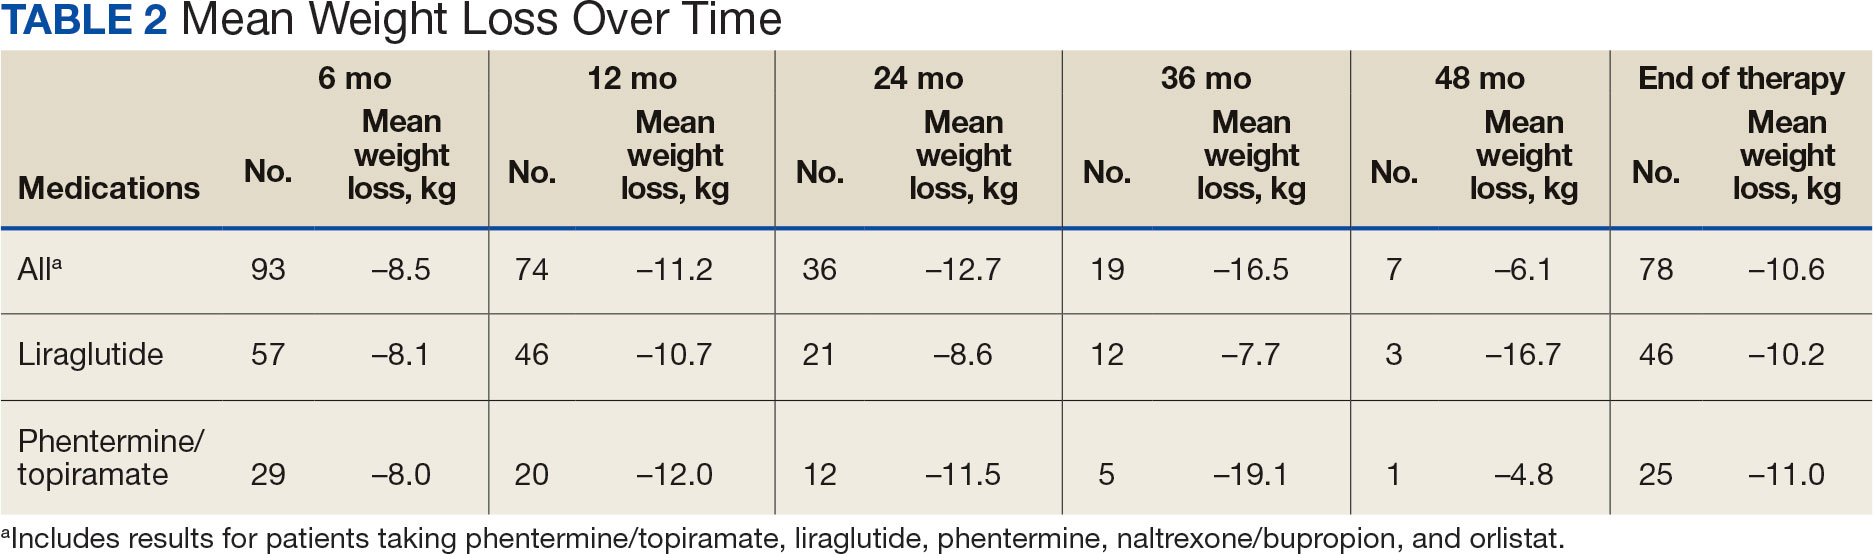
When classified by medication choice, the mean change in weight over the duration of the study was −23.9 kg for 2 patients using orlistat, −10.2 kg for 46 patients using liraglutide, −11.0 kg for 25 patients using phentermine/topiramate, -7.4 kg for 1 patient using phentermine, and -13.0 kg for 4 patients using naltrexone/bupropion. Patients without a weight documented at the end of their therapy or at the conclusion of the data collection period were not included in the total weight loss at the end of therapy. There were 78 documented instances of weight loss at the end of therapy (Table 2).
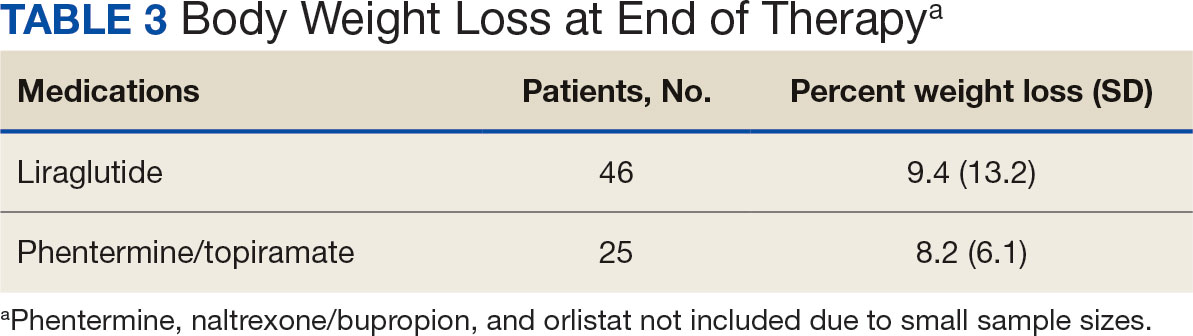
Body weight loss percentage was recorded at 6, 12, 24, 36, and 48 months of weight management therapy. The mean (SD) body weight loss percentage over the duration of the study was 9.2% (11.2). When classified by medication choice, the mean percentage of body weight loss was 16.8% for 2 patients using orlistat, 9.4% for 46 patients using liraglutide, 8.2% for 25 patients using phentermine/topiramate, 6.0% for 1 patient using phentermine alone, and 10.6% for 4 patients using naltrexone/bupropion (Table 3).
Secondary Outcomes
While none of the secondary outcomes were statistically significant, the results of this study suggest that both medications may contribute to weight loss in many patients included in this study. Almost two-thirds of the included patients analyzed lost ≥ 5% of weight from baseline while taking weight management medication. Sixty-six patients (63%) lost ≥ 5% of body weight at any time during the data collection period. When stratified by liraglutide and phentermine/topiramate, 41 patients (63%) taking liraglutide and 20 patients (67%) taking phentermine/topiramate lost ≥ 5% of weight from baseline. Of the 66 patients who lost ≥ 5% of body weight from baseline, 36 (55%) lost ≥ 10% of body weight from baseline at any time during the data collection period.
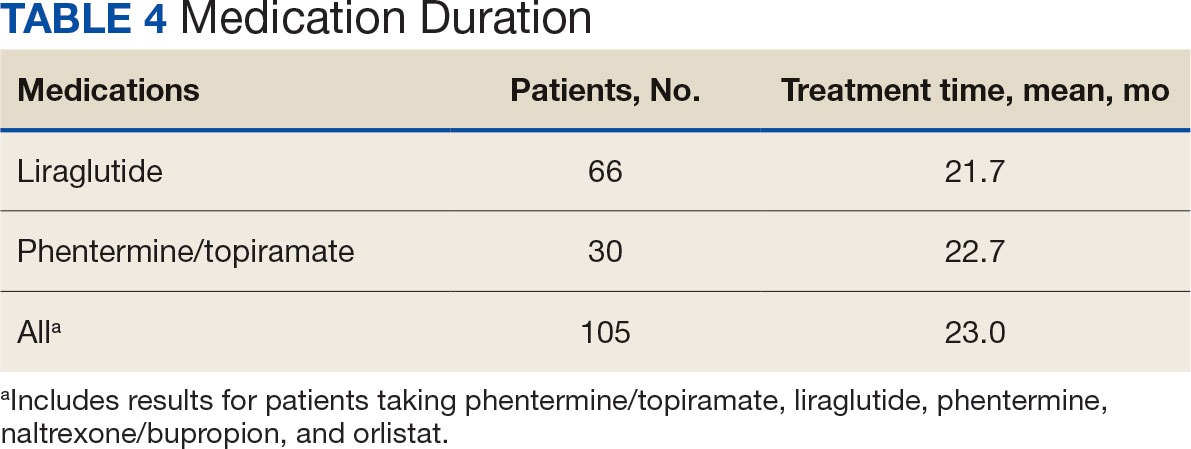
The mean (SD) duration for weight management medication use was 23 months (14.9). Phentermine/topiramate was tolerated longer than liraglutide: 22.7 months vs 21.7 months, respectively (Table 4).
The average overall documented medication discontinuation rate was 35.2%. Reasons for discontinuation included 21 patient-elected discontinuations, 8 patients no longer met criteria for use, 4 medications were no longer indicated, and 4 patients experienced AEs. It is unknown whether weight management medication was discontinued or not in 18 patients (17.2%).
DISCUSSION
This study evaluated the use and outcomes of weight loss medications over a longer period (up to 48 months) than what was previously studied among patients at VHI (12 months). The study aimed to better understand the long-term effect of weight loss medications, determine which medication had better long-term outcomes, and examine the reasons for medication discontinuation.
The results of this study displayed some similarities and differences compared with the Hood and colleagues study.16 Both yielded similar results for 5% of body weight loss and 10% of body weight loss. The largest difference was mean weight loss over the study period. In this study, patients lost a mean 10.6 kg over the course of weight loss medication use compared to 15.8 kg found by Hood and colleagues.16 A reason patients in the current study lost less weight overall could be the difference in time frames. The current study encompassed the COVID-19 pandemic, meaning fewer overall in-person patient appointments, which led to patients being lost to follow-up, missing weigh-ins during the time period, and gaps in care. For some patients, the pandemic possibly contributed to depression, missed medication doses, and a more sedentary lifestyle, leading to more weight gain.17 Telemedicine services at VHI expanded during the pandemic in an attempt to increase patient monitoring and counseling. It is unclear whether this expansion was enough to replace the in-person contact necessary to promote a healthy lifestyle.
VA pharmacists now care for patients through telehealth and are more involved in weight loss management. Since the conclusion of the Hood and colleagues study and start of this research, 2 pharmacists at VHI have been assigned to follow patients for obesity management to help with adherence to medication and lifestyle changes, management of AEs, dispense logistics, interventions for medications that may cause weight gain, and case management of glycemic control and weight loss with GLP-1RAs. Care management by pharmacists at VHI helps improve the logistics of titratable orders and save money by improving the use of high-cost items like GLP-1RAs. VA clinical pharmacy practitioners already monitor GLP-1RAs for patients with T2DM, so they are prepared to educate and assist patients with these medications.
It is important to continue developing a standardized process for weight loss medication management across the VA to improve the quality of patient care and optimize prescription outcomes. VA facilities differ in how weight loss management care is delivered and the level at which pharmacists are involved. Given the high rate of obesity among patients at the VA, the advent of new prescription options for weight loss, and the high cost associated with these medications, there has been increased attention to obesity care. Some Veterans Integrated Service Networks are forming a weight management community of practice groups to create standard operating procedures and algorithms to standardize care. Developing consistent processes is necessary to improve weight loss and patient care for veterans regardless where they receive treatment.
Limitations
The data used in this study were dependent on clinician documentation. Because of a lack of documentation in many instances, it was difficult to determine the full efficacy of the medications studied due to missing weight recordings. The lack of documentation made it difficult to determine whether patients were enrolled and active in the MOVE! program. It is required that patients enroll in MOVE! to obtain medications, but many did not have any follow-up MOVE! visits after initially obtaining their weight loss medication.
In this study, differences in the outcomes of patients with and without T2DM were not compared. It is the VA standard of care to prefer liraglutide over phentermine/topiramate in patients with T2DM or prediabetes.2 This makes it difficult to assess whether phentermine/topiramate or liraglutide is more effective for weight loss in patients with T2DM. Weight gain after the discontinuation of weight loss medications was not assessed. Collecting this data may help determine whether a certain weight loss medication is less likely to cause rebound weight gain when discontinued.
Other limitations to this study consisted of excluding patients who discontinued therapy within 6 months, small sample sizes on some medications, and lack of data on adherence. Adherence was based on medication refills, which means that if a patient refilled the medication, it was assumed they were taking it. This is not always the case, and while accurate data on adherence is difficult to gather, it can impact how results may be interpreted. These additional limitations make it difficult to accurately determine the efficacy of the medications in this study.
CONCLUSIONS
This study found similar outcomes to what has been observed in larger clinical trials regarding weight loss medications. Nevertheless, there was a lack of accurate clinical documentation for most patients, which limits the conclusions. This lack of documentation potentially led to inaccurate results. It revealed that many patients at VHI did not uniformly receive consistent follow-up after starting a weight loss medication during the study period. With more standardized processes implemented at VA facilities, increased pharmacist involvement in weight loss medication management, and increased use of established telehealth services, patients could have the opportunity for closer follow-up that may lead to better weight loss outcomes. With these changes, there is more reason for additional studies to be conducted to assess follow-up, medication management, and weight loss overall.
1. Overweight & obesity. Centers for Disease Control and Prevention. Updated September 21, 2023. Accessed April 23, 2024. https://www.cdc.gov/obesity/index.html
2. US Department of Defense, US Department of Veterans Affairs. The Management of Adult Overweight and Obesity Working Group. VA/DoD Clinical Practice Guideline for the Management of Adult Overweight and Obesity. Updated July 2020. Accessed April 23, 2024. https://www.healthquality.va.gov/guidelines/CD/obesity/VADoDObesityCPGFinal5087242020.pdf
3. Health effects of overweight and obesity. Centers for Disease Control and Prevention. Updated September 24, 2022. Accessed April 23, 2024. https://www.cdc.gov/healthyweight/effects/index.html
4. Jensen MD, Ryan DH, Apovian CM, et al. 2013 AHA/ACC/TOS guideline for the management of overweight and obesity in adults: a report of the American College of Cardiology/American Heart Association Task Force on Practice Guidelines and The Obesity Society. J Am Coll Cardiol. 2014;63(25 Pt B):2985-3023. doi:10.1016/j.jacc.2013.11.004
5. Apovian CM, Aronne LJ, Bessesen DH, et al. Pharmacological management of obesity: an endocrine society clinical practice guideline. J Clin Endocrinol Metab. 2015;100(2):342-362. doi:10.1210/jc.2014-3415
6. American Diabetes Association Professional Practice Committee. 3. Prevention or delay of type 2 diabetes and associated comorbidities: standards of medical care in diabetes-2022. Diabetes Care. 2022;45(Suppl 1):S39-S45. doi:10.2337/dc22-S003
7. Phentermine and topiramate extended-release. Package insert. Vivus, Inc; 2012. Accessed April 23, 2024. https://qsymia.com/patient/include/media/pdf/prescribing-information.pdf
8. Naltrexone and bupropion extended-release. Package insert. Orexigen Therapeutics, Inc; 2014. Accessed April 23, 2024. https://contrave.com/wp-content/uploads/2024/01/Contrave-label-113023.pdf
9. Orlistat. Package insert. Roche Laboratories, Inc; 2009. Accessed April 23, 2024. https://www.accessdata.fda.gov/drugsatfda_docs/label/2009/020766s026lbl.pdf
10. Lorcaserin. Package insert. Arena Pharmaceuticals; 2012. Accessed April 23, 2024. https://www.accessdata.fda.gov/drugsatfda_docs/label/2012/022529lbl.pdf
11. FDA requests the withdrawal of the weight-loss drug Belviq, Belviq XR (lorcaserin) from the market. News release. US Food & Drug Administration. February 13, 2020. Accessed April 23, 2024. https://www.fda.gov/drugs/drug-safety-and-availability/fda-requests-withdrawal-weight-loss-drug-belviq-belviq-xr-lorcaserin-market
12. Saxenda Injection (Liraglutide [rDNA origin]). Novo Nordisk, Inc. October 1, 2015. Accessed April 23, 2024. https://www.accessdata.fda.gov/drugsatfda_docs/nda/2014/206321Orig1s000TOC.cfm
13. FDA approves new drug treatment for chronic weight management, first since 2014. News release. US Food & Drug Administration. June 4, 2021. Accessed April 23, 2024. https://www.fda.gov/news-events/press-announcements/fda-approves-new-drug-treatment-chronic-weight-management-first-2014
14. Pi-Sunyer X, Astrup A, Fujioka K, et al. A randomized, controlled trial of 3.0 mg of liraglutide in weight management. New Engl J Med. 2015;373:11-22. doi:10.1056/NEJMoa1411892
15. Wilding JPH, Batterham RL, Calanna S, et al. Once-weekly semaglutide in adults with overweight or obesity. New Engl J Med 2021;384:989-1002. doi:10.1056/NEJMoa2032183
16. Hood SR, Berkeley AW, Moore EA. Evaluation of pharmacologic interventions for weight management in a veteran population. Fed Pract. 2021;38(5):220-226. doi:10.12788/fp.0117
17. Melamed OC, Selby P, Taylor VH. Mental health and obesity during the COVID-19 pandemic. Curr Obes Rep. 2022;11(1):23-31. doi:10.1007/s13679-021-00466-6
The Centers for Disease Control and Prevention (CDC) classifies individuals with a body mass index (BMI) of 25 to 29.9as overweight and those with a BMI > 30 as obese (obesity classes: I, BMI 30 to 34.9; II, BMI 35 to 39.9; and III, BMI ≥ 40).1 In 2011, the CDC estimated that 27.4% of adults in the United States were obese; less than a decade later, that number increased to 31.9%.1 In that same period, the percentage of adults in Indiana classified as obese increased from 30.8% to 36.8%.1 About 1 in 14 individuals in the US have class III obesity and 86% of veterans are either overweight or obese.2
High medical expenses can likely be attributed to the long-term health consequences of obesity. Compared to those with a healthy weight, individuals who are overweight or obese are at an increased risk for high blood pressure, high low-density lipoprotein cholesterol levels, low high-density lipoprotein cholesterol levels, high triglyceride levels, type 2 diabetes mellitus (T2DM), coronary heart disease, stroke, gallbladder disease, osteoarthritis, sleep apnea, cancer, mental health disorders, body pain, low quality of life, and death.3 Many of these conditions lead to increased health care needs, medication needs, hospitalizations, and overall health care system use.
Guidelines for the prevention and treatment of obesity have been produced by the American Heart Association, American College of Cardiology, and The Obesity Society; the Endocrine Society; the American Diabetes Association; and the US Departments of Veterans Affairs (VA) and Defense. Each follows a general algorithm to manage and prevent adverse effects (AEs) related to obesity. General practice is to assess a patient for elevated BMI (> 25), implement intense lifestyle modifications including calorie restriction and exercise, reassess for a maintained 5% to 10% weight loss for cardiovascular benefits, and potentially assess for pharmacological or surgical intervention to assist in weight loss.2,4-6
While some weight loss medications (eg, phentermine/topiramate, naltrexone/bupropion, orlistat, and lorcaserin) tend to have unfavorable AEs or mixed efficacy, glucagon-like peptide-1 receptor agonists (GLP-1RAs) have provided new options.7-10 Lorcaserin, for example, was removed from the market in 2020 due to its association with cancer risks.11 The GLP-1RAs liraglutide and semaglutide received US Food and Drug Administration (FDA) approval for weight loss in 2014 and 2021, respectively.12,13 GLP-1RAs have shown the greatest efficacy and benefits in reducing hemoglobin A1c (HbA1c); they are the preferred agents for patients who qualify for pharmacologic intervention for weight loss, especially those with T2DM. However, these studies have not evaluated the long-term outcomes of using these medications for weight loss and may not reflect the veteran population.14,15
At Veteran Health Indiana (VHI), clinicians may use several weight loss medications for patients to achieve 5% to 10% weight loss. The medications most often used include liraglutide, phentermine/topiramate, naltrexone/bupropion, orlistat, and phentermine alone. However, more research is needed to determine which weight loss medication is the most beneficial for veterans, particularly following FDA approval of GLP-1RAs. At VHI, phentermine/topiramate is the preferred first-line agent unless patients have contraindications for use, in which case naltrexone/bupropion is recommended. These are considered first-line due to their ease of use in pill form, lower cost, and comparable weight loss to the GLP-1 medication class.2 However, for patients with prediabetes, T2DM, BMI > 40, or BMI > 35 with specific comorbid conditions, liraglutide is preferred because of its beneficial effects for both weight loss and blood glucose control.2
This study aimed to expand on the 2021 Hood and colleagues study that examined total weight loss and weight loss as a percentage of baseline weight in patients with obesity at 3, 6, 12, and > 12 months of pharmacologic therapy by extending the time frame to 48 months.16 This study excluded semaglutide because few patients were prescribed the medication for weight loss during the study.
METHODS
We conducted a single-center, retrospective chart review of patients prescribed weight loss medications at VHI. A patient list was generated based on prescription fills from June 1, 2017, to July 31, 2021. Data were obtained from the Computerized Patient Record System; patients were not contacted. This study was approved by the Indiana University Health Institutional Review Board and VHI Research and Development Committee.
At the time of this study, liraglutide, phentermine/topiramate, naltrexone/bupropion, orlistat, and phentermine alone were available at VHI for patients who met the clinical criteria for use. All patients must have been enrolled in dietary and lifestyle management programs, including the VA MOVE! program, to be approved for these medications. After the MOVE! orientation, patients could participate in group or individual 12-week programs that included weigh-ins, goal-setting strategies, meal planning, and habit modification support. If patients could not meet in person, phone and other telehealth opportunities were available.
Patients were included in the study if they were aged ≥ 18 years, received a prescription for any of the 5 available medications for weight loss during the enrollment period, and were on the medication for ≥ 6 consecutive months. Patients were excluded if they received a prescription, were treated outside the VA system, or were pregnant. The primary indication for the included medication was not weight loss; the primary indication for the GLP-1RA was T2DM, or the weight loss was attributed to another disease. Adherence was not a measured outcome of this study; if patients were filling the medication, it was assumed they were taking it. Data were collected for each instance of medication use; as a result, a few patients were included more than once. Data collection for a failed medication ended when failure was documented. New data points began when new medication was prescribed; all data were per medication, not per patient. This allowed us to account for medication failure and provide accurate weight loss results based on medication choice within VHI.
Primary outcomes included total weight loss and weight loss as a percentage ofbaseline weight during the study period at 3, 6, 12, 24, 36, and 48 months of therapy. Secondary outcomes included the percentage of patients who lost 5% to 10% of their body weight from baseline; the percentage of patients who maintained ≥ 5% weight loss from baseline to 12, 24, 36, and 48 months if maintained on medication for that duration; duration of medication treatment in weeks; medication discontinuation rate; reason for medication discontinuation; enrollment in the MOVE! clinic and the time enrolled; percentage of patients with a BMI of 18 to 24.9 at the end of the study; and change in HbA1c at 3, 6, 12, 24, 36, and 48 months.
Demographic data included race, age, sex, baseline weight, height, baseline BMI, and comorbid conditions (collected based on the most recent primary care clinical note before initiating medication). Medication data collected included medications used to manage comorbidities. Data related to weight management medication included prescribing clinic, maintenance dose of medication, duration of medication during the study period, the reason for medication discontinuation, or bariatric surgery intervention if applicable.
Basic descriptive statistics were used to characterize study participants. For continuous data, analysis of variance tests were used; if those results were not normal, then nonparametric tests were used, followed by pairwise tests between medication groups if the overall test was significant using the Fisher significant differences test. For nominal data, χ2 or Fisher exact tests were used. For comparisons of primary and secondary outcomes, if the analyses needed to include adjustment for confounding variables, analysis of covariance was used for continuous data. A 2-sided 5% significance level was used for all tests.
RESULTS
A total of 228 instances of medication use were identified based on prescription fills; 123 did not meet inclusion criteria (117 for < 6 consecutive months of medication use) (Figure). The study included 105 participants with a mean age of 56 years; 80 were male (76.2%), and 85 identified as White race (81.0%). Mean (SD) weight was 130.1 kg (26.8) and BMI was 41.6 (7.2). The most common comorbid disease states among patients included hypertension, dyslipidemia, obstructive sleep apnea, and T2DM (Table 1). The baseline characteristics were comparable to those of Hood and colleagues.16
Most patients at VHI started on liraglutide (63%) or phentermine/topiramate (28%). For primary and secondary outcomes, statistics were calculated to determine whether the results were statistically significant for comparing the liraglutide and phentermine/topiramate subgroups. Sample sizes were too small for statistical analysis for bupropion/naltrexone, phentermine, and orlistat.
Primary Outcomes
The mean (SD) weight of participants dropped 8.1% from 130.1 kg to 119.5 kg over the patient-specific duration of weight management medication therapy for an absolute difference of 10.6 kg (9.7). Duration of individual medication use varied from 6 to 48 months. Weight loss was recorded at 6, 12, 24, 36, and 48 months of weight management therapy. Patient weight was not recorded after the medication was discontinued.
When classified by medication choice, the mean change in weight over the duration of the study was −23.9 kg for 2 patients using orlistat, −10.2 kg for 46 patients using liraglutide, −11.0 kg for 25 patients using phentermine/topiramate, -7.4 kg for 1 patient using phentermine, and -13.0 kg for 4 patients using naltrexone/bupropion. Patients without a weight documented at the end of their therapy or at the conclusion of the data collection period were not included in the total weight loss at the end of therapy. There were 78 documented instances of weight loss at the end of therapy (Table 2).
Body weight loss percentage was recorded at 6, 12, 24, 36, and 48 months of weight management therapy. The mean (SD) body weight loss percentage over the duration of the study was 9.2% (11.2). When classified by medication choice, the mean percentage of body weight loss was 16.8% for 2 patients using orlistat, 9.4% for 46 patients using liraglutide, 8.2% for 25 patients using phentermine/topiramate, 6.0% for 1 patient using phentermine alone, and 10.6% for 4 patients using naltrexone/bupropion (Table 3).
Secondary Outcomes
While none of the secondary outcomes were statistically significant, the results of this study suggest that both medications may contribute to weight loss in many patients included in this study. Almost two-thirds of the included patients analyzed lost ≥ 5% of weight from baseline while taking weight management medication. Sixty-six patients (63%) lost ≥ 5% of body weight at any time during the data collection period. When stratified by liraglutide and phentermine/topiramate, 41 patients (63%) taking liraglutide and 20 patients (67%) taking phentermine/topiramate lost ≥ 5% of weight from baseline. Of the 66 patients who lost ≥ 5% of body weight from baseline, 36 (55%) lost ≥ 10% of body weight from baseline at any time during the data collection period.
The mean (SD) duration for weight management medication use was 23 months (14.9). Phentermine/topiramate was tolerated longer than liraglutide: 22.7 months vs 21.7 months, respectively (Table 4).
The average overall documented medication discontinuation rate was 35.2%. Reasons for discontinuation included 21 patient-elected discontinuations, 8 patients no longer met criteria for use, 4 medications were no longer indicated, and 4 patients experienced AEs. It is unknown whether weight management medication was discontinued or not in 18 patients (17.2%).
DISCUSSION
This study evaluated the use and outcomes of weight loss medications over a longer period (up to 48 months) than what was previously studied among patients at VHI (12 months). The study aimed to better understand the long-term effect of weight loss medications, determine which medication had better long-term outcomes, and examine the reasons for medication discontinuation.
The results of this study displayed some similarities and differences compared with the Hood and colleagues study.16 Both yielded similar results for 5% of body weight loss and 10% of body weight loss. The largest difference was mean weight loss over the study period. In this study, patients lost a mean 10.6 kg over the course of weight loss medication use compared to 15.8 kg found by Hood and colleagues.16 A reason patients in the current study lost less weight overall could be the difference in time frames. The current study encompassed the COVID-19 pandemic, meaning fewer overall in-person patient appointments, which led to patients being lost to follow-up, missing weigh-ins during the time period, and gaps in care. For some patients, the pandemic possibly contributed to depression, missed medication doses, and a more sedentary lifestyle, leading to more weight gain.17 Telemedicine services at VHI expanded during the pandemic in an attempt to increase patient monitoring and counseling. It is unclear whether this expansion was enough to replace the in-person contact necessary to promote a healthy lifestyle.
VA pharmacists now care for patients through telehealth and are more involved in weight loss management. Since the conclusion of the Hood and colleagues study and start of this research, 2 pharmacists at VHI have been assigned to follow patients for obesity management to help with adherence to medication and lifestyle changes, management of AEs, dispense logistics, interventions for medications that may cause weight gain, and case management of glycemic control and weight loss with GLP-1RAs. Care management by pharmacists at VHI helps improve the logistics of titratable orders and save money by improving the use of high-cost items like GLP-1RAs. VA clinical pharmacy practitioners already monitor GLP-1RAs for patients with T2DM, so they are prepared to educate and assist patients with these medications.
It is important to continue developing a standardized process for weight loss medication management across the VA to improve the quality of patient care and optimize prescription outcomes. VA facilities differ in how weight loss management care is delivered and the level at which pharmacists are involved. Given the high rate of obesity among patients at the VA, the advent of new prescription options for weight loss, and the high cost associated with these medications, there has been increased attention to obesity care. Some Veterans Integrated Service Networks are forming a weight management community of practice groups to create standard operating procedures and algorithms to standardize care. Developing consistent processes is necessary to improve weight loss and patient care for veterans regardless where they receive treatment.
Limitations
The data used in this study were dependent on clinician documentation. Because of a lack of documentation in many instances, it was difficult to determine the full efficacy of the medications studied due to missing weight recordings. The lack of documentation made it difficult to determine whether patients were enrolled and active in the MOVE! program. It is required that patients enroll in MOVE! to obtain medications, but many did not have any follow-up MOVE! visits after initially obtaining their weight loss medication.
In this study, differences in the outcomes of patients with and without T2DM were not compared. It is the VA standard of care to prefer liraglutide over phentermine/topiramate in patients with T2DM or prediabetes.2 This makes it difficult to assess whether phentermine/topiramate or liraglutide is more effective for weight loss in patients with T2DM. Weight gain after the discontinuation of weight loss medications was not assessed. Collecting this data may help determine whether a certain weight loss medication is less likely to cause rebound weight gain when discontinued.
Other limitations to this study consisted of excluding patients who discontinued therapy within 6 months, small sample sizes on some medications, and lack of data on adherence. Adherence was based on medication refills, which means that if a patient refilled the medication, it was assumed they were taking it. This is not always the case, and while accurate data on adherence is difficult to gather, it can impact how results may be interpreted. These additional limitations make it difficult to accurately determine the efficacy of the medications in this study.
CONCLUSIONS
This study found similar outcomes to what has been observed in larger clinical trials regarding weight loss medications. Nevertheless, there was a lack of accurate clinical documentation for most patients, which limits the conclusions. This lack of documentation potentially led to inaccurate results. It revealed that many patients at VHI did not uniformly receive consistent follow-up after starting a weight loss medication during the study period. With more standardized processes implemented at VA facilities, increased pharmacist involvement in weight loss medication management, and increased use of established telehealth services, patients could have the opportunity for closer follow-up that may lead to better weight loss outcomes. With these changes, there is more reason for additional studies to be conducted to assess follow-up, medication management, and weight loss overall.
1. Overweight & obesity. Centers for Disease Control and Prevention. Updated September 21, 2023. Accessed April 23, 2024. https://www.cdc.gov/obesity/index.html
2. US Department of Defense, US Department of Veterans Affairs. The Management of Adult Overweight and Obesity Working Group. VA/DoD Clinical Practice Guideline for the Management of Adult Overweight and Obesity. Updated July 2020. Accessed April 23, 2024. https://www.healthquality.va.gov/guidelines/CD/obesity/VADoDObesityCPGFinal5087242020.pdf
3. Health effects of overweight and obesity. Centers for Disease Control and Prevention. Updated September 24, 2022. Accessed April 23, 2024. https://www.cdc.gov/healthyweight/effects/index.html
4. Jensen MD, Ryan DH, Apovian CM, et al. 2013 AHA/ACC/TOS guideline for the management of overweight and obesity in adults: a report of the American College of Cardiology/American Heart Association Task Force on Practice Guidelines and The Obesity Society. J Am Coll Cardiol. 2014;63(25 Pt B):2985-3023. doi:10.1016/j.jacc.2013.11.004
5. Apovian CM, Aronne LJ, Bessesen DH, et al. Pharmacological management of obesity: an endocrine society clinical practice guideline. J Clin Endocrinol Metab. 2015;100(2):342-362. doi:10.1210/jc.2014-3415
6. American Diabetes Association Professional Practice Committee. 3. Prevention or delay of type 2 diabetes and associated comorbidities: standards of medical care in diabetes-2022. Diabetes Care. 2022;45(Suppl 1):S39-S45. doi:10.2337/dc22-S003
7. Phentermine and topiramate extended-release. Package insert. Vivus, Inc; 2012. Accessed April 23, 2024. https://qsymia.com/patient/include/media/pdf/prescribing-information.pdf
8. Naltrexone and bupropion extended-release. Package insert. Orexigen Therapeutics, Inc; 2014. Accessed April 23, 2024. https://contrave.com/wp-content/uploads/2024/01/Contrave-label-113023.pdf
9. Orlistat. Package insert. Roche Laboratories, Inc; 2009. Accessed April 23, 2024. https://www.accessdata.fda.gov/drugsatfda_docs/label/2009/020766s026lbl.pdf
10. Lorcaserin. Package insert. Arena Pharmaceuticals; 2012. Accessed April 23, 2024. https://www.accessdata.fda.gov/drugsatfda_docs/label/2012/022529lbl.pdf
11. FDA requests the withdrawal of the weight-loss drug Belviq, Belviq XR (lorcaserin) from the market. News release. US Food & Drug Administration. February 13, 2020. Accessed April 23, 2024. https://www.fda.gov/drugs/drug-safety-and-availability/fda-requests-withdrawal-weight-loss-drug-belviq-belviq-xr-lorcaserin-market
12. Saxenda Injection (Liraglutide [rDNA origin]). Novo Nordisk, Inc. October 1, 2015. Accessed April 23, 2024. https://www.accessdata.fda.gov/drugsatfda_docs/nda/2014/206321Orig1s000TOC.cfm
13. FDA approves new drug treatment for chronic weight management, first since 2014. News release. US Food & Drug Administration. June 4, 2021. Accessed April 23, 2024. https://www.fda.gov/news-events/press-announcements/fda-approves-new-drug-treatment-chronic-weight-management-first-2014
14. Pi-Sunyer X, Astrup A, Fujioka K, et al. A randomized, controlled trial of 3.0 mg of liraglutide in weight management. New Engl J Med. 2015;373:11-22. doi:10.1056/NEJMoa1411892
15. Wilding JPH, Batterham RL, Calanna S, et al. Once-weekly semaglutide in adults with overweight or obesity. New Engl J Med 2021;384:989-1002. doi:10.1056/NEJMoa2032183
16. Hood SR, Berkeley AW, Moore EA. Evaluation of pharmacologic interventions for weight management in a veteran population. Fed Pract. 2021;38(5):220-226. doi:10.12788/fp.0117
17. Melamed OC, Selby P, Taylor VH. Mental health and obesity during the COVID-19 pandemic. Curr Obes Rep. 2022;11(1):23-31. doi:10.1007/s13679-021-00466-6
Generational Differences in Isotretinoin Prescribing Habits: A Cross-Sectional Analysis
To the Editor:
Prescriptions for isotretinoin may be influenced by patient demographics, medical comorbidities, and drug safety programs.1,2 In 1982, isotretinoin was approved by the US Food and Drug Administration for treatment of severe recalcitrant nodulocystic acne that is nonresponsive to conventional therapies such as antibiotics; however, prescriber beliefs regarding the necessity of oral antibiotic failure before isotretinoin is prescribed may be influenced by the provider’s generational age.3 Currently, there is a knowledge gap regarding the impact of provider characteristics, including the year providers completed training, on isotretinoin utilization. The aim of our cross-sectional study was to characterize generational isotretinoin prescribing habits in a large-scale midwestern private practice dermatology group.
Modernizing Medicine (https://www.modmed.com), an electronic medical record software, was queried for all encounters that included both an International Classification of Diseases, Tenth Revision, Clinical Modification diagnosis code L70.0 (acne vulgaris) and a medication prescription from May 2021 to May 2022. Data were collected from a large private practice group with locations across the state of Ohio. Exclusion criteria included provider-patient prescription pairs that included non–acne medication prescriptions, patients seen by multiple providers, and providers who treated fewer than 5 patients with acne during the study period. A mixed-effect multiple logistic regression was performed to analyze whether a patient was ever prescribed isotretinoin, adjusting for individual prescriber, prescriber generation (millennial [1981–1996], Generation X [1965–1980], and baby boomer [1946–1964]),4 and patient sex; spironolactone and oral antibiotic prescriptions during the study period were included as additional covariates in a subsequent post hoc analysis. This study utilized data that was fully deidentified in accordance with the US Health Insurance Portability and Accountability Act (HIPAA) Privacy Rule. Approval from an institutional review board was not required.
A total of 18,089 provider-patient prescription pairs were included in our analysis (Table). In our most robust model, female patients were significantly less likely to receive isotretinoin compared with male patients (adjusted OR [aOR], 0.394; P<.01). Millennial providers were significantly more likely to utilize isotretinoin in patients who did not receive antibiotics compared with patients who did receive antibiotics (aOR, 1.693; P<.01). When compared with both Generation X and baby boomers, millennial providers were more likely to prescribe isotretinoin in patients who received antibiotics (aOR, 2.227 [P=.02] and 3.638 [P<.01], respectively).
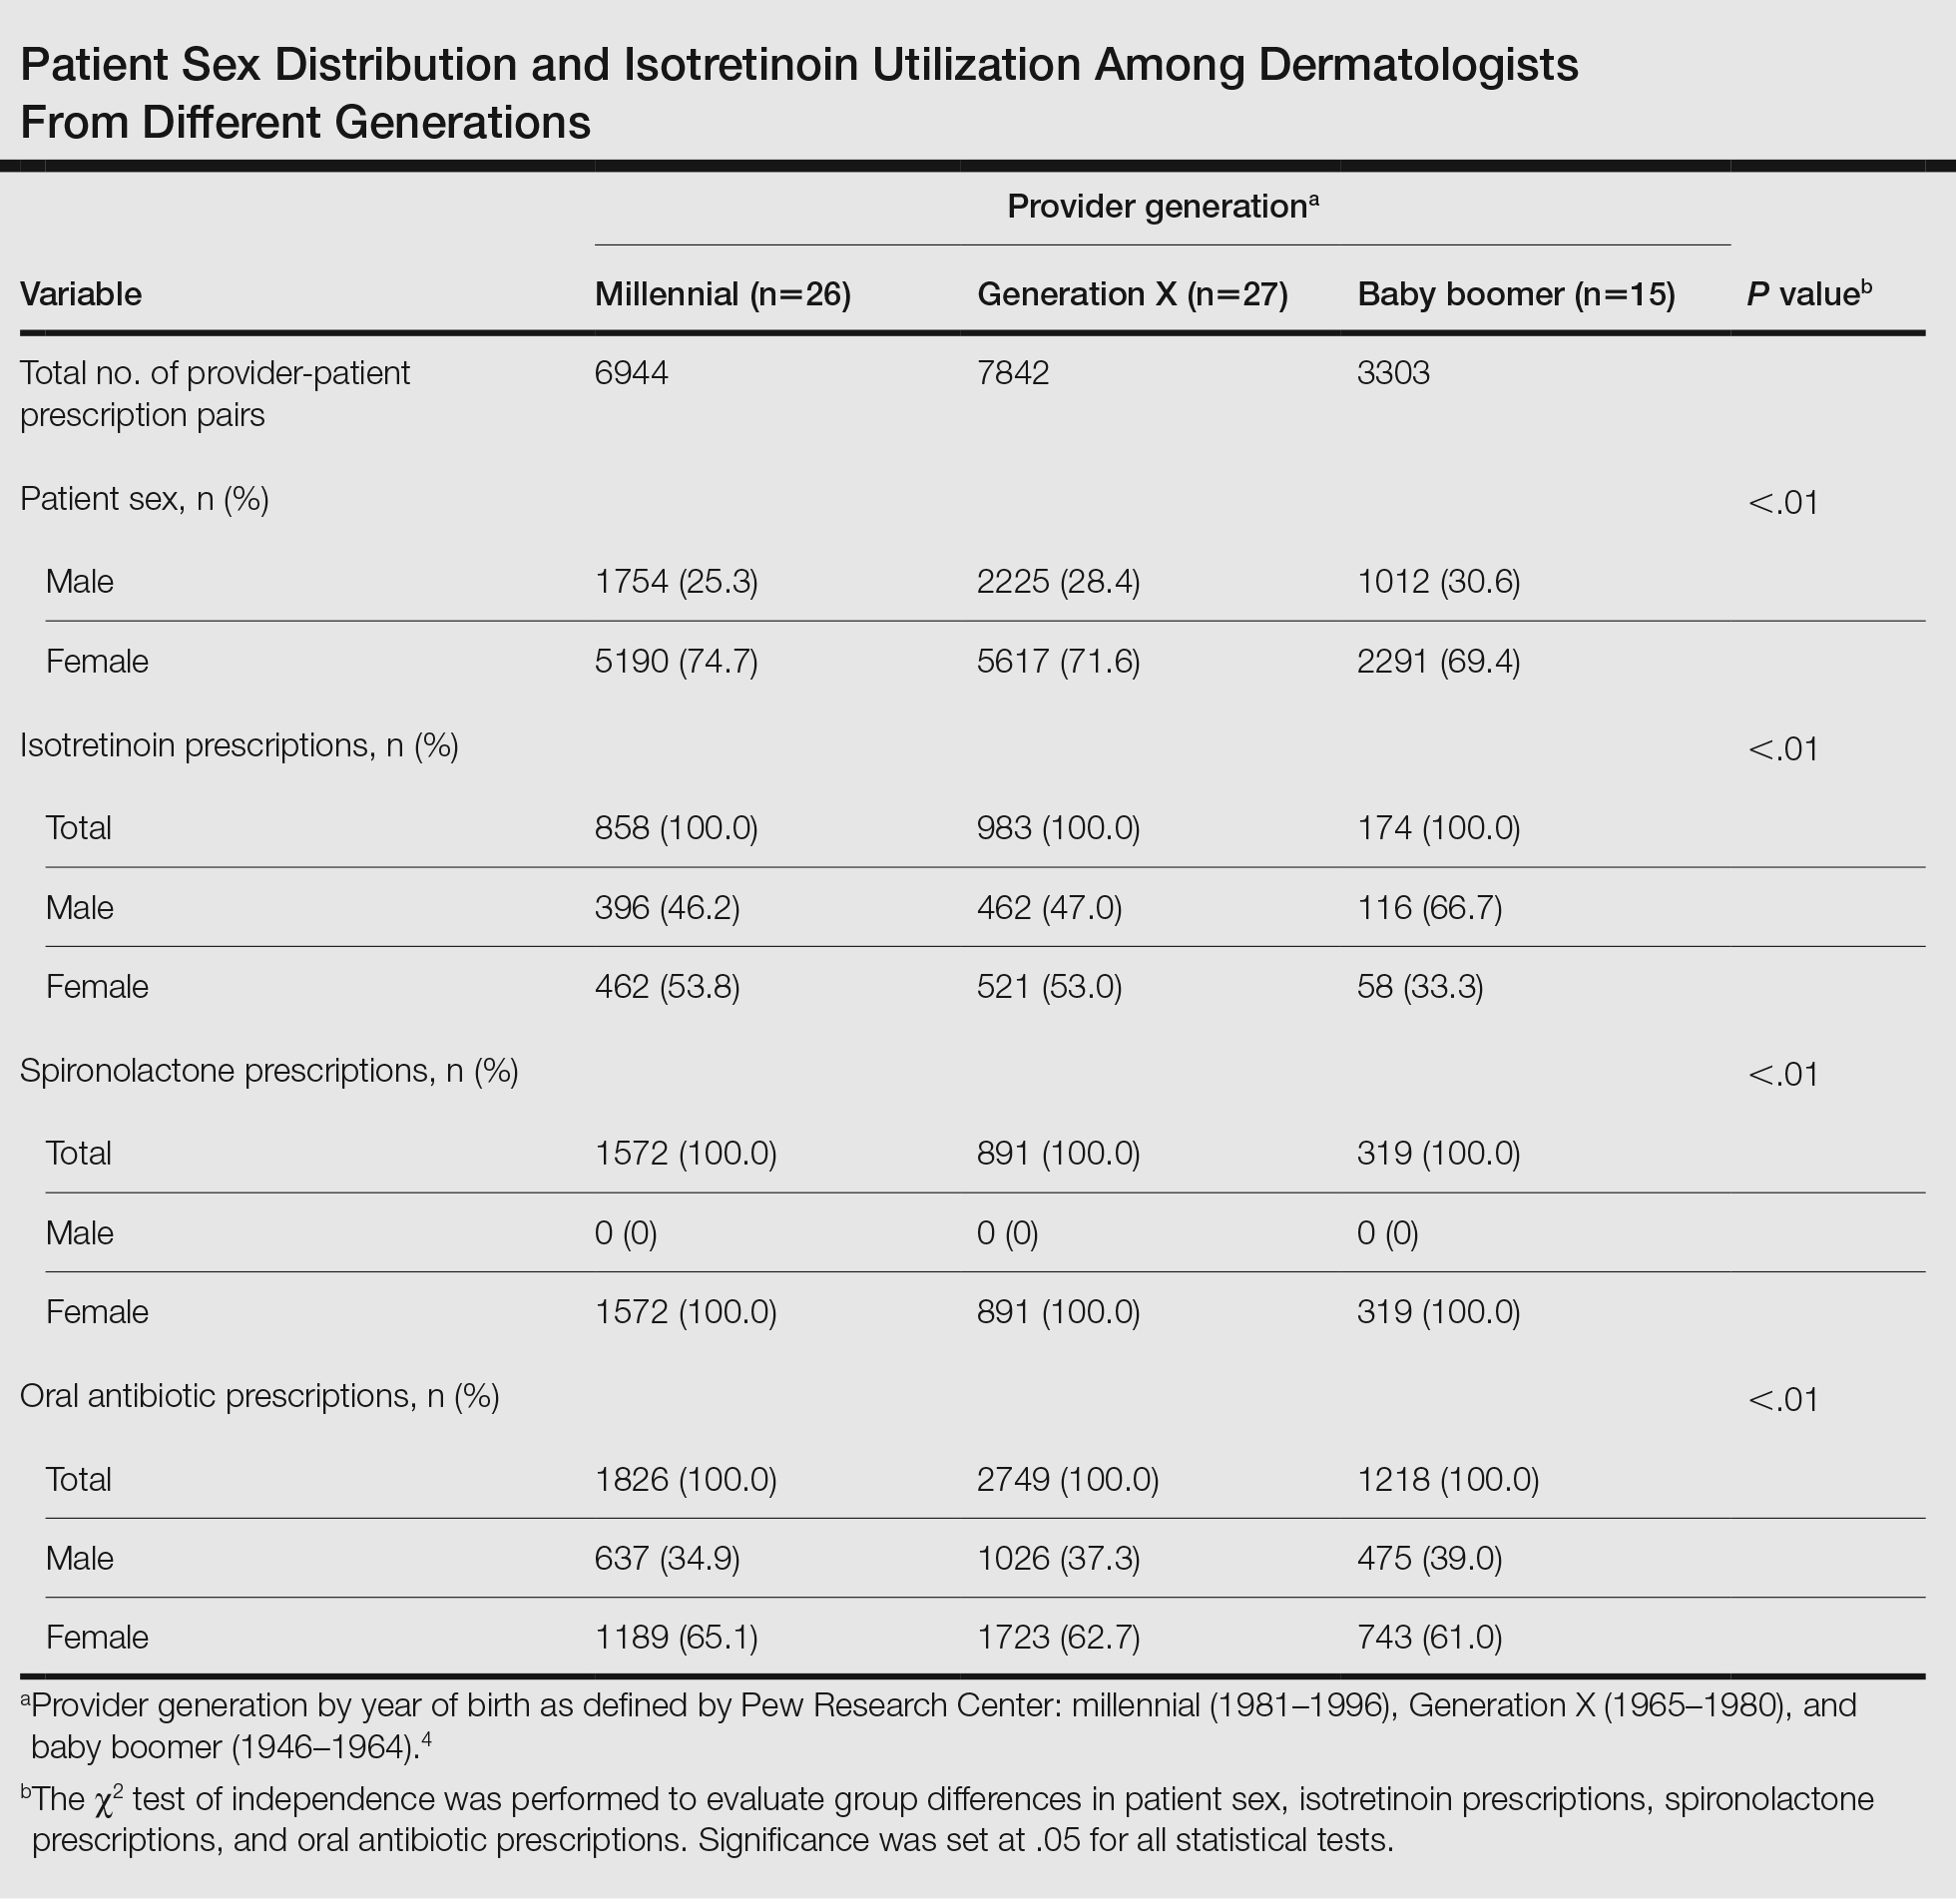
In 2018, the American Academy of Dermatology and the Global Alliance to Improve Outcomes in Acne updated thir guidelines to recommend isotretinoin as a first-line therapy for severe nodular acne, treatment-resistant moderate acne, or acne that produces scarring or psychosocial distress.5 Our study results suggest that millennial providers are adhering to these guidelines and readily prescribing isotretinoin in patients who did not receive antibiotics, which corroborates survey findings by Nagler and Orlow.3 Our results also revealed that prescriber generation may influence isotretinoin usage, with millennials utilizing isotretinoin more in patients who received oral antibiotic therapy than their older counterparts. In part, this may be due to beliefs among older generations that failure of oral antibiotics is necessary before pursuing isotretinoin.3 Additionally, this finding suggests that millennials, if utilizing antibiotics for acne, may have a lower threshold for starting isotretinoin in patients who received oral antibiotic therapy.
Generational prescribing variation appears not to be unique to isotretinoin and also may be present in the use of spironolactone. Over the past decade, utilization of spironolactone for acne treatment has increased, likely in response to new data demonstrating that routine use is safe and effective.6 Several large cohort and retrospective studies have debunked the historical concerns for tumorigenicity in those with breast cancer history as well as the need for routine laboratory monitoring for hyperkalemia.7,8 Although spironolactone use for the treatment of acne has increased, it still remains relatively underutilized,6 suggesting there may be a knowledge gap similar to that of isotretinoin, with younger generations utilizing spironolactone more readily than older generations.
Our study analyzed generational differences in isotretinoin utilization for acne over 1 calendar year. Limitations include sampling from a midwestern patient cohort and private practice–based providers. Due to limitations of our data set, we were unable to capture acne medication usage prior to May 2021, temporal sequencing of acne medication usage, and stratification of patients by acne severity. Furthermore, we were unable to capture female patients who were pregnant or planning pregnancy at the time of their encounter, which would exclude isotretinoin usage.
Overall, millennial providers may be utilizing isotretinoin more in line with the updated acne guidelines5 compared with providers from older generations. Further research is necessary to elucidate how these prescribing habits may change based on acne severity.
- Barbieri JS, Shin DB, Wang S, et al. Association of race/ethnicity and sex with differences in health care use and treatment for acne. JAMA Dermatol. 2020;156:312-319. doi:10.1001/jamadermatol.2019.4818
- Barbieri JS, Frieden IJ, Nagler AR. Isotretinoin, patient safety, and patient-centered care-time to reform iPLEDGE. JAMA Dermatol. 2020;156:21-22. doi:10.1001/jamadermatol.2019.3270
- Nagler AR, Orlow SJ. Dermatologists’ attitudes, prescription, and counseling patterns for isotretinoin: a questionnaire-based study. J Drugs Dermatol. 2015;14:184-189.
- Dimock M. Where Millennials end and Generation Z begins. Pew Research Center website. January 17, 2019. Accessed June 17, 2024. https://www.pewresearch.org/fact-tank/2019/01/17/where-millennials-end-and-generation-z-begins/
- Thiboutot DM, Dréno B, Abanmi A, et al. Practical management of acne for clinicians: an international consensus from the Global Alliance to Improve Outcomes in Acne. J Am Acad Dermatol. 2018;78(2 suppl 1):S1-S23.e1. doi:10.1016/j.jaad.2017.09.078
- Guzman AK, Barbieri JS. Comparative analysis of prescribing patterns of tetracycline class antibiotics and spironolactone between advanced practice providers and physicians in the treatment of acne vulgaris. J Am Acad Dermatol. 2021;84:1119-1121. doi:10.1016/j.jaad.2020.06.044
- Wei C, Bovonratwet P, Gu A, et al. Spironolactone use does not increase the risk of female breast cancer recurrence: a retrospective analysis. J Am Acad Dermatol. 2020;83:1021-1027. doi:10.1016/j.jaad.2020.05.081
- Plovanich M, Weng QY, Mostaghimi A. Low usefulness of potassium monitoring among healthy young women taking spironolactone for acne. JAMA Dermatol. 2015;151:941-944. doi:10.1001/jamadermatol.2015.34
To the Editor:
Prescriptions for isotretinoin may be influenced by patient demographics, medical comorbidities, and drug safety programs.1,2 In 1982, isotretinoin was approved by the US Food and Drug Administration for treatment of severe recalcitrant nodulocystic acne that is nonresponsive to conventional therapies such as antibiotics; however, prescriber beliefs regarding the necessity of oral antibiotic failure before isotretinoin is prescribed may be influenced by the provider’s generational age.3 Currently, there is a knowledge gap regarding the impact of provider characteristics, including the year providers completed training, on isotretinoin utilization. The aim of our cross-sectional study was to characterize generational isotretinoin prescribing habits in a large-scale midwestern private practice dermatology group.
Modernizing Medicine (https://www.modmed.com), an electronic medical record software, was queried for all encounters that included both an International Classification of Diseases, Tenth Revision, Clinical Modification diagnosis code L70.0 (acne vulgaris) and a medication prescription from May 2021 to May 2022. Data were collected from a large private practice group with locations across the state of Ohio. Exclusion criteria included provider-patient prescription pairs that included non–acne medication prescriptions, patients seen by multiple providers, and providers who treated fewer than 5 patients with acne during the study period. A mixed-effect multiple logistic regression was performed to analyze whether a patient was ever prescribed isotretinoin, adjusting for individual prescriber, prescriber generation (millennial [1981–1996], Generation X [1965–1980], and baby boomer [1946–1964]),4 and patient sex; spironolactone and oral antibiotic prescriptions during the study period were included as additional covariates in a subsequent post hoc analysis. This study utilized data that was fully deidentified in accordance with the US Health Insurance Portability and Accountability Act (HIPAA) Privacy Rule. Approval from an institutional review board was not required.
A total of 18,089 provider-patient prescription pairs were included in our analysis (Table). In our most robust model, female patients were significantly less likely to receive isotretinoin compared with male patients (adjusted OR [aOR], 0.394; P<.01). Millennial providers were significantly more likely to utilize isotretinoin in patients who did not receive antibiotics compared with patients who did receive antibiotics (aOR, 1.693; P<.01). When compared with both Generation X and baby boomers, millennial providers were more likely to prescribe isotretinoin in patients who received antibiotics (aOR, 2.227 [P=.02] and 3.638 [P<.01], respectively).
In 2018, the American Academy of Dermatology and the Global Alliance to Improve Outcomes in Acne updated thir guidelines to recommend isotretinoin as a first-line therapy for severe nodular acne, treatment-resistant moderate acne, or acne that produces scarring or psychosocial distress.5 Our study results suggest that millennial providers are adhering to these guidelines and readily prescribing isotretinoin in patients who did not receive antibiotics, which corroborates survey findings by Nagler and Orlow.3 Our results also revealed that prescriber generation may influence isotretinoin usage, with millennials utilizing isotretinoin more in patients who received oral antibiotic therapy than their older counterparts. In part, this may be due to beliefs among older generations that failure of oral antibiotics is necessary before pursuing isotretinoin.3 Additionally, this finding suggests that millennials, if utilizing antibiotics for acne, may have a lower threshold for starting isotretinoin in patients who received oral antibiotic therapy.
Generational prescribing variation appears not to be unique to isotretinoin and also may be present in the use of spironolactone. Over the past decade, utilization of spironolactone for acne treatment has increased, likely in response to new data demonstrating that routine use is safe and effective.6 Several large cohort and retrospective studies have debunked the historical concerns for tumorigenicity in those with breast cancer history as well as the need for routine laboratory monitoring for hyperkalemia.7,8 Although spironolactone use for the treatment of acne has increased, it still remains relatively underutilized,6 suggesting there may be a knowledge gap similar to that of isotretinoin, with younger generations utilizing spironolactone more readily than older generations.
Our study analyzed generational differences in isotretinoin utilization for acne over 1 calendar year. Limitations include sampling from a midwestern patient cohort and private practice–based providers. Due to limitations of our data set, we were unable to capture acne medication usage prior to May 2021, temporal sequencing of acne medication usage, and stratification of patients by acne severity. Furthermore, we were unable to capture female patients who were pregnant or planning pregnancy at the time of their encounter, which would exclude isotretinoin usage.
Overall, millennial providers may be utilizing isotretinoin more in line with the updated acne guidelines5 compared with providers from older generations. Further research is necessary to elucidate how these prescribing habits may change based on acne severity.
- Barbieri JS, Shin DB, Wang S, et al. Association of race/ethnicity and sex with differences in health care use and treatment for acne. JAMA Dermatol. 2020;156:312-319. doi:10.1001/jamadermatol.2019.4818
- Barbieri JS, Frieden IJ, Nagler AR. Isotretinoin, patient safety, and patient-centered care-time to reform iPLEDGE. JAMA Dermatol. 2020;156:21-22. doi:10.1001/jamadermatol.2019.3270
- Nagler AR, Orlow SJ. Dermatologists’ attitudes, prescription, and counseling patterns for isotretinoin: a questionnaire-based study. J Drugs Dermatol. 2015;14:184-189.
- Dimock M. Where Millennials end and Generation Z begins. Pew Research Center website. January 17, 2019. Accessed June 17, 2024. https://www.pewresearch.org/fact-tank/2019/01/17/where-millennials-end-and-generation-z-begins/
- Thiboutot DM, Dréno B, Abanmi A, et al. Practical management of acne for clinicians: an international consensus from the Global Alliance to Improve Outcomes in Acne. J Am Acad Dermatol. 2018;78(2 suppl 1):S1-S23.e1. doi:10.1016/j.jaad.2017.09.078
- Guzman AK, Barbieri JS. Comparative analysis of prescribing patterns of tetracycline class antibiotics and spironolactone between advanced practice providers and physicians in the treatment of acne vulgaris. J Am Acad Dermatol. 2021;84:1119-1121. doi:10.1016/j.jaad.2020.06.044
- Wei C, Bovonratwet P, Gu A, et al. Spironolactone use does not increase the risk of female breast cancer recurrence: a retrospective analysis. J Am Acad Dermatol. 2020;83:1021-1027. doi:10.1016/j.jaad.2020.05.081
- Plovanich M, Weng QY, Mostaghimi A. Low usefulness of potassium monitoring among healthy young women taking spironolactone for acne. JAMA Dermatol. 2015;151:941-944. doi:10.1001/jamadermatol.2015.34
Practice Points
- Provider generational age appears to impact utilization of isotretinoin for the treatment of acne.
- Millennial providers seem to adhere more readily to guidelines for precribing isotretinoin vs older generations and also may have a lower threshold for starting isotretinoin in patients who received oral antibiotic therapy for acne treatment.

Central Centrifugal Cicatricial Alopecia in Males: Analysis of Time to Diagnosis and Disease Severity
To the Editor:
Central centrifugal cicatricial alopecia (CCCA) is a chronic progressive type of scarring alopecia that primarily affects women of African descent.1 The disorder rarely is reported in men, which may be due to misdiagnosis or delayed diagnosis. Early diagnosis and treatment are the cornerstones to slow or halt disease progression and prevent permanent damage to hair follicles. This study aimed to investigate the time to diagnosis and disease severity among males with CCCA.
We conducted a retrospective chart review of male patients older than 18 years seen in outpatient clinics at an academic dermatology department (Philadelphia, Pennsylvania) between January 2012 and December 2022. An electronic query using the International Classification of Diseases, Ninth and Tenth Revisions, code L66.9 (cicatricial alopecia, unspecified) was performed. Patients were included if they had a clinical diagnosis of CCCA, histologic evidence of CCCA, and scalp photographs from the initial dermatology visit. Patients with folliculitis decalvans, scalp biopsy features that limited characterization, or no scalp biopsy were excluded from the study. Onset of CCCA was defined as the patient-reported start time of hair loss and/or scalp symptoms. To determine alopecia severity, the degree of central scalp hair loss was independently assessed by 2 dermatologists (S.C.T., T.O.) using the central scalp alopecia photographic scale in African American women.2,3 This 6-point photographic scale displays images with grades ranging from 0 (normal) to 5 (bald scalp); higher grades indicate probable and more severe CCCA. The scale also divides the central hair loss in a frontal-accentuation or vertex-predominant pattern, which corresponds to the A or B designations, respectively; thus, a score of 5A indicates probable severe CCCA with a frontal accentuation pattern, while 5B indicates probable severe CCCA with hair loss focused on the vertex scalp. This study was approved by the University of Pennsylvania institutional review board (approval #850730).
Of 108 male patients, 12 met the eligibility criteria. Nearly all patients (91.7% [11/12]) had a CCCA severity grade of 3 or higher at the initial dermatology visit, indicating extensive hair loss (Table). The clinical appearance of severity grades 2 through 5 is demonstrated in the Figure. Among patients with a known disease duration prior to diagnosis, 72.7% (8/11) were diagnosed more than 1 year after onset of CCCA, and 45.4% (5/11) were diagnosed more than 5 years after onset. On average (SD), it took 6.4 (5.9) years for patients to receive a diagnosis of CCCA after the onset of scalp symptoms and/or hair loss.
Randomized controlled trials evaluating treatment of CCCA are lacking, and anecdotal evidence posits a better treatment response in early CCCA; however, our results suggest that most male patients present with advanced CCCA and receive a diagnosis years after disease onset. Similar research in alopecia areata has shown that 72.4% (105/145) of patients received their diagnosis within a year after onset of symptoms, and the mean time from onset of symptoms to diagnosis was 1 year.4 In contrast, male patients with CCCA experience considerable diagnostic delays. This disparity indicates the need for clinicians to increase recognition of CCCA in men and quickly refer them to a dermatologist for prompt treatment.
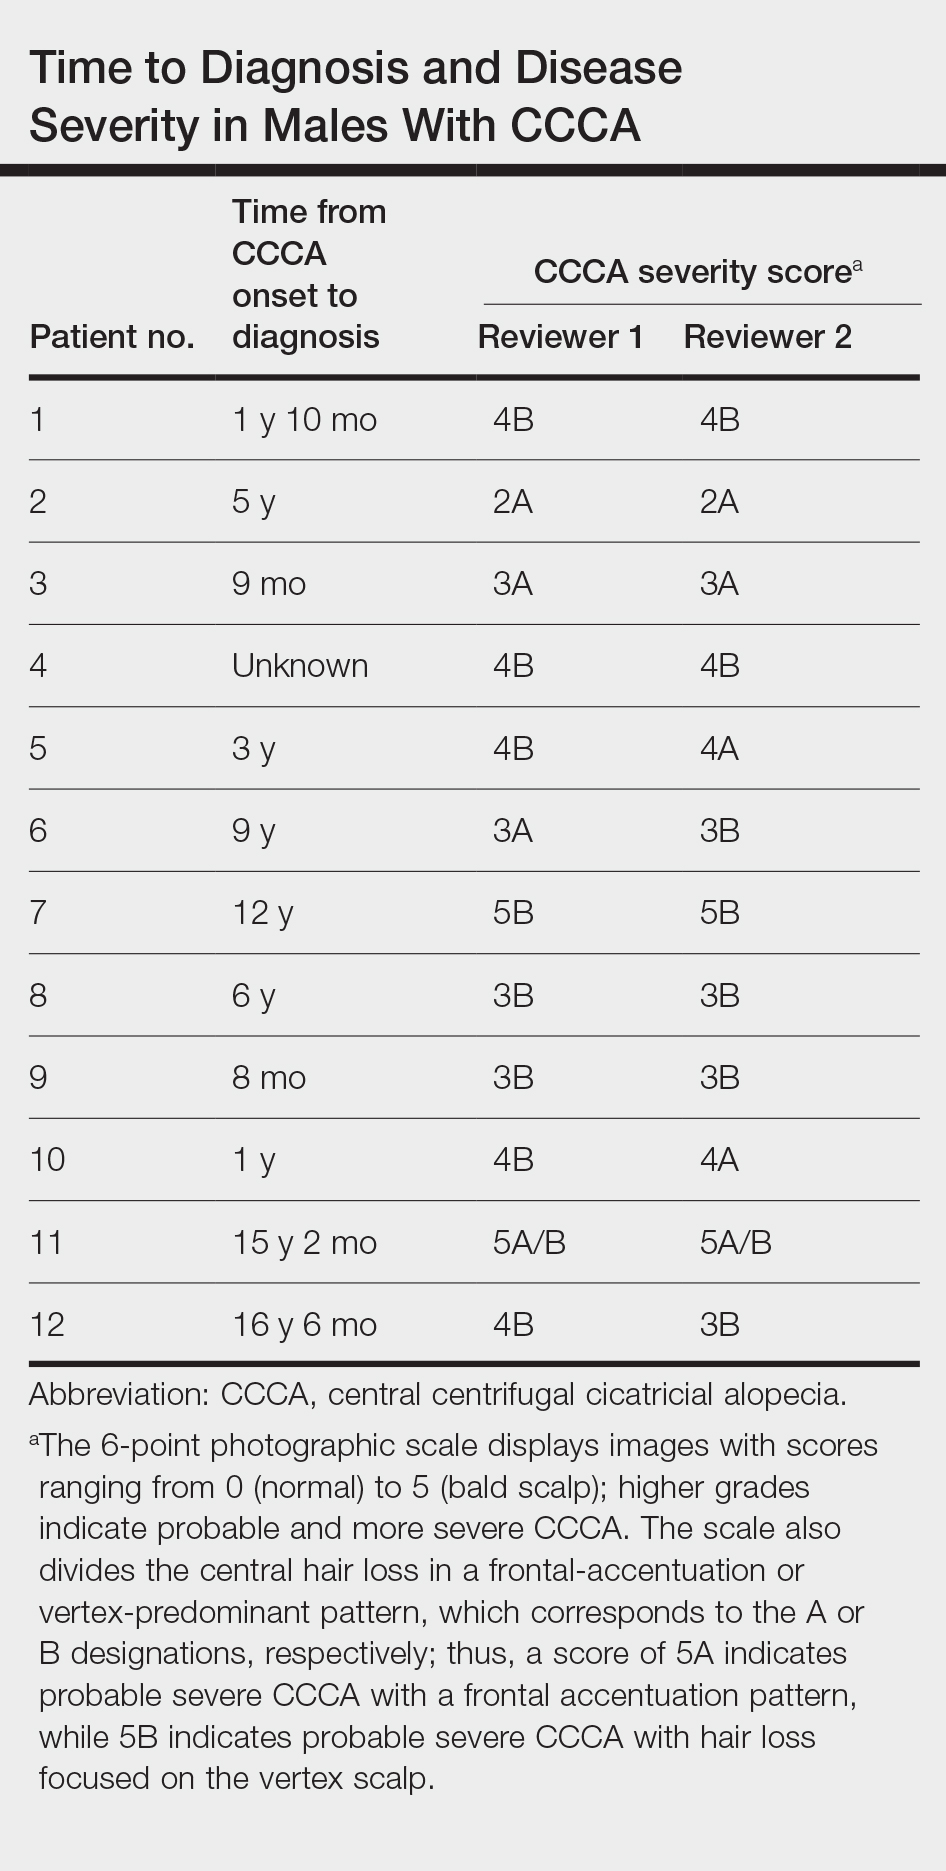
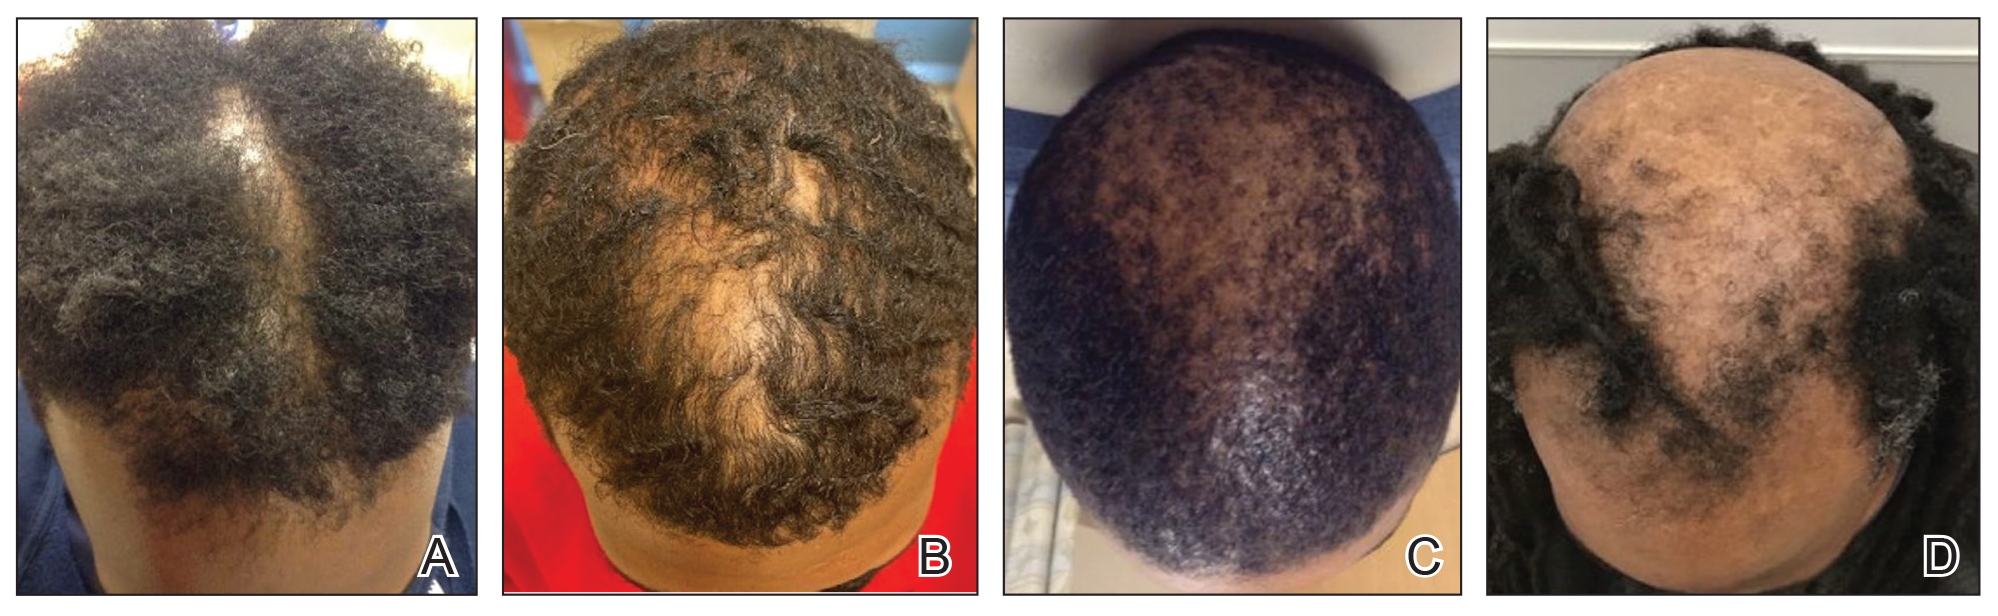
Androgenetic alopecia (AGA) commonly is at the top of the differential diagnosis for hair loss on the vertex of the scalp in males, but clinicians should maintain a high index of suspicion for CCCA, especially when scalp symptoms or atypical features of AGA are present.5 Androgenetic alopecia typically is asymptomatic, whereas the symptoms of CCCA may include itching, tenderness, and/or burning.6,7 Trichoscopy is useful to evaluate for scarring, and a scalp biopsy may reveal other features to lower AGA on the differential. Educating patients, barbers, and hairstylists about the importance of early intervention also may encourage earlier visits before the scarring process is advanced. Further exploration into factors impacting diagnosis and CCCA severity may uncover implications for prognosis and treatment.
This study was limited by a small sample size, retrospective design, and single-center analysis. Some patients had comorbid hair loss conditions, which could affect disease severity. Moreover, the central scalp alopecia photographic scale2 was not validated in men or designed for assessment of the nonclassical hair loss distributions noted in some of our patients. Nonetheless, we hope these data will support clinicians in efforts to advocate for early diagnosis and treatment in patients with CCCA to ultimately help improve outcomes.
- Ogunleye TA, McMichael A, Olsen EA. Central centrifugal cicatricial alopecia: what has been achieved, current clues for future research. Dermatol Clin. 2014;32:173-181. doi:10.1016/j.det.2013.12.005
- Olsen EA, Callender V, McMichael A, et al. Central hair loss in African American women: incidence and potential risk factors. J Am Acad Dermatol. 2011;64:245-252. doi:10.1016/j.jaad.2009.11.693
- Olsen EA, Callendar V, Sperling L, et al. Central scalp alopecia photographic scale in African American women. Dermatol Ther. 2008;21:264-267. doi:10.1111/j.1529-8019.2008.00208.x
- Andersen YMF, Nymand L, DeLozier AM, et al. Patient characteristics and disease burden of alopecia areata in the Danish Skin Cohort. BMJ Open. 2022;12:E053137. doi:10.1136/bmjopen-2021-053137
- Davis EC, Reid SD, Callender VD, et al. Differentiating central centrifugal cicatricial alopecia and androgenetic alopecia in African American men. J Clin Aesthetic Dermatol. 2012;5:37-40.
- Jackson TK, Sow Y, Ayoade KO, et al. Central centrifugal cicatricial alopecia in males. J Am Acad Dermatol. 2023;89:1136-1140. doi:10.1016/j.jaad.2023.07.1011
- Lawson CN, Bakayoko A, Callender VD. Central centrifugal cicatricial alopecia: challenges and treatments. Dermatol Clin. 2021;39:389-405. doi:10.1016/j.det.2021.03.004
To the Editor:
Central centrifugal cicatricial alopecia (CCCA) is a chronic progressive type of scarring alopecia that primarily affects women of African descent.1 The disorder rarely is reported in men, which may be due to misdiagnosis or delayed diagnosis. Early diagnosis and treatment are the cornerstones to slow or halt disease progression and prevent permanent damage to hair follicles. This study aimed to investigate the time to diagnosis and disease severity among males with CCCA.
We conducted a retrospective chart review of male patients older than 18 years seen in outpatient clinics at an academic dermatology department (Philadelphia, Pennsylvania) between January 2012 and December 2022. An electronic query using the International Classification of Diseases, Ninth and Tenth Revisions, code L66.9 (cicatricial alopecia, unspecified) was performed. Patients were included if they had a clinical diagnosis of CCCA, histologic evidence of CCCA, and scalp photographs from the initial dermatology visit. Patients with folliculitis decalvans, scalp biopsy features that limited characterization, or no scalp biopsy were excluded from the study. Onset of CCCA was defined as the patient-reported start time of hair loss and/or scalp symptoms. To determine alopecia severity, the degree of central scalp hair loss was independently assessed by 2 dermatologists (S.C.T., T.O.) using the central scalp alopecia photographic scale in African American women.2,3 This 6-point photographic scale displays images with grades ranging from 0 (normal) to 5 (bald scalp); higher grades indicate probable and more severe CCCA. The scale also divides the central hair loss in a frontal-accentuation or vertex-predominant pattern, which corresponds to the A or B designations, respectively; thus, a score of 5A indicates probable severe CCCA with a frontal accentuation pattern, while 5B indicates probable severe CCCA with hair loss focused on the vertex scalp. This study was approved by the University of Pennsylvania institutional review board (approval #850730).
Of 108 male patients, 12 met the eligibility criteria. Nearly all patients (91.7% [11/12]) had a CCCA severity grade of 3 or higher at the initial dermatology visit, indicating extensive hair loss (Table). The clinical appearance of severity grades 2 through 5 is demonstrated in the Figure. Among patients with a known disease duration prior to diagnosis, 72.7% (8/11) were diagnosed more than 1 year after onset of CCCA, and 45.4% (5/11) were diagnosed more than 5 years after onset. On average (SD), it took 6.4 (5.9) years for patients to receive a diagnosis of CCCA after the onset of scalp symptoms and/or hair loss.
Randomized controlled trials evaluating treatment of CCCA are lacking, and anecdotal evidence posits a better treatment response in early CCCA; however, our results suggest that most male patients present with advanced CCCA and receive a diagnosis years after disease onset. Similar research in alopecia areata has shown that 72.4% (105/145) of patients received their diagnosis within a year after onset of symptoms, and the mean time from onset of symptoms to diagnosis was 1 year.4 In contrast, male patients with CCCA experience considerable diagnostic delays. This disparity indicates the need for clinicians to increase recognition of CCCA in men and quickly refer them to a dermatologist for prompt treatment.
Androgenetic alopecia (AGA) commonly is at the top of the differential diagnosis for hair loss on the vertex of the scalp in males, but clinicians should maintain a high index of suspicion for CCCA, especially when scalp symptoms or atypical features of AGA are present.5 Androgenetic alopecia typically is asymptomatic, whereas the symptoms of CCCA may include itching, tenderness, and/or burning.6,7 Trichoscopy is useful to evaluate for scarring, and a scalp biopsy may reveal other features to lower AGA on the differential. Educating patients, barbers, and hairstylists about the importance of early intervention also may encourage earlier visits before the scarring process is advanced. Further exploration into factors impacting diagnosis and CCCA severity may uncover implications for prognosis and treatment.
This study was limited by a small sample size, retrospective design, and single-center analysis. Some patients had comorbid hair loss conditions, which could affect disease severity. Moreover, the central scalp alopecia photographic scale2 was not validated in men or designed for assessment of the nonclassical hair loss distributions noted in some of our patients. Nonetheless, we hope these data will support clinicians in efforts to advocate for early diagnosis and treatment in patients with CCCA to ultimately help improve outcomes.
- Ogunleye TA, McMichael A, Olsen EA. Central centrifugal cicatricial alopecia: what has been achieved, current clues for future research. Dermatol Clin. 2014;32:173-181. doi:10.1016/j.det.2013.12.005
- Olsen EA, Callender V, McMichael A, et al. Central hair loss in African American women: incidence and potential risk factors. J Am Acad Dermatol. 2011;64:245-252. doi:10.1016/j.jaad.2009.11.693
- Olsen EA, Callendar V, Sperling L, et al. Central scalp alopecia photographic scale in African American women. Dermatol Ther. 2008;21:264-267. doi:10.1111/j.1529-8019.2008.00208.x
- Andersen YMF, Nymand L, DeLozier AM, et al. Patient characteristics and disease burden of alopecia areata in the Danish Skin Cohort. BMJ Open. 2022;12:E053137. doi:10.1136/bmjopen-2021-053137
- Davis EC, Reid SD, Callender VD, et al. Differentiating central centrifugal cicatricial alopecia and androgenetic alopecia in African American men. J Clin Aesthetic Dermatol. 2012;5:37-40.
- Jackson TK, Sow Y, Ayoade KO, et al. Central centrifugal cicatricial alopecia in males. J Am Acad Dermatol. 2023;89:1136-1140. doi:10.1016/j.jaad.2023.07.1011
- Lawson CN, Bakayoko A, Callender VD. Central centrifugal cicatricial alopecia: challenges and treatments. Dermatol Clin. 2021;39:389-405. doi:10.1016/j.det.2021.03.004
Practice Points
- Most males with central centrifugal cicatricial alopecia (CCCA) experience considerable diagnostic delays and typically present to dermatology with late-stage disease.
- Dermatologists should consider CCCA in the differential diagnosis for adult Black males with alopecia.
- More research is needed to explore advanced CCCA in males, including factors limiting timely diagnosis and the impact on quality of life in this population.

Overuse of Hematocrit Testing After Elective General Surgery at a Veterans Affairs Medical Center
It is common practice to routinely measure postoperative hematocrit levels at US Department of Veterans Affairs (VA) hospitals for a wide range of elective general surgeries. While hematocrit measurement is a low-cost test, the high frequency with which these tests are performed may drastically increase overall costs.
Numerous studies have suggested that physicians overuse laboratory testing.1-10 Kohli and colleagues recommended that the routine practice of obtaining postoperative hematocrit tests following elective gynecologic surgery be abandoned.1 A similar recommendation was made by Olus and colleagues after studying uneventful, unplanned cesarean sections and by Wu and colleagues after investigating routine laboratory tests post total hip arthroplasty.2,3
To our knowledge, a study assessing routine postoperative hematocrit testing in elective general surgery has not yet been conducted. Many laboratory tests ordered in the perioperative period are not indicated, including complete blood count (CBC), electrolytes, and coagulation studies.4 Based on the results of these studies, we expected that the routine measurement of postoperative hematocrit levels after elective general surgeries at VA medical centers would not be cost effective. A PubMed search for articles published from 1990 to 2023 using the search terms “hematocrit,” “hemoglobin,” “general,” “surgery,” “routine,” and “cost” or “cost-effectiveness,” suggests that the clinical usefulness of postoperative hematocrit testing has not been well studied in the general surgery setting. The purpose of this study was to determine the clinical utility and associated cost of measuring routine postoperative hematocrit levels in order to generate a guide as to when the practice is warranted following common elective general surgery.
Although gynecologic textbooks may describe recommendations of routine hematocrit checking after elective gynecologic operations, one has difficulty finding the same recommendations in general surgery textbooks.1 However, it is common practice for surgical residents and attending surgeons to routinely order hematocrit on postoperative day-1 to ensure that the operation did not result in unsuspected anemia that then would need treatment (either with fluids or a blood transfusion). Many other surgeons rely on clinical factors such as tachycardia, oliguria, or hypotension to trigger a hematocrit (and other laboratory) tests. Our hypothesis is that the latter group has chosen the most cost-effective and prudent practice. One problem with checking the hematocrit routinely, as with any other screening test, is what to do with an abnormal result, assuming an asymptomatic patient? If the postoperative hematocrit is lower than expected given the estimated blood loss (EBL), what is one to do?
Methods
This retrospective case-control study conducted at the New Mexico VA Health Care System (NMVAHCS) in Albuquerque compared data for patients who received transfusion within 72 hours of elective surgeries vs patients who did not. Patients who underwent elective general surgery from January 2011 through December 2014 were included. An elective general surgery was defined as surgery performed following an outpatient preoperative anesthesia evaluation ≥ 30 days prior to operation. Patients who underwent emergency operations, and those with baseline anemia (preoperative hematocrit < 30%), and those transfused > 72 hours after their operation were excluded. The NMVAHCSInstitutional Review Board approved this study (No. 15-H184).
A detailed record review was conducted to collect data on demographics and other preoperative risk factors, including age, sex, body mass index (BMI), race and ethnicity, cardiac and pulmonary comorbidities, tobacco use, alcohol intake, diabetes, American Society of Anesthesiologists Physical Status Classification, metabolic equivalent of task, hematologic conditions, and renal disease.
For each procedure, we recorded the type of elective general surgery performed, the diagnosis/indication, pre- and postoperative hemoglobin/hematocrit, intraoperative EBL, length of operation, surgical wound class, length of hospital stay (LOS), intensive care unit (ICU) status, number of hematocrit tests, cardiovascular risk of operation (defined by anesthesia assessment), presence or absence of malignancy, preoperative platelet count, albumin level, preoperative prothrombin time/activated partial thromboplastin time (aPTT), international normalized ratio (INR), hemoglobin A1c, and incidence of transfusion. Signs and symptoms of anemia were recorded as present if the postoperative vital signs suggested low intravascular volume (pulse > 120 beats/minute, systolic blood pressure < 90 mm Hg, or vasoactive medication requirement [per anesthesia postoperative note]) or if the patient reported or exhibited symptoms of dizziness or fatigue or evidence of clinically apparent bleeding (ie, hematoma formation). Laboratory charges for hematocrit tests and CBC at the NMAVAHCS were used to assess cost.11
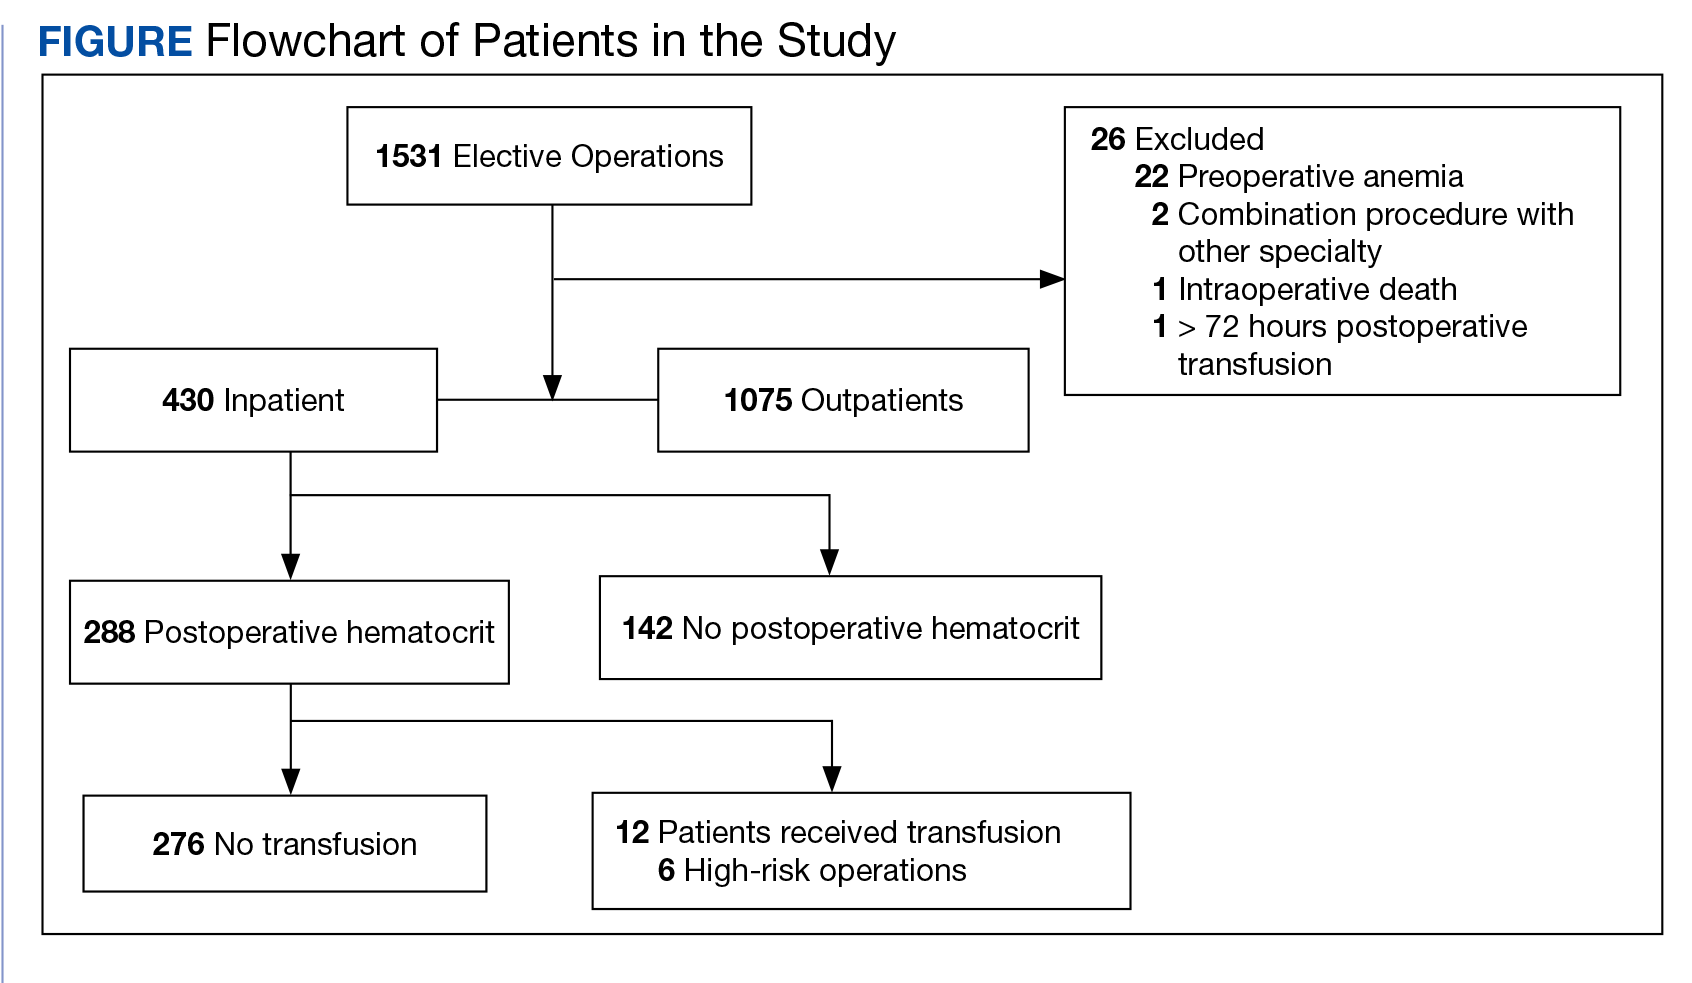
To stratify the transfusion risk, patients were distributed among 3 groups based on the following criteria: discharged home the same day as surgery; admitted but did not have postoperative hematocrit testing; and admitted and had postoperative hematocrit testing. We also stratified operations into low or high risk based on the risk for postoperative transfusion (Figure). Recognizing that the American College of Chest Physicians guidelines for perioperative management of antithrombotic therapy places bowel resection in a high-risk category, we designated a surgery as high risk when ≥ 2 patients in the transfusion group had that type of surgery over the 4 years of the study.12 Otherwise, the operations were deemed low risk.
Statistical Analysis
Numeric analysis used t tests and Binary and categorical variables used Fisher exact tests. P value ≤ .05 was considered statistically significant. SAS software was used for all statistical analyses.
Results
From 2011 through 2014, 1531 patients had elective general surgery at NMVAHCS. Twenty-two patients with preoperative anemia (hematocrit < 30%) and 1 patient who received a transfusion > 72 hours after the operation were excluded. Most elective operations (70%, n = 1075) were performed on an outpatient basis; none involved transfusion. Inguinal hernia repair was most common with 479 operations; 17 patients were treated inpatient of which 2 patients had routine postoperative hematocrit checks; (neither received transfusion). One patient with inguinal hernia surgery received transfusion without routine postoperative hematocrit monitoring.
Of 112 partial colon resections, 1 patient had a postoperative transfusion; and all but 3 received postoperative hematocrit monitoring. Nineteen patients undergoing partial colon resection had a clinical indication for postoperative hematocrit monitoring. None of the 5 patients with partial gastrectomy received a postoperative transfusion. Of 121 elective cholecystectomies, no patients had postoperative transfusion, whereas 34 had postoperative hematocrit monitoring; only 2 patients had a clinical reason for the hematocrit monitoring.
Of 430 elective inpatient operations, 12 received transfusions and 288 patients had ≥ 1 postoperative hematocrit test (67%). All hematocrit tests were requested by the attending surgeon, resident surgeon, or the surgical ICU team. Of the group that had postoperative hematocrit monitoring, there was an average of 4.4 postoperative hematocrit tests per patient (range, 1-44).
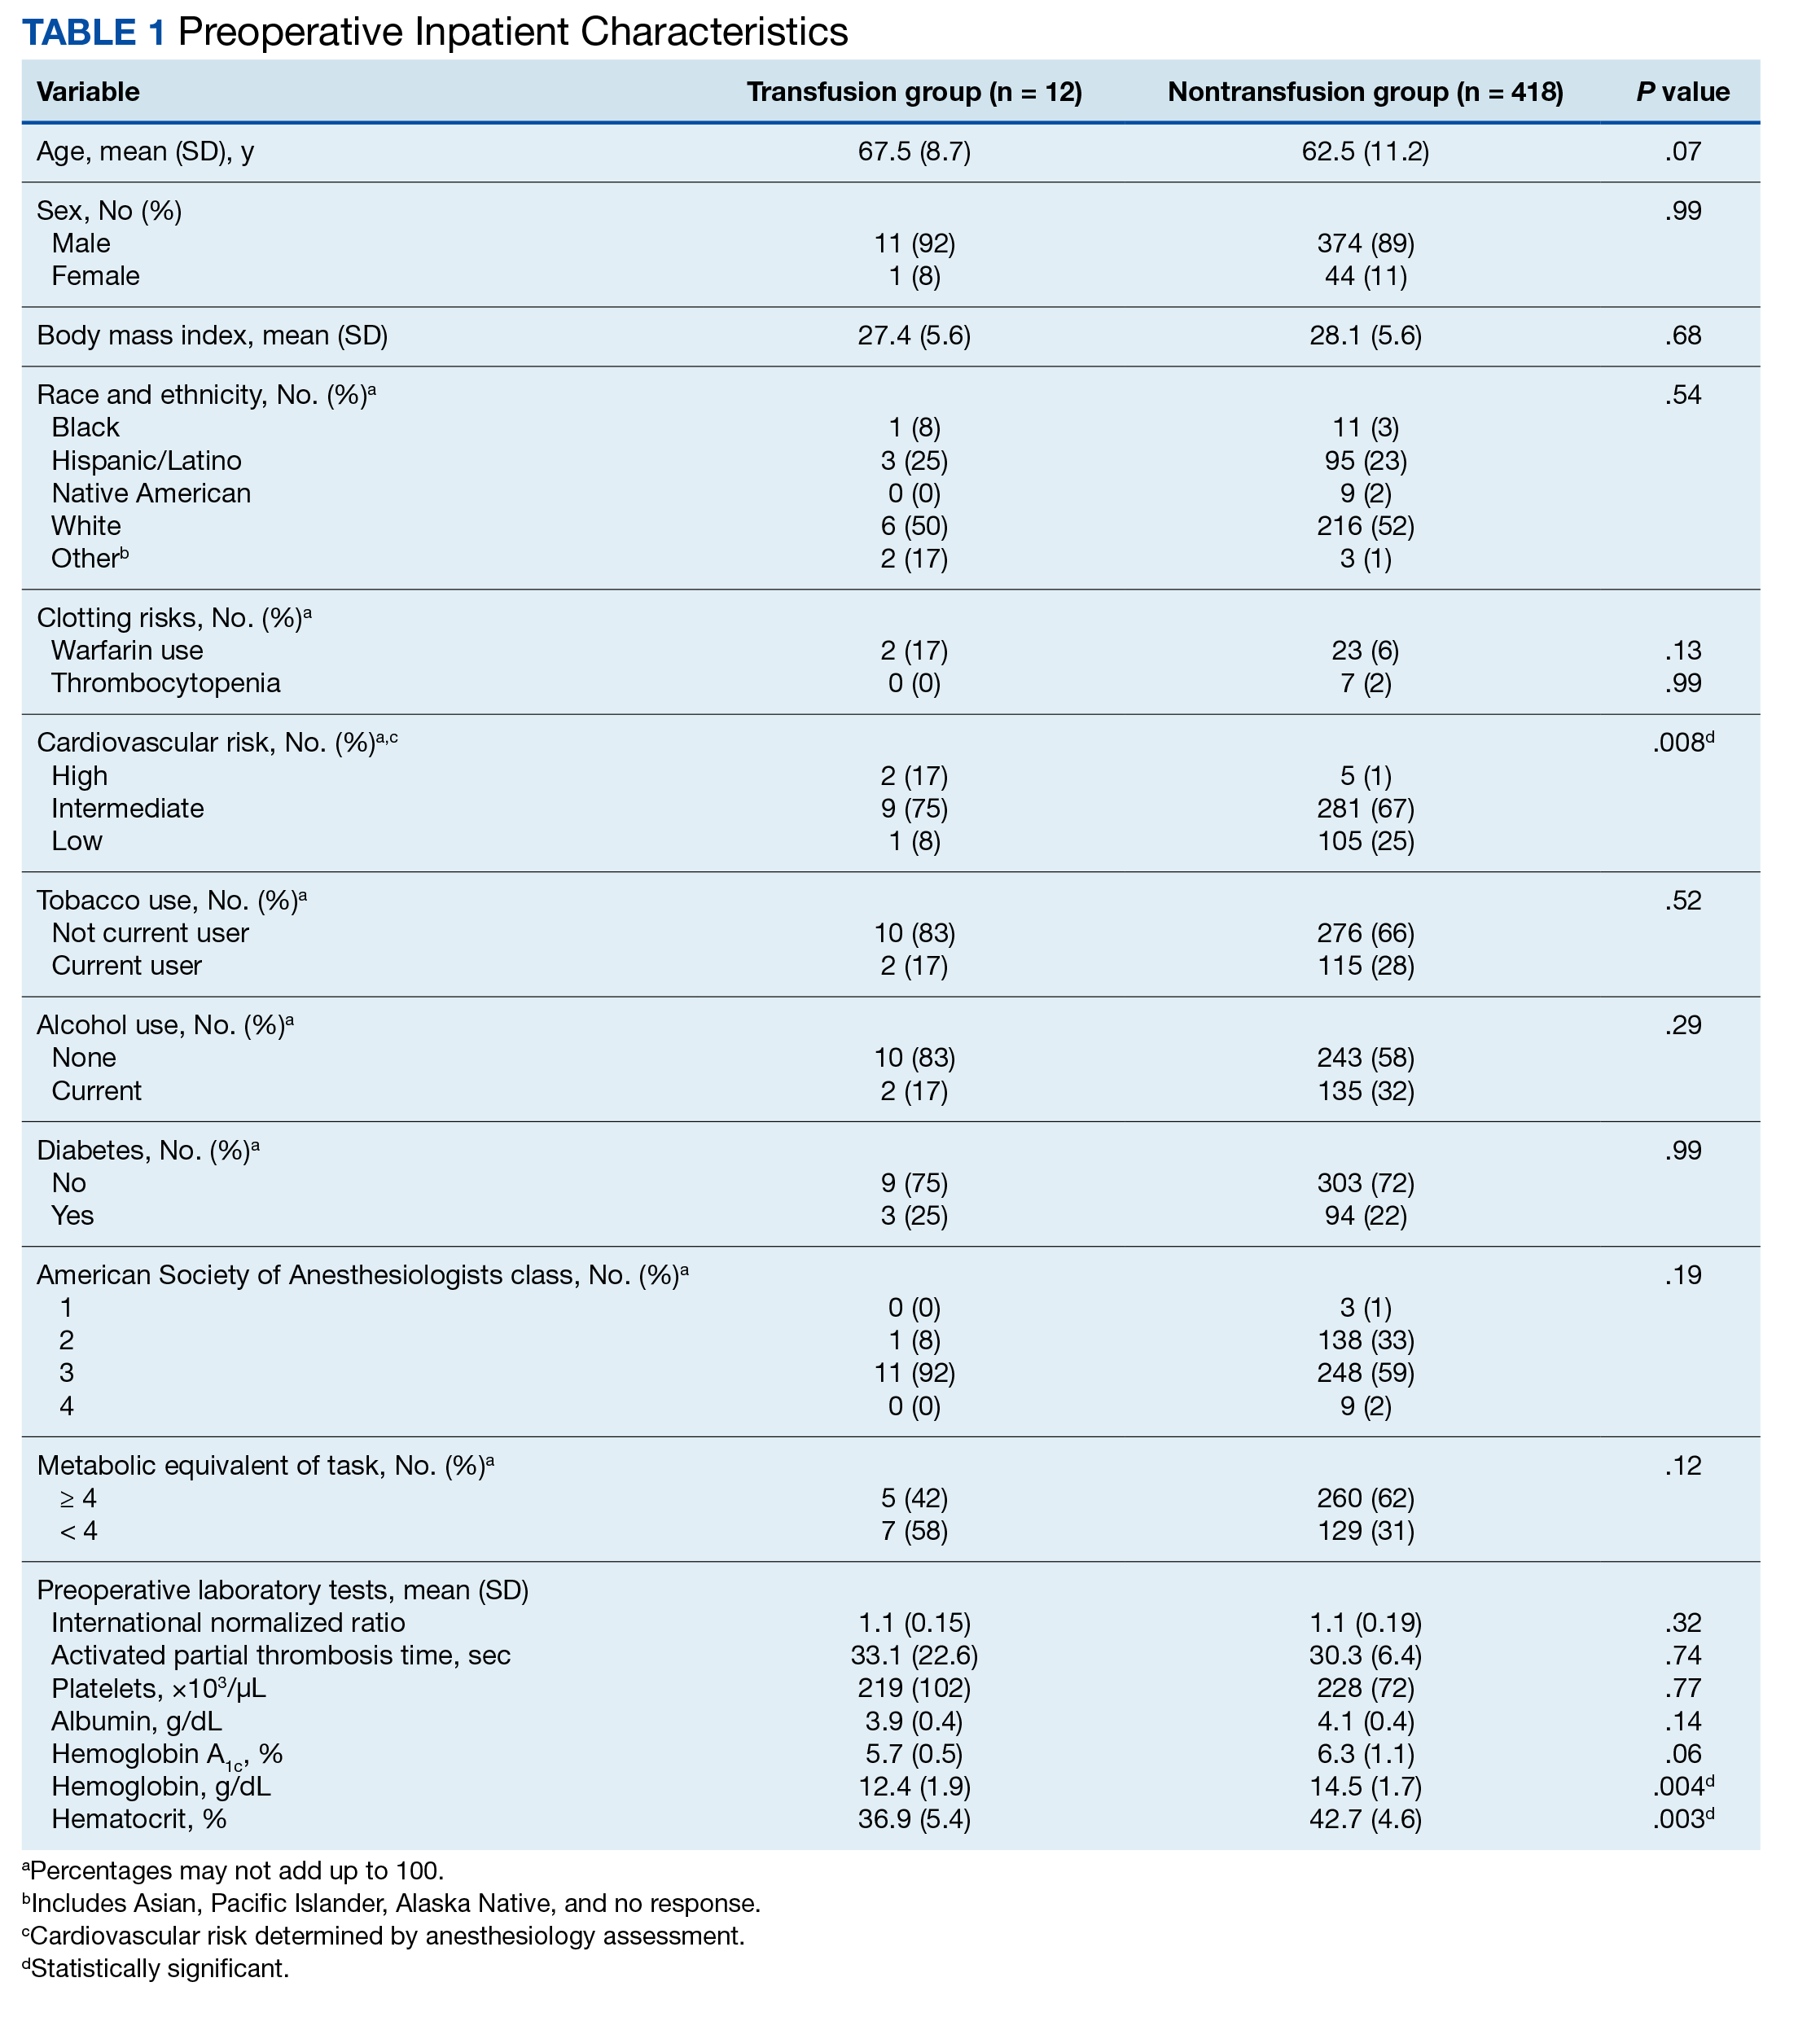
There were 12 transfusions for inpatients (2.8%), which is similar to the findings of a recent study of VA general surgery (2.3%).13 Five of the 12 patients received intraoperative transfusions while 7 were transfused within 72 hours postoperation. All but 1 patient receiving transfusion had EBL > 199 mL (range, 5-3000; mean, 950 mL; median, 500 mL) and/or signs or symptoms of anemia or other indications for measurement of the postoperative hematocrit. There were no statistically significant differences in patients’ age, sex, BMI, or race and ethnicity between groups receiving and not receiving transfusion (Table 1).
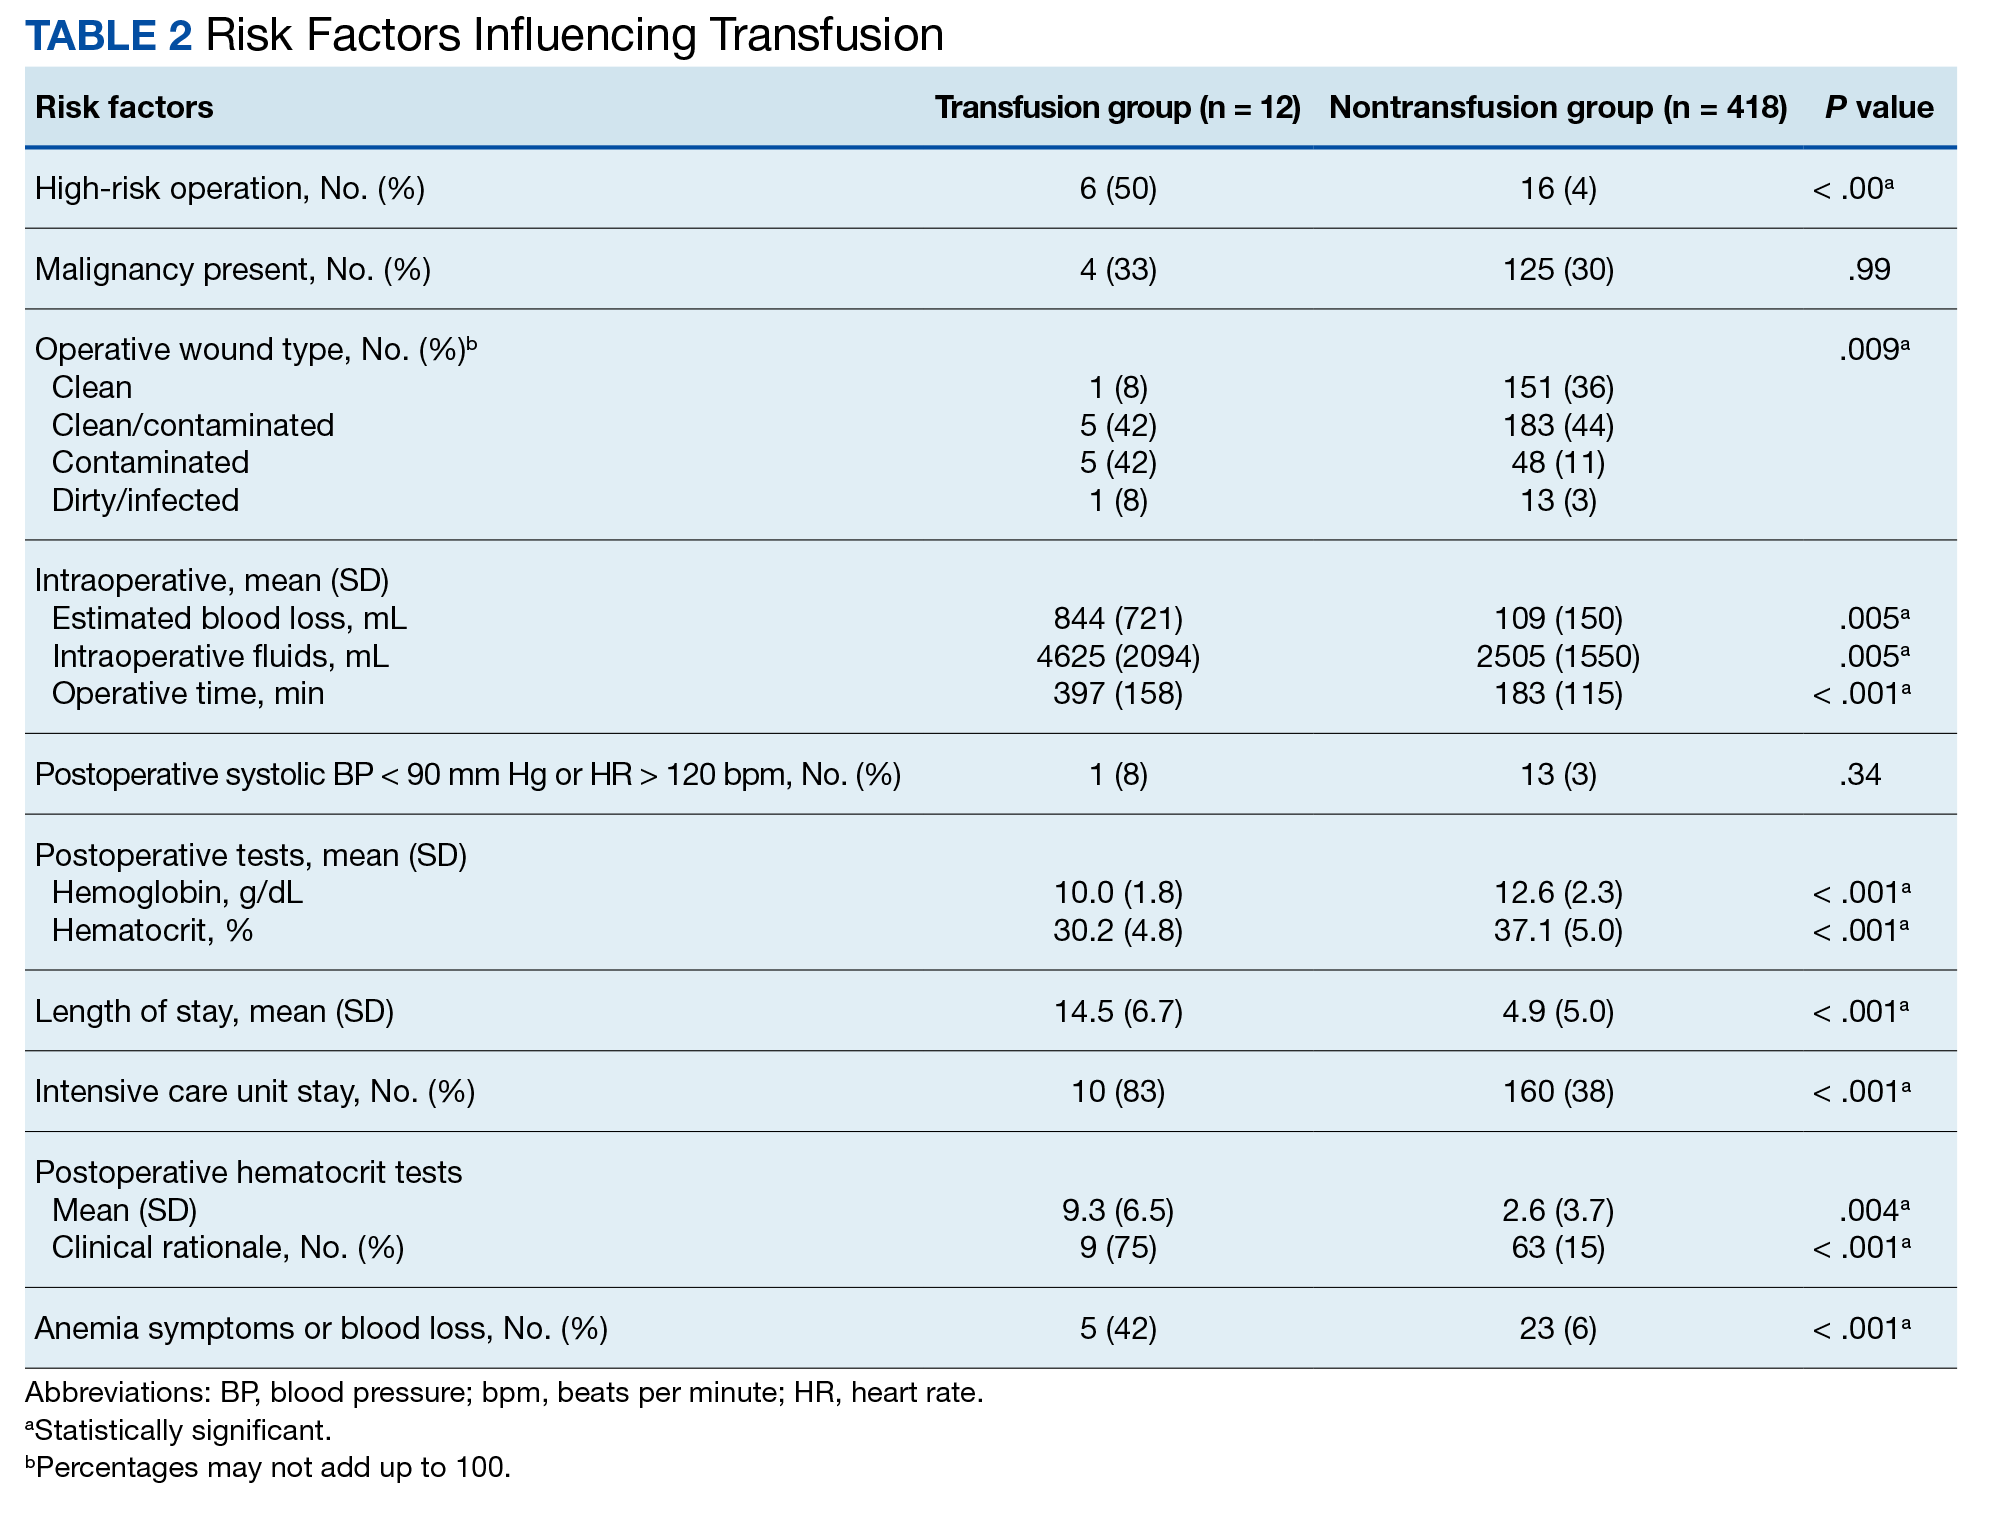
When comparing the transfusion vs the nontransfusion groups (after excluding those with clinical preoperative anemia) the risk factors for transfusion included: relatively low mean preoperative hematocrit (mean, 36.9% vs 42.7%, respectively; P = .003), low postoperative hematocrit (mean, 30.2% vs 37.1%, respectively; P < .001), high EBL (mean, 844 mL vs 109 mL, respectively; P = .005), large infusion of intraoperative fluids (mean, 4625 mL vs 2505 mL, respectively; P = .005), longer duration of operation (mean, 397 min vs 183 min, respectively; P < .001), and longer LOS (mean, 14.5 d vs 4.9 d, respectively; P < .001) (Table 2). Similarly, we found an increased risk for transfusion with high/intermediate cardiovascular risk (vs low), any wound not classified as clean, ICU stay, and postoperative symptoms of anemia.
We found no increased risk for transfusion with ethanol, tobacco, warfarin, or clopidogrel use; polycythemia; thrombocytopenia; preoperative INR; preoperative aPTT; preoperative albumin; Hemoglobin A1c; or diabetes mellitus; or for operations performed for malignancy. Ten patients in the ICU received transfusion (5.8%) compared with 2 patients (0.8%) not admitted to the ICU.
Operations were deemed high risk when ≥ 2 of patients having that operation received transfusions within 72 hours of their operation. There were 15 abdominoperineal resections; 3 of these received transfusions (20%). There were 7 total abdominal colectomies; 3 of these received transfusions (43%). We therefore had 22 high-risk operations, 6 of which were transfused (27%).
Discussion
Routine measurement of postoperative hematocrit levels after elective general surgery at NMVAHCS was not necessary. There were 12 transfusions for inpatients (2.8%), which is similar to the findings of a recent study of VA general surgery (2.3%).13 We found that routine postoperative hematocrit measurements to assess anemia had little or no effect on clinical decision-making or clinical outcomes.
According to our results, 88% of initial hematocrit tests after elective partial colectomies could have been eliminated; only 32 of 146 patients demonstrated a clinical reason for postoperative hematocrit testing. Similarly, 36 of 40 postcholecystectomy hematocrit tests (90%) could have been eliminated had the surgeons relied on clinical signs indicating possible postoperative anemia (none were transfused). Excluding patients with major intraoperative blood loss (> 300 mL), only 29 of 288 (10%) patients who had postoperative hematocrit tests had a clinical indication for a postoperative hematocrit test (ie, symptoms of anemia and/or active bleeding). One patient with inguinal hernia surgery who received transfusion was taking an anticoagulant and had a clinically indicated hematocrit test for a large hematoma that eventually required reoperation.
Our study found that routine hematocrit checks may actually increase the risk that a patient would receive an unnecessary transfusion. For instance, one elderly patient, after a right colectomy, had 6 hematocrit levels while on a heparin drip and received transfusion despite being asymptomatic. His lowest hematocrit level prior to transfusion was 23.7%. This patient had a total of 18 hematocrit tests. His EBL was 350 mL and his first postoperative HCT level was 33.1%. In another instance, a patient undergoing abdominoperineal resection had a transfusion on postoperative day 1, despite being hypertensive, with a hematocrit that ranged from 26% before transfusion to 31% after the transfusion. These 2 cases illustrate what has been shown in a recent study: A substantial number of patients with colorectal cancer receive unnecessary transfusions.14 On the other hand, one ileostomy closure patient had 33 hematocrit tests, yet his initial postoperative hematocrit was 37%, and he never received a transfusion. With low-risk surgeries, clinical judgment should dictate when a postoperative hematocrit level is needed. This strategy would have eliminated 206 unnecessary initial postoperative hematocrit tests (72%), could have decreased the number of unnecessary transfusions, and would have saved NMVAHCS about $1600 annually.
Abdominoperineal resections and total abdominal colectomies accounted for a high proportion of transfusions in our study. Inpatient elective operations can be risk stratified and have routine hematocrit tests ordered for patients at high risk. The probability of transfusion was greater in high-risk vs low-risk surgeries; 27% (6 of 22 patients) vs 2% (6 of 408 patients), respectively (P < .001). Since 14 of the 22 patients undergoing high-risk operation already had clinical reasons for a postoperative hematocrit test, we only need to add the remaining 8 patients with high-risk operations to the 74 who had a clinical reason for a hematocrit test and conclude that 82 of 430 patients (19%) had a clinical reason for a hematocrit test, either from signs or symptoms of blood loss or because they were in a high-risk group.
While our elective general surgery cases may not represent many general surgery programs in the US and VA health care systems, we can extrapolate cost savings using the same cost analyses outlined by Kohli and colleagues.1 Assuming 1.9 million elective inpatient general surgeries per year in the United States with an average cost of $21 per CBC, the annual cost of universal postoperative hematocrit testing would be $40 million.11,15 If postoperative hematocrit testing were 70% consistent with our findings, the annual cost for hematocrit tests on 51% of the inpatient general surgeries would be approximately $20.4 million. A reduction in routine hematocrit testing to 25% of all inpatient general surgeries (vs our finding that 19% were deemed necessary) results in an annual savings of $30 million. This conservative estimate could be even higher since there were 4.4 hematocrit tests per patient; therefore, we have about $132 million in savings.
Assuming 181,384 elective VA inpatient general surgeries each year, costing $7.14 per CBC (the NMVAHCS cost), the VA could save $1.3 million annually. If postoperative HCT testing were 70% consistent with our findings, the annual cost for hematocrit tests on 50.4% of inpatient general surgery operations would be about $653,000. A reduction in routine hematocrit testing to 25% of all inpatient general surgeries (vs our 19%) results in annual VA savings of $330,000. This conservative estimate could be even higher since there were on average 4.4 hematocrit levels per patient; therefore, we estimate that annual savings for the VA of about $1.45 million.
Limitations
The retrospective chart review nature of this study may have led to selection bias. Only a small number of patients received a transfusion, which may have skewed the data. This study population comes from a single VA medical center; this patient population may not be reflective of other VA medical centers or the US population as a whole. Given that NMVAHCS does not perform hepatic, esophageal, pancreas, or transplant operations, the potential savings to both the US and the VA may be overestimated, but this could be studied in the future by VA medical centers that perform more complex operations.
Conclusions
This study found that over a 4-year period routine postoperative hematocrit tests for patients undergoing elective general surgery at a VA medical center were not necessary. General surgeons routinely order various pre- and postoperative laboratory tests despite their limited utility. Reduction in unneeded routine tests could result in notable savings to the VA without compromising quality of care.
Only general surgery patients undergoing operations that carry a high risk for needing a blood transfusion should have a routine postoperative hematocrit testing. In our study population, the chance of an elective colectomy, cholecystectomy, or hernia patient needing a transfusion was rare. This strategy could eliminate a considerable number of unnecessary blood tests and would potentially yield significant savings.
1. Kohli N, Mallipeddi PK, Neff JM, Sze EH, Roat TW. Routine hematocrit after elective gynecologic surgery. Obstet Gynecol. 2000;95(6 Pt 1):847-850. doi:10.1016/s0029-7844(00)00796-1
2. Olus A, Orhan, U, Murat A, et al. Do asymptomatic patients require routine hemoglobin testing following uneventful, unplanned cesarean sections? Arch Gynecol Obstet. 2010;281(2):195-199. doi:10.1007/s00404-009-1093-1
3. Wu XD, Zhu ZL, Xiao P, Liu JC, Wang JW, Huang W. Are routine postoperative laboratory tests necessary after primary total hip arthroplasty? J Arthroplasty. 2020;35(10):2892-2898. doi:10.1016/j.arth.2020.04.097
4. Kumar A, Srivastava U. Role of routine laboratory investigations in preoperative evaluation. J Anesthesiol Clin Pharmacol. 2011;27(2):174-179. doi:10.4103/0970-9185.81824
5. Aghajanian A, Grimes DA. Routine prothrombin time determination before elective gynecologic operations. Obstet Gynecol. 1991;78(5 Pt 1):837-839.
6. Ransom SB, McNeeley SG, Malone JM Jr. A cost-effectiveness evaluation of preoperative type-and-screen testing for vaginal hysterectomy. Am J Obstet Gynecol. 1996;175(5):1201-1203. doi:10.1016/s0002-9378(96)70028-5
7. Ransom SB, McNeeley SG, Hosseini RB. Cost-effectiveness of routine blood type and screen testing before elective laparoscopy. Obstet Gynecol. 1995;86(3):346-348. doi:10.1016/0029-7844(95)00187-V
8. Committee on Standards and Practice Parameters, Apfelbaum JL, Connis RT, et al. Practice advisory for preanesthesia evaluation: an updated report by the American Society of Anesthesiologists Task Force on Preanesthesia Evaluation. Anesthesiology. 2012;116(3):522-538. doi:10.1097/ALN.0b013e31823c1067
9. Weil IA, Seicean S, Neuhauser D, Schiltz NK, Seicean A. Use and utility of hemostatic screening in adults undergoing elective, non-cardiac surgery. PLoS One. 2015;10(12):e0139139. doi:10.1371/journal.pone.0139139
10. Wu WC, Schifftner TL, Henderson WG, et al. Preoperative hematocrit levels and postoperative outcomes in older patients undergoing non-cardiac surgery. JAMA. 2007;297(22):2481-2488. doi:10.1001/jama.297.22.2481
11. Healthcare Bluebook. Complete blood count (CBC) with differential. Accessed March 28, 2024. https://www.healthcarebluebook.com/page_ProcedureDetails.aspx?id=214&dataset=lab
12. Douketis JD, Spyropoulos AC, Murad MH, et al. Perioperative management of antithrombotic therapy: an American College of Chest Physicians Clinical Practice Guideline. Chest. 2022;162(5):e207-e243. doi:10.1016/j.chest.2022.07.025
13. Randall JA, Wagner KT, Brody F. Perioperative transfusions in veterans following noncardiac procedures. J Laparoendosc Adv Surg Tech A. 2023;33(10):923-931. doi:10.1089/lap. 2023.0307
14. Tartter PI, Barron DM. Unnecessary blood transfusions in elective colorectal cancer surgery. Transfusion. 1985;25(2):113-115. doi:10.1046/j.1537-2995.1985.25285169199.x
15. Steiner CA, Karaca Z, Moore BJ, Imshaug MC, Pickens G. Surgeries in hospital-based ambulatory surgery and hospital inpatient settings, 2014. Healthcare Cost and Utilization Project statistical brief #223. May 2017. Revised July 2020. Agency for Healthcare Research and Quality. Accessed February 26, 2024. https://hcup-us.ahrq.gov/reports/statbriefs/sb223-Ambulatory-Inpatient-Surgeries-2014.pdf
16. US Department of Veterans Affairs, National Surgery Office. Quarterly report: Q3 of fiscal year 2017. VISN operative complexity summary [Source not verified].
It is common practice to routinely measure postoperative hematocrit levels at US Department of Veterans Affairs (VA) hospitals for a wide range of elective general surgeries. While hematocrit measurement is a low-cost test, the high frequency with which these tests are performed may drastically increase overall costs.
Numerous studies have suggested that physicians overuse laboratory testing.1-10 Kohli and colleagues recommended that the routine practice of obtaining postoperative hematocrit tests following elective gynecologic surgery be abandoned.1 A similar recommendation was made by Olus and colleagues after studying uneventful, unplanned cesarean sections and by Wu and colleagues after investigating routine laboratory tests post total hip arthroplasty.2,3
To our knowledge, a study assessing routine postoperative hematocrit testing in elective general surgery has not yet been conducted. Many laboratory tests ordered in the perioperative period are not indicated, including complete blood count (CBC), electrolytes, and coagulation studies.4 Based on the results of these studies, we expected that the routine measurement of postoperative hematocrit levels after elective general surgeries at VA medical centers would not be cost effective. A PubMed search for articles published from 1990 to 2023 using the search terms “hematocrit,” “hemoglobin,” “general,” “surgery,” “routine,” and “cost” or “cost-effectiveness,” suggests that the clinical usefulness of postoperative hematocrit testing has not been well studied in the general surgery setting. The purpose of this study was to determine the clinical utility and associated cost of measuring routine postoperative hematocrit levels in order to generate a guide as to when the practice is warranted following common elective general surgery.
Although gynecologic textbooks may describe recommendations of routine hematocrit checking after elective gynecologic operations, one has difficulty finding the same recommendations in general surgery textbooks.1 However, it is common practice for surgical residents and attending surgeons to routinely order hematocrit on postoperative day-1 to ensure that the operation did not result in unsuspected anemia that then would need treatment (either with fluids or a blood transfusion). Many other surgeons rely on clinical factors such as tachycardia, oliguria, or hypotension to trigger a hematocrit (and other laboratory) tests. Our hypothesis is that the latter group has chosen the most cost-effective and prudent practice. One problem with checking the hematocrit routinely, as with any other screening test, is what to do with an abnormal result, assuming an asymptomatic patient? If the postoperative hematocrit is lower than expected given the estimated blood loss (EBL), what is one to do?
Methods
This retrospective case-control study conducted at the New Mexico VA Health Care System (NMVAHCS) in Albuquerque compared data for patients who received transfusion within 72 hours of elective surgeries vs patients who did not. Patients who underwent elective general surgery from January 2011 through December 2014 were included. An elective general surgery was defined as surgery performed following an outpatient preoperative anesthesia evaluation ≥ 30 days prior to operation. Patients who underwent emergency operations, and those with baseline anemia (preoperative hematocrit < 30%), and those transfused > 72 hours after their operation were excluded. The NMVAHCSInstitutional Review Board approved this study (No. 15-H184).
A detailed record review was conducted to collect data on demographics and other preoperative risk factors, including age, sex, body mass index (BMI), race and ethnicity, cardiac and pulmonary comorbidities, tobacco use, alcohol intake, diabetes, American Society of Anesthesiologists Physical Status Classification, metabolic equivalent of task, hematologic conditions, and renal disease.
For each procedure, we recorded the type of elective general surgery performed, the diagnosis/indication, pre- and postoperative hemoglobin/hematocrit, intraoperative EBL, length of operation, surgical wound class, length of hospital stay (LOS), intensive care unit (ICU) status, number of hematocrit tests, cardiovascular risk of operation (defined by anesthesia assessment), presence or absence of malignancy, preoperative platelet count, albumin level, preoperative prothrombin time/activated partial thromboplastin time (aPTT), international normalized ratio (INR), hemoglobin A1c, and incidence of transfusion. Signs and symptoms of anemia were recorded as present if the postoperative vital signs suggested low intravascular volume (pulse > 120 beats/minute, systolic blood pressure < 90 mm Hg, or vasoactive medication requirement [per anesthesia postoperative note]) or if the patient reported or exhibited symptoms of dizziness or fatigue or evidence of clinically apparent bleeding (ie, hematoma formation). Laboratory charges for hematocrit tests and CBC at the NMAVAHCS were used to assess cost.11
To stratify the transfusion risk, patients were distributed among 3 groups based on the following criteria: discharged home the same day as surgery; admitted but did not have postoperative hematocrit testing; and admitted and had postoperative hematocrit testing. We also stratified operations into low or high risk based on the risk for postoperative transfusion (Figure). Recognizing that the American College of Chest Physicians guidelines for perioperative management of antithrombotic therapy places bowel resection in a high-risk category, we designated a surgery as high risk when ≥ 2 patients in the transfusion group had that type of surgery over the 4 years of the study.12 Otherwise, the operations were deemed low risk.
Statistical Analysis
Numeric analysis used t tests and Binary and categorical variables used Fisher exact tests. P value ≤ .05 was considered statistically significant. SAS software was used for all statistical analyses.
Results
From 2011 through 2014, 1531 patients had elective general surgery at NMVAHCS. Twenty-two patients with preoperative anemia (hematocrit < 30%) and 1 patient who received a transfusion > 72 hours after the operation were excluded. Most elective operations (70%, n = 1075) were performed on an outpatient basis; none involved transfusion. Inguinal hernia repair was most common with 479 operations; 17 patients were treated inpatient of which 2 patients had routine postoperative hematocrit checks; (neither received transfusion). One patient with inguinal hernia surgery received transfusion without routine postoperative hematocrit monitoring.
Of 112 partial colon resections, 1 patient had a postoperative transfusion; and all but 3 received postoperative hematocrit monitoring. Nineteen patients undergoing partial colon resection had a clinical indication for postoperative hematocrit monitoring. None of the 5 patients with partial gastrectomy received a postoperative transfusion. Of 121 elective cholecystectomies, no patients had postoperative transfusion, whereas 34 had postoperative hematocrit monitoring; only 2 patients had a clinical reason for the hematocrit monitoring.
Of 430 elective inpatient operations, 12 received transfusions and 288 patients had ≥ 1 postoperative hematocrit test (67%). All hematocrit tests were requested by the attending surgeon, resident surgeon, or the surgical ICU team. Of the group that had postoperative hematocrit monitoring, there was an average of 4.4 postoperative hematocrit tests per patient (range, 1-44).
There were 12 transfusions for inpatients (2.8%), which is similar to the findings of a recent study of VA general surgery (2.3%).13 Five of the 12 patients received intraoperative transfusions while 7 were transfused within 72 hours postoperation. All but 1 patient receiving transfusion had EBL > 199 mL (range, 5-3000; mean, 950 mL; median, 500 mL) and/or signs or symptoms of anemia or other indications for measurement of the postoperative hematocrit. There were no statistically significant differences in patients’ age, sex, BMI, or race and ethnicity between groups receiving and not receiving transfusion (Table 1).
When comparing the transfusion vs the nontransfusion groups (after excluding those with clinical preoperative anemia) the risk factors for transfusion included: relatively low mean preoperative hematocrit (mean, 36.9% vs 42.7%, respectively; P = .003), low postoperative hematocrit (mean, 30.2% vs 37.1%, respectively; P < .001), high EBL (mean, 844 mL vs 109 mL, respectively; P = .005), large infusion of intraoperative fluids (mean, 4625 mL vs 2505 mL, respectively; P = .005), longer duration of operation (mean, 397 min vs 183 min, respectively; P < .001), and longer LOS (mean, 14.5 d vs 4.9 d, respectively; P < .001) (Table 2). Similarly, we found an increased risk for transfusion with high/intermediate cardiovascular risk (vs low), any wound not classified as clean, ICU stay, and postoperative symptoms of anemia.
We found no increased risk for transfusion with ethanol, tobacco, warfarin, or clopidogrel use; polycythemia; thrombocytopenia; preoperative INR; preoperative aPTT; preoperative albumin; Hemoglobin A1c; or diabetes mellitus; or for operations performed for malignancy. Ten patients in the ICU received transfusion (5.8%) compared with 2 patients (0.8%) not admitted to the ICU.
Operations were deemed high risk when ≥ 2 of patients having that operation received transfusions within 72 hours of their operation. There were 15 abdominoperineal resections; 3 of these received transfusions (20%). There were 7 total abdominal colectomies; 3 of these received transfusions (43%). We therefore had 22 high-risk operations, 6 of which were transfused (27%).
Discussion
Routine measurement of postoperative hematocrit levels after elective general surgery at NMVAHCS was not necessary. There were 12 transfusions for inpatients (2.8%), which is similar to the findings of a recent study of VA general surgery (2.3%).13 We found that routine postoperative hematocrit measurements to assess anemia had little or no effect on clinical decision-making or clinical outcomes.
According to our results, 88% of initial hematocrit tests after elective partial colectomies could have been eliminated; only 32 of 146 patients demonstrated a clinical reason for postoperative hematocrit testing. Similarly, 36 of 40 postcholecystectomy hematocrit tests (90%) could have been eliminated had the surgeons relied on clinical signs indicating possible postoperative anemia (none were transfused). Excluding patients with major intraoperative blood loss (> 300 mL), only 29 of 288 (10%) patients who had postoperative hematocrit tests had a clinical indication for a postoperative hematocrit test (ie, symptoms of anemia and/or active bleeding). One patient with inguinal hernia surgery who received transfusion was taking an anticoagulant and had a clinically indicated hematocrit test for a large hematoma that eventually required reoperation.
Our study found that routine hematocrit checks may actually increase the risk that a patient would receive an unnecessary transfusion. For instance, one elderly patient, after a right colectomy, had 6 hematocrit levels while on a heparin drip and received transfusion despite being asymptomatic. His lowest hematocrit level prior to transfusion was 23.7%. This patient had a total of 18 hematocrit tests. His EBL was 350 mL and his first postoperative HCT level was 33.1%. In another instance, a patient undergoing abdominoperineal resection had a transfusion on postoperative day 1, despite being hypertensive, with a hematocrit that ranged from 26% before transfusion to 31% after the transfusion. These 2 cases illustrate what has been shown in a recent study: A substantial number of patients with colorectal cancer receive unnecessary transfusions.14 On the other hand, one ileostomy closure patient had 33 hematocrit tests, yet his initial postoperative hematocrit was 37%, and he never received a transfusion. With low-risk surgeries, clinical judgment should dictate when a postoperative hematocrit level is needed. This strategy would have eliminated 206 unnecessary initial postoperative hematocrit tests (72%), could have decreased the number of unnecessary transfusions, and would have saved NMVAHCS about $1600 annually.
Abdominoperineal resections and total abdominal colectomies accounted for a high proportion of transfusions in our study. Inpatient elective operations can be risk stratified and have routine hematocrit tests ordered for patients at high risk. The probability of transfusion was greater in high-risk vs low-risk surgeries; 27% (6 of 22 patients) vs 2% (6 of 408 patients), respectively (P < .001). Since 14 of the 22 patients undergoing high-risk operation already had clinical reasons for a postoperative hematocrit test, we only need to add the remaining 8 patients with high-risk operations to the 74 who had a clinical reason for a hematocrit test and conclude that 82 of 430 patients (19%) had a clinical reason for a hematocrit test, either from signs or symptoms of blood loss or because they were in a high-risk group.
While our elective general surgery cases may not represent many general surgery programs in the US and VA health care systems, we can extrapolate cost savings using the same cost analyses outlined by Kohli and colleagues.1 Assuming 1.9 million elective inpatient general surgeries per year in the United States with an average cost of $21 per CBC, the annual cost of universal postoperative hematocrit testing would be $40 million.11,15 If postoperative hematocrit testing were 70% consistent with our findings, the annual cost for hematocrit tests on 51% of the inpatient general surgeries would be approximately $20.4 million. A reduction in routine hematocrit testing to 25% of all inpatient general surgeries (vs our finding that 19% were deemed necessary) results in an annual savings of $30 million. This conservative estimate could be even higher since there were 4.4 hematocrit tests per patient; therefore, we have about $132 million in savings.
Assuming 181,384 elective VA inpatient general surgeries each year, costing $7.14 per CBC (the NMVAHCS cost), the VA could save $1.3 million annually. If postoperative HCT testing were 70% consistent with our findings, the annual cost for hematocrit tests on 50.4% of inpatient general surgery operations would be about $653,000. A reduction in routine hematocrit testing to 25% of all inpatient general surgeries (vs our 19%) results in annual VA savings of $330,000. This conservative estimate could be even higher since there were on average 4.4 hematocrit levels per patient; therefore, we estimate that annual savings for the VA of about $1.45 million.
Limitations
The retrospective chart review nature of this study may have led to selection bias. Only a small number of patients received a transfusion, which may have skewed the data. This study population comes from a single VA medical center; this patient population may not be reflective of other VA medical centers or the US population as a whole. Given that NMVAHCS does not perform hepatic, esophageal, pancreas, or transplant operations, the potential savings to both the US and the VA may be overestimated, but this could be studied in the future by VA medical centers that perform more complex operations.
Conclusions
This study found that over a 4-year period routine postoperative hematocrit tests for patients undergoing elective general surgery at a VA medical center were not necessary. General surgeons routinely order various pre- and postoperative laboratory tests despite their limited utility. Reduction in unneeded routine tests could result in notable savings to the VA without compromising quality of care.
Only general surgery patients undergoing operations that carry a high risk for needing a blood transfusion should have a routine postoperative hematocrit testing. In our study population, the chance of an elective colectomy, cholecystectomy, or hernia patient needing a transfusion was rare. This strategy could eliminate a considerable number of unnecessary blood tests and would potentially yield significant savings.
1. Kohli N, Mallipeddi PK, Neff JM, Sze EH, Roat TW. Routine hematocrit after elective gynecologic surgery. Obstet Gynecol. 2000;95(6 Pt 1):847-850. doi:10.1016/s0029-7844(00)00796-1
2. Olus A, Orhan, U, Murat A, et al. Do asymptomatic patients require routine hemoglobin testing following uneventful, unplanned cesarean sections? Arch Gynecol Obstet. 2010;281(2):195-199. doi:10.1007/s00404-009-1093-1
3. Wu XD, Zhu ZL, Xiao P, Liu JC, Wang JW, Huang W. Are routine postoperative laboratory tests necessary after primary total hip arthroplasty? J Arthroplasty. 2020;35(10):2892-2898. doi:10.1016/j.arth.2020.04.097
4. Kumar A, Srivastava U. Role of routine laboratory investigations in preoperative evaluation. J Anesthesiol Clin Pharmacol. 2011;27(2):174-179. doi:10.4103/0970-9185.81824
5. Aghajanian A, Grimes DA. Routine prothrombin time determination before elective gynecologic operations. Obstet Gynecol. 1991;78(5 Pt 1):837-839.
6. Ransom SB, McNeeley SG, Malone JM Jr. A cost-effectiveness evaluation of preoperative type-and-screen testing for vaginal hysterectomy. Am J Obstet Gynecol. 1996;175(5):1201-1203. doi:10.1016/s0002-9378(96)70028-5
7. Ransom SB, McNeeley SG, Hosseini RB. Cost-effectiveness of routine blood type and screen testing before elective laparoscopy. Obstet Gynecol. 1995;86(3):346-348. doi:10.1016/0029-7844(95)00187-V
8. Committee on Standards and Practice Parameters, Apfelbaum JL, Connis RT, et al. Practice advisory for preanesthesia evaluation: an updated report by the American Society of Anesthesiologists Task Force on Preanesthesia Evaluation. Anesthesiology. 2012;116(3):522-538. doi:10.1097/ALN.0b013e31823c1067
9. Weil IA, Seicean S, Neuhauser D, Schiltz NK, Seicean A. Use and utility of hemostatic screening in adults undergoing elective, non-cardiac surgery. PLoS One. 2015;10(12):e0139139. doi:10.1371/journal.pone.0139139
10. Wu WC, Schifftner TL, Henderson WG, et al. Preoperative hematocrit levels and postoperative outcomes in older patients undergoing non-cardiac surgery. JAMA. 2007;297(22):2481-2488. doi:10.1001/jama.297.22.2481
11. Healthcare Bluebook. Complete blood count (CBC) with differential. Accessed March 28, 2024. https://www.healthcarebluebook.com/page_ProcedureDetails.aspx?id=214&dataset=lab
12. Douketis JD, Spyropoulos AC, Murad MH, et al. Perioperative management of antithrombotic therapy: an American College of Chest Physicians Clinical Practice Guideline. Chest. 2022;162(5):e207-e243. doi:10.1016/j.chest.2022.07.025
13. Randall JA, Wagner KT, Brody F. Perioperative transfusions in veterans following noncardiac procedures. J Laparoendosc Adv Surg Tech A. 2023;33(10):923-931. doi:10.1089/lap. 2023.0307
14. Tartter PI, Barron DM. Unnecessary blood transfusions in elective colorectal cancer surgery. Transfusion. 1985;25(2):113-115. doi:10.1046/j.1537-2995.1985.25285169199.x
15. Steiner CA, Karaca Z, Moore BJ, Imshaug MC, Pickens G. Surgeries in hospital-based ambulatory surgery and hospital inpatient settings, 2014. Healthcare Cost and Utilization Project statistical brief #223. May 2017. Revised July 2020. Agency for Healthcare Research and Quality. Accessed February 26, 2024. https://hcup-us.ahrq.gov/reports/statbriefs/sb223-Ambulatory-Inpatient-Surgeries-2014.pdf
16. US Department of Veterans Affairs, National Surgery Office. Quarterly report: Q3 of fiscal year 2017. VISN operative complexity summary [Source not verified].
Oxidative Stress in Patients With Melasma: An Evaluation of the Correlation of the Thiol/Disulfide Homeostasis Parameters and Modified MASI Score
Melasma is an acquired hyperpigmentation disorder characterized by irregular brown macules and patches that usually appear on sun-exposed areas of the skin. The term melasma originates from the Greek word melas meaning black.1 Facial melasma is divided into 2 groups according to its clinical distribution: centrofacial lesions are located in the center of the face (eg, the glabellar, frontal, nasal, zygomatic, upper lip, chin areas), and peripheral lesions manifest on the frontotemporal, preauricular, and mandibular regions.1,2 There is debate on the categorization of zygomatic (or malar) melasma; some researchers argue it should be categorized independent of other areas, while others include malar melasma in the centrofacial group because of its frequent association with the centrofacial type, especially with glabellar lesions.2 Mandibular melasma is rare and occurs mostly in postmenopausal women after intense sun exposure.1,2 Although the etiopathogenesis of the disease is not clearly known, increased melanogenesis, extracellular matrix alterations, inflammation, and angiogenesis are assumed to play a role.3 Various risk factors such as genetic predisposition, UV radiation (UVR) exposure, pregnancy, thyroid dysfunction, and exogenous hormones (eg, oral contraceptives, hormone replacement therapy) have been identified; phototoxic drugs, anticonvulsants, and some cosmetics also have been implicated.4,5 Exposure to UVR is thought to be the main triggering environmental factor by inducing both melanin production and oxidative stress.5 However, it also has been shown that visible light can induce hyperpigmentation in darker skin types.6
The presence of oxidative stress in melasma recently has become an intriguing topic of interest. First, the presence of oxidative stress in the etiopathogenesis of melasma was thought to be based on the effectiveness of antioxidants in treatment. A few studies also have confirmed the presence of oxidative stress in melasma.7-10 Classically, oxidative stress can be described as a disturbance in the balance between oxidants and antioxidants. Reactive oxygen species (ROS) are highly reactive molecules due to the unpaired electrons in their structure. Although ROS are present at low levels in physiologic conditions and are involved in critical physiologic events, they damage cellular components such as fat, protein, and nucleic acid at high concentrations.5
Dynamic thiol/disulfide homeostasis is one of the most important markers of oxidative stress in biological systems. Thiols are organic compounds containing a sulfhydryl (-SH) group. Thiols are considered highly potent antioxidants because they reduce unstable free radicals by donating electrons. They are the first antioxidants to be depleted in an oxidative environment.11,12 In case of oxidative stress, they transform into reversible forms called disulfide bridges between 2 thiol groups. Disulfide bridges can be reduced back to thiol groups, which is how dynamic thiol/disulfide homeostasis is maintained. Dynamic thiol/disulfide homeostasis is responsible for cellular events such as antioxidant defense, signal transduction, regulation of enzyme function, and apoptosis.11,12
The aim of this study was to evaluate the presence of oxidative stress in melasma by comparing dynamic thiol/disulfide homeostasis in patients with melasma compared with age- and sex-matched healthy controls.
Materials and Methods
Participants and Eligibility Criteria—We conducted a prospective study in a tertiary-care hospital (Ankara Bilkent City Hospital [Ankara, Turkey]) of patients with melasma who were followed from October 2021 to October 2022 compared with age- and sex-matched healthy volunteers. Ethics committee approval was obtained from Ankara Bilkent City Hospital before the study (E2-21-881)(13.10.2021). Written informed consent was obtained from all participants, and all were older than 18 years. Patients were excluded if there was the presence of any systemic disease or dermatologic disease other than melasma; smoking or alcohol use; any use of vitamins, food supplements, or any medication in the last 3 months; or pregnancy.
Melasma Severity—The modified melasma area and severity index (mMASI) score was used to determine the severity of melasma. The score is calculated from assessments of the darkness of the pigmentation and the percentage of affected area on the face. The mMASI score is the sum of the darkness score (D); area score (A); and separate fixed coefficients for the forehead, as well as the right malar, left malar, and chin regions.13 The mMASI score, with a range of 0 to 24, is a reliable and objective marker in the calculation of melasma severity.4
Biochemical Analysis of Samples—The 6-cc peripheral fasting venous blood samples obtained from the study participants were centrifuged at 1500 g for 10 minutes, and the separated sera were stored in a freezer at −80 °C until the time of analysis. When the study was completed, the disulfide and thiol values were analyzed. Serum native and total thiol concentrations indicating thiol/disulfide homeostasis were calculated by a new fully automatic colorimetric method developed by Erel and Neselioglu.14 Using this method, short disulfide bonds are first reduced with sodium borohydride solution to form free-functional thiol groups, and then the unused sodium borohydride is removed using formaldehyde. Finally, all thiol groups are reacted with 5,5’-dithiobis-(2-nitrobenzoic) acid (Ellman reagent), and all thiol groups are detected after reaction with 5,5’-dithiobis-(2-nitrobenzoic) acid. When a disulfide bond (−S−S−) is reduced, 2 thiol groups are formed. For this reason, half of the difference between total thiol (-SH + the amount of thiol formed by the reduction of disulfides) and native thiol (-SH) corresponds to the dynamic disulfide amount (total thiol − native thiol/2).14
Statistical Analysis—Statistical analysis was performed using SPSS software (version 24.0). Descriptive statistics were presented as numbers and percentages for categorical variables, and numerical variables were presented as mean, SD, median, minimum, maximum, 25th quartile, and 75th quartile. The conformity of the variables to normal distribution was examined using visual (histograms and probability plots) and analytical methods (Kolmogorov-Smirnov/Shapiro-Wilk tests). In pairwise group comparisons for numerical variables, a Mann-Whitney U test was used when normal distribution was not met, and a t test was used when normal distribution was met. The statistical significance level was accepted as P<.05.
Results
Our study included 67 patients with melasma and 41 healthy age- and sex-matched controls. Of the participants with melasma, 60 (89.5%) were female and 7 (10.5%) were male. The control group was similar to the melasma group in terms of sex (87.8% female vs 12.2% male [P=.59]). The mean age (SD) was 33.1 (6.7) years in the melasma group and 31.9 (6.7) years in the control group. Age was similar across both groups (P=.41). All participants were of Asian race, and Fitzpatrick skin types (types II–IV) were similar across both groups.
Fifty-four (80.6%) participants had centrofacial melasma and 13 (19.4%) had mixed-type melasma. The mMASI score ranged from 3 to 20; the mean (SD) mMASI score was 11.28 (3.2). Disease duration ranged from 2 to 72 months; the mean (SD) disease duration was 12.26 (6.3) months. The demographics and clinical characteristics of the study group are shown in eTable 1.
eTable 2 provides a summary of disulfide, native thiol, and total thiol levels, as well as disulfide/native thiol, disulfide/total thiol, and native thiol/total thiol ratios in the study population. Disulfide/native thiol and disulfide/total thiol ratios were higher in melasma patients (Figure 1), whereas the native thiol/total thiol ratio was higher in the control group (P=.025, P=.025, and P=.026, respectively).
All correlations between age, disease duration, and mMASI scores and disulfide, native thiol, and total thiol levels, as well as disulfide/native thiol, disulfide/total thiol, and native thiol/total thiol ratios, are summarized in eTable 3. No significant correlation was observed between age and disease duration and disulfide, native thiol, and total thiol levels or disulfide/native thiol, disulfide/total thiol, and native thiol/total thiol ratios.
We independently assessed whether Fitzpatrick skin types II, III, and IV exhibited distinct levels of oxidative stress in clinical melasma. There were no significant correlations with Fitzpatrick skin type (disulfide/native thiol, P=.25; disulfide/total thiol, P=.19). We further evaluated if the thiol/disulfide parameters were correlated with duration of melasma by dividing the melasma patients into 3 groups (<6 months [n=12], 6–18 months [n=32], >18 months [n=23]), but there was not any significant correlation (disulfide/native thiol, P=.15; disulfide/total thiol, P=.15). We also divided our patients into 3 groups according to age (<27 years [n=14], 27–36 years [n=33], >36 years [n=20]). There was no correlation of the parameters with age (disulfide/native thiol, P=.15; disulfide/total thiol, P=.14).
There was a positive correlation between mMASI score and disulfide, native thiol, and total thiol levels and disulfide/native thiol and disulfide/total thiol ratios, as well as a negative correlation between mMASI score and native thiol/total thiol ratio. The correlations between mMASI scores and disulfide/native thiol and disulfide/total thiol ratios are shown in Figure 2 and eTable 3.
Comment
Melasma is a common condition that may cause psychosocial problems in affected patients and negatively affect quality of life.1 It occurs in all races but is more common in individuals with darker skin types (eg, Fitzpatrick skin types III and IV). Although melasma is more common in women during reproductive years (50%–70%), it also has been observed in 10% to 30% of men.5
Treatment options include topical bleaching agents, chemical peels, and laser therapy, as well as discontinuation of medications that may potentially trigger melasma; use of broad-spectrum sunscreens also is recommended.4 Vitamins A, C, and E, as well as niacinamide, are used in the treatment of melasma, especially for their antioxidant properties. The key role of antioxidants in the treatment of melasma supports the importance of oxidative stress in the pathogenesis.7 Melasma often is challenging to treat, particularly the mixed or dermal types, due to their stubborn nature. This condition poses a considerable therapeutic challenge for dermatologists.4
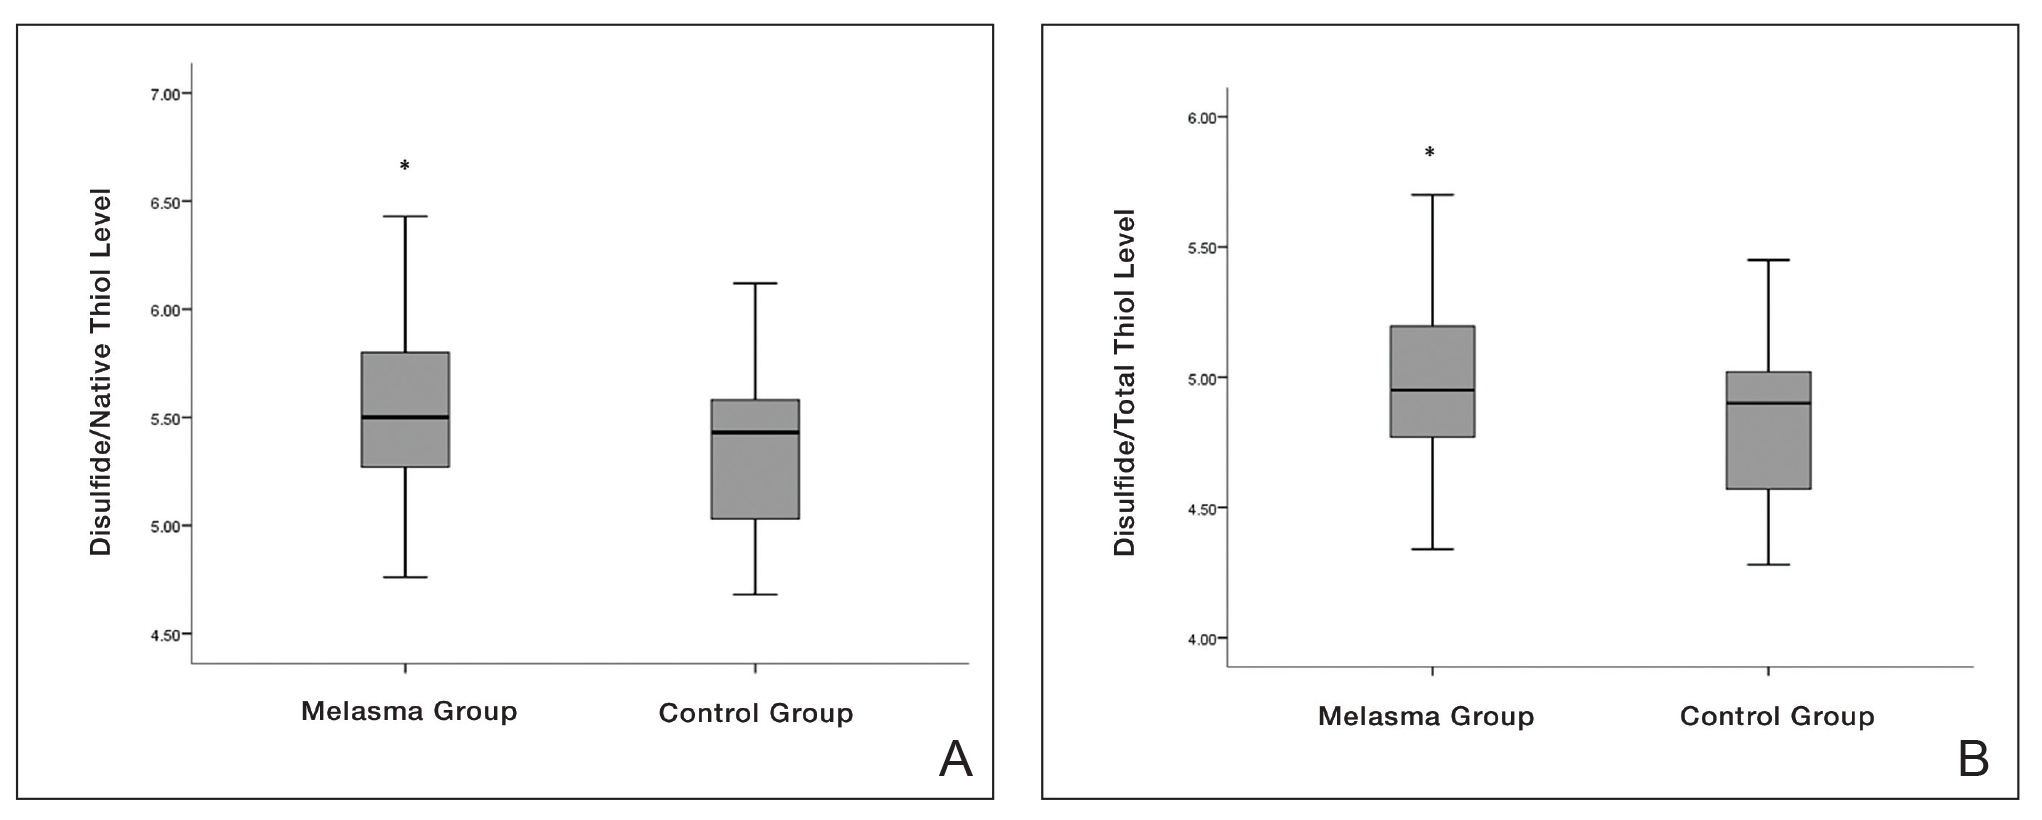

Oxidative stress and oxidant-antioxidant imbalance previously have been studied in various diseases, but research investigating the presence of oxidative stress in melasma are limited.7-10 Exposure of the skin to polluted air and intense UVR, as well as some food by-products, cosmetics, and drugs (eg, oral contraceptives), can directly or indirectly cause ROS production in the skin. Reactive oxygen species are thought to be involved in the pathophysiology of melasma by affecting apoptotic pathways and causing cell proliferation. The intermediate heme pathway has pro-oxidant effects and produces ROS and metabolites such as redox-active quinines. Exposure to UVR leads to the generation of ROS, highlighting the role of oxidative stress in the onset of melasma. 5
In any cutaneous disease in which oxidative stress plays a role, oxidant and antioxidant levels may be expected to vary both locally and systemically; however, measurement of oxidative stress markers in serum instead of skin is technically and economically more advantageous.8 Firstly, serum collection is less invasive and technically simpler than skin biopsies. Drawing blood is a routine procedure that requires minimal specialized equipment and training compared to the extraction and processing of skin samples. Secondly, analyzing serum samples generally is less expensive than processing skin tissue.8
In our study, we evaluated dynamic thiol/disulfide homeostasis in serum to investigate the presence of oxidative stress in the setting of melasma. Functional sulfhydryl (-SH) groups in thiols act as substrates for antioxidant enzymes and as free-radical scavengers. They constitute one of the most powerful defense systems against the unwanted effects of ROS. Thiols, which become the main target of ROS under oxidative stress, oxidize with oxidant molecules and form disulfide bridges.15
Thiol/disulfide homeostasis has been studied many times in dermatologic diseases,16-19 and the results obtained from these studies are heterogenous depending on the extent of oxidative damage. It has been shown that thiol/disulfide homeostasis plays a role in oxidative stress in conditions such as psoriasis,17 seborrheic dermatitis,11 atopic dermatitits,18 and rosacea.19 In our study, disulfide/native thiol and disulfide/total thiol levels were significantly higher (both P=.025) in the melasma group compared with the control group, which indicates that the thiol/disulfide balance in patients with melasma is shifted to disulfide formation and thiols are oxidized to disulfide bonds in the presence of oxidative stress.
Seçkin et al7 evaluated the role of oxidative stress in the pathogenesis of melasma and found that the serum levels of the antioxidants superoxide dismutase and glutathione peroxidase were significantly higher in the patient group compared with the control group (both P<.001). They also found that the levels of nitric oxide (another antioxidant) were increased in the patient group and the levels of protein carbonyl (an oxidative metabolite) were significantly lower (both P<.001). These findings indicated that free-radical damage may be involved in the pathogenesis of melasma
In a study of 75 patients with melasma, serum levels of the antioxidants melatonin and catalase were significantly (P<.001 and P=.001, respectively) lower in the melasma group compared with the control group, while serum levels of the oxidants protein carbonyl and nitric oxide were significantly higher (P=.002 and P=.001, respectively). No significant correlation was found between oxidative stress parameters and melasma severity.8
Choubey et al9 found that serum malondialdehyde (an end product of lipid peroxidation), superoxide dismutase, and glutathione peroxidase levels were significantly higher in the melasma group (n=50) compared with the control group (n=50)(all P<.001). In addition, a significant positive correlation (correlation coefficient, +0.307; P<.05) was found between serum malondialdehyde levels and melasma severity. The mean age (SD) of the patients was 32.22 (6.377) years, and the female (n=41) to male (n=9) ratio was 4.55:1. The most common melasma pattern was centrofacial, followed by malar.9
In a study with 50 melasma patients and 50 controls, Rahimi et al10 examined bilirubin and uric acid levels, which are major extracellular antioxidants. The mean age (SD) at disease onset was 32.6 (6.7) years, and the mean MASI score (SD) was 18.1 (9). Serum bilirubin levels were found to be higher in the melasma group than in the control group and were correlated with disease severity. No significant difference in uric acid levels was found between the groups, and no correlation was found between MASI score and bilirubin and uric acid levels.10
In our study, the melasma group was similar to those in other reportsin the literature regarding gender distribution, mean age, and melasma pattern.7-10 Additionally, the correlation of mMASI score with disulfide/native thiol and disulfide/total thiol values in the melasma group suggested that oxidative stress also is correlated with melasma severity.
Thiol-based treatments such as n-acetyl cysteine, which contains a thiol compound, may be helpful in melasma.20 In a double-blind, placebo-controlled study, topical n-acetyl cysteine combined with hydroquinone 2% was used in 10 female patients with melasma. Mild to strong bleaching of the skin was observed in 90% (9/10) of the patients.21 Systemic use of n-acetyl cysteine in melasma also may be a potential research topic.
Major limitations of our study were the small sample size and lack of measurement of oxidative stress parameters in the skin concurrently with serum.
Conclusion
In our study, the presence of oxidative stress in melasma was demonstrated by evaluating thiol/disulfide homeostasis—one of the strongest markers of oxidative stress. Oxidative stress also correlated with melasma disease severity in our analysis. The data obtained in this study may contribute to understanding the etiopathogenesis of melasma and may open new horizons in treatment; however, more comprehensive studies should be conducted to support our findings.
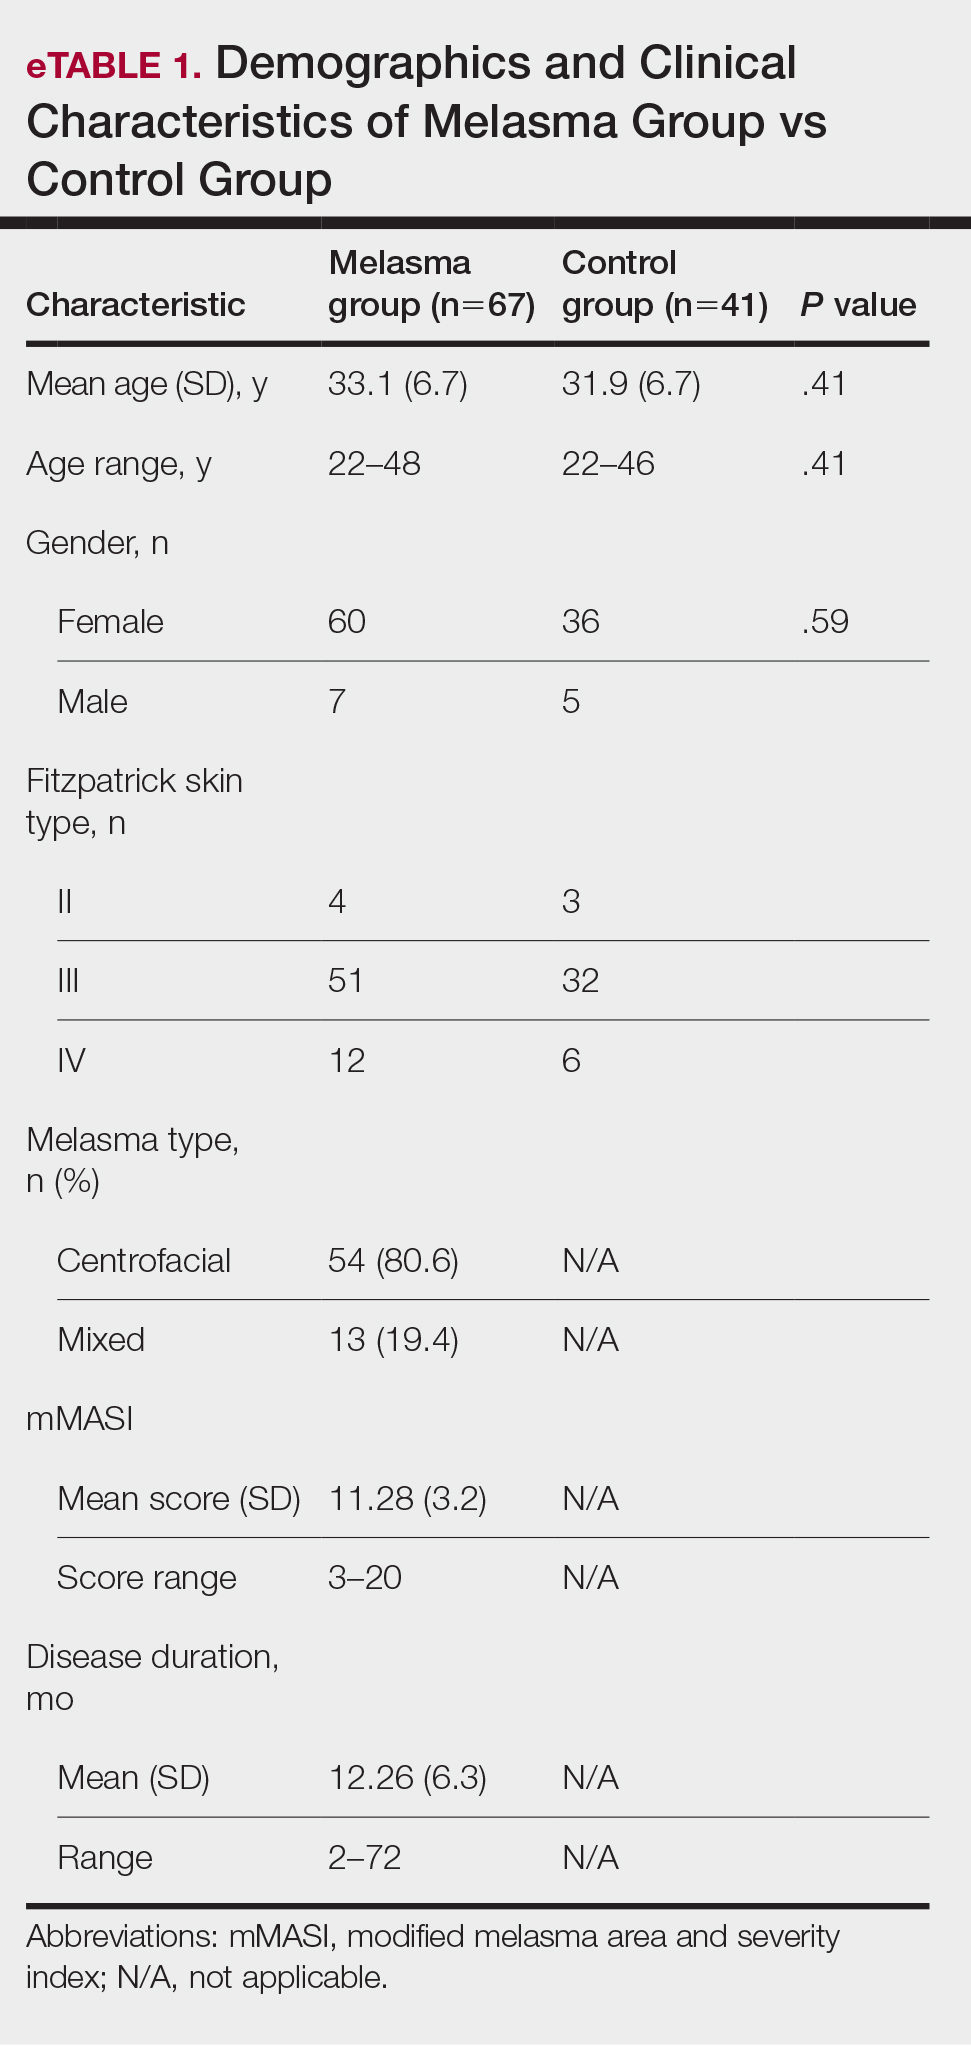

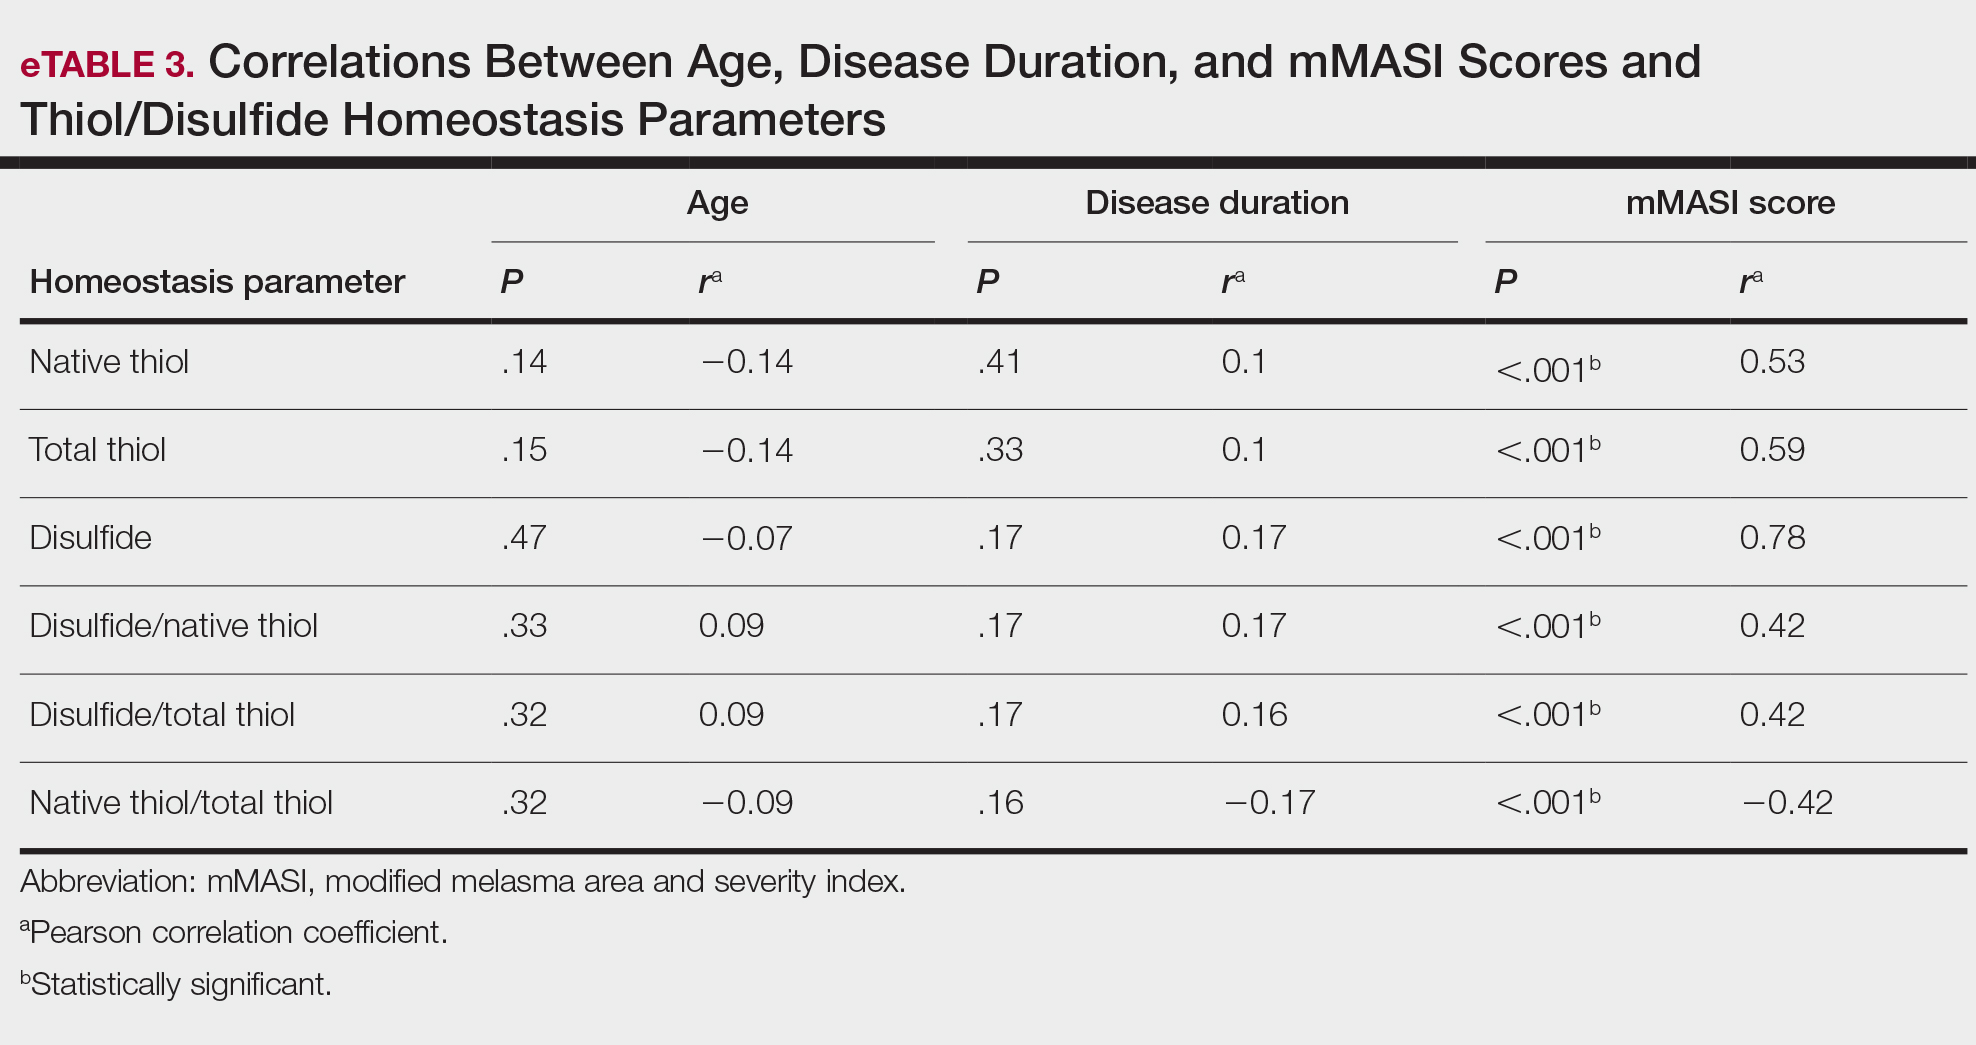
- Handel AC, Miot LD, Miot HA. Melasma: a clinical and epidemiological review. An Bras Dermatol. 2014;89:771-782.
- Tamega Ade A, Miot LD, Bonfietti C, et al. Clinical patterns and epidemiological characteristics of facial melasma in Brazilian women. J Eur Acad Dermatol Venereol. 2013;27:151-156.
- Rajanala S, Maymone MBC, Vashi NA. Melasma pathogenesis: a review of the latest research, pathological findings, and investigational therapies. Dermatol Online J. 2019;25:13030/qt47b7r28c.
- Abou-Taleb DA, Ibrahim AK, Youssef EM, et al. Reliability, validity, and sensitivity to change overtime of the modified melasma area and severity index score. Dermatol Surg. 2017;43:210-217.
- Katiyar S, Yadav D. Correlation of oxidative stress with melasma: an overview. Curr Pharm Des. 2022;28:225-231.
- Mahmoud BH, Ruvolo E, Hexsel CL, et al. Impact of long-wavelength UVA and visible light on melanocompetent skin. J Invest Dermatol. 2010;130:2092-2097.
- Seçkin HY, Kalkan G, Bas¸ Y, et al. Oxidative stress status in patients with melasma. Cutan Ocul Toxicol. 2014;33:212-217.
- Sarkar R, Devadasan S, Choubey V, et al. Melatonin and oxidative stress in melasma—an unexplored territory; a prospective study. Int J Dermatol. 2020;59:572-575.
- Choubey V, Sarkar R, Garg V, et al. Role of oxidative stress in melasma: a prospective study on serum and blood markers of oxidative stress in melasma patients. Int J Dermatol. 2017;56:939-943.
- Rahimi H, Mirnezami M, Yazdabadi A. Bilirubin as a new antioxidant in melasma. J Cosmet Dermatol. 2022;21:5800-5803.
- Emre S, Kalkan G, Erdog˘an S, et al. Dynamic thiol/disulfide balance in patients with seborrheic dermatitis: a case-control study. Saudi J Med Med Sci. 2020;8:12-16.
- Erel Ö, Erdog˘an S. Thiol-disulfide homeostasis: an integrated approach with biochemical and clinical aspects. Turk J Med Sci. 2020;50:1728-1738.
- Pandya AG, Hynan LS, Bhore R, et al. Reliability assessment and validation of the Melasma Area and Severity Index (MASI) and a new modified MASI scoring method. J Am Acad Dermatol. 2011;64:78-83, 83.E1-E2.
- Erel O, Neselioglu S. A novel and automated assay for thiol/disulphide homeostasis. Clin Biochem. 2014;47:326-332.
- Guzelcicek A, Cakirca G, Erel O, et al. Assessment of thiol/disulfide balance as an oxidative stress marker in children with β-thalassemia major. Pak J Med Sci. 2019;35:161-165.
- Georgescu SR, Mitran CI, Mitran MI, et al. Thiol-Disulfide homeostasis in skin diseases. J Clin Med. 2022;11:1507.
- Üstüner P, Balevi A, Özdemir M, et al. The role of thiol/disulfide homeostasis in psoriasis: can it be a new marker for inflammation? Turk Arch Dermatol Venereol. 2018;52:120-125.
- Karacan G, Ercan N, Bostanci I, et al. A novel oxidative stress marker of atopic dermatitis in infants: Thiol–disulfide balance. Arch Dermatol Res. 2020;312:697-703.
- Demir Pektas S, Cinar N, Pektas G, et al. Thiol/disulfide homeostasis and its relationship with insulin resistance in patients with rosacea. J Cosmet Dermatol. 2021;11:14477.
- Adil M, Amin SS, Mohtashim M. N-acetylcysteine in dermatology. Indian J Dermatol Venereol Leprol. 2018;84:652-659.
- Njoo MD, Menke HE, Pavel W, et al. N-acetylcysteine as a bleaching agent in the treatment of melasma. J Eur Acad Dermatol Venereol. 1997;9:86-87.
Melasma is an acquired hyperpigmentation disorder characterized by irregular brown macules and patches that usually appear on sun-exposed areas of the skin. The term melasma originates from the Greek word melas meaning black.1 Facial melasma is divided into 2 groups according to its clinical distribution: centrofacial lesions are located in the center of the face (eg, the glabellar, frontal, nasal, zygomatic, upper lip, chin areas), and peripheral lesions manifest on the frontotemporal, preauricular, and mandibular regions.1,2 There is debate on the categorization of zygomatic (or malar) melasma; some researchers argue it should be categorized independent of other areas, while others include malar melasma in the centrofacial group because of its frequent association with the centrofacial type, especially with glabellar lesions.2 Mandibular melasma is rare and occurs mostly in postmenopausal women after intense sun exposure.1,2 Although the etiopathogenesis of the disease is not clearly known, increased melanogenesis, extracellular matrix alterations, inflammation, and angiogenesis are assumed to play a role.3 Various risk factors such as genetic predisposition, UV radiation (UVR) exposure, pregnancy, thyroid dysfunction, and exogenous hormones (eg, oral contraceptives, hormone replacement therapy) have been identified; phototoxic drugs, anticonvulsants, and some cosmetics also have been implicated.4,5 Exposure to UVR is thought to be the main triggering environmental factor by inducing both melanin production and oxidative stress.5 However, it also has been shown that visible light can induce hyperpigmentation in darker skin types.6
The presence of oxidative stress in melasma recently has become an intriguing topic of interest. First, the presence of oxidative stress in the etiopathogenesis of melasma was thought to be based on the effectiveness of antioxidants in treatment. A few studies also have confirmed the presence of oxidative stress in melasma.7-10 Classically, oxidative stress can be described as a disturbance in the balance between oxidants and antioxidants. Reactive oxygen species (ROS) are highly reactive molecules due to the unpaired electrons in their structure. Although ROS are present at low levels in physiologic conditions and are involved in critical physiologic events, they damage cellular components such as fat, protein, and nucleic acid at high concentrations.5
Dynamic thiol/disulfide homeostasis is one of the most important markers of oxidative stress in biological systems. Thiols are organic compounds containing a sulfhydryl (-SH) group. Thiols are considered highly potent antioxidants because they reduce unstable free radicals by donating electrons. They are the first antioxidants to be depleted in an oxidative environment.11,12 In case of oxidative stress, they transform into reversible forms called disulfide bridges between 2 thiol groups. Disulfide bridges can be reduced back to thiol groups, which is how dynamic thiol/disulfide homeostasis is maintained. Dynamic thiol/disulfide homeostasis is responsible for cellular events such as antioxidant defense, signal transduction, regulation of enzyme function, and apoptosis.11,12
The aim of this study was to evaluate the presence of oxidative stress in melasma by comparing dynamic thiol/disulfide homeostasis in patients with melasma compared with age- and sex-matched healthy controls.
Materials and Methods
Participants and Eligibility Criteria—We conducted a prospective study in a tertiary-care hospital (Ankara Bilkent City Hospital [Ankara, Turkey]) of patients with melasma who were followed from October 2021 to October 2022 compared with age- and sex-matched healthy volunteers. Ethics committee approval was obtained from Ankara Bilkent City Hospital before the study (E2-21-881)(13.10.2021). Written informed consent was obtained from all participants, and all were older than 18 years. Patients were excluded if there was the presence of any systemic disease or dermatologic disease other than melasma; smoking or alcohol use; any use of vitamins, food supplements, or any medication in the last 3 months; or pregnancy.
Melasma Severity—The modified melasma area and severity index (mMASI) score was used to determine the severity of melasma. The score is calculated from assessments of the darkness of the pigmentation and the percentage of affected area on the face. The mMASI score is the sum of the darkness score (D); area score (A); and separate fixed coefficients for the forehead, as well as the right malar, left malar, and chin regions.13 The mMASI score, with a range of 0 to 24, is a reliable and objective marker in the calculation of melasma severity.4
Biochemical Analysis of Samples—The 6-cc peripheral fasting venous blood samples obtained from the study participants were centrifuged at 1500 g for 10 minutes, and the separated sera were stored in a freezer at −80 °C until the time of analysis. When the study was completed, the disulfide and thiol values were analyzed. Serum native and total thiol concentrations indicating thiol/disulfide homeostasis were calculated by a new fully automatic colorimetric method developed by Erel and Neselioglu.14 Using this method, short disulfide bonds are first reduced with sodium borohydride solution to form free-functional thiol groups, and then the unused sodium borohydride is removed using formaldehyde. Finally, all thiol groups are reacted with 5,5’-dithiobis-(2-nitrobenzoic) acid (Ellman reagent), and all thiol groups are detected after reaction with 5,5’-dithiobis-(2-nitrobenzoic) acid. When a disulfide bond (−S−S−) is reduced, 2 thiol groups are formed. For this reason, half of the difference between total thiol (-SH + the amount of thiol formed by the reduction of disulfides) and native thiol (-SH) corresponds to the dynamic disulfide amount (total thiol − native thiol/2).14
Statistical Analysis—Statistical analysis was performed using SPSS software (version 24.0). Descriptive statistics were presented as numbers and percentages for categorical variables, and numerical variables were presented as mean, SD, median, minimum, maximum, 25th quartile, and 75th quartile. The conformity of the variables to normal distribution was examined using visual (histograms and probability plots) and analytical methods (Kolmogorov-Smirnov/Shapiro-Wilk tests). In pairwise group comparisons for numerical variables, a Mann-Whitney U test was used when normal distribution was not met, and a t test was used when normal distribution was met. The statistical significance level was accepted as P<.05.
Results
Our study included 67 patients with melasma and 41 healthy age- and sex-matched controls. Of the participants with melasma, 60 (89.5%) were female and 7 (10.5%) were male. The control group was similar to the melasma group in terms of sex (87.8% female vs 12.2% male [P=.59]). The mean age (SD) was 33.1 (6.7) years in the melasma group and 31.9 (6.7) years in the control group. Age was similar across both groups (P=.41). All participants were of Asian race, and Fitzpatrick skin types (types II–IV) were similar across both groups.
Fifty-four (80.6%) participants had centrofacial melasma and 13 (19.4%) had mixed-type melasma. The mMASI score ranged from 3 to 20; the mean (SD) mMASI score was 11.28 (3.2). Disease duration ranged from 2 to 72 months; the mean (SD) disease duration was 12.26 (6.3) months. The demographics and clinical characteristics of the study group are shown in eTable 1.
eTable 2 provides a summary of disulfide, native thiol, and total thiol levels, as well as disulfide/native thiol, disulfide/total thiol, and native thiol/total thiol ratios in the study population. Disulfide/native thiol and disulfide/total thiol ratios were higher in melasma patients (Figure 1), whereas the native thiol/total thiol ratio was higher in the control group (P=.025, P=.025, and P=.026, respectively).
All correlations between age, disease duration, and mMASI scores and disulfide, native thiol, and total thiol levels, as well as disulfide/native thiol, disulfide/total thiol, and native thiol/total thiol ratios, are summarized in eTable 3. No significant correlation was observed between age and disease duration and disulfide, native thiol, and total thiol levels or disulfide/native thiol, disulfide/total thiol, and native thiol/total thiol ratios.
We independently assessed whether Fitzpatrick skin types II, III, and IV exhibited distinct levels of oxidative stress in clinical melasma. There were no significant correlations with Fitzpatrick skin type (disulfide/native thiol, P=.25; disulfide/total thiol, P=.19). We further evaluated if the thiol/disulfide parameters were correlated with duration of melasma by dividing the melasma patients into 3 groups (<6 months [n=12], 6–18 months [n=32], >18 months [n=23]), but there was not any significant correlation (disulfide/native thiol, P=.15; disulfide/total thiol, P=.15). We also divided our patients into 3 groups according to age (<27 years [n=14], 27–36 years [n=33], >36 years [n=20]). There was no correlation of the parameters with age (disulfide/native thiol, P=.15; disulfide/total thiol, P=.14).
There was a positive correlation between mMASI score and disulfide, native thiol, and total thiol levels and disulfide/native thiol and disulfide/total thiol ratios, as well as a negative correlation between mMASI score and native thiol/total thiol ratio. The correlations between mMASI scores and disulfide/native thiol and disulfide/total thiol ratios are shown in Figure 2 and eTable 3.
Comment
Melasma is a common condition that may cause psychosocial problems in affected patients and negatively affect quality of life.1 It occurs in all races but is more common in individuals with darker skin types (eg, Fitzpatrick skin types III and IV). Although melasma is more common in women during reproductive years (50%–70%), it also has been observed in 10% to 30% of men.5
Treatment options include topical bleaching agents, chemical peels, and laser therapy, as well as discontinuation of medications that may potentially trigger melasma; use of broad-spectrum sunscreens also is recommended.4 Vitamins A, C, and E, as well as niacinamide, are used in the treatment of melasma, especially for their antioxidant properties. The key role of antioxidants in the treatment of melasma supports the importance of oxidative stress in the pathogenesis.7 Melasma often is challenging to treat, particularly the mixed or dermal types, due to their stubborn nature. This condition poses a considerable therapeutic challenge for dermatologists.4
Oxidative stress and oxidant-antioxidant imbalance previously have been studied in various diseases, but research investigating the presence of oxidative stress in melasma are limited.7-10 Exposure of the skin to polluted air and intense UVR, as well as some food by-products, cosmetics, and drugs (eg, oral contraceptives), can directly or indirectly cause ROS production in the skin. Reactive oxygen species are thought to be involved in the pathophysiology of melasma by affecting apoptotic pathways and causing cell proliferation. The intermediate heme pathway has pro-oxidant effects and produces ROS and metabolites such as redox-active quinines. Exposure to UVR leads to the generation of ROS, highlighting the role of oxidative stress in the onset of melasma. 5
In any cutaneous disease in which oxidative stress plays a role, oxidant and antioxidant levels may be expected to vary both locally and systemically; however, measurement of oxidative stress markers in serum instead of skin is technically and economically more advantageous.8 Firstly, serum collection is less invasive and technically simpler than skin biopsies. Drawing blood is a routine procedure that requires minimal specialized equipment and training compared to the extraction and processing of skin samples. Secondly, analyzing serum samples generally is less expensive than processing skin tissue.8
In our study, we evaluated dynamic thiol/disulfide homeostasis in serum to investigate the presence of oxidative stress in the setting of melasma. Functional sulfhydryl (-SH) groups in thiols act as substrates for antioxidant enzymes and as free-radical scavengers. They constitute one of the most powerful defense systems against the unwanted effects of ROS. Thiols, which become the main target of ROS under oxidative stress, oxidize with oxidant molecules and form disulfide bridges.15
Thiol/disulfide homeostasis has been studied many times in dermatologic diseases,16-19 and the results obtained from these studies are heterogenous depending on the extent of oxidative damage. It has been shown that thiol/disulfide homeostasis plays a role in oxidative stress in conditions such as psoriasis,17 seborrheic dermatitis,11 atopic dermatitits,18 and rosacea.19 In our study, disulfide/native thiol and disulfide/total thiol levels were significantly higher (both P=.025) in the melasma group compared with the control group, which indicates that the thiol/disulfide balance in patients with melasma is shifted to disulfide formation and thiols are oxidized to disulfide bonds in the presence of oxidative stress.
Seçkin et al7 evaluated the role of oxidative stress in the pathogenesis of melasma and found that the serum levels of the antioxidants superoxide dismutase and glutathione peroxidase were significantly higher in the patient group compared with the control group (both P<.001). They also found that the levels of nitric oxide (another antioxidant) were increased in the patient group and the levels of protein carbonyl (an oxidative metabolite) were significantly lower (both P<.001). These findings indicated that free-radical damage may be involved in the pathogenesis of melasma
In a study of 75 patients with melasma, serum levels of the antioxidants melatonin and catalase were significantly (P<.001 and P=.001, respectively) lower in the melasma group compared with the control group, while serum levels of the oxidants protein carbonyl and nitric oxide were significantly higher (P=.002 and P=.001, respectively). No significant correlation was found between oxidative stress parameters and melasma severity.8
Choubey et al9 found that serum malondialdehyde (an end product of lipid peroxidation), superoxide dismutase, and glutathione peroxidase levels were significantly higher in the melasma group (n=50) compared with the control group (n=50)(all P<.001). In addition, a significant positive correlation (correlation coefficient, +0.307; P<.05) was found between serum malondialdehyde levels and melasma severity. The mean age (SD) of the patients was 32.22 (6.377) years, and the female (n=41) to male (n=9) ratio was 4.55:1. The most common melasma pattern was centrofacial, followed by malar.9
In a study with 50 melasma patients and 50 controls, Rahimi et al10 examined bilirubin and uric acid levels, which are major extracellular antioxidants. The mean age (SD) at disease onset was 32.6 (6.7) years, and the mean MASI score (SD) was 18.1 (9). Serum bilirubin levels were found to be higher in the melasma group than in the control group and were correlated with disease severity. No significant difference in uric acid levels was found between the groups, and no correlation was found between MASI score and bilirubin and uric acid levels.10
In our study, the melasma group was similar to those in other reportsin the literature regarding gender distribution, mean age, and melasma pattern.7-10 Additionally, the correlation of mMASI score with disulfide/native thiol and disulfide/total thiol values in the melasma group suggested that oxidative stress also is correlated with melasma severity.
Thiol-based treatments such as n-acetyl cysteine, which contains a thiol compound, may be helpful in melasma.20 In a double-blind, placebo-controlled study, topical n-acetyl cysteine combined with hydroquinone 2% was used in 10 female patients with melasma. Mild to strong bleaching of the skin was observed in 90% (9/10) of the patients.21 Systemic use of n-acetyl cysteine in melasma also may be a potential research topic.
Major limitations of our study were the small sample size and lack of measurement of oxidative stress parameters in the skin concurrently with serum.
Conclusion
In our study, the presence of oxidative stress in melasma was demonstrated by evaluating thiol/disulfide homeostasis—one of the strongest markers of oxidative stress. Oxidative stress also correlated with melasma disease severity in our analysis. The data obtained in this study may contribute to understanding the etiopathogenesis of melasma and may open new horizons in treatment; however, more comprehensive studies should be conducted to support our findings.
- Handel AC, Miot LD, Miot HA. Melasma: a clinical and epidemiological review. An Bras Dermatol. 2014;89:771-782.
- Tamega Ade A, Miot LD, Bonfietti C, et al. Clinical patterns and epidemiological characteristics of facial melasma in Brazilian women. J Eur Acad Dermatol Venereol. 2013;27:151-156.
- Rajanala S, Maymone MBC, Vashi NA. Melasma pathogenesis: a review of the latest research, pathological findings, and investigational therapies. Dermatol Online J. 2019;25:13030/qt47b7r28c.
- Abou-Taleb DA, Ibrahim AK, Youssef EM, et al. Reliability, validity, and sensitivity to change overtime of the modified melasma area and severity index score. Dermatol Surg. 2017;43:210-217.
- Katiyar S, Yadav D. Correlation of oxidative stress with melasma: an overview. Curr Pharm Des. 2022;28:225-231.
- Mahmoud BH, Ruvolo E, Hexsel CL, et al. Impact of long-wavelength UVA and visible light on melanocompetent skin. J Invest Dermatol. 2010;130:2092-2097.
- Seçkin HY, Kalkan G, Bas¸ Y, et al. Oxidative stress status in patients with melasma. Cutan Ocul Toxicol. 2014;33:212-217.
- Sarkar R, Devadasan S, Choubey V, et al. Melatonin and oxidative stress in melasma—an unexplored territory; a prospective study. Int J Dermatol. 2020;59:572-575.
- Choubey V, Sarkar R, Garg V, et al. Role of oxidative stress in melasma: a prospective study on serum and blood markers of oxidative stress in melasma patients. Int J Dermatol. 2017;56:939-943.
- Rahimi H, Mirnezami M, Yazdabadi A. Bilirubin as a new antioxidant in melasma. J Cosmet Dermatol. 2022;21:5800-5803.
- Emre S, Kalkan G, Erdog˘an S, et al. Dynamic thiol/disulfide balance in patients with seborrheic dermatitis: a case-control study. Saudi J Med Med Sci. 2020;8:12-16.
- Erel Ö, Erdog˘an S. Thiol-disulfide homeostasis: an integrated approach with biochemical and clinical aspects. Turk J Med Sci. 2020;50:1728-1738.
- Pandya AG, Hynan LS, Bhore R, et al. Reliability assessment and validation of the Melasma Area and Severity Index (MASI) and a new modified MASI scoring method. J Am Acad Dermatol. 2011;64:78-83, 83.E1-E2.
- Erel O, Neselioglu S. A novel and automated assay for thiol/disulphide homeostasis. Clin Biochem. 2014;47:326-332.
- Guzelcicek A, Cakirca G, Erel O, et al. Assessment of thiol/disulfide balance as an oxidative stress marker in children with β-thalassemia major. Pak J Med Sci. 2019;35:161-165.
- Georgescu SR, Mitran CI, Mitran MI, et al. Thiol-Disulfide homeostasis in skin diseases. J Clin Med. 2022;11:1507.
- Üstüner P, Balevi A, Özdemir M, et al. The role of thiol/disulfide homeostasis in psoriasis: can it be a new marker for inflammation? Turk Arch Dermatol Venereol. 2018;52:120-125.
- Karacan G, Ercan N, Bostanci I, et al. A novel oxidative stress marker of atopic dermatitis in infants: Thiol–disulfide balance. Arch Dermatol Res. 2020;312:697-703.
- Demir Pektas S, Cinar N, Pektas G, et al. Thiol/disulfide homeostasis and its relationship with insulin resistance in patients with rosacea. J Cosmet Dermatol. 2021;11:14477.
- Adil M, Amin SS, Mohtashim M. N-acetylcysteine in dermatology. Indian J Dermatol Venereol Leprol. 2018;84:652-659.
- Njoo MD, Menke HE, Pavel W, et al. N-acetylcysteine as a bleaching agent in the treatment of melasma. J Eur Acad Dermatol Venereol. 1997;9:86-87.
Practice Points
- Melasma is a common pigmentation disorder that causes brown or grayish patches on the skin.
- Disulfide/native thiol and disulfide/total thiol ratios were higher in patients with melasma compared with controls, which indicated the presence of oxidative stress in melasma.
- The evaluation of modified melasma area and severity index score with disulfide/native thiol and disulfide/total thiol values suggests that oxidative stress is correlated with melasma disease severity.
Small Fiber Neuropathy in Veterans With Gulf War Illness
Following deployment to operations Desert Shield and Desert Storm (Gulf War) in 1990 and 1991, many Gulf War veterans (GWVs) developed chronic, complex symptoms, including pain, dyscognition, and fatigue, with gastrointestinal, skin, and respiratory manifestations. This Gulf War Illness (GWI) is reported to affect about 30% of those deployed. More than 30 years later, there is no consensus as to the etiology of GWI, although some deployment-related exposures have been implicated.1
Accepted research definitions for GWI include the Centers for Disease Control and Prevention and Kansas definitions.2 The US Department of Veterans Affairs (VA) uses the terminology chronic multisymptom illness (CMI), which is an overarching diagnosis under which GWI falls. Although there is no consensus case definition for CMI, there is overlap with conditions such as fibromyalgia, myalgic encephalomyelitis/chronic fatigue syndrome, and irritable bowel syndrome; the VA considers these as qualifying clinical diagnoses.3 The pathophysiology of GWI is also unknown, though a frequently reported unifying feature is that of autonomic nervous system (ANS) dysfunction. Studies have demonstrated differences between veterans with GWI and those without GWI in both the reporting of symptoms attributable to ANS dysfunction and in physiologic evaluations of the ANS.4-10
Small fiber neuropathy (SFN), a condition with damage to the A-δ and C small nerve fibers, has been proposed as a potential mechanism for the pain and ANS dysfunction experienced in GWI.11-13 Symptoms of SFN are similar to those of GWI, with pain and ANS symptoms commonly reported.14,15 There are multiple diagnostic criteria for SFN, the most commonly used requiring the presence of appropriate symptoms in the absence of large fiber neuropathy and a skin biopsy demonstrating reduced intraepidermal nerve fiber density.16-19 Several conditions reportedly cause SFN, most notably diabetes/prediabetes. Autoimmune disease, vitamin B12 deficiency, monoclonal gammopathies, celiac disease, paraneoplastic syndromes, and sodium channel gene mutations may also contribute to SFN.20 Hyperlipidemia has been identified as a contributor, although it has been variably reported.21,22
Idiopathic neuropathies, SFN included, may be secondary to neurotoxicant exposures. Agents whose exposure or consumption have been associated with SFN include alcohol most prominently, but also the organic solvent n-hexane, heavy metals, and excess vitamin B6.20,23-25 Agents associated with large fiber neuropathy may also have relevance for SFN, as small fibers have been likened to the “canary in the coal mine” in that they may be more susceptible to neurotoxicants and are affected earlier in the disease process.26 In this way, SFN may be the harbinger of large fiber neuropathy in some cases. Of specific relevance for GWVs, organophosphates and carbamates are known to produce a delayed onset large fiber neuropathy.27-30 Exposure to petrochemical solvents has also been associated with large fiber neuropathies.31,32
The War Related Illness and Injury Study Center (WRIISC) is a clinical, research, and education center established by Congress in 2001. Its primary focus is on military exposures and postdeployment health of veterans. It is located at 3 sites: East Orange, New Jersey; Washington, DC; and Palo Alto, California. The New Jersey WRIISC began a program to evaluate GWVs with characteristic symptoms for possible SFN with use of a skin biopsy.
We hypothesize that SFN may underly much of GWI symptomatology and may not be accounted for by the putative etiologies detailed in review of the medical literature. This retrospective review of clinical evaluations for SFN in GWVs who sought care at the New Jersey WRIISC explored and addressed the following questions: (1) how common is biopsy-confirmed SFN in veterans with GWI; (2) do veterans with GWI and SFN report more symptoms attributable to ANS dysfunction when compared with veterans with GWI and no SFN; and (3) can SFN in veterans with GWI and SFN be explained by conditions and substances commonly associated with SFN? Institutional review board approval and waiver of consent was obtained from the Veterans Affairs New Jersey Health Care Center for the study.
Methods
A retrospective chart review was conducted on veterans evaluated at the WRIISC from March 1, 2015, to January 31, 2019. Inclusion criteria were: deployment to operations Desert Shield and Desert Storm between August 2, 1990, and February 28, 1991, and skin biopsy conducted at the WRIISC. Skin biopsies were obtained at the discretion of an examining clinician based on clinical indications, including neuropathic pain, ANS symptoms, and/or a fibromyalgia/chronic pain–type presentation.
Electronic health record review explicitly abstracted GWI status, results of the skin biopsy, and ANS symptom burden as determined by the Composite Autonomic Symptom Scale 31 (COMPASS 31) completed at the time of the WRIISC evaluation.
COMPASS 31 assesses symptoms across 6 domains (orthostatic, vasomotor, secretomotor, gastrointestinal, bladder, andpupillomotor). Patients are asked about symptom frequency (rarely to almost always), severity (mild to severe), and improvement (much worse to completely gone). Individual domain scores and a total weighted score (0-100) have demonstrated good validity, reliability, and consistency in SFN.33,34

In veterans with GWI and documented SFN, a health record review was performed to identify potential etiologies for SFN (Appendix).
Statistical Analysis
Microsoft Excel and IBM SPSS 12.0.1 for Windows were used for data collection and statistical analysis. Fisher exact test was used for comparing the prevalence of SFN in veterans with GWI vs without GWI. The independent samples t test was used for comparing COMPASS 31 scores for veterans with GWI by SFN status. α < .05 was used for determining statistical significance. For those GWVs documented with SFN and GWI, potential explanations were documented in total and by condition.
Results


From March 1, 2015, to January 31, 2019, 141 GWVs received a comprehensive in person clinical evaluation at the WRIISC and 51 veterans (36%) received a skin biopsy and were included in this retrospective observational study (Figure). The mean age was 48.6 years, and the majority were male and served in the US Army. Skin biopsies met clinical criteria for GWI for 42 (82%) and 24 of 42 (57%) were determined to have SFN. Four of 9 (44%) veterans without GWI had positive SFN biopsies, though this difference was not statistically significant (Table 1). Veterans with SFN but no GWI were not included in the further analysis.

Thirty-five veterans with GWI—18 with SFN and 17 without SFN—completed the COMPASS 31 (Table 2). COMPASS 31 data were not analyzed for veterans without GWI. Individual domain scores and the difference in COMPASS 31 scores for veterans with GWI and SFN vs GWI and no SFN (38.3 vs 37.8, respectively) were not statistically significant.

Sixteen of 24 veterans with GWI and SFN (67%) had ≥ 1 conditions that could potentially be responsible for SFN (Table 3), including 11 veterans (46%) with prediabetes/diabetes. Hyperlipidemia is only variably reported as a cause of SFN; when included, 19 of 24 (79%) SFN cases were accounted for. We could not identify a medical explanation for SFN in 5 of 24 veterans (21%) with GWI, which were deemed to be idiopathic.
Discussion
Biopsy-confirmed SFN was present in more than half of our sample of veterans with GWI, which is broadly consistent with what has been reported in the literature.13,35-38 In this clinical observation study, SFN was similarly prevalent in veterans with and without GWI; although it should be noted that biopsies only were obtained when there was a strong clinical suspicion for SFN. Almost half of patients with GWI did not have SFN, so our study does not support SFN as the underlying explanation for all GWI. Although our data cannot provide clinical guidance as to when skin biopsy may be indicated in GWI, work done in fibromyalgia found symptoms of dysautonomia and paresthesias are more specific for SFN and may be useful to help guide medical decision making.39
Veterans with GWI in our clinical sample reported a high burden of clinical symptoms conceivably attributable to ANS dysfunction. This symptom reporting is consistent with that seen in other GWI studies, as well as in other studies of SFN.4,5,7-9,14,15,34,38,40 Our clinical sample of veterans with GWI found no differences in the ANS symptom reporting between those with and without SFN. Therefore, our study cannot support SFN alone as accounting for ANS symptom burden in patients with GWI.
Two-thirds of biopsy-confirmed SFN in our clinical sample of veterans with GWI could potentially be explained by established medical conditions. As in other studies of SFN, prediabetes and diabetes represented a plurality (46%). Even after considering hyperlipidemia as a potential explanation, about 21% of SFN cases in veterans with GWI still were deemed idiopathic.
Evidence supports certain environmental agents as causal factors for GWI. Neurotoxicants reportedly related to GWI include pesticides (particularly organophosphates and carbamates), pyridostigmine bromide (used during the Gulf War as a prophylactic agent against the use of chemical weapons), and low levels of the nerve agent sarin from environmental contamination due to chemical weapons detonations.1 Some of these agents have been implicated in neuropathy as well.1,28-30 It is biologically plausible that deployment-related exposures could trigger SFN, though the traditional consensus has been that remote exposure to neurotoxic substances is unlikely to produce neuropathy that presents many years after the exposure.41 In the WRIISC clinical experience, however, veterans often report that their neuropathic symptoms predate the diagnosis of the associated medical conditions, sometimes by decades. It is conceivable that remote exposures may trigger the condition that is then potentiated by ongoing exposures, metabolic factors, and/or other medical conditions. These may perpetuate neuropathic symptoms and the illness experience of affected veterans. Our clinical observation study cannot clarify the extent to which this may be the case. Despite these findings and arguments, an environmental contribution to SFN cannot be discounted, and further research is needed to explore a potential relationship.
Limitations
This study’s conclusions are limited by its observational/retrospective design in a relatively small clinical sample of veterans evaluated at a tertiary referral center for postdeployment exposure-related health concerns. The WRIISC clinical sample is not representative of all GWVs or even of all veterans with GWI, as there is inherent selection bias as to who gets referred to and evaluated at the WRIISC. As with studies based on retrospective chart review, data are reliant on clinical documentation andaccuracy/consistency of the reviewer. Evaluation for SFN with skin biopsy is an invasive procedure and was performed when a high index of clinical suspicion for this condition existed, possibly representing confirmation bias. Therefore, the relatively high prevalence ofbiopsy-confirmed SFN seen in our clinical sample cannot be generalized to GWVs as a whole or even to veterans with GWI.
Assessment of autonomic dysfunction was based on COMPASS 31 symptom reporting by an small subset of the clinical cohort. Symptom reporting may not be reflective of true abnormality in ANS function. Physiologic tests of the ANS were not performed; such studies could more objectively establish whether ANS dysfunction is more prevalent in GWI veterans with SFN.
Evaluation for all potential etiologic/contributory conditions to SFN was not exhaustive. For example, sodium channel gene mutations have been documented to account for up to one-third of all cases of idiopathic SFN.42 For those cases in which no compelling etiology was identified, it is plausible that medical explanations for SFN may be found on further investigation.
Clinical assessments at the WRIISC were performed on GWVs ≥ 26 years after their deployment-related exposures. Other conditions/exposures may have occurred in the interim. What is not clear is whether the SFN predated the onset of any of these medical conditions or other putative contributors. This observational study is not able to tease out a temporal association to make a cause-and-effect assessment.
Conclusions
Retrospective analysis of clinical data of veterans evaluated at a specialized center for postdeployment health demonstrated that skin biopsy–confirmed SFN was prevalent, but not ubiquitous, in veterans with GWI. Symptom that may be attributed to ANS dysfunction in this clinical sample was consistent with literature on SFN and with GWI, but we could not definitively attribute ANS symptoms to SFN. Our study does not support the hypothesis that GWI symptoms are solely due to SFN, though it may still be relevant in a subset of veterans with GWI with strongly suggestive clinical features. We were able to identify a potential etiology for SFN in most veterans with GWI. Further investigations are recommended to explore any potential relationship between Gulf War exposures and SFN.
1. White RF, Steele L, O’Callaghan JP, et al. Recent research on Gulf War illness and other health problems in veterans of the 1991 Gulf War: effects of toxicant exposures during deployment. Cortex. 2016;74:449-475. doi:10.1016/j.cortex.2015.08.022
2. Committee on the Development of a Consensus Case Definition for Chronic Multisymptom Illness in 1990-1991 Gulf War Veterans, Board on the Health of Select Populations, Institute of Medicine. Chronic Multisymptom Illness in Gulf War Veterans: Case Definitions Reexamined. National Academies Press; 2014.
3. Robbins R, Helmer D, Monahan P, et al. Management of chronic multisymptom illness: synopsis of the 2021 US Department of Veterans Affairs and US Department of Defense Clinical Practice Guideline. Mayo Clin Proc. 2022;97(5):991-1002. doi:10.1016/j.mayocp.2022.01.031
4. Fox A, Helmer D, Tseng CL, Patrick-DeLuca L, Osinubi O. Report of autonomic symptoms in a clinical sample of veterans with Gulf War Illness. Mil Med. 2018;183(3-4):e179-e185. doi:10.1093/milmed/usx052
5. Fox A, Helmer D, Tseng CL, McCarron K, Satcher S, Osinubi O. Autonomic symptoms in Gulf War veterans evaluated at the War Related Illness and Injury Study Center. Mil Med. 2019;184(3-4):e191-e196. doi:10.1093/milmed/usy227
6. Reyes L, Falvo M, Blatt M, Ghobreal B, Acosta A, Serrador J. Autonomic dysfunction in veterans with Gulf War illness [abstract]. FASEB J. 2014;28(S1):1068.19. doi:10.1096/fasebj.28.1_supplement.1068.19
7. Haley RW, Charuvastra E, Shell WE, et al. Cholinergic autonomic dysfunction in veterans with Gulf War illness: confirmation in a population-based sample. JAMA Neurol. 2013;70(2):191-200. doi:10.1001/jamaneurol.2013.596
8. Haley RW, Vongpatanasin W, Wolfe GI, et al. Blunted circadian variation in autonomic regulation of sinus node function in veterans with Gulf War syndrome. Am J Med. 2004;117(7):469-478. doi:10.1016/j.amjmed.2004.03.041
9. Avery TJ, Mathersul DC, Schulz-Heik RJ, Mahoney L, Bayley PJ. Self-reported autonomic dysregulation in Gulf War Illness. Mil Med. Published online December 30, 2021. doi:10.1093/milmed/usab546
10. Verne ZT, Fields JZ, Zhang BB, Zhou Q. Autonomic dysfunction and gastroparesis in Gulf War veterans. J Investig Med. 2023;71(1):7-10. doi:10.1136/jim-2021-002291
11. Levine TD. Small fiber neuropathy: disease classification beyond pain and burning. J Cent Nerv Syst Dis. 2018;10:1179573518771703. doi:10.1177/1179573518771703
12. Novak P. Autonomic disorders. Am J Med. 2019;132(4):420-436. doi:10.1016/j.amjmed.2018.09.027
13. Oaklander AL, Klein MM. Undiagnosed small-fiber polyneuropathy: is it a component of Gulf War Illness? Defense Technical Information Center. Accessed February 21, 2024. https://apps.dtic.mil/sti/citations/ADA613891
14. Sène D. Small fiber neuropathy: diagnosis, causes, and treatment. Joint Bone Spine. 2018;85(5):553-559. doi:10.1016/j.jbspin.2017.11.002
15. Novak V, Freimer ML, Kissel JT, et al. Autonomic impairment in painful neuropathy. Neurology. 2001;56(7):861-868. doi:10.1212/wnl.56.7.861
16. Myers MI, Peltier AC. Uses of skin biopsy for sensory and autonomic nerve assessment. Curr Neurol Neurosci Rep. 2013;13(1):323. doi:10.1007/s11910-012-0323-2
17. Haroutounian S, Todorovic MS, Leinders M, et al. Diagnostic criteria for idiopathic small fiber neuropathy: a systematic review. Muscle Nerve. 2021;63(2):170-177. doi:10.1002/mus.27070
18. Levine TD, Saperstein DS. Routine use of punch biopsy to diagnose small fiber neuropathy in fibromyalgia patients. Clin Rheumatol. 2015;34(3):413-417. doi:10.1007/s10067-014-2850-5
19. England JD, Gronseth G S, Franklin G, et al. Practice parameter: the evaluation of distal symmetric polyneuropathy: the role of autonomic testing, nerve biopsy, and skin biopsy (an evidence-based review). Report of the American Academy of Neurology, the American Association of Neuromuscular and Electrodiagnostic Medicine, and the American Academy of Physical Medicine and Rehabilitation. PM R. 2009;1(1):14-22. doi:10.1016/j.pmrj.2008.11.011
20. de Greef BTA, Hoeijmakers JGJ, Gorissen-Brouwers CML, Geerts M, Faber CG, Merkies ISJ. Associated conditions in small fiber neuropathy - a large cohort study and review of the literature. Eur J Neurol. 2018;25(2):348-355. doi:10.1111/ene.13508
21. Morkavuk G, Leventoglu A. Small fiber neuropathy associated with hyperlipidemia: utility of cutaneous silent periods and autonomic tests. ISRN Neurol. 2014;2014:579242. doi:10.1155/2014/579242
22. Bednarik J, Vlckova-Moravcova E, Bursova S, Belobradkova J, Dusek L, Sommer C. Etiology of small-fiber neuropathy. J Peripher Nerv Syst. 2009;14(3):177-183. doi:10.1111/j.1529-8027.2009.00229.x
23. Kokotis P, Papantoniou M, Schmelz M, Buntziouka C, Tzavellas E, Paparrigopoulos T. Pure small fiber neuropathy in alcohol dependency detected by skin biopsy. Alcohol Fayettev N. 2023;111:67-73. doi:10.1016/j.alcohol.2023.05.006
24. Guimarães-Costa R, Schoindre Y, Metlaine A, et al. N-hexane exposure: a cause of small fiber neuropathy. J Peripher Nerv Syst. 2018;23(2):143-146. doi:10.1111/jns.12261
25. Koszewicz M, Markowska K, Waliszewska-Prosol M, et al. The impact of chronic co-exposure to different heavy metals on small fibers of peripheral nerves. A study of metal industry workers. J Occup Med Toxicol. 2021;16(1):12. doi:10.1186/s12995-021-00302-6
26. Johns Hopkins Medicine. Small nerve fibers defy neuropathy conventions. April 11, 2016. Accessed February 21, 2024. https://www.hopkinsmedicine.org/news/media/releases/small_nerve_fibers_defy_neuropathy_conventions
27. Jett DA. Neurotoxic pesticides and neurologic effects. Neurol Clin. 2011;29(3):667-677. doi:10.1016/j.ncl.2011.06.002
28. Berger AR, Schaumburg HH. Human toxic neuropathy caused by industrial agents. In: Dyck PJ, Thomas PK, eds. Peripheral Neuropathy. 4th ed. Saunders; 2005:2505-2525. doi:10.1016/B978-0-7216-9491-7.50115-0
29. Herskovitz S, Schaumburg HH. Neuropathy caused by drugs. In: Dyck PJ, Thomas PK, eds. Peripheral Neuropathy. 4th ed. Saunders; 2005:2553-2583.
30. Katona I, Weis J. Chapter 31 - Diseases of the peripheral nerves. Handb Clin Neurol. 2017;145:453-474. doi:10.1016/B978-0-12-802395-2.00031-6
31. Matikainen E, Juntunen J. Autonomic nervous system dysfunction in workers exposed to organic solvents. J Neurol Neurosurg Psychiatry. 1985;48(10):1021-1024. doi:10.1136/jnnp.48.10.1021
32. Murata K, Araki S, Yokoyama K, Maeda K. Autonomic and peripheral nervous system dysfunction in workers exposed to mixed organic solvents. Int Arch Occup Environ Health. 1991;63(5):335-340. doi:10.1007/BF00381584
33. Sletten DM, Suarez GA, Low PA, Mandrekar J, Singer W. COMPASS 31: a refined and abbreviated Composite Autonomic Symptom Score. Mayo Clin Proc. 2012;87(12):1196-1201. doi:10.1016/j.mayocp.2012.10.013
34. Treister R, O’Neil K, Downs HM, Oaklander AL. Validation of the Composite Autonomic Symptom Scale-31 (COMPASS-31) in patients with and without small-fiber polyneuropathy. Eur J Neurol. 2015;22(7):1124-1130. doi:10.1111/ene.12717
35. Joseph P, Arevalo C, Oliveira RKF, et al. Insights from invasive cardiopulmonary exercise testing of patients with myalgic encephalomyelitis/chronic fatigue syndrome. Chest. 2021;160(2):642-651. doi:10.1016/j.chest.2021.01.082
36. Giannoccaro MP, Donadio V, Incensi A, Avoni P, Liguori R. Small nerve fiber involvement in patients referred for fibromyalgia. Muscle Nerve. 2014;49(5):757-759. doi:10.1002/mus.24156
37. Oaklander AL, Herzog ZD, Downs HM, Klein MM. Objective evidence that small-fiber polyneuropathy underlies some illnesses currently labeled as fibromyalgia. Pain. 2013;154(11):2310-2316. doi:10.1016/j.pain.2013.06.001
38. Serrador JM. Diagnosis of late-stage, early-onset, small-fiber polyneuropathy. Defense Technical Information Center. December 1, 2019. Accessed February 21, 2024. https://apps.dtic.mil/sti/citations/AD1094831
39. Lodahl M, Treister R, Oaklander AL. Specific symptoms may discriminate between fibromyalgia patients with vs without objective test evidence of small-fiber polyneuropathy. Pain Rep. 2018;3(1):e633. doi:10.1097/PR9.0000000000000633
40. Sastre A, Cook MR. Autonomic dysfunction in Gulf War veterans. Defense Technical Information Center. April 1, 2004. Accessed February 21, 2024. https://apps.dtic.mil/sti/citations/ADA429525
41. Little AA, Albers JW. Clinical description of toxic neuropathies. Handb Clin Neurol. 2015;131:253-296. doi:10.1016/B978-0-444-62627-1.00015-9
42. Faber CG, Hoeijmakers JGJ, Ahn HS, et al. Gain of function NaV1.7 mutations in idiopathic small fiber neuropathy. Ann Neurol. 2012;71(1):26-39.
Following deployment to operations Desert Shield and Desert Storm (Gulf War) in 1990 and 1991, many Gulf War veterans (GWVs) developed chronic, complex symptoms, including pain, dyscognition, and fatigue, with gastrointestinal, skin, and respiratory manifestations. This Gulf War Illness (GWI) is reported to affect about 30% of those deployed. More than 30 years later, there is no consensus as to the etiology of GWI, although some deployment-related exposures have been implicated.1
Accepted research definitions for GWI include the Centers for Disease Control and Prevention and Kansas definitions.2 The US Department of Veterans Affairs (VA) uses the terminology chronic multisymptom illness (CMI), which is an overarching diagnosis under which GWI falls. Although there is no consensus case definition for CMI, there is overlap with conditions such as fibromyalgia, myalgic encephalomyelitis/chronic fatigue syndrome, and irritable bowel syndrome; the VA considers these as qualifying clinical diagnoses.3 The pathophysiology of GWI is also unknown, though a frequently reported unifying feature is that of autonomic nervous system (ANS) dysfunction. Studies have demonstrated differences between veterans with GWI and those without GWI in both the reporting of symptoms attributable to ANS dysfunction and in physiologic evaluations of the ANS.4-10
Small fiber neuropathy (SFN), a condition with damage to the A-δ and C small nerve fibers, has been proposed as a potential mechanism for the pain and ANS dysfunction experienced in GWI.11-13 Symptoms of SFN are similar to those of GWI, with pain and ANS symptoms commonly reported.14,15 There are multiple diagnostic criteria for SFN, the most commonly used requiring the presence of appropriate symptoms in the absence of large fiber neuropathy and a skin biopsy demonstrating reduced intraepidermal nerve fiber density.16-19 Several conditions reportedly cause SFN, most notably diabetes/prediabetes. Autoimmune disease, vitamin B12 deficiency, monoclonal gammopathies, celiac disease, paraneoplastic syndromes, and sodium channel gene mutations may also contribute to SFN.20 Hyperlipidemia has been identified as a contributor, although it has been variably reported.21,22
Idiopathic neuropathies, SFN included, may be secondary to neurotoxicant exposures. Agents whose exposure or consumption have been associated with SFN include alcohol most prominently, but also the organic solvent n-hexane, heavy metals, and excess vitamin B6.20,23-25 Agents associated with large fiber neuropathy may also have relevance for SFN, as small fibers have been likened to the “canary in the coal mine” in that they may be more susceptible to neurotoxicants and are affected earlier in the disease process.26 In this way, SFN may be the harbinger of large fiber neuropathy in some cases. Of specific relevance for GWVs, organophosphates and carbamates are known to produce a delayed onset large fiber neuropathy.27-30 Exposure to petrochemical solvents has also been associated with large fiber neuropathies.31,32
The War Related Illness and Injury Study Center (WRIISC) is a clinical, research, and education center established by Congress in 2001. Its primary focus is on military exposures and postdeployment health of veterans. It is located at 3 sites: East Orange, New Jersey; Washington, DC; and Palo Alto, California. The New Jersey WRIISC began a program to evaluate GWVs with characteristic symptoms for possible SFN with use of a skin biopsy.
We hypothesize that SFN may underly much of GWI symptomatology and may not be accounted for by the putative etiologies detailed in review of the medical literature. This retrospective review of clinical evaluations for SFN in GWVs who sought care at the New Jersey WRIISC explored and addressed the following questions: (1) how common is biopsy-confirmed SFN in veterans with GWI; (2) do veterans with GWI and SFN report more symptoms attributable to ANS dysfunction when compared with veterans with GWI and no SFN; and (3) can SFN in veterans with GWI and SFN be explained by conditions and substances commonly associated with SFN? Institutional review board approval and waiver of consent was obtained from the Veterans Affairs New Jersey Health Care Center for the study.
Methods
A retrospective chart review was conducted on veterans evaluated at the WRIISC from March 1, 2015, to January 31, 2019. Inclusion criteria were: deployment to operations Desert Shield and Desert Storm between August 2, 1990, and February 28, 1991, and skin biopsy conducted at the WRIISC. Skin biopsies were obtained at the discretion of an examining clinician based on clinical indications, including neuropathic pain, ANS symptoms, and/or a fibromyalgia/chronic pain–type presentation.
Electronic health record review explicitly abstracted GWI status, results of the skin biopsy, and ANS symptom burden as determined by the Composite Autonomic Symptom Scale 31 (COMPASS 31) completed at the time of the WRIISC evaluation.
COMPASS 31 assesses symptoms across 6 domains (orthostatic, vasomotor, secretomotor, gastrointestinal, bladder, andpupillomotor). Patients are asked about symptom frequency (rarely to almost always), severity (mild to severe), and improvement (much worse to completely gone). Individual domain scores and a total weighted score (0-100) have demonstrated good validity, reliability, and consistency in SFN.33,34
In veterans with GWI and documented SFN, a health record review was performed to identify potential etiologies for SFN (Appendix).
Statistical Analysis
Microsoft Excel and IBM SPSS 12.0.1 for Windows were used for data collection and statistical analysis. Fisher exact test was used for comparing the prevalence of SFN in veterans with GWI vs without GWI. The independent samples t test was used for comparing COMPASS 31 scores for veterans with GWI by SFN status. α < .05 was used for determining statistical significance. For those GWVs documented with SFN and GWI, potential explanations were documented in total and by condition.
Results
From March 1, 2015, to January 31, 2019, 141 GWVs received a comprehensive in person clinical evaluation at the WRIISC and 51 veterans (36%) received a skin biopsy and were included in this retrospective observational study (Figure). The mean age was 48.6 years, and the majority were male and served in the US Army. Skin biopsies met clinical criteria for GWI for 42 (82%) and 24 of 42 (57%) were determined to have SFN. Four of 9 (44%) veterans without GWI had positive SFN biopsies, though this difference was not statistically significant (Table 1). Veterans with SFN but no GWI were not included in the further analysis.
Thirty-five veterans with GWI—18 with SFN and 17 without SFN—completed the COMPASS 31 (Table 2). COMPASS 31 data were not analyzed for veterans without GWI. Individual domain scores and the difference in COMPASS 31 scores for veterans with GWI and SFN vs GWI and no SFN (38.3 vs 37.8, respectively) were not statistically significant.
Sixteen of 24 veterans with GWI and SFN (67%) had ≥ 1 conditions that could potentially be responsible for SFN (Table 3), including 11 veterans (46%) with prediabetes/diabetes. Hyperlipidemia is only variably reported as a cause of SFN; when included, 19 of 24 (79%) SFN cases were accounted for. We could not identify a medical explanation for SFN in 5 of 24 veterans (21%) with GWI, which were deemed to be idiopathic.
Discussion
Biopsy-confirmed SFN was present in more than half of our sample of veterans with GWI, which is broadly consistent with what has been reported in the literature.13,35-38 In this clinical observation study, SFN was similarly prevalent in veterans with and without GWI; although it should be noted that biopsies only were obtained when there was a strong clinical suspicion for SFN. Almost half of patients with GWI did not have SFN, so our study does not support SFN as the underlying explanation for all GWI. Although our data cannot provide clinical guidance as to when skin biopsy may be indicated in GWI, work done in fibromyalgia found symptoms of dysautonomia and paresthesias are more specific for SFN and may be useful to help guide medical decision making.39
Veterans with GWI in our clinical sample reported a high burden of clinical symptoms conceivably attributable to ANS dysfunction. This symptom reporting is consistent with that seen in other GWI studies, as well as in other studies of SFN.4,5,7-9,14,15,34,38,40 Our clinical sample of veterans with GWI found no differences in the ANS symptom reporting between those with and without SFN. Therefore, our study cannot support SFN alone as accounting for ANS symptom burden in patients with GWI.
Two-thirds of biopsy-confirmed SFN in our clinical sample of veterans with GWI could potentially be explained by established medical conditions. As in other studies of SFN, prediabetes and diabetes represented a plurality (46%). Even after considering hyperlipidemia as a potential explanation, about 21% of SFN cases in veterans with GWI still were deemed idiopathic.
Evidence supports certain environmental agents as causal factors for GWI. Neurotoxicants reportedly related to GWI include pesticides (particularly organophosphates and carbamates), pyridostigmine bromide (used during the Gulf War as a prophylactic agent against the use of chemical weapons), and low levels of the nerve agent sarin from environmental contamination due to chemical weapons detonations.1 Some of these agents have been implicated in neuropathy as well.1,28-30 It is biologically plausible that deployment-related exposures could trigger SFN, though the traditional consensus has been that remote exposure to neurotoxic substances is unlikely to produce neuropathy that presents many years after the exposure.41 In the WRIISC clinical experience, however, veterans often report that their neuropathic symptoms predate the diagnosis of the associated medical conditions, sometimes by decades. It is conceivable that remote exposures may trigger the condition that is then potentiated by ongoing exposures, metabolic factors, and/or other medical conditions. These may perpetuate neuropathic symptoms and the illness experience of affected veterans. Our clinical observation study cannot clarify the extent to which this may be the case. Despite these findings and arguments, an environmental contribution to SFN cannot be discounted, and further research is needed to explore a potential relationship.
Limitations
This study’s conclusions are limited by its observational/retrospective design in a relatively small clinical sample of veterans evaluated at a tertiary referral center for postdeployment exposure-related health concerns. The WRIISC clinical sample is not representative of all GWVs or even of all veterans with GWI, as there is inherent selection bias as to who gets referred to and evaluated at the WRIISC. As with studies based on retrospective chart review, data are reliant on clinical documentation andaccuracy/consistency of the reviewer. Evaluation for SFN with skin biopsy is an invasive procedure and was performed when a high index of clinical suspicion for this condition existed, possibly representing confirmation bias. Therefore, the relatively high prevalence ofbiopsy-confirmed SFN seen in our clinical sample cannot be generalized to GWVs as a whole or even to veterans with GWI.
Assessment of autonomic dysfunction was based on COMPASS 31 symptom reporting by an small subset of the clinical cohort. Symptom reporting may not be reflective of true abnormality in ANS function. Physiologic tests of the ANS were not performed; such studies could more objectively establish whether ANS dysfunction is more prevalent in GWI veterans with SFN.
Evaluation for all potential etiologic/contributory conditions to SFN was not exhaustive. For example, sodium channel gene mutations have been documented to account for up to one-third of all cases of idiopathic SFN.42 For those cases in which no compelling etiology was identified, it is plausible that medical explanations for SFN may be found on further investigation.
Clinical assessments at the WRIISC were performed on GWVs ≥ 26 years after their deployment-related exposures. Other conditions/exposures may have occurred in the interim. What is not clear is whether the SFN predated the onset of any of these medical conditions or other putative contributors. This observational study is not able to tease out a temporal association to make a cause-and-effect assessment.
Conclusions
Retrospective analysis of clinical data of veterans evaluated at a specialized center for postdeployment health demonstrated that skin biopsy–confirmed SFN was prevalent, but not ubiquitous, in veterans with GWI. Symptom that may be attributed to ANS dysfunction in this clinical sample was consistent with literature on SFN and with GWI, but we could not definitively attribute ANS symptoms to SFN. Our study does not support the hypothesis that GWI symptoms are solely due to SFN, though it may still be relevant in a subset of veterans with GWI with strongly suggestive clinical features. We were able to identify a potential etiology for SFN in most veterans with GWI. Further investigations are recommended to explore any potential relationship between Gulf War exposures and SFN.
1. White RF, Steele L, O’Callaghan JP, et al. Recent research on Gulf War illness and other health problems in veterans of the 1991 Gulf War: effects of toxicant exposures during deployment. Cortex. 2016;74:449-475. doi:10.1016/j.cortex.2015.08.022
2. Committee on the Development of a Consensus Case Definition for Chronic Multisymptom Illness in 1990-1991 Gulf War Veterans, Board on the Health of Select Populations, Institute of Medicine. Chronic Multisymptom Illness in Gulf War Veterans: Case Definitions Reexamined. National Academies Press; 2014.
3. Robbins R, Helmer D, Monahan P, et al. Management of chronic multisymptom illness: synopsis of the 2021 US Department of Veterans Affairs and US Department of Defense Clinical Practice Guideline. Mayo Clin Proc. 2022;97(5):991-1002. doi:10.1016/j.mayocp.2022.01.031
4. Fox A, Helmer D, Tseng CL, Patrick-DeLuca L, Osinubi O. Report of autonomic symptoms in a clinical sample of veterans with Gulf War Illness. Mil Med. 2018;183(3-4):e179-e185. doi:10.1093/milmed/usx052
5. Fox A, Helmer D, Tseng CL, McCarron K, Satcher S, Osinubi O. Autonomic symptoms in Gulf War veterans evaluated at the War Related Illness and Injury Study Center. Mil Med. 2019;184(3-4):e191-e196. doi:10.1093/milmed/usy227
6. Reyes L, Falvo M, Blatt M, Ghobreal B, Acosta A, Serrador J. Autonomic dysfunction in veterans with Gulf War illness [abstract]. FASEB J. 2014;28(S1):1068.19. doi:10.1096/fasebj.28.1_supplement.1068.19
7. Haley RW, Charuvastra E, Shell WE, et al. Cholinergic autonomic dysfunction in veterans with Gulf War illness: confirmation in a population-based sample. JAMA Neurol. 2013;70(2):191-200. doi:10.1001/jamaneurol.2013.596
8. Haley RW, Vongpatanasin W, Wolfe GI, et al. Blunted circadian variation in autonomic regulation of sinus node function in veterans with Gulf War syndrome. Am J Med. 2004;117(7):469-478. doi:10.1016/j.amjmed.2004.03.041
9. Avery TJ, Mathersul DC, Schulz-Heik RJ, Mahoney L, Bayley PJ. Self-reported autonomic dysregulation in Gulf War Illness. Mil Med. Published online December 30, 2021. doi:10.1093/milmed/usab546
10. Verne ZT, Fields JZ, Zhang BB, Zhou Q. Autonomic dysfunction and gastroparesis in Gulf War veterans. J Investig Med. 2023;71(1):7-10. doi:10.1136/jim-2021-002291
11. Levine TD. Small fiber neuropathy: disease classification beyond pain and burning. J Cent Nerv Syst Dis. 2018;10:1179573518771703. doi:10.1177/1179573518771703
12. Novak P. Autonomic disorders. Am J Med. 2019;132(4):420-436. doi:10.1016/j.amjmed.2018.09.027
13. Oaklander AL, Klein MM. Undiagnosed small-fiber polyneuropathy: is it a component of Gulf War Illness? Defense Technical Information Center. Accessed February 21, 2024. https://apps.dtic.mil/sti/citations/ADA613891
14. Sène D. Small fiber neuropathy: diagnosis, causes, and treatment. Joint Bone Spine. 2018;85(5):553-559. doi:10.1016/j.jbspin.2017.11.002
15. Novak V, Freimer ML, Kissel JT, et al. Autonomic impairment in painful neuropathy. Neurology. 2001;56(7):861-868. doi:10.1212/wnl.56.7.861
16. Myers MI, Peltier AC. Uses of skin biopsy for sensory and autonomic nerve assessment. Curr Neurol Neurosci Rep. 2013;13(1):323. doi:10.1007/s11910-012-0323-2
17. Haroutounian S, Todorovic MS, Leinders M, et al. Diagnostic criteria for idiopathic small fiber neuropathy: a systematic review. Muscle Nerve. 2021;63(2):170-177. doi:10.1002/mus.27070
18. Levine TD, Saperstein DS. Routine use of punch biopsy to diagnose small fiber neuropathy in fibromyalgia patients. Clin Rheumatol. 2015;34(3):413-417. doi:10.1007/s10067-014-2850-5
19. England JD, Gronseth G S, Franklin G, et al. Practice parameter: the evaluation of distal symmetric polyneuropathy: the role of autonomic testing, nerve biopsy, and skin biopsy (an evidence-based review). Report of the American Academy of Neurology, the American Association of Neuromuscular and Electrodiagnostic Medicine, and the American Academy of Physical Medicine and Rehabilitation. PM R. 2009;1(1):14-22. doi:10.1016/j.pmrj.2008.11.011
20. de Greef BTA, Hoeijmakers JGJ, Gorissen-Brouwers CML, Geerts M, Faber CG, Merkies ISJ. Associated conditions in small fiber neuropathy - a large cohort study and review of the literature. Eur J Neurol. 2018;25(2):348-355. doi:10.1111/ene.13508
21. Morkavuk G, Leventoglu A. Small fiber neuropathy associated with hyperlipidemia: utility of cutaneous silent periods and autonomic tests. ISRN Neurol. 2014;2014:579242. doi:10.1155/2014/579242
22. Bednarik J, Vlckova-Moravcova E, Bursova S, Belobradkova J, Dusek L, Sommer C. Etiology of small-fiber neuropathy. J Peripher Nerv Syst. 2009;14(3):177-183. doi:10.1111/j.1529-8027.2009.00229.x
23. Kokotis P, Papantoniou M, Schmelz M, Buntziouka C, Tzavellas E, Paparrigopoulos T. Pure small fiber neuropathy in alcohol dependency detected by skin biopsy. Alcohol Fayettev N. 2023;111:67-73. doi:10.1016/j.alcohol.2023.05.006
24. Guimarães-Costa R, Schoindre Y, Metlaine A, et al. N-hexane exposure: a cause of small fiber neuropathy. J Peripher Nerv Syst. 2018;23(2):143-146. doi:10.1111/jns.12261
25. Koszewicz M, Markowska K, Waliszewska-Prosol M, et al. The impact of chronic co-exposure to different heavy metals on small fibers of peripheral nerves. A study of metal industry workers. J Occup Med Toxicol. 2021;16(1):12. doi:10.1186/s12995-021-00302-6
26. Johns Hopkins Medicine. Small nerve fibers defy neuropathy conventions. April 11, 2016. Accessed February 21, 2024. https://www.hopkinsmedicine.org/news/media/releases/small_nerve_fibers_defy_neuropathy_conventions
27. Jett DA. Neurotoxic pesticides and neurologic effects. Neurol Clin. 2011;29(3):667-677. doi:10.1016/j.ncl.2011.06.002
28. Berger AR, Schaumburg HH. Human toxic neuropathy caused by industrial agents. In: Dyck PJ, Thomas PK, eds. Peripheral Neuropathy. 4th ed. Saunders; 2005:2505-2525. doi:10.1016/B978-0-7216-9491-7.50115-0
29. Herskovitz S, Schaumburg HH. Neuropathy caused by drugs. In: Dyck PJ, Thomas PK, eds. Peripheral Neuropathy. 4th ed. Saunders; 2005:2553-2583.
30. Katona I, Weis J. Chapter 31 - Diseases of the peripheral nerves. Handb Clin Neurol. 2017;145:453-474. doi:10.1016/B978-0-12-802395-2.00031-6
31. Matikainen E, Juntunen J. Autonomic nervous system dysfunction in workers exposed to organic solvents. J Neurol Neurosurg Psychiatry. 1985;48(10):1021-1024. doi:10.1136/jnnp.48.10.1021
32. Murata K, Araki S, Yokoyama K, Maeda K. Autonomic and peripheral nervous system dysfunction in workers exposed to mixed organic solvents. Int Arch Occup Environ Health. 1991;63(5):335-340. doi:10.1007/BF00381584
33. Sletten DM, Suarez GA, Low PA, Mandrekar J, Singer W. COMPASS 31: a refined and abbreviated Composite Autonomic Symptom Score. Mayo Clin Proc. 2012;87(12):1196-1201. doi:10.1016/j.mayocp.2012.10.013
34. Treister R, O’Neil K, Downs HM, Oaklander AL. Validation of the Composite Autonomic Symptom Scale-31 (COMPASS-31) in patients with and without small-fiber polyneuropathy. Eur J Neurol. 2015;22(7):1124-1130. doi:10.1111/ene.12717
35. Joseph P, Arevalo C, Oliveira RKF, et al. Insights from invasive cardiopulmonary exercise testing of patients with myalgic encephalomyelitis/chronic fatigue syndrome. Chest. 2021;160(2):642-651. doi:10.1016/j.chest.2021.01.082
36. Giannoccaro MP, Donadio V, Incensi A, Avoni P, Liguori R. Small nerve fiber involvement in patients referred for fibromyalgia. Muscle Nerve. 2014;49(5):757-759. doi:10.1002/mus.24156
37. Oaklander AL, Herzog ZD, Downs HM, Klein MM. Objective evidence that small-fiber polyneuropathy underlies some illnesses currently labeled as fibromyalgia. Pain. 2013;154(11):2310-2316. doi:10.1016/j.pain.2013.06.001
38. Serrador JM. Diagnosis of late-stage, early-onset, small-fiber polyneuropathy. Defense Technical Information Center. December 1, 2019. Accessed February 21, 2024. https://apps.dtic.mil/sti/citations/AD1094831
39. Lodahl M, Treister R, Oaklander AL. Specific symptoms may discriminate between fibromyalgia patients with vs without objective test evidence of small-fiber polyneuropathy. Pain Rep. 2018;3(1):e633. doi:10.1097/PR9.0000000000000633
40. Sastre A, Cook MR. Autonomic dysfunction in Gulf War veterans. Defense Technical Information Center. April 1, 2004. Accessed February 21, 2024. https://apps.dtic.mil/sti/citations/ADA429525
41. Little AA, Albers JW. Clinical description of toxic neuropathies. Handb Clin Neurol. 2015;131:253-296. doi:10.1016/B978-0-444-62627-1.00015-9
42. Faber CG, Hoeijmakers JGJ, Ahn HS, et al. Gain of function NaV1.7 mutations in idiopathic small fiber neuropathy. Ann Neurol. 2012;71(1):26-39.
Impact of the COVID-19 Pandemic on Care for Patients With Skin Cancer
To the Editor:
The most common malignancy in the United States is skin cancer, with melanoma accounting for the majority of skin cancer deaths.1 Despite the lack of established guidelines for routine total-body skin examinations, many patients regularly visit their dermatologist for assessment of pigmented skin lesions.2 During the COVID-19 pandemic, many patients were unable to attend in-person dermatology visits, which resulted in many high-risk individuals not receiving care or alternatively seeking virtual care for cutaneous lesions.3 There has been a lack of research in the United States exploring the utilization of teledermatology during the pandemic and its overall impact on the care of patients with a history of skin cancer. We explored the impact of the COVID-19 pandemic on care for patients with skin cancer in a large US population.
 With and Without a History of Skin Cancera in 2020-2021 NHIS (N=46,679)")
 With and Without a History of Skin Cancera in 2020-2021 NHIS (N=46,679)")
Using anonymous survey data from the 2020-2021 National Health Interview Survey,4 we conducted a population-based, cross-sectional study to evaluate access to care during the COVID-19 pandemic for patients with a self-reported history of skin cancer—melanoma, nonmelanoma skin cancer, or unknown skin cancer. The 3 outcome variables included having a virtual medical appointment in the past 12 months (yes/no), delaying medical care due to the COVID-19 pandemic (yes/no), and not receiving care due to the COVID-19 pandemic (yes/no). Multivariable logistic regression models evaluating the relationship between a history of skin cancer and access to care were constructed using Stata/MP 17.0 (StataCorp LLC). We controlled for patient age; education; race/ethnicity; received public assistance or welfare payments; sex; region; US citizenship status; health insurance status; comorbidities including history of hypertension, diabetes, and hypercholesterolemia; and birthplace in the United States in the logistic regression models.

Our analysis included 46,679 patients aged 18 years or older, of whom 3.4% (weighted)(n=2204) reported a history of skin cancer (eTable 1). The weighted percentage was calculated using National Health Interview Survey design parameters (accounting for the multistage sampling design) to represent the general US population. Compared with those with no history of skin cancer, patients with a history of skin cancer were significantly more likely to delay medical care (adjusted odds ratio [AOR], 1.37; 95% CI, 1.21-1.54; P<.001) or not receive care (AOR, 1.35; 95% CI, 1.16-1.57; P<.001) due to the pandemic and were more likely to have had a virtual medical visit in the past 12 months (AOR, 1.12; 95% CI, 1.00-1.26; P=.05). Additionally, subgroup analysis revealed that females were more likely than males to forego medical care (eTable 2). β Coefficients for independent and dependent variables were further analyzed using logistic regression (eTable 3).

After adjusting for various potential confounders including comorbidities, our results revealed that patients with a history of skin cancer reported that they were less likely to receive in-person medical care due to the COVID-19 pandemic, as high-risk individuals with a history of skin cancer may have stopped receiving total-body skin examinations and dermatology care during the pandemic. Our findings showed that patients with a history of skin cancer were more likely than those without skin cancer to delay or forego care due to the pandemic, which may contribute to a higher incidence of advanced-stage melanomas postpandemic. Trepanowski et al5 reported an increased incidence of patients presenting with more advanced melanomas during the pandemic. Telemedicine was more commonly utilized by patients with a history of skin cancer during the pandemic.
In the future, virtual care may help limit advanced stages of skin cancer by serving as a viable alternative to in-person care.6 It has been reported that telemedicine can serve as a useful triage service reducing patient wait times.7 Teledermatology should not replace in-person care, as there is no evidence of the diagnostic accuracy of this service and many patients still will need to be seen in-person for confirmation of their diagnosis and potential biopsy. Further studies are needed to assess for missed skin cancer diagnoses due to the utilization of telemedicine.
Limitations of this study included a self-reported history of skin cancer, β coefficients that may suggest a high degree of collinearity, and lack of specific survey questions regarding dermatologic care during the COVID-19 pandemic. Further long-term studies exploring the clinical applicability and diagnostic accuracy of virtual medicine visits for cutaneous malignancies are vital, as teledermatology may play an essential role in curbing rising skin cancer rates even beyond the pandemic.
- Guy GP Jr, Thomas CC, Thompson T, et al. Vital signs: melanoma incidence and mortality trends and projections—United States, 1982-2030. MMWR Morb Mortal Wkly Rep. 2015;64:591-596.
- Whiteman DC, Olsen CM, MacGregor S, et al; QSkin Study. The effect of screening on melanoma incidence and biopsy rates. Br J Dermatol. 2022;187:515-522. doi:10.1111/bjd.21649
- Jobbágy A, Kiss N, Meznerics FA, et al. Emergency use and efficacy of an asynchronous teledermatology system as a novel tool for early diagnosis of skin cancer during the first wave of COVID-19 pandemic. Int J Environ Res Public Health. 2022;19:2699. doi:10.3390/ijerph19052699
- National Center for Health Statistics. NHIS Data, Questionnaires and Related Documentation. Centers for Disease Control and Prevention website. Accessed April 19, 2023. https://www.cdc.gov/nchs/nhis/data-questionnaires-documentation.htm
- Trepanowski N, Chang MS, Zhou G, et al. Delays in melanoma presentation during the COVID-19 pandemic: a nationwide multi-institutional cohort study. J Am Acad Dermatol. 2022;87:1217-1219. doi:10.1016/j.jaad.2022.06.031
- Chiru MR, Hindocha S, Burova E, et al. Management of the two-week wait pathway for skin cancer patients, before and during the pandemic: is virtual consultation an option? J Pers Med. 2022;12:1258. doi:10.3390/jpm12081258
- Finnane A Dallest K Janda M et al. Teledermatology for the diagnosis and management of skin cancer: a systematic review. JAMA Dermatol. 2017;153:319-327. doi:10.1001/jamadermatol.2016.4361
To the Editor:
The most common malignancy in the United States is skin cancer, with melanoma accounting for the majority of skin cancer deaths.1 Despite the lack of established guidelines for routine total-body skin examinations, many patients regularly visit their dermatologist for assessment of pigmented skin lesions.2 During the COVID-19 pandemic, many patients were unable to attend in-person dermatology visits, which resulted in many high-risk individuals not receiving care or alternatively seeking virtual care for cutaneous lesions.3 There has been a lack of research in the United States exploring the utilization of teledermatology during the pandemic and its overall impact on the care of patients with a history of skin cancer. We explored the impact of the COVID-19 pandemic on care for patients with skin cancer in a large US population.
Using anonymous survey data from the 2020-2021 National Health Interview Survey,4 we conducted a population-based, cross-sectional study to evaluate access to care during the COVID-19 pandemic for patients with a self-reported history of skin cancer—melanoma, nonmelanoma skin cancer, or unknown skin cancer. The 3 outcome variables included having a virtual medical appointment in the past 12 months (yes/no), delaying medical care due to the COVID-19 pandemic (yes/no), and not receiving care due to the COVID-19 pandemic (yes/no). Multivariable logistic regression models evaluating the relationship between a history of skin cancer and access to care were constructed using Stata/MP 17.0 (StataCorp LLC). We controlled for patient age; education; race/ethnicity; received public assistance or welfare payments; sex; region; US citizenship status; health insurance status; comorbidities including history of hypertension, diabetes, and hypercholesterolemia; and birthplace in the United States in the logistic regression models.
Our analysis included 46,679 patients aged 18 years or older, of whom 3.4% (weighted)(n=2204) reported a history of skin cancer (eTable 1). The weighted percentage was calculated using National Health Interview Survey design parameters (accounting for the multistage sampling design) to represent the general US population. Compared with those with no history of skin cancer, patients with a history of skin cancer were significantly more likely to delay medical care (adjusted odds ratio [AOR], 1.37; 95% CI, 1.21-1.54; P<.001) or not receive care (AOR, 1.35; 95% CI, 1.16-1.57; P<.001) due to the pandemic and were more likely to have had a virtual medical visit in the past 12 months (AOR, 1.12; 95% CI, 1.00-1.26; P=.05). Additionally, subgroup analysis revealed that females were more likely than males to forego medical care (eTable 2). β Coefficients for independent and dependent variables were further analyzed using logistic regression (eTable 3).
After adjusting for various potential confounders including comorbidities, our results revealed that patients with a history of skin cancer reported that they were less likely to receive in-person medical care due to the COVID-19 pandemic, as high-risk individuals with a history of skin cancer may have stopped receiving total-body skin examinations and dermatology care during the pandemic. Our findings showed that patients with a history of skin cancer were more likely than those without skin cancer to delay or forego care due to the pandemic, which may contribute to a higher incidence of advanced-stage melanomas postpandemic. Trepanowski et al5 reported an increased incidence of patients presenting with more advanced melanomas during the pandemic. Telemedicine was more commonly utilized by patients with a history of skin cancer during the pandemic.
In the future, virtual care may help limit advanced stages of skin cancer by serving as a viable alternative to in-person care.6 It has been reported that telemedicine can serve as a useful triage service reducing patient wait times.7 Teledermatology should not replace in-person care, as there is no evidence of the diagnostic accuracy of this service and many patients still will need to be seen in-person for confirmation of their diagnosis and potential biopsy. Further studies are needed to assess for missed skin cancer diagnoses due to the utilization of telemedicine.
Limitations of this study included a self-reported history of skin cancer, β coefficients that may suggest a high degree of collinearity, and lack of specific survey questions regarding dermatologic care during the COVID-19 pandemic. Further long-term studies exploring the clinical applicability and diagnostic accuracy of virtual medicine visits for cutaneous malignancies are vital, as teledermatology may play an essential role in curbing rising skin cancer rates even beyond the pandemic.
- Guy GP Jr, Thomas CC, Thompson T, et al. Vital signs: melanoma incidence and mortality trends and projections—United States, 1982-2030. MMWR Morb Mortal Wkly Rep. 2015;64:591-596.
- Whiteman DC, Olsen CM, MacGregor S, et al; QSkin Study. The effect of screening on melanoma incidence and biopsy rates. Br J Dermatol. 2022;187:515-522. doi:10.1111/bjd.21649
- Jobbágy A, Kiss N, Meznerics FA, et al. Emergency use and efficacy of an asynchronous teledermatology system as a novel tool for early diagnosis of skin cancer during the first wave of COVID-19 pandemic. Int J Environ Res Public Health. 2022;19:2699. doi:10.3390/ijerph19052699
- National Center for Health Statistics. NHIS Data, Questionnaires and Related Documentation. Centers for Disease Control and Prevention website. Accessed April 19, 2023. https://www.cdc.gov/nchs/nhis/data-questionnaires-documentation.htm
- Trepanowski N, Chang MS, Zhou G, et al. Delays in melanoma presentation during the COVID-19 pandemic: a nationwide multi-institutional cohort study. J Am Acad Dermatol. 2022;87:1217-1219. doi:10.1016/j.jaad.2022.06.031
- Chiru MR, Hindocha S, Burova E, et al. Management of the two-week wait pathway for skin cancer patients, before and during the pandemic: is virtual consultation an option? J Pers Med. 2022;12:1258. doi:10.3390/jpm12081258
- Finnane A Dallest K Janda M et al. Teledermatology for the diagnosis and management of skin cancer: a systematic review. JAMA Dermatol. 2017;153:319-327. doi:10.1001/jamadermatol.2016.4361
PRACTICE POINTS
- The COVID-19 pandemic has altered the landscape of medicine, as many individuals are now utilizing telemedicine to receive care.
- Many individuals will continue to receive telemedicine moving forward, making it crucial to understand access to care.
Recurrence Rates of Mohs Micrographic Surgery vs Radiation Therapy for Basal Cell Carcinoma of the Ear
Basal cell carcinoma (BCC) of the ear may have aggressive histologic subtypes and a greater propensity for subclinical spread than BCC in other anatomic locations. In this retrospective analysis, we evaluated recurrence rates of BCC of the ear in 102 patients who underwent treatment with Mohs micrographic surgery (MMS) or radiation therapy (RT) at a single institution between January 2017 and December 2019. Data on patient demographics, tumor characteristics, treatment modality, and recurrence rates were collected from medical records. Recurrence rates were assessed over a mean follow-up time of 2.8 years. Although MMS is the gold standard for treatment of BCC of the ear, RT may be a suitable alternative for nonsurgical candidates.
Basal cell carcinoma (BCC) of the ear may have aggressive histologic subtypes and a greater propensity for subclinical spread than BCC in other anatomic locations. Given that these aggressive histologic subtypes—defined as morpheaform, basosquamous, sclerosing, infiltrative, or micronodular in any portion of the tumor—have been reported as independent predictors of recurrence,1,2 BCC of the ear may be more likely to recur.
Mohs micrographic surgery (MMS) is the gold standard for the treatment of BCC of the ear. For nonsurgical candidates—those with high bleeding risk, low life expectancy, or other medical or social factors—definitive radiation therapy (RT) may be an option. Our study sought to examine recurrence rates in patients with BCC of the ear treated with MMS vs RT.
Methods
A retrospective review of patients undergoing treatment of BCC of the ear at Bighorn Mohs Surgery and Dermatology Center (San Diego, California) between January 2017 and December 2019 was conducted. A total of 507 medical records were reviewed, and 102 patients were included in the study. Inclusion criteria consisted of biopsy-confirmed BCC of the ear that was treated with MMS, RT, or both. Data on patient demographics, tumor characteristics, treatment modality, and recurrence rates were collected from medical records. This retrospective review of medical records was exempt from institutional review board approval, as it did not involve direct human research subjects, solely entailing a retrospective examination of existing data.
Results
Of the 102 patients included, 82 were male and 20 were female, with an average age of 71 years. All patients were White with the exception of 1 patient whose race was unknown. Two patients were immunocompromised. The helix was identified as the most frequently involved site on the ear (Table). Most of the tumors (56/102) exhibited aggressive histologic subtypes; 36 tumors had nonaggressive histology, and 10 had no subtype listed. Two of the BCCs demonstrated perineural invasion on biopsy. Mohs micrographic surgery was used to treat 96 BCCs, definitive RT was used to treat 5 BCCs (all of which occurred in nonsurgical candidates), and MMS and adjuvant RT were used in 1 patient given multifocal perineural involvement. All 5 patients treated with definitive RT received electron beam radiation therapy; the total dose ranged from 5100 to 6000 cGy divided into 17 to 24 fractions. The final MMS defects ranged from 6 to 55 mm in size. The average follow-up time was 2.8 years. One of the BCCs on the helix that was treated with MMS recurred after 1.3 years. The overall recurrence rate was 0.98%. None of the patients treated with definitive RT experienced recurrence after the mean follow-up time of 2.8 years.

Comment
Basal cell carcinoma is the most commonly diagnosed cancer in the United States, with approximately 2 million new cases each year.1 Treatment modalities for localized BCC include MMS, surgical excision, electrodesiccation and curettage, topical and intralesional medications, laser therapy, and RT. For high-risk BCCs, MMS is associated with the lowest recurrence rates4 and remains the gold standard for treatment. For patients with contraindications to surgery, definitive RT is an alternative treatment for high-risk BCC.1
Definitive RT can be employed for patients who are poor surgical candidates or when surgery would result in substantial morbidity, impaired function, and/or poor cosmesis.3 Radiation therapy for skin cancers of the ear commonly is administered using high-energy electrons that produce double-strand breaks in the DNA of malignant cells, leading to cell death.4 Disadvantages of RT compared to MMS include a longer treatment course (3 to 6 weeks), possible minimal long-term cosmetic sequelae (eg, color or texture mismatch), lack of pathologic confirmation of margin control, and small risk for secondary malignancy in the treatment field over 2 to 3 decades. For patients with incurable or metastatic disease, palliative RT can provide local control and/or symptomatic relief to improve quality of life.4 Adjuvant RT may be indicated if there is substantial perineural involvement or positive margins after MMS when margins are unable to be achieved or in patients who may not tolerate prolonged or extensive surgical procedures.3
Basal cell carcinoma of the ear is considered a high-risk anatomic location independent of other prognostic factors. Basal cell carcinomas of the ear have a higher propensity for more aggressive histologic subtypes and subclinical spread.5 Our study demonstrated a higher proportion of aggressive histologic subtypes (56/102 [54.9%]) compared with nonaggressive subtypes (36/102 [35.3%]). There was 1 recurrence of a nodular, sclerosing, and infiltrative BCC on the helix treated with MMS after 1.3 years.
Limitations of our study include that it was conducted at a single institution with a homogenous study population and with relatively short follow-up.
Conclusion
Our study further validates the well-known utility of MMS for the treatment of BCC of the ears. Definitive RT is a suitable alternative for patients who are not surgical candidates. Adjuvant RT may be considered for substantial perineural involvement or positive margins after MMS.3
- Lee CT, Lehrer EJ, Aphale A, et al. Surgical excision, Mohs micrographic surgery, external-beam radiotherapy, or brachytherapy for indolent skin cancer: an international meta-analysis of 58 studies with 21,000 patients. Cancer. 2019;125:3582-3594.
- Cameron MC, Lee E, Hibler BP, et al. Basal cell carcinoma: contemporary approaches to diagnosis, treatment, and prevention. J Am Acad Dermatol. 2019;80:321-339.
- Wilmas KM, Garner WB, Ballo MT, et al. The role of radiation therapy in the management of cutaneous malignancies. part II: when is radiation therapy indicated? J Am Acad Dermatol. 2021;85:551-562.
- Wilmas KM, Garner WB, Ballo MT, et al. The role of radiation therapy in the management of cutaneous malignancies. part I: diagnostic modalities and applications. J Am Acad Dermatol. 2021;85:539-548.
- Bichakjian CK, Olencki T, Aasi SZ, et al. Basal cell skin cancer, version 1.2016, NCCN Clinical Practice Guidelines in Oncology. J Natl Compr Canc Netw. 2016;14:574-597.
Basal cell carcinoma (BCC) of the ear may have aggressive histologic subtypes and a greater propensity for subclinical spread than BCC in other anatomic locations. In this retrospective analysis, we evaluated recurrence rates of BCC of the ear in 102 patients who underwent treatment with Mohs micrographic surgery (MMS) or radiation therapy (RT) at a single institution between January 2017 and December 2019. Data on patient demographics, tumor characteristics, treatment modality, and recurrence rates were collected from medical records. Recurrence rates were assessed over a mean follow-up time of 2.8 years. Although MMS is the gold standard for treatment of BCC of the ear, RT may be a suitable alternative for nonsurgical candidates.
Basal cell carcinoma (BCC) of the ear may have aggressive histologic subtypes and a greater propensity for subclinical spread than BCC in other anatomic locations. Given that these aggressive histologic subtypes—defined as morpheaform, basosquamous, sclerosing, infiltrative, or micronodular in any portion of the tumor—have been reported as independent predictors of recurrence,1,2 BCC of the ear may be more likely to recur.
Mohs micrographic surgery (MMS) is the gold standard for the treatment of BCC of the ear. For nonsurgical candidates—those with high bleeding risk, low life expectancy, or other medical or social factors—definitive radiation therapy (RT) may be an option. Our study sought to examine recurrence rates in patients with BCC of the ear treated with MMS vs RT.
Methods
A retrospective review of patients undergoing treatment of BCC of the ear at Bighorn Mohs Surgery and Dermatology Center (San Diego, California) between January 2017 and December 2019 was conducted. A total of 507 medical records were reviewed, and 102 patients were included in the study. Inclusion criteria consisted of biopsy-confirmed BCC of the ear that was treated with MMS, RT, or both. Data on patient demographics, tumor characteristics, treatment modality, and recurrence rates were collected from medical records. This retrospective review of medical records was exempt from institutional review board approval, as it did not involve direct human research subjects, solely entailing a retrospective examination of existing data.
Results
Of the 102 patients included, 82 were male and 20 were female, with an average age of 71 years. All patients were White with the exception of 1 patient whose race was unknown. Two patients were immunocompromised. The helix was identified as the most frequently involved site on the ear (Table). Most of the tumors (56/102) exhibited aggressive histologic subtypes; 36 tumors had nonaggressive histology, and 10 had no subtype listed. Two of the BCCs demonstrated perineural invasion on biopsy. Mohs micrographic surgery was used to treat 96 BCCs, definitive RT was used to treat 5 BCCs (all of which occurred in nonsurgical candidates), and MMS and adjuvant RT were used in 1 patient given multifocal perineural involvement. All 5 patients treated with definitive RT received electron beam radiation therapy; the total dose ranged from 5100 to 6000 cGy divided into 17 to 24 fractions. The final MMS defects ranged from 6 to 55 mm in size. The average follow-up time was 2.8 years. One of the BCCs on the helix that was treated with MMS recurred after 1.3 years. The overall recurrence rate was 0.98%. None of the patients treated with definitive RT experienced recurrence after the mean follow-up time of 2.8 years.
Comment
Basal cell carcinoma is the most commonly diagnosed cancer in the United States, with approximately 2 million new cases each year.1 Treatment modalities for localized BCC include MMS, surgical excision, electrodesiccation and curettage, topical and intralesional medications, laser therapy, and RT. For high-risk BCCs, MMS is associated with the lowest recurrence rates4 and remains the gold standard for treatment. For patients with contraindications to surgery, definitive RT is an alternative treatment for high-risk BCC.1
Definitive RT can be employed for patients who are poor surgical candidates or when surgery would result in substantial morbidity, impaired function, and/or poor cosmesis.3 Radiation therapy for skin cancers of the ear commonly is administered using high-energy electrons that produce double-strand breaks in the DNA of malignant cells, leading to cell death.4 Disadvantages of RT compared to MMS include a longer treatment course (3 to 6 weeks), possible minimal long-term cosmetic sequelae (eg, color or texture mismatch), lack of pathologic confirmation of margin control, and small risk for secondary malignancy in the treatment field over 2 to 3 decades. For patients with incurable or metastatic disease, palliative RT can provide local control and/or symptomatic relief to improve quality of life.4 Adjuvant RT may be indicated if there is substantial perineural involvement or positive margins after MMS when margins are unable to be achieved or in patients who may not tolerate prolonged or extensive surgical procedures.3
Basal cell carcinoma of the ear is considered a high-risk anatomic location independent of other prognostic factors. Basal cell carcinomas of the ear have a higher propensity for more aggressive histologic subtypes and subclinical spread.5 Our study demonstrated a higher proportion of aggressive histologic subtypes (56/102 [54.9%]) compared with nonaggressive subtypes (36/102 [35.3%]). There was 1 recurrence of a nodular, sclerosing, and infiltrative BCC on the helix treated with MMS after 1.3 years.
Limitations of our study include that it was conducted at a single institution with a homogenous study population and with relatively short follow-up.
Conclusion
Our study further validates the well-known utility of MMS for the treatment of BCC of the ears. Definitive RT is a suitable alternative for patients who are not surgical candidates. Adjuvant RT may be considered for substantial perineural involvement or positive margins after MMS.3
- Lee CT, Lehrer EJ, Aphale A, et al. Surgical excision, Mohs micrographic surgery, external-beam radiotherapy, or brachytherapy for indolent skin cancer: an international meta-analysis of 58 studies with 21,000 patients. Cancer. 2019;125:3582-3594.
- Cameron MC, Lee E, Hibler BP, et al. Basal cell carcinoma: contemporary approaches to diagnosis, treatment, and prevention. J Am Acad Dermatol. 2019;80:321-339.
- Wilmas KM, Garner WB, Ballo MT, et al. The role of radiation therapy in the management of cutaneous malignancies. part II: when is radiation therapy indicated? J Am Acad Dermatol. 2021;85:551-562.
- Wilmas KM, Garner WB, Ballo MT, et al. The role of radiation therapy in the management of cutaneous malignancies. part I: diagnostic modalities and applications. J Am Acad Dermatol. 2021;85:539-548.
- Bichakjian CK, Olencki T, Aasi SZ, et al. Basal cell skin cancer, version 1.2016, NCCN Clinical Practice Guidelines in Oncology. J Natl Compr Canc Netw. 2016;14:574-597.
PRACTICE POINTS
- Basal cell carcinoma (BCC) of the ear may have aggressive histologic subtypes and a greater propensity for subclinical spread than BCC in other anatomic locations, highlighting the importance of careful management and follow-up.
- Although Mohs micrographic surgery remains the gold standard for treating BCC of the ear, radiation therapy can be considered as a suitable alternative for nonsurgical candidates.

Risk for COVID-19 Infection in Patients With Vitiligo
To the Editor:
Vitiligo is a depigmentation disorder that results from the loss of melanocytes in the epidermis.1 The most widely accepted pathophysiology for melanocyte destruction in vitiligo is an autoimmune process involving dysregulated cytokine production and autoreactive T-cell activation.1 Individuals with cutaneous autoinflammatory conditions currently are vital patient populations warranting research, as their susceptibility to COVID-19 infection may differ from the general population. We previously found a small increased risk for COVID-19 infection in patients with psoriasis,2 which suggests that other dermatologic conditions also may impact COVID-19 risk. The risk for COVID-19 infection in patients with vitiligo remains largely unknown. In this retrospective cohort study, we investigated the risk for COVID-19 infection in patients with vitiligo compared with those without vitiligo utilizing claims data from the COVID-19 Research Database (https://covid19researchdatabase.org/).
Claims were evaluated for patients aged 3 years and older with a vitiligo diagnosis (International Classification of Diseases, Tenth Revision [ICD-10] code L80) that was made between January 1, 2016, and January 1, 2020. Individuals without a vitiligo diagnosis during the same period were placed (4:1 ratio) in the control group and were matched with study group patients for age and sex. All comorbidity variables and vitiligo diagnoses were extracted from ICD-10 codes that were given prior to a diagnosis of COVID-19. We then constructed multivariable logistic regression models adjusting for measured confounders to evaluate if vitiligo was associated with higher risk for COVID-19 infection after January 1, 2020.
The vitiligo and nonvitiligo cohorts included 40,363 and 161,452 patients, respectively (Table 1). Logistic regression analysis with adjustment for confounding variables, including high comorbid risk factors (Table 2) revealed that patients with a diagnosis of vitiligo had significantly increased odds of COVID-19 infection compared with patients without vitiligo (adjusted odds ratio [AOR], 1.47; 95% CI, 1.37-1.57; P<.001)(Table 3). Additionally, subgroup logistic analyses for sex, age, and exclusion of patients who were HIV positive revealed that females with vitiligo had higher odds of contracting COVID-19 than males with vitiligo (Table 3).

Our results showed that patients with vitiligo had a higher relative risk for contracting COVID-19 than individuals without vitiligo. It has been reported that the prevalence of COVID-19 is higher among patients with autoimmune diseases compared to the general population.3 Additionally, a handful of vitiligo patients are managed with immunosuppressive agents that may further weaken their immune response.1 Moreover, survey results from dermatologists managing vitiligo patients revealed that physicians were fairly comfortable prescribing immunosuppressants and encouraging in-office phototherapy during the COVID-19 pandemic.4 As a result, more patients may have been attending in-office visits for their phototherapy, which may have increased their risk for COVID-19. Although these factors play a role in COVID-19 infection rates, the underlying immune dysregulation in vitiligo in relation to COVID-19 remains unknown and should be further explored.

Our findings are limited by the use of ICD-10 codes, the inability to control for all potential confounding variables, the lack of data regarding the stage of vitiligo, and the absence of data for undiagnosed COVID-19 infections. In addition, patients with vitiligo may be more likely to seek care, potentially increasing their rates of COVID-19 testing. The inability to identify the stage of vitiligo during enrollment in the database may have altered our results, as individuals with active disease have increased levels of IFN-γ. Increased secretion of IFN-γ also potentially helps in the clearance of COVID-19 infection.1 Future studies should investigate this relationship via planned COVID-19 testing, identification of vitiligo stage, and controlling for other associated comorbidities.

- Rashighi M, Harris JE. Vitiligo pathogenesis and emerging treatments. Dermatol Clin. 2017;35:257-265. doi:10.1016/j.det.2016.11.014
- Wu JJ, Liu J, Thatiparthi A, et al. The risk of COVID-19 in patients with psoriasis—a retrospective cohort study [published online September 20, 2022]. J Am Acad Dermatol. doi:10.1016/j.jaad.2022.07.040
- Zhong J, Shen G, Yang H, et al. COVID-19 in patients with rheumatic disease in Hubei province, China: a multicentre retrospective observational study. Lancet Rheumatol. 2020;2:E557-E564. doi:10.1016/S2665-9913(20)30227-7
- Chatterjee M, Das A. Management of vitiligo amidst the COVID-19 pandemic: a survey and resulting consensus. Indian J Dermatol. 2021;66:479-483. doi:10.4103/ijd.ijd_859_20
To the Editor:
Vitiligo is a depigmentation disorder that results from the loss of melanocytes in the epidermis.1 The most widely accepted pathophysiology for melanocyte destruction in vitiligo is an autoimmune process involving dysregulated cytokine production and autoreactive T-cell activation.1 Individuals with cutaneous autoinflammatory conditions currently are vital patient populations warranting research, as their susceptibility to COVID-19 infection may differ from the general population. We previously found a small increased risk for COVID-19 infection in patients with psoriasis,2 which suggests that other dermatologic conditions also may impact COVID-19 risk. The risk for COVID-19 infection in patients with vitiligo remains largely unknown. In this retrospective cohort study, we investigated the risk for COVID-19 infection in patients with vitiligo compared with those without vitiligo utilizing claims data from the COVID-19 Research Database (https://covid19researchdatabase.org/).
Claims were evaluated for patients aged 3 years and older with a vitiligo diagnosis (International Classification of Diseases, Tenth Revision [ICD-10] code L80) that was made between January 1, 2016, and January 1, 2020. Individuals without a vitiligo diagnosis during the same period were placed (4:1 ratio) in the control group and were matched with study group patients for age and sex. All comorbidity variables and vitiligo diagnoses were extracted from ICD-10 codes that were given prior to a diagnosis of COVID-19. We then constructed multivariable logistic regression models adjusting for measured confounders to evaluate if vitiligo was associated with higher risk for COVID-19 infection after January 1, 2020.
The vitiligo and nonvitiligo cohorts included 40,363 and 161,452 patients, respectively (Table 1). Logistic regression analysis with adjustment for confounding variables, including high comorbid risk factors (Table 2) revealed that patients with a diagnosis of vitiligo had significantly increased odds of COVID-19 infection compared with patients without vitiligo (adjusted odds ratio [AOR], 1.47; 95% CI, 1.37-1.57; P<.001)(Table 3). Additionally, subgroup logistic analyses for sex, age, and exclusion of patients who were HIV positive revealed that females with vitiligo had higher odds of contracting COVID-19 than males with vitiligo (Table 3).
Our results showed that patients with vitiligo had a higher relative risk for contracting COVID-19 than individuals without vitiligo. It has been reported that the prevalence of COVID-19 is higher among patients with autoimmune diseases compared to the general population.3 Additionally, a handful of vitiligo patients are managed with immunosuppressive agents that may further weaken their immune response.1 Moreover, survey results from dermatologists managing vitiligo patients revealed that physicians were fairly comfortable prescribing immunosuppressants and encouraging in-office phototherapy during the COVID-19 pandemic.4 As a result, more patients may have been attending in-office visits for their phototherapy, which may have increased their risk for COVID-19. Although these factors play a role in COVID-19 infection rates, the underlying immune dysregulation in vitiligo in relation to COVID-19 remains unknown and should be further explored.
Our findings are limited by the use of ICD-10 codes, the inability to control for all potential confounding variables, the lack of data regarding the stage of vitiligo, and the absence of data for undiagnosed COVID-19 infections. In addition, patients with vitiligo may be more likely to seek care, potentially increasing their rates of COVID-19 testing. The inability to identify the stage of vitiligo during enrollment in the database may have altered our results, as individuals with active disease have increased levels of IFN-γ. Increased secretion of IFN-γ also potentially helps in the clearance of COVID-19 infection.1 Future studies should investigate this relationship via planned COVID-19 testing, identification of vitiligo stage, and controlling for other associated comorbidities.
- Rashighi M, Harris JE. Vitiligo pathogenesis and emerging treatments. Dermatol Clin. 2017;35:257-265. doi:10.1016/j.det.2016.11.014
- Wu JJ, Liu J, Thatiparthi A, et al. The risk of COVID-19 in patients with psoriasis—a retrospective cohort study [published online September 20, 2022]. J Am Acad Dermatol. doi:10.1016/j.jaad.2022.07.040
- Zhong J, Shen G, Yang H, et al. COVID-19 in patients with rheumatic disease in Hubei province, China: a multicentre retrospective observational study. Lancet Rheumatol. 2020;2:E557-E564. doi:10.1016/S2665-9913(20)30227-7
- Chatterjee M, Das A. Management of vitiligo amidst the COVID-19 pandemic: a survey and resulting consensus. Indian J Dermatol. 2021;66:479-483. doi:10.4103/ijd.ijd_859_20
Practice Points
- The underlying autoimmune process in vitiligo can result in various changes to the immune system.
- A diagnosis of vitiligo may alter the body’s immune response to COVID-19 infection.