User login
The Daily Safety Brief in a Safety Net Hospital: Development and Outcomes
From the MetroHealth Medical Center, Cleveland, OH.
Abstract
- Objective: To describe the process for the creation and development of the Daily Safety Brief (DSB) in our safety net hospital.
- Methods: We developed the DSB, a daily interdepartmental briefing intended to increase the safety of patients, employees, and visitors by improving communication and situational awareness. Situational awareness involves gathering the right information, analyzing it, and making predictions and projections based on the analysis. Reporting issues while they are small oftentimes makes them easier to manage. The average call length with 25 departments reporting is just 9.5 minutes.
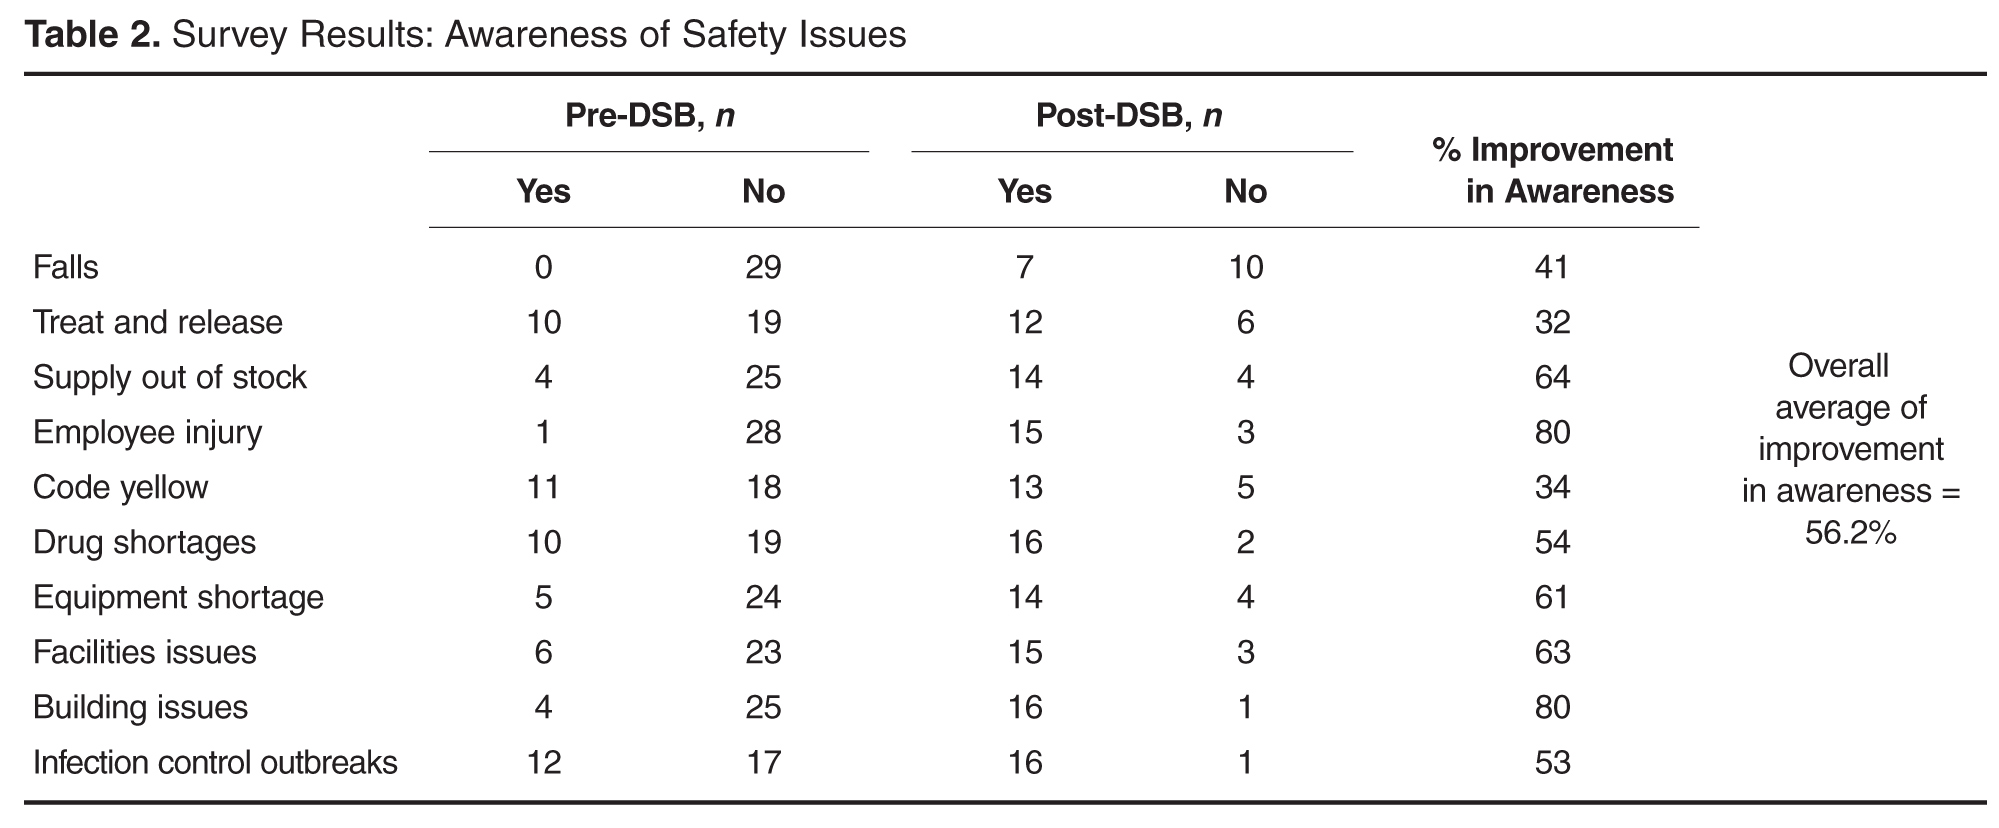
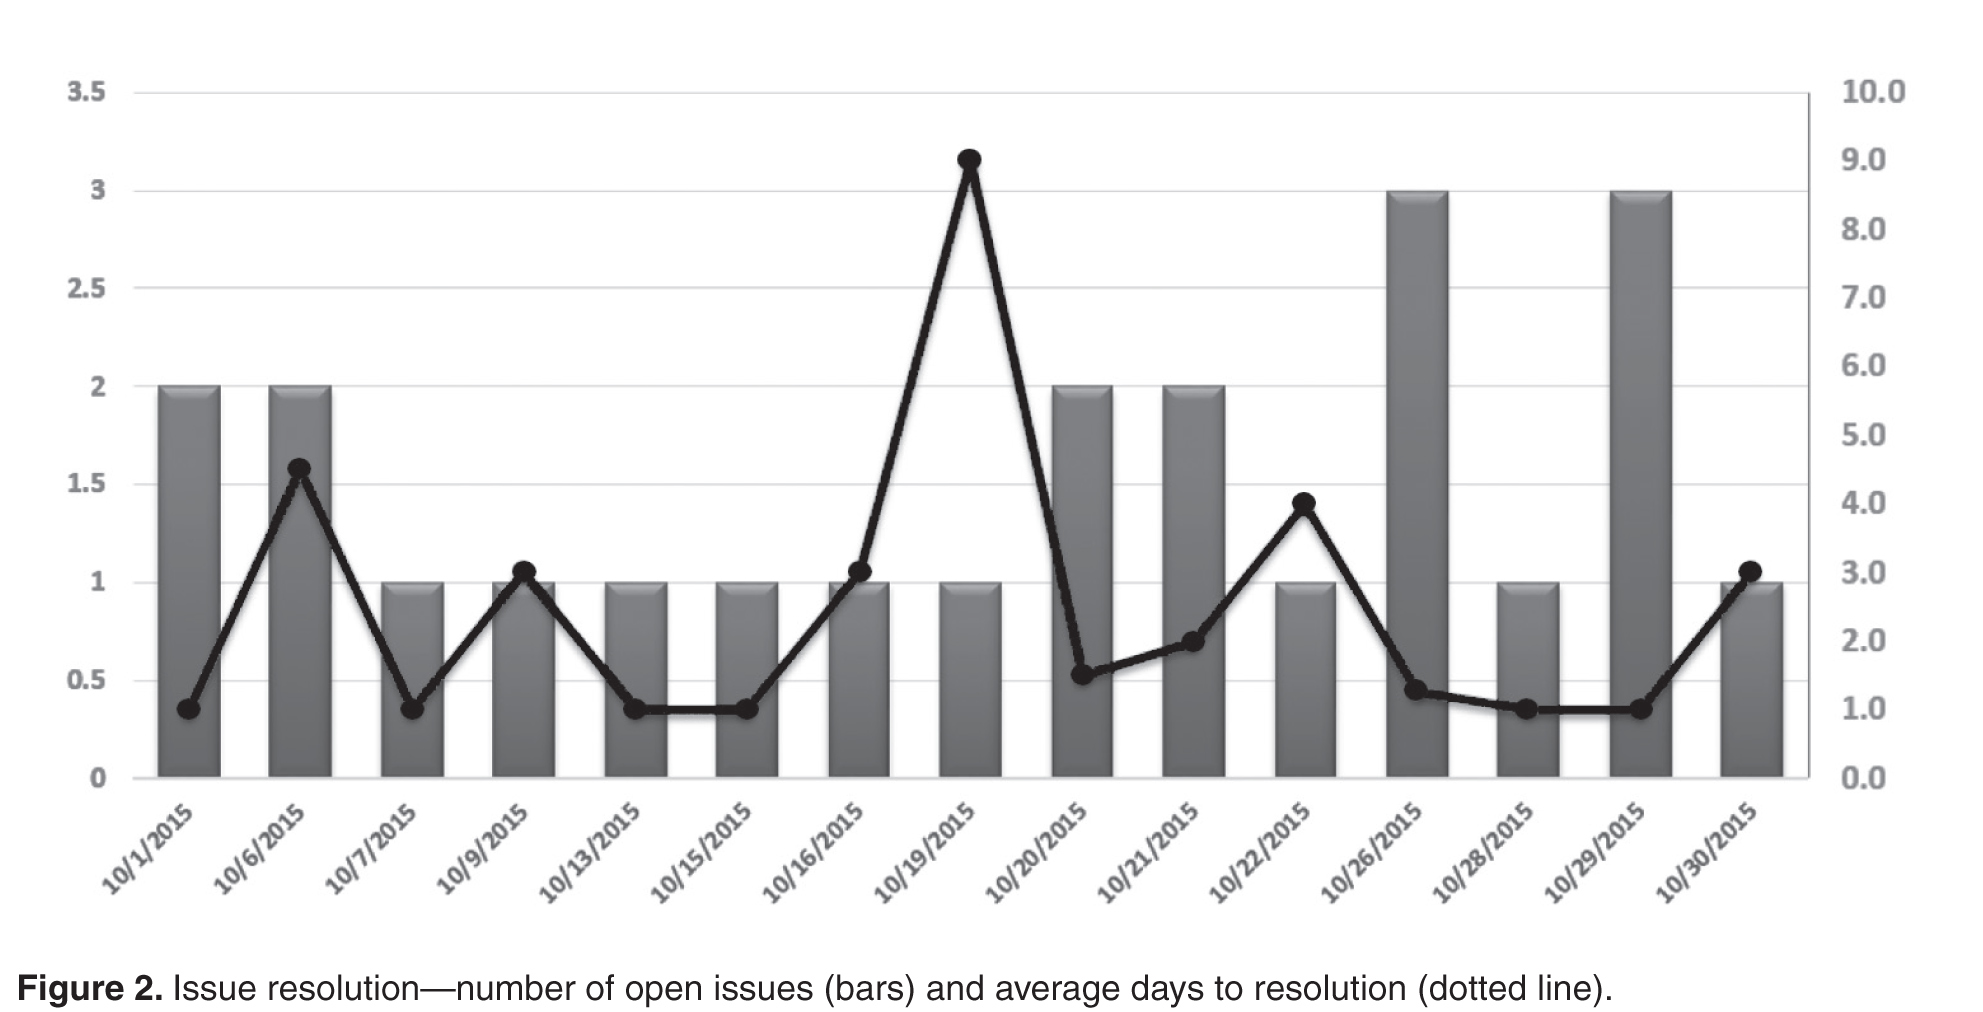
- Results: Survey results reveal an overall average improvement in awareness among DSB participants about hospital safety issues. Average days to issue resolution is currently 2.3 days, with open issues tracked and reported on daily.
- Conclusion: The DSB has improved real-time communication and awareness about safety issues in our organization.
As health care organizations strive to ensure a culture of safety for patients and staff, they must also be able to demonstrate reliability in that culture. The concept of highly reliable organizations originated in aviation and military fields due to the high-stakes environment and need for rapid and effective communication across departments. High reliability in health care organizations is described by the Joint Commission as consistent excellence in quality and safety for every patient, every time [1].
Highly reliable organizations put systems in place that makes them resilient with methods that lead to consistent accomplishment of goals and strategies to avoid potentially catastrophic errors [2]. An integral component to success in all high reliability organizations is a method of “Plan-of-the-Day” meetings to keep staff apprised of critical updates throughout the health system impacting care delivery [3]. Leaders at MetroHealth Medical Center believed that a daily safety briefing would help support the hospital’s journey to high reliability. We developed the Daily Safety Brief (DSB), a daily interdepartmental briefing intended to increase the safety of patients, employees, and visitors by improving communication and situational awareness. Situational awareness involves gathering the right information, analyzing it, and making predictions and projections based on the analysis [4]. Reporting issues while they are small oftentimes makes them easier to manage. This article will describe the development and implementation of the DSB in our hospital.
Setting
MetroHealth Medical Center is an academic medical center in Cleveland, OH, affiliated with Case Western Reserve University. Metrohealth is a public safety net hospital with 731 licensed beds and a total of 1,160,773 patient visits in 2014, with 27,933 inpatient stays and 106,000 emergency department (ED) visits. The staff includes 507 physicians, 374 resident physicians, and 1222 nurses.
Program Development
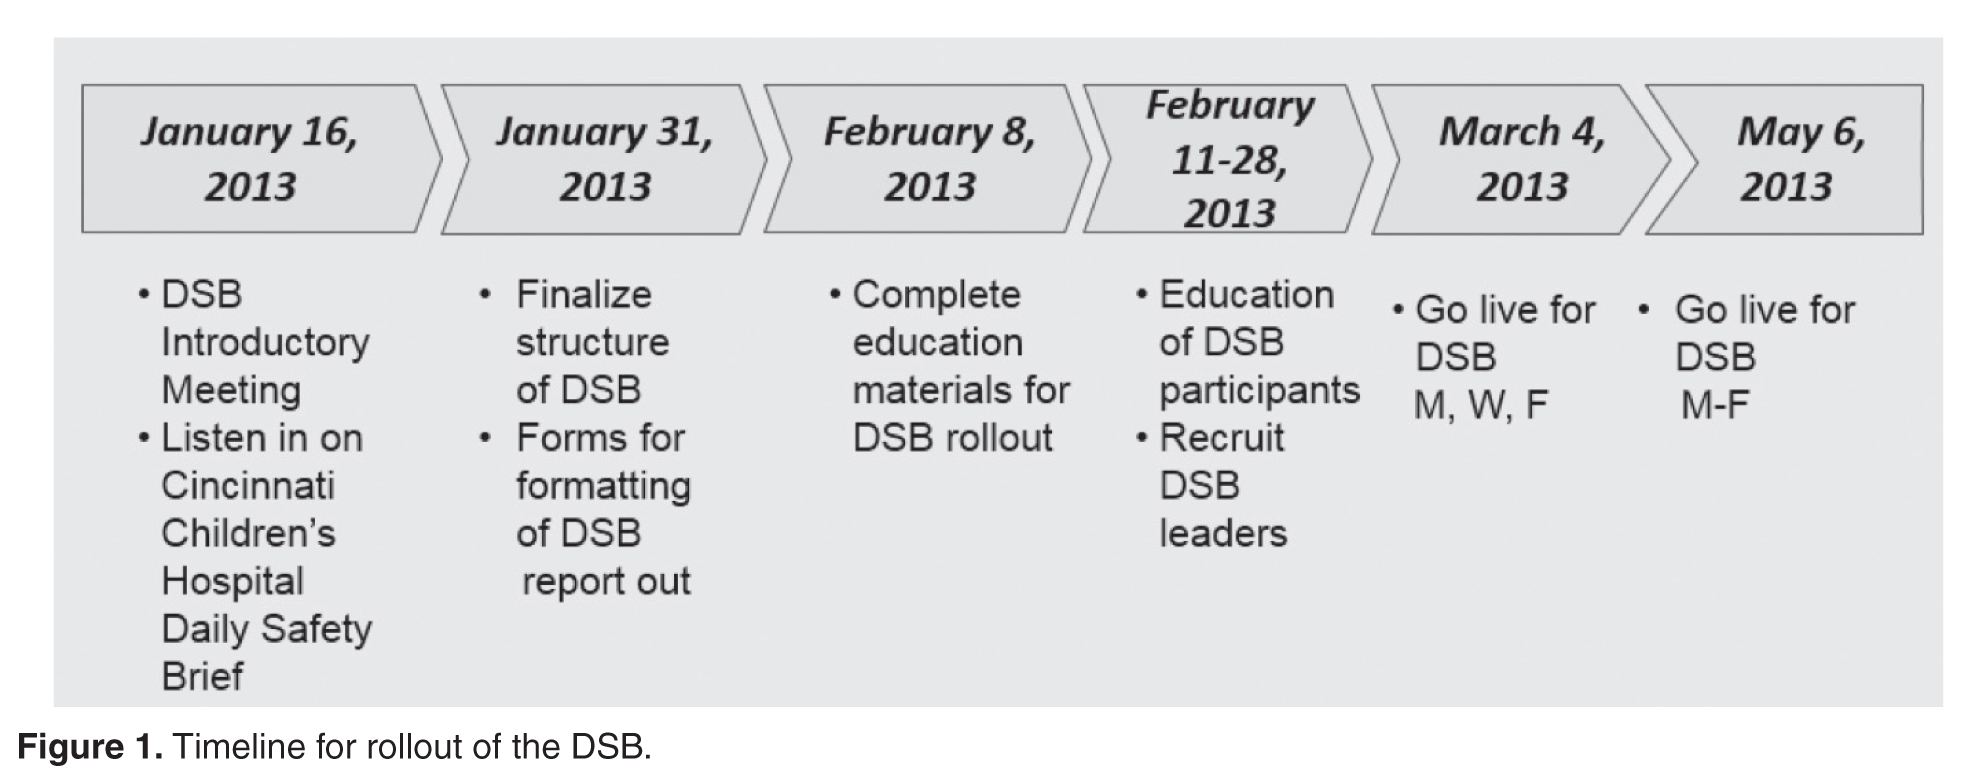
As Metrohealth was contemplating the DSB, a group of senior leaders, including the chief medical officer, visited the Cincinnati Children’s Hospital, which had a DSB process in place. Following that visit, a larger group of physicians and administrators from intake points, procedural areas, and ancillary departments were invited to listen in live to Cincinnati’s DSB. This turned out to be a pivotal step in gaining buy-in. The initial concerns from participants were that this would be another scheduled meeting in an already busy day. What we learned from listening in was that the DSB was conducted in a manner that was succinct and professional. Issues were identified without accusations or unrelated agendas. Following the call, participants discussed how impressed they were and clearly saw the value of the information that was shared. They began to brainstorm about what they could report that would be relevant to the audience.
It was determined that a leader and 2 facilitators would be assigned to each call. The role of the DSB leader is to trigger individual department report outs and to ensure follow-up on unresolved safety issues from the previous DSB. Leaders are recruited by senior leadership and need to be familiar with the effects that issues can have across the health care system. Leaders need to be able to ask pertinent questions, have the credibility to raise concerns, and have access to senior administration when they need to bypass usual administrative channels.
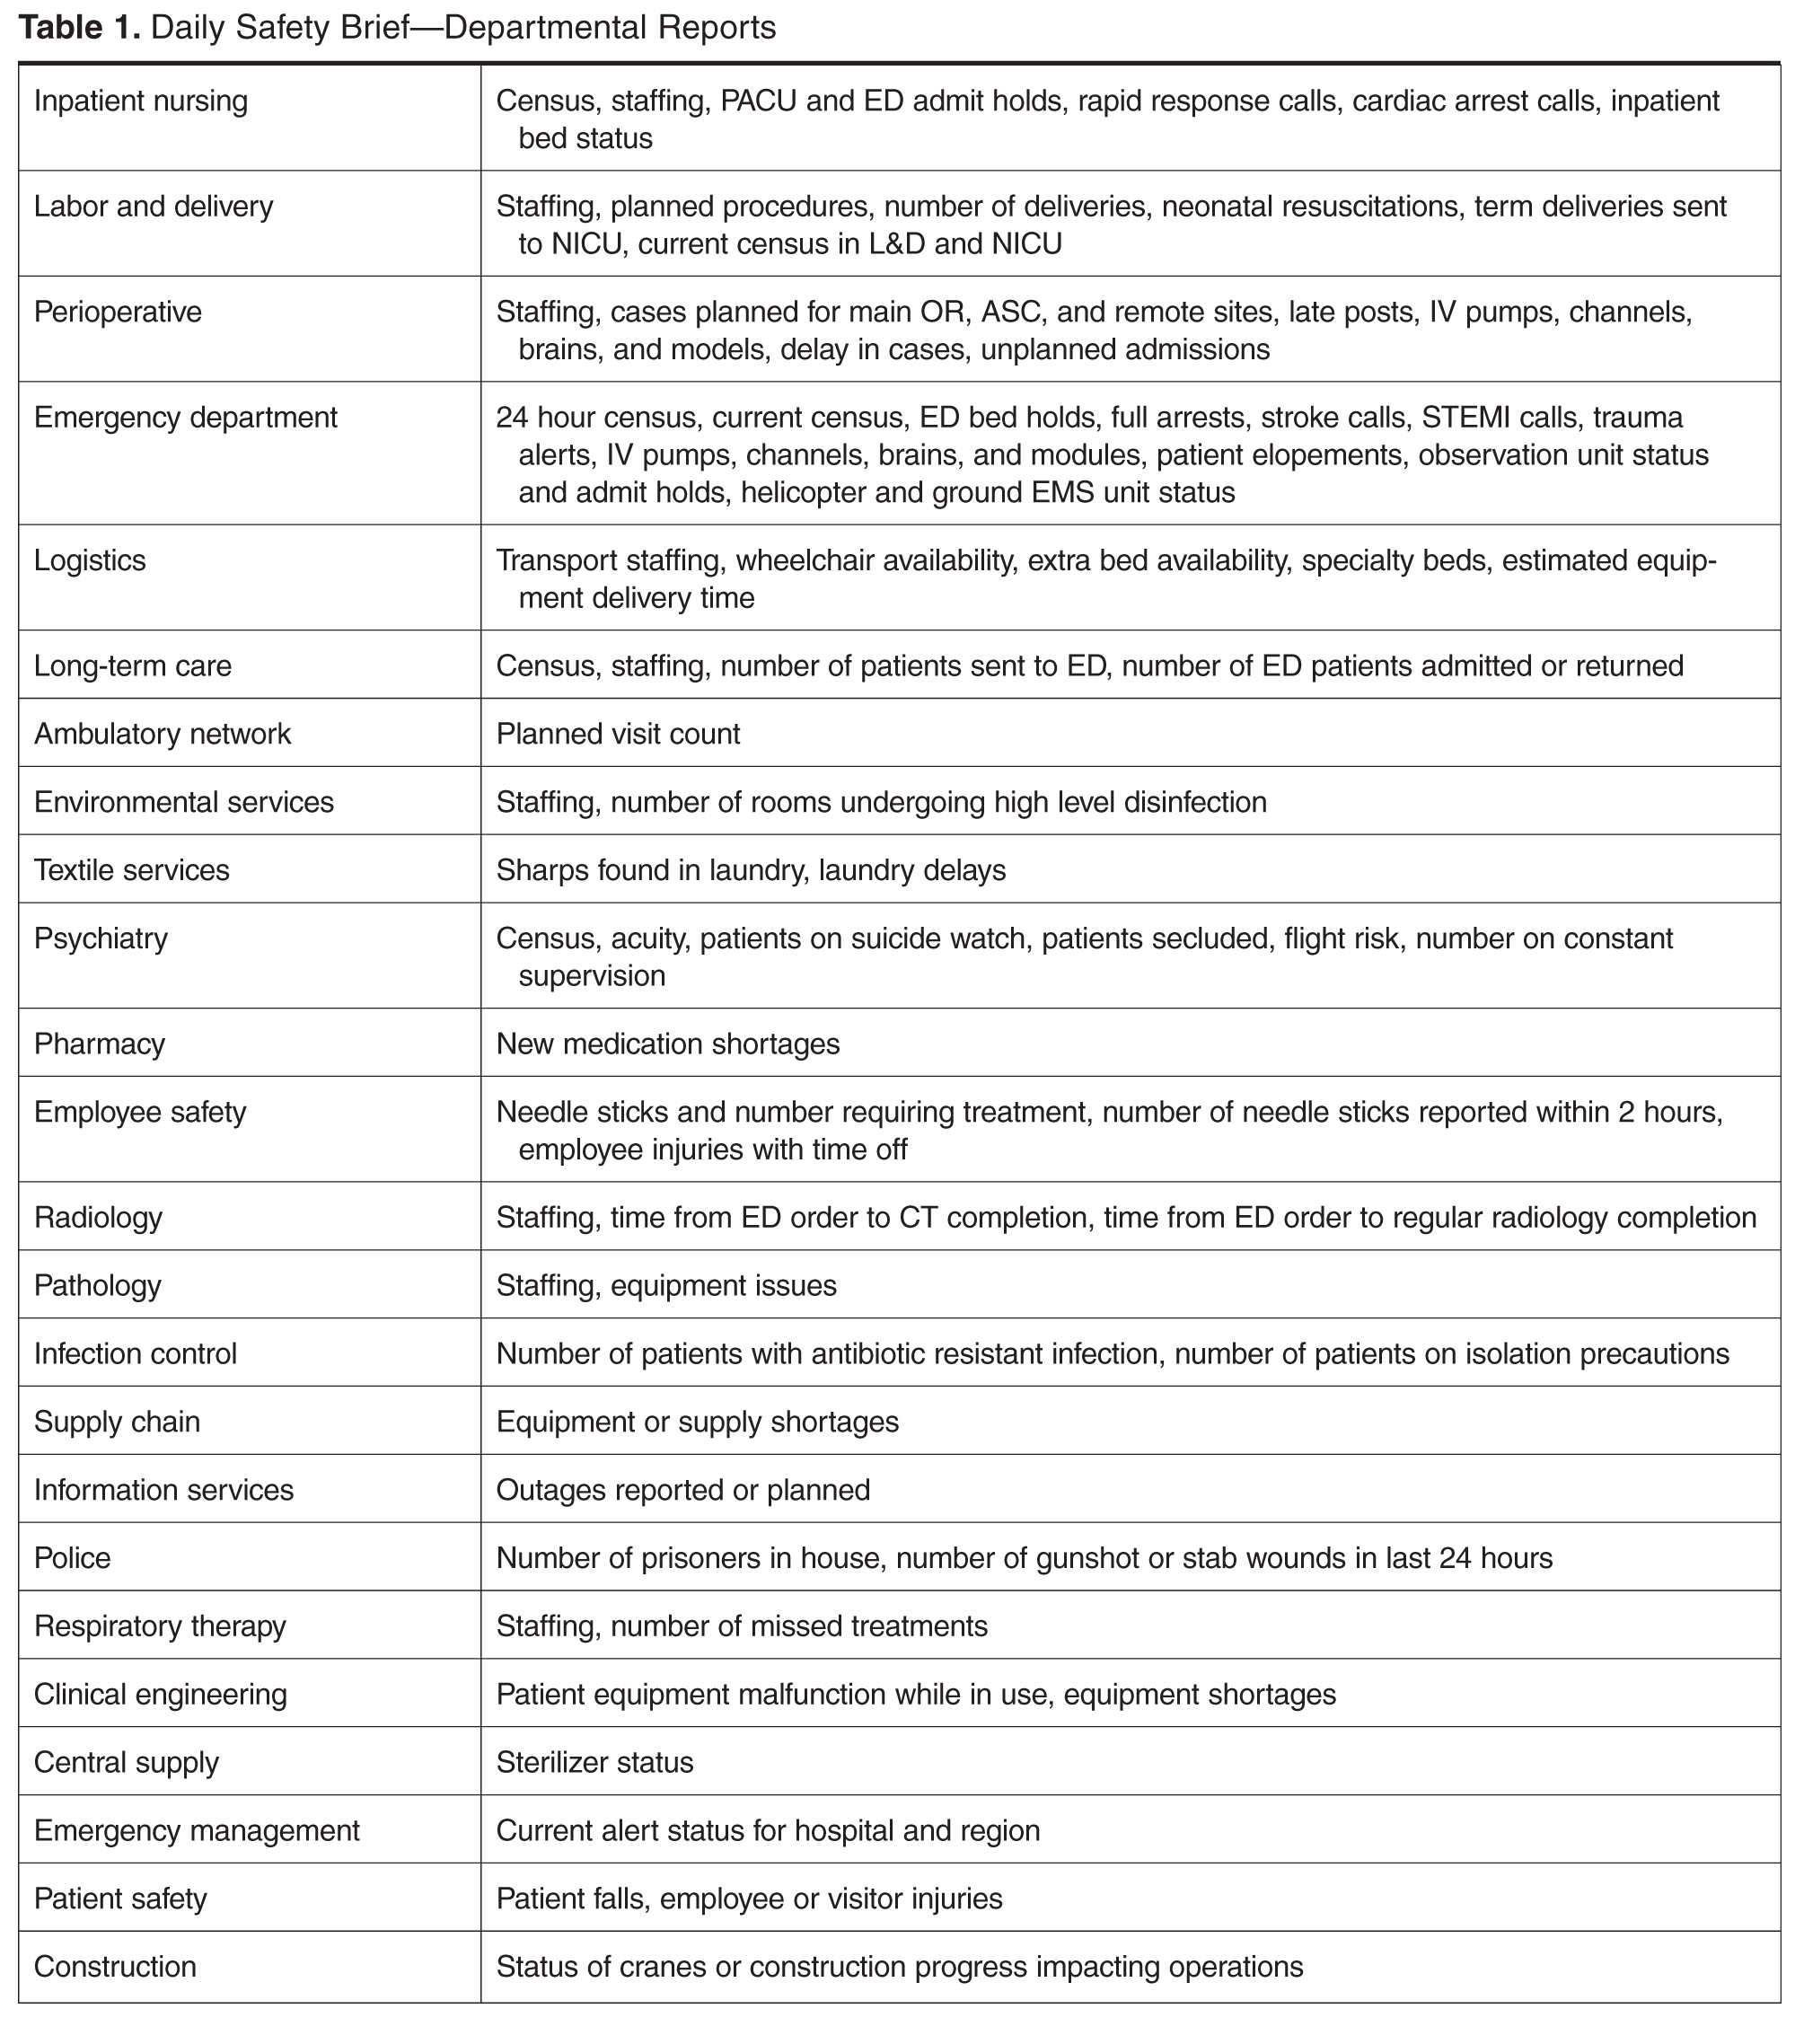
The role of the facilitators, who are all members of the Center for Quality, is to connect to the conference bridge line, to keep the DSB leader on task, and to record all departmental data and pertinent details of the DSB. The facilitators maintain the daily DSB document, which outlines the order in which departments are called to report and identifies for the leader any open items identified in the previous day’s DSB.
The Daily Safety Brief
Rollout
The DSB began 3 days per week on Monday, Wednesday and Friday at 0830. The time was moved to 0800 since participants found the later time difficult as it fell in the middle of an hour, potentially conflicting with other meetings and preparation for the daily bed huddle. We recognized that many meetings began right at the start of the DSB. The CEO requested that all 0800 meetings begin with a call in to listen to the DSB. After 2 months, the frequency was increased to 5 days per week, Monday through Friday. The hospital trialed a weekend DSB, however, feedback from participants found this extremely difficult to attend due to leaner weekend staffing models and found that information shared was not impactful. In particular, items were identified on the weekend daily safety briefs but the staff needed to resolve those items were generally not available until Monday.
Refinements
Coaching occurred to help people be more succinct in sharing information that would impact other areas. Information that was relevant only internally to their department was streamlined. The participants were counseled to identify items that had potential impact on other departments or where other departments had resources that might improve operations.
After a year, participating departments requested the addition of the logistics and construction departments to the DSB. The addition of the logistics department offered the opportunity for clinical departments to communicate what equipment was needed to start the day and created the opportunity for logistics to close the feedback loop by giving an estimate on expected time of arrival of equipment. The addition of the construction department helped communicate issues that may impact the organization, and helps to coordinate care to minimally impact patients and operations.
Examples of Safety Improvements
The DSB keeps the departmental leadership aware of problems developing in all areas of the hospital. Upcoming safety risks are identified early so that plans can be put in place to ameliorate them. The expectation of the DSB leader is that a problem that isn’t readily solved during the DSB must be taken to senior administration for resolution. As an example, an issue involving delays in the purchase of a required neonatal ventilator was taken directly to the CEO by the DSB leader, resulting in completion of the purchase within days. Importantly, the requirement to report at the DSB leads to a preoccupation with risk and reporting and leads to transparency among interdependent departments.
Another issue effectively addressed by the DSB was when we received notification of a required mandatory power shutdown for an extended period of time. The local power company informed our facilities management department director that they discovered issues requiring urgent replacement of the transformer within 2 weeks. Facilities management reported this in the morning DSB. The DSB leader requested all stakeholders to stay on the call following completion of the DSB, and plans were set in motion to plan for the shutdown of power. The team agreed to conference call again at noon the same day to continue planning, and the affected building was prepared for the shutdown by the following day.
Another benefit of the DSB is illustrated by our inpatient psychiatry unit, which reports an acuity measure each day on a scale of 1 to 10. The MetroHealth Police Department utilizes the report to adjust their rounding schedule, with increased presence on days with high acuity, which has led to an improvement in morale among psychiatry unit staff.
Challenges and Solutions
Since these reports are available to a wide audience in the organization, it is important to assure the reporters that no repercussions will ensue from any information that they provide. Senior leadership was enlisted to communicate with their departments that no repercussions would occur from reporting. As an example, some managers reported to the DSB development team privately that their supervisors were concerned about reporting of staff shortages on the DSB. As the shortages had patient care implications and affected other clinical departments, the DSB development team met with the involved supervisors to address the need for open reporting. In fact, repeated reporting of shortages in one support department on the DSB resulted in that issue being taken to high levels of administration leading to an increase in their staffing levels.
Scheduling can be a challenge for DSB participants. Holding the DSB at 0800 has led some departments to delegate the reporting or information gathering. For the individual reporting departments, creating a reporting workflow was a challenge. The departments needed to ensure that their DSB report was ready to go by 0800. This timeline forced departments to improve their own interdepartmental communication structure. An unexpected benefit of this requirement is that some departments have created a morning huddle to share information, which has reportedly improved communication and morale. The ambulatory network created a separate shared database for clinics to post concerns meeting DSB reporting criteria. One designated staff member would access this collective information when preparing for the DSB report. While most departments have a senior manager providing their report, this is not a requirement. In many departments, that reporter varies from day to day, although consistently it is someone with some administrative or leadership role in the department.
Conference call technology presented the solution to the problem of acquiring a meeting space for a large group. The DSB is broadcast from one physical location, where the facilitators and leader convene. While this conference room is open to anyone who wants to attend in person, most departments choose to participate through the conference line. The DSB conference call is open to anyone in the organization to access. Typically 35 to 40 phones are accessing the line each DSB. Challenges included callers not muting their phones, creating distracting background noise, and callers placing their phones on hold, which prompted the hospital hold message to play continuously. Multiple repeated reminders via email and at the start of the DSB has rectified this issue for the most part, with occasional reminders made when the issue recurs.
Data Management
Initially, an Excel file was created with columns for each reporting department as well as each item they were asked to report on. This “running” file became cumbersome. Retrieving information on past issues was not automated. Therefore, we enlisted the help of a data analyst to create an Access database. When it was complete, this new database allowed us to save information by individual dates, query number of days to issue resolution, and create reports noting unresolved issues for the leader to reference. Many data points can be queried in the access database. Real-time reports are available at all times and updated with every data entry. The database is able to identify departments not on the daily call and trend information, ie, how many listeners were on the DSB, number of falls, forensic patients in house, number of patients awaiting admission from the ED, number of ambulatory visits scheduled each day, equipment needed, number of cardiac arrest calls, and number of neonatal resuscitations.
At the conclusion of the call, the DSB report is completed and posted to a shared website on the hospital intranet for the entire hospital to access and read. Feedback from participant indicated that they found it cumbersome to access this. The communications department was enlisted to enable easy access and staff can now access the DSB report from the front page of the hospital intranet.
Outcomes
Since initiation of our DSB, we have tracked the average number of minutes spent on each call. When calls began, the average time on the call was 12.4 minutes. With the evolution of the DSB and coaching managers in various departments, the average time on the call is now 9.5 minutes in 2015, despite additional reporting departments joining the DSB.
Summary
The DSB has become an important tool in creating and moving towards a culture of safety and high reliability within the MetroHealth System. Over time, processes have become organized and engrained in all departments. This format has allowed issues to be brought forward timely where immediate attention can be given to achieve resolution in a nonthreatening manner, improving transparency. The fluidity of the DSB allows it to be enhanced and modified as improvements and opportunities are identified in the organization. The DSB has provided opportunities to create situational awareness which allows a look forward to prevention and creates a proactive environment. The results of these efforts has made MetroHealth a safer place for patients, visitors, and employees.
Corresponding author: Anne M. Aulisio, MSN, aaulisio@metrohealth.org.
Financial disclosures: None.
1. Joint Commission Center for Transforming Healthcare. Available at www.centerfortransforminghealthcare.org.
2. Gamble M. 5 traits of high reliability organizations: how to hardwire each in your organization. Becker’s Hospital Review 29 Apr 2013. Accessed at www.beckershospitalreview.com/hospital-management-administration/5-traits-of-high-reliability-organizations-how-to-hardwire-each-in-your-organization.html.
3. Stockmeier C, Clapper C. Daily check-in for safety: from best practice to common practice. Patient Safety Qual Healthcare 2011:23. Accessed at psqh.com/daily-check-in-for-safety-from-best-practice-to-common-practice.
4. Creating situational awareness: a systems approach. In: Institute of Medicine (US) Forum on Medical and Public Health Preparedness for Catastrophic Events. Medical surge capacity: workshop summary. Washington, DC: National Academies Press; 2010. Accessed at www.ncbi.nlm.nih.gov/books/NBK32859/.
5. TeamSTEPPS. Available at www.ahrq.gov/professionals/education/curriculum-tools/teamstepps/index.html.
From the MetroHealth Medical Center, Cleveland, OH.
Abstract
- Objective: To describe the process for the creation and development of the Daily Safety Brief (DSB) in our safety net hospital.
- Methods: We developed the DSB, a daily interdepartmental briefing intended to increase the safety of patients, employees, and visitors by improving communication and situational awareness. Situational awareness involves gathering the right information, analyzing it, and making predictions and projections based on the analysis. Reporting issues while they are small oftentimes makes them easier to manage. The average call length with 25 departments reporting is just 9.5 minutes.
- Results: Survey results reveal an overall average improvement in awareness among DSB participants about hospital safety issues. Average days to issue resolution is currently 2.3 days, with open issues tracked and reported on daily.
- Conclusion: The DSB has improved real-time communication and awareness about safety issues in our organization.
As health care organizations strive to ensure a culture of safety for patients and staff, they must also be able to demonstrate reliability in that culture. The concept of highly reliable organizations originated in aviation and military fields due to the high-stakes environment and need for rapid and effective communication across departments. High reliability in health care organizations is described by the Joint Commission as consistent excellence in quality and safety for every patient, every time [1].
Highly reliable organizations put systems in place that makes them resilient with methods that lead to consistent accomplishment of goals and strategies to avoid potentially catastrophic errors [2]. An integral component to success in all high reliability organizations is a method of “Plan-of-the-Day” meetings to keep staff apprised of critical updates throughout the health system impacting care delivery [3]. Leaders at MetroHealth Medical Center believed that a daily safety briefing would help support the hospital’s journey to high reliability. We developed the Daily Safety Brief (DSB), a daily interdepartmental briefing intended to increase the safety of patients, employees, and visitors by improving communication and situational awareness. Situational awareness involves gathering the right information, analyzing it, and making predictions and projections based on the analysis [4]. Reporting issues while they are small oftentimes makes them easier to manage. This article will describe the development and implementation of the DSB in our hospital.
Setting
MetroHealth Medical Center is an academic medical center in Cleveland, OH, affiliated with Case Western Reserve University. Metrohealth is a public safety net hospital with 731 licensed beds and a total of 1,160,773 patient visits in 2014, with 27,933 inpatient stays and 106,000 emergency department (ED) visits. The staff includes 507 physicians, 374 resident physicians, and 1222 nurses.
Program Development
As Metrohealth was contemplating the DSB, a group of senior leaders, including the chief medical officer, visited the Cincinnati Children’s Hospital, which had a DSB process in place. Following that visit, a larger group of physicians and administrators from intake points, procedural areas, and ancillary departments were invited to listen in live to Cincinnati’s DSB. This turned out to be a pivotal step in gaining buy-in. The initial concerns from participants were that this would be another scheduled meeting in an already busy day. What we learned from listening in was that the DSB was conducted in a manner that was succinct and professional. Issues were identified without accusations or unrelated agendas. Following the call, participants discussed how impressed they were and clearly saw the value of the information that was shared. They began to brainstorm about what they could report that would be relevant to the audience.
It was determined that a leader and 2 facilitators would be assigned to each call. The role of the DSB leader is to trigger individual department report outs and to ensure follow-up on unresolved safety issues from the previous DSB. Leaders are recruited by senior leadership and need to be familiar with the effects that issues can have across the health care system. Leaders need to be able to ask pertinent questions, have the credibility to raise concerns, and have access to senior administration when they need to bypass usual administrative channels.
The role of the facilitators, who are all members of the Center for Quality, is to connect to the conference bridge line, to keep the DSB leader on task, and to record all departmental data and pertinent details of the DSB. The facilitators maintain the daily DSB document, which outlines the order in which departments are called to report and identifies for the leader any open items identified in the previous day’s DSB.
The Daily Safety Brief
Rollout
The DSB began 3 days per week on Monday, Wednesday and Friday at 0830. The time was moved to 0800 since participants found the later time difficult as it fell in the middle of an hour, potentially conflicting with other meetings and preparation for the daily bed huddle. We recognized that many meetings began right at the start of the DSB. The CEO requested that all 0800 meetings begin with a call in to listen to the DSB. After 2 months, the frequency was increased to 5 days per week, Monday through Friday. The hospital trialed a weekend DSB, however, feedback from participants found this extremely difficult to attend due to leaner weekend staffing models and found that information shared was not impactful. In particular, items were identified on the weekend daily safety briefs but the staff needed to resolve those items were generally not available until Monday.
Refinements
Coaching occurred to help people be more succinct in sharing information that would impact other areas. Information that was relevant only internally to their department was streamlined. The participants were counseled to identify items that had potential impact on other departments or where other departments had resources that might improve operations.
After a year, participating departments requested the addition of the logistics and construction departments to the DSB. The addition of the logistics department offered the opportunity for clinical departments to communicate what equipment was needed to start the day and created the opportunity for logistics to close the feedback loop by giving an estimate on expected time of arrival of equipment. The addition of the construction department helped communicate issues that may impact the organization, and helps to coordinate care to minimally impact patients and operations.
Examples of Safety Improvements
The DSB keeps the departmental leadership aware of problems developing in all areas of the hospital. Upcoming safety risks are identified early so that plans can be put in place to ameliorate them. The expectation of the DSB leader is that a problem that isn’t readily solved during the DSB must be taken to senior administration for resolution. As an example, an issue involving delays in the purchase of a required neonatal ventilator was taken directly to the CEO by the DSB leader, resulting in completion of the purchase within days. Importantly, the requirement to report at the DSB leads to a preoccupation with risk and reporting and leads to transparency among interdependent departments.
Another issue effectively addressed by the DSB was when we received notification of a required mandatory power shutdown for an extended period of time. The local power company informed our facilities management department director that they discovered issues requiring urgent replacement of the transformer within 2 weeks. Facilities management reported this in the morning DSB. The DSB leader requested all stakeholders to stay on the call following completion of the DSB, and plans were set in motion to plan for the shutdown of power. The team agreed to conference call again at noon the same day to continue planning, and the affected building was prepared for the shutdown by the following day.
Another benefit of the DSB is illustrated by our inpatient psychiatry unit, which reports an acuity measure each day on a scale of 1 to 10. The MetroHealth Police Department utilizes the report to adjust their rounding schedule, with increased presence on days with high acuity, which has led to an improvement in morale among psychiatry unit staff.
Challenges and Solutions
Since these reports are available to a wide audience in the organization, it is important to assure the reporters that no repercussions will ensue from any information that they provide. Senior leadership was enlisted to communicate with their departments that no repercussions would occur from reporting. As an example, some managers reported to the DSB development team privately that their supervisors were concerned about reporting of staff shortages on the DSB. As the shortages had patient care implications and affected other clinical departments, the DSB development team met with the involved supervisors to address the need for open reporting. In fact, repeated reporting of shortages in one support department on the DSB resulted in that issue being taken to high levels of administration leading to an increase in their staffing levels.
Scheduling can be a challenge for DSB participants. Holding the DSB at 0800 has led some departments to delegate the reporting or information gathering. For the individual reporting departments, creating a reporting workflow was a challenge. The departments needed to ensure that their DSB report was ready to go by 0800. This timeline forced departments to improve their own interdepartmental communication structure. An unexpected benefit of this requirement is that some departments have created a morning huddle to share information, which has reportedly improved communication and morale. The ambulatory network created a separate shared database for clinics to post concerns meeting DSB reporting criteria. One designated staff member would access this collective information when preparing for the DSB report. While most departments have a senior manager providing their report, this is not a requirement. In many departments, that reporter varies from day to day, although consistently it is someone with some administrative or leadership role in the department.
Conference call technology presented the solution to the problem of acquiring a meeting space for a large group. The DSB is broadcast from one physical location, where the facilitators and leader convene. While this conference room is open to anyone who wants to attend in person, most departments choose to participate through the conference line. The DSB conference call is open to anyone in the organization to access. Typically 35 to 40 phones are accessing the line each DSB. Challenges included callers not muting their phones, creating distracting background noise, and callers placing their phones on hold, which prompted the hospital hold message to play continuously. Multiple repeated reminders via email and at the start of the DSB has rectified this issue for the most part, with occasional reminders made when the issue recurs.
Data Management
Initially, an Excel file was created with columns for each reporting department as well as each item they were asked to report on. This “running” file became cumbersome. Retrieving information on past issues was not automated. Therefore, we enlisted the help of a data analyst to create an Access database. When it was complete, this new database allowed us to save information by individual dates, query number of days to issue resolution, and create reports noting unresolved issues for the leader to reference. Many data points can be queried in the access database. Real-time reports are available at all times and updated with every data entry. The database is able to identify departments not on the daily call and trend information, ie, how many listeners were on the DSB, number of falls, forensic patients in house, number of patients awaiting admission from the ED, number of ambulatory visits scheduled each day, equipment needed, number of cardiac arrest calls, and number of neonatal resuscitations.
At the conclusion of the call, the DSB report is completed and posted to a shared website on the hospital intranet for the entire hospital to access and read. Feedback from participant indicated that they found it cumbersome to access this. The communications department was enlisted to enable easy access and staff can now access the DSB report from the front page of the hospital intranet.
Outcomes
Since initiation of our DSB, we have tracked the average number of minutes spent on each call. When calls began, the average time on the call was 12.4 minutes. With the evolution of the DSB and coaching managers in various departments, the average time on the call is now 9.5 minutes in 2015, despite additional reporting departments joining the DSB.
Summary
The DSB has become an important tool in creating and moving towards a culture of safety and high reliability within the MetroHealth System. Over time, processes have become organized and engrained in all departments. This format has allowed issues to be brought forward timely where immediate attention can be given to achieve resolution in a nonthreatening manner, improving transparency. The fluidity of the DSB allows it to be enhanced and modified as improvements and opportunities are identified in the organization. The DSB has provided opportunities to create situational awareness which allows a look forward to prevention and creates a proactive environment. The results of these efforts has made MetroHealth a safer place for patients, visitors, and employees.
Corresponding author: Anne M. Aulisio, MSN, aaulisio@metrohealth.org.
Financial disclosures: None.
1. Joint Commission Center for Transforming Healthcare. Available at www.centerfortransforminghealthcare.org.
2. Gamble M. 5 traits of high reliability organizations: how to hardwire each in your organization. Becker’s Hospital Review 29 Apr 2013. Accessed at www.beckershospitalreview.com/hospital-management-administration/5-traits-of-high-reliability-organizations-how-to-hardwire-each-in-your-organization.html.
3. Stockmeier C, Clapper C. Daily check-in for safety: from best practice to common practice. Patient Safety Qual Healthcare 2011:23. Accessed at psqh.com/daily-check-in-for-safety-from-best-practice-to-common-practice.
4. Creating situational awareness: a systems approach. In: Institute of Medicine (US) Forum on Medical and Public Health Preparedness for Catastrophic Events. Medical surge capacity: workshop summary. Washington, DC: National Academies Press; 2010. Accessed at www.ncbi.nlm.nih.gov/books/NBK32859/.
5. TeamSTEPPS. Available at www.ahrq.gov/professionals/education/curriculum-tools/teamstepps/index.html.
A Novel Emergency Department Surge Protocol: Implementation of a Targeted Response Plan
From the Ottawa Hospital, Ottawa, ON Canada.
Abstract
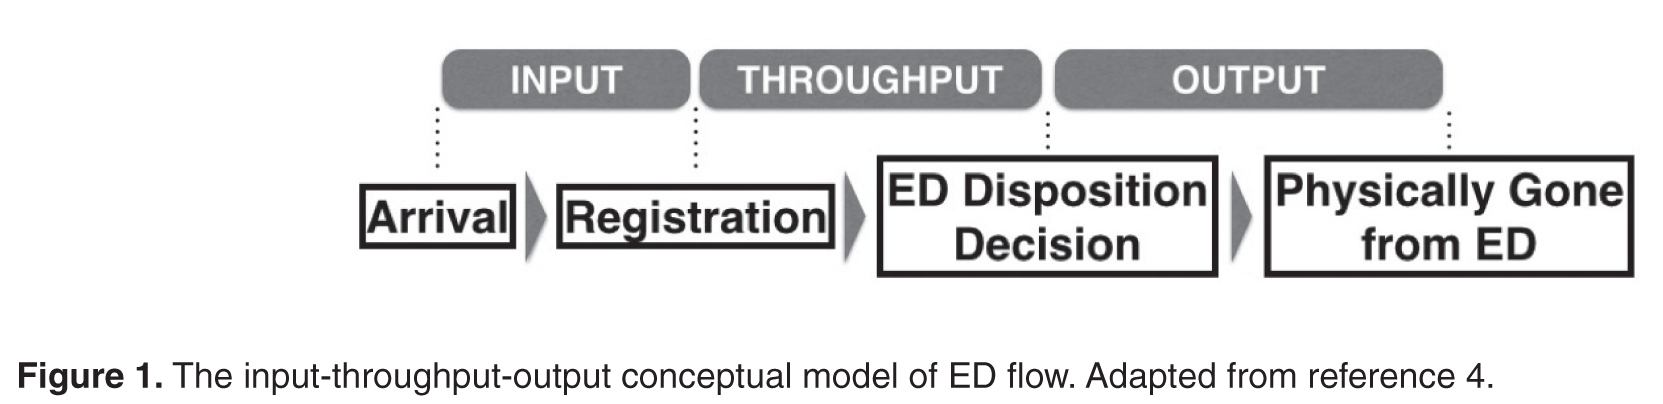
- Objective: Fluctuations in emergency department (ED) visits occur frequently, and traditional global measures of ED crowding do not allow for targeted responses to address root causes. We sought to develop, implement, and evaluate a novel ED surge protocol based on the input-throughput-output (ITO) model of ED flow.
- Methods: This initiative took place at a tertiary care academic teaching hospital. An inter-professional group developed and validated metrics for various levels of surge in relation to the ITO model, measured every 2 hours, which directly linked to specific actions targeting root causes within those components. Main outcome measure was defined as the frequency of sustained (≥ 6 hours) high surges, a marker of inability to respond effectively.
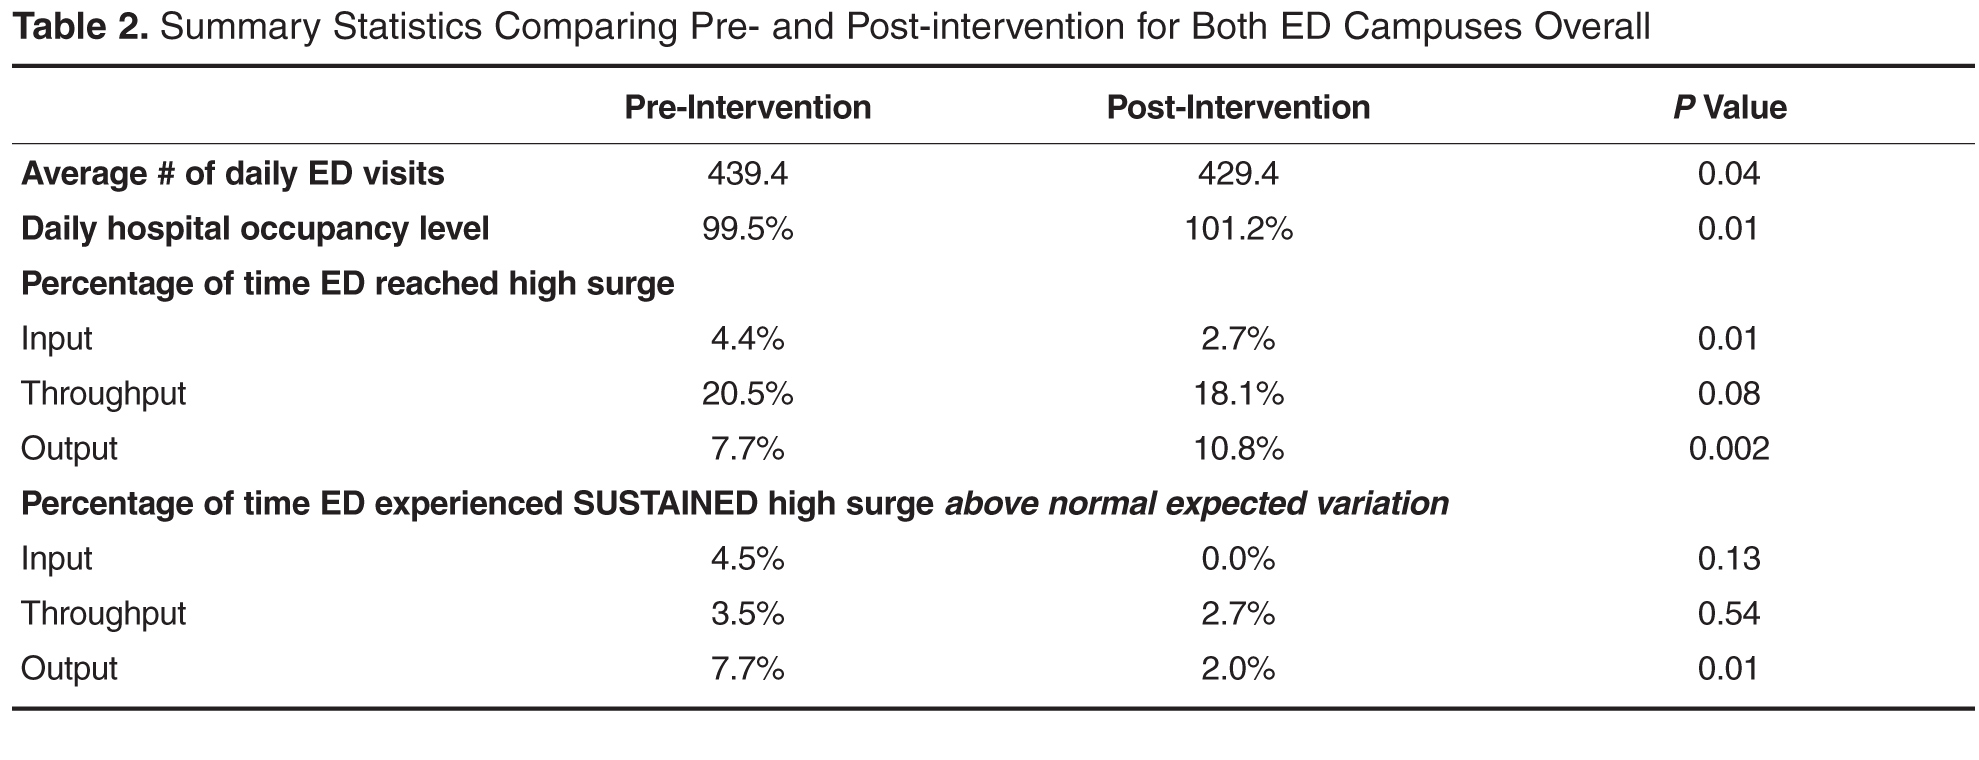
- Results: During the 6-month study period, average daily hospital occupancy levels rose above 100% (pre 99.5%, post 101.2%; P = 0.01) and frequency of high surges in the output component increased (pre 7.7%, post 10.8%; P = 0.002). Despite this, frequency of sustained high surges remained stable for input (pre 4.5%, post 0.0%; P = 0.13) and throughput (pre 3.5%, post 2.7%; P = 0.54), while improvement in output reached statistical significance (pre 7.7%, post 2.0%, P = 0.01).
- Conclusions: The ED surge protocol led to effective containment of daily high surges despite significant increase in hospital occupancy levels. This is the first study to describe an ED surge plan capable of identifying within which ITO component surge is happening and linking actions to address specific causes. We believe this protocol can be adapted for any ED.
Emergency department (ED) crowding has been defined as “a situation where the demand for emergency services exceeds the ability to provide care in a reasonable amount of time” [1]. Crowding is an increasingly common occurrence in hospital-based EDs, and overcrowding of EDs has been shown to adversely affect the delivery of emergency care and results in increased patient morbidity and mortality [2,3]. Furthermore, the nature of medical emergencies dictates that rapid daily changes (or surges) in patient volume and acuity occur frequently and unpredictably, contributing to the difficulty of matching resources to demands. Accurate understanding and continuous measurement of where bottlenecks may be occurring within an ED are critical to an effective response to ED surges.
Many of the widely used measurement tools for overcrowding produce one final overall net value on a one-dimensional scale, failing to capture the complexity of the root causes of surges. For example, the National ED Overcrowding Study (NEDOCS) scoring system, validated at various centers and widely used and studied [5–7] utilizes a number of institutional and situational variables to calculate a final NEDOCS score, which translates to “Not Busy,” “Busy,” “Overcrowded,” “Severely Overcrowded,” or “Dangerously Overcrowded” as a global state. Other published scoring systems such as the Emergency Department Work Index (EDWIN), while performing well in comparison to subjective impressions of physicians and nurses, also suffers from computation of a single final score, which makes it difficult to tie to specific actions or solutions [8]. Other surrogate markers quantifying ED crowding have also been used, such as left-without-being-seen rates, ambulance diversions, and total number of boarded patients in the ED; yet they too only measure consequences of crowding and provide little diagnostic information on when and where specific ED surges are actually happening throughout the day [9].
Responding to ED Surges
An effective surge plan should ensure the delivery of safe, effective care in response to various input/throughput/output surges in a coordinated and standardized manner. The ideal ED surge plan should include (1) a prospective continuous tool/method that accurately gauges the surge level (based on objective measures) in various components of the Input-Throughput-Output model of the department, (2) standardized targeted actions that are tied to specific triggers identified within that model to ensure effective solutions, and (3) built-in contingency plans for escalation in the face of sustained/worsening surges. Few studies have been published describing successful implementation of ED surge protocols, with the majority being linked to global ED crowding measures such as the NEDOCS score [10]. As a result, it is difficult to tease out the specific targeted actions that are most effective in dealing with the root causes of a surge.
Local Problem
Prior to the quality improvement initiative we describe below, the Ottawa Hospital ED had no formal process or method of measuring daily surges nor any standardized action plan to respond effectively to those surges. The state of “busy-ness” was often defined by gut feelings of frontline workers, which was quite variable depending on the individuals in charge of departmental patient flow. Often, actions to try and mitigate rising ED surges were triggered too late, resulting in consistent gridlock in the ED that lasted many hours. Several near-misses as well as actual critical incidences had occurred as a result of ineffective management of ED surges, and the authors of this initiative were tasked by senior hospital leadership with designing and implementing a novel solution.
Objectives
We describe our approach to the development, implementation, and evaluation of a novel ED surge protocol at a tertiary care academic hospital based on the principles cited above. Specifically, we sought to:
- define various levels of ED surge and to provide a common language for better communication between all stakeholders
- incorporate the validated Input-Throughput-Output model of ED flow to provide a conceptual framework for measuring surges in real-time and developing targeted action plans
- standardize ED and organizational responses to various ED surges based on identified bottlenecks
- measure and evaluate the effectiveness of the ED surge plan implementation
- continuously modify and improve the ED surge protocol using quality improvement strategies
Methods
Setting
The Ottawa Hospital is an academic tertiary care center with 3 campuses (Civic, General, and Riverside), with the ED providing coverage at 2 physical emergency rooms. The hospital is the regional trauma center as well as referral destination for many subspecialties such as cardiac, vascular and neurosurgical emergencies. This 1163-bed facility handles over 160,000 emergency visits a year, over 1 million ambulatory care visits a year, and roughly 35,000 surgical cases annually. The ED is staffed by 78 staff physicians, approximately 250 registered nurses (RNs), and ~50 emergency medicine residents/trainees.
The EDs are supported by a computerized tracking system that provides real-time metrics. This information is displayed by ED-specific geographical area on electronic whiteboards, which can be accessed on overhead monitors, desktop computers, and personal iPads. Information available to ED physicians and staff at any time includes individual-level data such as location, demographics, Canadian Triage Acuity Score (CTAS), and presenting complaint as well as departmental-level data such as patient volumes, wait times, length of stay (LOS), pending/completed diagnostics, consultation status and final dispositions.
According to the policy and standard operating procedures that govern research at the Ottawa Hospital Research Institute, this work met criteria for quality improvement activities exempt from ethics review.
Intervention
Over a 4-day period care facilitators were polled on an hourly basis to determine what factors were important to the in determining how “busy” they perceived the ED to be. These factors included but were not limited to: total number of patients waiting to be seen; time to physician initial assessment; number of monitored beds available; and number of admitted patients boarded in the ED. Analysis was done to prospectively compare their perception of surge levels to the proposed Surge Plan metrics, and to ensure that the individual criteria for each level was practically meaningful and accurate.
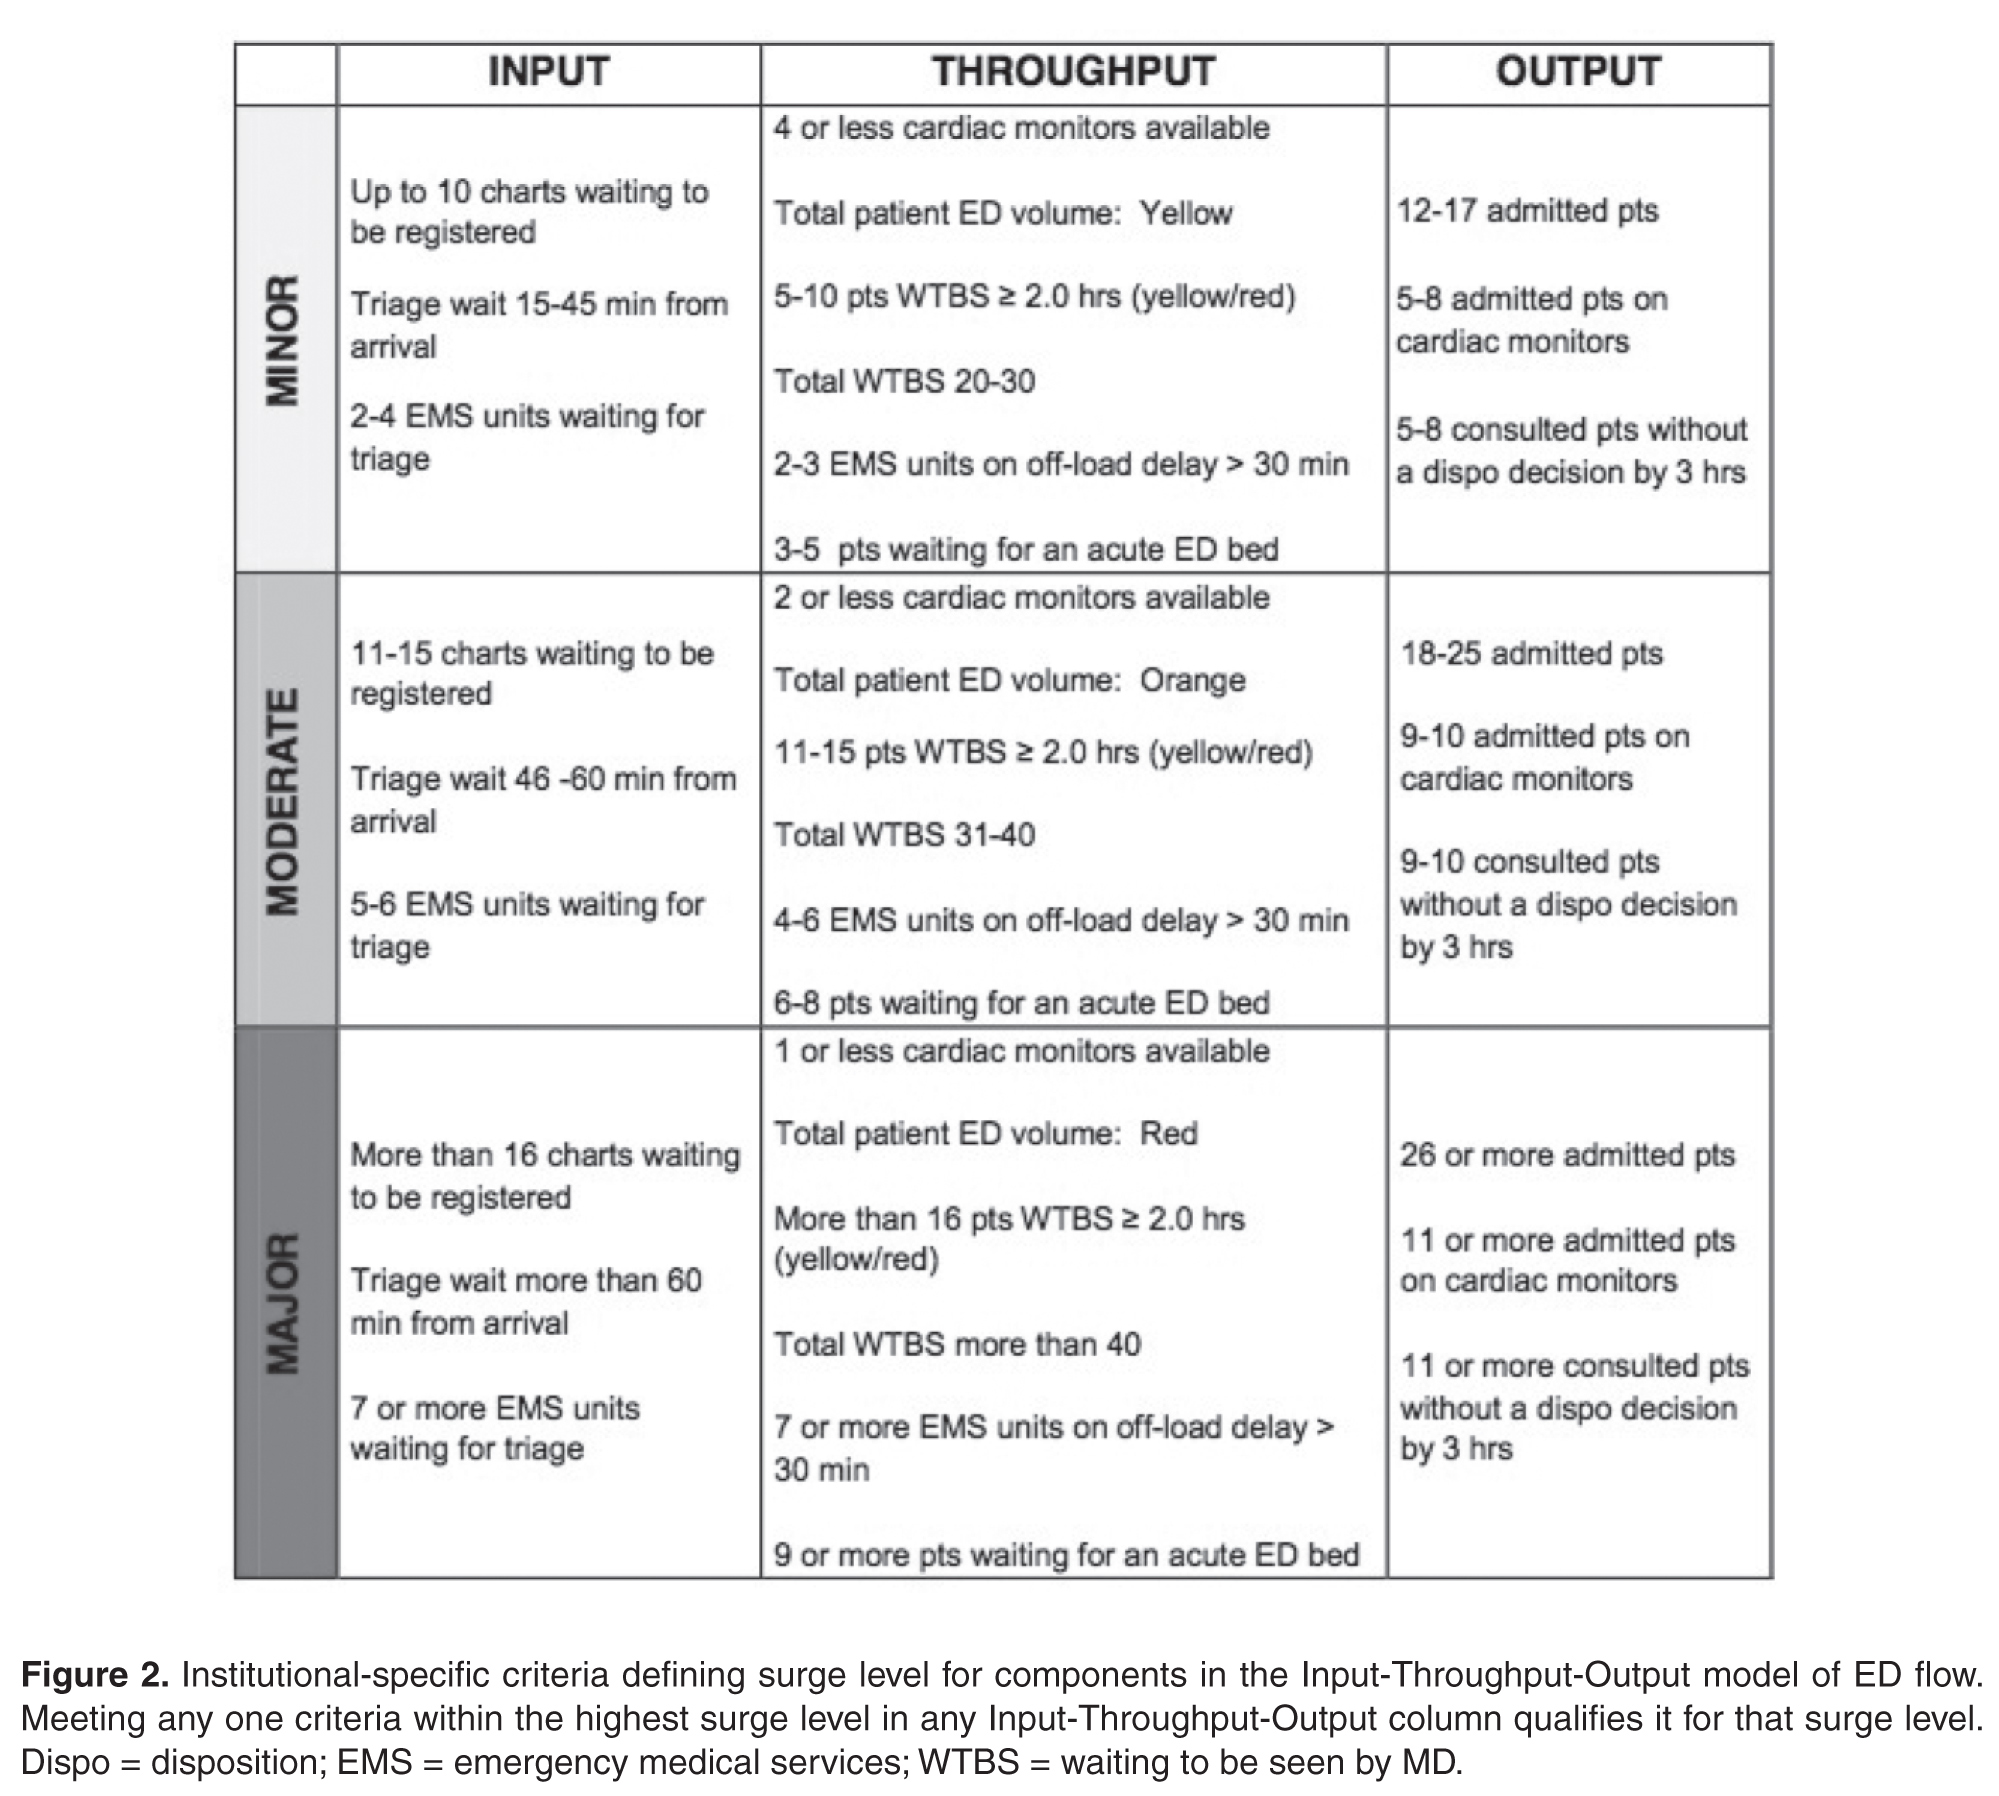
Next, a set of standardized action and response plans were developed and agreed upon that tied specifically to a corresponding component of the different measured ED surge levels (these action plans are detailed in an online Appendix and are also available from the author). The fundamental guiding principles behind the development of each action item was that it should (1) target underlying causes - in a standardized way - specific to the relevant Input-Throughput-Output surge, (2) provide escalating level of effectiveness for each corresponding escalation in the surge level (eg, contacting a staff physician directly for a disposition decision for patents consulted in the ED, if the resident trainees have failed to do so in a timely manner), and (3) coordinate actions by various stakeholders in a planned and organized manner. Practically, the standardized targeted actions span across 5 different roles, which were explicitly listed on action sheets for care facilitators, clinical managers, patient flow managers, evening and night coordinators, and clinical directors.
Stakeholder Engagement

Implementation and Continuous Improvement
Given the complexity of the ED- and hospital-wide nature of the surge protocol, implementation was done over multiple phases and Plan-Do-Study-Act (PDSA) improvement cycles:
Phase I (Apr 2013 - Jun 2013)
The initial proposed ED surge level metrics were measured at a single ED campus. Care facilitators were trained and asked to measure surge levels in the ED every 2 hours. This served as a testing period to gauge the sensitivity and reliability of our proposed surge level metrics, and no actual action items were triggered during this period. Stakeholder meetings were held to determine feasibility of the plan, validate the proposed metrics, and develop “standard work” action plans for each stakeholder group in response to the metrics. This first phase also allowed care facilitators to objectively reflect on ED surge patterns throughout the day, and provided everyone in the ED team a frequent global snapshot of how “busy” the department was at any time. Finally, surge level data during this phase confirmed previous suspicions that the Output component was the biggest driver behind overall ED surge level.
Throughout this phase, the ED clinical manager recorded all the usual actions taken in response to the different level of surges as felt appropriate by the individual care facilitator on duty. The variety of actions and types of escalations were collected and fed back to weekly workgroup meetings to help further refine crafting of standardized action plans for implementation of the surge protocol.
Phase II (June - Aug 2013)
An initial trial of a limited ED surge protocol was rolled out at both ED campuses, with actual action items being triggered in response to specific surge level metrics. The main focus of this PDSA cycle was to collect data on how the care facilitator groups at the 2 campuses utilized the surge protocol, as well as feedback on usability, barriers, and effectiveness. Regular audits were performed to ensure surge measurement and compliance rates. Educational sessions were provided regarding rationale and purpose of the plan so that all team members had a better understanding of ED surges. Frequent meetings with stakeholders to share updates continued throughout Phase II, allowing further engagement as well as fine-tuning of stakeholder action plans based on real-time experiences.
Phase III (Aug 2013 - Dec 2013)
The next phase of implementation expanded beyond the ED and included the hospital’s off-hours and off-service management group. This in effect was the official corporate roll-out of the ED surge protocol including full action plans for all stakeholders, including off-service clinical administrators, inpatient flow managers, and the director of emergency and critical care. Regular audits were performed to ensure compliance of measurement every 2 hours as well as performance of specified action items related to each surge level, with the actual surge level measurement completion rates of 98%.
Data Collection and Analysis
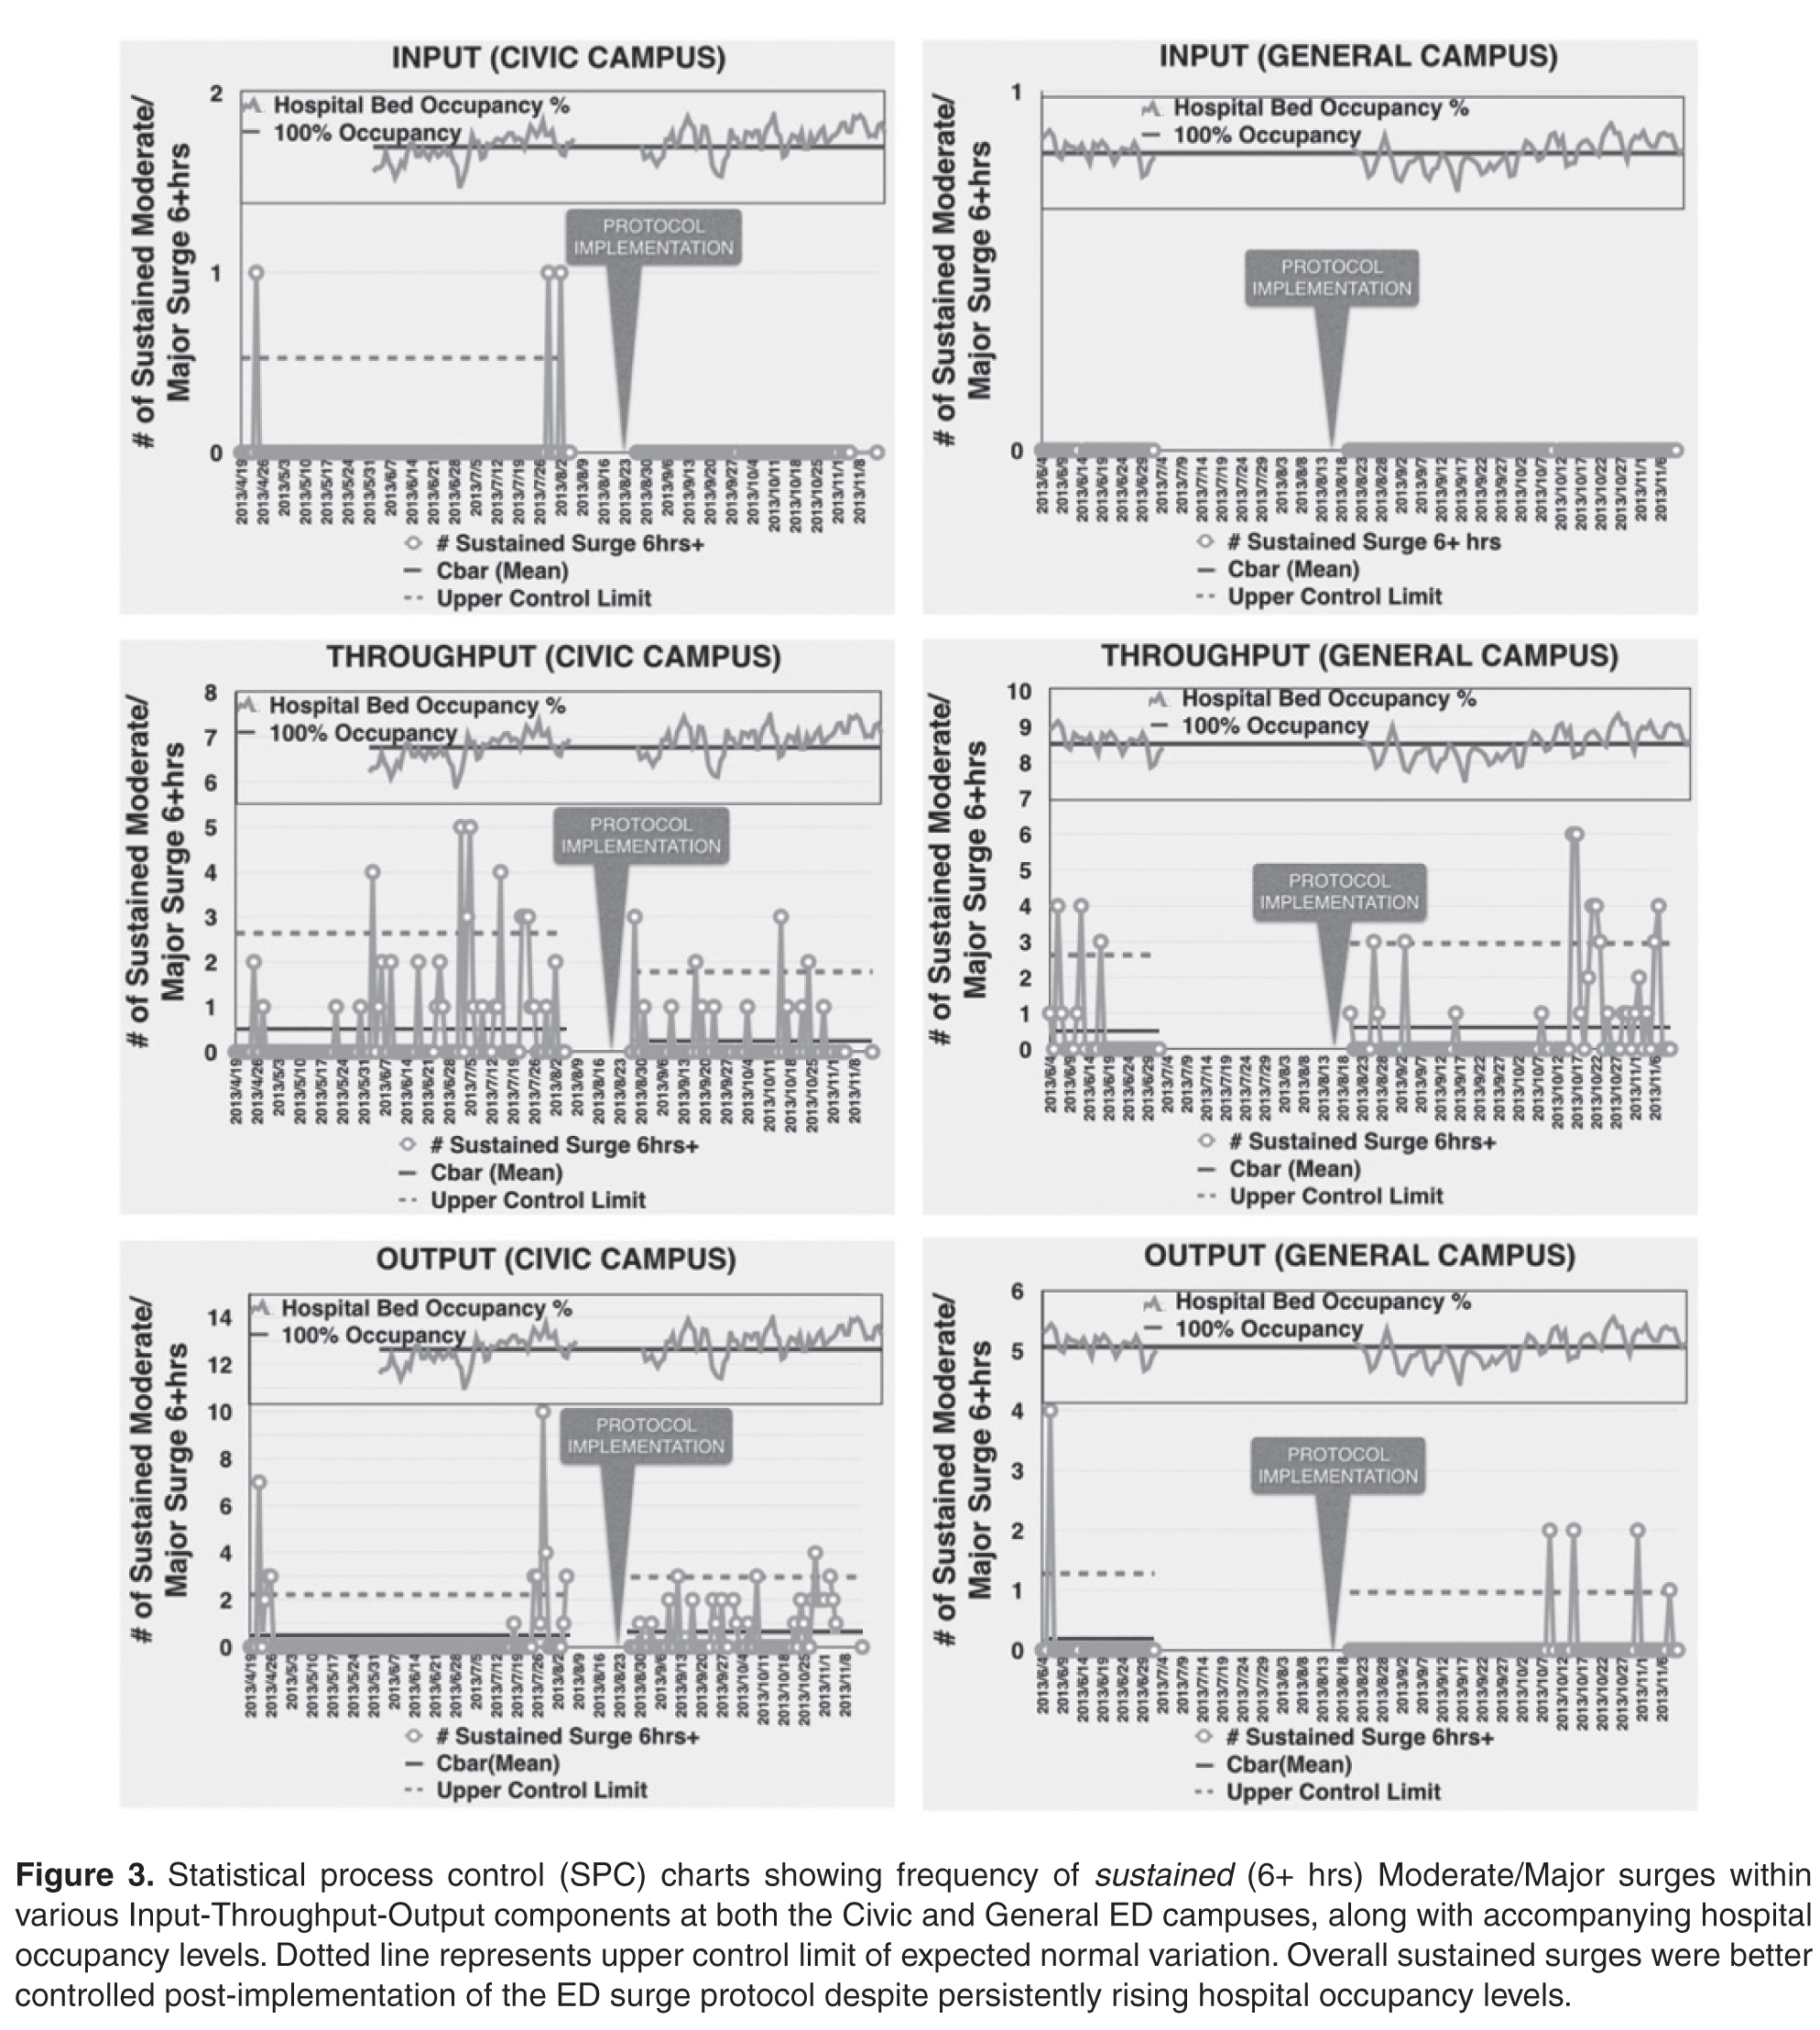
Over the study period April 2013 to December 2013 at the Civic campus and June 2013 to December 2013 at the General campus, ED surge levels were measured every 2 hours by the care facilitators and manually recorded in standardized ED surge protocol booklets. These were subsequently entered into Excel database for tracking and data analysis. Patient volumes and hospital occupancy levels were recorded daily. Perceptions of the primary users of the surge protocol (ie, care facilitators) were obtained via standardized interviews and polls. We present descriptive statistics and statistical process control (SPC) charts. Chi-squared test was performed for comparison of pre- and post-intervention frequencies of outcome measures.
Outcome Measures
The main outcome measure was the frequency of sustained (≥ 6 hours) high surges, a marker of inability to respond effectively. High surges were defined as Moderate and Major surges combined. Our expert group consensus was that combinging the Moderate and Major surge categories to represent “high” surge was reasonable since they both require mobilizing resources on a hospital-wide level, and failure to improve despite 6 continuous hours of actively trying to address such high surges would lead to significantly higher risk for quality of care and patient safety issues.
Secondary outcomes include overall frequency of reaching high surge levels at various components of the Input-Throughput-Output ED flow model, hospital occupancy levels, and care facilitators’ perceptions on workload and overall effectiveness of the surge protocol.
Results
ED Flow
Statistical Process Control Charts
Survey of Care Facilitators
The primary users and drivers of the surge protocol—the care facilitator group—felt strongly that the tool was easy to use and that it made a positive difference. 72% felt that the ED surge protocol has increased their workload but 92% felt that it was good for overall flow of the ED. Specific feedback included having a much more standardized language around communicating (and acting on) surges, and a better overall bird’s-eye view of the department.
Discussion
Despite a call for urgent research on implementing solutions targeting daily ED surges (vs. global ED crowding) over a decade ago at the Academic Emergency Medicine 2006 Consensus Conference [12], little work has been published on distinguishing, measuring, and dealing with ED surges. McCarthy et al proposed the rate of patient arrivals to the ED by time of day as a rudimentary definition of surge, although they provided very little specific guidance on what to do with that information in the setting of responding to spikes in surges [13]. Asplin et al described a number of theoretical models to bridge ED census, daily surges, length of stay and quality of care, however they were never validated in real-life scenarios [14]. A systematic review published in 2009 summarizing articles that described theoretical and practical ED surge responses found a large heterogeneity of different proposed models with little standardization and multiple shortcomings [15].
To our knowledge, this study is the first to report on the actual development, implementation, and evaluation of a daily ED surge protocol that utilizes a widely accepted conceptual model of ED flow. Unlike single global measure of ED crowding, our protocol measures frequent surge levels for various Input-Throughput-Output components of the ED, which are tied directly to standardized specific actions to address underlying root causes. Despite continued rise in hospital occupant levels and budgetary restraints, we found a improvement in the number of times the ED actually hit severe surges with the exception of Output, which is expected since this component of the flow model is intimately tied to hospital occupant levels. When severe surges did happen, we were able to deal with them much more effectively and efficiently, resulting in an overall decrease in sustained surges in the ED including the Output component.
Limitations
Similar to other pragmatic quality improvement projects that rely on manual processes, it was difficult to ensure absolute compliance of surge level measurements throughout the study period. As a result, there were occasional missing surge level data at various times of different days. However, we believe these are relatively nonsignificant occurrences that balanced out over the pre- and post-implementation periods. In addition, we did not have the resources to robustly record and confirm completion of specific action items that were activated in response to various surge levels, although we did confirm verbally with frontline workers regularly that those actions were done. Future Plan-Do-Study-Act cycles will focus on explicit measurement of actual completed action items and further refinement of targeted responses to surge. Finally, while we were able to only collect and present data over a relatively short period of evaluation (and thus potentially susceptible to seasonal variations in ED flow), we believe that our data does support the surge protocol’s effectiveness when compared to the robust trend of hospital occupant levels.
Future Directions
This ED surge protocol can be adapted and modified to fit any ED. The specific criteria defining Minor/Moderate/Major surges can be set up as ratios or percentages relative to total number of monitors, beds, etc., available. The principles of linking actions directly to specific triggers within each Input/Throughput/Output category could be translated to fit any-sized organization. Currently in progress is a longer evaluation period and based upon the results as well as individual feedback, necessary adjustments to our definitions, criteria and action items will be considered as part of ongoing quality improvement. The principles of our surge protocol are not limited to the ED, and we will explore its implementation in other hospital departments as well as methods to link them together in alignment with the hospital’s overall corporate strategy in tackling overcrowding.
Conclusion
In summary, implementation of this novel ED surge protocol led to a more effective response and management of high surges, despite significant increase in overall hospital occupancy rates and associated frequency of surges in the Output component of the ED flow model. Our surge measurement tool is capable of identifying within which area of the ED surges are occurring, and our ED surge protocol links specific actions to address those specific root causes. We believe this will lead not only to more accurate assessments of overall ED crowding but also to more timely and effective departmental and institutional responses.
Corresponding author: Dr. Edmund S.H. Kwok, Dept. of Emergency Medicine, Ottawa Hospital, Civic Campus, 1053 Carling Ave., Ottawa, ON, Canada K1Y 4E9, ekwok@toh.on.ca.
Financial disclosures: None.
1. Bond K. Interventions to reduce overcrowding in emergency departments. [Technology report no 67.4]. Ottawa: Canadian Agency for Drugs and Technologies in Health; 2006.
2. Richardson DB, et al. Increase in patient mortality at 10 days associated with emergency department overcrowding. Med J Aust 2006;184:213–6.
3. Sprivulis PC, et al. The association between hospital overcrowding and mortality among patients admitted via Western Australian emergency departments. Med J Aust 2006; 184:208–12.
4. Asplin BR, Magid DJ, Rhodes KV, et al. A conceptual model of emergency department crowding. Ann Emerg Med 2003; 42:173–80.
5. Affleck A, Parks P, Drummond A, et al. Emergency department overcrowding and access block. CAEP Position Statement. CJEM 2013;15:359–70.
6. Weiss SJ, Derlet R, Arndahl J, et al. Estimating the degree of emergency department overcrowding in academic medical centers: results of the National ED Overcrowding Study (NEDOCS). Acad Emerg Med 2004;11:38–50.
7. Weiss SJ, Ernst AA, Nick TG. Comparison of the National Emergency Department Overcrowding Scale and the Emergency Department Work Index for quantifying emergency department crowding. Acad Emerg Med 2006;13:513–8.
8. Jones SS, Allen TL, Welch SJ. An independent evaluation of four quantitative emergency department crowding scales. Acad Emerg Med 2006;13:1204–11
9. Bernstein SL, Verghese V, Leung W, et al. Development and validation of a new index to measure emergency department crowding. Acad Emerg Med 2003;10:938–42
10. General Accounting Office. Hospital emergency departments–crowded conditions vary among hospitals and communities. GAO-03-460. Washington, DC: US General Accounting Office; 2003.
11. Moseley MG, Dickerson CL, Kasey J, et al. Surge: a organizational response to emergency department overcrowding. J Clin Outcomes Manage 2010;17:453–7.
12. Jenkins JL, O’Connor RE, Cone DC. Differentiating large-scale surge versus daily surge. Acad Emerg Med 2006; 13:1169–72.
13. McCarthy ML, Aronsky D, Kelen GD. The measurement of daily surge and its relevance to disaster preparedness. Acad Emerg Med 2006; 13:1138–41.
14. Asplin BR, Flottemesch TJ, Gordon B. Developing models for patient flow and daily surge capacity research. Acad Emerg Med 2006;13:1109–13.
15. Nager AL, Khanna K. Emergency department surge: models and practical implications. J Trauma 2009; 67(2 Suppl):S96–9.
From the Ottawa Hospital, Ottawa, ON Canada.
Abstract
- Objective: Fluctuations in emergency department (ED) visits occur frequently, and traditional global measures of ED crowding do not allow for targeted responses to address root causes. We sought to develop, implement, and evaluate a novel ED surge protocol based on the input-throughput-output (ITO) model of ED flow.
- Methods: This initiative took place at a tertiary care academic teaching hospital. An inter-professional group developed and validated metrics for various levels of surge in relation to the ITO model, measured every 2 hours, which directly linked to specific actions targeting root causes within those components. Main outcome measure was defined as the frequency of sustained (≥ 6 hours) high surges, a marker of inability to respond effectively.
- Results: During the 6-month study period, average daily hospital occupancy levels rose above 100% (pre 99.5%, post 101.2%; P = 0.01) and frequency of high surges in the output component increased (pre 7.7%, post 10.8%; P = 0.002). Despite this, frequency of sustained high surges remained stable for input (pre 4.5%, post 0.0%; P = 0.13) and throughput (pre 3.5%, post 2.7%; P = 0.54), while improvement in output reached statistical significance (pre 7.7%, post 2.0%, P = 0.01).
- Conclusions: The ED surge protocol led to effective containment of daily high surges despite significant increase in hospital occupancy levels. This is the first study to describe an ED surge plan capable of identifying within which ITO component surge is happening and linking actions to address specific causes. We believe this protocol can be adapted for any ED.
Emergency department (ED) crowding has been defined as “a situation where the demand for emergency services exceeds the ability to provide care in a reasonable amount of time” [1]. Crowding is an increasingly common occurrence in hospital-based EDs, and overcrowding of EDs has been shown to adversely affect the delivery of emergency care and results in increased patient morbidity and mortality [2,3]. Furthermore, the nature of medical emergencies dictates that rapid daily changes (or surges) in patient volume and acuity occur frequently and unpredictably, contributing to the difficulty of matching resources to demands. Accurate understanding and continuous measurement of where bottlenecks may be occurring within an ED are critical to an effective response to ED surges.
Many of the widely used measurement tools for overcrowding produce one final overall net value on a one-dimensional scale, failing to capture the complexity of the root causes of surges. For example, the National ED Overcrowding Study (NEDOCS) scoring system, validated at various centers and widely used and studied [5–7] utilizes a number of institutional and situational variables to calculate a final NEDOCS score, which translates to “Not Busy,” “Busy,” “Overcrowded,” “Severely Overcrowded,” or “Dangerously Overcrowded” as a global state. Other published scoring systems such as the Emergency Department Work Index (EDWIN), while performing well in comparison to subjective impressions of physicians and nurses, also suffers from computation of a single final score, which makes it difficult to tie to specific actions or solutions [8]. Other surrogate markers quantifying ED crowding have also been used, such as left-without-being-seen rates, ambulance diversions, and total number of boarded patients in the ED; yet they too only measure consequences of crowding and provide little diagnostic information on when and where specific ED surges are actually happening throughout the day [9].
Responding to ED Surges
An effective surge plan should ensure the delivery of safe, effective care in response to various input/throughput/output surges in a coordinated and standardized manner. The ideal ED surge plan should include (1) a prospective continuous tool/method that accurately gauges the surge level (based on objective measures) in various components of the Input-Throughput-Output model of the department, (2) standardized targeted actions that are tied to specific triggers identified within that model to ensure effective solutions, and (3) built-in contingency plans for escalation in the face of sustained/worsening surges. Few studies have been published describing successful implementation of ED surge protocols, with the majority being linked to global ED crowding measures such as the NEDOCS score [10]. As a result, it is difficult to tease out the specific targeted actions that are most effective in dealing with the root causes of a surge.
Local Problem
Prior to the quality improvement initiative we describe below, the Ottawa Hospital ED had no formal process or method of measuring daily surges nor any standardized action plan to respond effectively to those surges. The state of “busy-ness” was often defined by gut feelings of frontline workers, which was quite variable depending on the individuals in charge of departmental patient flow. Often, actions to try and mitigate rising ED surges were triggered too late, resulting in consistent gridlock in the ED that lasted many hours. Several near-misses as well as actual critical incidences had occurred as a result of ineffective management of ED surges, and the authors of this initiative were tasked by senior hospital leadership with designing and implementing a novel solution.
Objectives
We describe our approach to the development, implementation, and evaluation of a novel ED surge protocol at a tertiary care academic hospital based on the principles cited above. Specifically, we sought to:
- define various levels of ED surge and to provide a common language for better communication between all stakeholders
- incorporate the validated Input-Throughput-Output model of ED flow to provide a conceptual framework for measuring surges in real-time and developing targeted action plans
- standardize ED and organizational responses to various ED surges based on identified bottlenecks
- measure and evaluate the effectiveness of the ED surge plan implementation
- continuously modify and improve the ED surge protocol using quality improvement strategies
Methods
Setting
The Ottawa Hospital is an academic tertiary care center with 3 campuses (Civic, General, and Riverside), with the ED providing coverage at 2 physical emergency rooms. The hospital is the regional trauma center as well as referral destination for many subspecialties such as cardiac, vascular and neurosurgical emergencies. This 1163-bed facility handles over 160,000 emergency visits a year, over 1 million ambulatory care visits a year, and roughly 35,000 surgical cases annually. The ED is staffed by 78 staff physicians, approximately 250 registered nurses (RNs), and ~50 emergency medicine residents/trainees.
The EDs are supported by a computerized tracking system that provides real-time metrics. This information is displayed by ED-specific geographical area on electronic whiteboards, which can be accessed on overhead monitors, desktop computers, and personal iPads. Information available to ED physicians and staff at any time includes individual-level data such as location, demographics, Canadian Triage Acuity Score (CTAS), and presenting complaint as well as departmental-level data such as patient volumes, wait times, length of stay (LOS), pending/completed diagnostics, consultation status and final dispositions.
According to the policy and standard operating procedures that govern research at the Ottawa Hospital Research Institute, this work met criteria for quality improvement activities exempt from ethics review.
Intervention
Over a 4-day period care facilitators were polled on an hourly basis to determine what factors were important to the in determining how “busy” they perceived the ED to be. These factors included but were not limited to: total number of patients waiting to be seen; time to physician initial assessment; number of monitored beds available; and number of admitted patients boarded in the ED. Analysis was done to prospectively compare their perception of surge levels to the proposed Surge Plan metrics, and to ensure that the individual criteria for each level was practically meaningful and accurate.
Next, a set of standardized action and response plans were developed and agreed upon that tied specifically to a corresponding component of the different measured ED surge levels (these action plans are detailed in an online Appendix and are also available from the author). The fundamental guiding principles behind the development of each action item was that it should (1) target underlying causes - in a standardized way - specific to the relevant Input-Throughput-Output surge, (2) provide escalating level of effectiveness for each corresponding escalation in the surge level (eg, contacting a staff physician directly for a disposition decision for patents consulted in the ED, if the resident trainees have failed to do so in a timely manner), and (3) coordinate actions by various stakeholders in a planned and organized manner. Practically, the standardized targeted actions span across 5 different roles, which were explicitly listed on action sheets for care facilitators, clinical managers, patient flow managers, evening and night coordinators, and clinical directors.
Stakeholder Engagement
Implementation and Continuous Improvement
Given the complexity of the ED- and hospital-wide nature of the surge protocol, implementation was done over multiple phases and Plan-Do-Study-Act (PDSA) improvement cycles:
Phase I (Apr 2013 - Jun 2013)
The initial proposed ED surge level metrics were measured at a single ED campus. Care facilitators were trained and asked to measure surge levels in the ED every 2 hours. This served as a testing period to gauge the sensitivity and reliability of our proposed surge level metrics, and no actual action items were triggered during this period. Stakeholder meetings were held to determine feasibility of the plan, validate the proposed metrics, and develop “standard work” action plans for each stakeholder group in response to the metrics. This first phase also allowed care facilitators to objectively reflect on ED surge patterns throughout the day, and provided everyone in the ED team a frequent global snapshot of how “busy” the department was at any time. Finally, surge level data during this phase confirmed previous suspicions that the Output component was the biggest driver behind overall ED surge level.
Throughout this phase, the ED clinical manager recorded all the usual actions taken in response to the different level of surges as felt appropriate by the individual care facilitator on duty. The variety of actions and types of escalations were collected and fed back to weekly workgroup meetings to help further refine crafting of standardized action plans for implementation of the surge protocol.
Phase II (June - Aug 2013)
An initial trial of a limited ED surge protocol was rolled out at both ED campuses, with actual action items being triggered in response to specific surge level metrics. The main focus of this PDSA cycle was to collect data on how the care facilitator groups at the 2 campuses utilized the surge protocol, as well as feedback on usability, barriers, and effectiveness. Regular audits were performed to ensure surge measurement and compliance rates. Educational sessions were provided regarding rationale and purpose of the plan so that all team members had a better understanding of ED surges. Frequent meetings with stakeholders to share updates continued throughout Phase II, allowing further engagement as well as fine-tuning of stakeholder action plans based on real-time experiences.
Phase III (Aug 2013 - Dec 2013)
The next phase of implementation expanded beyond the ED and included the hospital’s off-hours and off-service management group. This in effect was the official corporate roll-out of the ED surge protocol including full action plans for all stakeholders, including off-service clinical administrators, inpatient flow managers, and the director of emergency and critical care. Regular audits were performed to ensure compliance of measurement every 2 hours as well as performance of specified action items related to each surge level, with the actual surge level measurement completion rates of 98%.
Data Collection and Analysis
Over the study period April 2013 to December 2013 at the Civic campus and June 2013 to December 2013 at the General campus, ED surge levels were measured every 2 hours by the care facilitators and manually recorded in standardized ED surge protocol booklets. These were subsequently entered into Excel database for tracking and data analysis. Patient volumes and hospital occupancy levels were recorded daily. Perceptions of the primary users of the surge protocol (ie, care facilitators) were obtained via standardized interviews and polls. We present descriptive statistics and statistical process control (SPC) charts. Chi-squared test was performed for comparison of pre- and post-intervention frequencies of outcome measures.
Outcome Measures
The main outcome measure was the frequency of sustained (≥ 6 hours) high surges, a marker of inability to respond effectively. High surges were defined as Moderate and Major surges combined. Our expert group consensus was that combinging the Moderate and Major surge categories to represent “high” surge was reasonable since they both require mobilizing resources on a hospital-wide level, and failure to improve despite 6 continuous hours of actively trying to address such high surges would lead to significantly higher risk for quality of care and patient safety issues.
Secondary outcomes include overall frequency of reaching high surge levels at various components of the Input-Throughput-Output ED flow model, hospital occupancy levels, and care facilitators’ perceptions on workload and overall effectiveness of the surge protocol.
Results
ED Flow
Statistical Process Control Charts
Survey of Care Facilitators
The primary users and drivers of the surge protocol—the care facilitator group—felt strongly that the tool was easy to use and that it made a positive difference. 72% felt that the ED surge protocol has increased their workload but 92% felt that it was good for overall flow of the ED. Specific feedback included having a much more standardized language around communicating (and acting on) surges, and a better overall bird’s-eye view of the department.
Discussion
Despite a call for urgent research on implementing solutions targeting daily ED surges (vs. global ED crowding) over a decade ago at the Academic Emergency Medicine 2006 Consensus Conference [12], little work has been published on distinguishing, measuring, and dealing with ED surges. McCarthy et al proposed the rate of patient arrivals to the ED by time of day as a rudimentary definition of surge, although they provided very little specific guidance on what to do with that information in the setting of responding to spikes in surges [13]. Asplin et al described a number of theoretical models to bridge ED census, daily surges, length of stay and quality of care, however they were never validated in real-life scenarios [14]. A systematic review published in 2009 summarizing articles that described theoretical and practical ED surge responses found a large heterogeneity of different proposed models with little standardization and multiple shortcomings [15].
To our knowledge, this study is the first to report on the actual development, implementation, and evaluation of a daily ED surge protocol that utilizes a widely accepted conceptual model of ED flow. Unlike single global measure of ED crowding, our protocol measures frequent surge levels for various Input-Throughput-Output components of the ED, which are tied directly to standardized specific actions to address underlying root causes. Despite continued rise in hospital occupant levels and budgetary restraints, we found a improvement in the number of times the ED actually hit severe surges with the exception of Output, which is expected since this component of the flow model is intimately tied to hospital occupant levels. When severe surges did happen, we were able to deal with them much more effectively and efficiently, resulting in an overall decrease in sustained surges in the ED including the Output component.
Limitations
Similar to other pragmatic quality improvement projects that rely on manual processes, it was difficult to ensure absolute compliance of surge level measurements throughout the study period. As a result, there were occasional missing surge level data at various times of different days. However, we believe these are relatively nonsignificant occurrences that balanced out over the pre- and post-implementation periods. In addition, we did not have the resources to robustly record and confirm completion of specific action items that were activated in response to various surge levels, although we did confirm verbally with frontline workers regularly that those actions were done. Future Plan-Do-Study-Act cycles will focus on explicit measurement of actual completed action items and further refinement of targeted responses to surge. Finally, while we were able to only collect and present data over a relatively short period of evaluation (and thus potentially susceptible to seasonal variations in ED flow), we believe that our data does support the surge protocol’s effectiveness when compared to the robust trend of hospital occupant levels.
Future Directions
This ED surge protocol can be adapted and modified to fit any ED. The specific criteria defining Minor/Moderate/Major surges can be set up as ratios or percentages relative to total number of monitors, beds, etc., available. The principles of linking actions directly to specific triggers within each Input/Throughput/Output category could be translated to fit any-sized organization. Currently in progress is a longer evaluation period and based upon the results as well as individual feedback, necessary adjustments to our definitions, criteria and action items will be considered as part of ongoing quality improvement. The principles of our surge protocol are not limited to the ED, and we will explore its implementation in other hospital departments as well as methods to link them together in alignment with the hospital’s overall corporate strategy in tackling overcrowding.
Conclusion
In summary, implementation of this novel ED surge protocol led to a more effective response and management of high surges, despite significant increase in overall hospital occupancy rates and associated frequency of surges in the Output component of the ED flow model. Our surge measurement tool is capable of identifying within which area of the ED surges are occurring, and our ED surge protocol links specific actions to address those specific root causes. We believe this will lead not only to more accurate assessments of overall ED crowding but also to more timely and effective departmental and institutional responses.
Corresponding author: Dr. Edmund S.H. Kwok, Dept. of Emergency Medicine, Ottawa Hospital, Civic Campus, 1053 Carling Ave., Ottawa, ON, Canada K1Y 4E9, ekwok@toh.on.ca.
Financial disclosures: None.
1. Bond K. Interventions to reduce overcrowding in emergency departments. [Technology report no 67.4]. Ottawa: Canadian Agency for Drugs and Technologies in Health; 2006.
2. Richardson DB, et al. Increase in patient mortality at 10 days associated with emergency department overcrowding. Med J Aust 2006;184:213–6.
3. Sprivulis PC, et al. The association between hospital overcrowding and mortality among patients admitted via Western Australian emergency departments. Med J Aust 2006; 184:208–12.
4. Asplin BR, Magid DJ, Rhodes KV, et al. A conceptual model of emergency department crowding. Ann Emerg Med 2003; 42:173–80.
5. Affleck A, Parks P, Drummond A, et al. Emergency department overcrowding and access block. CAEP Position Statement. CJEM 2013;15:359–70.
6. Weiss SJ, Derlet R, Arndahl J, et al. Estimating the degree of emergency department overcrowding in academic medical centers: results of the National ED Overcrowding Study (NEDOCS). Acad Emerg Med 2004;11:38–50.
7. Weiss SJ, Ernst AA, Nick TG. Comparison of the National Emergency Department Overcrowding Scale and the Emergency Department Work Index for quantifying emergency department crowding. Acad Emerg Med 2006;13:513–8.
8. Jones SS, Allen TL, Welch SJ. An independent evaluation of four quantitative emergency department crowding scales. Acad Emerg Med 2006;13:1204–11
9. Bernstein SL, Verghese V, Leung W, et al. Development and validation of a new index to measure emergency department crowding. Acad Emerg Med 2003;10:938–42
10. General Accounting Office. Hospital emergency departments–crowded conditions vary among hospitals and communities. GAO-03-460. Washington, DC: US General Accounting Office; 2003.
11. Moseley MG, Dickerson CL, Kasey J, et al. Surge: a organizational response to emergency department overcrowding. J Clin Outcomes Manage 2010;17:453–7.
12. Jenkins JL, O’Connor RE, Cone DC. Differentiating large-scale surge versus daily surge. Acad Emerg Med 2006; 13:1169–72.
13. McCarthy ML, Aronsky D, Kelen GD. The measurement of daily surge and its relevance to disaster preparedness. Acad Emerg Med 2006; 13:1138–41.
14. Asplin BR, Flottemesch TJ, Gordon B. Developing models for patient flow and daily surge capacity research. Acad Emerg Med 2006;13:1109–13.
15. Nager AL, Khanna K. Emergency department surge: models and practical implications. J Trauma 2009; 67(2 Suppl):S96–9.
Improved Appointment Reminders at a VA Ophthalmology Clinic
From the Gavin Herbert Eye Institute, Department of Ophthalmology, University of California-Irvine, Irvine, CA.
Abstract
- Objective: To describe a change in mail notification approach at a Veterans Affairs hospital and its impact on appointments.
- Methods: A new notification system was implemented in which the information on the notice was limited to the date, time, and location of the appointment. Previously, the notice contained information about patients’ appointment time in addition to listing methods of rescheduling, patient account information, and a variety of VA policies presented in a disorganized manner. We assessed whether there was a reduction in number of patients who had to be redirected by clinical staff at the ophthalmology clinic at the Long Beach Veterans Affairs Hospital.
- Results: The mean number patients who visited the clinic mistakenly during the 14 days prior to the new notification system was 14.93 (SD = 6.05) compared with 9.4 (SD = 3.45; P = 0.005) during the 15 days after.
- Conclusion: A simple abbreviated notification has the potential to improve patient understanding and can increase clinical efficiency, ultimately reducing health costs.
Across the United States, patients at Veterans Affairs (VA) hospitals are routinely informed of their clinic appointments via both telephone and conventional mail notifications. Prior studies have confirmed that appointment reminders reduce no-show rates, thus increasing clinical efficiency and decreasing health care costs [1–10]. At the same time, avoiding occasions where patients who do not have an appointment arrive erroneously also enhances efficiency, allowing clinic staff to focus their attention on patients assigned to their clinic.
Recently a new notification system was implemented at our medical center. This new notification system involves a folded mailer delivered by the US Postal Service that provides patients only with the essential information necessary for timely arrival at the correct location to their appointments. The telephone notification system that works in tandem with this has been retained. In this report, we describe the change and the results seen in our clinic.
Methods
Setting
The Veterans Affairs Long Beach Healthcare system maintains a large teaching medical campus in Long Beach, CA. The medical center and its community clinics employ more than 2200 full-time employees and provide care for more than 50,000 veterans. There are 37 outpatient clinics located on the main campus.
Our study was conducted in the outpatient ophthalmology clinic, located on the main campus. The clinic is open 8 am to 4 pm Monday through Friday and sees on average 30 to 40 patients per day with a front desk staffed with 2 secretaries. When a patient arrives to the clinic, their information (name, social security number, date/time of appointment, etc.) is looked up in a national database. If the patient arrives at the incorrect location, time is additionally spent redirecting patients.
Notification System
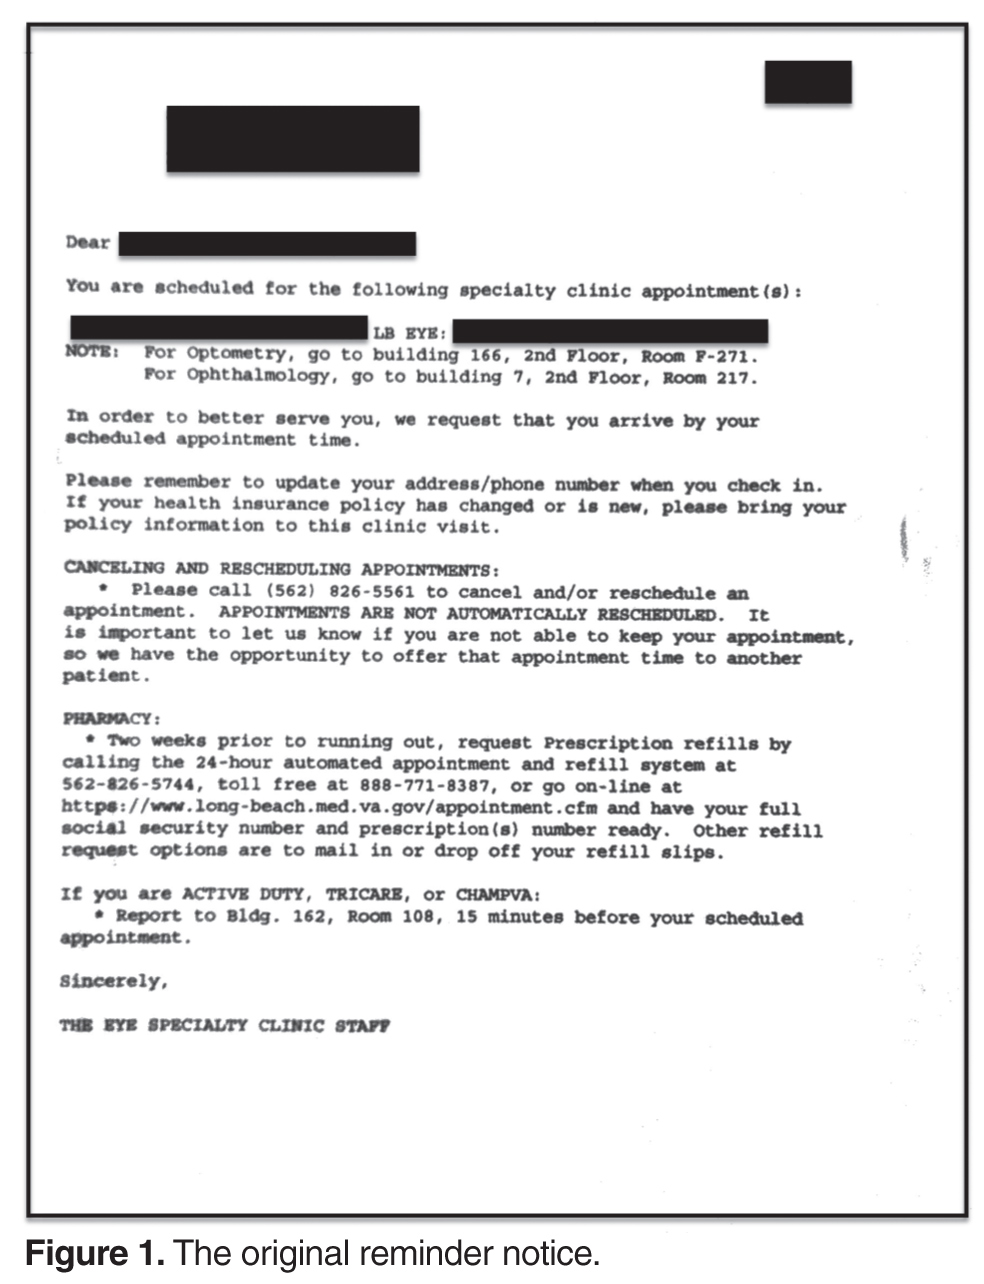
Assessment
We assessed the effectiveness of this new notification system by monitoring the number of patients who arrived at our clinic by mistake. The 2 clinic secretaries recorded daily on a piece of paper the number of patients who arrived in clinic 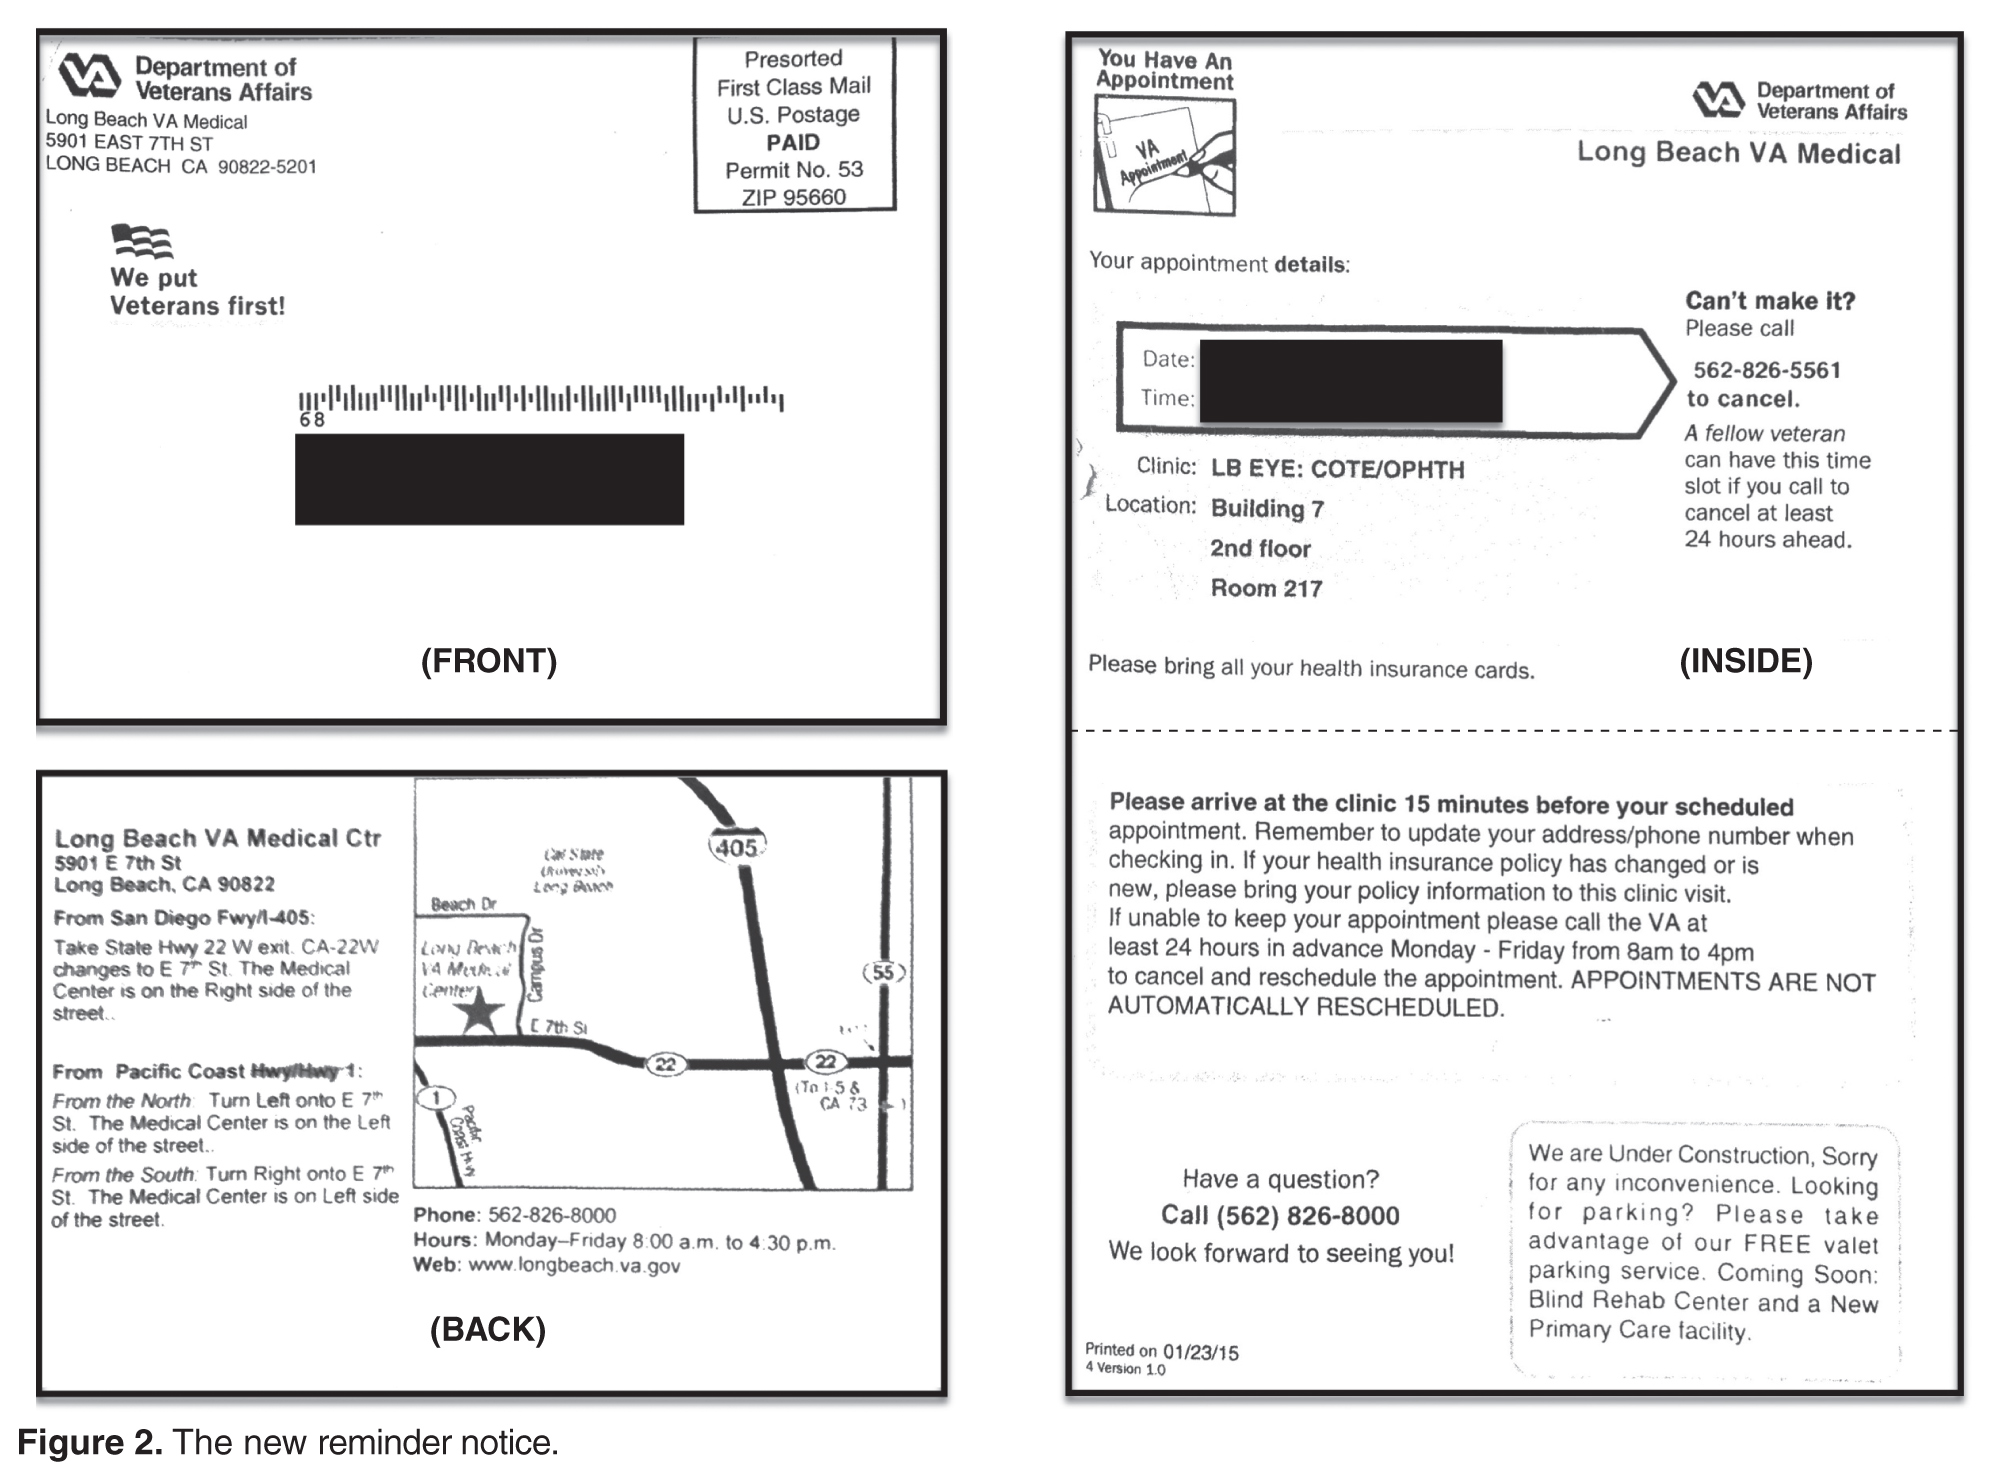
Results
During the 14 days prior to the change in notification system, the mean number patients per day who visited the clinic mistakenly was 14.93 (SD = 6.05). After the implementation of the new notification system, the mean number was 9.4 (SD = 3.45; P = 0.005) for the 15-day period after the change was implemented.
The mean number of minutes required to redirect patients was estimated to be 2.28 minutes prior to the change and 2.53 after (P = 0.507), which equates to an average of 40.64 minutes per day in the initial study period and 22.93 minutes per day in the second study period (P = 0.05). Assuming a secretary makes on average $22/hour, the Long Beach VA spent an average of $14.90 and $8.41 per day, respectively, redirecting mistaken patients to their correct clinic before and after the new notice system was implemented.
Discussion
The Veterans Health Administration is America’s largest integrated health care system, and is one of the few health systems—and by far the largest—that is virtually paperless [11]. Their medical records are nearly wholly electronic. The VA’s use of electronic health records has significantly enhanced the quality of patient care and improved productivity [12]. Their ongoing mission includes identifying and evaluating strategies that lead to high-quality and cost-effective care for veterans.
Effective appointment notifications have the potential to increase productivity and thus save money. Developing tailored methods of informing patients of the time and location of their clinic appointment improves the accuracy with which patients arrive at large medical campuses, which translates into a more efficient clinic flow. The simpler, abbreviated notification implemented at our VA appears to improve patient understanding of time/location of their clinic appointment, based on the decreased number of patients arriving in error to the ophthalmology clinic. It is unclear which specific aspect of this new mailed notification system is responsible for our results (addition of map, new layout, down-scaling of notification etc). Limitations to our study included reliance on the secretaries’ subjective reporting of time spent redirecting and limiting our data collection to one clinic. In addition, patients arriving at appointments may have received the old notice. Further investigations are underway to study appointment notification improvements across various hospitals and clinics.
In summary, efficiency is a key component in allowing the Veterans Affairs to provide quality care for the patients under its purview. We show that an abbreviated notification system was associated with a reduction in the need to redirect patients arriving by mistake to our office. Assuming that this abbreviated notification system would benefit the 37 outpatient clinics at the VA in Long Beach, CA as it did with the ophthalmology clinic, this new notification system has the potential to save $240 dollars/day and generate a yearly savings of $87,689.
Corresponding author: Bradley Jacobsen, Irvine School of Medicine, University of California, 1001 Health Sciences Road, 252 Irvine Hall Irvine, CA 92697 bjacobse@uci.edu.
1. Bigby J, Giblin J, Pappius EM, Goldman L. Appointment reminders to reduce no-show rates. A stratified analysis of their cost-effectiveness. JAMA 1983;250:1742–5.
2. Frankel BS, Hoevell MF. Health service appointment keeping: A behavioral view and critical review. Behav Modification 1978;2:435–64.
3. Friman PC, Finney JW, Rapoff MA, Christophersen ER. Improving pediatric appointment keeping with reminders and reduced response requirement. J Appl Behav Anal 1985;18:315–21.
4. Gariti P, Alterman AI, Holub-Beyer E, et al. Effects of an appointment reminder call on patient show rates. J Subst Abuse Treat 1995;12:207–12.
5. Grover S, Gagnon G, Flegel KM, Hoey JR. Improving appointment-keeping by patients new to a hospital medical clinic with telephone or mailed reminders. Can Med Assoc J 1983;129:1101–3.
6. Levy R, Claravall V. Differential effects of a phone reminder on appointment keeping for patients with long and short between-visit intervals. Med Care 1977;15:435–8.
7. Morse DL, Coulter MP, Nazarian LF, Napodano RJ. Waning effectiveness of mailed reminders on reducing broken appointments. Pediatrics 1981;68:846–9.
8. Schroeder SA. Lowering broken appointment rates at a medical clinic. Med Care 1973;11:75–8.
9. Shepard DS, Moseley TA 3rd. Mailed versus telephoned appointment reminders to reduce broken appointments in a hospital outpatient department. Med Care 1976;14:268–73.
10. Turner AJ, Vernon JC. Prompts to increase attendance in a community mental-health center. J Appl Behav Anal 1976;9:141–5.
11. Brown SH, Lincoln MJ, Groen PJ, Kolodner RM. VistA--US department of Veterans Affairs national-scale HIS. Int J Med Inform 2003;69:135–56.
12. Evans DC, Nichol WP, Perlin JB. Effect of the implementation of an enterprise-wide electronic health record on productivity in the Veterans Health Administration. Health Econ Policy Law 2006:1:163–9.
From the Gavin Herbert Eye Institute, Department of Ophthalmology, University of California-Irvine, Irvine, CA.
Abstract
- Objective: To describe a change in mail notification approach at a Veterans Affairs hospital and its impact on appointments.
- Methods: A new notification system was implemented in which the information on the notice was limited to the date, time, and location of the appointment. Previously, the notice contained information about patients’ appointment time in addition to listing methods of rescheduling, patient account information, and a variety of VA policies presented in a disorganized manner. We assessed whether there was a reduction in number of patients who had to be redirected by clinical staff at the ophthalmology clinic at the Long Beach Veterans Affairs Hospital.
- Results: The mean number patients who visited the clinic mistakenly during the 14 days prior to the new notification system was 14.93 (SD = 6.05) compared with 9.4 (SD = 3.45; P = 0.005) during the 15 days after.
- Conclusion: A simple abbreviated notification has the potential to improve patient understanding and can increase clinical efficiency, ultimately reducing health costs.
Across the United States, patients at Veterans Affairs (VA) hospitals are routinely informed of their clinic appointments via both telephone and conventional mail notifications. Prior studies have confirmed that appointment reminders reduce no-show rates, thus increasing clinical efficiency and decreasing health care costs [1–10]. At the same time, avoiding occasions where patients who do not have an appointment arrive erroneously also enhances efficiency, allowing clinic staff to focus their attention on patients assigned to their clinic.
Recently a new notification system was implemented at our medical center. This new notification system involves a folded mailer delivered by the US Postal Service that provides patients only with the essential information necessary for timely arrival at the correct location to their appointments. The telephone notification system that works in tandem with this has been retained. In this report, we describe the change and the results seen in our clinic.
Methods
Setting
The Veterans Affairs Long Beach Healthcare system maintains a large teaching medical campus in Long Beach, CA. The medical center and its community clinics employ more than 2200 full-time employees and provide care for more than 50,000 veterans. There are 37 outpatient clinics located on the main campus.
Our study was conducted in the outpatient ophthalmology clinic, located on the main campus. The clinic is open 8 am to 4 pm Monday through Friday and sees on average 30 to 40 patients per day with a front desk staffed with 2 secretaries. When a patient arrives to the clinic, their information (name, social security number, date/time of appointment, etc.) is looked up in a national database. If the patient arrives at the incorrect location, time is additionally spent redirecting patients.
Notification System
Assessment
We assessed the effectiveness of this new notification system by monitoring the number of patients who arrived at our clinic by mistake. The 2 clinic secretaries recorded daily on a piece of paper the number of patients who arrived in clinic
Results
During the 14 days prior to the change in notification system, the mean number patients per day who visited the clinic mistakenly was 14.93 (SD = 6.05). After the implementation of the new notification system, the mean number was 9.4 (SD = 3.45; P = 0.005) for the 15-day period after the change was implemented.
The mean number of minutes required to redirect patients was estimated to be 2.28 minutes prior to the change and 2.53 after (P = 0.507), which equates to an average of 40.64 minutes per day in the initial study period and 22.93 minutes per day in the second study period (P = 0.05). Assuming a secretary makes on average $22/hour, the Long Beach VA spent an average of $14.90 and $8.41 per day, respectively, redirecting mistaken patients to their correct clinic before and after the new notice system was implemented.
Discussion
The Veterans Health Administration is America’s largest integrated health care system, and is one of the few health systems—and by far the largest—that is virtually paperless [11]. Their medical records are nearly wholly electronic. The VA’s use of electronic health records has significantly enhanced the quality of patient care and improved productivity [12]. Their ongoing mission includes identifying and evaluating strategies that lead to high-quality and cost-effective care for veterans.
Effective appointment notifications have the potential to increase productivity and thus save money. Developing tailored methods of informing patients of the time and location of their clinic appointment improves the accuracy with which patients arrive at large medical campuses, which translates into a more efficient clinic flow. The simpler, abbreviated notification implemented at our VA appears to improve patient understanding of time/location of their clinic appointment, based on the decreased number of patients arriving in error to the ophthalmology clinic. It is unclear which specific aspect of this new mailed notification system is responsible for our results (addition of map, new layout, down-scaling of notification etc). Limitations to our study included reliance on the secretaries’ subjective reporting of time spent redirecting and limiting our data collection to one clinic. In addition, patients arriving at appointments may have received the old notice. Further investigations are underway to study appointment notification improvements across various hospitals and clinics.
In summary, efficiency is a key component in allowing the Veterans Affairs to provide quality care for the patients under its purview. We show that an abbreviated notification system was associated with a reduction in the need to redirect patients arriving by mistake to our office. Assuming that this abbreviated notification system would benefit the 37 outpatient clinics at the VA in Long Beach, CA as it did with the ophthalmology clinic, this new notification system has the potential to save $240 dollars/day and generate a yearly savings of $87,689.
Corresponding author: Bradley Jacobsen, Irvine School of Medicine, University of California, 1001 Health Sciences Road, 252 Irvine Hall Irvine, CA 92697 bjacobse@uci.edu.
1. Bigby J, Giblin J, Pappius EM, Goldman L. Appointment reminders to reduce no-show rates. A stratified analysis of their cost-effectiveness. JAMA 1983;250:1742–5.
2. Frankel BS, Hoevell MF. Health service appointment keeping: A behavioral view and critical review. Behav Modification 1978;2:435–64.
3. Friman PC, Finney JW, Rapoff MA, Christophersen ER. Improving pediatric appointment keeping with reminders and reduced response requirement. J Appl Behav Anal 1985;18:315–21.
4. Gariti P, Alterman AI, Holub-Beyer E, et al. Effects of an appointment reminder call on patient show rates. J Subst Abuse Treat 1995;12:207–12.
5. Grover S, Gagnon G, Flegel KM, Hoey JR. Improving appointment-keeping by patients new to a hospital medical clinic with telephone or mailed reminders. Can Med Assoc J 1983;129:1101–3.
6. Levy R, Claravall V. Differential effects of a phone reminder on appointment keeping for patients with long and short between-visit intervals. Med Care 1977;15:435–8.
7. Morse DL, Coulter MP, Nazarian LF, Napodano RJ. Waning effectiveness of mailed reminders on reducing broken appointments. Pediatrics 1981;68:846–9.
8. Schroeder SA. Lowering broken appointment rates at a medical clinic. Med Care 1973;11:75–8.
9. Shepard DS, Moseley TA 3rd. Mailed versus telephoned appointment reminders to reduce broken appointments in a hospital outpatient department. Med Care 1976;14:268–73.
10. Turner AJ, Vernon JC. Prompts to increase attendance in a community mental-health center. J Appl Behav Anal 1976;9:141–5.
11. Brown SH, Lincoln MJ, Groen PJ, Kolodner RM. VistA--US department of Veterans Affairs national-scale HIS. Int J Med Inform 2003;69:135–56.
12. Evans DC, Nichol WP, Perlin JB. Effect of the implementation of an enterprise-wide electronic health record on productivity in the Veterans Health Administration. Health Econ Policy Law 2006:1:163–9.
Attitudes of Physicians in Training Regarding Reporting of Patient Safety Events
From the Department of Internal Medicine, Advocate Lutheran General Hospital, Park Ridge, IL.
Abstract
- Objective: To understand the attitudes and experiences of physicians in training with regard to patient safety event reporting.
- Methods: Residents and fellows in the department of internal medicine were surveyed using a questionnaire containing 5 closed-ended items. These items examined trainees’ attitudes, experiences and knowledge about safety event reporting and barriers to their reporting.
- Results: 61% of 80 eligible trainees responded. The majority of residents understood that it is their responsibility to report safety events. Identified barriers to reporting were the complexity of the reporting system, lack of feedback after reporting safety events to gain knowledge of system advances, and reporting was not a priority in clinical workflow.
- Conclusion: An inpatient safety and quality committee intends to develop solutions to the challenges faced by trainees’ in reporting patient safety events.
Nationwide, graduate medical education programs are changing to include a greater focus on quality improvement and patient safety [1,2]. This has been recognized as a priority by the Institute of Medicine, the Joint Commission, and the Accreditation Council for Graduate Medical Education (ACGME) [3–6]. Hospital safety event reporting systems have been implemented to improve patient safety. Despite national expectations and demonstrated benefits of reporting adverse events, most resident and attending physicians fail to understand the value, lack the skills to report, and do not participate in incident reporting [7–9].
Past attempts to increase awareness about patient safety reporting have resulted in minimal participation [10,11]. In relation to other health care providers, attending and resident physicians have the lowest rate of patient safety reporting [12]. Interventions aiming to improve reporting have had mixed results, with sustained improvement being a major challenge [13,14]. To advance our efforts to improve reporting of patient safety events as a means toward improving patient safety, we sought to understand the attitudes and beliefs of our physicians in training with regard to patient safety event reporting.
Methods
Setting
Our institution, a community teaching hospital located in Park Ridge, IL, began patient safety event reporting in 2006 by remote data entry using the Midas information management system (MidasPlus, Xerox, Tucson, AZ). In 2012, as part of the system-based practice ACGME competency, we asked residents enter at least 1 patient safety event for each rotation block. The events could be entered with identifying information or anonymously.
Quality Improvement Project
Given the national focus on patient safety and quality improvement, as well as our organizational goal of zero patient safety events by 2020, in 2014 we formed an inpatient safety and quality committee. This committee includes the medical director of patient safety, internal medicine program director, associate program director, chief resident, fellows, residents and attending physicians. The committee was formed with the long-term objective of advancing patient safety and quality improvement efforts and to decrease preventable errors. As physicians in training are key frontline personnel, the committee decided to focus its initial short-term efforts on this group.
Questionnaire
To understand the magnitude and context of resident reporting behavior, we surveyed the residents and fellows in the department of internal medicine. The fellowships were in cardiology, gastroenterology, and hematology/oncology. The questionnaire we used contained 5 closed-ended items that examined trainees attitudes, experiences, and knowledge about incident reporting. The survey was distributed to the residents and fellows via SurveyMonkeyduring August 2014.
Results
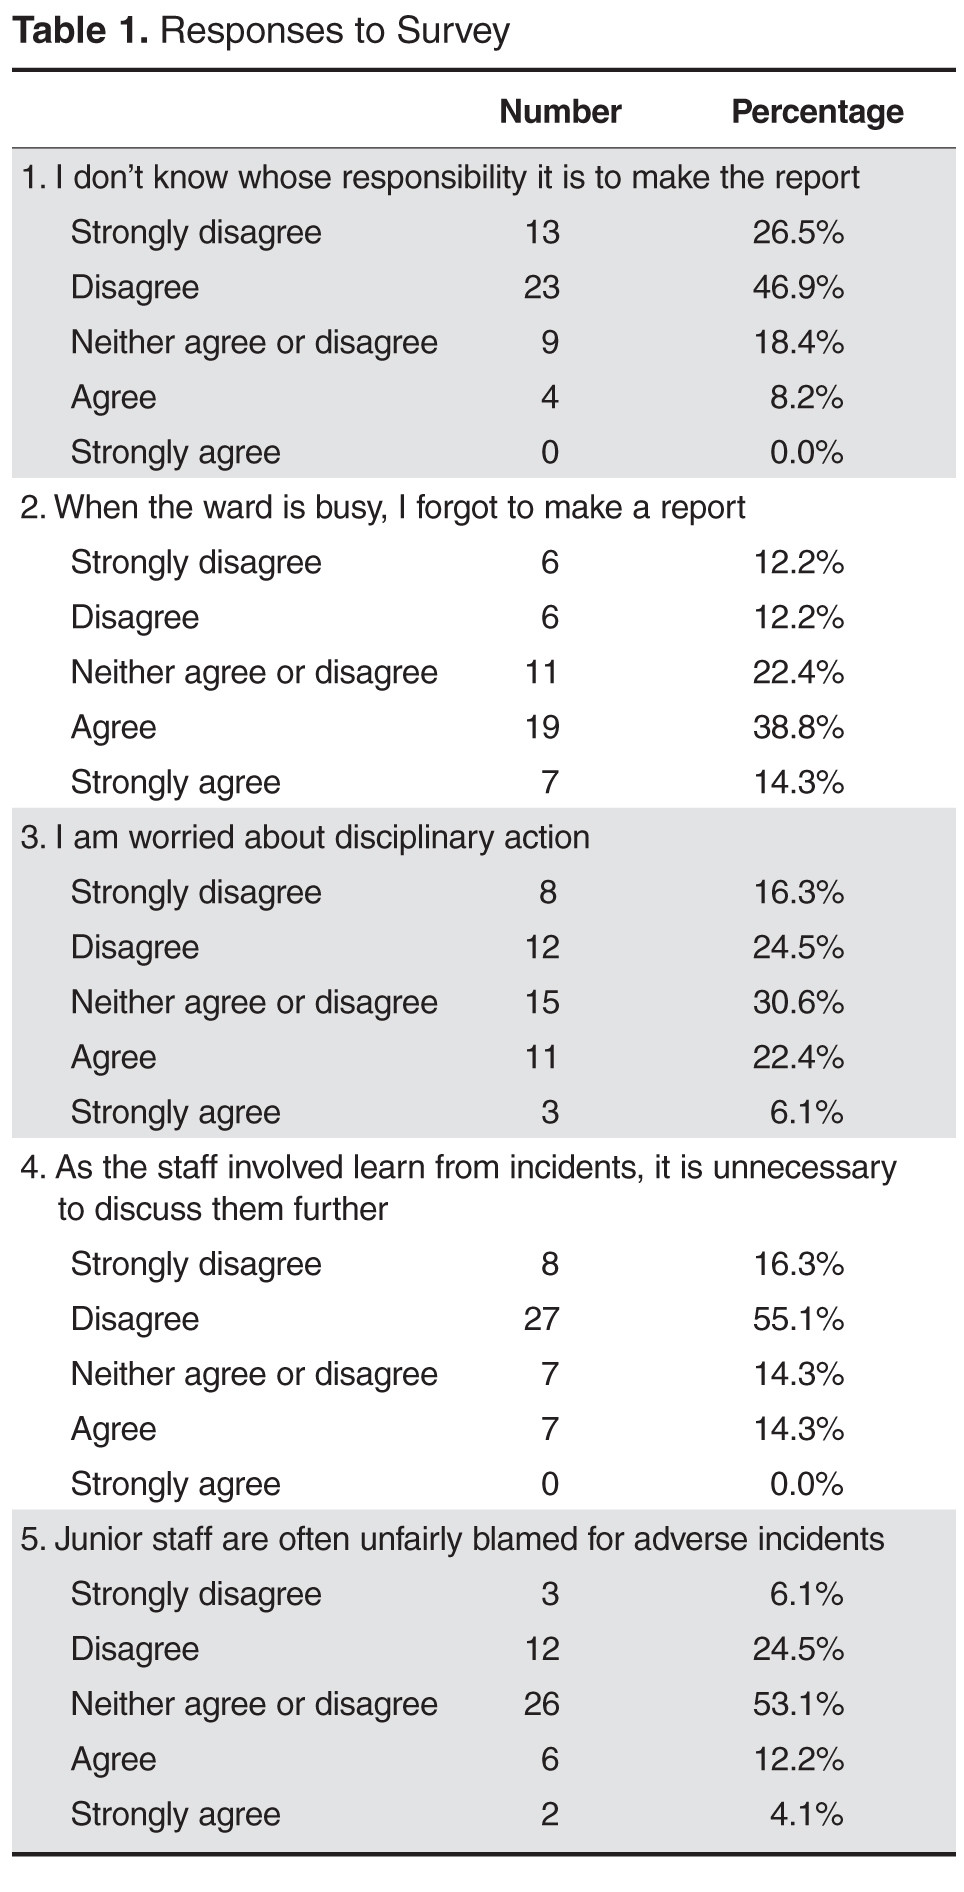
When asked to outline reasons for not reporting incidents, participating residents and fellows identified the complexity of reporting system, lack of feedback, lack of updates about new system changes resulting from safety event reporting, 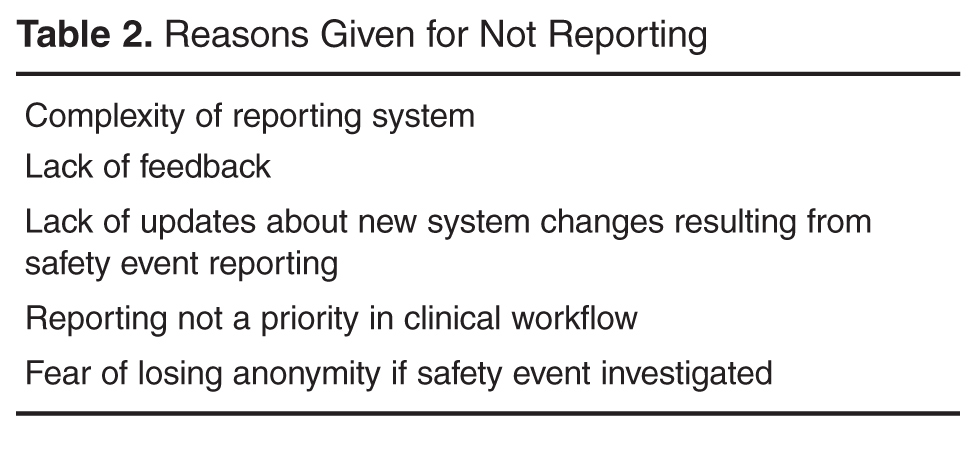
Discussion
This pilot study demonstrated that resident and fellow physicians in the department of internal medicine at our institution understand the necessity of reporting and that it is their responsibility; however, it is not a priority during the busy clinical workflow on the wards. Other investigators have observed similar attitudes/behaviors among physicians across teaching hospitals in the United States [10,12]. In a study by Boike et al [15], despite positive attitudes among internal medicine residents regarding reporting, increased reporting could not be sustained after the initial increase.
Our finding that 71.4% felt it was useful to discuss safety events is similar to Kaldjian et al’s [16] finding that 70% of generalist physicians in teaching hospitals believed that discussing mistakes strengthens professional relationships. The physicians in that study indicated that they usually discuss their errors with colleagues.
Prior to the development of the inpatient safety committee, the institution had a basic resource in place for reporting events, but there were minimal contributions from resident and fellow physicians. It is likely that the higher rates of reporting by nursing, laboratory, and pharmacy services (data not presented) that were seen are due to a required reporting protocol that is part of the workflow.
Since the inception of the inpatient safety committee, we have started several projects to build upon the foundation of positive resident and fellow physician attitudes. Based on the input of resident and fellow physicians, who are the front-line agents of process improvement, the existing patient safety reporting method was revised and reorganized. Previously, an online standardized patient safety event form was accessible after several click throughs on the institution’s homepage. This form was confusing and laborious to complete by residents and fellows, who were already operating on thin margins of spare time. The online reporting form was moved to the homepage for easy access and a free text option was enabled.
Another barrier to reporting was access to available computers. As such, the committee instituted a phone hotline reporting system. Instead of residents entering events using the Midas information management system, they now are able to call an in-house line and leave an anonymous voicemail to report safety events. Both the online and phone hotline reporting systems are integrated into a central database.
Lastly, resident and fellow physician education curricula were developed to instruct on the need to report patient safety events. Time is allotted at every monthly resident business meeting to discuss reportable patient safety events and offer feedback about concerns. In addition, the director of patient safety sends weekly safety updates, which are emailed to all faculty, residents, and fellows. These include de-identified safety event reports and any organizational and system improvements made in response to these events. Additionally, a mock root analysis takes place each quarter in which the patient safety director reviews a mock case with trainees to identify root causes and system failures. The committee has committed to transparency of reporting patient safety events as means to track the results of our efforts and interventions [17].
We plan to resurvey the resident and fellow physicians to reassess stability or changes in attitudes as a result of these physician-focused improvements. A more systematic analysis of temporal trends in reporting and comparisons across residency programs within our health system is being designed.
Conclusion
Reporting patient safety events should not be seen as a cumbersome task in an already busy clinical workday. We intend to develop scalable solutions that take into account the challenges faced by physicians in training. As the institution strives to become a high-reliability organization with a goal of zero serious patient safety events by 2020, we hope to share the lessons from our quality improvement efforts with other learning organizations.
Acknowledgements: The authors thank Suela Sulo, PhD, for manuscript review and editing.
Corresponding author: Jill Patton, DO, Advocate Lutheran General Hospital, 1775 Dempster St., Park Ridge, IL 60068, jill.patton@advocatehealth.com.
Financial disclosures: None.
1. Boonyasai RT, Windish DM, Chakraborti C, et al. Effectiveness of teaching quality improvement to clinicians: a systematic review. JAMA 2007;298:1023–37.
2. Wong BM, Etchells EE, Kuper A, et al. Teaching quality improvement and patient safety to trainees: a systematic review. Acad Med 2010;85:1425–39.
3. Leape LL, Berwick DM. Five years after To Err Is Human: what have we learned? JAMA. 2005;293:2384–90.
4. Kohn LT, Corrigan JM, Donaldson MS. To err is human: Building a safer health system. Washington, DC: National Academy Press; 1999.
5. Swing SR. The ACGME outcome project: retrospective and prospective. Med Teach 2007;29:648–54.
6. ACGME. Common program requirements. Available at www.acgme.org.
7. Kaldjian LC, Jones EW, Wu BJ, et al. Reporting medical errors to improve patient safety: a survey of physicians in teaching hospitals. Arch Intern Med 2008;168:40–6.
8. Kaldjian LC, Jones EW, Rosenthal GE, et al. An empirically derived taxonomy of factors affecting physicians’ willingness to disclose medical errors. J Gen Intern Med 2006;21:942–8.
9. White AA, Gallagher TH, Krauss MJ, et al. The attitudes and experiences of trainees regarding disclosing medical errors to patients. Acad Med 2008;83:250–6.
10. Farley DO, Haviland A, Champagne S, et al. Adverse-event-reporting practices by US hospitals: results of a national survey. Qual Saf Health Care 2008;17:416–23.
11. Schectman JM, Plews-Ogan ML. Physician perception of hospital safety and barriers to incident reporting. Jt Comm J Qual Patient Saf 2006;32:337–43.
12. Milch CE, Salem DN, Pauker SG, et al. Voluntary electronic reporting of medical errors and adverse events. An analysis of 92,547 reports from 26 acute care hospitals. J Gen Intern Med 2006;21:165–70.
13. Madigosky WS, Headrick LA, Nelson K, et al. Changing and sustaining medical students’ knowledge, skills, and attitudes about patient safety and medical fallibility. Acad Med 2006;81:94–101.
14. Jericho BG, Tassone RF, Centomani NM, et al. An assessment of an educational intervention on resident physician attitudes, knowledge, and skills related to adverse event reporting. J Grad Med Educ 2010;2:188–94.
15. Boike JR, Bortman JS, Radosta JM, et al. Patient safety event reporting expectation: does it influence residents’ attitudes and reporting behaviors? J Patient Saf 2013;9:59–67.
16.Kaldjian LC, Forman-Hoffman VL, Jones EW, et al. Do faculty and resident physicians discuss their medical errors? J Med Ethics 2008;34:717–22.
17. Willeumier D. Advocate health care: a systemwide approach to quality and safety. Jt Comm J Qual Saf 2004;30:559–66.
From the Department of Internal Medicine, Advocate Lutheran General Hospital, Park Ridge, IL.
Abstract
- Objective: To understand the attitudes and experiences of physicians in training with regard to patient safety event reporting.
- Methods: Residents and fellows in the department of internal medicine were surveyed using a questionnaire containing 5 closed-ended items. These items examined trainees’ attitudes, experiences and knowledge about safety event reporting and barriers to their reporting.
- Results: 61% of 80 eligible trainees responded. The majority of residents understood that it is their responsibility to report safety events. Identified barriers to reporting were the complexity of the reporting system, lack of feedback after reporting safety events to gain knowledge of system advances, and reporting was not a priority in clinical workflow.
- Conclusion: An inpatient safety and quality committee intends to develop solutions to the challenges faced by trainees’ in reporting patient safety events.
Nationwide, graduate medical education programs are changing to include a greater focus on quality improvement and patient safety [1,2]. This has been recognized as a priority by the Institute of Medicine, the Joint Commission, and the Accreditation Council for Graduate Medical Education (ACGME) [3–6]. Hospital safety event reporting systems have been implemented to improve patient safety. Despite national expectations and demonstrated benefits of reporting adverse events, most resident and attending physicians fail to understand the value, lack the skills to report, and do not participate in incident reporting [7–9].
Past attempts to increase awareness about patient safety reporting have resulted in minimal participation [10,11]. In relation to other health care providers, attending and resident physicians have the lowest rate of patient safety reporting [12]. Interventions aiming to improve reporting have had mixed results, with sustained improvement being a major challenge [13,14]. To advance our efforts to improve reporting of patient safety events as a means toward improving patient safety, we sought to understand the attitudes and beliefs of our physicians in training with regard to patient safety event reporting.
Methods
Setting
Our institution, a community teaching hospital located in Park Ridge, IL, began patient safety event reporting in 2006 by remote data entry using the Midas information management system (MidasPlus, Xerox, Tucson, AZ). In 2012, as part of the system-based practice ACGME competency, we asked residents enter at least 1 patient safety event for each rotation block. The events could be entered with identifying information or anonymously.
Quality Improvement Project
Given the national focus on patient safety and quality improvement, as well as our organizational goal of zero patient safety events by 2020, in 2014 we formed an inpatient safety and quality committee. This committee includes the medical director of patient safety, internal medicine program director, associate program director, chief resident, fellows, residents and attending physicians. The committee was formed with the long-term objective of advancing patient safety and quality improvement efforts and to decrease preventable errors. As physicians in training are key frontline personnel, the committee decided to focus its initial short-term efforts on this group.
Questionnaire
To understand the magnitude and context of resident reporting behavior, we surveyed the residents and fellows in the department of internal medicine. The fellowships were in cardiology, gastroenterology, and hematology/oncology. The questionnaire we used contained 5 closed-ended items that examined trainees attitudes, experiences, and knowledge about incident reporting. The survey was distributed to the residents and fellows via SurveyMonkeyduring August 2014.
Results
When asked to outline reasons for not reporting incidents, participating residents and fellows identified the complexity of reporting system, lack of feedback, lack of updates about new system changes resulting from safety event reporting,
Discussion
This pilot study demonstrated that resident and fellow physicians in the department of internal medicine at our institution understand the necessity of reporting and that it is their responsibility; however, it is not a priority during the busy clinical workflow on the wards. Other investigators have observed similar attitudes/behaviors among physicians across teaching hospitals in the United States [10,12]. In a study by Boike et al [15], despite positive attitudes among internal medicine residents regarding reporting, increased reporting could not be sustained after the initial increase.
Our finding that 71.4% felt it was useful to discuss safety events is similar to Kaldjian et al’s [16] finding that 70% of generalist physicians in teaching hospitals believed that discussing mistakes strengthens professional relationships. The physicians in that study indicated that they usually discuss their errors with colleagues.
Prior to the development of the inpatient safety committee, the institution had a basic resource in place for reporting events, but there were minimal contributions from resident and fellow physicians. It is likely that the higher rates of reporting by nursing, laboratory, and pharmacy services (data not presented) that were seen are due to a required reporting protocol that is part of the workflow.
Since the inception of the inpatient safety committee, we have started several projects to build upon the foundation of positive resident and fellow physician attitudes. Based on the input of resident and fellow physicians, who are the front-line agents of process improvement, the existing patient safety reporting method was revised and reorganized. Previously, an online standardized patient safety event form was accessible after several click throughs on the institution’s homepage. This form was confusing and laborious to complete by residents and fellows, who were already operating on thin margins of spare time. The online reporting form was moved to the homepage for easy access and a free text option was enabled.
Another barrier to reporting was access to available computers. As such, the committee instituted a phone hotline reporting system. Instead of residents entering events using the Midas information management system, they now are able to call an in-house line and leave an anonymous voicemail to report safety events. Both the online and phone hotline reporting systems are integrated into a central database.
Lastly, resident and fellow physician education curricula were developed to instruct on the need to report patient safety events. Time is allotted at every monthly resident business meeting to discuss reportable patient safety events and offer feedback about concerns. In addition, the director of patient safety sends weekly safety updates, which are emailed to all faculty, residents, and fellows. These include de-identified safety event reports and any organizational and system improvements made in response to these events. Additionally, a mock root analysis takes place each quarter in which the patient safety director reviews a mock case with trainees to identify root causes and system failures. The committee has committed to transparency of reporting patient safety events as means to track the results of our efforts and interventions [17].
We plan to resurvey the resident and fellow physicians to reassess stability or changes in attitudes as a result of these physician-focused improvements. A more systematic analysis of temporal trends in reporting and comparisons across residency programs within our health system is being designed.
Conclusion
Reporting patient safety events should not be seen as a cumbersome task in an already busy clinical workday. We intend to develop scalable solutions that take into account the challenges faced by physicians in training. As the institution strives to become a high-reliability organization with a goal of zero serious patient safety events by 2020, we hope to share the lessons from our quality improvement efforts with other learning organizations.
Acknowledgements: The authors thank Suela Sulo, PhD, for manuscript review and editing.
Corresponding author: Jill Patton, DO, Advocate Lutheran General Hospital, 1775 Dempster St., Park Ridge, IL 60068, jill.patton@advocatehealth.com.
Financial disclosures: None.
1. Boonyasai RT, Windish DM, Chakraborti C, et al. Effectiveness of teaching quality improvement to clinicians: a systematic review. JAMA 2007;298:1023–37.
2. Wong BM, Etchells EE, Kuper A, et al. Teaching quality improvement and patient safety to trainees: a systematic review. Acad Med 2010;85:1425–39.
3. Leape LL, Berwick DM. Five years after To Err Is Human: what have we learned? JAMA. 2005;293:2384–90.
4. Kohn LT, Corrigan JM, Donaldson MS. To err is human: Building a safer health system. Washington, DC: National Academy Press; 1999.
5. Swing SR. The ACGME outcome project: retrospective and prospective. Med Teach 2007;29:648–54.
6. ACGME. Common program requirements. Available at www.acgme.org.
7. Kaldjian LC, Jones EW, Wu BJ, et al. Reporting medical errors to improve patient safety: a survey of physicians in teaching hospitals. Arch Intern Med 2008;168:40–6.
8. Kaldjian LC, Jones EW, Rosenthal GE, et al. An empirically derived taxonomy of factors affecting physicians’ willingness to disclose medical errors. J Gen Intern Med 2006;21:942–8.
9. White AA, Gallagher TH, Krauss MJ, et al. The attitudes and experiences of trainees regarding disclosing medical errors to patients. Acad Med 2008;83:250–6.
10. Farley DO, Haviland A, Champagne S, et al. Adverse-event-reporting practices by US hospitals: results of a national survey. Qual Saf Health Care 2008;17:416–23.
11. Schectman JM, Plews-Ogan ML. Physician perception of hospital safety and barriers to incident reporting. Jt Comm J Qual Patient Saf 2006;32:337–43.
12. Milch CE, Salem DN, Pauker SG, et al. Voluntary electronic reporting of medical errors and adverse events. An analysis of 92,547 reports from 26 acute care hospitals. J Gen Intern Med 2006;21:165–70.
13. Madigosky WS, Headrick LA, Nelson K, et al. Changing and sustaining medical students’ knowledge, skills, and attitudes about patient safety and medical fallibility. Acad Med 2006;81:94–101.
14. Jericho BG, Tassone RF, Centomani NM, et al. An assessment of an educational intervention on resident physician attitudes, knowledge, and skills related to adverse event reporting. J Grad Med Educ 2010;2:188–94.
15. Boike JR, Bortman JS, Radosta JM, et al. Patient safety event reporting expectation: does it influence residents’ attitudes and reporting behaviors? J Patient Saf 2013;9:59–67.
16.Kaldjian LC, Forman-Hoffman VL, Jones EW, et al. Do faculty and resident physicians discuss their medical errors? J Med Ethics 2008;34:717–22.
17. Willeumier D. Advocate health care: a systemwide approach to quality and safety. Jt Comm J Qual Saf 2004;30:559–66.
Using an Electronic Health Record-Based Registry to Improve Pediatric Sickle Cell Care
From the Department of Pediatrics, Boston University School of Medicine, Boston Medical Center, Boston, MA.
This article is the second in our Hemoglobinopathy Learning Collaborative series. See the related editorial by Oyeku et al in the February 2014 issue of JCOM. (—Ed.)
Abstract
- Objective: To describe the development and use of an electronic health record (EHR)–based sickle cell disease (SCD) registry for children with SCD to enhance case management and quality improvement (QI) efforts at an urban, academic, safety net institution.
- Methods: Using national guidelines and the literature, we created quality metrics for pediatric SCD that focused on vaccination delivery and use of transcranial Doppler screening and hydroxyurea. We revised EHR forms for SCD care and created an EHR-based SCD registry that permitted monthly and annual reporting on quality metrics.
- Results: From 2008 to 2012, the percentage of children with SCD vaccinated for influenza increased from 52% to 65%, and for meningococcus from 53% to 70%. After licensure of PCV13 in 2010, the percentage of children vaccinated rose to 69% in 2012. Results for PPV23 were mixed: 87% to 91% received ≥1 dose, but the rate for receiving the second dose declined from 76% to 64%. Percentage of children screened annually with transcranial Doppler consistently ranged from 62% to 73% during the 5 years. QI initiatives in 2012–2013 led to increased influenza vaccination, from 65% to 83%, and increased hydroxyurea use, from 52% to 73%.
- Conclusion: In this study, a practical, replicable and feasible approach for improving the quality of SCD care combined the collaboration of a multidisciplinary team, an EHR-based disease registry, and QI initiatives. Additional work is needed to define and measure all elements of high-quality care for children with SCD and link process measures to clinical outcomes.
Sickle cell disease (SCD) is the most commonly inherited disorder in the United States, affecting approximately 100,000 individuals and 1 in 400 African American births [1,2]. The use of preventive strategies, such as immunizations [3], transcranial Doppler screening and transfusion protocols [4,5], and hydroxyurea therapy [6,7] has contributed to decreased morbidity and mortality among children with SCD [8,9]. However, a substantial gap exists between the care that children with SCD should receive and the care they actually receive [10–12]. An essential component of any effort that seeks to improve care is the ability to measure care processes and outcomes in a way that can drive quality improvement (QI) initiatives. Registries serve a vital role in quality improvement activities for many pediatric conditions, including inflammatory bowel disease [13] and cystic fibrosis [14]. However, there are no national or nationally representative registries currently available for children with SCD [15]. There is a pressing need for better information systems and tools that can be used in mainstream clinical settings to measure clinical performance with respect to quality indicators [16] if the goals of high quality care and better quality of life are to be achieved for children with SCD.
Electronic health records (EHRs) have been successfully used to improve the quality of care and enhance performance measurement in select institutions [17,18], and adoption of EHRs is growing. The 2009 American Recovery and Reinvestment Act allocated $20.8 billion in incentives to assist providers to adopt and “meaningfully use” EHRs [19,20]. As of 2011, 39% of office-based providers have implemented at least a basic EHR [21], up from 17% in 2008 [22]. The effective use of EHRs depends on collaboration between technical and medical experts so that functionality is achieved and clinical quality is appropriately measured. In addition, few EHRs contain specialized content for the care of persons with SCD.
While independent registries have been shown to be effective in improving care [13,14,23], they involve extra time and effort for data entry, can be difficult and expensive to maintain, and may not be feasible for many systems that care for SCD patients. In this paper, we describe the development and use of our EHR-based SCD registry for children with SCD, including our efforts to engage key technical and clinical experts to develop an EHR that is tailored to the outpatient workflow and data collection of quality measures and implement a fully functional system that collects data on quality measures to support case management and continuous QI.
Methods
This study was conducted at Boston Medical Center, New England’s largest safety net hospital, which cares for 190 children with SCD ages 0 to 21 years. The outpatient EHR (Centricity, GE) has been in use since 2000 and is used for all aspects of outpatient care, including ordering of immunizations and tests, electronic prescription writing, and referrals to specialty care.
Outcome Measures
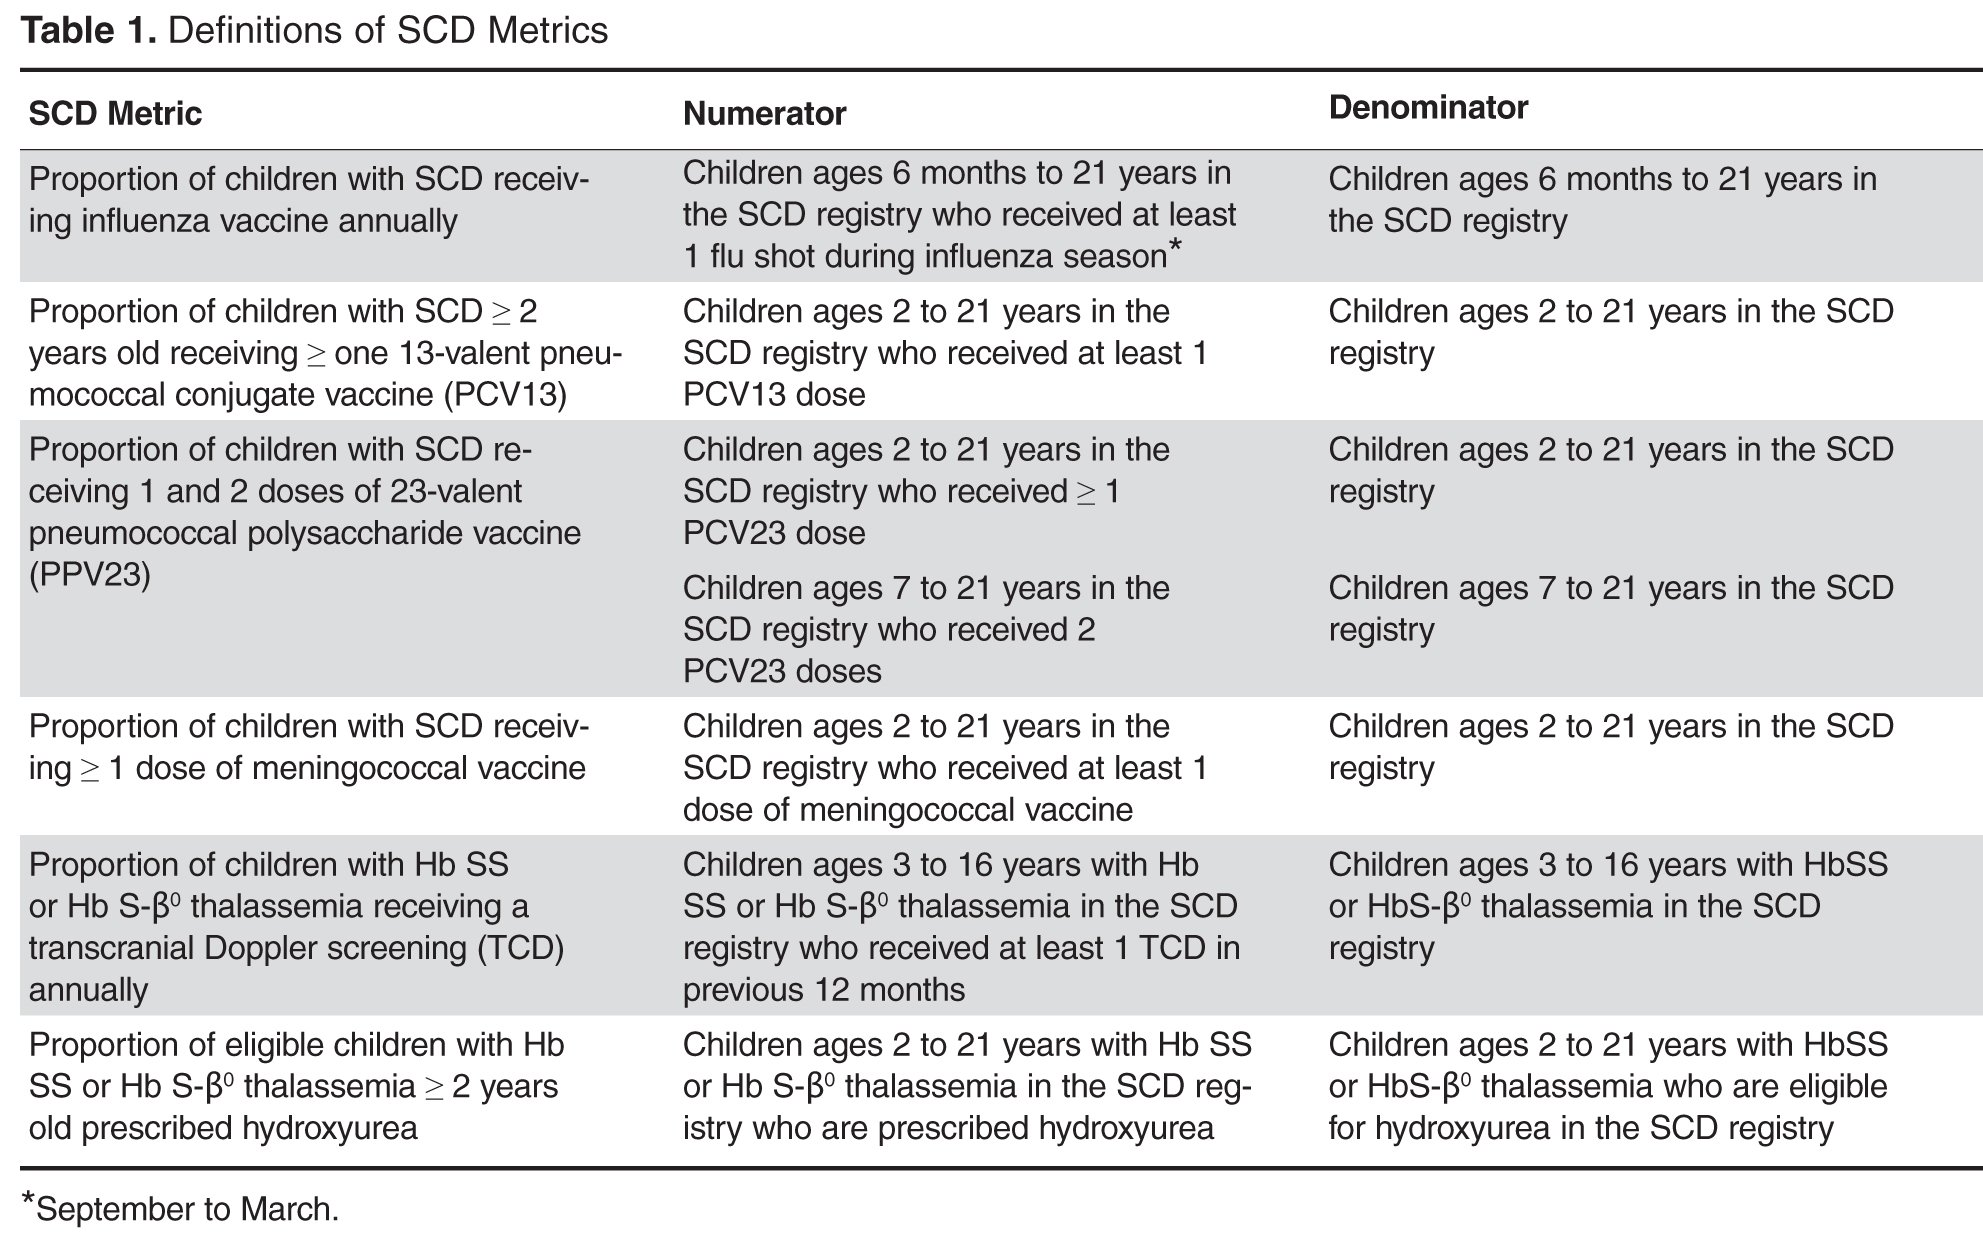
Vaccines: The Centers for Disease Control and Prevention (CDC) recommends vaccinating children with SCD [26] against influenza annually, given their susceptibility to the influenza virus [24,27]. The CDC also recommends the 23-valent pneumococcal polysaccharide vaccine (PPV23 2-dose series) and 13-valent pneumococcal conjugate vaccine (PCV13, per childhood routine vaccine schedule for young children and 1 catch-up dose for children previously vaccinated with PCV7), and meningococcal vaccine (2-dose series), given patients’ functional asplenic status [25,28].
Transcranial Doppler screening can identify children with hemoglobin (Hb) SS and Hb S-β0 thalassemia at higher risk of stroke, which may be prevented through hypertransfusion programs [4]. Screening is recommended annually for these children ages 2 to 16 years [25].
Hydroxyurea use among children with Hb SS and Hb S-β0 thalassemia is an established practice [29,30]. We consider hydroxyurea therapy for all children 2 years and older with Hb SS and Hb S-β0 thalassemia, given the recently published safety data from the Baby-HUG trial [7] and the benefits of hydroxyurea among children and adults with SCD [6,31–35].
EHR-based Registry
Our EHR-based SCD registry includes 3 key components: (1) forms to support detailed documentation at the point-of-care (ie, clinic visit); (2) a registry management form to allow the QI team to identify patients to be included or excluded from the registry; and (3) a central data warehouse to support quality measurement and improvement.
Documentation in the EHR is performed using a set of customized templates or “forms.” These forms allow documentation of care provision in a structured way. The discrete data elements are stored within the data warehousing system that supports the EHR. The SCD forms used in this project were a revised version of existing forms used by our pediatric hematologists for the past 6 years. The primary goal was to improve efficiency in a patient encounter and enhance data collection efforts. In particular, several changes were made to enhance data collection for quality measures included in the SCD registry. First, we collected genotype in a standardized way to better define subpopulations of SCD patients, as some of the care provided is dictated by genotype. We also expanded data capture for transcranial Doppler screening to include date of last screening to prompt scheduling. For hydroxyurea, the forms now capture if hydroxyurea has been prescribed, and if not, why (eg, declined, not indicated); adherence, current dose, and routine labs for monitoring are also listed to aid in clinical decision-making. Finally, the forms were revised to prominently display the subset of immunizations important to SCD (described above) to assess if the patient is current.
Within the new forms, we collected all data elements important to providing care to children with SCD. Several new items existed in other parts of the EHR and were automatically pulled into the forms, including laboratory results, medications and immunizations. Other new data elements required manual entry by providers based on EHR review, as they had previously not been documented, documented on an ad hoc basis, or found as free text within notes (eg, number of ED visits and hospitalizations in the past year). Initial completion of these forms took approximately 10 to 15 minutes per patient, as many of these data elements were not individually captured prior to this work; documentation for subsequent comprehensive visits required an additional 5 to 10 minutes per chart. Currently, the 3 pediatric hematologists regularly use the SCD forms for routine visits.
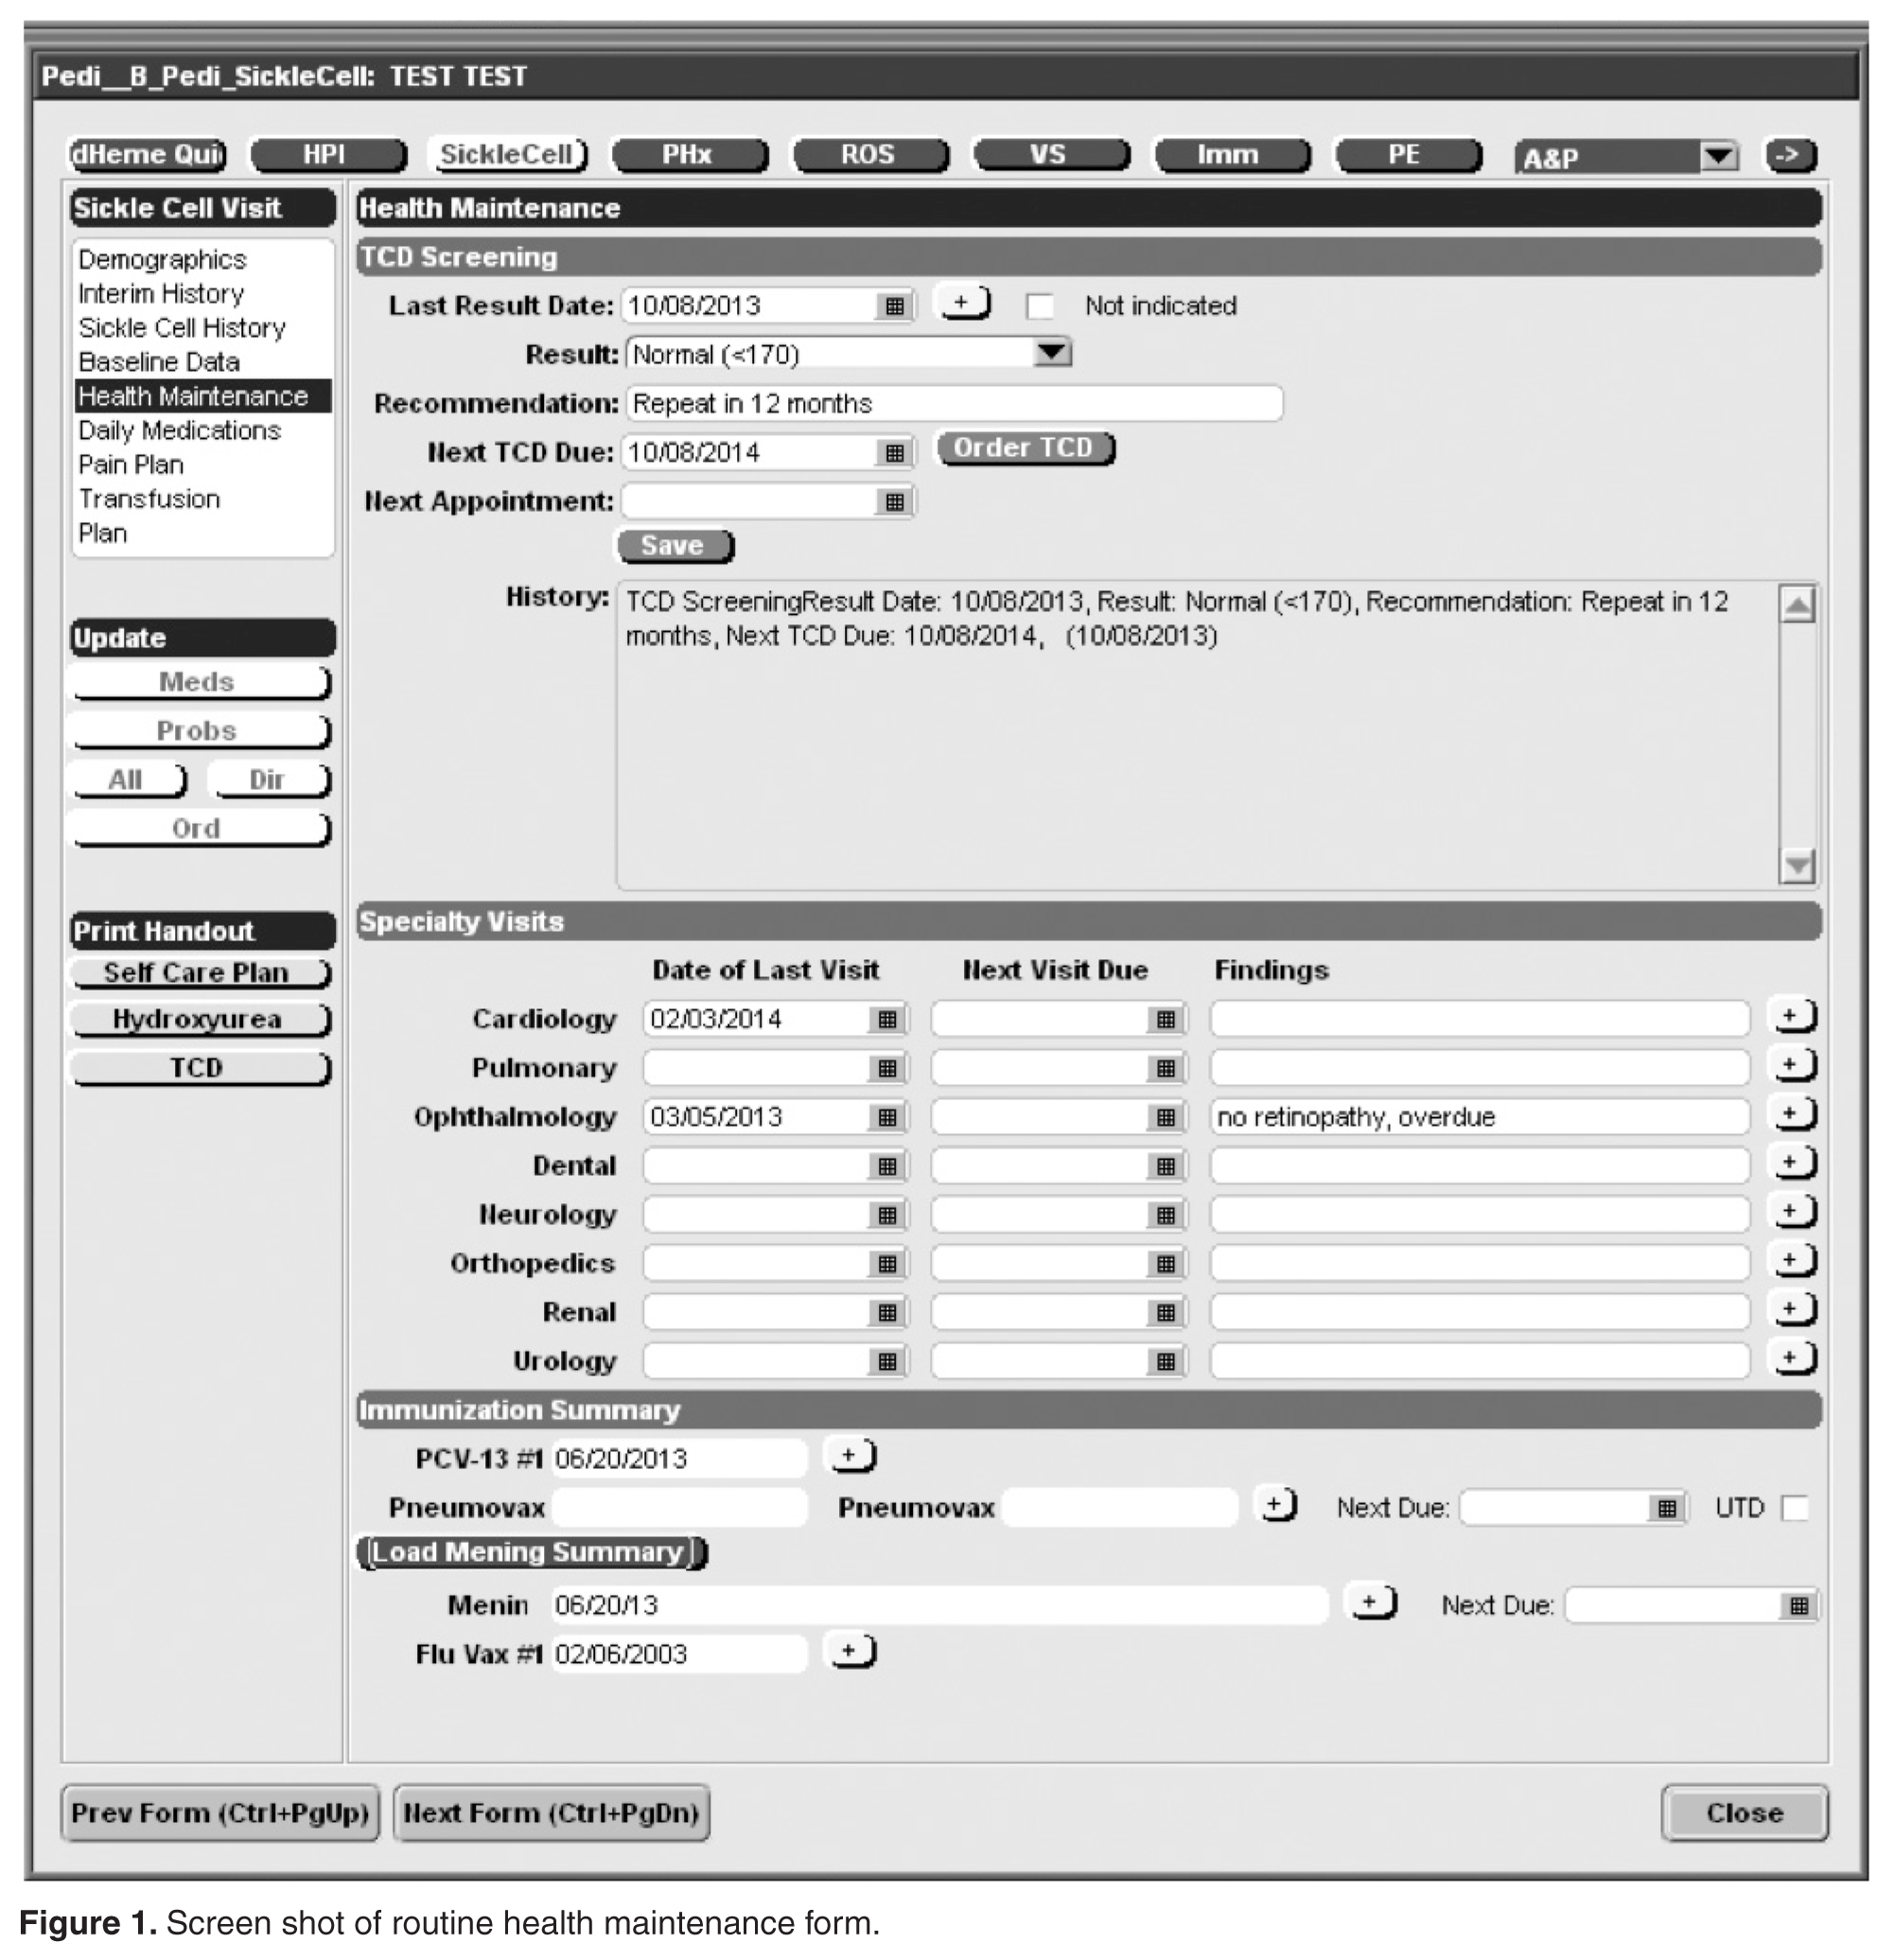
The registry management form was also created by the EHR design team. Although this form is separate from the SCD forms, it was readily accessible to the clinical team to quickly check whether patients should be included or excluded from the SCD registry. In this way, inactive patients could be removed and new patients could be included. This form was completed for all active pediatric patients with SCD as of February 2013 using data from a separately maintained clinical database. For patients who were new to the pediatric hematology practice between July 2012 and February 2013 (eg, infants born during this period, patients transferring care), we manually determined a registry start date in order to calculate accurate denominators for each measure. New patients were entered into the SCD registry by members of the care team on an ad hoc basis, and biannual searches of problem lists were planned to ensure the pediatric SCD registry was complete using the SCD-related ICD-9 codes 282.6, 282.41 and 282.4 to encompass all sickle hemoglobinopathies, including sickle cell thalassemia.
For this project, we were fortunate to have a well-established clinical data warehouse into which the medical center’s EHR data is copied nightly. In addition, the medical center already had multiple chronic disease registries and a framework for evaluating and sharing QI data. We were able to add SCD to this existing infrastructure, which was helpful since a secure and HIPAA-compliant location to post these patient-level reports had been previously identified.
We paid for 40 hours of technical staff time using grant funds to create reports using data collected in the EHR for patients who were actively in the SCD registry per the registry management form. Using these data, summary reports for our key SCD metrics were generated on both an annual and monthly basis. We tested and refined our key SCD metrics over a 4-month period to ensure that we had defined the numerators and denominators for each care process accurately. For example, children become eligible for influenza vaccine at 6 months of age, therefore, the eligible denominator would exclude infants < 6 months of age (Table 1). In addition, lists of patient names and phone numbers were automatically generated to identify those in need of care elements, facilitating both case management and continuous improvement for these measures, replacing the need for all external clinical databases.
Data Analysis
For children included in the SCD registry, we calculated the proportion who were appropriately vaccinated and received transcranial Doppler screening each year for the 5-year period 2008–2012. For the period July 2012–June 2013, we calculated the proportion of children with SCD in the registry who received influenza vaccine and children with Hb SS and Hb S-β0 thalassemia who were prescribed hydroxyurea.
This study was approved by the Boston University Medical Campus institutional review board.
Results
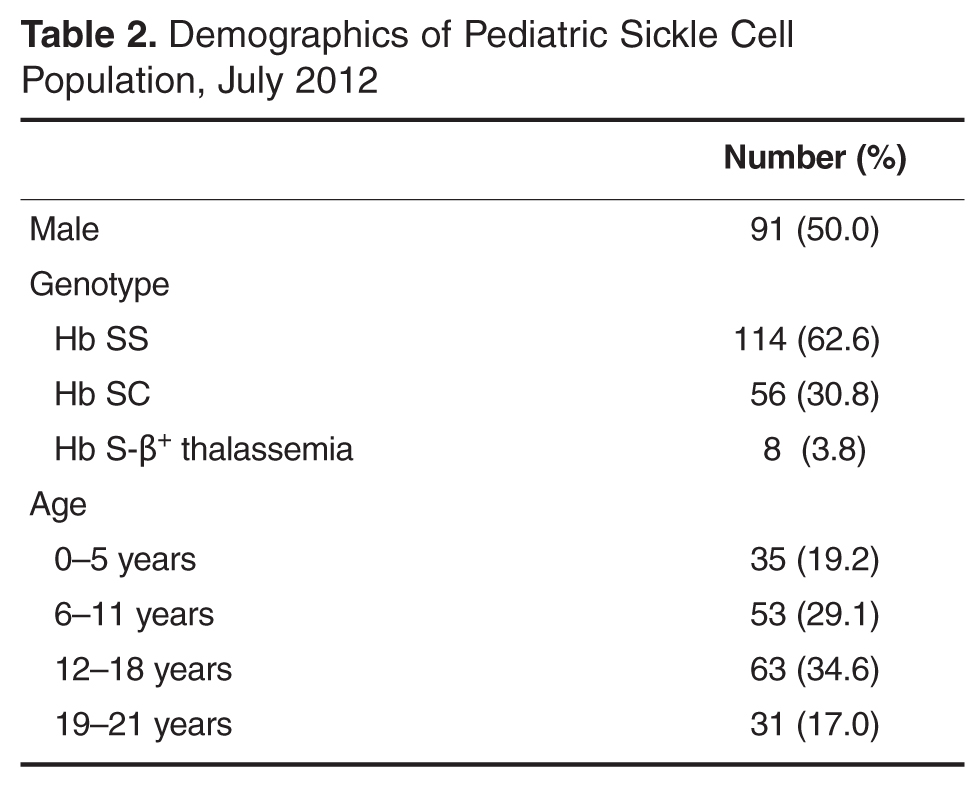
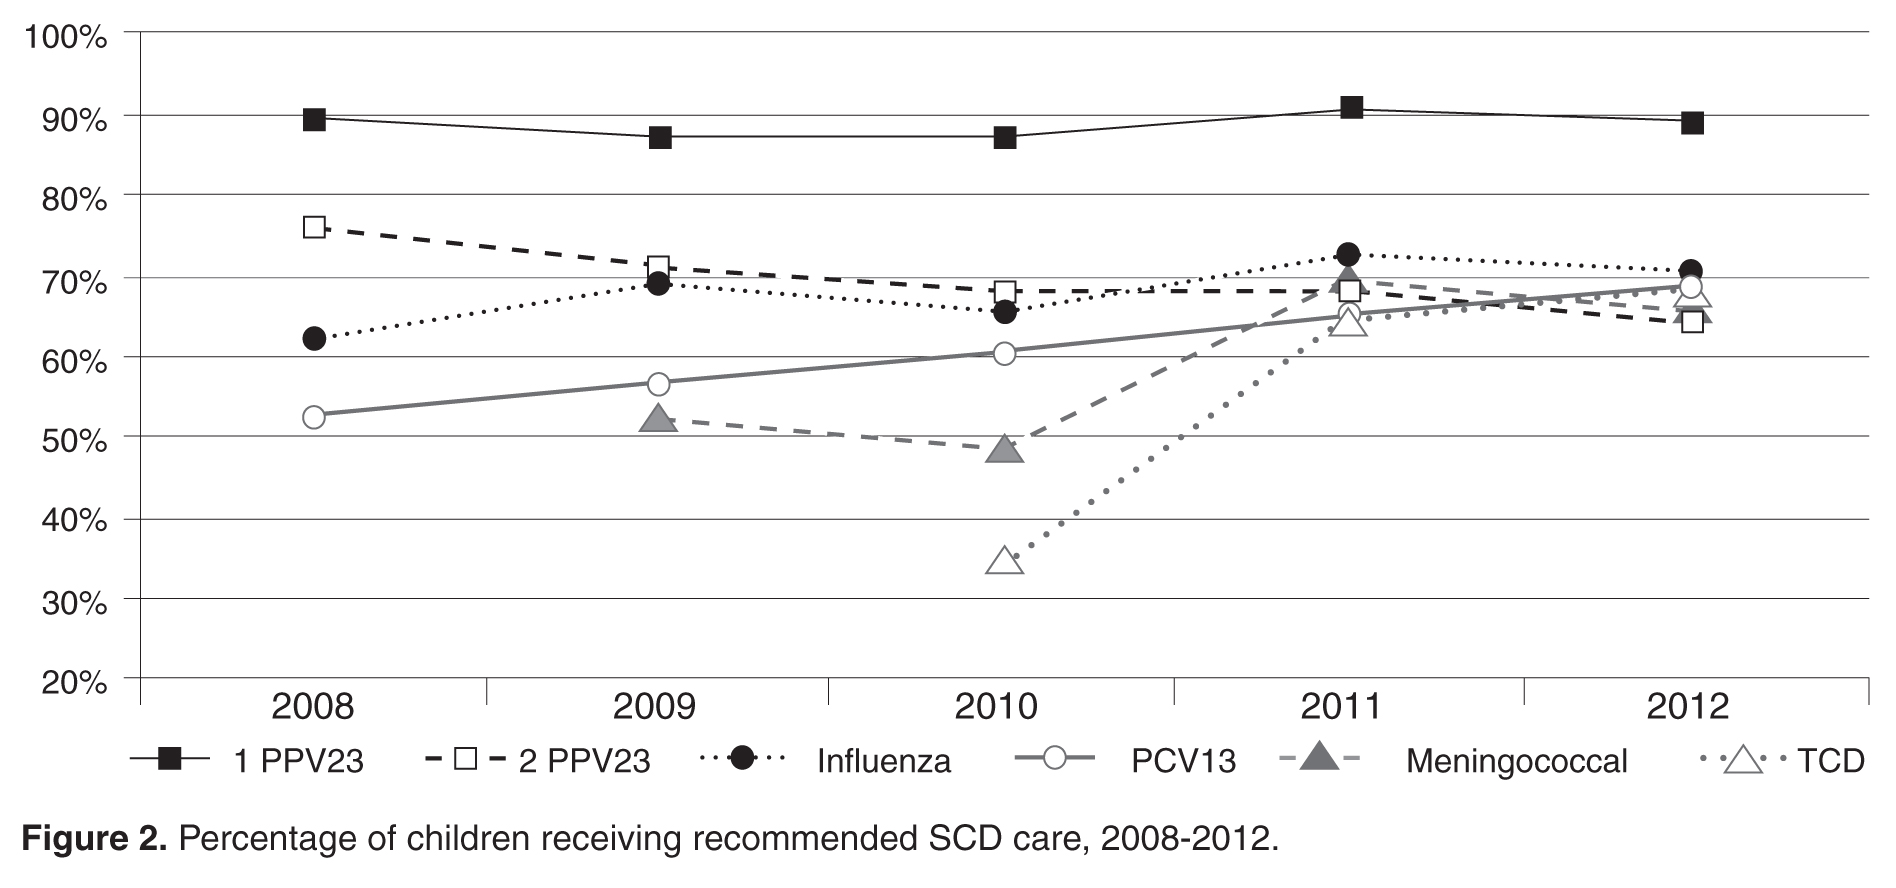
For influenza vaccination for the 2012–2013 season, only 49% of children were vaccinated as of November. This proportion increased after outreach 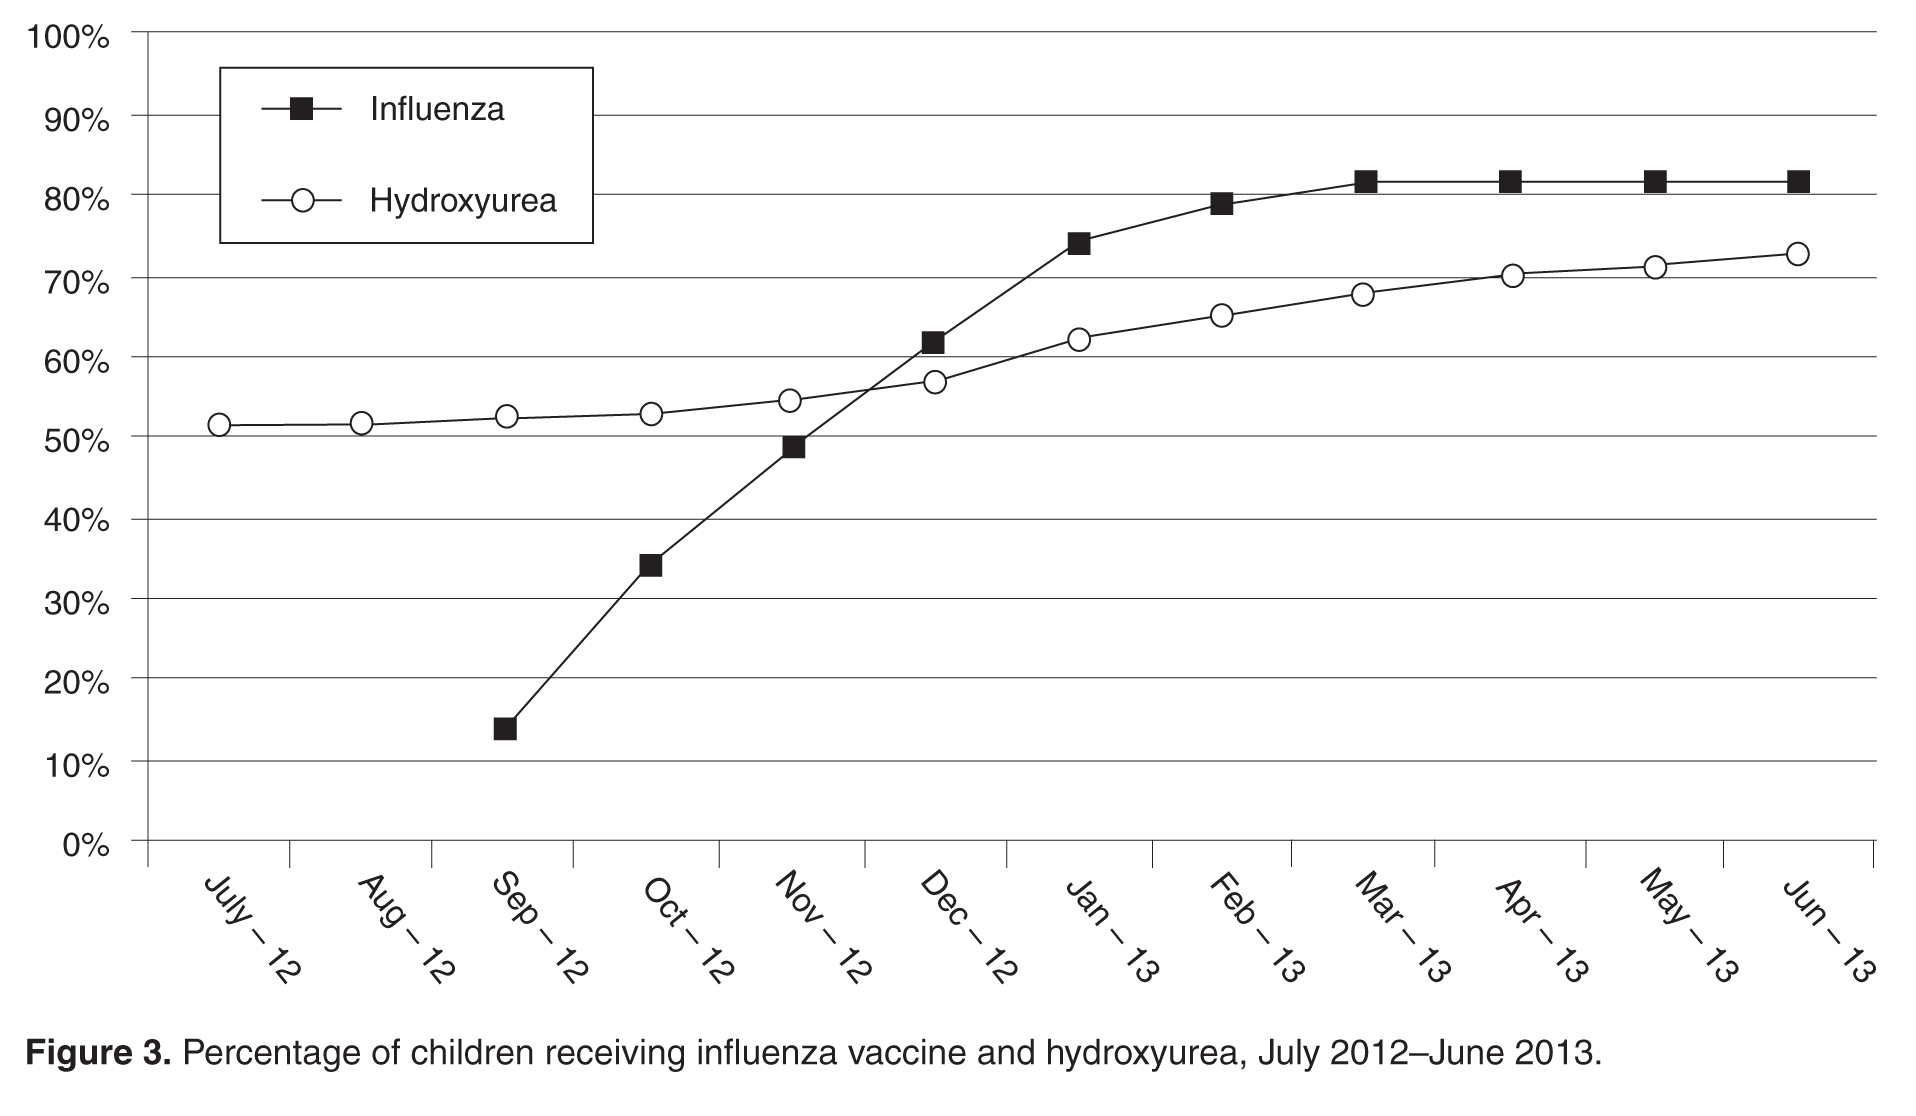
From July 2012 to June 2013, our rates of hydroxyurea use increased from 52% to 73% among eligible patients.
Discussion
In this paper we report on a practical approach for improving the quality of care for persons with SCD that combines the collaboration of a multidisciplinary team, the use of the EHR to create a disease registry, and QI initiatives. We identified where high-quality care is provided and where further attention is needed, and enhanced our case management capabilities with the generation of patient lists identifying those who are in need of care elements. We also used our registry to track care provision, achieving rates of influenza vaccination of 82% and hydroxyurea use to 73% as of June 2013. From these results, we have shown that our EHR can be used for registry management activities and provide real-time clinical data on the care that is provided, and can lead to improved performance on process measures important in the care for children with SCD.
After adjusting to the revised workflow required by the new SCD forms, the pediatric hematology team found them to be useful in tracking important clinical measures. They reported that the most important change was that all routine elements of SCD care, such as dates of last visits to pediatric subspecialists and receipt of recommended routine SCD care, were embedded into their note. This eliminated the need to search previous documents to find dates of the last cardiology visit or influenza immunizations and increased the likelihood that gaps in care would be addressed by the provider during the course of a clinic visit, thereby streamlining clinic workflow.
Healthy People 2020 recommend vaccination rates of 80% and 90% for influenza and PCV13 vaccines, respectively, in the general pediatric population [36]. We have met this goal for the influenza vaccine, but have room to improve for other recommended vaccines for children with SCD. Ultimately, our goal is to provide these vaccines to 100% of children with SCD at our institution. One barrier to achieving high vaccination rates is the lack of provider knowledge on the creation of catch-up vaccine schedules. A study of primary care providers showed that they frequently omitted vaccines when creating catch-up schedules, including the pneumococcal conjugate vaccine for healthy children [37]. Another hurdle is coordination of care between primary and specialty care, as these vaccines could be given in either setting. A recently published study found that only 20% of children with SCD had care coordination between primary and specialty care [38]. Promoting shared responsibility and information on the administration of vaccinations for children with SCD between primary and subspecialty care, and the development of state-wide immunization registries, may help alleviate these challenges.
In this study, our rates of hydroxyurea use among children with Hb SS and Hb S-β0 thalassemia are higher than in other reported studies [12]. We promote hydroxyurea use in this population of children based on the recently published safety data in infants and young children with Hb SS and Hb S-β0 thalassemia [7,32,39] and the significant benefits seen in adults, including improved survival [6,34,35,40]. Future efforts will include tracking outcomes, including the rates of acute chest syndrome and pain episodes, among children who are and are not taking hydroxyurea.
In this study, we found approximately 70% of eligible children were screened with transcranial Doppler each year from 2008–2012, which is higher than the 45% annual screening rate reported in the literature [10]. One reason our transcranial Doppler screening rates may be higher is that a technician is available to perform these tests on certain days that coincide with the pediatric hematology clinic, allowing patients and families to get this test and have a clinic visit on the same day. However, choosing a 12-month period for receipt of transcranial Doppler screening may be too conservative for centers who do not have such ready access to screening; reporting receipt of transcranial Doppler screening within a 15-month time period may be more appropriate and achievable.
Our study has several limitations. First, it was conducted in a single center with well-established electronic data systems, which are not available in many centers. Our hope is that this model can be replicated by others who seek to use EHR to improve the care of persons with SCD. Second, this work was performed in Massachusetts, a state with near-universal health care insurance coverage. As the Affordable Care Act is implemented nationally [41], other states may see improved performance on quality metrics as more people obtain health insurance. Third, although the EHR was designed to improve data capture for clinical care and quality initiatives, advanced clinical decision support systems were not incorporated due to the limitations of the EHR. The use of prompts for needed clinical care may further enhance performance on these measures. Fourth, this study is limited to children with SCD, who are traditionally monitored more closely than their adult counterparts. Efforts are currently underway to replicate these efforts with adults with SCD at our institution. Finally, the quality metrics in this study are process measures in the delivery of high quality SCD care. Future efforts will focus on linking outcomes to these measures, such as hydroxyurea use to reduce the frequency of acute chest syndrome and painful episodes.
Effective use of health information technology has proven challenging [42,43]. Although there are data that suggest that information technology has improved quality of care by increasing adherence to guidelines, enhancing disease surveillance, and decreasing medication errors, most of the high-quality literature to date comes from 4 research institutions [18]. We found that health IT can be effectively harnessed when end-users are engaged in the process of EHR design, there is a strong commitment to improve workflow and support documentation needs of end-users, the design of the EHR supports data collection for quality measures, and most importantly, there is close collaboration among those with overlapping technical, clinical, and health services research expertise.
There have been many calls for the creation of rare disease registries, as 6% to 8% of the population will develop one in their lifetime [44]. In 2010, the NIH’s Office of Rare Diseases Research funded 30 organizations with and without patient registries, and charged them with the creation of a common data collection template for rare diseases to be used internationally [45]. Common data collection elements for SCD, such as those used in our program, could be used in EHRs across US centers in an effort to improve the quality of care for these children. Although this work may be challenging for centers using large enterprise EHR systems, given the costs associated with modifications, once developed the content can often be shared easily with others using the same system. This would provide the opportunity to compare uniform data across institutions and facilitate learning nationally on ways to improve care. In addition, these efforts may serve as the beginnings of a national registry for pediatric SCD.
In conclusion, contemporary SCD care can lead to improved survival and quality of life, but only if the right care is delivered at the right time. In this study, we present our initial findings from the implementation of a population-based information system for children with SCD. Future efforts are needed to define and measure all elements of high quality care, and link improvements in the delivery of high quality care to outcomes for children and adults with SCD longitudinally.
Appendix. Additional Sickle Cell Disease Forms
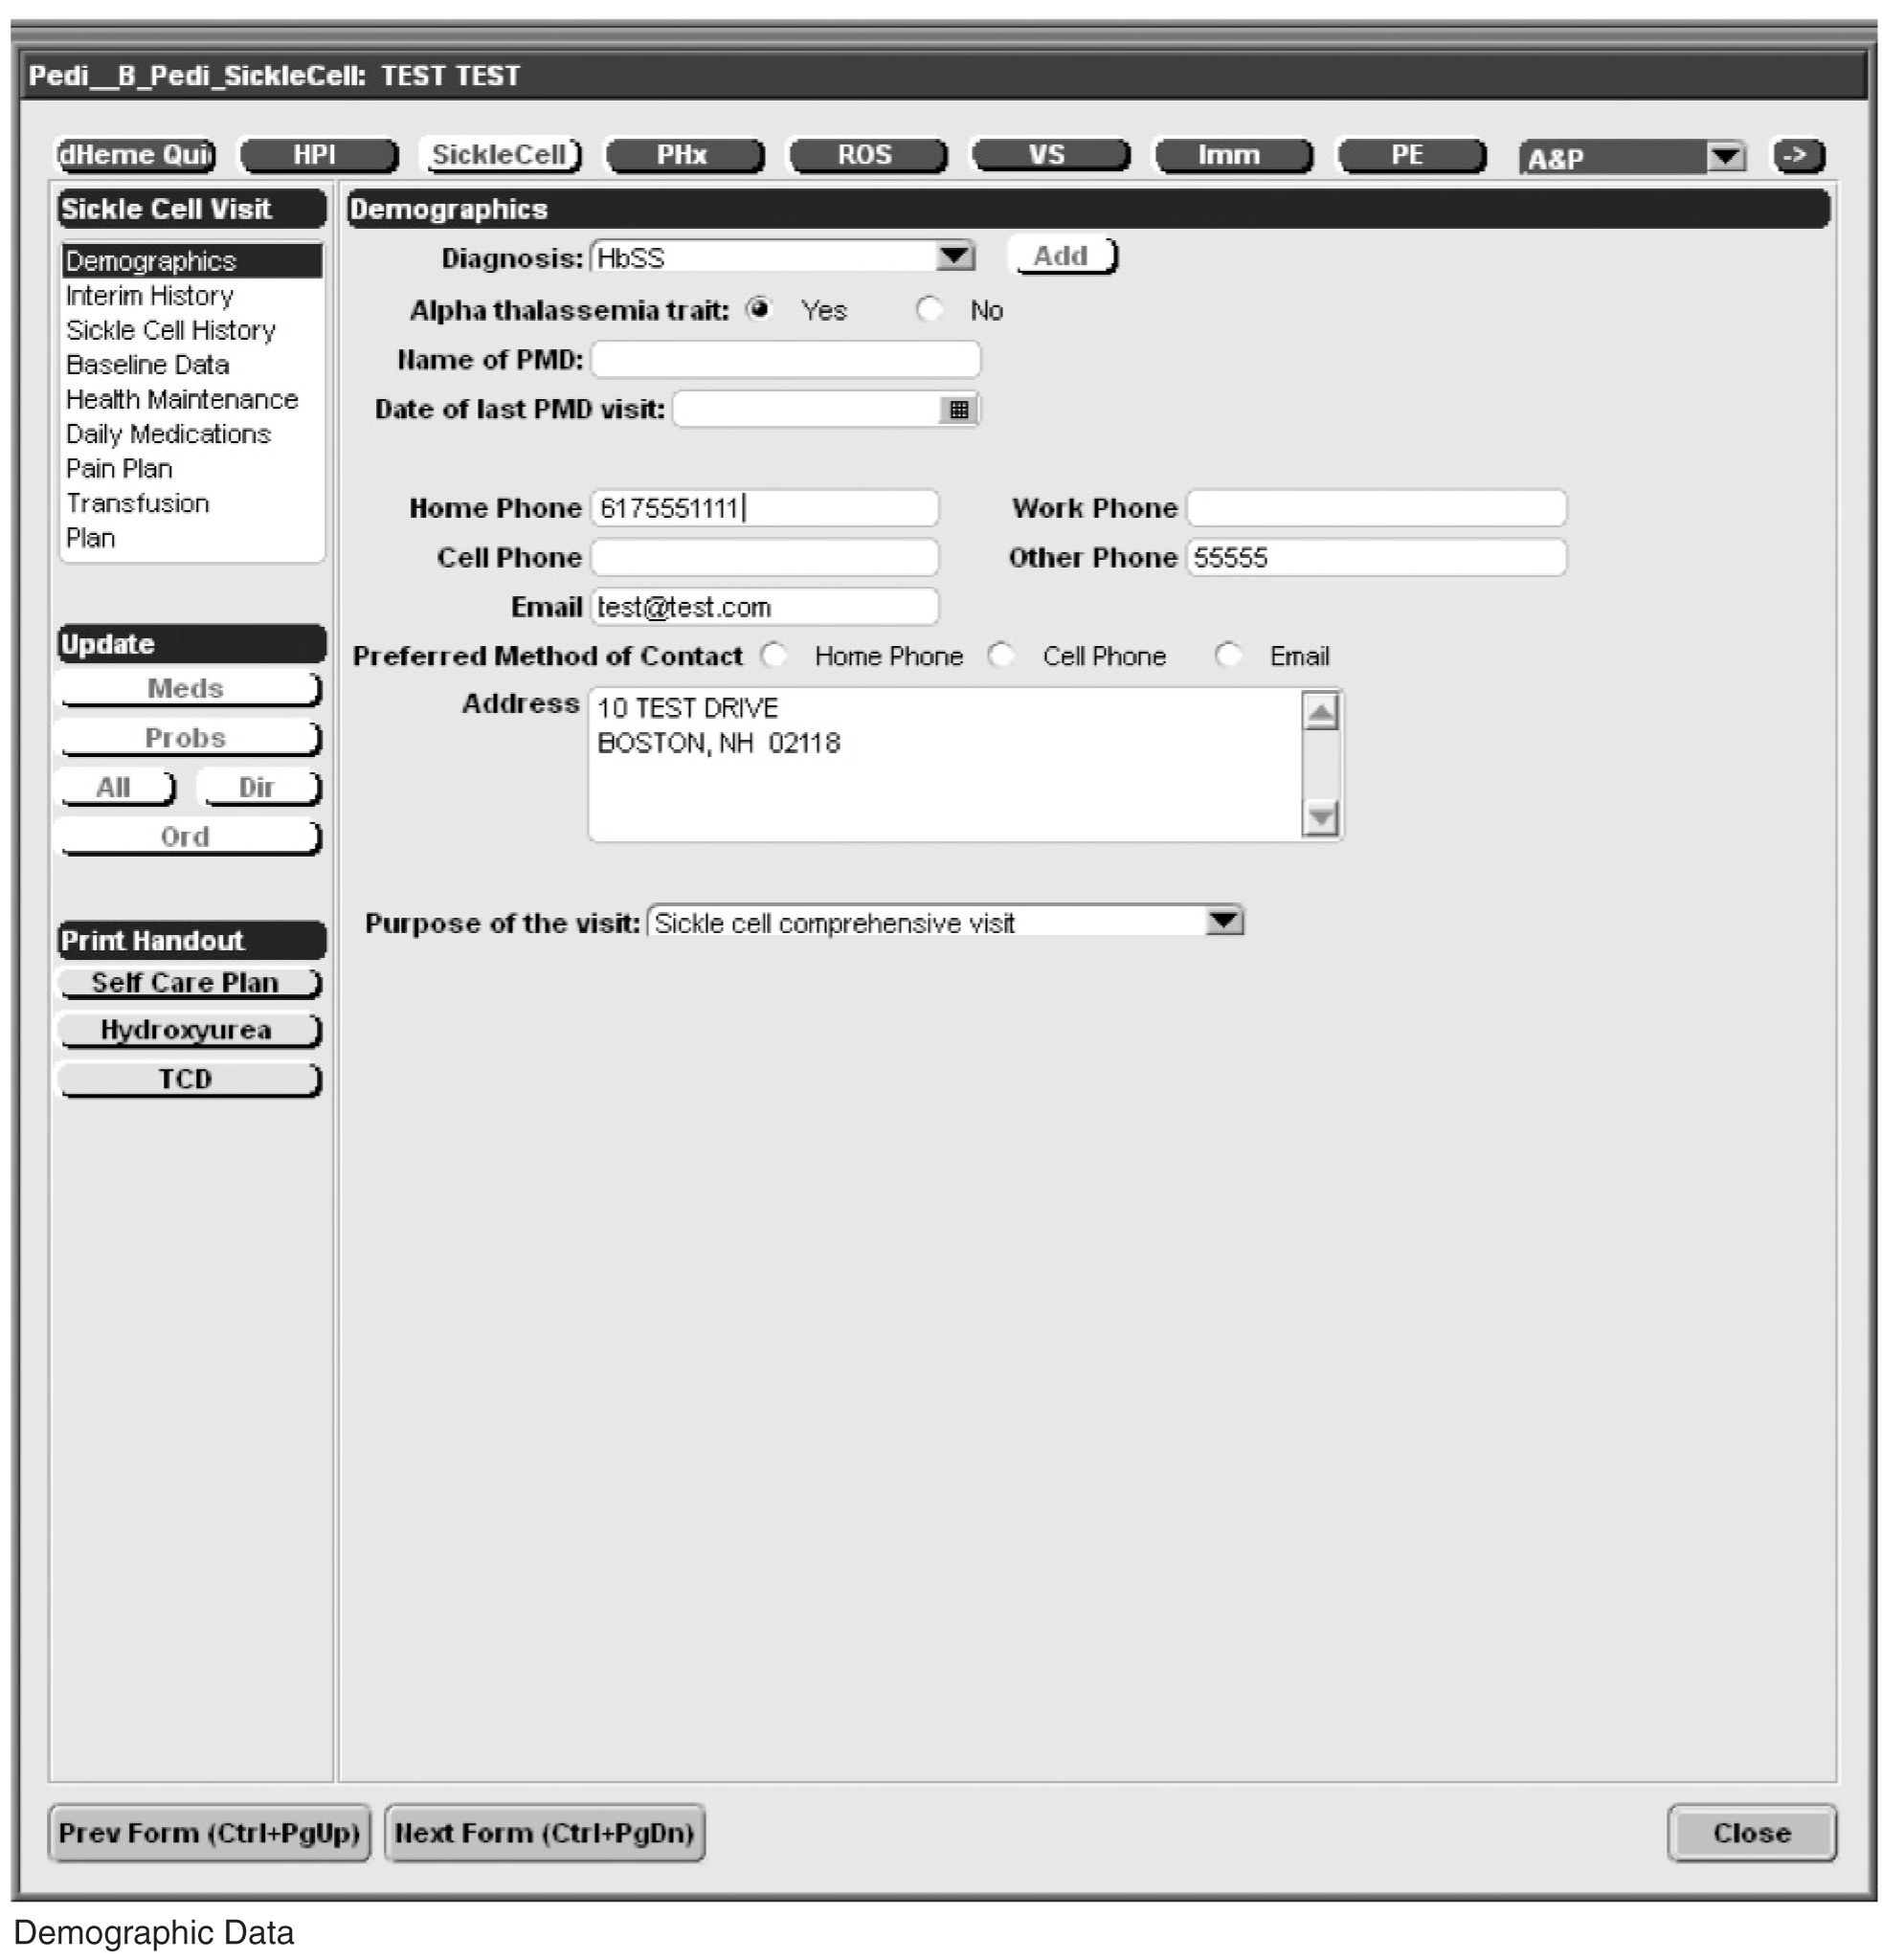
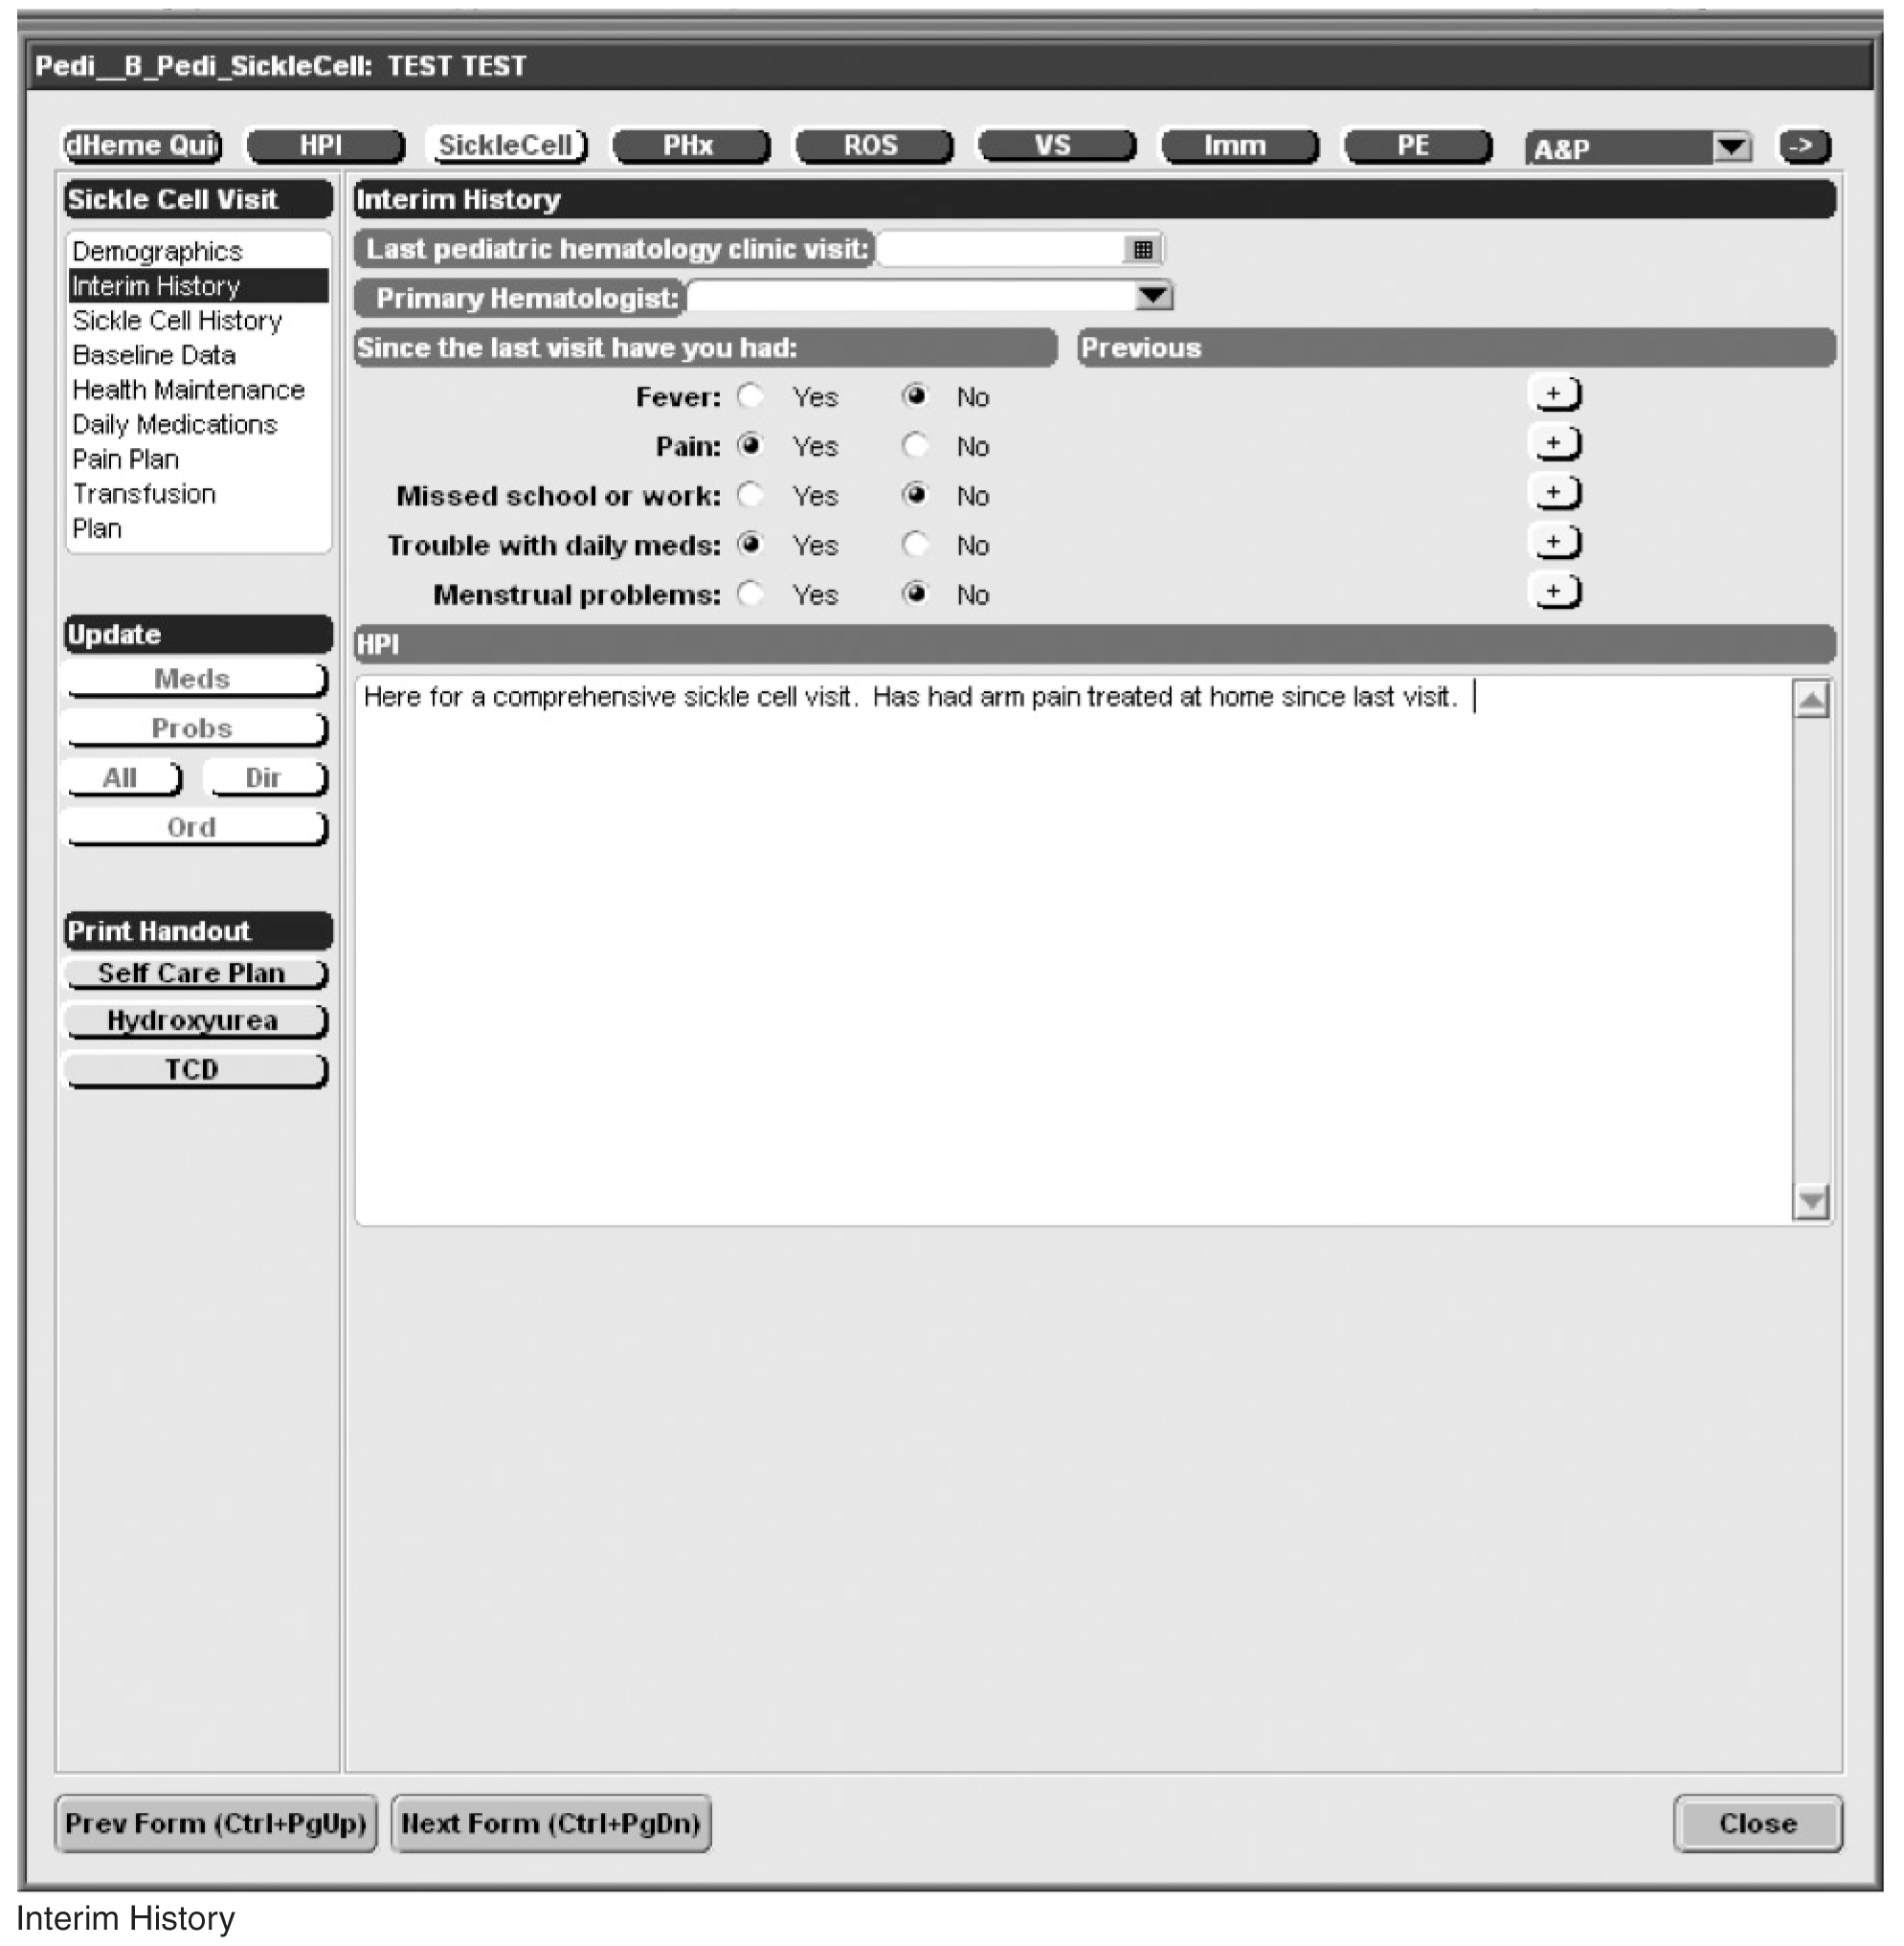
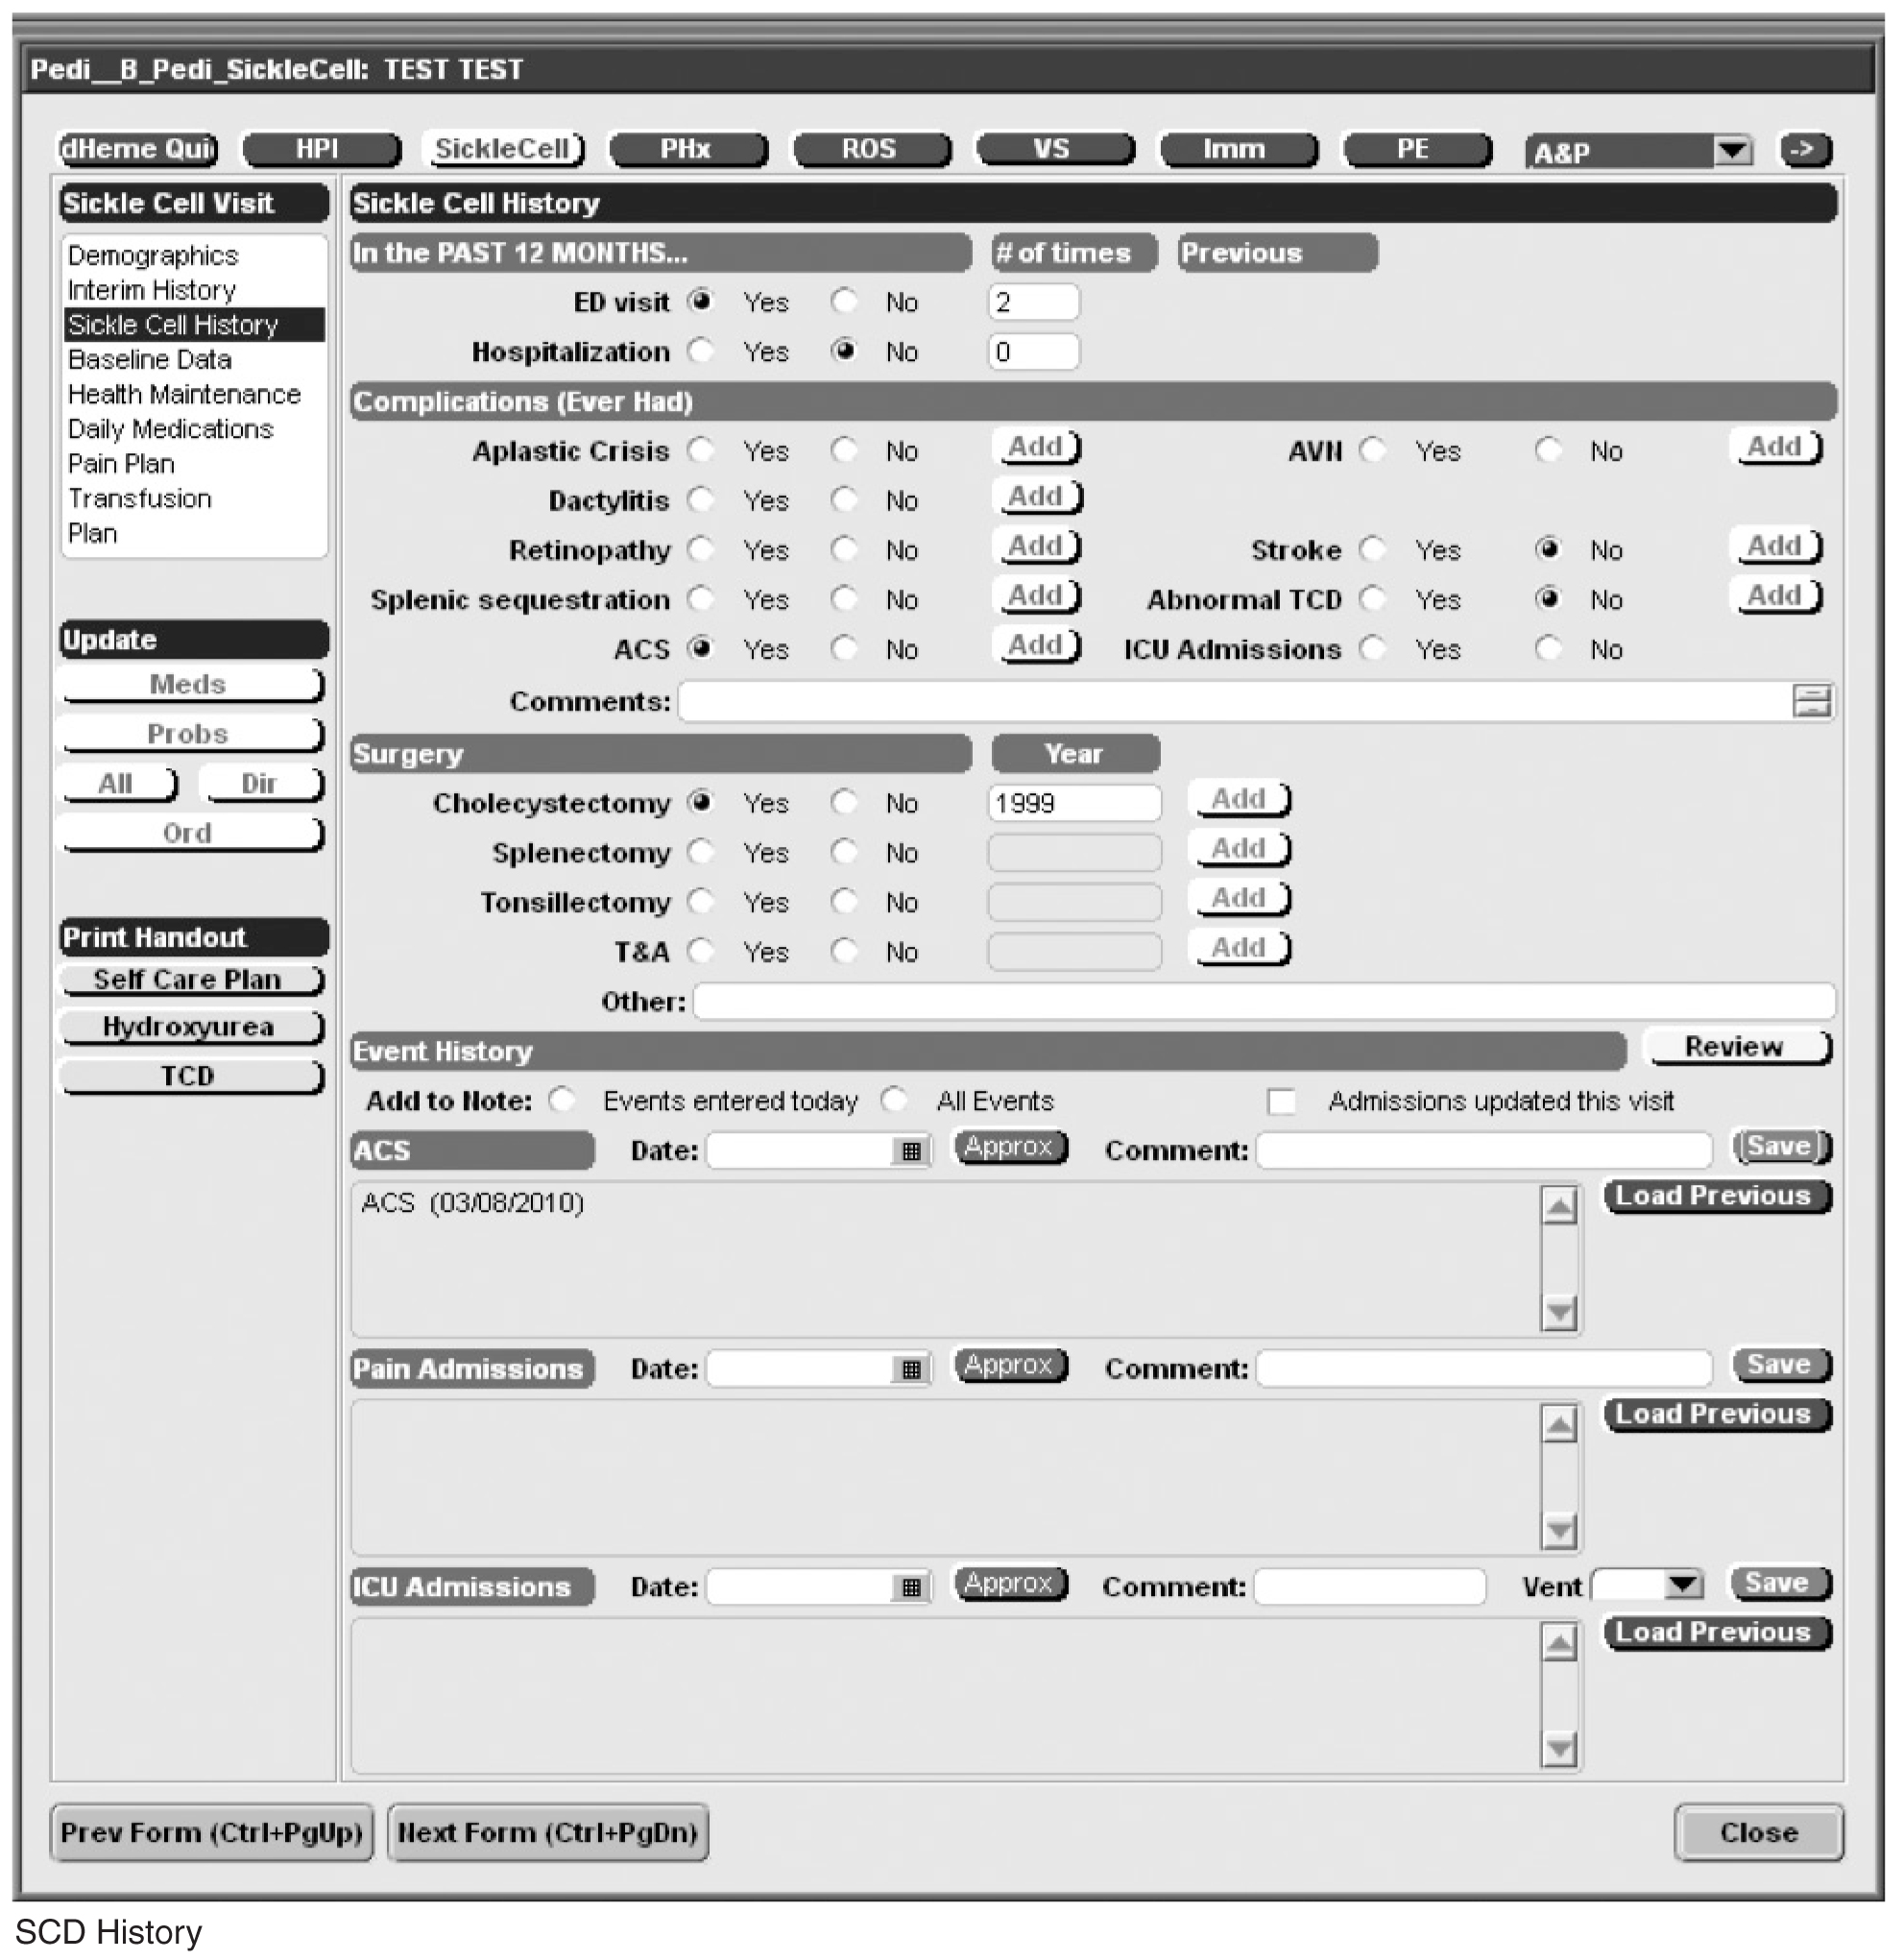
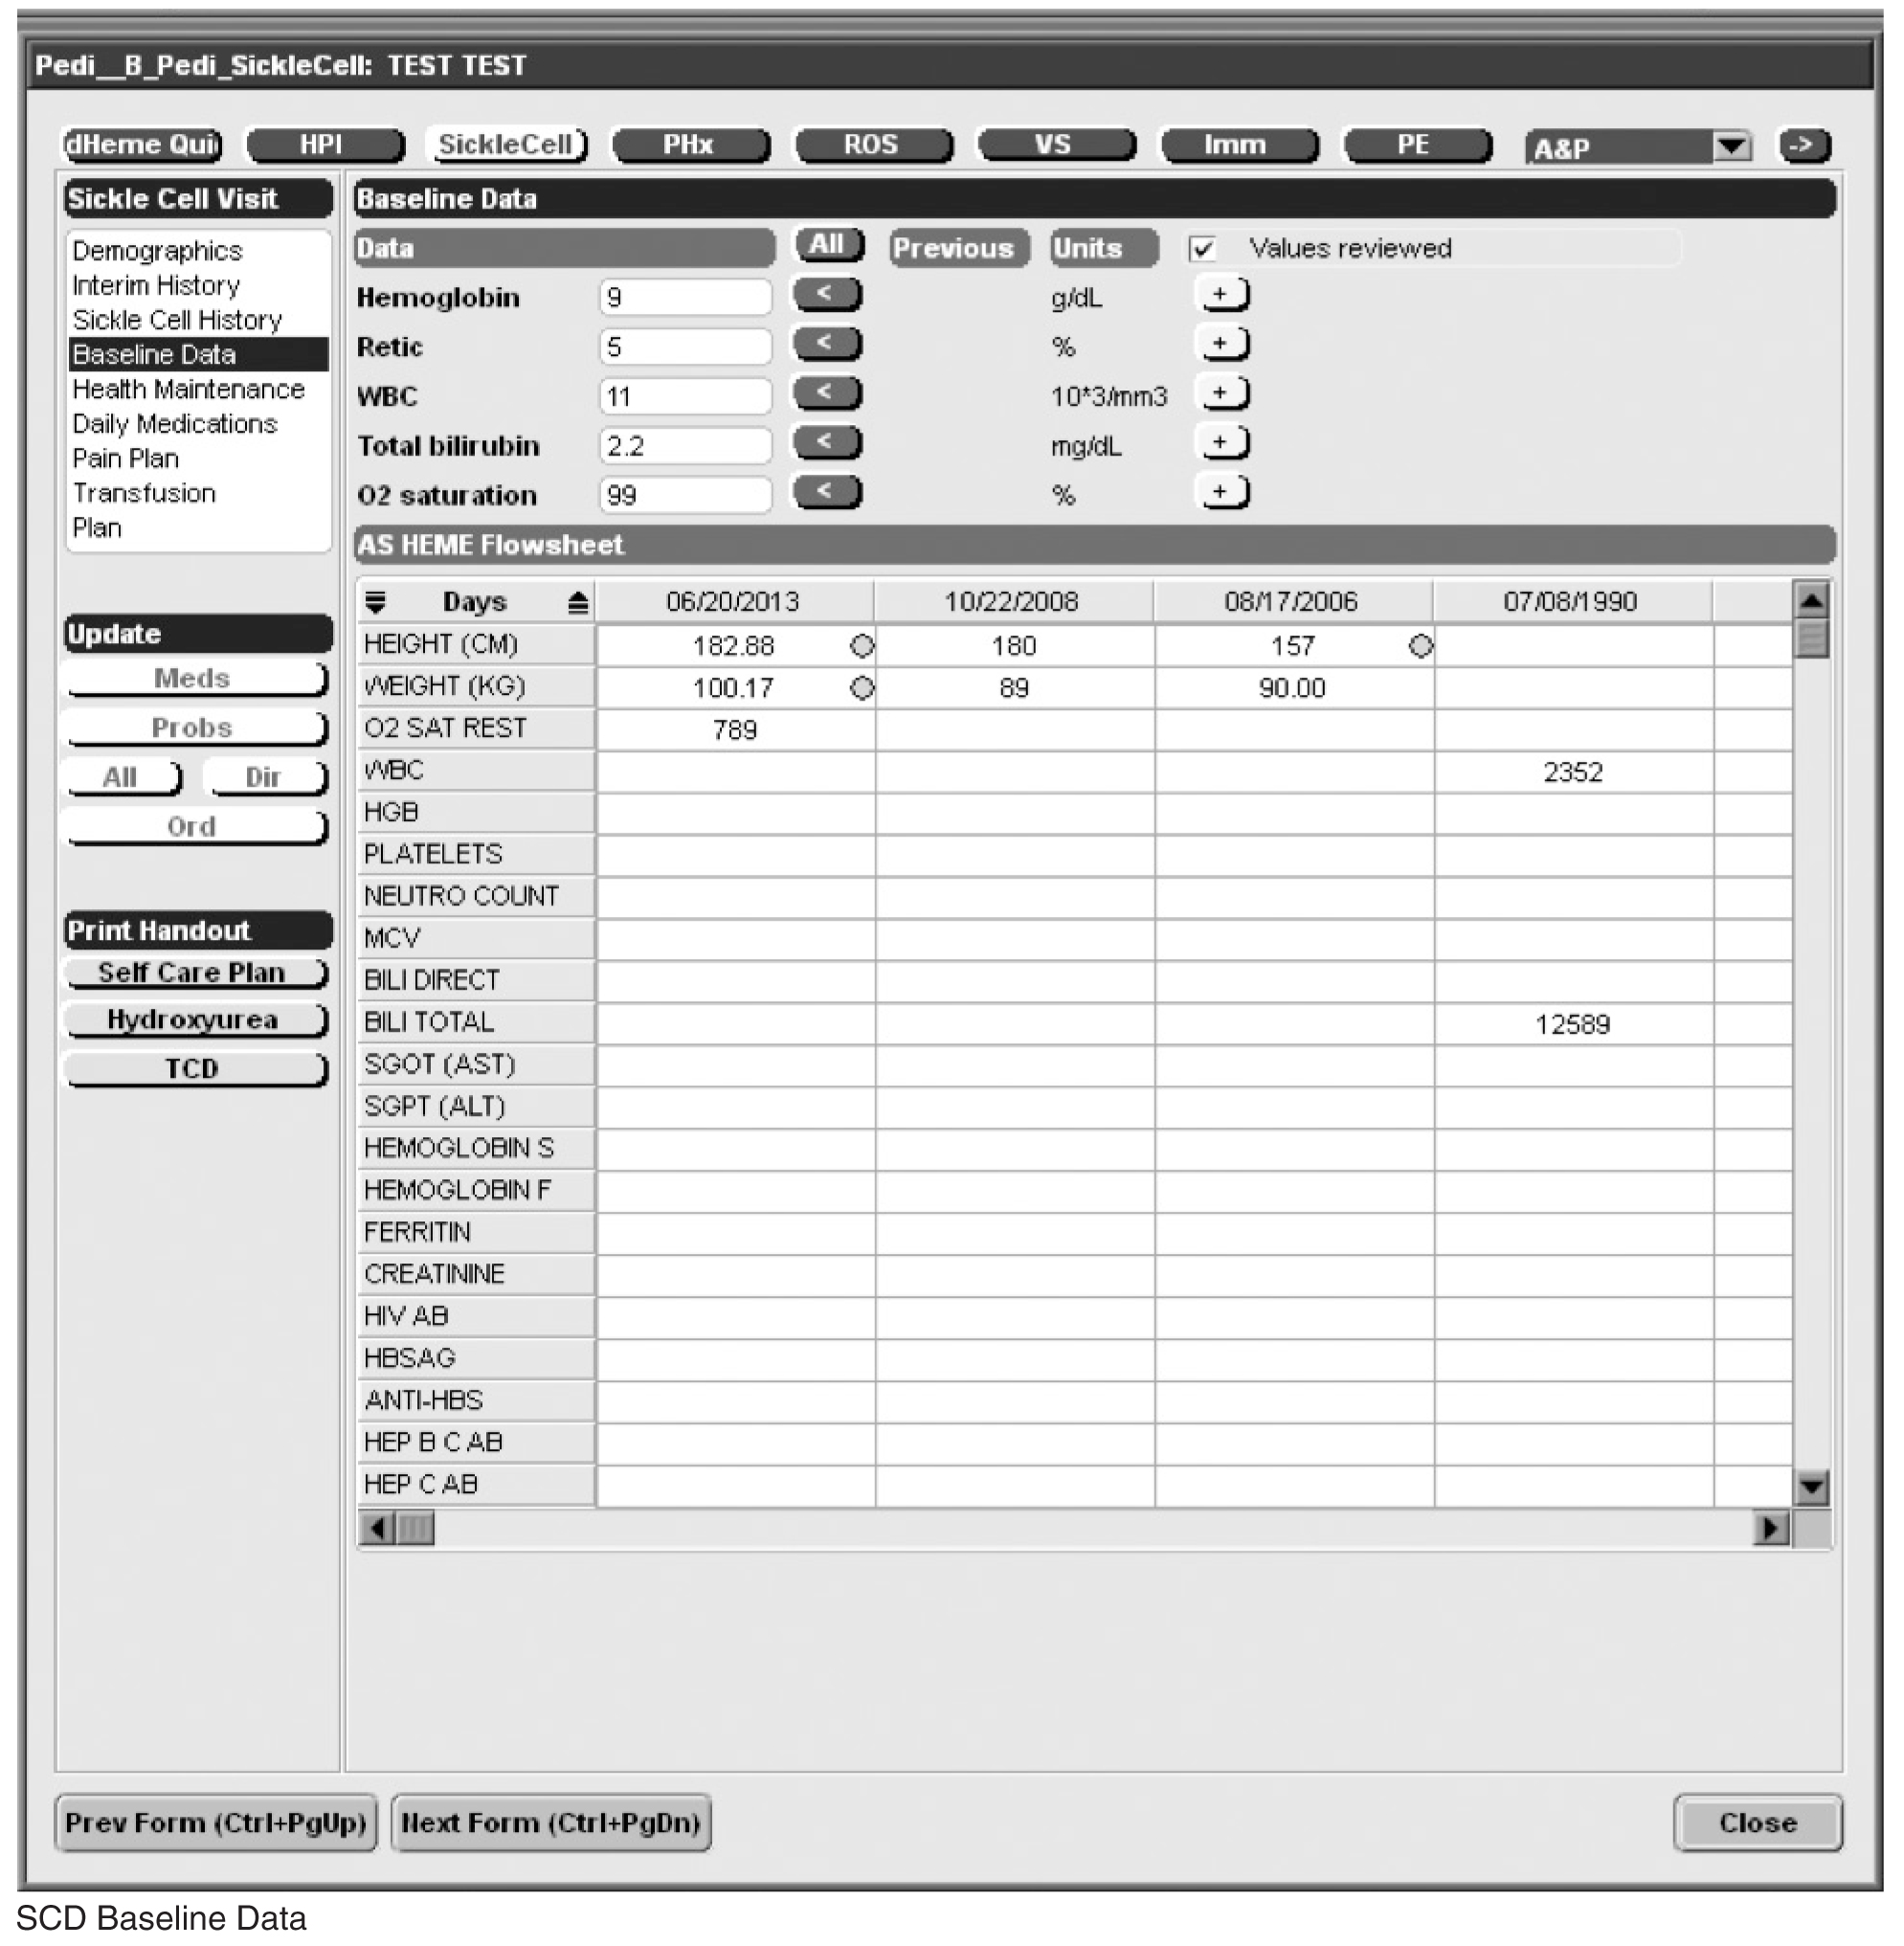
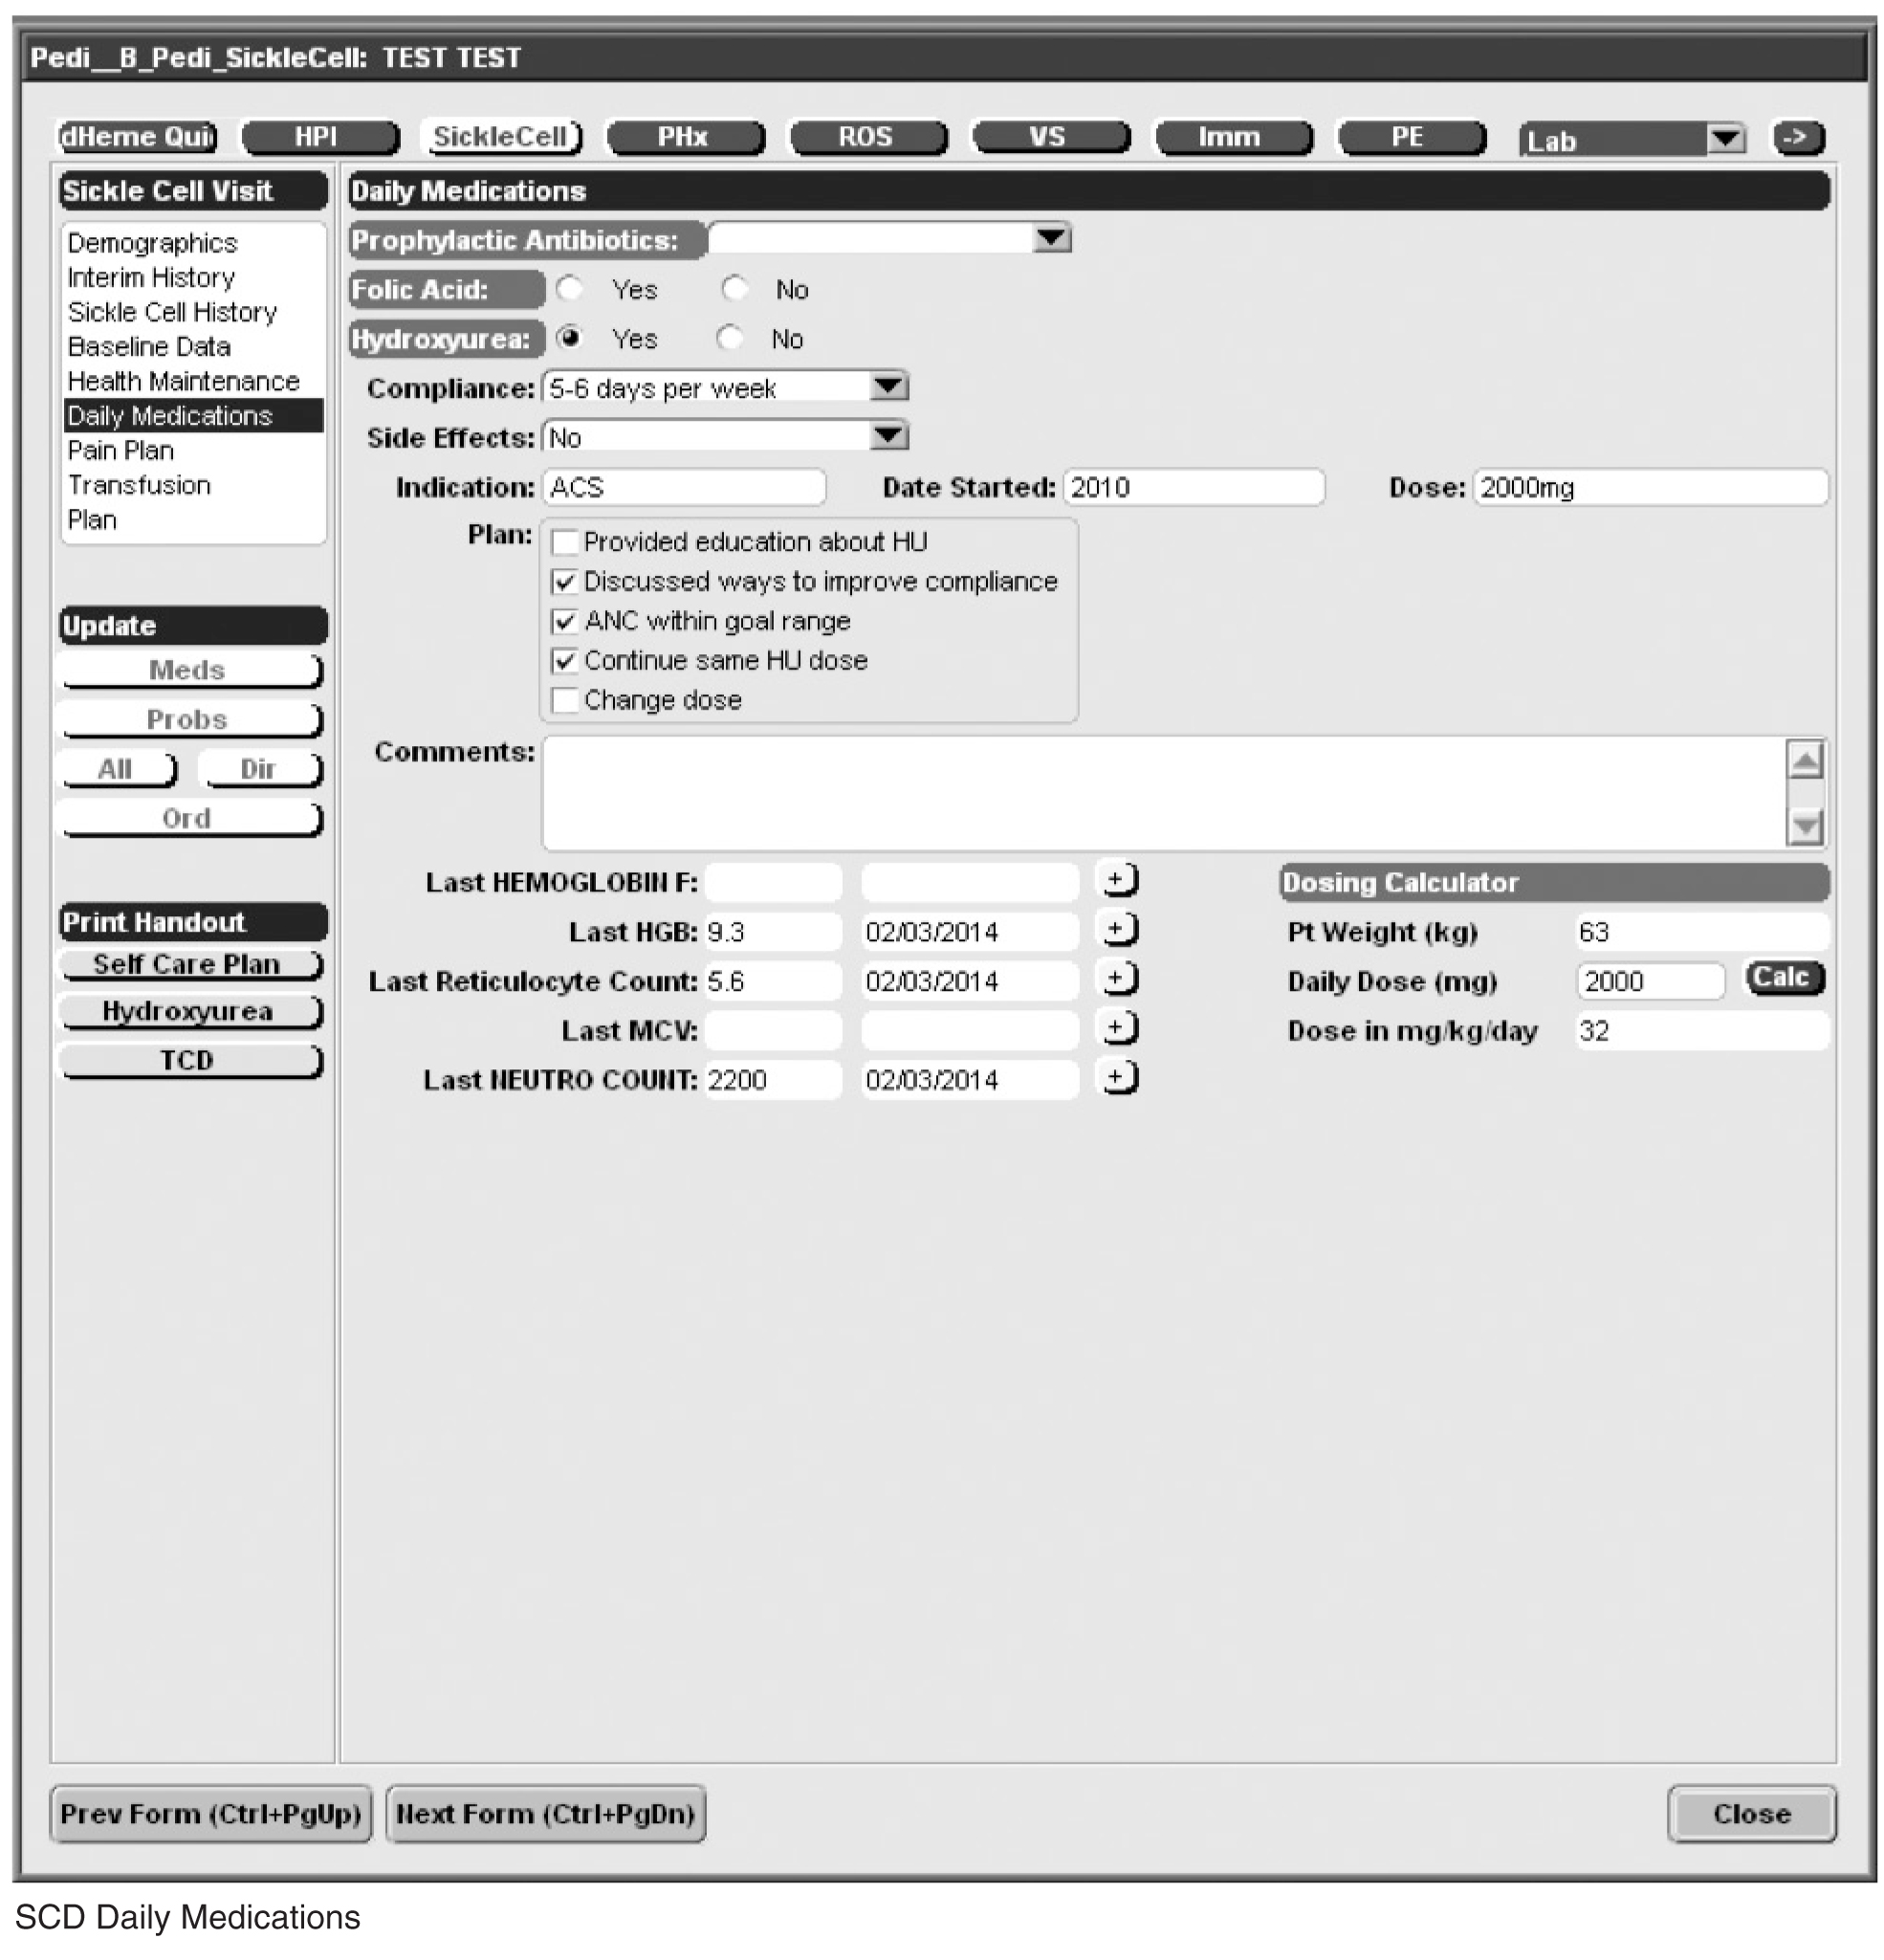
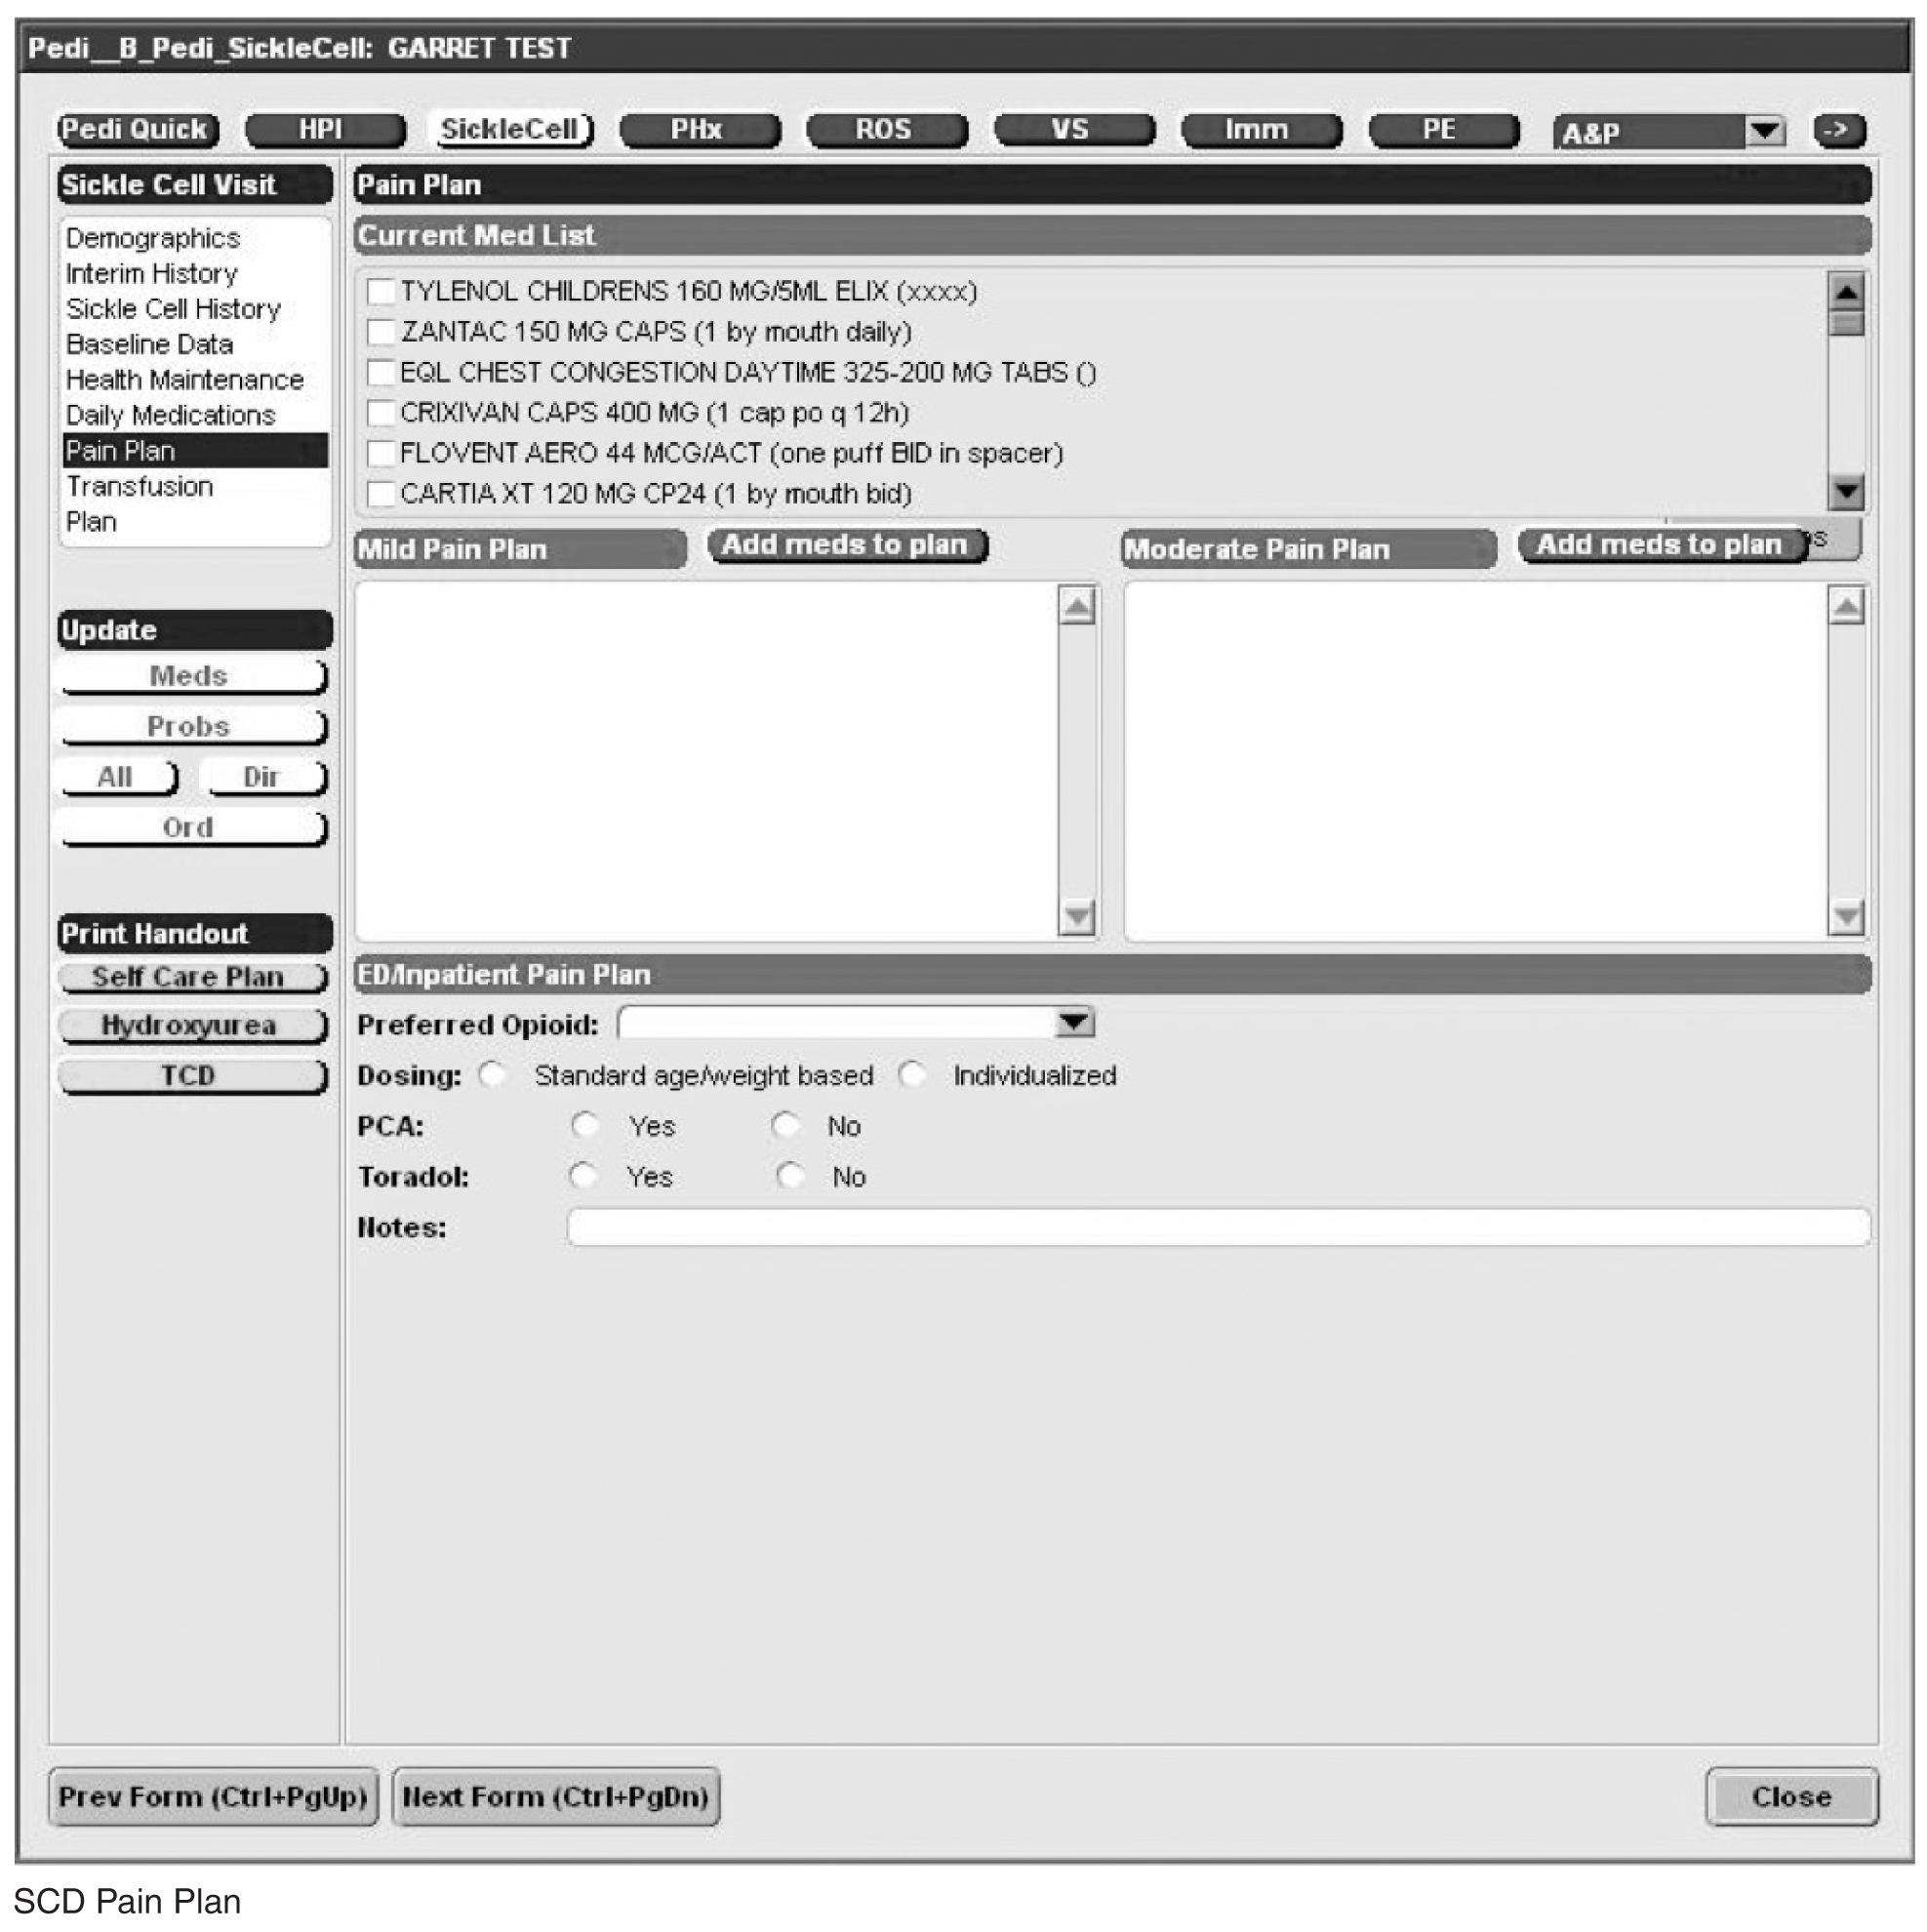
Acknowledgments: We would like to thank David Botts for his tireless efforts in creating the sickle cell forms within our EHR. We would also like to thank Barry Zuckerman for his support of this project.
Corresponding author: Patricia Kavanagh, MD, Boston University School of Medicine/Boston Medical Center, 88 E Newton St, Vose Hall 3rd Fl, Boston, MA 02118.
Funding/support: This work was supported by the Health Resources and Services Administration Sickle Cell Disease and Newborn Screening Program, grant #U38MC22215. The authors have also actively participated in the Hemoglobinopathy Learning Collaborative, a quality improvement forum coordinated by HRSA and the National Initiative for Children’s Healthcare Quality.
Financial disclosures: None.
1. Hassell KL. Population estimates of sickle cell disease in the U.S. Am J Preventive Med 2010;38(4 Suppl):S512–S521.
2. Steinberg MH. Management of sickle cell disease. N Engl J Med 1999;340:1021–30.
3. Adamkiewicz TV, Silk BJ, Howgate J, et al. Effectiveness of the 7-valent pneumococcal conjugate vaccine in children with sickle cell disease in the first decade of life. Pediatrics 2008;121:562–9.
4. Adams RJ, McKie VC, Hsu L, et al. Prevention of a first stroke by transfusions in children with sickle cell anemia and abnormal results on transcranial doppler ultrasonography. N Engl J Med 1998;339:5–1.
5. Adams RJ, Brambilla D, Optimizing Primary Stroke Prevention in Sickle Cell Anemia Trial I. Discontinuing prophylactic transfusions used to prevent stroke in sickle cell disease.[see comment]. N Engl J Med 2005;353:2769–78.
6. Charache S, Terrin ML, Moore RD, et al. Effect of hydroxyurea on the frequency of painful crises in sickle cell anemia. N Engl J Med 1995;332:1317–22.
7. Wang WC, Ware RE, Miller ST, et al. Hydroxycarbamide in very young children with sickle-cell anaemia: A multicentre, randomised, controlled trial (baby hug). Lancet 2011;377:1663–72.
8. Quinn CT, Rogers ZR, McCavit TL, Buchanan GR. Improved survival of children and adolescents with sickle cell disease. Blood 2010;115:3447–52.
9. Hamideh D, Alvarez O. Sickle cell disease related mortality in the united states (1999–2009). Pediatr Blood Cancer 2013;60:1482–6.
10. Raphael JL, Shetty PB, Liu H, et al. A critical assessment of transcranial doppler screening rates in a large pediatric sickle cell center: Opportunities to improve healthcare quality. Pediatr Blood Cancer 2008;51:647–51.
11. Sox CM, Cooper WO, Koepsell TD, et al. Provision of pneumococcal prophylaxis for publicly insured children with sickle cell disease. JAMA 2003;290:1057–61.
12. Oyeku SO, Driscoll MC, Cohen HW, et al. Parental and other factors associated with hydroxyurea use for pediatric sickle cell disease. Pediatr Blood Cancer 2013;60:653–58.
13. Crandall WV, Margolis PA, Kappelman MD, et al. Improved outcomes in a quality improvement collaborative for pediatric inflammatory bowel disease. Pediatrics 2012;129:e1030–e1041.
14. Schechter MS, Margolis P. Improving subspecialty healthcare: Lessons from cystic fibrosis. J Pediatr 2005;147:295–301.
15. Smith LA, Oyeku SO, Homer C, Zuckerman B. Sickle cell disease: A question of equity and quality. Pediatrics 2006;117:1763–70.
16. Wang CJ, Kavanagh PL, Little AA, et al. Quality-of-care indicators for children with sickle cell disease. Pediatrics 2011;128:484–93.
17. Jha AK, Perlin JB, Kizer KW, Dudley RA. Effect of the transformation of the veterans affairs health care system on the quality of care. N Engl J Med 2003;348:2218–27.
18. Chaudhry B, Wang J, Wu S, et al. Systematic review: Impact of health information technology on quality, efficiency, and costs of medical care. Ann Intern Med 2006;144:742–52.
19. American recovery and reinvestment act of 2009. Obey D, Frank B, Gordon B, et al., trans. 111th Congress of the United States.
20. Blumenthal D, Tavenner M. The “meaningful use” regulation for electronic health records. N Engl J Med 2010;363:501–4.
21. Electronic health record adoption by office-based providers. Office of National Coordinator for Health Information Technology. U.S. Department of Health and Human Services. Accessed 15 Jul 2013.
22. DesRoches CM, Campbell EG, Rao SR, et al. Electronic health records in ambulatory care — a national survey of physicians. N Engl J Med 2008;359:50–60.
23. Tricco AC, Ivers NM, Grimshaw JM, et al. Effectiveness of quality improvement strategies on the management of diabetes: A systematic review and meta-analysis. Lancet 379:2252–61.
24. Bundy DG, Strouse JJ, Casella JF, Miller MR. Burden of influenza-related hospitalizations among children with sickle cell disease. Pediatrics 2010;125:234–43.
25. National Heart Lung and Blood Institute. The management of sickle cell disease. NIH Pub No. 02-2117. Bethesda, MD: National Institutes of Health; 2002.
26. Centers for Disease Control and Prevention. Immunization schedules. Accessed 5 Jan 2013 at www.cdc.gov/vaccines/schedules/index.html.
27. Strouse JJ, Reller ME, Bundy DG, et al. Severe pandemic h1n1 and seasonal influenza in children and young adults with sickle cell disease. Blood 2010;116:3431–4.
28. Pilishvili T, Zell ER, Farley MM, et al. Risk factors for invasive pneumococcal disease in children in the era of conjugate vaccine use. Pediatrics 2010;126:e9–17.
29. Heeney MM, Ware RE. Hydroxyurea for children with sickle cell disease. Pediatr Clin North Am 008;55:483–501.
30. Ware RE. How I use hydroxyurea to treat young patients with sickle cell anemia. Blood 2010;115:5300–11.
31. Ferster A, Vermylen C, Cornu G, et al. Hydroxyurea for treatment of severe sickle cell anemia: a pediatric clinical trial. Blood 1996;88:1960–4.
32. Strouse JJ, Lanzkron S, Beach MC, et al. Hydroxyurea for sickle cell disease: a systematic review for efficacy and toxicity in children. Pediatrics 2008;122:1332–42.
33. Hankins JS, Ware RE, Rogers ZR, et al. Long-term hydroxyurea therapy for infants with sickle cell anemia: the husoft extension study. Blood 2005;106:2269–75.
34. Steinberg MH, McCarthy WF, Castro O, et al. The risks and benefits of long-term use of hydroxyurea in sickle cell anemia: a 17.5-year follow-up. Am J Hematol 2010;85:403–8.
35. Voskaridou E, Christoulas D, Bilalis A, et al. The effect of prolonged administration of hydroxyurea on morbidity and mortality in adult patients with sickle cell syndromes: results of a 17-year, single-center trial (lashs). Blood 2010;115:2354–63.
36. Healthy people 2020. Immunization and infectious diseases. Accessed 3 Jun 2013 at www.healthypeople.gov/2020/topicsobjectives2020/objectiveslist.aspx?topicid=23.
37. Cohen NJ, Lauderdale DS, Shete PB, et al. Physician knowledge of catch-up regimens and contraindications for childhood immunizations. Pediatrics 2003;111:925–32.
38. Raphael JL, Rattler TL, Kowalkowski MA, et al. The medical home experience among children with sickle cell disease. Pediatr Blood Cancer 2013;60:275–80.
39. Strouse JJ, Heeney MM. Hydroxyurea for the treatment of sickle cell disease: efficacy, barriers, toxicity, and management in children. Pediatr Blood Cancer 2012;59:365–71.
40. Steinberg MH, Barton F, Castro O, et al. Effect of hydroxyurea on mortality and morbidity in adult sickle cell anemia: risks and benefits up to 9 years of treatment. JAMA 2003;289:1645–51.
41. Patient protection and affordable care act, US Pub. L. No. 111-148, §2702, 124 stat. 119, 318-319. 2010.
42. Harrison M, Koppel R, Bar-Lev S. Unintended consequences of information technologies in health care: an interactive sociotechnical analysis. J Am Med Inform Assoc 2007;14:542–9.
43. Haux R. Health information systems – past, present, future. Int J Med Informatics 2006;75:268–81.
44. Schieppati A, Henter J-I, Daina E, Aperia A. Why rare diseases are an important medical and social issue. Lancet 2008;371:2039–41.
45. Office of Rare Diseases Research National Institutes of Health. Rare diseases and related terms. Accessed 28 Jun 2013 at www.rarediseases.info.nih.gov/rarediseaselist.aspx.
From the Department of Pediatrics, Boston University School of Medicine, Boston Medical Center, Boston, MA.
This article is the second in our Hemoglobinopathy Learning Collaborative series. See the related editorial by Oyeku et al in the February 2014 issue of JCOM. (—Ed.)
Abstract
- Objective: To describe the development and use of an electronic health record (EHR)–based sickle cell disease (SCD) registry for children with SCD to enhance case management and quality improvement (QI) efforts at an urban, academic, safety net institution.
- Methods: Using national guidelines and the literature, we created quality metrics for pediatric SCD that focused on vaccination delivery and use of transcranial Doppler screening and hydroxyurea. We revised EHR forms for SCD care and created an EHR-based SCD registry that permitted monthly and annual reporting on quality metrics.
- Results: From 2008 to 2012, the percentage of children with SCD vaccinated for influenza increased from 52% to 65%, and for meningococcus from 53% to 70%. After licensure of PCV13 in 2010, the percentage of children vaccinated rose to 69% in 2012. Results for PPV23 were mixed: 87% to 91% received ≥1 dose, but the rate for receiving the second dose declined from 76% to 64%. Percentage of children screened annually with transcranial Doppler consistently ranged from 62% to 73% during the 5 years. QI initiatives in 2012–2013 led to increased influenza vaccination, from 65% to 83%, and increased hydroxyurea use, from 52% to 73%.
- Conclusion: In this study, a practical, replicable and feasible approach for improving the quality of SCD care combined the collaboration of a multidisciplinary team, an EHR-based disease registry, and QI initiatives. Additional work is needed to define and measure all elements of high-quality care for children with SCD and link process measures to clinical outcomes.
Sickle cell disease (SCD) is the most commonly inherited disorder in the United States, affecting approximately 100,000 individuals and 1 in 400 African American births [1,2]. The use of preventive strategies, such as immunizations [3], transcranial Doppler screening and transfusion protocols [4,5], and hydroxyurea therapy [6,7] has contributed to decreased morbidity and mortality among children with SCD [8,9]. However, a substantial gap exists between the care that children with SCD should receive and the care they actually receive [10–12]. An essential component of any effort that seeks to improve care is the ability to measure care processes and outcomes in a way that can drive quality improvement (QI) initiatives. Registries serve a vital role in quality improvement activities for many pediatric conditions, including inflammatory bowel disease [13] and cystic fibrosis [14]. However, there are no national or nationally representative registries currently available for children with SCD [15]. There is a pressing need for better information systems and tools that can be used in mainstream clinical settings to measure clinical performance with respect to quality indicators [16] if the goals of high quality care and better quality of life are to be achieved for children with SCD.
Electronic health records (EHRs) have been successfully used to improve the quality of care and enhance performance measurement in select institutions [17,18], and adoption of EHRs is growing. The 2009 American Recovery and Reinvestment Act allocated $20.8 billion in incentives to assist providers to adopt and “meaningfully use” EHRs [19,20]. As of 2011, 39% of office-based providers have implemented at least a basic EHR [21], up from 17% in 2008 [22]. The effective use of EHRs depends on collaboration between technical and medical experts so that functionality is achieved and clinical quality is appropriately measured. In addition, few EHRs contain specialized content for the care of persons with SCD.
While independent registries have been shown to be effective in improving care [13,14,23], they involve extra time and effort for data entry, can be difficult and expensive to maintain, and may not be feasible for many systems that care for SCD patients. In this paper, we describe the development and use of our EHR-based SCD registry for children with SCD, including our efforts to engage key technical and clinical experts to develop an EHR that is tailored to the outpatient workflow and data collection of quality measures and implement a fully functional system that collects data on quality measures to support case management and continuous QI.
Methods
This study was conducted at Boston Medical Center, New England’s largest safety net hospital, which cares for 190 children with SCD ages 0 to 21 years. The outpatient EHR (Centricity, GE) has been in use since 2000 and is used for all aspects of outpatient care, including ordering of immunizations and tests, electronic prescription writing, and referrals to specialty care.
Outcome Measures
Vaccines: The Centers for Disease Control and Prevention (CDC) recommends vaccinating children with SCD [26] against influenza annually, given their susceptibility to the influenza virus [24,27]. The CDC also recommends the 23-valent pneumococcal polysaccharide vaccine (PPV23 2-dose series) and 13-valent pneumococcal conjugate vaccine (PCV13, per childhood routine vaccine schedule for young children and 1 catch-up dose for children previously vaccinated with PCV7), and meningococcal vaccine (2-dose series), given patients’ functional asplenic status [25,28].
Transcranial Doppler screening can identify children with hemoglobin (Hb) SS and Hb S-β0 thalassemia at higher risk of stroke, which may be prevented through hypertransfusion programs [4]. Screening is recommended annually for these children ages 2 to 16 years [25].
Hydroxyurea use among children with Hb SS and Hb S-β0 thalassemia is an established practice [29,30]. We consider hydroxyurea therapy for all children 2 years and older with Hb SS and Hb S-β0 thalassemia, given the recently published safety data from the Baby-HUG trial [7] and the benefits of hydroxyurea among children and adults with SCD [6,31–35].
EHR-based Registry
Our EHR-based SCD registry includes 3 key components: (1) forms to support detailed documentation at the point-of-care (ie, clinic visit); (2) a registry management form to allow the QI team to identify patients to be included or excluded from the registry; and (3) a central data warehouse to support quality measurement and improvement.
Documentation in the EHR is performed using a set of customized templates or “forms.” These forms allow documentation of care provision in a structured way. The discrete data elements are stored within the data warehousing system that supports the EHR. The SCD forms used in this project were a revised version of existing forms used by our pediatric hematologists for the past 6 years. The primary goal was to improve efficiency in a patient encounter and enhance data collection efforts. In particular, several changes were made to enhance data collection for quality measures included in the SCD registry. First, we collected genotype in a standardized way to better define subpopulations of SCD patients, as some of the care provided is dictated by genotype. We also expanded data capture for transcranial Doppler screening to include date of last screening to prompt scheduling. For hydroxyurea, the forms now capture if hydroxyurea has been prescribed, and if not, why (eg, declined, not indicated); adherence, current dose, and routine labs for monitoring are also listed to aid in clinical decision-making. Finally, the forms were revised to prominently display the subset of immunizations important to SCD (described above) to assess if the patient is current.
Within the new forms, we collected all data elements important to providing care to children with SCD. Several new items existed in other parts of the EHR and were automatically pulled into the forms, including laboratory results, medications and immunizations. Other new data elements required manual entry by providers based on EHR review, as they had previously not been documented, documented on an ad hoc basis, or found as free text within notes (eg, number of ED visits and hospitalizations in the past year). Initial completion of these forms took approximately 10 to 15 minutes per patient, as many of these data elements were not individually captured prior to this work; documentation for subsequent comprehensive visits required an additional 5 to 10 minutes per chart. Currently, the 3 pediatric hematologists regularly use the SCD forms for routine visits.
The registry management form was also created by the EHR design team. Although this form is separate from the SCD forms, it was readily accessible to the clinical team to quickly check whether patients should be included or excluded from the SCD registry. In this way, inactive patients could be removed and new patients could be included. This form was completed for all active pediatric patients with SCD as of February 2013 using data from a separately maintained clinical database. For patients who were new to the pediatric hematology practice between July 2012 and February 2013 (eg, infants born during this period, patients transferring care), we manually determined a registry start date in order to calculate accurate denominators for each measure. New patients were entered into the SCD registry by members of the care team on an ad hoc basis, and biannual searches of problem lists were planned to ensure the pediatric SCD registry was complete using the SCD-related ICD-9 codes 282.6, 282.41 and 282.4 to encompass all sickle hemoglobinopathies, including sickle cell thalassemia.
For this project, we were fortunate to have a well-established clinical data warehouse into which the medical center’s EHR data is copied nightly. In addition, the medical center already had multiple chronic disease registries and a framework for evaluating and sharing QI data. We were able to add SCD to this existing infrastructure, which was helpful since a secure and HIPAA-compliant location to post these patient-level reports had been previously identified.
We paid for 40 hours of technical staff time using grant funds to create reports using data collected in the EHR for patients who were actively in the SCD registry per the registry management form. Using these data, summary reports for our key SCD metrics were generated on both an annual and monthly basis. We tested and refined our key SCD metrics over a 4-month period to ensure that we had defined the numerators and denominators for each care process accurately. For example, children become eligible for influenza vaccine at 6 months of age, therefore, the eligible denominator would exclude infants < 6 months of age (Table 1). In addition, lists of patient names and phone numbers were automatically generated to identify those in need of care elements, facilitating both case management and continuous improvement for these measures, replacing the need for all external clinical databases.
Data Analysis
For children included in the SCD registry, we calculated the proportion who were appropriately vaccinated and received transcranial Doppler screening each year for the 5-year period 2008–2012. For the period July 2012–June 2013, we calculated the proportion of children with SCD in the registry who received influenza vaccine and children with Hb SS and Hb S-β0 thalassemia who were prescribed hydroxyurea.
This study was approved by the Boston University Medical Campus institutional review board.
Results
For influenza vaccination for the 2012–2013 season, only 49% of children were vaccinated as of November. This proportion increased after outreach
From July 2012 to June 2013, our rates of hydroxyurea use increased from 52% to 73% among eligible patients.
Discussion
In this paper we report on a practical approach for improving the quality of care for persons with SCD that combines the collaboration of a multidisciplinary team, the use of the EHR to create a disease registry, and QI initiatives. We identified where high-quality care is provided and where further attention is needed, and enhanced our case management capabilities with the generation of patient lists identifying those who are in need of care elements. We also used our registry to track care provision, achieving rates of influenza vaccination of 82% and hydroxyurea use to 73% as of June 2013. From these results, we have shown that our EHR can be used for registry management activities and provide real-time clinical data on the care that is provided, and can lead to improved performance on process measures important in the care for children with SCD.
After adjusting to the revised workflow required by the new SCD forms, the pediatric hematology team found them to be useful in tracking important clinical measures. They reported that the most important change was that all routine elements of SCD care, such as dates of last visits to pediatric subspecialists and receipt of recommended routine SCD care, were embedded into their note. This eliminated the need to search previous documents to find dates of the last cardiology visit or influenza immunizations and increased the likelihood that gaps in care would be addressed by the provider during the course of a clinic visit, thereby streamlining clinic workflow.
Healthy People 2020 recommend vaccination rates of 80% and 90% for influenza and PCV13 vaccines, respectively, in the general pediatric population [36]. We have met this goal for the influenza vaccine, but have room to improve for other recommended vaccines for children with SCD. Ultimately, our goal is to provide these vaccines to 100% of children with SCD at our institution. One barrier to achieving high vaccination rates is the lack of provider knowledge on the creation of catch-up vaccine schedules. A study of primary care providers showed that they frequently omitted vaccines when creating catch-up schedules, including the pneumococcal conjugate vaccine for healthy children [37]. Another hurdle is coordination of care between primary and specialty care, as these vaccines could be given in either setting. A recently published study found that only 20% of children with SCD had care coordination between primary and specialty care [38]. Promoting shared responsibility and information on the administration of vaccinations for children with SCD between primary and subspecialty care, and the development of state-wide immunization registries, may help alleviate these challenges.
In this study, our rates of hydroxyurea use among children with Hb SS and Hb S-β0 thalassemia are higher than in other reported studies [12]. We promote hydroxyurea use in this population of children based on the recently published safety data in infants and young children with Hb SS and Hb S-β0 thalassemia [7,32,39] and the significant benefits seen in adults, including improved survival [6,34,35,40]. Future efforts will include tracking outcomes, including the rates of acute chest syndrome and pain episodes, among children who are and are not taking hydroxyurea.
In this study, we found approximately 70% of eligible children were screened with transcranial Doppler each year from 2008–2012, which is higher than the 45% annual screening rate reported in the literature [10]. One reason our transcranial Doppler screening rates may be higher is that a technician is available to perform these tests on certain days that coincide with the pediatric hematology clinic, allowing patients and families to get this test and have a clinic visit on the same day. However, choosing a 12-month period for receipt of transcranial Doppler screening may be too conservative for centers who do not have such ready access to screening; reporting receipt of transcranial Doppler screening within a 15-month time period may be more appropriate and achievable.
Our study has several limitations. First, it was conducted in a single center with well-established electronic data systems, which are not available in many centers. Our hope is that this model can be replicated by others who seek to use EHR to improve the care of persons with SCD. Second, this work was performed in Massachusetts, a state with near-universal health care insurance coverage. As the Affordable Care Act is implemented nationally [41], other states may see improved performance on quality metrics as more people obtain health insurance. Third, although the EHR was designed to improve data capture for clinical care and quality initiatives, advanced clinical decision support systems were not incorporated due to the limitations of the EHR. The use of prompts for needed clinical care may further enhance performance on these measures. Fourth, this study is limited to children with SCD, who are traditionally monitored more closely than their adult counterparts. Efforts are currently underway to replicate these efforts with adults with SCD at our institution. Finally, the quality metrics in this study are process measures in the delivery of high quality SCD care. Future efforts will focus on linking outcomes to these measures, such as hydroxyurea use to reduce the frequency of acute chest syndrome and painful episodes.
Effective use of health information technology has proven challenging [42,43]. Although there are data that suggest that information technology has improved quality of care by increasing adherence to guidelines, enhancing disease surveillance, and decreasing medication errors, most of the high-quality literature to date comes from 4 research institutions [18]. We found that health IT can be effectively harnessed when end-users are engaged in the process of EHR design, there is a strong commitment to improve workflow and support documentation needs of end-users, the design of the EHR supports data collection for quality measures, and most importantly, there is close collaboration among those with overlapping technical, clinical, and health services research expertise.
There have been many calls for the creation of rare disease registries, as 6% to 8% of the population will develop one in their lifetime [44]. In 2010, the NIH’s Office of Rare Diseases Research funded 30 organizations with and without patient registries, and charged them with the creation of a common data collection template for rare diseases to be used internationally [45]. Common data collection elements for SCD, such as those used in our program, could be used in EHRs across US centers in an effort to improve the quality of care for these children. Although this work may be challenging for centers using large enterprise EHR systems, given the costs associated with modifications, once developed the content can often be shared easily with others using the same system. This would provide the opportunity to compare uniform data across institutions and facilitate learning nationally on ways to improve care. In addition, these efforts may serve as the beginnings of a national registry for pediatric SCD.
In conclusion, contemporary SCD care can lead to improved survival and quality of life, but only if the right care is delivered at the right time. In this study, we present our initial findings from the implementation of a population-based information system for children with SCD. Future efforts are needed to define and measure all elements of high quality care, and link improvements in the delivery of high quality care to outcomes for children and adults with SCD longitudinally.
Appendix. Additional Sickle Cell Disease Forms
Acknowledgments: We would like to thank David Botts for his tireless efforts in creating the sickle cell forms within our EHR. We would also like to thank Barry Zuckerman for his support of this project.
Corresponding author: Patricia Kavanagh, MD, Boston University School of Medicine/Boston Medical Center, 88 E Newton St, Vose Hall 3rd Fl, Boston, MA 02118.
Funding/support: This work was supported by the Health Resources and Services Administration Sickle Cell Disease and Newborn Screening Program, grant #U38MC22215. The authors have also actively participated in the Hemoglobinopathy Learning Collaborative, a quality improvement forum coordinated by HRSA and the National Initiative for Children’s Healthcare Quality.
Financial disclosures: None.
1. Hassell KL. Population estimates of sickle cell disease in the U.S. Am J Preventive Med 2010;38(4 Suppl):S512–S521.
2. Steinberg MH. Management of sickle cell disease. N Engl J Med 1999;340:1021–30.
3. Adamkiewicz TV, Silk BJ, Howgate J, et al. Effectiveness of the 7-valent pneumococcal conjugate vaccine in children with sickle cell disease in the first decade of life. Pediatrics 2008;121:562–9.
4. Adams RJ, McKie VC, Hsu L, et al. Prevention of a first stroke by transfusions in children with sickle cell anemia and abnormal results on transcranial doppler ultrasonography. N Engl J Med 1998;339:5–1.
5. Adams RJ, Brambilla D, Optimizing Primary Stroke Prevention in Sickle Cell Anemia Trial I. Discontinuing prophylactic transfusions used to prevent stroke in sickle cell disease.[see comment]. N Engl J Med 2005;353:2769–78.
6. Charache S, Terrin ML, Moore RD, et al. Effect of hydroxyurea on the frequency of painful crises in sickle cell anemia. N Engl J Med 1995;332:1317–22.
7. Wang WC, Ware RE, Miller ST, et al. Hydroxycarbamide in very young children with sickle-cell anaemia: A multicentre, randomised, controlled trial (baby hug). Lancet 2011;377:1663–72.
8. Quinn CT, Rogers ZR, McCavit TL, Buchanan GR. Improved survival of children and adolescents with sickle cell disease. Blood 2010;115:3447–52.
9. Hamideh D, Alvarez O. Sickle cell disease related mortality in the united states (1999–2009). Pediatr Blood Cancer 2013;60:1482–6.
10. Raphael JL, Shetty PB, Liu H, et al. A critical assessment of transcranial doppler screening rates in a large pediatric sickle cell center: Opportunities to improve healthcare quality. Pediatr Blood Cancer 2008;51:647–51.
11. Sox CM, Cooper WO, Koepsell TD, et al. Provision of pneumococcal prophylaxis for publicly insured children with sickle cell disease. JAMA 2003;290:1057–61.
12. Oyeku SO, Driscoll MC, Cohen HW, et al. Parental and other factors associated with hydroxyurea use for pediatric sickle cell disease. Pediatr Blood Cancer 2013;60:653–58.
13. Crandall WV, Margolis PA, Kappelman MD, et al. Improved outcomes in a quality improvement collaborative for pediatric inflammatory bowel disease. Pediatrics 2012;129:e1030–e1041.
14. Schechter MS, Margolis P. Improving subspecialty healthcare: Lessons from cystic fibrosis. J Pediatr 2005;147:295–301.
15. Smith LA, Oyeku SO, Homer C, Zuckerman B. Sickle cell disease: A question of equity and quality. Pediatrics 2006;117:1763–70.
16. Wang CJ, Kavanagh PL, Little AA, et al. Quality-of-care indicators for children with sickle cell disease. Pediatrics 2011;128:484–93.
17. Jha AK, Perlin JB, Kizer KW, Dudley RA. Effect of the transformation of the veterans affairs health care system on the quality of care. N Engl J Med 2003;348:2218–27.
18. Chaudhry B, Wang J, Wu S, et al. Systematic review: Impact of health information technology on quality, efficiency, and costs of medical care. Ann Intern Med 2006;144:742–52.
19. American recovery and reinvestment act of 2009. Obey D, Frank B, Gordon B, et al., trans. 111th Congress of the United States.
20. Blumenthal D, Tavenner M. The “meaningful use” regulation for electronic health records. N Engl J Med 2010;363:501–4.
21. Electronic health record adoption by office-based providers. Office of National Coordinator for Health Information Technology. U.S. Department of Health and Human Services. Accessed 15 Jul 2013.
22. DesRoches CM, Campbell EG, Rao SR, et al. Electronic health records in ambulatory care — a national survey of physicians. N Engl J Med 2008;359:50–60.
23. Tricco AC, Ivers NM, Grimshaw JM, et al. Effectiveness of quality improvement strategies on the management of diabetes: A systematic review and meta-analysis. Lancet 379:2252–61.
24. Bundy DG, Strouse JJ, Casella JF, Miller MR. Burden of influenza-related hospitalizations among children with sickle cell disease. Pediatrics 2010;125:234–43.
25. National Heart Lung and Blood Institute. The management of sickle cell disease. NIH Pub No. 02-2117. Bethesda, MD: National Institutes of Health; 2002.
26. Centers for Disease Control and Prevention. Immunization schedules. Accessed 5 Jan 2013 at www.cdc.gov/vaccines/schedules/index.html.
27. Strouse JJ, Reller ME, Bundy DG, et al. Severe pandemic h1n1 and seasonal influenza in children and young adults with sickle cell disease. Blood 2010;116:3431–4.
28. Pilishvili T, Zell ER, Farley MM, et al. Risk factors for invasive pneumococcal disease in children in the era of conjugate vaccine use. Pediatrics 2010;126:e9–17.
29. Heeney MM, Ware RE. Hydroxyurea for children with sickle cell disease. Pediatr Clin North Am 008;55:483–501.
30. Ware RE. How I use hydroxyurea to treat young patients with sickle cell anemia. Blood 2010;115:5300–11.
31. Ferster A, Vermylen C, Cornu G, et al. Hydroxyurea for treatment of severe sickle cell anemia: a pediatric clinical trial. Blood 1996;88:1960–4.
32. Strouse JJ, Lanzkron S, Beach MC, et al. Hydroxyurea for sickle cell disease: a systematic review for efficacy and toxicity in children. Pediatrics 2008;122:1332–42.
33. Hankins JS, Ware RE, Rogers ZR, et al. Long-term hydroxyurea therapy for infants with sickle cell anemia: the husoft extension study. Blood 2005;106:2269–75.
34. Steinberg MH, McCarthy WF, Castro O, et al. The risks and benefits of long-term use of hydroxyurea in sickle cell anemia: a 17.5-year follow-up. Am J Hematol 2010;85:403–8.
35. Voskaridou E, Christoulas D, Bilalis A, et al. The effect of prolonged administration of hydroxyurea on morbidity and mortality in adult patients with sickle cell syndromes: results of a 17-year, single-center trial (lashs). Blood 2010;115:2354–63.
36. Healthy people 2020. Immunization and infectious diseases. Accessed 3 Jun 2013 at www.healthypeople.gov/2020/topicsobjectives2020/objectiveslist.aspx?topicid=23.
37. Cohen NJ, Lauderdale DS, Shete PB, et al. Physician knowledge of catch-up regimens and contraindications for childhood immunizations. Pediatrics 2003;111:925–32.
38. Raphael JL, Rattler TL, Kowalkowski MA, et al. The medical home experience among children with sickle cell disease. Pediatr Blood Cancer 2013;60:275–80.
39. Strouse JJ, Heeney MM. Hydroxyurea for the treatment of sickle cell disease: efficacy, barriers, toxicity, and management in children. Pediatr Blood Cancer 2012;59:365–71.
40. Steinberg MH, Barton F, Castro O, et al. Effect of hydroxyurea on mortality and morbidity in adult sickle cell anemia: risks and benefits up to 9 years of treatment. JAMA 2003;289:1645–51.
41. Patient protection and affordable care act, US Pub. L. No. 111-148, §2702, 124 stat. 119, 318-319. 2010.
42. Harrison M, Koppel R, Bar-Lev S. Unintended consequences of information technologies in health care: an interactive sociotechnical analysis. J Am Med Inform Assoc 2007;14:542–9.
43. Haux R. Health information systems – past, present, future. Int J Med Informatics 2006;75:268–81.
44. Schieppati A, Henter J-I, Daina E, Aperia A. Why rare diseases are an important medical and social issue. Lancet 2008;371:2039–41.
45. Office of Rare Diseases Research National Institutes of Health. Rare diseases and related terms. Accessed 28 Jun 2013 at www.rarediseases.info.nih.gov/rarediseaselist.aspx.
Lessons Learned from a Quality Improvement Project to Reduce Missed Opportunities to Vaccinate Adults
From Abington Health, Abington, PA (Ms. Walter) and Duquesne University School of Nursing, Pittsburgh, PA (Dr. Guimond).
Abstract
- Background: National coverage rates for many recommended adult vaccines are low. Tetanus toxoid, diphtheria, and acellular pertussis (Tdap) and pneumococcal vaccination rates among adults are 20% and 16%, respectively. To address these low rates in our practice, we identified missed opportunities for vaccination as a target for improvement.
- Objective: To examine the effectiveness of a vaccine reminder checklist at the point of care and assess providers’ perceived vaccine practices.
- Methods: The quick sample method was used to assess pre- and post-intervention pneumococcal polysaccharide (PPSV) and Tdap vaccination rates among the target population (adults 18-64 for Tdap; high-risk adults 18-64 for PPSV). A post-intervention survey was used to assess providers’ adult vaccination practices and their opinion of the reminder tool.
- Results: The Tdap vaccination rate did not change and was constant at 47%. PPSV vaccination rates decreased from 50% to 40%. Among the providers, 47% reported ordering immunizations at sick visits, as compared to 76% at follow-up visits. The providers reported the reminder checklist was useful for determining a patient’s eligibility for a vaccine.
- Conclusion: No improvement in vaccination rates was detected for this project, which may be partially explained by challenges originating at patient check-in. In the future, buy-in from all staff in our practice setting will be sought. Results indicate that providers may hesitate to administer immunizations at sick visits and may need education on vaccination contraindications.
Vaccines are an important public health tool that offer safe and effective protection against certain diseases and reduce the health care burden [1,2]. Missed opportunities to vaccinate, defined as any primary care encounter in which a patient eligible for a vaccine is not administered a vaccine, lead to suboptimal immunization coverage among adults. Providers have been urged to review patients’ vaccine status at every patient encounter [3]. Rates of vaccinations recommended in 2012 by the Advisory Committee on Immunization Practices (ACIP) remain low [4], particularly coverage rates for tetanus toxoid, diphtheria, and acelluar pertussis vaccine (Tdap) vaccine among adults, and for pneumococcal polysaccharide vaccine (PPSV) among high-risk adults [2]. Nationally, uptake rates are approximately 16% for Tdap and 20% for pneumococcal vaccines among eligible adults aged 18 to 64 years [5]. These low uptake rates suggest that programs are needed to reduce missed opportunities to vaccinate and improve vaccination rates among adults.
There is a strong case for improving Tdap and pneumococcal vaccination uptake among high-risk adults. Since the 1970s, the incidence of pertussis in the United States has increased substantially, with numbers of reported cases reaching as high as 48,277 and 28,639 in 2012 and 2013, respectively [2]. Some states experienced epidemic levels of pertussis [2,6]. Pertussis is often fatal among infected infants, and infection in adolescents and adults may cost upwards of $800 per case [7,8]. In 2005, high-risk adults for whom the PPSV was indicated accounted for half of the 40,000 pneumococcal infections in the United States [9]. PPSV boasts a 50% to 80% effectiveness rate in preventing pneumococcal disease among high-risk patients [9]. In a CDC cost-effectiveness analysis, immunization of immunocompromised patients with the pneumococcal conjugate vaccine (PCV-13) at the time of diagnosis followed with PPSV vaccinations starting 1 year later led to savings of $7.6 million, added 1360 quality-adjusted life years, and prevented 57 cases of invasive pneumococcal disease [10].
Recognizing and overcoming practice-specific barriers to vaccinating adults are needed to improve uptake. A lack of patient- and provider-focused reminders may lead to missed opportunities to vaccinate [11,12]. Provider and patient-focused reminder tools can be effective in increasing vaccine uptake [1,13,14], but interventions that combine reminder tools with patient outreach may be more effective [15]. Furthermore, involving an interdisciplinary team to coordinate the administration of vaccines among adults may improve vaccine uptake rates [16]. These studies suggested the need to determine a standard, effective reminder tool and incorporate multilevel interventions to increase uptake of adult vaccines.
An informal electronic query at a large, suburban family practice revealed approximately 30% Tdap and PPSV coverage rates among eligible adults served by the practice, suggesting that providers fail to assess patients’ vaccine status at every opportunity. Electronic medical records provide no alerts for vaccines that may be due. PPSV and Tdap uptake rates were chosen for this quality improvement project to address low baseline coverage rates among adults. The objective of this project was to increase adult Tdap and 23-valent PPSV uptake rates using a reminder checklist at the point of care. A secondary objective was to assess providers’ vaccination practices during various types of visits, appraise their perceived vaccination practices and barriers to vaccinating adults, and to determine providers’ perceived effectiveness of the reminder checklist.
Methods
This quality improvement project was implemented in a large family practice that is home to a family medicine residency program. Approximately two-thirds of the patients served are adults, over half of whom are minorities, and nearly half are on Medicaid or underinsured. Providers in the practice included 21 resident physicians, 8 attending physicians, and 1 nurse practitioner who served as the primary investigator. Institutional review board approval for this study was obtained.
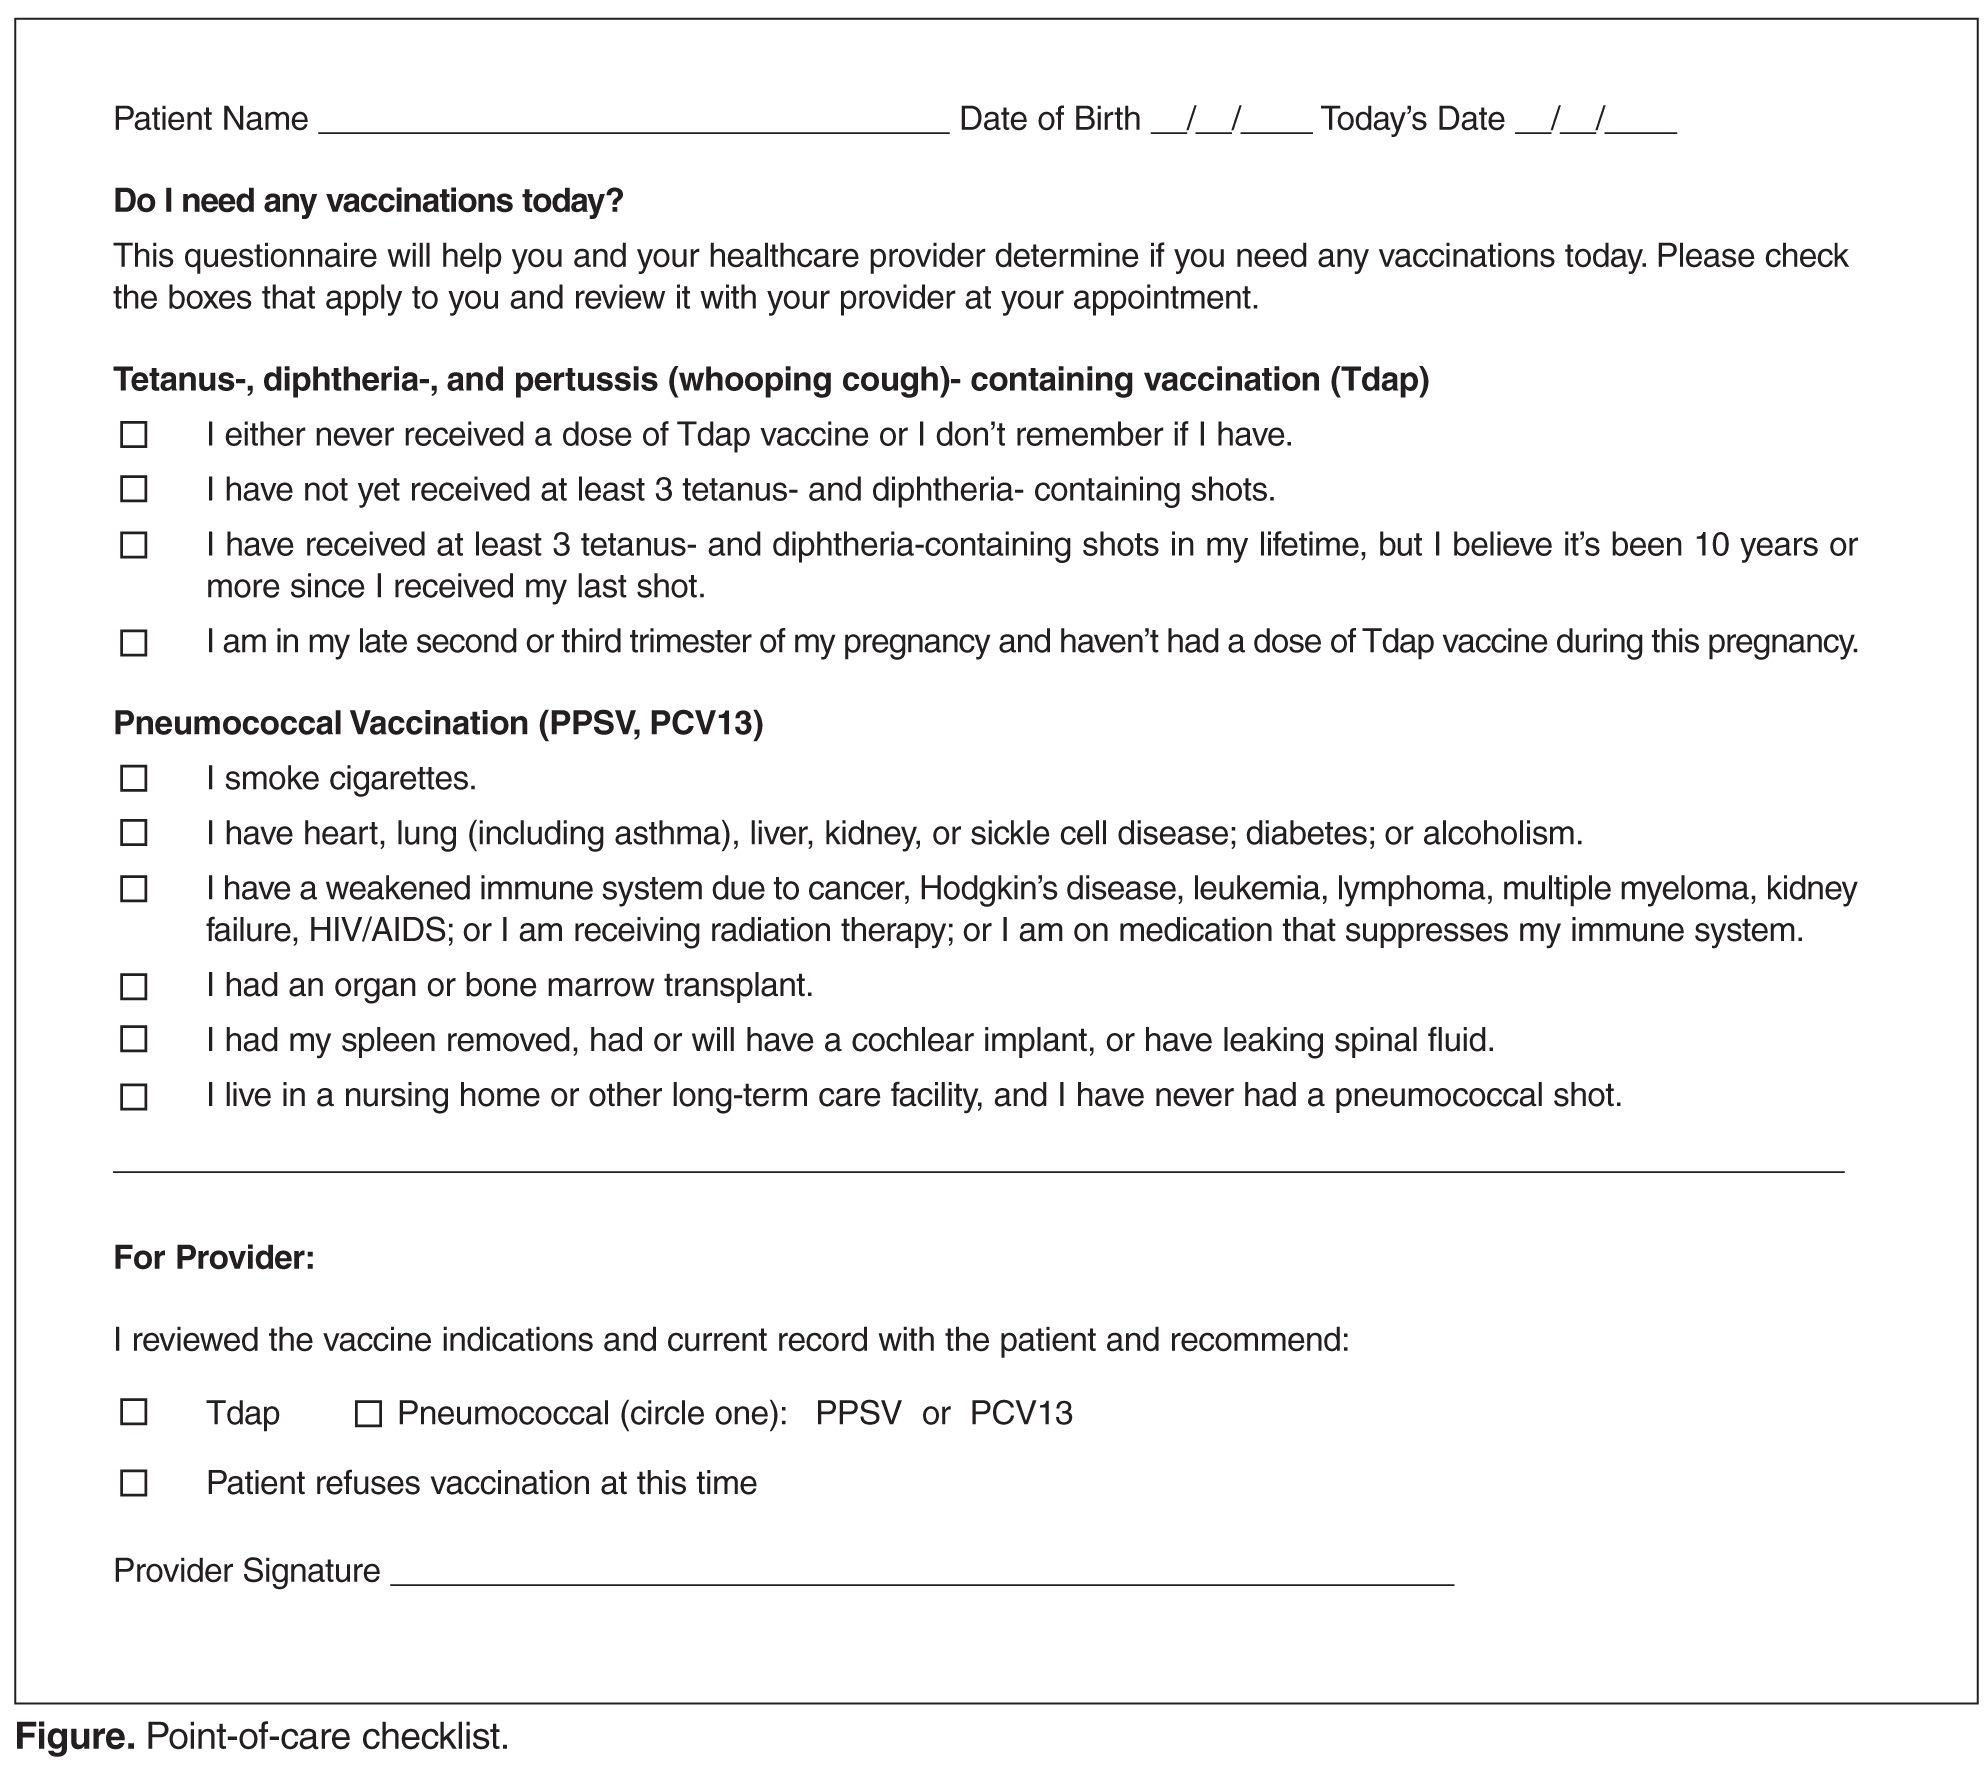
Measures included pre- and post-intervention vaccination rates for Tdap and PPSV, the providers’ perceived vaccination practices during various types of visits, the providers’ perceptions of practice-specific barriers to vaccinating adults, and the providers’ perceived usefulness of a vaccine checklist. To evaluate the effect of the reminder tool on immunization rates, we conducted a chart review. A random sample of 30 charts was derived separately for each vaccine, pre- and post-intervention, by selecting every 5th chart via the electronic health record after filtering for vaccine eligibility. Eligibility for the vaccines was based on age, vaccine history, and diagnoses noted in the medical history and problem list.
After the 3-month intervention period, an 18-item survey was distributed to participating providers to assess their vaccination practices, their perception of practice-related barriers to vaccinating, and their perception of the use of the checklist at the point of care. The survey included 5 demographic items, 5 Yes/No questions asking about the providers’ vaccination practices (adapted from [18]), and 8 questions asking about the providers’ perceptions of practice-specific vaccination barriers and the usefulness of the checklist. For these 8 questions providers were asked to choose a response along a 5-point Likert scale ranging from “strongly agree” to “strongly disagree.”
Results
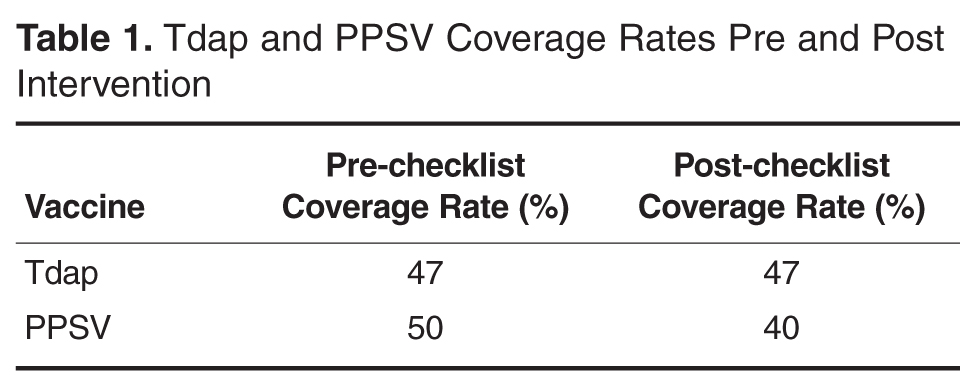
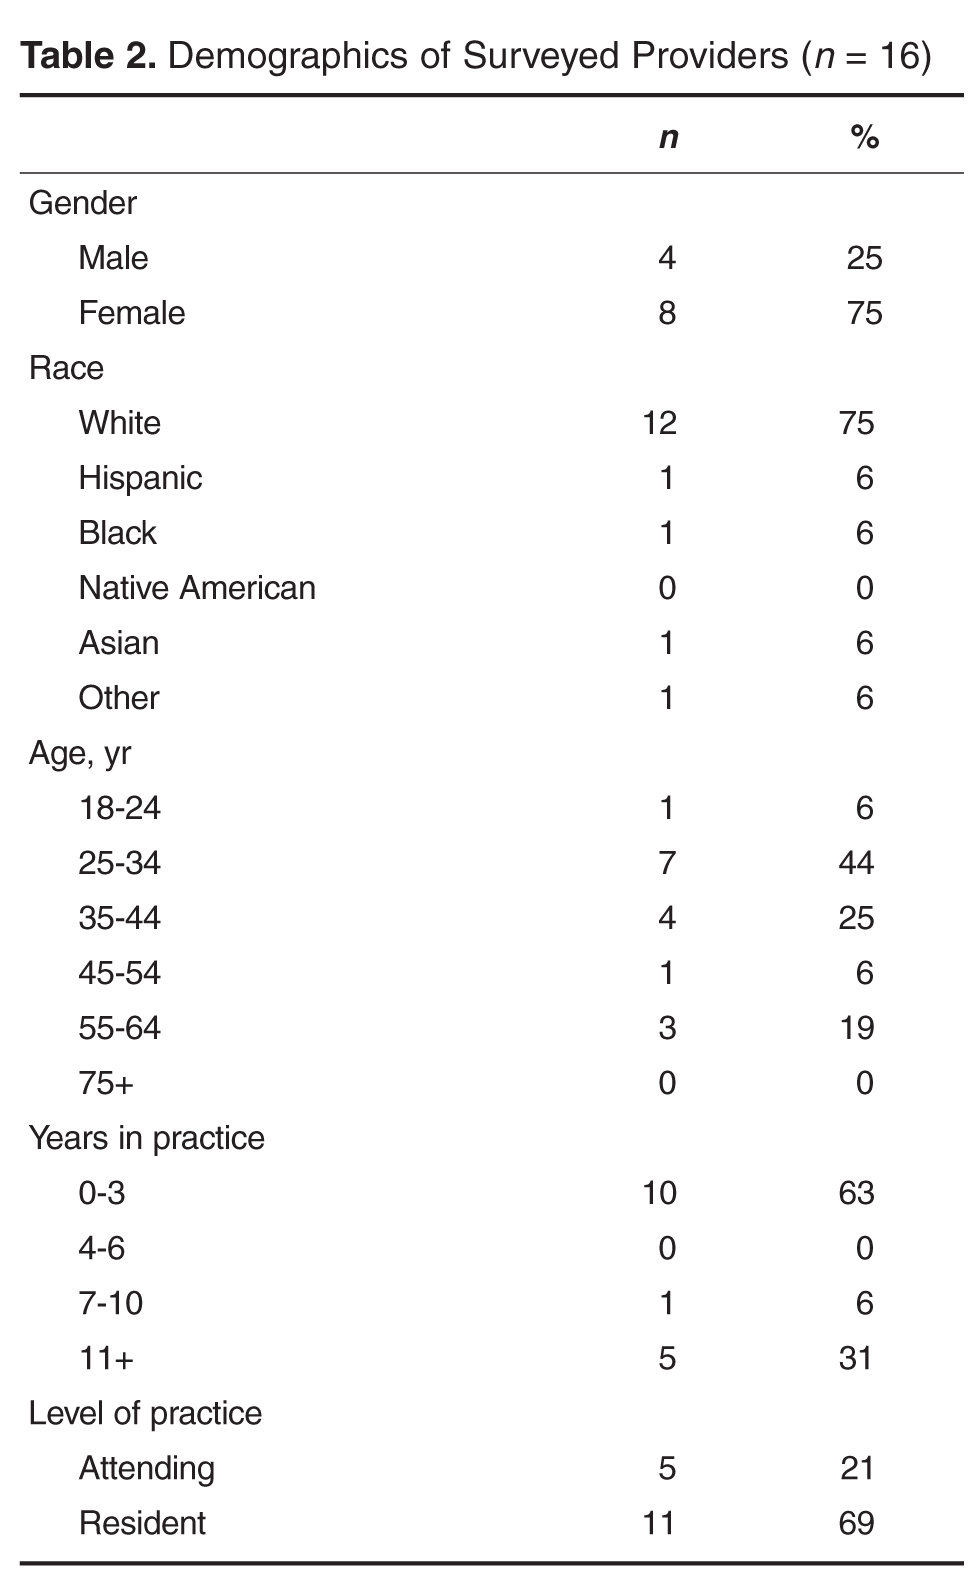
All providers responded to the vaccination practice-related questions. These questions and the frequency of responses are presented in Table 3. At follow-up visits, such as those for blood pressure checks, 82% of the providers stated they checked the patient’s immunization status and 76% of providers stated they ordered an immunization. In contrast, although 76% of providers indicated they checked the immunization status, only 47% noted they routinely ordered a vaccine at a sick visit. A Fisher’s exact test of independence to examine the relationship between providers’ years of experience and decision to vaccinate at sick visits revealed a result that was not significant (P = 1).
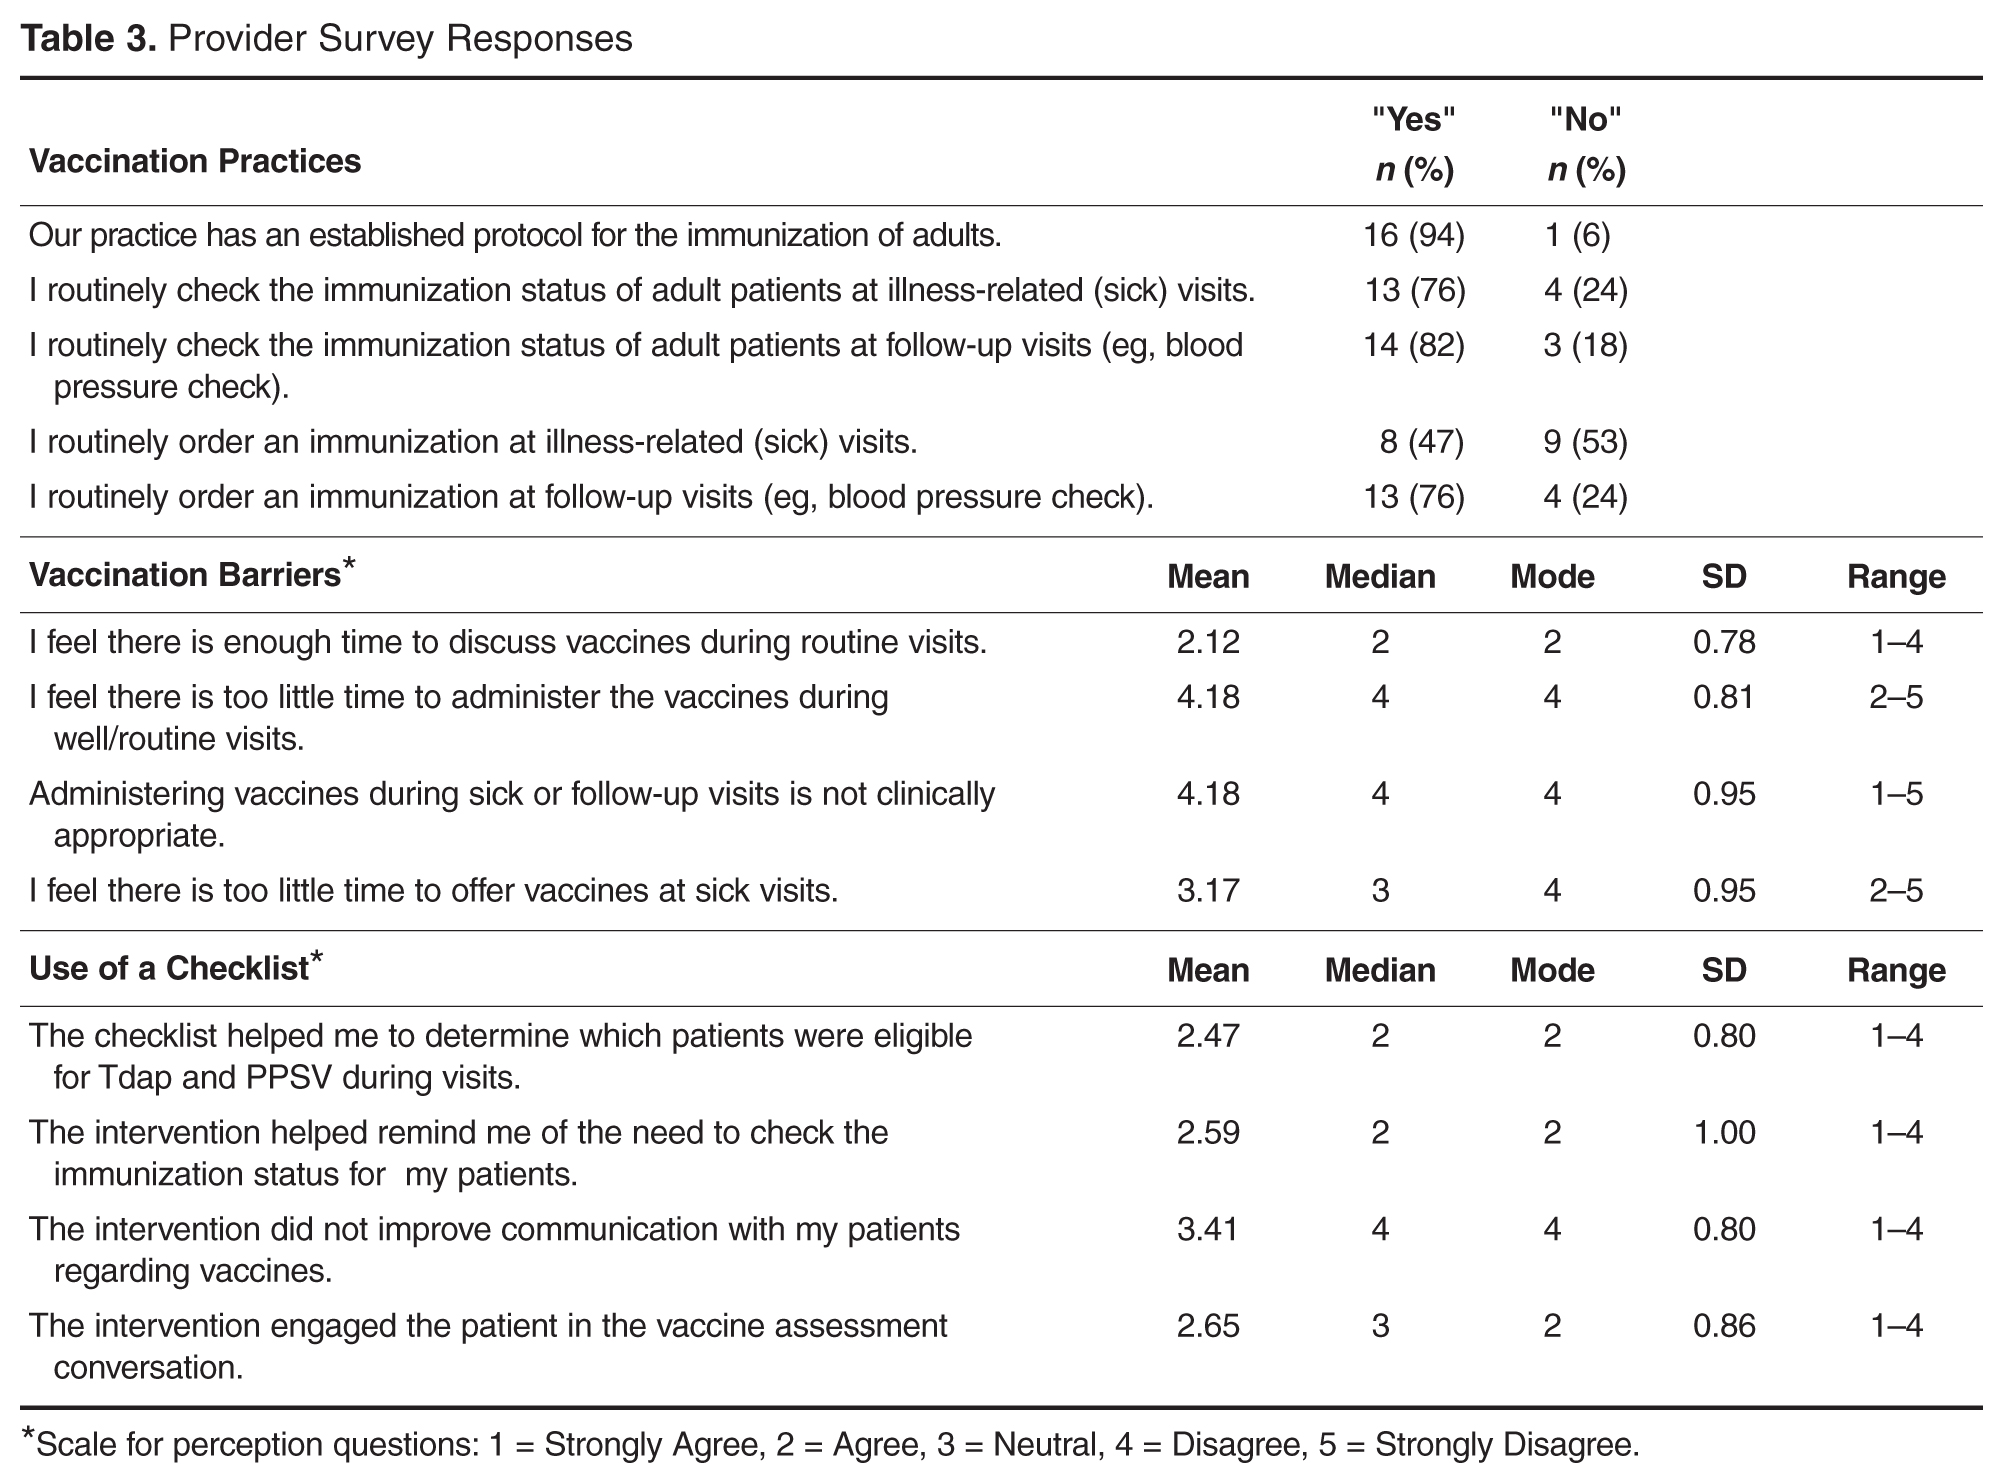
Discussion and Lessons Learned
Introduction of the reminder checklist at the point of care did not improve the administration or uptake of Tdap or PPSV during the intervention period. Limitations to our analysis include the small sample size. Also, this project was conducted in the fall, when influenza vaccines are usually given and providers may be more attuned to checking for vaccine eligibility. Future iterations of the project may be conducted to allow for samples over several months and use a process control chart to retrieve a more representative sample of participants from each vaccine-eligible group in the practice.
Usage of a paper reminder system after implementation of an electronic health record may have affected the results. Providers who are focused on the computer documentation may have overlooked paper reminders unless patients asked about vaccination. Although the checklist was printed on bright green paper as a visual cue, patients’ failure to present the reminder to providers undermined effectiveness of the paper system. In another study that used pre-visit paper reminders to improve physician performance on measures of chronic disease and preventive care, no benefit was found [19]. Developers of future vaccination programs should consider integrating reminder systems into the current system to mitigate this potential obstacle.
Staff and practice-related barriers may have also contributed to the limited success of the reminder checklist. Staff informally cited a paperwork burden as a challenge for patients. Informal feedback indicated that patients did not fully understand the questionnaire and often did not complete the form, even after being requested and instructed to do so. A systematic review of barriers to the use of reminders for immunizations showed that reminders can be perceived as disruptive to workflow and therefore not implemented or maintained [20]. These findings were congruent with behavior demonstrated by the office staff in the practice, whose buy-in to using the intervention waned over the course of the project. The front office staff needed reinforcement to continue the intervention as time passed. Informal interviews with staff suggested that patients who could have been given a checklist at the front desk did not receive it. These possibilities underline limitations in the study. Future projects may include collecting data such as perceptions of the office staff involved with vaccine interventions and proportion of patients who receive and complete the reminder checklist. A regression analysis is recommended to identify barriers that are more likely to decrease the likelihood of vaccination.
Providers’ responses to survey questions yielded insights into surveyed providers’ perceptions re the importance of immunizing adults and the use of the reminder checklist as an intervention. The majority of the providers (n = 16, 94%) acknowledged that the office had a procedure in place for immunization of adults. Review of the protocol and more vaccine education may be needed to increase providers’ knowledge of adult vaccine indications. Responses to survey questions related to vaccination barriers suggested that providers believed there was adequate time to assess for and order vaccines at routine visits. The possibility exists that an additional barrier may be present that was not uncovered by this project. Further investigation is needed to determine practice-barriers to administering vaccinations to adults at all types of visits for health care.
The findings of this review suggest that missed opportunities to vaccinate continue to exist. This project revealed that sick and problem visits may be an area warranting further exploration for opportunities to vaccinate adults. Survey findings that 76% of providers in the practice routinely check the immunization status of adult patients at sick visits and only 47% routinely order an immunization at sick visits point to the need in future vaccination programs to target sick visits as opportunities to increase adult vaccine administration. In other studies, years of experience has not been well correlated with performance of evidence based practice [21]. However, in our study, no relationship was identified between years of practice and decision to vaccinate during a sick visit. Follow-up visits, for which 76% of the surveyed providers reported ordering immunization, are another opportunity for improvement. A survey of pediatricians and family physicians regarding their adolescent patient vaccination practices revealed similar low rates for both checking the immunization status and administering vaccinations at sick and follow-up visits [18]. Based on these findings, a larger scale review is warranted that focuses on sick and follow-up visits to determine the rate of vaccination at these visits, barriers to vaccinating at sick and follow-up visits, and successful interventions to increase vaccination rates during these encounters.
Providers’ perceived vaccination behaviors at sick and follow-up visits may be related to time restrictions resulting from shorter appointments as well as providers’ varying degrees of comfort with offering vaccines during those visits. In addition, misunderstanding of vaccination contraindications has led to missed opportunities to vaccinate women and children [22] and this may apply to adults as well. Providers need to be aware of the true contraindications to vaccines. Mild acute illness is neither a contraindication nor a precaution to administering a vaccine [23]. Future projects may also focus on educating providers (at all levels of experience) regarding the safety and efficacy of administering vaccinations during illness-related visits and actual contraindications.
Also, to address time constraints during sick and follow-up visits, making the entire practice responsible for vaccination assessment and administration should be more widely employed to reduce the burden on the primary care provider. A successful model for increasing uptake involves using teamwork [16] among clinical and non-clinical staff. Successful implementation of an adult vaccination program may be improved by using a similar approach that will increase staff buy-in and accountability.
Conclusion
While care providers in this project generally perceived the reminder checklist at the point of care as helpful as a provider reminder, a patient engager, and a tool to determine vaccine eligibility, it was not effective in increasing Tdap or PPSV coverage among adult patients in the practice. Practice and workflow-related barriers to success of the intervention imply the need for careful consideration of the type of reminder system put in place in various practices. Hesitation to vaccinate during illness-related and follow-up visits denotes the need for further education of providers regarding true contraindications to particular vaccinations and further investigation of ways to make immunizing a collective responsibility shared by the patient, the office staff, and the primary and ancillary providers.
Corresponding author: Dyllan Walter, DNP, CRNP, North Hills Health Center, 212 Girard Ave., Glenside, PA 19038, dyllan79@yahoo.com.
Financial disclosures: None.
1. Stone EG, Morton SC, Hulscher ME, et al. Interventions that increase use of adult immunization and cancer screening services: a meta-analysis. Ann Intern Med 2002;136:641–51.
2. Centers for Disease Control and Prevention. Pertussis outbreak trends. 2015. Available at www.cdc.gov/pertussis/outbreaks/trends.html.
3. Centers for Disease Control and Prevention. Standards for adult immunization practice. 2014. Available at www.cdc.gov/vaccines/hcp/patient-ed/adults/for-practice/standards.html.
4. Bridges CB. Adult immunization in the United States: 2012 update. Available at www.womeningovernment.org/files/file/CarolynBridges.pdf
5. Williams WW, Lu P-J, O’Halloran A, et al. Noninfluenza vaccination coverage among adults—United States, 2012. MMWR 2014;63:95–102.
6. Winter K, Glaser C, Watt J, Harriman K; Centers for Disease Control and Prevention (CDC). Pertussis epidemic--California, 2014. MMWR Morb Mortal Wkly Rep 2014;63:1129–32.
7. Grizas AP, Camenga D, Vázquez M. Cocooning: A concept to protect young children from infectious diseases. Curr Opin Pediatr 2012;24:92–7.
8. Gidengil CA, Sandora TJ, Lee GM. Tetanus-diphtheria-acellular pertussis vaccination of adults in the USA. Expert Rev Vaccines 2008;7:621–34.
9. Wolfe RM. Update on adult immunizations. J Am Board Fam Med 2012;25:496–510.
10. Centers for Disease Control and Prevention. Use of 13-valent pneumococcal conjugate vaccine and 23-valent pneumococcal polysaccharide vaccine for adults with immunocompromising conditions: Recommendations of the Advisory Committee on Immunization Practices (ACIP). MMWR 2012;61:816–19.
11. Head KJ, Vanderpool RC, Mills LA. Health care providers’ perspectives on low HPV vaccine uptake and adherence in Appalachian Kentucky. Public Health Nurs 2013;30:351–60.
12. Perkins RB, Clark JA. What affects human papilloma virus vaccination rates? A qualitative analysis of providers’ perceptions. Womens Health Issues 2012;22:e379–86.
13. Thomas RE, Russell ML, Lorenzetti DL. Systematic review of interventions to increase influenza vaccination rates of those 60 years and older. Vaccine 2010;28:1684–70.
14. Briss PA, Rodewald LE, Hinman AR, et al. Reviews of evidence regarding interventions to improve vaccination coverage in children, adolescents, and adults. Am J Prev Med 2000;18:97–140.
15. Humiston SG, Bennett NM, Long C, et al. Increasing inner-city adult influenza vaccination rates: A randomized controlled trial. Public Health Rep 2011;126:39–47.
16. Gannon M, Qaseem A, Snooks Q, Snow V. Improving adult immunization practices using a team approach in the primary setting. Am J Public Health 2012;102:e46–e52.
17. Immunization Action Coalition. Do I need any vaccinations today? 2014. Available at www.immunize.org/catg.d/p4036.pdf.
18. Schaffer SJ, Humiston SG, Shone LP, et al. Adolescent immunization practices: A national survey of US physicians. Arch Pediat Adol Med 2001;155:566–71.
19. Baker DW, Persell SD, Kho AN, et al. The marginal value of pre-visit paper reminders when added to a multifaceted electronic health record based quality improvement system. J Am Med Informat Assoc 2011;18:805–11.
20. Pereira JA, Quach S, Heidebrecht CL, et al. Barriers to the use of reminder/recall interventions for immunizations: a systematic review. BMC Med Inform Decis Mak 2012;12:145.
21. Choudhry NK, Fletcher RH, Soumerai SB. Systematic review: The relationship between clinical experience and quality of health care. Ann Intern Med 2005;142:260–73.
22. Hutchins SS, Jansen HAFM, Robertson SE, et al. Missed opportunities for immunization: review of studies from developing and industrialized countries. Bull World Health Org 1993;71:549–60.
23. Immunization Action Coalition. Precautions and contraindications. 2015. Available at www.immunize.org/askexperts/precautions-contraindications.asp.
From Abington Health, Abington, PA (Ms. Walter) and Duquesne University School of Nursing, Pittsburgh, PA (Dr. Guimond).
Abstract
- Background: National coverage rates for many recommended adult vaccines are low. Tetanus toxoid, diphtheria, and acellular pertussis (Tdap) and pneumococcal vaccination rates among adults are 20% and 16%, respectively. To address these low rates in our practice, we identified missed opportunities for vaccination as a target for improvement.
- Objective: To examine the effectiveness of a vaccine reminder checklist at the point of care and assess providers’ perceived vaccine practices.
- Methods: The quick sample method was used to assess pre- and post-intervention pneumococcal polysaccharide (PPSV) and Tdap vaccination rates among the target population (adults 18-64 for Tdap; high-risk adults 18-64 for PPSV). A post-intervention survey was used to assess providers’ adult vaccination practices and their opinion of the reminder tool.
- Results: The Tdap vaccination rate did not change and was constant at 47%. PPSV vaccination rates decreased from 50% to 40%. Among the providers, 47% reported ordering immunizations at sick visits, as compared to 76% at follow-up visits. The providers reported the reminder checklist was useful for determining a patient’s eligibility for a vaccine.
- Conclusion: No improvement in vaccination rates was detected for this project, which may be partially explained by challenges originating at patient check-in. In the future, buy-in from all staff in our practice setting will be sought. Results indicate that providers may hesitate to administer immunizations at sick visits and may need education on vaccination contraindications.
Vaccines are an important public health tool that offer safe and effective protection against certain diseases and reduce the health care burden [1,2]. Missed opportunities to vaccinate, defined as any primary care encounter in which a patient eligible for a vaccine is not administered a vaccine, lead to suboptimal immunization coverage among adults. Providers have been urged to review patients’ vaccine status at every patient encounter [3]. Rates of vaccinations recommended in 2012 by the Advisory Committee on Immunization Practices (ACIP) remain low [4], particularly coverage rates for tetanus toxoid, diphtheria, and acelluar pertussis vaccine (Tdap) vaccine among adults, and for pneumococcal polysaccharide vaccine (PPSV) among high-risk adults [2]. Nationally, uptake rates are approximately 16% for Tdap and 20% for pneumococcal vaccines among eligible adults aged 18 to 64 years [5]. These low uptake rates suggest that programs are needed to reduce missed opportunities to vaccinate and improve vaccination rates among adults.
There is a strong case for improving Tdap and pneumococcal vaccination uptake among high-risk adults. Since the 1970s, the incidence of pertussis in the United States has increased substantially, with numbers of reported cases reaching as high as 48,277 and 28,639 in 2012 and 2013, respectively [2]. Some states experienced epidemic levels of pertussis [2,6]. Pertussis is often fatal among infected infants, and infection in adolescents and adults may cost upwards of $800 per case [7,8]. In 2005, high-risk adults for whom the PPSV was indicated accounted for half of the 40,000 pneumococcal infections in the United States [9]. PPSV boasts a 50% to 80% effectiveness rate in preventing pneumococcal disease among high-risk patients [9]. In a CDC cost-effectiveness analysis, immunization of immunocompromised patients with the pneumococcal conjugate vaccine (PCV-13) at the time of diagnosis followed with PPSV vaccinations starting 1 year later led to savings of $7.6 million, added 1360 quality-adjusted life years, and prevented 57 cases of invasive pneumococcal disease [10].
Recognizing and overcoming practice-specific barriers to vaccinating adults are needed to improve uptake. A lack of patient- and provider-focused reminders may lead to missed opportunities to vaccinate [11,12]. Provider and patient-focused reminder tools can be effective in increasing vaccine uptake [1,13,14], but interventions that combine reminder tools with patient outreach may be more effective [15]. Furthermore, involving an interdisciplinary team to coordinate the administration of vaccines among adults may improve vaccine uptake rates [16]. These studies suggested the need to determine a standard, effective reminder tool and incorporate multilevel interventions to increase uptake of adult vaccines.
An informal electronic query at a large, suburban family practice revealed approximately 30% Tdap and PPSV coverage rates among eligible adults served by the practice, suggesting that providers fail to assess patients’ vaccine status at every opportunity. Electronic medical records provide no alerts for vaccines that may be due. PPSV and Tdap uptake rates were chosen for this quality improvement project to address low baseline coverage rates among adults. The objective of this project was to increase adult Tdap and 23-valent PPSV uptake rates using a reminder checklist at the point of care. A secondary objective was to assess providers’ vaccination practices during various types of visits, appraise their perceived vaccination practices and barriers to vaccinating adults, and to determine providers’ perceived effectiveness of the reminder checklist.
Methods
This quality improvement project was implemented in a large family practice that is home to a family medicine residency program. Approximately two-thirds of the patients served are adults, over half of whom are minorities, and nearly half are on Medicaid or underinsured. Providers in the practice included 21 resident physicians, 8 attending physicians, and 1 nurse practitioner who served as the primary investigator. Institutional review board approval for this study was obtained.
Measures included pre- and post-intervention vaccination rates for Tdap and PPSV, the providers’ perceived vaccination practices during various types of visits, the providers’ perceptions of practice-specific barriers to vaccinating adults, and the providers’ perceived usefulness of a vaccine checklist. To evaluate the effect of the reminder tool on immunization rates, we conducted a chart review. A random sample of 30 charts was derived separately for each vaccine, pre- and post-intervention, by selecting every 5th chart via the electronic health record after filtering for vaccine eligibility. Eligibility for the vaccines was based on age, vaccine history, and diagnoses noted in the medical history and problem list.
After the 3-month intervention period, an 18-item survey was distributed to participating providers to assess their vaccination practices, their perception of practice-related barriers to vaccinating, and their perception of the use of the checklist at the point of care. The survey included 5 demographic items, 5 Yes/No questions asking about the providers’ vaccination practices (adapted from [18]), and 8 questions asking about the providers’ perceptions of practice-specific vaccination barriers and the usefulness of the checklist. For these 8 questions providers were asked to choose a response along a 5-point Likert scale ranging from “strongly agree” to “strongly disagree.”
Results
All providers responded to the vaccination practice-related questions. These questions and the frequency of responses are presented in Table 3. At follow-up visits, such as those for blood pressure checks, 82% of the providers stated they checked the patient’s immunization status and 76% of providers stated they ordered an immunization. In contrast, although 76% of providers indicated they checked the immunization status, only 47% noted they routinely ordered a vaccine at a sick visit. A Fisher’s exact test of independence to examine the relationship between providers’ years of experience and decision to vaccinate at sick visits revealed a result that was not significant (P = 1).
Discussion and Lessons Learned
Introduction of the reminder checklist at the point of care did not improve the administration or uptake of Tdap or PPSV during the intervention period. Limitations to our analysis include the small sample size. Also, this project was conducted in the fall, when influenza vaccines are usually given and providers may be more attuned to checking for vaccine eligibility. Future iterations of the project may be conducted to allow for samples over several months and use a process control chart to retrieve a more representative sample of participants from each vaccine-eligible group in the practice.
Usage of a paper reminder system after implementation of an electronic health record may have affected the results. Providers who are focused on the computer documentation may have overlooked paper reminders unless patients asked about vaccination. Although the checklist was printed on bright green paper as a visual cue, patients’ failure to present the reminder to providers undermined effectiveness of the paper system. In another study that used pre-visit paper reminders to improve physician performance on measures of chronic disease and preventive care, no benefit was found [19]. Developers of future vaccination programs should consider integrating reminder systems into the current system to mitigate this potential obstacle.
Staff and practice-related barriers may have also contributed to the limited success of the reminder checklist. Staff informally cited a paperwork burden as a challenge for patients. Informal feedback indicated that patients did not fully understand the questionnaire and often did not complete the form, even after being requested and instructed to do so. A systematic review of barriers to the use of reminders for immunizations showed that reminders can be perceived as disruptive to workflow and therefore not implemented or maintained [20]. These findings were congruent with behavior demonstrated by the office staff in the practice, whose buy-in to using the intervention waned over the course of the project. The front office staff needed reinforcement to continue the intervention as time passed. Informal interviews with staff suggested that patients who could have been given a checklist at the front desk did not receive it. These possibilities underline limitations in the study. Future projects may include collecting data such as perceptions of the office staff involved with vaccine interventions and proportion of patients who receive and complete the reminder checklist. A regression analysis is recommended to identify barriers that are more likely to decrease the likelihood of vaccination.
Providers’ responses to survey questions yielded insights into surveyed providers’ perceptions re the importance of immunizing adults and the use of the reminder checklist as an intervention. The majority of the providers (n = 16, 94%) acknowledged that the office had a procedure in place for immunization of adults. Review of the protocol and more vaccine education may be needed to increase providers’ knowledge of adult vaccine indications. Responses to survey questions related to vaccination barriers suggested that providers believed there was adequate time to assess for and order vaccines at routine visits. The possibility exists that an additional barrier may be present that was not uncovered by this project. Further investigation is needed to determine practice-barriers to administering vaccinations to adults at all types of visits for health care.
The findings of this review suggest that missed opportunities to vaccinate continue to exist. This project revealed that sick and problem visits may be an area warranting further exploration for opportunities to vaccinate adults. Survey findings that 76% of providers in the practice routinely check the immunization status of adult patients at sick visits and only 47% routinely order an immunization at sick visits point to the need in future vaccination programs to target sick visits as opportunities to increase adult vaccine administration. In other studies, years of experience has not been well correlated with performance of evidence based practice [21]. However, in our study, no relationship was identified between years of practice and decision to vaccinate during a sick visit. Follow-up visits, for which 76% of the surveyed providers reported ordering immunization, are another opportunity for improvement. A survey of pediatricians and family physicians regarding their adolescent patient vaccination practices revealed similar low rates for both checking the immunization status and administering vaccinations at sick and follow-up visits [18]. Based on these findings, a larger scale review is warranted that focuses on sick and follow-up visits to determine the rate of vaccination at these visits, barriers to vaccinating at sick and follow-up visits, and successful interventions to increase vaccination rates during these encounters.
Providers’ perceived vaccination behaviors at sick and follow-up visits may be related to time restrictions resulting from shorter appointments as well as providers’ varying degrees of comfort with offering vaccines during those visits. In addition, misunderstanding of vaccination contraindications has led to missed opportunities to vaccinate women and children [22] and this may apply to adults as well. Providers need to be aware of the true contraindications to vaccines. Mild acute illness is neither a contraindication nor a precaution to administering a vaccine [23]. Future projects may also focus on educating providers (at all levels of experience) regarding the safety and efficacy of administering vaccinations during illness-related visits and actual contraindications.
Also, to address time constraints during sick and follow-up visits, making the entire practice responsible for vaccination assessment and administration should be more widely employed to reduce the burden on the primary care provider. A successful model for increasing uptake involves using teamwork [16] among clinical and non-clinical staff. Successful implementation of an adult vaccination program may be improved by using a similar approach that will increase staff buy-in and accountability.
Conclusion
While care providers in this project generally perceived the reminder checklist at the point of care as helpful as a provider reminder, a patient engager, and a tool to determine vaccine eligibility, it was not effective in increasing Tdap or PPSV coverage among adult patients in the practice. Practice and workflow-related barriers to success of the intervention imply the need for careful consideration of the type of reminder system put in place in various practices. Hesitation to vaccinate during illness-related and follow-up visits denotes the need for further education of providers regarding true contraindications to particular vaccinations and further investigation of ways to make immunizing a collective responsibility shared by the patient, the office staff, and the primary and ancillary providers.
Corresponding author: Dyllan Walter, DNP, CRNP, North Hills Health Center, 212 Girard Ave., Glenside, PA 19038, dyllan79@yahoo.com.
Financial disclosures: None.
1. Stone EG, Morton SC, Hulscher ME, et al. Interventions that increase use of adult immunization and cancer screening services: a meta-analysis. Ann Intern Med 2002;136:641–51.
2. Centers for Disease Control and Prevention. Pertussis outbreak trends. 2015. Available at www.cdc.gov/pertussis/outbreaks/trends.html.
3. Centers for Disease Control and Prevention. Standards for adult immunization practice. 2014. Available at www.cdc.gov/vaccines/hcp/patient-ed/adults/for-practice/standards.html.
4. Bridges CB. Adult immunization in the United States: 2012 update. Available at www.womeningovernment.org/files/file/CarolynBridges.pdf
5. Williams WW, Lu P-J, O’Halloran A, et al. Noninfluenza vaccination coverage among adults—United States, 2012. MMWR 2014;63:95–102.
6. Winter K, Glaser C, Watt J, Harriman K; Centers for Disease Control and Prevention (CDC). Pertussis epidemic--California, 2014. MMWR Morb Mortal Wkly Rep 2014;63:1129–32.
7. Grizas AP, Camenga D, Vázquez M. Cocooning: A concept to protect young children from infectious diseases. Curr Opin Pediatr 2012;24:92–7.
8. Gidengil CA, Sandora TJ, Lee GM. Tetanus-diphtheria-acellular pertussis vaccination of adults in the USA. Expert Rev Vaccines 2008;7:621–34.
9. Wolfe RM. Update on adult immunizations. J Am Board Fam Med 2012;25:496–510.
10. Centers for Disease Control and Prevention. Use of 13-valent pneumococcal conjugate vaccine and 23-valent pneumococcal polysaccharide vaccine for adults with immunocompromising conditions: Recommendations of the Advisory Committee on Immunization Practices (ACIP). MMWR 2012;61:816–19.
11. Head KJ, Vanderpool RC, Mills LA. Health care providers’ perspectives on low HPV vaccine uptake and adherence in Appalachian Kentucky. Public Health Nurs 2013;30:351–60.
12. Perkins RB, Clark JA. What affects human papilloma virus vaccination rates? A qualitative analysis of providers’ perceptions. Womens Health Issues 2012;22:e379–86.
13. Thomas RE, Russell ML, Lorenzetti DL. Systematic review of interventions to increase influenza vaccination rates of those 60 years and older. Vaccine 2010;28:1684–70.
14. Briss PA, Rodewald LE, Hinman AR, et al. Reviews of evidence regarding interventions to improve vaccination coverage in children, adolescents, and adults. Am J Prev Med 2000;18:97–140.
15. Humiston SG, Bennett NM, Long C, et al. Increasing inner-city adult influenza vaccination rates: A randomized controlled trial. Public Health Rep 2011;126:39–47.
16. Gannon M, Qaseem A, Snooks Q, Snow V. Improving adult immunization practices using a team approach in the primary setting. Am J Public Health 2012;102:e46–e52.
17. Immunization Action Coalition. Do I need any vaccinations today? 2014. Available at www.immunize.org/catg.d/p4036.pdf.
18. Schaffer SJ, Humiston SG, Shone LP, et al. Adolescent immunization practices: A national survey of US physicians. Arch Pediat Adol Med 2001;155:566–71.
19. Baker DW, Persell SD, Kho AN, et al. The marginal value of pre-visit paper reminders when added to a multifaceted electronic health record based quality improvement system. J Am Med Informat Assoc 2011;18:805–11.
20. Pereira JA, Quach S, Heidebrecht CL, et al. Barriers to the use of reminder/recall interventions for immunizations: a systematic review. BMC Med Inform Decis Mak 2012;12:145.
21. Choudhry NK, Fletcher RH, Soumerai SB. Systematic review: The relationship between clinical experience and quality of health care. Ann Intern Med 2005;142:260–73.
22. Hutchins SS, Jansen HAFM, Robertson SE, et al. Missed opportunities for immunization: review of studies from developing and industrialized countries. Bull World Health Org 1993;71:549–60.
23. Immunization Action Coalition. Precautions and contraindications. 2015. Available at www.immunize.org/askexperts/precautions-contraindications.asp.
Impact of Standardized Screening Protocols for Cystic Fibrosis–Related Diabetes in a Pediatric Population
From Children’s Hospitals and Clinics of Minnesota, and Children’s Respiratory and Critical Care Specialists, Minneapolis, MN.
Abstract
- Objective: In an effort to improve our pediatric center’s processes for screening, identifying, and treating cystic fibrosis–related diabetes (CFRD), we aimed to create outpatient and inpatient CFRD screening protocols.
- Methods: We identified barriers in our existing screening processes. The lab protocol for outpatients receiving oral glucose tolerance tests was streamlined. Inpatient screening order sets were developed. Interdisciplinary communication between pulmonary and endocrine care teams was improved. A protocol was developed for endocrinology consultation and follow-up for CFRD patients. Staff and families received additional education.
- Results: Outpatient screening was 85% in 2010, 90% in 2011, 77% in 2012, and 95% in 2013 (P = 0.29). Inpatient screening was 13% in 2010, 44% in 2011, 63% in 2012, and 78% 2013 (P = 0.11). Therefore, the combined screening protocols improved overall screening from 87% in 2010 to 90% in 2011, 92% in 2012, and 93% in 2013 (P = 0.57).
- Conclusion: Development of screening protocols improved identification of patients with CFRD.
The most prevalent comorbidity of cystic fibrosis (CF) is cystic fibrosis–related diabetes (CFRD) [1]. The incidence of CFRD increases with age and disease progression. In 2009, Moran et al noted a CFRD prevalence of approximately 20% in adolescents and 40% to 50% in adults [1]. An early diagnosis is especially important due to the correlation of an insulin-deficient state with pulmonary decline, increased pulmonary exacerbations, nutritional impairment, and increased mortality [2–6].
In 2009, the CF Foundation (CFF), the American Diabetes Association, and the Pediatric Endocrine Society updated the clinical care guidelines for the screening, diagnosis, and medical management of CFRD [7]. Soon after, the CFF, the Pediatric Endocrine Society, and the Dartmouth Institute Microsystem Academy sponsored a Learning and Leadership Collaborative (LLC) focusing on CFRD with the purpose of standardizing evidence-based clinical care processes to improve outcomes for patients with CF [8]. Our institution was selected to participate in this endeavor along with 6 other accredited CF centers in the United States.
We report how our pediatric institution established CFRD screening processes in the areas of outpatient care and inpatient care, thereby increasing screening rates.
Methods
Context
Our center cares for approximately 140 pediatric patients with CF. Our CF multidisciplinary program provides outpatient care within a private practice as well as inpatient hospital care within an independent, not-for-profit health care system. The clinic and hospital collaboratively provide services for our patients. Our center has a comprehensive annual clinic day for each child including annual laboratory tests, x-rays, pulmonary function tests, and interaction with the multidisciplinary CF team.
This year-long CFRD screening project was conducted from 2011 to 2012. We began this project with an outpatient screening rate of 85% in 2010. While this rate is high, we identified room for improvement in our screening processes for both outpatients and inpatients. The LLC provided tools and coaching during the project. Locally, we received support and leadership from our institution.
Reflecting on our initial high outpatient screening rate, we identified 2 pre-existing elements:
- As the affiliate center of the University of Minnesota, we have been influenced by their leadership in the field of CFRD. Accordingly, we have made screening for CFRD a priority, which included integrating an endocrinologist into our CF team.
- A review of our established annual patient standard-of-care laboratory results demonstrated 75% of patients in 2010 were completing laboratory testing. Therefore, the timing of the oral glucose tolerance test (OGTT) was changed from an unscheduled basis to becoming part of the outpatient annual lab protocol in an effort to screen the majority of patients.
Target Patient Population
The 2010 CFF guidelines recommend screening patients for CFRD beginning at age 10 years; however, it has been our practice to initiate screening beginning at age 8 years. For the purpose of this project and to increase generalizability for other centers, our results were adapted to include only patients 10 years of age and older.
Definitions
Successful outpatient screening was defined as completion of a 2-hour OGTT obtained by the following process: 1) The patient fasted for 8 hours, 2) a venous blood sample was drawn for a fasting serum glucose, 3) the patient consumed an oral glucose dose of 75 g within 5 minutes of the fasting blood draw, 4) a venous blood sample was drawn 2 hours after glucose administration for the postprandial serum glucose [9]. Patients weighing less than 43 kg received 1.75 g/kg of oral glucose. Outpatients eligible for screening were 10 years of age or older at their first quarterly visit of the year when annual laboratory tests including serum glucose are drawn.
Inpatient screening parameters were determined with guidance from the clinical care guidelines for cystic fibrosis-related diabetes [7], which recommends “monitoring fasting and 2-hour postprandial plasma glucose levels for the first 48 hours.” As this recommendation leaves room for interpretation as far as the quantity and interval of testing, we elected to define a successful screening as completion of one 2-hour postprandial plasma glucose level within 24 hours of admission plus one fasting glucose level within 48 hours of admission. If a patient was identified as having a fasting level ≥ 125 mg/dL or a 2-hour postprandial ≥ 200 mg/dL, additional glucose testing continued beyond 48 hours. However, for the purpose of identifying a successful screening, only the criteria of completing one 2-hour postprandial glucose plus one fasting glucose was considered. Successful screening for inpatients who received a course of steroids was defined as completion of three 2-hour postprandial plasma glucose levels within 24, 48, and 72 hours of admission or initiation of steroids. Inpatients eligible for screening were ten years of age or older at the time of admission.
Patients were not included if they were lost to follow-up for longer than 1 year or were seen for 2 or more quarterly visits at another CF center. Additionally, patients were not eligible if they had been previously diagnosed with CFRD.
Ethical Considerations
Ethical approval for this project was provided by Children’s Hospitals and Clinics of Minnesota Institutional Review Board.
Strategy for Change
We applied the principles of clinical microsystems and conducted numerous tests of change following the Plan-Do-Study-Act (PDSA) technique [10,11]. We organized a core team consisting of 6 individuals: our CF center director (pulmonologist); a hospital-employed pediatric endocrinologist; an outpatient CF clinic nurse coordinator; the hospital’s CF coordinator (pediatric nurse practitioner); a hospital-employed, certified diabetes educator (nurse); and the hospital’s CF dietitian. The core team met weekly throughout the year-long project and ensured other CF care providers were kept up-to-date on the changes implemented with the project.
Interventions
Outpatient Screening
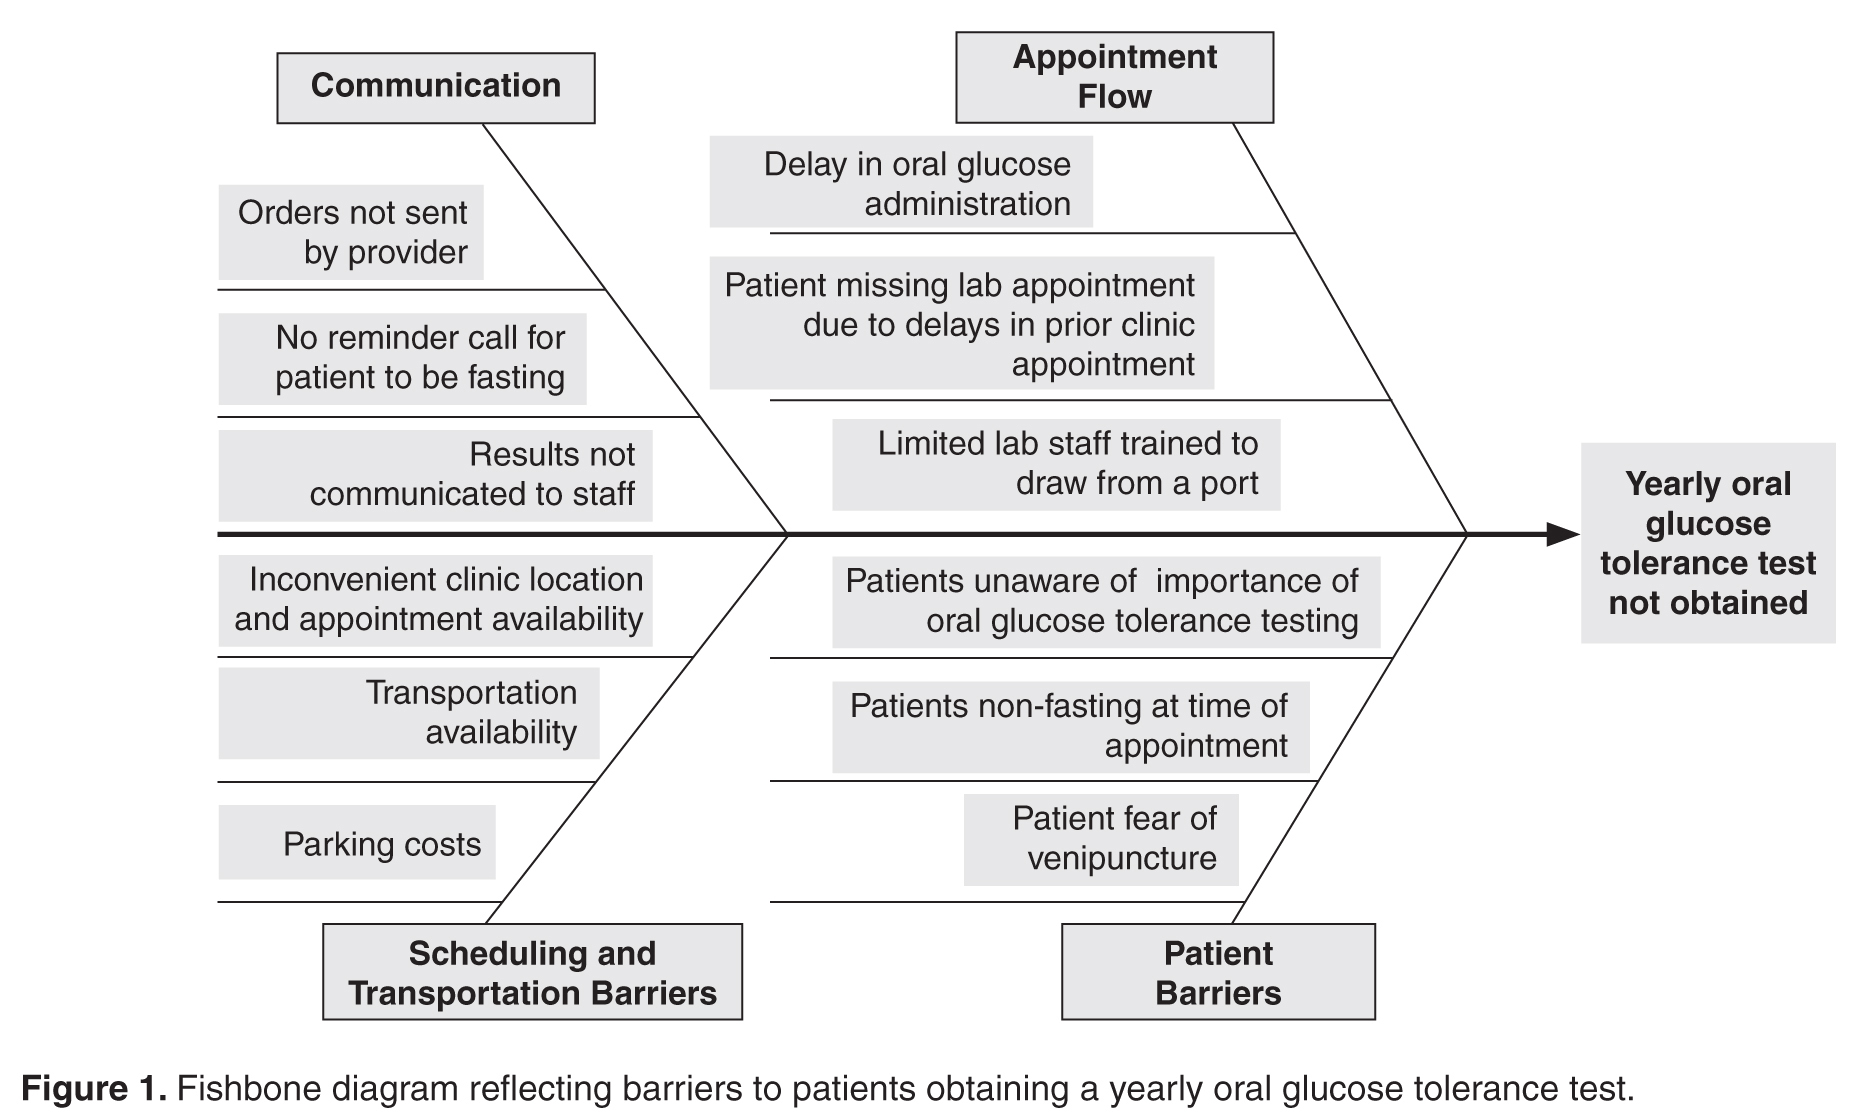
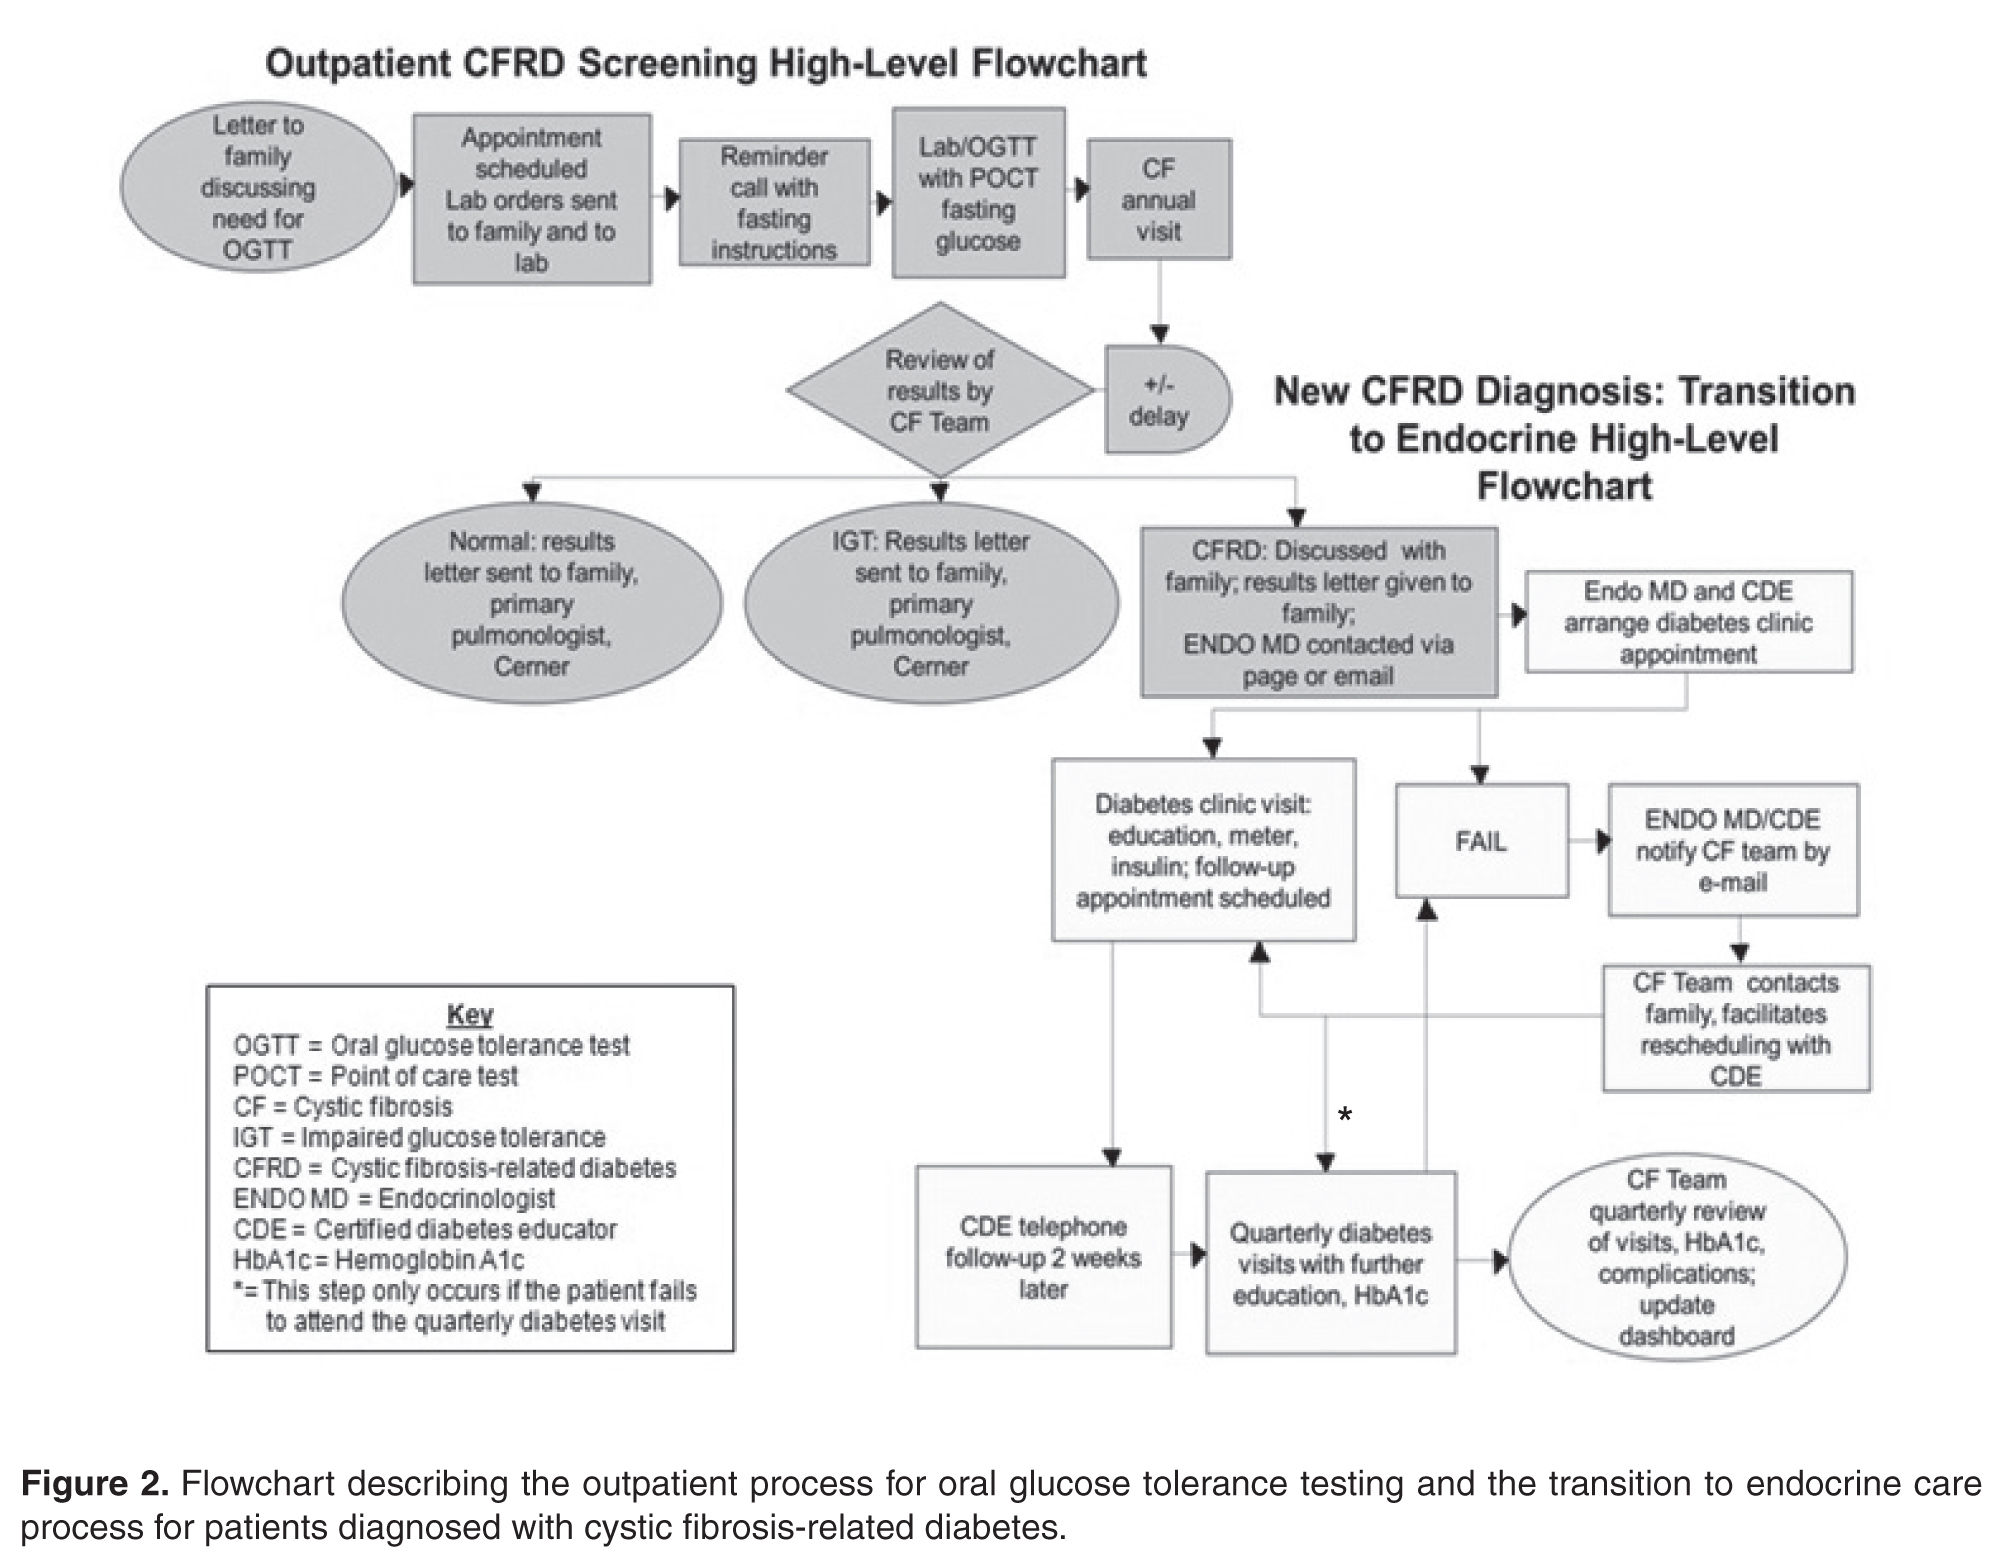
The OGTT was added to a previously established protocol for all patients to complete their annual labs at their first visit of the year. We stressed the importance and rationale for the OGTT in an annual clinic letter sent to families. The family was also sent a reminder letter with fasting instructions, a copy of the annual lab orders, and a reminder telephone call before the appointment. Based on family input regarding delays in the turn-around time for venous blood samples, a point of care (POC) glucose protocol was implemented. Laboratory personnel drew annual blood work, completed a POC blood glucose (in addition to the serum glucose), and administered the oral glucose load if the POC glucose was < 200 mg/dL.
Subsequent to completion of our project, we learned that our lab had inadvertently administered a 37.5-g dose for the OGTT instead of the recommended 75-g dose. To identify patients who may have had CFRD but were not diagnosed due to the low oral glucose dose, we have screened all patients with the corrected dose since January 2013.
To improve communication between the pulmonary and endocrine teams, weekly meetings were scheduled. The teams reviewed patients who had recently completed their annual laboratory tests or recently saw an endocrinology provider. After review of lab values, the patient families were mailed letters informing them of their child’s glucose test results which were categorized as normal, impaired, or abnormal suggesting CFRD. If the patient did not complete the OGTT, the family was mailed a letter reiterating the importance of screening. In the event of an abnormal OGTT suggesting CFRD, the results were discussed with the family during a clinic appointment. The endocrinologist and diabetes educator were subsequently notified, and an endocrine clinic appointment was arranged with the family to discuss the results and care plan. An electronic dashboard (spreadsheet) was created to track lab values and clinic visits for patients with impaired blood glucose tolerance as well as CFRD. The dashboard was reviewed and updated on a quarterly basis.
Inpatient Screening
To improve screening of hospitalized patients with CF not known to have CFRD, 4 standardized order sets detailing blood glucose testing schedules were developed in our electronic medical record as listed below. Our team educated physicians and nurses on the standardized order sets as well as patient families about the additional testing needed during hospitalization. An endocrine nurse practitioner conducted daily rounds on weekdays. All glucose results were verified by the laboratory. If a patient was identified to have a fasting blood glucose ≥ 125 mg/dL or 2-hour postprandial ≥ 200 mg/dL, the endocrine service was notified, and additional glucose testing was ordered. If the patient’s glucose levels persisted at high levels, meeting the criteria for a diagnosis of CFRD, further education was provided for the family and follow-up care was arranged.
Order Sets
1) Not receiving G-tube feedings
Day 1: 2-hour postprandial
Day 2: Fasting
2) Receiving G-tube feedings
Day 1: 2-hour postprandial, 2-hours after start of
G-tube feeds and at end of G-tube feeds
3) Receiving low-dose steroid therapy (IV methylprednisolone up to 4 mg/kg per day, administered every 6 hours and oral prednisolone 1 mg/kg twice per day for 5 days) [12]
Day 1: 2-hour postprandial
Day 2: Fasting and 2-hour postprandial
Day 3: 2-hour postprandial
4) Receiving high-dose steroid therapy per the allergic bronchopulmonary aspergillosis protocol (IV methylprednisolone 10–15 mg/kg once per day for 3 days) [12]
Days 1-4: Point of care prior to every meal, at bedtime, and at 0200 hours
Analysis
All patients with CF who are seen at our clinic were included in this project. Approximately 96% of our patients have consented to be part of the CFF supported patient registry, PortCF [13]. Data are entered by the CF clinic nurse coordinator for these patients to document clinic visits, hospital admissions, medications, lab values, and other parameters. We retrieved data from PortCF documenting the number of patients eligible for the OGTT and the number of patients diagnosed with CFRD. Individual medical records were cross-referenced with these results and also reviewed for patients who do not participate in PortCF. We retrieved data reports from our hospital informatics department to identify the number of patients with CF who were hospitalized each year and to obtain all glucose levels obtained during hospitalization. From these data, we calculated screening rates and the annual number of patients diagnosed with CFRD. We used the Cochran’s Q test to compare the differences in frequency of screening across years.
Results
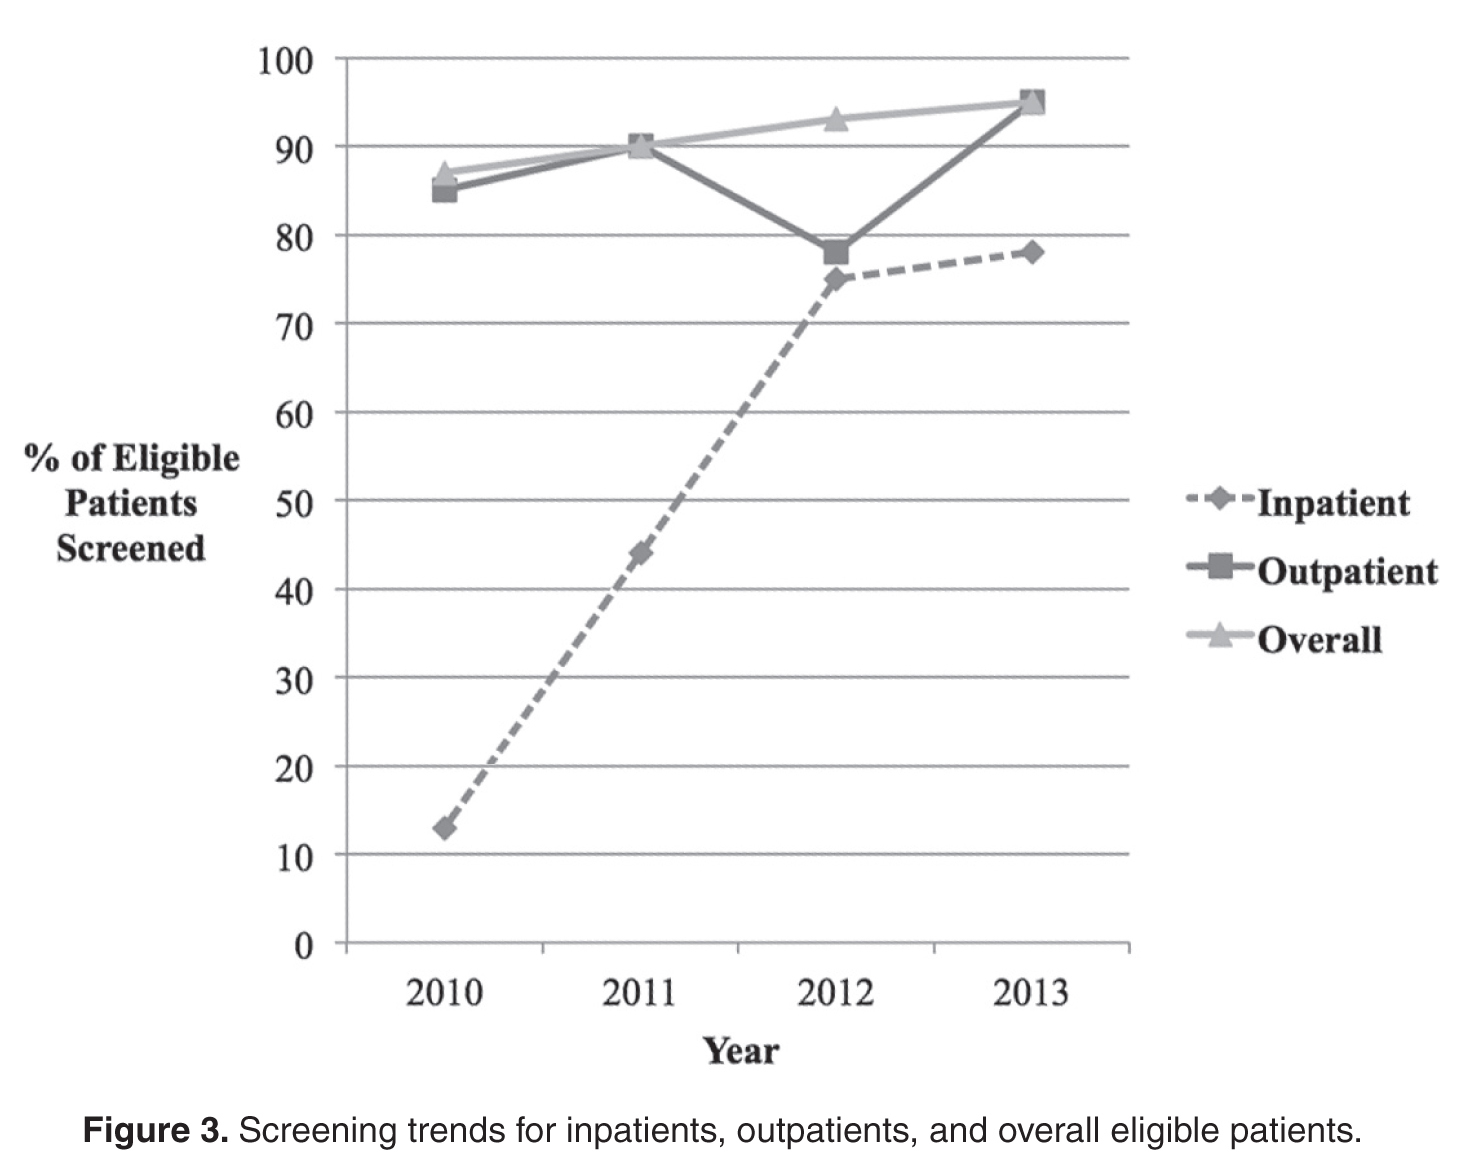
The newly implemented inpatient protocol, formally instituted in the third quarter of 2011, yielded a 43.8% screening rate in 2011 compared to a rate of 13.3% in 2010. Inpatient screening rates improved to 62.5% in 2012, and 77.8% in 2013 (Figures 3 and 4).
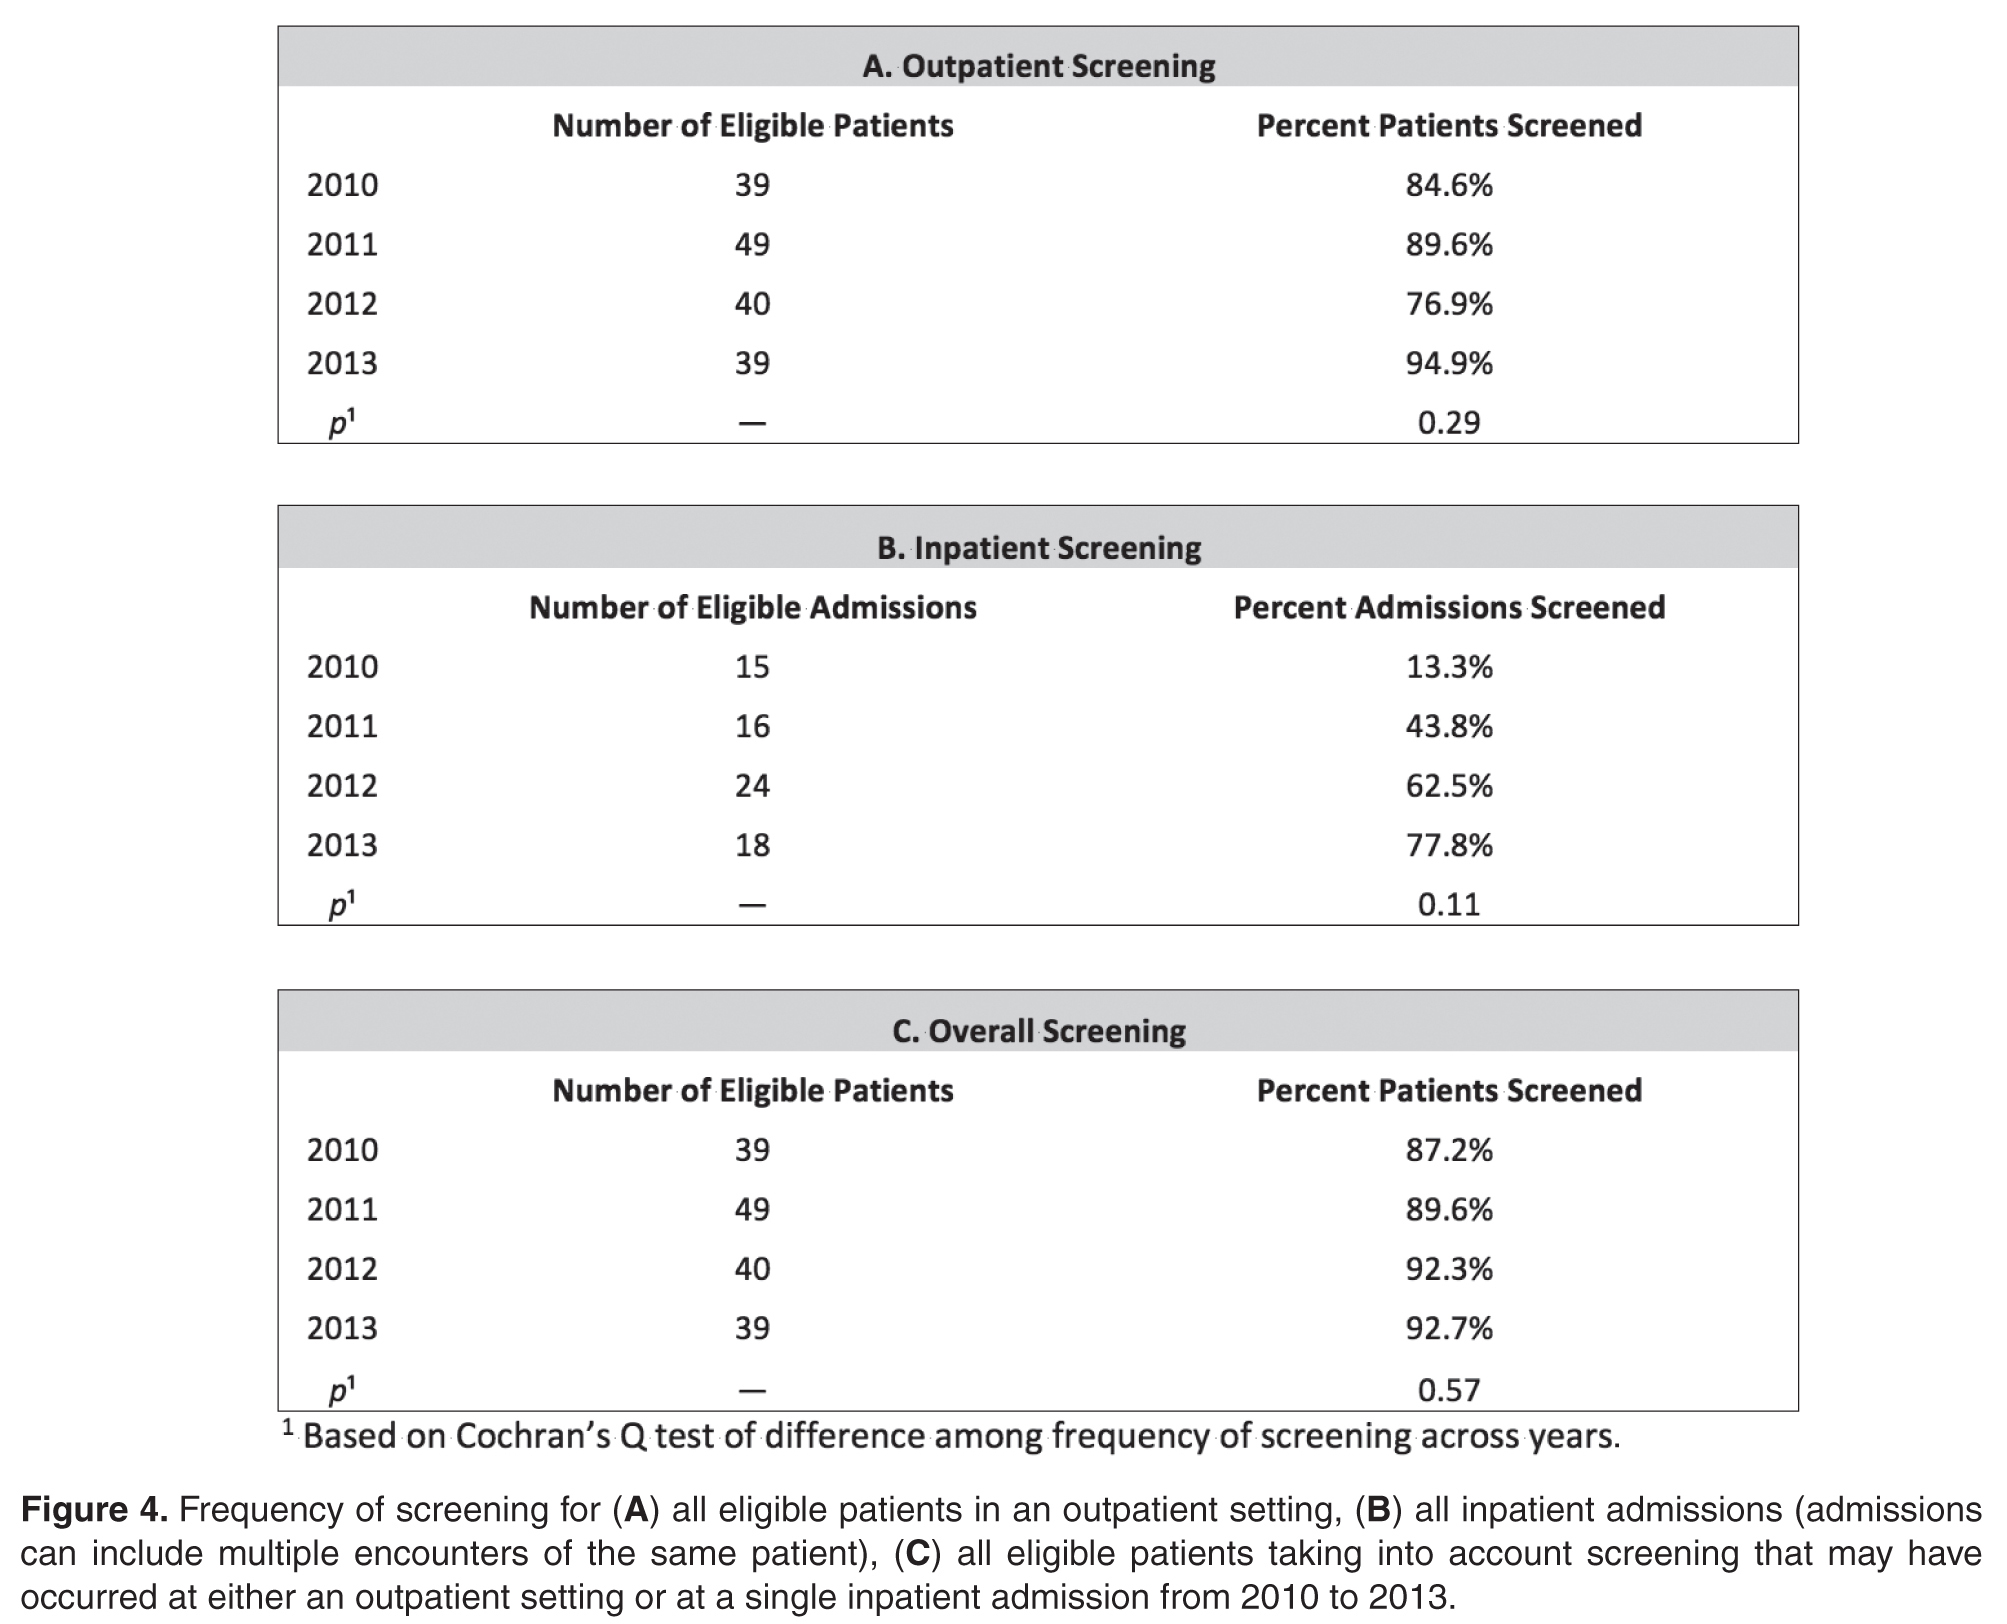
In 2011, 10 patients with CFRD were identified: 6 patients were diagnosed retrospectively based on a review of glucose levels collected in 2010 prior to the release of the new guidelines; 1 was diagnosed via inpatient screening; 3 were diagnosed via outpatient screening. In 2012, 5 patients with CFRD were identified: 4 were diagnosed via inpatient screening and one was diagnosed via outpatient screening. In 2013, 5 patients were identified: 1 diagnosed via inpatient screening and 4 diagnosed via outpatient screening. All diagnosed patients met the criteria of having a fasting blood sugar ≥ 126 mg/dL or a 2-hour postprandial ≥ 200 mg/dL that persisted for more than 48 hours.
Discussion
This collaborative initiative resulted in the development of structured screening protocols leading to overall screening improvement. A standardized screening protocol is fundamental to the identification and subsequent treatment of a patient with CFRD. Patients with CFRD may have decreased mortality when diagnosed early and treated aggressively, underscoring the necessity for CF centers to improve screening protocols [1,6].
Determining the best methods for implementation may vary from center to center, but the key factors we have identified from this project include strong leadership and team commitment—elements that have previously been identified as being predictive of positive quality improvement outcomes [14].
Education of staff, families, and patients is also an important factor. Education played a significant role during the inpatient screening PDSA cycles. For example, a time intensive but worthwhile training was conducted for the physicians and nurses on the order sets. Education for the patients and families during inpatient stays led to a better understanding of the rationale for, and support of, the additional blood draws.
The importance of family involvement was evident as we refined our outpatient protocol. Input from the phone surveys allowed us to identify barriers in our process that led us to establish more efficient clinic visits with reduced time in the lab, improved clinic flow and increased patient satisfaction. Other important factors were co-location of the endocrine and pulmonary clinics and flexibility of scheduling to facilitate seeing patients in both clinics on the same day.
Although we uncovered an error in oral glucose dosing, we were able to appropriately screen the majority of these patients within the next year. At the conclusion of 2013, our outpatient protocol had facilitated a screening rate of 95%, surpassing the 2012 rate of 77%. Interestingly, 2 of the patients diagnosed with CFRD in 2011 were diagnosed by HbA1c criteria, with normal OGTT results, perhaps due to the substandard glucose dose. Only 5 additional patients screened positive for CFRD at the end of 2013, which is the same number identified in 2012. It is unclear whether they would have been diagnosed earlier with the recommended dose of oral glucose or if they developed CFRD due to the progression of their disease.
A limitation of this project may be its reproducibility at other institutions. It is likely that the success of this project was due to the strong relationship between the endocrinology and pulmonary teams, committed leadership, institutional support for co-location of the clinics, and the team’s competency in quality improvement techniques with guidance from the LLC. The process of developing, implementing, and sustaining screening protocols was time-intensive and may be difficult to replicate in another center without similar resources available.
A strong motivation behind this project was the LLC, and while other centers may not have the same opportunity, the CFRD Evidence-Based Practice and Smart Change Idea Compendium was published as result of the LLC to serve as a guide for other centers [8]. Kern et al successfully demonstrated that a process based on the ideas from this compendium can help achieve higher OGTT outpatient screening rates in a CF center [15]. Kern et al’s project was similar to ours although the duration was shorter (< 1 year) and it began with a 47% screening rate prior to implementation. Our center extended the efforts of Kern et al by implementing our initiative over the course of 3 years, but unlike Kern et al, we included patients with failed or rescheduled appointments. Kern et al defined, identified, and excluded patients with moderate or severe pulmonary exacerbation from their eligible screening pool. We included all patients over the course of our year-long screening periods, as we have created an opportunity to screen ill patients at subsequent visits or as inpatients.
As with any quality improvement project, there is the risk of not sustaining improvements. In 2012 our outpatient screening rates were lower than the previous year. However, the coordination of the outpatient and inpatient protocols helped us achieve an improved overall screening rate of 92% in 2012. One possible explanation for the decrease in 2012 outpatient screening is that several patients eligible for screening in 2012 were less adherent with attending clinic visits. Five of these patients transitioned to an adult center or were diagnosed with CFRD in 2013. With this shift in the eligibility pool, our outpatient screening rate for 2013 surpassed our rate from 2012. In an attempt to sustain our gains, members of our team continue to review patient screening and endocrine referrals at monthly meetings. The decrease in outpatient screening demonstrates the importance of ongoing evaluation and monitoring of quality improvement projects after the initial objectives have been achieved.
Typically, our less adherent patients are only seen in clinic when experiencing an exacerbation when we cannot administer the OGTT. As a result, these patients are generally admitted for treatment of their exacerbation, and we are able to screen them during their hospitalization. Of the 9 patients not screened as outpatients in 2012, 7 were screened as inpatients. Three patients were unscreened that year: 1 patient failed to fast, another refused the test, and the last patient was inadvertently missed. While our intention is to screen all patients as an outpatient with OGTT, we have found that the only opportunity we have for screening less adherent patients is often while hospitalized, emphasizing the importance of a dual screening approach. This approach has allowed us to screen the majority of our patients as reflected in our overall screening rate.
One of our major challenges moving forward is to help the patients diagnosed with CFRD and their families accept yet another diagnosis and the burden of care associated with it. Our focus has shifted now to determine the best methods to motivate patients with CFRD to regularly attend endocrine clinic appointments, recognizing the challenges of additional clinic visits, monitoring, and medications. It is interesting to speculate whether improved CFRD clinical outcomes may correlate with improved screening rates. In 2012 our patients had a median HbA1c of 5.7 when the national average is 6.6 [16]. Further research is needed to delineate a possible relationship between an effective screening protocol and favorable clinical outcome measures.
Conclusion
The use of a structured process developed by a multidisciplinary team resulted in improved CFRD screening rates. In addition to outpatient protocols, it is critical to develop inpatient glucose testing protocols in order to capture patients who are only seen at times of exacerbation. Even in this era of treatment at a cellular level with correctors and potentiators, early detection and treatment of CFRD is essential for optimal clinical outcomes [1,5,17]. The next step for us is to sustain our gains and to improve endocrine care facilitation. We hope this report may guide other teams and institutional leadership in their efforts to improve identification of individuals with CFRD.
Acknowledgments: We would like to acknowledge Gautham Suresh, MD, Jennifer Abuzzahab, MD, Robert Payne, MD, and Andrew Flood, PhD, for their assistance in the preparation of our manuscript. We also acknowledge John Nash, MSW, LMSW, who provided us tools and coaching throughout the Learning and Leadership Collaborative.
Corresponding author: Lisa Read, MPH, 2525 Chicago Ave. South, MS 17-750, Minneapolis, MN 55404, lisa.read@childrensmn.org.
Funding/support. This work was supported by a grant from the Cystic Fibrosis Foundation for the Learning and Leadership Collaborative: Cystic Fibrosis-Related Diabetes Care (MCNAMA11Q10, to Dr. McNamara).
1. Moran A, Dunitz J, Nathan B, et al. Cystic fibrosis–related diabetes: current trends in prevalence, incidence, and mortality. Diabetes Care 2009;32:1626–31.
2. Cawood TJ, McKenna MJ, Gallagher CG, et al. Cystic fibrosis-related diabetes in adults. Ir Med J 2006;99:83–6.
3. Koch C, Rainisio M, Madessani U, et al. Investigators of the European Epidemiologic Registry of Cystic Fibrosis. Presence of cystic fibrosis-related diabetes mellitus tightly linked to poor lung function in patients with cystic fibrosis: data from the European Epidemiologic Registry of Cystic Fibrosis. Pediatr Pulmonol 2001;32:343–50.
4. Marshall BC, Butler SM, Stoddard M, et al. Epidemiology of cystic fibrosis-related diabetes. J Pediatr 2005;146:681–7.
5. Milla CE, Billings J, Moran A. Diabetes is associated with dramatically decreased survival in female but not male subjects with cystic fibrosis. Diabetes Care 2005;28:2141–4.
6. Lewis C, Blackman SM, Nelson A, et al. Diabetes-related mortality in adults with cystic fibrosis. Role of genotype and sex. Am J Respir Crit Care Med 2015;191:194–200.
7. Moran A, Brunzell C, Cohen, RC, et al. Clinical Care guidelines for cystic fibrosis–related diabetes. A position statement of the American Diabetes Association and a clinical practice guideline of the Cystic Fibrosis Foundation, endorsed by the Pediatric Endocrine Society. Diabetes Care 2010;33:2697–708.
8. Nash J, Messier R, Casella SJ, et al. Learning and Leadership Collaborative: CFRD. Cystic fibrosis related diabetes (CFRD) evidence-based practice and smart change idea compendium 2012. Bethesda, MD: Cystic Fibrosis Foundation; McLean, VA: Pediatric Endocrine Society; Lebanon, NH: Dartmouth Institute Microsystem Academy; May 2012.
9. WHO Expert Committee on Diabetes Mellitus: Second Report of the WHO Expert Committee on Diabetes Mellitus. Geneva: World Health Organization; 1980 (Tech. Rep. Ser no. 646).
10. Cystic Fibrosis Foundation, Dartmouth Medical School: Center for the Evaluative Clinical Sciences, Dartmouth/Hitchcock Medical Center. Action guide for accelerating improvement in cystic fibrosis care: clinical microsystems. 2006.
11. Langley GJ, Nolan KM, Nolan TW, et al. The improvement guide: a practical approach to enhancing organizational performance. San Francisco, CA: Jossey-Bass; 1996.
12. Cohen-Cymberknoh M, Blau H, Shoseyov D, et al. Intravenous monthly pulse methylprednisolone treatment for ABPA in patients with cystic fibrosis. J Cyst Fibros 2009;8:253–7.
13. Center Specific Patient Registry Report for 2011. Bethesda, MD: Cystic Fibrosis Foundation; 2012.
14. Parker VA, Wubbenhorst WH, Young GJ, et al. Implementing quality improvement in hospitals: The role of leadership and culture. Am J Med Qual 1999; 14:64–9.
15. Kern AS, Prestridge AL. Improving screening for cystic fibrosis-related diabetes at a pediatric cystic fibrosis program. Pediatrics 2013;132:e512–8.
16. Center Specific Patient Registry Report for 2012. Bethesda, MD: Cystic Fibrosis Foundation; 2013.
17. Schwarzenberg SJ, Thomas W, Olsen TW, et al. Microvascular complications in cystic fibrosis-related diabetes. Diabetes Care 2007;30:1056–61.
From Children’s Hospitals and Clinics of Minnesota, and Children’s Respiratory and Critical Care Specialists, Minneapolis, MN.
Abstract
- Objective: In an effort to improve our pediatric center’s processes for screening, identifying, and treating cystic fibrosis–related diabetes (CFRD), we aimed to create outpatient and inpatient CFRD screening protocols.
- Methods: We identified barriers in our existing screening processes. The lab protocol for outpatients receiving oral glucose tolerance tests was streamlined. Inpatient screening order sets were developed. Interdisciplinary communication between pulmonary and endocrine care teams was improved. A protocol was developed for endocrinology consultation and follow-up for CFRD patients. Staff and families received additional education.
- Results: Outpatient screening was 85% in 2010, 90% in 2011, 77% in 2012, and 95% in 2013 (P = 0.29). Inpatient screening was 13% in 2010, 44% in 2011, 63% in 2012, and 78% 2013 (P = 0.11). Therefore, the combined screening protocols improved overall screening from 87% in 2010 to 90% in 2011, 92% in 2012, and 93% in 2013 (P = 0.57).
- Conclusion: Development of screening protocols improved identification of patients with CFRD.
The most prevalent comorbidity of cystic fibrosis (CF) is cystic fibrosis–related diabetes (CFRD) [1]. The incidence of CFRD increases with age and disease progression. In 2009, Moran et al noted a CFRD prevalence of approximately 20% in adolescents and 40% to 50% in adults [1]. An early diagnosis is especially important due to the correlation of an insulin-deficient state with pulmonary decline, increased pulmonary exacerbations, nutritional impairment, and increased mortality [2–6].
In 2009, the CF Foundation (CFF), the American Diabetes Association, and the Pediatric Endocrine Society updated the clinical care guidelines for the screening, diagnosis, and medical management of CFRD [7]. Soon after, the CFF, the Pediatric Endocrine Society, and the Dartmouth Institute Microsystem Academy sponsored a Learning and Leadership Collaborative (LLC) focusing on CFRD with the purpose of standardizing evidence-based clinical care processes to improve outcomes for patients with CF [8]. Our institution was selected to participate in this endeavor along with 6 other accredited CF centers in the United States.
We report how our pediatric institution established CFRD screening processes in the areas of outpatient care and inpatient care, thereby increasing screening rates.
Methods
Context
Our center cares for approximately 140 pediatric patients with CF. Our CF multidisciplinary program provides outpatient care within a private practice as well as inpatient hospital care within an independent, not-for-profit health care system. The clinic and hospital collaboratively provide services for our patients. Our center has a comprehensive annual clinic day for each child including annual laboratory tests, x-rays, pulmonary function tests, and interaction with the multidisciplinary CF team.
This year-long CFRD screening project was conducted from 2011 to 2012. We began this project with an outpatient screening rate of 85% in 2010. While this rate is high, we identified room for improvement in our screening processes for both outpatients and inpatients. The LLC provided tools and coaching during the project. Locally, we received support and leadership from our institution.
Reflecting on our initial high outpatient screening rate, we identified 2 pre-existing elements:
- As the affiliate center of the University of Minnesota, we have been influenced by their leadership in the field of CFRD. Accordingly, we have made screening for CFRD a priority, which included integrating an endocrinologist into our CF team.
- A review of our established annual patient standard-of-care laboratory results demonstrated 75% of patients in 2010 were completing laboratory testing. Therefore, the timing of the oral glucose tolerance test (OGTT) was changed from an unscheduled basis to becoming part of the outpatient annual lab protocol in an effort to screen the majority of patients.
Target Patient Population
The 2010 CFF guidelines recommend screening patients for CFRD beginning at age 10 years; however, it has been our practice to initiate screening beginning at age 8 years. For the purpose of this project and to increase generalizability for other centers, our results were adapted to include only patients 10 years of age and older.
Definitions
Successful outpatient screening was defined as completion of a 2-hour OGTT obtained by the following process: 1) The patient fasted for 8 hours, 2) a venous blood sample was drawn for a fasting serum glucose, 3) the patient consumed an oral glucose dose of 75 g within 5 minutes of the fasting blood draw, 4) a venous blood sample was drawn 2 hours after glucose administration for the postprandial serum glucose [9]. Patients weighing less than 43 kg received 1.75 g/kg of oral glucose. Outpatients eligible for screening were 10 years of age or older at their first quarterly visit of the year when annual laboratory tests including serum glucose are drawn.
Inpatient screening parameters were determined with guidance from the clinical care guidelines for cystic fibrosis-related diabetes [7], which recommends “monitoring fasting and 2-hour postprandial plasma glucose levels for the first 48 hours.” As this recommendation leaves room for interpretation as far as the quantity and interval of testing, we elected to define a successful screening as completion of one 2-hour postprandial plasma glucose level within 24 hours of admission plus one fasting glucose level within 48 hours of admission. If a patient was identified as having a fasting level ≥ 125 mg/dL or a 2-hour postprandial ≥ 200 mg/dL, additional glucose testing continued beyond 48 hours. However, for the purpose of identifying a successful screening, only the criteria of completing one 2-hour postprandial glucose plus one fasting glucose was considered. Successful screening for inpatients who received a course of steroids was defined as completion of three 2-hour postprandial plasma glucose levels within 24, 48, and 72 hours of admission or initiation of steroids. Inpatients eligible for screening were ten years of age or older at the time of admission.
Patients were not included if they were lost to follow-up for longer than 1 year or were seen for 2 or more quarterly visits at another CF center. Additionally, patients were not eligible if they had been previously diagnosed with CFRD.
Ethical Considerations
Ethical approval for this project was provided by Children’s Hospitals and Clinics of Minnesota Institutional Review Board.
Strategy for Change
We applied the principles of clinical microsystems and conducted numerous tests of change following the Plan-Do-Study-Act (PDSA) technique [10,11]. We organized a core team consisting of 6 individuals: our CF center director (pulmonologist); a hospital-employed pediatric endocrinologist; an outpatient CF clinic nurse coordinator; the hospital’s CF coordinator (pediatric nurse practitioner); a hospital-employed, certified diabetes educator (nurse); and the hospital’s CF dietitian. The core team met weekly throughout the year-long project and ensured other CF care providers were kept up-to-date on the changes implemented with the project.
Interventions
Outpatient Screening
The OGTT was added to a previously established protocol for all patients to complete their annual labs at their first visit of the year. We stressed the importance and rationale for the OGTT in an annual clinic letter sent to families. The family was also sent a reminder letter with fasting instructions, a copy of the annual lab orders, and a reminder telephone call before the appointment. Based on family input regarding delays in the turn-around time for venous blood samples, a point of care (POC) glucose protocol was implemented. Laboratory personnel drew annual blood work, completed a POC blood glucose (in addition to the serum glucose), and administered the oral glucose load if the POC glucose was < 200 mg/dL.
Subsequent to completion of our project, we learned that our lab had inadvertently administered a 37.5-g dose for the OGTT instead of the recommended 75-g dose. To identify patients who may have had CFRD but were not diagnosed due to the low oral glucose dose, we have screened all patients with the corrected dose since January 2013.
To improve communication between the pulmonary and endocrine teams, weekly meetings were scheduled. The teams reviewed patients who had recently completed their annual laboratory tests or recently saw an endocrinology provider. After review of lab values, the patient families were mailed letters informing them of their child’s glucose test results which were categorized as normal, impaired, or abnormal suggesting CFRD. If the patient did not complete the OGTT, the family was mailed a letter reiterating the importance of screening. In the event of an abnormal OGTT suggesting CFRD, the results were discussed with the family during a clinic appointment. The endocrinologist and diabetes educator were subsequently notified, and an endocrine clinic appointment was arranged with the family to discuss the results and care plan. An electronic dashboard (spreadsheet) was created to track lab values and clinic visits for patients with impaired blood glucose tolerance as well as CFRD. The dashboard was reviewed and updated on a quarterly basis.
Inpatient Screening
To improve screening of hospitalized patients with CF not known to have CFRD, 4 standardized order sets detailing blood glucose testing schedules were developed in our electronic medical record as listed below. Our team educated physicians and nurses on the standardized order sets as well as patient families about the additional testing needed during hospitalization. An endocrine nurse practitioner conducted daily rounds on weekdays. All glucose results were verified by the laboratory. If a patient was identified to have a fasting blood glucose ≥ 125 mg/dL or 2-hour postprandial ≥ 200 mg/dL, the endocrine service was notified, and additional glucose testing was ordered. If the patient’s glucose levels persisted at high levels, meeting the criteria for a diagnosis of CFRD, further education was provided for the family and follow-up care was arranged.
Order Sets
1) Not receiving G-tube feedings
Day 1: 2-hour postprandial
Day 2: Fasting
2) Receiving G-tube feedings
Day 1: 2-hour postprandial, 2-hours after start of
G-tube feeds and at end of G-tube feeds
3) Receiving low-dose steroid therapy (IV methylprednisolone up to 4 mg/kg per day, administered every 6 hours and oral prednisolone 1 mg/kg twice per day for 5 days) [12]
Day 1: 2-hour postprandial
Day 2: Fasting and 2-hour postprandial
Day 3: 2-hour postprandial
4) Receiving high-dose steroid therapy per the allergic bronchopulmonary aspergillosis protocol (IV methylprednisolone 10–15 mg/kg once per day for 3 days) [12]
Days 1-4: Point of care prior to every meal, at bedtime, and at 0200 hours
Analysis
All patients with CF who are seen at our clinic were included in this project. Approximately 96% of our patients have consented to be part of the CFF supported patient registry, PortCF [13]. Data are entered by the CF clinic nurse coordinator for these patients to document clinic visits, hospital admissions, medications, lab values, and other parameters. We retrieved data from PortCF documenting the number of patients eligible for the OGTT and the number of patients diagnosed with CFRD. Individual medical records were cross-referenced with these results and also reviewed for patients who do not participate in PortCF. We retrieved data reports from our hospital informatics department to identify the number of patients with CF who were hospitalized each year and to obtain all glucose levels obtained during hospitalization. From these data, we calculated screening rates and the annual number of patients diagnosed with CFRD. We used the Cochran’s Q test to compare the differences in frequency of screening across years.
Results
The newly implemented inpatient protocol, formally instituted in the third quarter of 2011, yielded a 43.8% screening rate in 2011 compared to a rate of 13.3% in 2010. Inpatient screening rates improved to 62.5% in 2012, and 77.8% in 2013 (Figures 3 and 4).
In 2011, 10 patients with CFRD were identified: 6 patients were diagnosed retrospectively based on a review of glucose levels collected in 2010 prior to the release of the new guidelines; 1 was diagnosed via inpatient screening; 3 were diagnosed via outpatient screening. In 2012, 5 patients with CFRD were identified: 4 were diagnosed via inpatient screening and one was diagnosed via outpatient screening. In 2013, 5 patients were identified: 1 diagnosed via inpatient screening and 4 diagnosed via outpatient screening. All diagnosed patients met the criteria of having a fasting blood sugar ≥ 126 mg/dL or a 2-hour postprandial ≥ 200 mg/dL that persisted for more than 48 hours.
Discussion
This collaborative initiative resulted in the development of structured screening protocols leading to overall screening improvement. A standardized screening protocol is fundamental to the identification and subsequent treatment of a patient with CFRD. Patients with CFRD may have decreased mortality when diagnosed early and treated aggressively, underscoring the necessity for CF centers to improve screening protocols [1,6].
Determining the best methods for implementation may vary from center to center, but the key factors we have identified from this project include strong leadership and team commitment—elements that have previously been identified as being predictive of positive quality improvement outcomes [14].
Education of staff, families, and patients is also an important factor. Education played a significant role during the inpatient screening PDSA cycles. For example, a time intensive but worthwhile training was conducted for the physicians and nurses on the order sets. Education for the patients and families during inpatient stays led to a better understanding of the rationale for, and support of, the additional blood draws.
The importance of family involvement was evident as we refined our outpatient protocol. Input from the phone surveys allowed us to identify barriers in our process that led us to establish more efficient clinic visits with reduced time in the lab, improved clinic flow and increased patient satisfaction. Other important factors were co-location of the endocrine and pulmonary clinics and flexibility of scheduling to facilitate seeing patients in both clinics on the same day.
Although we uncovered an error in oral glucose dosing, we were able to appropriately screen the majority of these patients within the next year. At the conclusion of 2013, our outpatient protocol had facilitated a screening rate of 95%, surpassing the 2012 rate of 77%. Interestingly, 2 of the patients diagnosed with CFRD in 2011 were diagnosed by HbA1c criteria, with normal OGTT results, perhaps due to the substandard glucose dose. Only 5 additional patients screened positive for CFRD at the end of 2013, which is the same number identified in 2012. It is unclear whether they would have been diagnosed earlier with the recommended dose of oral glucose or if they developed CFRD due to the progression of their disease.
A limitation of this project may be its reproducibility at other institutions. It is likely that the success of this project was due to the strong relationship between the endocrinology and pulmonary teams, committed leadership, institutional support for co-location of the clinics, and the team’s competency in quality improvement techniques with guidance from the LLC. The process of developing, implementing, and sustaining screening protocols was time-intensive and may be difficult to replicate in another center without similar resources available.
A strong motivation behind this project was the LLC, and while other centers may not have the same opportunity, the CFRD Evidence-Based Practice and Smart Change Idea Compendium was published as result of the LLC to serve as a guide for other centers [8]. Kern et al successfully demonstrated that a process based on the ideas from this compendium can help achieve higher OGTT outpatient screening rates in a CF center [15]. Kern et al’s project was similar to ours although the duration was shorter (< 1 year) and it began with a 47% screening rate prior to implementation. Our center extended the efforts of Kern et al by implementing our initiative over the course of 3 years, but unlike Kern et al, we included patients with failed or rescheduled appointments. Kern et al defined, identified, and excluded patients with moderate or severe pulmonary exacerbation from their eligible screening pool. We included all patients over the course of our year-long screening periods, as we have created an opportunity to screen ill patients at subsequent visits or as inpatients.
As with any quality improvement project, there is the risk of not sustaining improvements. In 2012 our outpatient screening rates were lower than the previous year. However, the coordination of the outpatient and inpatient protocols helped us achieve an improved overall screening rate of 92% in 2012. One possible explanation for the decrease in 2012 outpatient screening is that several patients eligible for screening in 2012 were less adherent with attending clinic visits. Five of these patients transitioned to an adult center or were diagnosed with CFRD in 2013. With this shift in the eligibility pool, our outpatient screening rate for 2013 surpassed our rate from 2012. In an attempt to sustain our gains, members of our team continue to review patient screening and endocrine referrals at monthly meetings. The decrease in outpatient screening demonstrates the importance of ongoing evaluation and monitoring of quality improvement projects after the initial objectives have been achieved.
Typically, our less adherent patients are only seen in clinic when experiencing an exacerbation when we cannot administer the OGTT. As a result, these patients are generally admitted for treatment of their exacerbation, and we are able to screen them during their hospitalization. Of the 9 patients not screened as outpatients in 2012, 7 were screened as inpatients. Three patients were unscreened that year: 1 patient failed to fast, another refused the test, and the last patient was inadvertently missed. While our intention is to screen all patients as an outpatient with OGTT, we have found that the only opportunity we have for screening less adherent patients is often while hospitalized, emphasizing the importance of a dual screening approach. This approach has allowed us to screen the majority of our patients as reflected in our overall screening rate.
One of our major challenges moving forward is to help the patients diagnosed with CFRD and their families accept yet another diagnosis and the burden of care associated with it. Our focus has shifted now to determine the best methods to motivate patients with CFRD to regularly attend endocrine clinic appointments, recognizing the challenges of additional clinic visits, monitoring, and medications. It is interesting to speculate whether improved CFRD clinical outcomes may correlate with improved screening rates. In 2012 our patients had a median HbA1c of 5.7 when the national average is 6.6 [16]. Further research is needed to delineate a possible relationship between an effective screening protocol and favorable clinical outcome measures.
Conclusion
The use of a structured process developed by a multidisciplinary team resulted in improved CFRD screening rates. In addition to outpatient protocols, it is critical to develop inpatient glucose testing protocols in order to capture patients who are only seen at times of exacerbation. Even in this era of treatment at a cellular level with correctors and potentiators, early detection and treatment of CFRD is essential for optimal clinical outcomes [1,5,17]. The next step for us is to sustain our gains and to improve endocrine care facilitation. We hope this report may guide other teams and institutional leadership in their efforts to improve identification of individuals with CFRD.
Acknowledgments: We would like to acknowledge Gautham Suresh, MD, Jennifer Abuzzahab, MD, Robert Payne, MD, and Andrew Flood, PhD, for their assistance in the preparation of our manuscript. We also acknowledge John Nash, MSW, LMSW, who provided us tools and coaching throughout the Learning and Leadership Collaborative.
Corresponding author: Lisa Read, MPH, 2525 Chicago Ave. South, MS 17-750, Minneapolis, MN 55404, lisa.read@childrensmn.org.
Funding/support. This work was supported by a grant from the Cystic Fibrosis Foundation for the Learning and Leadership Collaborative: Cystic Fibrosis-Related Diabetes Care (MCNAMA11Q10, to Dr. McNamara).
1. Moran A, Dunitz J, Nathan B, et al. Cystic fibrosis–related diabetes: current trends in prevalence, incidence, and mortality. Diabetes Care 2009;32:1626–31.
2. Cawood TJ, McKenna MJ, Gallagher CG, et al. Cystic fibrosis-related diabetes in adults. Ir Med J 2006;99:83–6.
3. Koch C, Rainisio M, Madessani U, et al. Investigators of the European Epidemiologic Registry of Cystic Fibrosis. Presence of cystic fibrosis-related diabetes mellitus tightly linked to poor lung function in patients with cystic fibrosis: data from the European Epidemiologic Registry of Cystic Fibrosis. Pediatr Pulmonol 2001;32:343–50.
4. Marshall BC, Butler SM, Stoddard M, et al. Epidemiology of cystic fibrosis-related diabetes. J Pediatr 2005;146:681–7.
5. Milla CE, Billings J, Moran A. Diabetes is associated with dramatically decreased survival in female but not male subjects with cystic fibrosis. Diabetes Care 2005;28:2141–4.
6. Lewis C, Blackman SM, Nelson A, et al. Diabetes-related mortality in adults with cystic fibrosis. Role of genotype and sex. Am J Respir Crit Care Med 2015;191:194–200.
7. Moran A, Brunzell C, Cohen, RC, et al. Clinical Care guidelines for cystic fibrosis–related diabetes. A position statement of the American Diabetes Association and a clinical practice guideline of the Cystic Fibrosis Foundation, endorsed by the Pediatric Endocrine Society. Diabetes Care 2010;33:2697–708.
8. Nash J, Messier R, Casella SJ, et al. Learning and Leadership Collaborative: CFRD. Cystic fibrosis related diabetes (CFRD) evidence-based practice and smart change idea compendium 2012. Bethesda, MD: Cystic Fibrosis Foundation; McLean, VA: Pediatric Endocrine Society; Lebanon, NH: Dartmouth Institute Microsystem Academy; May 2012.
9. WHO Expert Committee on Diabetes Mellitus: Second Report of the WHO Expert Committee on Diabetes Mellitus. Geneva: World Health Organization; 1980 (Tech. Rep. Ser no. 646).
10. Cystic Fibrosis Foundation, Dartmouth Medical School: Center for the Evaluative Clinical Sciences, Dartmouth/Hitchcock Medical Center. Action guide for accelerating improvement in cystic fibrosis care: clinical microsystems. 2006.
11. Langley GJ, Nolan KM, Nolan TW, et al. The improvement guide: a practical approach to enhancing organizational performance. San Francisco, CA: Jossey-Bass; 1996.
12. Cohen-Cymberknoh M, Blau H, Shoseyov D, et al. Intravenous monthly pulse methylprednisolone treatment for ABPA in patients with cystic fibrosis. J Cyst Fibros 2009;8:253–7.
13. Center Specific Patient Registry Report for 2011. Bethesda, MD: Cystic Fibrosis Foundation; 2012.
14. Parker VA, Wubbenhorst WH, Young GJ, et al. Implementing quality improvement in hospitals: The role of leadership and culture. Am J Med Qual 1999; 14:64–9.
15. Kern AS, Prestridge AL. Improving screening for cystic fibrosis-related diabetes at a pediatric cystic fibrosis program. Pediatrics 2013;132:e512–8.
16. Center Specific Patient Registry Report for 2012. Bethesda, MD: Cystic Fibrosis Foundation; 2013.
17. Schwarzenberg SJ, Thomas W, Olsen TW, et al. Microvascular complications in cystic fibrosis-related diabetes. Diabetes Care 2007;30:1056–61.
Evaluation of a Diabetes Care Coordination Program for African-American Women Living in Public Housing
From the University of Kansas Work Group for Community Health and Development, Lawrence, KS (Hassaballa, Schultz, Hunter-Skidmore, Fawcett, Watson-Thompson) and Whittier Street Health Center, Boston, MA (Ebekozien, Ogungbadero, Williams)
Abstract
- Objective: To examine the implementation of the Diabetes Care Coordination Program (DCCP) and its effects on diabetes-related clinical health outcomes.
- Methods: Program participants were African American women (n = 148) with type 2 diabetes who lived in public housing in Boston’s Roxbury neighborhood. Through the DCCP, Whittier Street Health Center’s clinical team provided diabetes self-management education, support, and comprehensive diabetes care using the patient-centered medical home model and Diabetes Health Ambassadors as mediators for program delivery. Core intervention components of the DCCP included: 1) diabetes self-management education, 2) support for managing diabetes and distress, 3) enhancing access and linkage to care, 4) improving quality of care, 5) community organization, mobilization, and advocacy, and 6) health system and community transformation. A participatory monitoring and evaluation system was used to document and systematically reflect on program implementation.
- Results: DCCP implementation was associated with modest improvements in diabetes-related clinical health outcomes for program participants. Results showed statistically significant improvements in HbA1c (P = 0.016), weight (P = 0.021) and diastolic blood pressure (P = 0.027).
- Conclusion: Using neighborhood Diabetes Health Ambassadors for program delivery has implications for assuring access to quality diabetes care for populations experiencing health disparities.
The growing prevalence of type 2 diabetes, with its high morbidity and excess mortality, is imposing a heavy burden on the U.S. health care system [1–3]. It has been recognized that adoption of self-management skills by the person with diabetes is necessary in order to manage their diabetes. Diabetes self-management education and support (DSME/S) provides the foundation to help people with diabetes to navigate these decisions and activities and has been shown to improve health outcomes.
Compared to the general population, African Americans are disproportionately affected by diabetes. African Americans are also less likely to seek diabetes care and have routine diabetes-related visits with a health care professional [4,5]. African Americans have higher HbA1c levels, which contribute to the increased mortality and morbidity rates among this population [6]. Furthermore, African-American women have the poorest HbA1c control as compared to other groups [4]. Concentrated poverty and lower socioeconomic status are social determinants associated with higher prevalence of diabetes [7]. Economic barriers, living conditions, and the built environment play a significant role in contributing to this health disparity [8].
In 2010, the Bristol-Myers Squibb (BMS) Foundation launched the Together on Diabetes initiative to improve the health outcomes of adult populations disproportionately affected by type 2 diabetes. In November 2010, Together on Diabetes issued a request for proposals to encourage, identify, and promote new and evidence-based approaches to empower African-American women to control their diabetes [9–11], taking into account the opportunity these women have to influence the health of their families and communities. Whittier Street Health Center in Boston received a grant to implement a program that would connect African-American women living in public housing in the Roxbury neighborhood with comprehensive diabetes management, including health education by a certified diabetes educator, nutritional counseling by a dietitian, and a tailored program of physical activity.
In this article, we describe the project and effects on diabetes-related clinical health outcomes.
Methods
Setting
Whittier Street Health Center (WSHC) is a federally qualified community health center that serves over 25,000 patients annually. The WSHC is situated in the heart of Boston’s Roxbury neighborhood, close to 5 public housing developments; 83% of WSHC patients live in public housing units. Roxbury is an underserved neighborhood with high rates of poverty, violence, and disease [12]. African Americans comprise the majority of residents living in Roxbury, making up 55.6% of the total population [13].
Diabetes Care Coordination Program
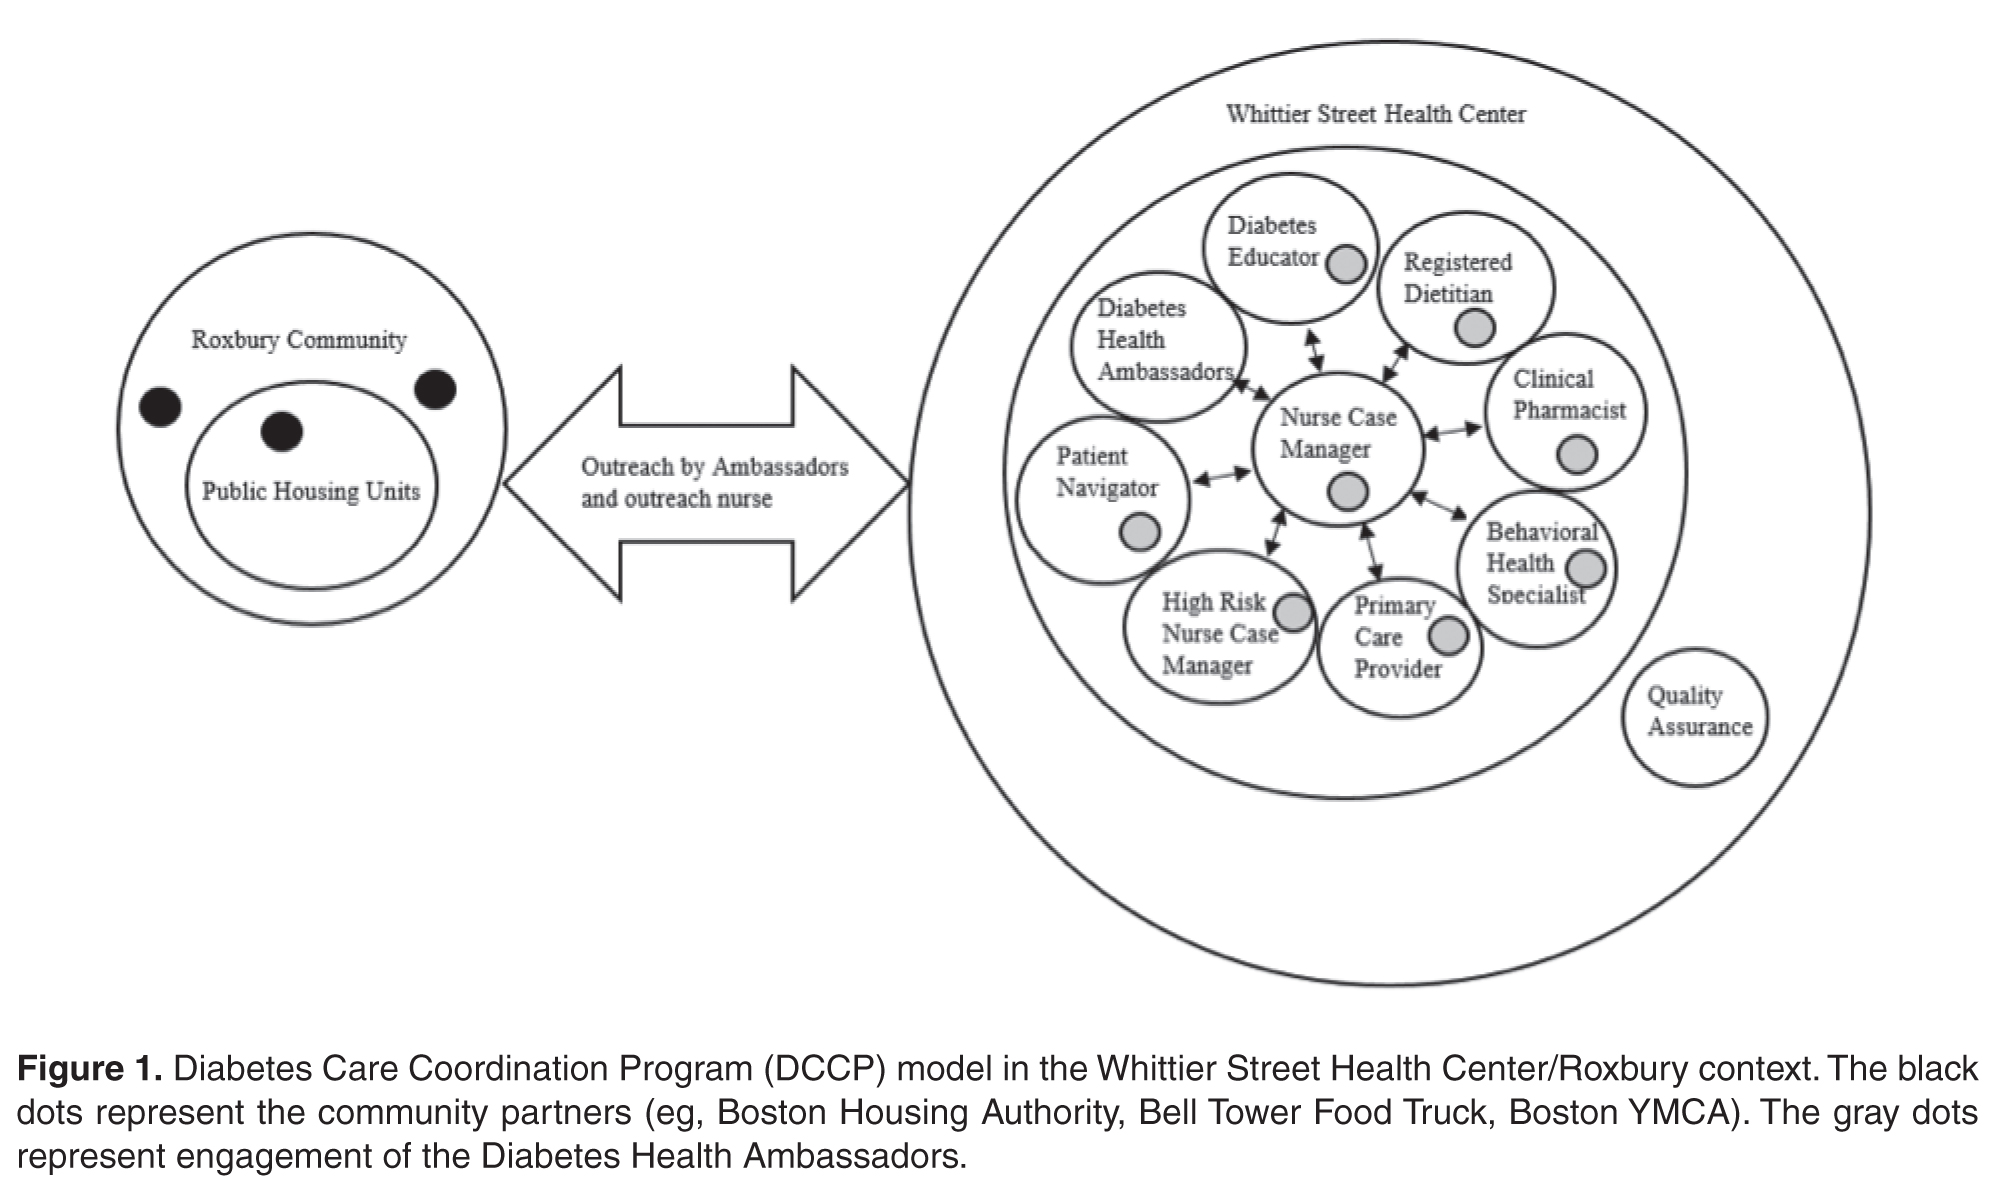
Ambassadors
Diabetes Health Ambassadors, a key component of the program, were hired to engage community members in managing their own health. Five Ambassadors were recruited and retained throughout the project period. Ambassadors were referred by their primary care provider at WSHC and interviewed for the job by the patient navigator. Ambassadors were required to be African-American women with type 2 diabetes living in a public housing unit within the Roxbury neighborhood. In addition, they were required to have their diabetes under control as defined by the WSHC clinical team (HbA1c of 8.0 or below). They also had to want to help other women control their diabetes and be able to deliver motivational presentations as well as have knowledge of available community resources.
Ambassadors received 30 hours of paid training from the certified diabetes educator. During training, they learned the definition, risk factors, and causes of diabetes, how it is controlled, and how to explain this information at a fifth-grade level. Modeling and feedback was used to assure that the information each Ambassador presented was accurate. Ambassadors were also trained on how to measure blood pressure and blood glucose levels and how to respectfully deliver the results. Additionally, Ambassadors received training on cultural competence. Ambassadors were engaged in community outreach and patient support for 20 hours per week and were compensated for their time with stipends.
Participant Recruitment and Outreach
A rolling enrollment for the DCCP began January 2012. The outreach team from the WSHC attended coffee hours at the public housing units and other community events where they conducted onsite blood pressure and glucose screenings as well as educated community members on healthy eating and active lifestyle to reduce the risks for diabetes. Mobile kits were used for testing, so participants received the test results immediately. Two Ambassadors, the outreach nurse, and the patient navigator conducted the outreach events. The set up included two tables, 6 chairs, education materials, and blood pressure and blood sugar screening materials.
Screenings were offered in the public housing units 3 times a week (twice during the week and once during the weekend). Posters in the neighborhood notifed women of the time and location of the screenings. Other settings for services such as screenings and referrals to primary care and health insurance applications included churches, mosques, community festivals, farmers markets, parks, and hair salons.
Women who had elevated glucose readings were invited to enroll in the DCCP program and an appointment at the WSHC was made for those who signed up.
During the period January 2012 to June 2013, 980 African-American women were screened for diabetes. Most screenings took place in the public housing units. Among those screened, 340 had an elevated blood glucose and were referred to WSHC for services. Of those, 175 women were recruited and enrolled into the DCCP. At the WSHC, a standardized protocol was used to measure HbA1c to confirm a diagnosis of diabetes once patients attended their first appointment. Age of participants ranged from 40 to 49. Most women were unemployed and had many competing responsibilities and stressors. Completed preassessment questionaires indicated that participants did not engage in healthy eating or physical activity as part of their daily routines prior to enrollment.
Program Components
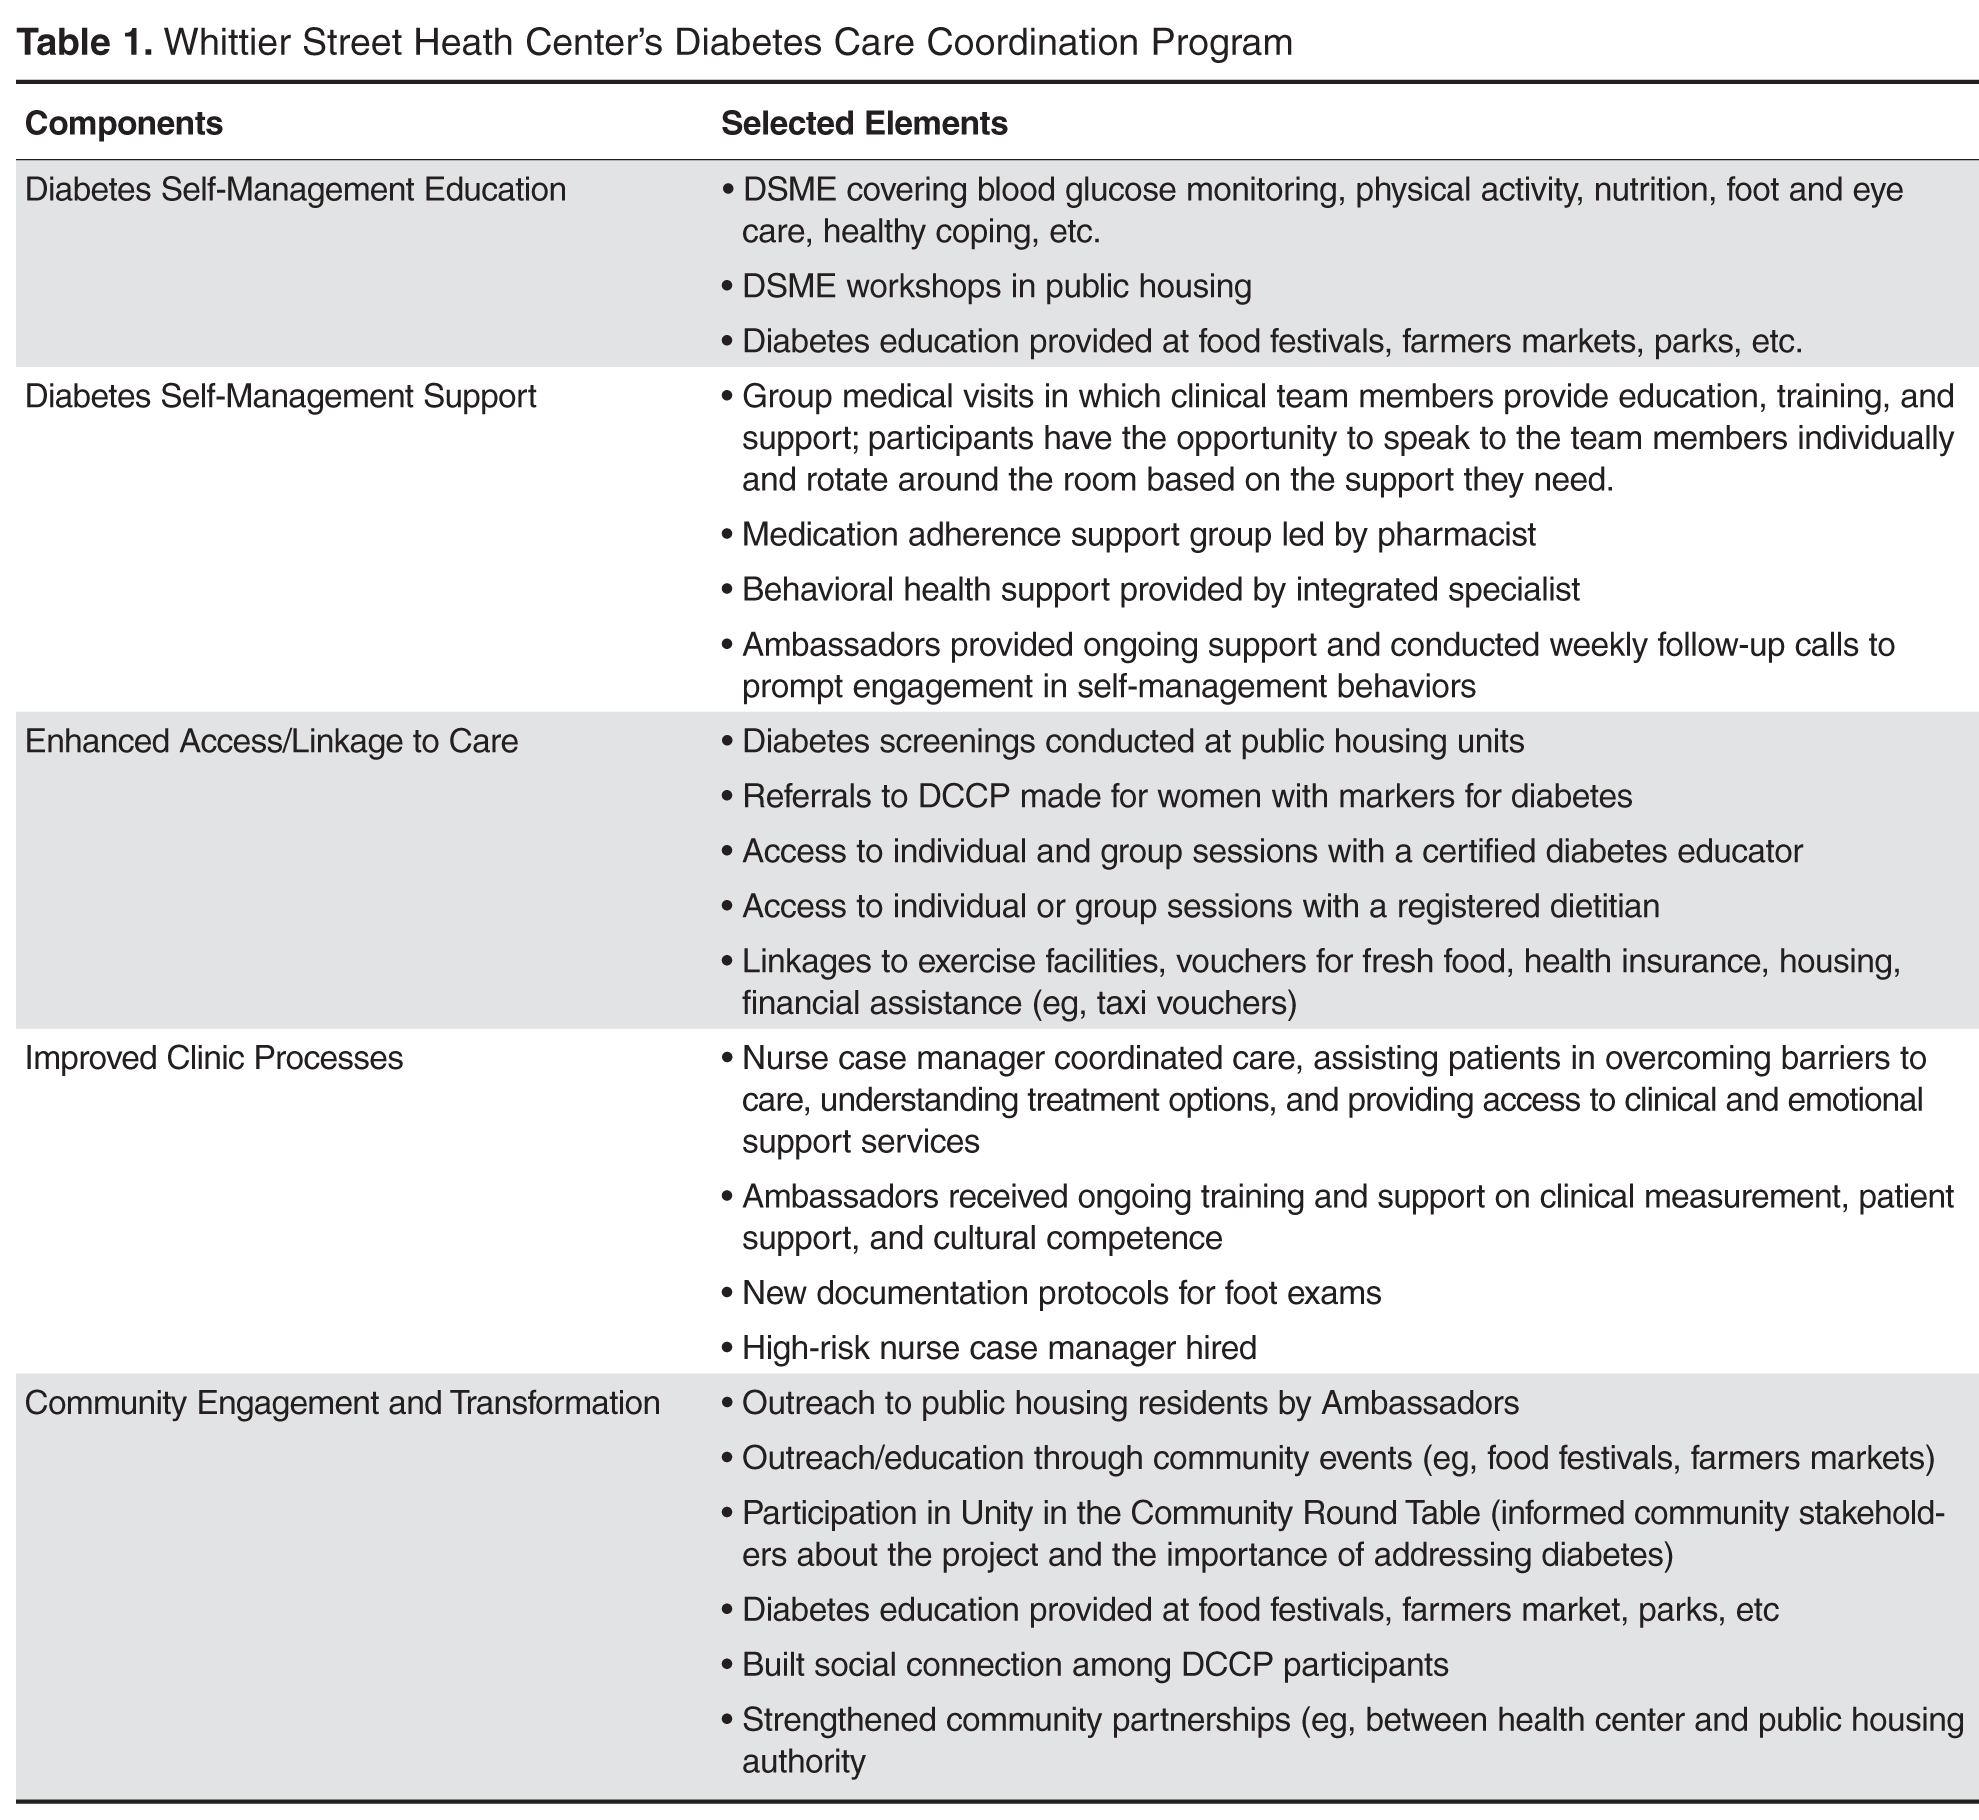
At the Center, Ambassadors spoke with program participants and inquired about their barriers to diabetes care (eg, access to food [15], health insurance, etc.) using a standardized list. Ambassadors linked program participants to community support services as needed, including health insurance enrollment, financial support, and housing support. Services were also provided in collaboration with community organizations. For example, subsidized gym memberships were available at the local YMCA and a local fitness studio, and there was an instructor at the YMCA to guide the women through physical activity routines.
Participants could attend DSME group sessions provided by the certified diabetes educator. The course met twice a week for 2 hours for a period of 6 weeks. The course was interactive and included hands-on training in blood glucose measurement and food preparation. Healthy food was offered after each session, which provided a further opportunity for participants to engage in peer-to-peer support. After the completion of the DSME course, bi-weekly support group sessions were held until program completion (June 2013). All clinical team members were present at the support group sessions, with patients rotating to speak to them to ask questions or discuss concerns related to self-management.
A part of DSME, the registered dietitian provided nutrition information and healthy cooking demonstrations for program participants within group sessions. The primary care physician met the patient once a month and kept track of clinical changes over time. Patients with HbA1c ≥ 9% were referred to the high-risk nurse case manager who worked one-on-one with program participants to help them avoid serious diabetes complications.
Ambassadors were a part of all the course and support group sessions, and when needed they attended indivdual sessions, such as doctor visits and meetings with the high-risk nurse case manager. Ambassadors accompanied program participants during visits with clinical staff to provide additional support when requested.
The manager of quality assurance assured the safety of intervention procedures and employed performance improvement methods. Program participants provided informed consent, and had the right to withdraw at any time. The Quality Assurance Committee at WSHC protected the rights of participants, assured the safety of intervention procedures, and assured the quality of care received by each participant.
Evaluation
The Work Group for Community Health and Development at the University of Kansas was selected by the BMS Foundation to evaluate the implementation and related clinical outcomes of the program using a participatory evaluation framework [16–18]. A similarly funded study used the same study approach [19]. Clinical health outcomes were analyzed through a pre-post test comparison using STATA Version 12. Paired t tests were used to examine within-patient health outcome changes. The mean interval between the pre and post measurements was 16 months. A 0.05 level of significance was used. Using a one-sided t test, Cohen’s d was computed to measure effect size.
Results
Services
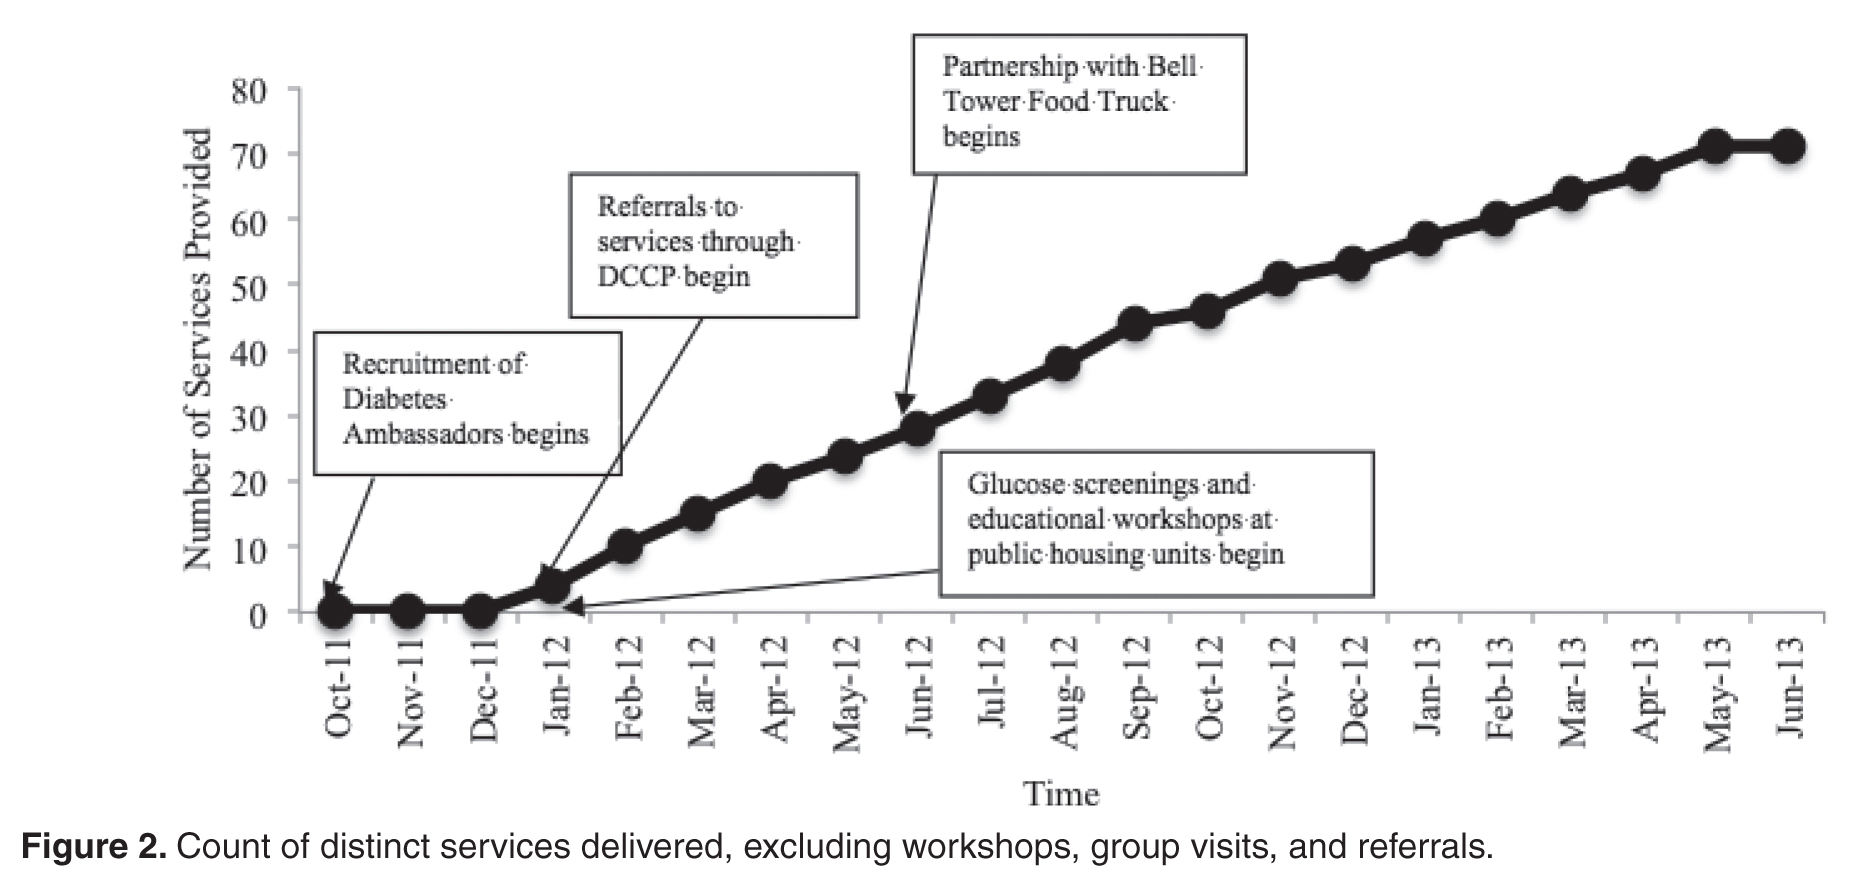
Clinical Outcomes
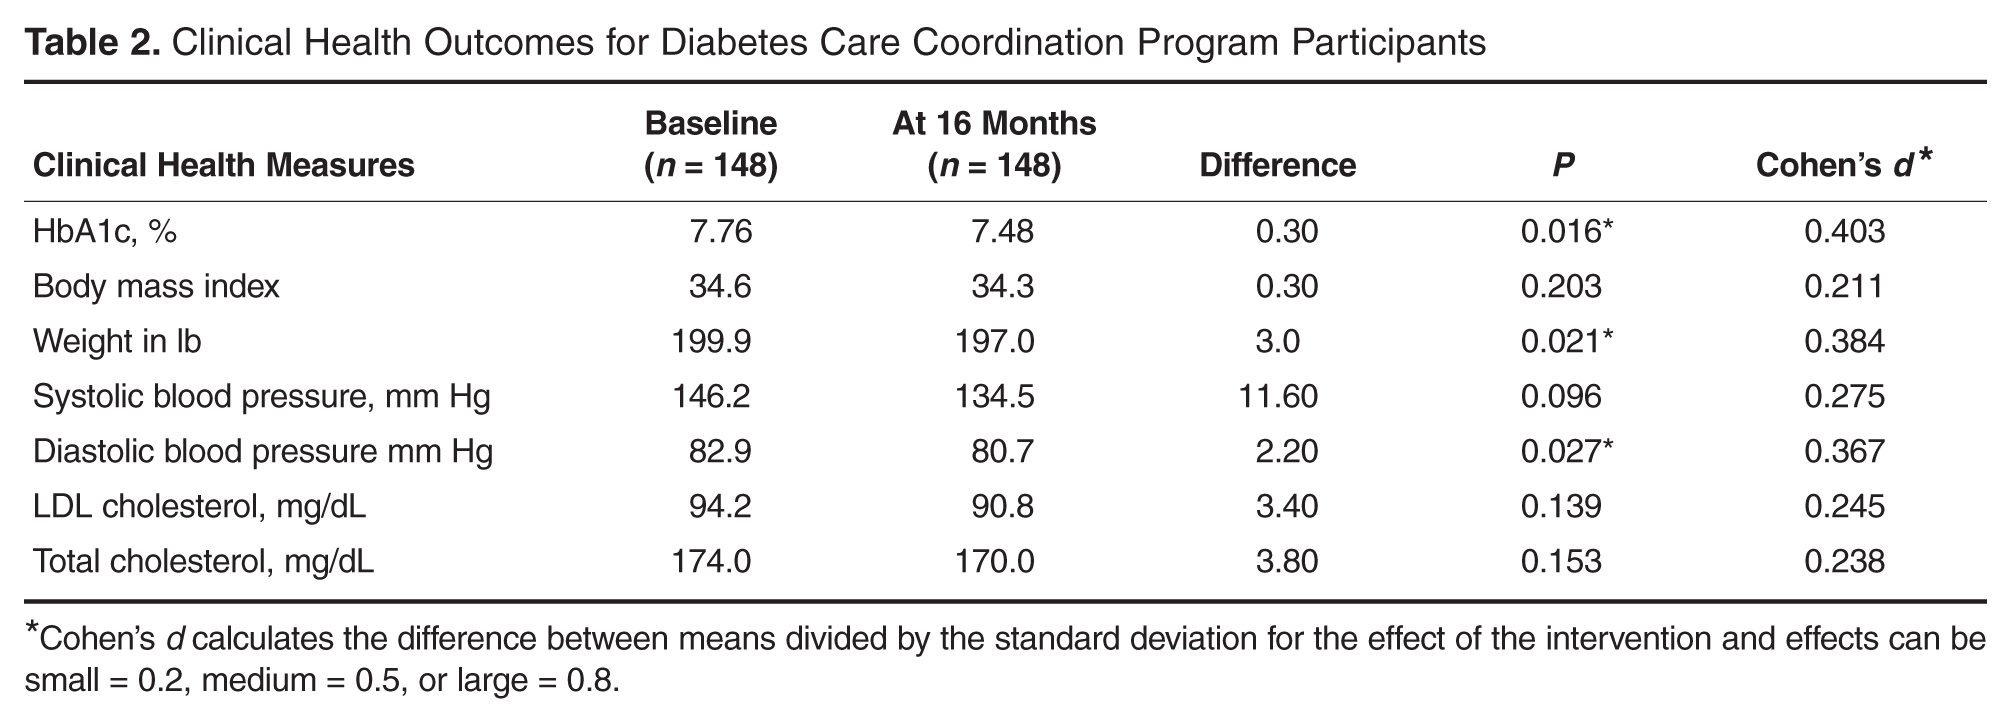
Discussion
This empirical case study examined the implementation of the Diabetes Care Coordination Program (DCCP) and its effects on diabetes-related clinical health outcomes for program participants. The program’ glucose screenings and educational workshops at public housing units provided enhanced access to diabetes care services for community members. Referrals to WSHC allowed for the provision of clinical health services through a comprehensive care model. Modest improvements in diabetes-related clinical health indicators were seen.
Some challenges were noted during implementation of the DCCP and addressed as part of a quality improvement process. First, Diabetes Health Ambassadors originally went door to door and had difficulty recruiting participants. Holding screening events in public spaces within housing units addressed this problem. Second, the WSHC team found that women needed more behavioral health support than was being provided, with some of the women reporting to their case managers that it was difficult for them to handle the stresses of life and at the same time manage their diabetes. In response, an integrated behavioral health specialist was hired to provide guidance on how to manage life stressors and how to increase health behaviors despite physical, social, and financial barriers.
Third, women reported a lack of access to fresh fruits and vegetables. In response, WSHC implemented a formal collaboration with a mobile food truck (June 2012) that sold subsidized fresh food 3 days a week to public housing residents. Fourth, participants reported some barriers related to transportation for scheduled appointments at the WSHC. The team addressed this issue by providing taxi vouchers for those who lacked adequate access to transportation. Finally, the coordinated team noticed that medication adherence was a barrier to care for many program participants. Consequently, they developed a medication management support group led by the clinical pharmacist to address barriers related to medication adherence.
There were several methodological challenges confronted in carrying out this study. First, the dose of services that were provided for each individual participant was difficult to ascertain. For example, some of those enrolled in the DCCP earlier may not have had the full set of services that were available towards the end of the program. Second, although group data were available, data on individual level outcomes were not; this made it difficult to assess whether there was change in behavior on the part of particular individuals. Third, a case study design, without a comparison group, does not control for threats to internal validity (eg, history, maturation, and attrition) that might have accounted for improvements in clinical outcomes. Finally, despite the comprehensive documentation, there could have been program elements that were implemented but not documented. Despite these methodological limitations, the case study design facilitated learning about associations between program implementation and changes in clinical health outcomes in a context of health disparities [20].
A particular strength of the program was use of Diabetes Health Ambassadors as mediators for DCCP service delivery. Ambassadors increased diabetes awareness within the community and also played a key role in building rapport and trust in the diabetes program among community members.
Lessons Learned
As part of a qualitative component, key informant interviews with WSHC staff were used to examine lessons learned during project implementation. First, an identified positive outcome was that the Ambassadors gained new insights into the management of their own diabetes and adopted additional lifestyle changes along with program participants. Second, the WSHC team affirmed that African-American women act as gatekeepers for their families, and that teaching and serving one woman allowed for teaching and serving the entire family. Program participants reported that their own lifestyle changes had an impact on other family members. For example, one participant reported she stopped purchasing soda beverages for her family. Another participant began using healthier cooking strategies, such as using olive oil instead of butter. Third, consistent with another study, the coordinated care model helped to assure comprehensive diabetes care [21]. Staff noted that “it takes a village” (a coordinated team) to address the diverse array of clinical issues needed for diabetes control. Fourth, self-management education was helpful, especially when coupled with social support from peers and family members. Fifth, working collaboratively with partners in non-health sectors was helpful in achieving the conditions needed for improved diabetes care [22].
Recommendations for Future Research and Practice
There are several recommendations for future research and practice. First, to achieve stronger clinical health outcomes, the DCCP would need to be enhanced by assuring lower caseloads for the WSHC clinical team. Second, to expand the evidence base, stronger experimental designs are needed to draw firmer conclusions about causal relationships. For instance, a multiple-baseline design across similar federally qualified heath centers could enable a better understanding of the effects of this community-based DCCP intervention in urban contexts. Third, research and practice would benefit from further testing of the model using community health workers for delivery of DSME and DSMS services. Fourth, implementation science can aid in enhancing the role of Ambassadors by providing tools/frameworks for improved delivery of services such as the core implementation components of selection and training [23]. Finally, the use of behavioral science methods can help extend the evidence base for the effects of the DCCP intervention on behavior change at the individual and the community levels [24,25].
Conclusion
This empirical case study adds to our understanding of delivering community-based diabetes care in a public housing context. This study examined the implementation and effects of a diabetes program for African-American women experiencing health disparities. The delivery of diabetes services by Diabetes Health Ambassadors was effective in engaging women with diabetes who lived in low-income housing. This study provided further evidence that coordinated diabetes care, with a focus on culturally and contextually appropriate service delivery, can have positive health outcomes. Further research is needed to examine effects of the DCCP intervention at the individual, clinic, family, and community levels.
Addressing the rapidly increasing prevalence of diabetes is a huge challenge, especially among vulnerable populations at disproportionate risk for adverse health outcomes. These patients face physical, emotional, and financial burdens. We need to assure that community health workers and coordinated clinical teams are prepared to support patients’ acquisition and maintenance of self-care behaviors. Eliminating diabetes-related disparities requires modifying the health system and the broader community environment [26]. Addressing the barriers to medical and self-care that vulnerable populations with type 2 diabetes face will provide them with greater opportunities for health and well-being.
Acknowledgments: The authors thank the many community partners throughout Boston that made this project possible.
Corresponding author: Ithar Hassaballa, KU Work Group for Community Health and Development, University of Kansas, 1000 Sunnyside Ave, 4082 Dole Center, Lawrence, KS 66045, ithar@ku.edu.
Funding/support: Funding for the Whittier Street Health Center’s Diabetes Care Coordination Program and for the evaluation of the Together on Diabetes initiative was provided by the Bristol-Myers Squibb Foundation.
Financial disclosures: None.
1. Wild S, Roglic G, Green A, Sicree R, King H. Global prevalence of diabetes: estimates for the year 2000 and projections for 2030. Diabetes Care 2004;27:1047–53.
2. Centers for Disease Control and Prevention. National diabetes statistics report: estimates of diabetes and its burden in the United States, 2014. Atlanta: U.S. Department of Health and Human Services; 2014.
3. Narayan KM, Boyle JP, Geiss LS, Saaddine JB, Thompson TJ. Impact of recent increase in incidence on future diabetes burden: U.S., 2005-2050. Diabetes Care 2006;29:2114–6.
4. Tang TS, Brown MB, Funnell MM, Anderson RM. Social support, quality of life, and self-care behaviors among African Americans with type 2 diabetes. Diabetes Educ 2008;34:266-76.
5. Crabtree K, Sherrer N, Rushton T, Willig A, Agne A, Shelton T, Cherrington A. Diabetes connect: African American men's preferences for a community-based diabetes management program. Diabetes Educ 2015;41:118-26.
6. Kirk JK, D'Agostino RB Jr, Bell RA, Passmore LV, Bonds DE, Karter AJ, Narayan KM. Disparities in HbA1c levels between African-American and non-Hispanic white adults with diabetes: a meta-analysis. Diabetes Care 2006;29:2130–6.
7. Batts ML, Gary TL, Huss K, Hill MN, Bone L, Brancati FL. Patient priorities and needs for diabetes care among urban African American adults. Diabetes Educ 2001;27:405–12.
8. Horowitz CR, Colson KA, Hebert PL, Lancaster K. Barriers to buying healthy foods for people with diabetes: evidence of environmental disparities. Am J Public Health 2004;94:1549–54.
9. Haas L, Maryniuk M, Beck J, et al; 2012 Standards Revision Task Force. National standards for diabetes self-management education and support. Diabetes Care 2013;36 Suppl 1:S100–8.
10. Cené CW, Haymore LB, Ellis D, Whitaker S, Henderson S, Lin FC, Corbie-Smith G. Implementation of the power to prevent diabetes prevention educational curriculum into rural African American communities: a feasibility study. Diabetes Educ 2013;39:776–85.
11. Feathers JT, Kieffer EC, Palmisano G, et al. The development, implementation, and process evaluation of the REACH Detroit Partnership's Diabetes Lifestyle Intervention. Diabetes Educ 2007;33:509–20.
12. Rahman S, Hu H, McNeely E, et al. Social and environmental risk factors for hypertension in African Americans. Fla Public Health Rev 2008;5:64–72.
13. US Bureau of the Census. Available at www.cityofboston.gov/dnd/PDR/Maps_and_Neighborhood_Profiles.asp.
14. Reid RJ, Coleman K, Johnson EA, Fishman PA, Hsu C, Soman MP, Trescott CE, Erikson M, Larson EB. The Group Health medical home at year two: cost savings, higher patient satisfaction, and less burnout for providers. Health Aff (Millwood) 2010;29:835–43.
15. Fulp RS, McManus KD, Johnson PA. Barriers to purchasing foods for a high-quality, healthy diet in a low-income African American community. Fam Community Health 2009;32:206–17.
16. Fawcett SB, Schultz JA. Supporting participatory evaluation using the Community Tool Box online documentation system. Community-Based Participatory Research for Health. San Francisco: Jossey-Bass; 2008: 419–23.
17. Collie-Akers V, Schultz JA, Carson V, Fawcett SB, Ronan M. REACH 2010: Kansas City, Missouri evaluating mobilization strategies with neighborhood and faith organizations to reduce risk for health disparities. Health Prom Pract 2009;10(Suppl 2):118S–127S.
18. Fawcett SB, Boothroyd R, Schultz JA, Francisco VT, Carson V, Bremby R. Building capacity for participatory evaluation within community initiatives. J Prev Interven Comm 2003;26:21–36.
19. Sepers CE Jr, Fawcett SB, Lipman R, Schultz J, Colie-Akers V, Perez A. Measuring the implementation and effects of a coordinated care model featuring diabetes self-management education within four patient-centered medical homes. Diabetes Educ 2015;41:328–42.
20. Yin RK. Case study research: Design and methods. Sage; 2013.
21. Mead H, Andres E, Regenstein M. Underserved patients' perspectives on patient-centered primary care: does the patient-centered medical home model meet their needs? Med Care Res Rev 2014;71:61–84.
22. Fawcett S, Schultz J, Watson-Thompson J, Fox M, Bremby R. Building multisectoral partnerships for population health and health equity. Prev Chronic Disease 2010;7:A118. Epub 2010 Oct 15.
23. Fixsen DL, Blase KA, Naoom SF, Wallace F. Core implementation components. Res Soc Work Prac 2009; 19:531–540.
24. Cooper JO, Heron TE, Heward WL. Applied behavior analysis. 2nd ed. Pearson; 2007.
25. Glanz K, Bishop DB. The role of behavioral science theory in development and implementation of public health interventions. Annu Rev Public Health 2010;31:399–418.
26. Jack L, Jack NH, Hayes SC. Social determinants of health in minority populations: a call for multidisciplinary approaches to eliminate diabetes-related health disparities. Diabetes Spectrum 2012;25:9–13.
From the University of Kansas Work Group for Community Health and Development, Lawrence, KS (Hassaballa, Schultz, Hunter-Skidmore, Fawcett, Watson-Thompson) and Whittier Street Health Center, Boston, MA (Ebekozien, Ogungbadero, Williams)
Abstract
- Objective: To examine the implementation of the Diabetes Care Coordination Program (DCCP) and its effects on diabetes-related clinical health outcomes.
- Methods: Program participants were African American women (n = 148) with type 2 diabetes who lived in public housing in Boston’s Roxbury neighborhood. Through the DCCP, Whittier Street Health Center’s clinical team provided diabetes self-management education, support, and comprehensive diabetes care using the patient-centered medical home model and Diabetes Health Ambassadors as mediators for program delivery. Core intervention components of the DCCP included: 1) diabetes self-management education, 2) support for managing diabetes and distress, 3) enhancing access and linkage to care, 4) improving quality of care, 5) community organization, mobilization, and advocacy, and 6) health system and community transformation. A participatory monitoring and evaluation system was used to document and systematically reflect on program implementation.
- Results: DCCP implementation was associated with modest improvements in diabetes-related clinical health outcomes for program participants. Results showed statistically significant improvements in HbA1c (P = 0.016), weight (P = 0.021) and diastolic blood pressure (P = 0.027).
- Conclusion: Using neighborhood Diabetes Health Ambassadors for program delivery has implications for assuring access to quality diabetes care for populations experiencing health disparities.
The growing prevalence of type 2 diabetes, with its high morbidity and excess mortality, is imposing a heavy burden on the U.S. health care system [1–3]. It has been recognized that adoption of self-management skills by the person with diabetes is necessary in order to manage their diabetes. Diabetes self-management education and support (DSME/S) provides the foundation to help people with diabetes to navigate these decisions and activities and has been shown to improve health outcomes.
Compared to the general population, African Americans are disproportionately affected by diabetes. African Americans are also less likely to seek diabetes care and have routine diabetes-related visits with a health care professional [4,5]. African Americans have higher HbA1c levels, which contribute to the increased mortality and morbidity rates among this population [6]. Furthermore, African-American women have the poorest HbA1c control as compared to other groups [4]. Concentrated poverty and lower socioeconomic status are social determinants associated with higher prevalence of diabetes [7]. Economic barriers, living conditions, and the built environment play a significant role in contributing to this health disparity [8].
In 2010, the Bristol-Myers Squibb (BMS) Foundation launched the Together on Diabetes initiative to improve the health outcomes of adult populations disproportionately affected by type 2 diabetes. In November 2010, Together on Diabetes issued a request for proposals to encourage, identify, and promote new and evidence-based approaches to empower African-American women to control their diabetes [9–11], taking into account the opportunity these women have to influence the health of their families and communities. Whittier Street Health Center in Boston received a grant to implement a program that would connect African-American women living in public housing in the Roxbury neighborhood with comprehensive diabetes management, including health education by a certified diabetes educator, nutritional counseling by a dietitian, and a tailored program of physical activity.
In this article, we describe the project and effects on diabetes-related clinical health outcomes.
Methods
Setting
Whittier Street Health Center (WSHC) is a federally qualified community health center that serves over 25,000 patients annually. The WSHC is situated in the heart of Boston’s Roxbury neighborhood, close to 5 public housing developments; 83% of WSHC patients live in public housing units. Roxbury is an underserved neighborhood with high rates of poverty, violence, and disease [12]. African Americans comprise the majority of residents living in Roxbury, making up 55.6% of the total population [13].
Diabetes Care Coordination Program
Ambassadors
Diabetes Health Ambassadors, a key component of the program, were hired to engage community members in managing their own health. Five Ambassadors were recruited and retained throughout the project period. Ambassadors were referred by their primary care provider at WSHC and interviewed for the job by the patient navigator. Ambassadors were required to be African-American women with type 2 diabetes living in a public housing unit within the Roxbury neighborhood. In addition, they were required to have their diabetes under control as defined by the WSHC clinical team (HbA1c of 8.0 or below). They also had to want to help other women control their diabetes and be able to deliver motivational presentations as well as have knowledge of available community resources.
Ambassadors received 30 hours of paid training from the certified diabetes educator. During training, they learned the definition, risk factors, and causes of diabetes, how it is controlled, and how to explain this information at a fifth-grade level. Modeling and feedback was used to assure that the information each Ambassador presented was accurate. Ambassadors were also trained on how to measure blood pressure and blood glucose levels and how to respectfully deliver the results. Additionally, Ambassadors received training on cultural competence. Ambassadors were engaged in community outreach and patient support for 20 hours per week and were compensated for their time with stipends.
Participant Recruitment and Outreach
A rolling enrollment for the DCCP began January 2012. The outreach team from the WSHC attended coffee hours at the public housing units and other community events where they conducted onsite blood pressure and glucose screenings as well as educated community members on healthy eating and active lifestyle to reduce the risks for diabetes. Mobile kits were used for testing, so participants received the test results immediately. Two Ambassadors, the outreach nurse, and the patient navigator conducted the outreach events. The set up included two tables, 6 chairs, education materials, and blood pressure and blood sugar screening materials.
Screenings were offered in the public housing units 3 times a week (twice during the week and once during the weekend). Posters in the neighborhood notifed women of the time and location of the screenings. Other settings for services such as screenings and referrals to primary care and health insurance applications included churches, mosques, community festivals, farmers markets, parks, and hair salons.
Women who had elevated glucose readings were invited to enroll in the DCCP program and an appointment at the WSHC was made for those who signed up.
During the period January 2012 to June 2013, 980 African-American women were screened for diabetes. Most screenings took place in the public housing units. Among those screened, 340 had an elevated blood glucose and were referred to WSHC for services. Of those, 175 women were recruited and enrolled into the DCCP. At the WSHC, a standardized protocol was used to measure HbA1c to confirm a diagnosis of diabetes once patients attended their first appointment. Age of participants ranged from 40 to 49. Most women were unemployed and had many competing responsibilities and stressors. Completed preassessment questionaires indicated that participants did not engage in healthy eating or physical activity as part of their daily routines prior to enrollment.
Program Components
At the Center, Ambassadors spoke with program participants and inquired about their barriers to diabetes care (eg, access to food [15], health insurance, etc.) using a standardized list. Ambassadors linked program participants to community support services as needed, including health insurance enrollment, financial support, and housing support. Services were also provided in collaboration with community organizations. For example, subsidized gym memberships were available at the local YMCA and a local fitness studio, and there was an instructor at the YMCA to guide the women through physical activity routines.
Participants could attend DSME group sessions provided by the certified diabetes educator. The course met twice a week for 2 hours for a period of 6 weeks. The course was interactive and included hands-on training in blood glucose measurement and food preparation. Healthy food was offered after each session, which provided a further opportunity for participants to engage in peer-to-peer support. After the completion of the DSME course, bi-weekly support group sessions were held until program completion (June 2013). All clinical team members were present at the support group sessions, with patients rotating to speak to them to ask questions or discuss concerns related to self-management.
A part of DSME, the registered dietitian provided nutrition information and healthy cooking demonstrations for program participants within group sessions. The primary care physician met the patient once a month and kept track of clinical changes over time. Patients with HbA1c ≥ 9% were referred to the high-risk nurse case manager who worked one-on-one with program participants to help them avoid serious diabetes complications.
Ambassadors were a part of all the course and support group sessions, and when needed they attended indivdual sessions, such as doctor visits and meetings with the high-risk nurse case manager. Ambassadors accompanied program participants during visits with clinical staff to provide additional support when requested.
The manager of quality assurance assured the safety of intervention procedures and employed performance improvement methods. Program participants provided informed consent, and had the right to withdraw at any time. The Quality Assurance Committee at WSHC protected the rights of participants, assured the safety of intervention procedures, and assured the quality of care received by each participant.
Evaluation
The Work Group for Community Health and Development at the University of Kansas was selected by the BMS Foundation to evaluate the implementation and related clinical outcomes of the program using a participatory evaluation framework [16–18]. A similarly funded study used the same study approach [19]. Clinical health outcomes were analyzed through a pre-post test comparison using STATA Version 12. Paired t tests were used to examine within-patient health outcome changes. The mean interval between the pre and post measurements was 16 months. A 0.05 level of significance was used. Using a one-sided t test, Cohen’s d was computed to measure effect size.
Results
Services
Clinical Outcomes
Discussion
This empirical case study examined the implementation of the Diabetes Care Coordination Program (DCCP) and its effects on diabetes-related clinical health outcomes for program participants. The program’ glucose screenings and educational workshops at public housing units provided enhanced access to diabetes care services for community members. Referrals to WSHC allowed for the provision of clinical health services through a comprehensive care model. Modest improvements in diabetes-related clinical health indicators were seen.
Some challenges were noted during implementation of the DCCP and addressed as part of a quality improvement process. First, Diabetes Health Ambassadors originally went door to door and had difficulty recruiting participants. Holding screening events in public spaces within housing units addressed this problem. Second, the WSHC team found that women needed more behavioral health support than was being provided, with some of the women reporting to their case managers that it was difficult for them to handle the stresses of life and at the same time manage their diabetes. In response, an integrated behavioral health specialist was hired to provide guidance on how to manage life stressors and how to increase health behaviors despite physical, social, and financial barriers.
Third, women reported a lack of access to fresh fruits and vegetables. In response, WSHC implemented a formal collaboration with a mobile food truck (June 2012) that sold subsidized fresh food 3 days a week to public housing residents. Fourth, participants reported some barriers related to transportation for scheduled appointments at the WSHC. The team addressed this issue by providing taxi vouchers for those who lacked adequate access to transportation. Finally, the coordinated team noticed that medication adherence was a barrier to care for many program participants. Consequently, they developed a medication management support group led by the clinical pharmacist to address barriers related to medication adherence.
There were several methodological challenges confronted in carrying out this study. First, the dose of services that were provided for each individual participant was difficult to ascertain. For example, some of those enrolled in the DCCP earlier may not have had the full set of services that were available towards the end of the program. Second, although group data were available, data on individual level outcomes were not; this made it difficult to assess whether there was change in behavior on the part of particular individuals. Third, a case study design, without a comparison group, does not control for threats to internal validity (eg, history, maturation, and attrition) that might have accounted for improvements in clinical outcomes. Finally, despite the comprehensive documentation, there could have been program elements that were implemented but not documented. Despite these methodological limitations, the case study design facilitated learning about associations between program implementation and changes in clinical health outcomes in a context of health disparities [20].
A particular strength of the program was use of Diabetes Health Ambassadors as mediators for DCCP service delivery. Ambassadors increased diabetes awareness within the community and also played a key role in building rapport and trust in the diabetes program among community members.
Lessons Learned
As part of a qualitative component, key informant interviews with WSHC staff were used to examine lessons learned during project implementation. First, an identified positive outcome was that the Ambassadors gained new insights into the management of their own diabetes and adopted additional lifestyle changes along with program participants. Second, the WSHC team affirmed that African-American women act as gatekeepers for their families, and that teaching and serving one woman allowed for teaching and serving the entire family. Program participants reported that their own lifestyle changes had an impact on other family members. For example, one participant reported she stopped purchasing soda beverages for her family. Another participant began using healthier cooking strategies, such as using olive oil instead of butter. Third, consistent with another study, the coordinated care model helped to assure comprehensive diabetes care [21]. Staff noted that “it takes a village” (a coordinated team) to address the diverse array of clinical issues needed for diabetes control. Fourth, self-management education was helpful, especially when coupled with social support from peers and family members. Fifth, working collaboratively with partners in non-health sectors was helpful in achieving the conditions needed for improved diabetes care [22].
Recommendations for Future Research and Practice
There are several recommendations for future research and practice. First, to achieve stronger clinical health outcomes, the DCCP would need to be enhanced by assuring lower caseloads for the WSHC clinical team. Second, to expand the evidence base, stronger experimental designs are needed to draw firmer conclusions about causal relationships. For instance, a multiple-baseline design across similar federally qualified heath centers could enable a better understanding of the effects of this community-based DCCP intervention in urban contexts. Third, research and practice would benefit from further testing of the model using community health workers for delivery of DSME and DSMS services. Fourth, implementation science can aid in enhancing the role of Ambassadors by providing tools/frameworks for improved delivery of services such as the core implementation components of selection and training [23]. Finally, the use of behavioral science methods can help extend the evidence base for the effects of the DCCP intervention on behavior change at the individual and the community levels [24,25].
Conclusion
This empirical case study adds to our understanding of delivering community-based diabetes care in a public housing context. This study examined the implementation and effects of a diabetes program for African-American women experiencing health disparities. The delivery of diabetes services by Diabetes Health Ambassadors was effective in engaging women with diabetes who lived in low-income housing. This study provided further evidence that coordinated diabetes care, with a focus on culturally and contextually appropriate service delivery, can have positive health outcomes. Further research is needed to examine effects of the DCCP intervention at the individual, clinic, family, and community levels.
Addressing the rapidly increasing prevalence of diabetes is a huge challenge, especially among vulnerable populations at disproportionate risk for adverse health outcomes. These patients face physical, emotional, and financial burdens. We need to assure that community health workers and coordinated clinical teams are prepared to support patients’ acquisition and maintenance of self-care behaviors. Eliminating diabetes-related disparities requires modifying the health system and the broader community environment [26]. Addressing the barriers to medical and self-care that vulnerable populations with type 2 diabetes face will provide them with greater opportunities for health and well-being.
Acknowledgments: The authors thank the many community partners throughout Boston that made this project possible.
Corresponding author: Ithar Hassaballa, KU Work Group for Community Health and Development, University of Kansas, 1000 Sunnyside Ave, 4082 Dole Center, Lawrence, KS 66045, ithar@ku.edu.
Funding/support: Funding for the Whittier Street Health Center’s Diabetes Care Coordination Program and for the evaluation of the Together on Diabetes initiative was provided by the Bristol-Myers Squibb Foundation.
Financial disclosures: None.
1. Wild S, Roglic G, Green A, Sicree R, King H. Global prevalence of diabetes: estimates for the year 2000 and projections for 2030. Diabetes Care 2004;27:1047–53.
2. Centers for Disease Control and Prevention. National diabetes statistics report: estimates of diabetes and its burden in the United States, 2014. Atlanta: U.S. Department of Health and Human Services; 2014.
3. Narayan KM, Boyle JP, Geiss LS, Saaddine JB, Thompson TJ. Impact of recent increase in incidence on future diabetes burden: U.S., 2005-2050. Diabetes Care 2006;29:2114–6.
4. Tang TS, Brown MB, Funnell MM, Anderson RM. Social support, quality of life, and self-care behaviors among African Americans with type 2 diabetes. Diabetes Educ 2008;34:266-76.
5. Crabtree K, Sherrer N, Rushton T, Willig A, Agne A, Shelton T, Cherrington A. Diabetes connect: African American men's preferences for a community-based diabetes management program. Diabetes Educ 2015;41:118-26.
6. Kirk JK, D'Agostino RB Jr, Bell RA, Passmore LV, Bonds DE, Karter AJ, Narayan KM. Disparities in HbA1c levels between African-American and non-Hispanic white adults with diabetes: a meta-analysis. Diabetes Care 2006;29:2130–6.
7. Batts ML, Gary TL, Huss K, Hill MN, Bone L, Brancati FL. Patient priorities and needs for diabetes care among urban African American adults. Diabetes Educ 2001;27:405–12.
8. Horowitz CR, Colson KA, Hebert PL, Lancaster K. Barriers to buying healthy foods for people with diabetes: evidence of environmental disparities. Am J Public Health 2004;94:1549–54.
9. Haas L, Maryniuk M, Beck J, et al; 2012 Standards Revision Task Force. National standards for diabetes self-management education and support. Diabetes Care 2013;36 Suppl 1:S100–8.
10. Cené CW, Haymore LB, Ellis D, Whitaker S, Henderson S, Lin FC, Corbie-Smith G. Implementation of the power to prevent diabetes prevention educational curriculum into rural African American communities: a feasibility study. Diabetes Educ 2013;39:776–85.
11. Feathers JT, Kieffer EC, Palmisano G, et al. The development, implementation, and process evaluation of the REACH Detroit Partnership's Diabetes Lifestyle Intervention. Diabetes Educ 2007;33:509–20.
12. Rahman S, Hu H, McNeely E, et al. Social and environmental risk factors for hypertension in African Americans. Fla Public Health Rev 2008;5:64–72.
13. US Bureau of the Census. Available at www.cityofboston.gov/dnd/PDR/Maps_and_Neighborhood_Profiles.asp.
14. Reid RJ, Coleman K, Johnson EA, Fishman PA, Hsu C, Soman MP, Trescott CE, Erikson M, Larson EB. The Group Health medical home at year two: cost savings, higher patient satisfaction, and less burnout for providers. Health Aff (Millwood) 2010;29:835–43.
15. Fulp RS, McManus KD, Johnson PA. Barriers to purchasing foods for a high-quality, healthy diet in a low-income African American community. Fam Community Health 2009;32:206–17.
16. Fawcett SB, Schultz JA. Supporting participatory evaluation using the Community Tool Box online documentation system. Community-Based Participatory Research for Health. San Francisco: Jossey-Bass; 2008: 419–23.
17. Collie-Akers V, Schultz JA, Carson V, Fawcett SB, Ronan M. REACH 2010: Kansas City, Missouri evaluating mobilization strategies with neighborhood and faith organizations to reduce risk for health disparities. Health Prom Pract 2009;10(Suppl 2):118S–127S.
18. Fawcett SB, Boothroyd R, Schultz JA, Francisco VT, Carson V, Bremby R. Building capacity for participatory evaluation within community initiatives. J Prev Interven Comm 2003;26:21–36.
19. Sepers CE Jr, Fawcett SB, Lipman R, Schultz J, Colie-Akers V, Perez A. Measuring the implementation and effects of a coordinated care model featuring diabetes self-management education within four patient-centered medical homes. Diabetes Educ 2015;41:328–42.
20. Yin RK. Case study research: Design and methods. Sage; 2013.
21. Mead H, Andres E, Regenstein M. Underserved patients' perspectives on patient-centered primary care: does the patient-centered medical home model meet their needs? Med Care Res Rev 2014;71:61–84.
22. Fawcett S, Schultz J, Watson-Thompson J, Fox M, Bremby R. Building multisectoral partnerships for population health and health equity. Prev Chronic Disease 2010;7:A118. Epub 2010 Oct 15.
23. Fixsen DL, Blase KA, Naoom SF, Wallace F. Core implementation components. Res Soc Work Prac 2009; 19:531–540.
24. Cooper JO, Heron TE, Heward WL. Applied behavior analysis. 2nd ed. Pearson; 2007.
25. Glanz K, Bishop DB. The role of behavioral science theory in development and implementation of public health interventions. Annu Rev Public Health 2010;31:399–418.
26. Jack L, Jack NH, Hayes SC. Social determinants of health in minority populations: a call for multidisciplinary approaches to eliminate diabetes-related health disparities. Diabetes Spectrum 2012;25:9–13.
Optimizing Inpatient Pharmacotherapy Using a Single Clinical Policy Streamlining Pharmacy Protocols
From the Ernest Mario School of Pharmacy, Rutgers, The State University of New Jersey, Piscataway, NJ.
Abstract
- Objectives: To describe the implementation of broadly scoped clinical pharmacy protocols positioned as a singular policy in a community hospital. These protocols were designed to expand the established benefits demonstrated using narrower, traditional protocols.
- Methods: A retrospective chart review of protocol interventions in the first year of the policy’s implementation was conducted to evaluate prescriber acceptance of protocol interventions. Interventions were identified from required email notifications. The frequency of use of each protocol was assessed, including evaluation of novel characteristics of specific protocols. Pharmacist utilization patterns were assessed for job classification, shift, and practice setting (ie, centralized or decentralized).
- Results: In the 1-year assessment period, 145 interventions were reported and 144 were accepted by the prescribing physicians. Interventions involved orders from hospitalists and intensivists most frequently, with the renal dosing and dose formulations protocols being the most commonly utilized. Staff pharmacists used the policy more frequently than clinical pharmacists, primarily during day shift from decentralized locations on the patient care units.
- Conclusions: The implementation of broadly scoped clinical pharmacy protocols for items our pharmacists routinely contact physicians about (and our physicians deemed were within the practice of pharmacy) instituted a cultural shift that expanded the elements considered to be part of routine pharmacy practice. As a result, pharmacists more seamlessly applied their expertise as pharmacotherapy specialists to optimize pharmacotherapy, which streamlined workflow for both pharmacists and physicians. This expanded the proven benefits of allowing professionals to work to their fullest extent, as established in the literature.
Allowing pharmacists to apply their expertise has been associated with improved outcomes in both pharmacotherapy quality (eg, reduction in mortality and length of stay [1]) and savings in health care dollars. Studies of focused protocols, including intravenous-to-oral (IV-to-PO) switch [2–20], renal dosing [21], stress ulcer prophylaxis [22] and anticoagulation management [1,23,24] demonstrate these benefits in a multitude of practice areas. While such protocols have become commonplace in the acute care setting [25–28], most continue to be singularly focused and impose patient population restrictions that preclude comprehensive patient evaluation. Many are administered as a task within the pharmacist workflow using a patient list generated by the limited protocol criteria, which are often restricted to agent or patient characteristics.
Better outcomes are associated with permitting professionals such as pharmacists to work to the fullest extent of their scope and expertise [29–31]. In specific cases, studies evaluating pharmacists’ impact within a multi-disciplinary health care team have demonstrated improved outcomes in regard to both patient care and cost [29–31]. Recognizing this, accountable care organizations (ACOs) have developed practice models that are based on this benefit. Each team member is expected to robustly apply their training and expertise to achieve the best outcomes [32,33]. As health care moves toward a more integrative approach, it is paramount that pharmacists utilize the full scope of the skills in which they are trained.
This report describes the development, implementation, and outcomes of a singular policy outlining comprehensively scoped protocols allowing acute care hospital pharmacists within Princeton HealthCare System to optimize pharmacotherapy during the course of their usual clinical practice.
Methods
Setting
The University Medical Center of Princeton at Plainsboro (UMCPP), part of the Princeton HealthCare System, is a 230-bed community acute care hospital located in central New Jersey. The hospital facility relocated in May 2012 from its previous location in Princeton to a new state-of-the-art facility in Plainsboro. As an affiliate of the Robert Wood Johnson Medical School and the Ernest Mario School of Pharmacy at Rutgers, The State University of New Jersey (ie, Rutgers), it is an academic teaching hospital with a mixed model for providing patient care. UMCPP employs both faculty physicians leading academic teams alongside hospitalists and private attendings.
Pharmacy services are provided on facility 24 hours a day, 365 days a year. The department of pharmacy services provides a full scope medication services from a centralized location with 3 full-time day pharmacists and 1 oncology satellite pharmacist. During weekdays, decentralized pharmacists provide medication review, patient education, and medication reconciliation on 2 to 3 inpatient care units. Centralized support decreases to 2 pharmacists in the evening and 1 overnight. Clinical pharmacists, both hospital-based and Rutgers faculty, work in conjunction with the staff pharmacists to ensure appropriate management of patients throughout different levels of care.
Program Overview and Implementation
To enhance protocols allowing pharmacists to more holistically and robustly optimize pharmacotherapy, UMCPP implemented the Clinical Pharmacy Services policy in February 2012. The policy outlined 8 protocols through which registered pharmacists within the acute care hospital could implement outlined medication order adjustments for adults of inpatient status. Pediatric patients or those treated outside of the acute care hospital (eg, in the psychiatric hospital, surgical center or outpatient facilities) were excluded. While the hospital had existing traditional programs such as IV-to-PO conversions, the programs were restricted to specific agents or conditions. As such, pharmacists were assigned to review queues in the clinical computer system to which orders for the agents outlined by the specific program would flow. Review would occur at set intervals and focus on that detail of the patient’s care as opposed to broadly encompassing an evaluation of the patient’s comprehensive pharmacotherapy. The goal of the new policy was to better utilize the pharmacists’ expertise by broadening these assessments to all applicable agents, refine workflow (by allowing protocol management instead of requiring individual prescriber calls for each issue) and integrate holistic refinement of pharmacotherapy regimens during the usual course of the pharmacist’s clinical care.
In the state of New Jersey, the Pharmacy Practice Act (updated on 14 January 2004) formally recognizes pharmacists as health care professionals and permits for collaborative practice in the community setting [34]. However, pharmacist management by protocol in the acute care hospital setting is defined separately, requiring only medical approvals within the system [35]. In accordance, the policy and associated protocols were approved by the institution’s multidisciplinary pharmacy and therapeutics (P&T) and medical executive committee processes.
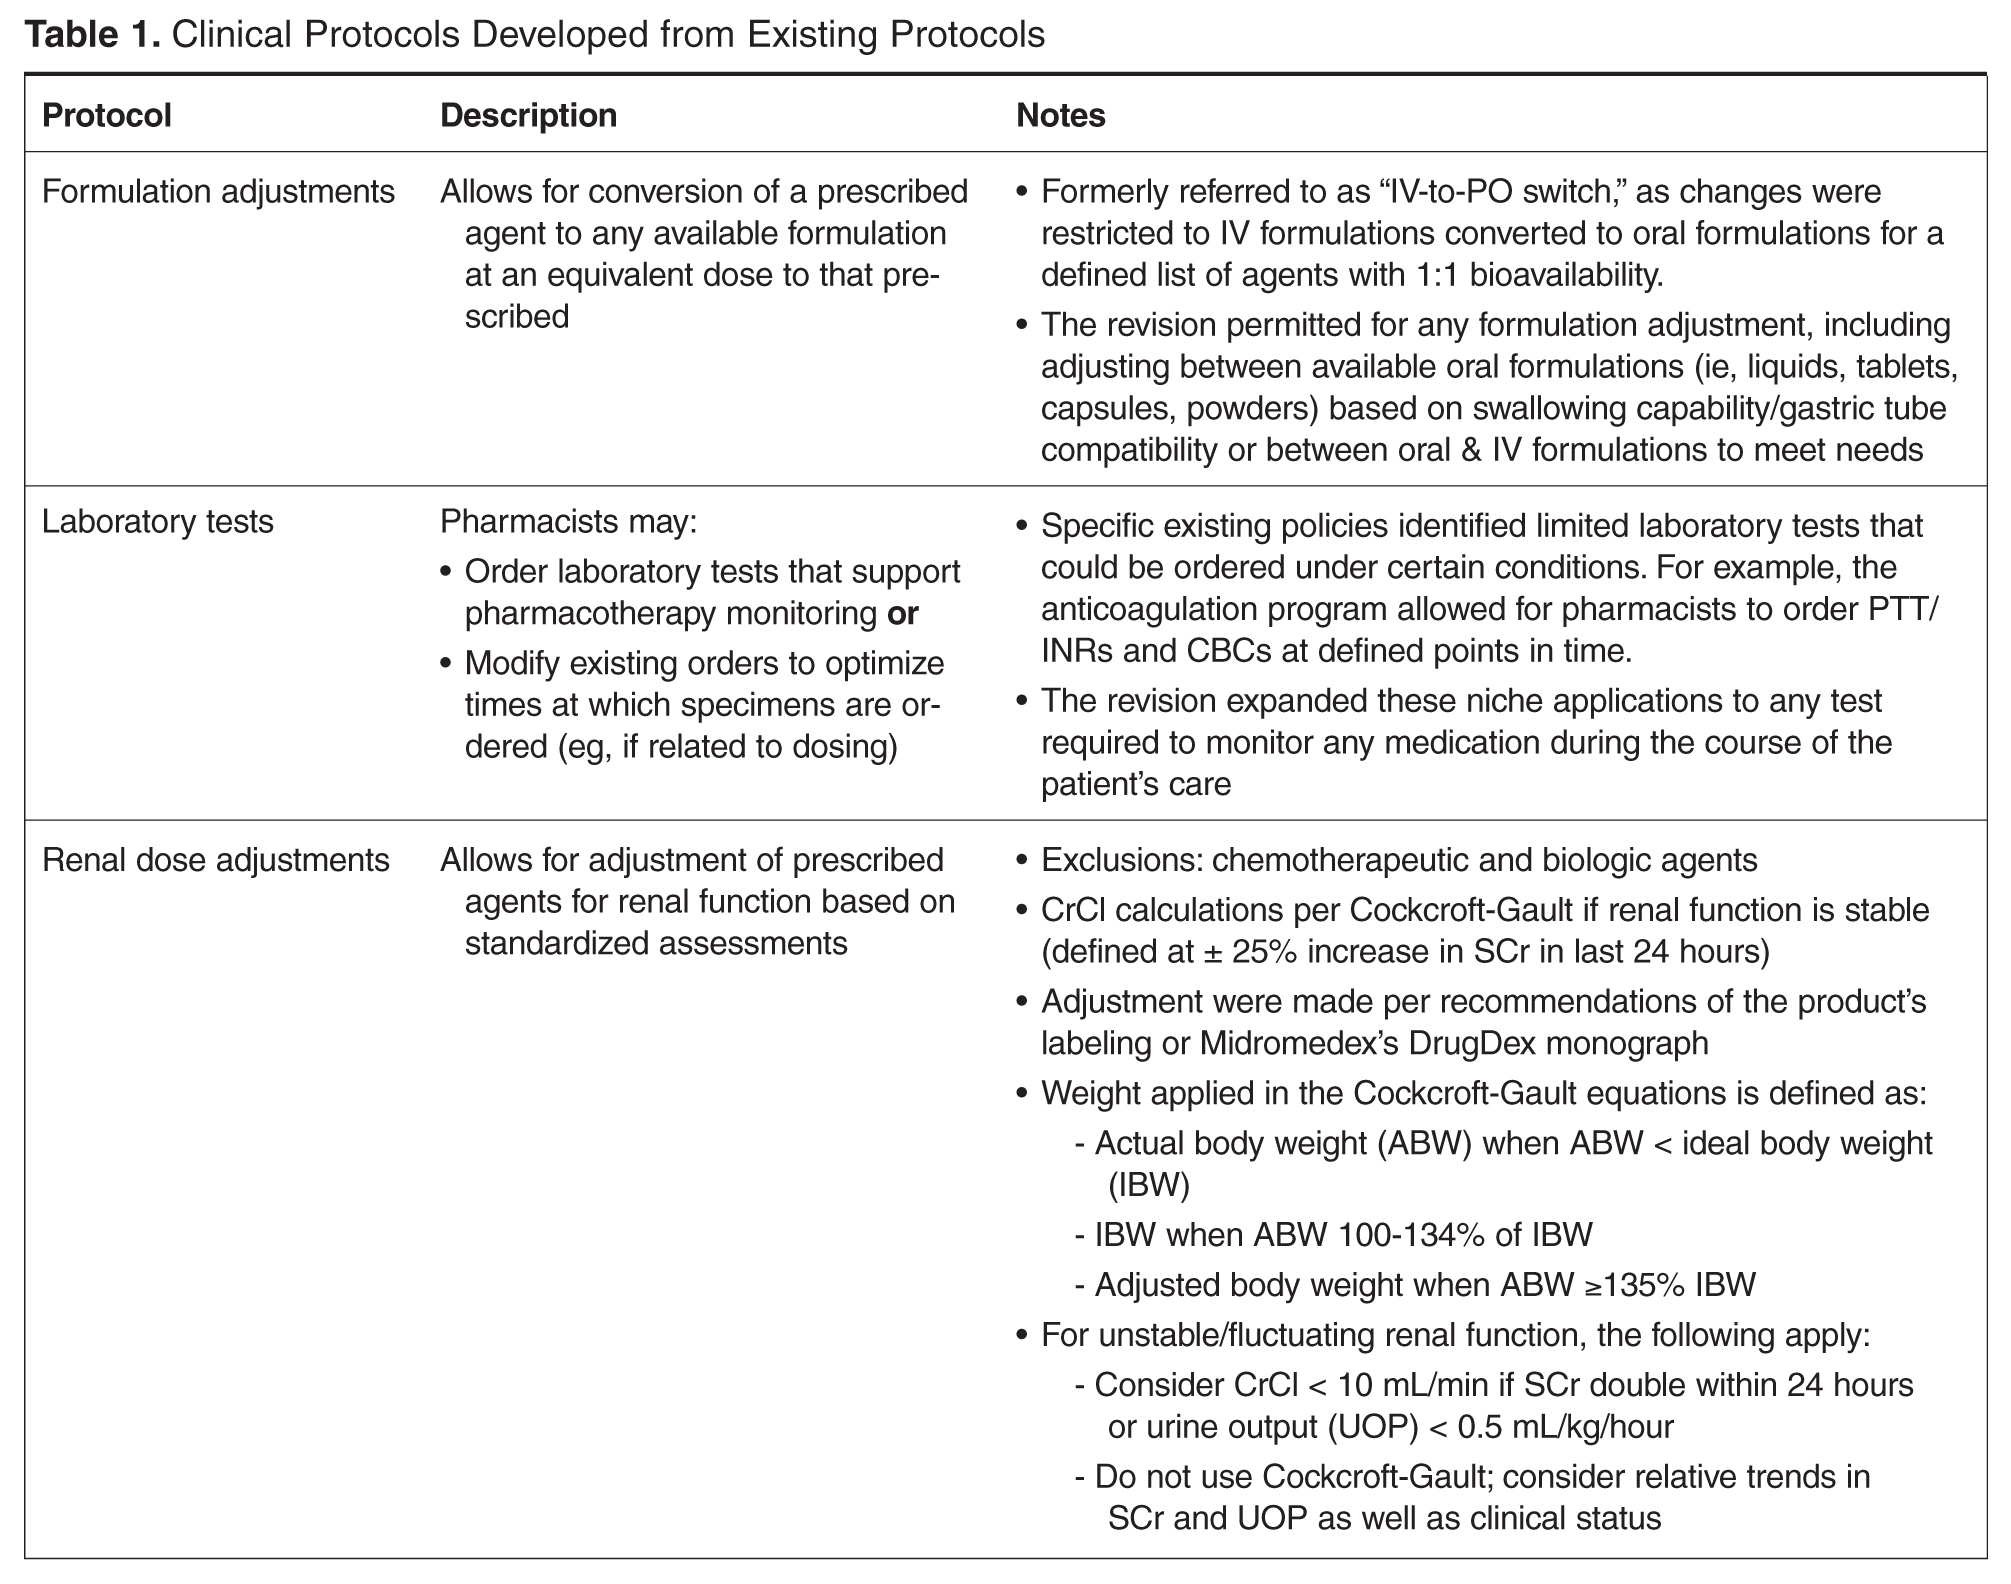
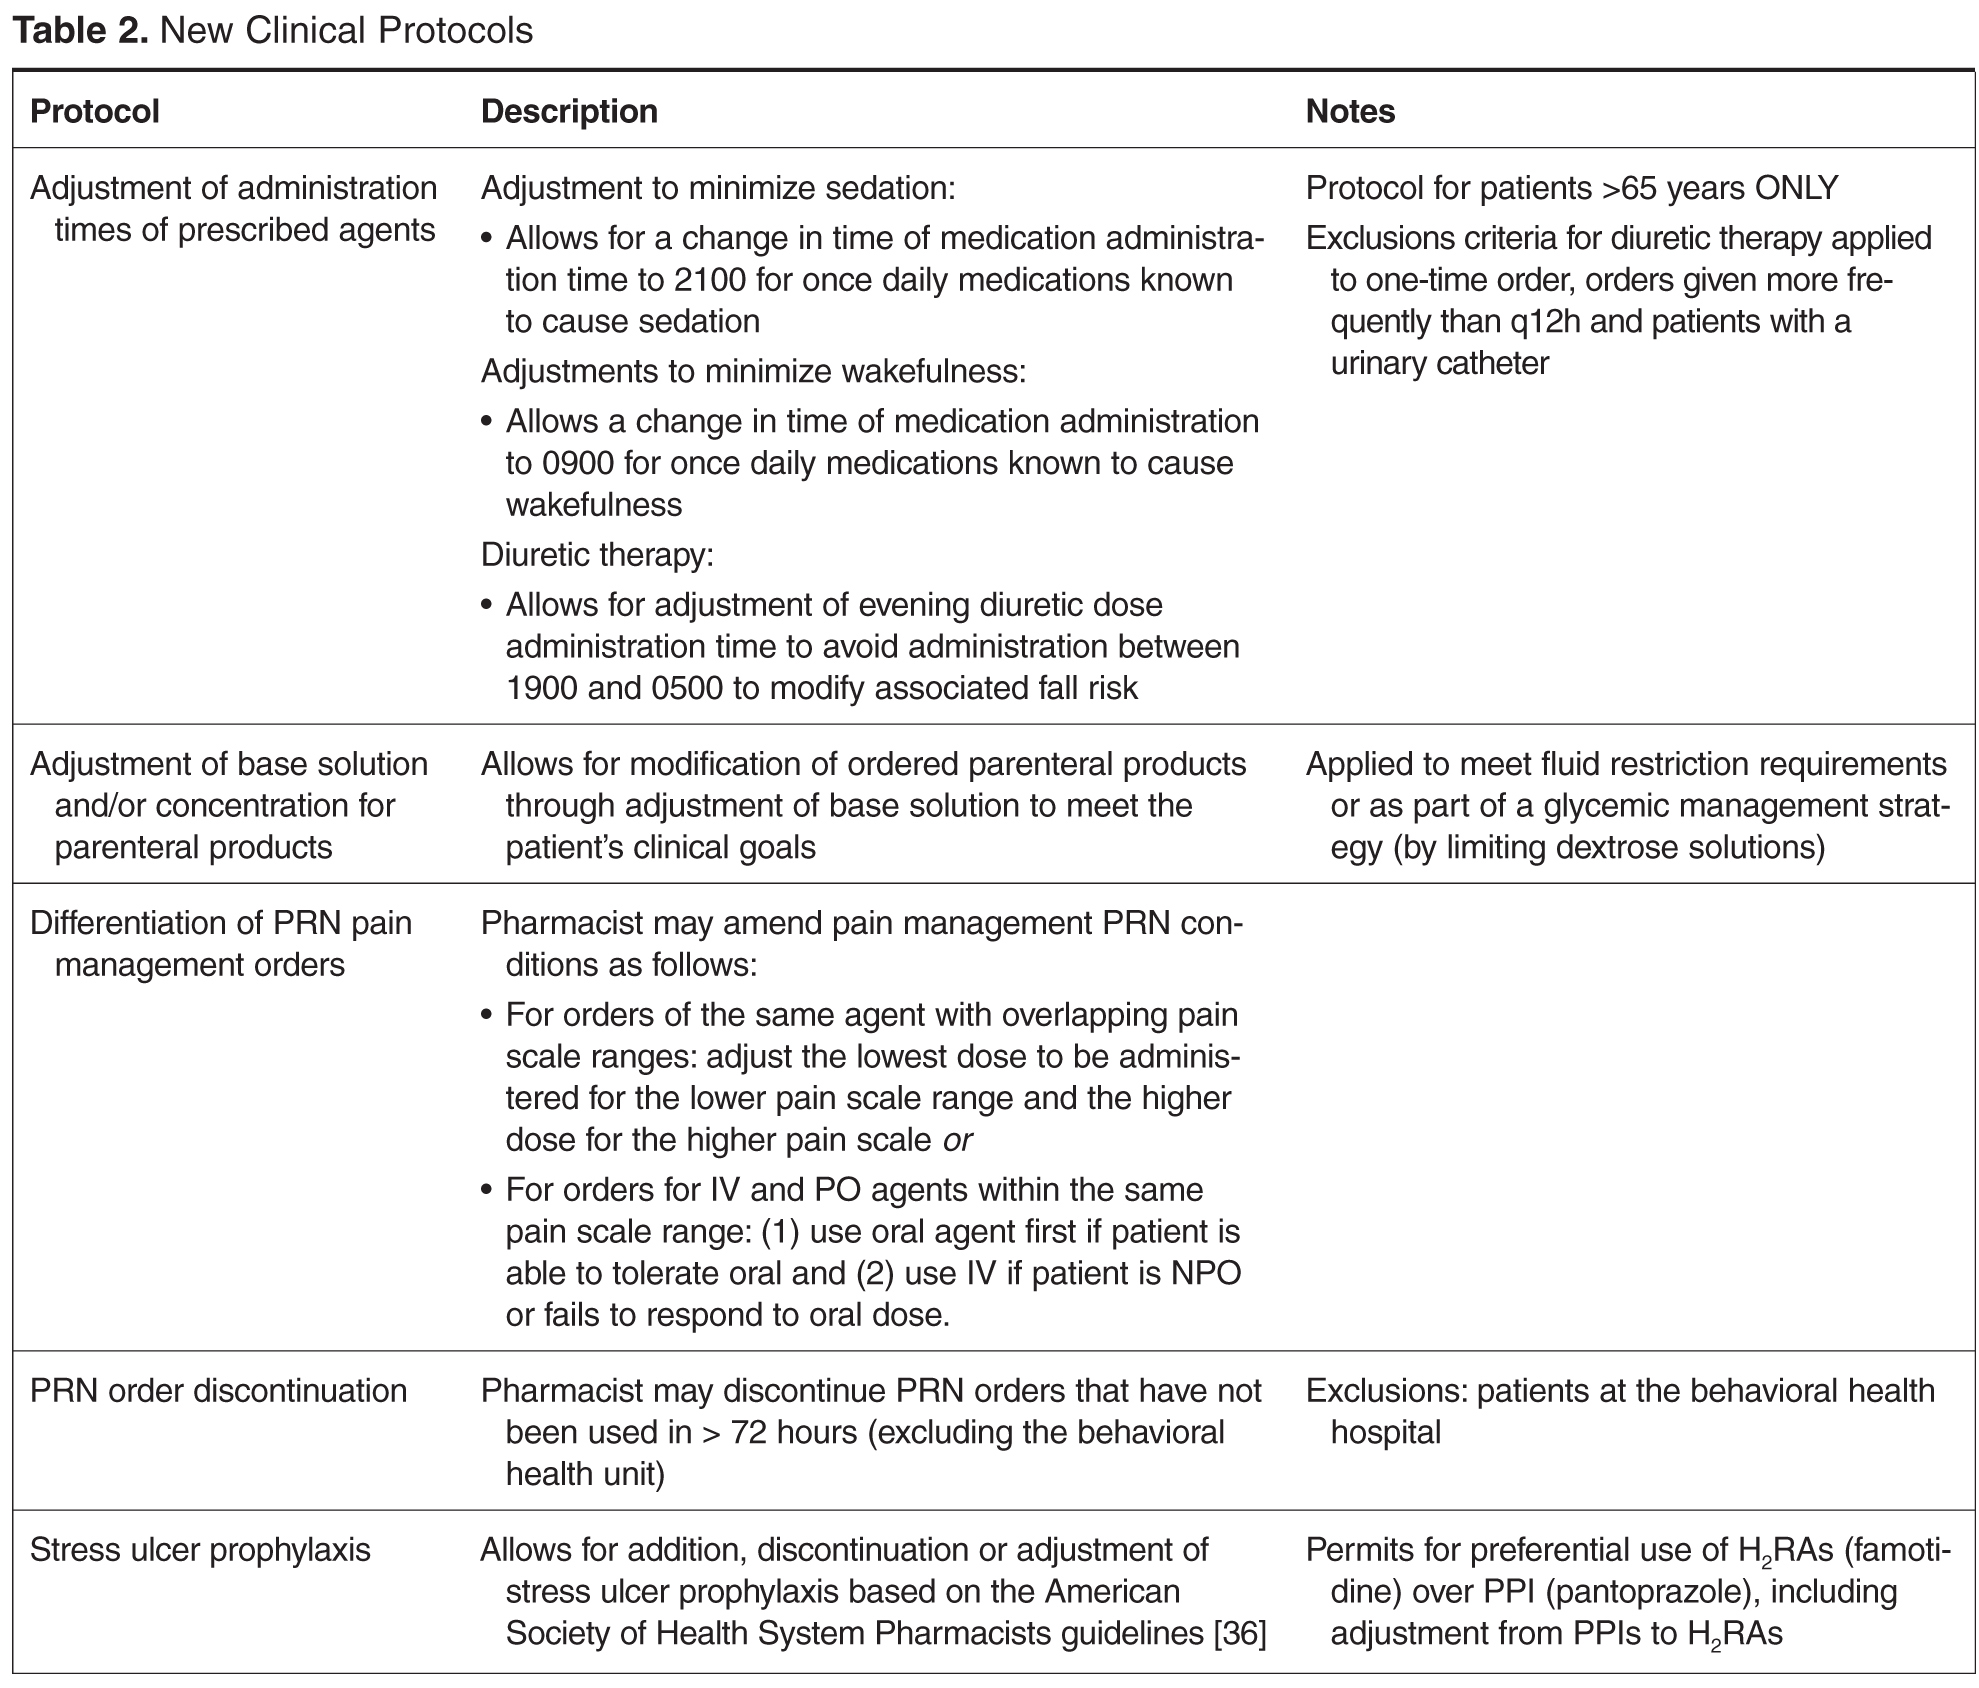
To ensure appropriate oversight, the policy required that the pharmacist making changes submit notification of protocol intervention to the patient’s attending physician, the physician who generated the original order (if other than the attending) and a designated clinical pharmacist (for auditing purposes). All notifications were made via email within the clinical computer system in “interrupt” status to ensure active recognition by the prescriber(s).
Program Evaluation
An evaluation of the first year’s interventions was conducted to validate the program, describe its utility, and provide a basis for re-evaluation and continued evolution. The aim was to evaluate the institution’s experience with the program, focusing on both specific physician and pharmacist elements. One of the primary goals was to evaluate which physician’s orders were associated with interventions as well as the rate of physician acceptance of protocol interventions, as their acceptance clearly validates the pharmacist’s ability to appropriately apply the protocols in patient-specific contexts.
To evaluate the pharmacist’s experience, trends in pharmacist utilization were captured, including which pharmacist by job classification (ie, staff or clinical pharmacist) implemented interventions, during which shift, and in what operational capacity (ie, centralized or decentralized) the pharmacist was practicing. Lastly, the study sought to characterize the frequency to which each protocol was applied. Based on the existing experiences described in the literature as well as with consideration of institutional culture and operation, we hypothesized that all pharmacists would apply protocols with equal efficacy with more interventions likely generated by staff pharmacists due to their role in primary order review and that the types of interventions would vary based on shift and location.
A retrospective review of cases throughout the first year of the policy’s implementation was conducted, including interventions made between 1 February 2012 and 31 January 2013. Cases were identified through the required email notification of the auditing clinical pharmacist. The patient’s electronic medical record for that defined visit was reviewed. To assess pharmacist utilization patterns, data captured included the agent involved in the intervention, date, day of week and shift, whether the pharmacist was centralized or decentralized, and whether that pharmacist was classified as staff or clinical. Decentralized pharmacists were defined as a pharmacist working on the patient care unit with direct access to other practitioners and patients, rather than those performing their functions from within the confines of the pharmacy department.
Prescribers were described both by status (ie, attending or resident/training) and specialty. Physician acceptance was assessed through evaluation of order trends as the electronic medical record allows for all changes to an order to be audited and tracked; a review of progress notes to capture any commentary or rationale regarding interventions or the surrounding circumstances; as well as a review of any associated laboratory or diagnostic reports and nursing notes. If the order was not altered by the physician within 24 hours (ie, the time frame in which orders must be reviewed by the prescriber per institutional standards) of the pharmacist’s protocol change it was deemed accepted by the physician. Changes made within 24 hours for clinical reasons unrelated to the protocol change as verified by documentation in the progress notes were considered as accepted. These included, for example, the discontinuation of empiric antibiotics that had been dose adjusted by the pharmacist for patients in whom infection had been ruled out or a change from the adjusted agent to one of another class (such as might occur during de-escalation of antibiotic therapy). Interventions were excluded if there were insufficient patient and/or intervention details to allow complete assessment.
For protocol evaluation, details concerning the nature of the adjustment were collected. For formulation changes, agents were classified by their bioavailability. Renal dose adjustments were classified by the patient’s estimated creatinine clearance range since interventions were not restricted to ranges or agents. Stress ulcer prophylaxis adjustments were classified as those involving initiation, changes or discontinuation of therapy. For parenteral product adjustments, the initial and final base solution and/or the change in concentration was captured. Pain management order adjustments were classified as those involving the same agent with overlapping indications or those with oral and intravenous orders for the same pain scale range. When laboratory tests were ordered, the type of test was captured.
The study was approved by the institutional review boards of Princeton HealthCare System and Rutgers.
Results
There were 145 interventions occurring between 1 February 2012 and 31 January 2013, with 144 (99.3%) of those being accepted by the prescriber. The 1 intervention that was not accepted involved an IV to oral conversion of levothyroxine. The pharmacist performed the conversion appropriately as the patient was tolerating other oral medications. However, on the day of the change, the patient refused all oral medications despite having the ability to accept them and, as a result, all medications were converted back to parenteral formulations.
Pharmacist Evaluation
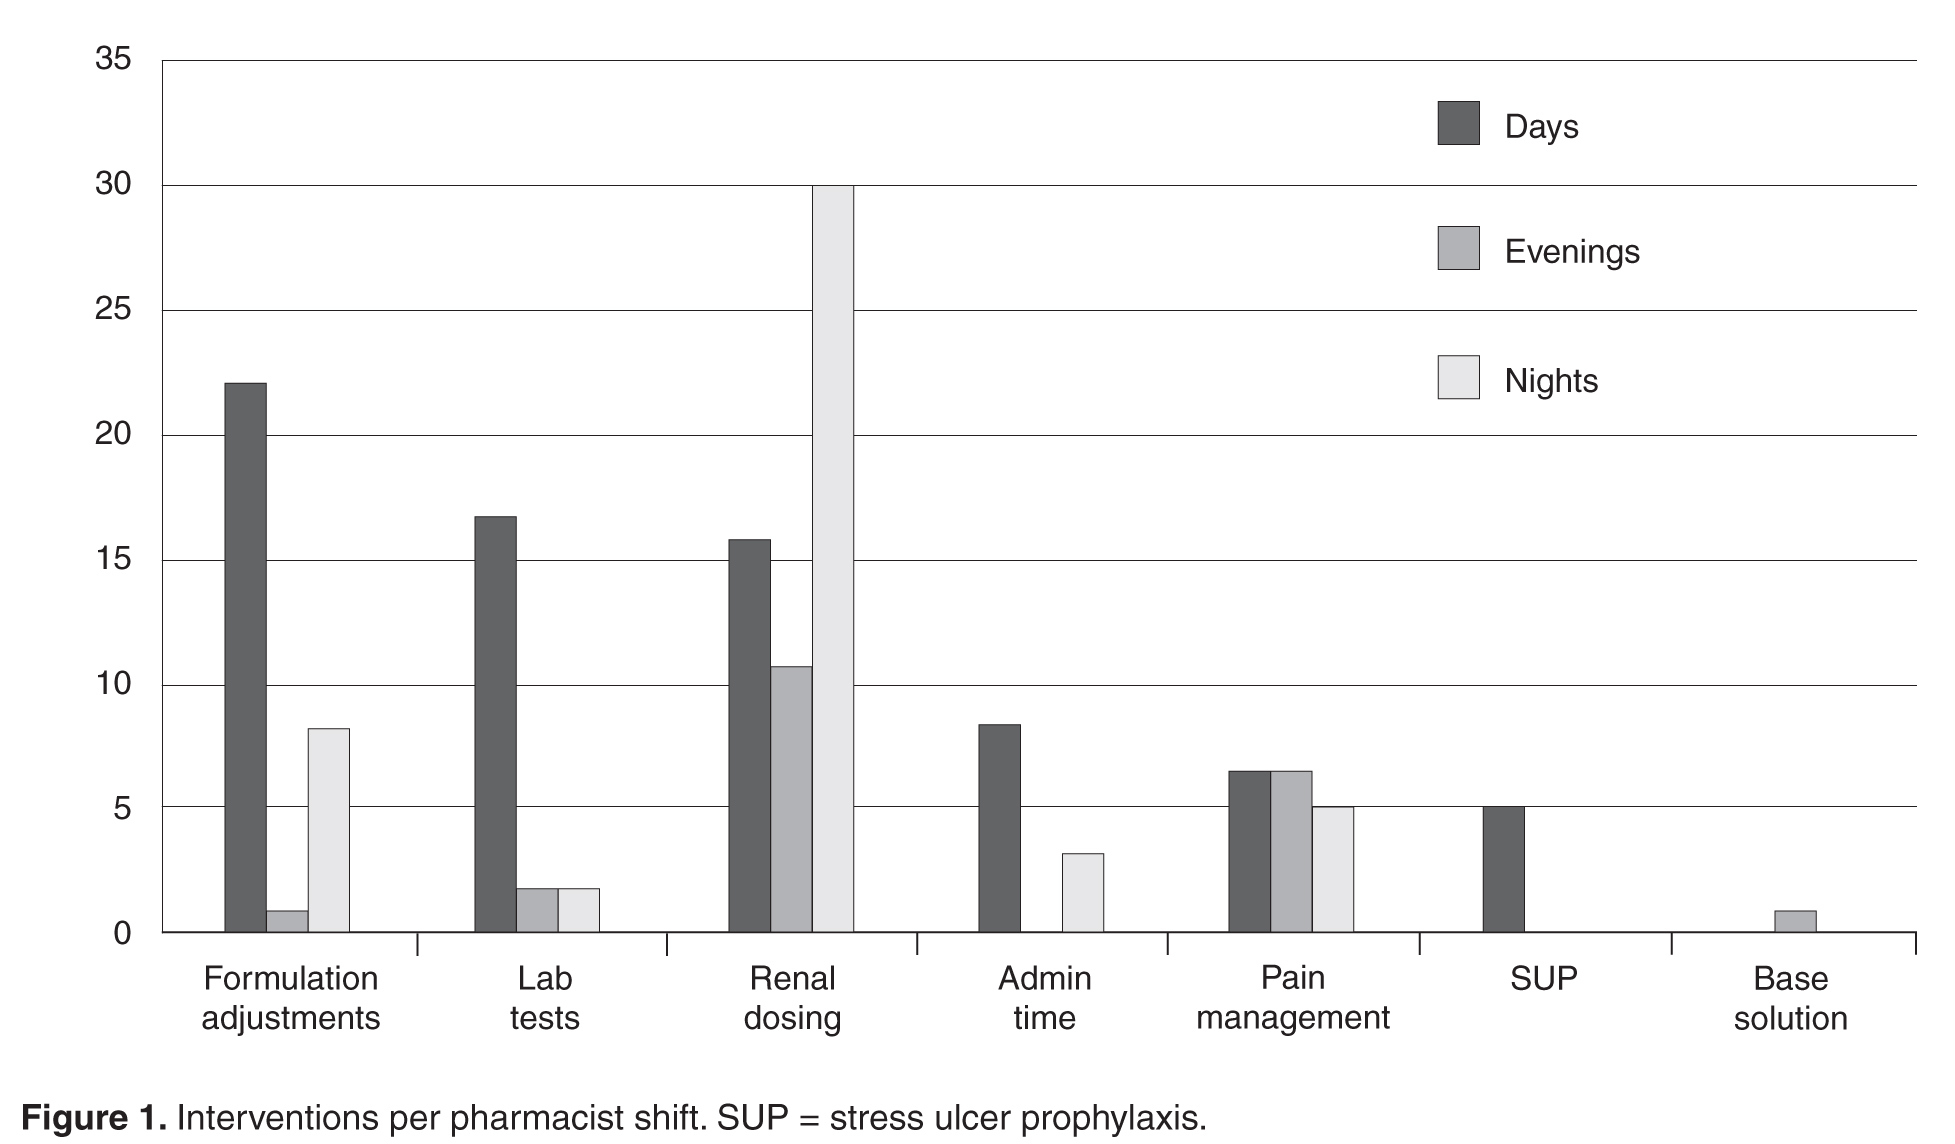
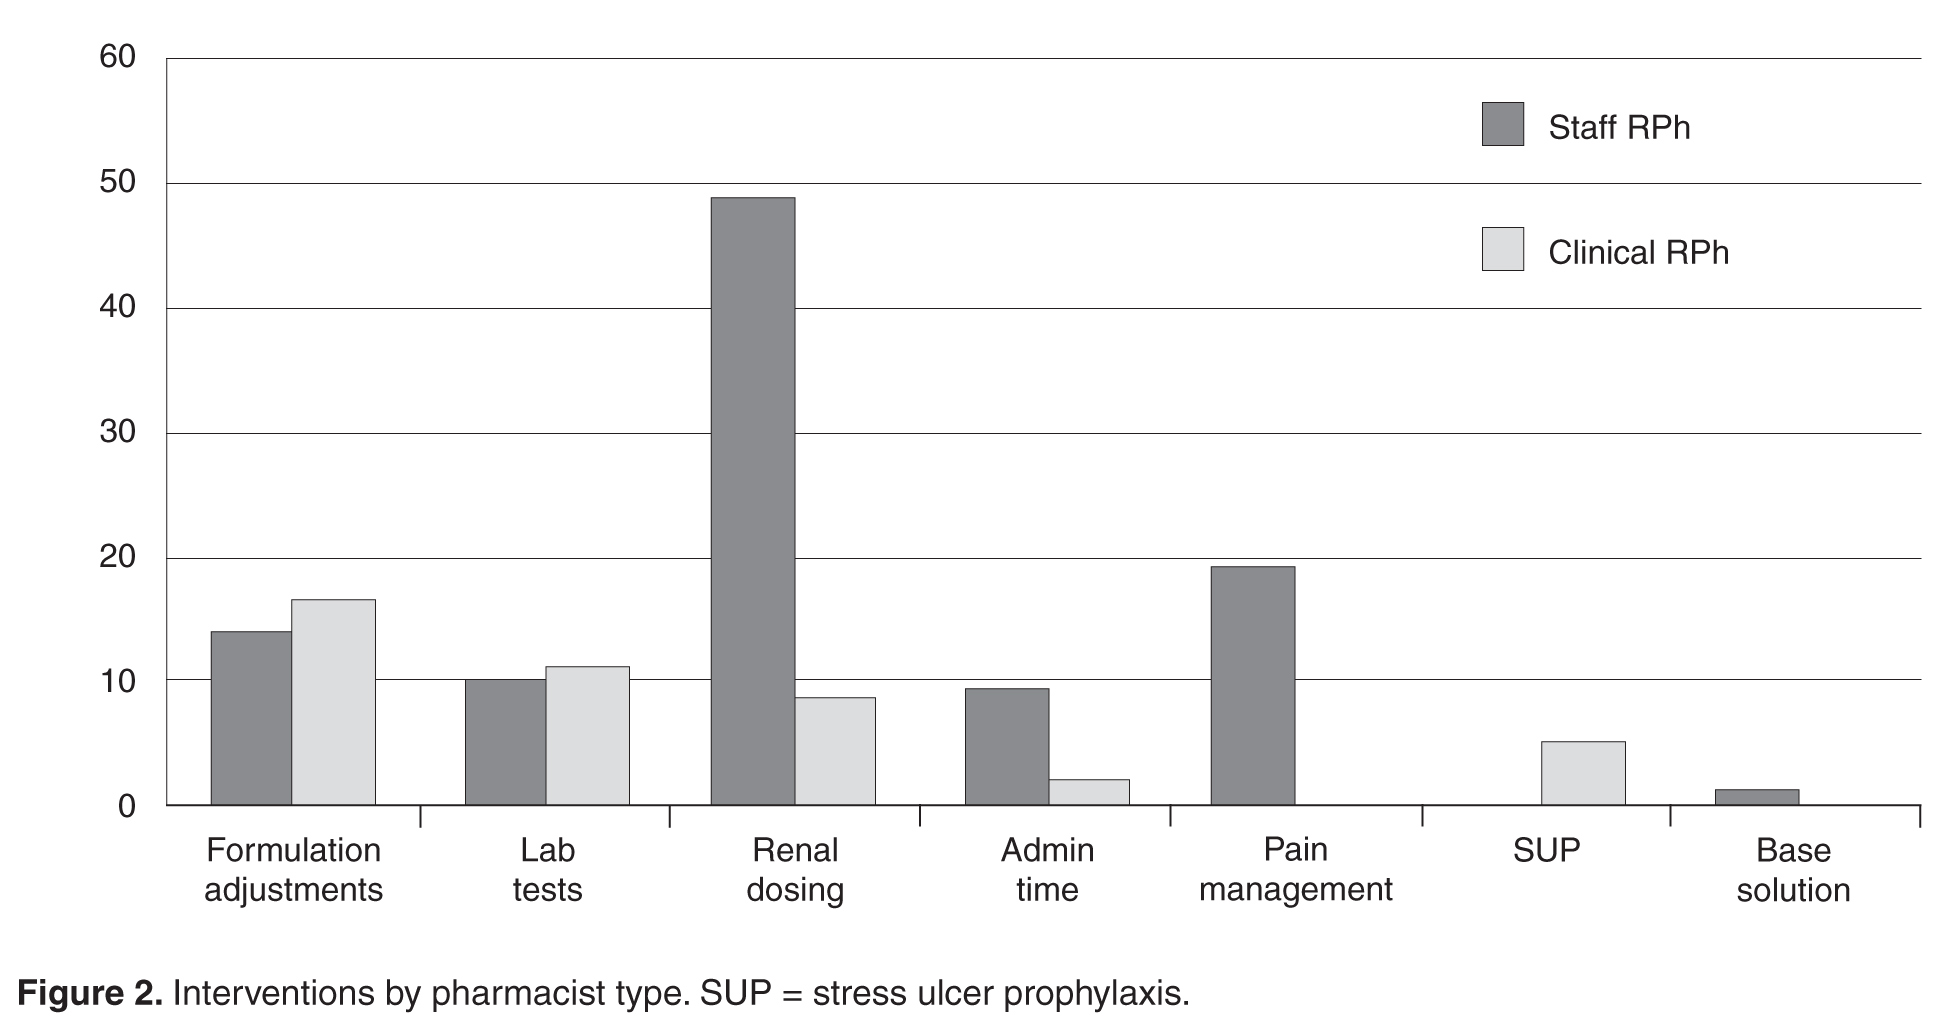
Prescriber Evaluation
An evaluation of prescribers revealed that the primary physician groups (ie, order generators) involved were hospitalists (n = 32) and critical care attendings (n = 24) at 22% and 17% of all orders, respectively. The remaining 89 interventions were distributed across other attending types (including general medicine physicians, specialty physicians and surgeons) and trainees (residents and fellows) with no more than eight orders for any individual physician category.
Protocol Evaluation
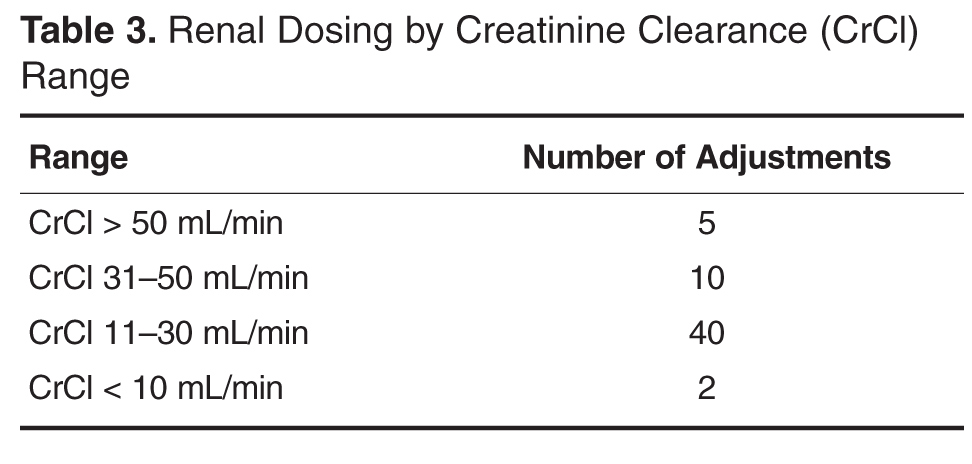
The total number of laboratory tests ordered accounted for 14% (n = 21) of all interventions. Studies related to the management of anti-infective agents and blood formation, coagulation, and thrombosis agents consisted of the majority of the lab tests ordered; INR/PTT and vancomycin levels were the most commonly ordered. Thirteen percent (n = 19) of all interventions include pain management adjustments with an even distribution between pain medications.
Several protocols were less frequently used, specifically the stress ulcer prophylaxis protocol (representing 3% of all interventions or n = 5), base solution changes (< 1% of all interventions or n = 1), and adjustment of administration time (7.6% of all interventions, n = 11). Of the time adjustments, more than 50% (n = 6) involved furosemide.
Discussion
While the literature has many studies describing pharmacists improving outcomes through successful provision of clinical programs by protocol in the acute care hospital setting, the majority of studies are limited to single or focused protocols [2–24,27,37,38]. This approach fails to recognize or limits application of a pharmacist’s expertise in pharmacotherapy, as intervention is permitted only on defined agents under specific circumstances. This is the only report we are aware of that addresses a broader approach in permitting pharmacists to optimize pharmaco-therapy during the course of their usual practice through a single policy. As better outcomes are associated with allowing professionals to work to the fullest extent of their expertise, a broad range of protocols identified as pharmacy clinical services were selected and integrated into a singular policy that would be the foundation for instituting cultural change in regard to the elements considered to be routine pharmacy practice. Thus, the protocols applied here did not specify agents that could be adjusted for renal function or classes for which formulation conversion were permissible. This is also the case for dose formulation adjustments, where the protocol allowed for the pharmacist to apply their expertise beyond 1:1 conversions using standardized drug information references (Table 1 and Table 2). As such, the protocols allowed for the full application of the pharmacist’s expertise as a pharmacotherapy consultant within these intervention categories to assure that therapies are optimized. Additionally, eliminating phone calls streamlined the workflow for both the pharmacist and physicians, thus minimizing interruptions that distract from the other functions in which they are engaged.
During the approval process, physicians inquired whether all pharmacists were equally capable of making the clinical judgments involved with the protocols as described and, thusly, whether protocol management should be limited to clinical pharmacists who have less traditional dispensing roles and more experience and time at the bedside. During those discussions we contended that the nature of these protocols were fundamental and applicable to all practicing pharmacists and, if limited, would result in missed opportunities as the clinical pharmacists are focused in specialized areas during weekdays only at UMCPP. For example, a single, centralized night-shift pharmacist could make routine dose or formulation adjustments without the need to awaken a physician as the UMCPP electronic medical record makes available all progress notes, laboratory results, and diagnostics crucial to clinical decision making. All pharmacists, regardless of job title, meet the same requirements for licensure. Post-doctoral residency or fellowship training and advanced certifications in specialty areas of practice exist among both groups as well. The study results support the validity of this argument. The majority of interventions were successfully performed by staff pharmacists with involvement from all shifts, including a third that occurred overnight. This is important because, like at most hospitals, the UMCPP staffing ratio decreases throughout the course of the day presenting changing workflow challenges throughout different shifts.
Several limitations of this study should be noted. Due to its retrospective nature, it is likely that not all interventions were captured. Some decentralized pharmacists reported not emailing interventions as they had verbally communicated the adjustments prior to having the opportunity to send the email. Four interventions could not be assessed as the email notification did not contain all the required patient identifiers or intervention information to permit for appropriate evaluation. The hospital also moved to a newly built facility in the fourth month of protocol implementation, which required significant changes in drug distribution methods, and this could have contributed to the small sample size of interventions. The move temporarily shifted departmental resources to support operational needs.
Another important factor is the voluntary nature of the policy; while it was within the pharmacist’s professional judgment to apply the protocols, pharmacists were encouraged to contact prescribers if there was any ambiguity. Therefore, while one might have expected more resident physicians to be involved with orders that were adjusted, the UMCPP practice philosophy supports contacting training physicians about changes so that they may learn from the discussion to support developing stronger prescribing habits. Future development should therefore support more universal protocol application to all eligible patients to optimize the benefits described here. Lastly, data measuring the clinical outcomes and time savings or increased productivity secondary to the elimination of physician phone calls was not directly measured. We thus sought to first demonstrate to the physician base that pharmacists could successfully apply a variety of protocols that were broader than those formally studied with equal accuracy. With that effectiveness established, future studies should explore if broader protocol application produces a greater optimization of outcomes.
After the study was completed, a survey was conducted of the pharmacists to assess perceptions and guide further policy development. We received a 63.6% response rate (14 of 22 possible respondents) with a strong majority of the respondents expressing a favorable perception of the protocols. A few respondents indicated some protocols were infrequently utilized and there was limited familiarity with others. We anticipate this is largely based on various shift and unit assignments that would make some protocols more applicable than others to the populations serviced. One of the survey questions polled the respondents on the necessity of the email notification to the prescriber given that this practice is of a higher level of notification than other established hospital protocols which only requires a notation of the change within the medication order. Seventy-one percent (n = 10) of respondents favored removing the email notification, citing primarily that it would be consistent with physician comments regarding the existing notifications. Pharmacists also identified further areas of protocol development including electrocardiogram ordering for QTc monitoring, implementation of a standardized vancomycin dosing protocol, discontinuation of duplicate orders, product substitution for nonformulary items and addition of a protocol for pharmacists to order over-the-counter or nonprescription products as they would in a community setting. This input will shape the revision of the policy and its protocols.
Conclusion
Consistent with the published literature, pharmacists effectively performed pharmacotherapy interventions in a multitude of practice categories for adult inpatients of an acute care community-teaching hospital using a single, comprehensive clinical policy. Providing these broadly scoped protocols in a singular policy allowed pharmacists to increase the autonomy with which they applied their pharmacotherapy expertise during the course of their routine, prospective care and expanded the established benefit of allowing professionals to work to their fullest extent. Pharmacist protocol intervention was met with a high physician acceptance rate.
Acknowledgment: We thank all the pharmacists at UMCPP for supporting our efforts to refine pharmacy practice for our patients.
Corresponding author: Liza Barbarello Andrews, PharmD, BSPharm, BCPS, Rutgers, The State University of New Jersey, 160 Frelinghuysen Rd, Piscataway, NJ 08854, lbarbarello@pharmacy.rutgers.edu.
Financial disclosures: None.
1. Bond CA, Raehl CL. Pharmacist provided anticoagulation management in United States hospitals: death rates, length of stay, Medicare charges, bleeding complications and transfusions. Pharmacother 2004;24:953–63.
2. Yen YH, Chen HY, Wuan-Jin L, et al. Clinical and economic impact of a pharmacist-managed iv-to-po conversion service for levofloxacin in Taiwan. Int J Clin Pharmacol Ther 2012;50:136–41.
3. Buyle F, Vogelaers D, PelemanR, et al. Implementation of guidelines for sequential therapy with fluoroquinolones in a Belgian hospital. Pharm World Sci 2010;32:404–10.
4. Davis SL, Delgado G, McKinnon PS. Pharmacoeconomic consideration associated with the use of intravenous-to-oral moxifloxacin for community-acquired pneumonia Clin Infect Dis 2005;41Supp2;5:136–43.
5. Ho BP, Lau TT, Balen RM, et al. The impact of a pharmacist-managed dosage form conversion service on ciprofloxacin usage at a major Canadian teaching hospital: a pre- and post-intervention study. BMC Health Serv Res 2005;5:48.
6. Kuti JL, Le TN, Nightingale CH, et al. Pharmacoeconomics of a pharmacist-managed program for automatically converting levofloxacin route from iv to oral. Am J Health Sys Pharm 2002;59:2209–15.
7. Cohen SM, Lipsett PA, Buchman TG, et al. Comparison of intravenous/oral ciprofloxacin plus metronidazole versus piperacillin/tazobactam in the treatment of complicated intraabdominal infections. Ann Surg 2000;232:254–62.
8. Plouffe J, Schwartz DB, Kolokathis A, et al. Clinical efficacy of intravenous followed by oral azithromycin monotherapy in hospitalized patients with community-acquired pneumonia. Antimicrob Agents Chemother 2000;44:1796–802.
9. Wetzstein GA. Intravenous to oral (IV:PO) anti-infective combination therapy. Cancer Control 2000;7:170–6.
10. Paladino JA. Pharmacoeconomics of antimicrobial therapy. Am J Healthsys Pharm 1999;56(Supp3):S25–8.
11. Ahkee S, Smith S, et al. Early switch from intravenous to oral antibiotics in hospitalized patient with infections: a six-month prospective study. Pharmacotherapy 1997;17:569–75.
12. Przybylski KG, Rybak MJ, Martin PR, et al. A pharmacist-initiated program of intravenous to oral antibiotic conversion. Pharmacotherapy 1997;17:271–6.
13. Jewesson P. Cost-effectiveness and value of an IV switch. Pharmacoeconomics 1994;5(Supp2):20–6.
14. Ramirez J. Advances in antibiotic use: switch therapy. Curr Ther Res 1994;55(suppA):30–3.
15. Shepard MF. Making the switch from IV to PO. Am J Healthsys Pharm 1994;50:2510.
16. Chessin LN. When to switch from IV to oral antibiotics. Patient Care 1993;15:113–25.
17. Cohen MR. Important news! IV route not needed to justify hospitalization for antibiotics. Hospital Pharmacy 1993;28:946.
18. Schentag JJ. Changes in antimicrobial agent usage resulting from interactions among clinical pharmacy, infectious disease division and the microbiology laboratory. Diagnos Microbiol Infect Dis 1993;16:255–64.
19. Fighetto L. Intravenous to oral stepdown program: four years’ experience in a large teaching hospital. Ann Pharmacother 1992;26:1447–51.
20. Powers T. Clinical and economic effect of ciprofloxacin as an alternative to injectable antimicrobial therapy. Am J Healthsys Pharm 1990;47:1781–4.
21. Ament PW, McGuire WM. Setting up an automatic pharmacist-initiated pharmacokinetic dosing service. Hosp Formul 1993;28:589–92.
22. Mousavi M, Dashti-Khavidaki S, Khalili H, et al. Impact of clinical pharmacy services on stress ulcer prophylaxis prescribing and related cost in patients with renal insufficiency. Int J Pharm Pract 2012;Nov 9.
23. Damaske DL, Baird RW. Development and implementation of a pharmacist managed inpatient warfarin protocol. Proc (Baylor Univ Med Cent) 2005;18:397–400.
24. Radley AS, Hall J, Farrow M, et al. Evaluation of anticoagulation control in a pharmacist operated anticoagulation clinic. J Clin Pathol 1995;48:545–47.
25. Pharmacy and Therapeutics Committee. Medication policies and protocols of Nebraska Methodist Hospital, Methodist Women’s Hospital.
26. University of Kentucky Pharmacy Services. Therapeutic interchanges [Internet]. Available at www.hosp.uky.edu/pharmacy/interchange.asp
27. Bayshore Community Hospital Department of Pharmacy. Conversion of intravenous azithromycin (Zithromax), ceftriaxone (Rocephin), ciprofloxacin (Cipro), fluconazole (Diflucan), lansoprazole (Prevacid), levofloxacin (Levaquin), linezolid (Zyvox), metronidazole (Flagyl), moxifloxacin (Avelox), potassium chloride (KC), or ranitidine (Zantac) to oral medication [Internet]. [cited 2013 May 9]. Available at www.ashp.org/s_ashp/docs/files/R-IVtoPOConvPol-2.pdf.
28. Medication Education Safety Approval Committee, Massachusetts General Hospital. Automatic intravenous to oral protocol [Internet]. MESAC memo; 2005 July [cited 2013 March 9]. Available at www2.massgeneral.org/pharmacy/mesac/mesac_memo3.pdf.
29. Hanson RL, Habibi M, Khamo N, et al. Integrated clinical and specialty pharmacy practice model for management of patients with multiple sclerosis. Am J Health Syst Pharm 2014;71:463–9.
30. Making pharmacists part of the multidisciplinary team. Hosp Case Manag 2014;22:13–6.
31. Preslaski CR, Lat I, MacLaren R, et al. Pharmacist contributions as members of the multidisciplinary ICU team. Chest 2013;144:1687–95.
32. Ripley TL, Adamson PB, Hennebry TA, et al. Collaborative practice model between cardiologists and clinical pharmacist for management of patients with cardiovascular disease in an outpatient clinic. Ann Pharmacother 2014;48:412–9.
33. Smith M, Bates DW, Bodenheimer TS. Pharmacists belong in accountable care organizations and integrated care teams. Health Aff (Millwood) 2013;32:1963–70.
34. Ukens C. New Jersey rewrites its state pharmacy practice act. Drug Topics 2004;148:41.
35. New Jersey Board of Pharmacy Laws. Statute 45:14-64. Inapplicability relative to collaborative drug therapy management in hospital. [Internet] July 2011 [cited 11 September 14]. Available from: www.njconsumeraffairs.gov/laws/pharmlaws.pdf.
36. ASHP Commission on Therapeutics. ASHP therapeutic guidelines on stress ulcer prophylaxis. Am J Health Syst Pharm 1999;56:347–79.
37. Bond CA, Raehl CL. Clinical pharmacy services, pharmacy staffing, and hospital mortality rates. Pharmacotherapy 2007;27:481–93.
38. Bond CA, Raehl CL, Franke T. Interrelationships among mortality rates, drug costs, total cost of care, and length of stay in United States hospitals: summary and recommendations for clinical pharmacy services and staffing. Pharmacotherapy 2001;21:129–41.
From the Ernest Mario School of Pharmacy, Rutgers, The State University of New Jersey, Piscataway, NJ.
Abstract
- Objectives: To describe the implementation of broadly scoped clinical pharmacy protocols positioned as a singular policy in a community hospital. These protocols were designed to expand the established benefits demonstrated using narrower, traditional protocols.
- Methods: A retrospective chart review of protocol interventions in the first year of the policy’s implementation was conducted to evaluate prescriber acceptance of protocol interventions. Interventions were identified from required email notifications. The frequency of use of each protocol was assessed, including evaluation of novel characteristics of specific protocols. Pharmacist utilization patterns were assessed for job classification, shift, and practice setting (ie, centralized or decentralized).
- Results: In the 1-year assessment period, 145 interventions were reported and 144 were accepted by the prescribing physicians. Interventions involved orders from hospitalists and intensivists most frequently, with the renal dosing and dose formulations protocols being the most commonly utilized. Staff pharmacists used the policy more frequently than clinical pharmacists, primarily during day shift from decentralized locations on the patient care units.
- Conclusions: The implementation of broadly scoped clinical pharmacy protocols for items our pharmacists routinely contact physicians about (and our physicians deemed were within the practice of pharmacy) instituted a cultural shift that expanded the elements considered to be part of routine pharmacy practice. As a result, pharmacists more seamlessly applied their expertise as pharmacotherapy specialists to optimize pharmacotherapy, which streamlined workflow for both pharmacists and physicians. This expanded the proven benefits of allowing professionals to work to their fullest extent, as established in the literature.
Allowing pharmacists to apply their expertise has been associated with improved outcomes in both pharmacotherapy quality (eg, reduction in mortality and length of stay [1]) and savings in health care dollars. Studies of focused protocols, including intravenous-to-oral (IV-to-PO) switch [2–20], renal dosing [21], stress ulcer prophylaxis [22] and anticoagulation management [1,23,24] demonstrate these benefits in a multitude of practice areas. While such protocols have become commonplace in the acute care setting [25–28], most continue to be singularly focused and impose patient population restrictions that preclude comprehensive patient evaluation. Many are administered as a task within the pharmacist workflow using a patient list generated by the limited protocol criteria, which are often restricted to agent or patient characteristics.
Better outcomes are associated with permitting professionals such as pharmacists to work to the fullest extent of their scope and expertise [29–31]. In specific cases, studies evaluating pharmacists’ impact within a multi-disciplinary health care team have demonstrated improved outcomes in regard to both patient care and cost [29–31]. Recognizing this, accountable care organizations (ACOs) have developed practice models that are based on this benefit. Each team member is expected to robustly apply their training and expertise to achieve the best outcomes [32,33]. As health care moves toward a more integrative approach, it is paramount that pharmacists utilize the full scope of the skills in which they are trained.
This report describes the development, implementation, and outcomes of a singular policy outlining comprehensively scoped protocols allowing acute care hospital pharmacists within Princeton HealthCare System to optimize pharmacotherapy during the course of their usual clinical practice.
Methods
Setting
The University Medical Center of Princeton at Plainsboro (UMCPP), part of the Princeton HealthCare System, is a 230-bed community acute care hospital located in central New Jersey. The hospital facility relocated in May 2012 from its previous location in Princeton to a new state-of-the-art facility in Plainsboro. As an affiliate of the Robert Wood Johnson Medical School and the Ernest Mario School of Pharmacy at Rutgers, The State University of New Jersey (ie, Rutgers), it is an academic teaching hospital with a mixed model for providing patient care. UMCPP employs both faculty physicians leading academic teams alongside hospitalists and private attendings.
Pharmacy services are provided on facility 24 hours a day, 365 days a year. The department of pharmacy services provides a full scope medication services from a centralized location with 3 full-time day pharmacists and 1 oncology satellite pharmacist. During weekdays, decentralized pharmacists provide medication review, patient education, and medication reconciliation on 2 to 3 inpatient care units. Centralized support decreases to 2 pharmacists in the evening and 1 overnight. Clinical pharmacists, both hospital-based and Rutgers faculty, work in conjunction with the staff pharmacists to ensure appropriate management of patients throughout different levels of care.
Program Overview and Implementation
To enhance protocols allowing pharmacists to more holistically and robustly optimize pharmacotherapy, UMCPP implemented the Clinical Pharmacy Services policy in February 2012. The policy outlined 8 protocols through which registered pharmacists within the acute care hospital could implement outlined medication order adjustments for adults of inpatient status. Pediatric patients or those treated outside of the acute care hospital (eg, in the psychiatric hospital, surgical center or outpatient facilities) were excluded. While the hospital had existing traditional programs such as IV-to-PO conversions, the programs were restricted to specific agents or conditions. As such, pharmacists were assigned to review queues in the clinical computer system to which orders for the agents outlined by the specific program would flow. Review would occur at set intervals and focus on that detail of the patient’s care as opposed to broadly encompassing an evaluation of the patient’s comprehensive pharmacotherapy. The goal of the new policy was to better utilize the pharmacists’ expertise by broadening these assessments to all applicable agents, refine workflow (by allowing protocol management instead of requiring individual prescriber calls for each issue) and integrate holistic refinement of pharmacotherapy regimens during the usual course of the pharmacist’s clinical care.
In the state of New Jersey, the Pharmacy Practice Act (updated on 14 January 2004) formally recognizes pharmacists as health care professionals and permits for collaborative practice in the community setting [34]. However, pharmacist management by protocol in the acute care hospital setting is defined separately, requiring only medical approvals within the system [35]. In accordance, the policy and associated protocols were approved by the institution’s multidisciplinary pharmacy and therapeutics (P&T) and medical executive committee processes.
To ensure appropriate oversight, the policy required that the pharmacist making changes submit notification of protocol intervention to the patient’s attending physician, the physician who generated the original order (if other than the attending) and a designated clinical pharmacist (for auditing purposes). All notifications were made via email within the clinical computer system in “interrupt” status to ensure active recognition by the prescriber(s).
Program Evaluation
An evaluation of the first year’s interventions was conducted to validate the program, describe its utility, and provide a basis for re-evaluation and continued evolution. The aim was to evaluate the institution’s experience with the program, focusing on both specific physician and pharmacist elements. One of the primary goals was to evaluate which physician’s orders were associated with interventions as well as the rate of physician acceptance of protocol interventions, as their acceptance clearly validates the pharmacist’s ability to appropriately apply the protocols in patient-specific contexts.
To evaluate the pharmacist’s experience, trends in pharmacist utilization were captured, including which pharmacist by job classification (ie, staff or clinical pharmacist) implemented interventions, during which shift, and in what operational capacity (ie, centralized or decentralized) the pharmacist was practicing. Lastly, the study sought to characterize the frequency to which each protocol was applied. Based on the existing experiences described in the literature as well as with consideration of institutional culture and operation, we hypothesized that all pharmacists would apply protocols with equal efficacy with more interventions likely generated by staff pharmacists due to their role in primary order review and that the types of interventions would vary based on shift and location.
A retrospective review of cases throughout the first year of the policy’s implementation was conducted, including interventions made between 1 February 2012 and 31 January 2013. Cases were identified through the required email notification of the auditing clinical pharmacist. The patient’s electronic medical record for that defined visit was reviewed. To assess pharmacist utilization patterns, data captured included the agent involved in the intervention, date, day of week and shift, whether the pharmacist was centralized or decentralized, and whether that pharmacist was classified as staff or clinical. Decentralized pharmacists were defined as a pharmacist working on the patient care unit with direct access to other practitioners and patients, rather than those performing their functions from within the confines of the pharmacy department.
Prescribers were described both by status (ie, attending or resident/training) and specialty. Physician acceptance was assessed through evaluation of order trends as the electronic medical record allows for all changes to an order to be audited and tracked; a review of progress notes to capture any commentary or rationale regarding interventions or the surrounding circumstances; as well as a review of any associated laboratory or diagnostic reports and nursing notes. If the order was not altered by the physician within 24 hours (ie, the time frame in which orders must be reviewed by the prescriber per institutional standards) of the pharmacist’s protocol change it was deemed accepted by the physician. Changes made within 24 hours for clinical reasons unrelated to the protocol change as verified by documentation in the progress notes were considered as accepted. These included, for example, the discontinuation of empiric antibiotics that had been dose adjusted by the pharmacist for patients in whom infection had been ruled out or a change from the adjusted agent to one of another class (such as might occur during de-escalation of antibiotic therapy). Interventions were excluded if there were insufficient patient and/or intervention details to allow complete assessment.
For protocol evaluation, details concerning the nature of the adjustment were collected. For formulation changes, agents were classified by their bioavailability. Renal dose adjustments were classified by the patient’s estimated creatinine clearance range since interventions were not restricted to ranges or agents. Stress ulcer prophylaxis adjustments were classified as those involving initiation, changes or discontinuation of therapy. For parenteral product adjustments, the initial and final base solution and/or the change in concentration was captured. Pain management order adjustments were classified as those involving the same agent with overlapping indications or those with oral and intravenous orders for the same pain scale range. When laboratory tests were ordered, the type of test was captured.
The study was approved by the institutional review boards of Princeton HealthCare System and Rutgers.
Results
There were 145 interventions occurring between 1 February 2012 and 31 January 2013, with 144 (99.3%) of those being accepted by the prescriber. The 1 intervention that was not accepted involved an IV to oral conversion of levothyroxine. The pharmacist performed the conversion appropriately as the patient was tolerating other oral medications. However, on the day of the change, the patient refused all oral medications despite having the ability to accept them and, as a result, all medications were converted back to parenteral formulations.
Pharmacist Evaluation
Prescriber Evaluation
An evaluation of prescribers revealed that the primary physician groups (ie, order generators) involved were hospitalists (n = 32) and critical care attendings (n = 24) at 22% and 17% of all orders, respectively. The remaining 89 interventions were distributed across other attending types (including general medicine physicians, specialty physicians and surgeons) and trainees (residents and fellows) with no more than eight orders for any individual physician category.
Protocol Evaluation
The total number of laboratory tests ordered accounted for 14% (n = 21) of all interventions. Studies related to the management of anti-infective agents and blood formation, coagulation, and thrombosis agents consisted of the majority of the lab tests ordered; INR/PTT and vancomycin levels were the most commonly ordered. Thirteen percent (n = 19) of all interventions include pain management adjustments with an even distribution between pain medications.
Several protocols were less frequently used, specifically the stress ulcer prophylaxis protocol (representing 3% of all interventions or n = 5), base solution changes (< 1% of all interventions or n = 1), and adjustment of administration time (7.6% of all interventions, n = 11). Of the time adjustments, more than 50% (n = 6) involved furosemide.
Discussion
While the literature has many studies describing pharmacists improving outcomes through successful provision of clinical programs by protocol in the acute care hospital setting, the majority of studies are limited to single or focused protocols [2–24,27,37,38]. This approach fails to recognize or limits application of a pharmacist’s expertise in pharmacotherapy, as intervention is permitted only on defined agents under specific circumstances. This is the only report we are aware of that addresses a broader approach in permitting pharmacists to optimize pharmaco-therapy during the course of their usual practice through a single policy. As better outcomes are associated with allowing professionals to work to the fullest extent of their expertise, a broad range of protocols identified as pharmacy clinical services were selected and integrated into a singular policy that would be the foundation for instituting cultural change in regard to the elements considered to be routine pharmacy practice. Thus, the protocols applied here did not specify agents that could be adjusted for renal function or classes for which formulation conversion were permissible. This is also the case for dose formulation adjustments, where the protocol allowed for the pharmacist to apply their expertise beyond 1:1 conversions using standardized drug information references (Table 1 and Table 2). As such, the protocols allowed for the full application of the pharmacist’s expertise as a pharmacotherapy consultant within these intervention categories to assure that therapies are optimized. Additionally, eliminating phone calls streamlined the workflow for both the pharmacist and physicians, thus minimizing interruptions that distract from the other functions in which they are engaged.
During the approval process, physicians inquired whether all pharmacists were equally capable of making the clinical judgments involved with the protocols as described and, thusly, whether protocol management should be limited to clinical pharmacists who have less traditional dispensing roles and more experience and time at the bedside. During those discussions we contended that the nature of these protocols were fundamental and applicable to all practicing pharmacists and, if limited, would result in missed opportunities as the clinical pharmacists are focused in specialized areas during weekdays only at UMCPP. For example, a single, centralized night-shift pharmacist could make routine dose or formulation adjustments without the need to awaken a physician as the UMCPP electronic medical record makes available all progress notes, laboratory results, and diagnostics crucial to clinical decision making. All pharmacists, regardless of job title, meet the same requirements for licensure. Post-doctoral residency or fellowship training and advanced certifications in specialty areas of practice exist among both groups as well. The study results support the validity of this argument. The majority of interventions were successfully performed by staff pharmacists with involvement from all shifts, including a third that occurred overnight. This is important because, like at most hospitals, the UMCPP staffing ratio decreases throughout the course of the day presenting changing workflow challenges throughout different shifts.
Several limitations of this study should be noted. Due to its retrospective nature, it is likely that not all interventions were captured. Some decentralized pharmacists reported not emailing interventions as they had verbally communicated the adjustments prior to having the opportunity to send the email. Four interventions could not be assessed as the email notification did not contain all the required patient identifiers or intervention information to permit for appropriate evaluation. The hospital also moved to a newly built facility in the fourth month of protocol implementation, which required significant changes in drug distribution methods, and this could have contributed to the small sample size of interventions. The move temporarily shifted departmental resources to support operational needs.
Another important factor is the voluntary nature of the policy; while it was within the pharmacist’s professional judgment to apply the protocols, pharmacists were encouraged to contact prescribers if there was any ambiguity. Therefore, while one might have expected more resident physicians to be involved with orders that were adjusted, the UMCPP practice philosophy supports contacting training physicians about changes so that they may learn from the discussion to support developing stronger prescribing habits. Future development should therefore support more universal protocol application to all eligible patients to optimize the benefits described here. Lastly, data measuring the clinical outcomes and time savings or increased productivity secondary to the elimination of physician phone calls was not directly measured. We thus sought to first demonstrate to the physician base that pharmacists could successfully apply a variety of protocols that were broader than those formally studied with equal accuracy. With that effectiveness established, future studies should explore if broader protocol application produces a greater optimization of outcomes.
After the study was completed, a survey was conducted of the pharmacists to assess perceptions and guide further policy development. We received a 63.6% response rate (14 of 22 possible respondents) with a strong majority of the respondents expressing a favorable perception of the protocols. A few respondents indicated some protocols were infrequently utilized and there was limited familiarity with others. We anticipate this is largely based on various shift and unit assignments that would make some protocols more applicable than others to the populations serviced. One of the survey questions polled the respondents on the necessity of the email notification to the prescriber given that this practice is of a higher level of notification than other established hospital protocols which only requires a notation of the change within the medication order. Seventy-one percent (n = 10) of respondents favored removing the email notification, citing primarily that it would be consistent with physician comments regarding the existing notifications. Pharmacists also identified further areas of protocol development including electrocardiogram ordering for QTc monitoring, implementation of a standardized vancomycin dosing protocol, discontinuation of duplicate orders, product substitution for nonformulary items and addition of a protocol for pharmacists to order over-the-counter or nonprescription products as they would in a community setting. This input will shape the revision of the policy and its protocols.
Conclusion
Consistent with the published literature, pharmacists effectively performed pharmacotherapy interventions in a multitude of practice categories for adult inpatients of an acute care community-teaching hospital using a single, comprehensive clinical policy. Providing these broadly scoped protocols in a singular policy allowed pharmacists to increase the autonomy with which they applied their pharmacotherapy expertise during the course of their routine, prospective care and expanded the established benefit of allowing professionals to work to their fullest extent. Pharmacist protocol intervention was met with a high physician acceptance rate.
Acknowledgment: We thank all the pharmacists at UMCPP for supporting our efforts to refine pharmacy practice for our patients.
Corresponding author: Liza Barbarello Andrews, PharmD, BSPharm, BCPS, Rutgers, The State University of New Jersey, 160 Frelinghuysen Rd, Piscataway, NJ 08854, lbarbarello@pharmacy.rutgers.edu.
Financial disclosures: None.
1. Bond CA, Raehl CL. Pharmacist provided anticoagulation management in United States hospitals: death rates, length of stay, Medicare charges, bleeding complications and transfusions. Pharmacother 2004;24:953–63.
2. Yen YH, Chen HY, Wuan-Jin L, et al. Clinical and economic impact of a pharmacist-managed iv-to-po conversion service for levofloxacin in Taiwan. Int J Clin Pharmacol Ther 2012;50:136–41.
3. Buyle F, Vogelaers D, PelemanR, et al. Implementation of guidelines for sequential therapy with fluoroquinolones in a Belgian hospital. Pharm World Sci 2010;32:404–10.
4. Davis SL, Delgado G, McKinnon PS. Pharmacoeconomic consideration associated with the use of intravenous-to-oral moxifloxacin for community-acquired pneumonia Clin Infect Dis 2005;41Supp2;5:136–43.
5. Ho BP, Lau TT, Balen RM, et al. The impact of a pharmacist-managed dosage form conversion service on ciprofloxacin usage at a major Canadian teaching hospital: a pre- and post-intervention study. BMC Health Serv Res 2005;5:48.
6. Kuti JL, Le TN, Nightingale CH, et al. Pharmacoeconomics of a pharmacist-managed program for automatically converting levofloxacin route from iv to oral. Am J Health Sys Pharm 2002;59:2209–15.
7. Cohen SM, Lipsett PA, Buchman TG, et al. Comparison of intravenous/oral ciprofloxacin plus metronidazole versus piperacillin/tazobactam in the treatment of complicated intraabdominal infections. Ann Surg 2000;232:254–62.
8. Plouffe J, Schwartz DB, Kolokathis A, et al. Clinical efficacy of intravenous followed by oral azithromycin monotherapy in hospitalized patients with community-acquired pneumonia. Antimicrob Agents Chemother 2000;44:1796–802.
9. Wetzstein GA. Intravenous to oral (IV:PO) anti-infective combination therapy. Cancer Control 2000;7:170–6.
10. Paladino JA. Pharmacoeconomics of antimicrobial therapy. Am J Healthsys Pharm 1999;56(Supp3):S25–8.
11. Ahkee S, Smith S, et al. Early switch from intravenous to oral antibiotics in hospitalized patient with infections: a six-month prospective study. Pharmacotherapy 1997;17:569–75.
12. Przybylski KG, Rybak MJ, Martin PR, et al. A pharmacist-initiated program of intravenous to oral antibiotic conversion. Pharmacotherapy 1997;17:271–6.
13. Jewesson P. Cost-effectiveness and value of an IV switch. Pharmacoeconomics 1994;5(Supp2):20–6.
14. Ramirez J. Advances in antibiotic use: switch therapy. Curr Ther Res 1994;55(suppA):30–3.
15. Shepard MF. Making the switch from IV to PO. Am J Healthsys Pharm 1994;50:2510.
16. Chessin LN. When to switch from IV to oral antibiotics. Patient Care 1993;15:113–25.
17. Cohen MR. Important news! IV route not needed to justify hospitalization for antibiotics. Hospital Pharmacy 1993;28:946.
18. Schentag JJ. Changes in antimicrobial agent usage resulting from interactions among clinical pharmacy, infectious disease division and the microbiology laboratory. Diagnos Microbiol Infect Dis 1993;16:255–64.
19. Fighetto L. Intravenous to oral stepdown program: four years’ experience in a large teaching hospital. Ann Pharmacother 1992;26:1447–51.
20. Powers T. Clinical and economic effect of ciprofloxacin as an alternative to injectable antimicrobial therapy. Am J Healthsys Pharm 1990;47:1781–4.
21. Ament PW, McGuire WM. Setting up an automatic pharmacist-initiated pharmacokinetic dosing service. Hosp Formul 1993;28:589–92.
22. Mousavi M, Dashti-Khavidaki S, Khalili H, et al. Impact of clinical pharmacy services on stress ulcer prophylaxis prescribing and related cost in patients with renal insufficiency. Int J Pharm Pract 2012;Nov 9.
23. Damaske DL, Baird RW. Development and implementation of a pharmacist managed inpatient warfarin protocol. Proc (Baylor Univ Med Cent) 2005;18:397–400.
24. Radley AS, Hall J, Farrow M, et al. Evaluation of anticoagulation control in a pharmacist operated anticoagulation clinic. J Clin Pathol 1995;48:545–47.
25. Pharmacy and Therapeutics Committee. Medication policies and protocols of Nebraska Methodist Hospital, Methodist Women’s Hospital.
26. University of Kentucky Pharmacy Services. Therapeutic interchanges [Internet]. Available at www.hosp.uky.edu/pharmacy/interchange.asp
27. Bayshore Community Hospital Department of Pharmacy. Conversion of intravenous azithromycin (Zithromax), ceftriaxone (Rocephin), ciprofloxacin (Cipro), fluconazole (Diflucan), lansoprazole (Prevacid), levofloxacin (Levaquin), linezolid (Zyvox), metronidazole (Flagyl), moxifloxacin (Avelox), potassium chloride (KC), or ranitidine (Zantac) to oral medication [Internet]. [cited 2013 May 9]. Available at www.ashp.org/s_ashp/docs/files/R-IVtoPOConvPol-2.pdf.
28. Medication Education Safety Approval Committee, Massachusetts General Hospital. Automatic intravenous to oral protocol [Internet]. MESAC memo; 2005 July [cited 2013 March 9]. Available at www2.massgeneral.org/pharmacy/mesac/mesac_memo3.pdf.
29. Hanson RL, Habibi M, Khamo N, et al. Integrated clinical and specialty pharmacy practice model for management of patients with multiple sclerosis. Am J Health Syst Pharm 2014;71:463–9.
30. Making pharmacists part of the multidisciplinary team. Hosp Case Manag 2014;22:13–6.
31. Preslaski CR, Lat I, MacLaren R, et al. Pharmacist contributions as members of the multidisciplinary ICU team. Chest 2013;144:1687–95.
32. Ripley TL, Adamson PB, Hennebry TA, et al. Collaborative practice model between cardiologists and clinical pharmacist for management of patients with cardiovascular disease in an outpatient clinic. Ann Pharmacother 2014;48:412–9.
33. Smith M, Bates DW, Bodenheimer TS. Pharmacists belong in accountable care organizations and integrated care teams. Health Aff (Millwood) 2013;32:1963–70.
34. Ukens C. New Jersey rewrites its state pharmacy practice act. Drug Topics 2004;148:41.
35. New Jersey Board of Pharmacy Laws. Statute 45:14-64. Inapplicability relative to collaborative drug therapy management in hospital. [Internet] July 2011 [cited 11 September 14]. Available from: www.njconsumeraffairs.gov/laws/pharmlaws.pdf.
36. ASHP Commission on Therapeutics. ASHP therapeutic guidelines on stress ulcer prophylaxis. Am J Health Syst Pharm 1999;56:347–79.
37. Bond CA, Raehl CL. Clinical pharmacy services, pharmacy staffing, and hospital mortality rates. Pharmacotherapy 2007;27:481–93.
38. Bond CA, Raehl CL, Franke T. Interrelationships among mortality rates, drug costs, total cost of care, and length of stay in United States hospitals: summary and recommendations for clinical pharmacy services and staffing. Pharmacotherapy 2001;21:129–41.
Perfect Depression Care Spread: The Traction of Zero Suicides
From The Menninger Clinic, Houston, TX.
Abstract
- Objective: To summarize the Perfect Depression Care initiative and describe recent work to spread this quality improvement initiative.
- Methods: We summarize the background and methodology of the Perfect Depression Care initiative within the specialty behavioral health care setting and then describe the application of this methodology to 2 examples of spreading Perfect Depression Care to general medical settings: primary care and general hospitals.
- Results: In the primary care setting, Perfect Depression Care spread successfully in association with the development and implementation of a practice guideline for managing the potentially suicidal patient. In the general hospital setting, Perfect Depression Care is spreading successfully in association with the development and implementation of a simple and efficient tool to screen not for suicide risk specifically, but for common psychiatric conditions associated with increased risk of suicide.
- Conclusion: Both examples of spreading Perfect Depression Care to general medical settings illustrate the social traction of “zero suicides,” the audacious and transformative goal of the Perfect Depression Care Initiative.
Each year depression affects roughly 10% of adults in the United States [1]. The leading cause of disability in developed countries, depression results in substantial medical care expenditures, lost productivity, and absenteeism [1]. It is a chronic condition, and one that is associated with tremendous comorbidity from multiple chronic general medical conditions, including congestive heart failure, coronary artery disease, and diabetes [2]. Moreover, the presence of depression has deleterious effects on the outcomes of those comorbid conditions [2]. Untreated or poorly treated, depression can be deadly—each year as many as 10% of patients with major depression die from suicide [1].
In 1999 the Behavioral Health Services (BHS) division of Henry Ford Health System in Detroit, Michigan, set out to eliminate suicide among all patients with depression in our HMO network. This audacious goal was a key lever in a broader aim, which was to build a system of perfect depression care. We aimed to achieve breakthrough improvement in quality and safety by completely redesigning the delivery of depression care using the 6 aims and 10 new rules set forth in the Institute of Medicine’s (IOM) report Crossing the Quality Chasm [3]. To communicate our bold vision, we called the initiative Perfect Depression Care. Today, we can report a dramatic and sustained reduction in suicide that is unprecedented in the clinical and quality improvement literature [4].
In the Chasm report, the IOM cast a spotlight on behavioral health care, placing depression and anxiety disorders on the short list of priority conditions for immediate national attention and improvement. Importantly, the IOM called for a focus on not only behavioral health care benefits and coverage, but access and quality of care for all persons with depression. Finding inspiration from our success in the specialty behavioral health care setting, we decided to answer the IOM’s call. We set out to build a system of depression care that is not confined to the specialty behavioral health care setting, a system that delivers perfect care to every patient with depression, regardless of general medical comorbidity or care setting. We called this work Perfect Depression Care Spread.
In this article, we first summarize the background and methodology of the Perfect Depression Care initiative. We then describe the application of this methodology to spreading Perfect Depression Care into 2 nonspecialty care settings—primary care and general hospitals. Finally, we review some of the challenges and lessons learned from our efforts to sustain this important work.
Building a System of Perfect Depression Care
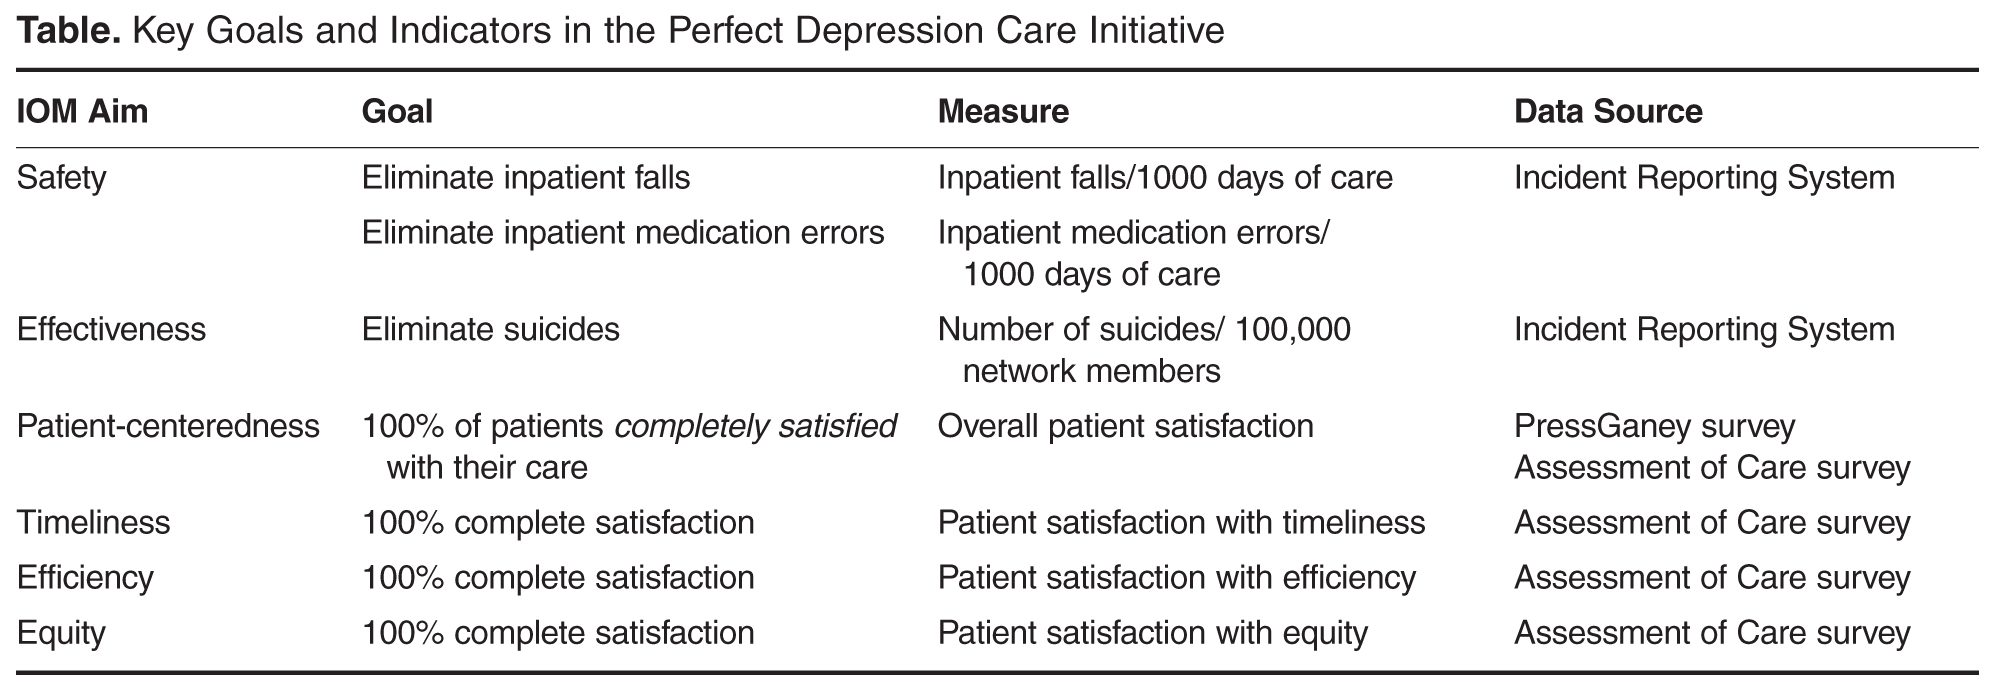
One example of the transformative power of a “zero defects” approach is the case of the Effectiveness aim. Our team engaged in vigorous debate about the goal for this aim. While some team members eagerly embraced the “zero defects” ambition and argued that truly perfect care could only mean “no suicides,” others challenged it, viewing it as lofty but unrealistic. After all, we had been taught that for some number of individuals with depression, suicide was the tragic yet inevitable outcome of their illness. How could it be possible to eliminate every single suicide? The debate was ultimately resolved when one team member asked, “If zero isn’t the right number of suicides, then what is? Two? Four? Forty?” The answer was obvious and undeniable. It was at that moment that setting “zero suicides” as the goal became a galvanizing force within BHS for the Perfect Depression Care initiative.
The pursuit of zero defects must take place within a “just culture,” an organizational environment in which frontline staff feel comfortable disclosing errors, especially their own, while still maintaining professional accountability [6]. Without a just culture, good but imperfect performance can breed disengagement and resentment. By contrast, within a just culture, it becomes possible to implement specific strategies and tactics to pursue perfection. Along the way, each step towards “zero defects” is celebrated because each defect that does occur is identified as an opportunity for learning.
One core strategy for Perfect Depression Care was organizing care according to the planned care model, a locally tailored version of the chronic care model [7]. We developed a clear vision for how each patient’s care would change in a system of Perfect Depression Care. We partnered with patients to ensure their voice in the redesign of our depression care services. We then conceptualized, designed, and tested strategies for improvement in 4 high-leverage domains (patient partnership, clinical practice, access to care, and information systems), which were identified through mapping our current care processes. Once this new model of care was in place, we implemented relevant measures of care quality and began continually assessing progress and then adjusting the plan as needed (ie, following the Model for Improvement).
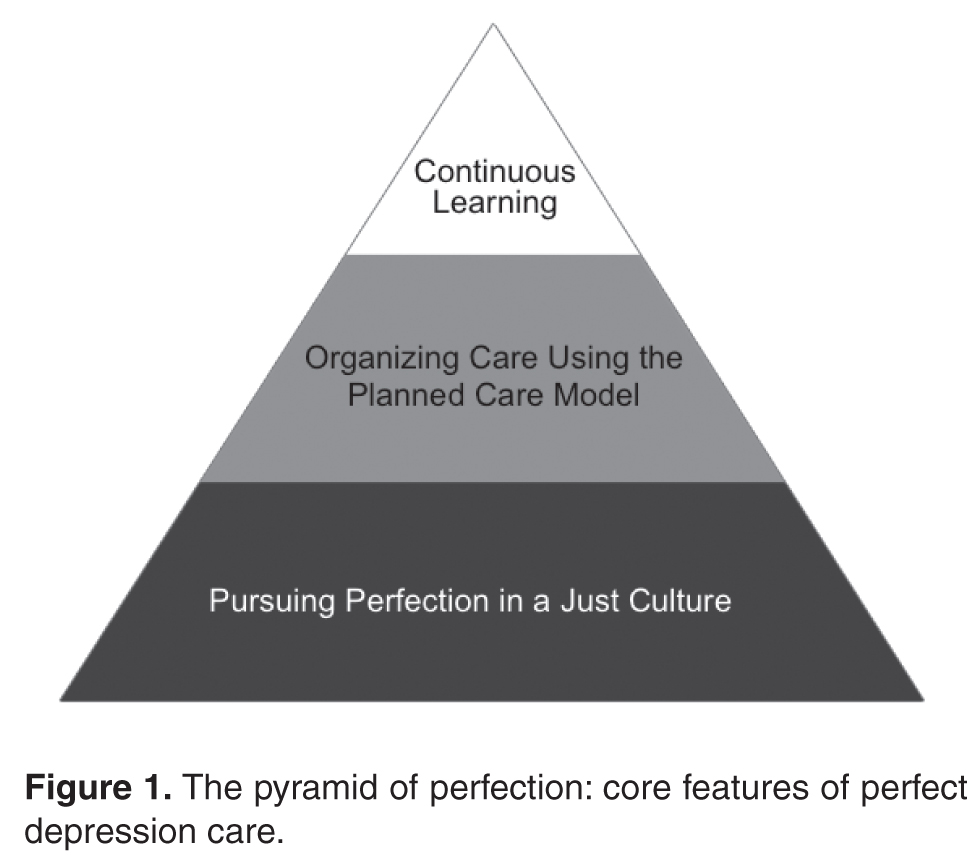
Spread to Primary Care
The spread to primary care began in 2005, about 5 years after the initial launch of Perfect Depression Care in BHS. (There had been some previous work done aimed at integrating depression screening into a small number of specialty chronic disease management initiatives, although that work was not sustained.) We based the overall clinical structure on the IMPACT model of integrated behavioral health care [10]. Primary care providers collaborated with depression care managers, typically nurses, who had been trained to provide education to primary care providers and problem solving therapy to patients. The care managers were supervised by a project leader (a full-time clinical psychologist) and supported by 2 full-time psychiatric nurse practitioners who were embedded in each clinic during the early phases of implementation. An electronic medical record (EMR) was comfortably in place and facilitated the delivery of evidence-based depression care, as well as the collection of relevant process and outcome measures, which were fed back to the care teams on a regular basis. And, importantly, the primary care leadership team formally sanctioned depression care to be spread to all 27 primary care clinics.
Overcoming the Challenges of the Primary Care Visits
From 2005 to 2010, the model was spread tenuously to 5 primary care clinics. At that rate (1 clinic per year), it would have taken over 20 years to spread depression care through all 27 primary care clinics. Not satisfied with this progress, we stepped back to consider why adoption was happening so slowly. First, we spoke with leaders. Although the project was on a shoestring budget, our leaders understood the business case for integrating some version of depression care into the primary care setting [11]. They advised limiting the scope of the project to focus only on adults with 1 of 6 chronic diseases: diabetes mellitus, congestive heart failure, coronary artery disease, chronic obstructive pulmonary disease (COPD), asthma, and chronic kidney disease. This narrower focus was aimed at using the project’s limited resources more effectively on behalf of patients who were more frequent utilizers of care and statistically more likely to have a comorbid depressive illness. Through the use of time studies, however, we learned that the time consumed discerning which patients each day were eligible for depression screening created delays in clinic workflow that were untenable. It turned out that the process of screening all patients was far more efficient that the process of identifying which patients “should” be screened and then screening only those who were identified. This pragmatic approach to daily workflow in the clinics was a key driver of successful spread.
Next, we spoke to patients. In an effort to assess patient engagement, we reviewed the records of 830 patients who had been seen in one of the clinics where depression care was up and running. Among this group, less than 1% had declined to receive depression screening. In fact, during informal discussions with patients and clinic staff, patients were thanking their primary care providers for talking with them about depression. When it came to spreading depression care, patient engagement was not the problem.
Finally, we spoke with primary care providers, physicians who were viewed as leaders in their clinics. They described trepidation among their teams about adopting an innovation that would lead to patients being identified as at risk for suicide. Their concern was not that integrating depression care was not the right thing to do in the primary care setting; indeed, they had a strong and genuine desire to provide better depression care for their patients. Their concern was that the primary care clinic was not equipped to manage a suicidal patient safely and effectively. This concern was real, and it was pervasive. After all, the typical primary care office visit was already replete with problem lists too long to be managed effectively in the diminishing amount of time allotted to each visit. Screening for depression would only make matters worse [12]. Furthermore, identifying a patient at risk for suicide was not uncommon in our primary care setting. Between 2006 and 2012, an average of 16% of primary care patients screened each year had reported some degree of suicidal ideation (as measures by a positive response on question 9 of the PHQ-9). These discussions showed us that the model of depression care we were trying to spread into primary care was not designed with an explicit and confident approach to suicide—it was not Perfect Depression Care.
Leveraging Suicide As a Driver of Spread
When we realized that the anxiety surrounding the management of a suicidal patient was the biggest obstacle to Perfect Depression Care spread to primary care, we decided to turn this obstacle into an opportunity. First, an interdisciplinary team developed a practice guideline for managing the suicidal patient in general medical settings. The guideline was based on the World Health Organization’s evidence-based guidelines for addressing mental health disorders in nonspecialized health settings [13] and modified into a single page to make it easy to adopt. Following the guideline was not at all a requirement, but doing so made it very easy to identify patients at potential risk for suicide and to refer them safely and seamlessly to the next most appropriate level of care.
Second, and most importantly, BHS made a formal commitment to provide immediate access for any patient referred by a primary care provider following the practice guideline. BHS pledged to perform the evaluation on the same day as the referral was made and without any questions asked. Delivering on this promise required BHS to develop and implement reliable processes for its ambulatory centers to receive same-day referrals from any one of 27 primary care clinics. Success meant delighting our customers in primary care while obviating the expense and trauma associated with sending patients to local emergency departments. This work was hard. And it was made possible by the culture within BHS of pursuing perfection.
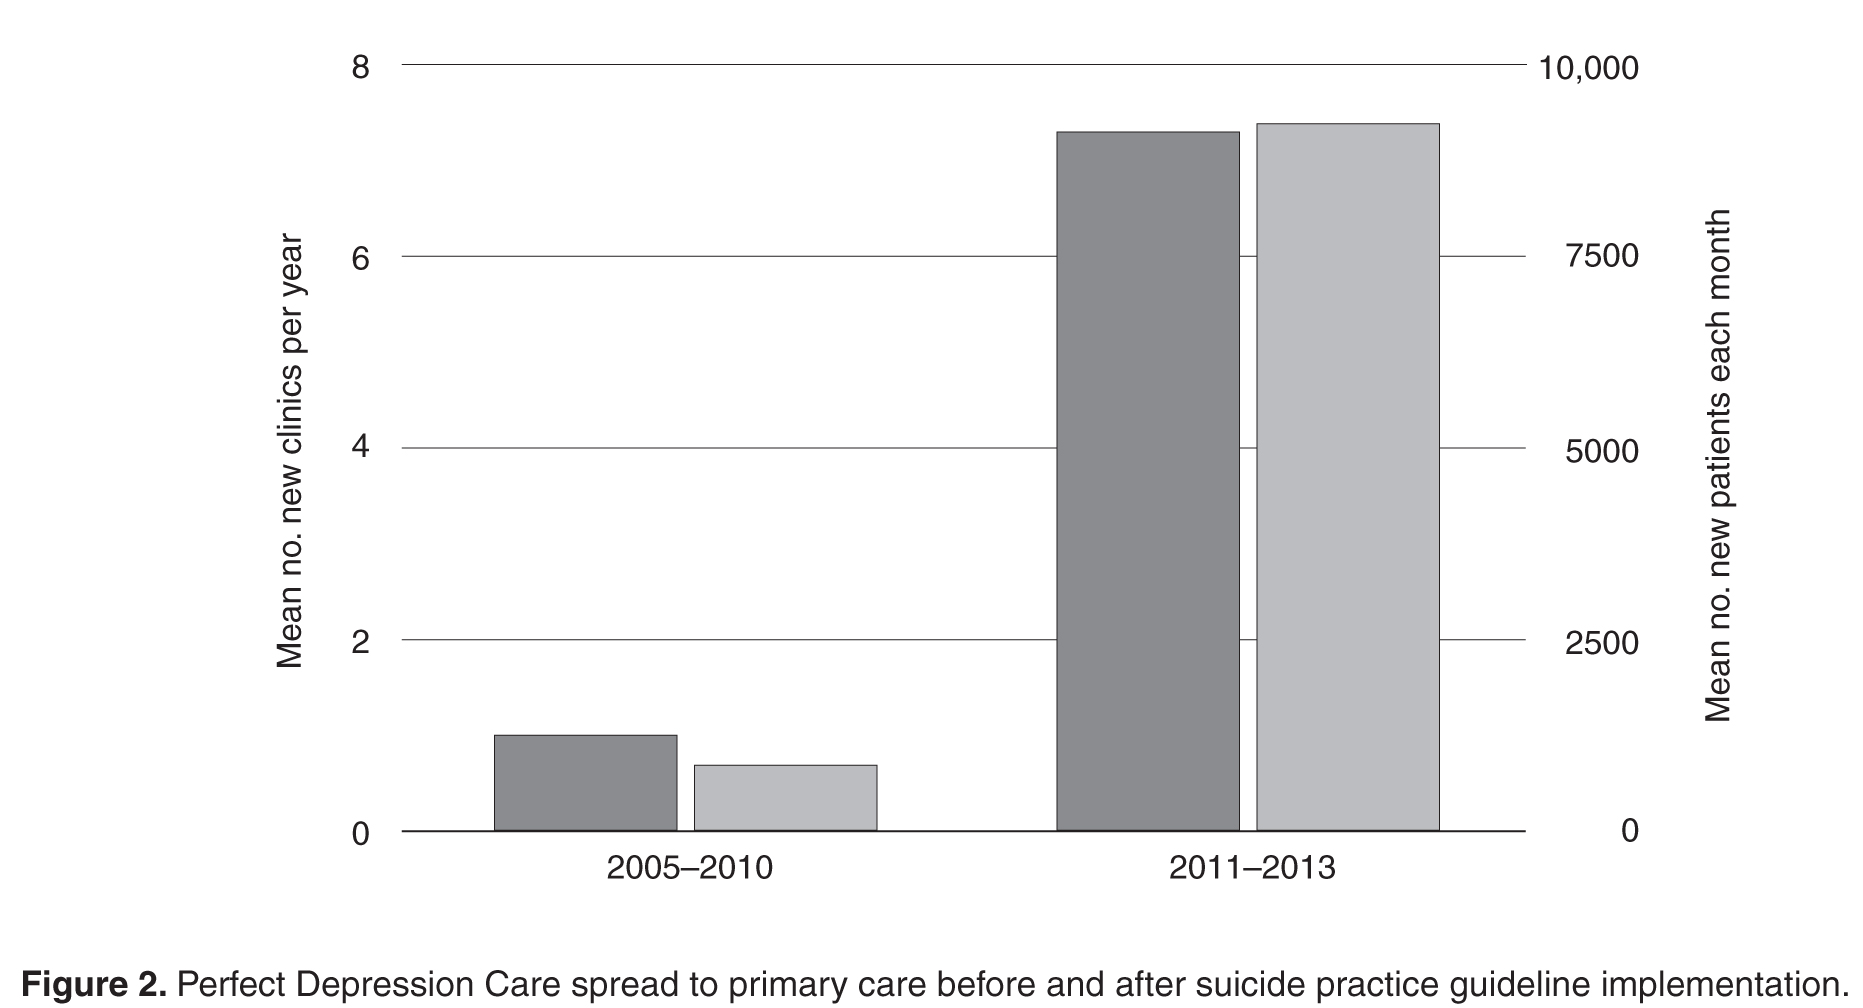
During this time of successful spread, project resources remained similar, no new or additional financial support was provided, and no new leadership directives had been communicated. The only new features of Perfect Depression Care spread were a 1-page practice guideline and a promise. Making suicide an explicit target of the intervention, and doing so in a ruthlessly practical way, created the conditions for the intervention to diffuse and be adopted more readily.
Spread to General Hospitals
In 2006, the Joint Commission established National Patient Safety Goal (NPSG) 15.01.01 for hospitals and health care facilities “to identify patients at risk for suicide” [14]. NPSG 15.01.01 applies not just to patients in psychiatric hospitals, but to all patients “being treated for emotional or behavioral disorders in general hospitals,” including emergency departments. As a measure of safety, suicide is the second most common sentinel event among hospitalized patients—only wrong-site surgery occurs more often. And when a suicide does take place in a hospital, the impact on patients, families, health care workers, and administrators is profound.
Still, completed suicide among hospitalized patients is statistically a very rare event. As a result, general hospitals find it challenging to meet the expectations set forth in NPSG 15.01.01, which seemingly asks hospitals to search for a needle in a haystack. Is it really valuable to ask a patient about suicide when that patient is a 16-year-old teenager who presented to the emergency department for minor scrapes and bruises sustained while skateboarding? Should all patients with “do not resuscitate” orders receive a mandatory, comprehensive suicide risk assessment? In 2010, general hospitals in our organization enlisted our Perfect Depression Care team to help them develop a meaningful approach to NPSG 15.01.01, and so Perfect Depression Care spread to general hospitals began.
The goal of NPSG 15.01.01 is “to identify patients at risk for suicide.” To accomplish this goal, hospital care teams need simple, efficient, evidence-based tools for identifying such patients and responding appropriately to the identified risk. In a general hospital setting, implementing targeted suicide risk assessments is simply not feasible. Assessing every single hospitalized patient for suicide risk seems clinically unnecessary, if not wasteful, and yet the processes needed to identify reliably which patients ought to be assessed end up taking far longer than simply screening everybody. With these considerations in mind, our Perfect Depression Care team took a different approach.
The DAPS Tool
We developed a simple and easy tool to screen, not for suicide risk specifically, but for common psychiatric conditions associated with increased risk of suicide. The Depression, Anxiety, Polysubstance Use, and Suicide screen (DAPS) [15] consists of 7 questions coming from 5 individual evidence-based screening measures: the PHQ-2 for depression, the GAD-2 for anxiety, question 9 from the PHQ-9 for suicidal ideation, the SASQ for problem alcohol use, and a single drug use question for substance use. Each of these questionnaires has been validated as a sensitive screening measure for the psychiatric condition of interest (eg, major depression, generalized anxiety, current problem drinking). Some of them have been validated specifically in general medical settings or among general medical patient populations. Moreover, each questionnaire is valid whether clinician-administered or self-completed. Some have also been validated in languages other than English.
The DAPS tool bundles together these separate screening measures into one easy to use and efficient tool. As a bundle, the DAPS tool offers 3 major advantages over traditional screening tools. First, the tool takes a broader approach to suicide risk with the aim of increasing utility. Suicide is a statistically rare event, especially in general medical settings. On the other hand, psychiatric conditions that themselves increase people’s risk of suicide are quite common, particularly in hospital settings. Rather than screening exclusively for suicidal thoughts and behavior, the DAPS tool screens for psychiatric conditions associated with an increased risk of suicide that are common in general medical settings. This approach to suicide screening is novel. It allows for the recognition of higher number of patients who may benefit from behavioral health interventions, whether or not they are “actively suicidal” at that moment. By not including extensive assessments of numerous suicide risk factors, the DAPS tool offers practical utility without losing much specificity. After all, persons in general hospital settings who at acutely increased risk of suicide (eg, a person admitted to the hospital following a suicide attempt via overdose) are already being identified.
The second advantage of the DAPS tool is that the information it obtains is actionable. Suicide screening tools, whether brief or comprehensive, are not immediately predictive and arrive at essentially the same conclusion—the person screened is deemed to fall into some risk stratification (eg, high, medium, low risk; acute vs non-acute risk). In general hospital settings, the responses to these stratifications are limited (eg, order a sitter, call a psychiatry consultation) and not specific to the level of risk. Furthermore, persons with psychiatric disorders may be at increased risk of suicide even if they deny having suicidal thoughts. The DAPS tool allows for the recognition of these persons, thus identifying opportunities for intervention. For example, a person who screens positive on the PHQ-2 portion of the DAPS but who denies having recent suicidal thoughts or behavior may not benefit from an immediate safety measure (eg, ordering a sitter) but may benefit from an evaluation and, if indicated, treatment for depression. Treating that person’s depression would decrease the longitudinal risk of suicide. If another person screens negative on the PHQ-2 but positive on the SASQ, then that person may benefit most from interventions targeting problem alcohol use, such as the initiation of a CIWA protocol in order to prevent the emergence of alcohol withdrawal during the hospitalization, but not necessarily from depression treatment.
The third main advantage of the DAPS tool is its ease of use. There are a limited number of psychiatrists and other mental health care workers in general hospitals, and that number is not adequate to have all psychiatric screens and assessments in performed by a specialist. The DAPS tool consists of scripted questions that any health care provider can read and follow. This type of instruction may be especially beneficial to health care providers who are unsure or uncomfortable about how to screen patients for suicide or psychiatric disorders. The DAPS tool provides these clinicians with language they can use comfortably when talking with patients. Alternatively, patients themselves can complete the DAPS questions, which frees up valuable time for providers to deliver other types of care. During a pilot project at one of our general hospitals, 20 general floor nurses were asked to implement the DAPS with their patients after receiving only a very brief set of instructions. On average, it took a nurse less than 4 minutes to complete the DAPS. Ninety percent of the nurses stated the DAPS tool would take “less time” or “no additional time” compared with the behavioral health questions in the current nursing admission assessment they were required to complete on every patient. Eighty-five percent found the tool “easy” or “very easy” to use.
At the time of publication of this article, one of our general hospitals is set to roll out DAPS screening hospital wide with the goal of prospectively identifying patients who might benefit from some form of behavioral health intervention and thus reducing length of stay. Another of our general hospitals is already using the DAPS to reduce hospital readmissions [15]. What started out as an initiative simply to meet a regulatory requirement turned into a novel and efficient means to bring mental health care services to hospitalized patients.
Lessons Learned
Our goal in the Perfect Depression Care initiative was to eliminate suicide, and we have come remarkably close to achieving that goal. Our determination to strive for perfection rather than incremental goals had a powerful effect on our results. To move to a different order of performance required us to challenge our most basic assumptions and required new learning and new behavior.
This social aspect of our improvement work was fundamental to every effort made to spread Perfect Depression Care outside of the specialty behavioral health care setting. Indeed, the diffusion of all innovation occurs within a social context [16]. Ideas do not spread by themselves—they are spread from one person (the messenger) to another (the adopter). Successful spread, therefore, depends in large part on the communication between messenger and adopter.
Implementing Perfect Depression Care within BHS involved like-minded messengers and adopters from the same department, whereas spreading the initiative to the general medical setting involved messengers from one specialty and adopters from another. The nature of such a social system demands that the goals of the messenger be aligned with the incentives of the adopter. In health service organizations, such alignment requires effective leadership, not just local champions [17]. For example, spreading the initiative to the primary care setting really only became possible when our departmental leaders made a public promise to the leaders of primary care that BHS would see any patient referred from primary care on the same day of referral with no questions asked. And while it is true that operationalizing that promise was a more arduous task than articulating it, the promise itself is what created a social space within which the innovation could diffuse.
Even if leaders are successful at aligning the messenger’s goals and the adopter’s incentives, spread still must actually occur locally between 2 people. This social context means that a “good” idea in the mind of the messenger must be a “better” idea in the mind of the adopter. In other words, an idea or innovation is more likely to be adopted if it is better than the status quo [18]. And it is the adopter’s definition of “better” that matters. For example, our organization’s primary care clinics agreed that improving their depression care was a good idea. However, specific interventions were not adopted (or adoptable) until they became a way to make daily life easier for the front-line clinic staff (eg, by facilitating more efficient referrals to BHS). Furthermore, because daily life in each clinic was a little bit different, the specific interventions adopted were allowed to vary. Similarly, in the general hospital setting, DAPS screening was nothing more than a good idea until the nurses learned that it took less time and yielded more actionable results than the long list of behavioral health screening questions they were currently required to complete on every patient being admitted. When replacing those questions with the DAPS screen saved time and added value, the DAPS became better than the status quo, a tipping point was reached, and spread took place.
Future Spread
The 2 examples of Perfect Depression Care Spread described herein are testaments to the social traction of “zero suicides.” Importantly, the success of each effort has hinged on its creative, practical approach to suicide, even though there is scant scientific evidence to support suicide prevention initiatives in general medical settings [19].
As it turns out, there is also little scientific knowledge about how innovations in health service organizations are successfully sustained [16]. It is our hope that the 15 years of Perfect Depression Care shed some light on this question, and that the initiative can continue to be sustained in today’s turbulent and increasingly austere health care environment. We are confident that we will keep improving as long as we keep learning.
In addition, we find tremendous inspiration in the many others who are learning and improving with us. In 2012, for instance, the US Surgeon General promoted the adoption “zero suicides” as a national strategic objective [1]. And in 2015, the Deputy Prime Minister of the United Kingdom called for the adoption of “zero suicides” across the entire National Health Service [20]. As the Perfect Depression Care team continues to grow, the pursuit of perfection becomes even more stirring.
Acknowledgment: The author acknowledges Brian K. Ahmedani, PhD, Charles E. Coffey, MD, MS, C. Edward Coffey, MD, Terri Robertson, PhD, and the entire Perfect Depression Care team.
Corresponding author: M. Justin Coffey, MD, The Menninger Clinic, 12301 S. Main St., Houston, TX 77035, jcoffey@menninger.edu.
Financial disclosures: None.
1. U.S. Department of Health and Human Services (HHS) Office of the Surgeon General and National Action Alliance for Suicide Prevention. 2012 National Strategy for Suicide Prevention: goals and objectives for action. Washington, DC: HHS; 2012.
2. Druss BG, Walker ER. Mental disorders and medical comorbidity: research synthesis report no. 21. Robert Wood Johnson Foundation 2011.
3. Committee on Quality Health Care in America, Institute of Medicine. Crossing the Quality Chasm. Washington, DC: National Academy Press; 2001.
4. Coffey CE, Coffey MJ, Ahmedani BK. An update on Perfect Depression Care. Psychiatric Services 2013;64:396.
5. Robert Wood Johnson Foundation. Pursuing Perfection: Raising the bar in health care performance. Robert Wood Johnson Foundation; 2014.
6. Marx D. Patient safety and the “just culture”: a primer for health care executives. New York: Columbia University; 2001.
7. Coleman K, Austin BT, Brach C, Wagner EH. Evidence on the chronic care model in the new millennium. Health Aff 2009;28:75–85.
8. Coffey CE. Building a system of perfect depression care in behavioral health. Jt Comm J Qual Patient Saf 2007;33:193–9.
9. Hampton T. Depression care effort brings dramatic drop in large HMO population’s suicide rate. JAMA 2010;303: 1903–5.
10. Unützer J, Powers D, Katon W, Langston C. From establishing an evidence-based practice to implementation in real-world settings: IMPACT as a case study. Psychiatr Clin North Am 2005;28:1079–92.
11. Melek SP, Norris DT, Paulus J. Economic impact of integrated medical-behavioral healthcare: implications for psychiatry. Milliman; 2014.
12. Schmitt MR, Miller MJ, Harrison DL, Touchet BK. Relationship of depression screening and physician office visit duration in a national sample. Psych Svc 2010;61:1126–31.
13. mhGAP intervention guide for mental, neurological, and substance use disorders in non-specialized health settings: Mental Health Gap Action Programme (mhGAP). World Health Organization; 2010.
14. National Patient Safety Goals 2008. The Joint Commission. Oakbrook, IL.
15. Coffey CE, Johns J, Veliz S, Coffey MJ. The DAPS tool: an actionable screen for psychiatric risk factors for rehospitalization. J Hosp Med 2012;7(suppl 2):S100–101.
16. Greenhalgh T, Robert G, Macfarlane F, et al. Diffusion of innovations in service organizations: systematic review and recommendations. Milbank Q 2004;82:581–629.
17. Berwick DM. Disseminating innovations in health care. JAMA 2003;289:1969–75.
18. Rogers EM. Diffusion of innovations. 4th ed. New York: The Free Press; 1995.
19. LeFevre MF. Screening for suicide risk in adolescents, adults, and older adults in primary care: US Preventive Services Task Force Recommendation Statement. Ann Intern Med 2014;160:719–26.
20. Clegg N. Speech at mental health conference. Available at www.gov.uk/government/speeches/nick-clegg-at-mental-health-conference.
From The Menninger Clinic, Houston, TX.
Abstract
- Objective: To summarize the Perfect Depression Care initiative and describe recent work to spread this quality improvement initiative.
- Methods: We summarize the background and methodology of the Perfect Depression Care initiative within the specialty behavioral health care setting and then describe the application of this methodology to 2 examples of spreading Perfect Depression Care to general medical settings: primary care and general hospitals.
- Results: In the primary care setting, Perfect Depression Care spread successfully in association with the development and implementation of a practice guideline for managing the potentially suicidal patient. In the general hospital setting, Perfect Depression Care is spreading successfully in association with the development and implementation of a simple and efficient tool to screen not for suicide risk specifically, but for common psychiatric conditions associated with increased risk of suicide.
- Conclusion: Both examples of spreading Perfect Depression Care to general medical settings illustrate the social traction of “zero suicides,” the audacious and transformative goal of the Perfect Depression Care Initiative.
Each year depression affects roughly 10% of adults in the United States [1]. The leading cause of disability in developed countries, depression results in substantial medical care expenditures, lost productivity, and absenteeism [1]. It is a chronic condition, and one that is associated with tremendous comorbidity from multiple chronic general medical conditions, including congestive heart failure, coronary artery disease, and diabetes [2]. Moreover, the presence of depression has deleterious effects on the outcomes of those comorbid conditions [2]. Untreated or poorly treated, depression can be deadly—each year as many as 10% of patients with major depression die from suicide [1].
In 1999 the Behavioral Health Services (BHS) division of Henry Ford Health System in Detroit, Michigan, set out to eliminate suicide among all patients with depression in our HMO network. This audacious goal was a key lever in a broader aim, which was to build a system of perfect depression care. We aimed to achieve breakthrough improvement in quality and safety by completely redesigning the delivery of depression care using the 6 aims and 10 new rules set forth in the Institute of Medicine’s (IOM) report Crossing the Quality Chasm [3]. To communicate our bold vision, we called the initiative Perfect Depression Care. Today, we can report a dramatic and sustained reduction in suicide that is unprecedented in the clinical and quality improvement literature [4].
In the Chasm report, the IOM cast a spotlight on behavioral health care, placing depression and anxiety disorders on the short list of priority conditions for immediate national attention and improvement. Importantly, the IOM called for a focus on not only behavioral health care benefits and coverage, but access and quality of care for all persons with depression. Finding inspiration from our success in the specialty behavioral health care setting, we decided to answer the IOM’s call. We set out to build a system of depression care that is not confined to the specialty behavioral health care setting, a system that delivers perfect care to every patient with depression, regardless of general medical comorbidity or care setting. We called this work Perfect Depression Care Spread.
In this article, we first summarize the background and methodology of the Perfect Depression Care initiative. We then describe the application of this methodology to spreading Perfect Depression Care into 2 nonspecialty care settings—primary care and general hospitals. Finally, we review some of the challenges and lessons learned from our efforts to sustain this important work.
Building a System of Perfect Depression Care
One example of the transformative power of a “zero defects” approach is the case of the Effectiveness aim. Our team engaged in vigorous debate about the goal for this aim. While some team members eagerly embraced the “zero defects” ambition and argued that truly perfect care could only mean “no suicides,” others challenged it, viewing it as lofty but unrealistic. After all, we had been taught that for some number of individuals with depression, suicide was the tragic yet inevitable outcome of their illness. How could it be possible to eliminate every single suicide? The debate was ultimately resolved when one team member asked, “If zero isn’t the right number of suicides, then what is? Two? Four? Forty?” The answer was obvious and undeniable. It was at that moment that setting “zero suicides” as the goal became a galvanizing force within BHS for the Perfect Depression Care initiative.
The pursuit of zero defects must take place within a “just culture,” an organizational environment in which frontline staff feel comfortable disclosing errors, especially their own, while still maintaining professional accountability [6]. Without a just culture, good but imperfect performance can breed disengagement and resentment. By contrast, within a just culture, it becomes possible to implement specific strategies and tactics to pursue perfection. Along the way, each step towards “zero defects” is celebrated because each defect that does occur is identified as an opportunity for learning.
One core strategy for Perfect Depression Care was organizing care according to the planned care model, a locally tailored version of the chronic care model [7]. We developed a clear vision for how each patient’s care would change in a system of Perfect Depression Care. We partnered with patients to ensure their voice in the redesign of our depression care services. We then conceptualized, designed, and tested strategies for improvement in 4 high-leverage domains (patient partnership, clinical practice, access to care, and information systems), which were identified through mapping our current care processes. Once this new model of care was in place, we implemented relevant measures of care quality and began continually assessing progress and then adjusting the plan as needed (ie, following the Model for Improvement).
Spread to Primary Care
The spread to primary care began in 2005, about 5 years after the initial launch of Perfect Depression Care in BHS. (There had been some previous work done aimed at integrating depression screening into a small number of specialty chronic disease management initiatives, although that work was not sustained.) We based the overall clinical structure on the IMPACT model of integrated behavioral health care [10]. Primary care providers collaborated with depression care managers, typically nurses, who had been trained to provide education to primary care providers and problem solving therapy to patients. The care managers were supervised by a project leader (a full-time clinical psychologist) and supported by 2 full-time psychiatric nurse practitioners who were embedded in each clinic during the early phases of implementation. An electronic medical record (EMR) was comfortably in place and facilitated the delivery of evidence-based depression care, as well as the collection of relevant process and outcome measures, which were fed back to the care teams on a regular basis. And, importantly, the primary care leadership team formally sanctioned depression care to be spread to all 27 primary care clinics.
Overcoming the Challenges of the Primary Care Visits
From 2005 to 2010, the model was spread tenuously to 5 primary care clinics. At that rate (1 clinic per year), it would have taken over 20 years to spread depression care through all 27 primary care clinics. Not satisfied with this progress, we stepped back to consider why adoption was happening so slowly. First, we spoke with leaders. Although the project was on a shoestring budget, our leaders understood the business case for integrating some version of depression care into the primary care setting [11]. They advised limiting the scope of the project to focus only on adults with 1 of 6 chronic diseases: diabetes mellitus, congestive heart failure, coronary artery disease, chronic obstructive pulmonary disease (COPD), asthma, and chronic kidney disease. This narrower focus was aimed at using the project’s limited resources more effectively on behalf of patients who were more frequent utilizers of care and statistically more likely to have a comorbid depressive illness. Through the use of time studies, however, we learned that the time consumed discerning which patients each day were eligible for depression screening created delays in clinic workflow that were untenable. It turned out that the process of screening all patients was far more efficient that the process of identifying which patients “should” be screened and then screening only those who were identified. This pragmatic approach to daily workflow in the clinics was a key driver of successful spread.
Next, we spoke to patients. In an effort to assess patient engagement, we reviewed the records of 830 patients who had been seen in one of the clinics where depression care was up and running. Among this group, less than 1% had declined to receive depression screening. In fact, during informal discussions with patients and clinic staff, patients were thanking their primary care providers for talking with them about depression. When it came to spreading depression care, patient engagement was not the problem.
Finally, we spoke with primary care providers, physicians who were viewed as leaders in their clinics. They described trepidation among their teams about adopting an innovation that would lead to patients being identified as at risk for suicide. Their concern was not that integrating depression care was not the right thing to do in the primary care setting; indeed, they had a strong and genuine desire to provide better depression care for their patients. Their concern was that the primary care clinic was not equipped to manage a suicidal patient safely and effectively. This concern was real, and it was pervasive. After all, the typical primary care office visit was already replete with problem lists too long to be managed effectively in the diminishing amount of time allotted to each visit. Screening for depression would only make matters worse [12]. Furthermore, identifying a patient at risk for suicide was not uncommon in our primary care setting. Between 2006 and 2012, an average of 16% of primary care patients screened each year had reported some degree of suicidal ideation (as measures by a positive response on question 9 of the PHQ-9). These discussions showed us that the model of depression care we were trying to spread into primary care was not designed with an explicit and confident approach to suicide—it was not Perfect Depression Care.
Leveraging Suicide As a Driver of Spread
When we realized that the anxiety surrounding the management of a suicidal patient was the biggest obstacle to Perfect Depression Care spread to primary care, we decided to turn this obstacle into an opportunity. First, an interdisciplinary team developed a practice guideline for managing the suicidal patient in general medical settings. The guideline was based on the World Health Organization’s evidence-based guidelines for addressing mental health disorders in nonspecialized health settings [13] and modified into a single page to make it easy to adopt. Following the guideline was not at all a requirement, but doing so made it very easy to identify patients at potential risk for suicide and to refer them safely and seamlessly to the next most appropriate level of care.
Second, and most importantly, BHS made a formal commitment to provide immediate access for any patient referred by a primary care provider following the practice guideline. BHS pledged to perform the evaluation on the same day as the referral was made and without any questions asked. Delivering on this promise required BHS to develop and implement reliable processes for its ambulatory centers to receive same-day referrals from any one of 27 primary care clinics. Success meant delighting our customers in primary care while obviating the expense and trauma associated with sending patients to local emergency departments. This work was hard. And it was made possible by the culture within BHS of pursuing perfection.
During this time of successful spread, project resources remained similar, no new or additional financial support was provided, and no new leadership directives had been communicated. The only new features of Perfect Depression Care spread were a 1-page practice guideline and a promise. Making suicide an explicit target of the intervention, and doing so in a ruthlessly practical way, created the conditions for the intervention to diffuse and be adopted more readily.
Spread to General Hospitals
In 2006, the Joint Commission established National Patient Safety Goal (NPSG) 15.01.01 for hospitals and health care facilities “to identify patients at risk for suicide” [14]. NPSG 15.01.01 applies not just to patients in psychiatric hospitals, but to all patients “being treated for emotional or behavioral disorders in general hospitals,” including emergency departments. As a measure of safety, suicide is the second most common sentinel event among hospitalized patients—only wrong-site surgery occurs more often. And when a suicide does take place in a hospital, the impact on patients, families, health care workers, and administrators is profound.
Still, completed suicide among hospitalized patients is statistically a very rare event. As a result, general hospitals find it challenging to meet the expectations set forth in NPSG 15.01.01, which seemingly asks hospitals to search for a needle in a haystack. Is it really valuable to ask a patient about suicide when that patient is a 16-year-old teenager who presented to the emergency department for minor scrapes and bruises sustained while skateboarding? Should all patients with “do not resuscitate” orders receive a mandatory, comprehensive suicide risk assessment? In 2010, general hospitals in our organization enlisted our Perfect Depression Care team to help them develop a meaningful approach to NPSG 15.01.01, and so Perfect Depression Care spread to general hospitals began.
The goal of NPSG 15.01.01 is “to identify patients at risk for suicide.” To accomplish this goal, hospital care teams need simple, efficient, evidence-based tools for identifying such patients and responding appropriately to the identified risk. In a general hospital setting, implementing targeted suicide risk assessments is simply not feasible. Assessing every single hospitalized patient for suicide risk seems clinically unnecessary, if not wasteful, and yet the processes needed to identify reliably which patients ought to be assessed end up taking far longer than simply screening everybody. With these considerations in mind, our Perfect Depression Care team took a different approach.
The DAPS Tool
We developed a simple and easy tool to screen, not for suicide risk specifically, but for common psychiatric conditions associated with increased risk of suicide. The Depression, Anxiety, Polysubstance Use, and Suicide screen (DAPS) [15] consists of 7 questions coming from 5 individual evidence-based screening measures: the PHQ-2 for depression, the GAD-2 for anxiety, question 9 from the PHQ-9 for suicidal ideation, the SASQ for problem alcohol use, and a single drug use question for substance use. Each of these questionnaires has been validated as a sensitive screening measure for the psychiatric condition of interest (eg, major depression, generalized anxiety, current problem drinking). Some of them have been validated specifically in general medical settings or among general medical patient populations. Moreover, each questionnaire is valid whether clinician-administered or self-completed. Some have also been validated in languages other than English.
The DAPS tool bundles together these separate screening measures into one easy to use and efficient tool. As a bundle, the DAPS tool offers 3 major advantages over traditional screening tools. First, the tool takes a broader approach to suicide risk with the aim of increasing utility. Suicide is a statistically rare event, especially in general medical settings. On the other hand, psychiatric conditions that themselves increase people’s risk of suicide are quite common, particularly in hospital settings. Rather than screening exclusively for suicidal thoughts and behavior, the DAPS tool screens for psychiatric conditions associated with an increased risk of suicide that are common in general medical settings. This approach to suicide screening is novel. It allows for the recognition of higher number of patients who may benefit from behavioral health interventions, whether or not they are “actively suicidal” at that moment. By not including extensive assessments of numerous suicide risk factors, the DAPS tool offers practical utility without losing much specificity. After all, persons in general hospital settings who at acutely increased risk of suicide (eg, a person admitted to the hospital following a suicide attempt via overdose) are already being identified.
The second advantage of the DAPS tool is that the information it obtains is actionable. Suicide screening tools, whether brief or comprehensive, are not immediately predictive and arrive at essentially the same conclusion—the person screened is deemed to fall into some risk stratification (eg, high, medium, low risk; acute vs non-acute risk). In general hospital settings, the responses to these stratifications are limited (eg, order a sitter, call a psychiatry consultation) and not specific to the level of risk. Furthermore, persons with psychiatric disorders may be at increased risk of suicide even if they deny having suicidal thoughts. The DAPS tool allows for the recognition of these persons, thus identifying opportunities for intervention. For example, a person who screens positive on the PHQ-2 portion of the DAPS but who denies having recent suicidal thoughts or behavior may not benefit from an immediate safety measure (eg, ordering a sitter) but may benefit from an evaluation and, if indicated, treatment for depression. Treating that person’s depression would decrease the longitudinal risk of suicide. If another person screens negative on the PHQ-2 but positive on the SASQ, then that person may benefit most from interventions targeting problem alcohol use, such as the initiation of a CIWA protocol in order to prevent the emergence of alcohol withdrawal during the hospitalization, but not necessarily from depression treatment.
The third main advantage of the DAPS tool is its ease of use. There are a limited number of psychiatrists and other mental health care workers in general hospitals, and that number is not adequate to have all psychiatric screens and assessments in performed by a specialist. The DAPS tool consists of scripted questions that any health care provider can read and follow. This type of instruction may be especially beneficial to health care providers who are unsure or uncomfortable about how to screen patients for suicide or psychiatric disorders. The DAPS tool provides these clinicians with language they can use comfortably when talking with patients. Alternatively, patients themselves can complete the DAPS questions, which frees up valuable time for providers to deliver other types of care. During a pilot project at one of our general hospitals, 20 general floor nurses were asked to implement the DAPS with their patients after receiving only a very brief set of instructions. On average, it took a nurse less than 4 minutes to complete the DAPS. Ninety percent of the nurses stated the DAPS tool would take “less time” or “no additional time” compared with the behavioral health questions in the current nursing admission assessment they were required to complete on every patient. Eighty-five percent found the tool “easy” or “very easy” to use.
At the time of publication of this article, one of our general hospitals is set to roll out DAPS screening hospital wide with the goal of prospectively identifying patients who might benefit from some form of behavioral health intervention and thus reducing length of stay. Another of our general hospitals is already using the DAPS to reduce hospital readmissions [15]. What started out as an initiative simply to meet a regulatory requirement turned into a novel and efficient means to bring mental health care services to hospitalized patients.
Lessons Learned
Our goal in the Perfect Depression Care initiative was to eliminate suicide, and we have come remarkably close to achieving that goal. Our determination to strive for perfection rather than incremental goals had a powerful effect on our results. To move to a different order of performance required us to challenge our most basic assumptions and required new learning and new behavior.
This social aspect of our improvement work was fundamental to every effort made to spread Perfect Depression Care outside of the specialty behavioral health care setting. Indeed, the diffusion of all innovation occurs within a social context [16]. Ideas do not spread by themselves—they are spread from one person (the messenger) to another (the adopter). Successful spread, therefore, depends in large part on the communication between messenger and adopter.
Implementing Perfect Depression Care within BHS involved like-minded messengers and adopters from the same department, whereas spreading the initiative to the general medical setting involved messengers from one specialty and adopters from another. The nature of such a social system demands that the goals of the messenger be aligned with the incentives of the adopter. In health service organizations, such alignment requires effective leadership, not just local champions [17]. For example, spreading the initiative to the primary care setting really only became possible when our departmental leaders made a public promise to the leaders of primary care that BHS would see any patient referred from primary care on the same day of referral with no questions asked. And while it is true that operationalizing that promise was a more arduous task than articulating it, the promise itself is what created a social space within which the innovation could diffuse.
Even if leaders are successful at aligning the messenger’s goals and the adopter’s incentives, spread still must actually occur locally between 2 people. This social context means that a “good” idea in the mind of the messenger must be a “better” idea in the mind of the adopter. In other words, an idea or innovation is more likely to be adopted if it is better than the status quo [18]. And it is the adopter’s definition of “better” that matters. For example, our organization’s primary care clinics agreed that improving their depression care was a good idea. However, specific interventions were not adopted (or adoptable) until they became a way to make daily life easier for the front-line clinic staff (eg, by facilitating more efficient referrals to BHS). Furthermore, because daily life in each clinic was a little bit different, the specific interventions adopted were allowed to vary. Similarly, in the general hospital setting, DAPS screening was nothing more than a good idea until the nurses learned that it took less time and yielded more actionable results than the long list of behavioral health screening questions they were currently required to complete on every patient being admitted. When replacing those questions with the DAPS screen saved time and added value, the DAPS became better than the status quo, a tipping point was reached, and spread took place.
Future Spread
The 2 examples of Perfect Depression Care Spread described herein are testaments to the social traction of “zero suicides.” Importantly, the success of each effort has hinged on its creative, practical approach to suicide, even though there is scant scientific evidence to support suicide prevention initiatives in general medical settings [19].
As it turns out, there is also little scientific knowledge about how innovations in health service organizations are successfully sustained [16]. It is our hope that the 15 years of Perfect Depression Care shed some light on this question, and that the initiative can continue to be sustained in today’s turbulent and increasingly austere health care environment. We are confident that we will keep improving as long as we keep learning.
In addition, we find tremendous inspiration in the many others who are learning and improving with us. In 2012, for instance, the US Surgeon General promoted the adoption “zero suicides” as a national strategic objective [1]. And in 2015, the Deputy Prime Minister of the United Kingdom called for the adoption of “zero suicides” across the entire National Health Service [20]. As the Perfect Depression Care team continues to grow, the pursuit of perfection becomes even more stirring.
Acknowledgment: The author acknowledges Brian K. Ahmedani, PhD, Charles E. Coffey, MD, MS, C. Edward Coffey, MD, Terri Robertson, PhD, and the entire Perfect Depression Care team.
Corresponding author: M. Justin Coffey, MD, The Menninger Clinic, 12301 S. Main St., Houston, TX 77035, jcoffey@menninger.edu.
Financial disclosures: None.
1. U.S. Department of Health and Human Services (HHS) Office of the Surgeon General and National Action Alliance for Suicide Prevention. 2012 National Strategy for Suicide Prevention: goals and objectives for action. Washington, DC: HHS; 2012.
2. Druss BG, Walker ER. Mental disorders and medical comorbidity: research synthesis report no. 21. Robert Wood Johnson Foundation 2011.
3. Committee on Quality Health Care in America, Institute of Medicine. Crossing the Quality Chasm. Washington, DC: National Academy Press; 2001.
4. Coffey CE, Coffey MJ, Ahmedani BK. An update on Perfect Depression Care. Psychiatric Services 2013;64:396.
5. Robert Wood Johnson Foundation. Pursuing Perfection: Raising the bar in health care performance. Robert Wood Johnson Foundation; 2014.
6. Marx D. Patient safety and the “just culture”: a primer for health care executives. New York: Columbia University; 2001.
7. Coleman K, Austin BT, Brach C, Wagner EH. Evidence on the chronic care model in the new millennium. Health Aff 2009;28:75–85.
8. Coffey CE. Building a system of perfect depression care in behavioral health. Jt Comm J Qual Patient Saf 2007;33:193–9.
9. Hampton T. Depression care effort brings dramatic drop in large HMO population’s suicide rate. JAMA 2010;303: 1903–5.
10. Unützer J, Powers D, Katon W, Langston C. From establishing an evidence-based practice to implementation in real-world settings: IMPACT as a case study. Psychiatr Clin North Am 2005;28:1079–92.
11. Melek SP, Norris DT, Paulus J. Economic impact of integrated medical-behavioral healthcare: implications for psychiatry. Milliman; 2014.
12. Schmitt MR, Miller MJ, Harrison DL, Touchet BK. Relationship of depression screening and physician office visit duration in a national sample. Psych Svc 2010;61:1126–31.
13. mhGAP intervention guide for mental, neurological, and substance use disorders in non-specialized health settings: Mental Health Gap Action Programme (mhGAP). World Health Organization; 2010.
14. National Patient Safety Goals 2008. The Joint Commission. Oakbrook, IL.
15. Coffey CE, Johns J, Veliz S, Coffey MJ. The DAPS tool: an actionable screen for psychiatric risk factors for rehospitalization. J Hosp Med 2012;7(suppl 2):S100–101.
16. Greenhalgh T, Robert G, Macfarlane F, et al. Diffusion of innovations in service organizations: systematic review and recommendations. Milbank Q 2004;82:581–629.
17. Berwick DM. Disseminating innovations in health care. JAMA 2003;289:1969–75.
18. Rogers EM. Diffusion of innovations. 4th ed. New York: The Free Press; 1995.
19. LeFevre MF. Screening for suicide risk in adolescents, adults, and older adults in primary care: US Preventive Services Task Force Recommendation Statement. Ann Intern Med 2014;160:719–26.
20. Clegg N. Speech at mental health conference. Available at www.gov.uk/government/speeches/nick-clegg-at-mental-health-conference.