User login
Improved Safety Event Reporting in Outpatient, Nonacademic Practices with an Anonymous, Nonpunitive Approach
From Novant Health and Novant Health Medical Group, Winston-Salem, NC.
Abstract
- Objective: To evaluate the effect of an educational intervention with regular audit and feedback on reporting of patient safety events in a nonacademic, community practice setting with an established reporting system.
- Methods: A quasi-experimental with comparator design was used to compare a 6-practice collaborative group with a 27-practice comparator group with regard to safety event reporting rates. Baseline data were collected for a 12-month period followed by recruitment of 6 practices (3 family medicine, 2 pediatric, and 1 general surgery). An educational intervention was carried out with each, and this was followed by monthly audit and regular written and in-person feedback. Practice-level comparisons were made with specialty- and size-matched practices for the 6 practices in the collaborative group.
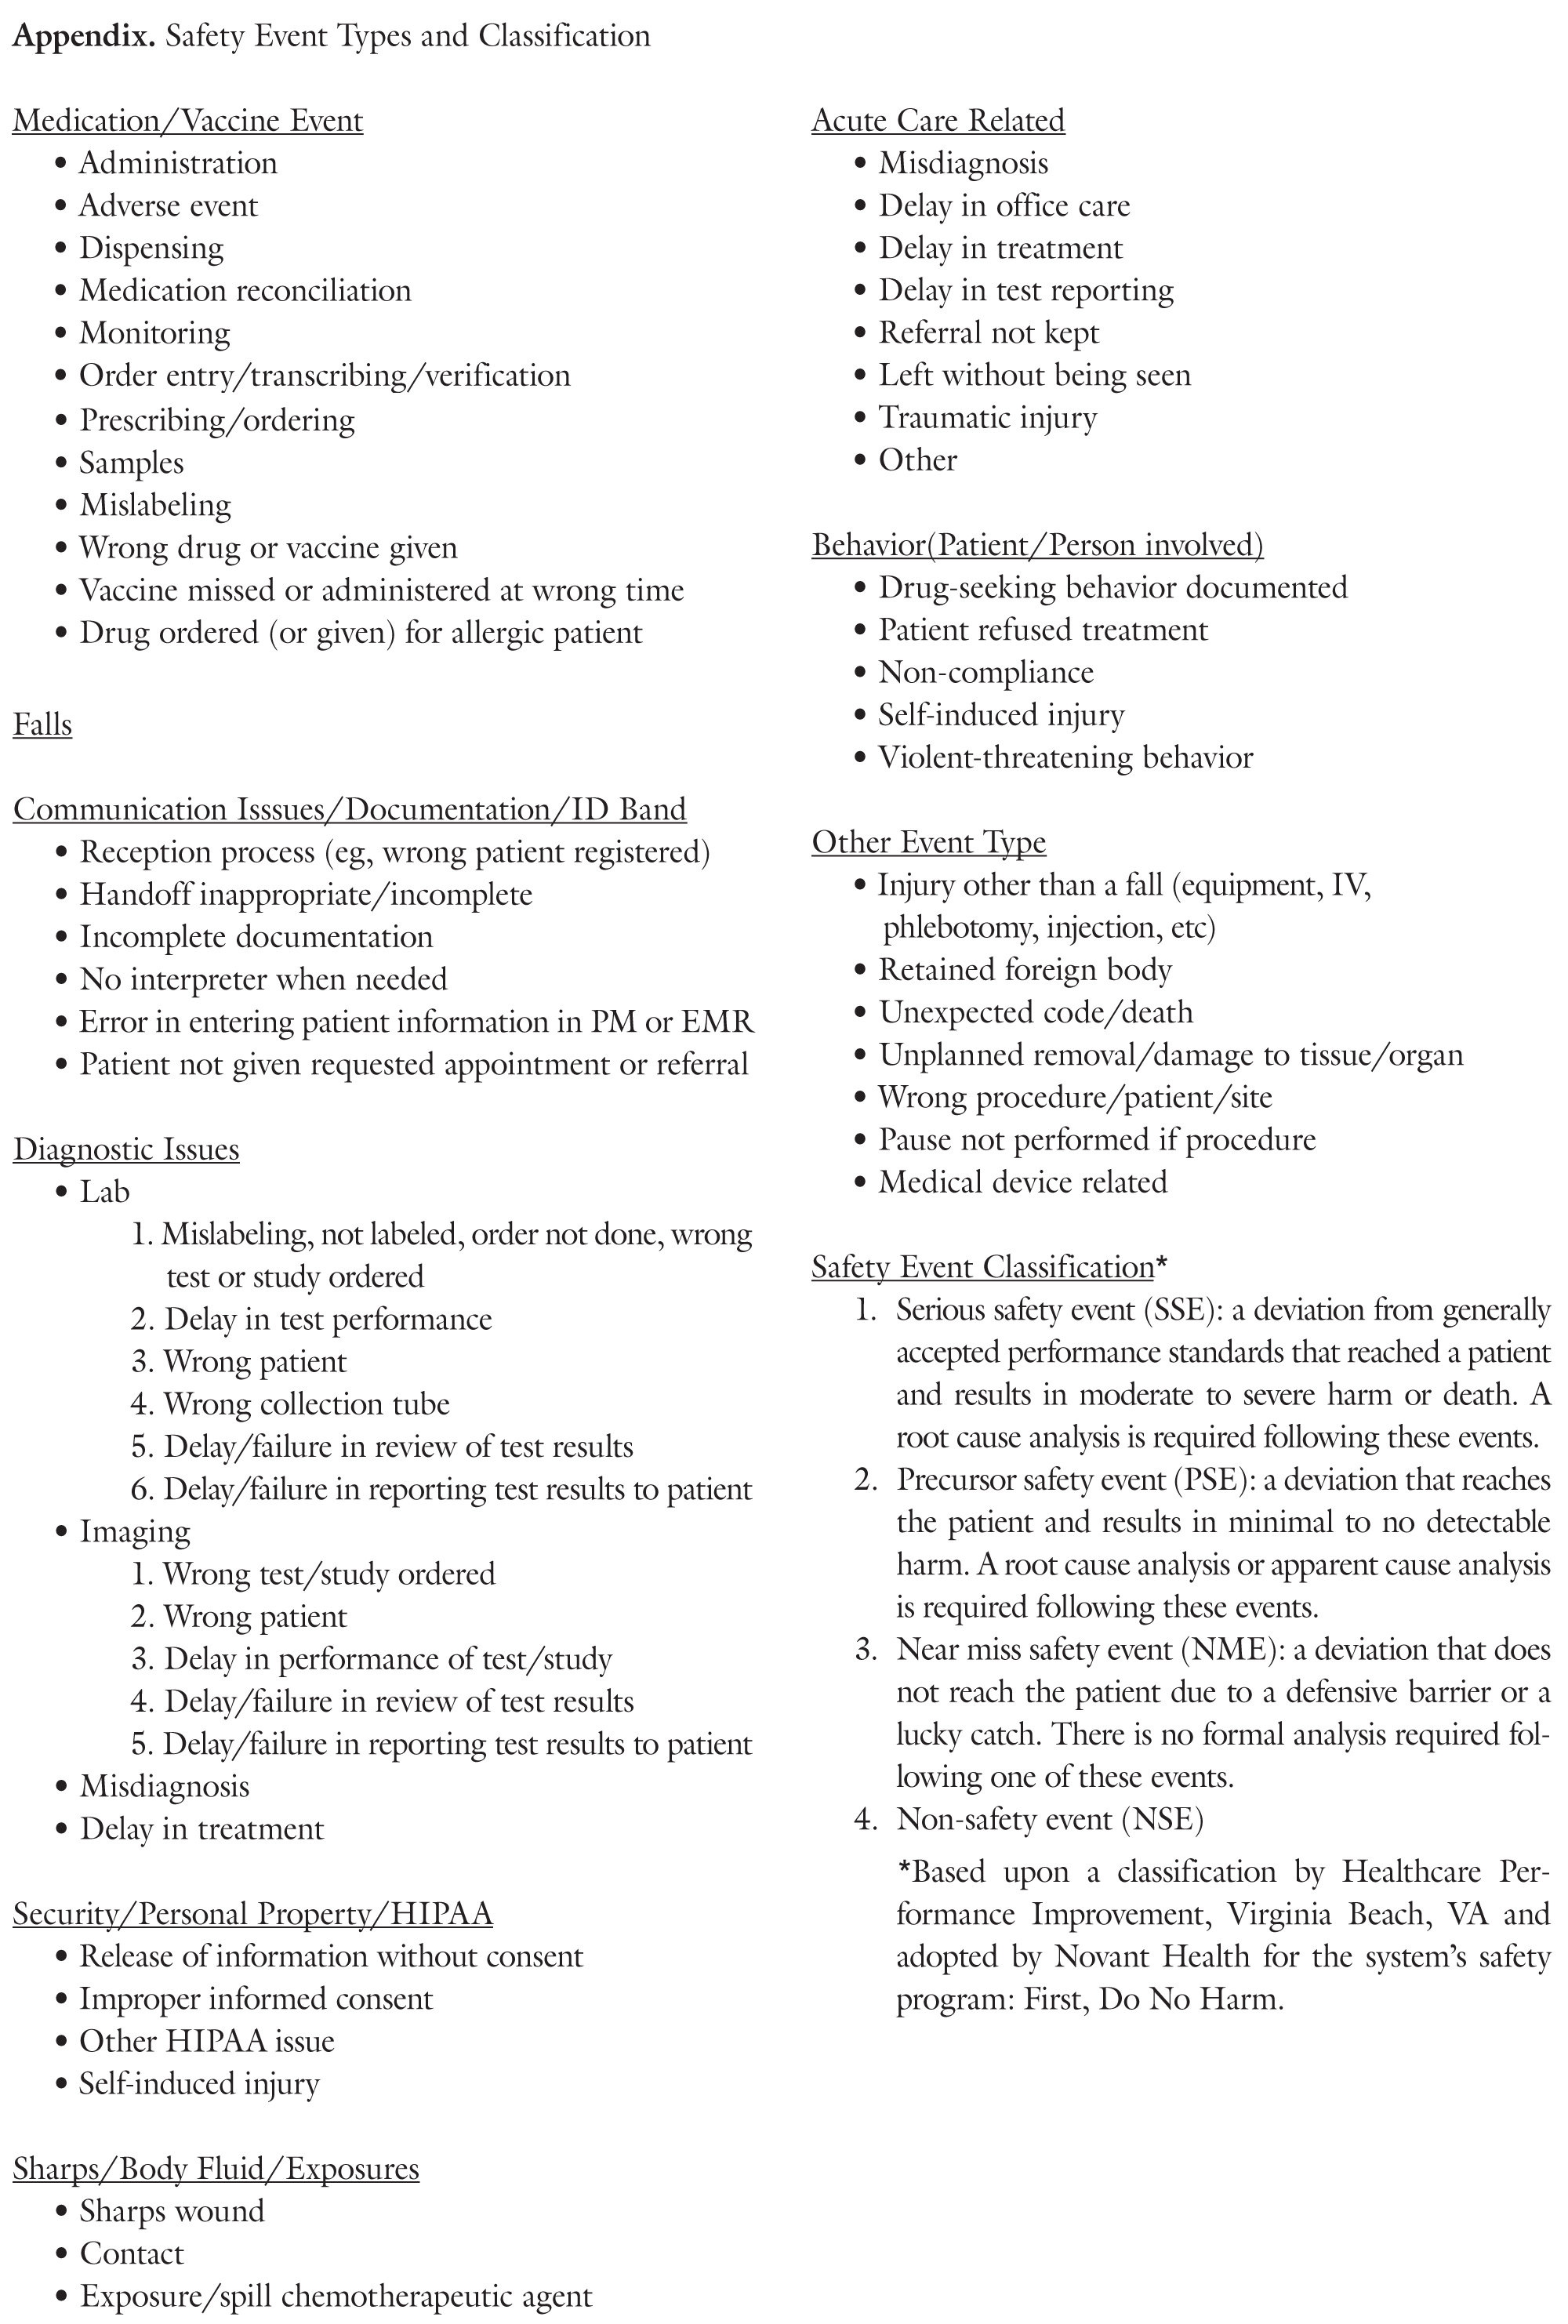
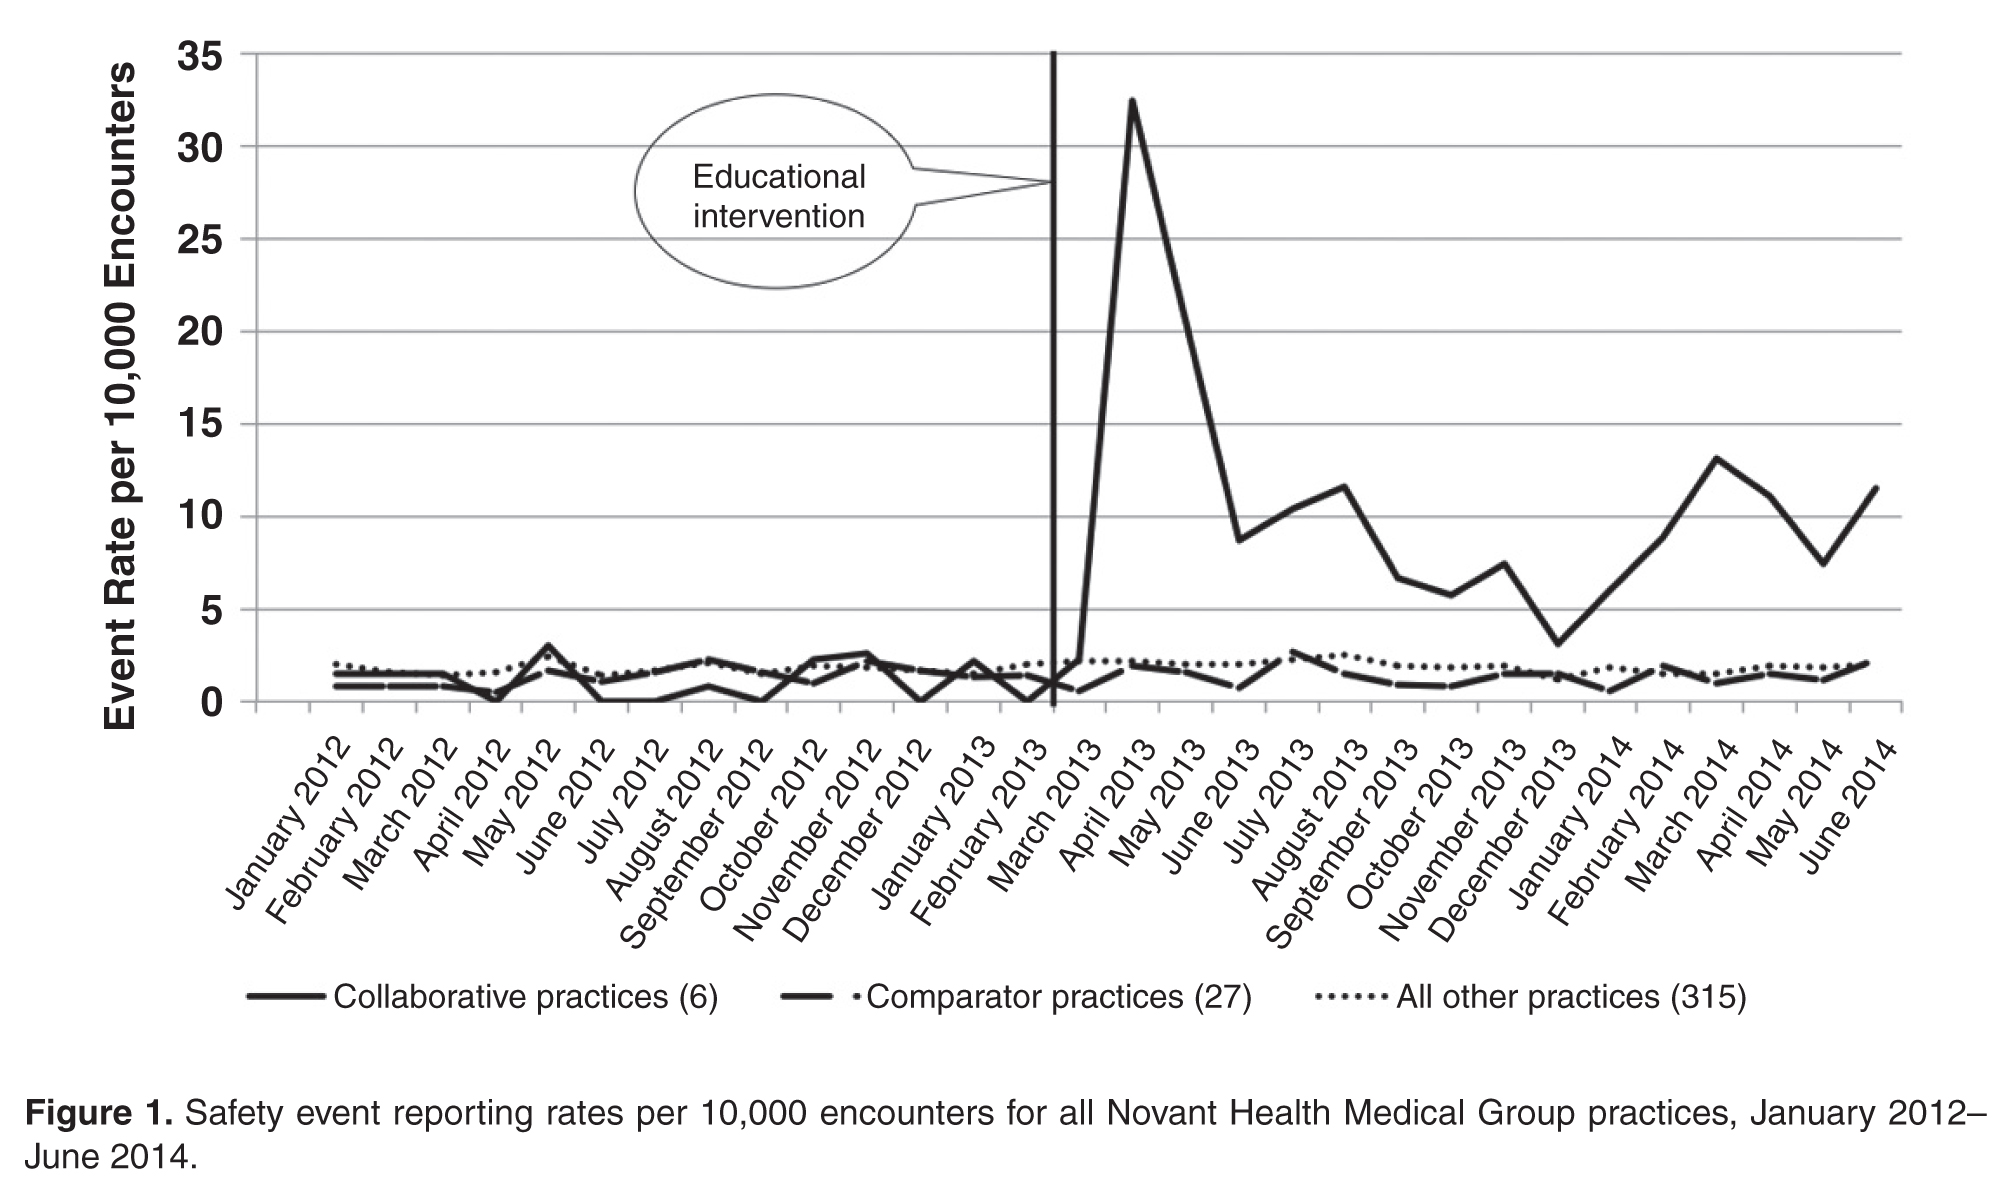
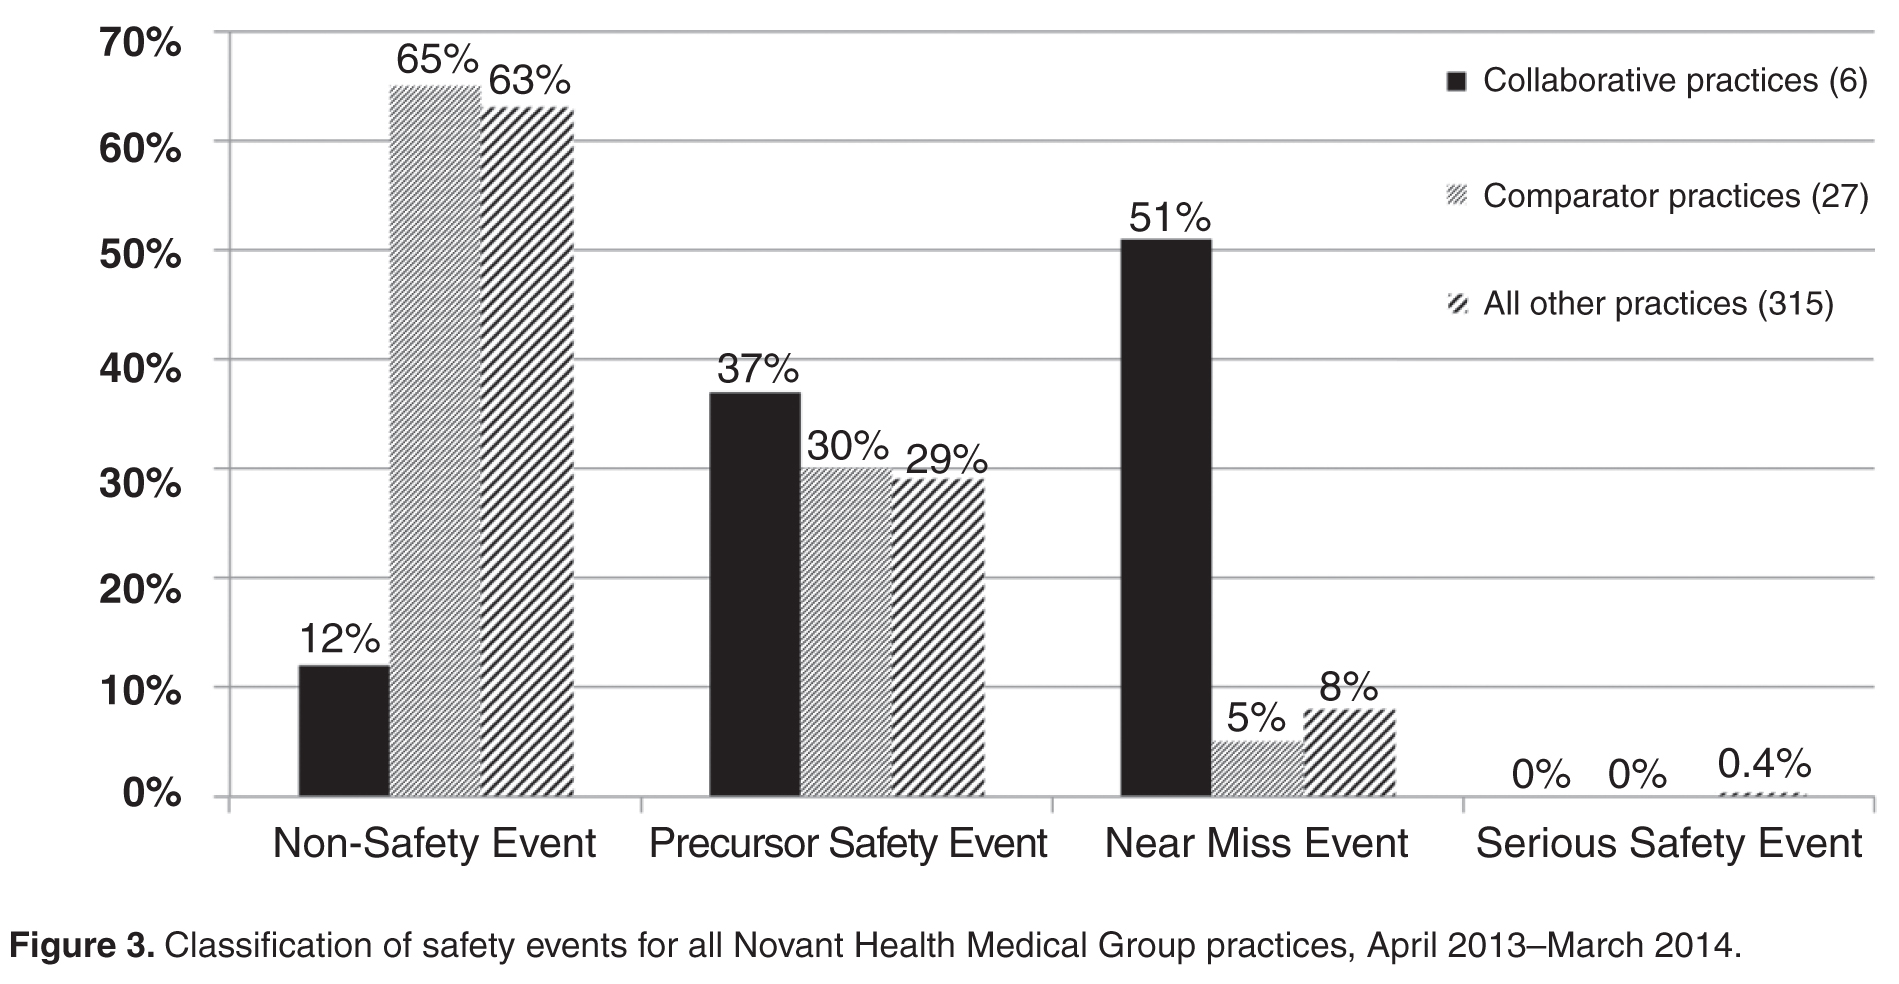
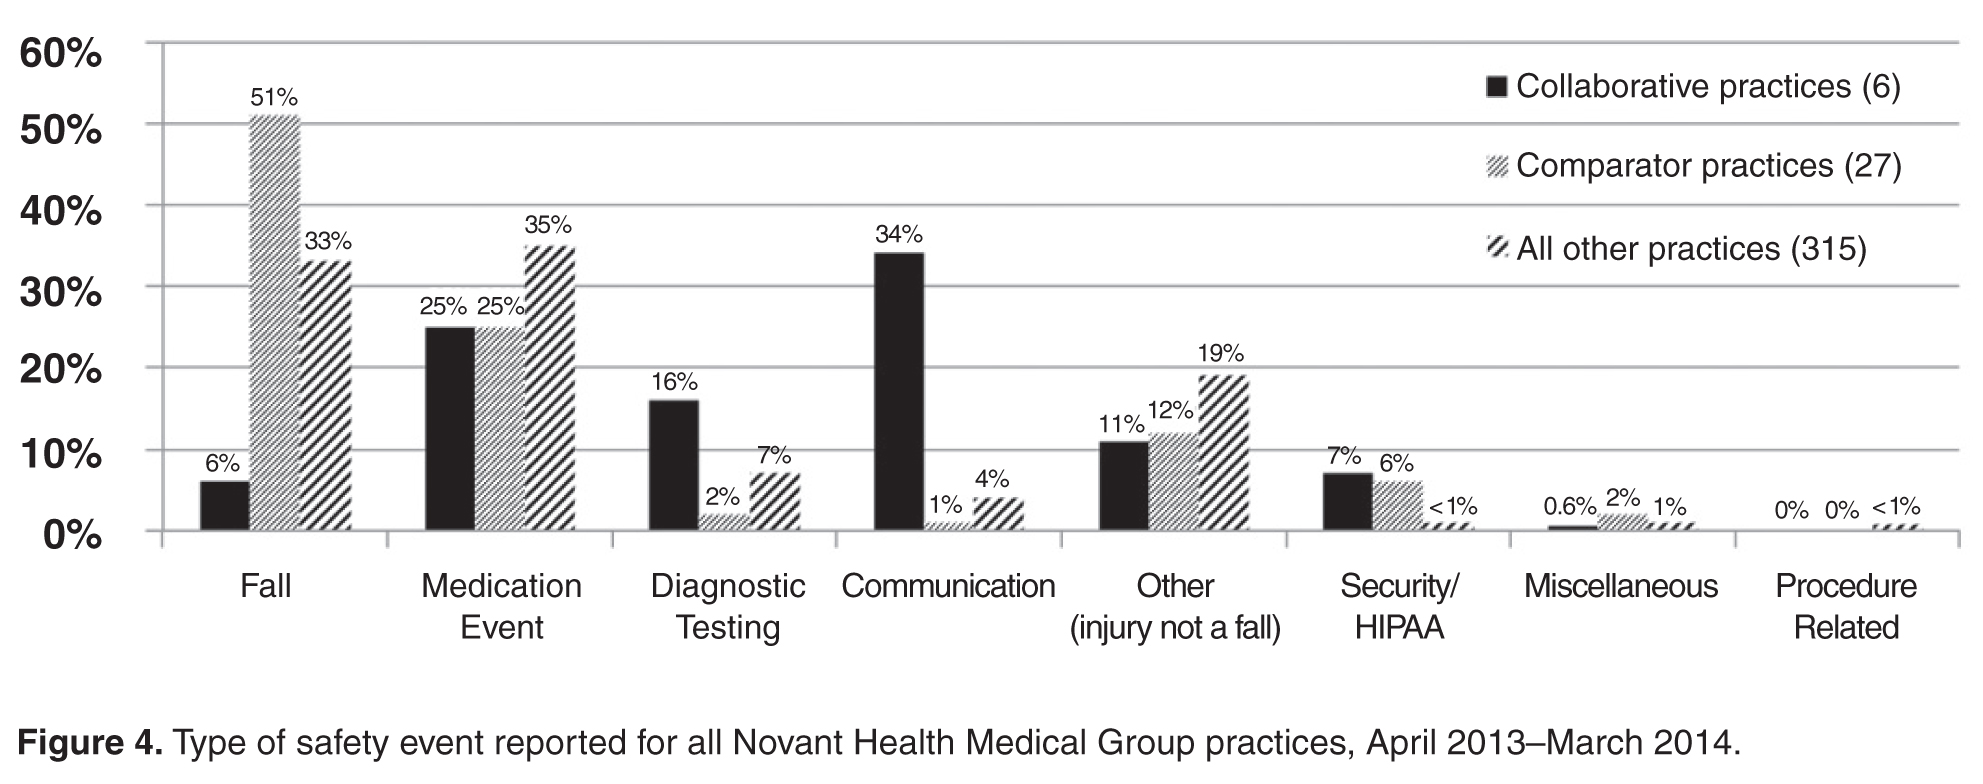
- Results: In the 12-month period following the intervention in March 2013, the 6 practices reported 175 patient safety events compared with only 19 events in the previous 12-month period. Each practice at least doubled reporting rates, and 5 of the 6 significantly increased rates. In contrast, rates for comparator practices were unchanged, with 84 events reported for the pre-intervention period and 81 for the post-intervention period. Event classification and types of events reported were different in the collaborative practices compared with the comparators for the post-intervention period. For the collaborative group, near miss events predominated as did diagnostic testing and communication event types.
- Conclusion: An initial educational session stressing anonymous, voluntary safety event reporting together with monthly audit and feedback and a focus on developing a nonpunitive environment can significantly enhance reporting of safety events.
Multiple challenges in the outpatient setting make establishing a culture of safety and improving care delivery more difficult than for inpatient settings. In the outpatient setting, care is often inaccessible, not well coordinated between providers and between facilities and providers, and delivered in many locations. It may also involve multiple sites and providers for a single patient, may require multiple visits in a single location, and can be provided by phone, email, mail, video, or in person [1]. Errors and adverse events may take long periods of time to become apparent and are more often errors of omission compared with those in the inpatient setting [2].
Incident reporting systems are considered important in improving patient safety [3], and their limitations and value have recently been reviewed [4]. However, limited research has been conducted on medical errors in ambulatory care, and even less is available on optimal monitoring and reporting strategies [5–12].Reporting in our system is time-consuming (about 15 minutes for entry of a single report), is not tailored for outpatient practices, may be considered potentially punitive (staff may believe that reporting may place themselves at risk for performance downgrade or other actions), and marked under-reporting of safety events was suspected. Most but not all of the suggested characteristics considered important for hospital-based reporting systems are fulfilled in our ambulatory reporting system [13].
Several academic groups have reported much improved reporting and a much better understanding of the types of errors occurring in their respective outpatient settings [14–16]. The most compelling model includes a voluntary, nonpunitive, anonymous reporting approach and a multidisciplinary practice-specific team to analyze reported errors and to enact change through a continuous quality improvement process [14,15].
We implemented a project to significantly improve reporting of safety events in an outpatient, nonacademic 6-practice collaborative by using education, monthly audit, and regular feedback.
Methods
Setting
Novant Health Medical Group is a consortium of over 380 clinic sites, nearly 1300 physicians, and over 500 advanced practice clinicians. Clinic locations are found in Virginia, North Carolina, and South Carolina. Medical group members partner with physicians and staff in 15 hospitals in these geographic locations. Novant Health utilizes Epic (Epic Systems, Verona, WI) as an electronic health record. Safety event reporting is accomplished electronically in a single software program (VIncident, Verge Solutions, Mt. Pleasant, SC), used for all patients in our integrated care system (inpatient and outpatient facilities).
Intervention
Two of the authors (HWC and TC) met in March 2013 with the lead physician, practice manager, and patient safety coach at each clinic for approximately 1 hour. We discussed current reporting practice, delivered education for the safety event compendium, and detailed an anonymous, voluntary, and nonpunitive approach (stressing the use of the term “safety event” and not “error”) to reporting using a single page, 8-question paper report about the event. The report was not to be signed by the person completing the event data with placement in a drop box for later collection and electronic reporting as per usual practice in the clinic. We agreed that clinic leaders would stress to staff and providers that the initiative was nonpunitive and anonymous and that the goal was to report all known safety events, as an improvement project.
Patient safety coaches were selected for each of the 6 practices by the manager. Patient safety coaches are volunteer clinical or nonclinical staff members whose role is to observe, model, and reinforce pre-established patient safety behaviors and use of error prevention tools among peers and providers. Training requirements include an initial 2-hour training session in which they learn fundamentals of patient safety science, high reliability principles, coaching techniques for team accountability, and concepts for continuous quality improvement. Additionally, they attend monthly meetings where patient safety concepts are discussed in greater detail and best practices are shared. Following this training, each clinic’s staff was educated on the project, a process improvement team (lead physician, manager, and patient safety coach) was constituted, and the project was begun in April 2013. In quarter 3 of 2013, each practice team selected a quality improvement project based upon reported safety events in their clinic. We asked our medical group risk managers to continue event discussion with practice managers as usual, as each event is discussed briefly after a report is made.
We audited reports monthly and provided feedback to the practice team with a written report at the end of each 3-month period starting in June 2013 and ending in June 2014 (5 reports). Individual on-site visits to meet and discuss progress were completed in September 2013 and March 2014, in addition to the initial visit in March 2013.
Evaluation
We compared reported monthly safety events for each of the 6 practices and for the 6-practice collaborative in the aggregate for the 12-month pre-intervention period (April 2012 through March 2013) and post-intervention period (April 2013 through March 2014). Each practice was compared with 3 specialty- and size (number of providers)-matched practices, none of whom received education or feedback on reporting or had patient safety coaches in the practice. In addition, for each of the 3 family medicine practices in the collaborative, we matched 1:3 other family medicine practices for specialty, size, and presence of a designated and trained patient safety coach. For the duration of the project, only 50 of 380 practices in the medical group had a trained patient safety coach.
The rate of safety events reported (ie, number of safety events reported/number of patient encounters) was compared for the 2 time periods using Poisson regression or zero-inflated Poisson regression. SASenterprise guide5.1 was used for all analyses. A P value of < 0.05 was considered statistically significant. The protocol was reviewed by the institutional review board of Novant Health Presbyterian Medical Center and a waiver for informed written consent was granted.
Results
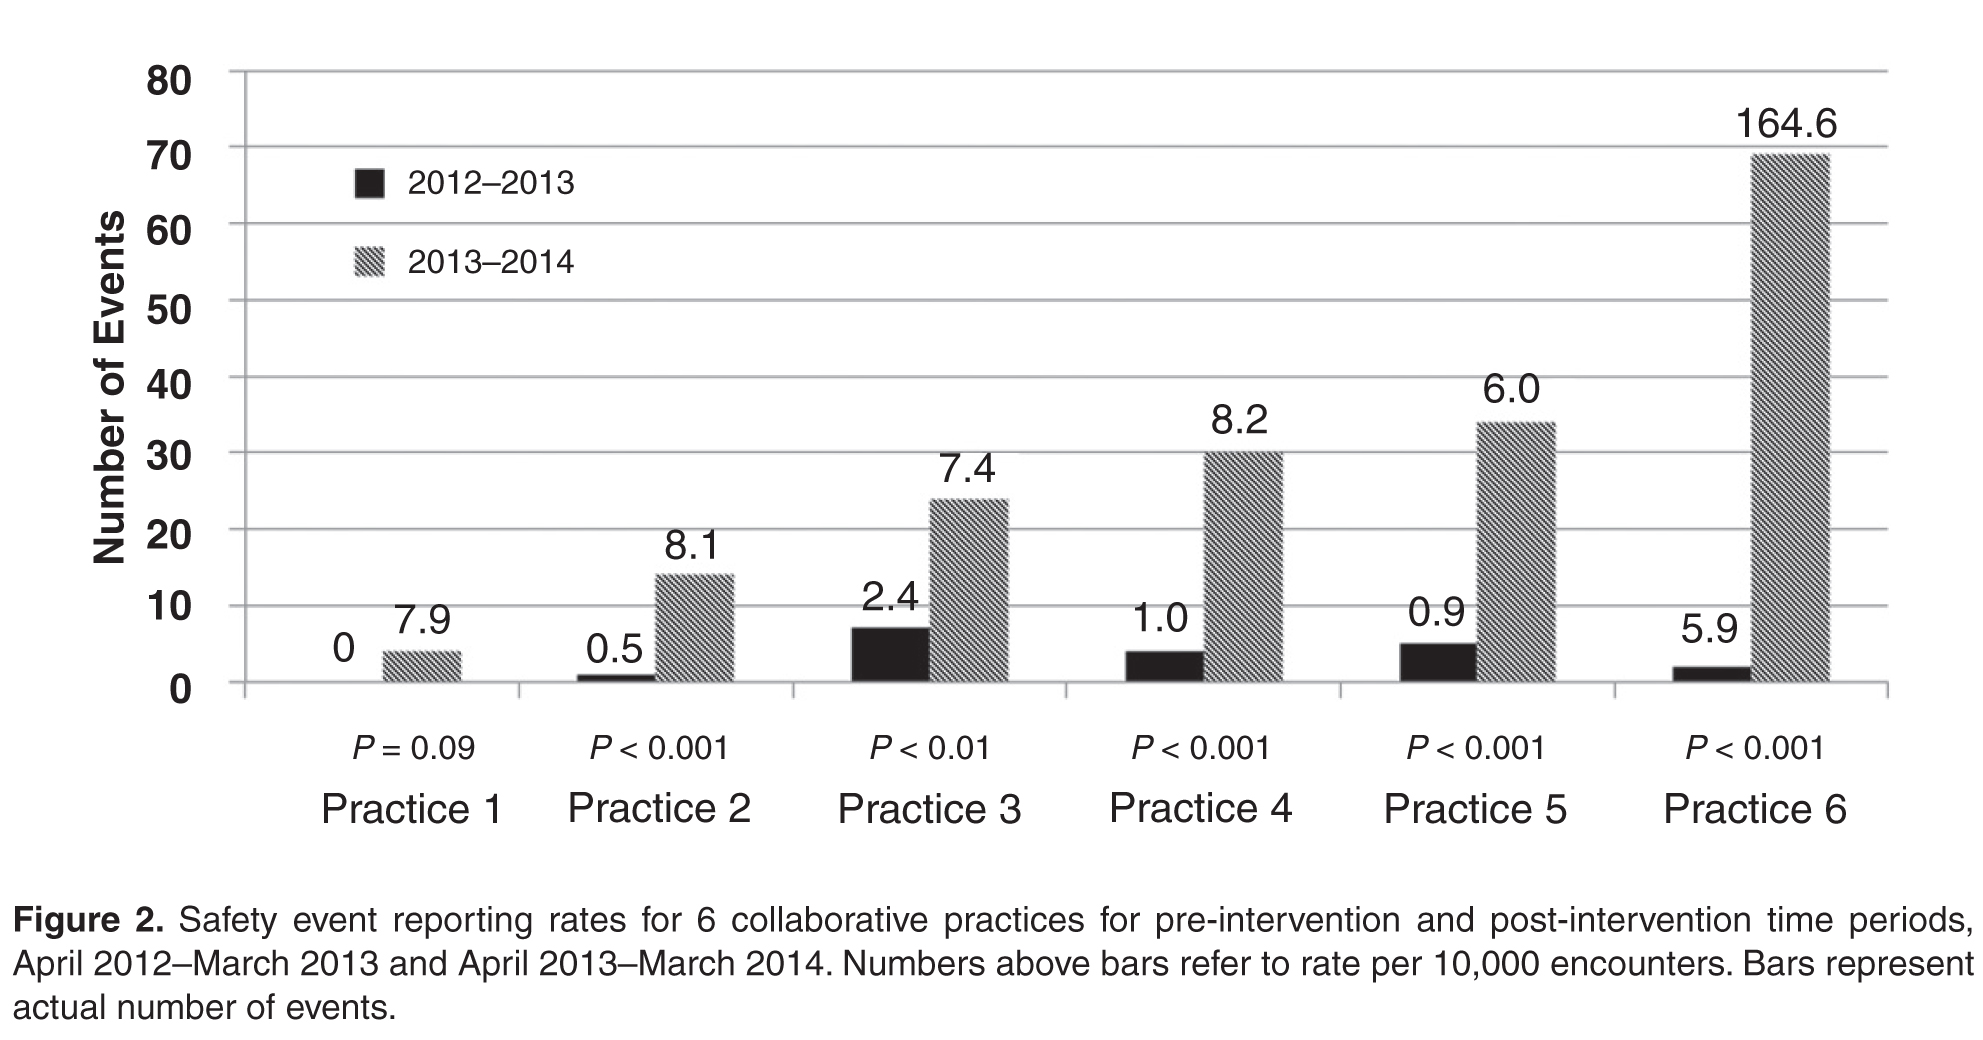
To control for the presence of patient safety coaches in practices, the 3 family medicine clinics (clinics 4 through 6, Figure 2) were each matched 1:3 for size (number of providers) and specialty (other family medicine clinics), also with a patient safety coach. While the rates were significantly increased for the 3 collaborative family medicine clinics (P < 0.001), only 1 of the comparators clinic’s rate changed significantly (0.2 or 1/44,580 to 1.3 or 6/45,157), and this change was marginally significant (P = 0.048). This practice was the only one of the 27 comparator clinics to demonstrate any increased rate.
Discussion
In our nonacademic community practices, patient safety reporting rates improved following an initial educational session stressing anonymous, voluntary safety event reporting together with monthly audit and feedback. Our findings corroborate those of others in academic ambulatory settings, who found that an emphasis on patient safety reporting, particularly if an anonymous approach is taken in a nonpunitive atmosphere, can significantly increase the reporting of patient safety events [14–16]. We demonstrated marked under-reporting and stability of patient safety event reporting throughout our ambulatory practice group and a 10-fold increase in reporting among the 6-practice collaborative.
An unexpected finding was that with the exception of 1 practice, we found no increased reporting in comparator practices that had a patient safety coach. Additionally, we noted that general surgery practices report (or experience) very few ambulatory safety events, as a total of 4 events were reported for all 4 general surgery practices in 18 months.
We chose a quasi-experimental with a comparison group and pre-test/post-test design since randomization of practices was not feasible [17]. We used a 2-year period to control for any seasonal trends and to allow time after the intervention to see if meaningful improvement in reporting over time would continue. We attempted to address the potential for nonequivalence in the comparison group by matching for specialty and size of practice.
There are several limitations to this study. Bias in the selection of collaborative practices may have occurred since each had a proven leader, and this may have led to more rapid adoption and utilization of this reporting approach. Also, our findings may not be generalizable to other integrated health systems given the unique approaches to patient safety culture development and the disparate nature of reporting systems. In addition, with our study design we could not be certain that anonymous reporting was a key factor in the increase in reporting rates, but de-briefing interviews indicated that both anonymous reporting and declaring a nonpunitive, supportive approach in each practice was important to enhanced reporting.
We expect increased reporting to decline over time without consistent feedback, as has been demonstrated in other studies [18], and we will continue to monitor rates over time.
As our current reporting system requires considerable reporter time for data input and discussion with risk managers, is not specifically configured for ambulatory reporting, is considered by staff and providers potentially punitive, and marked under-reporting is clear, we have proposed moving to a new system that is more user-friendly, ambulatory-focused, and has a provision for anonymous reporting.
Presented in part at the Institute for Healthcare Improvement 15th Annual International Summit on Improving Patient Care in the Office Practice and the Community, Washington DC, March 2014.
Acknowledgements: We gratefully acknowledge the work of collaborative practice team members, including Christopher Isenhour MD, Janet White, Shelby Carlyle, Mark Tillotson MD, Maria Migliaccio, Melanie Trapp, Jennifer Ochs, Gary DeRosa MD, Margarete Hinkle, Scott Wagner, Kelly Schetselaar, Timothy Eichenbrenner MD, Sandy Hite, Jamie Shelton, Raymond Swetenburg MD, James Lye MD, Kelly Morrison, Jan Rapisardo, Jane Moss, Rhett Brown MD, Dorothy Hedrick, Camille Farmer, and William Anderson, MS, for assistance with analysis.
Corresponding author: Herbert Clegg, MD, 108 Providence Road, Charlotte NC, 28207, hwclegg@novanthealth.org.
Financial disclosures: None.
1. Tang N, Meyer GS. Ambulatory patient safety: The time is now. Arch Intern Med 2010;170:1487–9.
2. Ghandi TK, Lee TH. Patient safety beyond the hospital. N Engl J Med 2010;363:1001–3.
3. Institute of Medicine. To err is human: Building a safer health system. Washington DC: National Academies Press; 1999.
4. Pham JC, Girard T, Pronovost PJ. What to do with healthcare incident reporting systems. J Public Health Res 2013;2:e27.
5. Elder NC, Dovey SM. Classification of medical errors and preventable adverse events in primary care: A synthesis of the literature. J Fam Pract 2002;51:927–32.
6. Mohr JJ, Lannon CM, Thoma KA, et al. Learning from errors in ambulatory pediatrics. In: Henriksen K, Battles JB, Marks ES, et al, editors. Advances in patient safety: from research to implementation. Washington, DC: Agency for Healthcare Research and Quality; 2005: 355–68. Available at www.ahrq.gov//downloads/pub/advances/vol1/Mohr.pdf.
7. Phillips RL, Dovey SM, Graham D, et al. Learning from different lenses: reports of medical errors in primary care by clinicians, staff, and patients. J Patient Saf 2006;2:140–6.
8. Singh H, Thomas EJ, Khan MM, Peterson LA. Identifying diagnostic errors in primary care using an electronic screening algorithm. Arch Intern Med 2007;167:302–8.
9. Rappaport DI, Collins B, Koster A, et al. Implementing medication reconciliation in outpatient pediatrics. Pediatrics 2011;128:e1600-e1607.
10. Bishop TF, Ryan AK, Casalino LP. Paid malpractice claims for adverse events in inpatient and outpatient settings. JAMA 2011;305:2427–31.
11. Wynia MK, Classen DC. Improving ambulatory patient safety. Learning from the last decade, moving ahead in the next. JAMA 2011;306:2504–5.
12. Neuspiel DR, Stubbs EH. Patient safety in ambulatory care. Pediatr Clin North Am 2012;59:1341–54.
13. Leape LL. Patient safety. Reporting of adverse events. N Engl J Med 2002;347:1633–8.
14. Neuspiel DR, Stubbs EH, Liggin L. Improving reporting of outpatient medical errors. Pediatrics 2011;128:e1608–e1613.
15. Neuspiel DR, Gizman M, Harewood C. Improving error reporting in ambulatory pediatrics with team approach. In: Henriksen K, Battles JB, Keyes MA, et al, editors. Advances in patient safety: new directions and alternative approaches. Vol 1. Agency for Healthcare Research and Quality; 2008. Available at www.ncbi.nlm.nih.gov/books/NBK43643/.
16. Plews-Ogan ML, Nadkarni MM, Forren S, et al. Patient safety in the ambulatory setting: a clinician-based approach. J Gen Intern Med 2004;19:719–25.
17. Harris AD, McGregor JC, Perencevich EN, et al. The use and interpretation of quasi-experimental studies in medical informatics. J Am Med Inform Assoc 2006;13:16–23.
18. Gerber JS, Prasad PA, Fiks AG, et al. Durability of benefits of an outpatient antimicrobial stewardship intervention after discontinuation of audit and feedback. JAMA 2014;312:2569–70.
From Novant Health and Novant Health Medical Group, Winston-Salem, NC.
Abstract
- Objective: To evaluate the effect of an educational intervention with regular audit and feedback on reporting of patient safety events in a nonacademic, community practice setting with an established reporting system.
- Methods: A quasi-experimental with comparator design was used to compare a 6-practice collaborative group with a 27-practice comparator group with regard to safety event reporting rates. Baseline data were collected for a 12-month period followed by recruitment of 6 practices (3 family medicine, 2 pediatric, and 1 general surgery). An educational intervention was carried out with each, and this was followed by monthly audit and regular written and in-person feedback. Practice-level comparisons were made with specialty- and size-matched practices for the 6 practices in the collaborative group.
- Results: In the 12-month period following the intervention in March 2013, the 6 practices reported 175 patient safety events compared with only 19 events in the previous 12-month period. Each practice at least doubled reporting rates, and 5 of the 6 significantly increased rates. In contrast, rates for comparator practices were unchanged, with 84 events reported for the pre-intervention period and 81 for the post-intervention period. Event classification and types of events reported were different in the collaborative practices compared with the comparators for the post-intervention period. For the collaborative group, near miss events predominated as did diagnostic testing and communication event types.
- Conclusion: An initial educational session stressing anonymous, voluntary safety event reporting together with monthly audit and feedback and a focus on developing a nonpunitive environment can significantly enhance reporting of safety events.
Multiple challenges in the outpatient setting make establishing a culture of safety and improving care delivery more difficult than for inpatient settings. In the outpatient setting, care is often inaccessible, not well coordinated between providers and between facilities and providers, and delivered in many locations. It may also involve multiple sites and providers for a single patient, may require multiple visits in a single location, and can be provided by phone, email, mail, video, or in person [1]. Errors and adverse events may take long periods of time to become apparent and are more often errors of omission compared with those in the inpatient setting [2].
Incident reporting systems are considered important in improving patient safety [3], and their limitations and value have recently been reviewed [4]. However, limited research has been conducted on medical errors in ambulatory care, and even less is available on optimal monitoring and reporting strategies [5–12].Reporting in our system is time-consuming (about 15 minutes for entry of a single report), is not tailored for outpatient practices, may be considered potentially punitive (staff may believe that reporting may place themselves at risk for performance downgrade or other actions), and marked under-reporting of safety events was suspected. Most but not all of the suggested characteristics considered important for hospital-based reporting systems are fulfilled in our ambulatory reporting system [13].
Several academic groups have reported much improved reporting and a much better understanding of the types of errors occurring in their respective outpatient settings [14–16]. The most compelling model includes a voluntary, nonpunitive, anonymous reporting approach and a multidisciplinary practice-specific team to analyze reported errors and to enact change through a continuous quality improvement process [14,15].
We implemented a project to significantly improve reporting of safety events in an outpatient, nonacademic 6-practice collaborative by using education, monthly audit, and regular feedback.
Methods
Setting
Novant Health Medical Group is a consortium of over 380 clinic sites, nearly 1300 physicians, and over 500 advanced practice clinicians. Clinic locations are found in Virginia, North Carolina, and South Carolina. Medical group members partner with physicians and staff in 15 hospitals in these geographic locations. Novant Health utilizes Epic (Epic Systems, Verona, WI) as an electronic health record. Safety event reporting is accomplished electronically in a single software program (VIncident, Verge Solutions, Mt. Pleasant, SC), used for all patients in our integrated care system (inpatient and outpatient facilities).
Intervention
Two of the authors (HWC and TC) met in March 2013 with the lead physician, practice manager, and patient safety coach at each clinic for approximately 1 hour. We discussed current reporting practice, delivered education for the safety event compendium, and detailed an anonymous, voluntary, and nonpunitive approach (stressing the use of the term “safety event” and not “error”) to reporting using a single page, 8-question paper report about the event. The report was not to be signed by the person completing the event data with placement in a drop box for later collection and electronic reporting as per usual practice in the clinic. We agreed that clinic leaders would stress to staff and providers that the initiative was nonpunitive and anonymous and that the goal was to report all known safety events, as an improvement project.
Patient safety coaches were selected for each of the 6 practices by the manager. Patient safety coaches are volunteer clinical or nonclinical staff members whose role is to observe, model, and reinforce pre-established patient safety behaviors and use of error prevention tools among peers and providers. Training requirements include an initial 2-hour training session in which they learn fundamentals of patient safety science, high reliability principles, coaching techniques for team accountability, and concepts for continuous quality improvement. Additionally, they attend monthly meetings where patient safety concepts are discussed in greater detail and best practices are shared. Following this training, each clinic’s staff was educated on the project, a process improvement team (lead physician, manager, and patient safety coach) was constituted, and the project was begun in April 2013. In quarter 3 of 2013, each practice team selected a quality improvement project based upon reported safety events in their clinic. We asked our medical group risk managers to continue event discussion with practice managers as usual, as each event is discussed briefly after a report is made.
We audited reports monthly and provided feedback to the practice team with a written report at the end of each 3-month period starting in June 2013 and ending in June 2014 (5 reports). Individual on-site visits to meet and discuss progress were completed in September 2013 and March 2014, in addition to the initial visit in March 2013.
Evaluation
We compared reported monthly safety events for each of the 6 practices and for the 6-practice collaborative in the aggregate for the 12-month pre-intervention period (April 2012 through March 2013) and post-intervention period (April 2013 through March 2014). Each practice was compared with 3 specialty- and size (number of providers)-matched practices, none of whom received education or feedback on reporting or had patient safety coaches in the practice. In addition, for each of the 3 family medicine practices in the collaborative, we matched 1:3 other family medicine practices for specialty, size, and presence of a designated and trained patient safety coach. For the duration of the project, only 50 of 380 practices in the medical group had a trained patient safety coach.
The rate of safety events reported (ie, number of safety events reported/number of patient encounters) was compared for the 2 time periods using Poisson regression or zero-inflated Poisson regression. SASenterprise guide5.1 was used for all analyses. A P value of < 0.05 was considered statistically significant. The protocol was reviewed by the institutional review board of Novant Health Presbyterian Medical Center and a waiver for informed written consent was granted.
Results
To control for the presence of patient safety coaches in practices, the 3 family medicine clinics (clinics 4 through 6, Figure 2) were each matched 1:3 for size (number of providers) and specialty (other family medicine clinics), also with a patient safety coach. While the rates were significantly increased for the 3 collaborative family medicine clinics (P < 0.001), only 1 of the comparators clinic’s rate changed significantly (0.2 or 1/44,580 to 1.3 or 6/45,157), and this change was marginally significant (P = 0.048). This practice was the only one of the 27 comparator clinics to demonstrate any increased rate.
Discussion
In our nonacademic community practices, patient safety reporting rates improved following an initial educational session stressing anonymous, voluntary safety event reporting together with monthly audit and feedback. Our findings corroborate those of others in academic ambulatory settings, who found that an emphasis on patient safety reporting, particularly if an anonymous approach is taken in a nonpunitive atmosphere, can significantly increase the reporting of patient safety events [14–16]. We demonstrated marked under-reporting and stability of patient safety event reporting throughout our ambulatory practice group and a 10-fold increase in reporting among the 6-practice collaborative.
An unexpected finding was that with the exception of 1 practice, we found no increased reporting in comparator practices that had a patient safety coach. Additionally, we noted that general surgery practices report (or experience) very few ambulatory safety events, as a total of 4 events were reported for all 4 general surgery practices in 18 months.
We chose a quasi-experimental with a comparison group and pre-test/post-test design since randomization of practices was not feasible [17]. We used a 2-year period to control for any seasonal trends and to allow time after the intervention to see if meaningful improvement in reporting over time would continue. We attempted to address the potential for nonequivalence in the comparison group by matching for specialty and size of practice.
There are several limitations to this study. Bias in the selection of collaborative practices may have occurred since each had a proven leader, and this may have led to more rapid adoption and utilization of this reporting approach. Also, our findings may not be generalizable to other integrated health systems given the unique approaches to patient safety culture development and the disparate nature of reporting systems. In addition, with our study design we could not be certain that anonymous reporting was a key factor in the increase in reporting rates, but de-briefing interviews indicated that both anonymous reporting and declaring a nonpunitive, supportive approach in each practice was important to enhanced reporting.
We expect increased reporting to decline over time without consistent feedback, as has been demonstrated in other studies [18], and we will continue to monitor rates over time.
As our current reporting system requires considerable reporter time for data input and discussion with risk managers, is not specifically configured for ambulatory reporting, is considered by staff and providers potentially punitive, and marked under-reporting is clear, we have proposed moving to a new system that is more user-friendly, ambulatory-focused, and has a provision for anonymous reporting.
Presented in part at the Institute for Healthcare Improvement 15th Annual International Summit on Improving Patient Care in the Office Practice and the Community, Washington DC, March 2014.
Acknowledgements: We gratefully acknowledge the work of collaborative practice team members, including Christopher Isenhour MD, Janet White, Shelby Carlyle, Mark Tillotson MD, Maria Migliaccio, Melanie Trapp, Jennifer Ochs, Gary DeRosa MD, Margarete Hinkle, Scott Wagner, Kelly Schetselaar, Timothy Eichenbrenner MD, Sandy Hite, Jamie Shelton, Raymond Swetenburg MD, James Lye MD, Kelly Morrison, Jan Rapisardo, Jane Moss, Rhett Brown MD, Dorothy Hedrick, Camille Farmer, and William Anderson, MS, for assistance with analysis.
Corresponding author: Herbert Clegg, MD, 108 Providence Road, Charlotte NC, 28207, hwclegg@novanthealth.org.
Financial disclosures: None.
1. Tang N, Meyer GS. Ambulatory patient safety: The time is now. Arch Intern Med 2010;170:1487–9.
2. Ghandi TK, Lee TH. Patient safety beyond the hospital. N Engl J Med 2010;363:1001–3.
3. Institute of Medicine. To err is human: Building a safer health system. Washington DC: National Academies Press; 1999.
4. Pham JC, Girard T, Pronovost PJ. What to do with healthcare incident reporting systems. J Public Health Res 2013;2:e27.
5. Elder NC, Dovey SM. Classification of medical errors and preventable adverse events in primary care: A synthesis of the literature. J Fam Pract 2002;51:927–32.
6. Mohr JJ, Lannon CM, Thoma KA, et al. Learning from errors in ambulatory pediatrics. In: Henriksen K, Battles JB, Marks ES, et al, editors. Advances in patient safety: from research to implementation. Washington, DC: Agency for Healthcare Research and Quality; 2005: 355–68. Available at www.ahrq.gov//downloads/pub/advances/vol1/Mohr.pdf.
7. Phillips RL, Dovey SM, Graham D, et al. Learning from different lenses: reports of medical errors in primary care by clinicians, staff, and patients. J Patient Saf 2006;2:140–6.
8. Singh H, Thomas EJ, Khan MM, Peterson LA. Identifying diagnostic errors in primary care using an electronic screening algorithm. Arch Intern Med 2007;167:302–8.
9. Rappaport DI, Collins B, Koster A, et al. Implementing medication reconciliation in outpatient pediatrics. Pediatrics 2011;128:e1600-e1607.
10. Bishop TF, Ryan AK, Casalino LP. Paid malpractice claims for adverse events in inpatient and outpatient settings. JAMA 2011;305:2427–31.
11. Wynia MK, Classen DC. Improving ambulatory patient safety. Learning from the last decade, moving ahead in the next. JAMA 2011;306:2504–5.
12. Neuspiel DR, Stubbs EH. Patient safety in ambulatory care. Pediatr Clin North Am 2012;59:1341–54.
13. Leape LL. Patient safety. Reporting of adverse events. N Engl J Med 2002;347:1633–8.
14. Neuspiel DR, Stubbs EH, Liggin L. Improving reporting of outpatient medical errors. Pediatrics 2011;128:e1608–e1613.
15. Neuspiel DR, Gizman M, Harewood C. Improving error reporting in ambulatory pediatrics with team approach. In: Henriksen K, Battles JB, Keyes MA, et al, editors. Advances in patient safety: new directions and alternative approaches. Vol 1. Agency for Healthcare Research and Quality; 2008. Available at www.ncbi.nlm.nih.gov/books/NBK43643/.
16. Plews-Ogan ML, Nadkarni MM, Forren S, et al. Patient safety in the ambulatory setting: a clinician-based approach. J Gen Intern Med 2004;19:719–25.
17. Harris AD, McGregor JC, Perencevich EN, et al. The use and interpretation of quasi-experimental studies in medical informatics. J Am Med Inform Assoc 2006;13:16–23.
18. Gerber JS, Prasad PA, Fiks AG, et al. Durability of benefits of an outpatient antimicrobial stewardship intervention after discontinuation of audit and feedback. JAMA 2014;312:2569–70.
Changing Hospital Visiting Policies: From Families as “Visitors” to Families as Partners
From the Institute for Patient- and Family-Centered Care, Bethesda, MD (Ms. Dokken, Ms. Kaufman, and Ms. Johnson), Anne Arundel Medical Center, Annapolis, MD (Dr. Perkins), Contra Costa Regional Medical Center & Health Centers, Martinez, CA (Ms. Benepal, Ms. Roth, and Vidant Health, Greenville, NC (Ms. Dutton and Ms. Jones).
Abstract
- Objective: To describe a campaign to eliminate restrictive hospital visiting policies and to put in place policies that recognize families as partners in care.
- Methods: Descriptive report.
- Results: Many hospitals still have “visiting” hours that limit family presence, often counter to patient preferences. To change the concept of families as visitors and eliminate restrictive hospital visiting policies, the Institute for Patient- and Family-Centered Care (IPFCC) launched the campaign Better Together: Partnering with Families, calling on all hospitals to welcome families 24 hours a day and transform their policies and approaches to care so that patients’ families and loved ones are included in care and decision making, according to patient preferences. As part of the campaign, IPFCC recognized 12 hospitals that exemplify success in eliminating restrictive visiting policies and have changed the concept of families from “visitors” to partners. Leaders at these hospitals attest to the benefits of the changes through improved experience of care and other outcomes. Three exemplar hospitals are highlighted in this article and share their processes of change as well as key learnings and outcomes.
- Conclusion: Hospital policies and practices that encourage and support families as partners in care are essential to patients’ health, well-being, and safety.
Many families are restricted from the bedsides of loved ones because of hospital visiting policies [1–3]. Restrictive policies are often based on long-held beliefs that the presence and participation of families interferes with care, exhausts patients, is a burden to families, spreads infection, or violates HIPAA. However, there is no evidence to support those beliefs. In fact, isolating patients at their most vulnerable time from the people who know them best places them at risk for medical error, emotional harm, inconsistencies in care, and lack of preparedness for transitions in care [4,5]. Jackie Gruzenski’s story “Behind a Locked Door” (printed below) affectingly describes the impact of restrictive policies on a couple's last days.
Fortunately, a growing number of hospitals are lifting these restrictions. But opening the door is not enough. Hospitals need to change the concept of families as “visitors” to families as partners in care. Changing policies is a foundational step in creating a patient- and family-centered culture where families are recognized as essential to patients’ health and well-being and where they are respected as allies for quality and safety.
In response to this critical need for change, in June 2014 the Institute for Patient- and Family-Centered Care (IPFCC) launched the campaign Better Together: Partnering with Families. IPFCC, founded in 1992, is a nonprofit organization that provides essential leadership to advance the understanding and practice of patient- and family-centered care [6]. Emphasizing the importance of family presence and participation to quality and safety, the campaign seeks to eliminate restrictive “visiting” policies and calls upon hospitals to include families as members of the care team and to welcome them 24 hours a day, 7 days a week, according to patient preference [7]. The goal of the campaign is to change visiting policies in 1000 hospitals by 2017. Partnering with IPFCC in this initiative are the American Society for Healthcare Risk Management, American Association of Critical Care Nurses, National Partnership for Women & Families, New Yorkers for Patient and Family Empowerment, Health In Aging Foundation, and the Canadian Foundation for Healthcare Improvement.
Anne Arundel Medical Center
A regional not-for-profit hospital founded in 1902, Anne Arundel Medical Center in Annapolis, MD, provides acute inpatient and outpatient care to residents of 4 counties in Maryland. A 380-bed facility, Anne Arundel has a cancer institute, heart and vascular institute, joint center, spine center, and a women’s and children’s center. In April 2011, the hospital completed a $424 million expansion project, which included a pediatric emergency room, an expanded general emergency room, 50 new patient beds, and 8 new operating rooms.
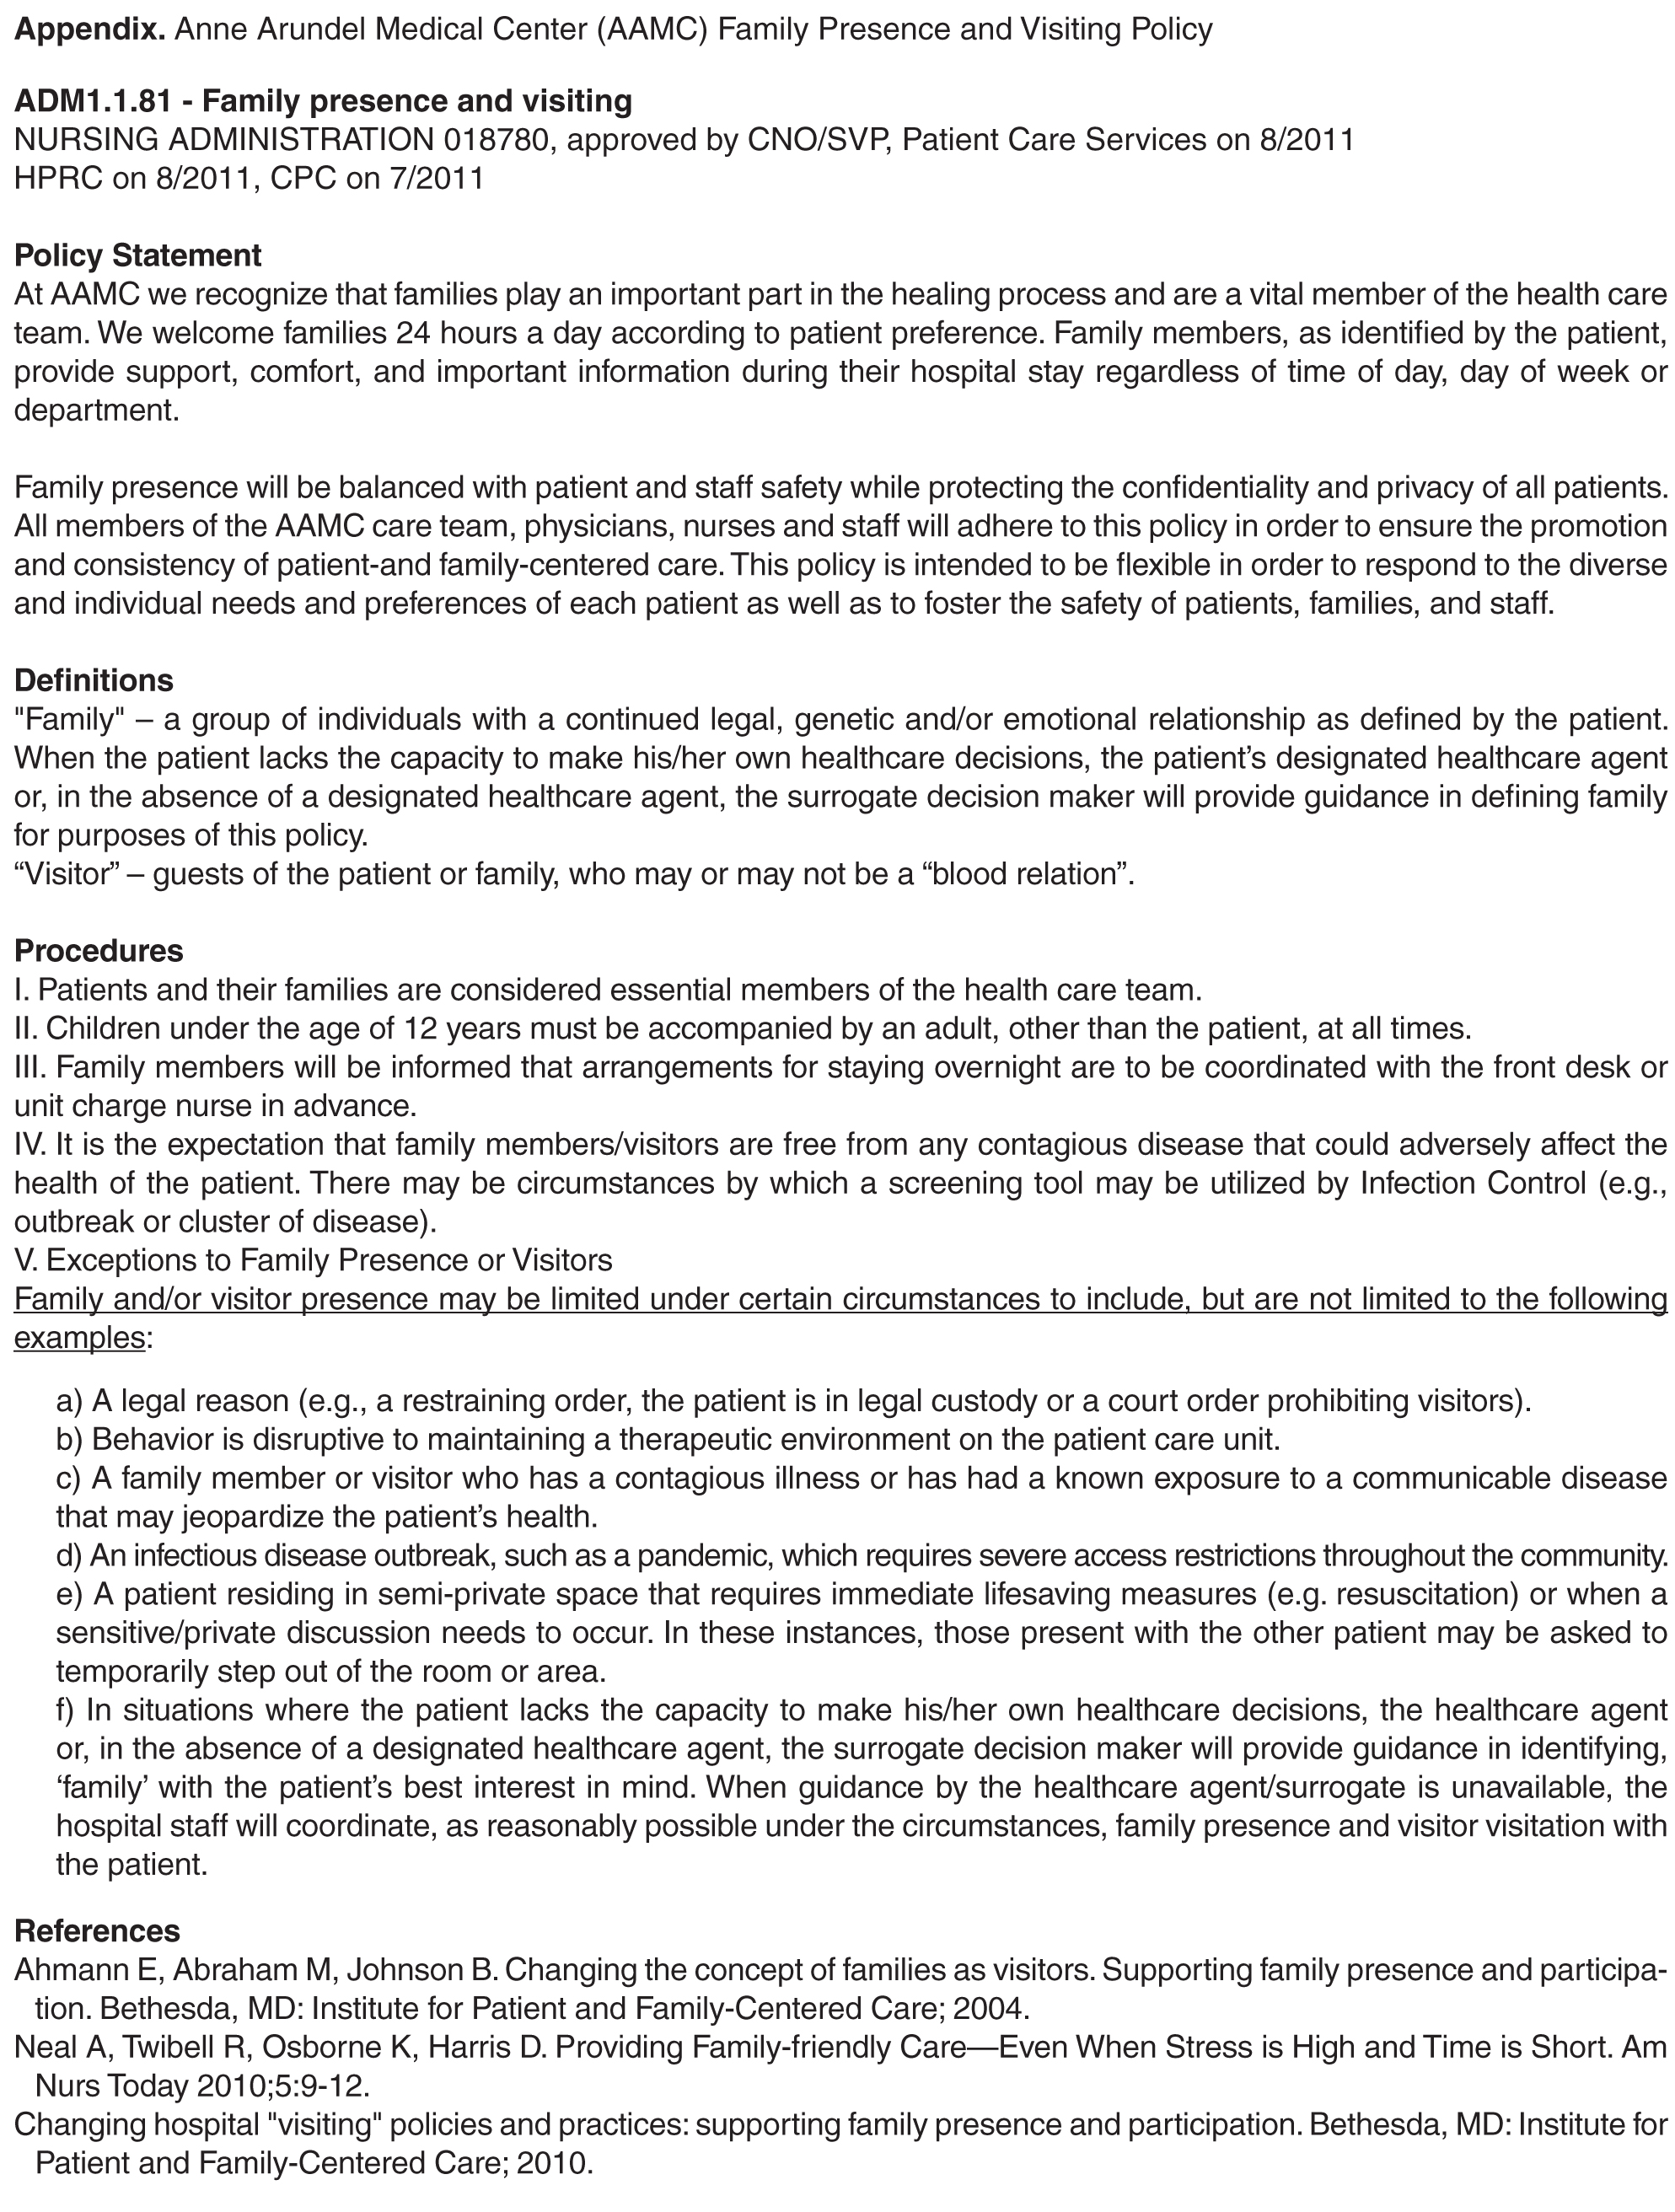
In 2010, based on a desire to concretely implement the principles of patient- and family-centered care, leaders at Anne Arundel began working with patient and family advisors and initiated a process to change the hospital’s restrictive visiting policy. Now, there are no restrictions on family presence anywhere in the hospital, from ICUs to medical/surgical units to other clinical areas. Patients have the power to choose who they want to stay with them—24 hours a day, 7 days a week. According to Anne Arundel’s policy, each patient determines who is defined as “family.” A “Revisiting Visiting” task force, comprising support staff, providers, and patient and family advisors, worked for 9 months to develop the new family presence policy and support its implementation.
With Anne Arundel leadership encouragement and support, patient and family advisors participated in all phases of the development and implementation of the new family presence policy and in other ways to advance the practice of patient- and family-centered care. The advisors also participated in the process to change the way nurse change of shift report was conducted, and they made recommendations for changes in the directional signs throughout the hospital. New signs, featuring a pineapple (a symbol of hospitality) and the words “Welcome Families” replaced old ones displaying the former restrictive visiting policy.
Supporting patient and family involvement in transitions in care is an integral aspect of implementing family presence policies and practices. Through an “Always Events” grant from the Picker Institute (for information about the Always Events program, see www.ihi.org/Engage/Initiatives/PatientFamilyCenteredCare/Pages/AlwaysEvents.aspx), patient and family advisors, staff, and providers at Anne Arundel developed the SMART discharge protocol, which includes a simple 5-item checklist that is reviewed and discussed with the patient and family prior to discharge. SMART is an acronym for Signs, Medications, Appointments, Results, and Talk. In its work, the SMART team built on current evidence, created urgency and expectation for use with patients, families, and caregivers, disseminated findings, and promoted the protocol as a national standard. The tool is available at www.ihi.org/resources/Pages/Tools/SMARTDischargeProtocol.aspx.
According to Anne Arundel’s COO and CNO, Sherry Perkins, a critical part of the change process was to first understand staff’s fears and then learn what the evidence says. For example, with regard to the impact of additional family presence on infection control, they learned that family presence did not pose additional infection control concerns.
In 2009, there were no patient and family advisors volunteering at Anne Arundel. In 2014, there are approximately 80 advisors. Since 2009, the overall HCAHPS rating of the hospital has gone from 75.4% to 82% (the national average is 70%). While patient satisfaction scores have previously been in the top deciles at Anne Arundel, they have consistently risen since expanding family presence and implementing additional patient- and family-centered strategies.
Contra Costa Regional Medical Center and Health Centers
Contra Costa Health Services in Martinez, CA, includes Contra Costa Regional Medical Center and 10 health centers as part of a comprehensive county health system. Its 164-bed public hospital is dedicated to offering services that are welcoming, accessible, safe and respectful for everyone.
Like many hospitals in the country, for years Contra Costa Regional Medical Center restricted the hours when family members and loved ones could visit patients. However, the hospital’s medical staff often felt uncomfortable that they had to usher family and care partners away from patients when visiting hours were over. Anna Roth, Contra Costa’s CEO, recalls an incident that caused great anguish and contributed to the hospital’s decision to eliminate its restrictive visiting policy. A young boy whose grandfather was in the ICU was denied visitation. The grandfather, who had raised him, passed away, with the two having had no chance to say goodbye. Roth said that the incident hit home for her and the entire staff, and they knew they could do better. “Our old policies treated family members like visitors, until we realized that we are the visitors in people’s lives, not the other way around,” she noted.
In 2012, the hospital established an interdisciplinary team to transform its existing visiting policy into a “welcoming policy.” The team comprised the director of inpatient nursing, the chief of nursing, the chief of security, a public health program specialist, the facilities manager, and a patient partner. The new policy would support family presence 24/7 as well as change the concept of families as “visitors.”
Over the course of a year, the team designed the framework for a 3-day pilot and developed a check-in process to help loved ones gain access to patients after regular hospital hours. Working closely with nursing leadership, front-line staff, patient partners, and security, the team made necessary adjustments to the policy throughout the pilot period. The pilot was well-received and the policy was implemented soon after.
In the policy’s first year, more than 7000 family members and care partners were able to be with their loved ones between 8 pm and 6 am, the time period formerly restricted. The feedback from staff, patients and loved ones has been overwhelmingly positive. Front-line nurses are currently strengthening their skills and confidence in conducting change of shift report at bedside with patients and families. Other “welcoming” measures have also been implemented, including making signage more user-friendly, providing comfortable chairs to sleep in, and installing new vending machines with healthy snacks and drinks.
Vidant Health
Vidant Health serves 1.4 million people in a 29-county region of eastern North Carolina and comprises over 70 primary and specialty physician office practices, a 900-bed academic medical center, 7 community hospitals, an ambulatory surgery center, and home health and hospice services. Vidant Health’s efforts to advance a culture of patient- and family-centered care began in the late 1990s in the James and Connie Maynard Children’s Hospital and the regional rehabilitation center, but this culture did not spread consistently throughout Vidant Health, leading to differing experiences of care for patients and families.
The Vidant Health executive team and senior leaders heard about these inconsistencies firsthand in the spring of 2007 when an employee shared her family’s experiences during her brother’s ICU stay. Christie Odom described how the visitation policy restricted her family’s access to her brother to 15-minute increments, 6 times a day, which led to heightened fear and anxiety for her brother, family, and friends and impeded patient and family engagement in care and decision-making. Odom’s brother died alone with no family by his side. A physical therapist, Odom observed that in the regional rehabilitation center, families were partners in care, yet in the adult ICU, they were visitors.
After hearing Christie’s story, the system’s executive team, board of directors, and physician leaders made a commitment to eliminate these restrictive visitation guidelines. Leaders understood that this would require the organization’s culture to change from viewing patients and families as passive recipients of care to recognizing them as partners. Subsequently, the commitment to patient-family partnerships was imbedded in key documents including the corporation’s strategic and 5-year quality plans. An Office of Patient-Family Experience was established at Vidant Medical Center in 2008 and, a year later, a corporate office was established to guide system transformation. Emphasis was placed on building a solid team of patient-family advisors and staff champions. An initial focus was to replace the restrictive visitation policy with family presence guidelines. A key tenet of these guidelines is that patients define who their family members are and how they should be included in care and decision-making.
This policy and practice change provided the impetus for ongoing evolution of patient-family partnerships. Patient-family advisors are now integrated across the health care system. They serve on performance improvement teams, make safety rounds, serve as faculty in education programs, interview applicants for key positions, and develop and edit patient education materials. The outcomes achieved by this system transformation are evidenced in exceptional HCAHPS performance, significant reductions in serious safety events and hospital acquired infections and national recognition for commitment to patient-family partnerships.
Conclusion
Changing the concept of families as visitors to families as partners in care, according to patient preference, is foundational to advancing the practice of patient- and family-centered care and to building a safe, high-quality, cost-effective system of care. In 2009, Lucian Leape and colleagues envisioned a transformed health care culture in which “the family is respected as part of the care team—never visitors—in every area of the hospital, including the emergency department and the intensive care unit” [8]. A 2014 report by the National Patient Safety Foundation’s Lucian Leape Institute affirmed, “patients and families can play a critical role in preventing medical errors and reducing harm” [9].
Many hospitals still do not encourage family presence and participation and do not embrace the concept of families as true partners in care. But as demonstrated by the actions of the exemplar hospitals described here, it is possible to make this critical culture shift. The exemplar hospitals understand the importance of partnering with patients’ families instead of treating them as outsiders who are interfering in their loved one’s care. These hospitals are proving that giving patients the access they want to their loved ones actually helps themget better.
Through its campaign Better Together: Partnering with Families, IPFCC challenges hospitals across the United States and Canada to pledge to join this important initiative. Now is the time for all hospitals to embrace family presence and participation and to welcome families and other care partners 24 hours a day, 7 days a week.
Hospitals are invited to join this initiative. Steps to begin the change process may be found at www.ipfcc.org/advance/topics/better-together-pledge.html. Also available at IPFCC website is the Better Together toolkit, other materials and information that support the initiative, and a complete list of the exemplar hospitals and their processes and policies. The toolkit includes an organizational self-assessment, sample processes and policies, videos, and guides for families and staff to use in developing partnership. It is available at no charge at www.ipfcc.org/bettertogether/.
Corresponding author: Beverley H. Johnson, 6917 Arlington Rd., Ste. 309, Bethesda, MD 20814, bjohson@ipfcc.org.
Behind a Locked Door
This is our story as I remember it.
One day I came home from work, and my husband was confused. In all the years we’d been married, I’d never known him to be confused. He was sitting in the family room, and he looked frightened.
I said, “Bill, what’s going on?” He said, “Well, I was just going to get up and go look outside for Joey.” I said, “Bill, Joey’s not here.” He insisted, “Oh yes, we just came back from vacation. Joey just went outside, and I was going to check on him.”
I was alarmed and said, “Bill, I think you’re a little confused. I’m concerned because this morning you told me you had a headache. Maybe we should go to the hospital.” He resisted, but I simply told him, “Bill, if something was to happen to you, I might be held responsible because I didn’t do what was in your best interest. We can come home if everything is okay.”
And so we went to the emergency room, where we learned that my husband had a small bleed in his brain. We were told that we needed to go to another hospital that had a neurosurgeon on staff. My husband was transported by ambulance to a hospital about a mile away, and I followed him there in our car.
I want to stop here and tell you a bit about my husband and about myself. My name is Jackie Gruzenski, and I am a nurse involved in the field of psychiatric nursing. My husband’s name was Dr. William Gruzenski. He was a psychiatrist for forty years, and he was a chief medical officer for the last twelve years of his career.
Bill was a very good doctor and a very good husband. And toward the end of his life, he realized that all of his degrees, along with money and material possessions, didn’t matter. They were nothing. He just wanted to have me with him. We loved each other very deeply, and we wanted to share our last days and moments together, but I’m getting ahead of myself.
When we got to the second hospital, my husband was in the emergency room from about 7:00 p.m. until about 6:00 a.m. the next morning. At some point, he started to develop a hypertensive crisis, and the staff could not bring his blood pressure down. They started an IV medication, which required that he be monitored closely in the intensive care unit (ICU).
Of course, I went with him as he was transferred from emergency to ICU. When we got to the ICU door, I was told, “Now, just go into the waiting room. We’re going to settle your husband, and then we’ll come and get you.”
I was a nervous wreck while I waited. I knew my husband had been pretty sick while in emergency. What if he got more confused? What if he lost even this current level of functioning and wouldn’t
remember me? The longer I waited, the more my anxiety grew.
The waiting room was a small area, with chairs around the perimeter, except by the locked door. After an hour with no news, I saw a phone on the wall and called. I said to the voice on the other end, “My name is Mrs. Gruzenski. I was informed that my husband was going to be settled and that someone would come and get me.”
The next thing I knew a young, perky nurse came out, greeted me, and then directed me totally away from my husband, away from the door to the ICU, to a little room. She proceeded to give me the strict policies and procedures for the ICU, including that visitation was allowed only four times a day for thirty minutes each time.
Not believing what I was hearing, I said, “But my husband is going to be worried that I am not with him. We are the center of each other’s lives—we are only apart when we are at work!” Her response was, “Well, you can’t be with him. Those are the rules.”
I lived ten miles away. What was I supposed to do between these widely spaced thirty-minute visits? I felt I had to play by the rules. I was afraid that if I questioned too much or was abrupt with someone, they would treat my husband meanly. And because he was behind a locked door, I would never know.
I didn’t know what else to do and so, shortly before 8:00 a.m., I went home to get some rest. Ironically, just after I got home and started to settle after our long night in the ER, I got a flurry of calls from different residents who wanted information about my husband. They never said, “Come over and visit. He’s missing you.” They called because they needed the information I could give them, but they kept me locked out.
When I was able to have my first visit the next day, my husband asked where I had been. I explained that there were very limited visiting hours. This prompted my husband to speak to his nurse and say, “You know, she’s not a visitor. She’s my wife!” But he was informed that didn’t matter, that there were rules, and that I was a visitor and had to be treated as a visitor.
The rule trumped both of us and what we wanted. The rule meant he had to suffer alone. This was an accredited hospital, but in my view it was archaic. Staff hid behind the rules rather than using their heads and their hearts.
Over the next few days, I saw that my not being there with my husband was leading to more and more distress for him. As he became more ill, he would not allow the nurses to wash him, and he would not eat their food. He was doing everything he could do to get the staff’s attention to revisit the visiting restrictions. If I’d been allowed to stay, I’m sure I could have helped with feeding, with bathing, and with toileting. I’m certain I could have calmed him and helped lower his blood pressure.
I was treated as though I was an enemy, but all I wanted was to be with him, to share the last days of his life. I had always been his anchor. I was the person who navigated the everyday waters of his life. The hospital’s rules meant that he was adrift, and I was lost.
During his hospitalization, he was not afforded the respect he had given to all his patients and the nurses and doctors he had worked with each day. For example, the ICU staff never asked him how he would like to be addressed. They called him “Bill” when he should have been addressed as “Doctor Gruzenski.” He wouldn’t have thought of calling a resident by his first name, and there were only a few people in his life, his inner circle of family and friends, who called him “Bill.”
One day, I actually witnessed one doctor refer to my husband not even as “Bill” but as “Billy.”
I followed this doctor out of the ICU and challenged him saying “Would you think you were valued as a medical professional, and that your life had meant something if, in forty years’ time, someone called you ‘Billy’? ‘Billy’ is what you call some young boy you like, not someone who is sixty-eight years old and is a dignified gentleman and physician.”
My husband earned the title of “Doctor.” He attended four years of medical school, one year of internship, four years as a resident psychiatrist, and he was board certified in psychiatry. He had earned respect by exceeding all the societal standards for being addressed as “Doctor.” These achievements should not be washed away once you are hospitalized. In fact, I believe my husband might have felt a little safer if he had been addressed as “Doctor.”
My husband was in the ICU for eight of the last sixteen days of his life, and there were lots of missed opportunities for us. He wanted me there more than I was allowed. We missed time together we could have had. I feel it was a very cruel thing that was done to us.
We both knew the gravity of his condition, and my husband wanted quality of life, not quantity. I was a large part of the quality he wanted, but I was locked out for the greater part of his last days.
After my husband died, I felt I had to do something so that what happened to us wouldn’t happen to anyone else. I wrote letters to the chief executive officer of the hospital. I wrote to the chief of the medical staff. I wrote to the chief of nursing. And I wrote to the chaplain. The only person I ever heard from was the chaplain. No one apologized or said they would change the rules.
I believe more harm comes when family are not actively involved, and research is proving my belief is sound. And so I will continue to tell my story. I hope that if I tell it enough times, maybe people who write the rules in hospitals will realize that loved ones are advocates, not visitors.
I will never stop advocating for the elimination of visiting hours.
Reprinted from Crocker L, Johnson B. Privileged presence. Personal stories of connections in health care. 2nd ed. Boulder, CO: Bull Publishing; 2014.
1. American Association of Critical-Care Nurses. Practice alert: Family presence: Visitation in the adult ICU. Accessed at www.aacn.org/WD/practice/docs/practicealerts/family-visitation-adult-icu-practicealert.pdf.
2. New Yorkers for Patient & Family Empowerment and the New York Public Interest Research Group. Sick, scared and separated from loved ones: A report on NYS hospital visiting policies and how patient-centered approaches can promote wellness and safer healthcare. August 2012. Accessed at www.patientandfamily/default.html.
3. Liu V, Read JL, Scruth E, Cheng E. Visitation policies and practices in US ICUs. Crit Care 2013;17:R71.
4. Institute for Patient- and Family-Centered Care. Facts and figures about family presence and participation. Accessed at www.ipfcc.org/advance/topics/Better-Together-Facts-and-Figures.pdf.
5. Better together: partnering with families. Changing the concept of families as visitors bibliography. Accessed at www.ipfcc.org/advance/topics/Changing-the-Concept-of-Families-as-Visitors-Bibliography.pdf.
6. Institute for Patient- and Family-Centered Care. Accessed at www.ipfcc.org/about/index.html.
7. Institute for Patient- and Family-Centered Care. Better together: Partnering with families. Accessed at www.ipfcc.org/advance/topics/better-together.html.
8. Leape L, Berwick D, Clancy C, et al; Lucian Leape Institute at the National Patient Safety Foundation. Transforming healthcare: a safety imperative. Qual Saf Health Care 2009;18:424–8.
9. The National Patient Safety Foundation’s Lucien Leape Institute. Safety is personal: Partnering with patients and families for the safest care. Report of the Roundtable on Consumer Engagement in Patient Safety. Boston: National Patient Safety Foundation; 2014.
From the Institute for Patient- and Family-Centered Care, Bethesda, MD (Ms. Dokken, Ms. Kaufman, and Ms. Johnson), Anne Arundel Medical Center, Annapolis, MD (Dr. Perkins), Contra Costa Regional Medical Center & Health Centers, Martinez, CA (Ms. Benepal, Ms. Roth, and Vidant Health, Greenville, NC (Ms. Dutton and Ms. Jones).
Abstract
- Objective: To describe a campaign to eliminate restrictive hospital visiting policies and to put in place policies that recognize families as partners in care.
- Methods: Descriptive report.
- Results: Many hospitals still have “visiting” hours that limit family presence, often counter to patient preferences. To change the concept of families as visitors and eliminate restrictive hospital visiting policies, the Institute for Patient- and Family-Centered Care (IPFCC) launched the campaign Better Together: Partnering with Families, calling on all hospitals to welcome families 24 hours a day and transform their policies and approaches to care so that patients’ families and loved ones are included in care and decision making, according to patient preferences. As part of the campaign, IPFCC recognized 12 hospitals that exemplify success in eliminating restrictive visiting policies and have changed the concept of families from “visitors” to partners. Leaders at these hospitals attest to the benefits of the changes through improved experience of care and other outcomes. Three exemplar hospitals are highlighted in this article and share their processes of change as well as key learnings and outcomes.
- Conclusion: Hospital policies and practices that encourage and support families as partners in care are essential to patients’ health, well-being, and safety.
Many families are restricted from the bedsides of loved ones because of hospital visiting policies [1–3]. Restrictive policies are often based on long-held beliefs that the presence and participation of families interferes with care, exhausts patients, is a burden to families, spreads infection, or violates HIPAA. However, there is no evidence to support those beliefs. In fact, isolating patients at their most vulnerable time from the people who know them best places them at risk for medical error, emotional harm, inconsistencies in care, and lack of preparedness for transitions in care [4,5]. Jackie Gruzenski’s story “Behind a Locked Door” (printed below) affectingly describes the impact of restrictive policies on a couple's last days.
Fortunately, a growing number of hospitals are lifting these restrictions. But opening the door is not enough. Hospitals need to change the concept of families as “visitors” to families as partners in care. Changing policies is a foundational step in creating a patient- and family-centered culture where families are recognized as essential to patients’ health and well-being and where they are respected as allies for quality and safety.
In response to this critical need for change, in June 2014 the Institute for Patient- and Family-Centered Care (IPFCC) launched the campaign Better Together: Partnering with Families. IPFCC, founded in 1992, is a nonprofit organization that provides essential leadership to advance the understanding and practice of patient- and family-centered care [6]. Emphasizing the importance of family presence and participation to quality and safety, the campaign seeks to eliminate restrictive “visiting” policies and calls upon hospitals to include families as members of the care team and to welcome them 24 hours a day, 7 days a week, according to patient preference [7]. The goal of the campaign is to change visiting policies in 1000 hospitals by 2017. Partnering with IPFCC in this initiative are the American Society for Healthcare Risk Management, American Association of Critical Care Nurses, National Partnership for Women & Families, New Yorkers for Patient and Family Empowerment, Health In Aging Foundation, and the Canadian Foundation for Healthcare Improvement.
Anne Arundel Medical Center
A regional not-for-profit hospital founded in 1902, Anne Arundel Medical Center in Annapolis, MD, provides acute inpatient and outpatient care to residents of 4 counties in Maryland. A 380-bed facility, Anne Arundel has a cancer institute, heart and vascular institute, joint center, spine center, and a women’s and children’s center. In April 2011, the hospital completed a $424 million expansion project, which included a pediatric emergency room, an expanded general emergency room, 50 new patient beds, and 8 new operating rooms.
In 2010, based on a desire to concretely implement the principles of patient- and family-centered care, leaders at Anne Arundel began working with patient and family advisors and initiated a process to change the hospital’s restrictive visiting policy. Now, there are no restrictions on family presence anywhere in the hospital, from ICUs to medical/surgical units to other clinical areas. Patients have the power to choose who they want to stay with them—24 hours a day, 7 days a week. According to Anne Arundel’s policy, each patient determines who is defined as “family.” A “Revisiting Visiting” task force, comprising support staff, providers, and patient and family advisors, worked for 9 months to develop the new family presence policy and support its implementation.
With Anne Arundel leadership encouragement and support, patient and family advisors participated in all phases of the development and implementation of the new family presence policy and in other ways to advance the practice of patient- and family-centered care. The advisors also participated in the process to change the way nurse change of shift report was conducted, and they made recommendations for changes in the directional signs throughout the hospital. New signs, featuring a pineapple (a symbol of hospitality) and the words “Welcome Families” replaced old ones displaying the former restrictive visiting policy.
Supporting patient and family involvement in transitions in care is an integral aspect of implementing family presence policies and practices. Through an “Always Events” grant from the Picker Institute (for information about the Always Events program, see www.ihi.org/Engage/Initiatives/PatientFamilyCenteredCare/Pages/AlwaysEvents.aspx), patient and family advisors, staff, and providers at Anne Arundel developed the SMART discharge protocol, which includes a simple 5-item checklist that is reviewed and discussed with the patient and family prior to discharge. SMART is an acronym for Signs, Medications, Appointments, Results, and Talk. In its work, the SMART team built on current evidence, created urgency and expectation for use with patients, families, and caregivers, disseminated findings, and promoted the protocol as a national standard. The tool is available at www.ihi.org/resources/Pages/Tools/SMARTDischargeProtocol.aspx.
According to Anne Arundel’s COO and CNO, Sherry Perkins, a critical part of the change process was to first understand staff’s fears and then learn what the evidence says. For example, with regard to the impact of additional family presence on infection control, they learned that family presence did not pose additional infection control concerns.
In 2009, there were no patient and family advisors volunteering at Anne Arundel. In 2014, there are approximately 80 advisors. Since 2009, the overall HCAHPS rating of the hospital has gone from 75.4% to 82% (the national average is 70%). While patient satisfaction scores have previously been in the top deciles at Anne Arundel, they have consistently risen since expanding family presence and implementing additional patient- and family-centered strategies.
Contra Costa Regional Medical Center and Health Centers
Contra Costa Health Services in Martinez, CA, includes Contra Costa Regional Medical Center and 10 health centers as part of a comprehensive county health system. Its 164-bed public hospital is dedicated to offering services that are welcoming, accessible, safe and respectful for everyone.
Like many hospitals in the country, for years Contra Costa Regional Medical Center restricted the hours when family members and loved ones could visit patients. However, the hospital’s medical staff often felt uncomfortable that they had to usher family and care partners away from patients when visiting hours were over. Anna Roth, Contra Costa’s CEO, recalls an incident that caused great anguish and contributed to the hospital’s decision to eliminate its restrictive visiting policy. A young boy whose grandfather was in the ICU was denied visitation. The grandfather, who had raised him, passed away, with the two having had no chance to say goodbye. Roth said that the incident hit home for her and the entire staff, and they knew they could do better. “Our old policies treated family members like visitors, until we realized that we are the visitors in people’s lives, not the other way around,” she noted.
In 2012, the hospital established an interdisciplinary team to transform its existing visiting policy into a “welcoming policy.” The team comprised the director of inpatient nursing, the chief of nursing, the chief of security, a public health program specialist, the facilities manager, and a patient partner. The new policy would support family presence 24/7 as well as change the concept of families as “visitors.”
Over the course of a year, the team designed the framework for a 3-day pilot and developed a check-in process to help loved ones gain access to patients after regular hospital hours. Working closely with nursing leadership, front-line staff, patient partners, and security, the team made necessary adjustments to the policy throughout the pilot period. The pilot was well-received and the policy was implemented soon after.
In the policy’s first year, more than 7000 family members and care partners were able to be with their loved ones between 8 pm and 6 am, the time period formerly restricted. The feedback from staff, patients and loved ones has been overwhelmingly positive. Front-line nurses are currently strengthening their skills and confidence in conducting change of shift report at bedside with patients and families. Other “welcoming” measures have also been implemented, including making signage more user-friendly, providing comfortable chairs to sleep in, and installing new vending machines with healthy snacks and drinks.
Vidant Health
Vidant Health serves 1.4 million people in a 29-county region of eastern North Carolina and comprises over 70 primary and specialty physician office practices, a 900-bed academic medical center, 7 community hospitals, an ambulatory surgery center, and home health and hospice services. Vidant Health’s efforts to advance a culture of patient- and family-centered care began in the late 1990s in the James and Connie Maynard Children’s Hospital and the regional rehabilitation center, but this culture did not spread consistently throughout Vidant Health, leading to differing experiences of care for patients and families.
The Vidant Health executive team and senior leaders heard about these inconsistencies firsthand in the spring of 2007 when an employee shared her family’s experiences during her brother’s ICU stay. Christie Odom described how the visitation policy restricted her family’s access to her brother to 15-minute increments, 6 times a day, which led to heightened fear and anxiety for her brother, family, and friends and impeded patient and family engagement in care and decision-making. Odom’s brother died alone with no family by his side. A physical therapist, Odom observed that in the regional rehabilitation center, families were partners in care, yet in the adult ICU, they were visitors.
After hearing Christie’s story, the system’s executive team, board of directors, and physician leaders made a commitment to eliminate these restrictive visitation guidelines. Leaders understood that this would require the organization’s culture to change from viewing patients and families as passive recipients of care to recognizing them as partners. Subsequently, the commitment to patient-family partnerships was imbedded in key documents including the corporation’s strategic and 5-year quality plans. An Office of Patient-Family Experience was established at Vidant Medical Center in 2008 and, a year later, a corporate office was established to guide system transformation. Emphasis was placed on building a solid team of patient-family advisors and staff champions. An initial focus was to replace the restrictive visitation policy with family presence guidelines. A key tenet of these guidelines is that patients define who their family members are and how they should be included in care and decision-making.
This policy and practice change provided the impetus for ongoing evolution of patient-family partnerships. Patient-family advisors are now integrated across the health care system. They serve on performance improvement teams, make safety rounds, serve as faculty in education programs, interview applicants for key positions, and develop and edit patient education materials. The outcomes achieved by this system transformation are evidenced in exceptional HCAHPS performance, significant reductions in serious safety events and hospital acquired infections and national recognition for commitment to patient-family partnerships.
Conclusion
Changing the concept of families as visitors to families as partners in care, according to patient preference, is foundational to advancing the practice of patient- and family-centered care and to building a safe, high-quality, cost-effective system of care. In 2009, Lucian Leape and colleagues envisioned a transformed health care culture in which “the family is respected as part of the care team—never visitors—in every area of the hospital, including the emergency department and the intensive care unit” [8]. A 2014 report by the National Patient Safety Foundation’s Lucian Leape Institute affirmed, “patients and families can play a critical role in preventing medical errors and reducing harm” [9].
Many hospitals still do not encourage family presence and participation and do not embrace the concept of families as true partners in care. But as demonstrated by the actions of the exemplar hospitals described here, it is possible to make this critical culture shift. The exemplar hospitals understand the importance of partnering with patients’ families instead of treating them as outsiders who are interfering in their loved one’s care. These hospitals are proving that giving patients the access they want to their loved ones actually helps themget better.
Through its campaign Better Together: Partnering with Families, IPFCC challenges hospitals across the United States and Canada to pledge to join this important initiative. Now is the time for all hospitals to embrace family presence and participation and to welcome families and other care partners 24 hours a day, 7 days a week.
Hospitals are invited to join this initiative. Steps to begin the change process may be found at www.ipfcc.org/advance/topics/better-together-pledge.html. Also available at IPFCC website is the Better Together toolkit, other materials and information that support the initiative, and a complete list of the exemplar hospitals and their processes and policies. The toolkit includes an organizational self-assessment, sample processes and policies, videos, and guides for families and staff to use in developing partnership. It is available at no charge at www.ipfcc.org/bettertogether/.
Corresponding author: Beverley H. Johnson, 6917 Arlington Rd., Ste. 309, Bethesda, MD 20814, bjohson@ipfcc.org.
Behind a Locked Door
This is our story as I remember it.
One day I came home from work, and my husband was confused. In all the years we’d been married, I’d never known him to be confused. He was sitting in the family room, and he looked frightened.
I said, “Bill, what’s going on?” He said, “Well, I was just going to get up and go look outside for Joey.” I said, “Bill, Joey’s not here.” He insisted, “Oh yes, we just came back from vacation. Joey just went outside, and I was going to check on him.”
I was alarmed and said, “Bill, I think you’re a little confused. I’m concerned because this morning you told me you had a headache. Maybe we should go to the hospital.” He resisted, but I simply told him, “Bill, if something was to happen to you, I might be held responsible because I didn’t do what was in your best interest. We can come home if everything is okay.”
And so we went to the emergency room, where we learned that my husband had a small bleed in his brain. We were told that we needed to go to another hospital that had a neurosurgeon on staff. My husband was transported by ambulance to a hospital about a mile away, and I followed him there in our car.
I want to stop here and tell you a bit about my husband and about myself. My name is Jackie Gruzenski, and I am a nurse involved in the field of psychiatric nursing. My husband’s name was Dr. William Gruzenski. He was a psychiatrist for forty years, and he was a chief medical officer for the last twelve years of his career.
Bill was a very good doctor and a very good husband. And toward the end of his life, he realized that all of his degrees, along with money and material possessions, didn’t matter. They were nothing. He just wanted to have me with him. We loved each other very deeply, and we wanted to share our last days and moments together, but I’m getting ahead of myself.
When we got to the second hospital, my husband was in the emergency room from about 7:00 p.m. until about 6:00 a.m. the next morning. At some point, he started to develop a hypertensive crisis, and the staff could not bring his blood pressure down. They started an IV medication, which required that he be monitored closely in the intensive care unit (ICU).
Of course, I went with him as he was transferred from emergency to ICU. When we got to the ICU door, I was told, “Now, just go into the waiting room. We’re going to settle your husband, and then we’ll come and get you.”
I was a nervous wreck while I waited. I knew my husband had been pretty sick while in emergency. What if he got more confused? What if he lost even this current level of functioning and wouldn’t
remember me? The longer I waited, the more my anxiety grew.
The waiting room was a small area, with chairs around the perimeter, except by the locked door. After an hour with no news, I saw a phone on the wall and called. I said to the voice on the other end, “My name is Mrs. Gruzenski. I was informed that my husband was going to be settled and that someone would come and get me.”
The next thing I knew a young, perky nurse came out, greeted me, and then directed me totally away from my husband, away from the door to the ICU, to a little room. She proceeded to give me the strict policies and procedures for the ICU, including that visitation was allowed only four times a day for thirty minutes each time.
Not believing what I was hearing, I said, “But my husband is going to be worried that I am not with him. We are the center of each other’s lives—we are only apart when we are at work!” Her response was, “Well, you can’t be with him. Those are the rules.”
I lived ten miles away. What was I supposed to do between these widely spaced thirty-minute visits? I felt I had to play by the rules. I was afraid that if I questioned too much or was abrupt with someone, they would treat my husband meanly. And because he was behind a locked door, I would never know.
I didn’t know what else to do and so, shortly before 8:00 a.m., I went home to get some rest. Ironically, just after I got home and started to settle after our long night in the ER, I got a flurry of calls from different residents who wanted information about my husband. They never said, “Come over and visit. He’s missing you.” They called because they needed the information I could give them, but they kept me locked out.
When I was able to have my first visit the next day, my husband asked where I had been. I explained that there were very limited visiting hours. This prompted my husband to speak to his nurse and say, “You know, she’s not a visitor. She’s my wife!” But he was informed that didn’t matter, that there were rules, and that I was a visitor and had to be treated as a visitor.
The rule trumped both of us and what we wanted. The rule meant he had to suffer alone. This was an accredited hospital, but in my view it was archaic. Staff hid behind the rules rather than using their heads and their hearts.
Over the next few days, I saw that my not being there with my husband was leading to more and more distress for him. As he became more ill, he would not allow the nurses to wash him, and he would not eat their food. He was doing everything he could do to get the staff’s attention to revisit the visiting restrictions. If I’d been allowed to stay, I’m sure I could have helped with feeding, with bathing, and with toileting. I’m certain I could have calmed him and helped lower his blood pressure.
I was treated as though I was an enemy, but all I wanted was to be with him, to share the last days of his life. I had always been his anchor. I was the person who navigated the everyday waters of his life. The hospital’s rules meant that he was adrift, and I was lost.
During his hospitalization, he was not afforded the respect he had given to all his patients and the nurses and doctors he had worked with each day. For example, the ICU staff never asked him how he would like to be addressed. They called him “Bill” when he should have been addressed as “Doctor Gruzenski.” He wouldn’t have thought of calling a resident by his first name, and there were only a few people in his life, his inner circle of family and friends, who called him “Bill.”
One day, I actually witnessed one doctor refer to my husband not even as “Bill” but as “Billy.”
I followed this doctor out of the ICU and challenged him saying “Would you think you were valued as a medical professional, and that your life had meant something if, in forty years’ time, someone called you ‘Billy’? ‘Billy’ is what you call some young boy you like, not someone who is sixty-eight years old and is a dignified gentleman and physician.”
My husband earned the title of “Doctor.” He attended four years of medical school, one year of internship, four years as a resident psychiatrist, and he was board certified in psychiatry. He had earned respect by exceeding all the societal standards for being addressed as “Doctor.” These achievements should not be washed away once you are hospitalized. In fact, I believe my husband might have felt a little safer if he had been addressed as “Doctor.”
My husband was in the ICU for eight of the last sixteen days of his life, and there were lots of missed opportunities for us. He wanted me there more than I was allowed. We missed time together we could have had. I feel it was a very cruel thing that was done to us.
We both knew the gravity of his condition, and my husband wanted quality of life, not quantity. I was a large part of the quality he wanted, but I was locked out for the greater part of his last days.
After my husband died, I felt I had to do something so that what happened to us wouldn’t happen to anyone else. I wrote letters to the chief executive officer of the hospital. I wrote to the chief of the medical staff. I wrote to the chief of nursing. And I wrote to the chaplain. The only person I ever heard from was the chaplain. No one apologized or said they would change the rules.
I believe more harm comes when family are not actively involved, and research is proving my belief is sound. And so I will continue to tell my story. I hope that if I tell it enough times, maybe people who write the rules in hospitals will realize that loved ones are advocates, not visitors.
I will never stop advocating for the elimination of visiting hours.
Reprinted from Crocker L, Johnson B. Privileged presence. Personal stories of connections in health care. 2nd ed. Boulder, CO: Bull Publishing; 2014.
1. American Association of Critical-Care Nurses. Practice alert: Family presence: Visitation in the adult ICU. Accessed at www.aacn.org/WD/practice/docs/practicealerts/family-visitation-adult-icu-practicealert.pdf.
2. New Yorkers for Patient & Family Empowerment and the New York Public Interest Research Group. Sick, scared and separated from loved ones: A report on NYS hospital visiting policies and how patient-centered approaches can promote wellness and safer healthcare. August 2012. Accessed at www.patientandfamily/default.html.
3. Liu V, Read JL, Scruth E, Cheng E. Visitation policies and practices in US ICUs. Crit Care 2013;17:R71.
4. Institute for Patient- and Family-Centered Care. Facts and figures about family presence and participation. Accessed at www.ipfcc.org/advance/topics/Better-Together-Facts-and-Figures.pdf.
5. Better together: partnering with families. Changing the concept of families as visitors bibliography. Accessed at www.ipfcc.org/advance/topics/Changing-the-Concept-of-Families-as-Visitors-Bibliography.pdf.
6. Institute for Patient- and Family-Centered Care. Accessed at www.ipfcc.org/about/index.html.
7. Institute for Patient- and Family-Centered Care. Better together: Partnering with families. Accessed at www.ipfcc.org/advance/topics/better-together.html.
8. Leape L, Berwick D, Clancy C, et al; Lucian Leape Institute at the National Patient Safety Foundation. Transforming healthcare: a safety imperative. Qual Saf Health Care 2009;18:424–8.
9. The National Patient Safety Foundation’s Lucien Leape Institute. Safety is personal: Partnering with patients and families for the safest care. Report of the Roundtable on Consumer Engagement in Patient Safety. Boston: National Patient Safety Foundation; 2014.
Integrating Lay Health Care Workers into the Primary Care Team
From Allina Health, Minneapolis, MN.
Abstract
- Objective: To describe a care model in which lay “care guides” are integrated into the primary care team to help patients with chronic disease and their providers achieve care goals.
- Methods: Care guides are individuals without formal medical training who receive brief training about chronic conditions and behavior change. General activities include educating and encouraging patients to take control of their illness, supporting medication and treatment adherence, and facilitating resolution of barriers to quality care.
- Results: The care guide model can improve care for some patients with chronic disease at low cost. In a randomized trial testing the intervention, patients with care guides achieved more goals than usual care patients at 1 year (odds ratio, 1.31; 95% confidence interval, 1.16–1.47; P < 0.001).
- Conclusion: Lay health care workers with relevant skills and training, located in clinic waiting rooms where they can meet patients and providers face-to-face, can help chronic disease patients and their providers improve the quality of care.
Improving the quality of care for chronic disease patients is an important goal for the US health care system. Almost half of American with chronic disease fail to receive evidence-based care [1–3]. Reasons for this include limited access to the health care delivery system [4,5] and payment systems that undervalue primary care and provide incentives for more but not necessarily better care [6]. Not only is there a need to improve the quality of care among chronic disease patients, but also to recognize the constraints faced by primary care providers (PCPs) and clinic staff in the current health care environment.
One approach for improving care for patients with chronic disease has been care coordination, or management by health care professionals such as nurses and certified medical assistants [7]. These care managers are usually located in primary care medical offices and have some face-to-face contact with both patients and providers in addition to telephone or electronic contact [7,8]. Care management provided by registered nurses can be effective but is expensive, and it is unclear where payment for these services will come from [7,9].
An alternative approach is employing lay health care workers. In the literature lay health care workers have been referred to as promotoras de salud, lay advisors or navigators, and peer coaches [10–12]. Some of these workers are employees while others are part-time volunteers [13,14]. Tasks assigned to these workers are often limited, such as improving access to cancer care [15], teaching self-help techniques [16–18], or goal-setting [19], and are usually focused on a specific disease or problem. Some of workers do have contact with nurses and doctors, but they tend not to work with the primary care team in the day-to-day provision of care [14].
To improve the quality and efficiency of chronic disease care, Allina Health, a large not-for-profit system of hospitals and clinics in Minnesota and western Wisconsin, hired lay “care guides” to help patients and providers achieve care goals and integrated them into the primary care team. In this article, we describe the care guide model we used and tested and discuss adoption considerations.
Role and Responsibilities of a Care Guide
Care guides are individuals without formal medical training whose general activities include:
- fostering a longitudinal relationship to encourage patients to take control of their chronic illness;
- educating patients about the considerable benefits of best practice treatment;
- communicating with patients, families and providers to keep the entire care team, including the PCP, focused on meeting care guidelines;
- supporting medication and treatment adherence;
- identifying and facilitating resolution of barriers to quality care;
- facilitating referrals to extended care team members and introducing patients to appropriate services or resources within the clinic, health system and/or community they live or work in.
How do care guides differ from other personnel used as care managers? Care guides can explain the value of meeting standard goals, but unlike nurses cannot answer clinical questions. Care guides and medical assistants have similar salaries but care guides have higher educational requirements, less clinical training, and no competing duties in clinic. Like community health workers, care guides are culturally similar to the patients they serve, but are located in the clinic. Care guides were recruited for specific traits and competencies: an outgoing personality, the ability to engage easily with people of different ages and backgrounds, and a second language where needed (eg, Spanish and Somali in the pilot study) [20].
Implementation Trial
![]()
The study recruited 2135 patients. Both groups had an increased percentage of goals met at the end of the 1-year study compared to baseline. Care guide patients met a larger percentage of possible care goals at 1 year than did usual care patients (odds ratio, 1.31; 95% confidence interval, 1.16–1.47; P < 0.001). Care guide patients reduced unmet goals by 30.1%, usual care patients by 12.6%. The difference in outcomes between the 2 groups was minimally affected by differences in the times of final measurement for each goal. The benefit of working with a care guide was not different across demographic categories of age, sex, race, language, insurance, or education. In this study, care guides helped a broad range of patients who were meeting many goals at baseline and who were cared for by providers already receiving regular quality-improvement feedback. Estimated cost was $286 per patient per year.
Development Process
At each clinic, the research team enlisted the help of a site-specific implementation team consisting of a provider champion and clinic leader (ie, the clinic manager, clinic supervisor, or business office supervisor) to customize the study implementation. After selecting the target patient population, chronic disease focus, and eligibility criteria, the research team solicited the help of providers, nurses, medical assistants, and other clinic support staff to develop care guide workflows and processes. Clinic providers and staff were involved early and often in the model planning process. The team gave thoughtful consideration to existing clinic work processes and personnel dynamics to help ensure that the care guide would be accepted and integrated into the clinic culture.
Concurrent with designing workflows for the interactions between care guides and providers, clinical staff, and patients, the research team worked with a variety of support departments at Allina Health System to ensure that the necessary tools were in place for care guides to do their work effectively. They collaborated with human resources to screen for care guide candidates with appropriate skills and personal attributes; information systems to create new tools and security access within the electronic health record; learning and development to organize resources and devise an appropriate training schedule; and marketing/communications to broadcast this new initiative on a system-wide level.
Once details of the model and workflows were established, the research team secured subject matter experts to build content for care guide training. The research team partnered with PCPs whose expertise was treating these chronic diseases as well as pharmacists, nutritionists, diabetes nurse educators, and behavioral health specialists available within the health system. These subject matter experts provided the training content as well as conducted the training. Training took place over 2 weeks and included basic training on the 3 chronic disease conditions, pharmacology, nutrition, and mental health issues, barriers to care, and behavioral change techniques.
Benefits
What were the key interactions leading to clinical improvements? What made the intervention successful? Care guides described using a variety of techniques to yield clinical improvements. With patients, care guides took time to explain the benefits of meeting goals in lay language, used their non-medical backgrounds to create an environment where patients felt at ease asking questions, called patients following office visits to ensure instructions were understood, and helped develop specific action plans. With providers and nurses, care guides gave reminders about unmet goals on the day of an appointment (when this information would be most useful) and supplied information such as “this patient reports difficulty affording medication” or “this patient seems ready to quit tobacco.” Care guides reinforced the effectiveness of longer-term care relationships; for example, most patients who quit tobacco did so between 9 and 12 months after enrollment in the care guide program. In after-study surveys, care guide patients reported significantly more positive perceptions of their care than usual care patients in constructs measuring social support, individualized care, help, reinforcement, and understanding of how to improve their health.
Care guides, using their relationships with providers, served as quality improvement advocates integrated into the daily process of providing primary care. This arrangement differed from the common practice of giving providers periodic feedback based on data gleaned from the electronic health record.
Moving the quality improvement process into the primary care office resolved many problems related to strictly electronic health record–based feedback. Each patient was considered individually. There was opportunity for conversations about care quality to occur face-to-face; members of the primary care team could discuss when to deviate from a care guideline. Strong relationships and a sense of teamwork increased workplace satisfaction [22]. In a post-study survey of 115 providers and nurses, 93% felt that care guides improved patient care and 94% felt that care guides were an effective use of resources.
Adoption Considerations
Adding a care guide into an existing clinic structure and culture requires planning and customization. In order to fully integrate this role into clinics and on care teams and achieve expected results, 6 steps are recommended:
- Program set-up through recruitment of the proper set of stakeholders to plan for implementation, including logistics, budget, etc.
- Defining details, such as the target patient population and eligibility criteria, how interactions will take place with patients, and the duration of the patient relationship.
- Clinic readiness and program development, including detailed clinic staff orientation and workflow development.
- Clinic-specific development of the care guide training, including enlisting the help of subject matter experts to develop content.
- A 2-week training of newly-hired care guides
- Defining the expectations and job responsibilities of the care guide and proper integration of care guides into care teams.
- Monitoring and evaluation – This is not the last step in the process but rather requires the ongoing work of the clinic staff, providers, and care guides to measure progress and outcomes.
Although transforming care teams in primary care clinics is no easy task, it is the foundation of the care guide model. The premise of the care guide role is simple and relatable, thereby making it transferrable to different patient populations and settings as well as attractive to different types of providers. The model is flexible, allowing room for adaptations while maintaining its focus on serving patients and families and reducing burden for providers and other clinic staff. The model is currently being adapted and used in different settings outside of traditional primary care, including urgent care and emergency departments, specialty services, and patient-centered medical homes, among others. In addition, care guides are being used across different patient populations, including high-risk patients in an accountable care organization, pediatric patients, and patients late in life, to name a few. Each adaptation may have population-specific goals and outcomes, but the core of the model remains focused on the Institute for Healthcare Improvement's triple aim: improving the patient experience of care, improving the health of populations, and reducing the per capita cost of health care.
For clinics and care providers interested in integrating care guides within their own clinic, a toolkit, eLearning modules, and evaluation templates, among other resources, are available at no cost through the Care Copilot Institute (www.carecopilotinstitute.org). The Institute was created to translate and disseminate the care guide research.
Conclusion
Lay health care workers with relevant skills and training, located in clinic waiting rooms where they can meet patients and providers face-to-face, can help chronic disease patients and their providers improve the quality of care. Because of its low cost, this model can be implemented in many settings, including small independent primary care offices, where much primary care in the US is still delivered [7,23–25].
Corresponding author: Kim Radel, MHA, Allina Health, Minneapolis, MN, kimberly.radel@allina.com.
Financial disclosures: Dr. Christianson disclosed that he received grant support from the Robina Foundation.
1. Banerjee D, Stafford R. Lack of improvement in outpatient management of congestive heart failure in the United States Arch Intern Med 2010;16:1–2.
2. Egan BM, Zhao Y, RN A. US trends in prevalence, awareness, treatment, and control of hypertension. JAMA 2010;303:2043–50.
3. McGlynn E, Asch S, Adams J, et al. The quality of health care delivered to adults in the United States. N Engl J Med 2003;348:2635–45.
4. Ghorob A, Bodenheimer T. Sharing the care to improve access to primary care. N Engl J Med 2012;366:1955–7.
5. Schroeder SA. Shattuck Lecture. We can do better - improving the health of the American people. N Engl J Med 2007;357:1221–8.
6. Bazinsky KR, Herrera L, Sharfstein JM. Toward innovative models of health care and financing: matchmaking in Maryland. JAMA 2012;307:1261–2.
7. Berry-Millett R, Bodenheimer TS. Care management of patients with complex health care needs. Synth Proj Res Synth Rep 2009;(19).
8. Peikes D, Chen A, Schore J, Brown R. Effects of care coordination on hospitalization, quality of care, and health care expenditures among Medicare beneficiaries: 15 randomized trials. JAMA 2009;301:603–18.
9. Ayanian JZ. The elusive quest for quality and cost savings in the Medicare program. JAMA 2009;301:668–70.
10. Babamoto KS, Sey KA, Camilleri AJ, et al. Improving diabetes care and health measures among hispanics using community health workers: results from a randomized controlled trial. Health Educ Behav 2009;36:113–26.
11. Brownstein JN, Hirsch GR, Rosenthal EL, Rush CH. Community health workers “101” for primary care providers and other stakeholders in health care systems. J Ambul Care Manage 2011;34:210–20.
12. Lewin S, Dick J, Pond P, et al. Lay health workers in primary and community health care. Cochrane Database Syst Rev 2005;(1):CD004015.
13. Doull M, O’Connor A, Welch V, et al. Peer support strategies for improving the health and well-being of individuals with chronic diseases. Cochrane Database Syst Rev 2004;(2):CD004774.
14. Witmer A, Seifer SD, Finocchio L, et al. Community health workers: integral members of the health care work force. Am J Public Health 1995;85(8 Pt 1):1055–8.
15. Steinberg ML, Fremont A, Khan DC, et al. Lay patient navigator program implementation for equal access to cancer care and clinical trials: essential steps and initial challenges. Cancer 2006;107:2669–77.
16. Fu D, Fu H, McGowan P, et al. Implementation and quantitative evaluation of chronic disease self-management programme in Shanghai, China: randomized controlled trial. Bull World Health Organ 2003;81:174–82.
17. Kennedy A, Reeves D, Bower P, et al. The effectiveness and cost effectiveness of a national lay-led self care support programme for patients with long-term conditions: a pragmatic randomised controlled trial. J Epidemiol Comm Health 2007;61:254–61.
18. Rhodes SD, Foley KL, Zometa CS, Bloom FR. Lay health advisor interventions among Hispanics/Latinos: a qualitative systematic review. Am J Prev Med 2007;33:418–27.
19. Heisler M, Spencer M, Forman J, et al. Participants’ assessments of the effects of a community health worker intervention on their diabetes self-management and interactions with healthcare providers. Am J Prev Med 2009;37(6 Suppl 1):S270–9.
20. Adair R, Christianson JB, Wholey DR, et al. Care guides: employing nonclinical laypersons to help primary care teams manage chronic disease. J Ambul Care Manage 2012;35:27–37.
21. Adair R, Wholey DR, Christianson JB, et al. Improving chronic disease care by adding laypersons to the primary care team: a parallel randomized trial. Ann Intern Med 2013;159:176–84.
22. Cassel CK, Jain S. Assessing individual physician performance: does measurement suppress motivation? JAMA 2012;307:2595–6.
23. Nocon RS, Sharma R, Birnberg JM, et al. Association between patient-centered medical home rating and operating cost at federally funded health centers. JAMA 2012;308:60–6.
24. Rittenhouse D, Casalino L. Small and medium-size physician practices use few patient-centered medical home processes. Health Aff 2011;30:1575–84.
25. Fifield J, Forrest DD, Martin-Peele M, et al. A randomized, controlled trial of implementing the patient-centered medical home model in solo and small practices. J Gen Intern Med 2012;28:770–7.
From Allina Health, Minneapolis, MN.
Abstract
- Objective: To describe a care model in which lay “care guides” are integrated into the primary care team to help patients with chronic disease and their providers achieve care goals.
- Methods: Care guides are individuals without formal medical training who receive brief training about chronic conditions and behavior change. General activities include educating and encouraging patients to take control of their illness, supporting medication and treatment adherence, and facilitating resolution of barriers to quality care.
- Results: The care guide model can improve care for some patients with chronic disease at low cost. In a randomized trial testing the intervention, patients with care guides achieved more goals than usual care patients at 1 year (odds ratio, 1.31; 95% confidence interval, 1.16–1.47; P < 0.001).
- Conclusion: Lay health care workers with relevant skills and training, located in clinic waiting rooms where they can meet patients and providers face-to-face, can help chronic disease patients and their providers improve the quality of care.
Improving the quality of care for chronic disease patients is an important goal for the US health care system. Almost half of American with chronic disease fail to receive evidence-based care [1–3]. Reasons for this include limited access to the health care delivery system [4,5] and payment systems that undervalue primary care and provide incentives for more but not necessarily better care [6]. Not only is there a need to improve the quality of care among chronic disease patients, but also to recognize the constraints faced by primary care providers (PCPs) and clinic staff in the current health care environment.
One approach for improving care for patients with chronic disease has been care coordination, or management by health care professionals such as nurses and certified medical assistants [7]. These care managers are usually located in primary care medical offices and have some face-to-face contact with both patients and providers in addition to telephone or electronic contact [7,8]. Care management provided by registered nurses can be effective but is expensive, and it is unclear where payment for these services will come from [7,9].
An alternative approach is employing lay health care workers. In the literature lay health care workers have been referred to as promotoras de salud, lay advisors or navigators, and peer coaches [10–12]. Some of these workers are employees while others are part-time volunteers [13,14]. Tasks assigned to these workers are often limited, such as improving access to cancer care [15], teaching self-help techniques [16–18], or goal-setting [19], and are usually focused on a specific disease or problem. Some of workers do have contact with nurses and doctors, but they tend not to work with the primary care team in the day-to-day provision of care [14].
To improve the quality and efficiency of chronic disease care, Allina Health, a large not-for-profit system of hospitals and clinics in Minnesota and western Wisconsin, hired lay “care guides” to help patients and providers achieve care goals and integrated them into the primary care team. In this article, we describe the care guide model we used and tested and discuss adoption considerations.
Role and Responsibilities of a Care Guide
Care guides are individuals without formal medical training whose general activities include:
- fostering a longitudinal relationship to encourage patients to take control of their chronic illness;
- educating patients about the considerable benefits of best practice treatment;
- communicating with patients, families and providers to keep the entire care team, including the PCP, focused on meeting care guidelines;
- supporting medication and treatment adherence;
- identifying and facilitating resolution of barriers to quality care;
- facilitating referrals to extended care team members and introducing patients to appropriate services or resources within the clinic, health system and/or community they live or work in.
How do care guides differ from other personnel used as care managers? Care guides can explain the value of meeting standard goals, but unlike nurses cannot answer clinical questions. Care guides and medical assistants have similar salaries but care guides have higher educational requirements, less clinical training, and no competing duties in clinic. Like community health workers, care guides are culturally similar to the patients they serve, but are located in the clinic. Care guides were recruited for specific traits and competencies: an outgoing personality, the ability to engage easily with people of different ages and backgrounds, and a second language where needed (eg, Spanish and Somali in the pilot study) [20].
Implementation Trial
![]()
The study recruited 2135 patients. Both groups had an increased percentage of goals met at the end of the 1-year study compared to baseline. Care guide patients met a larger percentage of possible care goals at 1 year than did usual care patients (odds ratio, 1.31; 95% confidence interval, 1.16–1.47; P < 0.001). Care guide patients reduced unmet goals by 30.1%, usual care patients by 12.6%. The difference in outcomes between the 2 groups was minimally affected by differences in the times of final measurement for each goal. The benefit of working with a care guide was not different across demographic categories of age, sex, race, language, insurance, or education. In this study, care guides helped a broad range of patients who were meeting many goals at baseline and who were cared for by providers already receiving regular quality-improvement feedback. Estimated cost was $286 per patient per year.
Development Process
At each clinic, the research team enlisted the help of a site-specific implementation team consisting of a provider champion and clinic leader (ie, the clinic manager, clinic supervisor, or business office supervisor) to customize the study implementation. After selecting the target patient population, chronic disease focus, and eligibility criteria, the research team solicited the help of providers, nurses, medical assistants, and other clinic support staff to develop care guide workflows and processes. Clinic providers and staff were involved early and often in the model planning process. The team gave thoughtful consideration to existing clinic work processes and personnel dynamics to help ensure that the care guide would be accepted and integrated into the clinic culture.
Concurrent with designing workflows for the interactions between care guides and providers, clinical staff, and patients, the research team worked with a variety of support departments at Allina Health System to ensure that the necessary tools were in place for care guides to do their work effectively. They collaborated with human resources to screen for care guide candidates with appropriate skills and personal attributes; information systems to create new tools and security access within the electronic health record; learning and development to organize resources and devise an appropriate training schedule; and marketing/communications to broadcast this new initiative on a system-wide level.
Once details of the model and workflows were established, the research team secured subject matter experts to build content for care guide training. The research team partnered with PCPs whose expertise was treating these chronic diseases as well as pharmacists, nutritionists, diabetes nurse educators, and behavioral health specialists available within the health system. These subject matter experts provided the training content as well as conducted the training. Training took place over 2 weeks and included basic training on the 3 chronic disease conditions, pharmacology, nutrition, and mental health issues, barriers to care, and behavioral change techniques.
Benefits
What were the key interactions leading to clinical improvements? What made the intervention successful? Care guides described using a variety of techniques to yield clinical improvements. With patients, care guides took time to explain the benefits of meeting goals in lay language, used their non-medical backgrounds to create an environment where patients felt at ease asking questions, called patients following office visits to ensure instructions were understood, and helped develop specific action plans. With providers and nurses, care guides gave reminders about unmet goals on the day of an appointment (when this information would be most useful) and supplied information such as “this patient reports difficulty affording medication” or “this patient seems ready to quit tobacco.” Care guides reinforced the effectiveness of longer-term care relationships; for example, most patients who quit tobacco did so between 9 and 12 months after enrollment in the care guide program. In after-study surveys, care guide patients reported significantly more positive perceptions of their care than usual care patients in constructs measuring social support, individualized care, help, reinforcement, and understanding of how to improve their health.
Care guides, using their relationships with providers, served as quality improvement advocates integrated into the daily process of providing primary care. This arrangement differed from the common practice of giving providers periodic feedback based on data gleaned from the electronic health record.
Moving the quality improvement process into the primary care office resolved many problems related to strictly electronic health record–based feedback. Each patient was considered individually. There was opportunity for conversations about care quality to occur face-to-face; members of the primary care team could discuss when to deviate from a care guideline. Strong relationships and a sense of teamwork increased workplace satisfaction [22]. In a post-study survey of 115 providers and nurses, 93% felt that care guides improved patient care and 94% felt that care guides were an effective use of resources.
Adoption Considerations
Adding a care guide into an existing clinic structure and culture requires planning and customization. In order to fully integrate this role into clinics and on care teams and achieve expected results, 6 steps are recommended:
- Program set-up through recruitment of the proper set of stakeholders to plan for implementation, including logistics, budget, etc.
- Defining details, such as the target patient population and eligibility criteria, how interactions will take place with patients, and the duration of the patient relationship.
- Clinic readiness and program development, including detailed clinic staff orientation and workflow development.
- Clinic-specific development of the care guide training, including enlisting the help of subject matter experts to develop content.
- A 2-week training of newly-hired care guides
- Defining the expectations and job responsibilities of the care guide and proper integration of care guides into care teams.
- Monitoring and evaluation – This is not the last step in the process but rather requires the ongoing work of the clinic staff, providers, and care guides to measure progress and outcomes.
Although transforming care teams in primary care clinics is no easy task, it is the foundation of the care guide model. The premise of the care guide role is simple and relatable, thereby making it transferrable to different patient populations and settings as well as attractive to different types of providers. The model is flexible, allowing room for adaptations while maintaining its focus on serving patients and families and reducing burden for providers and other clinic staff. The model is currently being adapted and used in different settings outside of traditional primary care, including urgent care and emergency departments, specialty services, and patient-centered medical homes, among others. In addition, care guides are being used across different patient populations, including high-risk patients in an accountable care organization, pediatric patients, and patients late in life, to name a few. Each adaptation may have population-specific goals and outcomes, but the core of the model remains focused on the Institute for Healthcare Improvement's triple aim: improving the patient experience of care, improving the health of populations, and reducing the per capita cost of health care.
For clinics and care providers interested in integrating care guides within their own clinic, a toolkit, eLearning modules, and evaluation templates, among other resources, are available at no cost through the Care Copilot Institute (www.carecopilotinstitute.org). The Institute was created to translate and disseminate the care guide research.
Conclusion
Lay health care workers with relevant skills and training, located in clinic waiting rooms where they can meet patients and providers face-to-face, can help chronic disease patients and their providers improve the quality of care. Because of its low cost, this model can be implemented in many settings, including small independent primary care offices, where much primary care in the US is still delivered [7,23–25].
Corresponding author: Kim Radel, MHA, Allina Health, Minneapolis, MN, kimberly.radel@allina.com.
Financial disclosures: Dr. Christianson disclosed that he received grant support from the Robina Foundation.
1. Banerjee D, Stafford R. Lack of improvement in outpatient management of congestive heart failure in the United States Arch Intern Med 2010;16:1–2.
2. Egan BM, Zhao Y, RN A. US trends in prevalence, awareness, treatment, and control of hypertension. JAMA 2010;303:2043–50.
3. McGlynn E, Asch S, Adams J, et al. The quality of health care delivered to adults in the United States. N Engl J Med 2003;348:2635–45.
4. Ghorob A, Bodenheimer T. Sharing the care to improve access to primary care. N Engl J Med 2012;366:1955–7.
5. Schroeder SA. Shattuck Lecture. We can do better - improving the health of the American people. N Engl J Med 2007;357:1221–8.
6. Bazinsky KR, Herrera L, Sharfstein JM. Toward innovative models of health care and financing: matchmaking in Maryland. JAMA 2012;307:1261–2.
7. Berry-Millett R, Bodenheimer TS. Care management of patients with complex health care needs. Synth Proj Res Synth Rep 2009;(19).
8. Peikes D, Chen A, Schore J, Brown R. Effects of care coordination on hospitalization, quality of care, and health care expenditures among Medicare beneficiaries: 15 randomized trials. JAMA 2009;301:603–18.
9. Ayanian JZ. The elusive quest for quality and cost savings in the Medicare program. JAMA 2009;301:668–70.
10. Babamoto KS, Sey KA, Camilleri AJ, et al. Improving diabetes care and health measures among hispanics using community health workers: results from a randomized controlled trial. Health Educ Behav 2009;36:113–26.
11. Brownstein JN, Hirsch GR, Rosenthal EL, Rush CH. Community health workers “101” for primary care providers and other stakeholders in health care systems. J Ambul Care Manage 2011;34:210–20.
12. Lewin S, Dick J, Pond P, et al. Lay health workers in primary and community health care. Cochrane Database Syst Rev 2005;(1):CD004015.
13. Doull M, O’Connor A, Welch V, et al. Peer support strategies for improving the health and well-being of individuals with chronic diseases. Cochrane Database Syst Rev 2004;(2):CD004774.
14. Witmer A, Seifer SD, Finocchio L, et al. Community health workers: integral members of the health care work force. Am J Public Health 1995;85(8 Pt 1):1055–8.
15. Steinberg ML, Fremont A, Khan DC, et al. Lay patient navigator program implementation for equal access to cancer care and clinical trials: essential steps and initial challenges. Cancer 2006;107:2669–77.
16. Fu D, Fu H, McGowan P, et al. Implementation and quantitative evaluation of chronic disease self-management programme in Shanghai, China: randomized controlled trial. Bull World Health Organ 2003;81:174–82.
17. Kennedy A, Reeves D, Bower P, et al. The effectiveness and cost effectiveness of a national lay-led self care support programme for patients with long-term conditions: a pragmatic randomised controlled trial. J Epidemiol Comm Health 2007;61:254–61.
18. Rhodes SD, Foley KL, Zometa CS, Bloom FR. Lay health advisor interventions among Hispanics/Latinos: a qualitative systematic review. Am J Prev Med 2007;33:418–27.
19. Heisler M, Spencer M, Forman J, et al. Participants’ assessments of the effects of a community health worker intervention on their diabetes self-management and interactions with healthcare providers. Am J Prev Med 2009;37(6 Suppl 1):S270–9.
20. Adair R, Christianson JB, Wholey DR, et al. Care guides: employing nonclinical laypersons to help primary care teams manage chronic disease. J Ambul Care Manage 2012;35:27–37.
21. Adair R, Wholey DR, Christianson JB, et al. Improving chronic disease care by adding laypersons to the primary care team: a parallel randomized trial. Ann Intern Med 2013;159:176–84.
22. Cassel CK, Jain S. Assessing individual physician performance: does measurement suppress motivation? JAMA 2012;307:2595–6.
23. Nocon RS, Sharma R, Birnberg JM, et al. Association between patient-centered medical home rating and operating cost at federally funded health centers. JAMA 2012;308:60–6.
24. Rittenhouse D, Casalino L. Small and medium-size physician practices use few patient-centered medical home processes. Health Aff 2011;30:1575–84.
25. Fifield J, Forrest DD, Martin-Peele M, et al. A randomized, controlled trial of implementing the patient-centered medical home model in solo and small practices. J Gen Intern Med 2012;28:770–7.
Team Approach for Improving Outcomes in a Culturally Diverse Patient Population
From the Samuel U. Rodgers Health Center, Kansas City, MO.
Abstract
- Objective: To describe the application of the Health Home model in a center that provides care for a culturally diverse patient population.
- Methods: The initiative serves 300 Medicaid beneficiaries, providing intense primary care and behavioral health services for patients with 2 or more chronic diseases. The program addresses multicultural issues and health literacy in addition to assessing patients’ physical and mental health issues and basic needs. It builds upon the patient-centered medical home model, employing a team-based, holistic approach that integrates a behavioral health component to encompass the needs of the whole person, including psychosocial requirements.
- Results: Implementation has led to improved clinical outcomes, including lower A1c levels in our diabetic patients and fewer emergency department visits and hospitalizations.
- Conclusion: The Health Home model has improved our ability to provide high quality, culturally competent health care to our diverse patient population.
Samuel U. Rodgers Health Center (SURHC) has a long and proud history in Kansas City. It was founded in 1967 and incorporated in 1968 as the fourth federally qualified health center in the United States and the first in Missouri. SURHC provides comprehensive primary and urgent care to persons of all ages in the areas of adult and senior medicine, obstetrics/gynecology, pediatric and adolescent health, behavioral health, and dental health services for our community’s most medically vulnerable families, regardless of their ability to pay or health insurance status.
SURHC has a New Americans program in partnership with the Jewish Vocational Immigration Intake Center, in which all newly arrived refugees come to SURHC to receive their physical health exam and be brought up to date with necessary vaccinations. A large proportion of SURHC’s patients are refugees from war-torn and famine-impacted countries, many of which lived in refugee camps with inconsistent access to health care. Some arrive feeling hopeless, fearful, and drained while others have been tortured, maimed, and/or raped. Given these extraordinary circumstances, many patients come to us without a clear understanding of their illness or what constitutes a healthy lifestyle, including diet and exercise, preventive health screenings, and immunizations. Assistance is often required for behavioral health issues associated with acculturation stress, migration, and resettlement in addition to medical care.
Our refugees come from culturally diverse populations and may have limited literacy rates, be impacted by race-related health disparities, and be non-English speaking. Twenty-nine percent of SURHC’s total patient population and 43% of our patient population at our primary downtown campus location are non-English speaking refugees and/or immigrants. Within our chronic disease population, 68% require interpreter services. The health center employs interpreters for English, Somali, Spanish, Arabic, Burmese, and Vietnamese, but for languages less commonly used in the clinic—such as Karen, Nepalese, and Swahili—phone language interpreter services are used.
One problem we identified while working with our unique patient population was the lack of appropriate educational materials. As a result, the “traditional” method of working with patients would not be effective, necessitating a new approach to meeting the needs of our patients if there was to be any impact on their health outcomes or quality of life or provision of cost savings to the health care system. We recognized the need to address multicultural issues involving health literacy levels in addition to assessing the patient’s physical and mental health issues and basic needs before confronting their chronic disease. The stress produced from these concerns was notably interfering with the patient’s ability to focus on their overall health. We describe our approach to addressing these issues in this article.
Approach to Care
SURHC has been successful in fully integrating behavioral health care with primary care as part of our participation in the Missouri Medicaid primary care Health Home (PCHH) initiative. Our PCHH participation began in 2012 and provides SURHC with the opportunity to benefit from a fully integrated model of care. The initiative serves 300 Missouri Medicaid beneficiaries, providing intense primary care and behavioral health services for patients with 2 or more chronic diseases. The patient centered medical home laid the foundation for PCHH, which relies on a team-based care approach. PCHH employs a holistic approach similar to the medical home model and includes behavioral health as part of the front-line interventions to manage physical and mental health issues, including the determinants of health factors that may be influencing the ability of the patient to adhere to the treatment plan and live a healthy life.
Working with multiple cultures involves developing a staff that is culturally competent. This includes education on the values and beliefs of different cultures which enhances staff’s ability to understand, communicate with, and create an effective learning experience for the patient. Evidence shows that understanding someone’s culture aids in developing trust between patient and team member. This relationship greatly contributes to successful results and the reaching of patient self-management goals.
Working with different cultures also necessitates a multidisciplinary team, comprising a care coordinator, behavioral health consultant, and an RN care manager. The multidisciplinary team works in coordination with the primary care provider, LPN, and medical assistant to address the physical, mental, and social needs of the patient.
The care coordinator maintains current insurance status on patients. Specific doctor-prescribed medical supplies go through the coordinator to be pre-certified through our Cyber Access (electronic health record). The coordinator completes our measures report for meaningful use. The care coordinator answers patient calls and schedules and redirects calls as needed. A newsletter is created and mailed out monthly to our patients.
The behavioral health consultant addresses the mental processes of the patient. An assessment may include an evaluation of the patient’s emotional and spiritual needs as well as possible behavioral modification. The behavioral health consultant also addresses smoking cessation, stress reduction, and exercising. Assessment of motivation and readiness is evaluated to assist the patient in setting goals for the self-management of chronic diseases. The behavioral health consultant and RN care manager work closely together by integrating the behavioral health with the primary medical care of the patient.
The RN care manager sees patients when they come in for appointments with their primary care provider (PCP). The RN uses this time to answer patient questions regarding chronic disease, to check if patients know which medications they are taking and why, and for following up on any previous chronic disease teaching or hospital visits they may have had. This team member also coordinates with other specialists and agencies outside of the clinic to assure the patient is followed up with.
Self-Management Support
The ultimate goal in educating a multicultural patient is to wean them from hands-on support provided by the multidisciplinary staff to be able to effectively self-manage their disease. With effective self-management, the patient understands his or her condition, how it affects the body, and can monitor the condition in order to make any necessary changes to stay healthy.
Health literacy plays a significant role in educating the patient about their chronic disease. It is important to measure each patient’s ability to read and write—not only in their native language, but in English as well. This assessment enabled the multidisciplinary team to create new methods of working distinctively with each individual to support their self-management.
One of the self-management techniques that has helped patients and staff track their progress is the use of wall calendars. Our practice provides a wall calendar for interested patients to help track daily fasting, blood glucose, blood pressure, medications taken, etc. The patient can track times they took their medications by using stickers to indicate if they have taken their morning, noon, or evening medications. Our practice supplies the patient with stickers of their choice to use. These wall calendars are helpful for providing daily and monthly accounts of self-management activitites and patients are encouraged to bring them to their appointments. Future appointments can be added to the calendar before the patient leaves the doctor’s office.
Having on-site, professionally certified interpreters greatly improves the education and learning-time for non-English speaking patients. These team members are crucial for their abilities to visually assess the patient’s understanding of teaching materials and interpreting if the patient is showing signs of confusion. The interpreter is also helpful in re-labeling prescription bottles in the patient’s language or with stickers to help them understand how to take the medication correctly. Interpreters have also helped in creating new patient information tools written in different languages for patients that are literate. We have also noted that patients appear more comfortable in the learning environment when a personal interpreter is present as opposed to a telecommunication service.
Scheduled appointment times are set for the patient to meet one-on-one with the nurse care manager or behavioral health consultant for education during which 1 or 2 main points relating to their chronic disease is discussed. This strategy, called “chunking,” breaks the content down into bite-sized segments, helping the patient to learn and retain the information presented. These sessions are good times to work on specifics of the individual’s lifestyle and history and allow time for the patient to ask questions. Most information on a chronic disease can be given in 2 to 4 sessions, with an hour allotted for each one. Follow-up can be done as needed for each patient.
Teaching patients how to read nutrition labels is another useful skill. This is helpful for patients that have diabetes, hypertension, and/or hyperlipidemia. Our staff has collected empty food containers, snack packages, and drink bottles of different ethnic foods. Patients are taught how to read the nutrition labels to help them make healthy choices; for instance, a patient with diabetes is taught to read the serving size and then assess the carbohydrate amount. When comparing foods of the same kind, patients then know to choose the one with less carbohydrates per serving for the healthiest choice. A patient with hypertension would look at serving size and sodium content whereas a patient with hyperlipidemia would learn to pay attention to the serving size, fats, and cholesterol amounts. Using actual food containers as props has been an eye-opening experience for many of patients and those that understand and follow instructions on how to read nutrition labels have higher success rates in their self-management.
To further encourage healthy eating, with the help of our international interpreters we took pictures of prepared foods from different countries. Each picture was then placed on a red, yellow, or green sheet of paper (the stop light method) based on the ingredients in the food depicted. When a patient comes for teaching, we have them go through the pictures and pull out the ones they recognize and consume. We then teach the patient that foods depicted on green paper may be consumed as much as desired, foods on the yellow paper should be limited in the quantity, and foods on the red sheets represent the unhealthiest choices. Time is spent teaching patients how they can make these red-sheet dishes in a healthier manner.
Outcomes
Although SURHC’s patient population faces many challenges in achieving and maintaining control over their health, we are having success in improving clinical outcomes resulting from the implementation of the PCHH model. For example, within a 6-month period, 80% of our patients with an A1c > 8% saw a reduction in their A1c level. In addition, we found emergency room visits and hospitalizations dropped from 332 in December 2012 to 176 in August 2013. This reflects a 53% decrease in visits, for a conservative estimate of over $327,600 in savings to the health care system.
Discussion
Our outcomes support the fact that interventions and one-on-one work with patients have been helpful. The PCHH model provides personal attention to the patient—such as individually-structured teaching plans to assist in setting and attaining goals—which makes patients more accountable for self-management of their health. The use of interpreters in the education process was key to successful goal management and outcomes as they provided the bridge for patients to learn how to set and reach their goals. This model also integrates a behavioral health component to encompass the needs of the whole person, including psychosocial requirements.
Health literacy is an important factor in working with our multicultural population. It is important to provide literate patients with information in their native tongue, which can help teach them more about their chronic disease. We found some helpful educational handouts online in different languages. We also have used our onsite interpreters to help us in creating new educational handouts. In addition, we developed videos that feature our health center’s personal interpreters providing information in 6 languages about “Medications” and “What do I need to bring to my appointment?” The medication video explains the importance of taking the prescribed medicine every day or as the provider orders, and how to refill medications. The other video explains the need to bring all medications, glucose or blood pressure readings, etc, to appointments. These multilingual videos play in the waiting room throughout the day. Seeing employees on the video helps draw the patients into listening and learning the information provided.
We found that we needed to address the basic needs of the patient before confronting their chronic disease. This process sometimes involved finding beds or providing food for the patient. Many had dental issues that needed to be addressed before we could work with them on their diabetic diet issues or other contributing chronic issues. If these needs are met, it can ameliorate stress, which can have negative effects on their health.
On review of current A1c findings, there was a decrease in the percentage of patients who showed improvement. This is reflective of the most challenging patients we continue to work with. Moving forward, as more refugees representing increasingly diverse cultures come to our clinic, greater understanding of cultural nuances remains a challenge. Additional work is necessary to produce and accumulate more diverse educational materials to meet the health literacy needs of each patient.
Samuel U. Rodgers Health Center has earned the trust of our diverse communities and we are confident and proud of our ability to provide high quality, culturally-competent health care to our diverse patient population.
Corresponding author: Robyn McCright, RN, 825 Euclid Ave., Kansas City, MO 64124, rmccright@rodgershealth.org.
Financial disclosures: None.
Reducing Hospital Readmissions for CHF Patients through Pre-Discharge Simulation-Based Learning
From North Mississippi Health Services, Tupelo, MS (Drs. Greer and Fagan), and the University of Colorado, Denver, CO (Dr. Coleman).
Abstract
- Objective: To describe the self-care college, an innovative initiative designed to reduce hospital readmissions for congestive heart failure (CHF) patients.
- Methods: CHF patients at North Mississippi Medical Center are asked to participate in a “self-care college” prior to discharge. Participants rotate through 3 learning stations: weight, diet and medications. At each station, they are asked to perform the tasks they will be required to do at home. By engaging patients in the learning process, they are activated to assume responsibility for their care. This approach has the added advantage of providing a feedback loop, allowing the health care team to “road test” the proposed care plan to determine the likelihood that the patient (and family caregivers) will be able to execute following discharge.
- Results: Since the self-care college was implemented in 2011, the 30-day readmission rate for CHF patients at NMMC has been reduced from 16.8% to 12.85%. There has also been a reduction in the observed to expected CHF readmissions ratio, from 0.90 to 0.71.
- Conclusion: Although the self-care college targets CHF patients, it is likely that this type of initiative could be applied for rural patients with other chronic illnesses, such as asthma, COPD, and diabetes. It is a relatively simple and inexpensive program (approximately $30,000 per year, primarily in personnel expenses, or roughly the cost of 3 hospital readmissions) that does not require sophisticated technology or equipment, and could easily be replicated in health care settings across the country.
Congestive heart failure (CHF) is a chronic and costly condition that affects approximately 5.1 million people in the United States, with an additional 670,000 diagnosed yearly [1]. Heart failure is the most common cause of hospitalization among adults over 65. Nearly 25% of patients hospitalized with heart failure are readmitted within 30 days [2].
Medical management of people living with CHF and other chronic illnesses presents a challenge for health care providers. Due to their often complex medical conditions and limited opportunities to learn self-management skills, patients in rural areas with CHF are at increased risk for complications and hospital readmission [3]. Many approaches have been considered to reduce heart failure readmissions, including efforts to improve self-management skills. Initiatives that engage patients in the process of learning to self manage their illness may activate them to assume responsibility for their care.
North Mississippi Health Services (NMHS) is an integrated regional health care organization with over 5000 employees that serves more than 700,000 residents of 24 primarily rural counties in north Mississippi and northwest Alabama. The flagship of the NMHS system is North Mississippi Medical Center (NMMC), a 650-bed regional referral center in Tupelo. NMHS is one of the largest rural health systems in the United States, and the statistics for its service area reflect these challenges: the prevalence and age-adjusted mortality rates for most chronic illnesses exceed those for the nation as well as for Mississippi, which itself historically ranks at or near the bottom of almost all health status indicators [4–6]. On average, 800 patients with CHF are discharged annually from NMHS’s hospitals, and more than 2900 patients diagnosed with CHF are active NMMC clinic patients.
NHMS is addressing these challenges through a series of innovative quality improvement initiatives. NMHS’s newest initiative is the CHF self-care college. In this paper, we describe the initiative, its implementation, and evaluation to date.
Self-Care College
Background
The idea for the self-care college grew out of discussions with Nurse Link coaches, registered nurses employed by NMHS, who call CHF patients at their homes following discharge. The first call, within 48 hours following discharge, is to reconcile medications, conduct patient education, and confirm follow-up appointments. Three subsequent weekly calls focus on additional education and recognizing “red flags ” utilizing the IHI “teach back” method, in which patients are asked to restate instructions or concepts in their own words. During regular biweekly meetings with physicians to monitor patient progress, Nurse Link coaches observed that many patients (and in some cases, their caregivers) had difficulty following their discharge instructions. In particular, patients did not understand how to properly weigh themselves, how and when to take their medications, or how to ensure their diet met physicians’ guidelines. Although patients were being provided with written and oral instructions as part of the discharge process and through post-discharge follow-up communications, they did not properly implement those instructions once they returned home.
A multidisciplinary team consisting of NMHS physician leaders and representatives from pharmacy, dietary, physical therapy, cardiac rehabilitation, nursing, and case management met to brainstorm ways to overcome this challenge. What emerged from these discussions was the idea for a simulation-based learning experience for patients prior to discharge.
Simulation-based learning is not a new concept. It has been utilized for many years in aviation, health care, and the military as a way to train people in high-risk professions, using realistic scenarios in a controlled environment, without risk to participants. Participants receive immediate feedback from trained instructors as to whether they are performing critical functions properly, providing an opportunity to practice areas in which there is a need to improve technique, speed, or implementation of actions in the correct order. It has been proven to be a highly effective type of learning experience that results in better retention of skills, both cognitive and procedural, and it reduces preventable adverse events [7]. Simulation-based learning in medicine has traditionally been limited to clinician education, where providers practice on computerized patient simulators or other substitutes for live patients. To our knowledge, the concept of simulation learning has not been extended to patient education initiatives.
Simulation-based learning would actively engage patients in learning the necessary self-care skills rather than being passive recipients of information. As the self-care college team often says, “You don’t learn to ride a bike by reading a book; neither should you be asked how to manage CHF by reading a pamphlet.”
Learning Stations
Participants in the self-care college rotate sequentially through 3 learning stations: weight, diet and medications. The main location for the self-care college is a conference room on the cardiac unit of NMMC. At each station, patients are asked to perform the tasks they will be required to do at home. If they cannot complete the task, the deficit is recognized and addressed. This might include referring the patient to home health care, ensuring that a Nurse Link coach contacts him or his caregiver to reiterate medication instructions or ensuring that his case manager refers him to appropriate social services. Although no formal cognitive assessment is conducted, if the team perceives that the patient has a cognitive impairment that could prevent him from being able to perform self-care activities, this information is relayed to the case manager.
At the weight station, a physical therapist or cardiac rehabilitation professional stresses the importance of weighing daily and has the patient demonstrate weighing himself, providing feedback if necessary, to ensure that each patient knows how to properly weigh himself. If the patient does not own a scale, or needs an adaptive scale (such as one with extra large numbers or one that “talks”) and is financially unable to purchase one, he is given one to take home.
At the diet station, a registered dietitian asks the patient what he eats on a typical day, and he is given helpful dietary choices based on his responses. A display at this station provides sample food labels from some common foods, so that patients can see where and how to locate important nutrition information, such as sodium content. The dietitian also discusses fluid restriction and provides the patient and/or caregiver with a written copy of dietary recommendations. In the words of one self-care college patient, “I had to push that salt shaker away, but I also learned that salt comes in cans and boxes. I learned to read food labels for sodium content and to stay away from processed foods.”
At the medication station, a pharmacist reviews the patient’s heart failure medications, has the patient simulate how he will obtain, organize, and remember to take his medications at home, offers feedback and instruction, and answers questions. The pharmacist also provides the patient with a 7-day medication planner for home use and has the patient demonstrate completing the planner.
After the patient has been through the 3 learning stations, a Nurse Link coach enrolls him in the 4-week call-back program. In addition, home health care representatives are available to discuss the benefits of home health to help manage their CHF at home. Finally, each patient receives a CHF self-care college folder, with educational materials including a weight log/calendar; information on smoking cessation, medications, and prescription assistance; a personal health record; control zones for CHF management; red flags and warning signs/symptoms to report; and when to call the doctor.
When the patient has completed the self-care college, the self-care college team “huddles” to ensure that the patient is adequately prepared to transfer to their next health care destination. If not, recommendations are made to their provider to ensure a smooth transition. Family members and/or caregivers are encouraged to participate in the self-care college experience whenever possible and are included in the huddle.
Implementation
Prior to implementing the self-care college, the team identified 4 major challenges and developed strategies to address them. In many cases, strategies were effective in addressing more than one challenge.
- Coordinating the allocation of resources among different departments: as with any new initiative, finding time in everyone’s schedule to accommodate additional tasks is a challenge. In order to ensure that the self-care college was streamlined into everyone’s schedule, the team determined a set time of day that it would take place.
- Gaining buy-in from referring physicians: because referrals from physicians would be critical to the success of the self-care college, the team spent significant time meeting face-to-face with physicians to explain the reason for the program and how it would be implemented. In almost every case, physicians enthusiastically agreed to refer appropriate patients to the self-care college. Although NMHS operates in a fee-for-service environment (and physicians therefore are not financially incentivized to reduce readmissions), it has a strong culture of compassion and caring, focused on innovation, vision, and performance results. Physician buy-in was also facilitated by rolling out the program one floor at a time, so that the team and the physicians could become comfortable with the process. The nurses and case managers on each unit were educated about the program and could prompt the physician to consider placing a referral to the program if warranted.
- Logistical issues in getting the patients to the self-care college room: many CHF patients have significant mobility challenges, and the team discovered that it was not always possible for the patient to be transported to the room where the self-care college was set up, particularly as the program expanded into different wings of the medical center. As a result of feedback from patients and staff regarding the logistical issues around transporting patients to the college, the team developed a mobile version that is brought directly to the patient’s room. A cart holds scales, patient folders, medication planners, and all the tools necessary to present the program. Each member of the team rotates into the room to present their piece of the program. In addition to ensuring that patient mobility issues were not an obstacle to participation, developing the mobile program made the most efficient use of the team’s time in serving these patients, and no patient has been turned away due to having reached capacity at the stationary self-care college.
- Completing the self-care college in a timely fashion: In order to make most efficient use of time (for both the team and the patient), the content for each station was designed to last no more than 15 minutes on average. We have also worked with physicians to encourage referrals prior to the day of discharge, so that patients can be scheduled efficiently.
Program Evaluation
Because the self-care college is one of several initiatives being implemented by NMHS with a focus on reducing readmissions for CHF patients, it is difficult to identify the specific effect of the self-care college on readmissions. However, since implementation in 2011, we have seen a relative rate reduction in CHF readmissions of approximately 23%, and a reduction in the observed to expected CHF readmissions ratio from 0.90 to 0.70.
In addition, referrals have steadily increased since the program began, which suggests that physicians are confident in the program and its ability to improve outcomes.
Beyond the quantifiable measures available to us, comments from patients indicate that the self-care college is improving the quality of life for many of our patients. Two patients noted the following:
“I felt like I wasn’t just thrown out there by myself...I was scared because I didn’t know anything about this disease. The program let me know I wasn’t alone.”
“I eat much differently. I am learning to eat less and eat the right foods...I check my blood sugar every day now, and I weigh myself every day. I know if I weigh more than 244 pounds, I need to call someone.”
While patient and physician feedback has been very positive as far as the effectiveness in teaching patients important self-care skills, we discovered another benefit: not only does the self-care college give patients hands-on practice with skills they will need and the opportunity to ask questions, the team has an opportunity to observe patients actually performing self-care activities, ask the patient questions about how they will follow their discharge instructions, and evaluate whether they are ready to be discharged. Given the distances that many of these patients travel to receive care in the hospital, having insight into their capability prior to discharge is an important advantage.
For example, a patient completing the weight module was having difficulty reading the numbers on the scales due to poor visual acuity, which had not been otherwise noted in his hospital records. The team was able to fit him for a scale with large numbers. In other cases, we have found patients who are unable to identify low-sodium foods. To help them meet dietary guidelines, the dietitian uses a food prop to show them how to read and understand the Nutrition Facts label and then discusses alternative food choices with them. At the medication station, patients bring in all the medications they are currently taking and are asked to identify when, how, and why they take each medication. Frequently, we find that patients do not understand the instructions on the label or that they have duplicate medications because one is a generic and another is a brand name. We can provide the patient with a medication planner that helps ensure their medications are taken properly.
Lessons Learned
As with any new initiative, the self-care college team learned important lessons throughout the implementation process. Chief among these was that flexibility is critical to success. We listened to feedback from patients, physicians, and hospital staff and modified the program to ensure that it was integrated as seamlessly as possible into everyone’s schedule. Feedback was obtained through a variety of methods, including medical staff meetings, discussions with patients and their family members, and feedback from Nurse Link coaches. Feedback led to a number of changes, including development of the mobile self-care college and changing the timing from the day of discharge to the day prior to avoid conflicts with other day-of-discharge activities.
An additional lesson learned, which was actually a process of learning, was how important it is for self-care college team members to be active listeners. As opposed to the didactic approach, where clinicians provide instructions to patients, the self-care college team learned to ask questions of the patients and to actively listen to the responses, filling in the gaps where necessary. Interestingly, we found that this was also a learning process for the patients, many of whom are unaccustomed to engaging in dialogue with their doctors and to being active participants in their health care. They were not all initially comfortable with the concept of simulation, but our staff learned different ways to introduce patients to it, so that ultimately most seemed to enjoy the program.
Take-Away Points
For health care organizations considering implementing a self-care college or similar initiative, we offer a few key points:
- Consider the benefits beyond reducing readmissions: at NMHS, we have found that the self-care college has positively impacted patient satisfaction. For the past 2 years, our HCAHPS scores have consistently been well above the top performance threshold, a top quartile performer in Premier’s quality database (Premier, Inc., a health care performance improvement alliance of approximately 3000 U.S. hospitals). While it is difficult to correlate patient satisfaction scores with any one initiative, we hear from patients, physicians, and nursing staff that the self-care college greatly increases effective communication between provider and patient. We have also found that some of our biggest advocates are now the cardiologists who refer patients.
- Analyze your operational readiness: this is a low-tech but high-touch program. While it requires a minimal financial investment, it does require strong organizational leadership and staff buy-in to make it successful. Nursing staff are likely to buy into the program because they will not have to deliver discharge education to patients in addition to the many other responsibilities they have. Administrators should see that patient satisfaction will improve and readmissions will decrease. Ultimately, it is up to the program “champion” to make it clear to key stakeholders what the advantages are, and to include them in the process of developing the self-care college.
- This is the future of medicine: The self-care college is just one example of a team-based approach to medicine. Most of the disciplines on our team did not know each other prior to the program. We now have established a line of communication that permeates throughout the hospital to the outpatient setting.
Based on our success with the CHF self-care college, the next logical step will be to create self-care colleges for other common disease states, such as asthma/COPD or diabetes. However, while the value of this model for patient education has clearly been demonstrated, the team has also contemplated its application for staff training. Many large hospitals already use patient simulation manikins in nursing education, but the cost of this high-tech equipment is out of reach for many smaller, community hospitals. The possibility to create low-cost, low-tech simulation training experiences for clinicians similar to that provided by self-care college for patients bears examination.
Corresponding author: Lee Greer, MD, MBA, 830 S. Gloster St., Tupelo, MS 38801, lgreer@nmhs.net.
Financial disclosures: None.
1. Yancy CW, Jessup M, Bozkurt B, et al; American College of Cardiology Foundation; American Heart Association Task Force on Practice Guidelines. 2013 ACCF/AHA guideline for the management of heart failure: a report of the American College of Cardiology Foundation/American Heart Association Task Force on Practice Guidelines. J Am Coll Cardiol 2013;62:e147–239.
2. Hospital compare (Internet). Baltimore: Centers for Medicare and Medicaid Services; 2014. Available at www.medicare.gov/hospitalcompare.
3. Health disparities—a rural-urban chartbook. Columbia, SC: South Carolina Rural Health Research Center; 2008.
4. America’s health rankings [Internet]. Minnetonka: United Health Foundation; 2014. Available at www.americashealthrankings.org/MS.
5. County health profiles 2007 [Internet]. Jackson: Mississippi State Department of Health; 2009. Available at msdh.ms.gov/msdhsite/_static/31,0,299,463.html.
6. County Health rankings and roadmaps [Internet]. Madison: University of Wisconsin Population Health Institute; 2014. Available at www.countyhealthrankings.org.
7. Aebersold M, Tschannen D. Simulation in nursing practice: the impact on patient care. OJIN: Online J Iss Nurs 2013; 18(2):Manuscript 6.
From North Mississippi Health Services, Tupelo, MS (Drs. Greer and Fagan), and the University of Colorado, Denver, CO (Dr. Coleman).
Abstract
- Objective: To describe the self-care college, an innovative initiative designed to reduce hospital readmissions for congestive heart failure (CHF) patients.
- Methods: CHF patients at North Mississippi Medical Center are asked to participate in a “self-care college” prior to discharge. Participants rotate through 3 learning stations: weight, diet and medications. At each station, they are asked to perform the tasks they will be required to do at home. By engaging patients in the learning process, they are activated to assume responsibility for their care. This approach has the added advantage of providing a feedback loop, allowing the health care team to “road test” the proposed care plan to determine the likelihood that the patient (and family caregivers) will be able to execute following discharge.
- Results: Since the self-care college was implemented in 2011, the 30-day readmission rate for CHF patients at NMMC has been reduced from 16.8% to 12.85%. There has also been a reduction in the observed to expected CHF readmissions ratio, from 0.90 to 0.71.
- Conclusion: Although the self-care college targets CHF patients, it is likely that this type of initiative could be applied for rural patients with other chronic illnesses, such as asthma, COPD, and diabetes. It is a relatively simple and inexpensive program (approximately $30,000 per year, primarily in personnel expenses, or roughly the cost of 3 hospital readmissions) that does not require sophisticated technology or equipment, and could easily be replicated in health care settings across the country.
Congestive heart failure (CHF) is a chronic and costly condition that affects approximately 5.1 million people in the United States, with an additional 670,000 diagnosed yearly [1]. Heart failure is the most common cause of hospitalization among adults over 65. Nearly 25% of patients hospitalized with heart failure are readmitted within 30 days [2].
Medical management of people living with CHF and other chronic illnesses presents a challenge for health care providers. Due to their often complex medical conditions and limited opportunities to learn self-management skills, patients in rural areas with CHF are at increased risk for complications and hospital readmission [3]. Many approaches have been considered to reduce heart failure readmissions, including efforts to improve self-management skills. Initiatives that engage patients in the process of learning to self manage their illness may activate them to assume responsibility for their care.
North Mississippi Health Services (NMHS) is an integrated regional health care organization with over 5000 employees that serves more than 700,000 residents of 24 primarily rural counties in north Mississippi and northwest Alabama. The flagship of the NMHS system is North Mississippi Medical Center (NMMC), a 650-bed regional referral center in Tupelo. NMHS is one of the largest rural health systems in the United States, and the statistics for its service area reflect these challenges: the prevalence and age-adjusted mortality rates for most chronic illnesses exceed those for the nation as well as for Mississippi, which itself historically ranks at or near the bottom of almost all health status indicators [4–6]. On average, 800 patients with CHF are discharged annually from NMHS’s hospitals, and more than 2900 patients diagnosed with CHF are active NMMC clinic patients.
NHMS is addressing these challenges through a series of innovative quality improvement initiatives. NMHS’s newest initiative is the CHF self-care college. In this paper, we describe the initiative, its implementation, and evaluation to date.
Self-Care College
Background
The idea for the self-care college grew out of discussions with Nurse Link coaches, registered nurses employed by NMHS, who call CHF patients at their homes following discharge. The first call, within 48 hours following discharge, is to reconcile medications, conduct patient education, and confirm follow-up appointments. Three subsequent weekly calls focus on additional education and recognizing “red flags ” utilizing the IHI “teach back” method, in which patients are asked to restate instructions or concepts in their own words. During regular biweekly meetings with physicians to monitor patient progress, Nurse Link coaches observed that many patients (and in some cases, their caregivers) had difficulty following their discharge instructions. In particular, patients did not understand how to properly weigh themselves, how and when to take their medications, or how to ensure their diet met physicians’ guidelines. Although patients were being provided with written and oral instructions as part of the discharge process and through post-discharge follow-up communications, they did not properly implement those instructions once they returned home.
A multidisciplinary team consisting of NMHS physician leaders and representatives from pharmacy, dietary, physical therapy, cardiac rehabilitation, nursing, and case management met to brainstorm ways to overcome this challenge. What emerged from these discussions was the idea for a simulation-based learning experience for patients prior to discharge.
Simulation-based learning is not a new concept. It has been utilized for many years in aviation, health care, and the military as a way to train people in high-risk professions, using realistic scenarios in a controlled environment, without risk to participants. Participants receive immediate feedback from trained instructors as to whether they are performing critical functions properly, providing an opportunity to practice areas in which there is a need to improve technique, speed, or implementation of actions in the correct order. It has been proven to be a highly effective type of learning experience that results in better retention of skills, both cognitive and procedural, and it reduces preventable adverse events [7]. Simulation-based learning in medicine has traditionally been limited to clinician education, where providers practice on computerized patient simulators or other substitutes for live patients. To our knowledge, the concept of simulation learning has not been extended to patient education initiatives.
Simulation-based learning would actively engage patients in learning the necessary self-care skills rather than being passive recipients of information. As the self-care college team often says, “You don’t learn to ride a bike by reading a book; neither should you be asked how to manage CHF by reading a pamphlet.”
Learning Stations
Participants in the self-care college rotate sequentially through 3 learning stations: weight, diet and medications. The main location for the self-care college is a conference room on the cardiac unit of NMMC. At each station, patients are asked to perform the tasks they will be required to do at home. If they cannot complete the task, the deficit is recognized and addressed. This might include referring the patient to home health care, ensuring that a Nurse Link coach contacts him or his caregiver to reiterate medication instructions or ensuring that his case manager refers him to appropriate social services. Although no formal cognitive assessment is conducted, if the team perceives that the patient has a cognitive impairment that could prevent him from being able to perform self-care activities, this information is relayed to the case manager.
At the weight station, a physical therapist or cardiac rehabilitation professional stresses the importance of weighing daily and has the patient demonstrate weighing himself, providing feedback if necessary, to ensure that each patient knows how to properly weigh himself. If the patient does not own a scale, or needs an adaptive scale (such as one with extra large numbers or one that “talks”) and is financially unable to purchase one, he is given one to take home.
At the diet station, a registered dietitian asks the patient what he eats on a typical day, and he is given helpful dietary choices based on his responses. A display at this station provides sample food labels from some common foods, so that patients can see where and how to locate important nutrition information, such as sodium content. The dietitian also discusses fluid restriction and provides the patient and/or caregiver with a written copy of dietary recommendations. In the words of one self-care college patient, “I had to push that salt shaker away, but I also learned that salt comes in cans and boxes. I learned to read food labels for sodium content and to stay away from processed foods.”
At the medication station, a pharmacist reviews the patient’s heart failure medications, has the patient simulate how he will obtain, organize, and remember to take his medications at home, offers feedback and instruction, and answers questions. The pharmacist also provides the patient with a 7-day medication planner for home use and has the patient demonstrate completing the planner.
After the patient has been through the 3 learning stations, a Nurse Link coach enrolls him in the 4-week call-back program. In addition, home health care representatives are available to discuss the benefits of home health to help manage their CHF at home. Finally, each patient receives a CHF self-care college folder, with educational materials including a weight log/calendar; information on smoking cessation, medications, and prescription assistance; a personal health record; control zones for CHF management; red flags and warning signs/symptoms to report; and when to call the doctor.
When the patient has completed the self-care college, the self-care college team “huddles” to ensure that the patient is adequately prepared to transfer to their next health care destination. If not, recommendations are made to their provider to ensure a smooth transition. Family members and/or caregivers are encouraged to participate in the self-care college experience whenever possible and are included in the huddle.
Implementation
Prior to implementing the self-care college, the team identified 4 major challenges and developed strategies to address them. In many cases, strategies were effective in addressing more than one challenge.
- Coordinating the allocation of resources among different departments: as with any new initiative, finding time in everyone’s schedule to accommodate additional tasks is a challenge. In order to ensure that the self-care college was streamlined into everyone’s schedule, the team determined a set time of day that it would take place.
- Gaining buy-in from referring physicians: because referrals from physicians would be critical to the success of the self-care college, the team spent significant time meeting face-to-face with physicians to explain the reason for the program and how it would be implemented. In almost every case, physicians enthusiastically agreed to refer appropriate patients to the self-care college. Although NMHS operates in a fee-for-service environment (and physicians therefore are not financially incentivized to reduce readmissions), it has a strong culture of compassion and caring, focused on innovation, vision, and performance results. Physician buy-in was also facilitated by rolling out the program one floor at a time, so that the team and the physicians could become comfortable with the process. The nurses and case managers on each unit were educated about the program and could prompt the physician to consider placing a referral to the program if warranted.
- Logistical issues in getting the patients to the self-care college room: many CHF patients have significant mobility challenges, and the team discovered that it was not always possible for the patient to be transported to the room where the self-care college was set up, particularly as the program expanded into different wings of the medical center. As a result of feedback from patients and staff regarding the logistical issues around transporting patients to the college, the team developed a mobile version that is brought directly to the patient’s room. A cart holds scales, patient folders, medication planners, and all the tools necessary to present the program. Each member of the team rotates into the room to present their piece of the program. In addition to ensuring that patient mobility issues were not an obstacle to participation, developing the mobile program made the most efficient use of the team’s time in serving these patients, and no patient has been turned away due to having reached capacity at the stationary self-care college.
- Completing the self-care college in a timely fashion: In order to make most efficient use of time (for both the team and the patient), the content for each station was designed to last no more than 15 minutes on average. We have also worked with physicians to encourage referrals prior to the day of discharge, so that patients can be scheduled efficiently.
Program Evaluation
Because the self-care college is one of several initiatives being implemented by NMHS with a focus on reducing readmissions for CHF patients, it is difficult to identify the specific effect of the self-care college on readmissions. However, since implementation in 2011, we have seen a relative rate reduction in CHF readmissions of approximately 23%, and a reduction in the observed to expected CHF readmissions ratio from 0.90 to 0.70.
In addition, referrals have steadily increased since the program began, which suggests that physicians are confident in the program and its ability to improve outcomes.
Beyond the quantifiable measures available to us, comments from patients indicate that the self-care college is improving the quality of life for many of our patients. Two patients noted the following:
“I felt like I wasn’t just thrown out there by myself...I was scared because I didn’t know anything about this disease. The program let me know I wasn’t alone.”
“I eat much differently. I am learning to eat less and eat the right foods...I check my blood sugar every day now, and I weigh myself every day. I know if I weigh more than 244 pounds, I need to call someone.”
While patient and physician feedback has been very positive as far as the effectiveness in teaching patients important self-care skills, we discovered another benefit: not only does the self-care college give patients hands-on practice with skills they will need and the opportunity to ask questions, the team has an opportunity to observe patients actually performing self-care activities, ask the patient questions about how they will follow their discharge instructions, and evaluate whether they are ready to be discharged. Given the distances that many of these patients travel to receive care in the hospital, having insight into their capability prior to discharge is an important advantage.
For example, a patient completing the weight module was having difficulty reading the numbers on the scales due to poor visual acuity, which had not been otherwise noted in his hospital records. The team was able to fit him for a scale with large numbers. In other cases, we have found patients who are unable to identify low-sodium foods. To help them meet dietary guidelines, the dietitian uses a food prop to show them how to read and understand the Nutrition Facts label and then discusses alternative food choices with them. At the medication station, patients bring in all the medications they are currently taking and are asked to identify when, how, and why they take each medication. Frequently, we find that patients do not understand the instructions on the label or that they have duplicate medications because one is a generic and another is a brand name. We can provide the patient with a medication planner that helps ensure their medications are taken properly.
Lessons Learned
As with any new initiative, the self-care college team learned important lessons throughout the implementation process. Chief among these was that flexibility is critical to success. We listened to feedback from patients, physicians, and hospital staff and modified the program to ensure that it was integrated as seamlessly as possible into everyone’s schedule. Feedback was obtained through a variety of methods, including medical staff meetings, discussions with patients and their family members, and feedback from Nurse Link coaches. Feedback led to a number of changes, including development of the mobile self-care college and changing the timing from the day of discharge to the day prior to avoid conflicts with other day-of-discharge activities.
An additional lesson learned, which was actually a process of learning, was how important it is for self-care college team members to be active listeners. As opposed to the didactic approach, where clinicians provide instructions to patients, the self-care college team learned to ask questions of the patients and to actively listen to the responses, filling in the gaps where necessary. Interestingly, we found that this was also a learning process for the patients, many of whom are unaccustomed to engaging in dialogue with their doctors and to being active participants in their health care. They were not all initially comfortable with the concept of simulation, but our staff learned different ways to introduce patients to it, so that ultimately most seemed to enjoy the program.
Take-Away Points
For health care organizations considering implementing a self-care college or similar initiative, we offer a few key points:
- Consider the benefits beyond reducing readmissions: at NMHS, we have found that the self-care college has positively impacted patient satisfaction. For the past 2 years, our HCAHPS scores have consistently been well above the top performance threshold, a top quartile performer in Premier’s quality database (Premier, Inc., a health care performance improvement alliance of approximately 3000 U.S. hospitals). While it is difficult to correlate patient satisfaction scores with any one initiative, we hear from patients, physicians, and nursing staff that the self-care college greatly increases effective communication between provider and patient. We have also found that some of our biggest advocates are now the cardiologists who refer patients.
- Analyze your operational readiness: this is a low-tech but high-touch program. While it requires a minimal financial investment, it does require strong organizational leadership and staff buy-in to make it successful. Nursing staff are likely to buy into the program because they will not have to deliver discharge education to patients in addition to the many other responsibilities they have. Administrators should see that patient satisfaction will improve and readmissions will decrease. Ultimately, it is up to the program “champion” to make it clear to key stakeholders what the advantages are, and to include them in the process of developing the self-care college.
- This is the future of medicine: The self-care college is just one example of a team-based approach to medicine. Most of the disciplines on our team did not know each other prior to the program. We now have established a line of communication that permeates throughout the hospital to the outpatient setting.
Based on our success with the CHF self-care college, the next logical step will be to create self-care colleges for other common disease states, such as asthma/COPD or diabetes. However, while the value of this model for patient education has clearly been demonstrated, the team has also contemplated its application for staff training. Many large hospitals already use patient simulation manikins in nursing education, but the cost of this high-tech equipment is out of reach for many smaller, community hospitals. The possibility to create low-cost, low-tech simulation training experiences for clinicians similar to that provided by self-care college for patients bears examination.
Corresponding author: Lee Greer, MD, MBA, 830 S. Gloster St., Tupelo, MS 38801, lgreer@nmhs.net.
Financial disclosures: None.
1. Yancy CW, Jessup M, Bozkurt B, et al; American College of Cardiology Foundation; American Heart Association Task Force on Practice Guidelines. 2013 ACCF/AHA guideline for the management of heart failure: a report of the American College of Cardiology Foundation/American Heart Association Task Force on Practice Guidelines. J Am Coll Cardiol 2013;62:e147–239.
2. Hospital compare (Internet). Baltimore: Centers for Medicare and Medicaid Services; 2014. Available at www.medicare.gov/hospitalcompare.
3. Health disparities—a rural-urban chartbook. Columbia, SC: South Carolina Rural Health Research Center; 2008.
4. America’s health rankings [Internet]. Minnetonka: United Health Foundation; 2014. Available at www.americashealthrankings.org/MS.
5. County health profiles 2007 [Internet]. Jackson: Mississippi State Department of Health; 2009. Available at msdh.ms.gov/msdhsite/_static/31,0,299,463.html.
6. County Health rankings and roadmaps [Internet]. Madison: University of Wisconsin Population Health Institute; 2014. Available at www.countyhealthrankings.org.
7. Aebersold M, Tschannen D. Simulation in nursing practice: the impact on patient care. OJIN: Online J Iss Nurs 2013; 18(2):Manuscript 6.
Operational Lessons from a Large Accountable Care Organization
From Partners HealthCare, Boston, MA.
Abstract
- Objective: To describe operational lessons from a large accountable care organization (ACO).
- Methods: Description of an approach that includes the creation of a sustainable financing mechanism, new incentive structures, a high risk care management program, integrated mental health services, tools for specialist engagement, a post acute strategy, fostering patient engagement, and new clinical and analytic technologies.
- Results: Committed ACOs face challenges in enacting care delivery changes. Key challenges include educating boards and management about requirements for success as an ACO; advocacy for state and federal regulations that support the success of ACOs; and engaging patients as active participants in the changes. Importantly, financial returns (as shared savings) on the investment required for these changes will not be available within short-term contract cycles, so committed organizations will need to plan for the long haul.
- Conclusion: A comprehensive approach undertaken within a system that is capable of integrating care across the full continuum of care delivery has the best chance for successfully managing costs and improving care.
After Massachusetts enacted legislation expanding health insurance to nearly all residents in 2006, additional legislation was enacted that focused on health cost containment. The goal of the many new regulations has been to hold the rate of health care cost growth to the rate of general inflation. Consistent with payment policy changes under the Accountable Care Act, Massachusetts regulatory efforts have emphasized putting health care providers at financial risk for some proportion of increases in costs of care. Providers who contract as accountable care organizations (ACOs) typically conduct their usual fee-for-service billing practices, but in addition the providers also agree to an annual total medical expenses (TME) spending target for an assigned population of patients. An annual reconciliation results in either penalties for exceeding targets or shared savings if spending remains below the target. The reconciliation incorporates a small number of commonly used primary care quality measures.
Partners HealthCare, an integrated health care delivery system in Massachusetts that includes 2 large academic medical centers—Massachusetts General Hospital (MGH) and Brigham and Women’s Hospital (BWH)—began deploying new care models designed to reduce the growth in health care costs prior to these policy changes, but the new contracting environment has dramatically accelerated these efforts. Partners HealthCare signed accountable care risk contracts across all major payer categories—commercial, Medicare, and Medicaid—in 2011. Currently, Partners HealthCare has accountability for cost increases for nearly 500,000 lives, making it one of the largest providers of accountable care in the United States [1].
In this paper, we describe some of the initial lessons learned and share some of our concerns for the future success of risk-based contracting. We have organized the paper as we have organized our work—addressing different care services by site of care: primary care, specialty care, non-acute care, patient engagement, and necessary infrastructure. This framework has allowed us to engage the care providers throughout our organization with programs tailored to their specific circumstances. While practical, this framework is nonetheless somewhat artificial because much of our work could be characterized as building bridges between sites of care.
Organizing System-Wide ACO Programs
Focused efforts to lower cost trends and improve outcomes for a defined population began with MGH’s participation in a Medicare demonstration project in 2006. This successful program assigned specially trained nurse care managers to over 2000 of MGH’s highest cost Medicare beneficiaries [2]. The program was expanded in 2009 and then again in 2012, and now includes the entire Partners system. Building on this success, Partners’ providers evolved a broader set of tactics to include data, measurement and evidence-based methods of improving access, continuity, and care coordination to provide population-based health care [3,4]. To coordinate the system-wide work required by new risk contracting arrangements, Partners created the Division of Population Health Management (PHM). PHM works closely with organizational leadership at member institutions to collaboratively design and execute its system-wide accountable care strategy.
PHM has developed capacity, infrastructure, and expertise to implement and manage a clinical strategy for the entire integrated delivery system. This included some governance changes, new management processes, new investments in information technology and establishing system-wide incentives to promote care delivery innovation and improvement. Most importantly, through an extensive planning process Partners identified a comprehensive set of tactics and a multi-year plan for system-wide adoption of those tactics.
The majority of Partners information infrastructure to date was built internally, which allowed for rapid customization and flexibility, but also created significant interoperability problems. Moving forward, the majority of Partners systems will use a single IT platform. Partners has developed and implemented patient registries and care management decision support tools to help focus provider attention on patients most in need of interventions and to support reporting of quality metrics. In addition, Partners continues to expand a comprehensive data warehouse that incorporates a variety of clinical, administrative, and financial data sources to support advanced analytics for self-monitoring and continuous improvement. This extensive network-wide approach over the past several years has generated a number of lessons regarding successful accountable care organization implementation.
Implementing New Financing and Incentive Structures
Once an ACO is formed, the organization needs to restructure management to create organizational accountability for performance (as noted above), determine how to finance programmatic initiatives required to deliver the performance called for in the contracts, and create incentives for all the different providers within the ACO to drive performance towards the system’s goals. These latter two require the ACO to make specific design choices that include some trade-offs.
Partners chose to fund system-level population health management initiatives through a tax on net patient service revenue from its member providers—both hospitals and physicians. Alternative approaches include either setting aside a yearly allocation that is not proportional to a revenue stream or simply allocating the external risk to different operating units and allowing them to determine their own individual approaches (and investments) to managing the financial risk. By linking financing of PHM programs to clinical revenue (independent of risk contracts), and setting a uniform percentage tax, Partners has signaled that the wealthier parts of the system will contribute more to PHM (on an absolute basis) and more importantly that accountable care is a prioritized long-term investment. Allowing each entity within the organization to “sink or swim” based on its own performance was considered inconsistent with the interdependent nature of care delivery in a well functioning system. In addition, investments in the required infrastructure cannot be dependent on annual contract performance due to the volatility in contracted performance and the time it takes for an organization to get a return on their PHM investment.
Any organization involved in multiple performance based risk contracts faces the challenge of organizing the tactics and metrics for their providers. It is simply inconsistent with provider values and workflow to manage to different targets for different subpopulations of patients. In our attempts to promote the best possible care for all our patients and at the same time meet the demands of multiple external contract requirements, we have created an internal performance framework (IPF) that uses a single set of performance targets and a single incentive pool for all out contracts. The IPF rewards member institutions for (1) adopting programmatic initiatives (funded through the tax as described above), (2) meeting external quality measure targets, and (3) limiting the growth of cost-standardized medical expense trend (Figure).
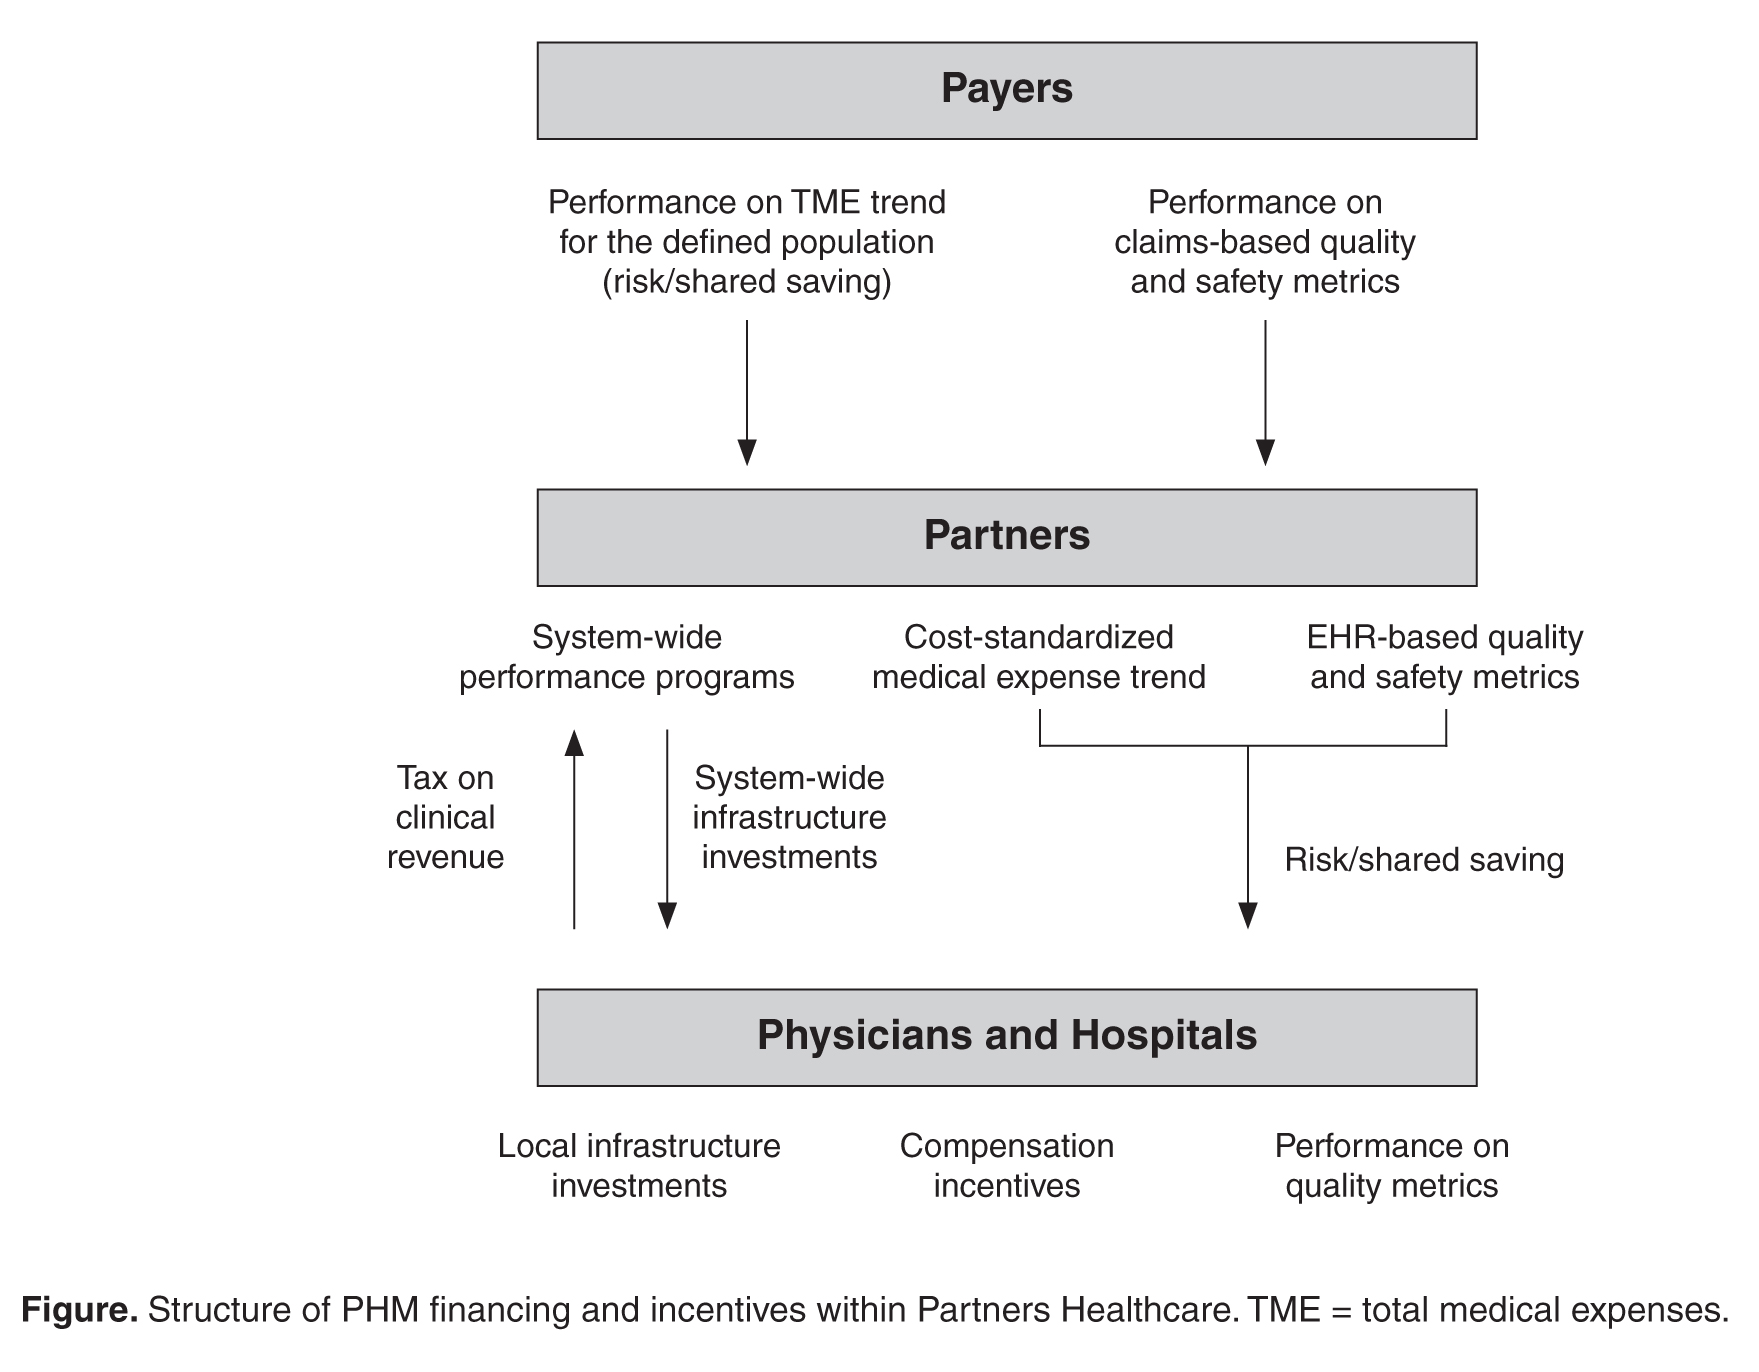
Fixing Primary Care
Populations in risk contracts are typically defined by their primary care providers. In addition, the chronic underfunding of primary care in the US has resulted in unsustainable practice environments as well as well known access problems. Finally, the concentration of costs in a relatively small proportion of patients provides the greatest opportunity for ACOs to reduce costs through better care coordination for these patients. This core set of facts has guided our efforts to improve primary care. To address these issues, we have increased funding to primary care through our efforts to certify all 236 practices as patient-centered medical homes (PCMHs). In addition, we have begun transitioning our compensation models to include components based on risk-adjusted panel size and performance on quality metrics. As mentioned above, we have invested heavily in our complex care management program. Finally, we are working on a much tighter integration of mental health services with primary care. In this section we focus on lessons from our care management program and our efforts in mental health integration.
Complex Care Management
Provider-led high-risk care management has become the primary clinical lever for cost containment for most accountable care organizations [6]. The design and operational characteristics or our program have been described by Hong et al and are available on our website. Our decade of experience with this program has taught us a few lessons regarding the use of algorithms to identify patients, the management of program costs, and the difficulty of creating meaningful accountability.
Our analysis of commercially available risk prediction algorithms found minimal differences among the various products’ ability to predict high cost patients in the following year. A majority of the algorithms are exclusively claims based, though some include the ability to augment risk predictions with clinical data. Clinicians have played a critical role in improving our ability to identify high-risk patients. We have found that when physicians review a pre-selected set of their own patients, they have some ability to discriminate among patients who are likely to benefit from care management and those who are not. Clinicians are prone to overemphasizing recent events, but review of a list of patients who are predicted of becoming high cost mitigates this problem. Commercially available algorithms can help create an initial list, but physicians can add perspective on such important factors as social support and executive functioning. This additional information improves the specificity of the initial algorithm outputs, allowing clinicians to play an important role in refining the lists of patients eligible for high-risk care management.
The high cost of labor and space make high-risk care management programs among the most costly programs for an ACO. Care management requires a skilled nursing workforce (among others), which should be embedded into the primary care office for optimal effect [6,7].Given the high costs, there is understandable pressure to increase the ratio of patients per care manager. We have found that the optimal ratio is approximately 200 patients per care manager, with a third of the patients having active complex care management issues, a third being passively surveyed, and a third requiring modest care coordination. We continue with our attempts to refine how we manage this critical aspect of care management programs.
How can managers demonstrate that the investment in care coordination is impacting the ACO’s TME trend? Demonstrating a return on investment is difficult because a population of high-cost patients will inevitably show reduced costs in the following year (a phenomenon called regression to the mean). Isolating a well-matched control group to demonstrate program effectiveness would have the unintended consequence of reducing the potential effectiveness of the program. This situation is complicated by the different risk profiles of high-risk patients in different payer categories. For example, potentially avoidable Medicare costs are dominated by hospitalizations and end-of-life issues, Medicaid costs by mental illness and substance abuse, and commercial costs by specialty issues. In lieu of better management tools to assess the performance of our program, we have depended to date on process measures (eg., enrollment targets), patient surveys, and we are experimenting with some limited outcomes metrics (eg, admissions/1000).
Mental Health Integration
Another important lever for medical trend reduction within an ACO is the integration of mental health services into primary care. While our efforts in this complex area are only about a year old, some of our early lessons may prove valuable to others. First, we have worked hard to make the case for investment in mental health services, requiring assembling the evidence both for the magnitude of the problem as well as the effectiveness of available solutions.
A quarter of American adults suffer from diagnosable mental health disorders every year and it is estimated that PCPs manage between 40% and 80% of these patients [8,9].Rates of detection and adequate treatment in primary care settings are currently suboptimal, leading to poor disease management and driving excess utilization. Using claims data within the Partners’ primary care population, we have found medical expenditures are 45% higher for patients with a mental health diagnosis. Over 70% of mental health patients have additional illnesses, and the presence of a mental health disorder complicates overall clinical management [10].This results in a substantial increase in medical cost, independent of psychiatric medical spending [11].In addition, psychiatry shortage and access have become a major issue in mental health services [12].Over 70% of PCPs nationwide reported difficulty in finding high-quality outpatient mental health care for their patients [13].
The dominant clinical model for mental health integration is the collaborative care model (CCM), and evidence for its effectiveness is growing. Randomized controlled trials and meta-analyses have shown that CCMs are successful at improving detection and treatment of mental health disorders [14–16].Cost-savings analyses for many of these programs demonstrate considerable savings and favorable return on investment (ROI). Several CCMs that use nonmedical specialists and consulting psychiatrists to augment the management of mental health disorders for low- to moderate-risk primary care patients have been implemented. However, a majority of the CCMs are disease-specific—eg, integrating depression treatment resources into primary care. The challenge for ACOs is to determine how to build a comprehensive CCM that helps primary care manage the major primary care–based mental health conditions—depression, anxiety and substance abuse—in a coordinated, cost-efficient model. The ACO must consider how to implement both its high-risk program and its CCM programs in a way that is not disruptive but supportive to primary care practices.
Partners is implementing a multipronged strategy to address mental health issues within primary care. First, a universal screening program for mental health disorders using brief, well-validated screening tools (eg, Patient Health Questionnaire 2 and 9) will improve the identification of patients with mental health disorders. Second, consulting psychiatrist and mid-level health care providers, functioning as mental health specialists, will be virtually or physically integrated into our primary care teams. They will assist with issues such as initial clinical assessment; coordinate initiation of a mental health treatment plan; monitor the patient’s response to treatment; provide recommendations for treatment change based on evidence-based protocols and guidance from a consulting psychiatrist; provide therapy and mental health services to patients when indicated; and work closely with the patient to engage, activate, and educate him/her in order to promote disease management and treatment adherence. A unique feature of this integration program is the creation of a network-wide mental health access line for rapid mental health assessment and advice. Third, Partners is deploying sustained, network-wide educational programs that will train primary care personnel in brief interventions for improved disease management such as motivational interviewing, behavioral activation, problem-solving therapy, and other first-line interventions suitable for a primary care setting. Fourth, all primary care practices are developing and deploying standard workflows for the identification and treatment of mental health illnesses, starting with depression. Fifth, telehealth technologies will be used to improve access to specialty care and provide care in the most cost-effective setting. An initial focus is on online cognitive behavioral therapy, with virtual visit technologies to follow. Finally, registries will track mental health outcomes and provide prompts to ensure that follow-up screening tests are administered at periodic intervals and that treatment plans can be modified if progress is insufficient.
Implementing Prayer-Agnostic Programs For Specialty Services
Historically, cost containment by commercial payers focused on limiting access to specialist services. However, since costs are concentrated in a small portion of the population with complex chronic illnesses, considering the problems caused by gatekeeping in the 1990s, limiting access to specialists for the entire population may not be an appropriate lever for lowering TME trend. In addition, enhanced access to specialty services has the potential to reduce costs and improve quality through more efficient testing and treatment regimens. We have approached specialist services with the philosophy that early and coordinated access, through the application of tools such as bi-directional referral management systems and virtual visit capabilities, will have a greater ability to lower costs. The challenge for deploying these tools is that ACOs are built off of an aligned population of patients attributed to primary care physicians. Typically, specialists in ACOs are providing care to both a fee-for-service population as well as the ACO population. The costs of providing a nonbillable service such as virtual visits is not sustainable if a large portion of the patients are not in a risk contract. We have found that integrating virtual visits and e-referrals for a limited set of a specialist’s patients poses workflow and ethical challenges. As a system with 2 prominent academic medical centers, we have therefore focused our efforts on deploying these tools to specialists who have a high proportion of patients from our primary care physicians, and continue to work through these significant challenges.
Our specialist engagement tools are focused primarily on improving access and coordination or ensuring appropriateness and optimal outcomes. First, virtual visits (asynchronous and synchronous) between patients and providers or between providers help improve access and coordination. Second, referral management systems that allow for pre-consultative communications and review with key clinical data and messages allow for more thoughtful specialist consultations. This active management of referrals allows specialists to provide accelerated “curbside” consults without a formal consult for minor issues, appropriate pre-appointment testing for improved initial in-person consultation, or accelerated scheduling for initial consultation for urgent issues. Third, we are implementing technology and workflows to capture patient-reported outcomes in our specialty practices. We are collecting and reporting this data internally and externally to ensure we are monitoring the metrics that are most important to our patients. Monitoring patient-reported outcomes is especially important when a provider is concurrently implementing cost-containment measures. Fourth, we have developed technology to assess the appropriateness of surgical procedures. This technology combines analytics of both structured and unstructured data in an electronic platform and provide feedback to providers and patients regarding relative risks and benefits of certain procedures [17]. Lastly, we are implementing clinical bundles around select surgical procedures.
As an ACO that includes academic medical centers, we have a particular challenge of balancing the mission of fostering innovative and experimental technologies that may help advance human health and medical science, while ensuring we are stewards of limited financial resources. Academic medical center–led ACOs will need to thoughtfully balance these objectives [4].
Improving Non-Acute Services
We have included both improved access to emergency department alternatives as well as a focus on the appropriate and efficient use of post acute services in our approach to non-acute services. We have approached improving access to urgent care services by both implementing standards for access to primary care (through PCMH transformation) as well as partnering with urgent care providers.
The use of post-acute care services is the main driver of hospital referral region cost variation for both Medicare and Medicaid [18]. If an ACO is taking on risk in either of these payer categories, it is imperative that the organization has a strategy for managing post-acute care. We have been developing the following capabilities:
- Determine most appropriate level of post-acute care upon discharge from an acute facility (eg, home health vs. skilled nursing facility)
- Predict, to some level of reasonable confidence, the length of post-acute services required per episode of care
- Create a high performance post-acute referral network that can meet quality, efficiency and cost standards set forth by the ACO
The challenge in meeting these goals include the lack of high quality data required to execute on the first 2 objectives. In addition, development of a post-acute referral network is dependent on regional market characteristics. For example, if the region’s supply of post-acute facilities is limited, enforcing the ACO standards for high-quality post-acute care may be challenging. Executing a post-acute strategy that helps an ACO meet its financial and quality objectives may be one of the more challenging endeavors the ACO will undertake.
Engaging Patients in Accountable Care
Accountable care contracts provide a new imperative for providers to offer tools that help patients engage in their care outside of the traditional clinical encounter. Promoting shared decision making, where patients share preferences and clinicians incorporate these beliefs into clinical decision-making, is one of our primary patient engagement strategies. Systematic reviews have demonstrated the effectiveness of shared decision making in improving patient awareness and reducing variation in health care utilization [19–21]. In addition to shared decision making, we have invested in new video education tools and have updated our electronic patient portal to allow patients to access their clinical record, review educational materials, and communicate with their care team at their convenience. Patient engagement strategies are also embedded into other initiatives, such as our high-risk care management program. Keeping patient engagement integrated into all of an accountable care organization’s programs, instead of treating it as a distinct program, is critical for success.
Implementing Clinical Information Technology Tools
A majority of current clinical information technology tools have been created for synchronous, in-person delivery of health care, reflecting the dominant mode of care delivery in the US. However, under accountable care payment models, ACOs have the opportunity (and imperative) to deliver care either asynchronously and/or remotely. As we assessed our needs, we recognized several gaps between existing and desired technologies. Though many population health information technology frameworks exist, we have found three broad categories required for successful population health management: advanced data warehousing and analytics, next generation care delivery and coordination tools, and innovative clinical performance management tools.
Advanced data warehousing and analytics: ACOs must be able to integrate and analyze multiple data sources, including payer derived claims data (providing data on care rendered both inside and outside the ACO) as well as administrative data (scheduling, billing), and clinical (both structured and unstructured). This requires an ACO to invest in data warehousing technologies and analytical tools in order to take full advantage of the available information and provide guidance to providers and managers. We continue to build this set of solutions.
Next generation care delivery and coordination tools: The ACO must have new ways to connect various members of the patient care team including patient to provider, and provider to provider. These technologies include but are not limited to asynchronous and synchronous virtual visit capabilities, referral management software and high risk care management software, and remote monitoring for carefully selected patients. We are currently employing all of these types of health information technology.
Innovative clinical performance management tools: Third, the accountable care organization should have clinical performance management technologies that allow its providers to reduce care gaps and improve stewardship of resources. This includes, for example, advanced clinical decision support for radiology ordering and procedures and patient registries with clinical workflow integration.
In general, we have found a majority of accountable care information technology vendors are repurposing their existing assets for new applications towards population health management. For example, warehousing companies with strengths in the financial industry may convert their product for the health care market, or a company built for patient outreach and appointment reminders may convert their product into population health clinical registries. Given the relatively new nature of risk-based contracting, and uncertainty of the future of this payment model, it makes good sense from a vendor perspective to first try to repurpose existing assets, instead of creating built-for-purpose technologies that are more costly, and may not get to market fast enough to meet customer needs. The challenge for providers is that many of these repurposed technologies do not quite solve the particular challenges the provider is attempting to address. Accountable care organizations therefore are faced with challenging decisions regarding the purchase of a less than optimal product, waiting for the product segment to mature, or building the solution themselves.
Conclusion
We have described an approach to ACO success that includes the creation of a sustainable financing mechanism, new incentive structures, a high-risk care management program, integrated mental health services, tools for specialist engagement, a post-acute strategy, fostering patient engagement, and new clinical and analytic technologies. The breadth and depth of these changes to care delivery present numerous daunting challenges. Our experience suggests that partial approaches, implementing just a subset of the approaches listed above, will not constrain cost growth because costs are just shifted to a different part of the care delivery system. We conclude from this experience that a comprehensive approach undertaken within a system that is capable of integrating care across the full continuum of care delivery has the best chance for successfully managing costs and improving care. Nonetheless, the challenges associated with change on this scale are legion. Key challenges facing the committed ACOs include: educating their boards and management about requirements for success as an ACO; advocacy for state and federal regulations that support the success of ACOs; and engaging patients as active participants in the changes. Importantly, financial returns (as shared savings) on the investment required for these changes will not be available within short-term contract cycles, so committed organizations will need to plan for the long haul.
Acknowledgment: The authors would like to thank the leadership of Partners Healthcare for their unambiguous support of the efforts described in this paper, as well as the clinicians, administrators, and support service workers that are committed to the achievement of the goals we have together set for the organization.
Corresponding author: Sreekanth K. Chaguturu, MD, 800 Boylston St., Ste. 1150, Boston, MA 02199, schaguturu@partners.org.
Financial disclosures: None.
1. Modern Healthcare’s 2014 accountable care organizations survey. Accessed 13 Aug 2014 at www.modernhealthcare.com/article/20140712/DATA/500032360/accountable-care-organizations-2014-excel-full-results.
2. McCall N, Cromwell J, Urato C. Evaluation of Medicare Care Management for High Cost Beneficiaries (CMHCB) Demonstration: Massachusetts General Hospital and Massachusetts General Physicians Organization (MGH). Centers for Medicare & Medicaid Services. 2010 Sept:1–171.
3. Milford CE, Ferris TG. A modified “golden rule” for health care organizations. Mayo Clin Proc 2012;87:717–20.
4. Nabel EG, Ferris TG, Slavin PL. Balancing AMCs’ missions and health care costs – mission impossible? N Engl J Med 2013;369:994–6.
5. Torchiana DF, Colton DG, Rao SK, et al. Massachusetts General Physicians Organization’s quality incentive program produces encouraging results. Health Aff 2013;32:1748–56.
6. Hong CS, Abrams MK, Ferris TG. Toward increased adoption of complex care management. N Engl J Med 2014;371:491–3.
7. Hong CS, Siegel AL, Ferris TG. Caring for high-need, high-cost patients: what makes for a successful care management program? Issue Brief (Commonw Fund) 2014;19:1–19.
8. Kessler RC, Chiu WT, Demler O, et al. Prevalence, severity, and comorbidity of 12-month DSM-IV disorders in the National Comorbidity Survey Replication. Arch Gen Psychiatry 2005;62:617–27.
9. Kessler RC, Demler O, Frank RG, et al. Prevalence and treatment of mental disorders, 1990 to 2003. N Engl J Med 2005;352:2515–23.
10. Druss BG, Walker ER. Mental disorders and medical comorbidity. Research synthesis report no. 21. Princeton, NJ: Robert Wood Johnson Foundation; 2011.
11. Melek S, Norris D. Chronic conditions and comorbid psychological disorders. Milliman Research Report. Seattle, WA: Milliman; 2008.
12. Leslie DL, Rosenbeck RA. Comparing quality of mental health care for public-sector and privately insured populations. Psychiatr Serv 2000; 51:650–5.
13. Goldman W. Economic grand rounds: is there a shortage of psychiatrists? Psychiatr Serv 2001;52:1587–9.
14. Gilbody S, Bower P, Fletcher J, et al. Collaborative care for depression: a cumulative meta-analysis and review of longer-term outcomes. Arch Intern Med 2006;166:2314–21.
15. Woltmann E, Grogan-Kaylor A, Perron B, et al. Comparative effectiveness of collaborative chronic care models for mental health conditions across primary, specialty, and behavioral health care settings: systematic review and meta-analysis. Am J Psychiatry 2012;169:790–804.
16. Bower P, Gilbody S, Richards D, et al. Collaborative care for depression in primary care, making sense of a complex intervention: systematic review and meta-regression. Br J Psychiatry 2006;189:484–93.
17. Milford CE, Hutter MM, Lillemoe KD, Ferris TG. Optimizing appropriate use of procedures in an era of payment reform. Ann Surg 2014;260:204–4.
18. Geographic variation in spending, utilization and quality: Medicare and Medicaid beneficiaries. May 2013. Accessed 13 Aug 2014 at http://iom.edu/~/media/Files/Report%20Files/2013/Geographic-Variation/Sub-Contractor/Acumen-Medicare-Medicaid.pdf
19. Stacey D, Bennett CL, Barry MJ, et al. Decision aids for people facing health treatment or screening decisions. Cochrane Database Syst Rev 2011;(10)CD001431.
20. Oshima Lee E, Emanuel EJ. Shared decision making to improve care and reduce costs. N Engl J Med 2013;368:6–8.
21. Arterburn D, Wellman R, Westbrook E, et al. Introducing decision aids at Group Health was linked to sharply lower hip and knee surgery rates and costs. Health Aff (Millwood) 2012;31:2094–104.
From Partners HealthCare, Boston, MA.
Abstract
- Objective: To describe operational lessons from a large accountable care organization (ACO).
- Methods: Description of an approach that includes the creation of a sustainable financing mechanism, new incentive structures, a high risk care management program, integrated mental health services, tools for specialist engagement, a post acute strategy, fostering patient engagement, and new clinical and analytic technologies.
- Results: Committed ACOs face challenges in enacting care delivery changes. Key challenges include educating boards and management about requirements for success as an ACO; advocacy for state and federal regulations that support the success of ACOs; and engaging patients as active participants in the changes. Importantly, financial returns (as shared savings) on the investment required for these changes will not be available within short-term contract cycles, so committed organizations will need to plan for the long haul.
- Conclusion: A comprehensive approach undertaken within a system that is capable of integrating care across the full continuum of care delivery has the best chance for successfully managing costs and improving care.
After Massachusetts enacted legislation expanding health insurance to nearly all residents in 2006, additional legislation was enacted that focused on health cost containment. The goal of the many new regulations has been to hold the rate of health care cost growth to the rate of general inflation. Consistent with payment policy changes under the Accountable Care Act, Massachusetts regulatory efforts have emphasized putting health care providers at financial risk for some proportion of increases in costs of care. Providers who contract as accountable care organizations (ACOs) typically conduct their usual fee-for-service billing practices, but in addition the providers also agree to an annual total medical expenses (TME) spending target for an assigned population of patients. An annual reconciliation results in either penalties for exceeding targets or shared savings if spending remains below the target. The reconciliation incorporates a small number of commonly used primary care quality measures.
Partners HealthCare, an integrated health care delivery system in Massachusetts that includes 2 large academic medical centers—Massachusetts General Hospital (MGH) and Brigham and Women’s Hospital (BWH)—began deploying new care models designed to reduce the growth in health care costs prior to these policy changes, but the new contracting environment has dramatically accelerated these efforts. Partners HealthCare signed accountable care risk contracts across all major payer categories—commercial, Medicare, and Medicaid—in 2011. Currently, Partners HealthCare has accountability for cost increases for nearly 500,000 lives, making it one of the largest providers of accountable care in the United States [1].
In this paper, we describe some of the initial lessons learned and share some of our concerns for the future success of risk-based contracting. We have organized the paper as we have organized our work—addressing different care services by site of care: primary care, specialty care, non-acute care, patient engagement, and necessary infrastructure. This framework has allowed us to engage the care providers throughout our organization with programs tailored to their specific circumstances. While practical, this framework is nonetheless somewhat artificial because much of our work could be characterized as building bridges between sites of care.
Organizing System-Wide ACO Programs
Focused efforts to lower cost trends and improve outcomes for a defined population began with MGH’s participation in a Medicare demonstration project in 2006. This successful program assigned specially trained nurse care managers to over 2000 of MGH’s highest cost Medicare beneficiaries [2]. The program was expanded in 2009 and then again in 2012, and now includes the entire Partners system. Building on this success, Partners’ providers evolved a broader set of tactics to include data, measurement and evidence-based methods of improving access, continuity, and care coordination to provide population-based health care [3,4]. To coordinate the system-wide work required by new risk contracting arrangements, Partners created the Division of Population Health Management (PHM). PHM works closely with organizational leadership at member institutions to collaboratively design and execute its system-wide accountable care strategy.
PHM has developed capacity, infrastructure, and expertise to implement and manage a clinical strategy for the entire integrated delivery system. This included some governance changes, new management processes, new investments in information technology and establishing system-wide incentives to promote care delivery innovation and improvement. Most importantly, through an extensive planning process Partners identified a comprehensive set of tactics and a multi-year plan for system-wide adoption of those tactics.
The majority of Partners information infrastructure to date was built internally, which allowed for rapid customization and flexibility, but also created significant interoperability problems. Moving forward, the majority of Partners systems will use a single IT platform. Partners has developed and implemented patient registries and care management decision support tools to help focus provider attention on patients most in need of interventions and to support reporting of quality metrics. In addition, Partners continues to expand a comprehensive data warehouse that incorporates a variety of clinical, administrative, and financial data sources to support advanced analytics for self-monitoring and continuous improvement. This extensive network-wide approach over the past several years has generated a number of lessons regarding successful accountable care organization implementation.
Implementing New Financing and Incentive Structures
Once an ACO is formed, the organization needs to restructure management to create organizational accountability for performance (as noted above), determine how to finance programmatic initiatives required to deliver the performance called for in the contracts, and create incentives for all the different providers within the ACO to drive performance towards the system’s goals. These latter two require the ACO to make specific design choices that include some trade-offs.
Partners chose to fund system-level population health management initiatives through a tax on net patient service revenue from its member providers—both hospitals and physicians. Alternative approaches include either setting aside a yearly allocation that is not proportional to a revenue stream or simply allocating the external risk to different operating units and allowing them to determine their own individual approaches (and investments) to managing the financial risk. By linking financing of PHM programs to clinical revenue (independent of risk contracts), and setting a uniform percentage tax, Partners has signaled that the wealthier parts of the system will contribute more to PHM (on an absolute basis) and more importantly that accountable care is a prioritized long-term investment. Allowing each entity within the organization to “sink or swim” based on its own performance was considered inconsistent with the interdependent nature of care delivery in a well functioning system. In addition, investments in the required infrastructure cannot be dependent on annual contract performance due to the volatility in contracted performance and the time it takes for an organization to get a return on their PHM investment.
Any organization involved in multiple performance based risk contracts faces the challenge of organizing the tactics and metrics for their providers. It is simply inconsistent with provider values and workflow to manage to different targets for different subpopulations of patients. In our attempts to promote the best possible care for all our patients and at the same time meet the demands of multiple external contract requirements, we have created an internal performance framework (IPF) that uses a single set of performance targets and a single incentive pool for all out contracts. The IPF rewards member institutions for (1) adopting programmatic initiatives (funded through the tax as described above), (2) meeting external quality measure targets, and (3) limiting the growth of cost-standardized medical expense trend (Figure).
Fixing Primary Care
Populations in risk contracts are typically defined by their primary care providers. In addition, the chronic underfunding of primary care in the US has resulted in unsustainable practice environments as well as well known access problems. Finally, the concentration of costs in a relatively small proportion of patients provides the greatest opportunity for ACOs to reduce costs through better care coordination for these patients. This core set of facts has guided our efforts to improve primary care. To address these issues, we have increased funding to primary care through our efforts to certify all 236 practices as patient-centered medical homes (PCMHs). In addition, we have begun transitioning our compensation models to include components based on risk-adjusted panel size and performance on quality metrics. As mentioned above, we have invested heavily in our complex care management program. Finally, we are working on a much tighter integration of mental health services with primary care. In this section we focus on lessons from our care management program and our efforts in mental health integration.
Complex Care Management
Provider-led high-risk care management has become the primary clinical lever for cost containment for most accountable care organizations [6]. The design and operational characteristics or our program have been described by Hong et al and are available on our website. Our decade of experience with this program has taught us a few lessons regarding the use of algorithms to identify patients, the management of program costs, and the difficulty of creating meaningful accountability.
Our analysis of commercially available risk prediction algorithms found minimal differences among the various products’ ability to predict high cost patients in the following year. A majority of the algorithms are exclusively claims based, though some include the ability to augment risk predictions with clinical data. Clinicians have played a critical role in improving our ability to identify high-risk patients. We have found that when physicians review a pre-selected set of their own patients, they have some ability to discriminate among patients who are likely to benefit from care management and those who are not. Clinicians are prone to overemphasizing recent events, but review of a list of patients who are predicted of becoming high cost mitigates this problem. Commercially available algorithms can help create an initial list, but physicians can add perspective on such important factors as social support and executive functioning. This additional information improves the specificity of the initial algorithm outputs, allowing clinicians to play an important role in refining the lists of patients eligible for high-risk care management.
The high cost of labor and space make high-risk care management programs among the most costly programs for an ACO. Care management requires a skilled nursing workforce (among others), which should be embedded into the primary care office for optimal effect [6,7].Given the high costs, there is understandable pressure to increase the ratio of patients per care manager. We have found that the optimal ratio is approximately 200 patients per care manager, with a third of the patients having active complex care management issues, a third being passively surveyed, and a third requiring modest care coordination. We continue with our attempts to refine how we manage this critical aspect of care management programs.
How can managers demonstrate that the investment in care coordination is impacting the ACO’s TME trend? Demonstrating a return on investment is difficult because a population of high-cost patients will inevitably show reduced costs in the following year (a phenomenon called regression to the mean). Isolating a well-matched control group to demonstrate program effectiveness would have the unintended consequence of reducing the potential effectiveness of the program. This situation is complicated by the different risk profiles of high-risk patients in different payer categories. For example, potentially avoidable Medicare costs are dominated by hospitalizations and end-of-life issues, Medicaid costs by mental illness and substance abuse, and commercial costs by specialty issues. In lieu of better management tools to assess the performance of our program, we have depended to date on process measures (eg., enrollment targets), patient surveys, and we are experimenting with some limited outcomes metrics (eg, admissions/1000).
Mental Health Integration
Another important lever for medical trend reduction within an ACO is the integration of mental health services into primary care. While our efforts in this complex area are only about a year old, some of our early lessons may prove valuable to others. First, we have worked hard to make the case for investment in mental health services, requiring assembling the evidence both for the magnitude of the problem as well as the effectiveness of available solutions.
A quarter of American adults suffer from diagnosable mental health disorders every year and it is estimated that PCPs manage between 40% and 80% of these patients [8,9].Rates of detection and adequate treatment in primary care settings are currently suboptimal, leading to poor disease management and driving excess utilization. Using claims data within the Partners’ primary care population, we have found medical expenditures are 45% higher for patients with a mental health diagnosis. Over 70% of mental health patients have additional illnesses, and the presence of a mental health disorder complicates overall clinical management [10].This results in a substantial increase in medical cost, independent of psychiatric medical spending [11].In addition, psychiatry shortage and access have become a major issue in mental health services [12].Over 70% of PCPs nationwide reported difficulty in finding high-quality outpatient mental health care for their patients [13].
The dominant clinical model for mental health integration is the collaborative care model (CCM), and evidence for its effectiveness is growing. Randomized controlled trials and meta-analyses have shown that CCMs are successful at improving detection and treatment of mental health disorders [14–16].Cost-savings analyses for many of these programs demonstrate considerable savings and favorable return on investment (ROI). Several CCMs that use nonmedical specialists and consulting psychiatrists to augment the management of mental health disorders for low- to moderate-risk primary care patients have been implemented. However, a majority of the CCMs are disease-specific—eg, integrating depression treatment resources into primary care. The challenge for ACOs is to determine how to build a comprehensive CCM that helps primary care manage the major primary care–based mental health conditions—depression, anxiety and substance abuse—in a coordinated, cost-efficient model. The ACO must consider how to implement both its high-risk program and its CCM programs in a way that is not disruptive but supportive to primary care practices.
Partners is implementing a multipronged strategy to address mental health issues within primary care. First, a universal screening program for mental health disorders using brief, well-validated screening tools (eg, Patient Health Questionnaire 2 and 9) will improve the identification of patients with mental health disorders. Second, consulting psychiatrist and mid-level health care providers, functioning as mental health specialists, will be virtually or physically integrated into our primary care teams. They will assist with issues such as initial clinical assessment; coordinate initiation of a mental health treatment plan; monitor the patient’s response to treatment; provide recommendations for treatment change based on evidence-based protocols and guidance from a consulting psychiatrist; provide therapy and mental health services to patients when indicated; and work closely with the patient to engage, activate, and educate him/her in order to promote disease management and treatment adherence. A unique feature of this integration program is the creation of a network-wide mental health access line for rapid mental health assessment and advice. Third, Partners is deploying sustained, network-wide educational programs that will train primary care personnel in brief interventions for improved disease management such as motivational interviewing, behavioral activation, problem-solving therapy, and other first-line interventions suitable for a primary care setting. Fourth, all primary care practices are developing and deploying standard workflows for the identification and treatment of mental health illnesses, starting with depression. Fifth, telehealth technologies will be used to improve access to specialty care and provide care in the most cost-effective setting. An initial focus is on online cognitive behavioral therapy, with virtual visit technologies to follow. Finally, registries will track mental health outcomes and provide prompts to ensure that follow-up screening tests are administered at periodic intervals and that treatment plans can be modified if progress is insufficient.
Implementing Prayer-Agnostic Programs For Specialty Services
Historically, cost containment by commercial payers focused on limiting access to specialist services. However, since costs are concentrated in a small portion of the population with complex chronic illnesses, considering the problems caused by gatekeeping in the 1990s, limiting access to specialists for the entire population may not be an appropriate lever for lowering TME trend. In addition, enhanced access to specialty services has the potential to reduce costs and improve quality through more efficient testing and treatment regimens. We have approached specialist services with the philosophy that early and coordinated access, through the application of tools such as bi-directional referral management systems and virtual visit capabilities, will have a greater ability to lower costs. The challenge for deploying these tools is that ACOs are built off of an aligned population of patients attributed to primary care physicians. Typically, specialists in ACOs are providing care to both a fee-for-service population as well as the ACO population. The costs of providing a nonbillable service such as virtual visits is not sustainable if a large portion of the patients are not in a risk contract. We have found that integrating virtual visits and e-referrals for a limited set of a specialist’s patients poses workflow and ethical challenges. As a system with 2 prominent academic medical centers, we have therefore focused our efforts on deploying these tools to specialists who have a high proportion of patients from our primary care physicians, and continue to work through these significant challenges.
Our specialist engagement tools are focused primarily on improving access and coordination or ensuring appropriateness and optimal outcomes. First, virtual visits (asynchronous and synchronous) between patients and providers or between providers help improve access and coordination. Second, referral management systems that allow for pre-consultative communications and review with key clinical data and messages allow for more thoughtful specialist consultations. This active management of referrals allows specialists to provide accelerated “curbside” consults without a formal consult for minor issues, appropriate pre-appointment testing for improved initial in-person consultation, or accelerated scheduling for initial consultation for urgent issues. Third, we are implementing technology and workflows to capture patient-reported outcomes in our specialty practices. We are collecting and reporting this data internally and externally to ensure we are monitoring the metrics that are most important to our patients. Monitoring patient-reported outcomes is especially important when a provider is concurrently implementing cost-containment measures. Fourth, we have developed technology to assess the appropriateness of surgical procedures. This technology combines analytics of both structured and unstructured data in an electronic platform and provide feedback to providers and patients regarding relative risks and benefits of certain procedures [17]. Lastly, we are implementing clinical bundles around select surgical procedures.
As an ACO that includes academic medical centers, we have a particular challenge of balancing the mission of fostering innovative and experimental technologies that may help advance human health and medical science, while ensuring we are stewards of limited financial resources. Academic medical center–led ACOs will need to thoughtfully balance these objectives [4].
Improving Non-Acute Services
We have included both improved access to emergency department alternatives as well as a focus on the appropriate and efficient use of post acute services in our approach to non-acute services. We have approached improving access to urgent care services by both implementing standards for access to primary care (through PCMH transformation) as well as partnering with urgent care providers.
The use of post-acute care services is the main driver of hospital referral region cost variation for both Medicare and Medicaid [18]. If an ACO is taking on risk in either of these payer categories, it is imperative that the organization has a strategy for managing post-acute care. We have been developing the following capabilities:
- Determine most appropriate level of post-acute care upon discharge from an acute facility (eg, home health vs. skilled nursing facility)
- Predict, to some level of reasonable confidence, the length of post-acute services required per episode of care
- Create a high performance post-acute referral network that can meet quality, efficiency and cost standards set forth by the ACO
The challenge in meeting these goals include the lack of high quality data required to execute on the first 2 objectives. In addition, development of a post-acute referral network is dependent on regional market characteristics. For example, if the region’s supply of post-acute facilities is limited, enforcing the ACO standards for high-quality post-acute care may be challenging. Executing a post-acute strategy that helps an ACO meet its financial and quality objectives may be one of the more challenging endeavors the ACO will undertake.
Engaging Patients in Accountable Care
Accountable care contracts provide a new imperative for providers to offer tools that help patients engage in their care outside of the traditional clinical encounter. Promoting shared decision making, where patients share preferences and clinicians incorporate these beliefs into clinical decision-making, is one of our primary patient engagement strategies. Systematic reviews have demonstrated the effectiveness of shared decision making in improving patient awareness and reducing variation in health care utilization [19–21]. In addition to shared decision making, we have invested in new video education tools and have updated our electronic patient portal to allow patients to access their clinical record, review educational materials, and communicate with their care team at their convenience. Patient engagement strategies are also embedded into other initiatives, such as our high-risk care management program. Keeping patient engagement integrated into all of an accountable care organization’s programs, instead of treating it as a distinct program, is critical for success.
Implementing Clinical Information Technology Tools
A majority of current clinical information technology tools have been created for synchronous, in-person delivery of health care, reflecting the dominant mode of care delivery in the US. However, under accountable care payment models, ACOs have the opportunity (and imperative) to deliver care either asynchronously and/or remotely. As we assessed our needs, we recognized several gaps between existing and desired technologies. Though many population health information technology frameworks exist, we have found three broad categories required for successful population health management: advanced data warehousing and analytics, next generation care delivery and coordination tools, and innovative clinical performance management tools.
Advanced data warehousing and analytics: ACOs must be able to integrate and analyze multiple data sources, including payer derived claims data (providing data on care rendered both inside and outside the ACO) as well as administrative data (scheduling, billing), and clinical (both structured and unstructured). This requires an ACO to invest in data warehousing technologies and analytical tools in order to take full advantage of the available information and provide guidance to providers and managers. We continue to build this set of solutions.
Next generation care delivery and coordination tools: The ACO must have new ways to connect various members of the patient care team including patient to provider, and provider to provider. These technologies include but are not limited to asynchronous and synchronous virtual visit capabilities, referral management software and high risk care management software, and remote monitoring for carefully selected patients. We are currently employing all of these types of health information technology.
Innovative clinical performance management tools: Third, the accountable care organization should have clinical performance management technologies that allow its providers to reduce care gaps and improve stewardship of resources. This includes, for example, advanced clinical decision support for radiology ordering and procedures and patient registries with clinical workflow integration.
In general, we have found a majority of accountable care information technology vendors are repurposing their existing assets for new applications towards population health management. For example, warehousing companies with strengths in the financial industry may convert their product for the health care market, or a company built for patient outreach and appointment reminders may convert their product into population health clinical registries. Given the relatively new nature of risk-based contracting, and uncertainty of the future of this payment model, it makes good sense from a vendor perspective to first try to repurpose existing assets, instead of creating built-for-purpose technologies that are more costly, and may not get to market fast enough to meet customer needs. The challenge for providers is that many of these repurposed technologies do not quite solve the particular challenges the provider is attempting to address. Accountable care organizations therefore are faced with challenging decisions regarding the purchase of a less than optimal product, waiting for the product segment to mature, or building the solution themselves.
Conclusion
We have described an approach to ACO success that includes the creation of a sustainable financing mechanism, new incentive structures, a high-risk care management program, integrated mental health services, tools for specialist engagement, a post-acute strategy, fostering patient engagement, and new clinical and analytic technologies. The breadth and depth of these changes to care delivery present numerous daunting challenges. Our experience suggests that partial approaches, implementing just a subset of the approaches listed above, will not constrain cost growth because costs are just shifted to a different part of the care delivery system. We conclude from this experience that a comprehensive approach undertaken within a system that is capable of integrating care across the full continuum of care delivery has the best chance for successfully managing costs and improving care. Nonetheless, the challenges associated with change on this scale are legion. Key challenges facing the committed ACOs include: educating their boards and management about requirements for success as an ACO; advocacy for state and federal regulations that support the success of ACOs; and engaging patients as active participants in the changes. Importantly, financial returns (as shared savings) on the investment required for these changes will not be available within short-term contract cycles, so committed organizations will need to plan for the long haul.
Acknowledgment: The authors would like to thank the leadership of Partners Healthcare for their unambiguous support of the efforts described in this paper, as well as the clinicians, administrators, and support service workers that are committed to the achievement of the goals we have together set for the organization.
Corresponding author: Sreekanth K. Chaguturu, MD, 800 Boylston St., Ste. 1150, Boston, MA 02199, schaguturu@partners.org.
Financial disclosures: None.
1. Modern Healthcare’s 2014 accountable care organizations survey. Accessed 13 Aug 2014 at www.modernhealthcare.com/article/20140712/DATA/500032360/accountable-care-organizations-2014-excel-full-results.
2. McCall N, Cromwell J, Urato C. Evaluation of Medicare Care Management for High Cost Beneficiaries (CMHCB) Demonstration: Massachusetts General Hospital and Massachusetts General Physicians Organization (MGH). Centers for Medicare & Medicaid Services. 2010 Sept:1–171.
3. Milford CE, Ferris TG. A modified “golden rule” for health care organizations. Mayo Clin Proc 2012;87:717–20.
4. Nabel EG, Ferris TG, Slavin PL. Balancing AMCs’ missions and health care costs – mission impossible? N Engl J Med 2013;369:994–6.
5. Torchiana DF, Colton DG, Rao SK, et al. Massachusetts General Physicians Organization’s quality incentive program produces encouraging results. Health Aff 2013;32:1748–56.
6. Hong CS, Abrams MK, Ferris TG. Toward increased adoption of complex care management. N Engl J Med 2014;371:491–3.
7. Hong CS, Siegel AL, Ferris TG. Caring for high-need, high-cost patients: what makes for a successful care management program? Issue Brief (Commonw Fund) 2014;19:1–19.
8. Kessler RC, Chiu WT, Demler O, et al. Prevalence, severity, and comorbidity of 12-month DSM-IV disorders in the National Comorbidity Survey Replication. Arch Gen Psychiatry 2005;62:617–27.
9. Kessler RC, Demler O, Frank RG, et al. Prevalence and treatment of mental disorders, 1990 to 2003. N Engl J Med 2005;352:2515–23.
10. Druss BG, Walker ER. Mental disorders and medical comorbidity. Research synthesis report no. 21. Princeton, NJ: Robert Wood Johnson Foundation; 2011.
11. Melek S, Norris D. Chronic conditions and comorbid psychological disorders. Milliman Research Report. Seattle, WA: Milliman; 2008.
12. Leslie DL, Rosenbeck RA. Comparing quality of mental health care for public-sector and privately insured populations. Psychiatr Serv 2000; 51:650–5.
13. Goldman W. Economic grand rounds: is there a shortage of psychiatrists? Psychiatr Serv 2001;52:1587–9.
14. Gilbody S, Bower P, Fletcher J, et al. Collaborative care for depression: a cumulative meta-analysis and review of longer-term outcomes. Arch Intern Med 2006;166:2314–21.
15. Woltmann E, Grogan-Kaylor A, Perron B, et al. Comparative effectiveness of collaborative chronic care models for mental health conditions across primary, specialty, and behavioral health care settings: systematic review and meta-analysis. Am J Psychiatry 2012;169:790–804.
16. Bower P, Gilbody S, Richards D, et al. Collaborative care for depression in primary care, making sense of a complex intervention: systematic review and meta-regression. Br J Psychiatry 2006;189:484–93.
17. Milford CE, Hutter MM, Lillemoe KD, Ferris TG. Optimizing appropriate use of procedures in an era of payment reform. Ann Surg 2014;260:204–4.
18. Geographic variation in spending, utilization and quality: Medicare and Medicaid beneficiaries. May 2013. Accessed 13 Aug 2014 at http://iom.edu/~/media/Files/Report%20Files/2013/Geographic-Variation/Sub-Contractor/Acumen-Medicare-Medicaid.pdf
19. Stacey D, Bennett CL, Barry MJ, et al. Decision aids for people facing health treatment or screening decisions. Cochrane Database Syst Rev 2011;(10)CD001431.
20. Oshima Lee E, Emanuel EJ. Shared decision making to improve care and reduce costs. N Engl J Med 2013;368:6–8.
21. Arterburn D, Wellman R, Westbrook E, et al. Introducing decision aids at Group Health was linked to sharply lower hip and knee surgery rates and costs. Health Aff (Millwood) 2012;31:2094–104.
Improved Coordination of Care for Patients with Abnormalities on Chest Imaging: The Rapid Access Chest and Lung Assessment Program
From the DeCesaris Cancer Institute, Anne Arundel Medical Center, Annapolis, MD.
Abstract
- Objective: To describe the development and outcomes of a centralized evaluation service for patients with abnormalities on thoracic imaging to allow prompt and standardized review by an experienced multidisciplinary team.
- Methods: Patients with abnormal thoracic imaging studies, whether symptom-related or incidental, were referred to a specialized multidisciplinary team by radiologists, primary care physicians, or other providers. Recommendations for immediate or delayed follow-up were made based on professional society guidelines and patient characteristics. Follow-up was maintained within the program with close communication with primary care physicians.
- Results: 238 patients were referred over a 27-month period, 227 with abnormal findings on chest imaging. 171 patients (75%) accepted participation in the program. Radiologists were the most frequent referrers. Pulmonary symptoms were present in 74% of cases but were often unrelated to the findings. Patients and primary care physicians were contacted within a median of 2 days after imaging. Lung cancer was eventually diagnosed in 72 patients (32%), 51% with stage IA-IIB, at a median time of 16 days from first imaging. Physician satisfaction with the program was high.
- Conclusion: The program provided rapid and evidence-based evaluation and management of patients with thoracic imaging abnormalities, resulting in short time to diagnosis and high referring physician satisfaction.
Nonspecific abnormalities after chest imaging are a clinical dilemma for physicians and a source of anxiety for patients concerned about the possibility of malignancy. The range of abnormal findings most often involve the parenchyma but also can include nodal tissue, mediastinum, and the bony thorax. Often these findings are incidental to the symptoms that prompted the evaluation. For example, one study of over 12,000 abdominal computed tomography (CT) scans detected pulmonary nodules in 3% [1], and a study of 586 CT angiograms ordered in an emergency room found nodules in 13% and new adenopathy in 9% [2]. Furthermore, CT imaging in various lung cancer screening trials demonstrate that the prevalence of 1 or more pulmonary nodules is 8% to 51%, but the risk of malignancy is much less: 1.1% to 12% [3]. Indeed, it is estimated that due to a high prevalence of imaging, over 150,000 Americans are diagnosed with solitary pulmonary nodules (SPN) annually [2]. Although nodule characteristics such as size, shape, and stability over time can predict the likelihood of malignancy, the risk that any of these imaging abnormalities are related to a malignancy depends upon characteristics of both the lesion and the patient.
Given the nonspecific nature of many radiographic findings, management strategies and guidelines have been developed for several different types of imaging abnormalities [4–7]. However, gaps in the guidelines exist, and they often are not followed [8,9]. Radiologists are not adherent to any set of guidelines in as many as 64% of cases, despite a high level of awareness of such guidelines [10–13]. Recommendations that are not concordant with guidelines are more likely to involve excessively frequent imaging rather than inappropriately infrequent follow-up [13].
Actual cases of under- and over-imaging in surveillance and a single case of delayed diagnosis despite a radiology report highlighting a high-risk nodule prompted us to developed a centralized program to gather all patients with pulmonary imaging abnormalities into the hands of physicians most familiar with these abnormalities and the proper use of available diagnostic tools. The goals were to rely on existing guidelines tempered with clinical experience to advise patients and their primary care physicians, and to direct the most efficient diagnostic evaluation and management.
Methods
Setting
Anne Arundel Medical Center is a 385-bed acute care hospital in Annapolis, Maryland, with a medical staff of nearly 1000 physicians and mid-level providers. There are nearly 30,000 admissions and 95,000 emergency department visits annually. The medical center operates 5 regional diagnostic imaging sites that collectively perform 159,000 imaging studies annually, including 3995 chest CT scans and 5243 abdominal CT scans in 2013. The images are interpreted by 20 radiologists from a single private practice contracted to provide services at these locations. Specialist readers are deployed in nuclear medicine, musculoskeletal, neuroradiology, and breast imaging, but not in thoracic imaging.
Program Description
The goal of the Rapid Access Chest and Lung Assessment Program (RACLAP) is to perform a rapid multidisciplinary assessment of pulmonary findings related to patient symptoms or presenting as incidental findings. First contact with the primary care provider was made by either the interpreting radiologist or the nurse navigator to obtain approval for entrance into the program. At that point, the patients were contacted and offered evaluation. Once evaluated, patients provided informed consent to have their data and outcomes collected and analyzed. The assessment team included a nurse navigator to gather elements of the history, and thoracic surgeons, pulmonologists, and radiologists to make recommendations about further follow-up based on the guidelines of the Fleishner Society [5] and American College of Radiology [6] and knowledge of patient characteristics and risk factors. Patients who were judged to have lower-risk abnormalities were followed within the program for at least 2 years to document stability.
Keeping in close contact with the patient’s primary care physician, the team designed a plan for additional evaluation as necessary. If multidisciplinary consultation was required, the nurse navigator coordinated and facilitated visits to avoid duplication and delays. The RACLAP established a dedicated phone number to receive calls and messages from radiologists at any of the 5 diagnostic facilities and from emergency department or other physicians who encounter patients with abnormal chest imaging findings. Institutional review board approval was obtained for this project.
Analysis
The percentage of RACLAP patients presenting with early stage (IA–IIB) lung cancer diagnosed in the RACLAP was compared with both concurrent controls (those diagnosed during the same time period through traditional referral patterns) and with historic controls (those diagnosed in the 24 months prior to the institution of the RACLAP). A 2-sample test for binomial proportions was used for both of these comparisons.
Physician satisfaction with the program was assessed with an online survey tool sent to the 63 individual referring physicians. The survey tool consisted of 11 questions asking respondents to rate their satisfaction with various aspects of the program on a 1–10 scale where 10 was excellent.
Results
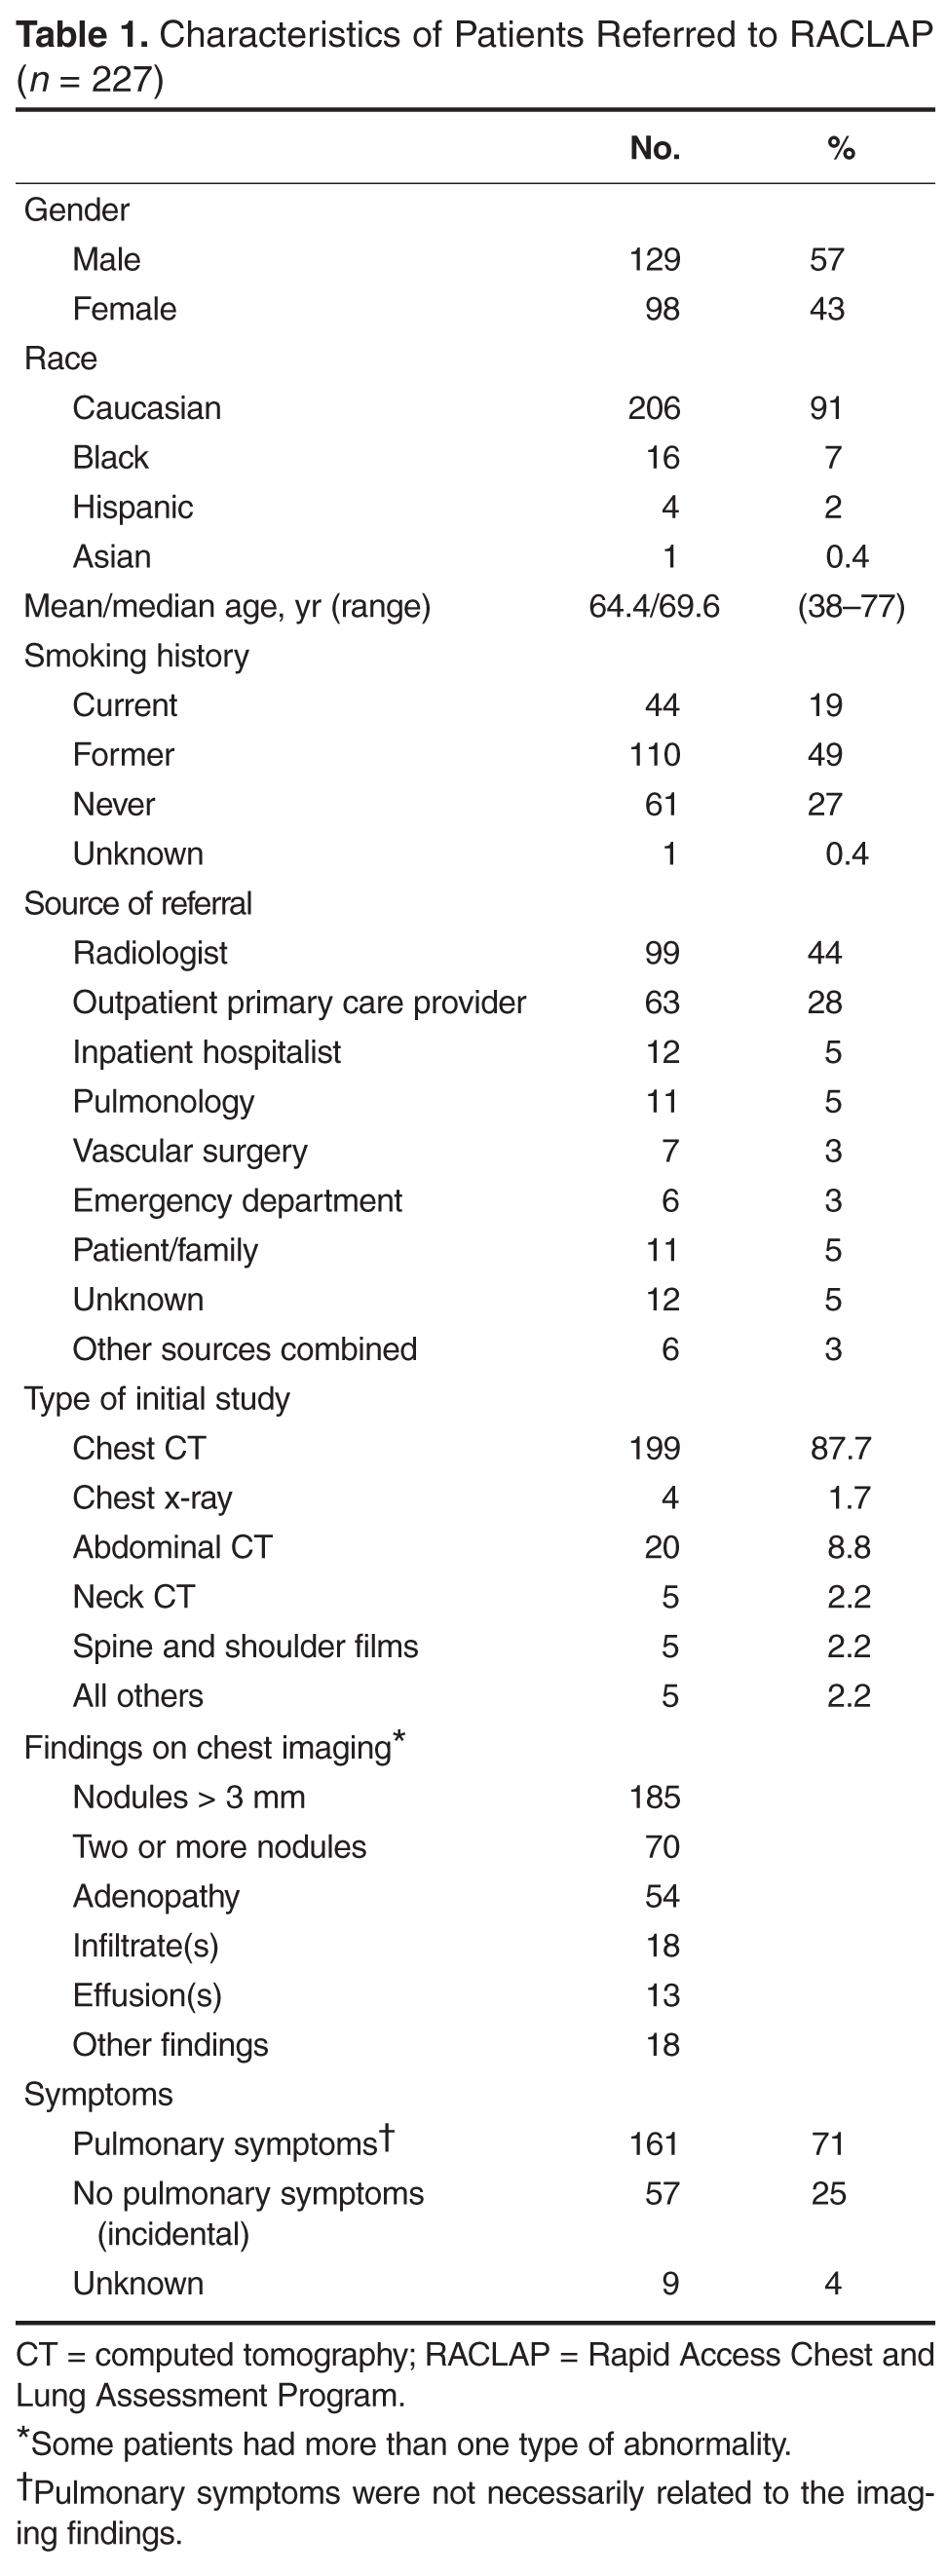
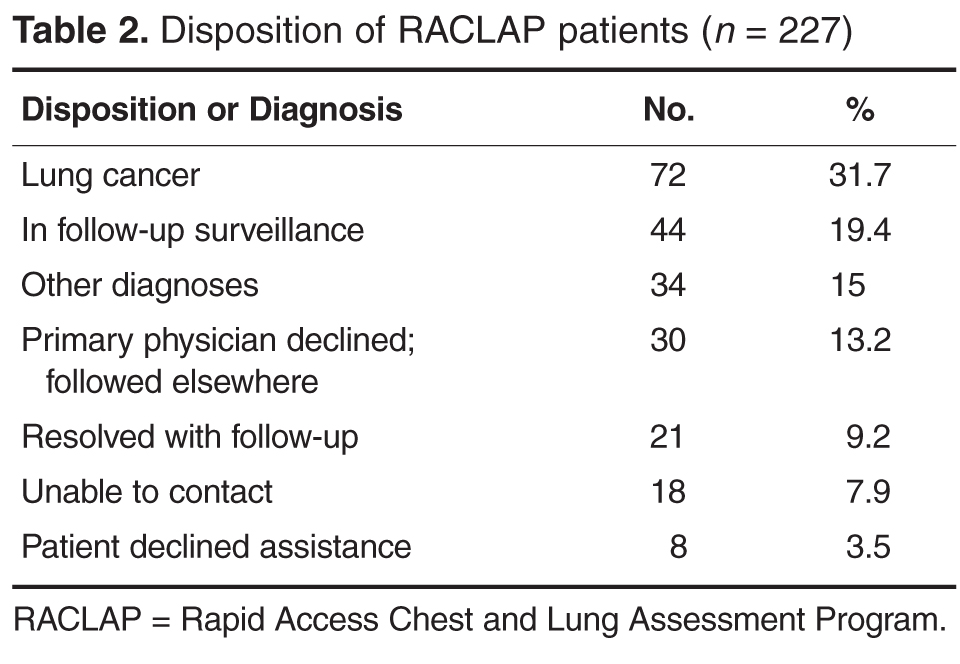
Operational metrics of the program were evaluated for the entire group. All patients were contacted within 2 business days, but data on time to evaluation is confounded by patients who had no need for urgent evaluation. However, we did quantify time to evaluation for the 72 patients who had more worrisome findings and were eventually shown to have newly diagnosed lung cancer (Table 3). 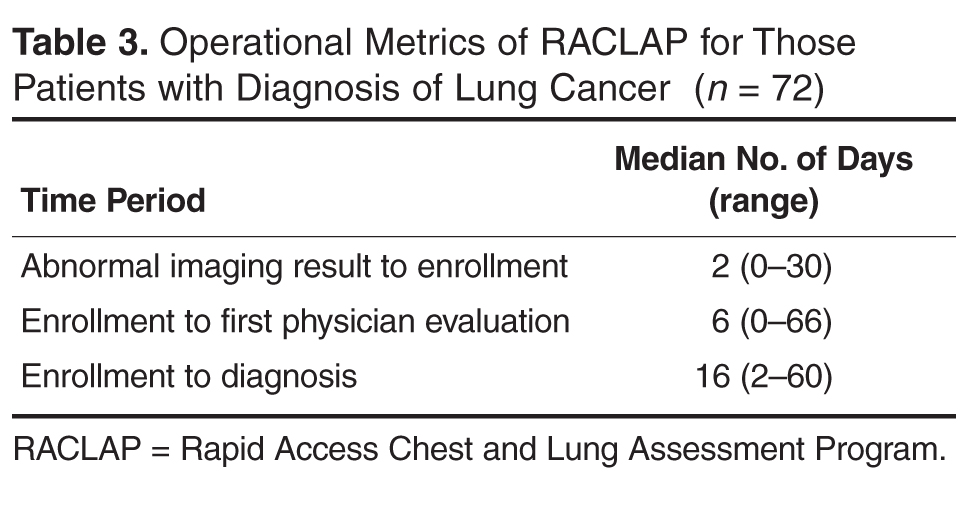
Seventy-two patients were diagnosed with lung cancer after referral (31.7%). Table 4 shows their stage at presentation and compares them to the 379 concurrent control patients diagnosed with lung cancer during these same months via traditional practice patterns and the 458 historic 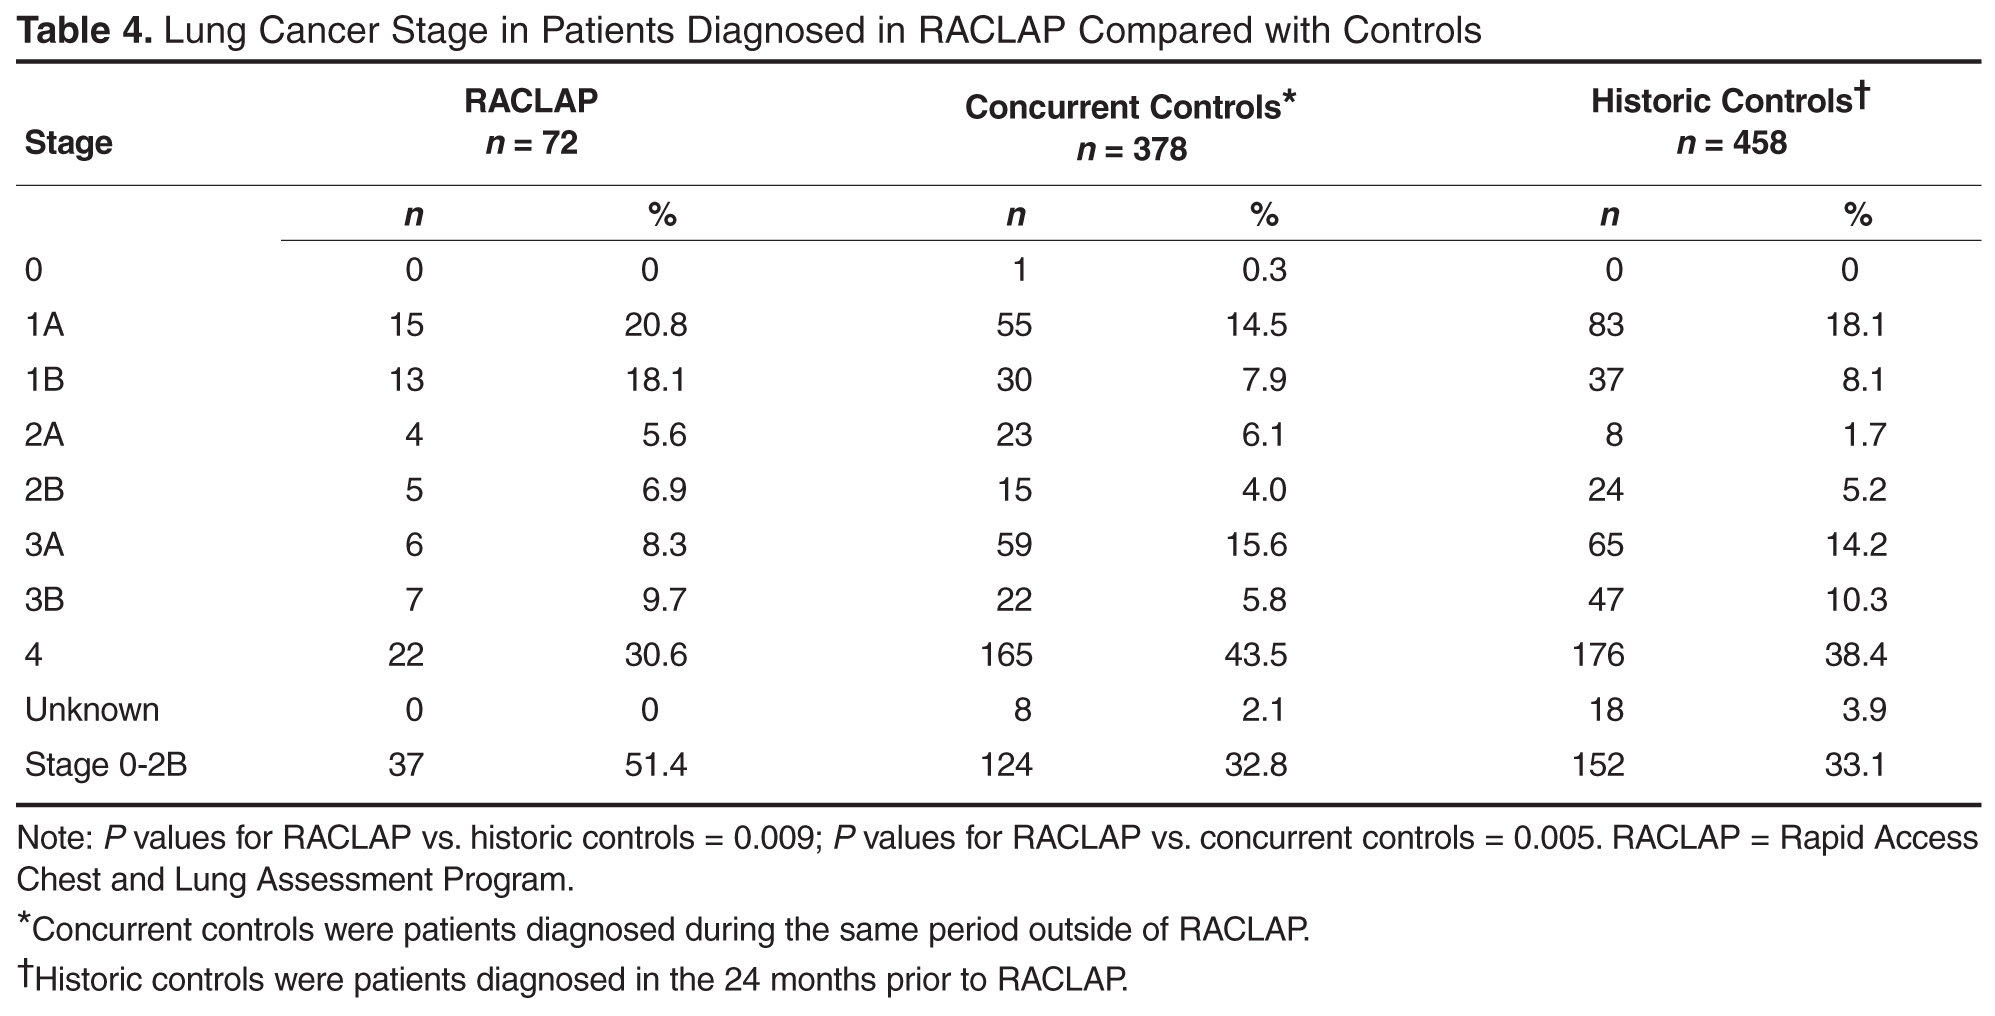
The online survey was sent to 63 referring physicians and 30 responded (47% response rate). Average overall satisfaction was 8.5 on a 1 to 10 scale with 10 being the highest level of satisfaction. Likelihood of referring another patient averaged 9.1 on the same scale. Individual comments cited ease of access, the comprehensive nature of the evaluation, and the communication to the primary care physicians as the best aspects of the program.
Discussion
The discovery of suspicious findings on imaging can have a dramatic impact on patients’ quality of life and emotional well-being, with nearly all patients fearing that they have cancer [15]. Clinical uncertainty about next steps heightens their concerns. The value of data-derived guidelines in shaping the recommendations of radiologists and primary care physicians has recently been expressed [16]. We know of no data quantifying primary care or emergency department physicians’ awareness of surveillance guidelines, but experience indicates that surveillance strategies are highly idiosyncratic, with at least a few patients getting lost to follow-up altogether. Many primary care physicians rely upon recommendations in radiologists’ reports. Unfortunately, there is ample evidence that radiologists’ recommendations are not consistently concordant with guidelines [10–13], with a tendency to over-recommend follow-up tests [13].
The RACLAP program was developed to centralize the follow-up of clinically significant pulmonary imaging abnormalities in order to standardize the approach, increase adherence to professional society guidelines, and to avoid the rare but real situation of having a patient lost to follow-up. Unlike other “nodule clinics,” it was pro-active, reaching out to primary care physicians and to patients once a radiologist notified a nurse navigator of a finding. Our findings document a high acceptance of the program with 171/227 (75%) of patients and primary care physicians opting for evaluation within the program. The fact that in only 30 of 227 (13%) of potential referrals did a primary care physician decline the service indicates that the RACLAP successfully addressed an existing need among physicians. Referring physician satisfaction with the service was high reflecting the fact that the program assisted them in making difficult management decisions and discussing clinical uncertainty with patients.
Our program bears superficial similarities to the one described by Lo et al at Toronto East General Hospital [17], where a re-design of operations lead to an increase in access to thoracic oncology specialists and resulted in a reduction of wait time to evaluation by a median of 27 days. However, the goals of the 2 programs were different and the problems being addressed were dissimilar. The Canadian program was designed to shorten time from clinical suspicion to diagnosis of lung cancer and involved improving access to specialists with the creation of “shadow” slots for CT scan and bronchoscopy to facilitate prompt consultation requests, something that was not necessary in our system. Our program was focused on inserting maximum experience into the clinical decision making about imaging abnormalities to assure guideline adherence and consistency in approach.
The short interval to patient contact and evaluation described in this report compares favorably to published data on time to evaluation in referral patterns from around the world when no special efforts are made [18–21]. Alsamari et al have shown the benefit of special efforts to coordinate care of patients with apparent lung cancer with regard to timeliness of evaluation and improved stage compared to historic controls [19]. It should be noted, that even though guidelines have been promulgated for the timeliness of evaluation of symptomatic patients, it is unclear if reducing time to evaluation improves lung cancer survival [18] though it can reduce anxiety.
Our program relied most heavily upon radiologists to make the referral to the RACLAP. We find that the ability to inform and organize a smaller number of radiologists is more effective than attempting to inform a much larger number of primary care physicians about the existence of the program. Even with the success of the program we noted that not all radiologists made referrals at the same frequency, suggesting variability in interest and/or awareness. The system could therefore be improved by making it easier for radiologists to participate by implementing electronic tools that allow radiologists to activate the RACLAP navigator via an inbox message in the electronic medical record as was described at the a program at the Veterans Affairs Connecticut Health Care System [19]. In addition, tools such as natural language processing and clinical decision support which “read” radiology reports and allow standardized templated recommendations, similar to breast imaging reports would improve standardization of recommendation.
The limitations of this study are chiefly related to questions regarding its generalizability, as this was a highly centralized, hospital-based program. The nurse navigator was a hospital employee and the involved physicians were all hospital-based, although only the surgeons were employed by the medical center. In addition, all 5 radiology centers and physicians in the program had access to the electronically stored images. Whether such a program could be recreated and thrive in communities without this degree of centralization, system collaboration, and leadership is unclear. Another feature of this program that raises questions of generalizability is that all the radiologists, the chief source of referrals, were employed in a single professional practice which facilitated communication and uniformity of practice. We are in the process of expanding the program to engage a larger number of radiology practices without the close relationships described above.
The high rate of new lung cancer diagnoses (32%) was surprising. Though most patients had some symptoms that provoked the imaging, many of these symptoms seemed to be unrelated to the findings, even among those subsequently found to have cancer. Our population did have a higher percentage of active smokers (19.7% compared with 14% of adults in our home county [22]), indicating perhaps a bias toward ordering imaging in those who smoke. It is possible that referring physicians, including radiologists, referred patients who had more worrisome characteristics more often. The program was intended to be universal, but we cannot exclude referral bias as a cause of the high rate of malignant diagnoses. Even so, the increased frequency of “early”- stage cancers stands.
Conclusion
Our study showed that in a community hospital–based practice, the care of patients with pulmonary imaging abnormalities can be coordinated and facilitated so that professional society guidelines for surveillance are utilized. The program required no capital and was only modestly labor intensive, requiring the deployment of a navigator who may be shared with other cancer programs. Referring physician satisfaction was high. As high resolution CT scans for lung cancer screening and other indications becomes more common, imaging abnormalities will be found increasingly. Health systems are increasingly focused on both costs of care and quality of care. In this setting, directing the evaluation of patient with abnormal lung imaging to those most experienced can be a means to achieve both higher quality and lower cost.
Acknowledgments: We acknowledge Professor Charles Mylander for expert statistical analysis and support. We are grateful to members of the Thoracic Oncology Steering Committee at Anne Arundel Medical Center for help in creating the program described above.
Corresponding author: Barry Meisenberg, MD, DeCesaris Cancer Institute, 2001 Medical Parkway, Annapolis, MD 21146, Meisenberg@AAHS.org.
Financial disclosures: None.
1. Alpert JB, Fantauzzi JP, Melamud K, et al. Clinical significance of lung nodules reported on abdominal CT. AJR Am J Roentgenol 2012;1998:793–9.
2. Hall WB, Truitt SG, Scheunemann LP, et al. The prevalence of clinically relevant incidental findings on chest computed tomographic angiograms ordered to diagnose pulmonary embolism. Arch Intern Med 2009;169:1961–5.
3. Wahidi MM, Govert JA, Goudar RK, et al. Evidence for the treatment of patients with pulmonary nodules: when is it lung cancer? Chest 2007;132(3 Suppl):94S–107S.
4. Ost D, Fein AM, Feinsilver SH. The solitary pulmonary nodule. N Engl J Med 2003;348:2535–42.
5. MacMahon H, Austin JH, Gamsu G, et al. Guidelines for management of small pulmonary nodules detected on CT scans: a statement from the Fleischner Society. Radiology 2005;237:395–400.
6. Ray Jr CE, English B, Funaki BS, et al. ACR appropriateness criteria radiologic management of thoracic nodules and masses. J Am Coll Radiol 2012;9:13–9.
7. Kanne JP, Jensen LE, Tan-Lucien HM, et al. ACR appropriateness criteria radiographically detected solitary pulmonary nodule. J Thorac Imaging 2013;28:W1–W3.
8. Edey AJ, Hansell DM. Incidentally detected small pulmonary nodules on CT. Clin Radiol 2009;64:872–84.
9. Nair A, Baldwin DR, Field JK, et al. Measurement methods and algorithms for the management of solid nodules. J Thorac Imaging 2012;27:230–9.
10. Eisenberg RL, Bankier, Boiselle PM. Compliance with Fleischner Society guidelines for management of small lung nodules: a survey of 834 radiologists. Radiology 2010;255:218–24.
11. Lacson, RL, Prevedello LM, Andriole KP, et al. Factors associated with radiologists’ adherence to Fleischner guidelines for management of pulmonary nodules. J Am Coll Radiol 2012; 9:468–73.
12. Esmail A, Munden RF, Muhammed TL. Small pulmonary nodule management: a survey of the members of the Society of Thoracic Radiology with comparison to the Fleischner Society guidelines. J Thorac Imaging 2011;26:27–31.
13. Masciocchi M, Wagner B, Lloyd B. Quality review: Fleischner criteria adherence by radiologists in a large community hospital. J Am Coll Radiol 2012;9:336–9.
14. National Cancer Institute Patient Information page: non-small cell lung cancer. Accessed 1 Jul 2013 at www.cancer.gov/cancertopics/pdq/treatment/non-small-cell-lung/Patient#Keypoint4.
15. Wiener RS, Gould MK, Woloshin S, et al. What do you mean, a spot? a qualitative analysis of patients’ reactions to discussion with their physicians about pulmonary nodules. Chest 2013;143:672–7.
16. McMahon H. Compliance with Fleischner Society guidelines for management of lung nodules: lessons and opportunities. Radiology 2010;255:14–5.
17. Lo DS, Zeldin RA, Skratsins R, et al. Time to treat: a system redesign focusing on decreasing the time from suspicion of lung cancer to diagnosis. J Thorac Oncol 2007;2:1001–6.
18. Brocken P, Loers BAB, Looijen-Salamon MG, et al. Timeliness of lung cancer diagnosis and treatment in a rapid outpatient diagnostic program with combined 18FDG-PET and contrast enhanced CT scanning. Lung Cancer 2012;75:336–41.
19. Alsamarai S, Xiaopan Y, Cain HC, et al. The effect of a lung cancer care coordination program on timeliness of care. Clin Lung Cancer 2013;14:527–34.
20. Leprieur EG, Labrune S, Giraud V, et al. Delay between the initial symptomsa, the diagnosis and the onset of specific treatment in elderly patients with lung cancer. Clin Lung Cancer 2012;13:363–8.
21. Cheung WY, Butler JR, Kliewer EV, et al. Analysis of wait times and costs during the peri-diagnostic period for non small cell lung cancer. Lung Cancer 2011;72:125–31.
22. Report card of community health indicators. Anne Arundel County Department of Health. Accessed 20 Jul 2013 at www.aahealth.org/pdf/aahealth-report-card-2011.pdf.
From the DeCesaris Cancer Institute, Anne Arundel Medical Center, Annapolis, MD.
Abstract
- Objective: To describe the development and outcomes of a centralized evaluation service for patients with abnormalities on thoracic imaging to allow prompt and standardized review by an experienced multidisciplinary team.
- Methods: Patients with abnormal thoracic imaging studies, whether symptom-related or incidental, were referred to a specialized multidisciplinary team by radiologists, primary care physicians, or other providers. Recommendations for immediate or delayed follow-up were made based on professional society guidelines and patient characteristics. Follow-up was maintained within the program with close communication with primary care physicians.
- Results: 238 patients were referred over a 27-month period, 227 with abnormal findings on chest imaging. 171 patients (75%) accepted participation in the program. Radiologists were the most frequent referrers. Pulmonary symptoms were present in 74% of cases but were often unrelated to the findings. Patients and primary care physicians were contacted within a median of 2 days after imaging. Lung cancer was eventually diagnosed in 72 patients (32%), 51% with stage IA-IIB, at a median time of 16 days from first imaging. Physician satisfaction with the program was high.
- Conclusion: The program provided rapid and evidence-based evaluation and management of patients with thoracic imaging abnormalities, resulting in short time to diagnosis and high referring physician satisfaction.
Nonspecific abnormalities after chest imaging are a clinical dilemma for physicians and a source of anxiety for patients concerned about the possibility of malignancy. The range of abnormal findings most often involve the parenchyma but also can include nodal tissue, mediastinum, and the bony thorax. Often these findings are incidental to the symptoms that prompted the evaluation. For example, one study of over 12,000 abdominal computed tomography (CT) scans detected pulmonary nodules in 3% [1], and a study of 586 CT angiograms ordered in an emergency room found nodules in 13% and new adenopathy in 9% [2]. Furthermore, CT imaging in various lung cancer screening trials demonstrate that the prevalence of 1 or more pulmonary nodules is 8% to 51%, but the risk of malignancy is much less: 1.1% to 12% [3]. Indeed, it is estimated that due to a high prevalence of imaging, over 150,000 Americans are diagnosed with solitary pulmonary nodules (SPN) annually [2]. Although nodule characteristics such as size, shape, and stability over time can predict the likelihood of malignancy, the risk that any of these imaging abnormalities are related to a malignancy depends upon characteristics of both the lesion and the patient.
Given the nonspecific nature of many radiographic findings, management strategies and guidelines have been developed for several different types of imaging abnormalities [4–7]. However, gaps in the guidelines exist, and they often are not followed [8,9]. Radiologists are not adherent to any set of guidelines in as many as 64% of cases, despite a high level of awareness of such guidelines [10–13]. Recommendations that are not concordant with guidelines are more likely to involve excessively frequent imaging rather than inappropriately infrequent follow-up [13].
Actual cases of under- and over-imaging in surveillance and a single case of delayed diagnosis despite a radiology report highlighting a high-risk nodule prompted us to developed a centralized program to gather all patients with pulmonary imaging abnormalities into the hands of physicians most familiar with these abnormalities and the proper use of available diagnostic tools. The goals were to rely on existing guidelines tempered with clinical experience to advise patients and their primary care physicians, and to direct the most efficient diagnostic evaluation and management.
Methods
Setting
Anne Arundel Medical Center is a 385-bed acute care hospital in Annapolis, Maryland, with a medical staff of nearly 1000 physicians and mid-level providers. There are nearly 30,000 admissions and 95,000 emergency department visits annually. The medical center operates 5 regional diagnostic imaging sites that collectively perform 159,000 imaging studies annually, including 3995 chest CT scans and 5243 abdominal CT scans in 2013. The images are interpreted by 20 radiologists from a single private practice contracted to provide services at these locations. Specialist readers are deployed in nuclear medicine, musculoskeletal, neuroradiology, and breast imaging, but not in thoracic imaging.
Program Description
The goal of the Rapid Access Chest and Lung Assessment Program (RACLAP) is to perform a rapid multidisciplinary assessment of pulmonary findings related to patient symptoms or presenting as incidental findings. First contact with the primary care provider was made by either the interpreting radiologist or the nurse navigator to obtain approval for entrance into the program. At that point, the patients were contacted and offered evaluation. Once evaluated, patients provided informed consent to have their data and outcomes collected and analyzed. The assessment team included a nurse navigator to gather elements of the history, and thoracic surgeons, pulmonologists, and radiologists to make recommendations about further follow-up based on the guidelines of the Fleishner Society [5] and American College of Radiology [6] and knowledge of patient characteristics and risk factors. Patients who were judged to have lower-risk abnormalities were followed within the program for at least 2 years to document stability.
Keeping in close contact with the patient’s primary care physician, the team designed a plan for additional evaluation as necessary. If multidisciplinary consultation was required, the nurse navigator coordinated and facilitated visits to avoid duplication and delays. The RACLAP established a dedicated phone number to receive calls and messages from radiologists at any of the 5 diagnostic facilities and from emergency department or other physicians who encounter patients with abnormal chest imaging findings. Institutional review board approval was obtained for this project.
Analysis
The percentage of RACLAP patients presenting with early stage (IA–IIB) lung cancer diagnosed in the RACLAP was compared with both concurrent controls (those diagnosed during the same time period through traditional referral patterns) and with historic controls (those diagnosed in the 24 months prior to the institution of the RACLAP). A 2-sample test for binomial proportions was used for both of these comparisons.
Physician satisfaction with the program was assessed with an online survey tool sent to the 63 individual referring physicians. The survey tool consisted of 11 questions asking respondents to rate their satisfaction with various aspects of the program on a 1–10 scale where 10 was excellent.
Results
Operational metrics of the program were evaluated for the entire group. All patients were contacted within 2 business days, but data on time to evaluation is confounded by patients who had no need for urgent evaluation. However, we did quantify time to evaluation for the 72 patients who had more worrisome findings and were eventually shown to have newly diagnosed lung cancer (Table 3).
Seventy-two patients were diagnosed with lung cancer after referral (31.7%). Table 4 shows their stage at presentation and compares them to the 379 concurrent control patients diagnosed with lung cancer during these same months via traditional practice patterns and the 458 historic
The online survey was sent to 63 referring physicians and 30 responded (47% response rate). Average overall satisfaction was 8.5 on a 1 to 10 scale with 10 being the highest level of satisfaction. Likelihood of referring another patient averaged 9.1 on the same scale. Individual comments cited ease of access, the comprehensive nature of the evaluation, and the communication to the primary care physicians as the best aspects of the program.
Discussion
The discovery of suspicious findings on imaging can have a dramatic impact on patients’ quality of life and emotional well-being, with nearly all patients fearing that they have cancer [15]. Clinical uncertainty about next steps heightens their concerns. The value of data-derived guidelines in shaping the recommendations of radiologists and primary care physicians has recently been expressed [16]. We know of no data quantifying primary care or emergency department physicians’ awareness of surveillance guidelines, but experience indicates that surveillance strategies are highly idiosyncratic, with at least a few patients getting lost to follow-up altogether. Many primary care physicians rely upon recommendations in radiologists’ reports. Unfortunately, there is ample evidence that radiologists’ recommendations are not consistently concordant with guidelines [10–13], with a tendency to over-recommend follow-up tests [13].
The RACLAP program was developed to centralize the follow-up of clinically significant pulmonary imaging abnormalities in order to standardize the approach, increase adherence to professional society guidelines, and to avoid the rare but real situation of having a patient lost to follow-up. Unlike other “nodule clinics,” it was pro-active, reaching out to primary care physicians and to patients once a radiologist notified a nurse navigator of a finding. Our findings document a high acceptance of the program with 171/227 (75%) of patients and primary care physicians opting for evaluation within the program. The fact that in only 30 of 227 (13%) of potential referrals did a primary care physician decline the service indicates that the RACLAP successfully addressed an existing need among physicians. Referring physician satisfaction with the service was high reflecting the fact that the program assisted them in making difficult management decisions and discussing clinical uncertainty with patients.
Our program bears superficial similarities to the one described by Lo et al at Toronto East General Hospital [17], where a re-design of operations lead to an increase in access to thoracic oncology specialists and resulted in a reduction of wait time to evaluation by a median of 27 days. However, the goals of the 2 programs were different and the problems being addressed were dissimilar. The Canadian program was designed to shorten time from clinical suspicion to diagnosis of lung cancer and involved improving access to specialists with the creation of “shadow” slots for CT scan and bronchoscopy to facilitate prompt consultation requests, something that was not necessary in our system. Our program was focused on inserting maximum experience into the clinical decision making about imaging abnormalities to assure guideline adherence and consistency in approach.
The short interval to patient contact and evaluation described in this report compares favorably to published data on time to evaluation in referral patterns from around the world when no special efforts are made [18–21]. Alsamari et al have shown the benefit of special efforts to coordinate care of patients with apparent lung cancer with regard to timeliness of evaluation and improved stage compared to historic controls [19]. It should be noted, that even though guidelines have been promulgated for the timeliness of evaluation of symptomatic patients, it is unclear if reducing time to evaluation improves lung cancer survival [18] though it can reduce anxiety.
Our program relied most heavily upon radiologists to make the referral to the RACLAP. We find that the ability to inform and organize a smaller number of radiologists is more effective than attempting to inform a much larger number of primary care physicians about the existence of the program. Even with the success of the program we noted that not all radiologists made referrals at the same frequency, suggesting variability in interest and/or awareness. The system could therefore be improved by making it easier for radiologists to participate by implementing electronic tools that allow radiologists to activate the RACLAP navigator via an inbox message in the electronic medical record as was described at the a program at the Veterans Affairs Connecticut Health Care System [19]. In addition, tools such as natural language processing and clinical decision support which “read” radiology reports and allow standardized templated recommendations, similar to breast imaging reports would improve standardization of recommendation.
The limitations of this study are chiefly related to questions regarding its generalizability, as this was a highly centralized, hospital-based program. The nurse navigator was a hospital employee and the involved physicians were all hospital-based, although only the surgeons were employed by the medical center. In addition, all 5 radiology centers and physicians in the program had access to the electronically stored images. Whether such a program could be recreated and thrive in communities without this degree of centralization, system collaboration, and leadership is unclear. Another feature of this program that raises questions of generalizability is that all the radiologists, the chief source of referrals, were employed in a single professional practice which facilitated communication and uniformity of practice. We are in the process of expanding the program to engage a larger number of radiology practices without the close relationships described above.
The high rate of new lung cancer diagnoses (32%) was surprising. Though most patients had some symptoms that provoked the imaging, many of these symptoms seemed to be unrelated to the findings, even among those subsequently found to have cancer. Our population did have a higher percentage of active smokers (19.7% compared with 14% of adults in our home county [22]), indicating perhaps a bias toward ordering imaging in those who smoke. It is possible that referring physicians, including radiologists, referred patients who had more worrisome characteristics more often. The program was intended to be universal, but we cannot exclude referral bias as a cause of the high rate of malignant diagnoses. Even so, the increased frequency of “early”- stage cancers stands.
Conclusion
Our study showed that in a community hospital–based practice, the care of patients with pulmonary imaging abnormalities can be coordinated and facilitated so that professional society guidelines for surveillance are utilized. The program required no capital and was only modestly labor intensive, requiring the deployment of a navigator who may be shared with other cancer programs. Referring physician satisfaction was high. As high resolution CT scans for lung cancer screening and other indications becomes more common, imaging abnormalities will be found increasingly. Health systems are increasingly focused on both costs of care and quality of care. In this setting, directing the evaluation of patient with abnormal lung imaging to those most experienced can be a means to achieve both higher quality and lower cost.
Acknowledgments: We acknowledge Professor Charles Mylander for expert statistical analysis and support. We are grateful to members of the Thoracic Oncology Steering Committee at Anne Arundel Medical Center for help in creating the program described above.
Corresponding author: Barry Meisenberg, MD, DeCesaris Cancer Institute, 2001 Medical Parkway, Annapolis, MD 21146, Meisenberg@AAHS.org.
Financial disclosures: None.
1. Alpert JB, Fantauzzi JP, Melamud K, et al. Clinical significance of lung nodules reported on abdominal CT. AJR Am J Roentgenol 2012;1998:793–9.
2. Hall WB, Truitt SG, Scheunemann LP, et al. The prevalence of clinically relevant incidental findings on chest computed tomographic angiograms ordered to diagnose pulmonary embolism. Arch Intern Med 2009;169:1961–5.
3. Wahidi MM, Govert JA, Goudar RK, et al. Evidence for the treatment of patients with pulmonary nodules: when is it lung cancer? Chest 2007;132(3 Suppl):94S–107S.
4. Ost D, Fein AM, Feinsilver SH. The solitary pulmonary nodule. N Engl J Med 2003;348:2535–42.
5. MacMahon H, Austin JH, Gamsu G, et al. Guidelines for management of small pulmonary nodules detected on CT scans: a statement from the Fleischner Society. Radiology 2005;237:395–400.
6. Ray Jr CE, English B, Funaki BS, et al. ACR appropriateness criteria radiologic management of thoracic nodules and masses. J Am Coll Radiol 2012;9:13–9.
7. Kanne JP, Jensen LE, Tan-Lucien HM, et al. ACR appropriateness criteria radiographically detected solitary pulmonary nodule. J Thorac Imaging 2013;28:W1–W3.
8. Edey AJ, Hansell DM. Incidentally detected small pulmonary nodules on CT. Clin Radiol 2009;64:872–84.
9. Nair A, Baldwin DR, Field JK, et al. Measurement methods and algorithms for the management of solid nodules. J Thorac Imaging 2012;27:230–9.
10. Eisenberg RL, Bankier, Boiselle PM. Compliance with Fleischner Society guidelines for management of small lung nodules: a survey of 834 radiologists. Radiology 2010;255:218–24.
11. Lacson, RL, Prevedello LM, Andriole KP, et al. Factors associated with radiologists’ adherence to Fleischner guidelines for management of pulmonary nodules. J Am Coll Radiol 2012; 9:468–73.
12. Esmail A, Munden RF, Muhammed TL. Small pulmonary nodule management: a survey of the members of the Society of Thoracic Radiology with comparison to the Fleischner Society guidelines. J Thorac Imaging 2011;26:27–31.
13. Masciocchi M, Wagner B, Lloyd B. Quality review: Fleischner criteria adherence by radiologists in a large community hospital. J Am Coll Radiol 2012;9:336–9.
14. National Cancer Institute Patient Information page: non-small cell lung cancer. Accessed 1 Jul 2013 at www.cancer.gov/cancertopics/pdq/treatment/non-small-cell-lung/Patient#Keypoint4.
15. Wiener RS, Gould MK, Woloshin S, et al. What do you mean, a spot? a qualitative analysis of patients’ reactions to discussion with their physicians about pulmonary nodules. Chest 2013;143:672–7.
16. McMahon H. Compliance with Fleischner Society guidelines for management of lung nodules: lessons and opportunities. Radiology 2010;255:14–5.
17. Lo DS, Zeldin RA, Skratsins R, et al. Time to treat: a system redesign focusing on decreasing the time from suspicion of lung cancer to diagnosis. J Thorac Oncol 2007;2:1001–6.
18. Brocken P, Loers BAB, Looijen-Salamon MG, et al. Timeliness of lung cancer diagnosis and treatment in a rapid outpatient diagnostic program with combined 18FDG-PET and contrast enhanced CT scanning. Lung Cancer 2012;75:336–41.
19. Alsamarai S, Xiaopan Y, Cain HC, et al. The effect of a lung cancer care coordination program on timeliness of care. Clin Lung Cancer 2013;14:527–34.
20. Leprieur EG, Labrune S, Giraud V, et al. Delay between the initial symptomsa, the diagnosis and the onset of specific treatment in elderly patients with lung cancer. Clin Lung Cancer 2012;13:363–8.
21. Cheung WY, Butler JR, Kliewer EV, et al. Analysis of wait times and costs during the peri-diagnostic period for non small cell lung cancer. Lung Cancer 2011;72:125–31.
22. Report card of community health indicators. Anne Arundel County Department of Health. Accessed 20 Jul 2013 at www.aahealth.org/pdf/aahealth-report-card-2011.pdf.
A Quality Improvement Initiative to Improve Emergency Department Care for Pediatric Patients with Sickle Cell Disease
From the Children’s Hospital & Research Center Oakland, Oakland, CA.
Abstract
- Objective: To determine whether a quality improvement (QI) initiative would result in more timely assessment and treatment of acute sickle cell–related pain for pediatric patients with sickle cell disease (SCD) treated in the emergency department (ED).
- Methods: We created and implemented a protocol for SCD pain management in the ED with the goals of improving (1) mean time from triage to first analgesic dose; (2) percentage of patients that received their first analgesic dose within 30 minutes of triage, and (3) percentage of patients who had pain assessment performed within 30 minutes of triage and who were re-assessed within 30 minutes after the first analgesic dose.
- Results: Significant improvements were achieved between baseline (55 patient visits) and post order set implementation (165 visits) in time from triage to administration of first analgesic (decreased from 89.9 ± 50.5 to 35.2 ± 22.8 minutes, P < 0.001); percentage of patient visits receiving pain medications within 30 minutes of triage (from 7% to 53%, P < 0.001); percentage of patient visits assessed within 30 minutes of triage (from 64% to 99.4%, P < 0.001); and percentage of patient visits re-assessed within 30 minutes of initial analgesic (from 54% to 86%, P < 0.001).
- Conclusions: Implementation of a QI initiative in the ED led to expeditious care for pediatric patients with SCD presenting with pain. A QI framework provided us with unique challenges but also invaluable lessons as we address our objective of decreasing the quality gap in SCD medical care.
Pain is the leading cause of emergency department (ED) visits for patients with sickle cell disease (SCD) [1]. In the United States, 78% of the nearly 200,000 annual ED visits for SCD are for a complaint of pain [1]. Guidelines for the management of sickle cell vaso-occlusive pain episodes (VOE) suggest prompt initiation of parenteral opioids, use of effective opioid doses, and repeat opioid doses at frequent intervals [2–4]. Adherence to guidelines is poor. Both pediatric and adult patients with SCD experience delays in the initiation of analgesics and are routinely undertreated with respect to opioid dosing [5–8]. Even after controlling for race, the delays in time to analgesic administration experienced by patients with SCD exceed the delays encountered by patients who present to the ED with other types of pain [5,9]. These disparities warrant efforts designed to improve the delivery of quality care to patients with SCD.
Barriers to rapid and appropriate care of VOE in the ED are multifactorial and include systems-based limitations, such as acuity of the ED census, staffing limitations (eg, nurse-to-patient ratios), and facility limitations (eg, room availability) [6]. Provider-based limitations may include lack of awareness of available guidelines [10]. Biases and misunderstandings amongst providers about sickle cell pain and adequate medication dosing may also play a role [11–13]. These provider biases often lead to undertreatment of the pain, which in turn can lead to pseudoaddiction (drug-seeking behavior due to inadequate treatment) and a cycle of increased ED and inpatient utilization [14,15].
Patient-specific barriers to effective ED management of pain are equally complex. Previous negative experiences in the ED can lead patients and families to delay seeking care or avoid the ED altogether despite severe VOE pain [16]. Patients report frustration with the lack of consideration that they receive for their reports of pain, perceived insensitivity of hospital staff, inadequate analgesic administration, staff preoccupation with concerns of drug addiction, and an overall lack of respect and trust [17–19]. Patients also perceive a lack of knowledge of SCD and its treatments on the part of ED staff [7]. Other barriers to effective management are technical in nature, such as difficulty in establishing timely intravenous (IV) access.
Gaps and variations in quality of care contribute to poor outcomes for patients with SCD [20,21]. To help address these inequities, the Working to Improve Sickle Cell Healthcare (WISCH) project began in 2010 to improve care and outcomes for patients with SCD. WISCH is a collaborative quality improvement (QI) project funded by the Health Resources and Services Administration (HRSA) that has the goal to use improvement science to improve outcomes for patients with SCD across the life course (Ed note: see Editorial by Oyeku et al in this issue). As one of the HRSA-WISCH grantee networks, we undertook a QI project designed to decrease the quality gap in SCD medical care by creating and implementing a protocol for ED pain management for pediatric patients. Goals of the project were to improve the timely and appropriate assessment and treatment of acute VOE in the ED.
Methods
Setting
This ED QI initiative was implemented at Children’s Hospital & Research Center Oakland, an urban free-standing pediatric hospital that serves a demographically diverse population. The hospital ED sees over 45,000 visits per year, with 250 visits per year for VOE. Residents in pediatrics, family medicine, and emergency medicine staff the ED. All attending physicians are subspecialists in pediatric emergency medicine. Study procedures were approved by the hospital’s institutional review board.
Intervention
A multidisciplinary team consisting of ED staff and sickle cell center staff drafted a nursing-driven protocol for the assessment and management of acute pain associated with VOE, incorporating elements from a protocol in use by another WISCH collaborative member. The protocol called for the immediate triage and assessment of all patients with SCD who presented with moderate to severe pain suggestive of VOE. Moderate to severe pain was defined as a pain score of ≥ 5 on a numeric scale of 0 to 10, where 0 = no pain and 10 = the worst pain imaginable. Exclusion criteria included a chief complaint of pain not considered secondary to VOE (eg, trauma, fracture). Patients were also excluded if they had been transferred from another facility. The protocol called for IV pain medication to be administered within 10 minutes of the patient being roomed, with re-evaluation at 20-minute intervals and re-dosing of pain medication based on the patient’s subsequent pain rating.
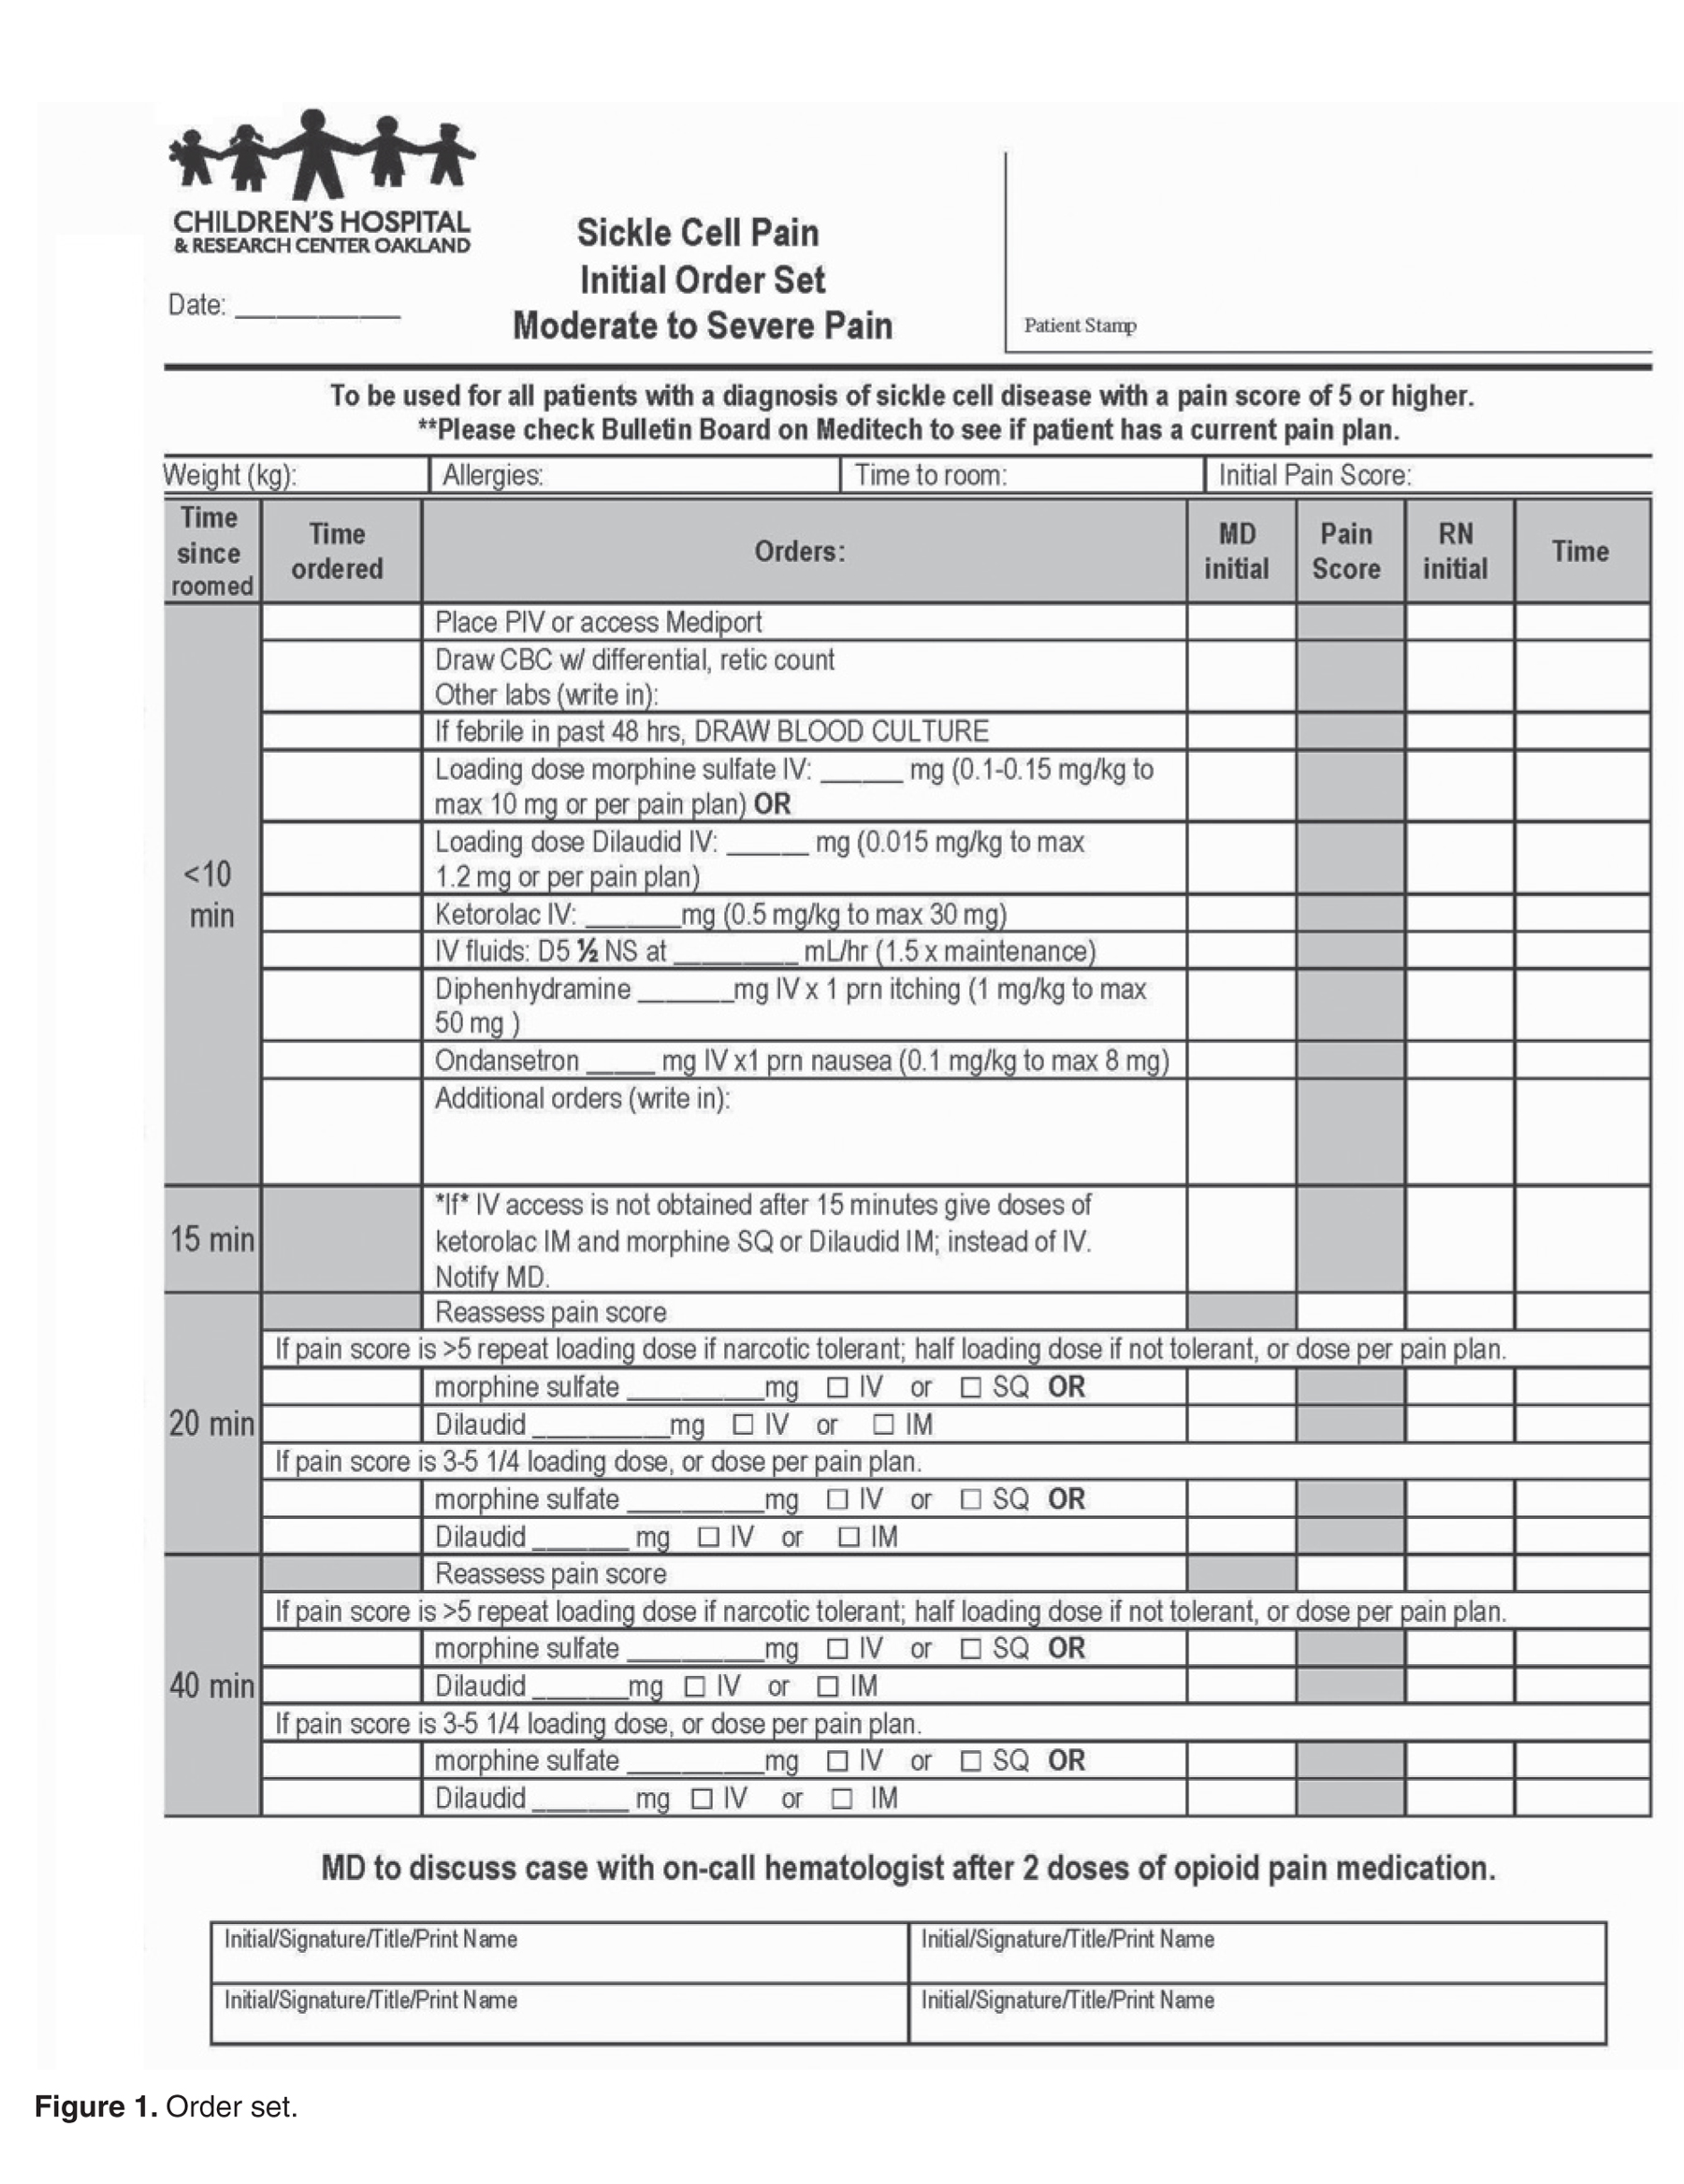
Measures
We selected performance measures from the bank developed by the WISCH team to track improvement and evaluate progress. These performance measures included (1) mean time from triage to first analgesic dose, (2) percentage of patients that received their first dose of analgesic within 30 minutes of triage, (3) percentage of patients who had a pain assessment performed within 30 minutes of triage, and (4) percentage of patients re-assessed within 30 minutes after the first dose of analgesic had been administered. Our aims were to have 80% of patients assessed and given pain medications within 30 minutes of triage, and to have 80% of patients re-assessed within 30 minutes after having received their first dose of an analgesic, within 12 months of implementing our intervention.
Data Collection and Analysis
The WISCH project coordinator reviewed records of visits to the ED for a baseline period of 6 months and post-order set implementaton. Demographic data (age, gender), clinical data (hemoglobin type), pain scores, utilization data (number of ED visits during the study period), and data pertaining to the metrics chosen from the WISCH measurement bank were extracted from each eligible patient’s ED chart after the visit was completed. If patients were admitted, their length of hospitalization was extracted from their inpatient medical record.
All biostatistical analyses were conducted using Stata 9.2 (StataCorp, College Station, TX). Descriptive statistics computed at 2 time-points (pre and post order set implementation) were utilized to examine means, standard deviations and percentages. The 2 time-points were initially compared at the visit level of measurement, using Student’s t tests corrected for unequal variances where necessary for continuous variables and chi-square analyses for categorical variables, to evaluate if there was an improvement in timely triage, assessment, and treatment of acute VOE pain for all ED visits pre and post order set implementation. To account for trends and possible correlations across the months post order set implementation, we ran a mixed linear model with repeated measures over time to compare visits during all months post order set implementation with the baseline months, for metric 1, time from triage to first pain medication. If significant differences were found, we used Dunnett’s method of multiple comparisons to determine which months differed from baseline. For metrics 2 through 4, we ran linear models with a binary outcome, a logit link function and using general estimating equations to determine trends and to account for correlations over time.
Secondary analyses were conducted to evaluate whether mean pain scores were significantly different over the course of the ED visit for the 78 unique patients seen post order set implementation. A multivariable mixed linear model, for the outcome of the third pain score, was used to assess the associations with prior scores and to control for potential covariates (age, gender, number of ED visits, hemoglobin type) that were determined in advance. A statistical significance level of 0.05 was used for all tests.
Results
Baseline data were collected from December 2011 to May 2012. The protocol was implemented in July 2012 and was utilized during 165 ED visits (91% of eligible visits) through April 2013. There were no statistically significant differences in demographic or clinical characteristics between the 55 patients whose charts were reviewed prior to implementing the order set and the 78 unique patients treated thereafter. Pre order set implementation, the mean age was 14.6 ± 6.4 years; 60% were female and the primary diagnosis was HgbSS disease (61.8% of diagnoses). Post order set implementation, the mean age was 16.0 ± 8.0 years; 51.3% were female and the primary diagnosis was HgbSS disease (61.5% of diagnoses). The mean number of visits was 1.5 visits per patient with a range of 1–8 visits, both pre and post order set implementation. Thirty-one patients had ED visits at both time periods.
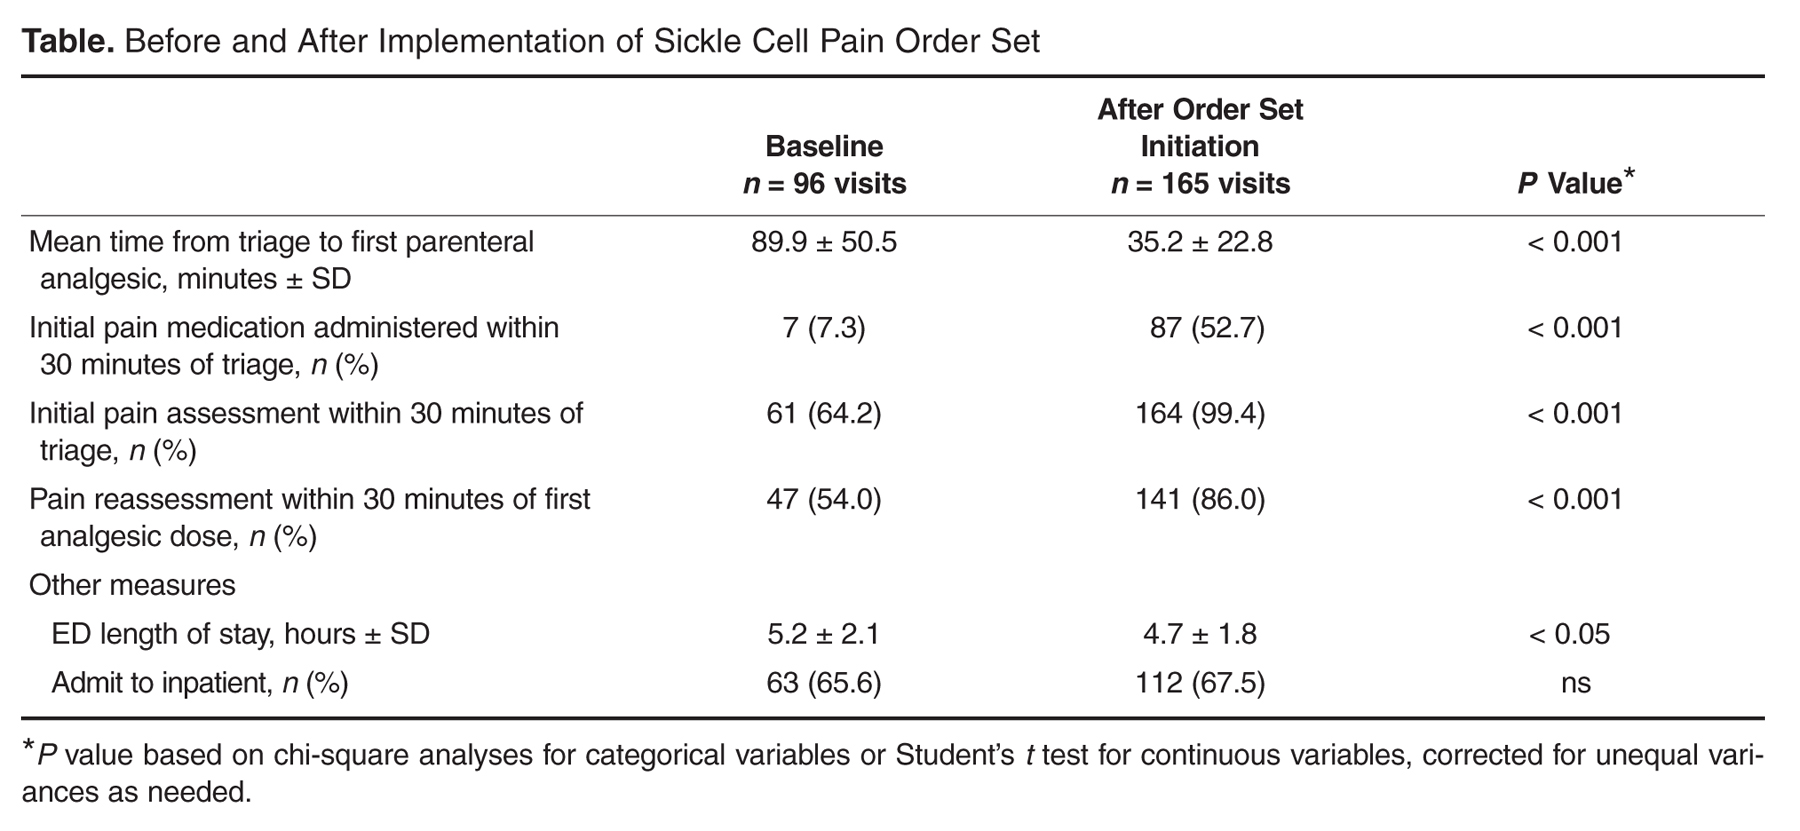
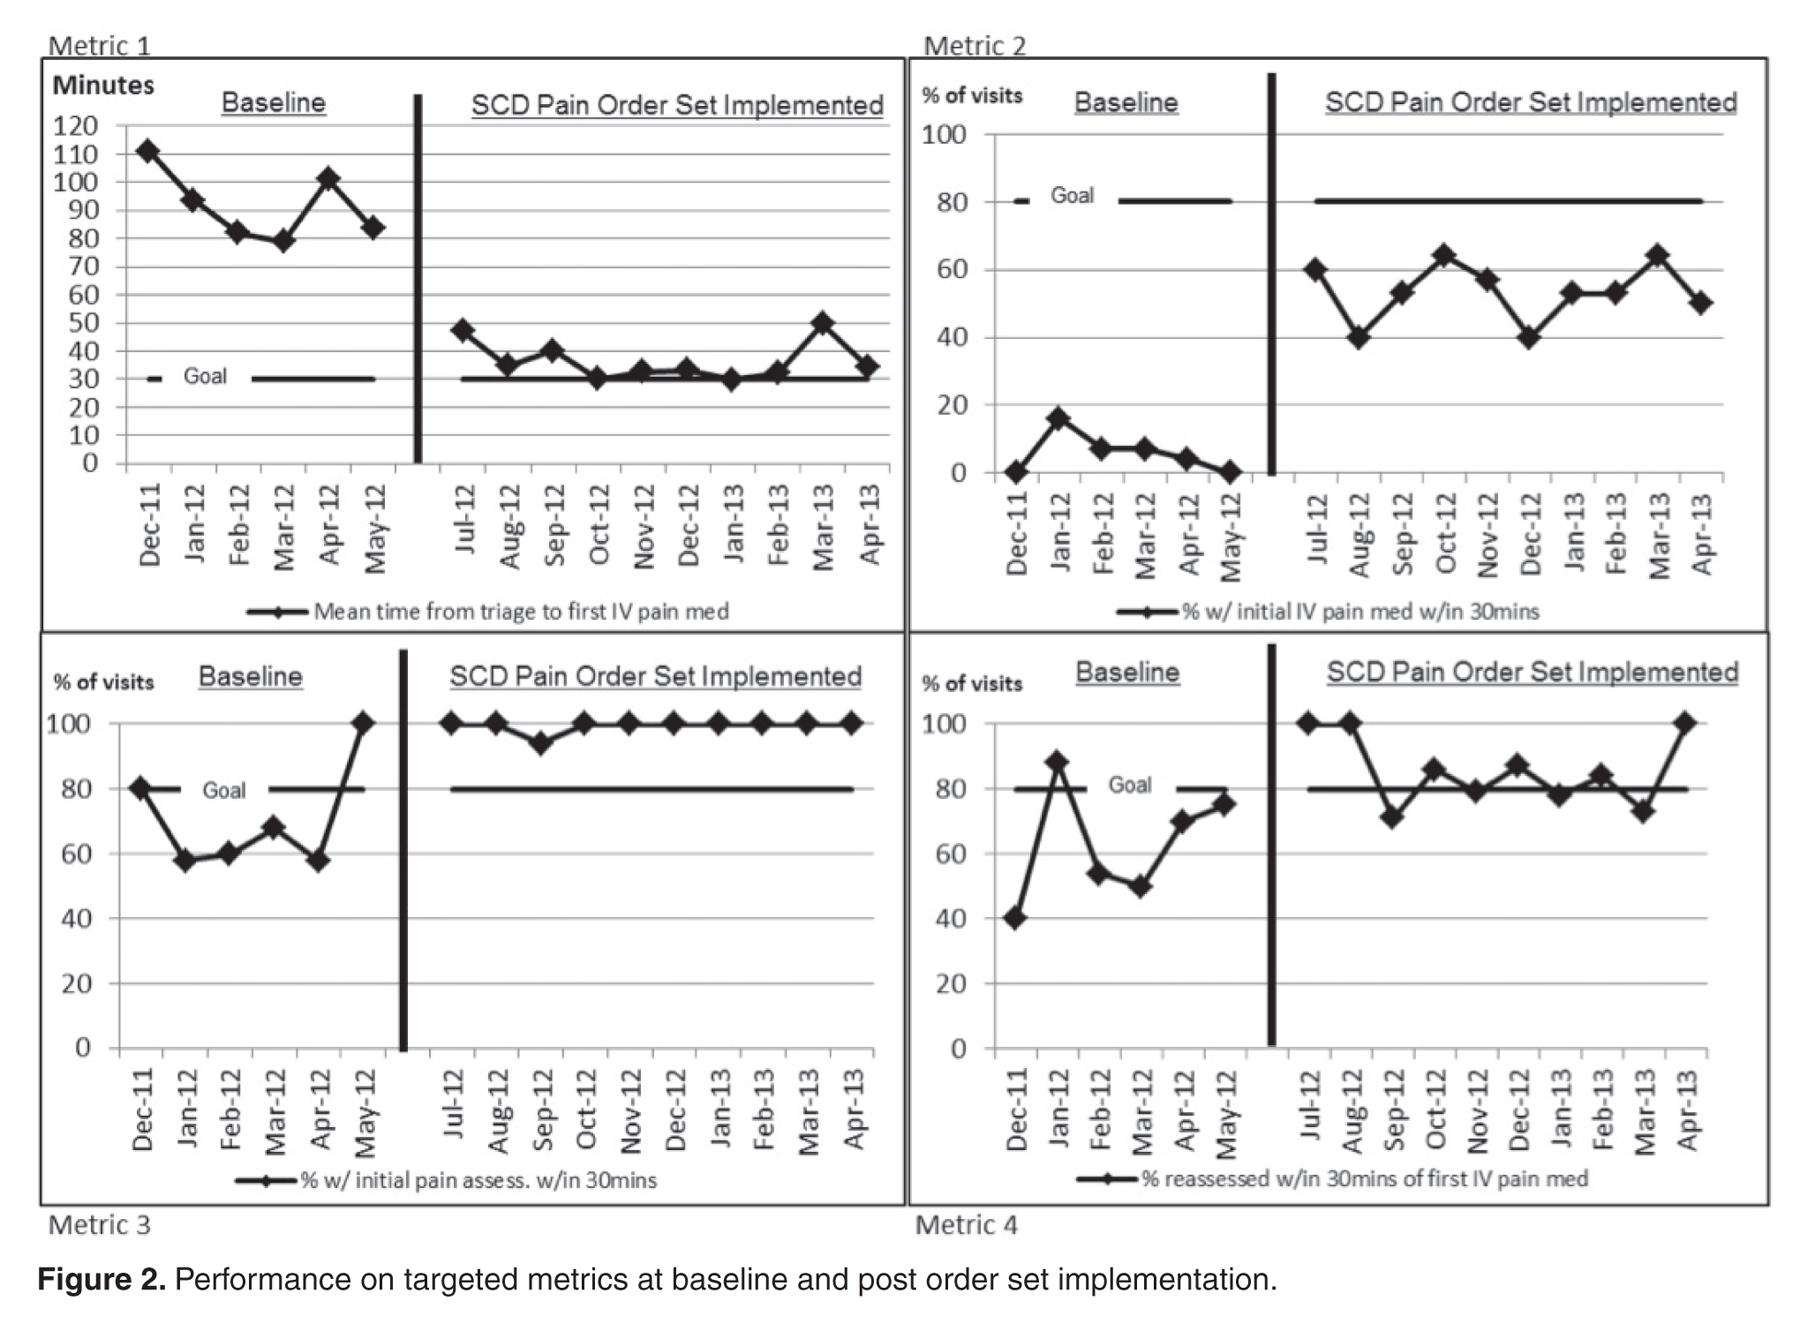
It can be seen in Figure 2 that staff performance on 3 of the 4 metrics (with the exception of initial analgesic within 30 minutes of triage) began to improve prior to implementing the order set. The mean length of ED stays decreased by 30 minutes, from a mean of 5.2 hours down to 4.7 hours (P < 0.05, Table). There was no significant change in the percentage of patients admitted to the inpatient unit.
We performed secondary analyses to determine if performance on our first metric, mean time from triage to first analgesic dose, was associated with any improvement on the third pain assessment for the patients enrolled post order set implementation. Looking at the first ED visit during the study period for the 78 unique patients, we found significant decreases in mean pain scores from the first to the second, from the second to the third, and from the first to the third assessment (P < 0.01). The mean pain scores were 8.3 ± 1.8, 5.9 ± 2.8, and 5.1 ± 3.0 on initial, second and third assessments, respectively. A multivariable model controlling for gender, hemoglobin type, number of ED visits and time to first pain medication showed that only the score at the second pain assessment (β = 0.88 ± 0.08, P < 0.001) was a significant predictor of the score at the third pain assessment.
Discussion
We demonstrated that a QI initiative to improve acute pain management resulted in more timely assessment and treatment of pain in pediatric patients with SCD. Significant improvements from baseline were achieved and sustained over a 10-month period in all 4 targeted metrics. We consistently exceeded our goal of having 80% of patients assessed within 30 minutes of triage, and our mean time to first pain medication (35.2 ± 22.8 minutes) came close to our goal of 30 minutes from triage. While we also achieved our goal to have 80% of patients re-assessed within 30 minutes after having received their first dose of an analgesic, we fell short in the percent who received their initial pain medication within 30 minutes of triage (52.7% versus goal of 80%). Although the length of stay in the ED decreased, no change was observed in the percentage of patients who required admission to the inpatient unit. A secondary analysis showed that mean pain scores significantly decreased over the course of the ED visit, from severe to moderate intensity.
The improvements that we observed began prior to implementation of the order set. We recognize that simply raising awareness and educating staff about the importance of timely and appropriate assessment and treatment of acute sickle cell related pain in the ED might be a potential confounder of our results. However, changes were sustained for 10 months post order set implementation and beyond, with no evidence that the performance on the target metrics is drifting back to baseline levels. Education and awareness-raising alone rarely result in sustained application of clinical practice guidelines [22]. We collaborated with NICHQ and other HRSA-WISCH grantees to systematically implement improvement science to ensure that the changes that we observed were indeed improvements and would be sustained [23] by first changing the system of care in the ED by introducing a standard order set [24,25]. We put a system into place to track use of the order set and to work with providers almost immediately if deviations were observed, to understand and overcome any barriers to the order set implementation. Systems in the ED and in the sickle cell center were aligned with the hospital’s QI initiatives [23].
Another strategy that we used to insure that the changes we observed would be sustained was to create a multidisciplinary team to build knowledge, skills, and new practices, including learning from other WISCH grantees and the NICHQ coordinating center [23]. We modified and adapted the intervention to our specific context [25]; although the outline of the order set was influenced by our WISCH colleagues, the final order set was structured to be consistent with other protocols within our institution. Finally, we included consumer input in the design of the project from the outset.
A previous study of a multi-institutional QI initiative aimed at improving acute SCD pain management for adult patients in the ED was unable to demonstrate an improvement in time to administration of initial analgesic [26]. Our study with pediatric patients was able to demonstrate a clinically meaningful decrease in the time to administration of first parenteral analgesic. The factors that account for the discrepant findings between these studies are likely multifactorial. Age (ie, pediatric vs. adult patients) may have played a role given that IV access may become increasingly difficult as patients with SCD age [26]. Education for providers should include the importance of alternative methods of administration of opioids, including subcutaneous and intranasal routes, to avoid delays when IV access is difficult. It is possible that negative provider attitudes converge with the documented increase in patient visits during the young adult years [27]. This may set up a challenging feedback loop wherein these vulnerable young adults are faced with greater stigma and consequently receive lower quality care, even when there is an attempt to carry out a standardized protocol.
We did not find that the QI intervention resulted in decreased admissions to the inpatient unit, with 68% of visits resulting in admission. In a recent pediatric SCD study, hospital admissions for pain control accounted for 78% of all admissions and 70% of readmissions within 30 days [28]. The investigators found that use of a SCD analgesic protocol including patient-controlled analgesia (PCA) improved quality of care as well as hospital readmission rates within 30 days (from 28% to 11%). Our ED QI protocol focused on only the first 90 minutes of the visit for pain. Our team has discussed the potential for starting the PCA in the ED and we should build on our success to focus on specific care that patients receive beyond their initial presentation. Further, we introduced pain action planning into outpatient care and need to continue to improve positive patient self-management strategies to ensure more seamless transition of pain management between home, ED, and inpatient settings.
Several valuable lessons were learned over the course of the ED QI initiative. Previous researchers [28] have emphasized the importance of coupling provider education with standardized order sets in efforts to improve the care of patients with SCD. Although we did not offer monthly formal education to our providers, the immediate follow-up when there were protocol deviations most likely served as teaching moments. These teaching moments also surfaced when some ED and hematology providers expressed concerns about the risk for oversedation with the rapid reassessment of pain and re-dosing of pain medications. Although rare, some parents also expressed that their child was being treated too vigorously with opioids. Our project highlighted the element of stigma that still accompanies the use of opioids for SCD pain management.
The project could not have been undertaken were it not for a small but determined multidisciplinary team of individuals who were personally invested in seeing the project come to fruition. The identification of physician and nurse champions who were enthusiastic about the project, invested in its conduct, and committed to its success was a cornerstone of the project’s success. These champions played an essential role in engaging staff interest in the project and oversaw the practicalities of implementing a new protocol in the ED. A spirit of collaboration, teamwork, and good communication between all involved parties was also critical. At the same time, we incorporated input from the treating ED and hematology clinicians using PDSA cycles as we were refining our protocol. We believe that our process enhanced buy-in from participating providers and clarified any issues that needed to be addressed in our setting, resulting in accelerated and sustained quality improvement.
Limitations
Although protocol-driven interventions are designed to provide a certain degree of uniformity of care, the protocol was not designed nor utilized in such a way that it superseded the best medical judgment of the treating clinicians. Deviations from the protocol were permissible when they were felt to be in the patient’s best interest. The study did not control for confounding variables such as disease severity, how long the patient had been in pain prior to coming to the ED, nor did we assess therapeutic interventions the patient had utilized at home prior to seeking out care in the ED. All of these factors could affect how well a patient might respond to treatment. We believe that sharing baseline data and monthly progress via run charts (graphs of data over time) with ED and sickle cell center staff and with consumer representatives enhanced the pace and focus of the project [23]. We had a dedicated person managing our data in real time through our HRSA funding, thus the project might not be generalizable to other institutions that do not have such staffing or access to the technology to allow project progress to be closely monitored by stakeholders.
Future Directions
With the goal of further reducing the time to administration of first analgesic dose in the ED setting, intranasal fentanyl will be utilized in our ED as the initial drug of choice for patients who do not object to or have a contraindication to its use. Collection of data from patients and family members is being undertaken to assess consumer satisfaction with the ED QI initiative. Recognizing that the ED management of acute pain addresses only one aspect of sickle cell pain, we are looking at ways to more comprehensively address pain. Individualized outpatient pain management plans are being created and patients and families are being encouraged and empowered to become active partners with their sickle cell providers in their own care. Although our initial efforts have focused on our pediatric patients, an additional aim of our project is to broaden the scope of our ED QI initiative to include community hospitals in the region that serve adult patients with SCD.
Conclusion
Implementation of a QI initiative in the ED has led to expeditious care for pediatric patients with SCD presenting with VOE. A multidisciplinary approach, ongoing staff education, and commitment to the initiative have been necessary to sustain the improvements. Our success can provide a template for other QI initiatives in the ED that translate to improved patient care for other diseases. A QI framework provided us with unique challenges but also invaluable lessons as we addressed our objective to improve outcomes for patients with SCD across the life course.
Acknowledgments: The authors wish to thank Theresa Freitas, RN, Lisa Hale, PNP, Carolyn Hoppe, MD, Ileana Mendez, RN, Helen Mitchell, Mary Rutherford, MD, Augusta Saulys, MD and the Children’s Hospital & Research Center Oakland Emergency Medicine Department and Sickle Cell Center for their support.
Corresponding author: Marsha Treadwell, PhD, Children’s Hospital & Research Center Oakland, 747 52nd St, Oakland, CA 94609, mtreadwell@mail.cho.org.
Funding/support: This research was conducted as part of the National Initiative for Children’s Healthcare Quality (NICHQ) Working to Improve Sickle Cell Healthcare (WISCH) project. Further support came from a grant from the Health Resources and Services Administration Sickle Cell Disease Treatment Demonstration Project Grant No. U1EMC16492 and from NIH CTSA grant UL1 RR024131. The views expressed in this publication do not necessarily reflect the views of WISCH, NICHQ, or HRSA.
1. Yusuf HR, Atrash HK, Grosse SD, et al. Emergency department visits made by patients with sickle cell disease: a descriptive study, 1999-2007. Am J Preventive Med 2010;38 (4 Suppl):S536–41.
2. Benjamin L, Dampier C, Jacox A, et al. Guideline for the management of acute and chronic pain in sickle cell disease. American Pain Society; 1999.
3. Rees DC, Olujohungbe AD, Parker NE, et al. Guidelines for the management of the acute painful crisis in sickle cell disease. Br J Haematology 2003;120:744–52.
4. Solomon LR. Pain management in adults with sickle cell disease in a medical center emergency department. J Nat Med Assoc 2010;102:1025–32.
5. Lazio MP, Costello HH, Courtney DM, et al. A comparison of analgesic management for emergency department patients with sickle cell disease and renal colic. Clin J Pain 2010;26:199–205.
6. Shenoi R, Ma L, Syblik D, Yusuf S. Emergency department crowding and analgesic delay in pediatric sickle cell pain crises. Ped Emerg Care 2011;27:911–7.
7. Tanabe P, Artz N, Mark Courtney D, et al. Adult emergency department patients with sickle cell pain crisis: a learning collaborative model to improve analgesic management. Acad Emerg Med 2010;17:399–407.
8. Zempsky WT. Evaluation and treatment of sickle cell pain in the emergency department: paths to a better future. Clin Ped Emerg Med 2010;11:265–73.
9. Haywood C Jr, Tanabe P, Naik R, et al. The impact of race and disease on sickle cell patient wait times in the emergency department. Am J Emerg Med 2013;31:651–6.
10. Solomon LR. Treatment and prevention of pain due to vaso-occlusive crises in adults with sickle cell disease: an educational void. Blood 2008;111:997–1003.
11. Ballas SK. New era dawns on sickle cell pain. Blood 2010;116:311–2.
12. Haywood C Jr, Lanzkron S, Ratanawongsa N, et al. The association of provider communication with trust among adults with sickle cell disease. J Gen Intern Med 2010;25:543–8.
13. Zempsky WT. Treatment of sickle cell pain: fostering trust and justice. JAMA 2009;302:2479–80.
14. Elander J, Lusher J, Bevan D, Telfer P. Pain management and symptoms of substance dependence among patients with sickle cell disease. Soc Sci Med 2003;57:1683–96.
15. Elander J, Lusher J, Bevan D, et al. Understanding the causes of problematic pain management in sickle cell disease: evidence that pseudoaddiction plays a more important role than genuine analgesic dependence. J Pain Sympt Manag 2004;27:156–69.
16. Smith WR, Penberthy LT, Bovbjerg VE, et al. Daily assessment of pain in adults with sickle cell disease. Ann Intern Med 2008;148:94–101.
17. Harris A, Parker N, Baker C. Adults with sickle cell. Psychol Health Med 1998;3:171–9.
18. Jenerette CM, Brewer C. Health-related stigma in young adults with sickle cell disease. J Nat Med Assoc 2010;102:1050–5.
19. Maxwell K, Streetly A, Bevan D. Experiences of hospital care and treatment seeking for pain from sickle cell disease: qualitative study. BMJ 1999;318:1585–90.
20. Oyeku SO, Wang CJ, Scoville R, et al. Hemoglobinopathy Learning Collaborative: using quality improvement (QI) to achieve equity in health care quality, coordination, and outcomes for sickle cell disease. J Health Care Poor Underserved 2012;23(3 Suppl):34–48.
21. Wang CJ, Kavanagh PL, Little AA, et al. Quality-of-care indicators for children with sickle cell disease. Pediatrics 2011;128:484–93.
22. Mansouri M, Lockyer J. A meta-analysis of continuing medical education effectiveness. J Contin Ed Health Prof 2007;27:6–15.
23. The breakthrough series: IHI’s collaborative model for achieving breakthrough improvement. Boston: Institute for Healthcare Improvement; 2003.
24. Berwick DM. Improvement, trust, and the healthcare workforce. Qual Safety Health Care 2003;12:448–52.
25. Hovlid E, Bukve O, Haug K, et al. Sustainability of healthcare improvement: what can we learn from learning theory? BMC Health Serv Res 2012;12:235.
26. Tanabe P, Hafner JW, Martinovich Z, Artz N. Adult emergency department patients with sickle cell pain crisis: results from a quality improvement learning collaborative model to improve analgesic management. Acad Emerg Med 2012;19:430–8.
27. Brousseau DC, Owens PL, Mosso AL, et al. Acute care utilization and rehospitalizations for sickle cell disease. JAMA 2010;303:1288–94.
28. Frei-Jones MJ, Field JJ, DeBaun MR. Multi-modal intervention and prospective implementation of standardized sickle cell pain admission orders reduces 30-day readmission rate. Pediatr Blood Cancer 2009;53:401–5.
From the Children’s Hospital & Research Center Oakland, Oakland, CA.
Abstract
- Objective: To determine whether a quality improvement (QI) initiative would result in more timely assessment and treatment of acute sickle cell–related pain for pediatric patients with sickle cell disease (SCD) treated in the emergency department (ED).
- Methods: We created and implemented a protocol for SCD pain management in the ED with the goals of improving (1) mean time from triage to first analgesic dose; (2) percentage of patients that received their first analgesic dose within 30 minutes of triage, and (3) percentage of patients who had pain assessment performed within 30 minutes of triage and who were re-assessed within 30 minutes after the first analgesic dose.
- Results: Significant improvements were achieved between baseline (55 patient visits) and post order set implementation (165 visits) in time from triage to administration of first analgesic (decreased from 89.9 ± 50.5 to 35.2 ± 22.8 minutes, P < 0.001); percentage of patient visits receiving pain medications within 30 minutes of triage (from 7% to 53%, P < 0.001); percentage of patient visits assessed within 30 minutes of triage (from 64% to 99.4%, P < 0.001); and percentage of patient visits re-assessed within 30 minutes of initial analgesic (from 54% to 86%, P < 0.001).
- Conclusions: Implementation of a QI initiative in the ED led to expeditious care for pediatric patients with SCD presenting with pain. A QI framework provided us with unique challenges but also invaluable lessons as we address our objective of decreasing the quality gap in SCD medical care.
Pain is the leading cause of emergency department (ED) visits for patients with sickle cell disease (SCD) [1]. In the United States, 78% of the nearly 200,000 annual ED visits for SCD are for a complaint of pain [1]. Guidelines for the management of sickle cell vaso-occlusive pain episodes (VOE) suggest prompt initiation of parenteral opioids, use of effective opioid doses, and repeat opioid doses at frequent intervals [2–4]. Adherence to guidelines is poor. Both pediatric and adult patients with SCD experience delays in the initiation of analgesics and are routinely undertreated with respect to opioid dosing [5–8]. Even after controlling for race, the delays in time to analgesic administration experienced by patients with SCD exceed the delays encountered by patients who present to the ED with other types of pain [5,9]. These disparities warrant efforts designed to improve the delivery of quality care to patients with SCD.
Barriers to rapid and appropriate care of VOE in the ED are multifactorial and include systems-based limitations, such as acuity of the ED census, staffing limitations (eg, nurse-to-patient ratios), and facility limitations (eg, room availability) [6]. Provider-based limitations may include lack of awareness of available guidelines [10]. Biases and misunderstandings amongst providers about sickle cell pain and adequate medication dosing may also play a role [11–13]. These provider biases often lead to undertreatment of the pain, which in turn can lead to pseudoaddiction (drug-seeking behavior due to inadequate treatment) and a cycle of increased ED and inpatient utilization [14,15].
Patient-specific barriers to effective ED management of pain are equally complex. Previous negative experiences in the ED can lead patients and families to delay seeking care or avoid the ED altogether despite severe VOE pain [16]. Patients report frustration with the lack of consideration that they receive for their reports of pain, perceived insensitivity of hospital staff, inadequate analgesic administration, staff preoccupation with concerns of drug addiction, and an overall lack of respect and trust [17–19]. Patients also perceive a lack of knowledge of SCD and its treatments on the part of ED staff [7]. Other barriers to effective management are technical in nature, such as difficulty in establishing timely intravenous (IV) access.
Gaps and variations in quality of care contribute to poor outcomes for patients with SCD [20,21]. To help address these inequities, the Working to Improve Sickle Cell Healthcare (WISCH) project began in 2010 to improve care and outcomes for patients with SCD. WISCH is a collaborative quality improvement (QI) project funded by the Health Resources and Services Administration (HRSA) that has the goal to use improvement science to improve outcomes for patients with SCD across the life course (Ed note: see Editorial by Oyeku et al in this issue). As one of the HRSA-WISCH grantee networks, we undertook a QI project designed to decrease the quality gap in SCD medical care by creating and implementing a protocol for ED pain management for pediatric patients. Goals of the project were to improve the timely and appropriate assessment and treatment of acute VOE in the ED.
Methods
Setting
This ED QI initiative was implemented at Children’s Hospital & Research Center Oakland, an urban free-standing pediatric hospital that serves a demographically diverse population. The hospital ED sees over 45,000 visits per year, with 250 visits per year for VOE. Residents in pediatrics, family medicine, and emergency medicine staff the ED. All attending physicians are subspecialists in pediatric emergency medicine. Study procedures were approved by the hospital’s institutional review board.
Intervention
A multidisciplinary team consisting of ED staff and sickle cell center staff drafted a nursing-driven protocol for the assessment and management of acute pain associated with VOE, incorporating elements from a protocol in use by another WISCH collaborative member. The protocol called for the immediate triage and assessment of all patients with SCD who presented with moderate to severe pain suggestive of VOE. Moderate to severe pain was defined as a pain score of ≥ 5 on a numeric scale of 0 to 10, where 0 = no pain and 10 = the worst pain imaginable. Exclusion criteria included a chief complaint of pain not considered secondary to VOE (eg, trauma, fracture). Patients were also excluded if they had been transferred from another facility. The protocol called for IV pain medication to be administered within 10 minutes of the patient being roomed, with re-evaluation at 20-minute intervals and re-dosing of pain medication based on the patient’s subsequent pain rating.
Measures
We selected performance measures from the bank developed by the WISCH team to track improvement and evaluate progress. These performance measures included (1) mean time from triage to first analgesic dose, (2) percentage of patients that received their first dose of analgesic within 30 minutes of triage, (3) percentage of patients who had a pain assessment performed within 30 minutes of triage, and (4) percentage of patients re-assessed within 30 minutes after the first dose of analgesic had been administered. Our aims were to have 80% of patients assessed and given pain medications within 30 minutes of triage, and to have 80% of patients re-assessed within 30 minutes after having received their first dose of an analgesic, within 12 months of implementing our intervention.
Data Collection and Analysis
The WISCH project coordinator reviewed records of visits to the ED for a baseline period of 6 months and post-order set implementaton. Demographic data (age, gender), clinical data (hemoglobin type), pain scores, utilization data (number of ED visits during the study period), and data pertaining to the metrics chosen from the WISCH measurement bank were extracted from each eligible patient’s ED chart after the visit was completed. If patients were admitted, their length of hospitalization was extracted from their inpatient medical record.
All biostatistical analyses were conducted using Stata 9.2 (StataCorp, College Station, TX). Descriptive statistics computed at 2 time-points (pre and post order set implementation) were utilized to examine means, standard deviations and percentages. The 2 time-points were initially compared at the visit level of measurement, using Student’s t tests corrected for unequal variances where necessary for continuous variables and chi-square analyses for categorical variables, to evaluate if there was an improvement in timely triage, assessment, and treatment of acute VOE pain for all ED visits pre and post order set implementation. To account for trends and possible correlations across the months post order set implementation, we ran a mixed linear model with repeated measures over time to compare visits during all months post order set implementation with the baseline months, for metric 1, time from triage to first pain medication. If significant differences were found, we used Dunnett’s method of multiple comparisons to determine which months differed from baseline. For metrics 2 through 4, we ran linear models with a binary outcome, a logit link function and using general estimating equations to determine trends and to account for correlations over time.
Secondary analyses were conducted to evaluate whether mean pain scores were significantly different over the course of the ED visit for the 78 unique patients seen post order set implementation. A multivariable mixed linear model, for the outcome of the third pain score, was used to assess the associations with prior scores and to control for potential covariates (age, gender, number of ED visits, hemoglobin type) that were determined in advance. A statistical significance level of 0.05 was used for all tests.
Results
Baseline data were collected from December 2011 to May 2012. The protocol was implemented in July 2012 and was utilized during 165 ED visits (91% of eligible visits) through April 2013. There were no statistically significant differences in demographic or clinical characteristics between the 55 patients whose charts were reviewed prior to implementing the order set and the 78 unique patients treated thereafter. Pre order set implementation, the mean age was 14.6 ± 6.4 years; 60% were female and the primary diagnosis was HgbSS disease (61.8% of diagnoses). Post order set implementation, the mean age was 16.0 ± 8.0 years; 51.3% were female and the primary diagnosis was HgbSS disease (61.5% of diagnoses). The mean number of visits was 1.5 visits per patient with a range of 1–8 visits, both pre and post order set implementation. Thirty-one patients had ED visits at both time periods.
It can be seen in Figure 2 that staff performance on 3 of the 4 metrics (with the exception of initial analgesic within 30 minutes of triage) began to improve prior to implementing the order set. The mean length of ED stays decreased by 30 minutes, from a mean of 5.2 hours down to 4.7 hours (P < 0.05, Table). There was no significant change in the percentage of patients admitted to the inpatient unit.
We performed secondary analyses to determine if performance on our first metric, mean time from triage to first analgesic dose, was associated with any improvement on the third pain assessment for the patients enrolled post order set implementation. Looking at the first ED visit during the study period for the 78 unique patients, we found significant decreases in mean pain scores from the first to the second, from the second to the third, and from the first to the third assessment (P < 0.01). The mean pain scores were 8.3 ± 1.8, 5.9 ± 2.8, and 5.1 ± 3.0 on initial, second and third assessments, respectively. A multivariable model controlling for gender, hemoglobin type, number of ED visits and time to first pain medication showed that only the score at the second pain assessment (β = 0.88 ± 0.08, P < 0.001) was a significant predictor of the score at the third pain assessment.
Discussion
We demonstrated that a QI initiative to improve acute pain management resulted in more timely assessment and treatment of pain in pediatric patients with SCD. Significant improvements from baseline were achieved and sustained over a 10-month period in all 4 targeted metrics. We consistently exceeded our goal of having 80% of patients assessed within 30 minutes of triage, and our mean time to first pain medication (35.2 ± 22.8 minutes) came close to our goal of 30 minutes from triage. While we also achieved our goal to have 80% of patients re-assessed within 30 minutes after having received their first dose of an analgesic, we fell short in the percent who received their initial pain medication within 30 minutes of triage (52.7% versus goal of 80%). Although the length of stay in the ED decreased, no change was observed in the percentage of patients who required admission to the inpatient unit. A secondary analysis showed that mean pain scores significantly decreased over the course of the ED visit, from severe to moderate intensity.
The improvements that we observed began prior to implementation of the order set. We recognize that simply raising awareness and educating staff about the importance of timely and appropriate assessment and treatment of acute sickle cell related pain in the ED might be a potential confounder of our results. However, changes were sustained for 10 months post order set implementation and beyond, with no evidence that the performance on the target metrics is drifting back to baseline levels. Education and awareness-raising alone rarely result in sustained application of clinical practice guidelines [22]. We collaborated with NICHQ and other HRSA-WISCH grantees to systematically implement improvement science to ensure that the changes that we observed were indeed improvements and would be sustained [23] by first changing the system of care in the ED by introducing a standard order set [24,25]. We put a system into place to track use of the order set and to work with providers almost immediately if deviations were observed, to understand and overcome any barriers to the order set implementation. Systems in the ED and in the sickle cell center were aligned with the hospital’s QI initiatives [23].
Another strategy that we used to insure that the changes we observed would be sustained was to create a multidisciplinary team to build knowledge, skills, and new practices, including learning from other WISCH grantees and the NICHQ coordinating center [23]. We modified and adapted the intervention to our specific context [25]; although the outline of the order set was influenced by our WISCH colleagues, the final order set was structured to be consistent with other protocols within our institution. Finally, we included consumer input in the design of the project from the outset.
A previous study of a multi-institutional QI initiative aimed at improving acute SCD pain management for adult patients in the ED was unable to demonstrate an improvement in time to administration of initial analgesic [26]. Our study with pediatric patients was able to demonstrate a clinically meaningful decrease in the time to administration of first parenteral analgesic. The factors that account for the discrepant findings between these studies are likely multifactorial. Age (ie, pediatric vs. adult patients) may have played a role given that IV access may become increasingly difficult as patients with SCD age [26]. Education for providers should include the importance of alternative methods of administration of opioids, including subcutaneous and intranasal routes, to avoid delays when IV access is difficult. It is possible that negative provider attitudes converge with the documented increase in patient visits during the young adult years [27]. This may set up a challenging feedback loop wherein these vulnerable young adults are faced with greater stigma and consequently receive lower quality care, even when there is an attempt to carry out a standardized protocol.
We did not find that the QI intervention resulted in decreased admissions to the inpatient unit, with 68% of visits resulting in admission. In a recent pediatric SCD study, hospital admissions for pain control accounted for 78% of all admissions and 70% of readmissions within 30 days [28]. The investigators found that use of a SCD analgesic protocol including patient-controlled analgesia (PCA) improved quality of care as well as hospital readmission rates within 30 days (from 28% to 11%). Our ED QI protocol focused on only the first 90 minutes of the visit for pain. Our team has discussed the potential for starting the PCA in the ED and we should build on our success to focus on specific care that patients receive beyond their initial presentation. Further, we introduced pain action planning into outpatient care and need to continue to improve positive patient self-management strategies to ensure more seamless transition of pain management between home, ED, and inpatient settings.
Several valuable lessons were learned over the course of the ED QI initiative. Previous researchers [28] have emphasized the importance of coupling provider education with standardized order sets in efforts to improve the care of patients with SCD. Although we did not offer monthly formal education to our providers, the immediate follow-up when there were protocol deviations most likely served as teaching moments. These teaching moments also surfaced when some ED and hematology providers expressed concerns about the risk for oversedation with the rapid reassessment of pain and re-dosing of pain medications. Although rare, some parents also expressed that their child was being treated too vigorously with opioids. Our project highlighted the element of stigma that still accompanies the use of opioids for SCD pain management.
The project could not have been undertaken were it not for a small but determined multidisciplinary team of individuals who were personally invested in seeing the project come to fruition. The identification of physician and nurse champions who were enthusiastic about the project, invested in its conduct, and committed to its success was a cornerstone of the project’s success. These champions played an essential role in engaging staff interest in the project and oversaw the practicalities of implementing a new protocol in the ED. A spirit of collaboration, teamwork, and good communication between all involved parties was also critical. At the same time, we incorporated input from the treating ED and hematology clinicians using PDSA cycles as we were refining our protocol. We believe that our process enhanced buy-in from participating providers and clarified any issues that needed to be addressed in our setting, resulting in accelerated and sustained quality improvement.
Limitations
Although protocol-driven interventions are designed to provide a certain degree of uniformity of care, the protocol was not designed nor utilized in such a way that it superseded the best medical judgment of the treating clinicians. Deviations from the protocol were permissible when they were felt to be in the patient’s best interest. The study did not control for confounding variables such as disease severity, how long the patient had been in pain prior to coming to the ED, nor did we assess therapeutic interventions the patient had utilized at home prior to seeking out care in the ED. All of these factors could affect how well a patient might respond to treatment. We believe that sharing baseline data and monthly progress via run charts (graphs of data over time) with ED and sickle cell center staff and with consumer representatives enhanced the pace and focus of the project [23]. We had a dedicated person managing our data in real time through our HRSA funding, thus the project might not be generalizable to other institutions that do not have such staffing or access to the technology to allow project progress to be closely monitored by stakeholders.
Future Directions
With the goal of further reducing the time to administration of first analgesic dose in the ED setting, intranasal fentanyl will be utilized in our ED as the initial drug of choice for patients who do not object to or have a contraindication to its use. Collection of data from patients and family members is being undertaken to assess consumer satisfaction with the ED QI initiative. Recognizing that the ED management of acute pain addresses only one aspect of sickle cell pain, we are looking at ways to more comprehensively address pain. Individualized outpatient pain management plans are being created and patients and families are being encouraged and empowered to become active partners with their sickle cell providers in their own care. Although our initial efforts have focused on our pediatric patients, an additional aim of our project is to broaden the scope of our ED QI initiative to include community hospitals in the region that serve adult patients with SCD.
Conclusion
Implementation of a QI initiative in the ED has led to expeditious care for pediatric patients with SCD presenting with VOE. A multidisciplinary approach, ongoing staff education, and commitment to the initiative have been necessary to sustain the improvements. Our success can provide a template for other QI initiatives in the ED that translate to improved patient care for other diseases. A QI framework provided us with unique challenges but also invaluable lessons as we addressed our objective to improve outcomes for patients with SCD across the life course.
Acknowledgments: The authors wish to thank Theresa Freitas, RN, Lisa Hale, PNP, Carolyn Hoppe, MD, Ileana Mendez, RN, Helen Mitchell, Mary Rutherford, MD, Augusta Saulys, MD and the Children’s Hospital & Research Center Oakland Emergency Medicine Department and Sickle Cell Center for their support.
Corresponding author: Marsha Treadwell, PhD, Children’s Hospital & Research Center Oakland, 747 52nd St, Oakland, CA 94609, mtreadwell@mail.cho.org.
Funding/support: This research was conducted as part of the National Initiative for Children’s Healthcare Quality (NICHQ) Working to Improve Sickle Cell Healthcare (WISCH) project. Further support came from a grant from the Health Resources and Services Administration Sickle Cell Disease Treatment Demonstration Project Grant No. U1EMC16492 and from NIH CTSA grant UL1 RR024131. The views expressed in this publication do not necessarily reflect the views of WISCH, NICHQ, or HRSA.
1. Yusuf HR, Atrash HK, Grosse SD, et al. Emergency department visits made by patients with sickle cell disease: a descriptive study, 1999-2007. Am J Preventive Med 2010;38 (4 Suppl):S536–41.
2. Benjamin L, Dampier C, Jacox A, et al. Guideline for the management of acute and chronic pain in sickle cell disease. American Pain Society; 1999.
3. Rees DC, Olujohungbe AD, Parker NE, et al. Guidelines for the management of the acute painful crisis in sickle cell disease. Br J Haematology 2003;120:744–52.
4. Solomon LR. Pain management in adults with sickle cell disease in a medical center emergency department. J Nat Med Assoc 2010;102:1025–32.
5. Lazio MP, Costello HH, Courtney DM, et al. A comparison of analgesic management for emergency department patients with sickle cell disease and renal colic. Clin J Pain 2010;26:199–205.
6. Shenoi R, Ma L, Syblik D, Yusuf S. Emergency department crowding and analgesic delay in pediatric sickle cell pain crises. Ped Emerg Care 2011;27:911–7.
7. Tanabe P, Artz N, Mark Courtney D, et al. Adult emergency department patients with sickle cell pain crisis: a learning collaborative model to improve analgesic management. Acad Emerg Med 2010;17:399–407.
8. Zempsky WT. Evaluation and treatment of sickle cell pain in the emergency department: paths to a better future. Clin Ped Emerg Med 2010;11:265–73.
9. Haywood C Jr, Tanabe P, Naik R, et al. The impact of race and disease on sickle cell patient wait times in the emergency department. Am J Emerg Med 2013;31:651–6.
10. Solomon LR. Treatment and prevention of pain due to vaso-occlusive crises in adults with sickle cell disease: an educational void. Blood 2008;111:997–1003.
11. Ballas SK. New era dawns on sickle cell pain. Blood 2010;116:311–2.
12. Haywood C Jr, Lanzkron S, Ratanawongsa N, et al. The association of provider communication with trust among adults with sickle cell disease. J Gen Intern Med 2010;25:543–8.
13. Zempsky WT. Treatment of sickle cell pain: fostering trust and justice. JAMA 2009;302:2479–80.
14. Elander J, Lusher J, Bevan D, Telfer P. Pain management and symptoms of substance dependence among patients with sickle cell disease. Soc Sci Med 2003;57:1683–96.
15. Elander J, Lusher J, Bevan D, et al. Understanding the causes of problematic pain management in sickle cell disease: evidence that pseudoaddiction plays a more important role than genuine analgesic dependence. J Pain Sympt Manag 2004;27:156–69.
16. Smith WR, Penberthy LT, Bovbjerg VE, et al. Daily assessment of pain in adults with sickle cell disease. Ann Intern Med 2008;148:94–101.
17. Harris A, Parker N, Baker C. Adults with sickle cell. Psychol Health Med 1998;3:171–9.
18. Jenerette CM, Brewer C. Health-related stigma in young adults with sickle cell disease. J Nat Med Assoc 2010;102:1050–5.
19. Maxwell K, Streetly A, Bevan D. Experiences of hospital care and treatment seeking for pain from sickle cell disease: qualitative study. BMJ 1999;318:1585–90.
20. Oyeku SO, Wang CJ, Scoville R, et al. Hemoglobinopathy Learning Collaborative: using quality improvement (QI) to achieve equity in health care quality, coordination, and outcomes for sickle cell disease. J Health Care Poor Underserved 2012;23(3 Suppl):34–48.
21. Wang CJ, Kavanagh PL, Little AA, et al. Quality-of-care indicators for children with sickle cell disease. Pediatrics 2011;128:484–93.
22. Mansouri M, Lockyer J. A meta-analysis of continuing medical education effectiveness. J Contin Ed Health Prof 2007;27:6–15.
23. The breakthrough series: IHI’s collaborative model for achieving breakthrough improvement. Boston: Institute for Healthcare Improvement; 2003.
24. Berwick DM. Improvement, trust, and the healthcare workforce. Qual Safety Health Care 2003;12:448–52.
25. Hovlid E, Bukve O, Haug K, et al. Sustainability of healthcare improvement: what can we learn from learning theory? BMC Health Serv Res 2012;12:235.
26. Tanabe P, Hafner JW, Martinovich Z, Artz N. Adult emergency department patients with sickle cell pain crisis: results from a quality improvement learning collaborative model to improve analgesic management. Acad Emerg Med 2012;19:430–8.
27. Brousseau DC, Owens PL, Mosso AL, et al. Acute care utilization and rehospitalizations for sickle cell disease. JAMA 2010;303:1288–94.
28. Frei-Jones MJ, Field JJ, DeBaun MR. Multi-modal intervention and prospective implementation of standardized sickle cell pain admission orders reduces 30-day readmission rate. Pediatr Blood Cancer 2009;53:401–5.
Using Patient Navigators to Help Adults with Sickle Cell Disease Obtain a Primary Care Home
From the Colorado Sickle Cell Network, University of Colorado School of Medicine, Aurora, CO.
This article is the fifth in our Hemoglobinopathy Learning Collaborative series. See the related editorial by Oyeku et al in the February 2014 issue of JCOM. (—Ed.)
Abstract
- Objective: To describe the development and implementation of a patient navigation program to help individuals with sickle cell disease (SCD) overcome barriers to finding adult primary care.
- Methods: Six patient navigators were recruited and received training. A workgroup was formed to clarify goals and objectives and develop standard procedures. Navigators were instrumental in establishing a network of primary care offices that were willing to accept new patients with SCD. Navigators assisted patients in making calls to primary care offices and in some cases would attend appointments with them.
- Results: About two-thirds of patients who were referred to the navigator program for primary care follow-up attended an initial appointment with a new primary care provider.
- Conclusion: Patient navigation is a feasible and useful strategy to help individuals with SCD overcome barriers to receiving comprehensive care.
With advances in the management of sickle cell disease (SCD), adults with SCD are living longer [1,2]. Adequate care for individuals with SCD requires that they receive both specialized services and comprehensive primary care. A lack of comprehensive outpatient care can translate into suboptimal outcomes and increased reliance on the emergency room [3].
In the metropolitan area of Denver, specialty care for individuals with SCD is centralized and easily accessible at a tertiary academic medical center. However, we found that many adult patients treated in our specialty setting had not established care with an adult primary care provider (PCP) or had not been seen regularly by their PCP for ongoing preventive primary care services. Thus, they were not getting their comprehensive care needs met. Although support was available from community-based organizations to help them access certain resources (eg, directions to the food bank), patients reported difficulties in accessing the adult care health system, for example, securing appointments with PCPs and securing/maintaining insurance. No services existed to specifically help them navigate through the complexities of obtaining needed care.
Patient navigation is a strategy commonly used in cancer care settings [4–7] to to help patients overcome barriers in accessing the health care system. Patient navigators can not only facilitate improved health care access and quality for underserved populations through advocacy and care coordination, but they can also address the information needs of patients and assist in overcoming language and cultural barriers. Navigation has been proposed as a strategy to help reduce health disparities [8].
We developed a patient navigation program to address unmet needs of children and adults with SCD receving care in our clinics. In this paper we describe our program.
Patient Navigator Program
Setting
The SCD Treatment Demonstration Program was created in 2004 by the federal government to improve care and outcomes for persons with SCD [9]. As a grantee of this program, we developed the Colorado Sickle Cell Care Network (CSCCN) to care for scd patients in the Denver metropolitan and surrounding area. The CSCCN is a collaboration between the Colorado Sickle Cell Treatment and Research Center and the Division of General Internal Medicine and Department of Hematology at the University of Colorado Denver Anschutz Medical Campus, the Center for Cancer and Blood Disorders at Children’s Hospital Colorado, and 2 community-based organizations. With other grantees, we are participating in the Hemoglobinopathy Learning Collaborative, a collaborative of teams utilizing iterative cycles of testing to learn what changes can be made to improve care processes [10].
Navigators
We developed the patient navigator program to help patients overcome barriers to receiving comprehensive care in a primary care medical home. We hired 4 patient navigators to serve individuals living in or seeking resources in the Denver metropolitan area. Persons interested in being navigators were required to first qualify to be official hospital volunteers at the University of Colorado Hospital and Children’s Hospital Colorado, a process that involved attending an orientation and obtaining official facility badging. They received patient navigation training at the Harold P. Freeman Patient Navigation Institute in New York [11] as well as completed the Colorado Patient Navigator Training Program [12]. Navigators in training learned about the history of patient navigation, health promotion and communication models, motivational interviewing techniques, and systemic and individual barriers to care. All patient navigators received training in HIPAA and went through a volunteer credentialing process at the hospital; however they do not have access to patient’s medical records or the electronic health records.
The navigators are from various backgrounds, and 2 of our patient navigators are bilingual Spanish-English speakers, enhancing our ability to outreach to individuals whose preferred language is Spanish and who may otherwise not be able to access available resources. Some of our patient navigators are family members of individuals being treated for SCD and are able to provide a unique perspective that aids program development.
Once training for the initial group of navigators was completed, a patient navigation workgroup was created to clarify goals and objectives, develop standard procedures, and define navigator responsibilities. This workgroup included the CSCCN program staff, adult and pediatric hematology trained SCD specialists, and the pediatric coordinator. We used the Hemoglobinopathy Learning Collaborative process [10] to develop and refine a process map for referrals made for primary care. Process mapping was an iterative process with regular input from the navigators and other members of the patient navigation workgroup, as well as input from case managers and social workers when needed.
Process
Upon receiving a referral, navigators made contact with the patient within 1 business day and obtained preferred contact information. The navigator completed a patient intake form and needs assessment. Each patient referral was logged into a secure database. Most referrals were generated by our specialty health care providers, but as awareness of the program grew referrals also came from the community-based organizations as well as self-referrals from patients or caregivers. Most of the referrals (68%) were specifically for assistance in finding a primary care medical home. Other reasons patients were referred to the navigator program included needing assistance with housing, financial assistance, or insurance application questions.
Barriers Addressed
Patient navigators spent much of their time proactively seeking local sources of adult primary care for clients and in doing so established a network of primary care offices in the community that would be able and willing to accept new patients with SCD. This was accomplished through personal outreach and communication with stakeholders at the academic medical center and in the community, utilizing skills learned during patient navigation training and by sorting through vast informational resources available to the public. When feasible the navigators, accompanied by the project director and adult hematology specialist, personally visited sites of primary care in the community to help provide information about the CSCCN and establish a working relationship.
Our navigators would make calls together with the patient to make a PCP appointment and would remind them of upcoming PCP appointments. In some cases, navigators would attend appointments with the patient; in addition, they would help advocate for them when they had to go to the emergency department. If a patient missed a PCP appointment, the navigator followed up to find out why and how to secure another appointment. Navigators would follow-up every 10 days if a patient had not yet seen a PCP. As many of our patients did not understand why they needed to have a PCP when they had a specialist, the navigators educated patients on the importance of PCP care.
In additon, navigators helped our patients deal with insurance coverage problems, such as frequent insurance changes/insurance getting dropped. Some patients had low literacy or had difficulties in filling out disability or insurance forms properly. Navigators received training from state coordinators for Medicaid and SSI disability on filling out the respective forms, which can be confusing.
Our navigators were trained in motivational interviewing and used it to identify other barriers patients were facing. In trying to obtain proper care, our patients struggled with competing priorities (eg, food, shelter, child care). Because of the numerous challenges that our patients and families face, an important role for the patients navigators was creating a bridge to accessing social and community resources.
Outcomes
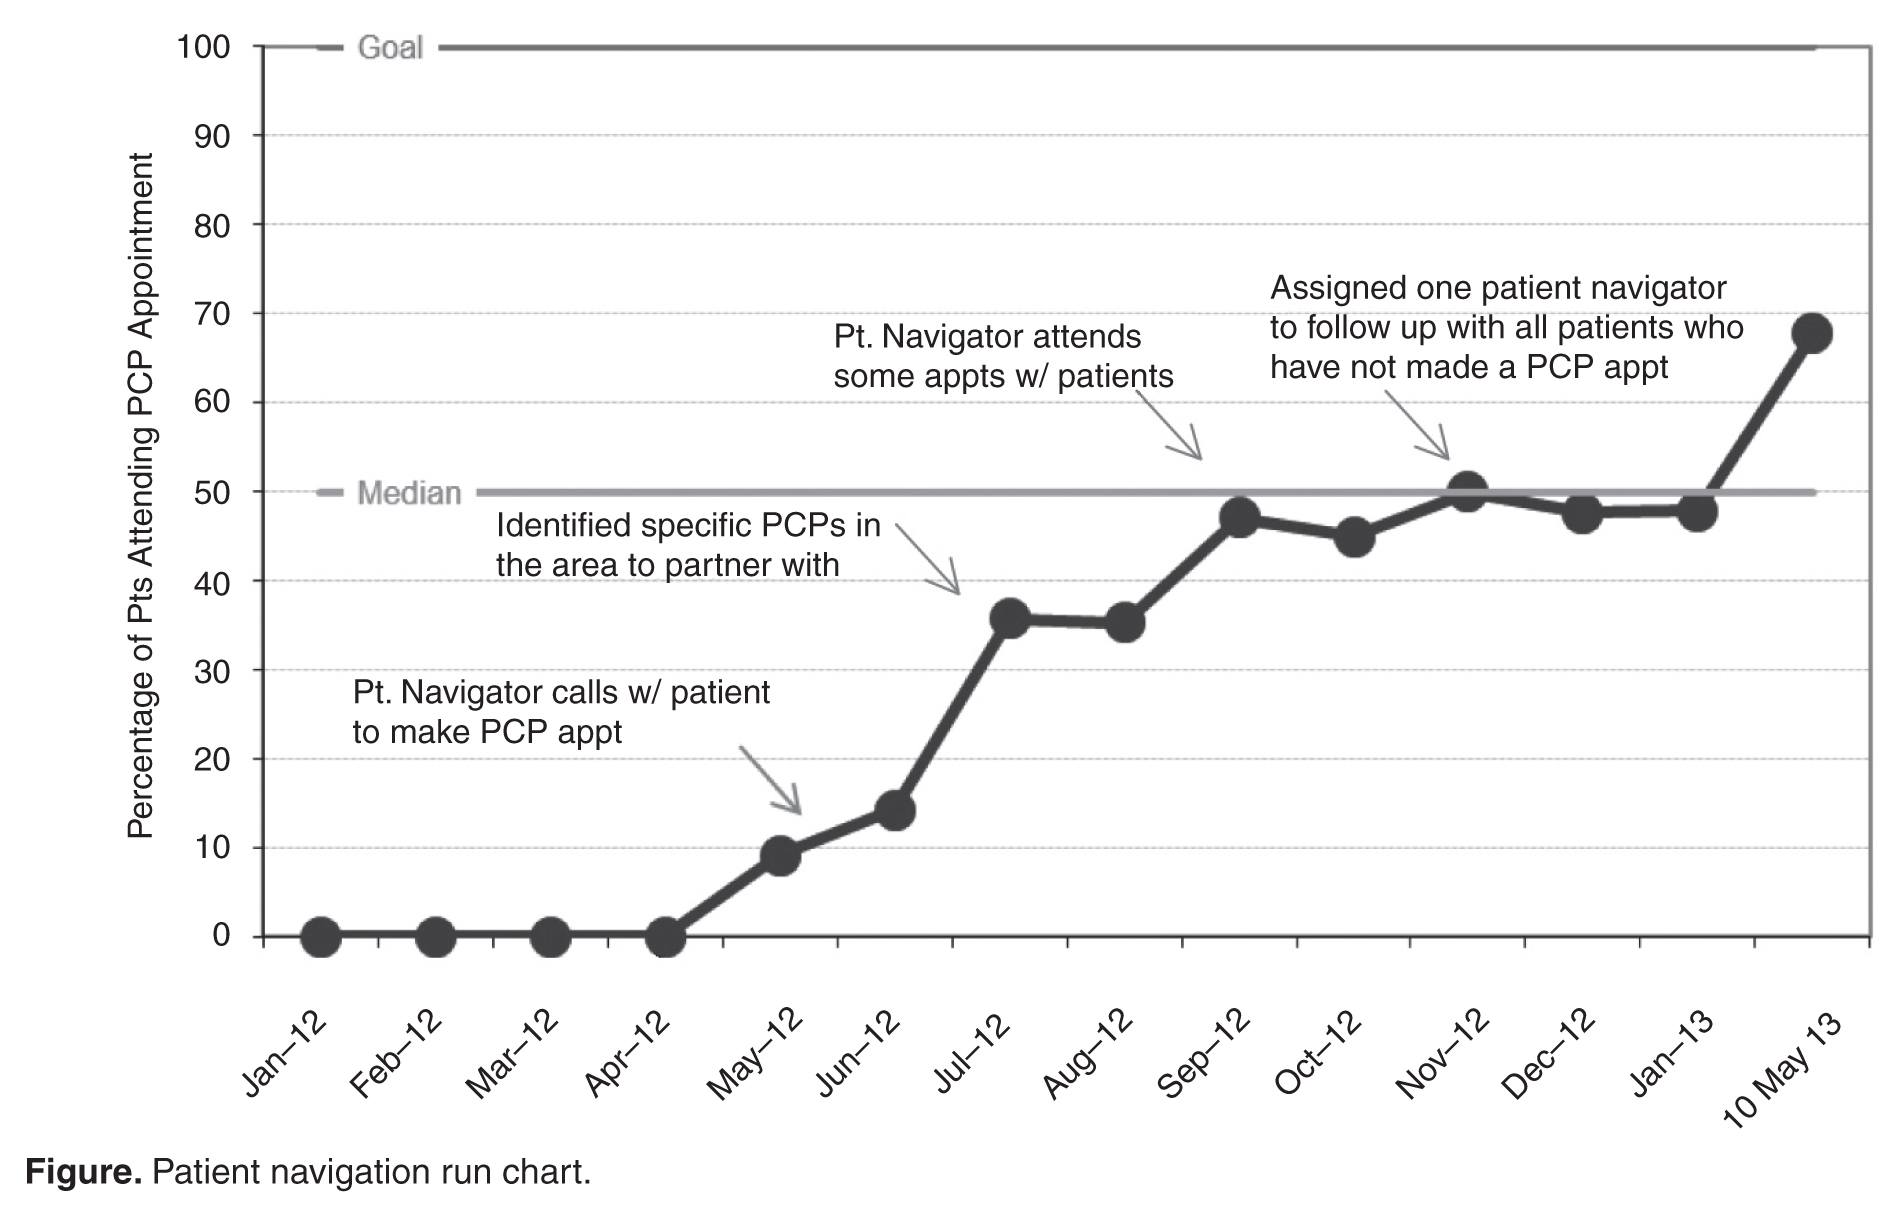
The help and support provided by the navigators is helpful in mitigating the mistrust our patients have about the health care system, in part due to unfavorable initial experiences as young adults or being stereotyped for pain issues. Our patients have said that navigators make them feel like they have an advocate—someone who is on their side.
Subsequent to forming the initial navigator group, we expanded our program by adding 2 patient navigators in Colorado Springs, a smaller metropolitan area about an hour and a half south of Denver. In Colorado Springs, 16 referrals for services have been made but none of these referrals were specifically for a PCP, since access to a PCP was not a barrier to care in that locale. Patients were more likely to need help with things such as transportation to get to their location of specialty care.
Conclusion
Coordination of care is essential for individuals with chronic diseases. While the focus to date has been on coordination of care for common chronic illness such as diabetes, it is essential to use best practices for individuals with less common, but often more complex, chronic diseases such as SCD. To facilitate coordination of care for this population who receive specialty care in an academic medical center, we developed a patient navigation program for adults with SCD as a quality improvement project. Our navigation program assisted 62% of referred adults in the Denver metropolitan area in identifying a PCP and attending an initial appointment.
The program is continuing for the duration of the grant funding and at this time we will likely need to seek mechanisms for additional support to continue the work that has been started, as well as to consider measurement of outcomes that are meaningful to the institutions in which the program is housed in order to become more sustainable internally.
Patient navigation is an acceptable and feasible way to enhance the care for adults with SCD and can help to bridge systems of clinical care, support and resources. Our program can serve as a model for similar patient populations with orphan chronic diseases that have both primary care and subspecialty needs that have both distinct and overlapping roles. Sustainability is a crucial issue to address and the use of outcome measures that can accurately reflect both successes and challenges of program implementation will be important to share with institutional leaders.
Corresponding author: Linda S. Overholser, MD, MPH, 12631 E 17th Ave., Mail Stop B180, Academic Office 1, Aurora, CO 80045, linda.overholser@ucdenver.edu.
1. Prabhakar H, Haywood C Jr, Molokie R. Sickle cell disease in the United States: looking back and forward at 100 years of progress in management and survival. Am J Hematol 2010;85:346–53.
2. Quinn CT, Rogers ZR, McCavit TL, Buchanan GR. Improved survival of children and adolescents with sickle cell disease. Blood 2010;115:3447–52.
3. Hemker BG, Brousseau DC, Yan K, et al. When children with sickle-cell disease become adults: lack of outpatient care leads to increased use of the emergency department. Am J Hematol 2011;86:863–5.
4. Freeman HP, Muth BJ, Kerner JF. Expanding access to cancer screening and clinical follow-up among the medically underserved. Cancer Pract 1995 3:19–30.
5. Freeman HP, Rodriguez RL. History and principles of patient navigation. Cancer 2011;117(15 Suppl):3539–42.
6. Natale-Pereira A, Enard KR, Nevarez L, Jones LA. The role of patient navigators in eliminating health disparities. Cancer 2011;117(15 Suppl):3543–52.
7. Dohan D, Schrag D. Using navigators to improve care of underserved patients: current practices and approaches. Cancer 2005;104:848–55.
8. Chin MH, Clarke AR, Nocon RS, et al. A roadmap and best practices for organizations to reduce racial and ethnic disparities in health care. J Gen Intern Med 2012;27:992–1000.
9. Grosse SD, Schechter MS, Kulkarni R, et al. Models of comprehensive multidisciplinary care for individuals in the United States with genetic disorders. Pediatrics 2009;123:407–12.
10. Oyeku SO, Wang CJ, Scoville R, et al. Hemoglobinopathy Learning Collaborative: using quality improvement (QI) to achieve equity in health care quality, coordination, and outcomes for sickle cell disease. J Health Care Poor Underserved 2012;23(3 Suppl):34–48.
11. Harold P. Freeman Patient Navigation Institute. Available at www.hpfreemanpni.org.
12. Patient Navigator Training Collaborative. Available at www.patientnavigatortraining.org.
From the Colorado Sickle Cell Network, University of Colorado School of Medicine, Aurora, CO.
This article is the fifth in our Hemoglobinopathy Learning Collaborative series. See the related editorial by Oyeku et al in the February 2014 issue of JCOM. (—Ed.)
Abstract
- Objective: To describe the development and implementation of a patient navigation program to help individuals with sickle cell disease (SCD) overcome barriers to finding adult primary care.
- Methods: Six patient navigators were recruited and received training. A workgroup was formed to clarify goals and objectives and develop standard procedures. Navigators were instrumental in establishing a network of primary care offices that were willing to accept new patients with SCD. Navigators assisted patients in making calls to primary care offices and in some cases would attend appointments with them.
- Results: About two-thirds of patients who were referred to the navigator program for primary care follow-up attended an initial appointment with a new primary care provider.
- Conclusion: Patient navigation is a feasible and useful strategy to help individuals with SCD overcome barriers to receiving comprehensive care.
With advances in the management of sickle cell disease (SCD), adults with SCD are living longer [1,2]. Adequate care for individuals with SCD requires that they receive both specialized services and comprehensive primary care. A lack of comprehensive outpatient care can translate into suboptimal outcomes and increased reliance on the emergency room [3].
In the metropolitan area of Denver, specialty care for individuals with SCD is centralized and easily accessible at a tertiary academic medical center. However, we found that many adult patients treated in our specialty setting had not established care with an adult primary care provider (PCP) or had not been seen regularly by their PCP for ongoing preventive primary care services. Thus, they were not getting their comprehensive care needs met. Although support was available from community-based organizations to help them access certain resources (eg, directions to the food bank), patients reported difficulties in accessing the adult care health system, for example, securing appointments with PCPs and securing/maintaining insurance. No services existed to specifically help them navigate through the complexities of obtaining needed care.
Patient navigation is a strategy commonly used in cancer care settings [4–7] to to help patients overcome barriers in accessing the health care system. Patient navigators can not only facilitate improved health care access and quality for underserved populations through advocacy and care coordination, but they can also address the information needs of patients and assist in overcoming language and cultural barriers. Navigation has been proposed as a strategy to help reduce health disparities [8].
We developed a patient navigation program to address unmet needs of children and adults with SCD receving care in our clinics. In this paper we describe our program.
Patient Navigator Program
Setting
The SCD Treatment Demonstration Program was created in 2004 by the federal government to improve care and outcomes for persons with SCD [9]. As a grantee of this program, we developed the Colorado Sickle Cell Care Network (CSCCN) to care for scd patients in the Denver metropolitan and surrounding area. The CSCCN is a collaboration between the Colorado Sickle Cell Treatment and Research Center and the Division of General Internal Medicine and Department of Hematology at the University of Colorado Denver Anschutz Medical Campus, the Center for Cancer and Blood Disorders at Children’s Hospital Colorado, and 2 community-based organizations. With other grantees, we are participating in the Hemoglobinopathy Learning Collaborative, a collaborative of teams utilizing iterative cycles of testing to learn what changes can be made to improve care processes [10].
Navigators
We developed the patient navigator program to help patients overcome barriers to receiving comprehensive care in a primary care medical home. We hired 4 patient navigators to serve individuals living in or seeking resources in the Denver metropolitan area. Persons interested in being navigators were required to first qualify to be official hospital volunteers at the University of Colorado Hospital and Children’s Hospital Colorado, a process that involved attending an orientation and obtaining official facility badging. They received patient navigation training at the Harold P. Freeman Patient Navigation Institute in New York [11] as well as completed the Colorado Patient Navigator Training Program [12]. Navigators in training learned about the history of patient navigation, health promotion and communication models, motivational interviewing techniques, and systemic and individual barriers to care. All patient navigators received training in HIPAA and went through a volunteer credentialing process at the hospital; however they do not have access to patient’s medical records or the electronic health records.
The navigators are from various backgrounds, and 2 of our patient navigators are bilingual Spanish-English speakers, enhancing our ability to outreach to individuals whose preferred language is Spanish and who may otherwise not be able to access available resources. Some of our patient navigators are family members of individuals being treated for SCD and are able to provide a unique perspective that aids program development.
Once training for the initial group of navigators was completed, a patient navigation workgroup was created to clarify goals and objectives, develop standard procedures, and define navigator responsibilities. This workgroup included the CSCCN program staff, adult and pediatric hematology trained SCD specialists, and the pediatric coordinator. We used the Hemoglobinopathy Learning Collaborative process [10] to develop and refine a process map for referrals made for primary care. Process mapping was an iterative process with regular input from the navigators and other members of the patient navigation workgroup, as well as input from case managers and social workers when needed.
Process
Upon receiving a referral, navigators made contact with the patient within 1 business day and obtained preferred contact information. The navigator completed a patient intake form and needs assessment. Each patient referral was logged into a secure database. Most referrals were generated by our specialty health care providers, but as awareness of the program grew referrals also came from the community-based organizations as well as self-referrals from patients or caregivers. Most of the referrals (68%) were specifically for assistance in finding a primary care medical home. Other reasons patients were referred to the navigator program included needing assistance with housing, financial assistance, or insurance application questions.
Barriers Addressed
Patient navigators spent much of their time proactively seeking local sources of adult primary care for clients and in doing so established a network of primary care offices in the community that would be able and willing to accept new patients with SCD. This was accomplished through personal outreach and communication with stakeholders at the academic medical center and in the community, utilizing skills learned during patient navigation training and by sorting through vast informational resources available to the public. When feasible the navigators, accompanied by the project director and adult hematology specialist, personally visited sites of primary care in the community to help provide information about the CSCCN and establish a working relationship.
Our navigators would make calls together with the patient to make a PCP appointment and would remind them of upcoming PCP appointments. In some cases, navigators would attend appointments with the patient; in addition, they would help advocate for them when they had to go to the emergency department. If a patient missed a PCP appointment, the navigator followed up to find out why and how to secure another appointment. Navigators would follow-up every 10 days if a patient had not yet seen a PCP. As many of our patients did not understand why they needed to have a PCP when they had a specialist, the navigators educated patients on the importance of PCP care.
In additon, navigators helped our patients deal with insurance coverage problems, such as frequent insurance changes/insurance getting dropped. Some patients had low literacy or had difficulties in filling out disability or insurance forms properly. Navigators received training from state coordinators for Medicaid and SSI disability on filling out the respective forms, which can be confusing.
Our navigators were trained in motivational interviewing and used it to identify other barriers patients were facing. In trying to obtain proper care, our patients struggled with competing priorities (eg, food, shelter, child care). Because of the numerous challenges that our patients and families face, an important role for the patients navigators was creating a bridge to accessing social and community resources.
Outcomes
The help and support provided by the navigators is helpful in mitigating the mistrust our patients have about the health care system, in part due to unfavorable initial experiences as young adults or being stereotyped for pain issues. Our patients have said that navigators make them feel like they have an advocate—someone who is on their side.
Subsequent to forming the initial navigator group, we expanded our program by adding 2 patient navigators in Colorado Springs, a smaller metropolitan area about an hour and a half south of Denver. In Colorado Springs, 16 referrals for services have been made but none of these referrals were specifically for a PCP, since access to a PCP was not a barrier to care in that locale. Patients were more likely to need help with things such as transportation to get to their location of specialty care.
Conclusion
Coordination of care is essential for individuals with chronic diseases. While the focus to date has been on coordination of care for common chronic illness such as diabetes, it is essential to use best practices for individuals with less common, but often more complex, chronic diseases such as SCD. To facilitate coordination of care for this population who receive specialty care in an academic medical center, we developed a patient navigation program for adults with SCD as a quality improvement project. Our navigation program assisted 62% of referred adults in the Denver metropolitan area in identifying a PCP and attending an initial appointment.
The program is continuing for the duration of the grant funding and at this time we will likely need to seek mechanisms for additional support to continue the work that has been started, as well as to consider measurement of outcomes that are meaningful to the institutions in which the program is housed in order to become more sustainable internally.
Patient navigation is an acceptable and feasible way to enhance the care for adults with SCD and can help to bridge systems of clinical care, support and resources. Our program can serve as a model for similar patient populations with orphan chronic diseases that have both primary care and subspecialty needs that have both distinct and overlapping roles. Sustainability is a crucial issue to address and the use of outcome measures that can accurately reflect both successes and challenges of program implementation will be important to share with institutional leaders.
Corresponding author: Linda S. Overholser, MD, MPH, 12631 E 17th Ave., Mail Stop B180, Academic Office 1, Aurora, CO 80045, linda.overholser@ucdenver.edu.
1. Prabhakar H, Haywood C Jr, Molokie R. Sickle cell disease in the United States: looking back and forward at 100 years of progress in management and survival. Am J Hematol 2010;85:346–53.
2. Quinn CT, Rogers ZR, McCavit TL, Buchanan GR. Improved survival of children and adolescents with sickle cell disease. Blood 2010;115:3447–52.
3. Hemker BG, Brousseau DC, Yan K, et al. When children with sickle-cell disease become adults: lack of outpatient care leads to increased use of the emergency department. Am J Hematol 2011;86:863–5.
4. Freeman HP, Muth BJ, Kerner JF. Expanding access to cancer screening and clinical follow-up among the medically underserved. Cancer Pract 1995 3:19–30.
5. Freeman HP, Rodriguez RL. History and principles of patient navigation. Cancer 2011;117(15 Suppl):3539–42.
6. Natale-Pereira A, Enard KR, Nevarez L, Jones LA. The role of patient navigators in eliminating health disparities. Cancer 2011;117(15 Suppl):3543–52.
7. Dohan D, Schrag D. Using navigators to improve care of underserved patients: current practices and approaches. Cancer 2005;104:848–55.
8. Chin MH, Clarke AR, Nocon RS, et al. A roadmap and best practices for organizations to reduce racial and ethnic disparities in health care. J Gen Intern Med 2012;27:992–1000.
9. Grosse SD, Schechter MS, Kulkarni R, et al. Models of comprehensive multidisciplinary care for individuals in the United States with genetic disorders. Pediatrics 2009;123:407–12.
10. Oyeku SO, Wang CJ, Scoville R, et al. Hemoglobinopathy Learning Collaborative: using quality improvement (QI) to achieve equity in health care quality, coordination, and outcomes for sickle cell disease. J Health Care Poor Underserved 2012;23(3 Suppl):34–48.
11. Harold P. Freeman Patient Navigation Institute. Available at www.hpfreemanpni.org.
12. Patient Navigator Training Collaborative. Available at www.patientnavigatortraining.org.
Two Home Health Agencies Reduce Readmissions Among Heart Failure Patients Using a Quality Improvement Approach
From Collaborative Healthcare Strategies, Lexington, MA (Dr. Boutwell), and the National Home Health Corporation, Scarsdale, NY.
Abstract
- Objective: To describe a quality improvement initiative implemented by 2 home health care agencies to reduce readmissions.
- Methods: The agencies reviewed their data and identified best practices for reducing acute hospital transfers among their high-risk heart failure patients, focusing on the first 14 days of the care episode. Care intensity was increased during the first 3 days, and an active surveillance approach was used during the first 2 weeks. Training for staff, called “Heart Failure Boot Camp,” was introduced and made part of new employee orientation.
- Results: The 30-day rehospitalization rate was reduced from 31% to 17%.
- Conclusion: A data-driven transitional care model can lead to reductions in 30-day readmissions among high-risk patients receiving home health care.
Hospital readmissions are frequent, costly, and can be a marker of poorly coordinated postdischarge care [1]. Since the passage of the Affordable Care Act in 2010, reducing readmissions has become a national priority, as reflected in the emergence of accountable care organizations, bundled payments, and readmission penalties for hospitals, among other efforts. With the increasing attention on reducing readmissions, home health care agencies are under pressure to identify opportunities to improve performance. Two affiliated home health care agencies in Massachusetts and Connecticut made reducing their all-cause 30-day readmission rate a strategic priority. In this article, we describe their approach.
Setting
New England Home Care (NEHC, Cromwell, CT) is a regional agency that serves 7 of the 8 counties in Connecticut and over 7400 patients annually. Medical Resources Home Health (Newton, MA) is a regional agency that serves 8 of the 12 counties in Massachusetts and 2000 patients annually. These home health agencies are both owned by National Home Health Care Corporation (Scarsdale, NY) but are independently managed, with separate staff and regional market differences.
Data Analysis

Opportunities for Improvement The data analysis highlighted several immediate opportunities for improvement. First, the data showed that the first 3 days of the home health episode are a period of increased risk. Thus, intensification of care—and successful first contacts—during the first 3 days of the home health episode was an important target goal. Similarly, the first 14 days were a period of increased risk, suggesting the potential benefit of home health staff proactively monitoring patients during this time to identify clinical or other needs early in the effort to avert a hospitalization. In addition, while respiratory symptoms were among the top reasons for acute care hospitalization within 30 days of episode initiation, many other diagnoses were also implicated. Nine conditions comprised 80% of coded reasons for hospitalization, suggesting that vigilance around respiratory complaints is important but cannot be the exclusive focus of symptom management in this population.
Approach The agencies started this performance improvement initiative by focusing on one patient subgroup (heart failure patients) served by one of the agencies (NEHC). New approaches were tried, and effective approaches were codified through training, on-the job coaching, and performance feedback to front-line clinicians. This approach facilitated the spread of these changes to the second agency, and subsequently both agencies expanded their focus beyond heart failure to other common diagnoses in the home health population.
Changes to Standard Care Practices Based on identified opportunities for improvement, the agency incorporated modifications to standard care utilizing existing resources and within the construct of a certified Medicare home health episode (Medicare’s required specific services, assessments, and other activities that a home health agency must provide in order to bill for an episode). First, working with managers and front-line clinicians, they focused on establishing successful contact during the first 3 days of an episode of care. Front-line staff reported that some patients did not respond to the first attempt to establish contact, and staff thought that it indicated that the patient did not want home health care. The agency designed a new initial contact protocol to increase the likelihood of a successful first contact with the patient. Second, staff increased the frequency of contact in the first 3 days of the episode, either through home visits or phone calls. Increased contact served to allowed the home health staff to get to know the patient and have more points of reference upon which to identify whether symptoms were developing or changing. In addition, increase initial frequency served to increase the comfort and confidence that the patient and their family had in the agency. Third, in the context of increasing the frequency and effectiveness of contacts in the first 14 days, home care staff were trained to adopt an “active surveillance” approach. This staff development and re-training initiative instructed staff on practices to increase their awareness and recognition of patient needs or changing circumstances, outside the specific problem-defined focus area(s) of the home health episode. Frequent contact in the first 14 days creates an opportunity for home health staff to intervene proactively in the confusion or symptoms that lead patients or their families to call 911. Fourth, home care staff received professional development training specifically focused on heart failure, called “Heart Failure Boot Camp.” This training provided a review and update on the clinical management best practices for home care for heart failure patients. This training was conducted by the agency’s staff clinical educator at each local field office. Once all the agencies’ existing staff were trained, the training materials were included in new employee orientation. Rate of acute care hospitalizations was tracked and reports were provided to each local field office on a quarterly basis. Agency leadership included review of these data with local field office managers in their existing management meetings to reinforce the importance of this initiative for the agency at the highest levels. As the efforts to reduce hospitalizations evolved to include patients with conditions other than heart failure, the agencies developed a readmission risk assessment that included the number of medications ( < 5; 6–10; 11–15; 16–20; or > 20) and number of hospitalizations within the past 12 months. Staff could act upon the risk elements identified to reduce each individual patient’s risk of readmission.
Adding Enhanced Service to Standard Care: The Transitional Care Liaison
ollowing the implementation of the above changes to standard home health care practices, the agencies subsequently deployed full-time transitional care liaisons at local hospitals. This was a new role, requiring newly dedicated resources for the position. The role is modeled upon the Care Transitions Intervention [2],which emphasizes the value of initiating transitional care during the hospitalization. In this new role, the hospital-based home care liaisons establish a relationship with the patient, schedule immediate follow-up, review medications and the plan to obtain new medications, and review the plan of care in the hospital, prior to the transition home. On-site transitional care liaisons greatly facilitate clinical collaboration, allowing the “receiving” provider to request clarifications prior to discharge. On-site relationships also enable formal and informal mutual improvements in the transition process. An unanticipated benefit to this collaboration is that the agencies are able to identify some high-utilizing patients who are served by several area hospitals. Thus the agencies were able to add to the list of highest-risk patients for some hospitals that were otherwise unidentified.
Outcomes
The 30-day rehospitalization rate for NEHC was 31% during the baseline period (9/30/2008 to 6/30/2010). The quarterly variability in readmission rates was high, ranging from 20% to 42% in any given quarter. Following the start of the performance improvement initiative in Quarter 3 of 2010, and through the most recent quarter for which data are available (Quarter 3 2013) the quarterly 30-day readmission rates demonstrated decreased variability (15% to 22%) and the 30-day readmission rate was reduced to 17%—a 45% reduction in rehospitalizations. The agencies’ rehospitalization rates are lower than local benchmarks [1].
Lessons Learned
The agencies experience with this initiative has led to several lessons learned that may be of interest to other agencies and providers looking to design and implement care models to reduce rehospitalizations.
First, it was essential to supplement our knowledge of best practices from the literature and industry experts with an examination of our own data. In addition to examining rates of rehospitalization, we were able to identify patients at highest risk so we could intensify services early for this group.
Second, the 2 agencies participating in this effort are affiliated but independently managed, with separate staff and regional market differences. We were pleased to learn that a common service delivery model could be successfully implemented in both agencies. This suggests that this structured care delivery improvement approach can be replicated in other organizations and local contexts.
Third, by no means was the staff development and retraining a “one and done” effort; continuous reinforcement of the rationale for the practice change and the protocols for optimizing engagement to reduce rehospitalizations was required.
Finally, the performance improvement initiative started with an initial focus on heart failure patients. Over the course of the Initiative we named the series of practice changes our “Healthy@Home” model of care. As we expanded our focus to all patients at high risk of readmission (as identified by our risk assessment score), we learned that staff thought the Healthy@Home practice changes only applied to heart failure patients. This required re-messaging with the staff and regional supervisors.
Conclusion
As rehospitalizations continue to be a prominent measure of quality, cost, and patient experience and a measure for which hospitals and post-acute and community-based providers are either penalized or rewarded, there is a growing awareness of the many factors outside the walls of the hospital that determine whether a patient will return within a defined period of time. Many home health agencies see this as an opportune moment to highlight the critical role they play in care transitions across settings and over time. In this article, we describe the experience of 2 affiliated regional home health care agencies as they engaged in a structured performance improvement effort to reduce readmissions among their high-risk patients. This effort involving data analysis, identification of locally relevant opportunities for improvement, modifications to standard care utilizing existing resources, adding a new service, and expansion beyond the initial target population to all patients at high risk of readmission. This 3-year effort has resulted in a substantial and sustained reduction in rehospitalization rates.
1. Masspro, Massachusetts’ Quality Improvement Organization. State of the state: readmissions in Massachusetts January 1 2009-September 30 2013. Accessed 14 April 2014 at www.masspro.org/files/tools/12_13_state_of_the_state.pdf.
2. Coleman EA, Parry C, Chalmers S, Min S. The care transitions intervention. Arch Intern Med 2006;166:1822–8.
From Collaborative Healthcare Strategies, Lexington, MA (Dr. Boutwell), and the National Home Health Corporation, Scarsdale, NY.
Abstract
- Objective: To describe a quality improvement initiative implemented by 2 home health care agencies to reduce readmissions.
- Methods: The agencies reviewed their data and identified best practices for reducing acute hospital transfers among their high-risk heart failure patients, focusing on the first 14 days of the care episode. Care intensity was increased during the first 3 days, and an active surveillance approach was used during the first 2 weeks. Training for staff, called “Heart Failure Boot Camp,” was introduced and made part of new employee orientation.
- Results: The 30-day rehospitalization rate was reduced from 31% to 17%.
- Conclusion: A data-driven transitional care model can lead to reductions in 30-day readmissions among high-risk patients receiving home health care.
Hospital readmissions are frequent, costly, and can be a marker of poorly coordinated postdischarge care [1]. Since the passage of the Affordable Care Act in 2010, reducing readmissions has become a national priority, as reflected in the emergence of accountable care organizations, bundled payments, and readmission penalties for hospitals, among other efforts. With the increasing attention on reducing readmissions, home health care agencies are under pressure to identify opportunities to improve performance. Two affiliated home health care agencies in Massachusetts and Connecticut made reducing their all-cause 30-day readmission rate a strategic priority. In this article, we describe their approach.
Setting
New England Home Care (NEHC, Cromwell, CT) is a regional agency that serves 7 of the 8 counties in Connecticut and over 7400 patients annually. Medical Resources Home Health (Newton, MA) is a regional agency that serves 8 of the 12 counties in Massachusetts and 2000 patients annually. These home health agencies are both owned by National Home Health Care Corporation (Scarsdale, NY) but are independently managed, with separate staff and regional market differences.
Data Analysis
Opportunities for Improvement The data analysis highlighted several immediate opportunities for improvement. First, the data showed that the first 3 days of the home health episode are a period of increased risk. Thus, intensification of care—and successful first contacts—during the first 3 days of the home health episode was an important target goal. Similarly, the first 14 days were a period of increased risk, suggesting the potential benefit of home health staff proactively monitoring patients during this time to identify clinical or other needs early in the effort to avert a hospitalization. In addition, while respiratory symptoms were among the top reasons for acute care hospitalization within 30 days of episode initiation, many other diagnoses were also implicated. Nine conditions comprised 80% of coded reasons for hospitalization, suggesting that vigilance around respiratory complaints is important but cannot be the exclusive focus of symptom management in this population.
Approach The agencies started this performance improvement initiative by focusing on one patient subgroup (heart failure patients) served by one of the agencies (NEHC). New approaches were tried, and effective approaches were codified through training, on-the job coaching, and performance feedback to front-line clinicians. This approach facilitated the spread of these changes to the second agency, and subsequently both agencies expanded their focus beyond heart failure to other common diagnoses in the home health population.
Changes to Standard Care Practices Based on identified opportunities for improvement, the agency incorporated modifications to standard care utilizing existing resources and within the construct of a certified Medicare home health episode (Medicare’s required specific services, assessments, and other activities that a home health agency must provide in order to bill for an episode). First, working with managers and front-line clinicians, they focused on establishing successful contact during the first 3 days of an episode of care. Front-line staff reported that some patients did not respond to the first attempt to establish contact, and staff thought that it indicated that the patient did not want home health care. The agency designed a new initial contact protocol to increase the likelihood of a successful first contact with the patient. Second, staff increased the frequency of contact in the first 3 days of the episode, either through home visits or phone calls. Increased contact served to allowed the home health staff to get to know the patient and have more points of reference upon which to identify whether symptoms were developing or changing. In addition, increase initial frequency served to increase the comfort and confidence that the patient and their family had in the agency. Third, in the context of increasing the frequency and effectiveness of contacts in the first 14 days, home care staff were trained to adopt an “active surveillance” approach. This staff development and re-training initiative instructed staff on practices to increase their awareness and recognition of patient needs or changing circumstances, outside the specific problem-defined focus area(s) of the home health episode. Frequent contact in the first 14 days creates an opportunity for home health staff to intervene proactively in the confusion or symptoms that lead patients or their families to call 911. Fourth, home care staff received professional development training specifically focused on heart failure, called “Heart Failure Boot Camp.” This training provided a review and update on the clinical management best practices for home care for heart failure patients. This training was conducted by the agency’s staff clinical educator at each local field office. Once all the agencies’ existing staff were trained, the training materials were included in new employee orientation. Rate of acute care hospitalizations was tracked and reports were provided to each local field office on a quarterly basis. Agency leadership included review of these data with local field office managers in their existing management meetings to reinforce the importance of this initiative for the agency at the highest levels. As the efforts to reduce hospitalizations evolved to include patients with conditions other than heart failure, the agencies developed a readmission risk assessment that included the number of medications ( < 5; 6–10; 11–15; 16–20; or > 20) and number of hospitalizations within the past 12 months. Staff could act upon the risk elements identified to reduce each individual patient’s risk of readmission.
Adding Enhanced Service to Standard Care: The Transitional Care Liaison
ollowing the implementation of the above changes to standard home health care practices, the agencies subsequently deployed full-time transitional care liaisons at local hospitals. This was a new role, requiring newly dedicated resources for the position. The role is modeled upon the Care Transitions Intervention [2],which emphasizes the value of initiating transitional care during the hospitalization. In this new role, the hospital-based home care liaisons establish a relationship with the patient, schedule immediate follow-up, review medications and the plan to obtain new medications, and review the plan of care in the hospital, prior to the transition home. On-site transitional care liaisons greatly facilitate clinical collaboration, allowing the “receiving” provider to request clarifications prior to discharge. On-site relationships also enable formal and informal mutual improvements in the transition process. An unanticipated benefit to this collaboration is that the agencies are able to identify some high-utilizing patients who are served by several area hospitals. Thus the agencies were able to add to the list of highest-risk patients for some hospitals that were otherwise unidentified.
Outcomes
The 30-day rehospitalization rate for NEHC was 31% during the baseline period (9/30/2008 to 6/30/2010). The quarterly variability in readmission rates was high, ranging from 20% to 42% in any given quarter. Following the start of the performance improvement initiative in Quarter 3 of 2010, and through the most recent quarter for which data are available (Quarter 3 2013) the quarterly 30-day readmission rates demonstrated decreased variability (15% to 22%) and the 30-day readmission rate was reduced to 17%—a 45% reduction in rehospitalizations. The agencies’ rehospitalization rates are lower than local benchmarks [1].
Lessons Learned
The agencies experience with this initiative has led to several lessons learned that may be of interest to other agencies and providers looking to design and implement care models to reduce rehospitalizations.
First, it was essential to supplement our knowledge of best practices from the literature and industry experts with an examination of our own data. In addition to examining rates of rehospitalization, we were able to identify patients at highest risk so we could intensify services early for this group.
Second, the 2 agencies participating in this effort are affiliated but independently managed, with separate staff and regional market differences. We were pleased to learn that a common service delivery model could be successfully implemented in both agencies. This suggests that this structured care delivery improvement approach can be replicated in other organizations and local contexts.
Third, by no means was the staff development and retraining a “one and done” effort; continuous reinforcement of the rationale for the practice change and the protocols for optimizing engagement to reduce rehospitalizations was required.
Finally, the performance improvement initiative started with an initial focus on heart failure patients. Over the course of the Initiative we named the series of practice changes our “Healthy@Home” model of care. As we expanded our focus to all patients at high risk of readmission (as identified by our risk assessment score), we learned that staff thought the Healthy@Home practice changes only applied to heart failure patients. This required re-messaging with the staff and regional supervisors.
Conclusion
As rehospitalizations continue to be a prominent measure of quality, cost, and patient experience and a measure for which hospitals and post-acute and community-based providers are either penalized or rewarded, there is a growing awareness of the many factors outside the walls of the hospital that determine whether a patient will return within a defined period of time. Many home health agencies see this as an opportune moment to highlight the critical role they play in care transitions across settings and over time. In this article, we describe the experience of 2 affiliated regional home health care agencies as they engaged in a structured performance improvement effort to reduce readmissions among their high-risk patients. This effort involving data analysis, identification of locally relevant opportunities for improvement, modifications to standard care utilizing existing resources, adding a new service, and expansion beyond the initial target population to all patients at high risk of readmission. This 3-year effort has resulted in a substantial and sustained reduction in rehospitalization rates.
1. Masspro, Massachusetts’ Quality Improvement Organization. State of the state: readmissions in Massachusetts January 1 2009-September 30 2013. Accessed 14 April 2014 at www.masspro.org/files/tools/12_13_state_of_the_state.pdf.
2. Coleman EA, Parry C, Chalmers S, Min S. The care transitions intervention. Arch Intern Med 2006;166:1822–8.