The American Journal of Orthopedics is an Index Medicus publication that is valued by orthopedic surgeons for its peer-reviewed, practice-oriented clinical information. Most articles are written by specialists at leading teaching institutions and help incorporate the latest technology into everyday practice.
Cellular healing response differs between bony and soft tissue biceps tenodesis.
Bony tenodesis incites an inflammatory healing response.
Bony tenodesis healing occurs at the tendon-bone interface.
Intrasseous bony fixation leads to tendon degeneration within the bone.
Tendon-to-tendon tenodesis may result in regenerative tendon healing.
The long head of the biceps tendon (LHBT) is a well-established pain generator of the anterior shoulder1,2 and may be surgically addressed in refractory cases.3 According to a recent study of 44,932 cases, biceps tenodesis rates increased 80% over just 3 years (2008-2011).4 Nevertheless, optimal tenodesis location and technique remain controversial. Proximal and distal tenodesis, including numerous soft-tissue and bony techniques, have been described.5-7 Several studies have focused on the biomechanical strength of various fixation modalities.8-14 These data highlight the ongoing evolution of our understanding of biceps-labrum complex (BLC) disease.
Over the years, tenodesis location has proved to be an important factor in outcomes.3,15-20 Several recent studies have elucidated the role of the extra-articular LHBT and the limited capabilities of diagnostic arthroscopy.15-17,20,21 Taylor and colleagues17 defined the bicipital tunnel as the extra-articular segment of LHBT and its fibro-osseous enclosure. The tunnel extends from the articular margin through the subpectoral region and can be divided into 3 zones: Zone 1 goes from the articular margin to the inferior margin of the subscapularis, zone 2 goes from the inferior margin of the subscapularis to the proximal margin of the pectoralis major tendon, and zone 3 is the subpectoral region. Zone 2 is often referred to as “no man’s land” for its relative invisibility from arthroscopy above and open exposure below.17,21 Notably, a recent study reported a 47% prevalence of hidden tunnel lesions in patients with chronic BLC disease symptoms.18 Other studies have shown that standard proximal tenodesis methods often fail to address LHBT pathology in this area, leading to residual symptoms.9,22 It is evident that tenodesis location and technique play important roles in patient outcomes. Sanders and colleagues16 found that the revision rate was significantly higher among patients who underwent biceps tenodesis without release of the bicipital tunnel sheath than among patients who underwent tenodesis with the release. Dr. O’Brien developed an alternative option: soft-tissue tenodesis with transfer of the LHBT to the conjoint tendon within the subdeltoid space.23,24 This technique addresses intra-articular and extra-articular tunnel disease while mitigating the complications associated with bony tenodesis. Early and midterm studies have shown this to be an effective intervention for chronically symptomatic BLC disease.25,26
Despite the abundance of literature on tenodesis techniques, no one has histologically evaluated the location-dependent healing and inflammatory responses. We conducted a study to determine the impact of tenodesis location on healing and inflammation in a rat model. We hypothesized that, compared with tendon-to-bone techniques, soft-tissue tenodesis would minimize inflammatory response and optimize healing.
Methods
The study was approved by the Institutional Animal Care and Use Committee at the Hospital for Special Surgery.
Animals
Biceps tenodesis was performed at 1 of 3 locations in 36 thirteen-week-old Sprague-Dawley rats (Charles River Laboratories). All rats were prepared for surgery by an experienced veterinary technician. Sedation was induced with isoflurane gas through a nose cone.
Surgical Procedure
Animals were randomly assigned to 3 different tenodesis groups: tendon-to-bone in the bicipital groove (metaphyseal, M); tendon-to-bone in the subpectoral region (diaphyseal, D); and soft tissue-to-soft tissue transfer to the conjoint tendon (T). A standard deltopectoral approach was used to expose the biceps tendon. The tendon was tagged with a 5-0 polypropylene suture and tenotomized at the level of the bicipital groove (zone 1). All wounds were irrigated and closed with 4-0 nylon suture.
For animals undergoing tendon-to-bone metaphyseal tenodesis, a 0.045-mm Kirschner wire was used to drill bicortically into the intertubercular sulcus. Wire positioning distal to the physeal plate was confirmed with fluoroscopy. A locking stitch of 5-0 polypropylene suture was run along the free edge of the tendon. The tendon was then passed through the bone tunnel in an anterior-to-posterior direction, and the limbs of the suture were tied around the lateral cortex.
The process was repeated for animals undergoing diaphyseal tenodesis; only the tenodesis location was different. The inferior border of the pectoralis major was identified, and a bicortical tunnel was made in the center of the diaphyseal bone. The tendon was then prepared and tenodesed to bone using the method already described.
In soft-tissue tenodesis, the conjoint tendon was identified and carefully dissected from surrounding tissues. The LHBT was then tenodesed to the attached conjoint tendon with interrupted simple stitches of 5-0 polypropylene suture.
The animals were allowed to bear weight on the operative limb immediately after surgery and without immobilization.
Specimen Harvest and Preparation
Four animals from each group were sacrificed at 6, 12, and 24 weeks. Harvested specimens were fixed in 10% neutral-buffered formalin solution. Bony specimens consisted of the upper half of the humerus and the tenodesed biceps tendon, and soft-tissue specimens consisted of the tenodesed LHBT-conjoint tendon complex. Bony specimens were decalcified in 10% ethylenediaminetetraacetic acid. All specimens were paraffin-embedded and sectioned at 7 microns.
Analysis of Cellularity
Sections were stained with hematoxylin-eosin. Overall cellularity at the tenodesis interface was quantified by averaging the nuclei count within 3 separate standardized ×20 magnification high power fields. Only nucleated cells were included in the cell count. Immunohistochemical staining with tenomodulin (Santa Cruz Laboratories, sc-49324) was performed to characterize the cell population at the interface. Deparaffinized sections underwent antigen retrieval with pronase for 30 minutes at 37°C and were incubated overnight with the anti-tenomodulin goat monoclonal antibody diluted to 1:200 in 1% phosphate-buffered saline. The prepared slides were then counterstained with methyl green. Specimens treated with tenomodulin were evaluated for presence or absence of a positive reaction at the tenodesis interface.
Analysis of Inflammation
Inflammation at the interface was evaluated with the CD68 macrophage marker (ABcam, ab31630). Deparaffinized sections underwent antigen retrieval with pronase for 30 minutes at 37°C and were incubated overnight with anti-CD68 mouse monoclonal antibodies diluted to 1:200 in 1% phosphate-buffered saline. The prepared slides were then counterstained with neutral red. Inflammation was quantified by averaging the number of reactive cells within 3 separate standardized ×20 magnification high power fields.
Statistical Analysis
Descriptive statistics were calculated for cell and macrophage counts for each group at every time point. Two-way analysis of variance was used to compare the cell and macrophage counts between groups at each time point as well as the count differences within each group between time points. P values were Bonferroni-corrected to account for the multiple comparisons between groups. P < .05 was used to signify statistical significance.
Results
All 36 animals survived to their designated harvest time without complications. Twelve specimens were successfully harvested at 6 weeks and another 12 at 24 weeks. At 12 weeks, tenodesis failure occurred in 1 animal in group D, leaving 11 specimens for analysis.
Cellularity
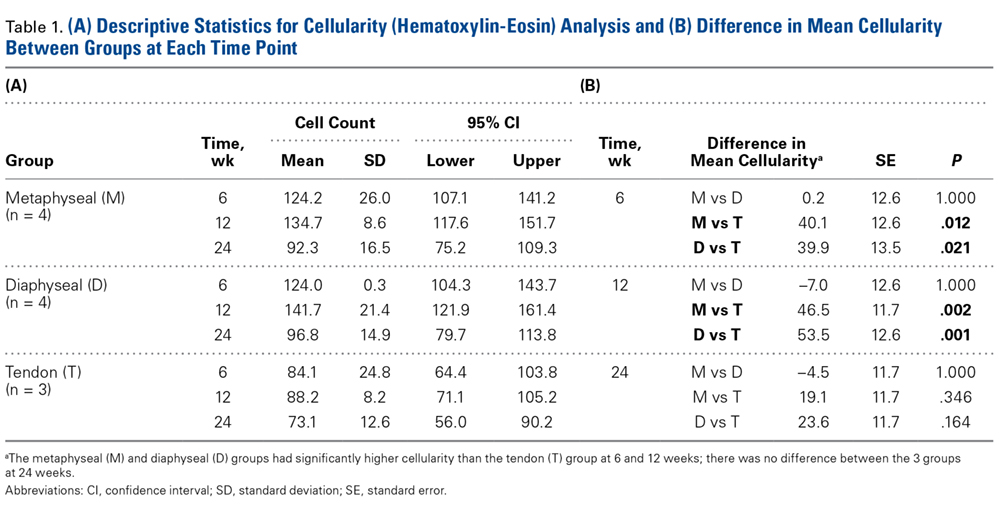
Table 1.At the 6-week harvest, 1 group T specimen was sectioned incorrectly and discarded, leaving 3 specimens for evaluation. Descriptive statistics for each group and each time point are listed in Table 1A. There were no significant differences in mean cellularity between the bony tenodesis groups at any time point (P = 1.000) (Table 1B).
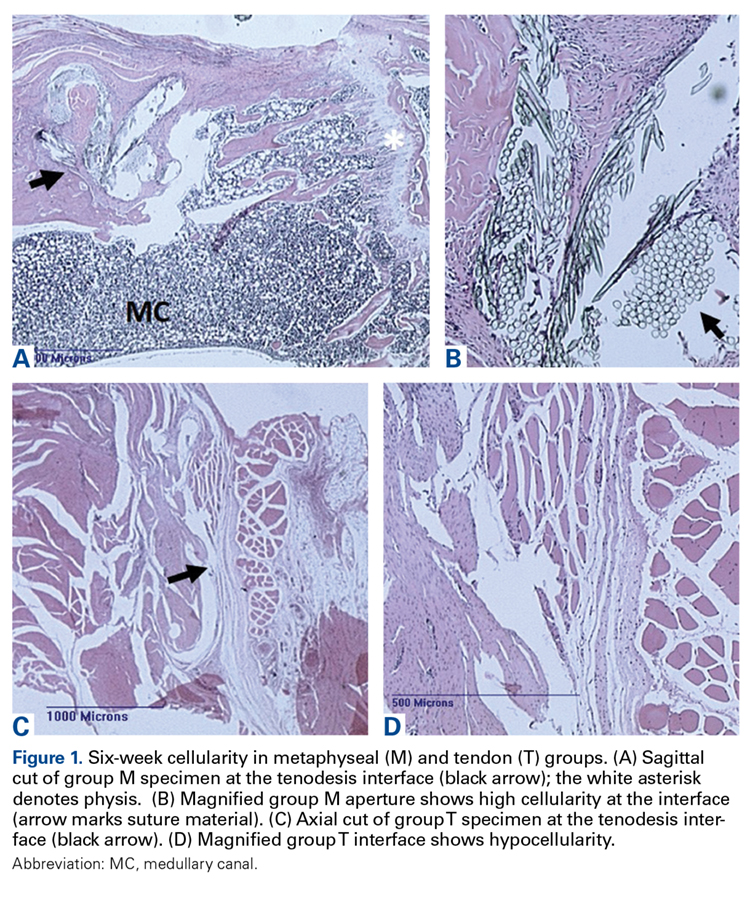
Figure 1.At 6 weeks, both group M (P = .012) and group D (P = .021) showed significantly more cellularity than group T (Figure 1). The same was true for group M (P = .002) and group D (P = .001) at the 12-week harvest. There were no significant differences in cellularity between the 3 groups at 24 weeks.
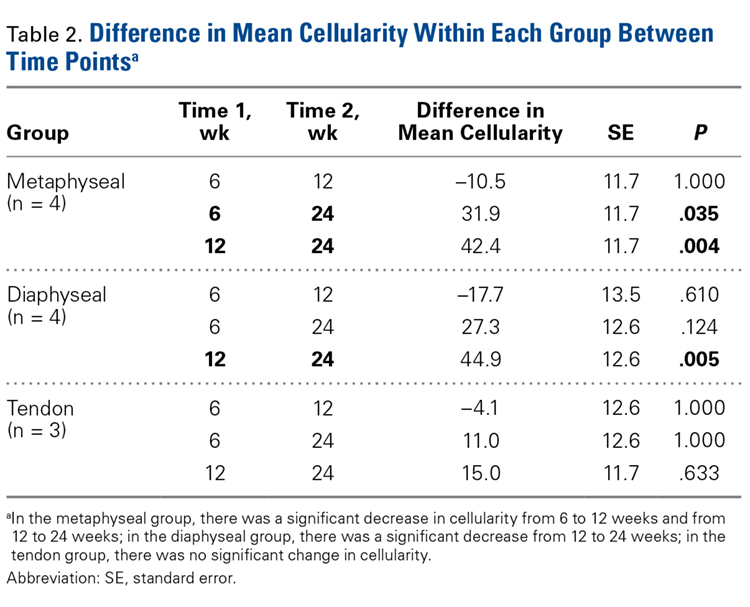
Within-group analysis revealed a trend of increasing cellularity at 12 weeks followed by a decrease at 24 weeks in all 3 groups (Table 2).
Table 2.Group M showed a significant overall decrease in cellularity from 6 to 24 weeks (P = .035) and from 12 to 24 weeks (P = .004). The overall decrease in cell count from 6 to 24 weeks was not significant in group D (P = .124), whereas the decrease from 12 to 24 weeks was significant (P = .005). There were no significant differences in cellularity for group T between any of the time points.
Inflammatory Response
During specimen processing, 1 group D specimen was severely degraded after pronase treatment, leaving 3 specimens for evaluation. Descriptive statistics for each group are listed in Table 3A.
Table 3.
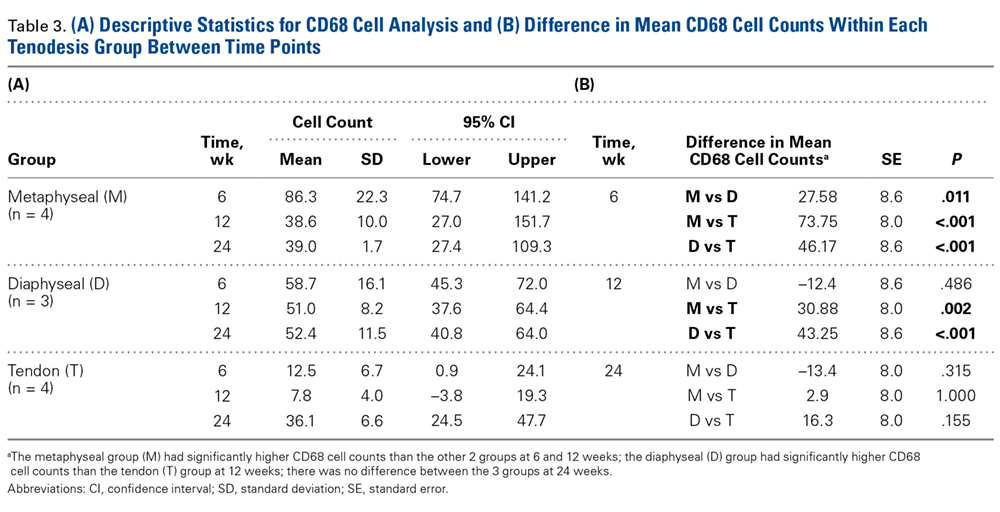
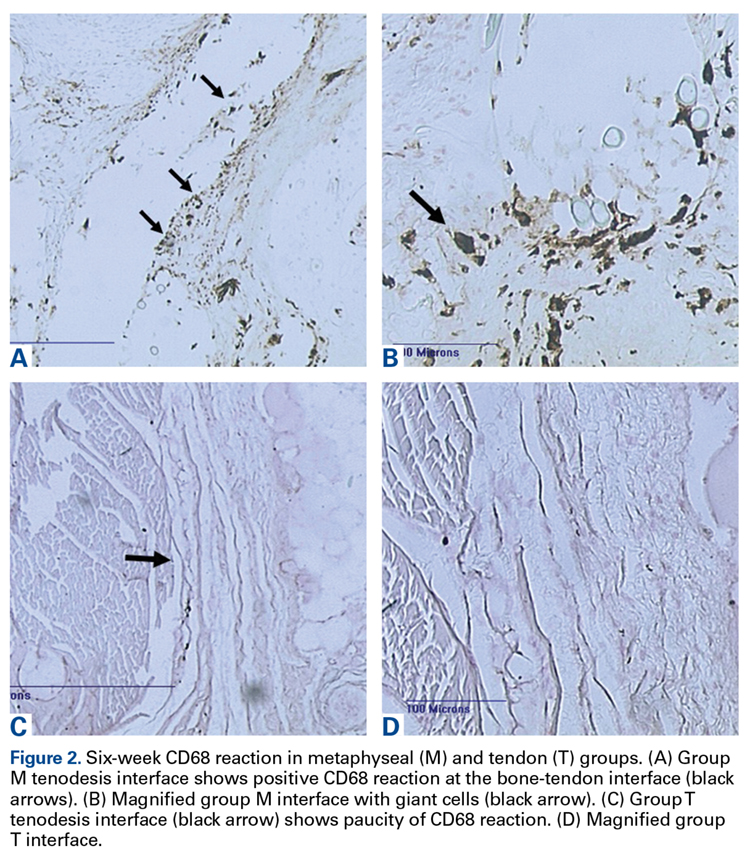
At 6 weeks, mean CD68 cell count was significantly higher in group M than in group D (P = .011) and group T (P < .001) (Table 3B). Likewise, CD68 count was significantly higher in group D than in group T (P < .001). There were no differences in CD68 counts between the 2 bony tenodesis groups at 12 weeks (P = .486) or 24 weeks (P = .315). Both bony tenodesis groups, however, had persistently higher CD68 counts at 12 weeks when compared with group T (group M, P = .002; group D, P < .001). In these specimens, an inflammatory milieu characterized by a large accumulation of lymphocytes and giant cells was noted at the bone-tendon interface.
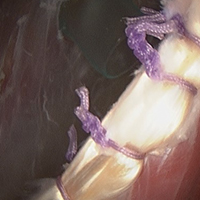
Figure 2. In comparison, inflammatory cells were scant at the tendon-tendon interface in group T specimens (Figure 2). There were no differences in CD68 reaction between the 3 tenodesis groups at 24 weeks. In all cases of tendon-to-bone tenodesis, no recognizable formed tendon was seen within the bone tunnel. Rather, all tendon-to-bone tenodeses were characterized by dense connective tissue at the bone surface, surrounded by an accumulation of macrophages.
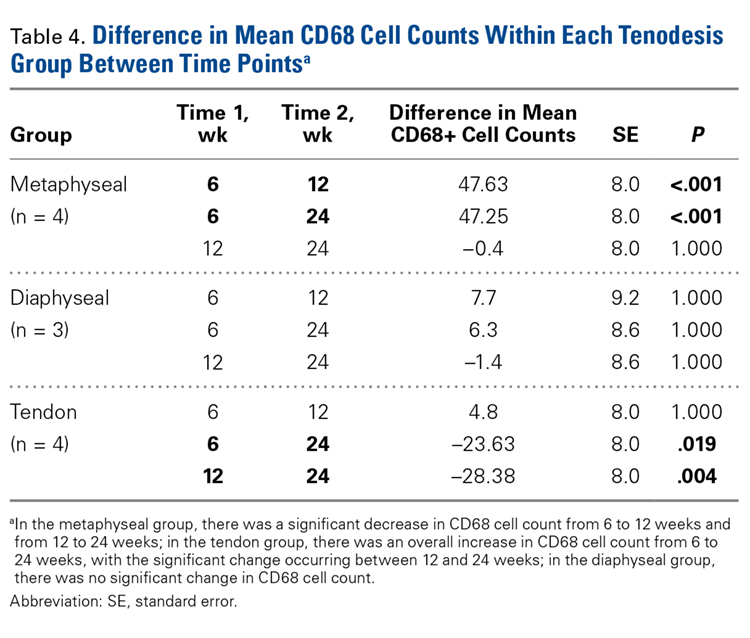
Table 4.Within-group analysis revealed a significant decrease in CD68 cells from 6 to 12 weeks and overall from 6 to 24 weeks in group M (Table 4). There was no significant change in CD68 cell counts between any time points within group D (P = 1.000) and between 6 and 12 weeks in group T (P = 1.000). Interestingly, the CD68 counts in group T showed an overall increase from 6 to 24 weeks (P = .019). The increase was even more significant from 12 to 24 weeks (P = .004).
Tissue-Specific Staining
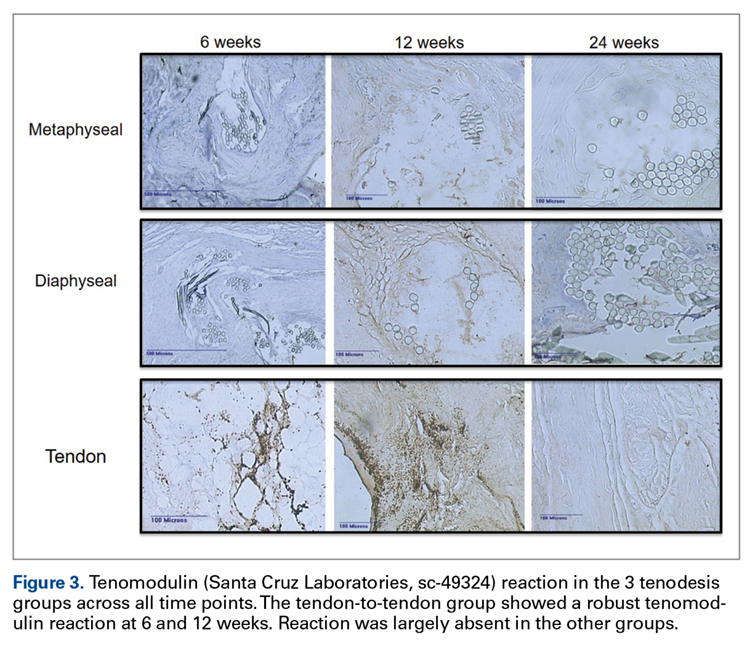
At 6 weeks, antigen retrieval resulted in severe degradation of 2 group M specimens, 2 group D specimens, and 1 group T specimen. The most notable tenomodulin reaction occurred in group T at the 6- and 12-week harvests, with the 6-week group having the most robust reaction. There was scant reaction in this group at 24 weeks.
Figure 3.One group D specimen showed a positive reaction at 24 weeks. No reaction occurred in the remaining bony specimens across all time points (Figure 3).
Discussion
In this study, the healing response differed between bony and soft-tissue tenodesis techniques in a rat model. Tendon-to-bone tenodesis, both diaphyseal and metaphyseal, appeared to incite an inflammatory degenerative response, whereas tendon-to-tendon healing occurred in a more quiescent and perhaps even regenerative manner.
The early inflammatory response that occurred in the bony tenodesis groups is not unlike what occurs in fracture healing.27 The reaction was even more robust at 12 weeks, signifying an ongoing inflammatory process. In this context, tendon degeneration may plausibly explain the consistent absence of mature tendon within the tunnels at all 3 time points. Some tendon degeneration may be explained by the vascular damage that occurred during surgery, but this damage was a constant factor in all 3 study groups. Interestingly, group M showed the highest early CD68 counts, consistent with this being the more biologically active region of bone.28
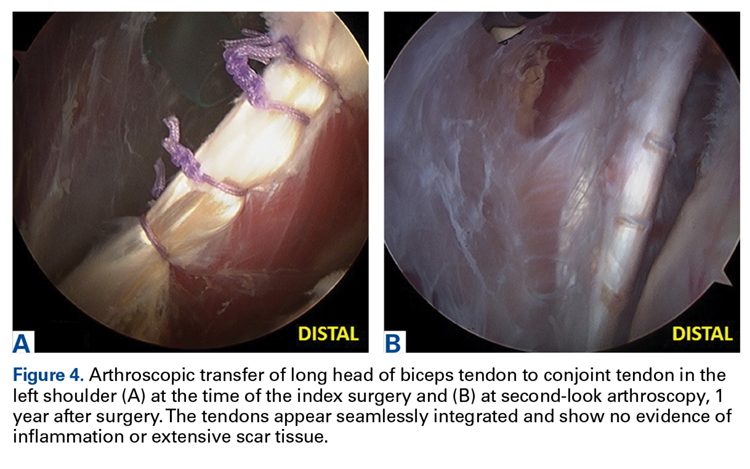
Group T had significantly lower cell and macrophage counts throughout the study period, possibly indicating improved healing—an observation supported by a study in which the impact of macrophage depletion on bone-tendon interface healing was evaluated.29 The authors found that, in suppressing macrophage activity, the morphologic and biomechanical properties at the healing interface were significantly improved.29 These findings are consistent with Dr. O’Brien’s anecdotal experience with patients who previously underwent the biceps transfer; on second-look arthroscopy, there was complete seamless integration of tendon and conjoint tendon (Figure 4).
Figure 4.
Studies have found that the inflammatory process is closely associated with pain, and pain syndromes such as fibromyalgia.30,31 Persistent inflammation, as seen in our bony tenodesis group, could explain the recalcitrant anterior shoulder pain that often occurs in patients after bony tenodesis of the LHBT.2,6,19,32
Studies have also suggested that osteoclasts at the bone-tendon interface—osteoclasts share a cell lineage with macrophages—may contribute to bone loss and tunnel widening.33,34 Osteoclasts are expected at the bone tunnel, as fracture healing occurs at the bone-tendon interface. These osteoclasts could have contributed to the strong CD68 reaction in our bony tenodesis groups. However, CD68 historically has been described as the classic macrophage marker.35 We specifically selected CD68 for this reason: Macrophages are the primary inflammatory cells involved in early healing and are key to the inflammatory process.36
Results of the tenomodulin analysis suggested 2 different healing processes are occurring in the bony and tendon groups. Tenomodulin is a known tenocyte marker for developing and mature tendon in both rats and humans.37,38 In our study, only group T had a positive tenomodulin reaction. Notably, the reaction occurred only at 6 and 12 weeks. This finding may indicate that a regenerative healing pattern becomes quiescent by 24 weeks. Indeed, it has been suggested that tenomodulin is a key regulator of tenocyte proliferation and tendon maturation.39
The complete absence of tenomodulin reaction in our bony tenodesis groups in the setting of significant inflammation further supports our theory of tendon degeneration within the tunnel. One potential explanation for this finding may be that as the tendon heals to the surface of the bone, the intra-osseous tendon is no longer load-bearing and is resorbed by the body through an inflammatory response. This finding differs from those in previous studies, which have described viable tendon within the bone tunnel at all time points up to 26 weeks.40 More recently, it has been suggested that callus formation at the external cortical tendon-bone interface is critical for healing and mechanical strength.41,42 In addition, recent studies have found a predominantly fibroblastic healing process at the midtunnel, potentially leading to the formation of loose fibrovascular tissue at the tendon-bone interface.43 These data, in concert with ours, call into question the rationale for performing intra-osseous tenodesis through bone tunnels.
Our study results, if confirmed in humans, will have significant clinical implications. If a similar effect can be confirmed in the human shoulder, one could argue that soft-tissue tenodesis may result in decreased postoperative shoulder pain. In addition, if tendon degeneration does occur within the intramedullary tunnel, surface fixation may be the better, safer alternative. Although older studies reported suboptimal strength with this type of fixation,8,44 more recent studies have found surface fixation strength equivalent to screw fixation strength.45,46 Such a shift in the treatment paradigm would obviate the need for violation of the humeral cortex, eliminating potential stress risers associated with screw fixation,47 and effectively eliminating the risk of iatrogenic fracture.48,49 It would be interesting to investigate what occurs histologically at the bone-tendon interface in surface fixation (ie, suture anchors). Would the inflammatory response at the surface be similar to the inflammatory intramedullary healing, or would it be similar to the quieter tendon-tendon healing? Answers to such questions have the potential to streamline the treatment algorithm for patients who require tenodesis.
Study Limitations
Our study had several limitations. First, as this was a basic science study using a rat model, its conclusions can only be extrapolated to humans. Second, given the nonspecific nature of the cellular analysis, we cannot draw any definitive conclusions about the cell population at the bone-tendon interface. For example, although tenomodulin is expressed by tenocytes, it is not an established specific marker for tenocytes and may be expressed by other fibroblastic cells. Still, our results provide insight into the local microenvironment and identify important differences between the tenodesis methods. Similarly, the complete absence of tendon within the bone tunnels suggests that an analysis of osteoclastic activity at the tenodesis interface may have been a valuable addition to the study. This finding, however, was unexpected, and we did not have the foresight to include it in our methods. A third limitation is that our fixation method essentially uses the suspension tenodesis method. This fixation method differs from the common fixation techniques used in the clinical setting. Testing of other fixation constructs would require a larger animal model. Furthermore, in suspension- type constructs, micromotion within the bone tunnel may independently elicit an inflammatory response. Inert suture was used in our fixation in order to reduce the risk of an iatrogenic inflammatory response. Last, it would have been valuable to perform a biomechanical analysis of the strength of each tenodesis construct. This was explored with our institution’s biomechanics team, but specimen size precluded successful analysis.
Conclusion
Our results indicated that, compared with tendon-to-tendon fixation, tendon-to-bone tenodesis produces a significantly greater inflammatory response at the tenodesis interface. An inflammatory milieu in the absence of tendon within the bony tunnel suggests intraosseous tendon degeneration. Tendon-to-tendon tenodesis, on the other hand, seems to limit the inflammatory response. In addition, a robust tenomodulin reaction in the early phases of tendon-to-tendon healing suggests regenerative healing. Our results showed a fundamental difference in the healing response between the 2 tenodesis methods. Further study is needed to evaluate the validity and applicability of our findings to the human patient population. Most important, our results underscore the need for more study to elucidate optimal tenodesis location and encourage orthopedic surgeons to reexamine current clinical practice patterns.
References
1. Alpantaki K, McLaughlin D, Karagogeos D, Hadjipavlou A, Kontakis G. Sympathetic and sensory neural elements in the tendon of the long head of the biceps. J Bone Joint Surg Am. 2005;87(7):1580-1583.
2. Nho SJ, Strauss EJ, Lenart BA, et al. Long head of the biceps tendinopathy: diagnosis and management. J Am Acad Orthop Surg. 2010;18(11):645-656.
3. Provencher MT, LeClere LE, Romeo AA. Subpectoral biceps tenodesis. Sports Med Arthrosc. 2008;16(3):170-176.
4. Werner BC, Brockmeier SF, Gwathmey FW. Trends in long head biceps tenodesis. Am J Sports Med. 2015;43(3):570-578.
5. Boileau P, Baque F, Valerio L, Ahrens P, Chuinard C, Trojani C. Isolated arthroscopic biceps tenotomy or tenodesis improves symptoms in patients with massive irreparable rotator cuff tears. J Bone Joint Surg Am. 2007;89(4):747-757.
6. Becker DA, Cofield RH. Tenodesis of the long head of the biceps brachii for chronic bicipital tendinitis. Long-term results. J Bone Joint Surg Am. 1989;71(3):376-381.
7. Richards DP, Burkhart SS. Arthroscopic-assisted biceps tenodesis for ruptures of the long head of biceps brachii: the cobra procedure. Arthroscopy. 2004;20(suppl 2):201-207.
8. Ozalay M, Akpinar S, Karaeminogullari O, et al. Mechanical strength of four different biceps tenodesis techniques. Arthroscopy. 2005;21(8):992-998.
9. Mazzocca AD, Bicos J, Santangelo S, Romeo AA, Arciero RA. The biomechanical evaluation of four fixation techniques for proximal biceps tenodesis. Arthroscopy. 2005;21(11):1296-1306.
10. Kilicoglu O, Koyuncu O, Demirhan M, et al. Time-dependent changes in failure loads of 3 biceps tenodesis techniques: in vivo study in a sheep model. Am J Sports Med. 2005;33(10):1536-1544.
11. Golish SR, Caldwell PE 3rd, Miller MD, et al. Interference screw versus suture anchor fixation for subpectoral tenodesis of the proximal biceps tendon: a cadaveric study. Arthroscopy. 2008;24(10):1103-1108.
12. Kusma M, Dienst M, Eckert J, Steimer O, Kohn D. Tenodesis of the long head of biceps brachii: cyclic testing of five methods of fixation in a porcine model. J Shoulder Elbow Surg. 2008;17(6):967-973.
13. Buchholz A, Martetschlager F, Siebenlist S, et al. Biomechanical comparison of intramedullary cortical button fixation and interference screw technique for subpectoral biceps tenodesis. Arthroscopy. 2013;29(5):845-853.
14. Werner BC, Lyons ML, Evans CL, et al. Arthroscopic suprapectoral and open subpectoral biceps tenodesis: a comparison of restoration of length-tension and mechanical strength between techniques. Arthroscopy. 2015;31(4):620-627.
15. Gilmer BB, DeMers AM, Guerrero D, Reid JB 3rd, Lubowitz JH, Guttmann D. Arthroscopic versus open comparison of long head of biceps tendon visualization and pathology in patients requiring tenodesis. Arthroscopy. 2015;31(1):29-34.
16. Sanders B, Lavery KP, Pennington S, Warner JJ. Clinical success of biceps tenodesis with and without release of the transverse humeral ligament. J Shoulder Elbow Surg. 2012;21(1):66-71.
17. Taylor SA, Fabricant PD, Bansal M, et al. The anatomy and histology of the bicipital tunnel of the shoulder. J Shoulder Elbow Surg. 2015;24(4):511-519.
18. Taylor SA, Khair MM, Gulotta LV, et al. Diagnostic glenohumeral arthroscopy fails to fully evaluate the biceps-labral complex. Arthroscopy. 2015;31(2):215-224.
19. Lutton DM, Gruson KI, Harrison AK, Gladstone JN, Flatow EL. Where to tenodese the biceps: proximal or distal? Clin Orthop Relat Res. 2011;469(4):1050-1055.
20. Moon SC, Cho NS, Rhee YG. Analysis of “hidden lesions” of the extra-articular biceps after subpectoral biceps tenodesis: the subpectoral portion as the optimal tenodesis site. Am J Sports Med. 2015;43(1):63-68.
21. Festa A, Allert J, Issa K, Tasto JP, Myer JJ. Visualization of the extra-articular portion of the long head of the biceps tendon during intra-articular shoulder arthroscopy. Arthroscopy. 2014;30(11):1413-1417.
22. Friedman DJ, Dunn JC, Higgins LD, Warner JJ. Proximal biceps tendon: injuries and management. Sports Med Arthrosc. 2008;16(3):162-169.
23. Verma NN, Drakos M, O’Brien SJ. Arthroscopic transfer of the long head biceps to the conjoint tendon. Arthroscopy. 2005;21(6):764.
24. O’Brien SJ, Taylor SA, DiPietro JR, Newman AM, Drakos MC, Voos JE. The arthroscopic “subdeltoid approach” to the anterior shoulder. J Shoulder Elbow Surg. 2013;22(4):e6-e10.
25. Drakos MC, Verma NN, Gulotta LV, et al. Arthroscopic transfer of the long head of the biceps tendon: functional outcome and clinical results. Arthroscopy. 2008;24(2):217-223.
26. Taylor SA, Fabricant PD, Baret NJ, et al. Midterm clinical outcomes for arthroscopic subdeltoid transfer of the long head of the biceps tendon to the conjoint tendon. Arthroscopy. 2014;30(12):1574-1581.
27. Marsell R, Einhorn TA. The biology of fracture healing. Injury. 2011;42(6):551-555.
28. Khan SN, Cammisa FP Jr, Sandhu HS, Diwan AD, Girardi FP, Lane JM. The biology of bone healing. J Am Acad Orthop Surg. 2005;13(1):77-86.
29. Hays PL, Kawamura S, Deng XH, et al. The role of macrophages in early healing of a tendon graft in a bone tunnel. J Bone Joint Surg Am. 2008;90(3):565-579.
30. Uhl RL, Roberts TT, Papaliodis DN, Mulligan MT, Dubin AH. Management of chronic musculoskeletal pain. J Am Acad Orthop Surg. 2014;22(2):101-110.
31. Kosek E, Altawil R, Kadetoff D, et al. Evidence of different mediators of central inflammation in dysfunctional and inflammatory pain—interleukin-8 in fibromyalgia and interleukin-1 β in rheumatoid arthritis. J Neuroimmunol. 2015;280:49-55.
32. Slenker NR, Lawson K, Ciccotti MG, Dodson CC, Cohen SB. Biceps tenotomy versus tenodesis: clinical outcomes. Arthroscopy. 2012;28(4):576-582.
33. Rodeo SA, Kawamura S, Kim HJ, Dynybil C, Ying L. Tendon healing in a bone tunnel differs at the tunnel entrance versus the tunnel exit: an effect of graft-tunnel motion? Am J Sports Med. 2006;34(11):1790-1800.
34. Hjorthaug GA, Madsen JE, Nordsletten L, Reinholt FP, Steen H, Dimmen S. Tendon to bone tunnel healing—a study on the time-dependent changes in biomechanics, bone remodeling, and histology in a rat model. J Orthop Res. 2015;33(2):216-223.
35. Pulford KA, Sipos A, Cordell JL, Stross WP, Mason DY. Distribution of the CD68 macrophage/myeloid associated antigen. Int Immunol. 1990;2(10):973-980.
36. Fujiwara N, Kobayashi K. Macrophages in inflammation. Curr Drug Targets Inflamm Allergy. 2005;4(3):281-286.
37. Qi J, Dmochowski JM, Banes AN, et al. Differential expression and cellular localization of novel isoforms of the tendon biomarker tenomodulin. J Appl Physiol (1985). 2012;113(6):861-871.
38. Jelinsky SA, Archambault J, Li L, Seeherman H. Tendon-selective genes identified from rat and human musculoskeletal tissues. J Orthop Res. 2010;28(3):289-297.
39. Docheva D, Hunziker EB, Fassler R, Brandau O. Tenomodulin is necessary for tenocyte proliferation and tendon maturation. Mol Cell Biol. 2005;25(2):699-705.
40. Rodeo SA, Arnoczky SP, Torzilli PA, Hidaka C, Warren RF. Tendon-healing in a bone tunnel. A biomechanical and histological study in the dog. J Bone Joint Surg Am. 1993;75(12):1795-1803.
41. Silva MJ, Thomopoulos S, Kusano N, et al. Early healing of flexor tendon insertion site injuries: tunnel repair is mechanically and histologically inferior to surface repair in a canine model. J Orthop Res. 2006;24(5):990-1000.
42. Hibino N, Hamada Y, Sairyo K, Yukata K, Sano T, Yasui N. Callus formation during healing of the repaired tendon–bone junction. A rat experimental model. J Bone Joint Surg Br. 2007;89(11):1539-1544.
43. Bedi A, Kawamura S, Ying L, Rodeo SA. Differences in tendon graft healing between the intra-articular and extra-articular ends of a bone tunnel. HSS J. 2009;5(1):51-57.
44. Richards DP, Burkhart SS. A biomechanical analysis of two biceps tenodesis fixation techniques. Arthroscopy. 2005;21(7):861-866.
45. Mazzocca AD, Cote MP, Arciero CL, Romeo AA, Arciero RA. Clinical outcomes after subpectoral biceps tenodesis with an interference screw. Am J Sports Med. 2008;36(10):1922-1929.
46. Baleani M, Francesconi D, Zani L, Giannini S, Snyder SJ. Suprapectoral biceps tenodesis: a biomechanical comparison of a new “soft anchor” tenodesis technique versus interference screw biceps tendon fixation. Clin Biomech. 2015;30(2):188-194.
47. Euler SA, Smith SD, Williams BT, Dornan GJ, Millett PJ, Wijdicks CA. Biomechanical analysis of subpectoral biceps tenodesis: effect of screw malpositioning on proximal humeral strength. Am J Sports Med. 2015;43(1):69-74.
Cellular healing response differs between bony and soft tissue biceps tenodesis.
Bony tenodesis incites an inflammatory healing response.
Bony tenodesis healing occurs at the tendon-bone interface.
Intrasseous bony fixation leads to tendon degeneration within the bone.
Tendon-to-tendon tenodesis may result in regenerative tendon healing.
The long head of the biceps tendon (LHBT) is a well-established pain generator of the anterior shoulder1,2 and may be surgically addressed in refractory cases.3 According to a recent study of 44,932 cases, biceps tenodesis rates increased 80% over just 3 years (2008-2011).4 Nevertheless, optimal tenodesis location and technique remain controversial. Proximal and distal tenodesis, including numerous soft-tissue and bony techniques, have been described.5-7 Several studies have focused on the biomechanical strength of various fixation modalities.8-14 These data highlight the ongoing evolution of our understanding of biceps-labrum complex (BLC) disease.
Over the years, tenodesis location has proved to be an important factor in outcomes.3,15-20 Several recent studies have elucidated the role of the extra-articular LHBT and the limited capabilities of diagnostic arthroscopy.15-17,20,21 Taylor and colleagues17 defined the bicipital tunnel as the extra-articular segment of LHBT and its fibro-osseous enclosure. The tunnel extends from the articular margin through the subpectoral region and can be divided into 3 zones: Zone 1 goes from the articular margin to the inferior margin of the subscapularis, zone 2 goes from the inferior margin of the subscapularis to the proximal margin of the pectoralis major tendon, and zone 3 is the subpectoral region. Zone 2 is often referred to as “no man’s land” for its relative invisibility from arthroscopy above and open exposure below.17,21 Notably, a recent study reported a 47% prevalence of hidden tunnel lesions in patients with chronic BLC disease symptoms.18 Other studies have shown that standard proximal tenodesis methods often fail to address LHBT pathology in this area, leading to residual symptoms.9,22 It is evident that tenodesis location and technique play important roles in patient outcomes. Sanders and colleagues16 found that the revision rate was significantly higher among patients who underwent biceps tenodesis without release of the bicipital tunnel sheath than among patients who underwent tenodesis with the release. Dr. O’Brien developed an alternative option: soft-tissue tenodesis with transfer of the LHBT to the conjoint tendon within the subdeltoid space.23,24 This technique addresses intra-articular and extra-articular tunnel disease while mitigating the complications associated with bony tenodesis. Early and midterm studies have shown this to be an effective intervention for chronically symptomatic BLC disease.25,26
Despite the abundance of literature on tenodesis techniques, no one has histologically evaluated the location-dependent healing and inflammatory responses. We conducted a study to determine the impact of tenodesis location on healing and inflammation in a rat model. We hypothesized that, compared with tendon-to-bone techniques, soft-tissue tenodesis would minimize inflammatory response and optimize healing.
Methods
The study was approved by the Institutional Animal Care and Use Committee at the Hospital for Special Surgery.
Animals
Biceps tenodesis was performed at 1 of 3 locations in 36 thirteen-week-old Sprague-Dawley rats (Charles River Laboratories). All rats were prepared for surgery by an experienced veterinary technician. Sedation was induced with isoflurane gas through a nose cone.
Surgical Procedure
Animals were randomly assigned to 3 different tenodesis groups: tendon-to-bone in the bicipital groove (metaphyseal, M); tendon-to-bone in the subpectoral region (diaphyseal, D); and soft tissue-to-soft tissue transfer to the conjoint tendon (T). A standard deltopectoral approach was used to expose the biceps tendon. The tendon was tagged with a 5-0 polypropylene suture and tenotomized at the level of the bicipital groove (zone 1). All wounds were irrigated and closed with 4-0 nylon suture.
For animals undergoing tendon-to-bone metaphyseal tenodesis, a 0.045-mm Kirschner wire was used to drill bicortically into the intertubercular sulcus. Wire positioning distal to the physeal plate was confirmed with fluoroscopy. A locking stitch of 5-0 polypropylene suture was run along the free edge of the tendon. The tendon was then passed through the bone tunnel in an anterior-to-posterior direction, and the limbs of the suture were tied around the lateral cortex.
The process was repeated for animals undergoing diaphyseal tenodesis; only the tenodesis location was different. The inferior border of the pectoralis major was identified, and a bicortical tunnel was made in the center of the diaphyseal bone. The tendon was then prepared and tenodesed to bone using the method already described.
In soft-tissue tenodesis, the conjoint tendon was identified and carefully dissected from surrounding tissues. The LHBT was then tenodesed to the attached conjoint tendon with interrupted simple stitches of 5-0 polypropylene suture.
The animals were allowed to bear weight on the operative limb immediately after surgery and without immobilization.
Specimen Harvest and Preparation
Four animals from each group were sacrificed at 6, 12, and 24 weeks. Harvested specimens were fixed in 10% neutral-buffered formalin solution. Bony specimens consisted of the upper half of the humerus and the tenodesed biceps tendon, and soft-tissue specimens consisted of the tenodesed LHBT-conjoint tendon complex. Bony specimens were decalcified in 10% ethylenediaminetetraacetic acid. All specimens were paraffin-embedded and sectioned at 7 microns.
Analysis of Cellularity
Sections were stained with hematoxylin-eosin. Overall cellularity at the tenodesis interface was quantified by averaging the nuclei count within 3 separate standardized ×20 magnification high power fields. Only nucleated cells were included in the cell count. Immunohistochemical staining with tenomodulin (Santa Cruz Laboratories, sc-49324) was performed to characterize the cell population at the interface. Deparaffinized sections underwent antigen retrieval with pronase for 30 minutes at 37°C and were incubated overnight with the anti-tenomodulin goat monoclonal antibody diluted to 1:200 in 1% phosphate-buffered saline. The prepared slides were then counterstained with methyl green. Specimens treated with tenomodulin were evaluated for presence or absence of a positive reaction at the tenodesis interface.
Analysis of Inflammation
Inflammation at the interface was evaluated with the CD68 macrophage marker (ABcam, ab31630). Deparaffinized sections underwent antigen retrieval with pronase for 30 minutes at 37°C and were incubated overnight with anti-CD68 mouse monoclonal antibodies diluted to 1:200 in 1% phosphate-buffered saline. The prepared slides were then counterstained with neutral red. Inflammation was quantified by averaging the number of reactive cells within 3 separate standardized ×20 magnification high power fields.
Statistical Analysis
Descriptive statistics were calculated for cell and macrophage counts for each group at every time point. Two-way analysis of variance was used to compare the cell and macrophage counts between groups at each time point as well as the count differences within each group between time points. P values were Bonferroni-corrected to account for the multiple comparisons between groups. P < .05 was used to signify statistical significance.
Results
All 36 animals survived to their designated harvest time without complications. Twelve specimens were successfully harvested at 6 weeks and another 12 at 24 weeks. At 12 weeks, tenodesis failure occurred in 1 animal in group D, leaving 11 specimens for analysis.
Cellularity
Table 1.At the 6-week harvest, 1 group T specimen was sectioned incorrectly and discarded, leaving 3 specimens for evaluation. Descriptive statistics for each group and each time point are listed in Table 1A. There were no significant differences in mean cellularity between the bony tenodesis groups at any time point (P = 1.000) (Table 1B).
Figure 1.At 6 weeks, both group M (P = .012) and group D (P = .021) showed significantly more cellularity than group T (Figure 1). The same was true for group M (P = .002) and group D (P = .001) at the 12-week harvest. There were no significant differences in cellularity between the 3 groups at 24 weeks.
Within-group analysis revealed a trend of increasing cellularity at 12 weeks followed by a decrease at 24 weeks in all 3 groups (Table 2).
Table 2.Group M showed a significant overall decrease in cellularity from 6 to 24 weeks (P = .035) and from 12 to 24 weeks (P = .004). The overall decrease in cell count from 6 to 24 weeks was not significant in group D (P = .124), whereas the decrease from 12 to 24 weeks was significant (P = .005). There were no significant differences in cellularity for group T between any of the time points.
Inflammatory Response
During specimen processing, 1 group D specimen was severely degraded after pronase treatment, leaving 3 specimens for evaluation. Descriptive statistics for each group are listed in Table 3A.
Table 3.
At 6 weeks, mean CD68 cell count was significantly higher in group M than in group D (P = .011) and group T (P < .001) (Table 3B). Likewise, CD68 count was significantly higher in group D than in group T (P < .001). There were no differences in CD68 counts between the 2 bony tenodesis groups at 12 weeks (P = .486) or 24 weeks (P = .315). Both bony tenodesis groups, however, had persistently higher CD68 counts at 12 weeks when compared with group T (group M, P = .002; group D, P < .001). In these specimens, an inflammatory milieu characterized by a large accumulation of lymphocytes and giant cells was noted at the bone-tendon interface.
Figure 2. In comparison, inflammatory cells were scant at the tendon-tendon interface in group T specimens (Figure 2). There were no differences in CD68 reaction between the 3 tenodesis groups at 24 weeks. In all cases of tendon-to-bone tenodesis, no recognizable formed tendon was seen within the bone tunnel. Rather, all tendon-to-bone tenodeses were characterized by dense connective tissue at the bone surface, surrounded by an accumulation of macrophages.
Table 4.Within-group analysis revealed a significant decrease in CD68 cells from 6 to 12 weeks and overall from 6 to 24 weeks in group M (Table 4). There was no significant change in CD68 cell counts between any time points within group D (P = 1.000) and between 6 and 12 weeks in group T (P = 1.000). Interestingly, the CD68 counts in group T showed an overall increase from 6 to 24 weeks (P = .019). The increase was even more significant from 12 to 24 weeks (P = .004).
Tissue-Specific Staining
At 6 weeks, antigen retrieval resulted in severe degradation of 2 group M specimens, 2 group D specimens, and 1 group T specimen. The most notable tenomodulin reaction occurred in group T at the 6- and 12-week harvests, with the 6-week group having the most robust reaction. There was scant reaction in this group at 24 weeks.
Figure 3.One group D specimen showed a positive reaction at 24 weeks. No reaction occurred in the remaining bony specimens across all time points (Figure 3).
Discussion
In this study, the healing response differed between bony and soft-tissue tenodesis techniques in a rat model. Tendon-to-bone tenodesis, both diaphyseal and metaphyseal, appeared to incite an inflammatory degenerative response, whereas tendon-to-tendon healing occurred in a more quiescent and perhaps even regenerative manner.
The early inflammatory response that occurred in the bony tenodesis groups is not unlike what occurs in fracture healing.27 The reaction was even more robust at 12 weeks, signifying an ongoing inflammatory process. In this context, tendon degeneration may plausibly explain the consistent absence of mature tendon within the tunnels at all 3 time points. Some tendon degeneration may be explained by the vascular damage that occurred during surgery, but this damage was a constant factor in all 3 study groups. Interestingly, group M showed the highest early CD68 counts, consistent with this being the more biologically active region of bone.28
Group T had significantly lower cell and macrophage counts throughout the study period, possibly indicating improved healing—an observation supported by a study in which the impact of macrophage depletion on bone-tendon interface healing was evaluated.29 The authors found that, in suppressing macrophage activity, the morphologic and biomechanical properties at the healing interface were significantly improved.29 These findings are consistent with Dr. O’Brien’s anecdotal experience with patients who previously underwent the biceps transfer; on second-look arthroscopy, there was complete seamless integration of tendon and conjoint tendon (Figure 4).
Figure 4.
Studies have found that the inflammatory process is closely associated with pain, and pain syndromes such as fibromyalgia.30,31 Persistent inflammation, as seen in our bony tenodesis group, could explain the recalcitrant anterior shoulder pain that often occurs in patients after bony tenodesis of the LHBT.2,6,19,32
Studies have also suggested that osteoclasts at the bone-tendon interface—osteoclasts share a cell lineage with macrophages—may contribute to bone loss and tunnel widening.33,34 Osteoclasts are expected at the bone tunnel, as fracture healing occurs at the bone-tendon interface. These osteoclasts could have contributed to the strong CD68 reaction in our bony tenodesis groups. However, CD68 historically has been described as the classic macrophage marker.35 We specifically selected CD68 for this reason: Macrophages are the primary inflammatory cells involved in early healing and are key to the inflammatory process.36
Results of the tenomodulin analysis suggested 2 different healing processes are occurring in the bony and tendon groups. Tenomodulin is a known tenocyte marker for developing and mature tendon in both rats and humans.37,38 In our study, only group T had a positive tenomodulin reaction. Notably, the reaction occurred only at 6 and 12 weeks. This finding may indicate that a regenerative healing pattern becomes quiescent by 24 weeks. Indeed, it has been suggested that tenomodulin is a key regulator of tenocyte proliferation and tendon maturation.39
The complete absence of tenomodulin reaction in our bony tenodesis groups in the setting of significant inflammation further supports our theory of tendon degeneration within the tunnel. One potential explanation for this finding may be that as the tendon heals to the surface of the bone, the intra-osseous tendon is no longer load-bearing and is resorbed by the body through an inflammatory response. This finding differs from those in previous studies, which have described viable tendon within the bone tunnel at all time points up to 26 weeks.40 More recently, it has been suggested that callus formation at the external cortical tendon-bone interface is critical for healing and mechanical strength.41,42 In addition, recent studies have found a predominantly fibroblastic healing process at the midtunnel, potentially leading to the formation of loose fibrovascular tissue at the tendon-bone interface.43 These data, in concert with ours, call into question the rationale for performing intra-osseous tenodesis through bone tunnels.
Our study results, if confirmed in humans, will have significant clinical implications. If a similar effect can be confirmed in the human shoulder, one could argue that soft-tissue tenodesis may result in decreased postoperative shoulder pain. In addition, if tendon degeneration does occur within the intramedullary tunnel, surface fixation may be the better, safer alternative. Although older studies reported suboptimal strength with this type of fixation,8,44 more recent studies have found surface fixation strength equivalent to screw fixation strength.45,46 Such a shift in the treatment paradigm would obviate the need for violation of the humeral cortex, eliminating potential stress risers associated with screw fixation,47 and effectively eliminating the risk of iatrogenic fracture.48,49 It would be interesting to investigate what occurs histologically at the bone-tendon interface in surface fixation (ie, suture anchors). Would the inflammatory response at the surface be similar to the inflammatory intramedullary healing, or would it be similar to the quieter tendon-tendon healing? Answers to such questions have the potential to streamline the treatment algorithm for patients who require tenodesis.
Study Limitations
Our study had several limitations. First, as this was a basic science study using a rat model, its conclusions can only be extrapolated to humans. Second, given the nonspecific nature of the cellular analysis, we cannot draw any definitive conclusions about the cell population at the bone-tendon interface. For example, although tenomodulin is expressed by tenocytes, it is not an established specific marker for tenocytes and may be expressed by other fibroblastic cells. Still, our results provide insight into the local microenvironment and identify important differences between the tenodesis methods. Similarly, the complete absence of tendon within the bone tunnels suggests that an analysis of osteoclastic activity at the tenodesis interface may have been a valuable addition to the study. This finding, however, was unexpected, and we did not have the foresight to include it in our methods. A third limitation is that our fixation method essentially uses the suspension tenodesis method. This fixation method differs from the common fixation techniques used in the clinical setting. Testing of other fixation constructs would require a larger animal model. Furthermore, in suspension- type constructs, micromotion within the bone tunnel may independently elicit an inflammatory response. Inert suture was used in our fixation in order to reduce the risk of an iatrogenic inflammatory response. Last, it would have been valuable to perform a biomechanical analysis of the strength of each tenodesis construct. This was explored with our institution’s biomechanics team, but specimen size precluded successful analysis.
Conclusion
Our results indicated that, compared with tendon-to-tendon fixation, tendon-to-bone tenodesis produces a significantly greater inflammatory response at the tenodesis interface. An inflammatory milieu in the absence of tendon within the bony tunnel suggests intraosseous tendon degeneration. Tendon-to-tendon tenodesis, on the other hand, seems to limit the inflammatory response. In addition, a robust tenomodulin reaction in the early phases of tendon-to-tendon healing suggests regenerative healing. Our results showed a fundamental difference in the healing response between the 2 tenodesis methods. Further study is needed to evaluate the validity and applicability of our findings to the human patient population. Most important, our results underscore the need for more study to elucidate optimal tenodesis location and encourage orthopedic surgeons to reexamine current clinical practice patterns.
Take-Home Points
Cellular healing response differs between bony and soft tissue biceps tenodesis.
Bony tenodesis incites an inflammatory healing response.
Bony tenodesis healing occurs at the tendon-bone interface.
Intrasseous bony fixation leads to tendon degeneration within the bone.
Tendon-to-tendon tenodesis may result in regenerative tendon healing.
The long head of the biceps tendon (LHBT) is a well-established pain generator of the anterior shoulder1,2 and may be surgically addressed in refractory cases.3 According to a recent study of 44,932 cases, biceps tenodesis rates increased 80% over just 3 years (2008-2011).4 Nevertheless, optimal tenodesis location and technique remain controversial. Proximal and distal tenodesis, including numerous soft-tissue and bony techniques, have been described.5-7 Several studies have focused on the biomechanical strength of various fixation modalities.8-14 These data highlight the ongoing evolution of our understanding of biceps-labrum complex (BLC) disease.
Over the years, tenodesis location has proved to be an important factor in outcomes.3,15-20 Several recent studies have elucidated the role of the extra-articular LHBT and the limited capabilities of diagnostic arthroscopy.15-17,20,21 Taylor and colleagues17 defined the bicipital tunnel as the extra-articular segment of LHBT and its fibro-osseous enclosure. The tunnel extends from the articular margin through the subpectoral region and can be divided into 3 zones: Zone 1 goes from the articular margin to the inferior margin of the subscapularis, zone 2 goes from the inferior margin of the subscapularis to the proximal margin of the pectoralis major tendon, and zone 3 is the subpectoral region. Zone 2 is often referred to as “no man’s land” for its relative invisibility from arthroscopy above and open exposure below.17,21 Notably, a recent study reported a 47% prevalence of hidden tunnel lesions in patients with chronic BLC disease symptoms.18 Other studies have shown that standard proximal tenodesis methods often fail to address LHBT pathology in this area, leading to residual symptoms.9,22 It is evident that tenodesis location and technique play important roles in patient outcomes. Sanders and colleagues16 found that the revision rate was significantly higher among patients who underwent biceps tenodesis without release of the bicipital tunnel sheath than among patients who underwent tenodesis with the release. Dr. O’Brien developed an alternative option: soft-tissue tenodesis with transfer of the LHBT to the conjoint tendon within the subdeltoid space.23,24 This technique addresses intra-articular and extra-articular tunnel disease while mitigating the complications associated with bony tenodesis. Early and midterm studies have shown this to be an effective intervention for chronically symptomatic BLC disease.25,26
Despite the abundance of literature on tenodesis techniques, no one has histologically evaluated the location-dependent healing and inflammatory responses. We conducted a study to determine the impact of tenodesis location on healing and inflammation in a rat model. We hypothesized that, compared with tendon-to-bone techniques, soft-tissue tenodesis would minimize inflammatory response and optimize healing.
Methods
The study was approved by the Institutional Animal Care and Use Committee at the Hospital for Special Surgery.
Animals
Biceps tenodesis was performed at 1 of 3 locations in 36 thirteen-week-old Sprague-Dawley rats (Charles River Laboratories). All rats were prepared for surgery by an experienced veterinary technician. Sedation was induced with isoflurane gas through a nose cone.
Surgical Procedure
Animals were randomly assigned to 3 different tenodesis groups: tendon-to-bone in the bicipital groove (metaphyseal, M); tendon-to-bone in the subpectoral region (diaphyseal, D); and soft tissue-to-soft tissue transfer to the conjoint tendon (T). A standard deltopectoral approach was used to expose the biceps tendon. The tendon was tagged with a 5-0 polypropylene suture and tenotomized at the level of the bicipital groove (zone 1). All wounds were irrigated and closed with 4-0 nylon suture.
For animals undergoing tendon-to-bone metaphyseal tenodesis, a 0.045-mm Kirschner wire was used to drill bicortically into the intertubercular sulcus. Wire positioning distal to the physeal plate was confirmed with fluoroscopy. A locking stitch of 5-0 polypropylene suture was run along the free edge of the tendon. The tendon was then passed through the bone tunnel in an anterior-to-posterior direction, and the limbs of the suture were tied around the lateral cortex.
The process was repeated for animals undergoing diaphyseal tenodesis; only the tenodesis location was different. The inferior border of the pectoralis major was identified, and a bicortical tunnel was made in the center of the diaphyseal bone. The tendon was then prepared and tenodesed to bone using the method already described.
In soft-tissue tenodesis, the conjoint tendon was identified and carefully dissected from surrounding tissues. The LHBT was then tenodesed to the attached conjoint tendon with interrupted simple stitches of 5-0 polypropylene suture.
The animals were allowed to bear weight on the operative limb immediately after surgery and without immobilization.
Specimen Harvest and Preparation
Four animals from each group were sacrificed at 6, 12, and 24 weeks. Harvested specimens were fixed in 10% neutral-buffered formalin solution. Bony specimens consisted of the upper half of the humerus and the tenodesed biceps tendon, and soft-tissue specimens consisted of the tenodesed LHBT-conjoint tendon complex. Bony specimens were decalcified in 10% ethylenediaminetetraacetic acid. All specimens were paraffin-embedded and sectioned at 7 microns.
Analysis of Cellularity
Sections were stained with hematoxylin-eosin. Overall cellularity at the tenodesis interface was quantified by averaging the nuclei count within 3 separate standardized ×20 magnification high power fields. Only nucleated cells were included in the cell count. Immunohistochemical staining with tenomodulin (Santa Cruz Laboratories, sc-49324) was performed to characterize the cell population at the interface. Deparaffinized sections underwent antigen retrieval with pronase for 30 minutes at 37°C and were incubated overnight with the anti-tenomodulin goat monoclonal antibody diluted to 1:200 in 1% phosphate-buffered saline. The prepared slides were then counterstained with methyl green. Specimens treated with tenomodulin were evaluated for presence or absence of a positive reaction at the tenodesis interface.
Analysis of Inflammation
Inflammation at the interface was evaluated with the CD68 macrophage marker (ABcam, ab31630). Deparaffinized sections underwent antigen retrieval with pronase for 30 minutes at 37°C and were incubated overnight with anti-CD68 mouse monoclonal antibodies diluted to 1:200 in 1% phosphate-buffered saline. The prepared slides were then counterstained with neutral red. Inflammation was quantified by averaging the number of reactive cells within 3 separate standardized ×20 magnification high power fields.
Statistical Analysis
Descriptive statistics were calculated for cell and macrophage counts for each group at every time point. Two-way analysis of variance was used to compare the cell and macrophage counts between groups at each time point as well as the count differences within each group between time points. P values were Bonferroni-corrected to account for the multiple comparisons between groups. P < .05 was used to signify statistical significance.
Results
All 36 animals survived to their designated harvest time without complications. Twelve specimens were successfully harvested at 6 weeks and another 12 at 24 weeks. At 12 weeks, tenodesis failure occurred in 1 animal in group D, leaving 11 specimens for analysis.
Cellularity
Table 1.At the 6-week harvest, 1 group T specimen was sectioned incorrectly and discarded, leaving 3 specimens for evaluation. Descriptive statistics for each group and each time point are listed in Table 1A. There were no significant differences in mean cellularity between the bony tenodesis groups at any time point (P = 1.000) (Table 1B).
Figure 1.At 6 weeks, both group M (P = .012) and group D (P = .021) showed significantly more cellularity than group T (Figure 1). The same was true for group M (P = .002) and group D (P = .001) at the 12-week harvest. There were no significant differences in cellularity between the 3 groups at 24 weeks.
Within-group analysis revealed a trend of increasing cellularity at 12 weeks followed by a decrease at 24 weeks in all 3 groups (Table 2).
Table 2.Group M showed a significant overall decrease in cellularity from 6 to 24 weeks (P = .035) and from 12 to 24 weeks (P = .004). The overall decrease in cell count from 6 to 24 weeks was not significant in group D (P = .124), whereas the decrease from 12 to 24 weeks was significant (P = .005). There were no significant differences in cellularity for group T between any of the time points.
Inflammatory Response
During specimen processing, 1 group D specimen was severely degraded after pronase treatment, leaving 3 specimens for evaluation. Descriptive statistics for each group are listed in Table 3A.
Table 3.
At 6 weeks, mean CD68 cell count was significantly higher in group M than in group D (P = .011) and group T (P < .001) (Table 3B). Likewise, CD68 count was significantly higher in group D than in group T (P < .001). There were no differences in CD68 counts between the 2 bony tenodesis groups at 12 weeks (P = .486) or 24 weeks (P = .315). Both bony tenodesis groups, however, had persistently higher CD68 counts at 12 weeks when compared with group T (group M, P = .002; group D, P < .001). In these specimens, an inflammatory milieu characterized by a large accumulation of lymphocytes and giant cells was noted at the bone-tendon interface.
Figure 2. In comparison, inflammatory cells were scant at the tendon-tendon interface in group T specimens (Figure 2). There were no differences in CD68 reaction between the 3 tenodesis groups at 24 weeks. In all cases of tendon-to-bone tenodesis, no recognizable formed tendon was seen within the bone tunnel. Rather, all tendon-to-bone tenodeses were characterized by dense connective tissue at the bone surface, surrounded by an accumulation of macrophages.
Table 4.Within-group analysis revealed a significant decrease in CD68 cells from 6 to 12 weeks and overall from 6 to 24 weeks in group M (Table 4). There was no significant change in CD68 cell counts between any time points within group D (P = 1.000) and between 6 and 12 weeks in group T (P = 1.000). Interestingly, the CD68 counts in group T showed an overall increase from 6 to 24 weeks (P = .019). The increase was even more significant from 12 to 24 weeks (P = .004).
Tissue-Specific Staining
At 6 weeks, antigen retrieval resulted in severe degradation of 2 group M specimens, 2 group D specimens, and 1 group T specimen. The most notable tenomodulin reaction occurred in group T at the 6- and 12-week harvests, with the 6-week group having the most robust reaction. There was scant reaction in this group at 24 weeks.
Figure 3.One group D specimen showed a positive reaction at 24 weeks. No reaction occurred in the remaining bony specimens across all time points (Figure 3).
Discussion
In this study, the healing response differed between bony and soft-tissue tenodesis techniques in a rat model. Tendon-to-bone tenodesis, both diaphyseal and metaphyseal, appeared to incite an inflammatory degenerative response, whereas tendon-to-tendon healing occurred in a more quiescent and perhaps even regenerative manner.
The early inflammatory response that occurred in the bony tenodesis groups is not unlike what occurs in fracture healing.27 The reaction was even more robust at 12 weeks, signifying an ongoing inflammatory process. In this context, tendon degeneration may plausibly explain the consistent absence of mature tendon within the tunnels at all 3 time points. Some tendon degeneration may be explained by the vascular damage that occurred during surgery, but this damage was a constant factor in all 3 study groups. Interestingly, group M showed the highest early CD68 counts, consistent with this being the more biologically active region of bone.28
Group T had significantly lower cell and macrophage counts throughout the study period, possibly indicating improved healing—an observation supported by a study in which the impact of macrophage depletion on bone-tendon interface healing was evaluated.29 The authors found that, in suppressing macrophage activity, the morphologic and biomechanical properties at the healing interface were significantly improved.29 These findings are consistent with Dr. O’Brien’s anecdotal experience with patients who previously underwent the biceps transfer; on second-look arthroscopy, there was complete seamless integration of tendon and conjoint tendon (Figure 4).
Figure 4.
Studies have found that the inflammatory process is closely associated with pain, and pain syndromes such as fibromyalgia.30,31 Persistent inflammation, as seen in our bony tenodesis group, could explain the recalcitrant anterior shoulder pain that often occurs in patients after bony tenodesis of the LHBT.2,6,19,32
Studies have also suggested that osteoclasts at the bone-tendon interface—osteoclasts share a cell lineage with macrophages—may contribute to bone loss and tunnel widening.33,34 Osteoclasts are expected at the bone tunnel, as fracture healing occurs at the bone-tendon interface. These osteoclasts could have contributed to the strong CD68 reaction in our bony tenodesis groups. However, CD68 historically has been described as the classic macrophage marker.35 We specifically selected CD68 for this reason: Macrophages are the primary inflammatory cells involved in early healing and are key to the inflammatory process.36
Results of the tenomodulin analysis suggested 2 different healing processes are occurring in the bony and tendon groups. Tenomodulin is a known tenocyte marker for developing and mature tendon in both rats and humans.37,38 In our study, only group T had a positive tenomodulin reaction. Notably, the reaction occurred only at 6 and 12 weeks. This finding may indicate that a regenerative healing pattern becomes quiescent by 24 weeks. Indeed, it has been suggested that tenomodulin is a key regulator of tenocyte proliferation and tendon maturation.39
The complete absence of tenomodulin reaction in our bony tenodesis groups in the setting of significant inflammation further supports our theory of tendon degeneration within the tunnel. One potential explanation for this finding may be that as the tendon heals to the surface of the bone, the intra-osseous tendon is no longer load-bearing and is resorbed by the body through an inflammatory response. This finding differs from those in previous studies, which have described viable tendon within the bone tunnel at all time points up to 26 weeks.40 More recently, it has been suggested that callus formation at the external cortical tendon-bone interface is critical for healing and mechanical strength.41,42 In addition, recent studies have found a predominantly fibroblastic healing process at the midtunnel, potentially leading to the formation of loose fibrovascular tissue at the tendon-bone interface.43 These data, in concert with ours, call into question the rationale for performing intra-osseous tenodesis through bone tunnels.
Our study results, if confirmed in humans, will have significant clinical implications. If a similar effect can be confirmed in the human shoulder, one could argue that soft-tissue tenodesis may result in decreased postoperative shoulder pain. In addition, if tendon degeneration does occur within the intramedullary tunnel, surface fixation may be the better, safer alternative. Although older studies reported suboptimal strength with this type of fixation,8,44 more recent studies have found surface fixation strength equivalent to screw fixation strength.45,46 Such a shift in the treatment paradigm would obviate the need for violation of the humeral cortex, eliminating potential stress risers associated with screw fixation,47 and effectively eliminating the risk of iatrogenic fracture.48,49 It would be interesting to investigate what occurs histologically at the bone-tendon interface in surface fixation (ie, suture anchors). Would the inflammatory response at the surface be similar to the inflammatory intramedullary healing, or would it be similar to the quieter tendon-tendon healing? Answers to such questions have the potential to streamline the treatment algorithm for patients who require tenodesis.
Study Limitations
Our study had several limitations. First, as this was a basic science study using a rat model, its conclusions can only be extrapolated to humans. Second, given the nonspecific nature of the cellular analysis, we cannot draw any definitive conclusions about the cell population at the bone-tendon interface. For example, although tenomodulin is expressed by tenocytes, it is not an established specific marker for tenocytes and may be expressed by other fibroblastic cells. Still, our results provide insight into the local microenvironment and identify important differences between the tenodesis methods. Similarly, the complete absence of tendon within the bone tunnels suggests that an analysis of osteoclastic activity at the tenodesis interface may have been a valuable addition to the study. This finding, however, was unexpected, and we did not have the foresight to include it in our methods. A third limitation is that our fixation method essentially uses the suspension tenodesis method. This fixation method differs from the common fixation techniques used in the clinical setting. Testing of other fixation constructs would require a larger animal model. Furthermore, in suspension- type constructs, micromotion within the bone tunnel may independently elicit an inflammatory response. Inert suture was used in our fixation in order to reduce the risk of an iatrogenic inflammatory response. Last, it would have been valuable to perform a biomechanical analysis of the strength of each tenodesis construct. This was explored with our institution’s biomechanics team, but specimen size precluded successful analysis.
Conclusion
Our results indicated that, compared with tendon-to-tendon fixation, tendon-to-bone tenodesis produces a significantly greater inflammatory response at the tenodesis interface. An inflammatory milieu in the absence of tendon within the bony tunnel suggests intraosseous tendon degeneration. Tendon-to-tendon tenodesis, on the other hand, seems to limit the inflammatory response. In addition, a robust tenomodulin reaction in the early phases of tendon-to-tendon healing suggests regenerative healing. Our results showed a fundamental difference in the healing response between the 2 tenodesis methods. Further study is needed to evaluate the validity and applicability of our findings to the human patient population. Most important, our results underscore the need for more study to elucidate optimal tenodesis location and encourage orthopedic surgeons to reexamine current clinical practice patterns.
References
1. Alpantaki K, McLaughlin D, Karagogeos D, Hadjipavlou A, Kontakis G. Sympathetic and sensory neural elements in the tendon of the long head of the biceps. J Bone Joint Surg Am. 2005;87(7):1580-1583.
2. Nho SJ, Strauss EJ, Lenart BA, et al. Long head of the biceps tendinopathy: diagnosis and management. J Am Acad Orthop Surg. 2010;18(11):645-656.
3. Provencher MT, LeClere LE, Romeo AA. Subpectoral biceps tenodesis. Sports Med Arthrosc. 2008;16(3):170-176.
4. Werner BC, Brockmeier SF, Gwathmey FW. Trends in long head biceps tenodesis. Am J Sports Med. 2015;43(3):570-578.
5. Boileau P, Baque F, Valerio L, Ahrens P, Chuinard C, Trojani C. Isolated arthroscopic biceps tenotomy or tenodesis improves symptoms in patients with massive irreparable rotator cuff tears. J Bone Joint Surg Am. 2007;89(4):747-757.
6. Becker DA, Cofield RH. Tenodesis of the long head of the biceps brachii for chronic bicipital tendinitis. Long-term results. J Bone Joint Surg Am. 1989;71(3):376-381.
7. Richards DP, Burkhart SS. Arthroscopic-assisted biceps tenodesis for ruptures of the long head of biceps brachii: the cobra procedure. Arthroscopy. 2004;20(suppl 2):201-207.
8. Ozalay M, Akpinar S, Karaeminogullari O, et al. Mechanical strength of four different biceps tenodesis techniques. Arthroscopy. 2005;21(8):992-998.
9. Mazzocca AD, Bicos J, Santangelo S, Romeo AA, Arciero RA. The biomechanical evaluation of four fixation techniques for proximal biceps tenodesis. Arthroscopy. 2005;21(11):1296-1306.
10. Kilicoglu O, Koyuncu O, Demirhan M, et al. Time-dependent changes in failure loads of 3 biceps tenodesis techniques: in vivo study in a sheep model. Am J Sports Med. 2005;33(10):1536-1544.
11. Golish SR, Caldwell PE 3rd, Miller MD, et al. Interference screw versus suture anchor fixation for subpectoral tenodesis of the proximal biceps tendon: a cadaveric study. Arthroscopy. 2008;24(10):1103-1108.
12. Kusma M, Dienst M, Eckert J, Steimer O, Kohn D. Tenodesis of the long head of biceps brachii: cyclic testing of five methods of fixation in a porcine model. J Shoulder Elbow Surg. 2008;17(6):967-973.
13. Buchholz A, Martetschlager F, Siebenlist S, et al. Biomechanical comparison of intramedullary cortical button fixation and interference screw technique for subpectoral biceps tenodesis. Arthroscopy. 2013;29(5):845-853.
14. Werner BC, Lyons ML, Evans CL, et al. Arthroscopic suprapectoral and open subpectoral biceps tenodesis: a comparison of restoration of length-tension and mechanical strength between techniques. Arthroscopy. 2015;31(4):620-627.
15. Gilmer BB, DeMers AM, Guerrero D, Reid JB 3rd, Lubowitz JH, Guttmann D. Arthroscopic versus open comparison of long head of biceps tendon visualization and pathology in patients requiring tenodesis. Arthroscopy. 2015;31(1):29-34.
16. Sanders B, Lavery KP, Pennington S, Warner JJ. Clinical success of biceps tenodesis with and without release of the transverse humeral ligament. J Shoulder Elbow Surg. 2012;21(1):66-71.
17. Taylor SA, Fabricant PD, Bansal M, et al. The anatomy and histology of the bicipital tunnel of the shoulder. J Shoulder Elbow Surg. 2015;24(4):511-519.
18. Taylor SA, Khair MM, Gulotta LV, et al. Diagnostic glenohumeral arthroscopy fails to fully evaluate the biceps-labral complex. Arthroscopy. 2015;31(2):215-224.
19. Lutton DM, Gruson KI, Harrison AK, Gladstone JN, Flatow EL. Where to tenodese the biceps: proximal or distal? Clin Orthop Relat Res. 2011;469(4):1050-1055.
20. Moon SC, Cho NS, Rhee YG. Analysis of “hidden lesions” of the extra-articular biceps after subpectoral biceps tenodesis: the subpectoral portion as the optimal tenodesis site. Am J Sports Med. 2015;43(1):63-68.
21. Festa A, Allert J, Issa K, Tasto JP, Myer JJ. Visualization of the extra-articular portion of the long head of the biceps tendon during intra-articular shoulder arthroscopy. Arthroscopy. 2014;30(11):1413-1417.
22. Friedman DJ, Dunn JC, Higgins LD, Warner JJ. Proximal biceps tendon: injuries and management. Sports Med Arthrosc. 2008;16(3):162-169.
23. Verma NN, Drakos M, O’Brien SJ. Arthroscopic transfer of the long head biceps to the conjoint tendon. Arthroscopy. 2005;21(6):764.
24. O’Brien SJ, Taylor SA, DiPietro JR, Newman AM, Drakos MC, Voos JE. The arthroscopic “subdeltoid approach” to the anterior shoulder. J Shoulder Elbow Surg. 2013;22(4):e6-e10.
25. Drakos MC, Verma NN, Gulotta LV, et al. Arthroscopic transfer of the long head of the biceps tendon: functional outcome and clinical results. Arthroscopy. 2008;24(2):217-223.
26. Taylor SA, Fabricant PD, Baret NJ, et al. Midterm clinical outcomes for arthroscopic subdeltoid transfer of the long head of the biceps tendon to the conjoint tendon. Arthroscopy. 2014;30(12):1574-1581.
27. Marsell R, Einhorn TA. The biology of fracture healing. Injury. 2011;42(6):551-555.
28. Khan SN, Cammisa FP Jr, Sandhu HS, Diwan AD, Girardi FP, Lane JM. The biology of bone healing. J Am Acad Orthop Surg. 2005;13(1):77-86.
29. Hays PL, Kawamura S, Deng XH, et al. The role of macrophages in early healing of a tendon graft in a bone tunnel. J Bone Joint Surg Am. 2008;90(3):565-579.
30. Uhl RL, Roberts TT, Papaliodis DN, Mulligan MT, Dubin AH. Management of chronic musculoskeletal pain. J Am Acad Orthop Surg. 2014;22(2):101-110.
31. Kosek E, Altawil R, Kadetoff D, et al. Evidence of different mediators of central inflammation in dysfunctional and inflammatory pain—interleukin-8 in fibromyalgia and interleukin-1 β in rheumatoid arthritis. J Neuroimmunol. 2015;280:49-55.
32. Slenker NR, Lawson K, Ciccotti MG, Dodson CC, Cohen SB. Biceps tenotomy versus tenodesis: clinical outcomes. Arthroscopy. 2012;28(4):576-582.
33. Rodeo SA, Kawamura S, Kim HJ, Dynybil C, Ying L. Tendon healing in a bone tunnel differs at the tunnel entrance versus the tunnel exit: an effect of graft-tunnel motion? Am J Sports Med. 2006;34(11):1790-1800.
34. Hjorthaug GA, Madsen JE, Nordsletten L, Reinholt FP, Steen H, Dimmen S. Tendon to bone tunnel healing—a study on the time-dependent changes in biomechanics, bone remodeling, and histology in a rat model. J Orthop Res. 2015;33(2):216-223.
35. Pulford KA, Sipos A, Cordell JL, Stross WP, Mason DY. Distribution of the CD68 macrophage/myeloid associated antigen. Int Immunol. 1990;2(10):973-980.
36. Fujiwara N, Kobayashi K. Macrophages in inflammation. Curr Drug Targets Inflamm Allergy. 2005;4(3):281-286.
37. Qi J, Dmochowski JM, Banes AN, et al. Differential expression and cellular localization of novel isoforms of the tendon biomarker tenomodulin. J Appl Physiol (1985). 2012;113(6):861-871.
38. Jelinsky SA, Archambault J, Li L, Seeherman H. Tendon-selective genes identified from rat and human musculoskeletal tissues. J Orthop Res. 2010;28(3):289-297.
39. Docheva D, Hunziker EB, Fassler R, Brandau O. Tenomodulin is necessary for tenocyte proliferation and tendon maturation. Mol Cell Biol. 2005;25(2):699-705.
40. Rodeo SA, Arnoczky SP, Torzilli PA, Hidaka C, Warren RF. Tendon-healing in a bone tunnel. A biomechanical and histological study in the dog. J Bone Joint Surg Am. 1993;75(12):1795-1803.
41. Silva MJ, Thomopoulos S, Kusano N, et al. Early healing of flexor tendon insertion site injuries: tunnel repair is mechanically and histologically inferior to surface repair in a canine model. J Orthop Res. 2006;24(5):990-1000.
42. Hibino N, Hamada Y, Sairyo K, Yukata K, Sano T, Yasui N. Callus formation during healing of the repaired tendon–bone junction. A rat experimental model. J Bone Joint Surg Br. 2007;89(11):1539-1544.
43. Bedi A, Kawamura S, Ying L, Rodeo SA. Differences in tendon graft healing between the intra-articular and extra-articular ends of a bone tunnel. HSS J. 2009;5(1):51-57.
44. Richards DP, Burkhart SS. A biomechanical analysis of two biceps tenodesis fixation techniques. Arthroscopy. 2005;21(7):861-866.
45. Mazzocca AD, Cote MP, Arciero CL, Romeo AA, Arciero RA. Clinical outcomes after subpectoral biceps tenodesis with an interference screw. Am J Sports Med. 2008;36(10):1922-1929.
46. Baleani M, Francesconi D, Zani L, Giannini S, Snyder SJ. Suprapectoral biceps tenodesis: a biomechanical comparison of a new “soft anchor” tenodesis technique versus interference screw biceps tendon fixation. Clin Biomech. 2015;30(2):188-194.
47. Euler SA, Smith SD, Williams BT, Dornan GJ, Millett PJ, Wijdicks CA. Biomechanical analysis of subpectoral biceps tenodesis: effect of screw malpositioning on proximal humeral strength. Am J Sports Med. 2015;43(1):69-74.
49. Dein EJ, Huri G, Gordon JC, McFarland EG. A humerus fracture in a baseball pitcher after biceps tenodesis. Am J Sports Med. 2014;42(4):877-879.
References
1. Alpantaki K, McLaughlin D, Karagogeos D, Hadjipavlou A, Kontakis G. Sympathetic and sensory neural elements in the tendon of the long head of the biceps. J Bone Joint Surg Am. 2005;87(7):1580-1583.
2. Nho SJ, Strauss EJ, Lenart BA, et al. Long head of the biceps tendinopathy: diagnosis and management. J Am Acad Orthop Surg. 2010;18(11):645-656.
3. Provencher MT, LeClere LE, Romeo AA. Subpectoral biceps tenodesis. Sports Med Arthrosc. 2008;16(3):170-176.
4. Werner BC, Brockmeier SF, Gwathmey FW. Trends in long head biceps tenodesis. Am J Sports Med. 2015;43(3):570-578.
5. Boileau P, Baque F, Valerio L, Ahrens P, Chuinard C, Trojani C. Isolated arthroscopic biceps tenotomy or tenodesis improves symptoms in patients with massive irreparable rotator cuff tears. J Bone Joint Surg Am. 2007;89(4):747-757.
6. Becker DA, Cofield RH. Tenodesis of the long head of the biceps brachii for chronic bicipital tendinitis. Long-term results. J Bone Joint Surg Am. 1989;71(3):376-381.
7. Richards DP, Burkhart SS. Arthroscopic-assisted biceps tenodesis for ruptures of the long head of biceps brachii: the cobra procedure. Arthroscopy. 2004;20(suppl 2):201-207.
8. Ozalay M, Akpinar S, Karaeminogullari O, et al. Mechanical strength of four different biceps tenodesis techniques. Arthroscopy. 2005;21(8):992-998.
9. Mazzocca AD, Bicos J, Santangelo S, Romeo AA, Arciero RA. The biomechanical evaluation of four fixation techniques for proximal biceps tenodesis. Arthroscopy. 2005;21(11):1296-1306.
10. Kilicoglu O, Koyuncu O, Demirhan M, et al. Time-dependent changes in failure loads of 3 biceps tenodesis techniques: in vivo study in a sheep model. Am J Sports Med. 2005;33(10):1536-1544.
11. Golish SR, Caldwell PE 3rd, Miller MD, et al. Interference screw versus suture anchor fixation for subpectoral tenodesis of the proximal biceps tendon: a cadaveric study. Arthroscopy. 2008;24(10):1103-1108.
12. Kusma M, Dienst M, Eckert J, Steimer O, Kohn D. Tenodesis of the long head of biceps brachii: cyclic testing of five methods of fixation in a porcine model. J Shoulder Elbow Surg. 2008;17(6):967-973.
13. Buchholz A, Martetschlager F, Siebenlist S, et al. Biomechanical comparison of intramedullary cortical button fixation and interference screw technique for subpectoral biceps tenodesis. Arthroscopy. 2013;29(5):845-853.
14. Werner BC, Lyons ML, Evans CL, et al. Arthroscopic suprapectoral and open subpectoral biceps tenodesis: a comparison of restoration of length-tension and mechanical strength between techniques. Arthroscopy. 2015;31(4):620-627.
15. Gilmer BB, DeMers AM, Guerrero D, Reid JB 3rd, Lubowitz JH, Guttmann D. Arthroscopic versus open comparison of long head of biceps tendon visualization and pathology in patients requiring tenodesis. Arthroscopy. 2015;31(1):29-34.
16. Sanders B, Lavery KP, Pennington S, Warner JJ. Clinical success of biceps tenodesis with and without release of the transverse humeral ligament. J Shoulder Elbow Surg. 2012;21(1):66-71.
17. Taylor SA, Fabricant PD, Bansal M, et al. The anatomy and histology of the bicipital tunnel of the shoulder. J Shoulder Elbow Surg. 2015;24(4):511-519.
18. Taylor SA, Khair MM, Gulotta LV, et al. Diagnostic glenohumeral arthroscopy fails to fully evaluate the biceps-labral complex. Arthroscopy. 2015;31(2):215-224.
19. Lutton DM, Gruson KI, Harrison AK, Gladstone JN, Flatow EL. Where to tenodese the biceps: proximal or distal? Clin Orthop Relat Res. 2011;469(4):1050-1055.
20. Moon SC, Cho NS, Rhee YG. Analysis of “hidden lesions” of the extra-articular biceps after subpectoral biceps tenodesis: the subpectoral portion as the optimal tenodesis site. Am J Sports Med. 2015;43(1):63-68.
21. Festa A, Allert J, Issa K, Tasto JP, Myer JJ. Visualization of the extra-articular portion of the long head of the biceps tendon during intra-articular shoulder arthroscopy. Arthroscopy. 2014;30(11):1413-1417.
22. Friedman DJ, Dunn JC, Higgins LD, Warner JJ. Proximal biceps tendon: injuries and management. Sports Med Arthrosc. 2008;16(3):162-169.
23. Verma NN, Drakos M, O’Brien SJ. Arthroscopic transfer of the long head biceps to the conjoint tendon. Arthroscopy. 2005;21(6):764.
24. O’Brien SJ, Taylor SA, DiPietro JR, Newman AM, Drakos MC, Voos JE. The arthroscopic “subdeltoid approach” to the anterior shoulder. J Shoulder Elbow Surg. 2013;22(4):e6-e10.
25. Drakos MC, Verma NN, Gulotta LV, et al. Arthroscopic transfer of the long head of the biceps tendon: functional outcome and clinical results. Arthroscopy. 2008;24(2):217-223.
26. Taylor SA, Fabricant PD, Baret NJ, et al. Midterm clinical outcomes for arthroscopic subdeltoid transfer of the long head of the biceps tendon to the conjoint tendon. Arthroscopy. 2014;30(12):1574-1581.
27. Marsell R, Einhorn TA. The biology of fracture healing. Injury. 2011;42(6):551-555.
28. Khan SN, Cammisa FP Jr, Sandhu HS, Diwan AD, Girardi FP, Lane JM. The biology of bone healing. J Am Acad Orthop Surg. 2005;13(1):77-86.
29. Hays PL, Kawamura S, Deng XH, et al. The role of macrophages in early healing of a tendon graft in a bone tunnel. J Bone Joint Surg Am. 2008;90(3):565-579.
30. Uhl RL, Roberts TT, Papaliodis DN, Mulligan MT, Dubin AH. Management of chronic musculoskeletal pain. J Am Acad Orthop Surg. 2014;22(2):101-110.
31. Kosek E, Altawil R, Kadetoff D, et al. Evidence of different mediators of central inflammation in dysfunctional and inflammatory pain—interleukin-8 in fibromyalgia and interleukin-1 β in rheumatoid arthritis. J Neuroimmunol. 2015;280:49-55.
32. Slenker NR, Lawson K, Ciccotti MG, Dodson CC, Cohen SB. Biceps tenotomy versus tenodesis: clinical outcomes. Arthroscopy. 2012;28(4):576-582.
33. Rodeo SA, Kawamura S, Kim HJ, Dynybil C, Ying L. Tendon healing in a bone tunnel differs at the tunnel entrance versus the tunnel exit: an effect of graft-tunnel motion? Am J Sports Med. 2006;34(11):1790-1800.
34. Hjorthaug GA, Madsen JE, Nordsletten L, Reinholt FP, Steen H, Dimmen S. Tendon to bone tunnel healing—a study on the time-dependent changes in biomechanics, bone remodeling, and histology in a rat model. J Orthop Res. 2015;33(2):216-223.
35. Pulford KA, Sipos A, Cordell JL, Stross WP, Mason DY. Distribution of the CD68 macrophage/myeloid associated antigen. Int Immunol. 1990;2(10):973-980.
36. Fujiwara N, Kobayashi K. Macrophages in inflammation. Curr Drug Targets Inflamm Allergy. 2005;4(3):281-286.
37. Qi J, Dmochowski JM, Banes AN, et al. Differential expression and cellular localization of novel isoforms of the tendon biomarker tenomodulin. J Appl Physiol (1985). 2012;113(6):861-871.
38. Jelinsky SA, Archambault J, Li L, Seeherman H. Tendon-selective genes identified from rat and human musculoskeletal tissues. J Orthop Res. 2010;28(3):289-297.
39. Docheva D, Hunziker EB, Fassler R, Brandau O. Tenomodulin is necessary for tenocyte proliferation and tendon maturation. Mol Cell Biol. 2005;25(2):699-705.
40. Rodeo SA, Arnoczky SP, Torzilli PA, Hidaka C, Warren RF. Tendon-healing in a bone tunnel. A biomechanical and histological study in the dog. J Bone Joint Surg Am. 1993;75(12):1795-1803.
41. Silva MJ, Thomopoulos S, Kusano N, et al. Early healing of flexor tendon insertion site injuries: tunnel repair is mechanically and histologically inferior to surface repair in a canine model. J Orthop Res. 2006;24(5):990-1000.
42. Hibino N, Hamada Y, Sairyo K, Yukata K, Sano T, Yasui N. Callus formation during healing of the repaired tendon–bone junction. A rat experimental model. J Bone Joint Surg Br. 2007;89(11):1539-1544.
43. Bedi A, Kawamura S, Ying L, Rodeo SA. Differences in tendon graft healing between the intra-articular and extra-articular ends of a bone tunnel. HSS J. 2009;5(1):51-57.
44. Richards DP, Burkhart SS. A biomechanical analysis of two biceps tenodesis fixation techniques. Arthroscopy. 2005;21(7):861-866.
45. Mazzocca AD, Cote MP, Arciero CL, Romeo AA, Arciero RA. Clinical outcomes after subpectoral biceps tenodesis with an interference screw. Am J Sports Med. 2008;36(10):1922-1929.
46. Baleani M, Francesconi D, Zani L, Giannini S, Snyder SJ. Suprapectoral biceps tenodesis: a biomechanical comparison of a new “soft anchor” tenodesis technique versus interference screw biceps tendon fixation. Clin Biomech. 2015;30(2):188-194.
47. Euler SA, Smith SD, Williams BT, Dornan GJ, Millett PJ, Wijdicks CA. Biomechanical analysis of subpectoral biceps tenodesis: effect of screw malpositioning on proximal humeral strength. Am J Sports Med. 2015;43(1):69-74.
TTO specifics depend on anatomy, radiographic alignment characteristics, and presence of chondral defects.
Osteotomy and movement of the tibial tubercle can include anteriorization, anteromedialization, proximalization, medialization, or distalization.
TTO was most commonly performed for isolated patellar instability in the presence of knee pain.
Young women with prior surgery on the affected knee made up the primary patient population for this procedure.
While TTO significantly improves knee pain and clinical outcome scores, >1 in 5 patients required reoperation for hardware removal.
Patellofemoral pain and patellofemoral instability are common orthopedic problems. Studies have found that 30% of patients 13 to 19 years old have patellofemoral pain and that 29 in 100,000 patients 10 to 17 years old have patellofemoral instability.1-3 The reported rate of recurrence after nonoperative management of patellofemoral instability is 33%.4 Tibial tubercle osteotomy (TTO), first described by Hauser5 in 1938, is an effective treatment option for many patellofemoral disorders.
TTO indications include patellofemoral maltracking or malalignment, patellar instability, patellofemoral arthritis, and focal patellofemoral chondral defects.6 With TTO, the goal is to move the tibial tubercle in a direction that will either improve patellar tracking or offload the medial or lateral patellar facet to improve pain and function.7,8 This action typically involves anterior, medial, lateral, or distal translation of the tibial tubercle, as posteriorization can lead to increased contact forces across the patellofemoral joint, resulting in accelerated patellofemoral wear and increased pain.9
We systematically reviewed the TTO literature to identify indications, clinical outcomes, complications, and reoperations. We hypothesized that the overall complication rate and the overall reoperation rate would both be <10%.
Clinical Evaluation of Patellofemoral Pathology
Patients with patellofemoral pain often report anterior knee pain, which typically begins gradually and is often activity related. Several symptoms may be present: pain with prolonged sitting with knees bent; pain on rising from a seated position; pain or crepitus with climbing stairs; and pain during repetitive activity such as running, squatting, or jumping. Location, duration, and onset of symptoms should be elicited. Patellofemoral instability can be described as dislocation events or subluxation events; number of events, mechanisms of injury, and resulting need for reduction should be documented. As age, sex, body mass index, and physical fitness are relevant to risk of recurrence, the physician should ask about general ligamentous laxity, other joint dislocations, and prior surgical intervention. Swelling or mechanical symptoms may indicate patellofemoral joint pathology.6,10
Physical examination of patients with patellofemoral pathology begins with assessment for overall limb alignment (including resting position of patella and corresponding quadriceps angle [Q-angle]), generalized ligamentous laxity (including hypermobile joints, evaluated with Brighton criteria), overall peri-knee muscle tone and strength, effusion, and gait pattern.
Figure 1.Knee and hip range of motion should be documented. Apprehension (Figure 1) and lack of a firm endpoint on placement of a lateralizing moment on the patella suggest prior dislocation or subluxation. Patella and surrounding anatomy must be palpated for location and severity of tenderness. Finally, patellar tilt, height, mobility, and dynamic tracking, including J-sign, are pertinent to evaluation. The J-sign for patellar tracking is positive when the patella deviates laterally as the knee moves from flexion into extension. Examination of the asymptomatic contralateral side is essential for comparison. Plain radiographs are important first-line imaging. Computed tomography or magnetic resonance imaging can be used to measure tibial tubercle-trochlear groove (TT-TG) distance. TT-TG distance of >15 mm is abnormal, and >20 mm indicates TTO is required. Advanced imaging is additionally valuable in assessing for chondral injury or trochlear dysplasia.6,10
Common TTO Procedures
TTO specifics depend on anatomy, radiographic alignment characteristics, and presence of chondral defects. Essentially, the patella is translated to offload the affected areas. Osteotomy and movement of the tibial tubercle can include anteriorization, anteromedialization, proximalization, medialization, or distalization.
Figure 2.Lateralization or anterolateralization may be pertinent to revision if an osteotomy direction results in overcorrection of tuberosity position. Anteriorization (Figures 2A-2C) does not have a role in patellofemoral instability, but can unload areas of excessive patellar chondral force concentration at the central or proximal patella by increasing the angle between the patellar and quadriceps tendons and thereby decreasing the joint reaction forces.
Figure 3.Straight medialization (Figures 3A, 3B) offloads lateral patellar chondral injury and may decrease lateral instability.
Figure 4. Distalization (Figures 4A-4C) can correct for patella alta in the setting of patellar instability and allows earlier engagement of the patella in the trochlea to increase osseous restraint to lateral translation.6
Figure 5.Anteromedialization (Figure 5) is indicated in patients with a normal proximal and medial patellar chondral surface and a laterally positioned patella leading to alteration of the contact area in the trochlear groove and resulting pain, lateral patellar or trochlear chondral disease, or instability. Osteotomy angle can provide varied medialization through consistent slope and anteriorization. For example, a 60° slope osteotomy provides 9 mm of medialization with 15 mm of anteriorization.6 The procedure, similar to the additional TTO operations, begins with a lateral parapatellar incision that is extended distal to the tibial tubercle and anterior over the crest. The soft tissues around the tubercle are released to allow mobilization.
Figure 6.Variable osteotomy jigs allow for different slope cuts for more medialization or anteriorization, based on preoperative findings. The osteotomy cuts are started with a thin oscillating blade (Figure 6) and finished with an osteotome.
Figure 7.The tubercle fragment (Figure 7) is shifted and provisionally fixed with a Kirschner wire before being drilled and fixated with two 4.5-mm countersunk cortical screws (Figures 8, 9A-9B).
Figure 8.
Figure 9.Locally harvested corticocancellous bone can help anteriorize the tubercle block. Osteotomy specifics allow for corresponding anatomical translations of the TTO to address the preoperative pathology.
Methods
Search Strategy and Data Collection
We searched the PubMed (Medline) database for all English-language TTO studies published between database inception and April 9, 2015. After PROSPERO registration, and following PRISMA (Preferred Reporting Items for Systematic Reviews and Meta-Analyses) guidelines, we used the algorithm (“tibial” AND “tubercle” AND “osteotomy”) NOT (“total” AND “knee” AND “arthroplasty”) to search the literature. Inclusion criteria included level I-IV studies on TTO indications, operative findings, and outcomes. Exclusion criteria were non-English studies, unpublished studies, level V evidence, letters to the editor, editorials, review articles, basic science articles, technique articles, revision procedures, articles without clinical outcomes, and conference proceeding abstracts. Studies that reported on duplicate populations were included only with the most recent available clinical outcomes. All abstracts were reviewed in duplicate by Dr. Levy and Dr. Rao and assessed with respect to the criteria outlined. Then the same authors performed full-text reviews of eligible studies before including these studies in the systematic review.
Table 1.They also manually checked the references in study articles to identify additional studies for possible inclusion in the review. A standardized form created by the authors at the start of the review was used to extract data (Table 1).
Assessment of Study Quality
The quality of each TTO study in the review was assessed with a modified Coleman methodology score (MCMS), which ranges from 0 to 100. A study with an MCMS of <55 points is considered a poor-quality study.11
Data Synthesis and Statistical Analysis
Given that most of the included studies were level IV, a formal meta-analysis was not indicated. In this article, we report categorical data as frequencies with percentages and preoperative and postoperative continuous data as means (SDs), with weighted means based on number of patients in each study, where applicable. We used 2-tailed t tests for comparisons made with the free Meta-Analysis Calculator and Grapher (http://www.healthstrategy.com/meta/meta.pl ). Statistical significance was set at P < .05.
Results
Search Results and Included Studies
Figure 10.
Table 2.Twenty-one studies (976 patients, 1055 knees) were included in the analysis (Figure 10; Table 2).12-32 These studies were published between 1986 and 2013. There were 18 level IV studies (85.7%), 3 level III studies (14%), and no level I or II studies. Better quality studies had a mean (SD) MCMS of 19.8 (8.2), well under the 55-point cutoff. In the 16 studies that reported sex, women accounted for 69% of the population. Weighted mean (SD) age was 27.68 (10.45) years (range, 12-77 years) (18 studies reporting).
Only 1 study provided preoperative body mass index (27 kg/m2). There were 55.35% of patients who had prior surgery on the affected knee (6 studies reporting).
Preoperative Data
Preoperative pathologic, radiographic, and clinical scoring data were scarcely reported and nonuniform (Table 2). The most common pathology treated with TTO was isolated patellofemoral instability (746/1055 patients, 70.7%). The other pathologies addressed were isolated patellofemoral osteoarthritis/chondromalacia patellae (143, 13.6%), patellofemoral instability with patella alta (61, 5.8%), patellofemoral instability with patellofemoral osteoarthritis (45, 4.3%), isolated patella baja (41, 3.9%), isolated patella alta (19, 1.8%), and patellofemoral osteoarthritis with patella baja (2, 0.2%). Five hundred fifty-five patients (53%) had a preoperative complaint that included knee pain, and 809 (77%) reported preoperative patellar laxity or instability events. The imaging data reported were Q-angle, Insall-Salvati ratio, Caton-Deschamps index, Blackburne-Peel ratio, Outerbridge osteoarthritis grade, and TT-TG distance. Preoperative clinical scoring data most prominently included a visual analog scale (VAS) score of 70.50 (4 studies reporting), a Lysholm score of 59.19 (5 studies), and a Kujala score of 41.16 (4 studies). Shelbourne-Trumper and Cox-Insall scores were reported in 1 and 2 studies, respectively.
Operative Characteristics
Of the 21 studies, 12 reported only on patients who had TTO performed in isolation; in the other 9 studies, cohorts included patients who underwent concurrent procedures. In the 17 studies (856 patients) that listed numbers of patients who underwent specific concomitant procedures, 715 patients (83.5%) underwent an isolated TTO procedure, and the other 141 (16.5%) underwent either concomitant lateral femoral trochleoplasty, arthroscopic drilling of chondral lesions, patellar shaving chondroplasty, partial meniscectomy or concomitant meniscal repair, intra-articular loose body removal, and/or lateral release with or without medial plication.
Table 3.Twenty studies reported specifics on the intraoperative direction of the tibial bone block osteotomy (Table 3). In most cases (50.8%), anteromedial translation (anteromedialization) was performed; anteriorization was performed in 18.7% of cases, medialization in 9.6%, medial and distal translation in 7.2%, a “triple” (anteriorization, medialization, proximalization) in 6%, isolated distalization in 2.8%, and proximalization in 1.6%. The remaining 2.8% of procedure specifics were not identified.
Postoperative Data
Table 4A.
Table 4B.
Table 4C.Table 4 lists the overall cohort’s postoperative radiographic, clinical outcome scoring, and complications data. Fifteen studies reported follow-up of >2 years. As with the preoperative data, radiographic and clinical scoring data were relatively nonuniform; some numeric data, however, should be highlighted. Statistical analysis allowed for comparison of preoperative-postoperative VAS, Lysholm, and Kujala scores, each of which was significantly higher after surgery (P < .001). Seven studies reported an overall clinical outcome rating, with the cumulative majority of patients reporting good (37.9%) or excellent (39.2%) results.
There was a cumulative total of 79 complications (8% of cohort): 17 recurrent patellar dislocations (1.9%), 4 recurrent patellar subluxations (0.4%), 10 wound complications (1.0%), 2 intraoperative complications (0.2%), 14 tibial tubercle fractures (1.3%), 19 proximal tibia fractures (1.8%), 4 cases of anterior knee pain (0.4%), 4 cases of neuropraxia (0.4%), and 5 infections (0.5%). Of note, 219 knees (21%) required reoperation, but 170 (16.3%) of these were for painful hardware removal. Sixteen knees (1.5%) required revision TTO, 1 (0.1%) required subsequent high tibial osteotomy, 2 (0.2%) underwent patellofemoral arthroplasty for advanced arthritic changes, and 5 (0.5%) underwent total knee arthroplasty for advanced arthritic changes.
Studies With TTO Performed in Isolation
Twelve studies reported outcomes of isolated TTO procedures. In the 638 patients who underwent isolated TTO, the pathologies addressed were instability/laxity (429 patients, 67%), patellofemoral osteoarthritis (74, 12%), patella alta with instability (61, 10%), patellofemoral osteoarthritis with instability (31, 5%), patella baja (24, 4%), and patella alta (19, 3%). Pain was a preoperative issue in 289 (45%) of these patients and instability in 472 (74%).
Only 2.8% of patients experienced postoperative patellar dislocation events. Of the 12 studies, 2 reported VAS scores (34-point weighted mean improvement, 65 points before surgery to 31 after surgery), 3 reported Lysholm scores (30-point improvement, from 60 to 90), and 2 reported Kujala scores (21-point improvement, from 46 to 67).
Complication rates for this isolated-TTO pooled cohort of patients were 1.2% for revision TTOs, 0.5% for wound complications, 0.8% for tibial tubercle fractures, and 1.9% for proximal tibia fractures. In total, 16% of patients required hardware removal after surgery.
Discussion
This study found that TTO improved patient pain and clinical outcome scores despite having a high (16%) rate of reoperation for painful hardware in patients with preoperative pain or instability, or with patellofemoral osteoarthritis or aberrant patellar anatomy. This reoperation rate and the overall complication rate both exceeded our hypothesized 10% cumulative rate. However, <1% of patients required conversion to a definitive end-stage surgery (patellofemoral arthroplasty or total knee arthroplasty) by final follow-up, and the rates of comorbidities (anterior knee pain, wound infection, recurrent patellar subluxation/dislocation, tibial fracture) were relatively low.
Patellofemoral disorders are common in the general population and a frequent primary complaint on presentation to orthopedic offices. Having a thorough understanding of knee joint biomechanics is imperative when trying to determine whether surgery is appropriate for these complaints and how to proceed. Extensor mechanism abnormalities, including high lateral force vectors (or larger TT-TG distances) and excessive patellar tilt, can affect alignment and increase the risk for patellofemoral dislocations, patellofemoral anterior- based knee pains, and chondral lesions. Patella alta, an elevated patella, risks increased contact stresses between the patella and the trochlear groove33 and decreases the osseous constraints that inhibit dislocation of the patella with physiologic flexion of the joint.34 With TTO, the change in tuberosity position can alter angles in the extensor mechanism and thereby decrease joint reaction forces and patellofemoral contact area forces.35,36
Although its use began as an option for combating patellar instability events in patients with predisposed patellofemoral kinematics,5 TTO has evolved in its therapeutic uses to include offloading patellar and trochlear focal chondral lesions and slowing progression of patellofemoral arthritis. Multiple iterations and modifications of the procedure have involved distal and medial transfer of the tibial tuberosity, medialization alone, concurrent anterior and medial elevation of the tuberosity, and proximal or distal transfers, depending on the pathology being corrected. Although TTO is highly versatile in treating multiple patellofemoral joint pathologies, this study found that its primary indication continues to be patellar instability, with anteromedialization as the most common direction of tubercle transfer in support of the medial structures providing the medial force vector that keeps the patella in place. These medial structures include the medial patellofemoral ligament, the vastus medialis obliquus, the medial patellotibial ligament, and the medial retinaculum.
Also notable was the relatively high rate of reoperation after TTO. However, >75% of reoperations were performed to remove painful hardware, and the need for reoperation seemed to have no effect on the statistically significant overall preoperative-to-postoperative improvement in VAS, Lysholm, and Kujala scores. Rates of definitive surgery for end-stage patellofemoral changes, including patellofemoral arthroplasty and total knee arthroplasty, were quite low at the weighted mean follow-up of several years after surgery, suggesting a role for TTO in avoiding arthroplasty. Although the infection rate was <1%, the rate of tibial tubercle or proximal tibia fractures was a cumulative 3.1%. Patients should be counseled on this complication risk, as treatment can require cast immobilization and weight-bearing limitations.24
The 69% proportion of women in the overall cohort and the mean (SD) age of 27.68 (10.45) years highlight the primary patient population that undergoes TTO. Compared with men, young women are more likely to have aberrant patellofemoral biomechanics, owing to their native anatomy, including their relatively larger Q-angle and TT-TG distance and thus increased lateral translational force vectors on the patella.37 In addition, more than half of patients who are having TTO underwent previous surgery on the affected knee—an indication that TTO is still not universally considered first-line in addressing patellofemoral pathology.
Limitations of the Analysis
The limitations of this analysis derive from the limitations of the included studies, which were mostly retrospective case series with relatively short follow-up. The low MCMS (<55) of all 21 studies highlights their low quality as well. These studies showed considerable heterogeneity in their reporting of specific preoperative, intraoperative, and postoperative radiographic, physical examination, and clinical outcome scores, which may be indicative of the relatively low rate of use of TTO, a procedure originally described decades ago. These studies also showed ample heterogeneity in the specific radiographic parameters or outcome scales they used to present their data. We were therefore limited in our ability to cohesively summarize and provide cumulative data points from the patients as a unified cohort. There was substantial variety in the procedures performed, surgical techniques used, concomitant pathologies addressed at time of surgery, and diagnoses treated—indicating a performance bias. This additionally precluded any significant meta-analysis within the patient cohort. A higher quality study, a randomized controlled trial, is needed to answer more definitively and completely the questions we left unanswered, including the effect on radiographic parameters, additional clinical outcomes, and patient satisfaction.
Conclusion
TTO is most commonly performed for isolated patellar instability in the presence of knee pain. Other pathologies addressed are patellofemoral osteoarthritis, and patella alta and patella baja with and without associated knee pain. TTO significantly improves knee pain and clinical outcome scores, though 21% of patients (>1 in 5) require reoperation for hardware removal. Young women with prior surgery on the affected knee are the primary patient population.
References
1. Blond L, Hansen L. Patellofemoral pain syndrome in athletes: a 5.7- year retrospective follow-up study of 250 athletes. Acta Orthop Belg. 1998;64(4):393-400.
2. Fairbank JC, Pynsent PB, van Poortvliet JA, Phillips H. Mechanical factors in the incidence of knee pain in adolescents and young adults. J Bone Joint Surg Br. 1984;66(5):685-693.
3. Mehta VM, Inoue M, Nomura E, Fithian DC. An algorithm guiding the evaluation and treatment of acute primary patellar dislocations. Sports Med Arthrosc. 2007;15(2):78-81.
4. Erickson BJ, Mascarenhas R, Sayegh ET, et al. Does operative treatment of first-time patellar dislocations lead to increased patellofemoral stability? A systematic review of overlapping meta-analyses. Arthroscopy. 2015;31(6):1207-1215.
5. Hauser E. Total tendon transplant for slipping patella. Surg Gynecol Obstet. 1938;66:199-214.
6. Sherman SL, Erickson BJ, Cvetanovich GL, et al. Tibial tuberosity osteotomy: indications, techniques, and outcomes. Am J Sports Med. 2014;42(8):2006-2017.
7. Hall MJ, Mandalia VI. Tibial tubercle osteotomy for patello-femoral joint disorders. Knee Surg Sports Traumatol Arthrosc. 2016;24(3):855-861.
9. Fulkerson JP. Disorders of the Patellofemoral Joint. 4th ed. Baltimore, MD: Williams & Wilkins; 1997.
10. Koh JL, Stewart C. Patellar instability. Clin Sports Med. 2014;33(3):461-476.
11. Coleman BD, Khan KM, Maffulli N, Cook JL, Wark JD. Studies of surgical outcome after patellar tendinopathy: clinical significance of methodological deficiencies and guidelines for future studies. Victorian Institute of Sport Tendon Study Group. Scand J Med Sci Sports. 2000;10(1):2-11.
12. Al-Sayyad MJ, Cameron JC. Functional outcome after tibial tubercle transfer for the painful patella alta. Clin Orthop Rel Res. 2002;(396):152-162.
13. Atkinson HD, Bailey CA, Anand S, Johal P, Oakeshott RD. Tibial tubercle advancement osteotomy with bone allograft for patellofemoral arthritis: a retrospective cohort study of 50 knees. Arch Orthop Trauma Surg. 2012;132(4):437-445.
14. Caton JH, Dejour D. Tibial tubercle osteotomy in patello-femoral instability and in patellar height abnormality. Int Orthop. 2010;34(2):305-309.
15. Dantas P, Nunes C, Moreira J, Amaral LB. Antero-medialisation of the tibial tubercle for patellar instability. Int Orthop. 2005;29(6):390-391.
16. Drexler M, Dwyer T, Marmor M, Sternheim A, Cameron HU, Cameron JC. The treatment of acquired patella baja with proximalize the tibial tuberosity. Knee Surg Sports Traumatol Arthrosc. 2013;21(11):2578-2583.
17. Eager MR, Bader DA, Kelly JD 4th, Moyer RA. Delayed fracture of the tibia following anteromedialization osteotomy of the tibial tubercle: a report of 5 cases. Am J Sports Med. 2004;32(4):1041-1048.
18. Ebinger TP, Boezaart A, Albright JP. Modifications of the Fulkerson osteotomy: a pilot study assessment of a novel technique of dynamic intraoperative determination of the adequacy of tubercle transfer. Iowa Orthop J. 2007;27:61-64.
19. Fulkerson JP, Becker GJ, Meaney JA, Miranda M, Folcik MA. Anteromedial tibial tubercle transfer without bone graft. Am J Sports Med. 1990;18(5):490-498.
20. Heatley FW, Allen PR, Patrick JH. Tibial tubercle advancement for anterior knee pain: a temporary or permanent solution. Clin Orthop Relat Res. 1986;(208):216-225.
21. Hirsh DM, Reddy DK. Experience with Maquet anterior tibial tubercle advancement for patellofemoral arthralgia. Clin Orthop Relat Res. 1980;(148):136-139.
22. Jack CM, Rajaratnam SS, Khan HO, Keast-Butler O, Butler-Manuel PA, Heatley FW. The modified tibial tubercle osteotomy for anterior knee pain due to chondromalacia patellae in adults: a five-year prospective study. Bone Joint Res. 2012;1(8):167-173.
23. Koëter S, Diks MJ, Anderson PG, Wymenga AB. A modified tibial tubercle osteotomy for patellar maltracking: results at two years. J Bone Joint Surg Br. 2007;89(2):180-185.
24. Luhmann SJ, Fuhrhop S, O’Donnell JC, Gordon JE. Tibial fractures after tibial tubercle osteotomies for patellar instability: a comparison of three osteotomy configurations. J Child Orthop. 2011;5(1):19-26.
25. Naranja RJ Jr, Reilly PJ, Kuhlman JR, Haut E, Torg JS. Long-term evaluation of the Elmslie-Trillat-Maquet procedure for patellofemoral dysfunction. Am J Sports Med. 1996;24(6):779-784.
26. Naveed MA, Ackroyd CE, Porteous AJ. Long-term (ten- to 15-year) outcome of arthroscopically assisted Elmslie-Trillat tibial tubercle osteotomy. Bone Joint J. 2013;95(4):478-485.
27. Paulos L, Swanson SC, Stoddard GJ, Barber-Westin S. Surgical correction of limb malalignment for instability of the patella: a comparison of 2 techniques. Am J Sports Med. 2009;37(7):1288-1300.
28. Pidoriano AJ, Weinstein RN, Buuck DA, Fulkerson JP. Correlation of patellar articular lesions with results from anteromedial tibial tubercle transfer. Am J Sports Med. 1997;25(4):533-537.
29. Shen HC, Chao KH, Huang GS, Pan RY, Lee CH. Combined proximal and distal realignment procedures to treat the habitual dislocation of the patella in adults. Am J Sports Med. 2007;35(12):2101-2108.
30. Stetson WB, Friedman MJ, Fulkerson JP, Cheng M, Buuck D. Fracture of the proximal tibia with immediate weightbearing after a Fulkerson osteotomy. Am J Sports Med. 1997;25(4):570-574.
31. Valenzuela L, Nemtala F, Orrego M, et al. Treatment of patellofemoral chondropathy with the Bandi tibial tubercle osteotomy: more than 10 years follow-up. Knee. 2011;18(2):94-97.
32. Wang CJ, Wong T, Ko JY, Siu KK. Triple positioning of tibial tubercle osteotomy for patellofemoral disorders. Knee. 2014;21(1):133-137.
33. Luyckx T, Didden K, Vandenneucker H, Labey L, Innocenti B, Bellemans J. Is there a biomechanical explanation for anterior knee pain in patients with patella alta? Influence of patellar height on patellofemoral contact force, contact area and contact pressure. J Bone Joint Surg Br. 2009;91(3):344-350.
34. Mayer C, Magnussen RA, Servien E, et al. Patellar tendon tenodesis in association with tibial tubercle distalization for the treatment of episodic patellar dislocation with patella alta. Am J Sports Med. 2012;40(2):346-351.
35. Maquet P. Advancement of the tibial tuberosity. Clin Orthop Relat Res. 1976;(115):225-230.
36. Lewallen DG, Riegger CL, Myers ER, Hayes WC. Effects of retinacular release and tibial tubercle elevation in patellofemoral degenerative joint disease. J Orthop Res. 1990;8(6):856-862.
37. Aglietti P, Insall JN, Cerulli G. Patellar pain and incongruence, I: measurements of incongruence. Clin Orthop Relat Res. 1983;(176):217-224.
TTO specifics depend on anatomy, radiographic alignment characteristics, and presence of chondral defects.
Osteotomy and movement of the tibial tubercle can include anteriorization, anteromedialization, proximalization, medialization, or distalization.
TTO was most commonly performed for isolated patellar instability in the presence of knee pain.
Young women with prior surgery on the affected knee made up the primary patient population for this procedure.
While TTO significantly improves knee pain and clinical outcome scores, >1 in 5 patients required reoperation for hardware removal.
Patellofemoral pain and patellofemoral instability are common orthopedic problems. Studies have found that 30% of patients 13 to 19 years old have patellofemoral pain and that 29 in 100,000 patients 10 to 17 years old have patellofemoral instability.1-3 The reported rate of recurrence after nonoperative management of patellofemoral instability is 33%.4 Tibial tubercle osteotomy (TTO), first described by Hauser5 in 1938, is an effective treatment option for many patellofemoral disorders.
TTO indications include patellofemoral maltracking or malalignment, patellar instability, patellofemoral arthritis, and focal patellofemoral chondral defects.6 With TTO, the goal is to move the tibial tubercle in a direction that will either improve patellar tracking or offload the medial or lateral patellar facet to improve pain and function.7,8 This action typically involves anterior, medial, lateral, or distal translation of the tibial tubercle, as posteriorization can lead to increased contact forces across the patellofemoral joint, resulting in accelerated patellofemoral wear and increased pain.9
We systematically reviewed the TTO literature to identify indications, clinical outcomes, complications, and reoperations. We hypothesized that the overall complication rate and the overall reoperation rate would both be <10%.
Clinical Evaluation of Patellofemoral Pathology
Patients with patellofemoral pain often report anterior knee pain, which typically begins gradually and is often activity related. Several symptoms may be present: pain with prolonged sitting with knees bent; pain on rising from a seated position; pain or crepitus with climbing stairs; and pain during repetitive activity such as running, squatting, or jumping. Location, duration, and onset of symptoms should be elicited. Patellofemoral instability can be described as dislocation events or subluxation events; number of events, mechanisms of injury, and resulting need for reduction should be documented. As age, sex, body mass index, and physical fitness are relevant to risk of recurrence, the physician should ask about general ligamentous laxity, other joint dislocations, and prior surgical intervention. Swelling or mechanical symptoms may indicate patellofemoral joint pathology.6,10
Physical examination of patients with patellofemoral pathology begins with assessment for overall limb alignment (including resting position of patella and corresponding quadriceps angle [Q-angle]), generalized ligamentous laxity (including hypermobile joints, evaluated with Brighton criteria), overall peri-knee muscle tone and strength, effusion, and gait pattern.
Figure 1.Knee and hip range of motion should be documented. Apprehension (Figure 1) and lack of a firm endpoint on placement of a lateralizing moment on the patella suggest prior dislocation or subluxation. Patella and surrounding anatomy must be palpated for location and severity of tenderness. Finally, patellar tilt, height, mobility, and dynamic tracking, including J-sign, are pertinent to evaluation. The J-sign for patellar tracking is positive when the patella deviates laterally as the knee moves from flexion into extension. Examination of the asymptomatic contralateral side is essential for comparison. Plain radiographs are important first-line imaging. Computed tomography or magnetic resonance imaging can be used to measure tibial tubercle-trochlear groove (TT-TG) distance. TT-TG distance of >15 mm is abnormal, and >20 mm indicates TTO is required. Advanced imaging is additionally valuable in assessing for chondral injury or trochlear dysplasia.6,10
Common TTO Procedures
TTO specifics depend on anatomy, radiographic alignment characteristics, and presence of chondral defects. Essentially, the patella is translated to offload the affected areas. Osteotomy and movement of the tibial tubercle can include anteriorization, anteromedialization, proximalization, medialization, or distalization.
Figure 2.Lateralization or anterolateralization may be pertinent to revision if an osteotomy direction results in overcorrection of tuberosity position. Anteriorization (Figures 2A-2C) does not have a role in patellofemoral instability, but can unload areas of excessive patellar chondral force concentration at the central or proximal patella by increasing the angle between the patellar and quadriceps tendons and thereby decreasing the joint reaction forces.
Figure 3.Straight medialization (Figures 3A, 3B) offloads lateral patellar chondral injury and may decrease lateral instability.
Figure 4. Distalization (Figures 4A-4C) can correct for patella alta in the setting of patellar instability and allows earlier engagement of the patella in the trochlea to increase osseous restraint to lateral translation.6
Figure 5.Anteromedialization (Figure 5) is indicated in patients with a normal proximal and medial patellar chondral surface and a laterally positioned patella leading to alteration of the contact area in the trochlear groove and resulting pain, lateral patellar or trochlear chondral disease, or instability. Osteotomy angle can provide varied medialization through consistent slope and anteriorization. For example, a 60° slope osteotomy provides 9 mm of medialization with 15 mm of anteriorization.6 The procedure, similar to the additional TTO operations, begins with a lateral parapatellar incision that is extended distal to the tibial tubercle and anterior over the crest. The soft tissues around the tubercle are released to allow mobilization.
Figure 6.Variable osteotomy jigs allow for different slope cuts for more medialization or anteriorization, based on preoperative findings. The osteotomy cuts are started with a thin oscillating blade (Figure 6) and finished with an osteotome.
Figure 7.The tubercle fragment (Figure 7) is shifted and provisionally fixed with a Kirschner wire before being drilled and fixated with two 4.5-mm countersunk cortical screws (Figures 8, 9A-9B).
Figure 8.
Figure 9.Locally harvested corticocancellous bone can help anteriorize the tubercle block. Osteotomy specifics allow for corresponding anatomical translations of the TTO to address the preoperative pathology.
Methods
Search Strategy and Data Collection
We searched the PubMed (Medline) database for all English-language TTO studies published between database inception and April 9, 2015. After PROSPERO registration, and following PRISMA (Preferred Reporting Items for Systematic Reviews and Meta-Analyses) guidelines, we used the algorithm (“tibial” AND “tubercle” AND “osteotomy”) NOT (“total” AND “knee” AND “arthroplasty”) to search the literature. Inclusion criteria included level I-IV studies on TTO indications, operative findings, and outcomes. Exclusion criteria were non-English studies, unpublished studies, level V evidence, letters to the editor, editorials, review articles, basic science articles, technique articles, revision procedures, articles without clinical outcomes, and conference proceeding abstracts. Studies that reported on duplicate populations were included only with the most recent available clinical outcomes. All abstracts were reviewed in duplicate by Dr. Levy and Dr. Rao and assessed with respect to the criteria outlined. Then the same authors performed full-text reviews of eligible studies before including these studies in the systematic review.
Table 1.They also manually checked the references in study articles to identify additional studies for possible inclusion in the review. A standardized form created by the authors at the start of the review was used to extract data (Table 1).
Assessment of Study Quality
The quality of each TTO study in the review was assessed with a modified Coleman methodology score (MCMS), which ranges from 0 to 100. A study with an MCMS of <55 points is considered a poor-quality study.11
Data Synthesis and Statistical Analysis
Given that most of the included studies were level IV, a formal meta-analysis was not indicated. In this article, we report categorical data as frequencies with percentages and preoperative and postoperative continuous data as means (SDs), with weighted means based on number of patients in each study, where applicable. We used 2-tailed t tests for comparisons made with the free Meta-Analysis Calculator and Grapher (http://www.healthstrategy.com/meta/meta.pl ). Statistical significance was set at P < .05.
Results
Search Results and Included Studies
Figure 10.
Table 2.Twenty-one studies (976 patients, 1055 knees) were included in the analysis (Figure 10; Table 2).12-32 These studies were published between 1986 and 2013. There were 18 level IV studies (85.7%), 3 level III studies (14%), and no level I or II studies. Better quality studies had a mean (SD) MCMS of 19.8 (8.2), well under the 55-point cutoff. In the 16 studies that reported sex, women accounted for 69% of the population. Weighted mean (SD) age was 27.68 (10.45) years (range, 12-77 years) (18 studies reporting).
Only 1 study provided preoperative body mass index (27 kg/m2). There were 55.35% of patients who had prior surgery on the affected knee (6 studies reporting).
Preoperative Data
Preoperative pathologic, radiographic, and clinical scoring data were scarcely reported and nonuniform (Table 2). The most common pathology treated with TTO was isolated patellofemoral instability (746/1055 patients, 70.7%). The other pathologies addressed were isolated patellofemoral osteoarthritis/chondromalacia patellae (143, 13.6%), patellofemoral instability with patella alta (61, 5.8%), patellofemoral instability with patellofemoral osteoarthritis (45, 4.3%), isolated patella baja (41, 3.9%), isolated patella alta (19, 1.8%), and patellofemoral osteoarthritis with patella baja (2, 0.2%). Five hundred fifty-five patients (53%) had a preoperative complaint that included knee pain, and 809 (77%) reported preoperative patellar laxity or instability events. The imaging data reported were Q-angle, Insall-Salvati ratio, Caton-Deschamps index, Blackburne-Peel ratio, Outerbridge osteoarthritis grade, and TT-TG distance. Preoperative clinical scoring data most prominently included a visual analog scale (VAS) score of 70.50 (4 studies reporting), a Lysholm score of 59.19 (5 studies), and a Kujala score of 41.16 (4 studies). Shelbourne-Trumper and Cox-Insall scores were reported in 1 and 2 studies, respectively.
Operative Characteristics
Of the 21 studies, 12 reported only on patients who had TTO performed in isolation; in the other 9 studies, cohorts included patients who underwent concurrent procedures. In the 17 studies (856 patients) that listed numbers of patients who underwent specific concomitant procedures, 715 patients (83.5%) underwent an isolated TTO procedure, and the other 141 (16.5%) underwent either concomitant lateral femoral trochleoplasty, arthroscopic drilling of chondral lesions, patellar shaving chondroplasty, partial meniscectomy or concomitant meniscal repair, intra-articular loose body removal, and/or lateral release with or without medial plication.
Table 3.Twenty studies reported specifics on the intraoperative direction of the tibial bone block osteotomy (Table 3). In most cases (50.8%), anteromedial translation (anteromedialization) was performed; anteriorization was performed in 18.7% of cases, medialization in 9.6%, medial and distal translation in 7.2%, a “triple” (anteriorization, medialization, proximalization) in 6%, isolated distalization in 2.8%, and proximalization in 1.6%. The remaining 2.8% of procedure specifics were not identified.
Postoperative Data
Table 4A.
Table 4B.
Table 4C.Table 4 lists the overall cohort’s postoperative radiographic, clinical outcome scoring, and complications data. Fifteen studies reported follow-up of >2 years. As with the preoperative data, radiographic and clinical scoring data were relatively nonuniform; some numeric data, however, should be highlighted. Statistical analysis allowed for comparison of preoperative-postoperative VAS, Lysholm, and Kujala scores, each of which was significantly higher after surgery (P < .001). Seven studies reported an overall clinical outcome rating, with the cumulative majority of patients reporting good (37.9%) or excellent (39.2%) results.
There was a cumulative total of 79 complications (8% of cohort): 17 recurrent patellar dislocations (1.9%), 4 recurrent patellar subluxations (0.4%), 10 wound complications (1.0%), 2 intraoperative complications (0.2%), 14 tibial tubercle fractures (1.3%), 19 proximal tibia fractures (1.8%), 4 cases of anterior knee pain (0.4%), 4 cases of neuropraxia (0.4%), and 5 infections (0.5%). Of note, 219 knees (21%) required reoperation, but 170 (16.3%) of these were for painful hardware removal. Sixteen knees (1.5%) required revision TTO, 1 (0.1%) required subsequent high tibial osteotomy, 2 (0.2%) underwent patellofemoral arthroplasty for advanced arthritic changes, and 5 (0.5%) underwent total knee arthroplasty for advanced arthritic changes.
Studies With TTO Performed in Isolation
Twelve studies reported outcomes of isolated TTO procedures. In the 638 patients who underwent isolated TTO, the pathologies addressed were instability/laxity (429 patients, 67%), patellofemoral osteoarthritis (74, 12%), patella alta with instability (61, 10%), patellofemoral osteoarthritis with instability (31, 5%), patella baja (24, 4%), and patella alta (19, 3%). Pain was a preoperative issue in 289 (45%) of these patients and instability in 472 (74%).
Only 2.8% of patients experienced postoperative patellar dislocation events. Of the 12 studies, 2 reported VAS scores (34-point weighted mean improvement, 65 points before surgery to 31 after surgery), 3 reported Lysholm scores (30-point improvement, from 60 to 90), and 2 reported Kujala scores (21-point improvement, from 46 to 67).
Complication rates for this isolated-TTO pooled cohort of patients were 1.2% for revision TTOs, 0.5% for wound complications, 0.8% for tibial tubercle fractures, and 1.9% for proximal tibia fractures. In total, 16% of patients required hardware removal after surgery.
Discussion
This study found that TTO improved patient pain and clinical outcome scores despite having a high (16%) rate of reoperation for painful hardware in patients with preoperative pain or instability, or with patellofemoral osteoarthritis or aberrant patellar anatomy. This reoperation rate and the overall complication rate both exceeded our hypothesized 10% cumulative rate. However, <1% of patients required conversion to a definitive end-stage surgery (patellofemoral arthroplasty or total knee arthroplasty) by final follow-up, and the rates of comorbidities (anterior knee pain, wound infection, recurrent patellar subluxation/dislocation, tibial fracture) were relatively low.
Patellofemoral disorders are common in the general population and a frequent primary complaint on presentation to orthopedic offices. Having a thorough understanding of knee joint biomechanics is imperative when trying to determine whether surgery is appropriate for these complaints and how to proceed. Extensor mechanism abnormalities, including high lateral force vectors (or larger TT-TG distances) and excessive patellar tilt, can affect alignment and increase the risk for patellofemoral dislocations, patellofemoral anterior- based knee pains, and chondral lesions. Patella alta, an elevated patella, risks increased contact stresses between the patella and the trochlear groove33 and decreases the osseous constraints that inhibit dislocation of the patella with physiologic flexion of the joint.34 With TTO, the change in tuberosity position can alter angles in the extensor mechanism and thereby decrease joint reaction forces and patellofemoral contact area forces.35,36
Although its use began as an option for combating patellar instability events in patients with predisposed patellofemoral kinematics,5 TTO has evolved in its therapeutic uses to include offloading patellar and trochlear focal chondral lesions and slowing progression of patellofemoral arthritis. Multiple iterations and modifications of the procedure have involved distal and medial transfer of the tibial tuberosity, medialization alone, concurrent anterior and medial elevation of the tuberosity, and proximal or distal transfers, depending on the pathology being corrected. Although TTO is highly versatile in treating multiple patellofemoral joint pathologies, this study found that its primary indication continues to be patellar instability, with anteromedialization as the most common direction of tubercle transfer in support of the medial structures providing the medial force vector that keeps the patella in place. These medial structures include the medial patellofemoral ligament, the vastus medialis obliquus, the medial patellotibial ligament, and the medial retinaculum.
Also notable was the relatively high rate of reoperation after TTO. However, >75% of reoperations were performed to remove painful hardware, and the need for reoperation seemed to have no effect on the statistically significant overall preoperative-to-postoperative improvement in VAS, Lysholm, and Kujala scores. Rates of definitive surgery for end-stage patellofemoral changes, including patellofemoral arthroplasty and total knee arthroplasty, were quite low at the weighted mean follow-up of several years after surgery, suggesting a role for TTO in avoiding arthroplasty. Although the infection rate was <1%, the rate of tibial tubercle or proximal tibia fractures was a cumulative 3.1%. Patients should be counseled on this complication risk, as treatment can require cast immobilization and weight-bearing limitations.24
The 69% proportion of women in the overall cohort and the mean (SD) age of 27.68 (10.45) years highlight the primary patient population that undergoes TTO. Compared with men, young women are more likely to have aberrant patellofemoral biomechanics, owing to their native anatomy, including their relatively larger Q-angle and TT-TG distance and thus increased lateral translational force vectors on the patella.37 In addition, more than half of patients who are having TTO underwent previous surgery on the affected knee—an indication that TTO is still not universally considered first-line in addressing patellofemoral pathology.
Limitations of the Analysis
The limitations of this analysis derive from the limitations of the included studies, which were mostly retrospective case series with relatively short follow-up. The low MCMS (<55) of all 21 studies highlights their low quality as well. These studies showed considerable heterogeneity in their reporting of specific preoperative, intraoperative, and postoperative radiographic, physical examination, and clinical outcome scores, which may be indicative of the relatively low rate of use of TTO, a procedure originally described decades ago. These studies also showed ample heterogeneity in the specific radiographic parameters or outcome scales they used to present their data. We were therefore limited in our ability to cohesively summarize and provide cumulative data points from the patients as a unified cohort. There was substantial variety in the procedures performed, surgical techniques used, concomitant pathologies addressed at time of surgery, and diagnoses treated—indicating a performance bias. This additionally precluded any significant meta-analysis within the patient cohort. A higher quality study, a randomized controlled trial, is needed to answer more definitively and completely the questions we left unanswered, including the effect on radiographic parameters, additional clinical outcomes, and patient satisfaction.
Conclusion
TTO is most commonly performed for isolated patellar instability in the presence of knee pain. Other pathologies addressed are patellofemoral osteoarthritis, and patella alta and patella baja with and without associated knee pain. TTO significantly improves knee pain and clinical outcome scores, though 21% of patients (>1 in 5) require reoperation for hardware removal. Young women with prior surgery on the affected knee are the primary patient population.
Take-Home Points
TTO specifics depend on anatomy, radiographic alignment characteristics, and presence of chondral defects.
Osteotomy and movement of the tibial tubercle can include anteriorization, anteromedialization, proximalization, medialization, or distalization.
TTO was most commonly performed for isolated patellar instability in the presence of knee pain.
Young women with prior surgery on the affected knee made up the primary patient population for this procedure.
While TTO significantly improves knee pain and clinical outcome scores, >1 in 5 patients required reoperation for hardware removal.
Patellofemoral pain and patellofemoral instability are common orthopedic problems. Studies have found that 30% of patients 13 to 19 years old have patellofemoral pain and that 29 in 100,000 patients 10 to 17 years old have patellofemoral instability.1-3 The reported rate of recurrence after nonoperative management of patellofemoral instability is 33%.4 Tibial tubercle osteotomy (TTO), first described by Hauser5 in 1938, is an effective treatment option for many patellofemoral disorders.
TTO indications include patellofemoral maltracking or malalignment, patellar instability, patellofemoral arthritis, and focal patellofemoral chondral defects.6 With TTO, the goal is to move the tibial tubercle in a direction that will either improve patellar tracking or offload the medial or lateral patellar facet to improve pain and function.7,8 This action typically involves anterior, medial, lateral, or distal translation of the tibial tubercle, as posteriorization can lead to increased contact forces across the patellofemoral joint, resulting in accelerated patellofemoral wear and increased pain.9
We systematically reviewed the TTO literature to identify indications, clinical outcomes, complications, and reoperations. We hypothesized that the overall complication rate and the overall reoperation rate would both be <10%.
Clinical Evaluation of Patellofemoral Pathology
Patients with patellofemoral pain often report anterior knee pain, which typically begins gradually and is often activity related. Several symptoms may be present: pain with prolonged sitting with knees bent; pain on rising from a seated position; pain or crepitus with climbing stairs; and pain during repetitive activity such as running, squatting, or jumping. Location, duration, and onset of symptoms should be elicited. Patellofemoral instability can be described as dislocation events or subluxation events; number of events, mechanisms of injury, and resulting need for reduction should be documented. As age, sex, body mass index, and physical fitness are relevant to risk of recurrence, the physician should ask about general ligamentous laxity, other joint dislocations, and prior surgical intervention. Swelling or mechanical symptoms may indicate patellofemoral joint pathology.6,10
Physical examination of patients with patellofemoral pathology begins with assessment for overall limb alignment (including resting position of patella and corresponding quadriceps angle [Q-angle]), generalized ligamentous laxity (including hypermobile joints, evaluated with Brighton criteria), overall peri-knee muscle tone and strength, effusion, and gait pattern.
Figure 1.Knee and hip range of motion should be documented. Apprehension (Figure 1) and lack of a firm endpoint on placement of a lateralizing moment on the patella suggest prior dislocation or subluxation. Patella and surrounding anatomy must be palpated for location and severity of tenderness. Finally, patellar tilt, height, mobility, and dynamic tracking, including J-sign, are pertinent to evaluation. The J-sign for patellar tracking is positive when the patella deviates laterally as the knee moves from flexion into extension. Examination of the asymptomatic contralateral side is essential for comparison. Plain radiographs are important first-line imaging. Computed tomography or magnetic resonance imaging can be used to measure tibial tubercle-trochlear groove (TT-TG) distance. TT-TG distance of >15 mm is abnormal, and >20 mm indicates TTO is required. Advanced imaging is additionally valuable in assessing for chondral injury or trochlear dysplasia.6,10
Common TTO Procedures
TTO specifics depend on anatomy, radiographic alignment characteristics, and presence of chondral defects. Essentially, the patella is translated to offload the affected areas. Osteotomy and movement of the tibial tubercle can include anteriorization, anteromedialization, proximalization, medialization, or distalization.
Figure 2.Lateralization or anterolateralization may be pertinent to revision if an osteotomy direction results in overcorrection of tuberosity position. Anteriorization (Figures 2A-2C) does not have a role in patellofemoral instability, but can unload areas of excessive patellar chondral force concentration at the central or proximal patella by increasing the angle between the patellar and quadriceps tendons and thereby decreasing the joint reaction forces.
Figure 3.Straight medialization (Figures 3A, 3B) offloads lateral patellar chondral injury and may decrease lateral instability.
Figure 4. Distalization (Figures 4A-4C) can correct for patella alta in the setting of patellar instability and allows earlier engagement of the patella in the trochlea to increase osseous restraint to lateral translation.6
Figure 5.Anteromedialization (Figure 5) is indicated in patients with a normal proximal and medial patellar chondral surface and a laterally positioned patella leading to alteration of the contact area in the trochlear groove and resulting pain, lateral patellar or trochlear chondral disease, or instability. Osteotomy angle can provide varied medialization through consistent slope and anteriorization. For example, a 60° slope osteotomy provides 9 mm of medialization with 15 mm of anteriorization.6 The procedure, similar to the additional TTO operations, begins with a lateral parapatellar incision that is extended distal to the tibial tubercle and anterior over the crest. The soft tissues around the tubercle are released to allow mobilization.
Figure 6.Variable osteotomy jigs allow for different slope cuts for more medialization or anteriorization, based on preoperative findings. The osteotomy cuts are started with a thin oscillating blade (Figure 6) and finished with an osteotome.
Figure 7.The tubercle fragment (Figure 7) is shifted and provisionally fixed with a Kirschner wire before being drilled and fixated with two 4.5-mm countersunk cortical screws (Figures 8, 9A-9B).
Figure 8.
Figure 9.Locally harvested corticocancellous bone can help anteriorize the tubercle block. Osteotomy specifics allow for corresponding anatomical translations of the TTO to address the preoperative pathology.
Methods
Search Strategy and Data Collection
We searched the PubMed (Medline) database for all English-language TTO studies published between database inception and April 9, 2015. After PROSPERO registration, and following PRISMA (Preferred Reporting Items for Systematic Reviews and Meta-Analyses) guidelines, we used the algorithm (“tibial” AND “tubercle” AND “osteotomy”) NOT (“total” AND “knee” AND “arthroplasty”) to search the literature. Inclusion criteria included level I-IV studies on TTO indications, operative findings, and outcomes. Exclusion criteria were non-English studies, unpublished studies, level V evidence, letters to the editor, editorials, review articles, basic science articles, technique articles, revision procedures, articles without clinical outcomes, and conference proceeding abstracts. Studies that reported on duplicate populations were included only with the most recent available clinical outcomes. All abstracts were reviewed in duplicate by Dr. Levy and Dr. Rao and assessed with respect to the criteria outlined. Then the same authors performed full-text reviews of eligible studies before including these studies in the systematic review.
Table 1.They also manually checked the references in study articles to identify additional studies for possible inclusion in the review. A standardized form created by the authors at the start of the review was used to extract data (Table 1).
Assessment of Study Quality
The quality of each TTO study in the review was assessed with a modified Coleman methodology score (MCMS), which ranges from 0 to 100. A study with an MCMS of <55 points is considered a poor-quality study.11
Data Synthesis and Statistical Analysis
Given that most of the included studies were level IV, a formal meta-analysis was not indicated. In this article, we report categorical data as frequencies with percentages and preoperative and postoperative continuous data as means (SDs), with weighted means based on number of patients in each study, where applicable. We used 2-tailed t tests for comparisons made with the free Meta-Analysis Calculator and Grapher (http://www.healthstrategy.com/meta/meta.pl ). Statistical significance was set at P < .05.
Results
Search Results and Included Studies
Figure 10.
Table 2.Twenty-one studies (976 patients, 1055 knees) were included in the analysis (Figure 10; Table 2).12-32 These studies were published between 1986 and 2013. There were 18 level IV studies (85.7%), 3 level III studies (14%), and no level I or II studies. Better quality studies had a mean (SD) MCMS of 19.8 (8.2), well under the 55-point cutoff. In the 16 studies that reported sex, women accounted for 69% of the population. Weighted mean (SD) age was 27.68 (10.45) years (range, 12-77 years) (18 studies reporting).
Only 1 study provided preoperative body mass index (27 kg/m2). There were 55.35% of patients who had prior surgery on the affected knee (6 studies reporting).
Preoperative Data
Preoperative pathologic, radiographic, and clinical scoring data were scarcely reported and nonuniform (Table 2). The most common pathology treated with TTO was isolated patellofemoral instability (746/1055 patients, 70.7%). The other pathologies addressed were isolated patellofemoral osteoarthritis/chondromalacia patellae (143, 13.6%), patellofemoral instability with patella alta (61, 5.8%), patellofemoral instability with patellofemoral osteoarthritis (45, 4.3%), isolated patella baja (41, 3.9%), isolated patella alta (19, 1.8%), and patellofemoral osteoarthritis with patella baja (2, 0.2%). Five hundred fifty-five patients (53%) had a preoperative complaint that included knee pain, and 809 (77%) reported preoperative patellar laxity or instability events. The imaging data reported were Q-angle, Insall-Salvati ratio, Caton-Deschamps index, Blackburne-Peel ratio, Outerbridge osteoarthritis grade, and TT-TG distance. Preoperative clinical scoring data most prominently included a visual analog scale (VAS) score of 70.50 (4 studies reporting), a Lysholm score of 59.19 (5 studies), and a Kujala score of 41.16 (4 studies). Shelbourne-Trumper and Cox-Insall scores were reported in 1 and 2 studies, respectively.
Operative Characteristics
Of the 21 studies, 12 reported only on patients who had TTO performed in isolation; in the other 9 studies, cohorts included patients who underwent concurrent procedures. In the 17 studies (856 patients) that listed numbers of patients who underwent specific concomitant procedures, 715 patients (83.5%) underwent an isolated TTO procedure, and the other 141 (16.5%) underwent either concomitant lateral femoral trochleoplasty, arthroscopic drilling of chondral lesions, patellar shaving chondroplasty, partial meniscectomy or concomitant meniscal repair, intra-articular loose body removal, and/or lateral release with or without medial plication.
Table 3.Twenty studies reported specifics on the intraoperative direction of the tibial bone block osteotomy (Table 3). In most cases (50.8%), anteromedial translation (anteromedialization) was performed; anteriorization was performed in 18.7% of cases, medialization in 9.6%, medial and distal translation in 7.2%, a “triple” (anteriorization, medialization, proximalization) in 6%, isolated distalization in 2.8%, and proximalization in 1.6%. The remaining 2.8% of procedure specifics were not identified.
Postoperative Data
Table 4A.
Table 4B.
Table 4C.Table 4 lists the overall cohort’s postoperative radiographic, clinical outcome scoring, and complications data. Fifteen studies reported follow-up of >2 years. As with the preoperative data, radiographic and clinical scoring data were relatively nonuniform; some numeric data, however, should be highlighted. Statistical analysis allowed for comparison of preoperative-postoperative VAS, Lysholm, and Kujala scores, each of which was significantly higher after surgery (P < .001). Seven studies reported an overall clinical outcome rating, with the cumulative majority of patients reporting good (37.9%) or excellent (39.2%) results.
There was a cumulative total of 79 complications (8% of cohort): 17 recurrent patellar dislocations (1.9%), 4 recurrent patellar subluxations (0.4%), 10 wound complications (1.0%), 2 intraoperative complications (0.2%), 14 tibial tubercle fractures (1.3%), 19 proximal tibia fractures (1.8%), 4 cases of anterior knee pain (0.4%), 4 cases of neuropraxia (0.4%), and 5 infections (0.5%). Of note, 219 knees (21%) required reoperation, but 170 (16.3%) of these were for painful hardware removal. Sixteen knees (1.5%) required revision TTO, 1 (0.1%) required subsequent high tibial osteotomy, 2 (0.2%) underwent patellofemoral arthroplasty for advanced arthritic changes, and 5 (0.5%) underwent total knee arthroplasty for advanced arthritic changes.
Studies With TTO Performed in Isolation
Twelve studies reported outcomes of isolated TTO procedures. In the 638 patients who underwent isolated TTO, the pathologies addressed were instability/laxity (429 patients, 67%), patellofemoral osteoarthritis (74, 12%), patella alta with instability (61, 10%), patellofemoral osteoarthritis with instability (31, 5%), patella baja (24, 4%), and patella alta (19, 3%). Pain was a preoperative issue in 289 (45%) of these patients and instability in 472 (74%).
Only 2.8% of patients experienced postoperative patellar dislocation events. Of the 12 studies, 2 reported VAS scores (34-point weighted mean improvement, 65 points before surgery to 31 after surgery), 3 reported Lysholm scores (30-point improvement, from 60 to 90), and 2 reported Kujala scores (21-point improvement, from 46 to 67).
Complication rates for this isolated-TTO pooled cohort of patients were 1.2% for revision TTOs, 0.5% for wound complications, 0.8% for tibial tubercle fractures, and 1.9% for proximal tibia fractures. In total, 16% of patients required hardware removal after surgery.
Discussion
This study found that TTO improved patient pain and clinical outcome scores despite having a high (16%) rate of reoperation for painful hardware in patients with preoperative pain or instability, or with patellofemoral osteoarthritis or aberrant patellar anatomy. This reoperation rate and the overall complication rate both exceeded our hypothesized 10% cumulative rate. However, <1% of patients required conversion to a definitive end-stage surgery (patellofemoral arthroplasty or total knee arthroplasty) by final follow-up, and the rates of comorbidities (anterior knee pain, wound infection, recurrent patellar subluxation/dislocation, tibial fracture) were relatively low.
Patellofemoral disorders are common in the general population and a frequent primary complaint on presentation to orthopedic offices. Having a thorough understanding of knee joint biomechanics is imperative when trying to determine whether surgery is appropriate for these complaints and how to proceed. Extensor mechanism abnormalities, including high lateral force vectors (or larger TT-TG distances) and excessive patellar tilt, can affect alignment and increase the risk for patellofemoral dislocations, patellofemoral anterior- based knee pains, and chondral lesions. Patella alta, an elevated patella, risks increased contact stresses between the patella and the trochlear groove33 and decreases the osseous constraints that inhibit dislocation of the patella with physiologic flexion of the joint.34 With TTO, the change in tuberosity position can alter angles in the extensor mechanism and thereby decrease joint reaction forces and patellofemoral contact area forces.35,36
Although its use began as an option for combating patellar instability events in patients with predisposed patellofemoral kinematics,5 TTO has evolved in its therapeutic uses to include offloading patellar and trochlear focal chondral lesions and slowing progression of patellofemoral arthritis. Multiple iterations and modifications of the procedure have involved distal and medial transfer of the tibial tuberosity, medialization alone, concurrent anterior and medial elevation of the tuberosity, and proximal or distal transfers, depending on the pathology being corrected. Although TTO is highly versatile in treating multiple patellofemoral joint pathologies, this study found that its primary indication continues to be patellar instability, with anteromedialization as the most common direction of tubercle transfer in support of the medial structures providing the medial force vector that keeps the patella in place. These medial structures include the medial patellofemoral ligament, the vastus medialis obliquus, the medial patellotibial ligament, and the medial retinaculum.
Also notable was the relatively high rate of reoperation after TTO. However, >75% of reoperations were performed to remove painful hardware, and the need for reoperation seemed to have no effect on the statistically significant overall preoperative-to-postoperative improvement in VAS, Lysholm, and Kujala scores. Rates of definitive surgery for end-stage patellofemoral changes, including patellofemoral arthroplasty and total knee arthroplasty, were quite low at the weighted mean follow-up of several years after surgery, suggesting a role for TTO in avoiding arthroplasty. Although the infection rate was <1%, the rate of tibial tubercle or proximal tibia fractures was a cumulative 3.1%. Patients should be counseled on this complication risk, as treatment can require cast immobilization and weight-bearing limitations.24
The 69% proportion of women in the overall cohort and the mean (SD) age of 27.68 (10.45) years highlight the primary patient population that undergoes TTO. Compared with men, young women are more likely to have aberrant patellofemoral biomechanics, owing to their native anatomy, including their relatively larger Q-angle and TT-TG distance and thus increased lateral translational force vectors on the patella.37 In addition, more than half of patients who are having TTO underwent previous surgery on the affected knee—an indication that TTO is still not universally considered first-line in addressing patellofemoral pathology.
Limitations of the Analysis
The limitations of this analysis derive from the limitations of the included studies, which were mostly retrospective case series with relatively short follow-up. The low MCMS (<55) of all 21 studies highlights their low quality as well. These studies showed considerable heterogeneity in their reporting of specific preoperative, intraoperative, and postoperative radiographic, physical examination, and clinical outcome scores, which may be indicative of the relatively low rate of use of TTO, a procedure originally described decades ago. These studies also showed ample heterogeneity in the specific radiographic parameters or outcome scales they used to present their data. We were therefore limited in our ability to cohesively summarize and provide cumulative data points from the patients as a unified cohort. There was substantial variety in the procedures performed, surgical techniques used, concomitant pathologies addressed at time of surgery, and diagnoses treated—indicating a performance bias. This additionally precluded any significant meta-analysis within the patient cohort. A higher quality study, a randomized controlled trial, is needed to answer more definitively and completely the questions we left unanswered, including the effect on radiographic parameters, additional clinical outcomes, and patient satisfaction.
Conclusion
TTO is most commonly performed for isolated patellar instability in the presence of knee pain. Other pathologies addressed are patellofemoral osteoarthritis, and patella alta and patella baja with and without associated knee pain. TTO significantly improves knee pain and clinical outcome scores, though 21% of patients (>1 in 5) require reoperation for hardware removal. Young women with prior surgery on the affected knee are the primary patient population.
References
1. Blond L, Hansen L. Patellofemoral pain syndrome in athletes: a 5.7- year retrospective follow-up study of 250 athletes. Acta Orthop Belg. 1998;64(4):393-400.
2. Fairbank JC, Pynsent PB, van Poortvliet JA, Phillips H. Mechanical factors in the incidence of knee pain in adolescents and young adults. J Bone Joint Surg Br. 1984;66(5):685-693.
3. Mehta VM, Inoue M, Nomura E, Fithian DC. An algorithm guiding the evaluation and treatment of acute primary patellar dislocations. Sports Med Arthrosc. 2007;15(2):78-81.
4. Erickson BJ, Mascarenhas R, Sayegh ET, et al. Does operative treatment of first-time patellar dislocations lead to increased patellofemoral stability? A systematic review of overlapping meta-analyses. Arthroscopy. 2015;31(6):1207-1215.
5. Hauser E. Total tendon transplant for slipping patella. Surg Gynecol Obstet. 1938;66:199-214.
6. Sherman SL, Erickson BJ, Cvetanovich GL, et al. Tibial tuberosity osteotomy: indications, techniques, and outcomes. Am J Sports Med. 2014;42(8):2006-2017.
7. Hall MJ, Mandalia VI. Tibial tubercle osteotomy for patello-femoral joint disorders. Knee Surg Sports Traumatol Arthrosc. 2016;24(3):855-861.
9. Fulkerson JP. Disorders of the Patellofemoral Joint. 4th ed. Baltimore, MD: Williams & Wilkins; 1997.
10. Koh JL, Stewart C. Patellar instability. Clin Sports Med. 2014;33(3):461-476.
11. Coleman BD, Khan KM, Maffulli N, Cook JL, Wark JD. Studies of surgical outcome after patellar tendinopathy: clinical significance of methodological deficiencies and guidelines for future studies. Victorian Institute of Sport Tendon Study Group. Scand J Med Sci Sports. 2000;10(1):2-11.
12. Al-Sayyad MJ, Cameron JC. Functional outcome after tibial tubercle transfer for the painful patella alta. Clin Orthop Rel Res. 2002;(396):152-162.
13. Atkinson HD, Bailey CA, Anand S, Johal P, Oakeshott RD. Tibial tubercle advancement osteotomy with bone allograft for patellofemoral arthritis: a retrospective cohort study of 50 knees. Arch Orthop Trauma Surg. 2012;132(4):437-445.
14. Caton JH, Dejour D. Tibial tubercle osteotomy in patello-femoral instability and in patellar height abnormality. Int Orthop. 2010;34(2):305-309.
15. Dantas P, Nunes C, Moreira J, Amaral LB. Antero-medialisation of the tibial tubercle for patellar instability. Int Orthop. 2005;29(6):390-391.
16. Drexler M, Dwyer T, Marmor M, Sternheim A, Cameron HU, Cameron JC. The treatment of acquired patella baja with proximalize the tibial tuberosity. Knee Surg Sports Traumatol Arthrosc. 2013;21(11):2578-2583.
17. Eager MR, Bader DA, Kelly JD 4th, Moyer RA. Delayed fracture of the tibia following anteromedialization osteotomy of the tibial tubercle: a report of 5 cases. Am J Sports Med. 2004;32(4):1041-1048.
18. Ebinger TP, Boezaart A, Albright JP. Modifications of the Fulkerson osteotomy: a pilot study assessment of a novel technique of dynamic intraoperative determination of the adequacy of tubercle transfer. Iowa Orthop J. 2007;27:61-64.
19. Fulkerson JP, Becker GJ, Meaney JA, Miranda M, Folcik MA. Anteromedial tibial tubercle transfer without bone graft. Am J Sports Med. 1990;18(5):490-498.
20. Heatley FW, Allen PR, Patrick JH. Tibial tubercle advancement for anterior knee pain: a temporary or permanent solution. Clin Orthop Relat Res. 1986;(208):216-225.
21. Hirsh DM, Reddy DK. Experience with Maquet anterior tibial tubercle advancement for patellofemoral arthralgia. Clin Orthop Relat Res. 1980;(148):136-139.
22. Jack CM, Rajaratnam SS, Khan HO, Keast-Butler O, Butler-Manuel PA, Heatley FW. The modified tibial tubercle osteotomy for anterior knee pain due to chondromalacia patellae in adults: a five-year prospective study. Bone Joint Res. 2012;1(8):167-173.
23. Koëter S, Diks MJ, Anderson PG, Wymenga AB. A modified tibial tubercle osteotomy for patellar maltracking: results at two years. J Bone Joint Surg Br. 2007;89(2):180-185.
24. Luhmann SJ, Fuhrhop S, O’Donnell JC, Gordon JE. Tibial fractures after tibial tubercle osteotomies for patellar instability: a comparison of three osteotomy configurations. J Child Orthop. 2011;5(1):19-26.
25. Naranja RJ Jr, Reilly PJ, Kuhlman JR, Haut E, Torg JS. Long-term evaluation of the Elmslie-Trillat-Maquet procedure for patellofemoral dysfunction. Am J Sports Med. 1996;24(6):779-784.
26. Naveed MA, Ackroyd CE, Porteous AJ. Long-term (ten- to 15-year) outcome of arthroscopically assisted Elmslie-Trillat tibial tubercle osteotomy. Bone Joint J. 2013;95(4):478-485.
27. Paulos L, Swanson SC, Stoddard GJ, Barber-Westin S. Surgical correction of limb malalignment for instability of the patella: a comparison of 2 techniques. Am J Sports Med. 2009;37(7):1288-1300.
28. Pidoriano AJ, Weinstein RN, Buuck DA, Fulkerson JP. Correlation of patellar articular lesions with results from anteromedial tibial tubercle transfer. Am J Sports Med. 1997;25(4):533-537.
29. Shen HC, Chao KH, Huang GS, Pan RY, Lee CH. Combined proximal and distal realignment procedures to treat the habitual dislocation of the patella in adults. Am J Sports Med. 2007;35(12):2101-2108.
30. Stetson WB, Friedman MJ, Fulkerson JP, Cheng M, Buuck D. Fracture of the proximal tibia with immediate weightbearing after a Fulkerson osteotomy. Am J Sports Med. 1997;25(4):570-574.
31. Valenzuela L, Nemtala F, Orrego M, et al. Treatment of patellofemoral chondropathy with the Bandi tibial tubercle osteotomy: more than 10 years follow-up. Knee. 2011;18(2):94-97.
32. Wang CJ, Wong T, Ko JY, Siu KK. Triple positioning of tibial tubercle osteotomy for patellofemoral disorders. Knee. 2014;21(1):133-137.
33. Luyckx T, Didden K, Vandenneucker H, Labey L, Innocenti B, Bellemans J. Is there a biomechanical explanation for anterior knee pain in patients with patella alta? Influence of patellar height on patellofemoral contact force, contact area and contact pressure. J Bone Joint Surg Br. 2009;91(3):344-350.
34. Mayer C, Magnussen RA, Servien E, et al. Patellar tendon tenodesis in association with tibial tubercle distalization for the treatment of episodic patellar dislocation with patella alta. Am J Sports Med. 2012;40(2):346-351.
35. Maquet P. Advancement of the tibial tuberosity. Clin Orthop Relat Res. 1976;(115):225-230.
36. Lewallen DG, Riegger CL, Myers ER, Hayes WC. Effects of retinacular release and tibial tubercle elevation in patellofemoral degenerative joint disease. J Orthop Res. 1990;8(6):856-862.
37. Aglietti P, Insall JN, Cerulli G. Patellar pain and incongruence, I: measurements of incongruence. Clin Orthop Relat Res. 1983;(176):217-224.
SSIs after TJA pose a substantial burden on patients, surgeons, and the healthcare system.
While different forms of preoperative skin preparation have shown varying outcomes after TJA, the importance of preoperative patient optimization (nutritional status, immune function, etc) cannot be overstated.
Intraoperative infection prevention measures include cutaneous preparation, gloving, body exhaust suits, surgical drapes, OR staff traffic and ventilation flow, and antibiotic-loaded cement.
Antibiotic prophylaxis for dental procedures in TJA patients continues to remain a controversial issue with conflicting recommendations.
SSIs have considerable financial costs and require increased resource utilization. Given the significant economic burden associated with TJA infections, it is imperative for orthopedists to establish practical and cost-effective strategies to prevent these devastating complications.
Surgical-site infection (SSI), a potentially devastating complication of lower extremity total joint arthroplasty (TJA), is estimated to occur in 1% to 2.5% of cases annually.1 Infection after TJA places a significant burden on patients, surgeons, and the healthcare system. Revision procedures that address infection after total hip arthroplasty (THA) are associated with more hospitalizations, more operations, longer hospital stay, and higher outpatient costs in comparison with primary THAs and revision surgeries for aseptic loosening.2 If left untreated, a SSI can go deeper into the joint and develop into a periprosthetic infection, which can be disastrous and costly. A periprosthetic joint infection study that used 2001 to 2009 Nationwide Inpatient Sample (NIS) data found that the cost of revision procedures increased to $560 million from $320 million, and was projected to reach $1.62 billion by 2020.3 Furthermore, society incurs indirect costs as a result of patient disability and loss of wages and productivity.2 Therefore, the issue of infection after TJA is even more crucial in our cost-conscious healthcare environment.
Patient optimization, advances in surgical technique, sterile protocol, and operative procedures have been effective in reducing bacterial counts at incision sites and minimizing SSIs. As a result, infection rates have leveled off after rising for a decade.4 Although infection prevention modalities have their differences, routine use is fundamental and recommended by the Hospital Infection Control Practices Advisory Committee.5 Furthermore, both the US Centers for Disease Control and Prevention (CDC) and its Healthcare Infection Control Practices Advisory Committee6,7 recently updated their SSI prevention guidelines by incorporating evidence-based methodology, an element missing from earlier recommendations.
The etiologies of postoperative SSIs have been discussed ad nauseam, but there are few reports summarizing the literature on infection prevention modalities. In this review, we identify and examine SSI prevention strategies as they relate to lower extremity TJA. Specifically, we discuss the literature on the preoperative, intraoperative, and postoperative actions that can be taken to reduce the incidence of SSIs after TJA. We also highlight the economic implications of SSIs that occur after TJA.
Methods
For this review, we performed a literature search with PubMed, EBSCOhost, and Scopus. We looked for reports published between the inception of each database and July 2016. Combinations of various search terms were used: surgical site, infection, total joint arthroplasty, knee, hip, preoperative, intraoperative, perioperative, postoperative, preparation, nutrition, ventilation, antibiotic, body exhaust suit, gloves, drain, costs, economic, and payment.
Our search identified 195 abstracts. Drs. Mistry and Chughtai reviewed these to determine which articles were relevant. For any uncertainties, consensus was reached with the help of Dr. Delanois. Of the 195 articles, 103 were potentially relevant, and 54 of the 103 were excluded for being not relevant to preventing SSIs after TJA or for being written in a language other than English. The references in the remaining articles were assessed, and those with potentially relevant titles were selected for abstract review. This step provided another 35 articles. After all exclusions, 48 articles remained. We discuss these in the context of preoperative, intraoperative, and postoperative measures and economic impact.
Results
Preoperative Measures
Skin Preparation. Preoperative skin preparation methods include standard washing and rinsing, antiseptic soaps, and iodine-based or chlorhexidine gluconate-based antiseptic showers or skin cloths. Iodine-based antiseptics are effective against a wide range of Gram-positive and Gram-negative bacteria, fungi, and viruses. These agents penetrate the cell wall, oxidize the microbial contents, and replace those contents with free iodine molecules.8 Iodophors are free iodine molecules associated with a polymer (eg, polyvinylpyrrolidone); the iodophor povidone-iodine is bactericidal.9 Chlorhexidine gluconate-based solutions are effective against many types of yeast, Gram-positive and Gram-negative bacteria, and a wide variety of viruses.9 Both solutions are useful. Patients with an allergy to iodine can use chlorhexidine. Table 1 summarizes the studies on preoperative measures for preventing SSIs.
Table 1A.
Table 1B.
There is no shortage of evidence of the efficacy of these antiseptics in minimizing the incidence of SSIs. Hayek and colleagues10 prospectively analyzed use of different preoperative skin preparation methods in 2015 patients. Six weeks after surgery, the infection rate was significantly lower with use of chlorhexidine than with use of an unmedicated bar of soap or placebo cloth (9% vs 11.7% and 12.8%, respectively; P < .05). In a study of 100 patients, Murray and colleagues11 found the overall bacterial culture rate was significantly lower for those who used a 2% chlorhexidine gluconate cloth before shoulder surgery than for those who took a standard shower with soap (66% vs 94%; P = .0008). Darouiche and colleagues12 found the overall SSI rate was significantly lower for 409 surgical patients prepared with chlorhexidine-alcohol than for 440 prepared with povidone-iodine (9.5% vs 16.1%; P = .004; relative risk [RR], 0.59; 95% confidence interval [CI], 0.41-0.85).
Chlorhexidine gluconate-impregnated cloths have also had promising results, which may be attributed to general ease of use and potentially improved patient adherence. Zywiel and colleagues13 reported no SSIs in 136 patients who used these cloths at home before total knee arthroplasty (TKA) and 21 SSIs (3.0%) in 711 patients who did not use the cloths. In a study of 2545 THA patients, Kapadia and colleagues14 noted a significantly lower incidence of SSIs with at-home preoperative use of chlorhexidine cloths than with only in-hospital perioperative skin preparation (0.5% vs 1.7%; P = .04). In 2293 TKAs, Johnson and colleagues15 similarly found a lower incidence of SSIs with at-home preoperative use of chlorhexidine cloths (0.6% vs 2.2%; P = .02). In another prospective, randomized trial, Kapadia and colleagues16 compared 275 patients who used chlorhexidine cloths the night before and the morning of lower extremity TJA surgery with 279 patients who underwent standard-of-care preparation (preadmission bathing with antibacterial soap and water). The chlorhexidine cohort had a lower overall incidence of infection (0.4% vs 2.9%; P = .049), and the standard-of-care cohort had a stronger association with infection (odds ratio [OR], 8.15; 95% CI, 1.01-65.6).
Patient Optimization. Poor nutritional status may compromise immune function, potentially resulting in delayed healing, increased risk of infection, and, ultimately, negative postoperative outcomes. Malnutrition can be diagnosed on the basis of a prealbumin level of <15 mg/dL (normal, 15-30 mg/dL), a serum albumin level of <3.4 g/dL (normal, 3.4-5.4 g/dL), or a total lymphocyte count under 1200 cells/μL (normal, 3900-10,000 cells/μL).17-19 Greene and colleagues18 found that patients with preoperative malnutrition had up to a 7-fold higher rate of infection after TJA. In a study of 135 THAs and TKAs, Alfargieny and colleagues20 found preoperative serum albumin was the only nutritional biomarker predictive of SSI (P = .011). Furthermore, patients who take immunomodulating medications (eg, for inflammatory arthropathies) should temporarily discontinue them before surgery in order to lower their risk of infection.21
Smoking is well established as a major risk factor for poor outcomes after surgery. It is postulated that the vasoconstrictive effects of nicotine and the hypoxic effects of carbon monoxide contribute to poor wound healing.22 In a meta-analysis of 4 studies, Sørensen23 found smokers were at increased risk for wound complications (OR, 2.27; 95% CI, 1.82-2.84), delayed wound healing and dehiscence (OR, 2.07; 95% CI, 1.53-2.81), and infection (OR, 1.79; 95% CI, 1.57-2.04). Moreover, smoking cessation decreased the incidence of SSIs (OR, 0.43; 95% CI, 0.21-0.85). A meta- analysis by Wong and colleagues24 revealed an inflection point for improved outcomes in patients who abstained from smoking for at least 4 weeks before surgery. Risk of infection was lower for these patients than for current smokers (OR, 0.69; 95% CI, 0.56-0.84).
Other comorbidities contribute to SSIs as well. In their analysis of American College of Surgeons National Surgical Quality Improvement Program registry data on 25,235 patients who underwent primary and revision lower extremity TJA, Pugely and colleagues25 found that, in the primary TJA cohort, body mass index (BMI) of >40 kg/m2 (OR, 1.9; 95% CI, 1.3-2.9), electrolyte disturbance (OR, 2.4; 95% CI, 1.0-6.0), and hypertension diagnosis (OR, 1.5; 95% CI, 1.1-2.0) increased the risk of SSI within 30 days. Furthermore, diabetes mellitus delays collagen synthesis, impairs lymphocyte function, and impairs wound healing, which may lead to poor recovery and higher risk of infection.26 In a study of 167 TKAs performed in 115 patients with type 2 diabetes mellitus, Han and Kang26 found that wound complications were 6 times more likely in those with hemoglobin A1c (HbA1c) levels higher than 8% than in those with lower HbA1c levels (OR, 6.07; 95% CI, 1.12-33.0). In a similar study of 462 patients with diabetes, Hwang and colleagues27 found a higher likelihood of superficial SSIs in patients with HbA1c levels >8% (OR, 6.1; 95% CI, 1.6-23.4; P = .008). This association was also found in patients with a fasting blood glucose level of >200 mg/dL (OR, 9.2; 95% CI, 2.2-38.2; P = .038).
Methicillin-resistant Staphylococcus aureus (MRSA) is thought to account for 10% to 25% of all periprosthetic infections in the United States.28 Nasal colonization by this pathogen increases the risk for SSIs; however, decolonization protocols have proved useful in decreasing the rates of colonization. Moroski and colleagues29 assessed the efficacy of a preoperative 5-day course of intranasal mupirocin in 289 primary or revision TJA patients. Before surgery, 12 patients had positive MRSA cultures, and 44 had positive methicillin-sensitive S aureus (MSSA) cultures. On day of surgery, a significant reduction in MRSA (P = .0073) and MSSA (P = .0341) colonization was noted. Rao and colleagues30 found that the infection rate decreased from 2.7% to 1.2% in 2284 TJA patients treated with a decolonization protocol (P = .009).
Intraoperative Measures
Cutaneous Preparation. The solutions used in perioperative skin preparation are similar to those used preoperatively: povidone-iodine, alcohol, and chlorhexidine. The efficacy of these preparations varies. Table 2 summarizes the studies on intraoperative measures for preventing SSIs.
Table 2A.
Table 2B.In a prospective study, Saltzman and colleagues31 randomly assigned 150 shoulder arthroplasty patients to one of 3 preparations: 0.75% iodine scrub with 1% iodine paint (Povidone-Iodine; Tyco Healthcare Group), 0.7% iodophor with 74% iodine povacrylex (DuraPrep; 3M Health Care), or chlorhexidine gluconate with 70% isopropyl alcohol (ChloraPrep; Enturia). All patients had their skin area prepared and swabbed for culture before incision. Although no one in any group developed a SSI, patients in the chlorhexidine group had the lowest overall incidence of positive skin cultures. That incidence (7%) and the incidence of patients in the iodophor group (19%) were significantly lower than that of patients in the iodine group (31%) (P < .001 for both). Conversely, another study32 found a higher likelihood of SSI with chlorhexidine than with povidone-iodine (OR, 4.75; 95% CI, 1.42-15.92; P = .012). This finding is controversial, but the body of evidence led the CDC to recommend use of an alcohol-based solution for preoperative skin preparation.6
The literature also highlights the importance of technique in incision-site preparation. In a prospective study, Morrison and colleagues33 randomly assigned 600 primary TJA patients to either (1) use of alcohol and povidone-iodine before draping, with additional preparation with iodine povacrylex (DuraPrep) and isopropyl alcohol before application of the final drape (300-patient intervention group) or (2) only use of alcohol and povidone-iodine before draping (300-patient control group). At the final follow-up, the incidence of SSI was significantly lower in the intervention group than in the control group (1.8% vs 6.5%; P = .015). In another study that assessed perioperative skin preparation methods, Brown and colleagues34 found that airborne bacteria levels in operating rooms were >4 times higher with patients whose legs were prepared by a scrubbed, gowned leg-holder than with patients whose legs were prepared by an unscrubbed, ungowned leg-holder (P = .0001).
Hair Removal. Although removing hair from surgical sites is common practice, the literature advocating it varies. A large comprehensive review35 revealed no increased risk of SSI with removing vs not removing hair (RR, 1.65; 95% CI, 0.85-3.19). On the other hand, some hair removal methods may affect the incidence of infection. For example, use of electric hair clippers is presumed to reduce the risk of SSIs, whereas traditional razors may compromise the epidermal barriers and create a pathway for bacterial colonization.5,36,37 In the aforementioned review,35 SSIs were more than twice as likely to occur with hair removed by shaving than with hair removed by electric clippers (RR, 2.02; 95% CI, 1.21-3.36). Cruse and Foord38 found a higher rate of SSIs with hair removed by shaving than with hair removed by clipping (2.3% vs 1.7%). Most surgeons agree that, if given the choice, they would remove hair with electric clippers rather than razors.
Gloves. Almost all orthopedists double their gloves for TJA cases. Over several studies, the incidence of glove perforation during orthopedic procedures has ranged from 3.6% to 26%,39-41 depending on the operating room personnel and glove layering studied. Orthopedists must know this startling finding, as surgical glove perforation is associated with an increase in the rate of SSIs, from 1.7% to 5.7%.38 Carter and colleagues42 found the highest risk of glove perforation occurs when double-gloved attending surgeons, adult reconstruction fellows, and registered nurses initially assist during primary and revision TJA. In their study, outer and inner glove layers were perforated 2.5% of the time. All outer-layer perforations were noticed, but inner-layer perforations went unnoticed 81% of the time, which poses a potential hazard for both patients and healthcare personnel. In addition, there was a significant increase in the incidence of glove perforations for attending surgeons during revision TJA vs primary TJA (8.9% vs 3.7%; P = .04). This finding may be expected given the complexity of revision procedures, the presence of sharp bony and metal edges, and the longer operative times. Giving more attention to glove perforations during arthroplasties may mitigate the risk of SSI. As soon as a perforation is noticed, the glove should be removed and replaced.
Body Exhaust Suits. Early TJAs had infection rates approaching 10%.43 Bacterial-laden particles shed from surgical staff were postulated to be the cause,44,45 and this idea prompted the development of new technology, such as body exhaust suits, which have demonstrated up to a 20-fold reduction in airborne bacterial contamination and decreased incidence of deep infection, from 1% to 0.1%, as compared with conventional surgical attire.46 However, the efficacy of these suits was recently challenged. Hooper and colleagues47 assessed >88,000 TJA cases in the New Zealand Joint Registry and found a significant increase in early revision THA for deep infection with vs without use of body exhaust suits (0.186% vs 0.064%; P < .0001). The incidence of revision TKAs for deep infections with use of these suits was similar (0.243% vs 0.098%; P < .001). Many of the surgeons surveyed indicated their peripheral vision was limited by the suits, which may contribute to sterile field contamination. By contrast, Miner and colleagues48 were unable to determine an increased risk of SSI with use of body exhaust suits (RR, 0.75; 95% CI, 0.34-1.62), though there was a trend toward more infections without suits. Moreover, these suits are effective in reducing mean air bacterial counts (P = .014), but it is not known if this method correlates with mean wound bacterial counts (r = –.011) and therefore increases the risk of SSI.49
Surgical Drapes. Surgical draping, including cloths, iodine-impregnated materials, and woven or unwoven materials, is the standard of care worldwide. The particular draping technique usually varies by surgeon. Plastic drapes are better barriers than cloth drapes, as found in a study by Blom and colleagues50: Bacterial growth rates were almost 10 times higher with use of wet woven cloth drapes than with plastic surgical drapes. These findings were supported in another, similar study by Blom and colleagues51: Wetting drapes with blood or normal saline enhanced bacterial penetration. In addition, wetting drapes with chlorhexidine or iodine reduced but did not eliminate bacterial penetration. Fairclough and colleagues52 emphasized that iodine-impregnated drapes reduced surgical-site bacterial contamination from 15% to 1.6%. However, a Cochrane review53 found these drapes had no effect on the SSI rate (RR, 1.03; 95% CI, 0.06-1.66; P = .89), though the risk of infection was slightly higher with adhesive draping than with no drape (RR, 1.23; 95% CI, 1.02-1.48; P = .03).
Ventilation Flow. Laminar-airflow systems are widely used to prevent SSIs after TJA. Horizontal-flow and vertical-flow ventilation provides and maintains ultra-clean air in the operating room. Evans54 found the bacterial counts in the air and the wound were lower with laminar airflow than without this airflow. The amount of airborne bacterial colony-forming units and dust large enough to carry bacteria was reduced to 1 or 2 particles more than 2 μm/m3 with use of a typical laminar- airflow system. In comparing 3922 TKA patients in laminar-airflow operating rooms with 4133 patients in conventional rooms, Lidwell and colleagues46 found a significantly lower incidence of SSIs in patients in laminar-airflow operating rooms (0.6% vs 2.3%; P < .001).
Conversely, Miner and colleagues48 did not find a lower risk of SSI with laminar-airflow systems (RR, 1.57; 95% CI, 0.75-3.31). In addition, in their analysis of >88,000 cases from the New Zealand Joint Registry, Hooper and colleagues47 found that the incidence of early infections was higher with laminar-airflow systems than with standard airflow systems for both TKA (0.193% vs 0.100%; P = .019) and THA (0.148% vs 0.061%; P < .001). They postulated that vertically oriented airflow may have transmitted contaminated particles into the surgical sites. Additional evidence may be needed to resolve these conflicting findings and determine whether clean-air practices provide significant clinical benefit in the operating room.
Staff Traffic Volume. When staff enters or exits the operating room or makes extra movements during a procedure, airflow near the wound is disturbed and no longer able to remove sufficient airborne pathogens from the sterile field. The laminar- airflow pattern may be disrupted each time the operating room doors open and close, potentially allowing airborne pathogens to be introduced near the patient. Lynch and colleagues55 found the operating room door opened almost 50 times per hour, and it took about 20 seconds to close each time. As a result, the door may remain open for up to 20 minutes per case, causing substantial airflow disruption and potentially ineffective removal of airborne bacterial particles. Similarly, Young and O’Regan56 found the operating room door opened about 19 times per hour and took 20 seconds to close each time. The theater door was open an estimated 10.7% of each hour of sterile procedure. Presence of more staff also increases airborne bacterial counts. Pryor and Messmer57 evaluated a cohort of 2864 patients to determine the effect of number of personnel in the operating theater on the incidence of SSIs. Infection rates were 6.27% with >17 different people entering the room and 1.52% with <9 different people entering the room. Restricting the number of people in the room may be one of the easiest and most efficient ways to prevent SSI.
Systemic Antibiotic Prophylaxis. Perioperative antibiotic use is vital in minimizing the risk of infection after TJA. The Surgical Care Improvement Project recommended beginning the first antimicrobial dose either within 60 minutes before surgical incision (for cephalosporin) or within 2 hours before incision (for vancomycin) and discontinuing the prophylactic antimicrobial agents within 24 hours after surgery ends.58,59 However, Gorenoi and colleagues60 were unable to recommend a way to select particular antibiotics, as they found no difference in the effectiveness of various antibiotic agents used in TKA. A systematic review by AlBuhairan and colleagues61 revealed that antibiotic prophylaxis (vs no prophylaxis) reduced the absolute risk of a SSI by 8% and the relative risk by 81% (P < 0.0001). These findings are supported by evidence of the efficacy of perioperative antibiotics in reducing the incidence of SSI.62,63 Antibiotic regimens should be based on susceptibility and availability, depending on hospital prevalence of infections. Even more, patients should receive prophylaxis in a timely manner. Finally, bacteriostatic antibiotics (vancomycin) should not be used on their own for preoperative prophylaxis.
Antibiotic Cement. Antibiotic-loaded bone cement (ALBC), which locally releases antimicrobials in high concentration, is often used in revision joint arthroplasty, but use in primary joint arthroplasty remains controversial. In a study of THA patients, Parvizi and colleagues64 found infection rates of 1.2% with 2.3% with and without use of ALBC, respectively. Other studies have had opposing results. Namba and colleagues65 evaluated 22,889 primary TKAs, 2030 (8.9%) of which used ALBC. The incidence of deep infection was significantly higher with ALBC than with regular bone cement (1.4% vs 0.7%; P = .002). In addition, a meta- analysis of >6500 primary TKA patients, by Zhou and colleagues,66 revealed no significant difference in the incidence of deep SSIs with use of ALBC vs regular cement (1.32% vs 1.89%; RR, 0.75; 95% CI, 0.43-1.33; P = .33). More evidence is needed to determine the efficacy of ALBC in primary TJA. International Consensus Meeting on Periprosthetic Joint Infection participants recommended use of ALBC in high-risk patients, including patients who are obese or immunosuppressed or have diabetes or a prior history of infection.67
Postoperative Measures
Antibiotic Prophylaxis. The American Academy of Orthopaedic Surgeons (AAOS) and the American Dental Association (ADA) have suggestions for antibiotic prophylaxis for patients at increased risk for infection. As of 2015, the ADA no longer recommends antibiotic prophylaxis for patients with prosthetic joint implants,68 whereas the AAOS considers all patients with TJA to be at risk.69
Table 3.For TJA patients, the AAOS recommends administering antibiotic prophylaxis at least 1 hour before a dental procedure and discontinuing it within 24 hours after the procedure ends.69 Single preoperative doses are acceptable for outpatient procedures.70Table 3 summarizes the studies that reported on postoperative measures for preventing SSI.
Although recommendations exist, the actual risk of infection resulting from dental procedures and the role of antibiotic prophylaxis are not well defined. Berbari and colleagues71 found that antibiotic prophylaxis in high- or low-risk dental procedures did not decrease the risk of subsequent THA infection (OR, 0.9; 95% CI, 0.5-1.6) or TKA infection (OR, 1.2; 95% CI, 0.7-2.2). Moreover, the risk of infection was no higher for patients who had a prosthetic hip or knee and underwent a high- or low-risk dental procedure without antibiotic prophylaxis (OR, 0.8; 95% CI, 0.4-1.6) than for similar patients who did not undergo a dental procedure (OR, 0.6; 95% CI, 0.4-1.1). Some studies highlight the low level of evidence supporting antibiotic prophylaxis during dental procedures.72,73 However, there is no evidence of adverse effects of antibiotic prophylaxis. Given the potential high risk of infection after such procedures, a more robust body of evidence is needed to reach consensus.
Evacuation Drain Management. Prolonged use of surgical evacuation drains may be a risk factor for SSI. Therefore, early drain removal is paramount. Higher infection rates with prolonged drain use have been found in patients with persistent wound drainage, including malnourished, obese, and over-anticoagulated patients. Patients with wounds persistently draining for >1 week should undergo superficial wound irrigation and débridement. Jaberi and colleagues74 assessed 10,325 TJA patients and found that the majority of persistent drainage ceased within 1 week with use of less invasive measures, including oral antibiotics and local wound care. Furthermore, only 28% of patients with persistent drainage underwent surgical débridement. It is unclear if this practice alone is appropriate. Infection should always be suspected and treated aggressively, and cultures should be obtained from synovial fluid before antibiotics are started, unless there is an obvious superficial infection that does not require further work-up.67
Economic Impact
SSIs remain a significant healthcare issue, and the social and financial costs are staggering. Without appropriate measures in place, these complications will place a larger burden on the healthcare system primarily as a result of longer hospital stays, multiple procedures, and increased resource utilization.75 Given the risk of progression to prosthetic joint infection, early preventive interventions must be explored.
Table 4.Several studies have addressed the economic implications of SSIs after TJA as well as the impact of preventive interventions (Table 4). Using the NIS database, Kurtz and colleagues4 found that not only were hospital stays significantly longer for infected (vs noninfected) knee arthroplasties (7.6 vs 3.9 days; P < .0001), but hospital charges were 1.52 times higher (P < .0001), and results were similar for infected (vs noninfected) hips (9.7 vs 4.3 days; 1.76 times higher charges; P < .0001 for both). Kapadia and colleagues76 matched 21 TKA patients with periprosthetic infections with 21 noninfected TKA patients at a single institution and found the infected patients had more readmissions (3.6 vs 0.1; P < .0001), longer hospitalizations (5.3 vs 3.0 days; P = .0002), more days in the hospital within 1 year of arthroplasty (23.7 vs 3.4 days; P < .0001), and more clinic visits (6.5 vs 1.3; P < .0001). Furthermore, the infected patients had a significantly higher mean annual cost of treatment ($116,383 vs $28,249; P < .0001). Performing a Markov analysis, Slover and colleagues77 found that the decreased incidence of infection and the potential cost savings associated with preoperative S aureus screening and a decolonization protocol were able to offset the costs acquired by the screening and decolonization protocol. Similarly, Cummins and colleagues78 evaluated the effects of ALBC on overall healthcare costs; if revision surgery was the primary outcome of all infections, use of ALBC (vs cement without antibiotics) resulted in a cost-effectiveness ratio of $37,355 per quality-adjusted life year. Kapadia and colleagues79 evaluated the economic impact of adding 2% chlorhexidine gluconate-impregnated cloths to an existing preoperative skin preparation protocol for TKA. One percent of non-chlorhexidine patients and 0.6% of chlorhexidine patients developed an infection. The reduction in incidence of infection amounted to projected net savings of almost $2.1 million per 1000 TKA patients. Nationally, annual healthcare savings were expected to range from $0.78 billion to $3.18 billion with implementation of this protocol.
Improved patient selection may be an important factor in reducing SSIs. In an analysis of 8494 joint arthroplasties, Malinzak and colleagues80 noted that patients with a BMI of >50 kg/m2 had an increased OR of infection of 21.3 compared to those with BMI <50 kg/m2. Wagner and colleagues81 analyzed 21,361 THAs and found that, for every BMI unit over 25 kg/m2, there was an 8% increased risk of joint infection (P < .001). Although it is unknown if there is an association between reduction in preoperative BMI and reduction in postoperative complication risk, it may still be worthwhile and cost-effective to modify this and similar risk factors before elective procedures.
Market forces are becoming a larger consideration in healthcare and are being driven by provider competition.82 Treatment outcomes, quality of care, and healthcare prices have gained attention as a means of estimating potential costs.83 In 2011, the Centers for Medicare & Medicaid Services (CMS) advanced the Bundled Payments for Care Improvement (BPCI) initiative, which aimed to provide better coordinated care of higher quality and lower cost.84 This led to development of the Comprehensive Care for Joint Replacement (CJR) program, which gives beneficiaries flexibility in choosing services and ensures that providers adhere to required standards. During its 5-year test period beginning in 2016, the CJR program is projected to save CMS $153 million.84 Under this program, the institution where TJA is performed is responsible for all the costs of related care from time of surgery through 90 days after hospital discharge—which is known as an “episode of care.” If the cost incurred during an episode exceeds an established target cost (as determined by CMS), the hospital must repay Medicare the difference. Conversely, if the cost of an episode is less than the established target cost, the hospital is rewarded with the difference. Bundling payments for a single episode of care in this manner is thought to incentivize providers and hospitals to give patients more comprehensive and coordinated care. Given the substantial economic burden associated with joint arthroplasty infections, it is imperative for orthopedists to establish practical and cost-effective strategies that can prevent these disastrous complications.
Conclusion
SSIs are a devastating burden to patients, surgeons, and other healthcare providers. In recent years, new discoveries and innovations have helped mitigate the incidence of these complications of THA and TKA. However, the incidence of SSIs may rise with the increasing use of TJAs and with the development of new drug-resistant pathogens. In addition, the increasing number of TJAs performed on overweight and high-risk patients means the costs of postoperative infections will be substantial. With new reimbursement models in place, hospitals and providers are being held more accountable for the care they deliver during and after TJA. Consequently, more emphasis should be placed on techniques that are proved to minimize the incidence of SSIs.
References
1. National Nosocomial Infections Surveillance System. National Nosocomial Infections Surveillance (NNIS) System report, data summary from January 1992 through June 2004, issued October 2004. Am J Infect Control. 2004;32(8):470-485.
2. Bozic KJ, Ries MD. The impact of infection after total hip arthroplasty on hospital and surgeon resource utilization. J Bone Joint Surg Am. 2005;87(8):1746-1751.
3. Kurtz SM, Lau E, Watson H, Schmier JK, Parvizi J. Economic burden of periprosthetic joint infection in the United States. J Arthroplasty. 2012;27(8 suppl):61-65.e61.
4. Kurtz SM, Lau E, Schmier J, Ong KL, Zhao K, Parvizi J. Infection burden for hip and knee arthroplasty in the United States. J Arthroplasty. 2008;23(7):984-991.
5. Mangram AJ, Horan TC, Pearson ML, Silver LC, Jarvis WR. Guideline for prevention of surgical site infection, 1999. Hospital Infection Control Practices Advisory Committee. Infect Control Hosp Epidemiol. 1999;20(4):250-278.
6. Berrios-Torres SI. Evidence-based update to the U.S. Centers for Disease Control and Prevention and Healthcare Infection Control Practices Advisory Committee guideline for the prevention of surgical site infection: developmental process. Surg Infect (Larchmt). 2016;17(2):256-261.
7 Mangram AJ, Horan TC, Pearson ML, Silver LC, Jarvis WR. Guideline for prevention of surgical site infection, 1999. Centers for Disease Control and Prevention (CDC) Hospital Infection Control Practices Advisory Committee. Am J Infect Control. 1999;27(2):97-132.
8. Marchetti MG, Kampf G, Finzi G, Salvatorelli G. Evaluation of the bactericidal effect of five products for surgical hand disinfection according to prEN 12054 and prEN 12791. J Hosp Infect. 2003;54(1):63-67.
9. Reichman DE, Greenberg JA. Reducing surgical site infections: a review. Rev Obstet Gynecol. 2009;2(4):212-221.
10. Hayek LJ, Emerson JM, Gardner AM. A placebo-controlled trial of the effect of two preoperative baths or showers with chlorhexidine detergent on postoperative wound infection rates. J Hosp Infect. 1987;10(2):165-172.
11. Murray MR, Saltzman MD, Gryzlo SM, Terry MA, Woodward CC, Nuber GW. Efficacy of preoperative home use of 2% chlorhexidine gluconate cloth before shoulder surgery. J Shoulder Elbow Surg. 2011;20(6):928-933.
12. Darouiche RO, Wall MJ Jr, Itani KM, et al. Chlorhexidine-alcohol versus povidone-iodine for surgical-site antisepsis. N Engl J Med. 2010;362(1):18-26.
13. Zywiel MG, Daley JA, Delanois RE, Naziri Q, Johnson AJ, Mont MA. Advance pre-operative chlorhexidine reduces the incidence of surgical site infections in knee arthroplasty. Int Orthop. 2011;35(7):1001-1006.
14. Kapadia BH, Johnson AJ, Daley JA, Issa K, Mont MA. Pre-admission cutaneous chlorhexidine preparation reduces surgical site infections in total hip arthroplasty. J Arthroplasty. 2013;28(3):490-493.
15. Johnson AJ, Kapadia BH, Daley JA, Molina CB, Mont MA. Chlorhexidine reduces infections in knee arthroplasty. J Knee Surg. 2013;26(3):213-218.
16. Kapadia BH, Elmallah RK, Mont MA. A randomized, clinical trial of preadmission chlorhexidine skin preparation for lower extremity total joint arthroplasty. J Arthroplasty. 2016;31(12):2856-2861.
17. Mainous MR, Deitch EA. Nutrition and infection. Surg Clin North Am. 1994;74(3):659-676.
18. Greene KA, Wilde AH, Stulberg BN. Preoperative nutritional status of total joint patients. Relationship to postoperative wound complications. J Arthroplasty. 1991;6(4):321-325.
19. Del Savio GC, Zelicof SB, Wexler LM, et al. Preoperative nutritional status and outcome of elective total hip replacement. Clin Orthop Relat Res. 1996;(326):153-161.
20. Alfargieny R, Bodalal Z, Bendardaf R, El-Fadli M, Langhi S. Nutritional status as a predictive marker for surgical site infection in total joint arthroplasty. Avicenna J Med. 2015;5(4):117-122.
21. Bridges SL Jr, Lopez-Mendez A, Han KH, Tracy IC, Alarcon GS. Should methotrexate be discontinued before elective orthopedic surgery in patients with rheumatoid arthritis? J Rheumatol. 1991;18(7):984-988.
22. Silverstein P. Smoking and wound healing. Am J Med. 1992;93(1A):22S-24S.
23. Sørensen LT. Wound healing and infection in surgery. The clinical impact of smoking and smoking cessation: a systematic review and meta-analysis. Arch Surg. 2012;147(4):373-383.
24. Wong J, Lam DP, Abrishami A, Chan MT, Chung F. Short-term preoperative smoking cessation and postoperative complications: a systematic review and meta-analysis. Can J Anaesth. 2012;59(3):268-279.
25. Pugely AJ, Martin CT, Gao Y, Schweizer ML, Callaghan JJ. The incidence of and risk factors for 30-day surgical site infections following primary and revision total joint arthroplasty. J Arthroplasty. 2015;30(9 suppl):47-50.
26. Han HS, Kang SB. Relations between long-term glycemic control and postoperative wound and infectious complications after total knee arthroplasty in type 2 diabetics. Clin Orthop Surg. 2013;5(2):118-123.
27. Hwang JS, Kim SJ, Bamne AB, Na YG, Kim TK. Do glycemic markers predict occurrence of complications after total knee arthroplasty in patients with diabetes? Clin Orthop Relat Res. 2015;473(5):1726-1731.
28. Whiteside LA, Peppers M, Nayfeh TA, Roy ME. Methicillin-resistant Staphylococcus aureus in TKA treated with revision and direct intra-articular antibiotic infusion. Clin Orthop Relat Res. 2011;469(1):26-33.
29. Moroski NM, Woolwine S, Schwarzkopf R. Is preoperative staphylococcal decolonization efficient in total joint arthroplasty. J Arthroplasty. 2015;30(3):444-446.
30. Rao N, Cannella BA, Crossett LS, Yates AJ Jr, McGough RL 3rd, Hamilton CW. Preoperative screening/decolonization for Staphylococcus aureus to prevent orthopedic surgical site infection: prospective cohort study with 2-year follow-up. J Arthroplasty. 2011;26(8):1501-1507.
31. Saltzman MD, Nuber GW, Gryzlo SM, Marecek GS, Koh JL. Efficacy of surgical preparation solutions in shoulder surgery. J Bone Joint Surg Am. 2009;91(8):1949-1953.
32. Carroll K, Dowsey M, Choong P, Peel T. Risk factors for superficial wound complications in hip and knee arthroplasty. Clin Microbiol Infect. 2014;20(2):130-135.
33. Morrison TN, Chen AF, Taneja M, Kucukdurmaz F, Rothman RH, Parvizi J. Single vs repeat surgical skin preparations for reducing surgical site infection after total joint arthroplasty: a prospective, randomized, double-blinded study. J Arthroplasty. 2016;31(6):1289-1294.
34. Brown AR, Taylor GJ, Gregg PJ. Air contamination during skin preparation and draping in joint replacement surgery. J Bone Joint Surg Br. 1996;78(1):92-94.
35. Tanner J, Woodings D, Moncaster K. Preoperative hair removal to reduce surgical site infection. Cochrane Database Syst Rev. 2006;(3):CD004122.
36. Mishriki SF, Law DJ, Jeffery PJ. Factors affecting the incidence of postoperative wound infection. J Hosp Infect. 1990;16(3):223-230.
37. Harrop JS, Styliaras JC, Ooi YC, Radcliff KE, Vaccaro AR, Wu C. Contributing factors to surgical site infections. J Am Acad Orthop Surg. 2012;20(2):94-101.
38. Cruse PJ, Foord R. A five-year prospective study of 23,649 surgical wounds. Arch Surg. 1973;107(2):206-210.
39. Laine T, Aarnio P. Glove perforation in orthopaedic and trauma surgery. A comparison between single, double indicator gloving and double gloving with two regular gloves. J Bone Joint Surg Br. 2004;86(6):898-900.
40. Ersozlu S, Sahin O, Ozgur AF, Akkaya T, Tuncay C. Glove punctures in major and minor orthopaedic surgery with double gloving. Acta Orthop Belg. 2007;73(6):760-764.
41. Chan KY, Singh VA, Oun BH, To BH. The rate of glove perforations in orthopaedic procedures: single versus double gloving. A prospective study. Med J Malaysia. 2006;61(suppl B):3-7.
42. Carter AH, Casper DS, Parvizi J, Austin MS. A prospective analysis of glove perforation in primary and revision total hip and total knee arthroplasty. J Arthroplasty. 2012;27(7):1271-1275.
43. Charnley J. A clean-air operating enclosure. Br J Surg. 1964;51:202-205.
44. Whyte W, Hodgson R, Tinkler J. The importance of airborne bacterial contamination of wounds. J Hosp Infect. 1982;3(2):123-135.
45. Owers KL, James E, Bannister GC. Source of bacterial shedding in laminar flow theatres. J Hosp Infect. 2004;58(3):230-232.
46. Lidwell OM, Lowbury EJ, Whyte W, Blowers R, Stanley SJ, Lowe D. Effect of ultraclean air in operating rooms on deep sepsis in the joint after total hip or knee replacement: a randomised study. Br Med J (Clin Res Ed). 1982;285(6334):10-14.
47. Hooper GJ, Rothwell AG, Frampton C, Wyatt MC. Does the use of laminar flow and space suits reduce early deep infection after total hip and knee replacement? The ten-year results of the New Zealand Joint Registry. J Bone Joint Surg Br. 2011;93(1):85-90.
48. Miner AL, Losina E, Katz JN, Fossel AH, Platt R. Deep infection after total knee replacement: impact of laminar airflow systems and body exhaust suits in the modern operating room. Infect Control Hosp Epidemiol. 2007;28(2):222-226.
49. Der Tavitian J, Ong SM, Taub NA, Taylor GJ. Body-exhaust suit versus occlusive clothing. A randomised, prospective trial using air and wound bacterial counts. J Bone Joint Surg Br. 2003;85(4):490-494.
50. Blom A, Estela C, Bowker K, MacGowan A, Hardy JR. The passage of bacteria through surgical drapes. Ann R Coll Surg Engl. 2000;82(6):405-407.
51. Blom AW, Gozzard C, Heal J, Bowker K, Estela CM. Bacterial strike-through of re-usable surgical drapes: the effect of different wetting agents. J Hosp Infect. 2002;52(1):52-55.
52. Fairclough JA, Johnson D, Mackie I. The prevention of wound contamination by skin organisms by the pre-operative application of an iodophor impregnated plastic adhesive drape. J Int Med Res. 1986;14(2):105-109.
53. Webster J, Alghamdi AA. Use of plastic adhesive drapes during surgery for preventing surgical site infection. Cochrane Database Syst Rev. 2007;(4):CD006353.
54. Evans RP. Current concepts for clean air and total joint arthroplasty: laminar airflow and ultraviolet radiation: a systematic review. Clin Orthop Relat Res. 2011;469(4):945-953.
55. Lynch RJ, Englesbe MJ, Sturm L, et al. Measurement of foot traffic in the operating room: implications for infection control. Am J Med Qual. 2009;24(1):45-52.
56. Young RS, O’Regan DJ. Cardiac surgical theatre traffic: time for traffic calming measures? Interact Cardiovasc Thorac Surg. 2010;10(4):526-529.
57. Pryor F, Messmer PR. The effect of traffic patterns in the OR on surgical site infections. AORN J. 1998;68(4):649-660.
58. Bratzler DW, Houck PM; Surgical Infection Prevention Guidelines Writers Workgroup, American Academy of Orthopaedic Surgeons, American Association of Critical Care Nurses, et al. Antimicrobial prophylaxis for surgery: an advisory statement from the National Surgical Infection Prevention Project. Clin Infect Dis. 2004;38(12):1706-1715.
59. Rosenberger LH, Politano AD, Sawyer RG. The Surgical Care Improvement Project and prevention of post-operative infection, including surgical site infection. Surg Infect (Larchmt). 2011;12(3):163-168.
60. Gorenoi V, Schonermark MP, Hagen A. Prevention of infection after knee arthroplasty. GMS Health Technol Assess. 2010;6:Doc10.
61. AlBuhairan B, Hind D, Hutchinson A. Antibiotic prophylaxis for wound infections in total joint arthroplasty: a systematic review. J Bone Joint Surg Br. 2008;90(7):915-919.
62. Bratzler DW, Houck PM; Surgical Infection Prevention Guideline Writers Workgroup. Antimicrobial prophylaxis for surgery: an advisory statement from the National Surgical Infection Prevention Project. Am J Surg. 2005;189(4):395-404.
63. Quenon JL, Eveillard M, Vivien A, et al. Evaluation of current practices in surgical antimicrobial prophylaxis in primary total hip prosthesis—a multicentre survey in private and public French hospitals. J Hosp Infect. 2004;56(3):202-207.
64. Parvizi J, Saleh KJ, Ragland PS, Pour AE, Mont MA. Efficacy of antibiotic-impregnated cement in total hip replacement. Acta Orthop. 2008;79(3):335-341.
65. Namba RS, Chen Y, Paxton EW, Slipchenko T, Fithian DC. Outcomes of routine use of antibiotic-loaded cement in primary total knee arthroplasty. J Arthroplasty. 2009;24(6 suppl):44-47.
66. Zhou Y, Li L, Zhou Q, et al. Lack of efficacy of prophylactic application of antibiotic-loaded bone cement for prevention of infection in primary total knee arthroplasty: results of a meta-analysis. Surg Infect (Larchmt). 2015;16(2):183-187.
67. Leopold SS. Consensus statement from the International Consensus Meeting on Periprosthetic Joint Infection. Clin Orthop Relat Res. 2013;471(12):3731-3732.
68. Sollecito TP, Abt E, Lockhart PB, et al. The use of prophylactic antibiotics prior to dental procedures in patients with prosthetic joints: evidence-based clinical practice guideline for dental practitioners—a report of the American Dental Association Council on Scientific Affairs. J Am Dent Assoc. 2015;146(1):11-16.e18.
69. Watters W 3rd, Rethman MP, Hanson NB, et al. Prevention of orthopaedic implant infection in patients undergoing dental procedures. J Am Acad Orthop Surg. 2013;21(3):180-189.
70. Merchant VA; American Academy of Orthopaedic Surgeons, American Dental Association. The new AAOS/ADA clinical practice guidelines for management of patients with prosthetic joint replacements. J Mich Dent Assoc. 2013;95(2):16, 74.
71. Berbari EF, Osmon DR, Carr A, et al. Dental procedures as risk factors for prosthetic hip or knee infection: a hospital-based prospective case–control study. Clin Infect Dis. 2010;50(1):8-16.
72. Little JW, Jacobson JJ, Lockhart PB; American Academy of Oral Medicine. The dental treatment of patients with joint replacements: a position paper from the American Academy of Oral Medicine. J Am Dent Assoc. 2010;141(6):667-671.
73. Curry S, Phillips H. Joint arthroplasty, dental treatment, and antibiotics: a review. J Arthroplasty. 2002;17(1):111-113.
74. Jaberi FM, Parvizi J, Haytmanek CT, Joshi A, Purtill J. Procrastination of wound drainage and malnutrition affect the outcome of joint arthroplasty. Clin Orthop Relat Res. 2008;466(6):1368-1371.
75. Stone PW. Economic burden of healthcare-associated infections: an American perspective. Expert Rev Pharmacoecon Outcomes Res. 2009;9(5):417-422.
76. Kapadia BH, McElroy MJ, Issa K, Johnson AJ, Bozic KJ, Mont MA. The economic impact of periprosthetic infections following total knee arthroplasty at a specialized tertiary-care center. J Arthroplasty. 2014;29(5):929-932.
77. Slover J, Haas JP, Quirno M, Phillips MS, Bosco JA 3rd. Cost-effectiveness of a Staphylococcus aureus screening and decolonization program for high-risk orthopedic patients. J Arthroplasty. 2011;26(3):360-365.
78. Cummins JS, Tomek IM, Kantor SR, Furnes O, Engesaeter LB, Finlayson SR. Cost-effectiveness of antibiotic-impregnated bone cement used in primary total hip arthroplasty. J Bone Joint Surg Am. 2009;91(3):634-641.
79. Kapadia BH, Johnson AJ, Issa K, Mont MA. Economic evaluation of chlorhexidine cloths on healthcare costs due to surgical site infections following total knee arthroplasty. J Arthroplasty. 2013;28(7):1061-1065.
80. Malinzak RA, Ritter MA, Berend ME, Meding JB, Olberding EM, Davis KE. Morbidly obese, diabetic, younger, and unilateral joint arthroplasty patients have elevated total joint arthroplasty infection rates. J Arthroplasty. 2009;24(6 suppl):84-88.
81. Wagner ER, Kamath AF, Fruth KM, Harmsen WS, Berry DJ. Effect of body mass index on complications and reoperations after total hip arthroplasty. J Bone Joint Surg Am. 2016;98(3):169-179.
82 Broex EC, van Asselt AD, Bruggeman CA, van Tiel FH. Surgical site infections: how high are the costs? J Hosp Infect. 2009;72(3):193-201.
83. Anderson DJ, Kirkland KB, Kaye KS, et al. Underresourced hospital infection control and prevention programs: penny wise, pound foolish? Infect Control Hosp Epidemiol. 2007;28(7):767-773.
84. Centers for Medicare & Medicaid Services (CMS), HHS. Medicare program; comprehensive care for joint replacement payment model for acute care hospitals furnishing lower extremity joint replacement services. Final rule. Fed Regist. 2015;80(226):73273-73554.
Authors’ Disclosure Statement: Dr. Chughtai reports that he is a paid consultant for DJ Orthopaedics, Sage Products, and Stryker. Dr. Mont reports that he receives grants/fees from DJ Orthopaedics, Johnson & Johnson, Merz, Microport, National Institutes of Health, Ongoing Care Solutions, Orthosensor, Pacira Pharmaceuticals, Sage Products, Stryker, TissueGene, and US Medical Innovations; he is on the editorial/governing boards of The American Academy of Orthopaedic Surgeons, The American Journal of Orthopedics, Journal of Arthroplasty, Journal of Knee Surgery, Orthopedics, and Surgical Technology International. Dr. Delanois reports that he is a paid consultant and speaker for Corin and a Maryland Orthopaedic Association board/committee member, and he receives research support from OrthoFix Inc. and Stryker. The other authors report no actual or potential conflict of interest in relation to this article.
Authors’ Disclosure Statement: Dr. Chughtai reports that he is a paid consultant for DJ Orthopaedics, Sage Products, and Stryker. Dr. Mont reports that he receives grants/fees from DJ Orthopaedics, Johnson & Johnson, Merz, Microport, National Institutes of Health, Ongoing Care Solutions, Orthosensor, Pacira Pharmaceuticals, Sage Products, Stryker, TissueGene, and US Medical Innovations; he is on the editorial/governing boards of The American Academy of Orthopaedic Surgeons, The American Journal of Orthopedics, Journal of Arthroplasty, Journal of Knee Surgery, Orthopedics, and Surgical Technology International. Dr. Delanois reports that he is a paid consultant and speaker for Corin and a Maryland Orthopaedic Association board/committee member, and he receives research support from OrthoFix Inc. and Stryker. The other authors report no actual or potential conflict of interest in relation to this article.
Author and Disclosure Information
Authors’ Disclosure Statement: Dr. Chughtai reports that he is a paid consultant for DJ Orthopaedics, Sage Products, and Stryker. Dr. Mont reports that he receives grants/fees from DJ Orthopaedics, Johnson & Johnson, Merz, Microport, National Institutes of Health, Ongoing Care Solutions, Orthosensor, Pacira Pharmaceuticals, Sage Products, Stryker, TissueGene, and US Medical Innovations; he is on the editorial/governing boards of The American Academy of Orthopaedic Surgeons, The American Journal of Orthopedics, Journal of Arthroplasty, Journal of Knee Surgery, Orthopedics, and Surgical Technology International. Dr. Delanois reports that he is a paid consultant and speaker for Corin and a Maryland Orthopaedic Association board/committee member, and he receives research support from OrthoFix Inc. and Stryker. The other authors report no actual or potential conflict of interest in relation to this article.
SSIs after TJA pose a substantial burden on patients, surgeons, and the healthcare system.
While different forms of preoperative skin preparation have shown varying outcomes after TJA, the importance of preoperative patient optimization (nutritional status, immune function, etc) cannot be overstated.
Intraoperative infection prevention measures include cutaneous preparation, gloving, body exhaust suits, surgical drapes, OR staff traffic and ventilation flow, and antibiotic-loaded cement.
Antibiotic prophylaxis for dental procedures in TJA patients continues to remain a controversial issue with conflicting recommendations.
SSIs have considerable financial costs and require increased resource utilization. Given the significant economic burden associated with TJA infections, it is imperative for orthopedists to establish practical and cost-effective strategies to prevent these devastating complications.
Surgical-site infection (SSI), a potentially devastating complication of lower extremity total joint arthroplasty (TJA), is estimated to occur in 1% to 2.5% of cases annually.1 Infection after TJA places a significant burden on patients, surgeons, and the healthcare system. Revision procedures that address infection after total hip arthroplasty (THA) are associated with more hospitalizations, more operations, longer hospital stay, and higher outpatient costs in comparison with primary THAs and revision surgeries for aseptic loosening.2 If left untreated, a SSI can go deeper into the joint and develop into a periprosthetic infection, which can be disastrous and costly. A periprosthetic joint infection study that used 2001 to 2009 Nationwide Inpatient Sample (NIS) data found that the cost of revision procedures increased to $560 million from $320 million, and was projected to reach $1.62 billion by 2020.3 Furthermore, society incurs indirect costs as a result of patient disability and loss of wages and productivity.2 Therefore, the issue of infection after TJA is even more crucial in our cost-conscious healthcare environment.
Patient optimization, advances in surgical technique, sterile protocol, and operative procedures have been effective in reducing bacterial counts at incision sites and minimizing SSIs. As a result, infection rates have leveled off after rising for a decade.4 Although infection prevention modalities have their differences, routine use is fundamental and recommended by the Hospital Infection Control Practices Advisory Committee.5 Furthermore, both the US Centers for Disease Control and Prevention (CDC) and its Healthcare Infection Control Practices Advisory Committee6,7 recently updated their SSI prevention guidelines by incorporating evidence-based methodology, an element missing from earlier recommendations.
The etiologies of postoperative SSIs have been discussed ad nauseam, but there are few reports summarizing the literature on infection prevention modalities. In this review, we identify and examine SSI prevention strategies as they relate to lower extremity TJA. Specifically, we discuss the literature on the preoperative, intraoperative, and postoperative actions that can be taken to reduce the incidence of SSIs after TJA. We also highlight the economic implications of SSIs that occur after TJA.
Methods
For this review, we performed a literature search with PubMed, EBSCOhost, and Scopus. We looked for reports published between the inception of each database and July 2016. Combinations of various search terms were used: surgical site, infection, total joint arthroplasty, knee, hip, preoperative, intraoperative, perioperative, postoperative, preparation, nutrition, ventilation, antibiotic, body exhaust suit, gloves, drain, costs, economic, and payment.
Our search identified 195 abstracts. Drs. Mistry and Chughtai reviewed these to determine which articles were relevant. For any uncertainties, consensus was reached with the help of Dr. Delanois. Of the 195 articles, 103 were potentially relevant, and 54 of the 103 were excluded for being not relevant to preventing SSIs after TJA or for being written in a language other than English. The references in the remaining articles were assessed, and those with potentially relevant titles were selected for abstract review. This step provided another 35 articles. After all exclusions, 48 articles remained. We discuss these in the context of preoperative, intraoperative, and postoperative measures and economic impact.
Results
Preoperative Measures
Skin Preparation. Preoperative skin preparation methods include standard washing and rinsing, antiseptic soaps, and iodine-based or chlorhexidine gluconate-based antiseptic showers or skin cloths. Iodine-based antiseptics are effective against a wide range of Gram-positive and Gram-negative bacteria, fungi, and viruses. These agents penetrate the cell wall, oxidize the microbial contents, and replace those contents with free iodine molecules.8 Iodophors are free iodine molecules associated with a polymer (eg, polyvinylpyrrolidone); the iodophor povidone-iodine is bactericidal.9 Chlorhexidine gluconate-based solutions are effective against many types of yeast, Gram-positive and Gram-negative bacteria, and a wide variety of viruses.9 Both solutions are useful. Patients with an allergy to iodine can use chlorhexidine. Table 1 summarizes the studies on preoperative measures for preventing SSIs.
Table 1A.
Table 1B.
There is no shortage of evidence of the efficacy of these antiseptics in minimizing the incidence of SSIs. Hayek and colleagues10 prospectively analyzed use of different preoperative skin preparation methods in 2015 patients. Six weeks after surgery, the infection rate was significantly lower with use of chlorhexidine than with use of an unmedicated bar of soap or placebo cloth (9% vs 11.7% and 12.8%, respectively; P < .05). In a study of 100 patients, Murray and colleagues11 found the overall bacterial culture rate was significantly lower for those who used a 2% chlorhexidine gluconate cloth before shoulder surgery than for those who took a standard shower with soap (66% vs 94%; P = .0008). Darouiche and colleagues12 found the overall SSI rate was significantly lower for 409 surgical patients prepared with chlorhexidine-alcohol than for 440 prepared with povidone-iodine (9.5% vs 16.1%; P = .004; relative risk [RR], 0.59; 95% confidence interval [CI], 0.41-0.85).
Chlorhexidine gluconate-impregnated cloths have also had promising results, which may be attributed to general ease of use and potentially improved patient adherence. Zywiel and colleagues13 reported no SSIs in 136 patients who used these cloths at home before total knee arthroplasty (TKA) and 21 SSIs (3.0%) in 711 patients who did not use the cloths. In a study of 2545 THA patients, Kapadia and colleagues14 noted a significantly lower incidence of SSIs with at-home preoperative use of chlorhexidine cloths than with only in-hospital perioperative skin preparation (0.5% vs 1.7%; P = .04). In 2293 TKAs, Johnson and colleagues15 similarly found a lower incidence of SSIs with at-home preoperative use of chlorhexidine cloths (0.6% vs 2.2%; P = .02). In another prospective, randomized trial, Kapadia and colleagues16 compared 275 patients who used chlorhexidine cloths the night before and the morning of lower extremity TJA surgery with 279 patients who underwent standard-of-care preparation (preadmission bathing with antibacterial soap and water). The chlorhexidine cohort had a lower overall incidence of infection (0.4% vs 2.9%; P = .049), and the standard-of-care cohort had a stronger association with infection (odds ratio [OR], 8.15; 95% CI, 1.01-65.6).
Patient Optimization. Poor nutritional status may compromise immune function, potentially resulting in delayed healing, increased risk of infection, and, ultimately, negative postoperative outcomes. Malnutrition can be diagnosed on the basis of a prealbumin level of <15 mg/dL (normal, 15-30 mg/dL), a serum albumin level of <3.4 g/dL (normal, 3.4-5.4 g/dL), or a total lymphocyte count under 1200 cells/μL (normal, 3900-10,000 cells/μL).17-19 Greene and colleagues18 found that patients with preoperative malnutrition had up to a 7-fold higher rate of infection after TJA. In a study of 135 THAs and TKAs, Alfargieny and colleagues20 found preoperative serum albumin was the only nutritional biomarker predictive of SSI (P = .011). Furthermore, patients who take immunomodulating medications (eg, for inflammatory arthropathies) should temporarily discontinue them before surgery in order to lower their risk of infection.21
Smoking is well established as a major risk factor for poor outcomes after surgery. It is postulated that the vasoconstrictive effects of nicotine and the hypoxic effects of carbon monoxide contribute to poor wound healing.22 In a meta-analysis of 4 studies, Sørensen23 found smokers were at increased risk for wound complications (OR, 2.27; 95% CI, 1.82-2.84), delayed wound healing and dehiscence (OR, 2.07; 95% CI, 1.53-2.81), and infection (OR, 1.79; 95% CI, 1.57-2.04). Moreover, smoking cessation decreased the incidence of SSIs (OR, 0.43; 95% CI, 0.21-0.85). A meta- analysis by Wong and colleagues24 revealed an inflection point for improved outcomes in patients who abstained from smoking for at least 4 weeks before surgery. Risk of infection was lower for these patients than for current smokers (OR, 0.69; 95% CI, 0.56-0.84).
Other comorbidities contribute to SSIs as well. In their analysis of American College of Surgeons National Surgical Quality Improvement Program registry data on 25,235 patients who underwent primary and revision lower extremity TJA, Pugely and colleagues25 found that, in the primary TJA cohort, body mass index (BMI) of >40 kg/m2 (OR, 1.9; 95% CI, 1.3-2.9), electrolyte disturbance (OR, 2.4; 95% CI, 1.0-6.0), and hypertension diagnosis (OR, 1.5; 95% CI, 1.1-2.0) increased the risk of SSI within 30 days. Furthermore, diabetes mellitus delays collagen synthesis, impairs lymphocyte function, and impairs wound healing, which may lead to poor recovery and higher risk of infection.26 In a study of 167 TKAs performed in 115 patients with type 2 diabetes mellitus, Han and Kang26 found that wound complications were 6 times more likely in those with hemoglobin A1c (HbA1c) levels higher than 8% than in those with lower HbA1c levels (OR, 6.07; 95% CI, 1.12-33.0). In a similar study of 462 patients with diabetes, Hwang and colleagues27 found a higher likelihood of superficial SSIs in patients with HbA1c levels >8% (OR, 6.1; 95% CI, 1.6-23.4; P = .008). This association was also found in patients with a fasting blood glucose level of >200 mg/dL (OR, 9.2; 95% CI, 2.2-38.2; P = .038).
Methicillin-resistant Staphylococcus aureus (MRSA) is thought to account for 10% to 25% of all periprosthetic infections in the United States.28 Nasal colonization by this pathogen increases the risk for SSIs; however, decolonization protocols have proved useful in decreasing the rates of colonization. Moroski and colleagues29 assessed the efficacy of a preoperative 5-day course of intranasal mupirocin in 289 primary or revision TJA patients. Before surgery, 12 patients had positive MRSA cultures, and 44 had positive methicillin-sensitive S aureus (MSSA) cultures. On day of surgery, a significant reduction in MRSA (P = .0073) and MSSA (P = .0341) colonization was noted. Rao and colleagues30 found that the infection rate decreased from 2.7% to 1.2% in 2284 TJA patients treated with a decolonization protocol (P = .009).
Intraoperative Measures
Cutaneous Preparation. The solutions used in perioperative skin preparation are similar to those used preoperatively: povidone-iodine, alcohol, and chlorhexidine. The efficacy of these preparations varies. Table 2 summarizes the studies on intraoperative measures for preventing SSIs.
Table 2A.
Table 2B.In a prospective study, Saltzman and colleagues31 randomly assigned 150 shoulder arthroplasty patients to one of 3 preparations: 0.75% iodine scrub with 1% iodine paint (Povidone-Iodine; Tyco Healthcare Group), 0.7% iodophor with 74% iodine povacrylex (DuraPrep; 3M Health Care), or chlorhexidine gluconate with 70% isopropyl alcohol (ChloraPrep; Enturia). All patients had their skin area prepared and swabbed for culture before incision. Although no one in any group developed a SSI, patients in the chlorhexidine group had the lowest overall incidence of positive skin cultures. That incidence (7%) and the incidence of patients in the iodophor group (19%) were significantly lower than that of patients in the iodine group (31%) (P < .001 for both). Conversely, another study32 found a higher likelihood of SSI with chlorhexidine than with povidone-iodine (OR, 4.75; 95% CI, 1.42-15.92; P = .012). This finding is controversial, but the body of evidence led the CDC to recommend use of an alcohol-based solution for preoperative skin preparation.6
The literature also highlights the importance of technique in incision-site preparation. In a prospective study, Morrison and colleagues33 randomly assigned 600 primary TJA patients to either (1) use of alcohol and povidone-iodine before draping, with additional preparation with iodine povacrylex (DuraPrep) and isopropyl alcohol before application of the final drape (300-patient intervention group) or (2) only use of alcohol and povidone-iodine before draping (300-patient control group). At the final follow-up, the incidence of SSI was significantly lower in the intervention group than in the control group (1.8% vs 6.5%; P = .015). In another study that assessed perioperative skin preparation methods, Brown and colleagues34 found that airborne bacteria levels in operating rooms were >4 times higher with patients whose legs were prepared by a scrubbed, gowned leg-holder than with patients whose legs were prepared by an unscrubbed, ungowned leg-holder (P = .0001).
Hair Removal. Although removing hair from surgical sites is common practice, the literature advocating it varies. A large comprehensive review35 revealed no increased risk of SSI with removing vs not removing hair (RR, 1.65; 95% CI, 0.85-3.19). On the other hand, some hair removal methods may affect the incidence of infection. For example, use of electric hair clippers is presumed to reduce the risk of SSIs, whereas traditional razors may compromise the epidermal barriers and create a pathway for bacterial colonization.5,36,37 In the aforementioned review,35 SSIs were more than twice as likely to occur with hair removed by shaving than with hair removed by electric clippers (RR, 2.02; 95% CI, 1.21-3.36). Cruse and Foord38 found a higher rate of SSIs with hair removed by shaving than with hair removed by clipping (2.3% vs 1.7%). Most surgeons agree that, if given the choice, they would remove hair with electric clippers rather than razors.
Gloves. Almost all orthopedists double their gloves for TJA cases. Over several studies, the incidence of glove perforation during orthopedic procedures has ranged from 3.6% to 26%,39-41 depending on the operating room personnel and glove layering studied. Orthopedists must know this startling finding, as surgical glove perforation is associated with an increase in the rate of SSIs, from 1.7% to 5.7%.38 Carter and colleagues42 found the highest risk of glove perforation occurs when double-gloved attending surgeons, adult reconstruction fellows, and registered nurses initially assist during primary and revision TJA. In their study, outer and inner glove layers were perforated 2.5% of the time. All outer-layer perforations were noticed, but inner-layer perforations went unnoticed 81% of the time, which poses a potential hazard for both patients and healthcare personnel. In addition, there was a significant increase in the incidence of glove perforations for attending surgeons during revision TJA vs primary TJA (8.9% vs 3.7%; P = .04). This finding may be expected given the complexity of revision procedures, the presence of sharp bony and metal edges, and the longer operative times. Giving more attention to glove perforations during arthroplasties may mitigate the risk of SSI. As soon as a perforation is noticed, the glove should be removed and replaced.
Body Exhaust Suits. Early TJAs had infection rates approaching 10%.43 Bacterial-laden particles shed from surgical staff were postulated to be the cause,44,45 and this idea prompted the development of new technology, such as body exhaust suits, which have demonstrated up to a 20-fold reduction in airborne bacterial contamination and decreased incidence of deep infection, from 1% to 0.1%, as compared with conventional surgical attire.46 However, the efficacy of these suits was recently challenged. Hooper and colleagues47 assessed >88,000 TJA cases in the New Zealand Joint Registry and found a significant increase in early revision THA for deep infection with vs without use of body exhaust suits (0.186% vs 0.064%; P < .0001). The incidence of revision TKAs for deep infections with use of these suits was similar (0.243% vs 0.098%; P < .001). Many of the surgeons surveyed indicated their peripheral vision was limited by the suits, which may contribute to sterile field contamination. By contrast, Miner and colleagues48 were unable to determine an increased risk of SSI with use of body exhaust suits (RR, 0.75; 95% CI, 0.34-1.62), though there was a trend toward more infections without suits. Moreover, these suits are effective in reducing mean air bacterial counts (P = .014), but it is not known if this method correlates with mean wound bacterial counts (r = –.011) and therefore increases the risk of SSI.49
Surgical Drapes. Surgical draping, including cloths, iodine-impregnated materials, and woven or unwoven materials, is the standard of care worldwide. The particular draping technique usually varies by surgeon. Plastic drapes are better barriers than cloth drapes, as found in a study by Blom and colleagues50: Bacterial growth rates were almost 10 times higher with use of wet woven cloth drapes than with plastic surgical drapes. These findings were supported in another, similar study by Blom and colleagues51: Wetting drapes with blood or normal saline enhanced bacterial penetration. In addition, wetting drapes with chlorhexidine or iodine reduced but did not eliminate bacterial penetration. Fairclough and colleagues52 emphasized that iodine-impregnated drapes reduced surgical-site bacterial contamination from 15% to 1.6%. However, a Cochrane review53 found these drapes had no effect on the SSI rate (RR, 1.03; 95% CI, 0.06-1.66; P = .89), though the risk of infection was slightly higher with adhesive draping than with no drape (RR, 1.23; 95% CI, 1.02-1.48; P = .03).
Ventilation Flow. Laminar-airflow systems are widely used to prevent SSIs after TJA. Horizontal-flow and vertical-flow ventilation provides and maintains ultra-clean air in the operating room. Evans54 found the bacterial counts in the air and the wound were lower with laminar airflow than without this airflow. The amount of airborne bacterial colony-forming units and dust large enough to carry bacteria was reduced to 1 or 2 particles more than 2 μm/m3 with use of a typical laminar- airflow system. In comparing 3922 TKA patients in laminar-airflow operating rooms with 4133 patients in conventional rooms, Lidwell and colleagues46 found a significantly lower incidence of SSIs in patients in laminar-airflow operating rooms (0.6% vs 2.3%; P < .001).
Conversely, Miner and colleagues48 did not find a lower risk of SSI with laminar-airflow systems (RR, 1.57; 95% CI, 0.75-3.31). In addition, in their analysis of >88,000 cases from the New Zealand Joint Registry, Hooper and colleagues47 found that the incidence of early infections was higher with laminar-airflow systems than with standard airflow systems for both TKA (0.193% vs 0.100%; P = .019) and THA (0.148% vs 0.061%; P < .001). They postulated that vertically oriented airflow may have transmitted contaminated particles into the surgical sites. Additional evidence may be needed to resolve these conflicting findings and determine whether clean-air practices provide significant clinical benefit in the operating room.
Staff Traffic Volume. When staff enters or exits the operating room or makes extra movements during a procedure, airflow near the wound is disturbed and no longer able to remove sufficient airborne pathogens from the sterile field. The laminar- airflow pattern may be disrupted each time the operating room doors open and close, potentially allowing airborne pathogens to be introduced near the patient. Lynch and colleagues55 found the operating room door opened almost 50 times per hour, and it took about 20 seconds to close each time. As a result, the door may remain open for up to 20 minutes per case, causing substantial airflow disruption and potentially ineffective removal of airborne bacterial particles. Similarly, Young and O’Regan56 found the operating room door opened about 19 times per hour and took 20 seconds to close each time. The theater door was open an estimated 10.7% of each hour of sterile procedure. Presence of more staff also increases airborne bacterial counts. Pryor and Messmer57 evaluated a cohort of 2864 patients to determine the effect of number of personnel in the operating theater on the incidence of SSIs. Infection rates were 6.27% with >17 different people entering the room and 1.52% with <9 different people entering the room. Restricting the number of people in the room may be one of the easiest and most efficient ways to prevent SSI.
Systemic Antibiotic Prophylaxis. Perioperative antibiotic use is vital in minimizing the risk of infection after TJA. The Surgical Care Improvement Project recommended beginning the first antimicrobial dose either within 60 minutes before surgical incision (for cephalosporin) or within 2 hours before incision (for vancomycin) and discontinuing the prophylactic antimicrobial agents within 24 hours after surgery ends.58,59 However, Gorenoi and colleagues60 were unable to recommend a way to select particular antibiotics, as they found no difference in the effectiveness of various antibiotic agents used in TKA. A systematic review by AlBuhairan and colleagues61 revealed that antibiotic prophylaxis (vs no prophylaxis) reduced the absolute risk of a SSI by 8% and the relative risk by 81% (P < 0.0001). These findings are supported by evidence of the efficacy of perioperative antibiotics in reducing the incidence of SSI.62,63 Antibiotic regimens should be based on susceptibility and availability, depending on hospital prevalence of infections. Even more, patients should receive prophylaxis in a timely manner. Finally, bacteriostatic antibiotics (vancomycin) should not be used on their own for preoperative prophylaxis.
Antibiotic Cement. Antibiotic-loaded bone cement (ALBC), which locally releases antimicrobials in high concentration, is often used in revision joint arthroplasty, but use in primary joint arthroplasty remains controversial. In a study of THA patients, Parvizi and colleagues64 found infection rates of 1.2% with 2.3% with and without use of ALBC, respectively. Other studies have had opposing results. Namba and colleagues65 evaluated 22,889 primary TKAs, 2030 (8.9%) of which used ALBC. The incidence of deep infection was significantly higher with ALBC than with regular bone cement (1.4% vs 0.7%; P = .002). In addition, a meta- analysis of >6500 primary TKA patients, by Zhou and colleagues,66 revealed no significant difference in the incidence of deep SSIs with use of ALBC vs regular cement (1.32% vs 1.89%; RR, 0.75; 95% CI, 0.43-1.33; P = .33). More evidence is needed to determine the efficacy of ALBC in primary TJA. International Consensus Meeting on Periprosthetic Joint Infection participants recommended use of ALBC in high-risk patients, including patients who are obese or immunosuppressed or have diabetes or a prior history of infection.67
Postoperative Measures
Antibiotic Prophylaxis. The American Academy of Orthopaedic Surgeons (AAOS) and the American Dental Association (ADA) have suggestions for antibiotic prophylaxis for patients at increased risk for infection. As of 2015, the ADA no longer recommends antibiotic prophylaxis for patients with prosthetic joint implants,68 whereas the AAOS considers all patients with TJA to be at risk.69
Table 3.For TJA patients, the AAOS recommends administering antibiotic prophylaxis at least 1 hour before a dental procedure and discontinuing it within 24 hours after the procedure ends.69 Single preoperative doses are acceptable for outpatient procedures.70Table 3 summarizes the studies that reported on postoperative measures for preventing SSI.
Although recommendations exist, the actual risk of infection resulting from dental procedures and the role of antibiotic prophylaxis are not well defined. Berbari and colleagues71 found that antibiotic prophylaxis in high- or low-risk dental procedures did not decrease the risk of subsequent THA infection (OR, 0.9; 95% CI, 0.5-1.6) or TKA infection (OR, 1.2; 95% CI, 0.7-2.2). Moreover, the risk of infection was no higher for patients who had a prosthetic hip or knee and underwent a high- or low-risk dental procedure without antibiotic prophylaxis (OR, 0.8; 95% CI, 0.4-1.6) than for similar patients who did not undergo a dental procedure (OR, 0.6; 95% CI, 0.4-1.1). Some studies highlight the low level of evidence supporting antibiotic prophylaxis during dental procedures.72,73 However, there is no evidence of adverse effects of antibiotic prophylaxis. Given the potential high risk of infection after such procedures, a more robust body of evidence is needed to reach consensus.
Evacuation Drain Management. Prolonged use of surgical evacuation drains may be a risk factor for SSI. Therefore, early drain removal is paramount. Higher infection rates with prolonged drain use have been found in patients with persistent wound drainage, including malnourished, obese, and over-anticoagulated patients. Patients with wounds persistently draining for >1 week should undergo superficial wound irrigation and débridement. Jaberi and colleagues74 assessed 10,325 TJA patients and found that the majority of persistent drainage ceased within 1 week with use of less invasive measures, including oral antibiotics and local wound care. Furthermore, only 28% of patients with persistent drainage underwent surgical débridement. It is unclear if this practice alone is appropriate. Infection should always be suspected and treated aggressively, and cultures should be obtained from synovial fluid before antibiotics are started, unless there is an obvious superficial infection that does not require further work-up.67
Economic Impact
SSIs remain a significant healthcare issue, and the social and financial costs are staggering. Without appropriate measures in place, these complications will place a larger burden on the healthcare system primarily as a result of longer hospital stays, multiple procedures, and increased resource utilization.75 Given the risk of progression to prosthetic joint infection, early preventive interventions must be explored.
Table 4.Several studies have addressed the economic implications of SSIs after TJA as well as the impact of preventive interventions (Table 4). Using the NIS database, Kurtz and colleagues4 found that not only were hospital stays significantly longer for infected (vs noninfected) knee arthroplasties (7.6 vs 3.9 days; P < .0001), but hospital charges were 1.52 times higher (P < .0001), and results were similar for infected (vs noninfected) hips (9.7 vs 4.3 days; 1.76 times higher charges; P < .0001 for both). Kapadia and colleagues76 matched 21 TKA patients with periprosthetic infections with 21 noninfected TKA patients at a single institution and found the infected patients had more readmissions (3.6 vs 0.1; P < .0001), longer hospitalizations (5.3 vs 3.0 days; P = .0002), more days in the hospital within 1 year of arthroplasty (23.7 vs 3.4 days; P < .0001), and more clinic visits (6.5 vs 1.3; P < .0001). Furthermore, the infected patients had a significantly higher mean annual cost of treatment ($116,383 vs $28,249; P < .0001). Performing a Markov analysis, Slover and colleagues77 found that the decreased incidence of infection and the potential cost savings associated with preoperative S aureus screening and a decolonization protocol were able to offset the costs acquired by the screening and decolonization protocol. Similarly, Cummins and colleagues78 evaluated the effects of ALBC on overall healthcare costs; if revision surgery was the primary outcome of all infections, use of ALBC (vs cement without antibiotics) resulted in a cost-effectiveness ratio of $37,355 per quality-adjusted life year. Kapadia and colleagues79 evaluated the economic impact of adding 2% chlorhexidine gluconate-impregnated cloths to an existing preoperative skin preparation protocol for TKA. One percent of non-chlorhexidine patients and 0.6% of chlorhexidine patients developed an infection. The reduction in incidence of infection amounted to projected net savings of almost $2.1 million per 1000 TKA patients. Nationally, annual healthcare savings were expected to range from $0.78 billion to $3.18 billion with implementation of this protocol.
Improved patient selection may be an important factor in reducing SSIs. In an analysis of 8494 joint arthroplasties, Malinzak and colleagues80 noted that patients with a BMI of >50 kg/m2 had an increased OR of infection of 21.3 compared to those with BMI <50 kg/m2. Wagner and colleagues81 analyzed 21,361 THAs and found that, for every BMI unit over 25 kg/m2, there was an 8% increased risk of joint infection (P < .001). Although it is unknown if there is an association between reduction in preoperative BMI and reduction in postoperative complication risk, it may still be worthwhile and cost-effective to modify this and similar risk factors before elective procedures.
Market forces are becoming a larger consideration in healthcare and are being driven by provider competition.82 Treatment outcomes, quality of care, and healthcare prices have gained attention as a means of estimating potential costs.83 In 2011, the Centers for Medicare & Medicaid Services (CMS) advanced the Bundled Payments for Care Improvement (BPCI) initiative, which aimed to provide better coordinated care of higher quality and lower cost.84 This led to development of the Comprehensive Care for Joint Replacement (CJR) program, which gives beneficiaries flexibility in choosing services and ensures that providers adhere to required standards. During its 5-year test period beginning in 2016, the CJR program is projected to save CMS $153 million.84 Under this program, the institution where TJA is performed is responsible for all the costs of related care from time of surgery through 90 days after hospital discharge—which is known as an “episode of care.” If the cost incurred during an episode exceeds an established target cost (as determined by CMS), the hospital must repay Medicare the difference. Conversely, if the cost of an episode is less than the established target cost, the hospital is rewarded with the difference. Bundling payments for a single episode of care in this manner is thought to incentivize providers and hospitals to give patients more comprehensive and coordinated care. Given the substantial economic burden associated with joint arthroplasty infections, it is imperative for orthopedists to establish practical and cost-effective strategies that can prevent these disastrous complications.
Conclusion
SSIs are a devastating burden to patients, surgeons, and other healthcare providers. In recent years, new discoveries and innovations have helped mitigate the incidence of these complications of THA and TKA. However, the incidence of SSIs may rise with the increasing use of TJAs and with the development of new drug-resistant pathogens. In addition, the increasing number of TJAs performed on overweight and high-risk patients means the costs of postoperative infections will be substantial. With new reimbursement models in place, hospitals and providers are being held more accountable for the care they deliver during and after TJA. Consequently, more emphasis should be placed on techniques that are proved to minimize the incidence of SSIs.
Take-Home Points
SSIs after TJA pose a substantial burden on patients, surgeons, and the healthcare system.
While different forms of preoperative skin preparation have shown varying outcomes after TJA, the importance of preoperative patient optimization (nutritional status, immune function, etc) cannot be overstated.
Intraoperative infection prevention measures include cutaneous preparation, gloving, body exhaust suits, surgical drapes, OR staff traffic and ventilation flow, and antibiotic-loaded cement.
Antibiotic prophylaxis for dental procedures in TJA patients continues to remain a controversial issue with conflicting recommendations.
SSIs have considerable financial costs and require increased resource utilization. Given the significant economic burden associated with TJA infections, it is imperative for orthopedists to establish practical and cost-effective strategies to prevent these devastating complications.
Surgical-site infection (SSI), a potentially devastating complication of lower extremity total joint arthroplasty (TJA), is estimated to occur in 1% to 2.5% of cases annually.1 Infection after TJA places a significant burden on patients, surgeons, and the healthcare system. Revision procedures that address infection after total hip arthroplasty (THA) are associated with more hospitalizations, more operations, longer hospital stay, and higher outpatient costs in comparison with primary THAs and revision surgeries for aseptic loosening.2 If left untreated, a SSI can go deeper into the joint and develop into a periprosthetic infection, which can be disastrous and costly. A periprosthetic joint infection study that used 2001 to 2009 Nationwide Inpatient Sample (NIS) data found that the cost of revision procedures increased to $560 million from $320 million, and was projected to reach $1.62 billion by 2020.3 Furthermore, society incurs indirect costs as a result of patient disability and loss of wages and productivity.2 Therefore, the issue of infection after TJA is even more crucial in our cost-conscious healthcare environment.
Patient optimization, advances in surgical technique, sterile protocol, and operative procedures have been effective in reducing bacterial counts at incision sites and minimizing SSIs. As a result, infection rates have leveled off after rising for a decade.4 Although infection prevention modalities have their differences, routine use is fundamental and recommended by the Hospital Infection Control Practices Advisory Committee.5 Furthermore, both the US Centers for Disease Control and Prevention (CDC) and its Healthcare Infection Control Practices Advisory Committee6,7 recently updated their SSI prevention guidelines by incorporating evidence-based methodology, an element missing from earlier recommendations.
The etiologies of postoperative SSIs have been discussed ad nauseam, but there are few reports summarizing the literature on infection prevention modalities. In this review, we identify and examine SSI prevention strategies as they relate to lower extremity TJA. Specifically, we discuss the literature on the preoperative, intraoperative, and postoperative actions that can be taken to reduce the incidence of SSIs after TJA. We also highlight the economic implications of SSIs that occur after TJA.
Methods
For this review, we performed a literature search with PubMed, EBSCOhost, and Scopus. We looked for reports published between the inception of each database and July 2016. Combinations of various search terms were used: surgical site, infection, total joint arthroplasty, knee, hip, preoperative, intraoperative, perioperative, postoperative, preparation, nutrition, ventilation, antibiotic, body exhaust suit, gloves, drain, costs, economic, and payment.
Our search identified 195 abstracts. Drs. Mistry and Chughtai reviewed these to determine which articles were relevant. For any uncertainties, consensus was reached with the help of Dr. Delanois. Of the 195 articles, 103 were potentially relevant, and 54 of the 103 were excluded for being not relevant to preventing SSIs after TJA or for being written in a language other than English. The references in the remaining articles were assessed, and those with potentially relevant titles were selected for abstract review. This step provided another 35 articles. After all exclusions, 48 articles remained. We discuss these in the context of preoperative, intraoperative, and postoperative measures and economic impact.
Results
Preoperative Measures
Skin Preparation. Preoperative skin preparation methods include standard washing and rinsing, antiseptic soaps, and iodine-based or chlorhexidine gluconate-based antiseptic showers or skin cloths. Iodine-based antiseptics are effective against a wide range of Gram-positive and Gram-negative bacteria, fungi, and viruses. These agents penetrate the cell wall, oxidize the microbial contents, and replace those contents with free iodine molecules.8 Iodophors are free iodine molecules associated with a polymer (eg, polyvinylpyrrolidone); the iodophor povidone-iodine is bactericidal.9 Chlorhexidine gluconate-based solutions are effective against many types of yeast, Gram-positive and Gram-negative bacteria, and a wide variety of viruses.9 Both solutions are useful. Patients with an allergy to iodine can use chlorhexidine. Table 1 summarizes the studies on preoperative measures for preventing SSIs.
Table 1A.
Table 1B.
There is no shortage of evidence of the efficacy of these antiseptics in minimizing the incidence of SSIs. Hayek and colleagues10 prospectively analyzed use of different preoperative skin preparation methods in 2015 patients. Six weeks after surgery, the infection rate was significantly lower with use of chlorhexidine than with use of an unmedicated bar of soap or placebo cloth (9% vs 11.7% and 12.8%, respectively; P < .05). In a study of 100 patients, Murray and colleagues11 found the overall bacterial culture rate was significantly lower for those who used a 2% chlorhexidine gluconate cloth before shoulder surgery than for those who took a standard shower with soap (66% vs 94%; P = .0008). Darouiche and colleagues12 found the overall SSI rate was significantly lower for 409 surgical patients prepared with chlorhexidine-alcohol than for 440 prepared with povidone-iodine (9.5% vs 16.1%; P = .004; relative risk [RR], 0.59; 95% confidence interval [CI], 0.41-0.85).
Chlorhexidine gluconate-impregnated cloths have also had promising results, which may be attributed to general ease of use and potentially improved patient adherence. Zywiel and colleagues13 reported no SSIs in 136 patients who used these cloths at home before total knee arthroplasty (TKA) and 21 SSIs (3.0%) in 711 patients who did not use the cloths. In a study of 2545 THA patients, Kapadia and colleagues14 noted a significantly lower incidence of SSIs with at-home preoperative use of chlorhexidine cloths than with only in-hospital perioperative skin preparation (0.5% vs 1.7%; P = .04). In 2293 TKAs, Johnson and colleagues15 similarly found a lower incidence of SSIs with at-home preoperative use of chlorhexidine cloths (0.6% vs 2.2%; P = .02). In another prospective, randomized trial, Kapadia and colleagues16 compared 275 patients who used chlorhexidine cloths the night before and the morning of lower extremity TJA surgery with 279 patients who underwent standard-of-care preparation (preadmission bathing with antibacterial soap and water). The chlorhexidine cohort had a lower overall incidence of infection (0.4% vs 2.9%; P = .049), and the standard-of-care cohort had a stronger association with infection (odds ratio [OR], 8.15; 95% CI, 1.01-65.6).
Patient Optimization. Poor nutritional status may compromise immune function, potentially resulting in delayed healing, increased risk of infection, and, ultimately, negative postoperative outcomes. Malnutrition can be diagnosed on the basis of a prealbumin level of <15 mg/dL (normal, 15-30 mg/dL), a serum albumin level of <3.4 g/dL (normal, 3.4-5.4 g/dL), or a total lymphocyte count under 1200 cells/μL (normal, 3900-10,000 cells/μL).17-19 Greene and colleagues18 found that patients with preoperative malnutrition had up to a 7-fold higher rate of infection after TJA. In a study of 135 THAs and TKAs, Alfargieny and colleagues20 found preoperative serum albumin was the only nutritional biomarker predictive of SSI (P = .011). Furthermore, patients who take immunomodulating medications (eg, for inflammatory arthropathies) should temporarily discontinue them before surgery in order to lower their risk of infection.21
Smoking is well established as a major risk factor for poor outcomes after surgery. It is postulated that the vasoconstrictive effects of nicotine and the hypoxic effects of carbon monoxide contribute to poor wound healing.22 In a meta-analysis of 4 studies, Sørensen23 found smokers were at increased risk for wound complications (OR, 2.27; 95% CI, 1.82-2.84), delayed wound healing and dehiscence (OR, 2.07; 95% CI, 1.53-2.81), and infection (OR, 1.79; 95% CI, 1.57-2.04). Moreover, smoking cessation decreased the incidence of SSIs (OR, 0.43; 95% CI, 0.21-0.85). A meta- analysis by Wong and colleagues24 revealed an inflection point for improved outcomes in patients who abstained from smoking for at least 4 weeks before surgery. Risk of infection was lower for these patients than for current smokers (OR, 0.69; 95% CI, 0.56-0.84).
Other comorbidities contribute to SSIs as well. In their analysis of American College of Surgeons National Surgical Quality Improvement Program registry data on 25,235 patients who underwent primary and revision lower extremity TJA, Pugely and colleagues25 found that, in the primary TJA cohort, body mass index (BMI) of >40 kg/m2 (OR, 1.9; 95% CI, 1.3-2.9), electrolyte disturbance (OR, 2.4; 95% CI, 1.0-6.0), and hypertension diagnosis (OR, 1.5; 95% CI, 1.1-2.0) increased the risk of SSI within 30 days. Furthermore, diabetes mellitus delays collagen synthesis, impairs lymphocyte function, and impairs wound healing, which may lead to poor recovery and higher risk of infection.26 In a study of 167 TKAs performed in 115 patients with type 2 diabetes mellitus, Han and Kang26 found that wound complications were 6 times more likely in those with hemoglobin A1c (HbA1c) levels higher than 8% than in those with lower HbA1c levels (OR, 6.07; 95% CI, 1.12-33.0). In a similar study of 462 patients with diabetes, Hwang and colleagues27 found a higher likelihood of superficial SSIs in patients with HbA1c levels >8% (OR, 6.1; 95% CI, 1.6-23.4; P = .008). This association was also found in patients with a fasting blood glucose level of >200 mg/dL (OR, 9.2; 95% CI, 2.2-38.2; P = .038).
Methicillin-resistant Staphylococcus aureus (MRSA) is thought to account for 10% to 25% of all periprosthetic infections in the United States.28 Nasal colonization by this pathogen increases the risk for SSIs; however, decolonization protocols have proved useful in decreasing the rates of colonization. Moroski and colleagues29 assessed the efficacy of a preoperative 5-day course of intranasal mupirocin in 289 primary or revision TJA patients. Before surgery, 12 patients had positive MRSA cultures, and 44 had positive methicillin-sensitive S aureus (MSSA) cultures. On day of surgery, a significant reduction in MRSA (P = .0073) and MSSA (P = .0341) colonization was noted. Rao and colleagues30 found that the infection rate decreased from 2.7% to 1.2% in 2284 TJA patients treated with a decolonization protocol (P = .009).
Intraoperative Measures
Cutaneous Preparation. The solutions used in perioperative skin preparation are similar to those used preoperatively: povidone-iodine, alcohol, and chlorhexidine. The efficacy of these preparations varies. Table 2 summarizes the studies on intraoperative measures for preventing SSIs.
Table 2A.
Table 2B.In a prospective study, Saltzman and colleagues31 randomly assigned 150 shoulder arthroplasty patients to one of 3 preparations: 0.75% iodine scrub with 1% iodine paint (Povidone-Iodine; Tyco Healthcare Group), 0.7% iodophor with 74% iodine povacrylex (DuraPrep; 3M Health Care), or chlorhexidine gluconate with 70% isopropyl alcohol (ChloraPrep; Enturia). All patients had their skin area prepared and swabbed for culture before incision. Although no one in any group developed a SSI, patients in the chlorhexidine group had the lowest overall incidence of positive skin cultures. That incidence (7%) and the incidence of patients in the iodophor group (19%) were significantly lower than that of patients in the iodine group (31%) (P < .001 for both). Conversely, another study32 found a higher likelihood of SSI with chlorhexidine than with povidone-iodine (OR, 4.75; 95% CI, 1.42-15.92; P = .012). This finding is controversial, but the body of evidence led the CDC to recommend use of an alcohol-based solution for preoperative skin preparation.6
The literature also highlights the importance of technique in incision-site preparation. In a prospective study, Morrison and colleagues33 randomly assigned 600 primary TJA patients to either (1) use of alcohol and povidone-iodine before draping, with additional preparation with iodine povacrylex (DuraPrep) and isopropyl alcohol before application of the final drape (300-patient intervention group) or (2) only use of alcohol and povidone-iodine before draping (300-patient control group). At the final follow-up, the incidence of SSI was significantly lower in the intervention group than in the control group (1.8% vs 6.5%; P = .015). In another study that assessed perioperative skin preparation methods, Brown and colleagues34 found that airborne bacteria levels in operating rooms were >4 times higher with patients whose legs were prepared by a scrubbed, gowned leg-holder than with patients whose legs were prepared by an unscrubbed, ungowned leg-holder (P = .0001).
Hair Removal. Although removing hair from surgical sites is common practice, the literature advocating it varies. A large comprehensive review35 revealed no increased risk of SSI with removing vs not removing hair (RR, 1.65; 95% CI, 0.85-3.19). On the other hand, some hair removal methods may affect the incidence of infection. For example, use of electric hair clippers is presumed to reduce the risk of SSIs, whereas traditional razors may compromise the epidermal barriers and create a pathway for bacterial colonization.5,36,37 In the aforementioned review,35 SSIs were more than twice as likely to occur with hair removed by shaving than with hair removed by electric clippers (RR, 2.02; 95% CI, 1.21-3.36). Cruse and Foord38 found a higher rate of SSIs with hair removed by shaving than with hair removed by clipping (2.3% vs 1.7%). Most surgeons agree that, if given the choice, they would remove hair with electric clippers rather than razors.
Gloves. Almost all orthopedists double their gloves for TJA cases. Over several studies, the incidence of glove perforation during orthopedic procedures has ranged from 3.6% to 26%,39-41 depending on the operating room personnel and glove layering studied. Orthopedists must know this startling finding, as surgical glove perforation is associated with an increase in the rate of SSIs, from 1.7% to 5.7%.38 Carter and colleagues42 found the highest risk of glove perforation occurs when double-gloved attending surgeons, adult reconstruction fellows, and registered nurses initially assist during primary and revision TJA. In their study, outer and inner glove layers were perforated 2.5% of the time. All outer-layer perforations were noticed, but inner-layer perforations went unnoticed 81% of the time, which poses a potential hazard for both patients and healthcare personnel. In addition, there was a significant increase in the incidence of glove perforations for attending surgeons during revision TJA vs primary TJA (8.9% vs 3.7%; P = .04). This finding may be expected given the complexity of revision procedures, the presence of sharp bony and metal edges, and the longer operative times. Giving more attention to glove perforations during arthroplasties may mitigate the risk of SSI. As soon as a perforation is noticed, the glove should be removed and replaced.
Body Exhaust Suits. Early TJAs had infection rates approaching 10%.43 Bacterial-laden particles shed from surgical staff were postulated to be the cause,44,45 and this idea prompted the development of new technology, such as body exhaust suits, which have demonstrated up to a 20-fold reduction in airborne bacterial contamination and decreased incidence of deep infection, from 1% to 0.1%, as compared with conventional surgical attire.46 However, the efficacy of these suits was recently challenged. Hooper and colleagues47 assessed >88,000 TJA cases in the New Zealand Joint Registry and found a significant increase in early revision THA for deep infection with vs without use of body exhaust suits (0.186% vs 0.064%; P < .0001). The incidence of revision TKAs for deep infections with use of these suits was similar (0.243% vs 0.098%; P < .001). Many of the surgeons surveyed indicated their peripheral vision was limited by the suits, which may contribute to sterile field contamination. By contrast, Miner and colleagues48 were unable to determine an increased risk of SSI with use of body exhaust suits (RR, 0.75; 95% CI, 0.34-1.62), though there was a trend toward more infections without suits. Moreover, these suits are effective in reducing mean air bacterial counts (P = .014), but it is not known if this method correlates with mean wound bacterial counts (r = –.011) and therefore increases the risk of SSI.49
Surgical Drapes. Surgical draping, including cloths, iodine-impregnated materials, and woven or unwoven materials, is the standard of care worldwide. The particular draping technique usually varies by surgeon. Plastic drapes are better barriers than cloth drapes, as found in a study by Blom and colleagues50: Bacterial growth rates were almost 10 times higher with use of wet woven cloth drapes than with plastic surgical drapes. These findings were supported in another, similar study by Blom and colleagues51: Wetting drapes with blood or normal saline enhanced bacterial penetration. In addition, wetting drapes with chlorhexidine or iodine reduced but did not eliminate bacterial penetration. Fairclough and colleagues52 emphasized that iodine-impregnated drapes reduced surgical-site bacterial contamination from 15% to 1.6%. However, a Cochrane review53 found these drapes had no effect on the SSI rate (RR, 1.03; 95% CI, 0.06-1.66; P = .89), though the risk of infection was slightly higher with adhesive draping than with no drape (RR, 1.23; 95% CI, 1.02-1.48; P = .03).
Ventilation Flow. Laminar-airflow systems are widely used to prevent SSIs after TJA. Horizontal-flow and vertical-flow ventilation provides and maintains ultra-clean air in the operating room. Evans54 found the bacterial counts in the air and the wound were lower with laminar airflow than without this airflow. The amount of airborne bacterial colony-forming units and dust large enough to carry bacteria was reduced to 1 or 2 particles more than 2 μm/m3 with use of a typical laminar- airflow system. In comparing 3922 TKA patients in laminar-airflow operating rooms with 4133 patients in conventional rooms, Lidwell and colleagues46 found a significantly lower incidence of SSIs in patients in laminar-airflow operating rooms (0.6% vs 2.3%; P < .001).
Conversely, Miner and colleagues48 did not find a lower risk of SSI with laminar-airflow systems (RR, 1.57; 95% CI, 0.75-3.31). In addition, in their analysis of >88,000 cases from the New Zealand Joint Registry, Hooper and colleagues47 found that the incidence of early infections was higher with laminar-airflow systems than with standard airflow systems for both TKA (0.193% vs 0.100%; P = .019) and THA (0.148% vs 0.061%; P < .001). They postulated that vertically oriented airflow may have transmitted contaminated particles into the surgical sites. Additional evidence may be needed to resolve these conflicting findings and determine whether clean-air practices provide significant clinical benefit in the operating room.
Staff Traffic Volume. When staff enters or exits the operating room or makes extra movements during a procedure, airflow near the wound is disturbed and no longer able to remove sufficient airborne pathogens from the sterile field. The laminar- airflow pattern may be disrupted each time the operating room doors open and close, potentially allowing airborne pathogens to be introduced near the patient. Lynch and colleagues55 found the operating room door opened almost 50 times per hour, and it took about 20 seconds to close each time. As a result, the door may remain open for up to 20 minutes per case, causing substantial airflow disruption and potentially ineffective removal of airborne bacterial particles. Similarly, Young and O’Regan56 found the operating room door opened about 19 times per hour and took 20 seconds to close each time. The theater door was open an estimated 10.7% of each hour of sterile procedure. Presence of more staff also increases airborne bacterial counts. Pryor and Messmer57 evaluated a cohort of 2864 patients to determine the effect of number of personnel in the operating theater on the incidence of SSIs. Infection rates were 6.27% with >17 different people entering the room and 1.52% with <9 different people entering the room. Restricting the number of people in the room may be one of the easiest and most efficient ways to prevent SSI.
Systemic Antibiotic Prophylaxis. Perioperative antibiotic use is vital in minimizing the risk of infection after TJA. The Surgical Care Improvement Project recommended beginning the first antimicrobial dose either within 60 minutes before surgical incision (for cephalosporin) or within 2 hours before incision (for vancomycin) and discontinuing the prophylactic antimicrobial agents within 24 hours after surgery ends.58,59 However, Gorenoi and colleagues60 were unable to recommend a way to select particular antibiotics, as they found no difference in the effectiveness of various antibiotic agents used in TKA. A systematic review by AlBuhairan and colleagues61 revealed that antibiotic prophylaxis (vs no prophylaxis) reduced the absolute risk of a SSI by 8% and the relative risk by 81% (P < 0.0001). These findings are supported by evidence of the efficacy of perioperative antibiotics in reducing the incidence of SSI.62,63 Antibiotic regimens should be based on susceptibility and availability, depending on hospital prevalence of infections. Even more, patients should receive prophylaxis in a timely manner. Finally, bacteriostatic antibiotics (vancomycin) should not be used on their own for preoperative prophylaxis.
Antibiotic Cement. Antibiotic-loaded bone cement (ALBC), which locally releases antimicrobials in high concentration, is often used in revision joint arthroplasty, but use in primary joint arthroplasty remains controversial. In a study of THA patients, Parvizi and colleagues64 found infection rates of 1.2% with 2.3% with and without use of ALBC, respectively. Other studies have had opposing results. Namba and colleagues65 evaluated 22,889 primary TKAs, 2030 (8.9%) of which used ALBC. The incidence of deep infection was significantly higher with ALBC than with regular bone cement (1.4% vs 0.7%; P = .002). In addition, a meta- analysis of >6500 primary TKA patients, by Zhou and colleagues,66 revealed no significant difference in the incidence of deep SSIs with use of ALBC vs regular cement (1.32% vs 1.89%; RR, 0.75; 95% CI, 0.43-1.33; P = .33). More evidence is needed to determine the efficacy of ALBC in primary TJA. International Consensus Meeting on Periprosthetic Joint Infection participants recommended use of ALBC in high-risk patients, including patients who are obese or immunosuppressed or have diabetes or a prior history of infection.67
Postoperative Measures
Antibiotic Prophylaxis. The American Academy of Orthopaedic Surgeons (AAOS) and the American Dental Association (ADA) have suggestions for antibiotic prophylaxis for patients at increased risk for infection. As of 2015, the ADA no longer recommends antibiotic prophylaxis for patients with prosthetic joint implants,68 whereas the AAOS considers all patients with TJA to be at risk.69
Table 3.For TJA patients, the AAOS recommends administering antibiotic prophylaxis at least 1 hour before a dental procedure and discontinuing it within 24 hours after the procedure ends.69 Single preoperative doses are acceptable for outpatient procedures.70Table 3 summarizes the studies that reported on postoperative measures for preventing SSI.
Although recommendations exist, the actual risk of infection resulting from dental procedures and the role of antibiotic prophylaxis are not well defined. Berbari and colleagues71 found that antibiotic prophylaxis in high- or low-risk dental procedures did not decrease the risk of subsequent THA infection (OR, 0.9; 95% CI, 0.5-1.6) or TKA infection (OR, 1.2; 95% CI, 0.7-2.2). Moreover, the risk of infection was no higher for patients who had a prosthetic hip or knee and underwent a high- or low-risk dental procedure without antibiotic prophylaxis (OR, 0.8; 95% CI, 0.4-1.6) than for similar patients who did not undergo a dental procedure (OR, 0.6; 95% CI, 0.4-1.1). Some studies highlight the low level of evidence supporting antibiotic prophylaxis during dental procedures.72,73 However, there is no evidence of adverse effects of antibiotic prophylaxis. Given the potential high risk of infection after such procedures, a more robust body of evidence is needed to reach consensus.
Evacuation Drain Management. Prolonged use of surgical evacuation drains may be a risk factor for SSI. Therefore, early drain removal is paramount. Higher infection rates with prolonged drain use have been found in patients with persistent wound drainage, including malnourished, obese, and over-anticoagulated patients. Patients with wounds persistently draining for >1 week should undergo superficial wound irrigation and débridement. Jaberi and colleagues74 assessed 10,325 TJA patients and found that the majority of persistent drainage ceased within 1 week with use of less invasive measures, including oral antibiotics and local wound care. Furthermore, only 28% of patients with persistent drainage underwent surgical débridement. It is unclear if this practice alone is appropriate. Infection should always be suspected and treated aggressively, and cultures should be obtained from synovial fluid before antibiotics are started, unless there is an obvious superficial infection that does not require further work-up.67
Economic Impact
SSIs remain a significant healthcare issue, and the social and financial costs are staggering. Without appropriate measures in place, these complications will place a larger burden on the healthcare system primarily as a result of longer hospital stays, multiple procedures, and increased resource utilization.75 Given the risk of progression to prosthetic joint infection, early preventive interventions must be explored.
Table 4.Several studies have addressed the economic implications of SSIs after TJA as well as the impact of preventive interventions (Table 4). Using the NIS database, Kurtz and colleagues4 found that not only were hospital stays significantly longer for infected (vs noninfected) knee arthroplasties (7.6 vs 3.9 days; P < .0001), but hospital charges were 1.52 times higher (P < .0001), and results were similar for infected (vs noninfected) hips (9.7 vs 4.3 days; 1.76 times higher charges; P < .0001 for both). Kapadia and colleagues76 matched 21 TKA patients with periprosthetic infections with 21 noninfected TKA patients at a single institution and found the infected patients had more readmissions (3.6 vs 0.1; P < .0001), longer hospitalizations (5.3 vs 3.0 days; P = .0002), more days in the hospital within 1 year of arthroplasty (23.7 vs 3.4 days; P < .0001), and more clinic visits (6.5 vs 1.3; P < .0001). Furthermore, the infected patients had a significantly higher mean annual cost of treatment ($116,383 vs $28,249; P < .0001). Performing a Markov analysis, Slover and colleagues77 found that the decreased incidence of infection and the potential cost savings associated with preoperative S aureus screening and a decolonization protocol were able to offset the costs acquired by the screening and decolonization protocol. Similarly, Cummins and colleagues78 evaluated the effects of ALBC on overall healthcare costs; if revision surgery was the primary outcome of all infections, use of ALBC (vs cement without antibiotics) resulted in a cost-effectiveness ratio of $37,355 per quality-adjusted life year. Kapadia and colleagues79 evaluated the economic impact of adding 2% chlorhexidine gluconate-impregnated cloths to an existing preoperative skin preparation protocol for TKA. One percent of non-chlorhexidine patients and 0.6% of chlorhexidine patients developed an infection. The reduction in incidence of infection amounted to projected net savings of almost $2.1 million per 1000 TKA patients. Nationally, annual healthcare savings were expected to range from $0.78 billion to $3.18 billion with implementation of this protocol.
Improved patient selection may be an important factor in reducing SSIs. In an analysis of 8494 joint arthroplasties, Malinzak and colleagues80 noted that patients with a BMI of >50 kg/m2 had an increased OR of infection of 21.3 compared to those with BMI <50 kg/m2. Wagner and colleagues81 analyzed 21,361 THAs and found that, for every BMI unit over 25 kg/m2, there was an 8% increased risk of joint infection (P < .001). Although it is unknown if there is an association between reduction in preoperative BMI and reduction in postoperative complication risk, it may still be worthwhile and cost-effective to modify this and similar risk factors before elective procedures.
Market forces are becoming a larger consideration in healthcare and are being driven by provider competition.82 Treatment outcomes, quality of care, and healthcare prices have gained attention as a means of estimating potential costs.83 In 2011, the Centers for Medicare & Medicaid Services (CMS) advanced the Bundled Payments for Care Improvement (BPCI) initiative, which aimed to provide better coordinated care of higher quality and lower cost.84 This led to development of the Comprehensive Care for Joint Replacement (CJR) program, which gives beneficiaries flexibility in choosing services and ensures that providers adhere to required standards. During its 5-year test period beginning in 2016, the CJR program is projected to save CMS $153 million.84 Under this program, the institution where TJA is performed is responsible for all the costs of related care from time of surgery through 90 days after hospital discharge—which is known as an “episode of care.” If the cost incurred during an episode exceeds an established target cost (as determined by CMS), the hospital must repay Medicare the difference. Conversely, if the cost of an episode is less than the established target cost, the hospital is rewarded with the difference. Bundling payments for a single episode of care in this manner is thought to incentivize providers and hospitals to give patients more comprehensive and coordinated care. Given the substantial economic burden associated with joint arthroplasty infections, it is imperative for orthopedists to establish practical and cost-effective strategies that can prevent these disastrous complications.
Conclusion
SSIs are a devastating burden to patients, surgeons, and other healthcare providers. In recent years, new discoveries and innovations have helped mitigate the incidence of these complications of THA and TKA. However, the incidence of SSIs may rise with the increasing use of TJAs and with the development of new drug-resistant pathogens. In addition, the increasing number of TJAs performed on overweight and high-risk patients means the costs of postoperative infections will be substantial. With new reimbursement models in place, hospitals and providers are being held more accountable for the care they deliver during and after TJA. Consequently, more emphasis should be placed on techniques that are proved to minimize the incidence of SSIs.
References
1. National Nosocomial Infections Surveillance System. National Nosocomial Infections Surveillance (NNIS) System report, data summary from January 1992 through June 2004, issued October 2004. Am J Infect Control. 2004;32(8):470-485.
2. Bozic KJ, Ries MD. The impact of infection after total hip arthroplasty on hospital and surgeon resource utilization. J Bone Joint Surg Am. 2005;87(8):1746-1751.
3. Kurtz SM, Lau E, Watson H, Schmier JK, Parvizi J. Economic burden of periprosthetic joint infection in the United States. J Arthroplasty. 2012;27(8 suppl):61-65.e61.
4. Kurtz SM, Lau E, Schmier J, Ong KL, Zhao K, Parvizi J. Infection burden for hip and knee arthroplasty in the United States. J Arthroplasty. 2008;23(7):984-991.
5. Mangram AJ, Horan TC, Pearson ML, Silver LC, Jarvis WR. Guideline for prevention of surgical site infection, 1999. Hospital Infection Control Practices Advisory Committee. Infect Control Hosp Epidemiol. 1999;20(4):250-278.
6. Berrios-Torres SI. Evidence-based update to the U.S. Centers for Disease Control and Prevention and Healthcare Infection Control Practices Advisory Committee guideline for the prevention of surgical site infection: developmental process. Surg Infect (Larchmt). 2016;17(2):256-261.
7 Mangram AJ, Horan TC, Pearson ML, Silver LC, Jarvis WR. Guideline for prevention of surgical site infection, 1999. Centers for Disease Control and Prevention (CDC) Hospital Infection Control Practices Advisory Committee. Am J Infect Control. 1999;27(2):97-132.
8. Marchetti MG, Kampf G, Finzi G, Salvatorelli G. Evaluation of the bactericidal effect of five products for surgical hand disinfection according to prEN 12054 and prEN 12791. J Hosp Infect. 2003;54(1):63-67.
9. Reichman DE, Greenberg JA. Reducing surgical site infections: a review. Rev Obstet Gynecol. 2009;2(4):212-221.
10. Hayek LJ, Emerson JM, Gardner AM. A placebo-controlled trial of the effect of two preoperative baths or showers with chlorhexidine detergent on postoperative wound infection rates. J Hosp Infect. 1987;10(2):165-172.
11. Murray MR, Saltzman MD, Gryzlo SM, Terry MA, Woodward CC, Nuber GW. Efficacy of preoperative home use of 2% chlorhexidine gluconate cloth before shoulder surgery. J Shoulder Elbow Surg. 2011;20(6):928-933.
12. Darouiche RO, Wall MJ Jr, Itani KM, et al. Chlorhexidine-alcohol versus povidone-iodine for surgical-site antisepsis. N Engl J Med. 2010;362(1):18-26.
13. Zywiel MG, Daley JA, Delanois RE, Naziri Q, Johnson AJ, Mont MA. Advance pre-operative chlorhexidine reduces the incidence of surgical site infections in knee arthroplasty. Int Orthop. 2011;35(7):1001-1006.
14. Kapadia BH, Johnson AJ, Daley JA, Issa K, Mont MA. Pre-admission cutaneous chlorhexidine preparation reduces surgical site infections in total hip arthroplasty. J Arthroplasty. 2013;28(3):490-493.
15. Johnson AJ, Kapadia BH, Daley JA, Molina CB, Mont MA. Chlorhexidine reduces infections in knee arthroplasty. J Knee Surg. 2013;26(3):213-218.
16. Kapadia BH, Elmallah RK, Mont MA. A randomized, clinical trial of preadmission chlorhexidine skin preparation for lower extremity total joint arthroplasty. J Arthroplasty. 2016;31(12):2856-2861.
17. Mainous MR, Deitch EA. Nutrition and infection. Surg Clin North Am. 1994;74(3):659-676.
18. Greene KA, Wilde AH, Stulberg BN. Preoperative nutritional status of total joint patients. Relationship to postoperative wound complications. J Arthroplasty. 1991;6(4):321-325.
19. Del Savio GC, Zelicof SB, Wexler LM, et al. Preoperative nutritional status and outcome of elective total hip replacement. Clin Orthop Relat Res. 1996;(326):153-161.
20. Alfargieny R, Bodalal Z, Bendardaf R, El-Fadli M, Langhi S. Nutritional status as a predictive marker for surgical site infection in total joint arthroplasty. Avicenna J Med. 2015;5(4):117-122.
21. Bridges SL Jr, Lopez-Mendez A, Han KH, Tracy IC, Alarcon GS. Should methotrexate be discontinued before elective orthopedic surgery in patients with rheumatoid arthritis? J Rheumatol. 1991;18(7):984-988.
22. Silverstein P. Smoking and wound healing. Am J Med. 1992;93(1A):22S-24S.
23. Sørensen LT. Wound healing and infection in surgery. The clinical impact of smoking and smoking cessation: a systematic review and meta-analysis. Arch Surg. 2012;147(4):373-383.
24. Wong J, Lam DP, Abrishami A, Chan MT, Chung F. Short-term preoperative smoking cessation and postoperative complications: a systematic review and meta-analysis. Can J Anaesth. 2012;59(3):268-279.
25. Pugely AJ, Martin CT, Gao Y, Schweizer ML, Callaghan JJ. The incidence of and risk factors for 30-day surgical site infections following primary and revision total joint arthroplasty. J Arthroplasty. 2015;30(9 suppl):47-50.
26. Han HS, Kang SB. Relations between long-term glycemic control and postoperative wound and infectious complications after total knee arthroplasty in type 2 diabetics. Clin Orthop Surg. 2013;5(2):118-123.
27. Hwang JS, Kim SJ, Bamne AB, Na YG, Kim TK. Do glycemic markers predict occurrence of complications after total knee arthroplasty in patients with diabetes? Clin Orthop Relat Res. 2015;473(5):1726-1731.
28. Whiteside LA, Peppers M, Nayfeh TA, Roy ME. Methicillin-resistant Staphylococcus aureus in TKA treated with revision and direct intra-articular antibiotic infusion. Clin Orthop Relat Res. 2011;469(1):26-33.
29. Moroski NM, Woolwine S, Schwarzkopf R. Is preoperative staphylococcal decolonization efficient in total joint arthroplasty. J Arthroplasty. 2015;30(3):444-446.
30. Rao N, Cannella BA, Crossett LS, Yates AJ Jr, McGough RL 3rd, Hamilton CW. Preoperative screening/decolonization for Staphylococcus aureus to prevent orthopedic surgical site infection: prospective cohort study with 2-year follow-up. J Arthroplasty. 2011;26(8):1501-1507.
31. Saltzman MD, Nuber GW, Gryzlo SM, Marecek GS, Koh JL. Efficacy of surgical preparation solutions in shoulder surgery. J Bone Joint Surg Am. 2009;91(8):1949-1953.
32. Carroll K, Dowsey M, Choong P, Peel T. Risk factors for superficial wound complications in hip and knee arthroplasty. Clin Microbiol Infect. 2014;20(2):130-135.
33. Morrison TN, Chen AF, Taneja M, Kucukdurmaz F, Rothman RH, Parvizi J. Single vs repeat surgical skin preparations for reducing surgical site infection after total joint arthroplasty: a prospective, randomized, double-blinded study. J Arthroplasty. 2016;31(6):1289-1294.
34. Brown AR, Taylor GJ, Gregg PJ. Air contamination during skin preparation and draping in joint replacement surgery. J Bone Joint Surg Br. 1996;78(1):92-94.
35. Tanner J, Woodings D, Moncaster K. Preoperative hair removal to reduce surgical site infection. Cochrane Database Syst Rev. 2006;(3):CD004122.
36. Mishriki SF, Law DJ, Jeffery PJ. Factors affecting the incidence of postoperative wound infection. J Hosp Infect. 1990;16(3):223-230.
37. Harrop JS, Styliaras JC, Ooi YC, Radcliff KE, Vaccaro AR, Wu C. Contributing factors to surgical site infections. J Am Acad Orthop Surg. 2012;20(2):94-101.
38. Cruse PJ, Foord R. A five-year prospective study of 23,649 surgical wounds. Arch Surg. 1973;107(2):206-210.
39. Laine T, Aarnio P. Glove perforation in orthopaedic and trauma surgery. A comparison between single, double indicator gloving and double gloving with two regular gloves. J Bone Joint Surg Br. 2004;86(6):898-900.
40. Ersozlu S, Sahin O, Ozgur AF, Akkaya T, Tuncay C. Glove punctures in major and minor orthopaedic surgery with double gloving. Acta Orthop Belg. 2007;73(6):760-764.
41. Chan KY, Singh VA, Oun BH, To BH. The rate of glove perforations in orthopaedic procedures: single versus double gloving. A prospective study. Med J Malaysia. 2006;61(suppl B):3-7.
42. Carter AH, Casper DS, Parvizi J, Austin MS. A prospective analysis of glove perforation in primary and revision total hip and total knee arthroplasty. J Arthroplasty. 2012;27(7):1271-1275.
43. Charnley J. A clean-air operating enclosure. Br J Surg. 1964;51:202-205.
44. Whyte W, Hodgson R, Tinkler J. The importance of airborne bacterial contamination of wounds. J Hosp Infect. 1982;3(2):123-135.
45. Owers KL, James E, Bannister GC. Source of bacterial shedding in laminar flow theatres. J Hosp Infect. 2004;58(3):230-232.
46. Lidwell OM, Lowbury EJ, Whyte W, Blowers R, Stanley SJ, Lowe D. Effect of ultraclean air in operating rooms on deep sepsis in the joint after total hip or knee replacement: a randomised study. Br Med J (Clin Res Ed). 1982;285(6334):10-14.
47. Hooper GJ, Rothwell AG, Frampton C, Wyatt MC. Does the use of laminar flow and space suits reduce early deep infection after total hip and knee replacement? The ten-year results of the New Zealand Joint Registry. J Bone Joint Surg Br. 2011;93(1):85-90.
48. Miner AL, Losina E, Katz JN, Fossel AH, Platt R. Deep infection after total knee replacement: impact of laminar airflow systems and body exhaust suits in the modern operating room. Infect Control Hosp Epidemiol. 2007;28(2):222-226.
49. Der Tavitian J, Ong SM, Taub NA, Taylor GJ. Body-exhaust suit versus occlusive clothing. A randomised, prospective trial using air and wound bacterial counts. J Bone Joint Surg Br. 2003;85(4):490-494.
50. Blom A, Estela C, Bowker K, MacGowan A, Hardy JR. The passage of bacteria through surgical drapes. Ann R Coll Surg Engl. 2000;82(6):405-407.
51. Blom AW, Gozzard C, Heal J, Bowker K, Estela CM. Bacterial strike-through of re-usable surgical drapes: the effect of different wetting agents. J Hosp Infect. 2002;52(1):52-55.
52. Fairclough JA, Johnson D, Mackie I. The prevention of wound contamination by skin organisms by the pre-operative application of an iodophor impregnated plastic adhesive drape. J Int Med Res. 1986;14(2):105-109.
53. Webster J, Alghamdi AA. Use of plastic adhesive drapes during surgery for preventing surgical site infection. Cochrane Database Syst Rev. 2007;(4):CD006353.
54. Evans RP. Current concepts for clean air and total joint arthroplasty: laminar airflow and ultraviolet radiation: a systematic review. Clin Orthop Relat Res. 2011;469(4):945-953.
55. Lynch RJ, Englesbe MJ, Sturm L, et al. Measurement of foot traffic in the operating room: implications for infection control. Am J Med Qual. 2009;24(1):45-52.
56. Young RS, O’Regan DJ. Cardiac surgical theatre traffic: time for traffic calming measures? Interact Cardiovasc Thorac Surg. 2010;10(4):526-529.
57. Pryor F, Messmer PR. The effect of traffic patterns in the OR on surgical site infections. AORN J. 1998;68(4):649-660.
58. Bratzler DW, Houck PM; Surgical Infection Prevention Guidelines Writers Workgroup, American Academy of Orthopaedic Surgeons, American Association of Critical Care Nurses, et al. Antimicrobial prophylaxis for surgery: an advisory statement from the National Surgical Infection Prevention Project. Clin Infect Dis. 2004;38(12):1706-1715.
59. Rosenberger LH, Politano AD, Sawyer RG. The Surgical Care Improvement Project and prevention of post-operative infection, including surgical site infection. Surg Infect (Larchmt). 2011;12(3):163-168.
60. Gorenoi V, Schonermark MP, Hagen A. Prevention of infection after knee arthroplasty. GMS Health Technol Assess. 2010;6:Doc10.
61. AlBuhairan B, Hind D, Hutchinson A. Antibiotic prophylaxis for wound infections in total joint arthroplasty: a systematic review. J Bone Joint Surg Br. 2008;90(7):915-919.
62. Bratzler DW, Houck PM; Surgical Infection Prevention Guideline Writers Workgroup. Antimicrobial prophylaxis for surgery: an advisory statement from the National Surgical Infection Prevention Project. Am J Surg. 2005;189(4):395-404.
63. Quenon JL, Eveillard M, Vivien A, et al. Evaluation of current practices in surgical antimicrobial prophylaxis in primary total hip prosthesis—a multicentre survey in private and public French hospitals. J Hosp Infect. 2004;56(3):202-207.
64. Parvizi J, Saleh KJ, Ragland PS, Pour AE, Mont MA. Efficacy of antibiotic-impregnated cement in total hip replacement. Acta Orthop. 2008;79(3):335-341.
65. Namba RS, Chen Y, Paxton EW, Slipchenko T, Fithian DC. Outcomes of routine use of antibiotic-loaded cement in primary total knee arthroplasty. J Arthroplasty. 2009;24(6 suppl):44-47.
66. Zhou Y, Li L, Zhou Q, et al. Lack of efficacy of prophylactic application of antibiotic-loaded bone cement for prevention of infection in primary total knee arthroplasty: results of a meta-analysis. Surg Infect (Larchmt). 2015;16(2):183-187.
67. Leopold SS. Consensus statement from the International Consensus Meeting on Periprosthetic Joint Infection. Clin Orthop Relat Res. 2013;471(12):3731-3732.
68. Sollecito TP, Abt E, Lockhart PB, et al. The use of prophylactic antibiotics prior to dental procedures in patients with prosthetic joints: evidence-based clinical practice guideline for dental practitioners—a report of the American Dental Association Council on Scientific Affairs. J Am Dent Assoc. 2015;146(1):11-16.e18.
69. Watters W 3rd, Rethman MP, Hanson NB, et al. Prevention of orthopaedic implant infection in patients undergoing dental procedures. J Am Acad Orthop Surg. 2013;21(3):180-189.
70. Merchant VA; American Academy of Orthopaedic Surgeons, American Dental Association. The new AAOS/ADA clinical practice guidelines for management of patients with prosthetic joint replacements. J Mich Dent Assoc. 2013;95(2):16, 74.
71. Berbari EF, Osmon DR, Carr A, et al. Dental procedures as risk factors for prosthetic hip or knee infection: a hospital-based prospective case–control study. Clin Infect Dis. 2010;50(1):8-16.
72. Little JW, Jacobson JJ, Lockhart PB; American Academy of Oral Medicine. The dental treatment of patients with joint replacements: a position paper from the American Academy of Oral Medicine. J Am Dent Assoc. 2010;141(6):667-671.
73. Curry S, Phillips H. Joint arthroplasty, dental treatment, and antibiotics: a review. J Arthroplasty. 2002;17(1):111-113.
74. Jaberi FM, Parvizi J, Haytmanek CT, Joshi A, Purtill J. Procrastination of wound drainage and malnutrition affect the outcome of joint arthroplasty. Clin Orthop Relat Res. 2008;466(6):1368-1371.
75. Stone PW. Economic burden of healthcare-associated infections: an American perspective. Expert Rev Pharmacoecon Outcomes Res. 2009;9(5):417-422.
76. Kapadia BH, McElroy MJ, Issa K, Johnson AJ, Bozic KJ, Mont MA. The economic impact of periprosthetic infections following total knee arthroplasty at a specialized tertiary-care center. J Arthroplasty. 2014;29(5):929-932.
77. Slover J, Haas JP, Quirno M, Phillips MS, Bosco JA 3rd. Cost-effectiveness of a Staphylococcus aureus screening and decolonization program for high-risk orthopedic patients. J Arthroplasty. 2011;26(3):360-365.
78. Cummins JS, Tomek IM, Kantor SR, Furnes O, Engesaeter LB, Finlayson SR. Cost-effectiveness of antibiotic-impregnated bone cement used in primary total hip arthroplasty. J Bone Joint Surg Am. 2009;91(3):634-641.
79. Kapadia BH, Johnson AJ, Issa K, Mont MA. Economic evaluation of chlorhexidine cloths on healthcare costs due to surgical site infections following total knee arthroplasty. J Arthroplasty. 2013;28(7):1061-1065.
80. Malinzak RA, Ritter MA, Berend ME, Meding JB, Olberding EM, Davis KE. Morbidly obese, diabetic, younger, and unilateral joint arthroplasty patients have elevated total joint arthroplasty infection rates. J Arthroplasty. 2009;24(6 suppl):84-88.
81. Wagner ER, Kamath AF, Fruth KM, Harmsen WS, Berry DJ. Effect of body mass index on complications and reoperations after total hip arthroplasty. J Bone Joint Surg Am. 2016;98(3):169-179.
82 Broex EC, van Asselt AD, Bruggeman CA, van Tiel FH. Surgical site infections: how high are the costs? J Hosp Infect. 2009;72(3):193-201.
83. Anderson DJ, Kirkland KB, Kaye KS, et al. Underresourced hospital infection control and prevention programs: penny wise, pound foolish? Infect Control Hosp Epidemiol. 2007;28(7):767-773.
84. Centers for Medicare & Medicaid Services (CMS), HHS. Medicare program; comprehensive care for joint replacement payment model for acute care hospitals furnishing lower extremity joint replacement services. Final rule. Fed Regist. 2015;80(226):73273-73554.
Shared decision-making tools, such as predictive models, can help empower the patient to make decisions for or against surgery equipped with more information about the expected outcome.
There is a role for preoperative collection of PROMs in the clinical decision-making process.
Mental health state, as reported by the VR-12 MCS, is a significant predictor of postoperative pain and function as reported by the VAS pain and ASES function scores.
A significant portion of the predictive ability of this model comes from the fact that at 1-year postoperatively, patients receiving a rTSA will on average have a 3.8 point lower on ASES function score than those receiving a TSA (P < .001, ω2=.083).
Future studies to discern the role of different modalities to improve a patient’s emotional health preoperatively will be beneficial as the healthcare industry trends toward value based medicine collecting PROMs as part of reimbursement schemes.
Over the past few decades, decisions regarding patients’ care have gradually transitioned from a paternalistic model to a more cooperative exchange between patient and physician. Shared decision-making provides patients a measure of autonomy in making choices for their health and their future. Patient participation may mitigate uncertainty and discomfort during selection of a course of treatment, which may lead to increased satisfaction levels after surgery.1 Moreover, shared decision-making may help patients better manage postoperative expectations through evidenced-based discussions of preoperative health levels and their corresponding outcomes. Patient-reported outcome measures (PROMs) use clinically sensitive and specific metrics to evaluate a patient’s self-reported pain, functional ability, and mental state.2 These metrics are useful in setting patient expectations for potential outcomes of treatment options. Use of evidence-based clinical decision-making tools, such as PROM-based predictive models, can facilitate a collaborative decision-making environment for patient and physician. Given the present cost-containment era, and the need for preoperative metrics that can assist in predictive analysis of postoperative improvement, models are clearly valuable.
In attempts to help patients set well-informed and reasonable expectations, physicians have turned to PROMs to facilitate preoperative evidence-based discussions. Although PROMs have been in use for almost 30 years, only recently have they been used to create tools that can aid quantitatively in the surgical decision-making process.2-6 Combining physical examination findings, imaging studies, comorbidities, and quantitative tools, such as this model, may enhance patients’ understanding of their preoperative condition and expected prognosis and thereby guide their surgical decisions.
We conducted a study to determine whether certain preoperative PROMs can predict 1-year postoperative visual analog scale (VAS) pain scores and American Shoulder and Elbow Surgeons (ASES) Function scores in total shoulder arthroplasty (TSA) and reverse TSA (rTSA). We hypothesized that preoperative mental health status as captured by Veterans RAND 12-Item Health Survey (VR-12) mental health component summary (MCS) score and preoperative VAS pain score would predict both VAS pain score and ASES Function score 1 year after surgery. Specifically, we hypothesized that a higher preoperative VR-12 MCS score would predict less pain and better function 1 year after surgery and that a higher preoperative VAS pain score would predict more pain and worse function 1 year after surgery.
Methods
This study was approved by the Institutional Review Board of Partners Healthcare. The study used the Surgical Outcome System (Arthrex), a comprehensive prospective database that stores preoperative and 1-year postoperative patient demographics and TSA-PROM data. Surveys are emailed to all enrolled patients before surgery and 1 year after surgery. As indicated by the Institutional Review Boards of all participating institutions, patients in the Surgical Outcome System have to sign a consent form to permit use of their responses in research.
The database includes patient data from 42 orthopedic surgeons across the United States. All primary TSAs and primary rTSAs in the database were included in this study, regardless of arthroplasty indication. Revisions were excluded. Also excluded were cases in which the 1-year postoperative questionnaire was not completed. Of the 1681 patients eligible for 1-year follow-up, 1225 (73%) completed the 1-year postoperative questionnaire. PROMs used in the study were VAS pain score, ASES Function score, VR-12 MCS score, and Single Assessment Numerical Evaluation (SANE). Unfortunately, not all surgeons use every measure in the 1-year postoperative questionnaire set. Thus, in our complete models, total number of observations was 1004 for modeling 1-year postoperative VAS pain scores and 986 for modeling 1-year postoperative ASES Function scores.
Metrics
On VAS, pain is rated from 0 (no pain) to 10 (pain as bad as it can be). Tashjian and colleagues7 estimated that the minimal clinically important difference (MCID) for postoperative VAS pain scores was 1.4 in a cohort of 326 patients who had TSA, rTSA, or shoulder hemiarthroplasty. ASES Function score is scaled from 0 to 30, with 30 representing best function.8 Wong and colleagues9 identified an MCID of 6.5 for ASES Function scores in a cohort of 107 patients who had TSA or rTSA. SANE ratings range from 0% to 100%, with 100% indicating the patient’s shoulder was totally “normal.”10 VR-12 MCS scores appear on a logarithmic scale, with higher numbers representing better mental health. The population mean estimate for VR-12 MCS scores is 50.1 (SD, 11.49; overall possible range, –2.47 to 76.1).11 Our patient population’s scores ranged from 12.5 to 73.8.
Statistical Analysis
Simple bivariate and multivariate linear regressions were performed to evaluate the predictive value of each of the outlined PROMs. Our complete model controls for patient sex, age, and type of arthroplasty. Categorical variables were dummy-coded. Both 1-year postoperative VAS pain score and 1-year postoperative ASES Function score were investigated as dependent variables. Regression coefficients and P and ω2 values are reported. Omega square represents how much of the variance in an outcome variable a model explains, like R2, and ω2 values can also be calculated for individual factors to see how much variance a given factor accounts for. For a simple relative risk calculation, we divided our cohort into 3 equal-sized groups based on preoperative VR-12 MCS scores and compared the risk that patients with scores in the top third (better mental health) would end up below certain ASES Total scores with the risk of patients with scores in the bottom third (worse mental health). All statistical analyses were performed with Stata (StataCorp).
Results
Table 1 lists summary statistics for the population used in these models.
Table 1.Our complete model for predicting VAS pain score 1 year after surgery accounted for 8% of the variability in this pain score (ω2 = .076), whereas our complete model for predicting ASES Function score 1 year after surgery accounted for 22% of the variability (ω2 = .219). These models include preoperative scores for VAS pain, ASES Function, VR-12 MCS, SANE, age at time of surgery, sex, and type of arthroplasty as possible explanatory variables.
Table 2.Predicting VAS Pain Score (Table 2)
Preoperative VAS pain score and VR-12 MCS score both predicted 1-year postoperative VAS pain score (P < .001). Preoperative ASES Function score did not predict pain 1 year after surgery. By contrast, higher preoperative VAS pain scores were associated with higher VAS pain scores 1 year after surgery. Higher preoperative VR-12 MCS scores were significantly associated with lower VAS pain scores 1 year after surgery, indicating that better preoperative mental health is significantly associated with better self-reported outcomes in terms of pain 1 year after surgery. These associations remained statistically significant when controlling for age at time of surgery, sex, and type of arthroplasty.
Preoperative VR-12 MCS score was more predictive of 1-year postoperative VAS pain score than preoperative VAS pain score was. In other words, preoperative VR-12 MCS score accounted for more variability in outcome for 1-year postoperative VAS pain score (2.4%; ω2 = .023) than preoperative VAS pain score did (1.6%; ω2 = .015).
Table 3.Predicting ASES Function Score (Table 3)
By contrast, preoperative VAS pain score did not predict 1-year postoperative ASES Function score. Preoperative ASES Function and VR-12 MCS scores both predicted 1-year postoperative ASES Function score (P < .001). Higher preoperative ASES Function scores were associated with higher 1-year postoperative ASES Function scores. In other words, reporting better shoulder function before surgery was associated with reporting better shoulder function after surgery.
An example gives a sense of the effect size associated with the coefficient for preoperative ASES Function score. Our model predicts that, compared with a patient who reports 5 points lower on preoperative ASES Function (which ranges from 0-30), a patient who reports 5 points higher will report on average about 1 point higher on 1-year postoperative ASES Function. As in the model for postoperative pain, these associations with preoperative function and mental health scores held when controlling for age, sex, and type of arthroplasty.
As in the postoperative pain model, preoperative VR-12 MCS score was more predictive of 1-year postoperative ASES Function score than preoperative ASES Function score was. Preoperative VR-12 MCS score accounted for more of the variation that our model predicts (ω2 = .029) than preoperative ASES Function score did (ω2 = .020). We compared the risk that patients with high preoperative VR-12 MCS scores (top third of cohort) would end up with ASES Total scores below 70, below 80, or below 90 with the risk of patients with low preoperative VR-12 MCS scores (bottom third). Results appear in Table 4.
Table 4.
A significant part of the predictive ability of our model for postoperative ASES Function scores stems from the fact that a patient who undergoes rTSA (vs TSA) is predicted to have an ASES Function score 3.8 points lower 1 year after surgery (P < .001, ω2 = .083). With type of arthroplasty controlled for, female sex is associated with an ASES Function score 1.6 points lower 1 year after surgery (P < .001, ω2 = .016).
Preoperative SANE score did not predict 1-year postoperative VAS pain score or ASES Function score. In addition, when our complete model was run with 1-year postoperative SANE score as the dependent variable, preoperative SANE score did not predict 1-year postoperative SANE score. Our data provide no supporting evidence for the use of SANE scores for predictive modeling for shoulder arthroplasty.
Discussion
We prospectively gathered data to determine which factors would predict patient subjective outcomes of primary TSA and primary rTSA. We hypothesized that preoperative VR-12 MCS scores and preoperative VAS pain scores would predict postoperative pain and function as measured with those PROMs. Second, we hypothesized that better preoperative mental health (as measured with VR-12 MCS scores) would predict lower postoperative pain (VAS pain scores) and better postoperative function (ASES Function scores). Third, we hypothesized that higher preoperative pain (VAS pain scores) would correlate with higher postoperative pain (VAS pain scores) and worse postoperative function (ASES Function scores).
Our main goal is to provide patients and surgeons with a predictive model that generates insights into what patients can expect after surgery. This model is not intended to be a screening tool for operative indications, but a clinical tool for helping set expectations.
Our results showed that patients with more pain before surgery were more likely to have more pain 1 year after surgery—confirming the hypothesized relationship between pain before and after surgery. Contrary to the hypothesis, however, degree of pain before surgery was not associated with function 1 year after surgery. Our mental health hypothesis was confirmed: Patients with better preoperative mental health scores had on average less pain and better function 1 year after surgery. Not surprisingly, our model demonstrated that patients with better self-reported function before surgery had better self-reported function after surgery. Patient-reported function before surgery did not significantly affect how much pain the patient had 1 year after surgery. Although we did not hypothesize about the role of function in predicting 1-year outcomes, function is a significant factor to be considered when setting patient expectations regarding shoulder arthroplasty outcomes (Table 5).
Table 5.
Although the effect sizes of each analyzed factor are small, together our models for 1-year postoperative pain and function provide significant insight into patients’ likely outcomes 1 year after TSA and rTSA.
Table 6.
Table 7.Table 6 and Table 7 listpreoperative PROMs and baseline characteristics for 2 sample patients and the corresponding 1-year postoperative results they should expect according to our model. Patient 1 (Table 6) achieves a theoretical ASES Total score of 67, and patient 2 (Table 7) achieves a theoretical ASES Total score of 90. During discussion of surgical options, these patients should be counseled differently. If patient 1 expects a “normal” shoulder after surgery, he or she likely will be disappointed with the outcome. Tools such as those provided here can contribute to evidence-based discussions and well-informed decision making.
Many studies have found that mental health correlated with pain and function during recovery from orthopedic trauma.12-18 For example, Wylie and colleagues19 found that preoperative mental health, as measured with the 36-Item Short Form Health Survey (SF-36) MCS score, predicted patient-reported pain and function in the setting of rotator cuff injury, regardless of treatment type (operative, nonoperative). Others have found that mental health may play a role in how patients report their pain and function on various PROMs.20,21 Modalities for improving patients’ emotional health baseline may even become a preoperative requirement as the healthcare industry moves toward value-based medicine and collection of patient-related outcomes as part of reimbursement schemes.
By contrast, some studies have found that preoperative mental health did not predict postoperative outcomes. For example, Kennedy and colleagues22 found that preoperative mental health (as measured with SF-36 MCS scores) did not predict functional outcome in patients with ankle arthritis treated with ankle arthroplasty or arthrodesis. Likewise, Styron and colleagues23 found no correlation between preoperative mental health (SF-12 MCS scores) and postoperative mental health and function in TSA. Their findings contradict those of the present study and many other studies.12-18 The contradiction in findings demonstrates the need for well-designed, sufficiently powered studies of the link between preoperative mental health and postoperative outcome. Our study, with its large sample and heterogeneous population, is a start.
Two other groups (Simmen and colleagues,18 Matsen and colleagues24) have attempted to develop a model predicting outcomes of shoulder arthroplasty. Simmen and colleagues18 estimated the probability of “treatment success” 1 year after TSA. Their model had 4 factors predictive of patient outcomes. Previous shoulder surgery and age over 75 years were significantly associated with lower probability of success, whereas higher preoperative SF-36 MCS scores and higher preoperative DASH (Disabilities of the Arm, Shoulder, and Hand) Function scores were associated with higher probability of success. The authors deemed TSA successful if the patient achieved a Constant score of ≥80 out of 100. Their model predicts probability of TSA “success,” whereas our models predict particular outcome scores. Both their results and ours support the hypothesis that preoperative mental health and function scores can predict how well a patient fares after surgery. Simmen and colleagues18 based their model on a cohort of only 140 patients and reported a 33.6% success rate (47/140 surgeries).
Matsen and colleagues24 used a 1-practice cohort of 337 patients who underwent different types of arthroplasties, including TSA, rTSA, hemiarthroplasty, and ream-and-run arthroplasty. Although their focus was not preoperative PROMs predicting postoperative PROMs, they used the Simple Shoulder Test (SST) baseline score as a predictive variable. They found that 6 baseline characteristics—American Society of Anesthesiologists class I, shoulder problem unrelated to work, no prior shoulder surgery, glenoid type other than A1, humeral head not superiorly displaced on anteroposterior radiograph, and lower baseline SST score—were statistically associated with better outcomes, and they developed a model driven by these characteristics. They urged other investigators to perform the same kind of analysis with larger patient populations from multiple practices. One of the strengths of our study is its large patient population. We collected data on 1004 patients for modeling 1-year postoperative VAS pain scores and 986 patients for modeling 1-year postoperative ASES Function scores.
Our study had several limitations. First, its data came from a 42-surgeon database, and there may be variations in how these surgeons enroll patients in the registry. If some surgeons did not enroll all their surgical patients, our sample could have been subject to selection bias. Second, in developing our model, we used only patient characteristics that were available in the database. On the other hand, the heterogeneity of the surgeon sample lended external validity to the model. A third limitation was that the model always predicts better pain and function outcomes after TSA than after rTSA. In other words, it does not consider whether TSA is appropriate for a particular patient. Instead, it predicts 1-year shoulder arthroplasty outcomes.
Our goal here is not to provide outcomes information or a surgical screening tool, but to report on our use of a simple data-driven tool for setting expectations. When appropriate data become available, tools like this should be expanded to predict longer-term shoulder arthroplasty outcomes. We need more studies that combine preoperative PROMs, more baseline clinical and patient characteristics (following the Matsen and colleagues24 model), and large sample sizes.
Conclusion
The educational models presented here can help patients and surgeons learn what to expect after surgery. These models reveal the value in collecting preoperative subjective PROMs and show how a quantitative tool can help facilitate shared decision-making and set patient expectations. Separately, the effect size of each factor is small, but together a patient’s preoperative VAS pain score, ASES Function score, VR-12 MCS score, age, sex, and type of arthroplasty can provide information predictive of the patient’s self-reported pain and function 1 year after surgery.
References
1. Stacey D, Légaré F, Col NF, et al. Decision aids for people facing health treatment or screening decisions. Cochrane Database Syst Rev. 2014;(1):CD001431.
2. Berliner JL, Brodke DJ, Chan V, SooHoo NF, Bozic KJ. Can preoperative patient-reported outcome measures be used to predict meaningful improvement in function after TKA? Clin Orthop Relat Res. 2017;475(1):149-157.
3. Berliner JL, Brodke DJ, Chan V, SooHoo NF, Bozic KJ. John Charnley award: preoperative patient-reported outcome measures predict clinically meaningful improvement in function after THA. Clin Orthop Relat Res. 2016;474(2):321-329.
4. Wong SE, Zhang AL, Berliner JL, Ma CB, Feeley BT. Preoperative patient-reported scores can predict postoperative outcomes after shoulder arthroplasty. J Shoulder Elbow Surg. 2016;25(6):913-919.
5. Werner BC, Chang B, Nguyen JT, Dines DM, Gulotta LV. What change in American Shoulder and Elbow Surgeons score represents a clinically important change after shoulder arthroplasty? Clin Orthop Relat Res. 2016;474(12):2672-2681.
7. Tashjian RZ, Hung M, Keener JD, et al. Determining the minimal clinically important difference for the American Shoulder and Elbow Surgeons score, Simple Shoulder Test, and visual analog scale (VAS) measuring pain after shoulder arthroplasty. J Shoulder Elbow Surg. 2017;26(1):144-148.
8. Michener LA, McClure PW, Sennett BJ. American Shoulder and Elbow Surgeons Standardized Shoulder Assessment Form, patient self-report section: reliability, validity, and responsiveness. J Shoulder Elbow Surg. 2002;11(6):587-594.
9. Wong SE, Zhang AL, Berliner JL, Ma CB, Feeley BT. Preoperative patient-reported scores can predict postoperative outcomes after shoulder arthroplasty. J Shoulder Elbow Surg. 2016;25(6):913-919.
10. Williams GN, Gangel TJ, Arciero RA, Uhorchak JM, Taylor DC. Comparison of the Single Assessment Numeric Evaluation method and two shoulder rating scales. Outcomes measures after shoulder surgery. Am J Sports Med. 1999;27(2):214-221.
11. Selim AJ, Rogers W, Fleishman JA, et al. Updated U.S. population standard for the Veterans RAND 12-Item Health Survey (VR-12). Qual Life Res. 2009;18(1):43-52.
12. Ayers DC, Franklin PD, Ploutz-Snyder R, Boisvert CB. Total knee replacement outcome and coexisting physical and emotional illness. Clin Orthop Relat Res. 2005;(440):157-161.
13. Ayers DC, Franklin PD, Trief PM, Ploutz-Snyder R, Freund D. Psychological attributes of preoperative total joint replacement patients: implications for optimal physical outcome. J Arthroplasty. 2004;19(7 suppl 2):125-130.
14. Barlow JD, Bishop JY, Dunn WR, Kuhn JE; MOON Shoulder Group. What factors are predictors of emotional health in patients with full-thickness rotator cuff tears? J Shoulder Elbow Surg. 2016;25(11):1769-1773.
15. Gandhi R, Davey JR, Mahomed NN. Predicting patient dissatisfaction following joint replacement surgery. J Rheumatol. 2008;35(12):2415-2418.
16. Parr J, Borsa P, Fillingim R, et al. Psychological influences predict recovery following exercise induced shoulder pain. Int J Sports Med. 2014;35(3):232-237.
18. Simmen BR, Bachmann LM, Drerup S, Schwyzer HK, Burkhart A, Goldhahn J. Development of a predictive model for estimating the probability of treatment success one year after total shoulder replacement—cohort study. Osteoarthritis Cartilage. 2008;16(5):631-634.
19. Wylie JD, Suter T, Potter MQ, Granger EK, Tashjian RZ. Mental health has a stronger association with patient-reported shoulder pain and function than tear size in patients with full-thickness rotator cuff tears. J Bone Joint Surg Am. 2016;98(4):251-256.
20. Potter MQ, Wylie JD, Greis PE, Burks RT, Tashjian RZ. Psychological distress negatively affects self-assessment of shoulder function in patients with rotator cuff tears. Clin Orthop Relat Res. 2014;472(12):3926-3932.
21. Roh YH, Noh JH, Oh JH, Baek GH, Gong HS. To what degree do shoulder outcome instruments reflect patients’ psychologic distress? Clin Orthop Relat Res. 2012;470(12):3470-3477.
22. Kennedy S, Barske H, Wing K, et al. SF-36 mental component summary (MCS) score does not predict functional outcome after surgery for end-stage ankle arthritis. J Bone Joint Surg Am. 2015;97(20):1702-1707.
23. Styron JF, Higuera CA, Strnad G, Iannotti JP. Greater patient confidence yields greater functional outcomes after primary total shoulder arthroplasty. J Shoulder Elbow Surg. 2015;24(8):1263-1267.
24. Matsen FA, Russ SM, Vu PT, Hsu JE, Lucas RM, Comstock BA. What factors are predictive of patient-reported outcomes? A prospective study of 337 shoulder arthroplasties. Clin Orthop Relat Res. 2016;474(11):2496-2510.
Shared decision-making tools, such as predictive models, can help empower the patient to make decisions for or against surgery equipped with more information about the expected outcome.
There is a role for preoperative collection of PROMs in the clinical decision-making process.
Mental health state, as reported by the VR-12 MCS, is a significant predictor of postoperative pain and function as reported by the VAS pain and ASES function scores.
A significant portion of the predictive ability of this model comes from the fact that at 1-year postoperatively, patients receiving a rTSA will on average have a 3.8 point lower on ASES function score than those receiving a TSA (P < .001, ω2=.083).
Future studies to discern the role of different modalities to improve a patient’s emotional health preoperatively will be beneficial as the healthcare industry trends toward value based medicine collecting PROMs as part of reimbursement schemes.
Over the past few decades, decisions regarding patients’ care have gradually transitioned from a paternalistic model to a more cooperative exchange between patient and physician. Shared decision-making provides patients a measure of autonomy in making choices for their health and their future. Patient participation may mitigate uncertainty and discomfort during selection of a course of treatment, which may lead to increased satisfaction levels after surgery.1 Moreover, shared decision-making may help patients better manage postoperative expectations through evidenced-based discussions of preoperative health levels and their corresponding outcomes. Patient-reported outcome measures (PROMs) use clinically sensitive and specific metrics to evaluate a patient’s self-reported pain, functional ability, and mental state.2 These metrics are useful in setting patient expectations for potential outcomes of treatment options. Use of evidence-based clinical decision-making tools, such as PROM-based predictive models, can facilitate a collaborative decision-making environment for patient and physician. Given the present cost-containment era, and the need for preoperative metrics that can assist in predictive analysis of postoperative improvement, models are clearly valuable.
In attempts to help patients set well-informed and reasonable expectations, physicians have turned to PROMs to facilitate preoperative evidence-based discussions. Although PROMs have been in use for almost 30 years, only recently have they been used to create tools that can aid quantitatively in the surgical decision-making process.2-6 Combining physical examination findings, imaging studies, comorbidities, and quantitative tools, such as this model, may enhance patients’ understanding of their preoperative condition and expected prognosis and thereby guide their surgical decisions.
We conducted a study to determine whether certain preoperative PROMs can predict 1-year postoperative visual analog scale (VAS) pain scores and American Shoulder and Elbow Surgeons (ASES) Function scores in total shoulder arthroplasty (TSA) and reverse TSA (rTSA). We hypothesized that preoperative mental health status as captured by Veterans RAND 12-Item Health Survey (VR-12) mental health component summary (MCS) score and preoperative VAS pain score would predict both VAS pain score and ASES Function score 1 year after surgery. Specifically, we hypothesized that a higher preoperative VR-12 MCS score would predict less pain and better function 1 year after surgery and that a higher preoperative VAS pain score would predict more pain and worse function 1 year after surgery.
Methods
This study was approved by the Institutional Review Board of Partners Healthcare. The study used the Surgical Outcome System (Arthrex), a comprehensive prospective database that stores preoperative and 1-year postoperative patient demographics and TSA-PROM data. Surveys are emailed to all enrolled patients before surgery and 1 year after surgery. As indicated by the Institutional Review Boards of all participating institutions, patients in the Surgical Outcome System have to sign a consent form to permit use of their responses in research.
The database includes patient data from 42 orthopedic surgeons across the United States. All primary TSAs and primary rTSAs in the database were included in this study, regardless of arthroplasty indication. Revisions were excluded. Also excluded were cases in which the 1-year postoperative questionnaire was not completed. Of the 1681 patients eligible for 1-year follow-up, 1225 (73%) completed the 1-year postoperative questionnaire. PROMs used in the study were VAS pain score, ASES Function score, VR-12 MCS score, and Single Assessment Numerical Evaluation (SANE). Unfortunately, not all surgeons use every measure in the 1-year postoperative questionnaire set. Thus, in our complete models, total number of observations was 1004 for modeling 1-year postoperative VAS pain scores and 986 for modeling 1-year postoperative ASES Function scores.
Metrics
On VAS, pain is rated from 0 (no pain) to 10 (pain as bad as it can be). Tashjian and colleagues7 estimated that the minimal clinically important difference (MCID) for postoperative VAS pain scores was 1.4 in a cohort of 326 patients who had TSA, rTSA, or shoulder hemiarthroplasty. ASES Function score is scaled from 0 to 30, with 30 representing best function.8 Wong and colleagues9 identified an MCID of 6.5 for ASES Function scores in a cohort of 107 patients who had TSA or rTSA. SANE ratings range from 0% to 100%, with 100% indicating the patient’s shoulder was totally “normal.”10 VR-12 MCS scores appear on a logarithmic scale, with higher numbers representing better mental health. The population mean estimate for VR-12 MCS scores is 50.1 (SD, 11.49; overall possible range, –2.47 to 76.1).11 Our patient population’s scores ranged from 12.5 to 73.8.
Statistical Analysis
Simple bivariate and multivariate linear regressions were performed to evaluate the predictive value of each of the outlined PROMs. Our complete model controls for patient sex, age, and type of arthroplasty. Categorical variables were dummy-coded. Both 1-year postoperative VAS pain score and 1-year postoperative ASES Function score were investigated as dependent variables. Regression coefficients and P and ω2 values are reported. Omega square represents how much of the variance in an outcome variable a model explains, like R2, and ω2 values can also be calculated for individual factors to see how much variance a given factor accounts for. For a simple relative risk calculation, we divided our cohort into 3 equal-sized groups based on preoperative VR-12 MCS scores and compared the risk that patients with scores in the top third (better mental health) would end up below certain ASES Total scores with the risk of patients with scores in the bottom third (worse mental health). All statistical analyses were performed with Stata (StataCorp).
Results
Table 1 lists summary statistics for the population used in these models.
Table 1.Our complete model for predicting VAS pain score 1 year after surgery accounted for 8% of the variability in this pain score (ω2 = .076), whereas our complete model for predicting ASES Function score 1 year after surgery accounted for 22% of the variability (ω2 = .219). These models include preoperative scores for VAS pain, ASES Function, VR-12 MCS, SANE, age at time of surgery, sex, and type of arthroplasty as possible explanatory variables.
Table 2.Predicting VAS Pain Score (Table 2)
Preoperative VAS pain score and VR-12 MCS score both predicted 1-year postoperative VAS pain score (P < .001). Preoperative ASES Function score did not predict pain 1 year after surgery. By contrast, higher preoperative VAS pain scores were associated with higher VAS pain scores 1 year after surgery. Higher preoperative VR-12 MCS scores were significantly associated with lower VAS pain scores 1 year after surgery, indicating that better preoperative mental health is significantly associated with better self-reported outcomes in terms of pain 1 year after surgery. These associations remained statistically significant when controlling for age at time of surgery, sex, and type of arthroplasty.
Preoperative VR-12 MCS score was more predictive of 1-year postoperative VAS pain score than preoperative VAS pain score was. In other words, preoperative VR-12 MCS score accounted for more variability in outcome for 1-year postoperative VAS pain score (2.4%; ω2 = .023) than preoperative VAS pain score did (1.6%; ω2 = .015).
Table 3.Predicting ASES Function Score (Table 3)
By contrast, preoperative VAS pain score did not predict 1-year postoperative ASES Function score. Preoperative ASES Function and VR-12 MCS scores both predicted 1-year postoperative ASES Function score (P < .001). Higher preoperative ASES Function scores were associated with higher 1-year postoperative ASES Function scores. In other words, reporting better shoulder function before surgery was associated with reporting better shoulder function after surgery.
An example gives a sense of the effect size associated with the coefficient for preoperative ASES Function score. Our model predicts that, compared with a patient who reports 5 points lower on preoperative ASES Function (which ranges from 0-30), a patient who reports 5 points higher will report on average about 1 point higher on 1-year postoperative ASES Function. As in the model for postoperative pain, these associations with preoperative function and mental health scores held when controlling for age, sex, and type of arthroplasty.
As in the postoperative pain model, preoperative VR-12 MCS score was more predictive of 1-year postoperative ASES Function score than preoperative ASES Function score was. Preoperative VR-12 MCS score accounted for more of the variation that our model predicts (ω2 = .029) than preoperative ASES Function score did (ω2 = .020). We compared the risk that patients with high preoperative VR-12 MCS scores (top third of cohort) would end up with ASES Total scores below 70, below 80, or below 90 with the risk of patients with low preoperative VR-12 MCS scores (bottom third). Results appear in Table 4.
Table 4.
A significant part of the predictive ability of our model for postoperative ASES Function scores stems from the fact that a patient who undergoes rTSA (vs TSA) is predicted to have an ASES Function score 3.8 points lower 1 year after surgery (P < .001, ω2 = .083). With type of arthroplasty controlled for, female sex is associated with an ASES Function score 1.6 points lower 1 year after surgery (P < .001, ω2 = .016).
Preoperative SANE score did not predict 1-year postoperative VAS pain score or ASES Function score. In addition, when our complete model was run with 1-year postoperative SANE score as the dependent variable, preoperative SANE score did not predict 1-year postoperative SANE score. Our data provide no supporting evidence for the use of SANE scores for predictive modeling for shoulder arthroplasty.
Discussion
We prospectively gathered data to determine which factors would predict patient subjective outcomes of primary TSA and primary rTSA. We hypothesized that preoperative VR-12 MCS scores and preoperative VAS pain scores would predict postoperative pain and function as measured with those PROMs. Second, we hypothesized that better preoperative mental health (as measured with VR-12 MCS scores) would predict lower postoperative pain (VAS pain scores) and better postoperative function (ASES Function scores). Third, we hypothesized that higher preoperative pain (VAS pain scores) would correlate with higher postoperative pain (VAS pain scores) and worse postoperative function (ASES Function scores).
Our main goal is to provide patients and surgeons with a predictive model that generates insights into what patients can expect after surgery. This model is not intended to be a screening tool for operative indications, but a clinical tool for helping set expectations.
Our results showed that patients with more pain before surgery were more likely to have more pain 1 year after surgery—confirming the hypothesized relationship between pain before and after surgery. Contrary to the hypothesis, however, degree of pain before surgery was not associated with function 1 year after surgery. Our mental health hypothesis was confirmed: Patients with better preoperative mental health scores had on average less pain and better function 1 year after surgery. Not surprisingly, our model demonstrated that patients with better self-reported function before surgery had better self-reported function after surgery. Patient-reported function before surgery did not significantly affect how much pain the patient had 1 year after surgery. Although we did not hypothesize about the role of function in predicting 1-year outcomes, function is a significant factor to be considered when setting patient expectations regarding shoulder arthroplasty outcomes (Table 5).
Table 5.
Although the effect sizes of each analyzed factor are small, together our models for 1-year postoperative pain and function provide significant insight into patients’ likely outcomes 1 year after TSA and rTSA.
Table 6.
Table 7.Table 6 and Table 7 listpreoperative PROMs and baseline characteristics for 2 sample patients and the corresponding 1-year postoperative results they should expect according to our model. Patient 1 (Table 6) achieves a theoretical ASES Total score of 67, and patient 2 (Table 7) achieves a theoretical ASES Total score of 90. During discussion of surgical options, these patients should be counseled differently. If patient 1 expects a “normal” shoulder after surgery, he or she likely will be disappointed with the outcome. Tools such as those provided here can contribute to evidence-based discussions and well-informed decision making.
Many studies have found that mental health correlated with pain and function during recovery from orthopedic trauma.12-18 For example, Wylie and colleagues19 found that preoperative mental health, as measured with the 36-Item Short Form Health Survey (SF-36) MCS score, predicted patient-reported pain and function in the setting of rotator cuff injury, regardless of treatment type (operative, nonoperative). Others have found that mental health may play a role in how patients report their pain and function on various PROMs.20,21 Modalities for improving patients’ emotional health baseline may even become a preoperative requirement as the healthcare industry moves toward value-based medicine and collection of patient-related outcomes as part of reimbursement schemes.
By contrast, some studies have found that preoperative mental health did not predict postoperative outcomes. For example, Kennedy and colleagues22 found that preoperative mental health (as measured with SF-36 MCS scores) did not predict functional outcome in patients with ankle arthritis treated with ankle arthroplasty or arthrodesis. Likewise, Styron and colleagues23 found no correlation between preoperative mental health (SF-12 MCS scores) and postoperative mental health and function in TSA. Their findings contradict those of the present study and many other studies.12-18 The contradiction in findings demonstrates the need for well-designed, sufficiently powered studies of the link between preoperative mental health and postoperative outcome. Our study, with its large sample and heterogeneous population, is a start.
Two other groups (Simmen and colleagues,18 Matsen and colleagues24) have attempted to develop a model predicting outcomes of shoulder arthroplasty. Simmen and colleagues18 estimated the probability of “treatment success” 1 year after TSA. Their model had 4 factors predictive of patient outcomes. Previous shoulder surgery and age over 75 years were significantly associated with lower probability of success, whereas higher preoperative SF-36 MCS scores and higher preoperative DASH (Disabilities of the Arm, Shoulder, and Hand) Function scores were associated with higher probability of success. The authors deemed TSA successful if the patient achieved a Constant score of ≥80 out of 100. Their model predicts probability of TSA “success,” whereas our models predict particular outcome scores. Both their results and ours support the hypothesis that preoperative mental health and function scores can predict how well a patient fares after surgery. Simmen and colleagues18 based their model on a cohort of only 140 patients and reported a 33.6% success rate (47/140 surgeries).
Matsen and colleagues24 used a 1-practice cohort of 337 patients who underwent different types of arthroplasties, including TSA, rTSA, hemiarthroplasty, and ream-and-run arthroplasty. Although their focus was not preoperative PROMs predicting postoperative PROMs, they used the Simple Shoulder Test (SST) baseline score as a predictive variable. They found that 6 baseline characteristics—American Society of Anesthesiologists class I, shoulder problem unrelated to work, no prior shoulder surgery, glenoid type other than A1, humeral head not superiorly displaced on anteroposterior radiograph, and lower baseline SST score—were statistically associated with better outcomes, and they developed a model driven by these characteristics. They urged other investigators to perform the same kind of analysis with larger patient populations from multiple practices. One of the strengths of our study is its large patient population. We collected data on 1004 patients for modeling 1-year postoperative VAS pain scores and 986 patients for modeling 1-year postoperative ASES Function scores.
Our study had several limitations. First, its data came from a 42-surgeon database, and there may be variations in how these surgeons enroll patients in the registry. If some surgeons did not enroll all their surgical patients, our sample could have been subject to selection bias. Second, in developing our model, we used only patient characteristics that were available in the database. On the other hand, the heterogeneity of the surgeon sample lended external validity to the model. A third limitation was that the model always predicts better pain and function outcomes after TSA than after rTSA. In other words, it does not consider whether TSA is appropriate for a particular patient. Instead, it predicts 1-year shoulder arthroplasty outcomes.
Our goal here is not to provide outcomes information or a surgical screening tool, but to report on our use of a simple data-driven tool for setting expectations. When appropriate data become available, tools like this should be expanded to predict longer-term shoulder arthroplasty outcomes. We need more studies that combine preoperative PROMs, more baseline clinical and patient characteristics (following the Matsen and colleagues24 model), and large sample sizes.
Conclusion
The educational models presented here can help patients and surgeons learn what to expect after surgery. These models reveal the value in collecting preoperative subjective PROMs and show how a quantitative tool can help facilitate shared decision-making and set patient expectations. Separately, the effect size of each factor is small, but together a patient’s preoperative VAS pain score, ASES Function score, VR-12 MCS score, age, sex, and type of arthroplasty can provide information predictive of the patient’s self-reported pain and function 1 year after surgery.
Take-Home Points
Shared decision-making tools, such as predictive models, can help empower the patient to make decisions for or against surgery equipped with more information about the expected outcome.
There is a role for preoperative collection of PROMs in the clinical decision-making process.
Mental health state, as reported by the VR-12 MCS, is a significant predictor of postoperative pain and function as reported by the VAS pain and ASES function scores.
A significant portion of the predictive ability of this model comes from the fact that at 1-year postoperatively, patients receiving a rTSA will on average have a 3.8 point lower on ASES function score than those receiving a TSA (P < .001, ω2=.083).
Future studies to discern the role of different modalities to improve a patient’s emotional health preoperatively will be beneficial as the healthcare industry trends toward value based medicine collecting PROMs as part of reimbursement schemes.
Over the past few decades, decisions regarding patients’ care have gradually transitioned from a paternalistic model to a more cooperative exchange between patient and physician. Shared decision-making provides patients a measure of autonomy in making choices for their health and their future. Patient participation may mitigate uncertainty and discomfort during selection of a course of treatment, which may lead to increased satisfaction levels after surgery.1 Moreover, shared decision-making may help patients better manage postoperative expectations through evidenced-based discussions of preoperative health levels and their corresponding outcomes. Patient-reported outcome measures (PROMs) use clinically sensitive and specific metrics to evaluate a patient’s self-reported pain, functional ability, and mental state.2 These metrics are useful in setting patient expectations for potential outcomes of treatment options. Use of evidence-based clinical decision-making tools, such as PROM-based predictive models, can facilitate a collaborative decision-making environment for patient and physician. Given the present cost-containment era, and the need for preoperative metrics that can assist in predictive analysis of postoperative improvement, models are clearly valuable.
In attempts to help patients set well-informed and reasonable expectations, physicians have turned to PROMs to facilitate preoperative evidence-based discussions. Although PROMs have been in use for almost 30 years, only recently have they been used to create tools that can aid quantitatively in the surgical decision-making process.2-6 Combining physical examination findings, imaging studies, comorbidities, and quantitative tools, such as this model, may enhance patients’ understanding of their preoperative condition and expected prognosis and thereby guide their surgical decisions.
We conducted a study to determine whether certain preoperative PROMs can predict 1-year postoperative visual analog scale (VAS) pain scores and American Shoulder and Elbow Surgeons (ASES) Function scores in total shoulder arthroplasty (TSA) and reverse TSA (rTSA). We hypothesized that preoperative mental health status as captured by Veterans RAND 12-Item Health Survey (VR-12) mental health component summary (MCS) score and preoperative VAS pain score would predict both VAS pain score and ASES Function score 1 year after surgery. Specifically, we hypothesized that a higher preoperative VR-12 MCS score would predict less pain and better function 1 year after surgery and that a higher preoperative VAS pain score would predict more pain and worse function 1 year after surgery.
Methods
This study was approved by the Institutional Review Board of Partners Healthcare. The study used the Surgical Outcome System (Arthrex), a comprehensive prospective database that stores preoperative and 1-year postoperative patient demographics and TSA-PROM data. Surveys are emailed to all enrolled patients before surgery and 1 year after surgery. As indicated by the Institutional Review Boards of all participating institutions, patients in the Surgical Outcome System have to sign a consent form to permit use of their responses in research.
The database includes patient data from 42 orthopedic surgeons across the United States. All primary TSAs and primary rTSAs in the database were included in this study, regardless of arthroplasty indication. Revisions were excluded. Also excluded were cases in which the 1-year postoperative questionnaire was not completed. Of the 1681 patients eligible for 1-year follow-up, 1225 (73%) completed the 1-year postoperative questionnaire. PROMs used in the study were VAS pain score, ASES Function score, VR-12 MCS score, and Single Assessment Numerical Evaluation (SANE). Unfortunately, not all surgeons use every measure in the 1-year postoperative questionnaire set. Thus, in our complete models, total number of observations was 1004 for modeling 1-year postoperative VAS pain scores and 986 for modeling 1-year postoperative ASES Function scores.
Metrics
On VAS, pain is rated from 0 (no pain) to 10 (pain as bad as it can be). Tashjian and colleagues7 estimated that the minimal clinically important difference (MCID) for postoperative VAS pain scores was 1.4 in a cohort of 326 patients who had TSA, rTSA, or shoulder hemiarthroplasty. ASES Function score is scaled from 0 to 30, with 30 representing best function.8 Wong and colleagues9 identified an MCID of 6.5 for ASES Function scores in a cohort of 107 patients who had TSA or rTSA. SANE ratings range from 0% to 100%, with 100% indicating the patient’s shoulder was totally “normal.”10 VR-12 MCS scores appear on a logarithmic scale, with higher numbers representing better mental health. The population mean estimate for VR-12 MCS scores is 50.1 (SD, 11.49; overall possible range, –2.47 to 76.1).11 Our patient population’s scores ranged from 12.5 to 73.8.
Statistical Analysis
Simple bivariate and multivariate linear regressions were performed to evaluate the predictive value of each of the outlined PROMs. Our complete model controls for patient sex, age, and type of arthroplasty. Categorical variables were dummy-coded. Both 1-year postoperative VAS pain score and 1-year postoperative ASES Function score were investigated as dependent variables. Regression coefficients and P and ω2 values are reported. Omega square represents how much of the variance in an outcome variable a model explains, like R2, and ω2 values can also be calculated for individual factors to see how much variance a given factor accounts for. For a simple relative risk calculation, we divided our cohort into 3 equal-sized groups based on preoperative VR-12 MCS scores and compared the risk that patients with scores in the top third (better mental health) would end up below certain ASES Total scores with the risk of patients with scores in the bottom third (worse mental health). All statistical analyses were performed with Stata (StataCorp).
Results
Table 1 lists summary statistics for the population used in these models.
Table 1.Our complete model for predicting VAS pain score 1 year after surgery accounted for 8% of the variability in this pain score (ω2 = .076), whereas our complete model for predicting ASES Function score 1 year after surgery accounted for 22% of the variability (ω2 = .219). These models include preoperative scores for VAS pain, ASES Function, VR-12 MCS, SANE, age at time of surgery, sex, and type of arthroplasty as possible explanatory variables.
Table 2.Predicting VAS Pain Score (Table 2)
Preoperative VAS pain score and VR-12 MCS score both predicted 1-year postoperative VAS pain score (P < .001). Preoperative ASES Function score did not predict pain 1 year after surgery. By contrast, higher preoperative VAS pain scores were associated with higher VAS pain scores 1 year after surgery. Higher preoperative VR-12 MCS scores were significantly associated with lower VAS pain scores 1 year after surgery, indicating that better preoperative mental health is significantly associated with better self-reported outcomes in terms of pain 1 year after surgery. These associations remained statistically significant when controlling for age at time of surgery, sex, and type of arthroplasty.
Preoperative VR-12 MCS score was more predictive of 1-year postoperative VAS pain score than preoperative VAS pain score was. In other words, preoperative VR-12 MCS score accounted for more variability in outcome for 1-year postoperative VAS pain score (2.4%; ω2 = .023) than preoperative VAS pain score did (1.6%; ω2 = .015).
Table 3.Predicting ASES Function Score (Table 3)
By contrast, preoperative VAS pain score did not predict 1-year postoperative ASES Function score. Preoperative ASES Function and VR-12 MCS scores both predicted 1-year postoperative ASES Function score (P < .001). Higher preoperative ASES Function scores were associated with higher 1-year postoperative ASES Function scores. In other words, reporting better shoulder function before surgery was associated with reporting better shoulder function after surgery.
An example gives a sense of the effect size associated with the coefficient for preoperative ASES Function score. Our model predicts that, compared with a patient who reports 5 points lower on preoperative ASES Function (which ranges from 0-30), a patient who reports 5 points higher will report on average about 1 point higher on 1-year postoperative ASES Function. As in the model for postoperative pain, these associations with preoperative function and mental health scores held when controlling for age, sex, and type of arthroplasty.
As in the postoperative pain model, preoperative VR-12 MCS score was more predictive of 1-year postoperative ASES Function score than preoperative ASES Function score was. Preoperative VR-12 MCS score accounted for more of the variation that our model predicts (ω2 = .029) than preoperative ASES Function score did (ω2 = .020). We compared the risk that patients with high preoperative VR-12 MCS scores (top third of cohort) would end up with ASES Total scores below 70, below 80, or below 90 with the risk of patients with low preoperative VR-12 MCS scores (bottom third). Results appear in Table 4.
Table 4.
A significant part of the predictive ability of our model for postoperative ASES Function scores stems from the fact that a patient who undergoes rTSA (vs TSA) is predicted to have an ASES Function score 3.8 points lower 1 year after surgery (P < .001, ω2 = .083). With type of arthroplasty controlled for, female sex is associated with an ASES Function score 1.6 points lower 1 year after surgery (P < .001, ω2 = .016).
Preoperative SANE score did not predict 1-year postoperative VAS pain score or ASES Function score. In addition, when our complete model was run with 1-year postoperative SANE score as the dependent variable, preoperative SANE score did not predict 1-year postoperative SANE score. Our data provide no supporting evidence for the use of SANE scores for predictive modeling for shoulder arthroplasty.
Discussion
We prospectively gathered data to determine which factors would predict patient subjective outcomes of primary TSA and primary rTSA. We hypothesized that preoperative VR-12 MCS scores and preoperative VAS pain scores would predict postoperative pain and function as measured with those PROMs. Second, we hypothesized that better preoperative mental health (as measured with VR-12 MCS scores) would predict lower postoperative pain (VAS pain scores) and better postoperative function (ASES Function scores). Third, we hypothesized that higher preoperative pain (VAS pain scores) would correlate with higher postoperative pain (VAS pain scores) and worse postoperative function (ASES Function scores).
Our main goal is to provide patients and surgeons with a predictive model that generates insights into what patients can expect after surgery. This model is not intended to be a screening tool for operative indications, but a clinical tool for helping set expectations.
Our results showed that patients with more pain before surgery were more likely to have more pain 1 year after surgery—confirming the hypothesized relationship between pain before and after surgery. Contrary to the hypothesis, however, degree of pain before surgery was not associated with function 1 year after surgery. Our mental health hypothesis was confirmed: Patients with better preoperative mental health scores had on average less pain and better function 1 year after surgery. Not surprisingly, our model demonstrated that patients with better self-reported function before surgery had better self-reported function after surgery. Patient-reported function before surgery did not significantly affect how much pain the patient had 1 year after surgery. Although we did not hypothesize about the role of function in predicting 1-year outcomes, function is a significant factor to be considered when setting patient expectations regarding shoulder arthroplasty outcomes (Table 5).
Table 5.
Although the effect sizes of each analyzed factor are small, together our models for 1-year postoperative pain and function provide significant insight into patients’ likely outcomes 1 year after TSA and rTSA.
Table 6.
Table 7.Table 6 and Table 7 listpreoperative PROMs and baseline characteristics for 2 sample patients and the corresponding 1-year postoperative results they should expect according to our model. Patient 1 (Table 6) achieves a theoretical ASES Total score of 67, and patient 2 (Table 7) achieves a theoretical ASES Total score of 90. During discussion of surgical options, these patients should be counseled differently. If patient 1 expects a “normal” shoulder after surgery, he or she likely will be disappointed with the outcome. Tools such as those provided here can contribute to evidence-based discussions and well-informed decision making.
Many studies have found that mental health correlated with pain and function during recovery from orthopedic trauma.12-18 For example, Wylie and colleagues19 found that preoperative mental health, as measured with the 36-Item Short Form Health Survey (SF-36) MCS score, predicted patient-reported pain and function in the setting of rotator cuff injury, regardless of treatment type (operative, nonoperative). Others have found that mental health may play a role in how patients report their pain and function on various PROMs.20,21 Modalities for improving patients’ emotional health baseline may even become a preoperative requirement as the healthcare industry moves toward value-based medicine and collection of patient-related outcomes as part of reimbursement schemes.
By contrast, some studies have found that preoperative mental health did not predict postoperative outcomes. For example, Kennedy and colleagues22 found that preoperative mental health (as measured with SF-36 MCS scores) did not predict functional outcome in patients with ankle arthritis treated with ankle arthroplasty or arthrodesis. Likewise, Styron and colleagues23 found no correlation between preoperative mental health (SF-12 MCS scores) and postoperative mental health and function in TSA. Their findings contradict those of the present study and many other studies.12-18 The contradiction in findings demonstrates the need for well-designed, sufficiently powered studies of the link between preoperative mental health and postoperative outcome. Our study, with its large sample and heterogeneous population, is a start.
Two other groups (Simmen and colleagues,18 Matsen and colleagues24) have attempted to develop a model predicting outcomes of shoulder arthroplasty. Simmen and colleagues18 estimated the probability of “treatment success” 1 year after TSA. Their model had 4 factors predictive of patient outcomes. Previous shoulder surgery and age over 75 years were significantly associated with lower probability of success, whereas higher preoperative SF-36 MCS scores and higher preoperative DASH (Disabilities of the Arm, Shoulder, and Hand) Function scores were associated with higher probability of success. The authors deemed TSA successful if the patient achieved a Constant score of ≥80 out of 100. Their model predicts probability of TSA “success,” whereas our models predict particular outcome scores. Both their results and ours support the hypothesis that preoperative mental health and function scores can predict how well a patient fares after surgery. Simmen and colleagues18 based their model on a cohort of only 140 patients and reported a 33.6% success rate (47/140 surgeries).
Matsen and colleagues24 used a 1-practice cohort of 337 patients who underwent different types of arthroplasties, including TSA, rTSA, hemiarthroplasty, and ream-and-run arthroplasty. Although their focus was not preoperative PROMs predicting postoperative PROMs, they used the Simple Shoulder Test (SST) baseline score as a predictive variable. They found that 6 baseline characteristics—American Society of Anesthesiologists class I, shoulder problem unrelated to work, no prior shoulder surgery, glenoid type other than A1, humeral head not superiorly displaced on anteroposterior radiograph, and lower baseline SST score—were statistically associated with better outcomes, and they developed a model driven by these characteristics. They urged other investigators to perform the same kind of analysis with larger patient populations from multiple practices. One of the strengths of our study is its large patient population. We collected data on 1004 patients for modeling 1-year postoperative VAS pain scores and 986 patients for modeling 1-year postoperative ASES Function scores.
Our study had several limitations. First, its data came from a 42-surgeon database, and there may be variations in how these surgeons enroll patients in the registry. If some surgeons did not enroll all their surgical patients, our sample could have been subject to selection bias. Second, in developing our model, we used only patient characteristics that were available in the database. On the other hand, the heterogeneity of the surgeon sample lended external validity to the model. A third limitation was that the model always predicts better pain and function outcomes after TSA than after rTSA. In other words, it does not consider whether TSA is appropriate for a particular patient. Instead, it predicts 1-year shoulder arthroplasty outcomes.
Our goal here is not to provide outcomes information or a surgical screening tool, but to report on our use of a simple data-driven tool for setting expectations. When appropriate data become available, tools like this should be expanded to predict longer-term shoulder arthroplasty outcomes. We need more studies that combine preoperative PROMs, more baseline clinical and patient characteristics (following the Matsen and colleagues24 model), and large sample sizes.
Conclusion
The educational models presented here can help patients and surgeons learn what to expect after surgery. These models reveal the value in collecting preoperative subjective PROMs and show how a quantitative tool can help facilitate shared decision-making and set patient expectations. Separately, the effect size of each factor is small, but together a patient’s preoperative VAS pain score, ASES Function score, VR-12 MCS score, age, sex, and type of arthroplasty can provide information predictive of the patient’s self-reported pain and function 1 year after surgery.
References
1. Stacey D, Légaré F, Col NF, et al. Decision aids for people facing health treatment or screening decisions. Cochrane Database Syst Rev. 2014;(1):CD001431.
2. Berliner JL, Brodke DJ, Chan V, SooHoo NF, Bozic KJ. Can preoperative patient-reported outcome measures be used to predict meaningful improvement in function after TKA? Clin Orthop Relat Res. 2017;475(1):149-157.
3. Berliner JL, Brodke DJ, Chan V, SooHoo NF, Bozic KJ. John Charnley award: preoperative patient-reported outcome measures predict clinically meaningful improvement in function after THA. Clin Orthop Relat Res. 2016;474(2):321-329.
4. Wong SE, Zhang AL, Berliner JL, Ma CB, Feeley BT. Preoperative patient-reported scores can predict postoperative outcomes after shoulder arthroplasty. J Shoulder Elbow Surg. 2016;25(6):913-919.
5. Werner BC, Chang B, Nguyen JT, Dines DM, Gulotta LV. What change in American Shoulder and Elbow Surgeons score represents a clinically important change after shoulder arthroplasty? Clin Orthop Relat Res. 2016;474(12):2672-2681.
7. Tashjian RZ, Hung M, Keener JD, et al. Determining the minimal clinically important difference for the American Shoulder and Elbow Surgeons score, Simple Shoulder Test, and visual analog scale (VAS) measuring pain after shoulder arthroplasty. J Shoulder Elbow Surg. 2017;26(1):144-148.
8. Michener LA, McClure PW, Sennett BJ. American Shoulder and Elbow Surgeons Standardized Shoulder Assessment Form, patient self-report section: reliability, validity, and responsiveness. J Shoulder Elbow Surg. 2002;11(6):587-594.
9. Wong SE, Zhang AL, Berliner JL, Ma CB, Feeley BT. Preoperative patient-reported scores can predict postoperative outcomes after shoulder arthroplasty. J Shoulder Elbow Surg. 2016;25(6):913-919.
10. Williams GN, Gangel TJ, Arciero RA, Uhorchak JM, Taylor DC. Comparison of the Single Assessment Numeric Evaluation method and two shoulder rating scales. Outcomes measures after shoulder surgery. Am J Sports Med. 1999;27(2):214-221.
11. Selim AJ, Rogers W, Fleishman JA, et al. Updated U.S. population standard for the Veterans RAND 12-Item Health Survey (VR-12). Qual Life Res. 2009;18(1):43-52.
12. Ayers DC, Franklin PD, Ploutz-Snyder R, Boisvert CB. Total knee replacement outcome and coexisting physical and emotional illness. Clin Orthop Relat Res. 2005;(440):157-161.
13. Ayers DC, Franklin PD, Trief PM, Ploutz-Snyder R, Freund D. Psychological attributes of preoperative total joint replacement patients: implications for optimal physical outcome. J Arthroplasty. 2004;19(7 suppl 2):125-130.
14. Barlow JD, Bishop JY, Dunn WR, Kuhn JE; MOON Shoulder Group. What factors are predictors of emotional health in patients with full-thickness rotator cuff tears? J Shoulder Elbow Surg. 2016;25(11):1769-1773.
15. Gandhi R, Davey JR, Mahomed NN. Predicting patient dissatisfaction following joint replacement surgery. J Rheumatol. 2008;35(12):2415-2418.
16. Parr J, Borsa P, Fillingim R, et al. Psychological influences predict recovery following exercise induced shoulder pain. Int J Sports Med. 2014;35(3):232-237.
18. Simmen BR, Bachmann LM, Drerup S, Schwyzer HK, Burkhart A, Goldhahn J. Development of a predictive model for estimating the probability of treatment success one year after total shoulder replacement—cohort study. Osteoarthritis Cartilage. 2008;16(5):631-634.
19. Wylie JD, Suter T, Potter MQ, Granger EK, Tashjian RZ. Mental health has a stronger association with patient-reported shoulder pain and function than tear size in patients with full-thickness rotator cuff tears. J Bone Joint Surg Am. 2016;98(4):251-256.
20. Potter MQ, Wylie JD, Greis PE, Burks RT, Tashjian RZ. Psychological distress negatively affects self-assessment of shoulder function in patients with rotator cuff tears. Clin Orthop Relat Res. 2014;472(12):3926-3932.
21. Roh YH, Noh JH, Oh JH, Baek GH, Gong HS. To what degree do shoulder outcome instruments reflect patients’ psychologic distress? Clin Orthop Relat Res. 2012;470(12):3470-3477.
22. Kennedy S, Barske H, Wing K, et al. SF-36 mental component summary (MCS) score does not predict functional outcome after surgery for end-stage ankle arthritis. J Bone Joint Surg Am. 2015;97(20):1702-1707.
23. Styron JF, Higuera CA, Strnad G, Iannotti JP. Greater patient confidence yields greater functional outcomes after primary total shoulder arthroplasty. J Shoulder Elbow Surg. 2015;24(8):1263-1267.
24. Matsen FA, Russ SM, Vu PT, Hsu JE, Lucas RM, Comstock BA. What factors are predictive of patient-reported outcomes? A prospective study of 337 shoulder arthroplasties. Clin Orthop Relat Res. 2016;474(11):2496-2510.
The authors have developed a total shoulder glenoid prosthesis that conforms with the humeral head in its center and is nonconforming on its peripheral edge.
All clinical survey and range of motion parameters demonstrated statistically significant improvements at final follow-up.
Only 3 shoulders (1.7%) required revision surgery.
Eighty-six (63%) of 136 shoulders demonstrated no radiographic evidence of glenoid loosening.
This is the first and largest study that evaluates the clinical and radiographic outcomes of this hybrid shoulder prosthesis.
Fixation of the glenoid component is the limiting factor in modern total shoulder arthroplasty (TSA). Glenoid loosening, the most common long-term complication, necessitates revision in up to 12% of patients.1-4 By contrast, humeral component loosening is relatively uncommon, affecting as few as 0.34% of patients.5 Multiple long-term studies have found consistently high rates (45%-93%) of radiolucencies around the glenoid component.3,6,7 Although their clinical significance has been debated, radiolucencies around the glenoid component raise concern about progressive loss of fixation.
Since TSA was introduced in the 1970s, complications with the glenoid component have been addressed with 2 different designs: conforming (congruent) and nonconforming. In a congruent articulation, the radii of curvature of the glenoid and humeral head components are identical, whereas they differ in a nonconforming model. Joint conformity is inversely related to glenohumeral translation.8 Neer’s original TSA was made congruent in order to limit translation and maximize the contact area. However, this design results in edge loading and a so-called rocking-horse phenomenon, which may lead to glenoid loosening.9-13 Surgeons therefore have increasingly turned to nonconforming implants. In the nonconforming design, the radius of curvature of the humeral head is smaller than that of the glenoid. Although this design may reduce edge loading,14 it allows more translation and reduces the relative contact area of the glenohumeral joint. As a result, more contact stress is transmitted to the glenoid component, leading to polyethylene deformation and wear.15,16
Figure 1.A desire to integrate the advantages of the 2 designs led to a novel glenoid implant design with variable conformity. This innovative component has a central conforming region and a peripheral nonconforming region or “translation zone” (Figure 1).
Dual radii of curvature are designed to augment joint stability without increasing component wear. Biomechanical data have indicated that edge loading is not increased by having a central conforming region added to a nonconforming model.17 The clinical value of this prosthesis, however, has not been determined. Therefore, we conducted a study to describe the intermediate-term clinical and radiographic outcomes of TSAs that use a novel hybrid glenoid component.
Materials and Methods
This study was approved (protocol AAAD3473) by the Institutional Review Board of Columbia University and was conducted in compliance with Health Insurance Portability and Accountability Act (HIPAA) regulations.
Patient Selection
At Columbia University Medical Center, Dr. Bigliani performed 196 TSAs with a hybrid glenoid component (Bigliani-Flatow; Zimmer Biomet) in 169 patients between September 1998 and November 2007. All patients had received a diagnosis of primary glenohumeral arthritis as defined by Neer.18 Patients with previous surgery such as rotator cuff repair or subacromial decompression were included in our review, and patients with a nonprimary form of arthritis, such as rheumatoid, posttraumatic, or post-capsulorrhaphy arthritis, were excluded.
Operative Technique
For all surgeries, Dr. Bigliani performed a subscapularis tenotomy with regional anesthesia and a standard deltopectoral approach. A partial anterior capsulectomy was performed to increase the glenoid’s visibility. The inferior labrum was removed with a needle-tip bovie while the axillary nerve was being protected with a metal finger or narrow Darrach retractor. After reaming and trialing, the final glenoid component was cemented into place. Cement was placed only in the peg or keel holes and pressurized twice before final implantation. Of the 196 glenoid components, 168 (86%) were pegged and 28 (14%) keeled; in addition,190 of these components were all-polyethylene, whereas 6 had trabecular-metal backing. All glenoid components incorporated the hybrid design of dual radii of curvature. After the glenoid was cemented, the final humeral component was placed in 30° of retroversion. Whenever posterior wear was found, retroversion was reduced by 5° to 10°. The humeral prosthesis was cemented in cases (104/196, 53%) of poor bone quality or a large canal.
After surgery, the patient’s sling was fitted with an abduction pillow and a swathe, to be worn the first 24 hours, and the arm was passively ranged. Patients typically were discharged on postoperative day 2. Then, for 2 weeks, they followed an assisted passive range of motion (ROM) protocol, with limited external rotation, for promotion of subscapularis healing.
Clinical Outcomes
Dr. Bigliani assessed preoperative ROM in all planes. During initial evaluation, patients completed a questionnaire that consisted of the 36-Item Short Form Health Survey19,20 (SF-36) and the American Shoulder and Elbow Surgeons21 (ASES) and Simple Shoulder Test22 (SST) surveys. Postoperative clinical data were collected from office follow-up visits, survey questionnaires, or both. Postoperative office data included ROM, subscapularis integrity testing (belly-press or lift-off), and any complications. Patients with <1 year of office follow-up were excluded. In addition, the same survey questionnaire that was used before surgery was mailed to all patients after surgery; then, for anyone who did not respond by mail, we attempted contact by telephone. Neer criteria were based on patients’ subjective assessment of each arm on a 3-point Likert scale (1 = very satisfied, 2 = satisfied, 3 = dissatisfied). Patients were also asked about any specific complications or revision operations since their index procedure.
Physical examination and office follow-up data were obtained for 129 patients (148/196 shoulders, 76% follow-up) at a mean of 3.7 years (range 1.0-10.2 years) after surgery. Surveys were completed by 117 patients (139/196 shoulders, 71% follow-up) at a mean of 5.1 years (range, 1.6-11.2 years) after surgery. Only 15 patients had neither 1 year of office follow-up nor a completed questionnaire. The remaining 154 patients (178/196 shoulders, 91% follow-up) had clinical follow-up with office, mail, or telephone questionnaire at a mean of 4.8 years (range, 1.0-11.2 years) after surgery. This cohort of patients was used to determine rates of surgical revisions, subscapularis tears, dislocations, and other complications.
Figure 2.Acromioplasty, performed in TSA patients who had subacromial impingement stemming from improved ROM, represented a second operation, and therefore the need for this surgery was deemed a complication as well. Figure 2 breaks down the 4 major study cohorts.
Radiographic Outcomes
Patients were included in the radiographic analysis if they had a shoulder radiograph at least 1 year after surgery. One hundred nineteen patients (136/196 shoulders, 69% follow-up) had radiographic follow-up at a mean of 3.7 years (range, 1.0-9.4 years) after surgery.
Table 1.All radiographs were independently assessed by 2 blinded physicians who were not involved in the index procedure. Any disputed radiographs were reassessed by these physicians together, until consensus was reached. Radiographs were reviewed for the presence of glenoid lucencies around the pegs or keel and were scored using the system of Lazarus and colleagues23 (Table 1). The humerus was assessed for total number of lucent lines in any of 8 periprosthetic zones, as described by Sperling and colleagues.24
Statistical Analysis
Statistical analysis was performed with Stata Version 10.0. Paired t tests were used to compare preoperative and postoperative numerical data, including ROM and survey scores. We calculated 95% confidence intervals (CIs) and set statistical significance at P < .05. For qualitative measures, the Fisher exact test was used. Survivorship analysis was performed according to the Kaplan-Meier method, with right-censored data for no event or missing data.25
Results
Clinical Analysis of Demographics
In demographics, the clinical and radiographic patient subgroups were similar to each other and to the overall study population (Table 2). Of 196 patients overall, 16 (8%) had a concomitant rotator cuff repair, and 27 (14%) underwent staged bilateral shoulder arthroplasties.
Table 2.
Clinical Analysis of ROM and Survey Scores
Operative shoulder ROM in forward elevation, external rotation at side, external rotation in abduction, and internal rotation all showed statistically significant (P < .001) improvement from before surgery to after surgery. Over 3.7 years, mean (SD) forward elevation improved from 107.3° (34.8°) to 159.0° (29.4°), external rotation at side improved from 20.4° (16.7°) to 49.4° (11.3°), and external rotation in abduction improved from 53.7° (24.3°) to 84.7° (9.1°). Internal rotation improved from a mean (SD) vertebral level of S1 (6.0 levels) to T9 (3.7 levels).
All validated survey scores also showed statistically significant (P < .001) improvement from before surgery to after surgery. Over 5.1 years, mean (SD) SF-36 scores improved from 64.9 (13.4) to 73.6 (17.1), ASES scores improved from 41.1 (22.5) to 82.7 (17.7), SST scores improved from 3.9 (2.8) to 9.7 (2.2), and visual analog scale pain scores improved from 5.6 (3.2) to 1.4 (2.1). Of 139 patients with follow-up, 130 (93.5%) were either satisfied or very satisfied with their TSA, and only 119 (86%) were either satisfied or very satisfied with the nonoperative shoulder.
Clinical Analysis of Postoperative Complications
Of the 178 shoulders evaluated for complications, 3 (1.7%) underwent revision surgery. Mean time to revision was 2.3 years (range, 1.5-3.9 years). Two revisions involved the glenoid component, and the third involved the humerus. In one of the glenoid cases, a 77-year-old woman fell and sustained a fracture at the base of the trabecular metal glenoid pegs; her component was revised to an all-polyethylene component, and she had no further complications. In the other glenoid case, a 73-year-old man’s all-polyethylene component loosened after 2 years and was revised to a trabecular metal implant, which loosened as well and was later converted to a hemiarthroplasty. In the humeral case, a 33-year-old man had his 4-year-old index TSA revised to a cemented stem and had no further complications.
Table 3.Of the 148 patients with office follow-up, only 8 had a positive belly-press or lift-off test. Of all 178 clinical study shoulders, 10 (5.6%) had a subscapularis tear confirmed by magnetic resonance imaging or a physician. Of these 10 tears, 3 resulted from traumatic falls. Four of the 10 tears were managed nonoperatively, and the other 6 underwent surgical repair at a mean of 2.9 years (range, 0.3-7.8 years) after index TSA. In 2 of the 6 repair cases, a 46-mm humeral head had been used, and, in the other 4 cases, a 52-mm humeral head. Of the 6 repaired tears, 2 were massive, and 4 were isolated to the subscapularis. None of these 6 tears required a second repair. Seven (4%) of the 178 shoulders experienced a clinically significant posterosuperior subluxation or dislocation; 5 of the 7 were managed nonoperatively, and the other 2 underwent open capsular shift, at 0.5 year and 3.0 years, respectively. Table 3 lists the other postoperative complications that required surgery.
Table 4.
Table 4 compares the clinical and radiographic outcomes of patients who required subscapularis repair, capsular shift, or implant revision with the outcomes of all other study patients, and Figure 3 shows Kaplan-Meier survivorship.
Figure 3.
Postoperative Radiographic Analysis
Glenoid Component. At a mean of 3.7 years (minimum, 1 year) after surgery, 86 (63%) of 136 radiographically evaluated shoulders showed no glenoid lucencies; the other 50 (37%) showed ≥1 lucency. Of the 136 shoulders, 33 (24%) had a Lazarus score of 1, 15 (11%) had a score of 2, and only 2 (2%) had a score of 3. None of the shoulders had a score of 4 or 5.
Humeral Component. Of the 136 shoulders, 91 (67%) showed no lucencies in any of the 8 humeral stem zones; the other 45 (33%) showed 1 to 3 lucencies. Thirty (22%) of the 136 shoulders had 1 stem lucency zone, 8 (6%) had 2, and 3 (2%) had 3. None of the shoulders had >3 periprosthetic zones with lucent lines.
Discussion
In this article, we describe a hybrid glenoid TSA component with dual radii of curvature. Its central portion is congruent with the humeral head, and its peripheral portion is noncongruent and larger. The most significant finding of our study is the low rate (1.1%) of glenoid component revision 4.8 years after surgery. This rate is the lowest that has been reported in a study of ≥100 patients. Overall implant survival appeared as an almost flat Kaplan-Meir curve. We attribute this low revision rate to improved biomechanics with the hybrid glenoid design.
Symptomatic glenoid component loosening is the most common TSA complication.1,26-28 In a review of 73 Neer TSAs, Cofield7 found glenoid radiolucencies in 71% of patients 3.8 years after surgery. Radiographic evidence of loosening, defined as component migration, or tilt, or a circumferential lucency 1.5 mm thick, was present in another 11% of patients, and 4.1% developed symptomatic loosening that required glenoid revision. In a study with 12.2-year follow-up, Torchia and colleagues3 found rates of 84% for glenoid radiolucencies, 44% for radiographic loosening, and 5.6% for symptomatic loosening that required revision. In a systematic review of studies with follow-up of ≥10 years, Bohsali and colleagues27 found similar lucency and radiographic loosening rates and a 7% glenoid revision rate. These data suggest glenoid radiolucencies may progress to component loosening.
Degree of joint congruence is a key factor in glenoid loosening. Neer’s congruent design increases the contact area with concentric loading and reduces glenohumeral translation, which leads to reduced polyethylene wear and improved joint stability. In extreme arm positions, however, humeral head subluxation results in edge loading and a glenoid rocking-horse effect.9-13,17,29-31 Conversely, nonconforming implants allow increased glenohumeral translation without edge loading,14 though they also reduce the relative glenohumeral contact area and thus transmit more contact stress to the glenoid.16,17 A hybrid glenoid component with central conforming and peripheral nonconforming zones may reduce the rocking-horse effect while maximizing ROM and joint stability. Wang and colleagues32 studied the biomechanical properties of this glenoid design and found that the addition of a central conforming region did not increase edge loading.
Additional results from our study support the efficacy of a hybrid glenoid component. Patients’ clinical outcomes improved significantly. At 5.1 years after surgery, 93.5% of patients were satisfied or very satisfied with their procedure and reported less satisfaction (86%) with the nonoperative shoulder. Also significant was the reduced number of radiolucencies. At 3.7 years after surgery, the overall percentage of shoulders with ≥1 glenoid radiolucency was 37%, considerably lower than the 82% reported by Cofield7 and the rates in more recent studies.3,16,33-36 Of the 178 shoulders in our study, 10 (5.6%) had subscapularis tears, and 6 (3.4%) of 178 had these tears surgically repaired. This 3.4% compares favorably with the 5.9% (of 119 patients) found by Miller and colleagues37 28 months after surgery. Of our 178 shoulders, 27 (15.2%) had clinically significant postoperative complications; 18 (10.1%) of the 178 had these complications surgically treated, and 9 (5.1%) had them managed nonoperatively. Bohsali and colleagues27 systematically reviewed 33 TSA studies and found a slightly higher complication rate (16.3%) 5.3 years after surgery. Furthermore, in our study, the 11 patients who underwent revision, capsular shift, or subscapularis repair had final outcomes comparable to those of the rest of our study population.
Our study had several potential weaknesses. First, its minimum clinical and radiographic follow-up was 1 year, whereas most long-term TSA series set a minimum of 2 years. We used 1 year because this was the first clinical study of the hybrid glenoid component design, and we wanted to maximize its sample size by reporting on intermediate-length outcomes. Even so, 93% (166/178) of our clinical patients and 83% (113/136) of our radiographic patients have had ≥2 years of follow-up, and we continue to follow all study patients for long-term outcomes. Another weakness of the study was its lack of a uniform group of patients with all the office, survey, complications, and radiographic data. Our retrospective study design made it difficult to obtain such a group without significantly reducing the sample size, so we divided patients into 4 data groups. A third potential weakness was the study’s variable method for collecting complications data. Rates of complications in the 178 shoulders were calculated from either office evaluation or patient self-report by mail or telephone. This data collection method is subject to recall bias, but mail and telephone contact was needed so the study would capture the large number of patients who had traveled to our institution for their surgery or had since moved away. Fourth, belly-press and lift-off tests were used in part to assess subscapularis function, but recent literature suggests post-TSA subscapularis assessment can be unreliable.38 These tests may be positive in up to two-thirds of patients after 2 years.39 Fifth, the generalizability of our findings to diagnoses such as rheumatoid and posttraumatic arthritis is limited. We had to restrict the study to patients with primary glenohumeral arthritis in order to minimize confounders.
This study’s main strength is its description of the clinical and radiographic outcomes of using a single prosthetic system in operations performed by a single surgeon in a large number of patients. This was the first and largest study evaluating the clinical and radiographic outcomes of this hybrid glenoid implant. Excluding patients with nonprimary arthritis allowed us to minimize potential confounding factors that affect patient outcomes. In conclusion, our study results showed the favorable clinical and radiographic outcomes of TSAs that have a hybrid glenoid component with dual radii of curvature. At a mean of 3.7 years after surgery, 63% of patients had no glenoid lucencies, and, at a mean of 4.8 years, only 1.7% of patients required revision. We continue to follow these patients to obtain long-term results of this innovative prosthesis.
References
1. Rodosky MW, Bigliani LU. Indications for glenoid resurfacing in shoulder arthroplasty. J Shoulder Elbow Surg. 1996;5(3):231-248.
2. Boyd AD Jr, Thomas WH, Scott RD, Sledge CB, Thornhill TS. Total shoulder arthroplasty versus hemiarthroplasty. Indications for glenoid resurfacing. J Arthroplasty. 1990;5(4):329-336.
3. Torchia ME, Cofield RH, Settergren CR. Total shoulder arthroplasty with the Neer prosthesis: long-term results. J Shoulder Elbow Surg. 1997;6(6):495-505.
4. Iannotti JP, Norris TR. Influence of preoperative factors on outcome of shoulder arthroplasty for glenohumeral osteoarthritis. J Bone Joint Surg Am. 2003;85(2):251-258.
5. Cofield RH. Degenerative and arthritic problems of the glenohumeral joint. In: Rockwood CA, Matsen FA, eds. The Shoulder. Philadelphia, PA: Saunders; 1990:740-745.
6. Neer CS 2nd, Watson KC, Stanton FJ. Recent experience in total shoulder replacement. J Bone Joint Surg Am. 1982;64(3):319-337.
7. Cofield RH. Total shoulder arthroplasty with the Neer prosthesis. J Bone Joint Surg Am. 1984;66(6):899-906.
8. Karduna AR, Williams GR, Williams JL, Iannotti JP. Kinematics of the glenohumeral joint: influences of muscle forces, ligamentous constraints, and articular geometry. J Orthop Res. 1996;14(6):986-993.
9. Karduna AR, Williams GR, Iannotti JP, Williams JL. Total shoulder arthroplasty biomechanics: a study of the forces and strains at the glenoid component. J Biomech Eng. 1998;120(1):92-99.
10. Karduna AR, Williams GR, Williams JL, Iannotti JP. Glenohumeral joint translations before and after total shoulder arthroplasty. A study in cadavera. J Bone Joint Surg Am. 1997;79(8):1166-1174.
11. Matsen FA 3rd, Clinton J, Lynch J, Bertelsen A, Richardson ML. Glenoid component failure in total shoulder arthroplasty. J Bone Joint Surg Am. 2008;90(4):885-896.
12. Franklin JL, Barrett WP, Jackins SE, Matsen FA 3rd. Glenoid loosening in total shoulder arthroplasty. Association with rotator cuff deficiency. J Arthroplasty. 1988;3(1):39-46.
13. Barrett WP, Franklin JL, Jackins SE, Wyss CR, Matsen FA 3rd. Total shoulder arthroplasty. J Bone Joint Surg Am. 1987;69(6):865-872.
14. Harryman DT, Sidles JA, Harris SL, Lippitt SB, Matsen FA 3rd. The effect of articular conformity and the size of the humeral head component on laxity and motion after glenohumeral arthroplasty. A study in cadavera. J Bone Joint Surg Am. 1995;77(4):555-563.
15. Flatow EL. Prosthetic design considerations in total shoulder arthroplasty. Semin Arthroplasty. 1995;6(4):233-244.
16. Klimkiewicz JJ, Iannotti JP, Rubash HE, Shanbhag AS. Aseptic loosening of the humeral component in total shoulder arthroplasty. J Shoulder Elbow Surg. 1998;7(4):422-426.
17. Wang VM, Krishnan R, Ugwonali OF, Flatow EL, Bigliani LU, Ateshian GA. Biomechanical evaluation of a novel glenoid design in total shoulder arthroplasty. J Shoulder Elbow Surg. 2005;14(1 suppl S):129S-140S.
18. Neer CS 2nd. Replacement arthroplasty for glenohumeral osteoarthritis. J Bone Joint Surg Am. 1974;56(1):1-13.
19. Boorman RS, Kopjar B, Fehringer E, Churchill RS, Smith K, Matsen FA 3rd. The effect of total shoulder arthroplasty on self-assessed health status is comparable to that of total hip arthroplasty and coronary artery bypass grafting. J Shoulder Elbow Surg. 2003;12(2):158-163.
20. Patel AA, Donegan D, Albert T. The 36-Item Short Form. J Am Acad Orthop Surg. 2007;15(2):126-134.
21. Richards RR, An KN, Bigliani LU, et al. A standardized method for the assessment of shoulder function. J Shoulder Elbow Surg. 1994;3(6):347-352.
22. Wright RW, Baumgarten KM. Shoulder outcomes measures. J Am Acad Orthop Surg. 2010;18(7):436-444.
23. Lazarus MD, Jensen KL, Southworth C, Matsen FA 3rd. The radiographic evaluation of keeled and pegged glenoid component insertion. J Bone Joint Surg Am. 2002;84(7):1174-1182.
24. Sperling JW, Cofield RH, O’Driscoll SW, Torchia ME, Rowland CM. Radiographic assessment of ingrowth total shoulder arthroplasty. J Shoulder Elbow Surg. 2000;9(6):507-513.
25. Dinse GE, Lagakos SW. Nonparametric estimation of lifetime and disease onset distributions from incomplete observations. Biometrics. 1982;38(4):921-932.
26. Baumgarten KM, Lashgari CJ, Yamaguchi K. Glenoid resurfacing in shoulder arthroplasty: indications and contraindications. Instr Course Lect. 2004;53:3-11.
27. Bohsali KI, Wirth MA, Rockwood CA Jr. Complications of total shoulder arthroplasty. J Bone Joint Surg Am. 2006;88(10):2279-2292.
28. Wirth MA, Rockwood CA Jr. Complications of total shoulder-replacement arthroplasty. J Bone Joint Surg Am. 1996;78(4):603-616.
29. Poppen NK, Walker PS. Normal and abnormal motion of the shoulder. J Bone Joint Surg Am. 1976;58(2):195-201.
30. Cotton RE, Rideout DF. Tears of the humeral rotator cuff; a radiological and pathological necropsy survey. J Bone Joint Surg Br. 1964;46:314-328.
31. Bigliani LU, Kelkar R, Flatow EL, Pollock RG, Mow VC. Glenohumeral stability. Biomechanical properties of passive and active stabilizers. Clin Orthop Relat Res. 1996;(330):13-30.
32. Wang VM, Sugalski MT, Levine WN, Pawluk RJ, Mow VC, Bigliani LU. Comparison of glenohumeral mechanics following a capsular shift and anterior tightening. J Bone Joint Surg Am. 2005;87(6):1312-1322.
33. Young A, Walch G, Boileau P, et al. A multicentre study of the long-term results of using a flat-back polyethylene glenoid component in shoulder replacement for primary osteoarthritis. J Bone Joint Surg Br. 2011;93(2):210-216.
34. Khan A, Bunker TD, Kitson JB. Clinical and radiological follow-up of the Aequalis third-generation cemented total shoulder replacement: a minimum ten-year study. J Bone Joint Surg Br. 2009;91(12):1594-1600.
35. Walch G, Edwards TB, Boulahia A, Boileau P, Mole D, Adeleine P. The influence of glenohumeral prosthetic mismatch on glenoid radiolucent lines: results of a multicenter study. J Bone Joint Surg Am. 2002;84(12):2186-2191.
36. Bartelt R, Sperling JW, Schleck CD, Cofield RH. Shoulder arthroplasty in patients aged fifty-five years or younger with osteoarthritis. J Shoulder Elbow Surg. 2011;20(1):123-130.
37. Miller BS, Joseph TA, Noonan TJ, Horan MP, Hawkins RJ. Rupture of the subscapularis tendon after shoulder arthroplasty: diagnosis, treatment, and outcome. J Shoulder Elbow Surg. 2005;14(5):492-496.
38. Armstrong A, Lashgari C, Teefey S, Menendez J, Yamaguchi K, Galatz LM. Ultrasound evaluation and clinical correlation of subscapularis repair after total shoulder arthroplasty. J Shoulder Elbow Surg. 2006;15(5):541-548.
39. Miller SL, Hazrati Y, Klepps S, Chiang A, Flatow EL. Loss of subscapularis function after total shoulder replacement: a seldom recognized problem. J Shoulder Elbow Surg. 2003;12(1):29-34.
Authors’ Disclosure Statement: Dr. Bigliani reports that he helped design the Zimmer Biomet prosthesis discussed in this article and has received royalties from Zimmer Biomet and Innomed. Columbia University, where Dr. Levine and Dr. Ahmad are employed, receives royalties from Zimmer Biomet, and Dr. Levine reports that he is an unpaid consultant to Zimmer Biomet. The other authors report no actual or potential conflict of interest in relation to this article.
Authors’ Disclosure Statement: Dr. Bigliani reports that he helped design the Zimmer Biomet prosthesis discussed in this article and has received royalties from Zimmer Biomet and Innomed. Columbia University, where Dr. Levine and Dr. Ahmad are employed, receives royalties from Zimmer Biomet, and Dr. Levine reports that he is an unpaid consultant to Zimmer Biomet. The other authors report no actual or potential conflict of interest in relation to this article.
Author and Disclosure Information
Authors’ Disclosure Statement: Dr. Bigliani reports that he helped design the Zimmer Biomet prosthesis discussed in this article and has received royalties from Zimmer Biomet and Innomed. Columbia University, where Dr. Levine and Dr. Ahmad are employed, receives royalties from Zimmer Biomet, and Dr. Levine reports that he is an unpaid consultant to Zimmer Biomet. The other authors report no actual or potential conflict of interest in relation to this article.
The authors have developed a total shoulder glenoid prosthesis that conforms with the humeral head in its center and is nonconforming on its peripheral edge.
All clinical survey and range of motion parameters demonstrated statistically significant improvements at final follow-up.
Only 3 shoulders (1.7%) required revision surgery.
Eighty-six (63%) of 136 shoulders demonstrated no radiographic evidence of glenoid loosening.
This is the first and largest study that evaluates the clinical and radiographic outcomes of this hybrid shoulder prosthesis.
Fixation of the glenoid component is the limiting factor in modern total shoulder arthroplasty (TSA). Glenoid loosening, the most common long-term complication, necessitates revision in up to 12% of patients.1-4 By contrast, humeral component loosening is relatively uncommon, affecting as few as 0.34% of patients.5 Multiple long-term studies have found consistently high rates (45%-93%) of radiolucencies around the glenoid component.3,6,7 Although their clinical significance has been debated, radiolucencies around the glenoid component raise concern about progressive loss of fixation.
Since TSA was introduced in the 1970s, complications with the glenoid component have been addressed with 2 different designs: conforming (congruent) and nonconforming. In a congruent articulation, the radii of curvature of the glenoid and humeral head components are identical, whereas they differ in a nonconforming model. Joint conformity is inversely related to glenohumeral translation.8 Neer’s original TSA was made congruent in order to limit translation and maximize the contact area. However, this design results in edge loading and a so-called rocking-horse phenomenon, which may lead to glenoid loosening.9-13 Surgeons therefore have increasingly turned to nonconforming implants. In the nonconforming design, the radius of curvature of the humeral head is smaller than that of the glenoid. Although this design may reduce edge loading,14 it allows more translation and reduces the relative contact area of the glenohumeral joint. As a result, more contact stress is transmitted to the glenoid component, leading to polyethylene deformation and wear.15,16
Figure 1.A desire to integrate the advantages of the 2 designs led to a novel glenoid implant design with variable conformity. This innovative component has a central conforming region and a peripheral nonconforming region or “translation zone” (Figure 1).
Dual radii of curvature are designed to augment joint stability without increasing component wear. Biomechanical data have indicated that edge loading is not increased by having a central conforming region added to a nonconforming model.17 The clinical value of this prosthesis, however, has not been determined. Therefore, we conducted a study to describe the intermediate-term clinical and radiographic outcomes of TSAs that use a novel hybrid glenoid component.
Materials and Methods
This study was approved (protocol AAAD3473) by the Institutional Review Board of Columbia University and was conducted in compliance with Health Insurance Portability and Accountability Act (HIPAA) regulations.
Patient Selection
At Columbia University Medical Center, Dr. Bigliani performed 196 TSAs with a hybrid glenoid component (Bigliani-Flatow; Zimmer Biomet) in 169 patients between September 1998 and November 2007. All patients had received a diagnosis of primary glenohumeral arthritis as defined by Neer.18 Patients with previous surgery such as rotator cuff repair or subacromial decompression were included in our review, and patients with a nonprimary form of arthritis, such as rheumatoid, posttraumatic, or post-capsulorrhaphy arthritis, were excluded.
Operative Technique
For all surgeries, Dr. Bigliani performed a subscapularis tenotomy with regional anesthesia and a standard deltopectoral approach. A partial anterior capsulectomy was performed to increase the glenoid’s visibility. The inferior labrum was removed with a needle-tip bovie while the axillary nerve was being protected with a metal finger or narrow Darrach retractor. After reaming and trialing, the final glenoid component was cemented into place. Cement was placed only in the peg or keel holes and pressurized twice before final implantation. Of the 196 glenoid components, 168 (86%) were pegged and 28 (14%) keeled; in addition,190 of these components were all-polyethylene, whereas 6 had trabecular-metal backing. All glenoid components incorporated the hybrid design of dual radii of curvature. After the glenoid was cemented, the final humeral component was placed in 30° of retroversion. Whenever posterior wear was found, retroversion was reduced by 5° to 10°. The humeral prosthesis was cemented in cases (104/196, 53%) of poor bone quality or a large canal.
After surgery, the patient’s sling was fitted with an abduction pillow and a swathe, to be worn the first 24 hours, and the arm was passively ranged. Patients typically were discharged on postoperative day 2. Then, for 2 weeks, they followed an assisted passive range of motion (ROM) protocol, with limited external rotation, for promotion of subscapularis healing.
Clinical Outcomes
Dr. Bigliani assessed preoperative ROM in all planes. During initial evaluation, patients completed a questionnaire that consisted of the 36-Item Short Form Health Survey19,20 (SF-36) and the American Shoulder and Elbow Surgeons21 (ASES) and Simple Shoulder Test22 (SST) surveys. Postoperative clinical data were collected from office follow-up visits, survey questionnaires, or both. Postoperative office data included ROM, subscapularis integrity testing (belly-press or lift-off), and any complications. Patients with <1 year of office follow-up were excluded. In addition, the same survey questionnaire that was used before surgery was mailed to all patients after surgery; then, for anyone who did not respond by mail, we attempted contact by telephone. Neer criteria were based on patients’ subjective assessment of each arm on a 3-point Likert scale (1 = very satisfied, 2 = satisfied, 3 = dissatisfied). Patients were also asked about any specific complications or revision operations since their index procedure.
Physical examination and office follow-up data were obtained for 129 patients (148/196 shoulders, 76% follow-up) at a mean of 3.7 years (range 1.0-10.2 years) after surgery. Surveys were completed by 117 patients (139/196 shoulders, 71% follow-up) at a mean of 5.1 years (range, 1.6-11.2 years) after surgery. Only 15 patients had neither 1 year of office follow-up nor a completed questionnaire. The remaining 154 patients (178/196 shoulders, 91% follow-up) had clinical follow-up with office, mail, or telephone questionnaire at a mean of 4.8 years (range, 1.0-11.2 years) after surgery. This cohort of patients was used to determine rates of surgical revisions, subscapularis tears, dislocations, and other complications.
Figure 2.Acromioplasty, performed in TSA patients who had subacromial impingement stemming from improved ROM, represented a second operation, and therefore the need for this surgery was deemed a complication as well. Figure 2 breaks down the 4 major study cohorts.
Radiographic Outcomes
Patients were included in the radiographic analysis if they had a shoulder radiograph at least 1 year after surgery. One hundred nineteen patients (136/196 shoulders, 69% follow-up) had radiographic follow-up at a mean of 3.7 years (range, 1.0-9.4 years) after surgery.
Table 1.All radiographs were independently assessed by 2 blinded physicians who were not involved in the index procedure. Any disputed radiographs were reassessed by these physicians together, until consensus was reached. Radiographs were reviewed for the presence of glenoid lucencies around the pegs or keel and were scored using the system of Lazarus and colleagues23 (Table 1). The humerus was assessed for total number of lucent lines in any of 8 periprosthetic zones, as described by Sperling and colleagues.24
Statistical Analysis
Statistical analysis was performed with Stata Version 10.0. Paired t tests were used to compare preoperative and postoperative numerical data, including ROM and survey scores. We calculated 95% confidence intervals (CIs) and set statistical significance at P < .05. For qualitative measures, the Fisher exact test was used. Survivorship analysis was performed according to the Kaplan-Meier method, with right-censored data for no event or missing data.25
Results
Clinical Analysis of Demographics
In demographics, the clinical and radiographic patient subgroups were similar to each other and to the overall study population (Table 2). Of 196 patients overall, 16 (8%) had a concomitant rotator cuff repair, and 27 (14%) underwent staged bilateral shoulder arthroplasties.
Table 2.
Clinical Analysis of ROM and Survey Scores
Operative shoulder ROM in forward elevation, external rotation at side, external rotation in abduction, and internal rotation all showed statistically significant (P < .001) improvement from before surgery to after surgery. Over 3.7 years, mean (SD) forward elevation improved from 107.3° (34.8°) to 159.0° (29.4°), external rotation at side improved from 20.4° (16.7°) to 49.4° (11.3°), and external rotation in abduction improved from 53.7° (24.3°) to 84.7° (9.1°). Internal rotation improved from a mean (SD) vertebral level of S1 (6.0 levels) to T9 (3.7 levels).
All validated survey scores also showed statistically significant (P < .001) improvement from before surgery to after surgery. Over 5.1 years, mean (SD) SF-36 scores improved from 64.9 (13.4) to 73.6 (17.1), ASES scores improved from 41.1 (22.5) to 82.7 (17.7), SST scores improved from 3.9 (2.8) to 9.7 (2.2), and visual analog scale pain scores improved from 5.6 (3.2) to 1.4 (2.1). Of 139 patients with follow-up, 130 (93.5%) were either satisfied or very satisfied with their TSA, and only 119 (86%) were either satisfied or very satisfied with the nonoperative shoulder.
Clinical Analysis of Postoperative Complications
Of the 178 shoulders evaluated for complications, 3 (1.7%) underwent revision surgery. Mean time to revision was 2.3 years (range, 1.5-3.9 years). Two revisions involved the glenoid component, and the third involved the humerus. In one of the glenoid cases, a 77-year-old woman fell and sustained a fracture at the base of the trabecular metal glenoid pegs; her component was revised to an all-polyethylene component, and she had no further complications. In the other glenoid case, a 73-year-old man’s all-polyethylene component loosened after 2 years and was revised to a trabecular metal implant, which loosened as well and was later converted to a hemiarthroplasty. In the humeral case, a 33-year-old man had his 4-year-old index TSA revised to a cemented stem and had no further complications.
Table 3.Of the 148 patients with office follow-up, only 8 had a positive belly-press or lift-off test. Of all 178 clinical study shoulders, 10 (5.6%) had a subscapularis tear confirmed by magnetic resonance imaging or a physician. Of these 10 tears, 3 resulted from traumatic falls. Four of the 10 tears were managed nonoperatively, and the other 6 underwent surgical repair at a mean of 2.9 years (range, 0.3-7.8 years) after index TSA. In 2 of the 6 repair cases, a 46-mm humeral head had been used, and, in the other 4 cases, a 52-mm humeral head. Of the 6 repaired tears, 2 were massive, and 4 were isolated to the subscapularis. None of these 6 tears required a second repair. Seven (4%) of the 178 shoulders experienced a clinically significant posterosuperior subluxation or dislocation; 5 of the 7 were managed nonoperatively, and the other 2 underwent open capsular shift, at 0.5 year and 3.0 years, respectively. Table 3 lists the other postoperative complications that required surgery.
Table 4.
Table 4 compares the clinical and radiographic outcomes of patients who required subscapularis repair, capsular shift, or implant revision with the outcomes of all other study patients, and Figure 3 shows Kaplan-Meier survivorship.
Figure 3.
Postoperative Radiographic Analysis
Glenoid Component. At a mean of 3.7 years (minimum, 1 year) after surgery, 86 (63%) of 136 radiographically evaluated shoulders showed no glenoid lucencies; the other 50 (37%) showed ≥1 lucency. Of the 136 shoulders, 33 (24%) had a Lazarus score of 1, 15 (11%) had a score of 2, and only 2 (2%) had a score of 3. None of the shoulders had a score of 4 or 5.
Humeral Component. Of the 136 shoulders, 91 (67%) showed no lucencies in any of the 8 humeral stem zones; the other 45 (33%) showed 1 to 3 lucencies. Thirty (22%) of the 136 shoulders had 1 stem lucency zone, 8 (6%) had 2, and 3 (2%) had 3. None of the shoulders had >3 periprosthetic zones with lucent lines.
Discussion
In this article, we describe a hybrid glenoid TSA component with dual radii of curvature. Its central portion is congruent with the humeral head, and its peripheral portion is noncongruent and larger. The most significant finding of our study is the low rate (1.1%) of glenoid component revision 4.8 years after surgery. This rate is the lowest that has been reported in a study of ≥100 patients. Overall implant survival appeared as an almost flat Kaplan-Meir curve. We attribute this low revision rate to improved biomechanics with the hybrid glenoid design.
Symptomatic glenoid component loosening is the most common TSA complication.1,26-28 In a review of 73 Neer TSAs, Cofield7 found glenoid radiolucencies in 71% of patients 3.8 years after surgery. Radiographic evidence of loosening, defined as component migration, or tilt, or a circumferential lucency 1.5 mm thick, was present in another 11% of patients, and 4.1% developed symptomatic loosening that required glenoid revision. In a study with 12.2-year follow-up, Torchia and colleagues3 found rates of 84% for glenoid radiolucencies, 44% for radiographic loosening, and 5.6% for symptomatic loosening that required revision. In a systematic review of studies with follow-up of ≥10 years, Bohsali and colleagues27 found similar lucency and radiographic loosening rates and a 7% glenoid revision rate. These data suggest glenoid radiolucencies may progress to component loosening.
Degree of joint congruence is a key factor in glenoid loosening. Neer’s congruent design increases the contact area with concentric loading and reduces glenohumeral translation, which leads to reduced polyethylene wear and improved joint stability. In extreme arm positions, however, humeral head subluxation results in edge loading and a glenoid rocking-horse effect.9-13,17,29-31 Conversely, nonconforming implants allow increased glenohumeral translation without edge loading,14 though they also reduce the relative glenohumeral contact area and thus transmit more contact stress to the glenoid.16,17 A hybrid glenoid component with central conforming and peripheral nonconforming zones may reduce the rocking-horse effect while maximizing ROM and joint stability. Wang and colleagues32 studied the biomechanical properties of this glenoid design and found that the addition of a central conforming region did not increase edge loading.
Additional results from our study support the efficacy of a hybrid glenoid component. Patients’ clinical outcomes improved significantly. At 5.1 years after surgery, 93.5% of patients were satisfied or very satisfied with their procedure and reported less satisfaction (86%) with the nonoperative shoulder. Also significant was the reduced number of radiolucencies. At 3.7 years after surgery, the overall percentage of shoulders with ≥1 glenoid radiolucency was 37%, considerably lower than the 82% reported by Cofield7 and the rates in more recent studies.3,16,33-36 Of the 178 shoulders in our study, 10 (5.6%) had subscapularis tears, and 6 (3.4%) of 178 had these tears surgically repaired. This 3.4% compares favorably with the 5.9% (of 119 patients) found by Miller and colleagues37 28 months after surgery. Of our 178 shoulders, 27 (15.2%) had clinically significant postoperative complications; 18 (10.1%) of the 178 had these complications surgically treated, and 9 (5.1%) had them managed nonoperatively. Bohsali and colleagues27 systematically reviewed 33 TSA studies and found a slightly higher complication rate (16.3%) 5.3 years after surgery. Furthermore, in our study, the 11 patients who underwent revision, capsular shift, or subscapularis repair had final outcomes comparable to those of the rest of our study population.
Our study had several potential weaknesses. First, its minimum clinical and radiographic follow-up was 1 year, whereas most long-term TSA series set a minimum of 2 years. We used 1 year because this was the first clinical study of the hybrid glenoid component design, and we wanted to maximize its sample size by reporting on intermediate-length outcomes. Even so, 93% (166/178) of our clinical patients and 83% (113/136) of our radiographic patients have had ≥2 years of follow-up, and we continue to follow all study patients for long-term outcomes. Another weakness of the study was its lack of a uniform group of patients with all the office, survey, complications, and radiographic data. Our retrospective study design made it difficult to obtain such a group without significantly reducing the sample size, so we divided patients into 4 data groups. A third potential weakness was the study’s variable method for collecting complications data. Rates of complications in the 178 shoulders were calculated from either office evaluation or patient self-report by mail or telephone. This data collection method is subject to recall bias, but mail and telephone contact was needed so the study would capture the large number of patients who had traveled to our institution for their surgery or had since moved away. Fourth, belly-press and lift-off tests were used in part to assess subscapularis function, but recent literature suggests post-TSA subscapularis assessment can be unreliable.38 These tests may be positive in up to two-thirds of patients after 2 years.39 Fifth, the generalizability of our findings to diagnoses such as rheumatoid and posttraumatic arthritis is limited. We had to restrict the study to patients with primary glenohumeral arthritis in order to minimize confounders.
This study’s main strength is its description of the clinical and radiographic outcomes of using a single prosthetic system in operations performed by a single surgeon in a large number of patients. This was the first and largest study evaluating the clinical and radiographic outcomes of this hybrid glenoid implant. Excluding patients with nonprimary arthritis allowed us to minimize potential confounding factors that affect patient outcomes. In conclusion, our study results showed the favorable clinical and radiographic outcomes of TSAs that have a hybrid glenoid component with dual radii of curvature. At a mean of 3.7 years after surgery, 63% of patients had no glenoid lucencies, and, at a mean of 4.8 years, only 1.7% of patients required revision. We continue to follow these patients to obtain long-term results of this innovative prosthesis.
Take-Home Points
The authors have developed a total shoulder glenoid prosthesis that conforms with the humeral head in its center and is nonconforming on its peripheral edge.
All clinical survey and range of motion parameters demonstrated statistically significant improvements at final follow-up.
Only 3 shoulders (1.7%) required revision surgery.
Eighty-six (63%) of 136 shoulders demonstrated no radiographic evidence of glenoid loosening.
This is the first and largest study that evaluates the clinical and radiographic outcomes of this hybrid shoulder prosthesis.
Fixation of the glenoid component is the limiting factor in modern total shoulder arthroplasty (TSA). Glenoid loosening, the most common long-term complication, necessitates revision in up to 12% of patients.1-4 By contrast, humeral component loosening is relatively uncommon, affecting as few as 0.34% of patients.5 Multiple long-term studies have found consistently high rates (45%-93%) of radiolucencies around the glenoid component.3,6,7 Although their clinical significance has been debated, radiolucencies around the glenoid component raise concern about progressive loss of fixation.
Since TSA was introduced in the 1970s, complications with the glenoid component have been addressed with 2 different designs: conforming (congruent) and nonconforming. In a congruent articulation, the radii of curvature of the glenoid and humeral head components are identical, whereas they differ in a nonconforming model. Joint conformity is inversely related to glenohumeral translation.8 Neer’s original TSA was made congruent in order to limit translation and maximize the contact area. However, this design results in edge loading and a so-called rocking-horse phenomenon, which may lead to glenoid loosening.9-13 Surgeons therefore have increasingly turned to nonconforming implants. In the nonconforming design, the radius of curvature of the humeral head is smaller than that of the glenoid. Although this design may reduce edge loading,14 it allows more translation and reduces the relative contact area of the glenohumeral joint. As a result, more contact stress is transmitted to the glenoid component, leading to polyethylene deformation and wear.15,16
Figure 1.A desire to integrate the advantages of the 2 designs led to a novel glenoid implant design with variable conformity. This innovative component has a central conforming region and a peripheral nonconforming region or “translation zone” (Figure 1).
Dual radii of curvature are designed to augment joint stability without increasing component wear. Biomechanical data have indicated that edge loading is not increased by having a central conforming region added to a nonconforming model.17 The clinical value of this prosthesis, however, has not been determined. Therefore, we conducted a study to describe the intermediate-term clinical and radiographic outcomes of TSAs that use a novel hybrid glenoid component.
Materials and Methods
This study was approved (protocol AAAD3473) by the Institutional Review Board of Columbia University and was conducted in compliance with Health Insurance Portability and Accountability Act (HIPAA) regulations.
Patient Selection
At Columbia University Medical Center, Dr. Bigliani performed 196 TSAs with a hybrid glenoid component (Bigliani-Flatow; Zimmer Biomet) in 169 patients between September 1998 and November 2007. All patients had received a diagnosis of primary glenohumeral arthritis as defined by Neer.18 Patients with previous surgery such as rotator cuff repair or subacromial decompression were included in our review, and patients with a nonprimary form of arthritis, such as rheumatoid, posttraumatic, or post-capsulorrhaphy arthritis, were excluded.
Operative Technique
For all surgeries, Dr. Bigliani performed a subscapularis tenotomy with regional anesthesia and a standard deltopectoral approach. A partial anterior capsulectomy was performed to increase the glenoid’s visibility. The inferior labrum was removed with a needle-tip bovie while the axillary nerve was being protected with a metal finger or narrow Darrach retractor. After reaming and trialing, the final glenoid component was cemented into place. Cement was placed only in the peg or keel holes and pressurized twice before final implantation. Of the 196 glenoid components, 168 (86%) were pegged and 28 (14%) keeled; in addition,190 of these components were all-polyethylene, whereas 6 had trabecular-metal backing. All glenoid components incorporated the hybrid design of dual radii of curvature. After the glenoid was cemented, the final humeral component was placed in 30° of retroversion. Whenever posterior wear was found, retroversion was reduced by 5° to 10°. The humeral prosthesis was cemented in cases (104/196, 53%) of poor bone quality or a large canal.
After surgery, the patient’s sling was fitted with an abduction pillow and a swathe, to be worn the first 24 hours, and the arm was passively ranged. Patients typically were discharged on postoperative day 2. Then, for 2 weeks, they followed an assisted passive range of motion (ROM) protocol, with limited external rotation, for promotion of subscapularis healing.
Clinical Outcomes
Dr. Bigliani assessed preoperative ROM in all planes. During initial evaluation, patients completed a questionnaire that consisted of the 36-Item Short Form Health Survey19,20 (SF-36) and the American Shoulder and Elbow Surgeons21 (ASES) and Simple Shoulder Test22 (SST) surveys. Postoperative clinical data were collected from office follow-up visits, survey questionnaires, or both. Postoperative office data included ROM, subscapularis integrity testing (belly-press or lift-off), and any complications. Patients with <1 year of office follow-up were excluded. In addition, the same survey questionnaire that was used before surgery was mailed to all patients after surgery; then, for anyone who did not respond by mail, we attempted contact by telephone. Neer criteria were based on patients’ subjective assessment of each arm on a 3-point Likert scale (1 = very satisfied, 2 = satisfied, 3 = dissatisfied). Patients were also asked about any specific complications or revision operations since their index procedure.
Physical examination and office follow-up data were obtained for 129 patients (148/196 shoulders, 76% follow-up) at a mean of 3.7 years (range 1.0-10.2 years) after surgery. Surveys were completed by 117 patients (139/196 shoulders, 71% follow-up) at a mean of 5.1 years (range, 1.6-11.2 years) after surgery. Only 15 patients had neither 1 year of office follow-up nor a completed questionnaire. The remaining 154 patients (178/196 shoulders, 91% follow-up) had clinical follow-up with office, mail, or telephone questionnaire at a mean of 4.8 years (range, 1.0-11.2 years) after surgery. This cohort of patients was used to determine rates of surgical revisions, subscapularis tears, dislocations, and other complications.
Figure 2.Acromioplasty, performed in TSA patients who had subacromial impingement stemming from improved ROM, represented a second operation, and therefore the need for this surgery was deemed a complication as well. Figure 2 breaks down the 4 major study cohorts.
Radiographic Outcomes
Patients were included in the radiographic analysis if they had a shoulder radiograph at least 1 year after surgery. One hundred nineteen patients (136/196 shoulders, 69% follow-up) had radiographic follow-up at a mean of 3.7 years (range, 1.0-9.4 years) after surgery.
Table 1.All radiographs were independently assessed by 2 blinded physicians who were not involved in the index procedure. Any disputed radiographs were reassessed by these physicians together, until consensus was reached. Radiographs were reviewed for the presence of glenoid lucencies around the pegs or keel and were scored using the system of Lazarus and colleagues23 (Table 1). The humerus was assessed for total number of lucent lines in any of 8 periprosthetic zones, as described by Sperling and colleagues.24
Statistical Analysis
Statistical analysis was performed with Stata Version 10.0. Paired t tests were used to compare preoperative and postoperative numerical data, including ROM and survey scores. We calculated 95% confidence intervals (CIs) and set statistical significance at P < .05. For qualitative measures, the Fisher exact test was used. Survivorship analysis was performed according to the Kaplan-Meier method, with right-censored data for no event or missing data.25
Results
Clinical Analysis of Demographics
In demographics, the clinical and radiographic patient subgroups were similar to each other and to the overall study population (Table 2). Of 196 patients overall, 16 (8%) had a concomitant rotator cuff repair, and 27 (14%) underwent staged bilateral shoulder arthroplasties.
Table 2.
Clinical Analysis of ROM and Survey Scores
Operative shoulder ROM in forward elevation, external rotation at side, external rotation in abduction, and internal rotation all showed statistically significant (P < .001) improvement from before surgery to after surgery. Over 3.7 years, mean (SD) forward elevation improved from 107.3° (34.8°) to 159.0° (29.4°), external rotation at side improved from 20.4° (16.7°) to 49.4° (11.3°), and external rotation in abduction improved from 53.7° (24.3°) to 84.7° (9.1°). Internal rotation improved from a mean (SD) vertebral level of S1 (6.0 levels) to T9 (3.7 levels).
All validated survey scores also showed statistically significant (P < .001) improvement from before surgery to after surgery. Over 5.1 years, mean (SD) SF-36 scores improved from 64.9 (13.4) to 73.6 (17.1), ASES scores improved from 41.1 (22.5) to 82.7 (17.7), SST scores improved from 3.9 (2.8) to 9.7 (2.2), and visual analog scale pain scores improved from 5.6 (3.2) to 1.4 (2.1). Of 139 patients with follow-up, 130 (93.5%) were either satisfied or very satisfied with their TSA, and only 119 (86%) were either satisfied or very satisfied with the nonoperative shoulder.
Clinical Analysis of Postoperative Complications
Of the 178 shoulders evaluated for complications, 3 (1.7%) underwent revision surgery. Mean time to revision was 2.3 years (range, 1.5-3.9 years). Two revisions involved the glenoid component, and the third involved the humerus. In one of the glenoid cases, a 77-year-old woman fell and sustained a fracture at the base of the trabecular metal glenoid pegs; her component was revised to an all-polyethylene component, and she had no further complications. In the other glenoid case, a 73-year-old man’s all-polyethylene component loosened after 2 years and was revised to a trabecular metal implant, which loosened as well and was later converted to a hemiarthroplasty. In the humeral case, a 33-year-old man had his 4-year-old index TSA revised to a cemented stem and had no further complications.
Table 3.Of the 148 patients with office follow-up, only 8 had a positive belly-press or lift-off test. Of all 178 clinical study shoulders, 10 (5.6%) had a subscapularis tear confirmed by magnetic resonance imaging or a physician. Of these 10 tears, 3 resulted from traumatic falls. Four of the 10 tears were managed nonoperatively, and the other 6 underwent surgical repair at a mean of 2.9 years (range, 0.3-7.8 years) after index TSA. In 2 of the 6 repair cases, a 46-mm humeral head had been used, and, in the other 4 cases, a 52-mm humeral head. Of the 6 repaired tears, 2 were massive, and 4 were isolated to the subscapularis. None of these 6 tears required a second repair. Seven (4%) of the 178 shoulders experienced a clinically significant posterosuperior subluxation or dislocation; 5 of the 7 were managed nonoperatively, and the other 2 underwent open capsular shift, at 0.5 year and 3.0 years, respectively. Table 3 lists the other postoperative complications that required surgery.
Table 4.
Table 4 compares the clinical and radiographic outcomes of patients who required subscapularis repair, capsular shift, or implant revision with the outcomes of all other study patients, and Figure 3 shows Kaplan-Meier survivorship.
Figure 3.
Postoperative Radiographic Analysis
Glenoid Component. At a mean of 3.7 years (minimum, 1 year) after surgery, 86 (63%) of 136 radiographically evaluated shoulders showed no glenoid lucencies; the other 50 (37%) showed ≥1 lucency. Of the 136 shoulders, 33 (24%) had a Lazarus score of 1, 15 (11%) had a score of 2, and only 2 (2%) had a score of 3. None of the shoulders had a score of 4 or 5.
Humeral Component. Of the 136 shoulders, 91 (67%) showed no lucencies in any of the 8 humeral stem zones; the other 45 (33%) showed 1 to 3 lucencies. Thirty (22%) of the 136 shoulders had 1 stem lucency zone, 8 (6%) had 2, and 3 (2%) had 3. None of the shoulders had >3 periprosthetic zones with lucent lines.
Discussion
In this article, we describe a hybrid glenoid TSA component with dual radii of curvature. Its central portion is congruent with the humeral head, and its peripheral portion is noncongruent and larger. The most significant finding of our study is the low rate (1.1%) of glenoid component revision 4.8 years after surgery. This rate is the lowest that has been reported in a study of ≥100 patients. Overall implant survival appeared as an almost flat Kaplan-Meir curve. We attribute this low revision rate to improved biomechanics with the hybrid glenoid design.
Symptomatic glenoid component loosening is the most common TSA complication.1,26-28 In a review of 73 Neer TSAs, Cofield7 found glenoid radiolucencies in 71% of patients 3.8 years after surgery. Radiographic evidence of loosening, defined as component migration, or tilt, or a circumferential lucency 1.5 mm thick, was present in another 11% of patients, and 4.1% developed symptomatic loosening that required glenoid revision. In a study with 12.2-year follow-up, Torchia and colleagues3 found rates of 84% for glenoid radiolucencies, 44% for radiographic loosening, and 5.6% for symptomatic loosening that required revision. In a systematic review of studies with follow-up of ≥10 years, Bohsali and colleagues27 found similar lucency and radiographic loosening rates and a 7% glenoid revision rate. These data suggest glenoid radiolucencies may progress to component loosening.
Degree of joint congruence is a key factor in glenoid loosening. Neer’s congruent design increases the contact area with concentric loading and reduces glenohumeral translation, which leads to reduced polyethylene wear and improved joint stability. In extreme arm positions, however, humeral head subluxation results in edge loading and a glenoid rocking-horse effect.9-13,17,29-31 Conversely, nonconforming implants allow increased glenohumeral translation without edge loading,14 though they also reduce the relative glenohumeral contact area and thus transmit more contact stress to the glenoid.16,17 A hybrid glenoid component with central conforming and peripheral nonconforming zones may reduce the rocking-horse effect while maximizing ROM and joint stability. Wang and colleagues32 studied the biomechanical properties of this glenoid design and found that the addition of a central conforming region did not increase edge loading.
Additional results from our study support the efficacy of a hybrid glenoid component. Patients’ clinical outcomes improved significantly. At 5.1 years after surgery, 93.5% of patients were satisfied or very satisfied with their procedure and reported less satisfaction (86%) with the nonoperative shoulder. Also significant was the reduced number of radiolucencies. At 3.7 years after surgery, the overall percentage of shoulders with ≥1 glenoid radiolucency was 37%, considerably lower than the 82% reported by Cofield7 and the rates in more recent studies.3,16,33-36 Of the 178 shoulders in our study, 10 (5.6%) had subscapularis tears, and 6 (3.4%) of 178 had these tears surgically repaired. This 3.4% compares favorably with the 5.9% (of 119 patients) found by Miller and colleagues37 28 months after surgery. Of our 178 shoulders, 27 (15.2%) had clinically significant postoperative complications; 18 (10.1%) of the 178 had these complications surgically treated, and 9 (5.1%) had them managed nonoperatively. Bohsali and colleagues27 systematically reviewed 33 TSA studies and found a slightly higher complication rate (16.3%) 5.3 years after surgery. Furthermore, in our study, the 11 patients who underwent revision, capsular shift, or subscapularis repair had final outcomes comparable to those of the rest of our study population.
Our study had several potential weaknesses. First, its minimum clinical and radiographic follow-up was 1 year, whereas most long-term TSA series set a minimum of 2 years. We used 1 year because this was the first clinical study of the hybrid glenoid component design, and we wanted to maximize its sample size by reporting on intermediate-length outcomes. Even so, 93% (166/178) of our clinical patients and 83% (113/136) of our radiographic patients have had ≥2 years of follow-up, and we continue to follow all study patients for long-term outcomes. Another weakness of the study was its lack of a uniform group of patients with all the office, survey, complications, and radiographic data. Our retrospective study design made it difficult to obtain such a group without significantly reducing the sample size, so we divided patients into 4 data groups. A third potential weakness was the study’s variable method for collecting complications data. Rates of complications in the 178 shoulders were calculated from either office evaluation or patient self-report by mail or telephone. This data collection method is subject to recall bias, but mail and telephone contact was needed so the study would capture the large number of patients who had traveled to our institution for their surgery or had since moved away. Fourth, belly-press and lift-off tests were used in part to assess subscapularis function, but recent literature suggests post-TSA subscapularis assessment can be unreliable.38 These tests may be positive in up to two-thirds of patients after 2 years.39 Fifth, the generalizability of our findings to diagnoses such as rheumatoid and posttraumatic arthritis is limited. We had to restrict the study to patients with primary glenohumeral arthritis in order to minimize confounders.
This study’s main strength is its description of the clinical and radiographic outcomes of using a single prosthetic system in operations performed by a single surgeon in a large number of patients. This was the first and largest study evaluating the clinical and radiographic outcomes of this hybrid glenoid implant. Excluding patients with nonprimary arthritis allowed us to minimize potential confounding factors that affect patient outcomes. In conclusion, our study results showed the favorable clinical and radiographic outcomes of TSAs that have a hybrid glenoid component with dual radii of curvature. At a mean of 3.7 years after surgery, 63% of patients had no glenoid lucencies, and, at a mean of 4.8 years, only 1.7% of patients required revision. We continue to follow these patients to obtain long-term results of this innovative prosthesis.
References
1. Rodosky MW, Bigliani LU. Indications for glenoid resurfacing in shoulder arthroplasty. J Shoulder Elbow Surg. 1996;5(3):231-248.
2. Boyd AD Jr, Thomas WH, Scott RD, Sledge CB, Thornhill TS. Total shoulder arthroplasty versus hemiarthroplasty. Indications for glenoid resurfacing. J Arthroplasty. 1990;5(4):329-336.
3. Torchia ME, Cofield RH, Settergren CR. Total shoulder arthroplasty with the Neer prosthesis: long-term results. J Shoulder Elbow Surg. 1997;6(6):495-505.
4. Iannotti JP, Norris TR. Influence of preoperative factors on outcome of shoulder arthroplasty for glenohumeral osteoarthritis. J Bone Joint Surg Am. 2003;85(2):251-258.
5. Cofield RH. Degenerative and arthritic problems of the glenohumeral joint. In: Rockwood CA, Matsen FA, eds. The Shoulder. Philadelphia, PA: Saunders; 1990:740-745.
6. Neer CS 2nd, Watson KC, Stanton FJ. Recent experience in total shoulder replacement. J Bone Joint Surg Am. 1982;64(3):319-337.
7. Cofield RH. Total shoulder arthroplasty with the Neer prosthesis. J Bone Joint Surg Am. 1984;66(6):899-906.
8. Karduna AR, Williams GR, Williams JL, Iannotti JP. Kinematics of the glenohumeral joint: influences of muscle forces, ligamentous constraints, and articular geometry. J Orthop Res. 1996;14(6):986-993.
9. Karduna AR, Williams GR, Iannotti JP, Williams JL. Total shoulder arthroplasty biomechanics: a study of the forces and strains at the glenoid component. J Biomech Eng. 1998;120(1):92-99.
10. Karduna AR, Williams GR, Williams JL, Iannotti JP. Glenohumeral joint translations before and after total shoulder arthroplasty. A study in cadavera. J Bone Joint Surg Am. 1997;79(8):1166-1174.
11. Matsen FA 3rd, Clinton J, Lynch J, Bertelsen A, Richardson ML. Glenoid component failure in total shoulder arthroplasty. J Bone Joint Surg Am. 2008;90(4):885-896.
12. Franklin JL, Barrett WP, Jackins SE, Matsen FA 3rd. Glenoid loosening in total shoulder arthroplasty. Association with rotator cuff deficiency. J Arthroplasty. 1988;3(1):39-46.
13. Barrett WP, Franklin JL, Jackins SE, Wyss CR, Matsen FA 3rd. Total shoulder arthroplasty. J Bone Joint Surg Am. 1987;69(6):865-872.
14. Harryman DT, Sidles JA, Harris SL, Lippitt SB, Matsen FA 3rd. The effect of articular conformity and the size of the humeral head component on laxity and motion after glenohumeral arthroplasty. A study in cadavera. J Bone Joint Surg Am. 1995;77(4):555-563.
15. Flatow EL. Prosthetic design considerations in total shoulder arthroplasty. Semin Arthroplasty. 1995;6(4):233-244.
16. Klimkiewicz JJ, Iannotti JP, Rubash HE, Shanbhag AS. Aseptic loosening of the humeral component in total shoulder arthroplasty. J Shoulder Elbow Surg. 1998;7(4):422-426.
17. Wang VM, Krishnan R, Ugwonali OF, Flatow EL, Bigliani LU, Ateshian GA. Biomechanical evaluation of a novel glenoid design in total shoulder arthroplasty. J Shoulder Elbow Surg. 2005;14(1 suppl S):129S-140S.
18. Neer CS 2nd. Replacement arthroplasty for glenohumeral osteoarthritis. J Bone Joint Surg Am. 1974;56(1):1-13.
19. Boorman RS, Kopjar B, Fehringer E, Churchill RS, Smith K, Matsen FA 3rd. The effect of total shoulder arthroplasty on self-assessed health status is comparable to that of total hip arthroplasty and coronary artery bypass grafting. J Shoulder Elbow Surg. 2003;12(2):158-163.
20. Patel AA, Donegan D, Albert T. The 36-Item Short Form. J Am Acad Orthop Surg. 2007;15(2):126-134.
21. Richards RR, An KN, Bigliani LU, et al. A standardized method for the assessment of shoulder function. J Shoulder Elbow Surg. 1994;3(6):347-352.
22. Wright RW, Baumgarten KM. Shoulder outcomes measures. J Am Acad Orthop Surg. 2010;18(7):436-444.
23. Lazarus MD, Jensen KL, Southworth C, Matsen FA 3rd. The radiographic evaluation of keeled and pegged glenoid component insertion. J Bone Joint Surg Am. 2002;84(7):1174-1182.
24. Sperling JW, Cofield RH, O’Driscoll SW, Torchia ME, Rowland CM. Radiographic assessment of ingrowth total shoulder arthroplasty. J Shoulder Elbow Surg. 2000;9(6):507-513.
25. Dinse GE, Lagakos SW. Nonparametric estimation of lifetime and disease onset distributions from incomplete observations. Biometrics. 1982;38(4):921-932.
26. Baumgarten KM, Lashgari CJ, Yamaguchi K. Glenoid resurfacing in shoulder arthroplasty: indications and contraindications. Instr Course Lect. 2004;53:3-11.
27. Bohsali KI, Wirth MA, Rockwood CA Jr. Complications of total shoulder arthroplasty. J Bone Joint Surg Am. 2006;88(10):2279-2292.
28. Wirth MA, Rockwood CA Jr. Complications of total shoulder-replacement arthroplasty. J Bone Joint Surg Am. 1996;78(4):603-616.
29. Poppen NK, Walker PS. Normal and abnormal motion of the shoulder. J Bone Joint Surg Am. 1976;58(2):195-201.
30. Cotton RE, Rideout DF. Tears of the humeral rotator cuff; a radiological and pathological necropsy survey. J Bone Joint Surg Br. 1964;46:314-328.
31. Bigliani LU, Kelkar R, Flatow EL, Pollock RG, Mow VC. Glenohumeral stability. Biomechanical properties of passive and active stabilizers. Clin Orthop Relat Res. 1996;(330):13-30.
32. Wang VM, Sugalski MT, Levine WN, Pawluk RJ, Mow VC, Bigliani LU. Comparison of glenohumeral mechanics following a capsular shift and anterior tightening. J Bone Joint Surg Am. 2005;87(6):1312-1322.
33. Young A, Walch G, Boileau P, et al. A multicentre study of the long-term results of using a flat-back polyethylene glenoid component in shoulder replacement for primary osteoarthritis. J Bone Joint Surg Br. 2011;93(2):210-216.
34. Khan A, Bunker TD, Kitson JB. Clinical and radiological follow-up of the Aequalis third-generation cemented total shoulder replacement: a minimum ten-year study. J Bone Joint Surg Br. 2009;91(12):1594-1600.
35. Walch G, Edwards TB, Boulahia A, Boileau P, Mole D, Adeleine P. The influence of glenohumeral prosthetic mismatch on glenoid radiolucent lines: results of a multicenter study. J Bone Joint Surg Am. 2002;84(12):2186-2191.
36. Bartelt R, Sperling JW, Schleck CD, Cofield RH. Shoulder arthroplasty in patients aged fifty-five years or younger with osteoarthritis. J Shoulder Elbow Surg. 2011;20(1):123-130.
37. Miller BS, Joseph TA, Noonan TJ, Horan MP, Hawkins RJ. Rupture of the subscapularis tendon after shoulder arthroplasty: diagnosis, treatment, and outcome. J Shoulder Elbow Surg. 2005;14(5):492-496.
38. Armstrong A, Lashgari C, Teefey S, Menendez J, Yamaguchi K, Galatz LM. Ultrasound evaluation and clinical correlation of subscapularis repair after total shoulder arthroplasty. J Shoulder Elbow Surg. 2006;15(5):541-548.
39. Miller SL, Hazrati Y, Klepps S, Chiang A, Flatow EL. Loss of subscapularis function after total shoulder replacement: a seldom recognized problem. J Shoulder Elbow Surg. 2003;12(1):29-34.
PFA improved knee function and pain scores in patients with isolated patellofemoral arthritis.
The majority (84.2%) of patients undergoing PFA were female.
Regardless of age or gender, 72.2% of patients returned to their desired preoperative activity after PFA, and 52.8% returned at the same or higher level.
The rate of conversion from PFA to TKA was 6.3%.
PFA is an alternative to TKA in active patients with isolated patellofemoral arthritis.
Compared with total knee arthroplasty (TKA), single-compartment knee arthroplasty may provide better physiologic function, faster recovery, and higher rates of return to activities in patients with unicompartmental knee disease.1-3 In 1955, McKeever4 introduced patellar arthroplasty for surgical management of isolated patellofemoral arthritis. In 1979, Lubinus5 improved on the technique and design by adding a femoral component. Since then, implants and techniques have been developed to effect better clinical outcomes. Patellofemoral arthroplasty (PFA) has many advantages over TKA in the treatment of patellofemoral arthritis. PFA is less invasive, requires shorter tourniquet times, has faster recovery, and spares the tibiofemoral compartment, leaving more native bone for potential conversion to TKA. Regarding activity and function, the resurfacing arthroplasty (vs TKA) allows maintenance of nearly normal knee kinematics.
Despite these advantages, the broader orthopedic surgery community has only cautiously accepted PFA. The procedure has high complication rates. Persistent instability, malalignment, wear, impingement, and tibiofemoral arthritis progression can occur after PFA.6 Although first-generation PFA prostheses often failed because of mechanical problems, loosening, maltracking, or instability,7 the most common indication for PFA revision has been, according to a recent large retrospective study,8 unexplained pain. More than 10 to 15 years after PFA, tibiofemoral arthritis may be the primary mechanism of failure.9 Nevertheless, compared with standard TKA for isolated patellofemoral arthritis, modern PFA does not have significantly different clinical outcomes, including complication and revision rates.6Numerous patient factors influence functional prognosis before and after knee arthroplasty, regardless of surgical technique and implant used. Age, comorbidities, athletic status, mental health, pain, functional limitations, excessive caution, “artificial joint”–related worries, and rehabilitation protocol all influence function.10 Return to activity and other quality-of-life indices are important aspects of postoperative patient satisfaction.
Methods
We conducted a retrospective cohort study to describe functional status after PFA for patellofemoral arthritis. We identified 48 consecutive PFAs (39 patients) performed by a team of 2 orthopedic surgeons (specialists in treating patellofemoral pathology) between 2009 and 2014.
Three validated patient-reported outcome measures (PROMs) were used to determine preoperative (baseline) and postoperative functional status: Kujala score, Lysholm score, and International Knee Documentation Committee (IKDC) score. The Kujala score is a measure of knee function specific to the patellofemoral joint; the Lysholm score focuses on activities related to the knee; and the IKDC score is a general measure of knee function. Charts were reviewed to extract patients’ clinical data, including preoperative outcome scores, medical history, physical examination data, intraoperative characteristics, and postoperative course. By telephone, patients answered questions about their postoperative clinical course and completed final follow-up questionnaires. They were also asked which sporting or fitness activity they had preferred before surgery and whether they were able to return to that activity after surgery.
Statistical analysis included the study population’s descriptive statistics. Means and SDs were reported for continuous variables, and frequencies and percentages were reported for categorical variables. Paired t tests were used to analyze changes in PROM scores. For comparison of differences between characteristics of patients who did and did not return to their previous activity level, independent-samples t tests were used for continuous variables. Chi-square tests or Fisher exact tests were used to compare discrete variables. Statistical significance was set at P ≤ .05. All analyses were performed with SPSS Version 22.0 (IBM).
Results
Table 1.Thirty-nine patients underwent PFA at our institution between 2009 and 2014. Mean age was 51.6 years. Of these patients, 84.2% were female, 28.6% had a body mass index of 30 kg/m2 or higher, and 23.4% had PFA for posttraumatic arthritis related to prior patellofemoral instability. Table 1 lists the study cohort’s demographic data.
Table 2.Table 2 lists self-reported activities limited by the affected knee before surgery, and Table 3 lists activity levels after surgery. Return to previous preferred activity was reported by 72.2% of patients, and 52.8% of patients reported returning to the same activity level or to a higher level. There were no differences in age (P = .978) or sex (P = .232) between patients who returned to the same or a higher activity level and patients who did not.
Table 3.However, mean BMI was significantly (P = .016) higher in patients who returned to the same or a higher activity level (28.6 kg/m2) than in patients who did not (23.7 kg/m2). Although the rate of posttraumatic arthritis (26%) was higher than the rate of primary osteoarthritis (19%) in patients who returned to the same or a higher activity level, this difference was not statistically significant (P = .724).
Postoperative knee-specific PROM scores and general pain score (reported by the patient on a scale of 0-10) were statistically significantly improved (P < .001 for all measures) over preoperative scores (Table 4).
Table 4.Mean follow-up was 26 months (range, 5-57 months). Kujala score improved a mean of 19.5 points; Lysholm score, 28.9 points; and IKDC score, 23.5 points. Mean general pain score improved from 6.3 before surgery to 2.8 after surgery. All PROM and pain score improvements were substantially larger than the minimal clinically important differences. Postoperative PROM scores and general pain score were significantly more improved in patients who returned to the same or a higher activity level than in patients who did not (P < .05 for all measures).
After surgery, 1 patient (2.6%) developed a pulmonary embolus, which was successfully identified and treated without incident. Five patients (10.4%) had another surgery on the same knee. Three patients (6.3%) underwent conversion to TKA: 1 for continued symptoms in the setting of newly diagnosed inflammatory arthritis, 1 for arthritic pain, and 1 for patellofemoral instability. Two patients (4.2%) underwent irrigation and débridement: 1 for hematoma and 1 for suspected (culture-negative) infection.
Discussion
Historically, the literature evaluating knee arthroplasty outcomes has focused on implant survivorship, pain relief, and patient satisfaction. Since the advent of partial knee arthroplasty options, more attention has been given to functional outcomes and return to activities after single-compartment knee resurfacing. TKA remains the gold standard by which newer, less invasive surgical options are measured. In a large prospective study, 97% of patients (age, >55 years) who had TKA for patellofemoral arthritis reported good or excellent clinical results, the majority being excellent.11 Post-TKA functional status and activity levels may not be rated as highly. After TKA, many patients switch to lower impact sports or reduce or stop their participation in sports.12 A small study of competitive adult tennis players found high levels of post-TKA satisfaction, ability to resume playing tennis, pain relief, and increased or continued enjoyment in playing.13 In a study of 355 patients (417 knees) who had underwent TKA, improvement in Knee Society function score showed a moderate correlation to an increase in weighted activity score (R = 0.362).14
Unicondylar knee arthroplasty (UKA) is becoming a popular treatment option for single-compartment tibiofemoral arthritis. A systematic review of 18 original studies of patients with knee osteoarthritis found that overall return to sports varied from 36% to 89% after TKA and from 75% to 100% after UKA.15 In another study, return-to-sports rates were similar for UKA (87%) and TKA (83%); the only significant difference was UKA patients returned quicker.16 The authors of a large meta-analysis conceded that significant heterogeneity of data prevented them from drawing definitive conclusions, but UKA patients seemed to return to low- and high-impact sports 2 weeks faster than their TKA counterparts.10 Overall, UKA and TKA patients (age, 51-71 years) had comparable return-to-sports rates at an average of 4 years after surgery.10 A smaller study corroborated faster return to sports for UKA over TKA patients and also found that, compared with TKA patients, UKA patients participated in sports more regularly and over a longer period.17 On the other hand, Walton and colleagues18 found similar return-to-sports rates but higher frequency of and satisfaction with sports participation in UKA over TKA patients.
A large retrospective study found no differences in rates of return to sports after TKA, UKA, patellar resurfacing, hip resurfacing, and total hip arthroplasty.19 Pain was the most common barrier to return. UKA patients who returned to sports tended to be younger than those who did not.20 Naal and colleagues3 found that 95% of UKA patients returned to their activities—hiking, walking, cycling, and swimming being most common. Although 90.3% of patients said surgery maintained or improved their ability to participate in sports, participation in high-impact sports (eg, running) decreased after surgery.
Outcomes of PFA vary because of evolving patient selection, implant design, surgical technique, and return-to-activity expectations.21,22 Most PFA outcome studies focus on implant survivorship, complication rates, and postoperative knee scores.23-28 PFA studies focused on return to activities are limited. Kooijman and colleagues7 and Mertl and colleagues29 reported good or excellent clinical results of PFA in 86% and 82% of patients, respectively. Neither study included a comprehensive analysis of postoperative functional status. Similarly, De Cloedt and colleagues30 reported good PFA outcomes in 43% of patients with degenerative joint disease and in 83% of patients with instability. Specific activity status was not described. Dahm and colleagues31 and Farr and colleagues32 suggested postoperative pain resolution motivates some PFA patients not only to resume preoperative activities but to start participating in new, higher level activities after pain has subsided. However, the studies did not examine the characteristics of patients who returned to baseline activities and did not examine return-to-sports rates.
Study Strengths and Limitations
Our study focused on the PFA patient population of a surgical team of 2 fellowship-trained orthopedic surgeons (specialists in treating patellofemoral pathology). Although generalization of our findings to other surgeons and different implants may be limited, the study design standardized treatment in a way that makes these findings more reliable. The 100% follow-up strengthens these findings as well. Last, though the patient population was relatively small, it was consistent with or larger than the PFA patient groups studied previously.
Conclusion
In this study, PROM and pain scores were significantly improved after PFA. That almost 75% of patients returned to their preferred activities and >50% of patients returned at the same or a higher activity level provides useful information for preoperative discussions with patients who want to remain active after PFA. Prospective studies are needed to evaluate the longevity and durability of PFA, particularly in active patients.
References
1. Laurencin CT, Zelicof SB, Scott RD, Ewald FC. Unicompartmental versus total knee arthroplasty in the same patient. A comparative study. Clin Orthop Relat Res. 1991;(273):151-156.
2. Kozinn SC, Scott R. Unicondylar knee arthroplasty. J Bone Joint Surg Am. 1989;71(1):145-150.
3. Naal FD, Fischer M, Preuss A, et al. Return to sports and recreational activity after unicompartmental knee arthroplasty. Am J Sports Med. 2007;35(10):1688-1695.
5. Lubinus HH. Patella glide bearing total replacement. Orthopedics. 1979;2(2):119-127.
6. Dy CJ, Franco N, Ma Y, Mazumdar M, McCarthy MM, Gonzalez Della Valle A. Complications after patello-femoral versus total knee replacement in the treatment of isolated patello-femoral osteoarthritis. A meta-analysis. Knee Surg Sports Traumatol Arthrosc. 2012;20(11):2174-2190.
7. Kooijman HJ, Driessen AP, van Horn JR. Long-term results of patellofemoral arthroplasty. A report of 56 arthroplasties with 17 years of follow-up. J Bone Joint Surg Br. 2003;85(6):836-840.
8. Baker PN, Refaie R, Gregg P, Deehan D. Revision following patello-femoral arthroplasty. Knee Surg Sports Traumatol Arthrosc. 2012;20(10):2047-2053.
9. Lonner JH, Bloomfield MR. The clinical outcome of patellofemoral arthroplasty. Orthop Clin North Am. 2013;44(3):271-280.
10. Papalia R, Del Buono A, Zampogna B, Maffulli N, Denaro V. Sport activity following joint arthroplasty: a systematic review. Br Med Bull. 2012;101:81-103.
11. Mont MA, Haas S, Mullick T, Hungerford DS. Total knee arthroplasty for patellofemoral arthritis. J Bone Joint Surg Am. 2002;84(11):1977-1981.
12. Chatterji U, Ashworth MJ, Lewis PL, Dobson PJ. Effect of total knee arthroplasty on recreational and sporting activity. ANZ J Surg. 2005;75(6):405-408.
13. Mont MA, Rajadhyaksha AD, Marxen JL, Silberstein CE, Hungerford DS. Tennis after total knee arthroplasty. Am J Sports Med. 2002;30(2):163-166.
14. Marker DR, Mont MA, Seyler TM, McGrath MS, Kolisek FR, Bonutti PM. Does functional improvement following TKA correlate to increased sports activity? Iowa Orthop J. 2009;29:11-16.
15. Witjes S, Gouttebarge V, Kuijer PP, van Geenen RC, Poolman RW, Kerkhoffs GM. Return to sports and physical activity after total and unicondylar knee arthroplasty: a systematic review and meta-analysis. Sports Med. 2016;46(2):269-292.
16. Ho JC, Stitzlein RN, Green CJ, Stoner T, Froimson MI. Return to sports activity following UKA and TKA. J Knee Surg. 2016;29(3):254-259.
17. Hopper GP, Leach WJ. Participation in sporting activities following knee replacement: total versus unicompartmental. Knee Surg Sports Traumatol Arthrosc. 2008;16(10):973-979.
18. Walton NP, Jahromi I, Lewis PL, Dobson PJ, Angel KR, Campbell DG. Patient-perceived outcomes and return to sport and work: TKA versus mini-incision unicompartmental knee arthroplasty. J Knee Surg. 2006;19(2):112-116.
19. Wylde V, Blom A, Dieppe P, Hewlett S, Learmonth I. Return to sport after joint replacement. J Bone Joint Surg Br. 2008;90(7):920-923.
20. Pietschmann MF, Wohlleb L, Weber P, et al. Sports activities after medial unicompartmental knee arthroplasty Oxford III—what can we expect? Int Orthop. 2013;37(1):31-37.
28. Leadbetter WB, Seyler TM, Ragland PS, Mont MA. Indications, contraindications, and pitfalls of patellofemoral arthroplasty. J Bone Joint Surg Am. 2006;88(suppl 4):122-137.
29. Mertl P, Van FT, Bonhomme P, Vives P. Femoropatellar osteoarthritis treated by prosthesis. Retrospective study of 50 implants [in French]. Rev Chir Orthop Reparatrice Appar Mot. 1997;83(8):712-718.
30. De Cloedt P, Legaye J, Lokietek W. Femoro-patellar prosthesis. A retrospective study of 45 consecutive cases with a follow-up of 3-12 years [in French]. Acta Orthop Belg. 1999;65(2):170-175.
31. Dahm DL, Al-Rayashi W, Dajani K, Shah JP, Levy BA, Stuart MJ. Patellofemoral arthroplasty versus total knee arthroplasty in patients with isolated patellofemoral osteoarthritis. Am J Orthop. 2010;39(10):487-491.
32. Farr J, Arendt E, Dahm D, Daynes J. Patellofemoral arthroplasty in the athlete. Clin Sports Med. 2014;33(3):547-552.
PFA improved knee function and pain scores in patients with isolated patellofemoral arthritis.
The majority (84.2%) of patients undergoing PFA were female.
Regardless of age or gender, 72.2% of patients returned to their desired preoperative activity after PFA, and 52.8% returned at the same or higher level.
The rate of conversion from PFA to TKA was 6.3%.
PFA is an alternative to TKA in active patients with isolated patellofemoral arthritis.
Compared with total knee arthroplasty (TKA), single-compartment knee arthroplasty may provide better physiologic function, faster recovery, and higher rates of return to activities in patients with unicompartmental knee disease.1-3 In 1955, McKeever4 introduced patellar arthroplasty for surgical management of isolated patellofemoral arthritis. In 1979, Lubinus5 improved on the technique and design by adding a femoral component. Since then, implants and techniques have been developed to effect better clinical outcomes. Patellofemoral arthroplasty (PFA) has many advantages over TKA in the treatment of patellofemoral arthritis. PFA is less invasive, requires shorter tourniquet times, has faster recovery, and spares the tibiofemoral compartment, leaving more native bone for potential conversion to TKA. Regarding activity and function, the resurfacing arthroplasty (vs TKA) allows maintenance of nearly normal knee kinematics.
Despite these advantages, the broader orthopedic surgery community has only cautiously accepted PFA. The procedure has high complication rates. Persistent instability, malalignment, wear, impingement, and tibiofemoral arthritis progression can occur after PFA.6 Although first-generation PFA prostheses often failed because of mechanical problems, loosening, maltracking, or instability,7 the most common indication for PFA revision has been, according to a recent large retrospective study,8 unexplained pain. More than 10 to 15 years after PFA, tibiofemoral arthritis may be the primary mechanism of failure.9 Nevertheless, compared with standard TKA for isolated patellofemoral arthritis, modern PFA does not have significantly different clinical outcomes, including complication and revision rates.6Numerous patient factors influence functional prognosis before and after knee arthroplasty, regardless of surgical technique and implant used. Age, comorbidities, athletic status, mental health, pain, functional limitations, excessive caution, “artificial joint”–related worries, and rehabilitation protocol all influence function.10 Return to activity and other quality-of-life indices are important aspects of postoperative patient satisfaction.
Methods
We conducted a retrospective cohort study to describe functional status after PFA for patellofemoral arthritis. We identified 48 consecutive PFAs (39 patients) performed by a team of 2 orthopedic surgeons (specialists in treating patellofemoral pathology) between 2009 and 2014.
Three validated patient-reported outcome measures (PROMs) were used to determine preoperative (baseline) and postoperative functional status: Kujala score, Lysholm score, and International Knee Documentation Committee (IKDC) score. The Kujala score is a measure of knee function specific to the patellofemoral joint; the Lysholm score focuses on activities related to the knee; and the IKDC score is a general measure of knee function. Charts were reviewed to extract patients’ clinical data, including preoperative outcome scores, medical history, physical examination data, intraoperative characteristics, and postoperative course. By telephone, patients answered questions about their postoperative clinical course and completed final follow-up questionnaires. They were also asked which sporting or fitness activity they had preferred before surgery and whether they were able to return to that activity after surgery.
Statistical analysis included the study population’s descriptive statistics. Means and SDs were reported for continuous variables, and frequencies and percentages were reported for categorical variables. Paired t tests were used to analyze changes in PROM scores. For comparison of differences between characteristics of patients who did and did not return to their previous activity level, independent-samples t tests were used for continuous variables. Chi-square tests or Fisher exact tests were used to compare discrete variables. Statistical significance was set at P ≤ .05. All analyses were performed with SPSS Version 22.0 (IBM).
Results
Table 1.Thirty-nine patients underwent PFA at our institution between 2009 and 2014. Mean age was 51.6 years. Of these patients, 84.2% were female, 28.6% had a body mass index of 30 kg/m2 or higher, and 23.4% had PFA for posttraumatic arthritis related to prior patellofemoral instability. Table 1 lists the study cohort’s demographic data.
Table 2.Table 2 lists self-reported activities limited by the affected knee before surgery, and Table 3 lists activity levels after surgery. Return to previous preferred activity was reported by 72.2% of patients, and 52.8% of patients reported returning to the same activity level or to a higher level. There were no differences in age (P = .978) or sex (P = .232) between patients who returned to the same or a higher activity level and patients who did not.
Table 3.However, mean BMI was significantly (P = .016) higher in patients who returned to the same or a higher activity level (28.6 kg/m2) than in patients who did not (23.7 kg/m2). Although the rate of posttraumatic arthritis (26%) was higher than the rate of primary osteoarthritis (19%) in patients who returned to the same or a higher activity level, this difference was not statistically significant (P = .724).
Postoperative knee-specific PROM scores and general pain score (reported by the patient on a scale of 0-10) were statistically significantly improved (P < .001 for all measures) over preoperative scores (Table 4).
Table 4.Mean follow-up was 26 months (range, 5-57 months). Kujala score improved a mean of 19.5 points; Lysholm score, 28.9 points; and IKDC score, 23.5 points. Mean general pain score improved from 6.3 before surgery to 2.8 after surgery. All PROM and pain score improvements were substantially larger than the minimal clinically important differences. Postoperative PROM scores and general pain score were significantly more improved in patients who returned to the same or a higher activity level than in patients who did not (P < .05 for all measures).
After surgery, 1 patient (2.6%) developed a pulmonary embolus, which was successfully identified and treated without incident. Five patients (10.4%) had another surgery on the same knee. Three patients (6.3%) underwent conversion to TKA: 1 for continued symptoms in the setting of newly diagnosed inflammatory arthritis, 1 for arthritic pain, and 1 for patellofemoral instability. Two patients (4.2%) underwent irrigation and débridement: 1 for hematoma and 1 for suspected (culture-negative) infection.
Discussion
Historically, the literature evaluating knee arthroplasty outcomes has focused on implant survivorship, pain relief, and patient satisfaction. Since the advent of partial knee arthroplasty options, more attention has been given to functional outcomes and return to activities after single-compartment knee resurfacing. TKA remains the gold standard by which newer, less invasive surgical options are measured. In a large prospective study, 97% of patients (age, >55 years) who had TKA for patellofemoral arthritis reported good or excellent clinical results, the majority being excellent.11 Post-TKA functional status and activity levels may not be rated as highly. After TKA, many patients switch to lower impact sports or reduce or stop their participation in sports.12 A small study of competitive adult tennis players found high levels of post-TKA satisfaction, ability to resume playing tennis, pain relief, and increased or continued enjoyment in playing.13 In a study of 355 patients (417 knees) who had underwent TKA, improvement in Knee Society function score showed a moderate correlation to an increase in weighted activity score (R = 0.362).14
Unicondylar knee arthroplasty (UKA) is becoming a popular treatment option for single-compartment tibiofemoral arthritis. A systematic review of 18 original studies of patients with knee osteoarthritis found that overall return to sports varied from 36% to 89% after TKA and from 75% to 100% after UKA.15 In another study, return-to-sports rates were similar for UKA (87%) and TKA (83%); the only significant difference was UKA patients returned quicker.16 The authors of a large meta-analysis conceded that significant heterogeneity of data prevented them from drawing definitive conclusions, but UKA patients seemed to return to low- and high-impact sports 2 weeks faster than their TKA counterparts.10 Overall, UKA and TKA patients (age, 51-71 years) had comparable return-to-sports rates at an average of 4 years after surgery.10 A smaller study corroborated faster return to sports for UKA over TKA patients and also found that, compared with TKA patients, UKA patients participated in sports more regularly and over a longer period.17 On the other hand, Walton and colleagues18 found similar return-to-sports rates but higher frequency of and satisfaction with sports participation in UKA over TKA patients.
A large retrospective study found no differences in rates of return to sports after TKA, UKA, patellar resurfacing, hip resurfacing, and total hip arthroplasty.19 Pain was the most common barrier to return. UKA patients who returned to sports tended to be younger than those who did not.20 Naal and colleagues3 found that 95% of UKA patients returned to their activities—hiking, walking, cycling, and swimming being most common. Although 90.3% of patients said surgery maintained or improved their ability to participate in sports, participation in high-impact sports (eg, running) decreased after surgery.
Outcomes of PFA vary because of evolving patient selection, implant design, surgical technique, and return-to-activity expectations.21,22 Most PFA outcome studies focus on implant survivorship, complication rates, and postoperative knee scores.23-28 PFA studies focused on return to activities are limited. Kooijman and colleagues7 and Mertl and colleagues29 reported good or excellent clinical results of PFA in 86% and 82% of patients, respectively. Neither study included a comprehensive analysis of postoperative functional status. Similarly, De Cloedt and colleagues30 reported good PFA outcomes in 43% of patients with degenerative joint disease and in 83% of patients with instability. Specific activity status was not described. Dahm and colleagues31 and Farr and colleagues32 suggested postoperative pain resolution motivates some PFA patients not only to resume preoperative activities but to start participating in new, higher level activities after pain has subsided. However, the studies did not examine the characteristics of patients who returned to baseline activities and did not examine return-to-sports rates.
Study Strengths and Limitations
Our study focused on the PFA patient population of a surgical team of 2 fellowship-trained orthopedic surgeons (specialists in treating patellofemoral pathology). Although generalization of our findings to other surgeons and different implants may be limited, the study design standardized treatment in a way that makes these findings more reliable. The 100% follow-up strengthens these findings as well. Last, though the patient population was relatively small, it was consistent with or larger than the PFA patient groups studied previously.
Conclusion
In this study, PROM and pain scores were significantly improved after PFA. That almost 75% of patients returned to their preferred activities and >50% of patients returned at the same or a higher activity level provides useful information for preoperative discussions with patients who want to remain active after PFA. Prospective studies are needed to evaluate the longevity and durability of PFA, particularly in active patients.
Take-Home Points
PFA improved knee function and pain scores in patients with isolated patellofemoral arthritis.
The majority (84.2%) of patients undergoing PFA were female.
Regardless of age or gender, 72.2% of patients returned to their desired preoperative activity after PFA, and 52.8% returned at the same or higher level.
The rate of conversion from PFA to TKA was 6.3%.
PFA is an alternative to TKA in active patients with isolated patellofemoral arthritis.
Compared with total knee arthroplasty (TKA), single-compartment knee arthroplasty may provide better physiologic function, faster recovery, and higher rates of return to activities in patients with unicompartmental knee disease.1-3 In 1955, McKeever4 introduced patellar arthroplasty for surgical management of isolated patellofemoral arthritis. In 1979, Lubinus5 improved on the technique and design by adding a femoral component. Since then, implants and techniques have been developed to effect better clinical outcomes. Patellofemoral arthroplasty (PFA) has many advantages over TKA in the treatment of patellofemoral arthritis. PFA is less invasive, requires shorter tourniquet times, has faster recovery, and spares the tibiofemoral compartment, leaving more native bone for potential conversion to TKA. Regarding activity and function, the resurfacing arthroplasty (vs TKA) allows maintenance of nearly normal knee kinematics.
Despite these advantages, the broader orthopedic surgery community has only cautiously accepted PFA. The procedure has high complication rates. Persistent instability, malalignment, wear, impingement, and tibiofemoral arthritis progression can occur after PFA.6 Although first-generation PFA prostheses often failed because of mechanical problems, loosening, maltracking, or instability,7 the most common indication for PFA revision has been, according to a recent large retrospective study,8 unexplained pain. More than 10 to 15 years after PFA, tibiofemoral arthritis may be the primary mechanism of failure.9 Nevertheless, compared with standard TKA for isolated patellofemoral arthritis, modern PFA does not have significantly different clinical outcomes, including complication and revision rates.6Numerous patient factors influence functional prognosis before and after knee arthroplasty, regardless of surgical technique and implant used. Age, comorbidities, athletic status, mental health, pain, functional limitations, excessive caution, “artificial joint”–related worries, and rehabilitation protocol all influence function.10 Return to activity and other quality-of-life indices are important aspects of postoperative patient satisfaction.
Methods
We conducted a retrospective cohort study to describe functional status after PFA for patellofemoral arthritis. We identified 48 consecutive PFAs (39 patients) performed by a team of 2 orthopedic surgeons (specialists in treating patellofemoral pathology) between 2009 and 2014.
Three validated patient-reported outcome measures (PROMs) were used to determine preoperative (baseline) and postoperative functional status: Kujala score, Lysholm score, and International Knee Documentation Committee (IKDC) score. The Kujala score is a measure of knee function specific to the patellofemoral joint; the Lysholm score focuses on activities related to the knee; and the IKDC score is a general measure of knee function. Charts were reviewed to extract patients’ clinical data, including preoperative outcome scores, medical history, physical examination data, intraoperative characteristics, and postoperative course. By telephone, patients answered questions about their postoperative clinical course and completed final follow-up questionnaires. They were also asked which sporting or fitness activity they had preferred before surgery and whether they were able to return to that activity after surgery.
Statistical analysis included the study population’s descriptive statistics. Means and SDs were reported for continuous variables, and frequencies and percentages were reported for categorical variables. Paired t tests were used to analyze changes in PROM scores. For comparison of differences between characteristics of patients who did and did not return to their previous activity level, independent-samples t tests were used for continuous variables. Chi-square tests or Fisher exact tests were used to compare discrete variables. Statistical significance was set at P ≤ .05. All analyses were performed with SPSS Version 22.0 (IBM).
Results
Table 1.Thirty-nine patients underwent PFA at our institution between 2009 and 2014. Mean age was 51.6 years. Of these patients, 84.2% were female, 28.6% had a body mass index of 30 kg/m2 or higher, and 23.4% had PFA for posttraumatic arthritis related to prior patellofemoral instability. Table 1 lists the study cohort’s demographic data.
Table 2.Table 2 lists self-reported activities limited by the affected knee before surgery, and Table 3 lists activity levels after surgery. Return to previous preferred activity was reported by 72.2% of patients, and 52.8% of patients reported returning to the same activity level or to a higher level. There were no differences in age (P = .978) or sex (P = .232) between patients who returned to the same or a higher activity level and patients who did not.
Table 3.However, mean BMI was significantly (P = .016) higher in patients who returned to the same or a higher activity level (28.6 kg/m2) than in patients who did not (23.7 kg/m2). Although the rate of posttraumatic arthritis (26%) was higher than the rate of primary osteoarthritis (19%) in patients who returned to the same or a higher activity level, this difference was not statistically significant (P = .724).
Postoperative knee-specific PROM scores and general pain score (reported by the patient on a scale of 0-10) were statistically significantly improved (P < .001 for all measures) over preoperative scores (Table 4).
Table 4.Mean follow-up was 26 months (range, 5-57 months). Kujala score improved a mean of 19.5 points; Lysholm score, 28.9 points; and IKDC score, 23.5 points. Mean general pain score improved from 6.3 before surgery to 2.8 after surgery. All PROM and pain score improvements were substantially larger than the minimal clinically important differences. Postoperative PROM scores and general pain score were significantly more improved in patients who returned to the same or a higher activity level than in patients who did not (P < .05 for all measures).
After surgery, 1 patient (2.6%) developed a pulmonary embolus, which was successfully identified and treated without incident. Five patients (10.4%) had another surgery on the same knee. Three patients (6.3%) underwent conversion to TKA: 1 for continued symptoms in the setting of newly diagnosed inflammatory arthritis, 1 for arthritic pain, and 1 for patellofemoral instability. Two patients (4.2%) underwent irrigation and débridement: 1 for hematoma and 1 for suspected (culture-negative) infection.
Discussion
Historically, the literature evaluating knee arthroplasty outcomes has focused on implant survivorship, pain relief, and patient satisfaction. Since the advent of partial knee arthroplasty options, more attention has been given to functional outcomes and return to activities after single-compartment knee resurfacing. TKA remains the gold standard by which newer, less invasive surgical options are measured. In a large prospective study, 97% of patients (age, >55 years) who had TKA for patellofemoral arthritis reported good or excellent clinical results, the majority being excellent.11 Post-TKA functional status and activity levels may not be rated as highly. After TKA, many patients switch to lower impact sports or reduce or stop their participation in sports.12 A small study of competitive adult tennis players found high levels of post-TKA satisfaction, ability to resume playing tennis, pain relief, and increased or continued enjoyment in playing.13 In a study of 355 patients (417 knees) who had underwent TKA, improvement in Knee Society function score showed a moderate correlation to an increase in weighted activity score (R = 0.362).14
Unicondylar knee arthroplasty (UKA) is becoming a popular treatment option for single-compartment tibiofemoral arthritis. A systematic review of 18 original studies of patients with knee osteoarthritis found that overall return to sports varied from 36% to 89% after TKA and from 75% to 100% after UKA.15 In another study, return-to-sports rates were similar for UKA (87%) and TKA (83%); the only significant difference was UKA patients returned quicker.16 The authors of a large meta-analysis conceded that significant heterogeneity of data prevented them from drawing definitive conclusions, but UKA patients seemed to return to low- and high-impact sports 2 weeks faster than their TKA counterparts.10 Overall, UKA and TKA patients (age, 51-71 years) had comparable return-to-sports rates at an average of 4 years after surgery.10 A smaller study corroborated faster return to sports for UKA over TKA patients and also found that, compared with TKA patients, UKA patients participated in sports more regularly and over a longer period.17 On the other hand, Walton and colleagues18 found similar return-to-sports rates but higher frequency of and satisfaction with sports participation in UKA over TKA patients.
A large retrospective study found no differences in rates of return to sports after TKA, UKA, patellar resurfacing, hip resurfacing, and total hip arthroplasty.19 Pain was the most common barrier to return. UKA patients who returned to sports tended to be younger than those who did not.20 Naal and colleagues3 found that 95% of UKA patients returned to their activities—hiking, walking, cycling, and swimming being most common. Although 90.3% of patients said surgery maintained or improved their ability to participate in sports, participation in high-impact sports (eg, running) decreased after surgery.
Outcomes of PFA vary because of evolving patient selection, implant design, surgical technique, and return-to-activity expectations.21,22 Most PFA outcome studies focus on implant survivorship, complication rates, and postoperative knee scores.23-28 PFA studies focused on return to activities are limited. Kooijman and colleagues7 and Mertl and colleagues29 reported good or excellent clinical results of PFA in 86% and 82% of patients, respectively. Neither study included a comprehensive analysis of postoperative functional status. Similarly, De Cloedt and colleagues30 reported good PFA outcomes in 43% of patients with degenerative joint disease and in 83% of patients with instability. Specific activity status was not described. Dahm and colleagues31 and Farr and colleagues32 suggested postoperative pain resolution motivates some PFA patients not only to resume preoperative activities but to start participating in new, higher level activities after pain has subsided. However, the studies did not examine the characteristics of patients who returned to baseline activities and did not examine return-to-sports rates.
Study Strengths and Limitations
Our study focused on the PFA patient population of a surgical team of 2 fellowship-trained orthopedic surgeons (specialists in treating patellofemoral pathology). Although generalization of our findings to other surgeons and different implants may be limited, the study design standardized treatment in a way that makes these findings more reliable. The 100% follow-up strengthens these findings as well. Last, though the patient population was relatively small, it was consistent with or larger than the PFA patient groups studied previously.
Conclusion
In this study, PROM and pain scores were significantly improved after PFA. That almost 75% of patients returned to their preferred activities and >50% of patients returned at the same or a higher activity level provides useful information for preoperative discussions with patients who want to remain active after PFA. Prospective studies are needed to evaluate the longevity and durability of PFA, particularly in active patients.
References
1. Laurencin CT, Zelicof SB, Scott RD, Ewald FC. Unicompartmental versus total knee arthroplasty in the same patient. A comparative study. Clin Orthop Relat Res. 1991;(273):151-156.
2. Kozinn SC, Scott R. Unicondylar knee arthroplasty. J Bone Joint Surg Am. 1989;71(1):145-150.
3. Naal FD, Fischer M, Preuss A, et al. Return to sports and recreational activity after unicompartmental knee arthroplasty. Am J Sports Med. 2007;35(10):1688-1695.
5. Lubinus HH. Patella glide bearing total replacement. Orthopedics. 1979;2(2):119-127.
6. Dy CJ, Franco N, Ma Y, Mazumdar M, McCarthy MM, Gonzalez Della Valle A. Complications after patello-femoral versus total knee replacement in the treatment of isolated patello-femoral osteoarthritis. A meta-analysis. Knee Surg Sports Traumatol Arthrosc. 2012;20(11):2174-2190.
7. Kooijman HJ, Driessen AP, van Horn JR. Long-term results of patellofemoral arthroplasty. A report of 56 arthroplasties with 17 years of follow-up. J Bone Joint Surg Br. 2003;85(6):836-840.
8. Baker PN, Refaie R, Gregg P, Deehan D. Revision following patello-femoral arthroplasty. Knee Surg Sports Traumatol Arthrosc. 2012;20(10):2047-2053.
9. Lonner JH, Bloomfield MR. The clinical outcome of patellofemoral arthroplasty. Orthop Clin North Am. 2013;44(3):271-280.
10. Papalia R, Del Buono A, Zampogna B, Maffulli N, Denaro V. Sport activity following joint arthroplasty: a systematic review. Br Med Bull. 2012;101:81-103.
11. Mont MA, Haas S, Mullick T, Hungerford DS. Total knee arthroplasty for patellofemoral arthritis. J Bone Joint Surg Am. 2002;84(11):1977-1981.
12. Chatterji U, Ashworth MJ, Lewis PL, Dobson PJ. Effect of total knee arthroplasty on recreational and sporting activity. ANZ J Surg. 2005;75(6):405-408.
13. Mont MA, Rajadhyaksha AD, Marxen JL, Silberstein CE, Hungerford DS. Tennis after total knee arthroplasty. Am J Sports Med. 2002;30(2):163-166.
14. Marker DR, Mont MA, Seyler TM, McGrath MS, Kolisek FR, Bonutti PM. Does functional improvement following TKA correlate to increased sports activity? Iowa Orthop J. 2009;29:11-16.
15. Witjes S, Gouttebarge V, Kuijer PP, van Geenen RC, Poolman RW, Kerkhoffs GM. Return to sports and physical activity after total and unicondylar knee arthroplasty: a systematic review and meta-analysis. Sports Med. 2016;46(2):269-292.
16. Ho JC, Stitzlein RN, Green CJ, Stoner T, Froimson MI. Return to sports activity following UKA and TKA. J Knee Surg. 2016;29(3):254-259.
17. Hopper GP, Leach WJ. Participation in sporting activities following knee replacement: total versus unicompartmental. Knee Surg Sports Traumatol Arthrosc. 2008;16(10):973-979.
18. Walton NP, Jahromi I, Lewis PL, Dobson PJ, Angel KR, Campbell DG. Patient-perceived outcomes and return to sport and work: TKA versus mini-incision unicompartmental knee arthroplasty. J Knee Surg. 2006;19(2):112-116.
19. Wylde V, Blom A, Dieppe P, Hewlett S, Learmonth I. Return to sport after joint replacement. J Bone Joint Surg Br. 2008;90(7):920-923.
20. Pietschmann MF, Wohlleb L, Weber P, et al. Sports activities after medial unicompartmental knee arthroplasty Oxford III—what can we expect? Int Orthop. 2013;37(1):31-37.
28. Leadbetter WB, Seyler TM, Ragland PS, Mont MA. Indications, contraindications, and pitfalls of patellofemoral arthroplasty. J Bone Joint Surg Am. 2006;88(suppl 4):122-137.
29. Mertl P, Van FT, Bonhomme P, Vives P. Femoropatellar osteoarthritis treated by prosthesis. Retrospective study of 50 implants [in French]. Rev Chir Orthop Reparatrice Appar Mot. 1997;83(8):712-718.
30. De Cloedt P, Legaye J, Lokietek W. Femoro-patellar prosthesis. A retrospective study of 45 consecutive cases with a follow-up of 3-12 years [in French]. Acta Orthop Belg. 1999;65(2):170-175.
31. Dahm DL, Al-Rayashi W, Dajani K, Shah JP, Levy BA, Stuart MJ. Patellofemoral arthroplasty versus total knee arthroplasty in patients with isolated patellofemoral osteoarthritis. Am J Orthop. 2010;39(10):487-491.
32. Farr J, Arendt E, Dahm D, Daynes J. Patellofemoral arthroplasty in the athlete. Clin Sports Med. 2014;33(3):547-552.
If you missed the recent headlines, Why Patients Delay Medical Payments: 12 findings1 and You think your health insurance costs too much. Try being a farmer.2, you may not be too worried about your ever-rising accounts receivables. But you should be.
The facts in these stories and the 2017 Employer Health Benefits Survey,3 released on September 19 by the non-partisan Kaiser Family Foundation and Health Research & Educational Trust (HRET), are alarming. Let’s look at some of the survey results.
Since 2007, the average family premium has increased 55% and the average worker contribution toward the premium has increased 74%.3 How does that translate into dollars and cents? Well, the average annual premiums this year are $6690 for single coverage and $18,764 for family coverage.
What does that mean exactly to the farm couple in the Crain’s story? The farmer who “will be lucky to net $75,000” on his hay crop this year has a policy premium with Blue Cross Blue Shield of Illinois that was $22,000 last year. And then there is a $5000 deductible for each him and his wife. Do the math: it means they’d spend 43% of their income before health insurance covers anything.
Do premiums vary significantly by firm size or region? Should surgeons in certain areas of the country be less concerned about these trends? No, the premiums don’t significantly vary by size or region.
The point here is not to write an essay about health insurance premiums, but rather to discuss what this economic reality means to patients who are seeing you tomorrow, next week, and next month. Given these economic realities, what is their attitude about your bill?
For insight, let’s look at an Advisory Board Company brief, “Minimizing Bad Debt: Point-of-Service Collections,”4 which states: “Patient propensity to pay decreases as patient obligation increases.” According to the brief, “Our analysis indicates that as the dollar value of a patient’s obligation increases, their propensity to pay any portion of the obligation decreases—for all patients, at all income levels.” See Figure 1.
Figure 1.
Given that market statistics show that more than a quarter of the commercially insured patients are covered by high deductible health plans (HDHPs), your practice must adapt to these changing times.
Review Your Pay or Mix
Smart practice administrators will keep their finger on the pulse of the insurance local market as more employers move toward offering HDHPs or health savings accounts. Knowing what the largest manufacturers are offering, along with local hospitals that are typically sizable employers in most communities, is critical. The coverage for school systems, police departments, fire departments, and governments should also be the practice radar.
A recent West Corporation survey5 reveals more about the demographic profile of patients who are less likely to pay or delay payments. Their study shows that 79% of patients cite affordability as the largest healthcare problem with 93% of patients saying it costs too much. So it should be no surprise that 67% say their financial situation makes it challenging to submit timely payments. If you are not familiar with the company name, you’ll be familiar with West Corporation’s products, like Televox, which are automated tools used by practices to remind patients about appointments and copays.
Here are other relevant findings from the West Corporation survey:
56% delay payments of medical bills at least some of the time.
70% of millennials have missed medical payment deadlines.
42% of patients cite their HDHP as the reason for delaying their payments.
36% of patients said they have difficulty remembering to make timely medical payments.
Figure 2.What West Corporation reported about the 23% of providers who habitually talk about patient’s ability before delivering services is similar to the Medscape Orthopedist Compensation survey report of April 1, 2016 (Figure 2).6
It’s no surprise that orthopedic surgeons are not discussing fees with patients. Although only 9% admitted that they don’t discuss costs with patients, it is safe to estimate that few surgeons have their fee schedules memorized.
In a 2013 article, Ubel and colleagues7 said, “Because treatments can be ‘financially toxic,’ physicians need to disclose the financial consequences of treatment alternatives just as they inform patients about treatments’ side effects.”
While uniquely qualified to discuss treatment options, few orthopedic surgeons have the time or the facts to personally discuss fees, out-of-pocket expenses, uncovered services and payment plans. Detailed discussions about patients’ financial liabilities are better done by qualified staff, who verify benefits and use modern technology tools to generate an electronic “estimate of costs and benefits.”
Target Your Efforts
What steps can your practice take to help patients pay their portion, even when it’s large, as well as help your practice reduce receivables and avoid collection problems and bad debt write-offs?
Start by analyzing the top Current Procedural Terminology (CPT) codes with patient responsibility, so you can focus your efforts. One such analysis, conducted by our firm, is shown in Figure 3. Although you might think the highest percent of patient financial responsibilities are for surgical procedures, notice that 4 of the top 5 services this practice identified as having the highest amount of patient collectible dollars are rendered in the office-carpal tunnel surgery being the only exception.
Figure 3.
Table.Next, take a look at the total amount of outstanding receivables that are patient responsibility. This requires generating the accounts receivable report in a way that shows insurance receivables and patient receivables separately. The Table provides an example report. It illustrates that $92,000 of the practice’s receivables is patient responsibility. Although $92,000 is only 17% of the total accounts receivable, it is real money, not charges, which is inflated by the practice fee schedule. The $92,000 is money that is 100% collectible, unlike the charges of $436,500, which, if the practice sets its fee schedule as a multiple of Medicare, as many do, will have 50% or more contractually adjusted after reimbursement is received.
Figure 4.Third, analyze the patient balances outstanding, to determine your approach for your patient collection effort. For instance, in Figure 4, 42% of the outstanding patient balances are <$100. That indicates a need for the practice to implement point of service collections since; at least 70% of these amounts could have been collected before the patient left the office.
Take Action
After conducting a thorough analysis and reviewing the results, here are 5 actionable steps your practice could take:
1. Make sure your patient portal has the capacity to take patient payments. Offering online payment options increases the opportunity for patients to pay. Promote this option on the patient statement.
2. Implement a system of collecting from patients before they leave the office. After a new visit, which involves a more expensive evaluation and management code, and possibly imaging and durable medical device, counsel patients to leave a credit card on file, so the minute insurance pays, their credit card can be charged.
The 2017 Navicure Patient Payment Check-Up survey8 conducted by Healthcare Information and Management Systems Society (HIMSS) Analytics shows that 78% of patients would provide a card to be charged for one time up to $200. Think about the previously illustrated collection amounts this would alleviate.
3. Provide all surgery patients with a cost estimate. Generating cost estimates has been possible for close to 10 years. It’s done through your clearinghouse and practice management software by entering the CPT codes and diagnosis codes, along with the patient’s information. Save time and avoid tying staff up on hold.
According to the Navicure Patient Payment Check-Up survey,8 75% of provider organizations are able to provide a cost estimate upon request. It makes good business sense.
4. Collect a pre-treatment or pre-surgery scheduling deposit. In the KarenZupko & Associates/American Academy of Orthopaedic Surgeons (AAOS) pre-course survey of those attending the 2017 coding and reimbursement workshops, 55% of orthopedic practices reported that they have instituted such a practice. With the proliferation of HDHPs, asking for a scheduling deposit is fast becoming a must for all surgeons.
5. Offer patients a healthcare financing option through a third party. In response to another pre-course survey question, about offering CareCredit or another healthcare credit card, 28% of orthopedic practices say they do. Still, that leaves >70% of the orthopedic patients without a financing option. Given the reality of high deductible HDHPs and the patient responsibilities going uncollected, it’s time surgeons take a look at financing. It’s a fool’s wish to believe the practice is “saving” the service fee by sending dozens of statements, having staff make calls, and ultimately writing off unpaid balances as uncollectible.
Practices that fail to change, will fail to prosper. Those who have technology-phobic staff will suffer as healthcare continues to automate. Practices led by surgeons like one recently interviewed who said, “If patients knew how much it cost, they’d never schedule” will see patient accounts receivable soar and patient online ratings sink. The first quarter of 2018 means the number of patients with HDHPs will increase and that deductibles will have to be met. It’s wise to have a full staff meeting, share the facts, and put an action plan in place.
References
1. Gooch K. Why patients delay medical payments: 12 findings. Becker’s ASC. https://www.beckershospitalreview.com/finance/why-patients-delay-medical-payments-12-findings.html. Published August 28, 2017.
2. Murphy HL. You think your health insurance costs too much. Try being a farmer. Crain’s Chicago Business. http://www.chicagobusiness.com/article/20170929/ISSUE01/170929835. Published September 29, 2017. Accessed October 2, 2017.
3. 2017 Employer Health Benefits Survey. The Henry J. Kaiser Family Foundation and the Health Research & Educational Trust (HRET). https://www.kff.org/health-costs/report/2017-employer-health-benefits-survey/. Published September 19, 2017.
4. Minimizing Bad Debt: Point-of-Service Collections. The Advisory Board Company. https://www.advisory.com/-/media/Advisory-com/Research/FLC/Resources/2015/CFO-Brief-POS.pdf. Published August 21, 2015.
5. Optimizing Revenue: Solving Healthcare’s Revenue Cycle Challenges Using Technology-Enabled Communications. West Corporation. https://cdn2.hubspot.net/hubfs/402746/Assets/West%20Assets/Optimizing%20Revenue%20Report/Reports%20and%20Handouts/WEST-Optimizing%20Revenue%20Report%20final.pdf?t=1508789915319. Accessed October 26, 2017.
6. Peckham C. Medscape Orthopedist Compensation Report 2016. Medscape. https://www.medscape.com/features/slideshow/compensation/2016/orthopedics. Published April 1, 2016.
7. Ubel PA, Abernathy AP, Zafar SY. Full disclosure - out-of-pocket costs as side effects. N Engl J. Med. 2013;369:1484-1486. doi:10.1056/NEJMp1306826.
If you missed the recent headlines, Why Patients Delay Medical Payments: 12 findings1 and You think your health insurance costs too much. Try being a farmer.2, you may not be too worried about your ever-rising accounts receivables. But you should be.
The facts in these stories and the 2017 Employer Health Benefits Survey,3 released on September 19 by the non-partisan Kaiser Family Foundation and Health Research & Educational Trust (HRET), are alarming. Let’s look at some of the survey results.
Since 2007, the average family premium has increased 55% and the average worker contribution toward the premium has increased 74%.3 How does that translate into dollars and cents? Well, the average annual premiums this year are $6690 for single coverage and $18,764 for family coverage.
What does that mean exactly to the farm couple in the Crain’s story? The farmer who “will be lucky to net $75,000” on his hay crop this year has a policy premium with Blue Cross Blue Shield of Illinois that was $22,000 last year. And then there is a $5000 deductible for each him and his wife. Do the math: it means they’d spend 43% of their income before health insurance covers anything.
Do premiums vary significantly by firm size or region? Should surgeons in certain areas of the country be less concerned about these trends? No, the premiums don’t significantly vary by size or region.
The point here is not to write an essay about health insurance premiums, but rather to discuss what this economic reality means to patients who are seeing you tomorrow, next week, and next month. Given these economic realities, what is their attitude about your bill?
For insight, let’s look at an Advisory Board Company brief, “Minimizing Bad Debt: Point-of-Service Collections,”4 which states: “Patient propensity to pay decreases as patient obligation increases.” According to the brief, “Our analysis indicates that as the dollar value of a patient’s obligation increases, their propensity to pay any portion of the obligation decreases—for all patients, at all income levels.” See Figure 1.
Figure 1.
Given that market statistics show that more than a quarter of the commercially insured patients are covered by high deductible health plans (HDHPs), your practice must adapt to these changing times.
Review Your Pay or Mix
Smart practice administrators will keep their finger on the pulse of the insurance local market as more employers move toward offering HDHPs or health savings accounts. Knowing what the largest manufacturers are offering, along with local hospitals that are typically sizable employers in most communities, is critical. The coverage for school systems, police departments, fire departments, and governments should also be the practice radar.
A recent West Corporation survey5 reveals more about the demographic profile of patients who are less likely to pay or delay payments. Their study shows that 79% of patients cite affordability as the largest healthcare problem with 93% of patients saying it costs too much. So it should be no surprise that 67% say their financial situation makes it challenging to submit timely payments. If you are not familiar with the company name, you’ll be familiar with West Corporation’s products, like Televox, which are automated tools used by practices to remind patients about appointments and copays.
Here are other relevant findings from the West Corporation survey:
56% delay payments of medical bills at least some of the time.
70% of millennials have missed medical payment deadlines.
42% of patients cite their HDHP as the reason for delaying their payments.
36% of patients said they have difficulty remembering to make timely medical payments.
Figure 2.What West Corporation reported about the 23% of providers who habitually talk about patient’s ability before delivering services is similar to the Medscape Orthopedist Compensation survey report of April 1, 2016 (Figure 2).6
It’s no surprise that orthopedic surgeons are not discussing fees with patients. Although only 9% admitted that they don’t discuss costs with patients, it is safe to estimate that few surgeons have their fee schedules memorized.
In a 2013 article, Ubel and colleagues7 said, “Because treatments can be ‘financially toxic,’ physicians need to disclose the financial consequences of treatment alternatives just as they inform patients about treatments’ side effects.”
While uniquely qualified to discuss treatment options, few orthopedic surgeons have the time or the facts to personally discuss fees, out-of-pocket expenses, uncovered services and payment plans. Detailed discussions about patients’ financial liabilities are better done by qualified staff, who verify benefits and use modern technology tools to generate an electronic “estimate of costs and benefits.”
Target Your Efforts
What steps can your practice take to help patients pay their portion, even when it’s large, as well as help your practice reduce receivables and avoid collection problems and bad debt write-offs?
Start by analyzing the top Current Procedural Terminology (CPT) codes with patient responsibility, so you can focus your efforts. One such analysis, conducted by our firm, is shown in Figure 3. Although you might think the highest percent of patient financial responsibilities are for surgical procedures, notice that 4 of the top 5 services this practice identified as having the highest amount of patient collectible dollars are rendered in the office-carpal tunnel surgery being the only exception.
Figure 3.
Table.Next, take a look at the total amount of outstanding receivables that are patient responsibility. This requires generating the accounts receivable report in a way that shows insurance receivables and patient receivables separately. The Table provides an example report. It illustrates that $92,000 of the practice’s receivables is patient responsibility. Although $92,000 is only 17% of the total accounts receivable, it is real money, not charges, which is inflated by the practice fee schedule. The $92,000 is money that is 100% collectible, unlike the charges of $436,500, which, if the practice sets its fee schedule as a multiple of Medicare, as many do, will have 50% or more contractually adjusted after reimbursement is received.
Figure 4.Third, analyze the patient balances outstanding, to determine your approach for your patient collection effort. For instance, in Figure 4, 42% of the outstanding patient balances are <$100. That indicates a need for the practice to implement point of service collections since; at least 70% of these amounts could have been collected before the patient left the office.
Take Action
After conducting a thorough analysis and reviewing the results, here are 5 actionable steps your practice could take:
1. Make sure your patient portal has the capacity to take patient payments. Offering online payment options increases the opportunity for patients to pay. Promote this option on the patient statement.
2. Implement a system of collecting from patients before they leave the office. After a new visit, which involves a more expensive evaluation and management code, and possibly imaging and durable medical device, counsel patients to leave a credit card on file, so the minute insurance pays, their credit card can be charged.
The 2017 Navicure Patient Payment Check-Up survey8 conducted by Healthcare Information and Management Systems Society (HIMSS) Analytics shows that 78% of patients would provide a card to be charged for one time up to $200. Think about the previously illustrated collection amounts this would alleviate.
3. Provide all surgery patients with a cost estimate. Generating cost estimates has been possible for close to 10 years. It’s done through your clearinghouse and practice management software by entering the CPT codes and diagnosis codes, along with the patient’s information. Save time and avoid tying staff up on hold.
According to the Navicure Patient Payment Check-Up survey,8 75% of provider organizations are able to provide a cost estimate upon request. It makes good business sense.
4. Collect a pre-treatment or pre-surgery scheduling deposit. In the KarenZupko & Associates/American Academy of Orthopaedic Surgeons (AAOS) pre-course survey of those attending the 2017 coding and reimbursement workshops, 55% of orthopedic practices reported that they have instituted such a practice. With the proliferation of HDHPs, asking for a scheduling deposit is fast becoming a must for all surgeons.
5. Offer patients a healthcare financing option through a third party. In response to another pre-course survey question, about offering CareCredit or another healthcare credit card, 28% of orthopedic practices say they do. Still, that leaves >70% of the orthopedic patients without a financing option. Given the reality of high deductible HDHPs and the patient responsibilities going uncollected, it’s time surgeons take a look at financing. It’s a fool’s wish to believe the practice is “saving” the service fee by sending dozens of statements, having staff make calls, and ultimately writing off unpaid balances as uncollectible.
Practices that fail to change, will fail to prosper. Those who have technology-phobic staff will suffer as healthcare continues to automate. Practices led by surgeons like one recently interviewed who said, “If patients knew how much it cost, they’d never schedule” will see patient accounts receivable soar and patient online ratings sink. The first quarter of 2018 means the number of patients with HDHPs will increase and that deductibles will have to be met. It’s wise to have a full staff meeting, share the facts, and put an action plan in place.
References
1. Gooch K. Why patients delay medical payments: 12 findings. Becker’s ASC. https://www.beckershospitalreview.com/finance/why-patients-delay-medical-payments-12-findings.html. Published August 28, 2017.
2. Murphy HL. You think your health insurance costs too much. Try being a farmer. Crain’s Chicago Business. http://www.chicagobusiness.com/article/20170929/ISSUE01/170929835. Published September 29, 2017. Accessed October 2, 2017.
3. 2017 Employer Health Benefits Survey. The Henry J. Kaiser Family Foundation and the Health Research & Educational Trust (HRET). https://www.kff.org/health-costs/report/2017-employer-health-benefits-survey/. Published September 19, 2017.
4. Minimizing Bad Debt: Point-of-Service Collections. The Advisory Board Company. https://www.advisory.com/-/media/Advisory-com/Research/FLC/Resources/2015/CFO-Brief-POS.pdf. Published August 21, 2015.
5. Optimizing Revenue: Solving Healthcare’s Revenue Cycle Challenges Using Technology-Enabled Communications. West Corporation. https://cdn2.hubspot.net/hubfs/402746/Assets/West%20Assets/Optimizing%20Revenue%20Report/Reports%20and%20Handouts/WEST-Optimizing%20Revenue%20Report%20final.pdf?t=1508789915319. Accessed October 26, 2017.
6. Peckham C. Medscape Orthopedist Compensation Report 2016. Medscape. https://www.medscape.com/features/slideshow/compensation/2016/orthopedics. Published April 1, 2016.
7. Ubel PA, Abernathy AP, Zafar SY. Full disclosure - out-of-pocket costs as side effects. N Engl J. Med. 2013;369:1484-1486. doi:10.1056/NEJMp1306826.
Patella alta has a reduced articular area of PF contact.
Presence of patella alta depends on the measurement method.
Patella alta is defined as ISI >1.2 and CDI >1.2 to >1.3.
On sagittal MRI, PTI is used most often with cutoff values of <0.125 to 0.28.
Tibial tubercle distalization is most often used to treat patella alta. The desired postoperative patellar height is a CDI of 1.0.
Patella alta is a patella that rides abnormally high in relation to the femur, the femoral trochlea, or the tibia,1 with decreased bony stability requiring increased knee flexion angles to engage the trochlea.2,3 An abnormally high patella may therefore insufficiently engage the proximal trochlea groove both in extension and in the early phase of knee flexion—making it one of the potential risk factors for patellar instability.4-10 Accordingly, patella alta is present in 30% of patients with recurrent patellar dislocation.11 It also occurs in other disorders, such as knee extensor apparatus disorders, in patients with patellofemoral (PF) pain, chondromalacia, Sinding-Larsen-Johansson disease, Osgood-Schlatter disease, patellar tendinopathy, and osteoarthritis.1,7,8,12-18 As such, patella alta represents an important predisposing factor for patellar malalignment and PF-related complaints. On the other hand, patella alta may also be a normal variant of a person’s knee anatomy and may be well tolerated when not combined with other instability factors.4
Despite the importance of patella alta, there is no consensus on a precise definition, the most reliable measurement method, or the factors thought to be important in clinical decisions regarding treatment. To address this issue, we systematically reviewed the patella alta literature for definitions, the most common measurement methods and their patella alta cutoff values, and cutoff values for surgical correction and proposed surgical techniques.
Methods
In February 2017, using the term patella alta, we performed a systematic literature search on PubMed. Inclusion criteria were original study or review articles, publication in peer-reviewed English-language journals between 2000 and 2017, and narrative description or measurement of human patellar height on plain radiographs or magnetic resonance imaging (MRI). Excluded were abstracts and articles in languages other than English; animal and computational/biomechanical studies; case reports; and knee arthroplasties, knee extensor ruptures, and hereditary and congenital diseases. All evidence levels were included.
We assessed measurement methods, reported cutoff values for patella alta, cutoff values for performing surgical correction, proposed surgical techniques, and postoperative target values. Original study articles and review articles were analyzed separately.
Results
Of 211 articles identified, 92 met the inclusion criteria for original study, and 28 for review. All their abstracts were reviewed, and 91 were excluded: 17 for language other than English, 11 for animal study, 12 for biomechanical/computational study, 20 for case report, 8 for arthroplasty, 13 for hereditary or congenital disease, 1 for extensor apparatus rupture, 3 for editorial letter, and 6 for other reasons. Full text copies of all included articles were obtained and reviewed.
Original Study Articles
Definition. Of the 92 original study articles, 17 (18.5%) defined patella alta by description alone, and 75 (81.5%) used imaging-based measurements. Patella alta was described as a patella that rides abnormally high in relation to the trochlear groove, with a reduced articular area of PF contact1,15,19-21 or decreased patella–trochlea cartilage overlap.22 With this reduced contact area, there is increased PF stress.21
With radiographic measurements, patella alta is defined as a Caton-Deschamps index (CDI) of >1.2 to >1.3, an Insall-Salvati index (ISI) of >1.2, a Blackburne-Peel index (PBI) of >1.0,4,15,18,23-25 and a patellotrochlear index (PTI) of <0.125 to 0.28.6,26
Table 1.
Table 2.Measurement Methods. Four different patella alta measurement methods were used: lateral radiographs with corresponding ratios (68 studies, 5 indices, Table 1), radiographic ratios measured on MRI (23 studies, 3 indices, Table 2), sagittal MRI (13 studies, 4 methods, Table 3), and patellar tendon length (PTL) measurements (11 studies, 5 methods, Table 4). In 26 studies, multiple measurement methods were used.
Table 3.
Table 4.
On lateral radiographs, ISI was the most common measurement (33 studies), with patella alta cutoff values ranging from >1.2 to >1.5. The second most common measurement was CDI (24 studies), with cutoff values of >1.2 to >1.3. Other indices, such as the modified ISI (6 studies), the BPI (1 study), and the Koshino index (2 studies), had their cutoff values used more consistently (>1.6 to >2.4, >1.0, and >1.2, respectively) but these indices were rarely reported in the literature (Table 1).27,28,29
Thirty-six studies defined patella alta with MRI using either the aforementioned radiographic ratios (23 studies, 3 indices, Table 2) or PF indices (13 studies, 4 methods, Table 3).30
On sagittal MRI, PTI was used most often; cutoff values were <0.125 to 0.28.
Thirteen studies defined patella alta with PTL: 5 using lateral conventional radiographs and 8 using sagittal MRI. For each type of imaging, the cutoff value was >52 mm to >56 mm. PTL was measured either independently or together with ISI on sagittal MRI (Table 4).
Table 5.Treatments. For patella alta, the surgical treatment goals are to increase the PF contact area and improve PF articular congruence and thereby increase PF stability.31-33 Four different procedures were used to treat patella alta (Table 5), but only 11 of the 92 studies included in our review mentioned a specific patellar height that required surgical correction (Table 5, Table 6). Recommendations were based on CDI (>1.2 to >1.4)34 and less often on ISI (>1.2)13 or PTL (>56 mm).22 Only 1 study defined how much distalization was necessary with the procedure.22
Table 6.
Review Articles
Twenty-eight review articles met the inclusion criteria.35-40 Patella alta was described mostly with ISI (75%) or CDI (64%). In up to 57% of these articles, a patella alta reference value was missing. Only 1 article mentioned different cutoff values for conventional radiographs and MRI. BPI was mentioned in 50% of studies, but only 2 indicated a cutoff value for patella alta. Eleven percent used PTI on sagittal MRI and took patella–trochlea cartilage overlap into account.
Eight review articles mentioned cutoff values for surgical correction. Only 1 of 4 articles mentioned a cutoff value for correcting patella alta in PF instability, and only 2 articles suggested an ideal postoperative patellar height (Table 6).
No review article relied on PTL to describe patella alta or to advise surgical treatment.
Discussion
Our review revealed many variations in patella alta definitions and descriptions, measurement methods, cutoff values, and treatment options. Interpretation of patellar height and, particularly, patella alta is very heterogeneous. Accordingly, comparing surgical indications, surgical treatment options, and outcomes across studies can be difficult.
Measurement Methods
Radiographs. Conventional radiographs were used to describe patella alta in two-thirds of the original study articles. The most common measurement methods marked the position of the patella relative to either the femur (direct assessment) or the tibia (indirect assessment).14,25 All established measurement methods use lateral radiographs, which do not show articular cartilage.11,14 Therefore, lateral radiograph ratios of different and variable bony landmarks do not measure actual PF articular congruence. The widely variable morphologies of patella (distal patellar nose, different articulating surface), femoral trochlea (facet in height and length), proximal tibia (inherited or acquired deformities on tibial tubercle), and slope are all confounding factors that may affect measurement (Figure 1). In addition, specific variations in PF joint morphology (eg, small patellar articular surface, short trochlea) are not well represented by these ratios.11
Figure 1.
All these methods have advantages, limitations, and different values of interobserver and intraobserver variability, reliability, and reproducibility (Table 7).29,41
Table 7.
Determination of both patellar height and patella alta depends on the measurement method used and is significantly affected by anatomical variants, such as extra-articular patella and femorotibial landmarks.
The ISI method is most commonly used because it does not depend on degree of knee flexion, is thought to measure the relative length of the patellar tendon the best,5 and has established MRI criteria.6 However, ISI has limitations: Its distal bony landmark is the tibial tuberosity, which can be difficult to assess14; the shape of the patella (mainly its inferior point) varies42; and the measurement does not change after distalization of the tibial tubercle.5
CDI is the most accurate diagnostic method because it relies on readily identifiable and reproducible anatomical landmarks; does not depend on radiograph quality, knee size, radiologic enlargement, or position of the tibial tubercle or patellar modification; and is unaffected by degree of knee flexion between 10° and 80°.38,43 CDI is the method that is most useful in describing patellar height after distalization of the tibial tubercle because it assesses the height of the patella relative to the tibial plateau.5 CDI is limited with respect to clear identification of the patellar and tibial articular margin.37
BPI has the lowest interobserver variability and discriminates best among patella alta, norma, and infera.41 Like CDI, BPI assesses patellar height relative to the tibial plateau, and thus is useful in describing patellar height after distalization of the tibial tubercle.5 BPI is limited in that it uses a line drawn along the tibial plateau, where variations in inclination and tibial slope produce inaccuracies,14 and depends highly on projection angles. Clinically, BPI is rarely used.
As the literature shows, the radiologic methods of determining patellar height are variable and unreliable and depend on the ratio used.26,41 These methods do not reveal precise information about the PF articular congruence, the key finding for necessary treatment.
Radiographic Indices on MRI. Some studies measured radiographic indices on sagittal MRI. Radiologic and MRI measurements are described as not significantly different or slightly different, and 0.09 to 0.13 needs to be added with ISI and BP ratios on radiographs, MRI, and computed tomography (CT).17,44-47 ISI is commonly used, and its clinical application is easy. Although classically measured on plain radiographs, ISI is reliably measured on MRI as well.17,30 The traditional 1.2 threshold for defining patella alta was used by Charles and colleagues.44 CDI is equally well measured on radiographs and MRI.47
Figure 2.MRI. Patellar height is reliably measured on sagittal MRI (Figure 2).6,14,26 The major advantage of sagittal MRI is that it shows the cartilage of the PF joint, and therefore patellar height can be assessed using patella–trochlea cartilage overlap,6,14,26,41 the clinical factor most relevant to patella alta.14
According to the literature, 3 different measurement methods have been used to describe degree of patella–trochlea cartilage overlap: PTI, sagittal patellofemoral engagement (SPE), and patellar articular overlap (PAO).1,11,26
PTI uses the true articular cartilage patella–trochlea relationship for measurement of patellar height on sagittal MRI in extension (Figure 3). If the patellar tendon is fully out to length (no laxity), PTI reliably and precisely determines the exact articular correlation of PF joint and patellar height.6
Figure 3.
SPE is similar to percentage of articular coverage.1,11 Patellar overlap of the trochlea is measured on 2 different sagittal MRI images: 1 with the greatest length of patellar cartilage and 1 with the greatest length of femoral trochlear cartilage. This measurement did not correlate with CDI.1 SPE was not evaluated in control studies, and normal and pathologic values are unavailable.
PAO is measured with patients positioned at rest and in standard knee coils.1 MRI was not obtained in full extension or with quadriceps activation, and knee flexion angle values are unavailable. Total patellar articular length was measured on the sagittal MRI that showed the greatest patellar length and articular cartilage thickness. The same image was used to measure articular overlap, or the length of patellar cartilage overlying the trochlear cartilage, as measured parallel to the subchondral surface of the patella. PAO correlates well with conventional patellar height measurements in the sagittal plane and shows promise as a simpler alternative to the conventional indices.1 Normal and pathologic values are unavailable.
So far, PTI is the only method that was controlled in several studies, assessed for its reliability, and compared with other patellar height measurements.6,14
Figure 4.Ten original study and 3 review articles mentioned PTI as a favorite diagnostic tool for patellar height (Figures 4A, 4B).6,14,40,48,49 SPE and PAO have no validated cutoff values and have not been compared with other patellar height measurements in patients with PF instability or in control patients. In addition, nontrivial technical limitations have been discussed in the literature (Table 8). Therefore, only PTI has proved valuable in measuring patella alta.
Table 8.
Patellar Tendon Length. PTL can be measured on lateral radiographs or sagittal MRI. Radiologic and MRI measurements are described as not significantly different47 or slightly different, and 0.09 to 0.13 needs to be added with the ISI ratio on radiographs, MRI, and CT.46 PTL is reliably evaluated with ISI.41,50 There is a weak correlation of patient height and PTL: Taller people have normally longer tendons.51-53
Figure 5.Some authors have used MRI to measure PTL because MRI 3-dimensionally depicts the patellar tendon and associated anatomy.46,54 The reliability of patellar tendon measurement on MRI is improved relative to radiographs because of improved soft-tissue contrast and cross-sectional depiction (Figure 5).46,54,55
PTL measurements revealed that the posterior surface of the patellar tendon was significantly shorter than the anterior surface. Compared with their corresponding posterior fascicles, anterior fascicles are longer; their attachment is more proximal to the patella and more distal to the tibia. In addition, posterior PTL is significantly shorter with the posterior patellar attachment (adheres to posterior aspect of the inferior patellar pole) than with the anterior attachment (adheres to anterior aspect of the inferior patellar pole).56 Moreover, the lateral and medial fascicles are longer than the central fascicles attaching at the most inferior patellar pole. This issue must be considered in image cut selection (Figures 6A, 6B). Furthermore, type of inferior pole of patella (pointed, intermediate, blunt) is important in measurement.56 Overall, mean (SD) PTL was 54.9 (1.2) mm on the anterior surface and 35.0 (0.6) mm on the posterior surface.
Figure 6.
It is important to precisely describe the measurement method and location (sagittal cut) and to consider the shape of the inferior patellar pole and the site of the patellar tendon attachment.56
Treatments. For patella alta, the surgical treatment goals are to increase the PF contact area and improve PF articular congruence, and thereby increase PF stability.31-33 Four different procedures were used to treat patella alta (Table 5), but only 11 of the 92 original study articles and 8 of the 28 review articles included in our review mentioned a specific patellar height that required surgical correction (Tables 5, 6). Recommendations were based on CDI (>1.2 to >1.4) and less often on ISI (>1.2 to >1.4) or PTL (>56 mm).
Tibial tubercle distalization is effective in normalizing patellar height to correct the patellar index in patella alta (Figures 7A, 7B).13,18,38,55,57 Tibial tubercle distalization and patellar tendon tenodesis attached to the original insertion normalize PTL and stabilize the PF joint in patients with patella alta.5,47 In a comparison of these surgical procedures, cartilage stress was lower with distalization than with distalization and tenodesis.13
Figure 7.
Soft-tissue methods are recommended in children, as bone procedures injure the proximal tibial physis and may cause it to close prematurely.58 The patella can be distally advanced by completely mobilizing the patellar tendon and fixating with sutures through the cartilaginous tibial tubercle. This technique is a satisfactory treatment for skeletally immature patients who present with habitual patellar dislocation associated with patella alta.58,59
CDI and BPI assess patellar height relative to the tibial plateau, and therefore are the most useful measurement methods for patellar height after distalization of the tibial tubercle.5 ISI does not change after distalization of the tibial tubercle and cannot be recommended.5,18 As PF indices (eg, PTI) can trace preoperative and postoperative values, these measurements are valuable.
Controversies
Our review found no consensus on measurement method or cutoff value. No measurement method showed clear clinical or methodologic superiority. Most published patellar height and patella alta data are based on conventional radiographs using a tibial reference point, even though a femoral or even trochlear reference point seems more reproducible, particularly in PF pathologies. Several cutoff values have been reported for each patella alta measurement method. Regarding pathologic thresholds, which might require surgical correction, very little information has been published, and scientific evidence is lacking. Numerous important aspects remain unanswered after this review, and clarification is mandatory.
Five Key Facts
1. In patella alta assessment, different morphologic, biomechanical, and functional aspects must be considered. The most relevant aspect is decreased engagement of the patella and trochlea,4-9,11,26 which results in decreased bony stability in knee extension.1-3 Therefore, patella alta is one of the potential risk factors for patellar instability with a high percentage of recurrent patellar dislocation.4-9 In early knee flexion, the patella translates more distally with better engagement of the patella in the trochlea and better stability. Therefore, measurement in extension, with the patellar tendon out to length, seems to offer a more reliable assessment of the patella–femur relationship.
2. Insufficient engagement of the patella in the trochlea is the most important aspect of patella alta.11 Therefore, direct measurement of this engagement seems logical.
3. As radiographs do not show articular cartilage, they should not be used to assess the articular patella–femur relationship.11,14,26 Patella–trochlea cartilage overlap is the most relevant factor for patella alta and should be measured on MRI.6,14,26,32
4. PTL is an important factor for patellar height and particularly patella alta. The range of normal PTL values is wide: 35 mm to 61 mm. The described cutoff values for patella alta (>52 mm to >56 mm) fall within this normal range. The cause may be the different measurement methods used.33,47,59-61 Therefore, for precise diagnostics, a standardized measurement method that includes the selected cut imaging is mandatory.
Table 9.5. Despite the relevance of surgical correction, investigators have reported only a few values for the postoperative position of the patella with the desired level.37,39,47 Exact values after surgical correction and type of measurement method must be defined. Many important aspects remain unanswered, and clarification is mandatory (Table 9).
Conclusion
Our review revealed many variations in patella alta definitions and descriptions, measurement methods, cutoff values, and treatment options. Presence of patella alta depends on measurement method used. Methods cannot be used interchangeably, and they all have their advantages and limitations. Unfortunately, there is no generally accepted consensus on measurement method, patella alta cutoff value, or treatment with ideal correction. Treatment planning and outcomes assessment require clarification of these many issues.
References
1 Munch JL, Sullivan JP, Nguyen JT, et al. Patellar articular overlap on MRI is a simple alternative to conventional measurements of patellar height. Orthop J Sports Med. 2016;4(7):2325967116656328.
2. Elias JJ, Soehnlen NT, Guseila LM, Cosgarea AJ. Dynamic tracking influenced by anatomy in patellar instability. Knee. 2016;23(3):450-455.
3. Fabricant PD, Ladenhauf HN, Salvati EA, Green DW. Medial patellofemoral ligament (MPFL) reconstruction improves radiographic measures of patella alta in children. Knee. 2014;21(6):1180-1184.
4. Askenberger M, Janarv PM, Finnbogason T, Arendt EA. Morphology and anatomic patellar instability risk factors in first-time traumatic lateral patellar dislocations. Am J Sports Med. 2017;45(1):50-58.
5. Mayer C, Magnussen RA, Servien E, et al. Patellar tendon tenodesis in association with tibial tubercle distalization for the treatment of episodic patellar dislocation with patella alta. Am J Sports Med. 2012;40(2):346-351.
6. Ali SA, Helmer R, Terk MR. Patella alta: lack of correlation between patellotrochlear cartilage congruence and commonly used patellar height ratios. AJR Am J Roentgenol. 2009;193(5):1361-1366.
7. Lewallen LW, McIntosh AL, Dahm DL. Predictors of recurrent instability after acute patellofemoral dislocation in pediatric and adolescent patients. Am J Sports Med. 2013;41(3):575-581.
8. Ward SR, Terk MR, Powers CM. Patella alta: association with patellofemoral alignment and changes in contact area during weight-bearing. J Bone Joint Surg Am. 2007;89(8):1749-1755.
9. Dejour H, Walch G, Nove-Josserand L, Guier C. Factors of patellar instability: an anatomic radiographic study. Knee Surg Sports Traumatol Arthrosc. 1994;2(1):19-26.
10. Arendt EA, Fithian DC, Cohen E. Current concepts of lateral patella dislocation. Clin Sports Med. 2002;21(3):499-519.
11. Dejour D, Ferrua P, Ntagiopoulos PG, et al. The introduction of a new MRI index to evaluate sagittal patellofemoral engagement. Orthop Traumatol Surg Res. 2013;99(8 suppl):S391-S398.
12. Althani S, Shahi A, Tan TL, Al-Belooshi A. Position of the patella among Emirati adult knees. Is Insall-Salvati ratio applicable to Middle-Easterners? Arch Bone Joint Surg. 2016;4(2):137-140.
13. Yin L, Liao TC, Yang L, Powers CM. Does patella tendon tenodesis improve tibial tubercle distalization in treating patella alta? A computational study. Clin Orthop Relat Res. 2016;474(11):2451-2461.
15. Otsuki S, Nakajima M, Fujiwara K, et al. Influence of age on clinical outcomes of three-dimensional transfer of the tibial tuberosity for patellar instability with patella alta. Knee Surg Sports Traumatol Arthrosc. 2017;25(8):2392-2396.
16. Otsuki S, Nakajima M, Oda S, et al. Three-dimensional transfer of the tibial tuberosity for patellar instability with patella alta. J Orthop Sci. 2013;18(3):437-442.
17. Steensen RN, Bentley JC, Trinh TQ, Backes JR, Wiltfong RE. The prevalence and combined prevalences of anatomic factors associated with recurrent patellar dislocation: a magnetic resonance imaging study. Am J Sports Med. 2015;43(4):921-927.
18. Magnussen RA, De Simone V, Lustig S, Neyret P, Flanigan DC. Treatment of patella alta in patients with episodic patellar dislocation: a systematic review. Knee Surg Sports Traumatol Arthrosc. 2014;22(10):2545-2550.
19. Bertollo N, Pelletier MH, Walsh WR. Simulation of patella alta and the implications for in vitro patellar tracking in the ovine stifle joint. J Orthop Res. 2012;30(11):1789-1797.
20. Narkbunnam R, Chareancholvanich K. Effect of patient position on measurement of patellar height ratio. Arch Orthop Trauma Surg. 2015;135(8):1151-1156.
21. Stefanik JJ, Zhu Y, Zumwalt AC, et al. Association between patella alta and the prevalence and worsening of structural features of patellofemoral joint osteoarthritis: the Multicenter Osteoarthritis Study. Arthritis Care Res. 2010;62(9):1258-1265.
22. Monk AP, Doll HA, Gibbons CL, et al. The patho-anatomy of patellofemoral subluxation. J Bone Joint Surg Br. 2011;93(10):1341-1347.
23. Hirano A, Fukubayashi T, Ishii T, Ochiai N. Relationship between the patellar height and the disorder of the knee extensor mechanism in immature athletes. J Pediatr Orthop. 2001;21(4):541-544.
24. Ng JP, Cawley DT, Beecher SM, Lee MJ, Bergin D, Shannon FJ. Focal intratendinous radiolucency: a new radiographic method for diagnosing patellar tendon ruptures. Knee. 2016;23(3):482-486.
25. van Duijvenbode D, Stavenuiter M, Burger B, van Dijke C, Spermon J, Hoozemans M. The reliability of four widely used patellar height ratios. Int Orthop. 2016;40(3):493-497.
26. Biedert RM, Albrecht S. The patellotrochlear index: a new index for assessing patellar height. Knee Surg Sports Traumatol Arthrosc. 2006;14(8):707-712.
27. Grelsamer RP, Meadows S. The modified Insall-Salvati ratio for assessment of patellar height. Clin Orthop Relat Res. 1992;(282):170-176.
28. Thaunat M, Erasmus PJ. The favourable anisometry: an original concept for medial patellofemoral ligament reconstruction. Knee. 2007;14(6):424-428.
29. Anagnostakos K, Lorbach O, Reiter S, Kohn D. Comparison of five patellar height measurement methods in 90 degrees knee flexion. Int Orthop. 2011;35(12):1791-1797.
30. Miller TT, Staron RB, Feldman F. Patellar height on sagittal MR imaging of the knee. AJR Am J Roentgenol. 1996;167(2):339-341.
31. Dejour D, Le Coultre B. Osteotomies in patello-femoral instabilities. Sports Med Arthrosc Rev. 2007;15(1):39-46.
32. Rhee SJ, Pavlou G, Oakley J, Barlow D, Haddad F. Modern management of patellar instability. Int Orthop. 2012;36(12):2447-2456.
33. Servien E, Verdonk PC, Neyret P. Tibial tuberosity transfer for episodic patellar dislocation. Sports Med Arthrosc Rev. 2007;15(2):61-67.
35. Meyers AB, Laor T, Sharafinski M, Zbojniewicz AM. Imaging assessment of patellar instability and its treatment in children and adolescents. Pediatr Radiol. 2016;46(5):618-636.
37. Dietrich TJ, Fucentese SF, Pfirrmann CW. Imaging of individual anatomical risk factors for patellar instability. Semin Musculoskelet Radiol. 2016;20(1):65-73.
38. Dean CS, Chahla J, Serra Cruz R, Cram TR, LaPrade RF. Patellofemoral joint reconstruction for patellar instability: medial patellofemoral ligament reconstruction, trochleoplasty, and tibial tubercle osteotomy. Arthrosc Tech. 2016;5(1):e169-e175.
39. Frosch KH, Schmeling A. A new classification system of patellar instability and patellar maltracking. Arch Orthop Trauma Surg. 2016;136(4):485-497.
40. Weber AE, Nathani A, Dines JS, et al. An algorithmic approach to the management of recurrent lateral patellar dislocation. J Bone Joint Surg Am. 2016;98(5):417-427.
41. Seil R, Muller B, Georg T, Kohn D, Rupp S. Reliability and interobserver variability in radiological patellar height ratios. Knee Surg Sports Traumatol Arthrosc. 2000;8(4):231-236.
42. Laprade J, Culham E. Radiographic measures in subjects who are asymptomatic and subjects with patellofemoral pain syndrome. Clin Orthop Relat Res. 2003;(414):172-182.
43. Caton JH, Dejour D. Tibial tubercle osteotomy in patello-femoral instability and in patellar height abnormality. Int Orthop. 2010;34(2):305-309.
44. Charles MD, Haloman S, Chen L, Ward SR, Fithian D, Afra R. Magnetic resonance imaging–based topographical differences between control and recurrent patellofemoral instability patients. Am J Sports Med. 2013;41(2):374-384.
45. Kurtul Yildiz H, Ekin EE. Patellar malalignment: a new method on knee MRI. Springerplus. 2016;5(1):1500.
46. Lee PP, Chalian M, Carrino JA, Eng J, Chhabra A. Multimodality correlations of patellar height measurement on x-ray, CT, and MRI. Skeletal Radiol. 2012;41(10):1309-1314.
47. Neyret P, Robinson AH, Le Coultre B, Lapra C, Chambat P. Patellar tendon length—the factor in patellar instability? Knee. 2002;9(1):3-6.
48. Diederichs G, Issever AS, Scheffler S. MR imaging of patellar instability: injury patterns and assessment of risk factors. Radiographics. 2010;30(4):961-981.
49. Earhart C, Patel DB, White EA, Gottsegen CJ, Forrester DM, Matcuk GR Jr. Transient lateral patellar dislocation: review of imaging findings, patellofemoral anatomy, and treatment options. Emerg Radiol. 2013;20(1):11-23.
50. Aarimaa V, Ranne J, Mattila K, Rahi K, Virolainen P, Hiltunen A. Patellar tendon shortening after treatment of patellar instability with a patellar tendon medialization procedure. Scand J Med Sci Sports. 2008;18(4):442-446.
51. Brown DE, Alexander AH, Lichtman DM. The Elmslie-Trillat procedure: evaluation in patellar dislocation and subluxation. Am J Sports Med. 1984;12(2):104-109.
52. Goldstein JL, Verma N, McNickle AG, Zelazny A, Ghodadra N, Bach BR Jr. Avoiding mismatch in allograft anterior cruciate ligament reconstruction: correlation between patient height and patellar tendon length. Arthroscopy. 2010;26(5):643-650.
53. Navali AM, Jafarabadi MA. Is there any correlation between patient height and patellar tendon length? Arch Bone Joint Surg. 2015;3(2):99-103.
54. Park MS, Chung CY, Lee KM, Lee SH, Choi IH. Which is the best method to determine the patellar height in children and adolescents? Clin Orthop Relat Res. 2010;468(5):1344-1351.
55. Berard JB, Magnussen RA, Bonjean G, et al. Femoral tunnel enlargement after medial patellofemoral ligament reconstruction: prevalence, risk factors, and clinical effect. Am J Sports Med. 2014;42(2):297-301.
56. Edama M, Kageyama I, Nakamura M, et al. Anatomical study of the inferior patellar pole and patellar tendon [published online ahead of print February 16, 2017]. Scand J Med Sci Sports. doi:10.1111/sms.12858.
57. Al-Sayyad MJ, Cameron JC. Functional outcome after tibial tubercle transfer for the painful patella alta. Clin Orthop Relat Res. 2002;(396):152-162.
58. Benoit B, Laflamme GY, Laflamme GH, Rouleau D, Delisle J, Morin B. Long-term outcome of surgically-treated habitual patellar dislocation in children with coexistent patella alta. Minimum follow-up of 11 years. J Bone Joint Surg Br. 2007;89(9):1172-1177.
59. Simmons E Jr, Cameron JC. Patella alta and recurrent dislocation of the patella. Clin Orthop Relat Res. 1992;(274):265-269.
60. Degnan AJ, Maldjian C, Adam RJ, Fu FH, Di Domenica M. Comparison of Insall-Salvati ratios in children with an acute anterior cruciate ligament tear and a matched control population. AJR Am J Roentgenol. 2015;204(1):161-166.
61. Wittstein JR, Bartlett EC, Easterbrook J, Byrd JC. Magnetic resonance imaging evaluation of patellofemoral malalignment. Arthroscopy. 2006;22(6):643-649.
Patella alta has a reduced articular area of PF contact.
Presence of patella alta depends on the measurement method.
Patella alta is defined as ISI >1.2 and CDI >1.2 to >1.3.
On sagittal MRI, PTI is used most often with cutoff values of <0.125 to 0.28.
Tibial tubercle distalization is most often used to treat patella alta. The desired postoperative patellar height is a CDI of 1.0.
Patella alta is a patella that rides abnormally high in relation to the femur, the femoral trochlea, or the tibia,1 with decreased bony stability requiring increased knee flexion angles to engage the trochlea.2,3 An abnormally high patella may therefore insufficiently engage the proximal trochlea groove both in extension and in the early phase of knee flexion—making it one of the potential risk factors for patellar instability.4-10 Accordingly, patella alta is present in 30% of patients with recurrent patellar dislocation.11 It also occurs in other disorders, such as knee extensor apparatus disorders, in patients with patellofemoral (PF) pain, chondromalacia, Sinding-Larsen-Johansson disease, Osgood-Schlatter disease, patellar tendinopathy, and osteoarthritis.1,7,8,12-18 As such, patella alta represents an important predisposing factor for patellar malalignment and PF-related complaints. On the other hand, patella alta may also be a normal variant of a person’s knee anatomy and may be well tolerated when not combined with other instability factors.4
Despite the importance of patella alta, there is no consensus on a precise definition, the most reliable measurement method, or the factors thought to be important in clinical decisions regarding treatment. To address this issue, we systematically reviewed the patella alta literature for definitions, the most common measurement methods and their patella alta cutoff values, and cutoff values for surgical correction and proposed surgical techniques.
Methods
In February 2017, using the term patella alta, we performed a systematic literature search on PubMed. Inclusion criteria were original study or review articles, publication in peer-reviewed English-language journals between 2000 and 2017, and narrative description or measurement of human patellar height on plain radiographs or magnetic resonance imaging (MRI). Excluded were abstracts and articles in languages other than English; animal and computational/biomechanical studies; case reports; and knee arthroplasties, knee extensor ruptures, and hereditary and congenital diseases. All evidence levels were included.
We assessed measurement methods, reported cutoff values for patella alta, cutoff values for performing surgical correction, proposed surgical techniques, and postoperative target values. Original study articles and review articles were analyzed separately.
Results
Of 211 articles identified, 92 met the inclusion criteria for original study, and 28 for review. All their abstracts were reviewed, and 91 were excluded: 17 for language other than English, 11 for animal study, 12 for biomechanical/computational study, 20 for case report, 8 for arthroplasty, 13 for hereditary or congenital disease, 1 for extensor apparatus rupture, 3 for editorial letter, and 6 for other reasons. Full text copies of all included articles were obtained and reviewed.
Original Study Articles
Definition. Of the 92 original study articles, 17 (18.5%) defined patella alta by description alone, and 75 (81.5%) used imaging-based measurements. Patella alta was described as a patella that rides abnormally high in relation to the trochlear groove, with a reduced articular area of PF contact1,15,19-21 or decreased patella–trochlea cartilage overlap.22 With this reduced contact area, there is increased PF stress.21
With radiographic measurements, patella alta is defined as a Caton-Deschamps index (CDI) of >1.2 to >1.3, an Insall-Salvati index (ISI) of >1.2, a Blackburne-Peel index (PBI) of >1.0,4,15,18,23-25 and a patellotrochlear index (PTI) of <0.125 to 0.28.6,26
Table 1.
Table 2.Measurement Methods. Four different patella alta measurement methods were used: lateral radiographs with corresponding ratios (68 studies, 5 indices, Table 1), radiographic ratios measured on MRI (23 studies, 3 indices, Table 2), sagittal MRI (13 studies, 4 methods, Table 3), and patellar tendon length (PTL) measurements (11 studies, 5 methods, Table 4). In 26 studies, multiple measurement methods were used.
Table 3.
Table 4.
On lateral radiographs, ISI was the most common measurement (33 studies), with patella alta cutoff values ranging from >1.2 to >1.5. The second most common measurement was CDI (24 studies), with cutoff values of >1.2 to >1.3. Other indices, such as the modified ISI (6 studies), the BPI (1 study), and the Koshino index (2 studies), had their cutoff values used more consistently (>1.6 to >2.4, >1.0, and >1.2, respectively) but these indices were rarely reported in the literature (Table 1).27,28,29
Thirty-six studies defined patella alta with MRI using either the aforementioned radiographic ratios (23 studies, 3 indices, Table 2) or PF indices (13 studies, 4 methods, Table 3).30
On sagittal MRI, PTI was used most often; cutoff values were <0.125 to 0.28.
Thirteen studies defined patella alta with PTL: 5 using lateral conventional radiographs and 8 using sagittal MRI. For each type of imaging, the cutoff value was >52 mm to >56 mm. PTL was measured either independently or together with ISI on sagittal MRI (Table 4).
Table 5.Treatments. For patella alta, the surgical treatment goals are to increase the PF contact area and improve PF articular congruence and thereby increase PF stability.31-33 Four different procedures were used to treat patella alta (Table 5), but only 11 of the 92 studies included in our review mentioned a specific patellar height that required surgical correction (Table 5, Table 6). Recommendations were based on CDI (>1.2 to >1.4)34 and less often on ISI (>1.2)13 or PTL (>56 mm).22 Only 1 study defined how much distalization was necessary with the procedure.22
Table 6.
Review Articles
Twenty-eight review articles met the inclusion criteria.35-40 Patella alta was described mostly with ISI (75%) or CDI (64%). In up to 57% of these articles, a patella alta reference value was missing. Only 1 article mentioned different cutoff values for conventional radiographs and MRI. BPI was mentioned in 50% of studies, but only 2 indicated a cutoff value for patella alta. Eleven percent used PTI on sagittal MRI and took patella–trochlea cartilage overlap into account.
Eight review articles mentioned cutoff values for surgical correction. Only 1 of 4 articles mentioned a cutoff value for correcting patella alta in PF instability, and only 2 articles suggested an ideal postoperative patellar height (Table 6).
No review article relied on PTL to describe patella alta or to advise surgical treatment.
Discussion
Our review revealed many variations in patella alta definitions and descriptions, measurement methods, cutoff values, and treatment options. Interpretation of patellar height and, particularly, patella alta is very heterogeneous. Accordingly, comparing surgical indications, surgical treatment options, and outcomes across studies can be difficult.
Measurement Methods
Radiographs. Conventional radiographs were used to describe patella alta in two-thirds of the original study articles. The most common measurement methods marked the position of the patella relative to either the femur (direct assessment) or the tibia (indirect assessment).14,25 All established measurement methods use lateral radiographs, which do not show articular cartilage.11,14 Therefore, lateral radiograph ratios of different and variable bony landmarks do not measure actual PF articular congruence. The widely variable morphologies of patella (distal patellar nose, different articulating surface), femoral trochlea (facet in height and length), proximal tibia (inherited or acquired deformities on tibial tubercle), and slope are all confounding factors that may affect measurement (Figure 1). In addition, specific variations in PF joint morphology (eg, small patellar articular surface, short trochlea) are not well represented by these ratios.11
Figure 1.
All these methods have advantages, limitations, and different values of interobserver and intraobserver variability, reliability, and reproducibility (Table 7).29,41
Table 7.
Determination of both patellar height and patella alta depends on the measurement method used and is significantly affected by anatomical variants, such as extra-articular patella and femorotibial landmarks.
The ISI method is most commonly used because it does not depend on degree of knee flexion, is thought to measure the relative length of the patellar tendon the best,5 and has established MRI criteria.6 However, ISI has limitations: Its distal bony landmark is the tibial tuberosity, which can be difficult to assess14; the shape of the patella (mainly its inferior point) varies42; and the measurement does not change after distalization of the tibial tubercle.5
CDI is the most accurate diagnostic method because it relies on readily identifiable and reproducible anatomical landmarks; does not depend on radiograph quality, knee size, radiologic enlargement, or position of the tibial tubercle or patellar modification; and is unaffected by degree of knee flexion between 10° and 80°.38,43 CDI is the method that is most useful in describing patellar height after distalization of the tibial tubercle because it assesses the height of the patella relative to the tibial plateau.5 CDI is limited with respect to clear identification of the patellar and tibial articular margin.37
BPI has the lowest interobserver variability and discriminates best among patella alta, norma, and infera.41 Like CDI, BPI assesses patellar height relative to the tibial plateau, and thus is useful in describing patellar height after distalization of the tibial tubercle.5 BPI is limited in that it uses a line drawn along the tibial plateau, where variations in inclination and tibial slope produce inaccuracies,14 and depends highly on projection angles. Clinically, BPI is rarely used.
As the literature shows, the radiologic methods of determining patellar height are variable and unreliable and depend on the ratio used.26,41 These methods do not reveal precise information about the PF articular congruence, the key finding for necessary treatment.
Radiographic Indices on MRI. Some studies measured radiographic indices on sagittal MRI. Radiologic and MRI measurements are described as not significantly different or slightly different, and 0.09 to 0.13 needs to be added with ISI and BP ratios on radiographs, MRI, and computed tomography (CT).17,44-47 ISI is commonly used, and its clinical application is easy. Although classically measured on plain radiographs, ISI is reliably measured on MRI as well.17,30 The traditional 1.2 threshold for defining patella alta was used by Charles and colleagues.44 CDI is equally well measured on radiographs and MRI.47
Figure 2.MRI. Patellar height is reliably measured on sagittal MRI (Figure 2).6,14,26 The major advantage of sagittal MRI is that it shows the cartilage of the PF joint, and therefore patellar height can be assessed using patella–trochlea cartilage overlap,6,14,26,41 the clinical factor most relevant to patella alta.14
According to the literature, 3 different measurement methods have been used to describe degree of patella–trochlea cartilage overlap: PTI, sagittal patellofemoral engagement (SPE), and patellar articular overlap (PAO).1,11,26
PTI uses the true articular cartilage patella–trochlea relationship for measurement of patellar height on sagittal MRI in extension (Figure 3). If the patellar tendon is fully out to length (no laxity), PTI reliably and precisely determines the exact articular correlation of PF joint and patellar height.6
Figure 3.
SPE is similar to percentage of articular coverage.1,11 Patellar overlap of the trochlea is measured on 2 different sagittal MRI images: 1 with the greatest length of patellar cartilage and 1 with the greatest length of femoral trochlear cartilage. This measurement did not correlate with CDI.1 SPE was not evaluated in control studies, and normal and pathologic values are unavailable.
PAO is measured with patients positioned at rest and in standard knee coils.1 MRI was not obtained in full extension or with quadriceps activation, and knee flexion angle values are unavailable. Total patellar articular length was measured on the sagittal MRI that showed the greatest patellar length and articular cartilage thickness. The same image was used to measure articular overlap, or the length of patellar cartilage overlying the trochlear cartilage, as measured parallel to the subchondral surface of the patella. PAO correlates well with conventional patellar height measurements in the sagittal plane and shows promise as a simpler alternative to the conventional indices.1 Normal and pathologic values are unavailable.
So far, PTI is the only method that was controlled in several studies, assessed for its reliability, and compared with other patellar height measurements.6,14
Figure 4.Ten original study and 3 review articles mentioned PTI as a favorite diagnostic tool for patellar height (Figures 4A, 4B).6,14,40,48,49 SPE and PAO have no validated cutoff values and have not been compared with other patellar height measurements in patients with PF instability or in control patients. In addition, nontrivial technical limitations have been discussed in the literature (Table 8). Therefore, only PTI has proved valuable in measuring patella alta.
Table 8.
Patellar Tendon Length. PTL can be measured on lateral radiographs or sagittal MRI. Radiologic and MRI measurements are described as not significantly different47 or slightly different, and 0.09 to 0.13 needs to be added with the ISI ratio on radiographs, MRI, and CT.46 PTL is reliably evaluated with ISI.41,50 There is a weak correlation of patient height and PTL: Taller people have normally longer tendons.51-53
Figure 5.Some authors have used MRI to measure PTL because MRI 3-dimensionally depicts the patellar tendon and associated anatomy.46,54 The reliability of patellar tendon measurement on MRI is improved relative to radiographs because of improved soft-tissue contrast and cross-sectional depiction (Figure 5).46,54,55
PTL measurements revealed that the posterior surface of the patellar tendon was significantly shorter than the anterior surface. Compared with their corresponding posterior fascicles, anterior fascicles are longer; their attachment is more proximal to the patella and more distal to the tibia. In addition, posterior PTL is significantly shorter with the posterior patellar attachment (adheres to posterior aspect of the inferior patellar pole) than with the anterior attachment (adheres to anterior aspect of the inferior patellar pole).56 Moreover, the lateral and medial fascicles are longer than the central fascicles attaching at the most inferior patellar pole. This issue must be considered in image cut selection (Figures 6A, 6B). Furthermore, type of inferior pole of patella (pointed, intermediate, blunt) is important in measurement.56 Overall, mean (SD) PTL was 54.9 (1.2) mm on the anterior surface and 35.0 (0.6) mm on the posterior surface.
Figure 6.
It is important to precisely describe the measurement method and location (sagittal cut) and to consider the shape of the inferior patellar pole and the site of the patellar tendon attachment.56
Treatments. For patella alta, the surgical treatment goals are to increase the PF contact area and improve PF articular congruence, and thereby increase PF stability.31-33 Four different procedures were used to treat patella alta (Table 5), but only 11 of the 92 original study articles and 8 of the 28 review articles included in our review mentioned a specific patellar height that required surgical correction (Tables 5, 6). Recommendations were based on CDI (>1.2 to >1.4) and less often on ISI (>1.2 to >1.4) or PTL (>56 mm).
Tibial tubercle distalization is effective in normalizing patellar height to correct the patellar index in patella alta (Figures 7A, 7B).13,18,38,55,57 Tibial tubercle distalization and patellar tendon tenodesis attached to the original insertion normalize PTL and stabilize the PF joint in patients with patella alta.5,47 In a comparison of these surgical procedures, cartilage stress was lower with distalization than with distalization and tenodesis.13
Figure 7.
Soft-tissue methods are recommended in children, as bone procedures injure the proximal tibial physis and may cause it to close prematurely.58 The patella can be distally advanced by completely mobilizing the patellar tendon and fixating with sutures through the cartilaginous tibial tubercle. This technique is a satisfactory treatment for skeletally immature patients who present with habitual patellar dislocation associated with patella alta.58,59
CDI and BPI assess patellar height relative to the tibial plateau, and therefore are the most useful measurement methods for patellar height after distalization of the tibial tubercle.5 ISI does not change after distalization of the tibial tubercle and cannot be recommended.5,18 As PF indices (eg, PTI) can trace preoperative and postoperative values, these measurements are valuable.
Controversies
Our review found no consensus on measurement method or cutoff value. No measurement method showed clear clinical or methodologic superiority. Most published patellar height and patella alta data are based on conventional radiographs using a tibial reference point, even though a femoral or even trochlear reference point seems more reproducible, particularly in PF pathologies. Several cutoff values have been reported for each patella alta measurement method. Regarding pathologic thresholds, which might require surgical correction, very little information has been published, and scientific evidence is lacking. Numerous important aspects remain unanswered after this review, and clarification is mandatory.
Five Key Facts
1. In patella alta assessment, different morphologic, biomechanical, and functional aspects must be considered. The most relevant aspect is decreased engagement of the patella and trochlea,4-9,11,26 which results in decreased bony stability in knee extension.1-3 Therefore, patella alta is one of the potential risk factors for patellar instability with a high percentage of recurrent patellar dislocation.4-9 In early knee flexion, the patella translates more distally with better engagement of the patella in the trochlea and better stability. Therefore, measurement in extension, with the patellar tendon out to length, seems to offer a more reliable assessment of the patella–femur relationship.
2. Insufficient engagement of the patella in the trochlea is the most important aspect of patella alta.11 Therefore, direct measurement of this engagement seems logical.
3. As radiographs do not show articular cartilage, they should not be used to assess the articular patella–femur relationship.11,14,26 Patella–trochlea cartilage overlap is the most relevant factor for patella alta and should be measured on MRI.6,14,26,32
4. PTL is an important factor for patellar height and particularly patella alta. The range of normal PTL values is wide: 35 mm to 61 mm. The described cutoff values for patella alta (>52 mm to >56 mm) fall within this normal range. The cause may be the different measurement methods used.33,47,59-61 Therefore, for precise diagnostics, a standardized measurement method that includes the selected cut imaging is mandatory.
Table 9.5. Despite the relevance of surgical correction, investigators have reported only a few values for the postoperative position of the patella with the desired level.37,39,47 Exact values after surgical correction and type of measurement method must be defined. Many important aspects remain unanswered, and clarification is mandatory (Table 9).
Conclusion
Our review revealed many variations in patella alta definitions and descriptions, measurement methods, cutoff values, and treatment options. Presence of patella alta depends on measurement method used. Methods cannot be used interchangeably, and they all have their advantages and limitations. Unfortunately, there is no generally accepted consensus on measurement method, patella alta cutoff value, or treatment with ideal correction. Treatment planning and outcomes assessment require clarification of these many issues.
Take-Home Points
Patella alta has a reduced articular area of PF contact.
Presence of patella alta depends on the measurement method.
Patella alta is defined as ISI >1.2 and CDI >1.2 to >1.3.
On sagittal MRI, PTI is used most often with cutoff values of <0.125 to 0.28.
Tibial tubercle distalization is most often used to treat patella alta. The desired postoperative patellar height is a CDI of 1.0.
Patella alta is a patella that rides abnormally high in relation to the femur, the femoral trochlea, or the tibia,1 with decreased bony stability requiring increased knee flexion angles to engage the trochlea.2,3 An abnormally high patella may therefore insufficiently engage the proximal trochlea groove both in extension and in the early phase of knee flexion—making it one of the potential risk factors for patellar instability.4-10 Accordingly, patella alta is present in 30% of patients with recurrent patellar dislocation.11 It also occurs in other disorders, such as knee extensor apparatus disorders, in patients with patellofemoral (PF) pain, chondromalacia, Sinding-Larsen-Johansson disease, Osgood-Schlatter disease, patellar tendinopathy, and osteoarthritis.1,7,8,12-18 As such, patella alta represents an important predisposing factor for patellar malalignment and PF-related complaints. On the other hand, patella alta may also be a normal variant of a person’s knee anatomy and may be well tolerated when not combined with other instability factors.4
Despite the importance of patella alta, there is no consensus on a precise definition, the most reliable measurement method, or the factors thought to be important in clinical decisions regarding treatment. To address this issue, we systematically reviewed the patella alta literature for definitions, the most common measurement methods and their patella alta cutoff values, and cutoff values for surgical correction and proposed surgical techniques.
Methods
In February 2017, using the term patella alta, we performed a systematic literature search on PubMed. Inclusion criteria were original study or review articles, publication in peer-reviewed English-language journals between 2000 and 2017, and narrative description or measurement of human patellar height on plain radiographs or magnetic resonance imaging (MRI). Excluded were abstracts and articles in languages other than English; animal and computational/biomechanical studies; case reports; and knee arthroplasties, knee extensor ruptures, and hereditary and congenital diseases. All evidence levels were included.
We assessed measurement methods, reported cutoff values for patella alta, cutoff values for performing surgical correction, proposed surgical techniques, and postoperative target values. Original study articles and review articles were analyzed separately.
Results
Of 211 articles identified, 92 met the inclusion criteria for original study, and 28 for review. All their abstracts were reviewed, and 91 were excluded: 17 for language other than English, 11 for animal study, 12 for biomechanical/computational study, 20 for case report, 8 for arthroplasty, 13 for hereditary or congenital disease, 1 for extensor apparatus rupture, 3 for editorial letter, and 6 for other reasons. Full text copies of all included articles were obtained and reviewed.
Original Study Articles
Definition. Of the 92 original study articles, 17 (18.5%) defined patella alta by description alone, and 75 (81.5%) used imaging-based measurements. Patella alta was described as a patella that rides abnormally high in relation to the trochlear groove, with a reduced articular area of PF contact1,15,19-21 or decreased patella–trochlea cartilage overlap.22 With this reduced contact area, there is increased PF stress.21
With radiographic measurements, patella alta is defined as a Caton-Deschamps index (CDI) of >1.2 to >1.3, an Insall-Salvati index (ISI) of >1.2, a Blackburne-Peel index (PBI) of >1.0,4,15,18,23-25 and a patellotrochlear index (PTI) of <0.125 to 0.28.6,26
Table 1.
Table 2.Measurement Methods. Four different patella alta measurement methods were used: lateral radiographs with corresponding ratios (68 studies, 5 indices, Table 1), radiographic ratios measured on MRI (23 studies, 3 indices, Table 2), sagittal MRI (13 studies, 4 methods, Table 3), and patellar tendon length (PTL) measurements (11 studies, 5 methods, Table 4). In 26 studies, multiple measurement methods were used.
Table 3.
Table 4.
On lateral radiographs, ISI was the most common measurement (33 studies), with patella alta cutoff values ranging from >1.2 to >1.5. The second most common measurement was CDI (24 studies), with cutoff values of >1.2 to >1.3. Other indices, such as the modified ISI (6 studies), the BPI (1 study), and the Koshino index (2 studies), had their cutoff values used more consistently (>1.6 to >2.4, >1.0, and >1.2, respectively) but these indices were rarely reported in the literature (Table 1).27,28,29
Thirty-six studies defined patella alta with MRI using either the aforementioned radiographic ratios (23 studies, 3 indices, Table 2) or PF indices (13 studies, 4 methods, Table 3).30
On sagittal MRI, PTI was used most often; cutoff values were <0.125 to 0.28.
Thirteen studies defined patella alta with PTL: 5 using lateral conventional radiographs and 8 using sagittal MRI. For each type of imaging, the cutoff value was >52 mm to >56 mm. PTL was measured either independently or together with ISI on sagittal MRI (Table 4).
Table 5.Treatments. For patella alta, the surgical treatment goals are to increase the PF contact area and improve PF articular congruence and thereby increase PF stability.31-33 Four different procedures were used to treat patella alta (Table 5), but only 11 of the 92 studies included in our review mentioned a specific patellar height that required surgical correction (Table 5, Table 6). Recommendations were based on CDI (>1.2 to >1.4)34 and less often on ISI (>1.2)13 or PTL (>56 mm).22 Only 1 study defined how much distalization was necessary with the procedure.22
Table 6.
Review Articles
Twenty-eight review articles met the inclusion criteria.35-40 Patella alta was described mostly with ISI (75%) or CDI (64%). In up to 57% of these articles, a patella alta reference value was missing. Only 1 article mentioned different cutoff values for conventional radiographs and MRI. BPI was mentioned in 50% of studies, but only 2 indicated a cutoff value for patella alta. Eleven percent used PTI on sagittal MRI and took patella–trochlea cartilage overlap into account.
Eight review articles mentioned cutoff values for surgical correction. Only 1 of 4 articles mentioned a cutoff value for correcting patella alta in PF instability, and only 2 articles suggested an ideal postoperative patellar height (Table 6).
No review article relied on PTL to describe patella alta or to advise surgical treatment.
Discussion
Our review revealed many variations in patella alta definitions and descriptions, measurement methods, cutoff values, and treatment options. Interpretation of patellar height and, particularly, patella alta is very heterogeneous. Accordingly, comparing surgical indications, surgical treatment options, and outcomes across studies can be difficult.
Measurement Methods
Radiographs. Conventional radiographs were used to describe patella alta in two-thirds of the original study articles. The most common measurement methods marked the position of the patella relative to either the femur (direct assessment) or the tibia (indirect assessment).14,25 All established measurement methods use lateral radiographs, which do not show articular cartilage.11,14 Therefore, lateral radiograph ratios of different and variable bony landmarks do not measure actual PF articular congruence. The widely variable morphologies of patella (distal patellar nose, different articulating surface), femoral trochlea (facet in height and length), proximal tibia (inherited or acquired deformities on tibial tubercle), and slope are all confounding factors that may affect measurement (Figure 1). In addition, specific variations in PF joint morphology (eg, small patellar articular surface, short trochlea) are not well represented by these ratios.11
Figure 1.
All these methods have advantages, limitations, and different values of interobserver and intraobserver variability, reliability, and reproducibility (Table 7).29,41
Table 7.
Determination of both patellar height and patella alta depends on the measurement method used and is significantly affected by anatomical variants, such as extra-articular patella and femorotibial landmarks.
The ISI method is most commonly used because it does not depend on degree of knee flexion, is thought to measure the relative length of the patellar tendon the best,5 and has established MRI criteria.6 However, ISI has limitations: Its distal bony landmark is the tibial tuberosity, which can be difficult to assess14; the shape of the patella (mainly its inferior point) varies42; and the measurement does not change after distalization of the tibial tubercle.5
CDI is the most accurate diagnostic method because it relies on readily identifiable and reproducible anatomical landmarks; does not depend on radiograph quality, knee size, radiologic enlargement, or position of the tibial tubercle or patellar modification; and is unaffected by degree of knee flexion between 10° and 80°.38,43 CDI is the method that is most useful in describing patellar height after distalization of the tibial tubercle because it assesses the height of the patella relative to the tibial plateau.5 CDI is limited with respect to clear identification of the patellar and tibial articular margin.37
BPI has the lowest interobserver variability and discriminates best among patella alta, norma, and infera.41 Like CDI, BPI assesses patellar height relative to the tibial plateau, and thus is useful in describing patellar height after distalization of the tibial tubercle.5 BPI is limited in that it uses a line drawn along the tibial plateau, where variations in inclination and tibial slope produce inaccuracies,14 and depends highly on projection angles. Clinically, BPI is rarely used.
As the literature shows, the radiologic methods of determining patellar height are variable and unreliable and depend on the ratio used.26,41 These methods do not reveal precise information about the PF articular congruence, the key finding for necessary treatment.
Radiographic Indices on MRI. Some studies measured radiographic indices on sagittal MRI. Radiologic and MRI measurements are described as not significantly different or slightly different, and 0.09 to 0.13 needs to be added with ISI and BP ratios on radiographs, MRI, and computed tomography (CT).17,44-47 ISI is commonly used, and its clinical application is easy. Although classically measured on plain radiographs, ISI is reliably measured on MRI as well.17,30 The traditional 1.2 threshold for defining patella alta was used by Charles and colleagues.44 CDI is equally well measured on radiographs and MRI.47
Figure 2.MRI. Patellar height is reliably measured on sagittal MRI (Figure 2).6,14,26 The major advantage of sagittal MRI is that it shows the cartilage of the PF joint, and therefore patellar height can be assessed using patella–trochlea cartilage overlap,6,14,26,41 the clinical factor most relevant to patella alta.14
According to the literature, 3 different measurement methods have been used to describe degree of patella–trochlea cartilage overlap: PTI, sagittal patellofemoral engagement (SPE), and patellar articular overlap (PAO).1,11,26
PTI uses the true articular cartilage patella–trochlea relationship for measurement of patellar height on sagittal MRI in extension (Figure 3). If the patellar tendon is fully out to length (no laxity), PTI reliably and precisely determines the exact articular correlation of PF joint and patellar height.6
Figure 3.
SPE is similar to percentage of articular coverage.1,11 Patellar overlap of the trochlea is measured on 2 different sagittal MRI images: 1 with the greatest length of patellar cartilage and 1 with the greatest length of femoral trochlear cartilage. This measurement did not correlate with CDI.1 SPE was not evaluated in control studies, and normal and pathologic values are unavailable.
PAO is measured with patients positioned at rest and in standard knee coils.1 MRI was not obtained in full extension or with quadriceps activation, and knee flexion angle values are unavailable. Total patellar articular length was measured on the sagittal MRI that showed the greatest patellar length and articular cartilage thickness. The same image was used to measure articular overlap, or the length of patellar cartilage overlying the trochlear cartilage, as measured parallel to the subchondral surface of the patella. PAO correlates well with conventional patellar height measurements in the sagittal plane and shows promise as a simpler alternative to the conventional indices.1 Normal and pathologic values are unavailable.
So far, PTI is the only method that was controlled in several studies, assessed for its reliability, and compared with other patellar height measurements.6,14
Figure 4.Ten original study and 3 review articles mentioned PTI as a favorite diagnostic tool for patellar height (Figures 4A, 4B).6,14,40,48,49 SPE and PAO have no validated cutoff values and have not been compared with other patellar height measurements in patients with PF instability or in control patients. In addition, nontrivial technical limitations have been discussed in the literature (Table 8). Therefore, only PTI has proved valuable in measuring patella alta.
Table 8.
Patellar Tendon Length. PTL can be measured on lateral radiographs or sagittal MRI. Radiologic and MRI measurements are described as not significantly different47 or slightly different, and 0.09 to 0.13 needs to be added with the ISI ratio on radiographs, MRI, and CT.46 PTL is reliably evaluated with ISI.41,50 There is a weak correlation of patient height and PTL: Taller people have normally longer tendons.51-53
Figure 5.Some authors have used MRI to measure PTL because MRI 3-dimensionally depicts the patellar tendon and associated anatomy.46,54 The reliability of patellar tendon measurement on MRI is improved relative to radiographs because of improved soft-tissue contrast and cross-sectional depiction (Figure 5).46,54,55
PTL measurements revealed that the posterior surface of the patellar tendon was significantly shorter than the anterior surface. Compared with their corresponding posterior fascicles, anterior fascicles are longer; their attachment is more proximal to the patella and more distal to the tibia. In addition, posterior PTL is significantly shorter with the posterior patellar attachment (adheres to posterior aspect of the inferior patellar pole) than with the anterior attachment (adheres to anterior aspect of the inferior patellar pole).56 Moreover, the lateral and medial fascicles are longer than the central fascicles attaching at the most inferior patellar pole. This issue must be considered in image cut selection (Figures 6A, 6B). Furthermore, type of inferior pole of patella (pointed, intermediate, blunt) is important in measurement.56 Overall, mean (SD) PTL was 54.9 (1.2) mm on the anterior surface and 35.0 (0.6) mm on the posterior surface.
Figure 6.
It is important to precisely describe the measurement method and location (sagittal cut) and to consider the shape of the inferior patellar pole and the site of the patellar tendon attachment.56
Treatments. For patella alta, the surgical treatment goals are to increase the PF contact area and improve PF articular congruence, and thereby increase PF stability.31-33 Four different procedures were used to treat patella alta (Table 5), but only 11 of the 92 original study articles and 8 of the 28 review articles included in our review mentioned a specific patellar height that required surgical correction (Tables 5, 6). Recommendations were based on CDI (>1.2 to >1.4) and less often on ISI (>1.2 to >1.4) or PTL (>56 mm).
Tibial tubercle distalization is effective in normalizing patellar height to correct the patellar index in patella alta (Figures 7A, 7B).13,18,38,55,57 Tibial tubercle distalization and patellar tendon tenodesis attached to the original insertion normalize PTL and stabilize the PF joint in patients with patella alta.5,47 In a comparison of these surgical procedures, cartilage stress was lower with distalization than with distalization and tenodesis.13
Figure 7.
Soft-tissue methods are recommended in children, as bone procedures injure the proximal tibial physis and may cause it to close prematurely.58 The patella can be distally advanced by completely mobilizing the patellar tendon and fixating with sutures through the cartilaginous tibial tubercle. This technique is a satisfactory treatment for skeletally immature patients who present with habitual patellar dislocation associated with patella alta.58,59
CDI and BPI assess patellar height relative to the tibial plateau, and therefore are the most useful measurement methods for patellar height after distalization of the tibial tubercle.5 ISI does not change after distalization of the tibial tubercle and cannot be recommended.5,18 As PF indices (eg, PTI) can trace preoperative and postoperative values, these measurements are valuable.
Controversies
Our review found no consensus on measurement method or cutoff value. No measurement method showed clear clinical or methodologic superiority. Most published patellar height and patella alta data are based on conventional radiographs using a tibial reference point, even though a femoral or even trochlear reference point seems more reproducible, particularly in PF pathologies. Several cutoff values have been reported for each patella alta measurement method. Regarding pathologic thresholds, which might require surgical correction, very little information has been published, and scientific evidence is lacking. Numerous important aspects remain unanswered after this review, and clarification is mandatory.
Five Key Facts
1. In patella alta assessment, different morphologic, biomechanical, and functional aspects must be considered. The most relevant aspect is decreased engagement of the patella and trochlea,4-9,11,26 which results in decreased bony stability in knee extension.1-3 Therefore, patella alta is one of the potential risk factors for patellar instability with a high percentage of recurrent patellar dislocation.4-9 In early knee flexion, the patella translates more distally with better engagement of the patella in the trochlea and better stability. Therefore, measurement in extension, with the patellar tendon out to length, seems to offer a more reliable assessment of the patella–femur relationship.
2. Insufficient engagement of the patella in the trochlea is the most important aspect of patella alta.11 Therefore, direct measurement of this engagement seems logical.
3. As radiographs do not show articular cartilage, they should not be used to assess the articular patella–femur relationship.11,14,26 Patella–trochlea cartilage overlap is the most relevant factor for patella alta and should be measured on MRI.6,14,26,32
4. PTL is an important factor for patellar height and particularly patella alta. The range of normal PTL values is wide: 35 mm to 61 mm. The described cutoff values for patella alta (>52 mm to >56 mm) fall within this normal range. The cause may be the different measurement methods used.33,47,59-61 Therefore, for precise diagnostics, a standardized measurement method that includes the selected cut imaging is mandatory.
Table 9.5. Despite the relevance of surgical correction, investigators have reported only a few values for the postoperative position of the patella with the desired level.37,39,47 Exact values after surgical correction and type of measurement method must be defined. Many important aspects remain unanswered, and clarification is mandatory (Table 9).
Conclusion
Our review revealed many variations in patella alta definitions and descriptions, measurement methods, cutoff values, and treatment options. Presence of patella alta depends on measurement method used. Methods cannot be used interchangeably, and they all have their advantages and limitations. Unfortunately, there is no generally accepted consensus on measurement method, patella alta cutoff value, or treatment with ideal correction. Treatment planning and outcomes assessment require clarification of these many issues.
References
1 Munch JL, Sullivan JP, Nguyen JT, et al. Patellar articular overlap on MRI is a simple alternative to conventional measurements of patellar height. Orthop J Sports Med. 2016;4(7):2325967116656328.
2. Elias JJ, Soehnlen NT, Guseila LM, Cosgarea AJ. Dynamic tracking influenced by anatomy in patellar instability. Knee. 2016;23(3):450-455.
3. Fabricant PD, Ladenhauf HN, Salvati EA, Green DW. Medial patellofemoral ligament (MPFL) reconstruction improves radiographic measures of patella alta in children. Knee. 2014;21(6):1180-1184.
4. Askenberger M, Janarv PM, Finnbogason T, Arendt EA. Morphology and anatomic patellar instability risk factors in first-time traumatic lateral patellar dislocations. Am J Sports Med. 2017;45(1):50-58.
5. Mayer C, Magnussen RA, Servien E, et al. Patellar tendon tenodesis in association with tibial tubercle distalization for the treatment of episodic patellar dislocation with patella alta. Am J Sports Med. 2012;40(2):346-351.
6. Ali SA, Helmer R, Terk MR. Patella alta: lack of correlation between patellotrochlear cartilage congruence and commonly used patellar height ratios. AJR Am J Roentgenol. 2009;193(5):1361-1366.
7. Lewallen LW, McIntosh AL, Dahm DL. Predictors of recurrent instability after acute patellofemoral dislocation in pediatric and adolescent patients. Am J Sports Med. 2013;41(3):575-581.
8. Ward SR, Terk MR, Powers CM. Patella alta: association with patellofemoral alignment and changes in contact area during weight-bearing. J Bone Joint Surg Am. 2007;89(8):1749-1755.
9. Dejour H, Walch G, Nove-Josserand L, Guier C. Factors of patellar instability: an anatomic radiographic study. Knee Surg Sports Traumatol Arthrosc. 1994;2(1):19-26.
10. Arendt EA, Fithian DC, Cohen E. Current concepts of lateral patella dislocation. Clin Sports Med. 2002;21(3):499-519.
11. Dejour D, Ferrua P, Ntagiopoulos PG, et al. The introduction of a new MRI index to evaluate sagittal patellofemoral engagement. Orthop Traumatol Surg Res. 2013;99(8 suppl):S391-S398.
12. Althani S, Shahi A, Tan TL, Al-Belooshi A. Position of the patella among Emirati adult knees. Is Insall-Salvati ratio applicable to Middle-Easterners? Arch Bone Joint Surg. 2016;4(2):137-140.
13. Yin L, Liao TC, Yang L, Powers CM. Does patella tendon tenodesis improve tibial tubercle distalization in treating patella alta? A computational study. Clin Orthop Relat Res. 2016;474(11):2451-2461.
15. Otsuki S, Nakajima M, Fujiwara K, et al. Influence of age on clinical outcomes of three-dimensional transfer of the tibial tuberosity for patellar instability with patella alta. Knee Surg Sports Traumatol Arthrosc. 2017;25(8):2392-2396.
16. Otsuki S, Nakajima M, Oda S, et al. Three-dimensional transfer of the tibial tuberosity for patellar instability with patella alta. J Orthop Sci. 2013;18(3):437-442.
17. Steensen RN, Bentley JC, Trinh TQ, Backes JR, Wiltfong RE. The prevalence and combined prevalences of anatomic factors associated with recurrent patellar dislocation: a magnetic resonance imaging study. Am J Sports Med. 2015;43(4):921-927.
18. Magnussen RA, De Simone V, Lustig S, Neyret P, Flanigan DC. Treatment of patella alta in patients with episodic patellar dislocation: a systematic review. Knee Surg Sports Traumatol Arthrosc. 2014;22(10):2545-2550.
19. Bertollo N, Pelletier MH, Walsh WR. Simulation of patella alta and the implications for in vitro patellar tracking in the ovine stifle joint. J Orthop Res. 2012;30(11):1789-1797.
20. Narkbunnam R, Chareancholvanich K. Effect of patient position on measurement of patellar height ratio. Arch Orthop Trauma Surg. 2015;135(8):1151-1156.
21. Stefanik JJ, Zhu Y, Zumwalt AC, et al. Association between patella alta and the prevalence and worsening of structural features of patellofemoral joint osteoarthritis: the Multicenter Osteoarthritis Study. Arthritis Care Res. 2010;62(9):1258-1265.
22. Monk AP, Doll HA, Gibbons CL, et al. The patho-anatomy of patellofemoral subluxation. J Bone Joint Surg Br. 2011;93(10):1341-1347.
23. Hirano A, Fukubayashi T, Ishii T, Ochiai N. Relationship between the patellar height and the disorder of the knee extensor mechanism in immature athletes. J Pediatr Orthop. 2001;21(4):541-544.
24. Ng JP, Cawley DT, Beecher SM, Lee MJ, Bergin D, Shannon FJ. Focal intratendinous radiolucency: a new radiographic method for diagnosing patellar tendon ruptures. Knee. 2016;23(3):482-486.
25. van Duijvenbode D, Stavenuiter M, Burger B, van Dijke C, Spermon J, Hoozemans M. The reliability of four widely used patellar height ratios. Int Orthop. 2016;40(3):493-497.
26. Biedert RM, Albrecht S. The patellotrochlear index: a new index for assessing patellar height. Knee Surg Sports Traumatol Arthrosc. 2006;14(8):707-712.
27. Grelsamer RP, Meadows S. The modified Insall-Salvati ratio for assessment of patellar height. Clin Orthop Relat Res. 1992;(282):170-176.
28. Thaunat M, Erasmus PJ. The favourable anisometry: an original concept for medial patellofemoral ligament reconstruction. Knee. 2007;14(6):424-428.
29. Anagnostakos K, Lorbach O, Reiter S, Kohn D. Comparison of five patellar height measurement methods in 90 degrees knee flexion. Int Orthop. 2011;35(12):1791-1797.
30. Miller TT, Staron RB, Feldman F. Patellar height on sagittal MR imaging of the knee. AJR Am J Roentgenol. 1996;167(2):339-341.
31. Dejour D, Le Coultre B. Osteotomies in patello-femoral instabilities. Sports Med Arthrosc Rev. 2007;15(1):39-46.
32. Rhee SJ, Pavlou G, Oakley J, Barlow D, Haddad F. Modern management of patellar instability. Int Orthop. 2012;36(12):2447-2456.
33. Servien E, Verdonk PC, Neyret P. Tibial tuberosity transfer for episodic patellar dislocation. Sports Med Arthrosc Rev. 2007;15(2):61-67.
35. Meyers AB, Laor T, Sharafinski M, Zbojniewicz AM. Imaging assessment of patellar instability and its treatment in children and adolescents. Pediatr Radiol. 2016;46(5):618-636.
37. Dietrich TJ, Fucentese SF, Pfirrmann CW. Imaging of individual anatomical risk factors for patellar instability. Semin Musculoskelet Radiol. 2016;20(1):65-73.
38. Dean CS, Chahla J, Serra Cruz R, Cram TR, LaPrade RF. Patellofemoral joint reconstruction for patellar instability: medial patellofemoral ligament reconstruction, trochleoplasty, and tibial tubercle osteotomy. Arthrosc Tech. 2016;5(1):e169-e175.
39. Frosch KH, Schmeling A. A new classification system of patellar instability and patellar maltracking. Arch Orthop Trauma Surg. 2016;136(4):485-497.
40. Weber AE, Nathani A, Dines JS, et al. An algorithmic approach to the management of recurrent lateral patellar dislocation. J Bone Joint Surg Am. 2016;98(5):417-427.
41. Seil R, Muller B, Georg T, Kohn D, Rupp S. Reliability and interobserver variability in radiological patellar height ratios. Knee Surg Sports Traumatol Arthrosc. 2000;8(4):231-236.
42. Laprade J, Culham E. Radiographic measures in subjects who are asymptomatic and subjects with patellofemoral pain syndrome. Clin Orthop Relat Res. 2003;(414):172-182.
43. Caton JH, Dejour D. Tibial tubercle osteotomy in patello-femoral instability and in patellar height abnormality. Int Orthop. 2010;34(2):305-309.
44. Charles MD, Haloman S, Chen L, Ward SR, Fithian D, Afra R. Magnetic resonance imaging–based topographical differences between control and recurrent patellofemoral instability patients. Am J Sports Med. 2013;41(2):374-384.
45. Kurtul Yildiz H, Ekin EE. Patellar malalignment: a new method on knee MRI. Springerplus. 2016;5(1):1500.
46. Lee PP, Chalian M, Carrino JA, Eng J, Chhabra A. Multimodality correlations of patellar height measurement on x-ray, CT, and MRI. Skeletal Radiol. 2012;41(10):1309-1314.
47. Neyret P, Robinson AH, Le Coultre B, Lapra C, Chambat P. Patellar tendon length—the factor in patellar instability? Knee. 2002;9(1):3-6.
48. Diederichs G, Issever AS, Scheffler S. MR imaging of patellar instability: injury patterns and assessment of risk factors. Radiographics. 2010;30(4):961-981.
49. Earhart C, Patel DB, White EA, Gottsegen CJ, Forrester DM, Matcuk GR Jr. Transient lateral patellar dislocation: review of imaging findings, patellofemoral anatomy, and treatment options. Emerg Radiol. 2013;20(1):11-23.
50. Aarimaa V, Ranne J, Mattila K, Rahi K, Virolainen P, Hiltunen A. Patellar tendon shortening after treatment of patellar instability with a patellar tendon medialization procedure. Scand J Med Sci Sports. 2008;18(4):442-446.
51. Brown DE, Alexander AH, Lichtman DM. The Elmslie-Trillat procedure: evaluation in patellar dislocation and subluxation. Am J Sports Med. 1984;12(2):104-109.
52. Goldstein JL, Verma N, McNickle AG, Zelazny A, Ghodadra N, Bach BR Jr. Avoiding mismatch in allograft anterior cruciate ligament reconstruction: correlation between patient height and patellar tendon length. Arthroscopy. 2010;26(5):643-650.
53. Navali AM, Jafarabadi MA. Is there any correlation between patient height and patellar tendon length? Arch Bone Joint Surg. 2015;3(2):99-103.
54. Park MS, Chung CY, Lee KM, Lee SH, Choi IH. Which is the best method to determine the patellar height in children and adolescents? Clin Orthop Relat Res. 2010;468(5):1344-1351.
55. Berard JB, Magnussen RA, Bonjean G, et al. Femoral tunnel enlargement after medial patellofemoral ligament reconstruction: prevalence, risk factors, and clinical effect. Am J Sports Med. 2014;42(2):297-301.
56. Edama M, Kageyama I, Nakamura M, et al. Anatomical study of the inferior patellar pole and patellar tendon [published online ahead of print February 16, 2017]. Scand J Med Sci Sports. doi:10.1111/sms.12858.
57. Al-Sayyad MJ, Cameron JC. Functional outcome after tibial tubercle transfer for the painful patella alta. Clin Orthop Relat Res. 2002;(396):152-162.
58. Benoit B, Laflamme GY, Laflamme GH, Rouleau D, Delisle J, Morin B. Long-term outcome of surgically-treated habitual patellar dislocation in children with coexistent patella alta. Minimum follow-up of 11 years. J Bone Joint Surg Br. 2007;89(9):1172-1177.
59. Simmons E Jr, Cameron JC. Patella alta and recurrent dislocation of the patella. Clin Orthop Relat Res. 1992;(274):265-269.
60. Degnan AJ, Maldjian C, Adam RJ, Fu FH, Di Domenica M. Comparison of Insall-Salvati ratios in children with an acute anterior cruciate ligament tear and a matched control population. AJR Am J Roentgenol. 2015;204(1):161-166.
61. Wittstein JR, Bartlett EC, Easterbrook J, Byrd JC. Magnetic resonance imaging evaluation of patellofemoral malalignment. Arthroscopy. 2006;22(6):643-649.
There is no difference in PROMs following knotless or knotted labral repair.
Operative time is shorter for knotless compared to knotted glenoid labral tears.
Knotless constructs may be more predictable than knotted constructs biomechanically.
Orthopedic surgeons often encounter labral pathology, and labral tears historically have required open techniques.1-3 Arthroscopy allows for advanced visualization and treatment of shoulder lesions,4,5 including anterior, posterior, and superior labrum anterior to posterior (SLAP) lesions.6
The goal of arthroscopic labral repair is to restore joint stability while maintaining range of motion. Arthroscopically repairing the labrum with suture anchors has become the standard technique, and several studies have reported satisfactory biomechanical and clinical results.1,7-12 Surgeons traditionally have been required to tie knots for these anchors, but knot security varies significantly among experienced arthroscopic surgeons.13 In addition, knots can migrate,14 and bulky knots can cause chondral abrasion.15,16 Several manufacturers have introduced knotless anchors for soft-tissue fixation.15,17 The knotless technique provides a low-profile repair with potentially less operating time.8 These factors may warrant switching from knotted to knotless techniques if outcomes are clinically acceptable. However, few studies have compared knotted and knotless techniques for glenohumeral labral repair.8,15,18-21
We conducted a study to compare the clinical results and operative times of knotless and knotted fixation of anterior and posterior glenohumeral labral repairs and SLAP repairs. We hypothesized there would be no difference in patient-reported outcome measures (PROMs) between knotted and knotless techniques.
Methods
We retrospectively evaluated data that had been prospectively collected between 2012 and 2016 in a Surgical Outcomes System (SOS; Arthrex) database. Participation in this registry is elective, and enrollment can occur on a case-by-case basis. The database stores data on basic demographics, PROMs, and operative time. Data for our specific analysis were available for surgeries performed by 115 different surgeons. Inclusion criteria included primary isolated arthroscopic anterior, isolated posterior, and isolated SLAP repair with completely knotted or completely knotless labral repair and minimum 1-year follow-up. Exclusion criteria included hybrid knotted–knotless repair, rotator cuff repair, revision surgery, open surgery, and lack of complete follow-up data.
SOS is a proprietary registry that allows for the collection of basic patient demographics, diagnostic and operative data, and PROMs. PROMs in the SOS shoulder arthroscopy module include Veterans RAND 12-Item Health Survey (VR-12) mental health and physical health component summary scores, visual analog scale (VAS) pain scores, and American Shoulder and Elbow Surgeons (ASES) scores. For this study, PROMs were reviewed before surgery and 6 and 12 months after surgery. In addition, operative times of all procedures were collected.
For the analysis, completely knotted and completely knotless techniques were compared for anterior repair, posterior repair, and SLAP repair. A t test was used to compare the techniques on PROMs, and χ2 test was used to evaluate proportion differences. Statistical significance was set at P < .05.
Results
Anterior Labral Repairs
Of the 102 knotted anterior labral repairs that met the study criteria, 26 (25%) had minimum 1-year follow-up. Of the 122 knotless labral repairs, 33 (27%) had minimum 1-year follow-up. Seventy-five percent of knotted repairs and 80% of knotless repairs were performed in men. Mean (SD) age was 25.3 (11.7) years for the knotted group and 26.9 (10.6) years for the knotless group (P = .109). Anterior labral repairs did not differ in PROMs at any point (Table 1).
Table 1.
A mean of 2.8 anchors was used for knotted repairs, and a mean of 3.1 anchors was used for knotless repairs. Mean operative time was 75.8 minutes for knotted repairs and 67.5 minutes for knotless repairs. Mean (SD) time per anchor was 30.9 (13.9) minutes for knotted repairs and 25.6 (19.5) minutes for knotless repairs (P = .021).
Posterior Labral Repairs
Of the 165 knotted posterior labral repairs that met the study criteria, 39 (29%) had minimum 1-year follow-up. Of the 229 knotless labral repairs, 56 (24%) had minimum 1-year follow-up. Eighty-five percent of knotted repairs and 74% of knotless repairs were performed in men. Mean (SD) age was 29.1 (12.0) years for the knotted group and 27.5 (11.9) years for the knotless group (P = .148). Posterior labral repairs did not differ in PROMs before surgery or 1 year after surgery; 6 months after surgery, these repairs differed only in ASES scores (Table 2).
Table 2.
A mean of 3.6 anchors was used for knotted repairs, and a mean of 3.0 anchors was used for knotless repairs. Mean operative time was 67.0 minutes for knotted repairs and 43.1 minutes for knotless repairs. Mean (SD) time per anchor was 21.1 (10.7) minutes for knotted repairs and 17.5 (14.7) minutes for knotless repairs (P = .031).
SLAP Repairs
Of the 54 knotted SLAP repairs that met the study criteria, 24 (44%) had minimum 1-year follow-up. Of the 138 knotless SLAP repairs, 48 (35%) had minimum 1-year follow-up. Seventy-two percent of knotted repairs and 72% of knotless repairs were performed in men. Mean (SD) age was 32.1 (11.6) years for the knotted group and 35.0 (12.8) years for the knotless group (P = .246). SLAP repairs did not differ in PROMs at any point (Table 3).
Table 3.
A mean of 1.9 anchors was used for knotted repairs, and a mean of 2.1 anchors was used for knotless repairs. Mean operative time was 59.0 minutes for knotted repairs and 40.9 minutes for knotless repairs. Mean (SD) time per anchor was 36.6 (22.4) minutes for knotted repairs and 26.3 (14.0) minutes for knotless repairs (P = .080).
Discussion
Our hypothesis that there would be no difference in PROMs between knotted and knotless labral repairs was confirmed. Our findings are important because this study compared the gold standard of knotted suture anchor with the alternative knotless suture anchor in glenohumeral labral repair. These findings have several important implications for labral repair.
Knot tying traditionally has been used to achieve fixation with an anchor. Although simple in concept, knot tying can be challenging and its quality variable. Thal15 wrote that good-quality arthroscopic suture anchor repair is difficult to achieve because satisfactory knot tying requires significant practice with certain devices designed specifically for knot tying. Multiple surgeons have noted a significant learning curve associated with knot tying, and there is no agreement on which knot is superior.22-26 Leedle and Miller17 even suggested that, because knot tying is difficult, tying knots arthroscopically can lead to knot failure. In their study, they concluded that the knot is consistently the weakest link in suture repair of an anterior labrum construct. In a controlled laboratory study, Hanypsiak and colleagues13 found considerable knot-strength variability among expert arthroscopists. Only 65 (18%) of 365 knots tied fell within 20% of the mean for ultimate load failure, and only 128 (36%) of 365 fell within 20% of the mean for clinical failure (3 mm of displacement). These data suggested expert arthroscopists were unable to tie 5 consecutive knots of the same type consistently. Even among experts, it seems, knot strength varies significantly, and knot-strength issues may affect the rates of labral repair failure.
Multiple authors have also reported that bulky knots can cause chondral abrasion or that knots can migrate.25,27 Rhee and Ha27 reported that, when another knot (eg, a half-hitch knot) is tied to prevent knot failure, the resulting overall knot can be too bulky for a limited space, and chondral abrasion can result. In addition, regardless of size, a knot can migrate and, in its new position, start rubbing against the head of the humerus. Kim and colleagues14 found that, even when a knot is placed away from the humeral head, migration and repeated contact with the head are possible. Park and colleagues28 found that a significant number of knotted SLAP repairs required arthroscopic knot removal for relief of knot-induced pain and clicking.
Knotless constructs have several theoretical advantages over knotted constructs. Compared with a knotted technique, a knotless technique appears to provide more predictable strength, as variability in knot tying is eliminated (unpublished data). A knotless repair also has a lower profile,8 which should lead to less contact with the humeral head.19 Last, a knotless repair is more efficient—it takes less time to perform. In our study, operative time was reduced by a mean of 5.3 minutes per anchor for anterior labral repair. Assuming a mean of 3 anchors, this reduction equates to 16 minutes per case. Therefore, a surgeon who performs 25 labral repairs a year can save 6.7 hours a year. Reduced operative time benefits the patient (ie, lower risk of infection and other complications29), the surgeon, and the healthcare system (ie, cost savings). Macario30 found that operating room costs averaged $62 per minute (range, $22-$133 per minute). Therefore, saving 16 minutes per case could lead to saving $992 per case. In summary, a knotless technique appears to be clinically and financially advantageous as long as its results are the same as or better than those of a knotted technique.
A few other studies have compared knotted and knotless techniques. In a cadaveric study, Slabaugh and colleagues20 found no difference in labral height between traditional and knotless suture anchors. Leedle and Miller17 found that knotless constructs are biomechanically stronger than knotted constructs in anterior labral repair. In a level 3 clinical study, Yang and colleagues21 compared a conventional vertical knot with a knotless horizontal mattress suture in 41 patients who underwent SLAP repair. Functional outcome was no different between the 2 groups, but postoperative range of motion was improved in the knotless group. Ng and Kumar31 compared 45 patients who had knotted Bankart repair with 42 patients who had knotless Bankart repair and found no difference in functional outcome or rate of recurrent dislocation. Similarly, Kocaoglu and colleagues22 found no difference in recurrence rate between 18 patients who underwent a knotted technique for arthroscopic Bankart repair and 20 patients who underwent a knotless technique. Our findings corroborate the findings of these studies and further support the idea that there is no difference between knotted and knotless constructs with respect to PROMs.
Study Limitations
The major strength of this study was its large cohort and large population of surgeons. However, there were several study limitations. First, we could not detail specific repair techniques, such as simple or horizontal mattress orientation, and rehabilitation protocols and other variables are likely as well. Second, the repair technique was not randomized, and therefore there may have been a selection bias based on tissue quality. Although we cannot prove no bias, we think it was unlikely given that the groups were similar in age. Third, our data did not include information on range of motion or recurrent instability. Our goal was simply to evaluate PROMs among multiple surgeons using the 2 techniques. Fourth, there was substantial follow-up loss, which introduced potential selection bias. Last, there may have been conditions under which a hybrid technique with inferior knot tying, combined with a hybrid knotless construct, could have proved advantageous.
Conclusion
Our data showed that the advantages of knotless repair are not compromised in clinical situations. Although the data showed no significant difference in clinical outcomes, knotless repairs may provide surgeons with shorter surgeries, simpler constructs, less potential for chondral damage, and more consistent suture tensioning. Additional studies may further confirm these results.
References
1. Levy DM, Cole BJ, Bach BR Jr. History of surgical intervention of anterior shoulder instability. J Shoulder Elbow Surg. 2016;25(6):e139-e150.
2. Gill TJ, Zarins B. Open repairs for the treatment of anterior shoulder instability. Am J Sports Med. 2003;31(1):142-153.
3. Millett PJ, Clavert P, Warner JJ. Open operative treatment for anterior shoulder instability: when and why? J Bone Joint Surg Am. 2005;87(2):419-432.
4. Stein DA, Jazrawi L, Bartolozzi AR. Arthroscopic stabilization of anterior shoulder instability: a review of the literature. Arthroscopy. 2002;18(8):912-924.
5. Kim SH, Ha KI, Kim SH. Bankart repair in traumatic anterior shoulder instability: open versus arthroscopic technique. Arthroscopy. 2002;18(7):755-763.
6. Snyder SJ, Karzel RP, Del Pizzo W, Ferkel RD, Friedman MJ. SLAP lesions of the shoulder. Arthroscopy. 1990;6(4):274-279.
7. Hantes M, Raoulis V. Arthroscopic findings in anterior shoulder instability. Open Orthop J. 2017;11:119-132.
8. Sileo MJ, Lee SJ, Kremenic IJ, et al. Biomechanical comparison of a knotless suture anchor with standard suture anchor in the repair of type II SLAP tears. Arthroscopy. 2009;25(4):348-354.
9. Iqbal S, Jacobs U, Akhtar A, Macfarlane RJ, Waseem M. A history of shoulder surgery. Open Orthop J. 2013;7:305-309.
10. Garofalo R, Mocci A, Moretti B, et al. Arthroscopic treatment of anterior shoulder instability using knotless suture anchors. Arthroscopy. 2005;21(11):1283-1289.
11. Kersten AD, Fabing M, Ensminger S, et al. Suture capsulorrhaphy versus capsulolabral advancement for shoulder instability. Arthroscopy. 2012;28(10):1344-1351.
12. Cole BJ, Warner JJ. Arthroscopic versus open Bankart repair for traumatic anterior shoulder instability. Clin Sports Med. 2000;19(1):19-48.
13. Hanypsiak BT, DeLong JM, Simmons L, Lowe W, Burkhart S. Knot strength varies widely among expert arthroscopists. Am J Sports Med. 2014;42(8):1978-1984.
14. Kim SH, Ha KI, Park JH, et al. Arthroscopic posterior labral repair and capsular shift for traumatic unidirectional recurrent posterior subluxation of the shoulder. J Bone Joint Surg Am. 2003;85(8):1479-1487.
17. Leedle BP, Miller MD. Pullout strength of knotless suture anchors. Arthroscopy. 2005;21(1):81-85.
18. Caldwell PE 3rd, Pearson SE, D’Angelo MS. Arthroscopic knotless repair of the posterior labrum using LabralTape. Arthrosc Tech. 2016;5(2):e315-e320.
19. Tennent D, Concina C, Pearse E. Arthroscopic posterior stabilization of the shoulder using a percutaneous knotless mattress suture technique. Arthrosc Tech. 2014;3(1):e161-e164.
20. Slabaugh MA, Friel NA, Wang VM, Cole BJ. Restoring the labral height for treatment of Bankart lesions: a comparison of suture anchor constructs. Arthroscopy. 2010;26(5):587-591.
21. Yang HJ, Yoon K, Jin H, Song HS. Clinical outcome of arthroscopic SLAP repair: conventional vertical knot versus knotless horizontal mattress sutures. Knee Surg Sports Traumatol Arthrosc. 2016;24(2):464-469.
22. Kocaoglu B, Guven O, Nalbantoglu U, Aydin N, Haklar U. No difference between knotless sutures and suture anchors in arthroscopic repair of Bankart lesions in collision athletes. Knee Surg Sports Traumatol Arthrosc. 2009;17(7):844-849.
23. Aboalata M, Halawa A, Basyoni Y. The double Bankart bridge: a technique for restoration of the labral footprint in arthroscopic shoulder instability repair. Arthrosc Tech. 2017;6(1):e43-e47.
24. Rhee SM, Kang SY, Jang EC, Kim JY, Ha YC. Clinical outcomes after arthroscopic acetabular labral repair using knot-tying or knotless suture technique. Arch Orthop Trauma Surg. 2016;136(10):1411-1416.
25. Oh JH, Lee HK, Kim JY, Kim SH, Gong HS. Clinical and radiologic outcomes of arthroscopic glenoid labrum repair with the BioKnotless suture anchor. Am J Sports Med. 2009;37(12):2340-2348.
26. Yian E, Wang C, Millett PJ, Warner JJ. Arthroscopic repair of SLAP lesions with a BioKnotless suture anchor. Arthroscopy. 2004;20(5):547-551.
27. Rhee YG, Ha JH. Knot-induced glenoid erosion after arthroscopic fixation for unstable superior labrum anterior-posterior lesion: case report. J Shoulder Elbow Surg. 2006;15(3):391-393.
28. Park JG, Cho NS, Kim JY, Song JH, Hong SJ, Rhee YG. Arthroscopic knot removal for failed superior labrum anterior-posterior repair secondary to knot-induced pain. Am J Sports Med. 2017;45(11):2563-2568.
29. Wang DS. Re: how slow is too slow? Correlation of operative time to complications: an analysis from the Tennessee Surgical Quality Collaborative. J Urol. 2016;195(5):1510-1511.
30. Macario A. What does one minute of operating room time cost? J Clin Anesth. 2010;22(4):233-236.
31. Ng DZ, Kumar VP. Arthroscopic Bankart repair using knot-tying versus knotless suture anchors: is there a difference? Arthroscopy. 2014;30(4):422-427.
Authors’ Disclosure Statement: Dr. Brady and Dr. Denard report that they are consultants for and receive royalties from Arthrex. Dr. Adams reports that he is an employee of Arthrex. Dr. Tokish reports that he is a consultant for Arthrex. The other authors report no actual or potential conflict of interest in relation to this article.
Authors’ Disclosure Statement: Dr. Brady and Dr. Denard report that they are consultants for and receive royalties from Arthrex. Dr. Adams reports that he is an employee of Arthrex. Dr. Tokish reports that he is a consultant for Arthrex. The other authors report no actual or potential conflict of interest in relation to this article.
Author and Disclosure Information
Authors’ Disclosure Statement: Dr. Brady and Dr. Denard report that they are consultants for and receive royalties from Arthrex. Dr. Adams reports that he is an employee of Arthrex. Dr. Tokish reports that he is a consultant for Arthrex. The other authors report no actual or potential conflict of interest in relation to this article.
There is no difference in PROMs following knotless or knotted labral repair.
Operative time is shorter for knotless compared to knotted glenoid labral tears.
Knotless constructs may be more predictable than knotted constructs biomechanically.
Orthopedic surgeons often encounter labral pathology, and labral tears historically have required open techniques.1-3 Arthroscopy allows for advanced visualization and treatment of shoulder lesions,4,5 including anterior, posterior, and superior labrum anterior to posterior (SLAP) lesions.6
The goal of arthroscopic labral repair is to restore joint stability while maintaining range of motion. Arthroscopically repairing the labrum with suture anchors has become the standard technique, and several studies have reported satisfactory biomechanical and clinical results.1,7-12 Surgeons traditionally have been required to tie knots for these anchors, but knot security varies significantly among experienced arthroscopic surgeons.13 In addition, knots can migrate,14 and bulky knots can cause chondral abrasion.15,16 Several manufacturers have introduced knotless anchors for soft-tissue fixation.15,17 The knotless technique provides a low-profile repair with potentially less operating time.8 These factors may warrant switching from knotted to knotless techniques if outcomes are clinically acceptable. However, few studies have compared knotted and knotless techniques for glenohumeral labral repair.8,15,18-21
We conducted a study to compare the clinical results and operative times of knotless and knotted fixation of anterior and posterior glenohumeral labral repairs and SLAP repairs. We hypothesized there would be no difference in patient-reported outcome measures (PROMs) between knotted and knotless techniques.
Methods
We retrospectively evaluated data that had been prospectively collected between 2012 and 2016 in a Surgical Outcomes System (SOS; Arthrex) database. Participation in this registry is elective, and enrollment can occur on a case-by-case basis. The database stores data on basic demographics, PROMs, and operative time. Data for our specific analysis were available for surgeries performed by 115 different surgeons. Inclusion criteria included primary isolated arthroscopic anterior, isolated posterior, and isolated SLAP repair with completely knotted or completely knotless labral repair and minimum 1-year follow-up. Exclusion criteria included hybrid knotted–knotless repair, rotator cuff repair, revision surgery, open surgery, and lack of complete follow-up data.
SOS is a proprietary registry that allows for the collection of basic patient demographics, diagnostic and operative data, and PROMs. PROMs in the SOS shoulder arthroscopy module include Veterans RAND 12-Item Health Survey (VR-12) mental health and physical health component summary scores, visual analog scale (VAS) pain scores, and American Shoulder and Elbow Surgeons (ASES) scores. For this study, PROMs were reviewed before surgery and 6 and 12 months after surgery. In addition, operative times of all procedures were collected.
For the analysis, completely knotted and completely knotless techniques were compared for anterior repair, posterior repair, and SLAP repair. A t test was used to compare the techniques on PROMs, and χ2 test was used to evaluate proportion differences. Statistical significance was set at P < .05.
Results
Anterior Labral Repairs
Of the 102 knotted anterior labral repairs that met the study criteria, 26 (25%) had minimum 1-year follow-up. Of the 122 knotless labral repairs, 33 (27%) had minimum 1-year follow-up. Seventy-five percent of knotted repairs and 80% of knotless repairs were performed in men. Mean (SD) age was 25.3 (11.7) years for the knotted group and 26.9 (10.6) years for the knotless group (P = .109). Anterior labral repairs did not differ in PROMs at any point (Table 1).
Table 1.
A mean of 2.8 anchors was used for knotted repairs, and a mean of 3.1 anchors was used for knotless repairs. Mean operative time was 75.8 minutes for knotted repairs and 67.5 minutes for knotless repairs. Mean (SD) time per anchor was 30.9 (13.9) minutes for knotted repairs and 25.6 (19.5) minutes for knotless repairs (P = .021).
Posterior Labral Repairs
Of the 165 knotted posterior labral repairs that met the study criteria, 39 (29%) had minimum 1-year follow-up. Of the 229 knotless labral repairs, 56 (24%) had minimum 1-year follow-up. Eighty-five percent of knotted repairs and 74% of knotless repairs were performed in men. Mean (SD) age was 29.1 (12.0) years for the knotted group and 27.5 (11.9) years for the knotless group (P = .148). Posterior labral repairs did not differ in PROMs before surgery or 1 year after surgery; 6 months after surgery, these repairs differed only in ASES scores (Table 2).
Table 2.
A mean of 3.6 anchors was used for knotted repairs, and a mean of 3.0 anchors was used for knotless repairs. Mean operative time was 67.0 minutes for knotted repairs and 43.1 minutes for knotless repairs. Mean (SD) time per anchor was 21.1 (10.7) minutes for knotted repairs and 17.5 (14.7) minutes for knotless repairs (P = .031).
SLAP Repairs
Of the 54 knotted SLAP repairs that met the study criteria, 24 (44%) had minimum 1-year follow-up. Of the 138 knotless SLAP repairs, 48 (35%) had minimum 1-year follow-up. Seventy-two percent of knotted repairs and 72% of knotless repairs were performed in men. Mean (SD) age was 32.1 (11.6) years for the knotted group and 35.0 (12.8) years for the knotless group (P = .246). SLAP repairs did not differ in PROMs at any point (Table 3).
Table 3.
A mean of 1.9 anchors was used for knotted repairs, and a mean of 2.1 anchors was used for knotless repairs. Mean operative time was 59.0 minutes for knotted repairs and 40.9 minutes for knotless repairs. Mean (SD) time per anchor was 36.6 (22.4) minutes for knotted repairs and 26.3 (14.0) minutes for knotless repairs (P = .080).
Discussion
Our hypothesis that there would be no difference in PROMs between knotted and knotless labral repairs was confirmed. Our findings are important because this study compared the gold standard of knotted suture anchor with the alternative knotless suture anchor in glenohumeral labral repair. These findings have several important implications for labral repair.
Knot tying traditionally has been used to achieve fixation with an anchor. Although simple in concept, knot tying can be challenging and its quality variable. Thal15 wrote that good-quality arthroscopic suture anchor repair is difficult to achieve because satisfactory knot tying requires significant practice with certain devices designed specifically for knot tying. Multiple surgeons have noted a significant learning curve associated with knot tying, and there is no agreement on which knot is superior.22-26 Leedle and Miller17 even suggested that, because knot tying is difficult, tying knots arthroscopically can lead to knot failure. In their study, they concluded that the knot is consistently the weakest link in suture repair of an anterior labrum construct. In a controlled laboratory study, Hanypsiak and colleagues13 found considerable knot-strength variability among expert arthroscopists. Only 65 (18%) of 365 knots tied fell within 20% of the mean for ultimate load failure, and only 128 (36%) of 365 fell within 20% of the mean for clinical failure (3 mm of displacement). These data suggested expert arthroscopists were unable to tie 5 consecutive knots of the same type consistently. Even among experts, it seems, knot strength varies significantly, and knot-strength issues may affect the rates of labral repair failure.
Multiple authors have also reported that bulky knots can cause chondral abrasion or that knots can migrate.25,27 Rhee and Ha27 reported that, when another knot (eg, a half-hitch knot) is tied to prevent knot failure, the resulting overall knot can be too bulky for a limited space, and chondral abrasion can result. In addition, regardless of size, a knot can migrate and, in its new position, start rubbing against the head of the humerus. Kim and colleagues14 found that, even when a knot is placed away from the humeral head, migration and repeated contact with the head are possible. Park and colleagues28 found that a significant number of knotted SLAP repairs required arthroscopic knot removal for relief of knot-induced pain and clicking.
Knotless constructs have several theoretical advantages over knotted constructs. Compared with a knotted technique, a knotless technique appears to provide more predictable strength, as variability in knot tying is eliminated (unpublished data). A knotless repair also has a lower profile,8 which should lead to less contact with the humeral head.19 Last, a knotless repair is more efficient—it takes less time to perform. In our study, operative time was reduced by a mean of 5.3 minutes per anchor for anterior labral repair. Assuming a mean of 3 anchors, this reduction equates to 16 minutes per case. Therefore, a surgeon who performs 25 labral repairs a year can save 6.7 hours a year. Reduced operative time benefits the patient (ie, lower risk of infection and other complications29), the surgeon, and the healthcare system (ie, cost savings). Macario30 found that operating room costs averaged $62 per minute (range, $22-$133 per minute). Therefore, saving 16 minutes per case could lead to saving $992 per case. In summary, a knotless technique appears to be clinically and financially advantageous as long as its results are the same as or better than those of a knotted technique.
A few other studies have compared knotted and knotless techniques. In a cadaveric study, Slabaugh and colleagues20 found no difference in labral height between traditional and knotless suture anchors. Leedle and Miller17 found that knotless constructs are biomechanically stronger than knotted constructs in anterior labral repair. In a level 3 clinical study, Yang and colleagues21 compared a conventional vertical knot with a knotless horizontal mattress suture in 41 patients who underwent SLAP repair. Functional outcome was no different between the 2 groups, but postoperative range of motion was improved in the knotless group. Ng and Kumar31 compared 45 patients who had knotted Bankart repair with 42 patients who had knotless Bankart repair and found no difference in functional outcome or rate of recurrent dislocation. Similarly, Kocaoglu and colleagues22 found no difference in recurrence rate between 18 patients who underwent a knotted technique for arthroscopic Bankart repair and 20 patients who underwent a knotless technique. Our findings corroborate the findings of these studies and further support the idea that there is no difference between knotted and knotless constructs with respect to PROMs.
Study Limitations
The major strength of this study was its large cohort and large population of surgeons. However, there were several study limitations. First, we could not detail specific repair techniques, such as simple or horizontal mattress orientation, and rehabilitation protocols and other variables are likely as well. Second, the repair technique was not randomized, and therefore there may have been a selection bias based on tissue quality. Although we cannot prove no bias, we think it was unlikely given that the groups were similar in age. Third, our data did not include information on range of motion or recurrent instability. Our goal was simply to evaluate PROMs among multiple surgeons using the 2 techniques. Fourth, there was substantial follow-up loss, which introduced potential selection bias. Last, there may have been conditions under which a hybrid technique with inferior knot tying, combined with a hybrid knotless construct, could have proved advantageous.
Conclusion
Our data showed that the advantages of knotless repair are not compromised in clinical situations. Although the data showed no significant difference in clinical outcomes, knotless repairs may provide surgeons with shorter surgeries, simpler constructs, less potential for chondral damage, and more consistent suture tensioning. Additional studies may further confirm these results.
Take-Home Points
There is no difference in PROMs following knotless or knotted labral repair.
Operative time is shorter for knotless compared to knotted glenoid labral tears.
Knotless constructs may be more predictable than knotted constructs biomechanically.
Orthopedic surgeons often encounter labral pathology, and labral tears historically have required open techniques.1-3 Arthroscopy allows for advanced visualization and treatment of shoulder lesions,4,5 including anterior, posterior, and superior labrum anterior to posterior (SLAP) lesions.6
The goal of arthroscopic labral repair is to restore joint stability while maintaining range of motion. Arthroscopically repairing the labrum with suture anchors has become the standard technique, and several studies have reported satisfactory biomechanical and clinical results.1,7-12 Surgeons traditionally have been required to tie knots for these anchors, but knot security varies significantly among experienced arthroscopic surgeons.13 In addition, knots can migrate,14 and bulky knots can cause chondral abrasion.15,16 Several manufacturers have introduced knotless anchors for soft-tissue fixation.15,17 The knotless technique provides a low-profile repair with potentially less operating time.8 These factors may warrant switching from knotted to knotless techniques if outcomes are clinically acceptable. However, few studies have compared knotted and knotless techniques for glenohumeral labral repair.8,15,18-21
We conducted a study to compare the clinical results and operative times of knotless and knotted fixation of anterior and posterior glenohumeral labral repairs and SLAP repairs. We hypothesized there would be no difference in patient-reported outcome measures (PROMs) between knotted and knotless techniques.
Methods
We retrospectively evaluated data that had been prospectively collected between 2012 and 2016 in a Surgical Outcomes System (SOS; Arthrex) database. Participation in this registry is elective, and enrollment can occur on a case-by-case basis. The database stores data on basic demographics, PROMs, and operative time. Data for our specific analysis were available for surgeries performed by 115 different surgeons. Inclusion criteria included primary isolated arthroscopic anterior, isolated posterior, and isolated SLAP repair with completely knotted or completely knotless labral repair and minimum 1-year follow-up. Exclusion criteria included hybrid knotted–knotless repair, rotator cuff repair, revision surgery, open surgery, and lack of complete follow-up data.
SOS is a proprietary registry that allows for the collection of basic patient demographics, diagnostic and operative data, and PROMs. PROMs in the SOS shoulder arthroscopy module include Veterans RAND 12-Item Health Survey (VR-12) mental health and physical health component summary scores, visual analog scale (VAS) pain scores, and American Shoulder and Elbow Surgeons (ASES) scores. For this study, PROMs were reviewed before surgery and 6 and 12 months after surgery. In addition, operative times of all procedures were collected.
For the analysis, completely knotted and completely knotless techniques were compared for anterior repair, posterior repair, and SLAP repair. A t test was used to compare the techniques on PROMs, and χ2 test was used to evaluate proportion differences. Statistical significance was set at P < .05.
Results
Anterior Labral Repairs
Of the 102 knotted anterior labral repairs that met the study criteria, 26 (25%) had minimum 1-year follow-up. Of the 122 knotless labral repairs, 33 (27%) had minimum 1-year follow-up. Seventy-five percent of knotted repairs and 80% of knotless repairs were performed in men. Mean (SD) age was 25.3 (11.7) years for the knotted group and 26.9 (10.6) years for the knotless group (P = .109). Anterior labral repairs did not differ in PROMs at any point (Table 1).
Table 1.
A mean of 2.8 anchors was used for knotted repairs, and a mean of 3.1 anchors was used for knotless repairs. Mean operative time was 75.8 minutes for knotted repairs and 67.5 minutes for knotless repairs. Mean (SD) time per anchor was 30.9 (13.9) minutes for knotted repairs and 25.6 (19.5) minutes for knotless repairs (P = .021).
Posterior Labral Repairs
Of the 165 knotted posterior labral repairs that met the study criteria, 39 (29%) had minimum 1-year follow-up. Of the 229 knotless labral repairs, 56 (24%) had minimum 1-year follow-up. Eighty-five percent of knotted repairs and 74% of knotless repairs were performed in men. Mean (SD) age was 29.1 (12.0) years for the knotted group and 27.5 (11.9) years for the knotless group (P = .148). Posterior labral repairs did not differ in PROMs before surgery or 1 year after surgery; 6 months after surgery, these repairs differed only in ASES scores (Table 2).
Table 2.
A mean of 3.6 anchors was used for knotted repairs, and a mean of 3.0 anchors was used for knotless repairs. Mean operative time was 67.0 minutes for knotted repairs and 43.1 minutes for knotless repairs. Mean (SD) time per anchor was 21.1 (10.7) minutes for knotted repairs and 17.5 (14.7) minutes for knotless repairs (P = .031).
SLAP Repairs
Of the 54 knotted SLAP repairs that met the study criteria, 24 (44%) had minimum 1-year follow-up. Of the 138 knotless SLAP repairs, 48 (35%) had minimum 1-year follow-up. Seventy-two percent of knotted repairs and 72% of knotless repairs were performed in men. Mean (SD) age was 32.1 (11.6) years for the knotted group and 35.0 (12.8) years for the knotless group (P = .246). SLAP repairs did not differ in PROMs at any point (Table 3).
Table 3.
A mean of 1.9 anchors was used for knotted repairs, and a mean of 2.1 anchors was used for knotless repairs. Mean operative time was 59.0 minutes for knotted repairs and 40.9 minutes for knotless repairs. Mean (SD) time per anchor was 36.6 (22.4) minutes for knotted repairs and 26.3 (14.0) minutes for knotless repairs (P = .080).
Discussion
Our hypothesis that there would be no difference in PROMs between knotted and knotless labral repairs was confirmed. Our findings are important because this study compared the gold standard of knotted suture anchor with the alternative knotless suture anchor in glenohumeral labral repair. These findings have several important implications for labral repair.
Knot tying traditionally has been used to achieve fixation with an anchor. Although simple in concept, knot tying can be challenging and its quality variable. Thal15 wrote that good-quality arthroscopic suture anchor repair is difficult to achieve because satisfactory knot tying requires significant practice with certain devices designed specifically for knot tying. Multiple surgeons have noted a significant learning curve associated with knot tying, and there is no agreement on which knot is superior.22-26 Leedle and Miller17 even suggested that, because knot tying is difficult, tying knots arthroscopically can lead to knot failure. In their study, they concluded that the knot is consistently the weakest link in suture repair of an anterior labrum construct. In a controlled laboratory study, Hanypsiak and colleagues13 found considerable knot-strength variability among expert arthroscopists. Only 65 (18%) of 365 knots tied fell within 20% of the mean for ultimate load failure, and only 128 (36%) of 365 fell within 20% of the mean for clinical failure (3 mm of displacement). These data suggested expert arthroscopists were unable to tie 5 consecutive knots of the same type consistently. Even among experts, it seems, knot strength varies significantly, and knot-strength issues may affect the rates of labral repair failure.
Multiple authors have also reported that bulky knots can cause chondral abrasion or that knots can migrate.25,27 Rhee and Ha27 reported that, when another knot (eg, a half-hitch knot) is tied to prevent knot failure, the resulting overall knot can be too bulky for a limited space, and chondral abrasion can result. In addition, regardless of size, a knot can migrate and, in its new position, start rubbing against the head of the humerus. Kim and colleagues14 found that, even when a knot is placed away from the humeral head, migration and repeated contact with the head are possible. Park and colleagues28 found that a significant number of knotted SLAP repairs required arthroscopic knot removal for relief of knot-induced pain and clicking.
Knotless constructs have several theoretical advantages over knotted constructs. Compared with a knotted technique, a knotless technique appears to provide more predictable strength, as variability in knot tying is eliminated (unpublished data). A knotless repair also has a lower profile,8 which should lead to less contact with the humeral head.19 Last, a knotless repair is more efficient—it takes less time to perform. In our study, operative time was reduced by a mean of 5.3 minutes per anchor for anterior labral repair. Assuming a mean of 3 anchors, this reduction equates to 16 minutes per case. Therefore, a surgeon who performs 25 labral repairs a year can save 6.7 hours a year. Reduced operative time benefits the patient (ie, lower risk of infection and other complications29), the surgeon, and the healthcare system (ie, cost savings). Macario30 found that operating room costs averaged $62 per minute (range, $22-$133 per minute). Therefore, saving 16 minutes per case could lead to saving $992 per case. In summary, a knotless technique appears to be clinically and financially advantageous as long as its results are the same as or better than those of a knotted technique.
A few other studies have compared knotted and knotless techniques. In a cadaveric study, Slabaugh and colleagues20 found no difference in labral height between traditional and knotless suture anchors. Leedle and Miller17 found that knotless constructs are biomechanically stronger than knotted constructs in anterior labral repair. In a level 3 clinical study, Yang and colleagues21 compared a conventional vertical knot with a knotless horizontal mattress suture in 41 patients who underwent SLAP repair. Functional outcome was no different between the 2 groups, but postoperative range of motion was improved in the knotless group. Ng and Kumar31 compared 45 patients who had knotted Bankart repair with 42 patients who had knotless Bankart repair and found no difference in functional outcome or rate of recurrent dislocation. Similarly, Kocaoglu and colleagues22 found no difference in recurrence rate between 18 patients who underwent a knotted technique for arthroscopic Bankart repair and 20 patients who underwent a knotless technique. Our findings corroborate the findings of these studies and further support the idea that there is no difference between knotted and knotless constructs with respect to PROMs.
Study Limitations
The major strength of this study was its large cohort and large population of surgeons. However, there were several study limitations. First, we could not detail specific repair techniques, such as simple or horizontal mattress orientation, and rehabilitation protocols and other variables are likely as well. Second, the repair technique was not randomized, and therefore there may have been a selection bias based on tissue quality. Although we cannot prove no bias, we think it was unlikely given that the groups were similar in age. Third, our data did not include information on range of motion or recurrent instability. Our goal was simply to evaluate PROMs among multiple surgeons using the 2 techniques. Fourth, there was substantial follow-up loss, which introduced potential selection bias. Last, there may have been conditions under which a hybrid technique with inferior knot tying, combined with a hybrid knotless construct, could have proved advantageous.
Conclusion
Our data showed that the advantages of knotless repair are not compromised in clinical situations. Although the data showed no significant difference in clinical outcomes, knotless repairs may provide surgeons with shorter surgeries, simpler constructs, less potential for chondral damage, and more consistent suture tensioning. Additional studies may further confirm these results.
References
1. Levy DM, Cole BJ, Bach BR Jr. History of surgical intervention of anterior shoulder instability. J Shoulder Elbow Surg. 2016;25(6):e139-e150.
2. Gill TJ, Zarins B. Open repairs for the treatment of anterior shoulder instability. Am J Sports Med. 2003;31(1):142-153.
3. Millett PJ, Clavert P, Warner JJ. Open operative treatment for anterior shoulder instability: when and why? J Bone Joint Surg Am. 2005;87(2):419-432.
4. Stein DA, Jazrawi L, Bartolozzi AR. Arthroscopic stabilization of anterior shoulder instability: a review of the literature. Arthroscopy. 2002;18(8):912-924.
5. Kim SH, Ha KI, Kim SH. Bankart repair in traumatic anterior shoulder instability: open versus arthroscopic technique. Arthroscopy. 2002;18(7):755-763.
6. Snyder SJ, Karzel RP, Del Pizzo W, Ferkel RD, Friedman MJ. SLAP lesions of the shoulder. Arthroscopy. 1990;6(4):274-279.
7. Hantes M, Raoulis V. Arthroscopic findings in anterior shoulder instability. Open Orthop J. 2017;11:119-132.
8. Sileo MJ, Lee SJ, Kremenic IJ, et al. Biomechanical comparison of a knotless suture anchor with standard suture anchor in the repair of type II SLAP tears. Arthroscopy. 2009;25(4):348-354.
9. Iqbal S, Jacobs U, Akhtar A, Macfarlane RJ, Waseem M. A history of shoulder surgery. Open Orthop J. 2013;7:305-309.
10. Garofalo R, Mocci A, Moretti B, et al. Arthroscopic treatment of anterior shoulder instability using knotless suture anchors. Arthroscopy. 2005;21(11):1283-1289.
11. Kersten AD, Fabing M, Ensminger S, et al. Suture capsulorrhaphy versus capsulolabral advancement for shoulder instability. Arthroscopy. 2012;28(10):1344-1351.
12. Cole BJ, Warner JJ. Arthroscopic versus open Bankart repair for traumatic anterior shoulder instability. Clin Sports Med. 2000;19(1):19-48.
13. Hanypsiak BT, DeLong JM, Simmons L, Lowe W, Burkhart S. Knot strength varies widely among expert arthroscopists. Am J Sports Med. 2014;42(8):1978-1984.
14. Kim SH, Ha KI, Park JH, et al. Arthroscopic posterior labral repair and capsular shift for traumatic unidirectional recurrent posterior subluxation of the shoulder. J Bone Joint Surg Am. 2003;85(8):1479-1487.
17. Leedle BP, Miller MD. Pullout strength of knotless suture anchors. Arthroscopy. 2005;21(1):81-85.
18. Caldwell PE 3rd, Pearson SE, D’Angelo MS. Arthroscopic knotless repair of the posterior labrum using LabralTape. Arthrosc Tech. 2016;5(2):e315-e320.
19. Tennent D, Concina C, Pearse E. Arthroscopic posterior stabilization of the shoulder using a percutaneous knotless mattress suture technique. Arthrosc Tech. 2014;3(1):e161-e164.
20. Slabaugh MA, Friel NA, Wang VM, Cole BJ. Restoring the labral height for treatment of Bankart lesions: a comparison of suture anchor constructs. Arthroscopy. 2010;26(5):587-591.
21. Yang HJ, Yoon K, Jin H, Song HS. Clinical outcome of arthroscopic SLAP repair: conventional vertical knot versus knotless horizontal mattress sutures. Knee Surg Sports Traumatol Arthrosc. 2016;24(2):464-469.
22. Kocaoglu B, Guven O, Nalbantoglu U, Aydin N, Haklar U. No difference between knotless sutures and suture anchors in arthroscopic repair of Bankart lesions in collision athletes. Knee Surg Sports Traumatol Arthrosc. 2009;17(7):844-849.
23. Aboalata M, Halawa A, Basyoni Y. The double Bankart bridge: a technique for restoration of the labral footprint in arthroscopic shoulder instability repair. Arthrosc Tech. 2017;6(1):e43-e47.
24. Rhee SM, Kang SY, Jang EC, Kim JY, Ha YC. Clinical outcomes after arthroscopic acetabular labral repair using knot-tying or knotless suture technique. Arch Orthop Trauma Surg. 2016;136(10):1411-1416.
25. Oh JH, Lee HK, Kim JY, Kim SH, Gong HS. Clinical and radiologic outcomes of arthroscopic glenoid labrum repair with the BioKnotless suture anchor. Am J Sports Med. 2009;37(12):2340-2348.
26. Yian E, Wang C, Millett PJ, Warner JJ. Arthroscopic repair of SLAP lesions with a BioKnotless suture anchor. Arthroscopy. 2004;20(5):547-551.
27. Rhee YG, Ha JH. Knot-induced glenoid erosion after arthroscopic fixation for unstable superior labrum anterior-posterior lesion: case report. J Shoulder Elbow Surg. 2006;15(3):391-393.
28. Park JG, Cho NS, Kim JY, Song JH, Hong SJ, Rhee YG. Arthroscopic knot removal for failed superior labrum anterior-posterior repair secondary to knot-induced pain. Am J Sports Med. 2017;45(11):2563-2568.
29. Wang DS. Re: how slow is too slow? Correlation of operative time to complications: an analysis from the Tennessee Surgical Quality Collaborative. J Urol. 2016;195(5):1510-1511.
30. Macario A. What does one minute of operating room time cost? J Clin Anesth. 2010;22(4):233-236.
31. Ng DZ, Kumar VP. Arthroscopic Bankart repair using knot-tying versus knotless suture anchors: is there a difference? Arthroscopy. 2014;30(4):422-427.
PRO data collection can provide feedback for improvements in patient care and physician performance.
Many options exist for orthopedic physicians to establish clinical data registries.
Registry systems can help improve patient follow-up with system monitoring and patient reminders.
Clinical registries can offer many advantages to observational research.
With registry use becoming more prevalent, work needs to be done to establish standards for validity and reliability.
In a 2012 review of database tools, Lubowitz and Smith1 examined Internet-based applications that arthroscopic surgeons could use to record and monitor patient-reported outcome (PRO) data and potential adverse effects. In this article, we update orthopedic surgeons on the registries and monitoring software mentioned in that earlier publication and in other publications that have since become available.
Most orthopedic surgery candidates are seeking pain relief and improved function. Many patients expect their pain to be completely relieved by surgical intervention and their function to return to what it was before they became stricken.2,3 Therefore, PRO measures (PROMs) are now standard in post-orthopedic surgery outcome reporting.4 PROMs, which include any measurement that assesses a patient’s health, illness, or benefits from the perspective of the patient, are often administered as a questionnaire or survey.5 The collection of PROMs continues to increase and evolve, creating a need for data storage and analysis. Registries, large collections of patient information and outcomes, allow for evaluation of patient outcomes, monitoring of adverse effects, identification of procedure incidence, understanding of predictors of prognosis, generation of feedback for quality of care, monitoring of the safety of implantable devices, and the conducting of hypothesis-driven scientific research.6-9
Orthopedic surgery has registries at regional, national, and international levels. Although the United States has fallen well behind other countries in establishing a national registry,9 it has made some recent progress. The United States now has several national registries, including the American Joint Replacement Registry (AJRR), Function and Outcomes Research for Comparative Effectiveness in Total Joint Replacement (FORCE-TJR), the Kaiser Permanente National Total Joint Replacement Registry (TJRR), the Veterans Affairs (VA) and American College of Surgeons (ACS) National Surgical Quality Improvement Programs (NSQIPs), and the National Trauma Data Bank (NTDB).9 AJRR currently has 960 hospitals participating and is tracking 1,084,664 hip and knee replacements.10
These orthopedic registries, however, are limited in 2 ways. First, the majority are joint replacement registries. Second, though registries are established to determine patterns of care and predict patient outcomes, many are not set up to report care data back to healthcare providers.7 For procedures other than joint arthroplasty and for providers interested in tracking their patients’ PROs, systems are available for establishing clinical quality registries in orthopedics.
Registry Systems
CareSense
CareSense (Medtrak) is an Internet-based care management and data collection system designed for patient engagement, which results in fewer missed appointments, increased patient adherence, enhanced patient education, and improved patient satisfaction.11 CareSense features email/text reminders for data entry, custom and standard reports, import and export of electronic medical record (EMR) information, and tools for running research studies.12 CareSense emphasizes care navigation by helping hospitals educate and guide patients through their care by sending exercise videos to patients for home rehabilitation, transferring messages from post-acute care facilities to surgeons and caregivers, and alerting the care team to any potential readmission symptoms.11,13 CareSense is also a Centers for Medicare & Medicaid Services (CMS) approved qualified clinical data registry (QCDR). QCDRs collect data for Merit-Based Incentive Payment System (MIPS) clinicians and submit the data to CMS.12
KareOutcomes
KareOutcomes, a healthcare technology and support firm founded in 2009, advocates transparency and trust among providers and patients, and aims to optimize PROs.14 The KareOutcomes team incorporates patient follow-up personnel, administrators, engineers, physicians, software developers, and technicians. The KareOutcomes software, which is backed by a 6-month guarantee, includes system design and implementation, data collection and entry, methods of submitting data to statewide or nationwide registries and sending standardized and customized surveys, and accessible and meaningful data presentation. KareOutcomes allows patient follow-up through automated reminders by telephone, SMS text message, and email. Patients can respond to surveys or questionnaires whichever way is most convenient—by telephone, Internet, SMS text message, or on paper, either in the office or by mail.
Oberd
Oberd (Universal Research Solutions) offers a comprehensive package of solutions for collecting optimal PRO data. The package has several modules: outcomes, education, registry, operative notes, data import and export, and data reporting.15 Oberd Outcomes allows convenient and engaging data collection. For example, users can send both standardized and customized forms. Oberd Education allows patients to receive information in an interactive, narrated format that is specific to their physician’s techniques and practices. Oberd Registry allows users to input multiple datasets into a registry, compare data, and generate reports with visuals. Like CareSense, Oberd is a CMS-approved QCDR. Oberd’s MIPS Dashboard helps providers collect and report patients’ reported outcomes, and use that information to modify and improve their practice.
Ortech
Ortech is a web-based data registry system that allows physicians and administrators to mine the data they own, track key metrics in their data, and improve reporting.16 Users can collect PROMs, use them to measure and analyze patient progress, and add to their collection of information that helps support their evidence-based decision making. They can capture intraoperative and implant data through barcode scanning, which then registers the data in an implant product code library that allows quick identification of patients with a specific implant in the event of a product recall. Ortech also allows automatic generation of customized operative reports on data entered from the operating room and populated into the EMR. Ortech offers 2 versions of its data collection platform, phiDB and phiDB Lite. The phiDB Lite version is for smaller practices and focuses mainly on PROMs but lacks many of the other features that phiDB offers, such as operating room modules, automated operative reports, barcode scanning, and unlimited data reporting.
Socrates
Socrates (Standardised Orthopaedic Clinical Research and Treatment Evaluation Software; Ortholink) is dedicated orthopedic software that facilitates following patient outcomes and conducting high-quality research.17 Socrates is fully customizable to fit each user’s needs. It allows for tracking of outcome scores, intraoperative details, nonoperative procedures, clinical examinations, therapies, and adverse effects. Users can also create reports from this information, which is inputted to Socrates and can be exported into EMR. Socrates data are stored on the user’s server, on site; the software generates patient summaries, collective summaries, and follow-up reports through its built-in descriptive statistics module. Raw data can be extracted for statistical analysis. Socrates can catalogue images, radiographs, documents, and videos.
Surgical Outcomes System
Surgical Outcomes System (SOS; Arthrex) is a cloud-based orthopedic and sports medicine global registry that focuses on monitoring and evaluating the outcomes of various orthopedic and sports medicine surgical procedures, as well as nonoperative interventions, to contribute to evidence-based protocols for patient treatment.18 SOS can be fully customized with desired PROMs for arthroplasty and for surgical procedures for extremity joints and even the spine. SOS includes real-time reporting on PROs for individual patients, summary PROMs for all of the physician’s patients who are receiving the same treatment, and comparisons with all registry patients (from global de-identified registry data) who had the same treatment or surgery. This real-time analysis provides immediate patient and physician feedback on treatments and products used. A patient portal for education on surgical procedures is also available. SOS is approved for use in 21 countries and is a benefit included with Arthroscopy Association of North America (AANA) membership. SOS is listed on the National Quality Registry Network (NQRN) website and, as a specialized registry as defined by CMS, can accept data generated by EMR technology.
Discussion
Delaunay19 indicated that successful registry management depends on several factors, including “use of a single identifier for each patient to ensure full traceability of all procedures related to a given implant; a long-term funding source; a contemporary, rapid, Internet-based data collection method; and the collection of exhaustive data, at least for innovative implants.” The registry systems reviewed in this article are Internet based and allow healthcare providers to monitor the clinical outcomes of their patients in the hope of improving clinical decision-making and overall patient care. From the provider perspective, many registry systems allow for integration of outcome data reporting into EMRs, including generation of operative reports. In turn, registries can improve documentation efficiency, as it was estimated that a US physician without a registry spends more than 15 hours a week reporting quality measures,20 or almost 800 hours and $15 billion each year.20,21 It remains to be seen whether registry systems will optimize the documentation process, but there is potential improvement in time and cost-efficiency with registry use.
Although the factors involved in management are important, clinical data registries must have systems in place to help ensure patient adherence and minimize selection bias, as adherence is crucial in data accuracy.3 What helps with adherence is the ability to send automated email or SMS text message reminders to patients. According to a review, email reminders increased the completion of PROM datasets by 26%.22 When the new national quality register (NQR) HAKIR (Handkirurgiskt kvalitetsregister) was established in Sweden, it was found that when only 1 type of reminder was used (SMS text message, in this case), only about 30% of participants completed their questionnaires.23 However, after the system was changed to send both SMS text message and email reminders, the response rate increased from 50% to 60%. Using 2 types of automated reminders might minimize lost data more effectively than 1 type alone.
Another benefit of outcome monitoring through a registry is potential reduction of interviewer- related errors. Interviewer bias can occur in many different ways. Interviewers might not follow the same instructions or administer questionnaires or surveys the same way for different patients,24 the interviewer’s presence might cause the patient to alter responses based on social norms,25 and the patient might report better outcomes in the presence of a physician or interviewer.26,27 Given that clinical registries allow electronic capture of self-administered surveys, interviewer bias is reduced because all patients receive a standardized set of questions and instructions. In addition, electronic questionnaires and surveys prompt users to add or fix missed or incorrectly completed items, further reducing potential data inaccuracies.
Healthcare costs continue to rise in the United States. In 2015, the total cost of healthcare expenditure in the United States was $3.2 trillion, or almost 18% of the US gross domestic product.28 In addition, in the first half of 2016, an estimated 16.2% of people under age 65 years were in families that were struggling to pay medical bills.29,30 Healthcare reform provides a financial incentive to healthcare providers to collaborate to reduce unnecessary costs and procedures and improve the quality of healthcare.31 Porter and Teisberg32 defined value as health outcomes achieved per dollar spent. Registry monitoring of PROMs, which are the numerator in this critical value formula, allows providers to track patient outcomes over time to determine which interventions produce the best outcomes.22 Therefore, clinical registries play an important role in improving health outcomes and reducing the cost of healthcare.7
Since the Swedish Knee Arthroplasty Register (SKAR) was established 40 years ago, NQRs have been commonplace in Scandinavian countries, Australia, and the United Kingdom.23 Between 2001 and 2014, the Australian Orthopaedic Association National Joint Replacement Registry (AOANJRR) documented a decline in the financial burden of hip and knee arthroplasty revision in Australia—in comparison with the United States, which did not have a full national registry at the time and showed a revision rate increase.24 The economic benefit of reducing hip and knee arthroplasty revisions in Australia during that period was an estimated $65 million to $143 million.24 Besides having financial benefits, national registries allow early identification of flawed implantation products and methods, leading to a further reduction in the burden associated with recall and future use of such defective implants—including patient harm.
In addition to monitoring existing techniques and devices, registries can also follow new techniques and, compared with publication in clinical journals, more expeditiously provide clinical data for outcome expectations and treatment methods. This timeliness is particularly valuable given that publication of clinical trials with the usual mandatory 2-year follow-up can take 4 years or longer.33,34 For instance, in the expanding field of hip arthroscopy, data from registries in both Sweden and Denmark are being analyzed.35,36 These data are important in new fields such as hip arthroscopy, in which clinical indications and treatment techniques may vary considerably between locations.35 In 2012, the Danish Hip Arthroscopy Registry (DHAR) was started as a web-based prospective registry.36 Between 2012 and December 2014, DHAR added 2000 procedures, which included all hip arthroscopy procedures performed at 11 centers in Denmark.36 DHAR tracks PROM, surgical procedure, operative, and radiologic data.
Increased use of clinical registries has led to use of their data in clinical research. Registry-based randomized controlled trials (RCTs) are lower in cost than other types of research, allow for rapid enrollment of patients, offer larger population sizes and multi-institutional sampling, and can provide a more diverse patient population.19,37 Although nonregistry RCTs remain the gold standard of clinical research, registry RCTs have several advantages given the abilities and structure of registries. Because of resources and cost, nonregistry RCTs are usually limited in the number of examined exposures and typically focus on only 2.6 Registry RCTs, on the other hand, can monitor multiple exposures, typically at minimal cost difference.6 Another disadvantage of nonregistry RCTs is that they are often performed at institutions providing care that might not be indicative of the quality most patients expect, as these institutions might be selected for a specific clinician or specialty service.
Registry RCTs also have their limitations with respect to clinical research. A major one is their lack of validity standards or accepted benchmarks for accuracy, adherence rates, registry completeness, and data collection.37,38 In addition, lack of standardization across national and international registries could produce conflicting data. Another limitation is that data in most registries are not subjected to any third-party checks or independent auditing.9,39 Furthermore, evaluating the impact of registries is difficult because it is difficult to find comparable outcome data on nonregistry patients.40 A final limitation involves the ethics of including registry data in RCTs. Although data are often added to a registry without patient consent, should the same data be used for research without patient consent? Should patients be able to disallow use of their data for research, or require a notification each time their data are used? These issues must be addressed.
Review Limitations
One limitation of this review of clinical Internet-based outcome systems is that it might not have identified comparable systems. In addition, specific costs associated with each system were not addressed, as they depend on PROM licensing fees, total institutional access, other proprietary costs, and other variables. Another limitation, in terms of creating a national or international registry, continues to be Internet access. The Pew Research Center estimated that 84% of US adults used the Internet in 2015.41 Although 84% represents most of the adult population, the other 16% typically is over age 65 years, where only 58% of adults reported using the Internet, or come from lower income households, where access was <75%. For registries in European countries and North America, where Internet usage typically is >70%, this is not a significant problem. However, worldwide, only 47% of the population used the Internet in 2016.42 Internet usage by Asian and Arab states citizens was 41.6% and 41.9%, respectively, and usage by African citizens was only 25.1%. As a significant benefit of registry use is that researchers can obtain larger sample sizes, it is a problem that some populations—elderly people, people of lower socioeconomic standing, people living where the Internet is unavailable—might be underrepresented in registry data.
As mentioned, patient adherence is an ongoing issue for clinical registries. As adherence tends to decrease as more time passes after a patient’s treatment date, it is important to account for and encourage continued patient participation with outcome monitoring. Missing data lessen the validity and accuracy of a registry, increasing the likelihood that certain groups will be underrepresented. Although registry systems can reduce the cost of following PROMs, doing so requires monitoring and following up on issues of patient adherence. In other words, many clinicians will need the help of a research assistant. Makhni and colleagues21 found that adding a research assistant for this task increased survey adherence from 65% to 94% before surgery, from 65% to 72% 6 months after surgery, and from 38% to 56% 12 months after surgery.
Even though studies continue to use clinical data from registries, there is not much research on the impact of these registries on improvement in healthcare. Again, many factors are involved: lack of standardized benchmarks for accuracy and adherence, lack of an accepted method of data auditing and validation, and difficulty evaluating the impact of registries owing to the difficulty obtaining comparable data on nonregistry patients. Registries must adopt accepted forms of standardization in order to allow better comparisons of registries, because comparing data across registries can be useful in determining the strengths and weaknesses of different registries.27,43 As registries support decision making at clinical, institutional, and governmental levels, it is vital that their clinical data be accurate and reliable.38
Conclusion
Rising healthcare costs, and government and third-party pressures are making patient outcomes collection a standard of care. Going forward, orthopedic surgeons must be proactive, and Internet -based registries provide technological advances that facilitate the process.
References
1. Lubowitz JH, Smith PA. Current concepts in clinical research: web-based, automated, arthroscopic surgery prospective database registry. Arthroscopy. 2012;28(3):425-428.
2. Ayers DC, Bozic KJ. The importance of outcome measurement in orthopaedics. Clin Orthop Relat Res. 2013;471(11):3409-3411.
3. Nwachukwu BU, Fields K, Chang B, Nawabi DH, Kelly BT, Ranawat AS. Preoperative outcome scores are predictive of achieving the minimal clinically important difference after arthroscopic treatment of femoroacetabular impingement. Am J Sports Med. 2017;45(3):612-619.
4. Breckenridge K, Bekker HL, Gibbons E, et al. How to routinely collect data on patient-reported outcome and experience measures in renal registries in Europe: an expert consensus meeting. Nephrol Dial Transplant. 2015;30(10):1605-1614.
5. Inacio MC, Paxton EW, Dillon MT. Understanding orthopaedic registry studies: a comparison with clinical studies. J Bone Joint Surg Am. 2016;98(1):e3.
6. Hoque DME, Kumari V, Hoque M, Ruseckaite R, Romero L, Evans SM. Impact of clinical registries on quality of patient care and clinical outcomes: a systematic review. PLoS One. 2017;12(9):e0183667.
7. Physician Consortium for Performance Improvement. National Quality Registry Network. http://www.thepcpi.org/programs-initiatives/national-quality-registry-network/. Accessed October 5, 2017.
8. Hickey GL, Grant SW, Cosgriff R, et al. Clinical registries: governance, management, analysis and applications. Eur J Cardiothorac Surg. 2013;44(4):605-614.
9. Pugely AJ, Martin CT, Harwood J, Ong KL, Bozic KJ, Callaghan JJ. Database and registry research in orthopaedic surgery: part 2: clinical registry data. J Bone Joint Surg Am. 2015;97(21):1799-1808.
10. American Joint Replacement Registry. http://www.ajrr.net/. Accessed October 5, 2017.
11. CareSense. https://www.caresense.com/. Accessed October 4, 2017.
12. US Department of Health and Human Services, Centers for Medicare & Medicaid Services, Quality Payment Program. Merit-Based Incentive Payment System (MIPS): 2017 CMS-Approved Qualified Clinical Data Registries (QCDRs). https://qpp.cms.gov/docs/QPP_2017_CMS_Approved_QCDRs.pdf. Accessed October 9, 2017.
13. Johnson & Johnson. Johnson & Johnson Medical Devices Companies introduce Orthopaedic Episode of Care Approach, leveraging CareAdvantage capabilities to support better clinical outcomes and reduce the cost of care. https://www.jnj.com/media-center/press-releases/johnson-johnson-medical-devices-companies-introduce-orthopaedic-episode-of-care-approach-leveraging-careadvantage-capabilities-to-support-better-clinical-outcomes-and-reduce-the-cost-of-care. Published January 9, 2017. Accessed October 4, 2017.
14. KareOutcomes. http://www.kareoutcomes.com/. Accessed October 4, 2017.
15. Oberd. http://www.oberd.com/. Accessed October 4, 2017.
16. Ortech Systems. http://www.ortechsystems.com/. Accessed October 4, 2017.
17. Socrates. http://www.socratesortho.com/. Accessed October 4, 2017.
18. Surgical Outcomes System. https://www.surgicaloutcomesystem.com/. Accessed October 4, 2017.
19. Delaunay C. Registries in orthopaedics. Orthop Traumatol Surg Res. 2015;101(1 suppl):S69-S75.
20. Bryan S, Davis J, Broesch J, Doyle-Waters MM, Lewis S, McGrail K. Choosing your partner for the PROM: a review of evidence on patient-reported outcome measures for use in primary and community care. Healthc Policy. 2014;10(2):38-51.
21. Makhni EC, Higgins JD, Hamamoto JT, Cole BJ, Romeo AA, Verma NN. Patient compliance with electronic patient reported outcomes following shoulder arthroscopy [published online ahead of print September 25, 2017]. Arthroscopy. doi:10.1016/j.arthro.2017.06.016.
22. Triplet JJ, Momoh E, Kurowicki J, Villarroel LD, Law T, Levy JC. E-mail reminders improve completion rates of patient-reported outcome measures. JSES Open Access. 2017;1:25-28.
23. Arner M. Developing a national quality registry for hand surgery: challenges and opportunities. EFORT Open Rev. 2016;1(4):100-106.
24. Ngongo CJ, Frick KD, Hightower AW, Mathingau FA, Burke H, Breiman RF. The perils of straying from protocol: sampling bias and interviewer effects. PLoS One. 2015;10(2):e0118025.
25. Hammarstedt JE, Redmond JM, Gupta A, Dunne KF, Vemula SP, Domb BG. Survey mode influence on patient-reported outcome scores in orthopaedic surgery: telephone results may be positively biased. Knee Surg Sports Traumatol Arthrosc. 2017;25(1):50-54.
26. Hoher J, Bach T, Munster A, et al. Does the mode of data collection change results in a subjective knee score? Self-administration versus interview. Am J Sports Med. 1997;25(5):642-647.
27. Lacny S, Bohm E, Hawker G, Powell J, Marshall DA. Assessing the comparability of hip arthroplasty registries in order to improve the recording and monitoring of outcome. Bone Joint J. 2016;98-B(4):442-451.
28. US Department of Health and Human Services, Centers for Medicare & Medicaid Services, National Center for Health Statistics. Health, United States, 2016: With Chartbook on Long-Term Trends in Health. Hyattsville, MD: National Center for Health Statistics, Centers for Medicare & Medicaid Services, US Dept of Health and Human Services; 2017. DHHS Publication 2017-1232. https://www.cdc.gov/nchs/data/hus/hus16.pdf. Published May 2017. Accessed October 9, 2017.
29. Cohen RA, Zammitti EP. Problems paying medical bills among persons under age 65: early release of estimates from the National Health Interview Survey, 2011-June 2016. National Health Interview Survey Early Release Program, Division of Health Interview Statistics, National Center for Health Statistics, Centers for Medicare & Medicaid Services, US Dept of Health and Human Services. https://www.cdc.gov/nchs/data/nhis/earlyrelease/probs_paying_medical_bills_jan_2011_jun_2016.pdf. Published November 2016. Accessed October 9, 2017.
30. National Center for Health Statistics. National Health Interview Survey. http://www.cdc.gov/nchs/nhis/releases.htm. Accessed October 5, 2017.
31. Karhade AV, Larsen AMG, Cote DJ, Dubois HM, Smith TR. National databases for neurosurgical outcomes research: options, strengths, and limitations [published online ahead of print August 5, 2017]. Neurosurgery. https://doi.org/10.1093/neuros/nyx408.
32. Porter ME, Teisberg EO. Redefining Health Care: Creating Value-Based Competition on Results. Boston, MA: Harvard Business School Press; 2006.
33. Chen R, Desai NR, Ross JS, et al. Publication and reporting of clinical trial results: cross sectional analysis across academic medical centers. BMJ. 2016;352:i637.
34. Counsell N, Biri D, Fraczek J, Hackshaw A. Publishing interim results of randomised clinical trials in peer-reviewed journals. Clin Trials. 2017;14(1):67-77.
35. Sansone M, Ahldén M, Jonasson P, et al. A Swedish hip arthroscopy registry: demographics and development. Knee Surg Sports Traumatol Arthrosc. 2014;22(4):774-780.
36. Mygind-Klavsen B, Grønbech Nielsen T, Maagaard N, et al. Danish Hip Arthroscopy Registry: an epidemiologic and perioperative description of the first 2000 procedures. J Hip Preserv Surg. 2016;3(2):138-145.
37. Li G, Sajobi TT, Menon BK, et al; 2016 Symposium on Registry-Based Randomized Controlled Trials in Calgary. Registry-based randomized controlled trials—what are the advantages, challenges, and areas for future research? J Clin Epidemiol. 2016;80:16-24.
38. Bautista MP, Bonilla GA, Mieth KW. Data quality in institutional arthroplasty registries: description of model of validation and report of preliminary results. J Arthroplasty. 2017;32(7):2065-2069.
39. Tevaearai H, Carrel T. Clinical registries: yes, but then appropriately! Eur J Cardiothorac Surg. 2013;44(4):614-615.
40. Australian Commission on Safety and Quality in Health Care. Economic evaluation of clinical quality registries: final report. Sydney, Australia: ACSQHC; 2016.
41. Perrin A, Duggan M. Americans’ internet access: 2000-2015. Pew Research Center website. http://www.pewinternet.org/2015/06/26/americans-internet-access-2000-2015/. Published June 26, 2015. Accessed October 5, 2017.
42. Taylor A. 47 percent of the world’s population now use the internet, study says. https://www.washingtonpost.com/news/worldviews/wp/2016/11/22/47-percent-of-the-worlds-population-now-use-the-internet-users-study-says/. Published November 22, 2016. Accessed October 5, 2017.
43. Romero L, Nieuwenhuijse M, Carr A, Sedrakyan A. Review of clinical outcomes-based anchors of minimum clinically important differences in hip and knee registry–based reports and publications. J Bone Joint Surg Am. 2014;96(suppl 1):98-103.
Authors’ Disclosure Statement: Dr. Smith reports that he is a consultant for Arthrex, Inc. and receives research support from Arthrex, Inc. Dr. Cook reports no actual or potential conflict of interest in relation to this article.
Authors’ Disclosure Statement: Dr. Smith reports that he is a consultant for Arthrex, Inc. and receives research support from Arthrex, Inc. Dr. Cook reports no actual or potential conflict of interest in relation to this article.
Author and Disclosure Information
Authors’ Disclosure Statement: Dr. Smith reports that he is a consultant for Arthrex, Inc. and receives research support from Arthrex, Inc. Dr. Cook reports no actual or potential conflict of interest in relation to this article.
PRO data collection can provide feedback for improvements in patient care and physician performance.
Many options exist for orthopedic physicians to establish clinical data registries.
Registry systems can help improve patient follow-up with system monitoring and patient reminders.
Clinical registries can offer many advantages to observational research.
With registry use becoming more prevalent, work needs to be done to establish standards for validity and reliability.
In a 2012 review of database tools, Lubowitz and Smith1 examined Internet-based applications that arthroscopic surgeons could use to record and monitor patient-reported outcome (PRO) data and potential adverse effects. In this article, we update orthopedic surgeons on the registries and monitoring software mentioned in that earlier publication and in other publications that have since become available.
Most orthopedic surgery candidates are seeking pain relief and improved function. Many patients expect their pain to be completely relieved by surgical intervention and their function to return to what it was before they became stricken.2,3 Therefore, PRO measures (PROMs) are now standard in post-orthopedic surgery outcome reporting.4 PROMs, which include any measurement that assesses a patient’s health, illness, or benefits from the perspective of the patient, are often administered as a questionnaire or survey.5 The collection of PROMs continues to increase and evolve, creating a need for data storage and analysis. Registries, large collections of patient information and outcomes, allow for evaluation of patient outcomes, monitoring of adverse effects, identification of procedure incidence, understanding of predictors of prognosis, generation of feedback for quality of care, monitoring of the safety of implantable devices, and the conducting of hypothesis-driven scientific research.6-9
Orthopedic surgery has registries at regional, national, and international levels. Although the United States has fallen well behind other countries in establishing a national registry,9 it has made some recent progress. The United States now has several national registries, including the American Joint Replacement Registry (AJRR), Function and Outcomes Research for Comparative Effectiveness in Total Joint Replacement (FORCE-TJR), the Kaiser Permanente National Total Joint Replacement Registry (TJRR), the Veterans Affairs (VA) and American College of Surgeons (ACS) National Surgical Quality Improvement Programs (NSQIPs), and the National Trauma Data Bank (NTDB).9 AJRR currently has 960 hospitals participating and is tracking 1,084,664 hip and knee replacements.10
These orthopedic registries, however, are limited in 2 ways. First, the majority are joint replacement registries. Second, though registries are established to determine patterns of care and predict patient outcomes, many are not set up to report care data back to healthcare providers.7 For procedures other than joint arthroplasty and for providers interested in tracking their patients’ PROs, systems are available for establishing clinical quality registries in orthopedics.
Registry Systems
CareSense
CareSense (Medtrak) is an Internet-based care management and data collection system designed for patient engagement, which results in fewer missed appointments, increased patient adherence, enhanced patient education, and improved patient satisfaction.11 CareSense features email/text reminders for data entry, custom and standard reports, import and export of electronic medical record (EMR) information, and tools for running research studies.12 CareSense emphasizes care navigation by helping hospitals educate and guide patients through their care by sending exercise videos to patients for home rehabilitation, transferring messages from post-acute care facilities to surgeons and caregivers, and alerting the care team to any potential readmission symptoms.11,13 CareSense is also a Centers for Medicare & Medicaid Services (CMS) approved qualified clinical data registry (QCDR). QCDRs collect data for Merit-Based Incentive Payment System (MIPS) clinicians and submit the data to CMS.12
KareOutcomes
KareOutcomes, a healthcare technology and support firm founded in 2009, advocates transparency and trust among providers and patients, and aims to optimize PROs.14 The KareOutcomes team incorporates patient follow-up personnel, administrators, engineers, physicians, software developers, and technicians. The KareOutcomes software, which is backed by a 6-month guarantee, includes system design and implementation, data collection and entry, methods of submitting data to statewide or nationwide registries and sending standardized and customized surveys, and accessible and meaningful data presentation. KareOutcomes allows patient follow-up through automated reminders by telephone, SMS text message, and email. Patients can respond to surveys or questionnaires whichever way is most convenient—by telephone, Internet, SMS text message, or on paper, either in the office or by mail.
Oberd
Oberd (Universal Research Solutions) offers a comprehensive package of solutions for collecting optimal PRO data. The package has several modules: outcomes, education, registry, operative notes, data import and export, and data reporting.15 Oberd Outcomes allows convenient and engaging data collection. For example, users can send both standardized and customized forms. Oberd Education allows patients to receive information in an interactive, narrated format that is specific to their physician’s techniques and practices. Oberd Registry allows users to input multiple datasets into a registry, compare data, and generate reports with visuals. Like CareSense, Oberd is a CMS-approved QCDR. Oberd’s MIPS Dashboard helps providers collect and report patients’ reported outcomes, and use that information to modify and improve their practice.
Ortech
Ortech is a web-based data registry system that allows physicians and administrators to mine the data they own, track key metrics in their data, and improve reporting.16 Users can collect PROMs, use them to measure and analyze patient progress, and add to their collection of information that helps support their evidence-based decision making. They can capture intraoperative and implant data through barcode scanning, which then registers the data in an implant product code library that allows quick identification of patients with a specific implant in the event of a product recall. Ortech also allows automatic generation of customized operative reports on data entered from the operating room and populated into the EMR. Ortech offers 2 versions of its data collection platform, phiDB and phiDB Lite. The phiDB Lite version is for smaller practices and focuses mainly on PROMs but lacks many of the other features that phiDB offers, such as operating room modules, automated operative reports, barcode scanning, and unlimited data reporting.
Socrates
Socrates (Standardised Orthopaedic Clinical Research and Treatment Evaluation Software; Ortholink) is dedicated orthopedic software that facilitates following patient outcomes and conducting high-quality research.17 Socrates is fully customizable to fit each user’s needs. It allows for tracking of outcome scores, intraoperative details, nonoperative procedures, clinical examinations, therapies, and adverse effects. Users can also create reports from this information, which is inputted to Socrates and can be exported into EMR. Socrates data are stored on the user’s server, on site; the software generates patient summaries, collective summaries, and follow-up reports through its built-in descriptive statistics module. Raw data can be extracted for statistical analysis. Socrates can catalogue images, radiographs, documents, and videos.
Surgical Outcomes System
Surgical Outcomes System (SOS; Arthrex) is a cloud-based orthopedic and sports medicine global registry that focuses on monitoring and evaluating the outcomes of various orthopedic and sports medicine surgical procedures, as well as nonoperative interventions, to contribute to evidence-based protocols for patient treatment.18 SOS can be fully customized with desired PROMs for arthroplasty and for surgical procedures for extremity joints and even the spine. SOS includes real-time reporting on PROs for individual patients, summary PROMs for all of the physician’s patients who are receiving the same treatment, and comparisons with all registry patients (from global de-identified registry data) who had the same treatment or surgery. This real-time analysis provides immediate patient and physician feedback on treatments and products used. A patient portal for education on surgical procedures is also available. SOS is approved for use in 21 countries and is a benefit included with Arthroscopy Association of North America (AANA) membership. SOS is listed on the National Quality Registry Network (NQRN) website and, as a specialized registry as defined by CMS, can accept data generated by EMR technology.
Discussion
Delaunay19 indicated that successful registry management depends on several factors, including “use of a single identifier for each patient to ensure full traceability of all procedures related to a given implant; a long-term funding source; a contemporary, rapid, Internet-based data collection method; and the collection of exhaustive data, at least for innovative implants.” The registry systems reviewed in this article are Internet based and allow healthcare providers to monitor the clinical outcomes of their patients in the hope of improving clinical decision-making and overall patient care. From the provider perspective, many registry systems allow for integration of outcome data reporting into EMRs, including generation of operative reports. In turn, registries can improve documentation efficiency, as it was estimated that a US physician without a registry spends more than 15 hours a week reporting quality measures,20 or almost 800 hours and $15 billion each year.20,21 It remains to be seen whether registry systems will optimize the documentation process, but there is potential improvement in time and cost-efficiency with registry use.
Although the factors involved in management are important, clinical data registries must have systems in place to help ensure patient adherence and minimize selection bias, as adherence is crucial in data accuracy.3 What helps with adherence is the ability to send automated email or SMS text message reminders to patients. According to a review, email reminders increased the completion of PROM datasets by 26%.22 When the new national quality register (NQR) HAKIR (Handkirurgiskt kvalitetsregister) was established in Sweden, it was found that when only 1 type of reminder was used (SMS text message, in this case), only about 30% of participants completed their questionnaires.23 However, after the system was changed to send both SMS text message and email reminders, the response rate increased from 50% to 60%. Using 2 types of automated reminders might minimize lost data more effectively than 1 type alone.
Another benefit of outcome monitoring through a registry is potential reduction of interviewer- related errors. Interviewer bias can occur in many different ways. Interviewers might not follow the same instructions or administer questionnaires or surveys the same way for different patients,24 the interviewer’s presence might cause the patient to alter responses based on social norms,25 and the patient might report better outcomes in the presence of a physician or interviewer.26,27 Given that clinical registries allow electronic capture of self-administered surveys, interviewer bias is reduced because all patients receive a standardized set of questions and instructions. In addition, electronic questionnaires and surveys prompt users to add or fix missed or incorrectly completed items, further reducing potential data inaccuracies.
Healthcare costs continue to rise in the United States. In 2015, the total cost of healthcare expenditure in the United States was $3.2 trillion, or almost 18% of the US gross domestic product.28 In addition, in the first half of 2016, an estimated 16.2% of people under age 65 years were in families that were struggling to pay medical bills.29,30 Healthcare reform provides a financial incentive to healthcare providers to collaborate to reduce unnecessary costs and procedures and improve the quality of healthcare.31 Porter and Teisberg32 defined value as health outcomes achieved per dollar spent. Registry monitoring of PROMs, which are the numerator in this critical value formula, allows providers to track patient outcomes over time to determine which interventions produce the best outcomes.22 Therefore, clinical registries play an important role in improving health outcomes and reducing the cost of healthcare.7
Since the Swedish Knee Arthroplasty Register (SKAR) was established 40 years ago, NQRs have been commonplace in Scandinavian countries, Australia, and the United Kingdom.23 Between 2001 and 2014, the Australian Orthopaedic Association National Joint Replacement Registry (AOANJRR) documented a decline in the financial burden of hip and knee arthroplasty revision in Australia—in comparison with the United States, which did not have a full national registry at the time and showed a revision rate increase.24 The economic benefit of reducing hip and knee arthroplasty revisions in Australia during that period was an estimated $65 million to $143 million.24 Besides having financial benefits, national registries allow early identification of flawed implantation products and methods, leading to a further reduction in the burden associated with recall and future use of such defective implants—including patient harm.
In addition to monitoring existing techniques and devices, registries can also follow new techniques and, compared with publication in clinical journals, more expeditiously provide clinical data for outcome expectations and treatment methods. This timeliness is particularly valuable given that publication of clinical trials with the usual mandatory 2-year follow-up can take 4 years or longer.33,34 For instance, in the expanding field of hip arthroscopy, data from registries in both Sweden and Denmark are being analyzed.35,36 These data are important in new fields such as hip arthroscopy, in which clinical indications and treatment techniques may vary considerably between locations.35 In 2012, the Danish Hip Arthroscopy Registry (DHAR) was started as a web-based prospective registry.36 Between 2012 and December 2014, DHAR added 2000 procedures, which included all hip arthroscopy procedures performed at 11 centers in Denmark.36 DHAR tracks PROM, surgical procedure, operative, and radiologic data.
Increased use of clinical registries has led to use of their data in clinical research. Registry-based randomized controlled trials (RCTs) are lower in cost than other types of research, allow for rapid enrollment of patients, offer larger population sizes and multi-institutional sampling, and can provide a more diverse patient population.19,37 Although nonregistry RCTs remain the gold standard of clinical research, registry RCTs have several advantages given the abilities and structure of registries. Because of resources and cost, nonregistry RCTs are usually limited in the number of examined exposures and typically focus on only 2.6 Registry RCTs, on the other hand, can monitor multiple exposures, typically at minimal cost difference.6 Another disadvantage of nonregistry RCTs is that they are often performed at institutions providing care that might not be indicative of the quality most patients expect, as these institutions might be selected for a specific clinician or specialty service.
Registry RCTs also have their limitations with respect to clinical research. A major one is their lack of validity standards or accepted benchmarks for accuracy, adherence rates, registry completeness, and data collection.37,38 In addition, lack of standardization across national and international registries could produce conflicting data. Another limitation is that data in most registries are not subjected to any third-party checks or independent auditing.9,39 Furthermore, evaluating the impact of registries is difficult because it is difficult to find comparable outcome data on nonregistry patients.40 A final limitation involves the ethics of including registry data in RCTs. Although data are often added to a registry without patient consent, should the same data be used for research without patient consent? Should patients be able to disallow use of their data for research, or require a notification each time their data are used? These issues must be addressed.
Review Limitations
One limitation of this review of clinical Internet-based outcome systems is that it might not have identified comparable systems. In addition, specific costs associated with each system were not addressed, as they depend on PROM licensing fees, total institutional access, other proprietary costs, and other variables. Another limitation, in terms of creating a national or international registry, continues to be Internet access. The Pew Research Center estimated that 84% of US adults used the Internet in 2015.41 Although 84% represents most of the adult population, the other 16% typically is over age 65 years, where only 58% of adults reported using the Internet, or come from lower income households, where access was <75%. For registries in European countries and North America, where Internet usage typically is >70%, this is not a significant problem. However, worldwide, only 47% of the population used the Internet in 2016.42 Internet usage by Asian and Arab states citizens was 41.6% and 41.9%, respectively, and usage by African citizens was only 25.1%. As a significant benefit of registry use is that researchers can obtain larger sample sizes, it is a problem that some populations—elderly people, people of lower socioeconomic standing, people living where the Internet is unavailable—might be underrepresented in registry data.
As mentioned, patient adherence is an ongoing issue for clinical registries. As adherence tends to decrease as more time passes after a patient’s treatment date, it is important to account for and encourage continued patient participation with outcome monitoring. Missing data lessen the validity and accuracy of a registry, increasing the likelihood that certain groups will be underrepresented. Although registry systems can reduce the cost of following PROMs, doing so requires monitoring and following up on issues of patient adherence. In other words, many clinicians will need the help of a research assistant. Makhni and colleagues21 found that adding a research assistant for this task increased survey adherence from 65% to 94% before surgery, from 65% to 72% 6 months after surgery, and from 38% to 56% 12 months after surgery.
Even though studies continue to use clinical data from registries, there is not much research on the impact of these registries on improvement in healthcare. Again, many factors are involved: lack of standardized benchmarks for accuracy and adherence, lack of an accepted method of data auditing and validation, and difficulty evaluating the impact of registries owing to the difficulty obtaining comparable data on nonregistry patients. Registries must adopt accepted forms of standardization in order to allow better comparisons of registries, because comparing data across registries can be useful in determining the strengths and weaknesses of different registries.27,43 As registries support decision making at clinical, institutional, and governmental levels, it is vital that their clinical data be accurate and reliable.38
Conclusion
Rising healthcare costs, and government and third-party pressures are making patient outcomes collection a standard of care. Going forward, orthopedic surgeons must be proactive, and Internet -based registries provide technological advances that facilitate the process.
Take-Home Points
PRO data collection can provide feedback for improvements in patient care and physician performance.
Many options exist for orthopedic physicians to establish clinical data registries.
Registry systems can help improve patient follow-up with system monitoring and patient reminders.
Clinical registries can offer many advantages to observational research.
With registry use becoming more prevalent, work needs to be done to establish standards for validity and reliability.
In a 2012 review of database tools, Lubowitz and Smith1 examined Internet-based applications that arthroscopic surgeons could use to record and monitor patient-reported outcome (PRO) data and potential adverse effects. In this article, we update orthopedic surgeons on the registries and monitoring software mentioned in that earlier publication and in other publications that have since become available.
Most orthopedic surgery candidates are seeking pain relief and improved function. Many patients expect their pain to be completely relieved by surgical intervention and their function to return to what it was before they became stricken.2,3 Therefore, PRO measures (PROMs) are now standard in post-orthopedic surgery outcome reporting.4 PROMs, which include any measurement that assesses a patient’s health, illness, or benefits from the perspective of the patient, are often administered as a questionnaire or survey.5 The collection of PROMs continues to increase and evolve, creating a need for data storage and analysis. Registries, large collections of patient information and outcomes, allow for evaluation of patient outcomes, monitoring of adverse effects, identification of procedure incidence, understanding of predictors of prognosis, generation of feedback for quality of care, monitoring of the safety of implantable devices, and the conducting of hypothesis-driven scientific research.6-9
Orthopedic surgery has registries at regional, national, and international levels. Although the United States has fallen well behind other countries in establishing a national registry,9 it has made some recent progress. The United States now has several national registries, including the American Joint Replacement Registry (AJRR), Function and Outcomes Research for Comparative Effectiveness in Total Joint Replacement (FORCE-TJR), the Kaiser Permanente National Total Joint Replacement Registry (TJRR), the Veterans Affairs (VA) and American College of Surgeons (ACS) National Surgical Quality Improvement Programs (NSQIPs), and the National Trauma Data Bank (NTDB).9 AJRR currently has 960 hospitals participating and is tracking 1,084,664 hip and knee replacements.10
These orthopedic registries, however, are limited in 2 ways. First, the majority are joint replacement registries. Second, though registries are established to determine patterns of care and predict patient outcomes, many are not set up to report care data back to healthcare providers.7 For procedures other than joint arthroplasty and for providers interested in tracking their patients’ PROs, systems are available for establishing clinical quality registries in orthopedics.
Registry Systems
CareSense
CareSense (Medtrak) is an Internet-based care management and data collection system designed for patient engagement, which results in fewer missed appointments, increased patient adherence, enhanced patient education, and improved patient satisfaction.11 CareSense features email/text reminders for data entry, custom and standard reports, import and export of electronic medical record (EMR) information, and tools for running research studies.12 CareSense emphasizes care navigation by helping hospitals educate and guide patients through their care by sending exercise videos to patients for home rehabilitation, transferring messages from post-acute care facilities to surgeons and caregivers, and alerting the care team to any potential readmission symptoms.11,13 CareSense is also a Centers for Medicare & Medicaid Services (CMS) approved qualified clinical data registry (QCDR). QCDRs collect data for Merit-Based Incentive Payment System (MIPS) clinicians and submit the data to CMS.12
KareOutcomes
KareOutcomes, a healthcare technology and support firm founded in 2009, advocates transparency and trust among providers and patients, and aims to optimize PROs.14 The KareOutcomes team incorporates patient follow-up personnel, administrators, engineers, physicians, software developers, and technicians. The KareOutcomes software, which is backed by a 6-month guarantee, includes system design and implementation, data collection and entry, methods of submitting data to statewide or nationwide registries and sending standardized and customized surveys, and accessible and meaningful data presentation. KareOutcomes allows patient follow-up through automated reminders by telephone, SMS text message, and email. Patients can respond to surveys or questionnaires whichever way is most convenient—by telephone, Internet, SMS text message, or on paper, either in the office or by mail.
Oberd
Oberd (Universal Research Solutions) offers a comprehensive package of solutions for collecting optimal PRO data. The package has several modules: outcomes, education, registry, operative notes, data import and export, and data reporting.15 Oberd Outcomes allows convenient and engaging data collection. For example, users can send both standardized and customized forms. Oberd Education allows patients to receive information in an interactive, narrated format that is specific to their physician’s techniques and practices. Oberd Registry allows users to input multiple datasets into a registry, compare data, and generate reports with visuals. Like CareSense, Oberd is a CMS-approved QCDR. Oberd’s MIPS Dashboard helps providers collect and report patients’ reported outcomes, and use that information to modify and improve their practice.
Ortech
Ortech is a web-based data registry system that allows physicians and administrators to mine the data they own, track key metrics in their data, and improve reporting.16 Users can collect PROMs, use them to measure and analyze patient progress, and add to their collection of information that helps support their evidence-based decision making. They can capture intraoperative and implant data through barcode scanning, which then registers the data in an implant product code library that allows quick identification of patients with a specific implant in the event of a product recall. Ortech also allows automatic generation of customized operative reports on data entered from the operating room and populated into the EMR. Ortech offers 2 versions of its data collection platform, phiDB and phiDB Lite. The phiDB Lite version is for smaller practices and focuses mainly on PROMs but lacks many of the other features that phiDB offers, such as operating room modules, automated operative reports, barcode scanning, and unlimited data reporting.
Socrates
Socrates (Standardised Orthopaedic Clinical Research and Treatment Evaluation Software; Ortholink) is dedicated orthopedic software that facilitates following patient outcomes and conducting high-quality research.17 Socrates is fully customizable to fit each user’s needs. It allows for tracking of outcome scores, intraoperative details, nonoperative procedures, clinical examinations, therapies, and adverse effects. Users can also create reports from this information, which is inputted to Socrates and can be exported into EMR. Socrates data are stored on the user’s server, on site; the software generates patient summaries, collective summaries, and follow-up reports through its built-in descriptive statistics module. Raw data can be extracted for statistical analysis. Socrates can catalogue images, radiographs, documents, and videos.
Surgical Outcomes System
Surgical Outcomes System (SOS; Arthrex) is a cloud-based orthopedic and sports medicine global registry that focuses on monitoring and evaluating the outcomes of various orthopedic and sports medicine surgical procedures, as well as nonoperative interventions, to contribute to evidence-based protocols for patient treatment.18 SOS can be fully customized with desired PROMs for arthroplasty and for surgical procedures for extremity joints and even the spine. SOS includes real-time reporting on PROs for individual patients, summary PROMs for all of the physician’s patients who are receiving the same treatment, and comparisons with all registry patients (from global de-identified registry data) who had the same treatment or surgery. This real-time analysis provides immediate patient and physician feedback on treatments and products used. A patient portal for education on surgical procedures is also available. SOS is approved for use in 21 countries and is a benefit included with Arthroscopy Association of North America (AANA) membership. SOS is listed on the National Quality Registry Network (NQRN) website and, as a specialized registry as defined by CMS, can accept data generated by EMR technology.
Discussion
Delaunay19 indicated that successful registry management depends on several factors, including “use of a single identifier for each patient to ensure full traceability of all procedures related to a given implant; a long-term funding source; a contemporary, rapid, Internet-based data collection method; and the collection of exhaustive data, at least for innovative implants.” The registry systems reviewed in this article are Internet based and allow healthcare providers to monitor the clinical outcomes of their patients in the hope of improving clinical decision-making and overall patient care. From the provider perspective, many registry systems allow for integration of outcome data reporting into EMRs, including generation of operative reports. In turn, registries can improve documentation efficiency, as it was estimated that a US physician without a registry spends more than 15 hours a week reporting quality measures,20 or almost 800 hours and $15 billion each year.20,21 It remains to be seen whether registry systems will optimize the documentation process, but there is potential improvement in time and cost-efficiency with registry use.
Although the factors involved in management are important, clinical data registries must have systems in place to help ensure patient adherence and minimize selection bias, as adherence is crucial in data accuracy.3 What helps with adherence is the ability to send automated email or SMS text message reminders to patients. According to a review, email reminders increased the completion of PROM datasets by 26%.22 When the new national quality register (NQR) HAKIR (Handkirurgiskt kvalitetsregister) was established in Sweden, it was found that when only 1 type of reminder was used (SMS text message, in this case), only about 30% of participants completed their questionnaires.23 However, after the system was changed to send both SMS text message and email reminders, the response rate increased from 50% to 60%. Using 2 types of automated reminders might minimize lost data more effectively than 1 type alone.
Another benefit of outcome monitoring through a registry is potential reduction of interviewer- related errors. Interviewer bias can occur in many different ways. Interviewers might not follow the same instructions or administer questionnaires or surveys the same way for different patients,24 the interviewer’s presence might cause the patient to alter responses based on social norms,25 and the patient might report better outcomes in the presence of a physician or interviewer.26,27 Given that clinical registries allow electronic capture of self-administered surveys, interviewer bias is reduced because all patients receive a standardized set of questions and instructions. In addition, electronic questionnaires and surveys prompt users to add or fix missed or incorrectly completed items, further reducing potential data inaccuracies.
Healthcare costs continue to rise in the United States. In 2015, the total cost of healthcare expenditure in the United States was $3.2 trillion, or almost 18% of the US gross domestic product.28 In addition, in the first half of 2016, an estimated 16.2% of people under age 65 years were in families that were struggling to pay medical bills.29,30 Healthcare reform provides a financial incentive to healthcare providers to collaborate to reduce unnecessary costs and procedures and improve the quality of healthcare.31 Porter and Teisberg32 defined value as health outcomes achieved per dollar spent. Registry monitoring of PROMs, which are the numerator in this critical value formula, allows providers to track patient outcomes over time to determine which interventions produce the best outcomes.22 Therefore, clinical registries play an important role in improving health outcomes and reducing the cost of healthcare.7
Since the Swedish Knee Arthroplasty Register (SKAR) was established 40 years ago, NQRs have been commonplace in Scandinavian countries, Australia, and the United Kingdom.23 Between 2001 and 2014, the Australian Orthopaedic Association National Joint Replacement Registry (AOANJRR) documented a decline in the financial burden of hip and knee arthroplasty revision in Australia—in comparison with the United States, which did not have a full national registry at the time and showed a revision rate increase.24 The economic benefit of reducing hip and knee arthroplasty revisions in Australia during that period was an estimated $65 million to $143 million.24 Besides having financial benefits, national registries allow early identification of flawed implantation products and methods, leading to a further reduction in the burden associated with recall and future use of such defective implants—including patient harm.
In addition to monitoring existing techniques and devices, registries can also follow new techniques and, compared with publication in clinical journals, more expeditiously provide clinical data for outcome expectations and treatment methods. This timeliness is particularly valuable given that publication of clinical trials with the usual mandatory 2-year follow-up can take 4 years or longer.33,34 For instance, in the expanding field of hip arthroscopy, data from registries in both Sweden and Denmark are being analyzed.35,36 These data are important in new fields such as hip arthroscopy, in which clinical indications and treatment techniques may vary considerably between locations.35 In 2012, the Danish Hip Arthroscopy Registry (DHAR) was started as a web-based prospective registry.36 Between 2012 and December 2014, DHAR added 2000 procedures, which included all hip arthroscopy procedures performed at 11 centers in Denmark.36 DHAR tracks PROM, surgical procedure, operative, and radiologic data.
Increased use of clinical registries has led to use of their data in clinical research. Registry-based randomized controlled trials (RCTs) are lower in cost than other types of research, allow for rapid enrollment of patients, offer larger population sizes and multi-institutional sampling, and can provide a more diverse patient population.19,37 Although nonregistry RCTs remain the gold standard of clinical research, registry RCTs have several advantages given the abilities and structure of registries. Because of resources and cost, nonregistry RCTs are usually limited in the number of examined exposures and typically focus on only 2.6 Registry RCTs, on the other hand, can monitor multiple exposures, typically at minimal cost difference.6 Another disadvantage of nonregistry RCTs is that they are often performed at institutions providing care that might not be indicative of the quality most patients expect, as these institutions might be selected for a specific clinician or specialty service.
Registry RCTs also have their limitations with respect to clinical research. A major one is their lack of validity standards or accepted benchmarks for accuracy, adherence rates, registry completeness, and data collection.37,38 In addition, lack of standardization across national and international registries could produce conflicting data. Another limitation is that data in most registries are not subjected to any third-party checks or independent auditing.9,39 Furthermore, evaluating the impact of registries is difficult because it is difficult to find comparable outcome data on nonregistry patients.40 A final limitation involves the ethics of including registry data in RCTs. Although data are often added to a registry without patient consent, should the same data be used for research without patient consent? Should patients be able to disallow use of their data for research, or require a notification each time their data are used? These issues must be addressed.
Review Limitations
One limitation of this review of clinical Internet-based outcome systems is that it might not have identified comparable systems. In addition, specific costs associated with each system were not addressed, as they depend on PROM licensing fees, total institutional access, other proprietary costs, and other variables. Another limitation, in terms of creating a national or international registry, continues to be Internet access. The Pew Research Center estimated that 84% of US adults used the Internet in 2015.41 Although 84% represents most of the adult population, the other 16% typically is over age 65 years, where only 58% of adults reported using the Internet, or come from lower income households, where access was <75%. For registries in European countries and North America, where Internet usage typically is >70%, this is not a significant problem. However, worldwide, only 47% of the population used the Internet in 2016.42 Internet usage by Asian and Arab states citizens was 41.6% and 41.9%, respectively, and usage by African citizens was only 25.1%. As a significant benefit of registry use is that researchers can obtain larger sample sizes, it is a problem that some populations—elderly people, people of lower socioeconomic standing, people living where the Internet is unavailable—might be underrepresented in registry data.
As mentioned, patient adherence is an ongoing issue for clinical registries. As adherence tends to decrease as more time passes after a patient’s treatment date, it is important to account for and encourage continued patient participation with outcome monitoring. Missing data lessen the validity and accuracy of a registry, increasing the likelihood that certain groups will be underrepresented. Although registry systems can reduce the cost of following PROMs, doing so requires monitoring and following up on issues of patient adherence. In other words, many clinicians will need the help of a research assistant. Makhni and colleagues21 found that adding a research assistant for this task increased survey adherence from 65% to 94% before surgery, from 65% to 72% 6 months after surgery, and from 38% to 56% 12 months after surgery.
Even though studies continue to use clinical data from registries, there is not much research on the impact of these registries on improvement in healthcare. Again, many factors are involved: lack of standardized benchmarks for accuracy and adherence, lack of an accepted method of data auditing and validation, and difficulty evaluating the impact of registries owing to the difficulty obtaining comparable data on nonregistry patients. Registries must adopt accepted forms of standardization in order to allow better comparisons of registries, because comparing data across registries can be useful in determining the strengths and weaknesses of different registries.27,43 As registries support decision making at clinical, institutional, and governmental levels, it is vital that their clinical data be accurate and reliable.38
Conclusion
Rising healthcare costs, and government and third-party pressures are making patient outcomes collection a standard of care. Going forward, orthopedic surgeons must be proactive, and Internet -based registries provide technological advances that facilitate the process.
References
1. Lubowitz JH, Smith PA. Current concepts in clinical research: web-based, automated, arthroscopic surgery prospective database registry. Arthroscopy. 2012;28(3):425-428.
2. Ayers DC, Bozic KJ. The importance of outcome measurement in orthopaedics. Clin Orthop Relat Res. 2013;471(11):3409-3411.
3. Nwachukwu BU, Fields K, Chang B, Nawabi DH, Kelly BT, Ranawat AS. Preoperative outcome scores are predictive of achieving the minimal clinically important difference after arthroscopic treatment of femoroacetabular impingement. Am J Sports Med. 2017;45(3):612-619.
4. Breckenridge K, Bekker HL, Gibbons E, et al. How to routinely collect data on patient-reported outcome and experience measures in renal registries in Europe: an expert consensus meeting. Nephrol Dial Transplant. 2015;30(10):1605-1614.
5. Inacio MC, Paxton EW, Dillon MT. Understanding orthopaedic registry studies: a comparison with clinical studies. J Bone Joint Surg Am. 2016;98(1):e3.
6. Hoque DME, Kumari V, Hoque M, Ruseckaite R, Romero L, Evans SM. Impact of clinical registries on quality of patient care and clinical outcomes: a systematic review. PLoS One. 2017;12(9):e0183667.
7. Physician Consortium for Performance Improvement. National Quality Registry Network. http://www.thepcpi.org/programs-initiatives/national-quality-registry-network/. Accessed October 5, 2017.
8. Hickey GL, Grant SW, Cosgriff R, et al. Clinical registries: governance, management, analysis and applications. Eur J Cardiothorac Surg. 2013;44(4):605-614.
9. Pugely AJ, Martin CT, Harwood J, Ong KL, Bozic KJ, Callaghan JJ. Database and registry research in orthopaedic surgery: part 2: clinical registry data. J Bone Joint Surg Am. 2015;97(21):1799-1808.
10. American Joint Replacement Registry. http://www.ajrr.net/. Accessed October 5, 2017.
11. CareSense. https://www.caresense.com/. Accessed October 4, 2017.
12. US Department of Health and Human Services, Centers for Medicare & Medicaid Services, Quality Payment Program. Merit-Based Incentive Payment System (MIPS): 2017 CMS-Approved Qualified Clinical Data Registries (QCDRs). https://qpp.cms.gov/docs/QPP_2017_CMS_Approved_QCDRs.pdf. Accessed October 9, 2017.
13. Johnson & Johnson. Johnson & Johnson Medical Devices Companies introduce Orthopaedic Episode of Care Approach, leveraging CareAdvantage capabilities to support better clinical outcomes and reduce the cost of care. https://www.jnj.com/media-center/press-releases/johnson-johnson-medical-devices-companies-introduce-orthopaedic-episode-of-care-approach-leveraging-careadvantage-capabilities-to-support-better-clinical-outcomes-and-reduce-the-cost-of-care. Published January 9, 2017. Accessed October 4, 2017.
14. KareOutcomes. http://www.kareoutcomes.com/. Accessed October 4, 2017.
15. Oberd. http://www.oberd.com/. Accessed October 4, 2017.
16. Ortech Systems. http://www.ortechsystems.com/. Accessed October 4, 2017.
17. Socrates. http://www.socratesortho.com/. Accessed October 4, 2017.
18. Surgical Outcomes System. https://www.surgicaloutcomesystem.com/. Accessed October 4, 2017.
19. Delaunay C. Registries in orthopaedics. Orthop Traumatol Surg Res. 2015;101(1 suppl):S69-S75.
20. Bryan S, Davis J, Broesch J, Doyle-Waters MM, Lewis S, McGrail K. Choosing your partner for the PROM: a review of evidence on patient-reported outcome measures for use in primary and community care. Healthc Policy. 2014;10(2):38-51.
21. Makhni EC, Higgins JD, Hamamoto JT, Cole BJ, Romeo AA, Verma NN. Patient compliance with electronic patient reported outcomes following shoulder arthroscopy [published online ahead of print September 25, 2017]. Arthroscopy. doi:10.1016/j.arthro.2017.06.016.
22. Triplet JJ, Momoh E, Kurowicki J, Villarroel LD, Law T, Levy JC. E-mail reminders improve completion rates of patient-reported outcome measures. JSES Open Access. 2017;1:25-28.
23. Arner M. Developing a national quality registry for hand surgery: challenges and opportunities. EFORT Open Rev. 2016;1(4):100-106.
24. Ngongo CJ, Frick KD, Hightower AW, Mathingau FA, Burke H, Breiman RF. The perils of straying from protocol: sampling bias and interviewer effects. PLoS One. 2015;10(2):e0118025.
25. Hammarstedt JE, Redmond JM, Gupta A, Dunne KF, Vemula SP, Domb BG. Survey mode influence on patient-reported outcome scores in orthopaedic surgery: telephone results may be positively biased. Knee Surg Sports Traumatol Arthrosc. 2017;25(1):50-54.
26. Hoher J, Bach T, Munster A, et al. Does the mode of data collection change results in a subjective knee score? Self-administration versus interview. Am J Sports Med. 1997;25(5):642-647.
27. Lacny S, Bohm E, Hawker G, Powell J, Marshall DA. Assessing the comparability of hip arthroplasty registries in order to improve the recording and monitoring of outcome. Bone Joint J. 2016;98-B(4):442-451.
28. US Department of Health and Human Services, Centers for Medicare & Medicaid Services, National Center for Health Statistics. Health, United States, 2016: With Chartbook on Long-Term Trends in Health. Hyattsville, MD: National Center for Health Statistics, Centers for Medicare & Medicaid Services, US Dept of Health and Human Services; 2017. DHHS Publication 2017-1232. https://www.cdc.gov/nchs/data/hus/hus16.pdf. Published May 2017. Accessed October 9, 2017.
29. Cohen RA, Zammitti EP. Problems paying medical bills among persons under age 65: early release of estimates from the National Health Interview Survey, 2011-June 2016. National Health Interview Survey Early Release Program, Division of Health Interview Statistics, National Center for Health Statistics, Centers for Medicare & Medicaid Services, US Dept of Health and Human Services. https://www.cdc.gov/nchs/data/nhis/earlyrelease/probs_paying_medical_bills_jan_2011_jun_2016.pdf. Published November 2016. Accessed October 9, 2017.
30. National Center for Health Statistics. National Health Interview Survey. http://www.cdc.gov/nchs/nhis/releases.htm. Accessed October 5, 2017.
31. Karhade AV, Larsen AMG, Cote DJ, Dubois HM, Smith TR. National databases for neurosurgical outcomes research: options, strengths, and limitations [published online ahead of print August 5, 2017]. Neurosurgery. https://doi.org/10.1093/neuros/nyx408.
32. Porter ME, Teisberg EO. Redefining Health Care: Creating Value-Based Competition on Results. Boston, MA: Harvard Business School Press; 2006.
33. Chen R, Desai NR, Ross JS, et al. Publication and reporting of clinical trial results: cross sectional analysis across academic medical centers. BMJ. 2016;352:i637.
34. Counsell N, Biri D, Fraczek J, Hackshaw A. Publishing interim results of randomised clinical trials in peer-reviewed journals. Clin Trials. 2017;14(1):67-77.
35. Sansone M, Ahldén M, Jonasson P, et al. A Swedish hip arthroscopy registry: demographics and development. Knee Surg Sports Traumatol Arthrosc. 2014;22(4):774-780.
36. Mygind-Klavsen B, Grønbech Nielsen T, Maagaard N, et al. Danish Hip Arthroscopy Registry: an epidemiologic and perioperative description of the first 2000 procedures. J Hip Preserv Surg. 2016;3(2):138-145.
37. Li G, Sajobi TT, Menon BK, et al; 2016 Symposium on Registry-Based Randomized Controlled Trials in Calgary. Registry-based randomized controlled trials—what are the advantages, challenges, and areas for future research? J Clin Epidemiol. 2016;80:16-24.
38. Bautista MP, Bonilla GA, Mieth KW. Data quality in institutional arthroplasty registries: description of model of validation and report of preliminary results. J Arthroplasty. 2017;32(7):2065-2069.
39. Tevaearai H, Carrel T. Clinical registries: yes, but then appropriately! Eur J Cardiothorac Surg. 2013;44(4):614-615.
40. Australian Commission on Safety and Quality in Health Care. Economic evaluation of clinical quality registries: final report. Sydney, Australia: ACSQHC; 2016.
41. Perrin A, Duggan M. Americans’ internet access: 2000-2015. Pew Research Center website. http://www.pewinternet.org/2015/06/26/americans-internet-access-2000-2015/. Published June 26, 2015. Accessed October 5, 2017.
42. Taylor A. 47 percent of the world’s population now use the internet, study says. https://www.washingtonpost.com/news/worldviews/wp/2016/11/22/47-percent-of-the-worlds-population-now-use-the-internet-users-study-says/. Published November 22, 2016. Accessed October 5, 2017.
43. Romero L, Nieuwenhuijse M, Carr A, Sedrakyan A. Review of clinical outcomes-based anchors of minimum clinically important differences in hip and knee registry–based reports and publications. J Bone Joint Surg Am. 2014;96(suppl 1):98-103.