User login
Most patients with lichen sclerosus receive appropriate treatment
The claims-based prevalence of 0.05% found in the study is lower than previously reported, and only 16% of the diagnoses were in women aged 18-44 years, Laura E. Melnick, MD, and associates wrote after identifying 10,004 females aged 0-65 years with lichen sclerosus in the IBM MarketScan Commercial Claims and Encounters Databases from 2015 to 2017. The majority (79%) of those diagnosed were aged 45-65 years (average, 50.8 years).
In pediatric patients (up to age 17 years), the low prevalence (0.01%) “may be attributable to several factors including relative rarity, as well as variability in pediatric clinicians’ familiarity with [lichen sclerosus] and in patients’ clinical symptoms,” said Dr. Melnick and associates in the department of dermatology at New York University.
Just over half of all diagnoses (52.4%) were made by ob.gyns., with dermatologists next at 14.5%, followed by family physicians (6.5%), nurse practitioners (2.5%), and internists (0.4%), they reported in the International Journal of Women’s Dermatology.
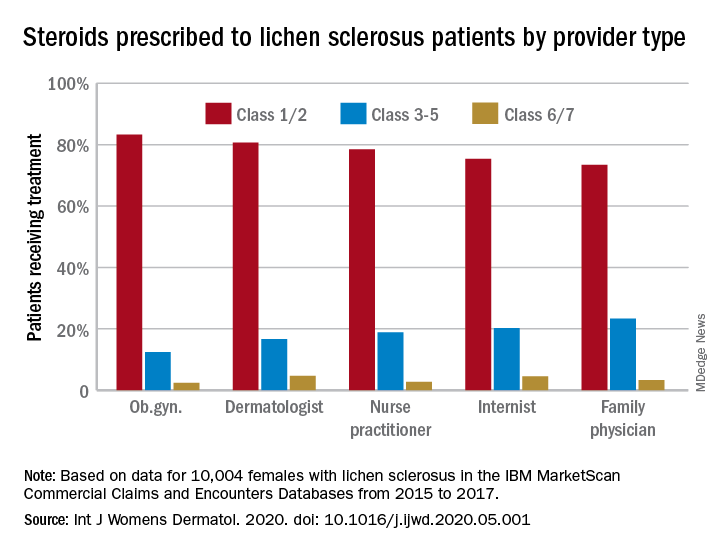
Treatment for lichen sclerosus, in the form of high-potency topical corticosteroids, was mostly appropriate. Ob.gyns. prescribed class 1/2 steroids to 83% of their patients, tops among all clinicians. Dermatologists were just over 80%, and the other clinician categories were all over 70%, the investigators said.
“Understanding the current management of [lichen sclerosus] is important given that un- or undertreated disease can significantly impact patients’ quality of life, lead to increased lower urinary tract symptoms and irreversible architectural changes, and predispose women to squamous cell carcinoma,” they wrote.
SOURCE: Melnick LE et al. Int J Womens Dermatol. 2020. doi: 10.1016/j.ijwd.2020.05.001.
The claims-based prevalence of 0.05% found in the study is lower than previously reported, and only 16% of the diagnoses were in women aged 18-44 years, Laura E. Melnick, MD, and associates wrote after identifying 10,004 females aged 0-65 years with lichen sclerosus in the IBM MarketScan Commercial Claims and Encounters Databases from 2015 to 2017. The majority (79%) of those diagnosed were aged 45-65 years (average, 50.8 years).
In pediatric patients (up to age 17 years), the low prevalence (0.01%) “may be attributable to several factors including relative rarity, as well as variability in pediatric clinicians’ familiarity with [lichen sclerosus] and in patients’ clinical symptoms,” said Dr. Melnick and associates in the department of dermatology at New York University.
Just over half of all diagnoses (52.4%) were made by ob.gyns., with dermatologists next at 14.5%, followed by family physicians (6.5%), nurse practitioners (2.5%), and internists (0.4%), they reported in the International Journal of Women’s Dermatology.
Treatment for lichen sclerosus, in the form of high-potency topical corticosteroids, was mostly appropriate. Ob.gyns. prescribed class 1/2 steroids to 83% of their patients, tops among all clinicians. Dermatologists were just over 80%, and the other clinician categories were all over 70%, the investigators said.
“Understanding the current management of [lichen sclerosus] is important given that un- or undertreated disease can significantly impact patients’ quality of life, lead to increased lower urinary tract symptoms and irreversible architectural changes, and predispose women to squamous cell carcinoma,” they wrote.
SOURCE: Melnick LE et al. Int J Womens Dermatol. 2020. doi: 10.1016/j.ijwd.2020.05.001.
FROM THE INTERNATIONAL JOURNAL OF WOMEN’S DERMATOLOGY
Sarcopenic obesity: The wasting within
Case
The patient is a 65-year-old white female who recently was discovered to have a 2-cm spiculated lung mass in the right upper lobe. She is undergoing an evaluation at present but her main complaint today is that of profound weakness and fatigue. Her appetite and energy level are noticeably less; her family ascribes this to anxiety and depression. Her other medical problems include diabetes, hypertension, osteoporosis, and obesity. The patient believes that she’s lost about 20-25 pounds recently, though her family is skeptical, adding that “she’s been heavy all her life.” Her body mass index is 40. What additional interventions would you add to her workup?

Background
Sarcopenic obesity occurs as a natural consequence of aging. As a general rule, as many as half the women and a quarter of the men over age 80 years are affected. A total of about 18 million people are involved.
One thought as to etiology is that as one ages, proteolysis outdoes protein synthesis. Fat then replaces the body’s muscle, permeates the viscera, and becomes the prominent body form. Chronic lipodeposition leads to chronic inflammation which, in turn, augments protein catabolism. The elderly become less energetic and less active, and the muscle mass decreases further. A vicious cycle develops. Concurrently with obesity, patients suffer with the onset of dyslipidemia, osteoarthritis, osteoporosis (due to vitamin D deficiency), insulin resistance, and an overall increase in frailty.
Sarcopenic obesity also plays a prognostic role in the management of cancer patients where the presence of sarcopenia correlates with earlier death and decreased capacity for therapy. Patients seen as obese are less likely to receive the intensive care (particularly nutritional support) that patients seen as a higher risk receive. The cancer cachexia is less pronounced. The obesity seen externally masks the wasting within.

Diagnosis and treatment
Sarcopenic obesity suffers from an inexact definition. According to the World Health Organization, obesity is defined, officially, as a body mass index of greater than 30 kg/m2. Muscle mass is an important part of this entity, too, but the inclusion of muscle function in this definition brings, seemingly, a point of conjecture. Is muscle function necessary? By what scale do you measure it? This imprecision makes comparative research in the field somewhat more difficult.
As clinical acumen remains the major diagnostic approach to this disease, confirmatory testing for sarcopenic obesity comprises MRIs/CTs and dual energy x-ray absorptiometry (DXA) scans. Presently DXA is used to assess bone density in the diagnosis of osteoporosis. It also reveals the decreased lean appendicular (extremity) muscle mass which, along with the increased BMI, forms the basic diagnosis of sarcopenic obesity. DXA scans are favored over CTs for the assessment of appendicular lean muscle mass. DXA scans provide a relatively inexpensive method of estimating fat, muscle, and additionally, bone density. CTs are less favored because of their radiation exposure as well as their high cost. Assessing muscle strength, using handgrip dynomometry, is available though not widely advocated.
Of the myriad modalities tried in sarcopenic obesity, many have shortcomings. No particular diet format can be advocated. Hypocaloric diets, with or without protein supplementation, offer little advantage to a good physical exercise program. The administration of vitamin D, with calcium, can be of benefit to those sarcopenically obese patients suffering with osteoporosis. Other medications, as exemplified by testosterone, vitamin K, myostatin inhibitors, or mesenchymal stem cells, are either anecdotal or dubious in nature. More research is definitely needed.
The key component for the treatment of sarcopenic obesity is exercise, both aerobic and resistant. Physical exercise recruits muscle satellite cells into the muscle fibers strengthening their composition. Growth factors are also released that stimulate the production of muscle satellite cells. Muscle mass becomes augmented and fortified. Aerobic exercise counteracts the negative metabolic effects of lipids. Resistance training is felt to improve strength when in combination with aerobic exercise, compared with aerobic exercise alone. Research has shown that high-speed resistance training, over a 12-week period, had shown a greater improvement in muscle power and capacity when compared to low-speed training. It was also recommended that patients exercise only until fatigued, not until “failure,” as a stopping point. Programs must be customized to fit the individual.
Sarcopenic obesity is a form of deconditioning that occurs naturally with age but is compounded by cancer. Research into this disease is confounded by a lack of accepted definitions. Radiographic workup and lifestyle changes are the mainstay of medical management. The foremost diagnostic tool remains, as always, clinical suspicion.
Dr. Killeen is a physician in Tampa, Fla. He practices internal medicine, hematology, and oncology, and has worked in hospice and hospital medicine.
Recommended reading
Gruber ES et al. Sarcopenia and Sarcopenic Obesity are independent adverse prognostic factors in resectable pancreatic ductal adenocarcinoma. PLoS One. 2019;14(5): e02115915.10.1371/journal.pone.0215915 [PMID 31059520].
Lombardo M et al. Sarcopenic Obesity: Etiology and lifestyle therapy. Eur Rev Med Pharmacol Sci. 2019; 23: 7152-62.
Petroni M et al. Prevention and treatment of Sarcopenic Obesity in women. Nutrients. 2019; Jun 8.10.3390/nu1161302 [PMID 31181771].
Barcos VE, Arribas L. Sarcopenic Obesity: Hidden muscle wasting and its impact for survival and complications of cancer therapy. Ann Oncol. 2018;29(suppl. 2):ii1-ii9.
Zhang X et al. Association of Sarcopenic Obesity with the risk of all-cause mortality among adults over a broad range of different settings: An update meta-analysis. BMC Geriatr. 2018;19:183-97.
Key points
- • In sarcopenic obesity a patient’s muscle loss in mass can be clouded, overshadowed by the obese body habitus. The major diagnostic tool initially is clinical suspicion.
- • The diagnostic tests for sarcopenic obesity are DXA and CT scans.
- • The best treatment for sarcopenic obesity is a good exercise plan.
Quiz
1. What is the best treatment for sarcopenic obesity?
A. Testosterone
B. Vitamin K
C. Myostatin inhibitors
D. None of the above
Answer: D
There is no particular pharmaceutical treatment, to date, for sarcopenic obesity. Only an exercise program has proved to be of benefit. Those for whom fatigue might be problematic could benefit perhaps by doing “energy banking” or taking programmed naps/rest periods prior to exercise.
2. DXA scans are favored over CT scans because of which of the following?
A. Less cost
B. Capacity to diagnose osteoporosis
C. Less radiation exposure
D. All of the above
Answer: D
DXA scans offer all of the above advantages over CT scans. Also, patients with sarcopenic obesity found to be osteoporotic could be started on vitamin D and calcium supplementation.
3. Which of the following hamper the diagnosis and treatment of sarcopenic obesity?
A. The issue of muscle function
B. Difficulties in comparative research studies
C. Remembering that muscle wasting can occur without external evidence of cachexia
D. All of the above
Answer: D
Obtaining a precise definition of sarcopenic obesity and dealing with the issue of muscle strength and capacity make comparative studies difficult. The sarcopenic obese patient needs as much attention as the cachectic one as their wasting is from within.
4. In sarcopenic obesity and cancer the presence of sarcopenia is likely to lead to which of the following?
A. Earlier death
B. Decreased capacity for therapy
C. Less treatment focus compared to nonsarcopenic patients
D. All of the above
Answer: D
The presence of sarcopenia correlates to all of the above particularly as the obese patient is thought to require less intensive attention than others.
Case
The patient is a 65-year-old white female who recently was discovered to have a 2-cm spiculated lung mass in the right upper lobe. She is undergoing an evaluation at present but her main complaint today is that of profound weakness and fatigue. Her appetite and energy level are noticeably less; her family ascribes this to anxiety and depression. Her other medical problems include diabetes, hypertension, osteoporosis, and obesity. The patient believes that she’s lost about 20-25 pounds recently, though her family is skeptical, adding that “she’s been heavy all her life.” Her body mass index is 40. What additional interventions would you add to her workup?
Background
Sarcopenic obesity occurs as a natural consequence of aging. As a general rule, as many as half the women and a quarter of the men over age 80 years are affected. A total of about 18 million people are involved.
One thought as to etiology is that as one ages, proteolysis outdoes protein synthesis. Fat then replaces the body’s muscle, permeates the viscera, and becomes the prominent body form. Chronic lipodeposition leads to chronic inflammation which, in turn, augments protein catabolism. The elderly become less energetic and less active, and the muscle mass decreases further. A vicious cycle develops. Concurrently with obesity, patients suffer with the onset of dyslipidemia, osteoarthritis, osteoporosis (due to vitamin D deficiency), insulin resistance, and an overall increase in frailty.
Sarcopenic obesity also plays a prognostic role in the management of cancer patients where the presence of sarcopenia correlates with earlier death and decreased capacity for therapy. Patients seen as obese are less likely to receive the intensive care (particularly nutritional support) that patients seen as a higher risk receive. The cancer cachexia is less pronounced. The obesity seen externally masks the wasting within.
Diagnosis and treatment
Sarcopenic obesity suffers from an inexact definition. According to the World Health Organization, obesity is defined, officially, as a body mass index of greater than 30 kg/m2. Muscle mass is an important part of this entity, too, but the inclusion of muscle function in this definition brings, seemingly, a point of conjecture. Is muscle function necessary? By what scale do you measure it? This imprecision makes comparative research in the field somewhat more difficult.
As clinical acumen remains the major diagnostic approach to this disease, confirmatory testing for sarcopenic obesity comprises MRIs/CTs and dual energy x-ray absorptiometry (DXA) scans. Presently DXA is used to assess bone density in the diagnosis of osteoporosis. It also reveals the decreased lean appendicular (extremity) muscle mass which, along with the increased BMI, forms the basic diagnosis of sarcopenic obesity. DXA scans are favored over CTs for the assessment of appendicular lean muscle mass. DXA scans provide a relatively inexpensive method of estimating fat, muscle, and additionally, bone density. CTs are less favored because of their radiation exposure as well as their high cost. Assessing muscle strength, using handgrip dynomometry, is available though not widely advocated.
Of the myriad modalities tried in sarcopenic obesity, many have shortcomings. No particular diet format can be advocated. Hypocaloric diets, with or without protein supplementation, offer little advantage to a good physical exercise program. The administration of vitamin D, with calcium, can be of benefit to those sarcopenically obese patients suffering with osteoporosis. Other medications, as exemplified by testosterone, vitamin K, myostatin inhibitors, or mesenchymal stem cells, are either anecdotal or dubious in nature. More research is definitely needed.
The key component for the treatment of sarcopenic obesity is exercise, both aerobic and resistant. Physical exercise recruits muscle satellite cells into the muscle fibers strengthening their composition. Growth factors are also released that stimulate the production of muscle satellite cells. Muscle mass becomes augmented and fortified. Aerobic exercise counteracts the negative metabolic effects of lipids. Resistance training is felt to improve strength when in combination with aerobic exercise, compared with aerobic exercise alone. Research has shown that high-speed resistance training, over a 12-week period, had shown a greater improvement in muscle power and capacity when compared to low-speed training. It was also recommended that patients exercise only until fatigued, not until “failure,” as a stopping point. Programs must be customized to fit the individual.
Sarcopenic obesity is a form of deconditioning that occurs naturally with age but is compounded by cancer. Research into this disease is confounded by a lack of accepted definitions. Radiographic workup and lifestyle changes are the mainstay of medical management. The foremost diagnostic tool remains, as always, clinical suspicion.
Dr. Killeen is a physician in Tampa, Fla. He practices internal medicine, hematology, and oncology, and has worked in hospice and hospital medicine.
Recommended reading
Gruber ES et al. Sarcopenia and Sarcopenic Obesity are independent adverse prognostic factors in resectable pancreatic ductal adenocarcinoma. PLoS One. 2019;14(5): e02115915.10.1371/journal.pone.0215915 [PMID 31059520].
Lombardo M et al. Sarcopenic Obesity: Etiology and lifestyle therapy. Eur Rev Med Pharmacol Sci. 2019; 23: 7152-62.
Petroni M et al. Prevention and treatment of Sarcopenic Obesity in women. Nutrients. 2019; Jun 8.10.3390/nu1161302 [PMID 31181771].
Barcos VE, Arribas L. Sarcopenic Obesity: Hidden muscle wasting and its impact for survival and complications of cancer therapy. Ann Oncol. 2018;29(suppl. 2):ii1-ii9.
Zhang X et al. Association of Sarcopenic Obesity with the risk of all-cause mortality among adults over a broad range of different settings: An update meta-analysis. BMC Geriatr. 2018;19:183-97.
Key points
- • In sarcopenic obesity a patient’s muscle loss in mass can be clouded, overshadowed by the obese body habitus. The major diagnostic tool initially is clinical suspicion.
- • The diagnostic tests for sarcopenic obesity are DXA and CT scans.
- • The best treatment for sarcopenic obesity is a good exercise plan.
Quiz
1. What is the best treatment for sarcopenic obesity?
A. Testosterone
B. Vitamin K
C. Myostatin inhibitors
D. None of the above
Answer: D
There is no particular pharmaceutical treatment, to date, for sarcopenic obesity. Only an exercise program has proved to be of benefit. Those for whom fatigue might be problematic could benefit perhaps by doing “energy banking” or taking programmed naps/rest periods prior to exercise.
2. DXA scans are favored over CT scans because of which of the following?
A. Less cost
B. Capacity to diagnose osteoporosis
C. Less radiation exposure
D. All of the above
Answer: D
DXA scans offer all of the above advantages over CT scans. Also, patients with sarcopenic obesity found to be osteoporotic could be started on vitamin D and calcium supplementation.
3. Which of the following hamper the diagnosis and treatment of sarcopenic obesity?
A. The issue of muscle function
B. Difficulties in comparative research studies
C. Remembering that muscle wasting can occur without external evidence of cachexia
D. All of the above
Answer: D
Obtaining a precise definition of sarcopenic obesity and dealing with the issue of muscle strength and capacity make comparative studies difficult. The sarcopenic obese patient needs as much attention as the cachectic one as their wasting is from within.
4. In sarcopenic obesity and cancer the presence of sarcopenia is likely to lead to which of the following?
A. Earlier death
B. Decreased capacity for therapy
C. Less treatment focus compared to nonsarcopenic patients
D. All of the above
Answer: D
The presence of sarcopenia correlates to all of the above particularly as the obese patient is thought to require less intensive attention than others.
Low-dose erlotinib seems feasible for frail, elderly patients with NSCLC
, according to researchers.
They conducted a phase 2 trial to investigate whether one-third of the maximum tolerated dose of erlotinib could maintain sufficient plasma concentration of the drug while avoiding the adverse effects of higher doses. The results were published in JAMA Oncology.
Erlotinib and other epidermal growth factor receptor (EGFR) tyrosine kinase inhibitors (TKIs) have demonstrated efficacy in elderly patients with EGFR-positive NSCLC, according to study author Shingo Miyamoto, MD, of Japanese Red Cross Medical Center in Tokyo, and colleagues.
“With the increasing number of elderly patients with cancer, many of whom also have significant comorbidities, there is a considerable value in investigating whether EGFR-TKIs are effective for the frail population,” the authors wrote. They also noted that it is “difficult to identify the appropriate dose of molecular-targeted drugs.”
With this in mind, Dr. Miyamoto and colleagues conducted a single-arm, phase 2 trial of low-dose erlotinib in 80 chemotherapy-naive frail or elderly patients with EGFR-positive NSCLC. Frailty was defined by age and the Charlson Comorbidity Index. The patients’ median age was 80 years (range, 49-90 years).
Patients received erlotinib at 50 mg per day, which is one-third of the established maximum tolerated dose, for 4 weeks. Then, they were evaluated with radiologic imaging. Treatment continued until disease progression or unacceptable adverse events. Dosing was modified by treatment response or by adverse events.
Results
At last follow-up, 7 of the 80 patients were still receiving low-dose erlotinib. Reasons for discontinuation were disease progression (n = 60), patient request (n = 6), adverse events (n = 4), and death (n = 3).
The overall response rate was 60%, and the disease control rate was 90%. The researchers measured plasma erlotinib concentration in 48 patients and found it did not correlate with response.
The median progression-free survival was 9.3 months, and the median overall survival was 26.2 months.
Ten patients had erlotinib temporarily suspended because of adverse events. Five patients had their dose reduced to 25 mg because of adverse events, including oral mucositis, paronychia, erythema multiforme, diarrhea, and anorexia.
Two patients discontinued treatment because of adverse events. One patient had a cutaneous ulcer and bone infection. The other had oral mucositis.
Dr. Miyamoto and colleagues concluded that, “low-dose erlotinib was associated with efficacy and safety in frail patients with EGFR mutation–positive lung cancer. More research on the dosing strategy of target-based drugs is warranted, especially in frail patients in the real-world setting.”
Less is more
Sometimes, less can be more, said Mellar P. Davis, MD, an oncologist and section head of the palliative care department at Geisinger Medical System in Danville, Penn., who was not involved in this study.

“Why do patients benefit from small doses? It may be that there are fewer drug interruptions over time and patients are able to stay on schedule,” Dr. Davis said. “It may also be that erlotinib clearance is reduced in the elderly and comorbid patient. The reduced dose may, in fact, be the ‘therapeutic’ dose in this special population.”
Plasma levels were frequently in therapeutic ranges in this study, but patients who had subtherapeutic plasma levels also responded to therapy, Dr. Davis pointed out. The lower dose was shown to maintain sufficient concentrations of the treatment while reducing adverse effects.
However, Dr. Davis noted, this was not a randomized trial. “It is always a risk hedging bets on single-arm trials,” he said. “Randomized trials often prove phase 2 single-arm trials wrong.”
He added that quality-of-life measures are absent from the study. Erlotinib is a palliative drug with side effects, Dr. Davis noted.
“Control of cancer and cancer regression should improve symptoms and quality of life when balanced against treatment toxicity,” he said. “In this study, I would have thought that symptom improvement, performance score, and quality of life would have been the primary outcome or the co-primary outcome with disease control.”
Should a randomized, controlled trial of low-dose erlotinib be conducted in the frail/elderly population? “If one believes trials should be quantitatively based, the answer would be no,” Dr. Davis said. “Responses may be the same, and it would be expensive to prove that low-dose erlotinib is the same as standard doses when comparing survival.”
However, if one is interested in quality of life, particularly in this growing population, a trial that incorporated quality-of-life measures would make more sense, according to Dr. Davis. “For if one can achieve less toxicity and treat more patients and get the same duration of clinical benefit, then less will be more,” he concluded.
Dr. Davis reported having no conflicts of interest. Study authors disclosed relationships with Astellas Pharma, AstraZeneca, Bristol-Myers Squibb, and many other companies. Erlotinib is manufactured for OSI Pharmaceuticals, an affiliate of Astellas Pharma, and distributed by Genentech, a member of the Roche Group.
The study was supported by the Japan Agency for Medical Research and Development.
SOURCE: Miyamoto S et al. JAMA Oncol. 2020 May 14; e201250. doi: 10.1001/jamaoncol.2020.1250.
, according to researchers.
They conducted a phase 2 trial to investigate whether one-third of the maximum tolerated dose of erlotinib could maintain sufficient plasma concentration of the drug while avoiding the adverse effects of higher doses. The results were published in JAMA Oncology.
Erlotinib and other epidermal growth factor receptor (EGFR) tyrosine kinase inhibitors (TKIs) have demonstrated efficacy in elderly patients with EGFR-positive NSCLC, according to study author Shingo Miyamoto, MD, of Japanese Red Cross Medical Center in Tokyo, and colleagues.
“With the increasing number of elderly patients with cancer, many of whom also have significant comorbidities, there is a considerable value in investigating whether EGFR-TKIs are effective for the frail population,” the authors wrote. They also noted that it is “difficult to identify the appropriate dose of molecular-targeted drugs.”
With this in mind, Dr. Miyamoto and colleagues conducted a single-arm, phase 2 trial of low-dose erlotinib in 80 chemotherapy-naive frail or elderly patients with EGFR-positive NSCLC. Frailty was defined by age and the Charlson Comorbidity Index. The patients’ median age was 80 years (range, 49-90 years).
Patients received erlotinib at 50 mg per day, which is one-third of the established maximum tolerated dose, for 4 weeks. Then, they were evaluated with radiologic imaging. Treatment continued until disease progression or unacceptable adverse events. Dosing was modified by treatment response or by adverse events.
Results
At last follow-up, 7 of the 80 patients were still receiving low-dose erlotinib. Reasons for discontinuation were disease progression (n = 60), patient request (n = 6), adverse events (n = 4), and death (n = 3).
The overall response rate was 60%, and the disease control rate was 90%. The researchers measured plasma erlotinib concentration in 48 patients and found it did not correlate with response.
The median progression-free survival was 9.3 months, and the median overall survival was 26.2 months.
Ten patients had erlotinib temporarily suspended because of adverse events. Five patients had their dose reduced to 25 mg because of adverse events, including oral mucositis, paronychia, erythema multiforme, diarrhea, and anorexia.
Two patients discontinued treatment because of adverse events. One patient had a cutaneous ulcer and bone infection. The other had oral mucositis.
Dr. Miyamoto and colleagues concluded that, “low-dose erlotinib was associated with efficacy and safety in frail patients with EGFR mutation–positive lung cancer. More research on the dosing strategy of target-based drugs is warranted, especially in frail patients in the real-world setting.”
Less is more
Sometimes, less can be more, said Mellar P. Davis, MD, an oncologist and section head of the palliative care department at Geisinger Medical System in Danville, Penn., who was not involved in this study.
“Why do patients benefit from small doses? It may be that there are fewer drug interruptions over time and patients are able to stay on schedule,” Dr. Davis said. “It may also be that erlotinib clearance is reduced in the elderly and comorbid patient. The reduced dose may, in fact, be the ‘therapeutic’ dose in this special population.”
Plasma levels were frequently in therapeutic ranges in this study, but patients who had subtherapeutic plasma levels also responded to therapy, Dr. Davis pointed out. The lower dose was shown to maintain sufficient concentrations of the treatment while reducing adverse effects.
However, Dr. Davis noted, this was not a randomized trial. “It is always a risk hedging bets on single-arm trials,” he said. “Randomized trials often prove phase 2 single-arm trials wrong.”
He added that quality-of-life measures are absent from the study. Erlotinib is a palliative drug with side effects, Dr. Davis noted.
“Control of cancer and cancer regression should improve symptoms and quality of life when balanced against treatment toxicity,” he said. “In this study, I would have thought that symptom improvement, performance score, and quality of life would have been the primary outcome or the co-primary outcome with disease control.”
Should a randomized, controlled trial of low-dose erlotinib be conducted in the frail/elderly population? “If one believes trials should be quantitatively based, the answer would be no,” Dr. Davis said. “Responses may be the same, and it would be expensive to prove that low-dose erlotinib is the same as standard doses when comparing survival.”
However, if one is interested in quality of life, particularly in this growing population, a trial that incorporated quality-of-life measures would make more sense, according to Dr. Davis. “For if one can achieve less toxicity and treat more patients and get the same duration of clinical benefit, then less will be more,” he concluded.
Dr. Davis reported having no conflicts of interest. Study authors disclosed relationships with Astellas Pharma, AstraZeneca, Bristol-Myers Squibb, and many other companies. Erlotinib is manufactured for OSI Pharmaceuticals, an affiliate of Astellas Pharma, and distributed by Genentech, a member of the Roche Group.
The study was supported by the Japan Agency for Medical Research and Development.
SOURCE: Miyamoto S et al. JAMA Oncol. 2020 May 14; e201250. doi: 10.1001/jamaoncol.2020.1250.
Painful Indurated Plaque on the Groin
The Diagnosis: Cutaneous Metastasis
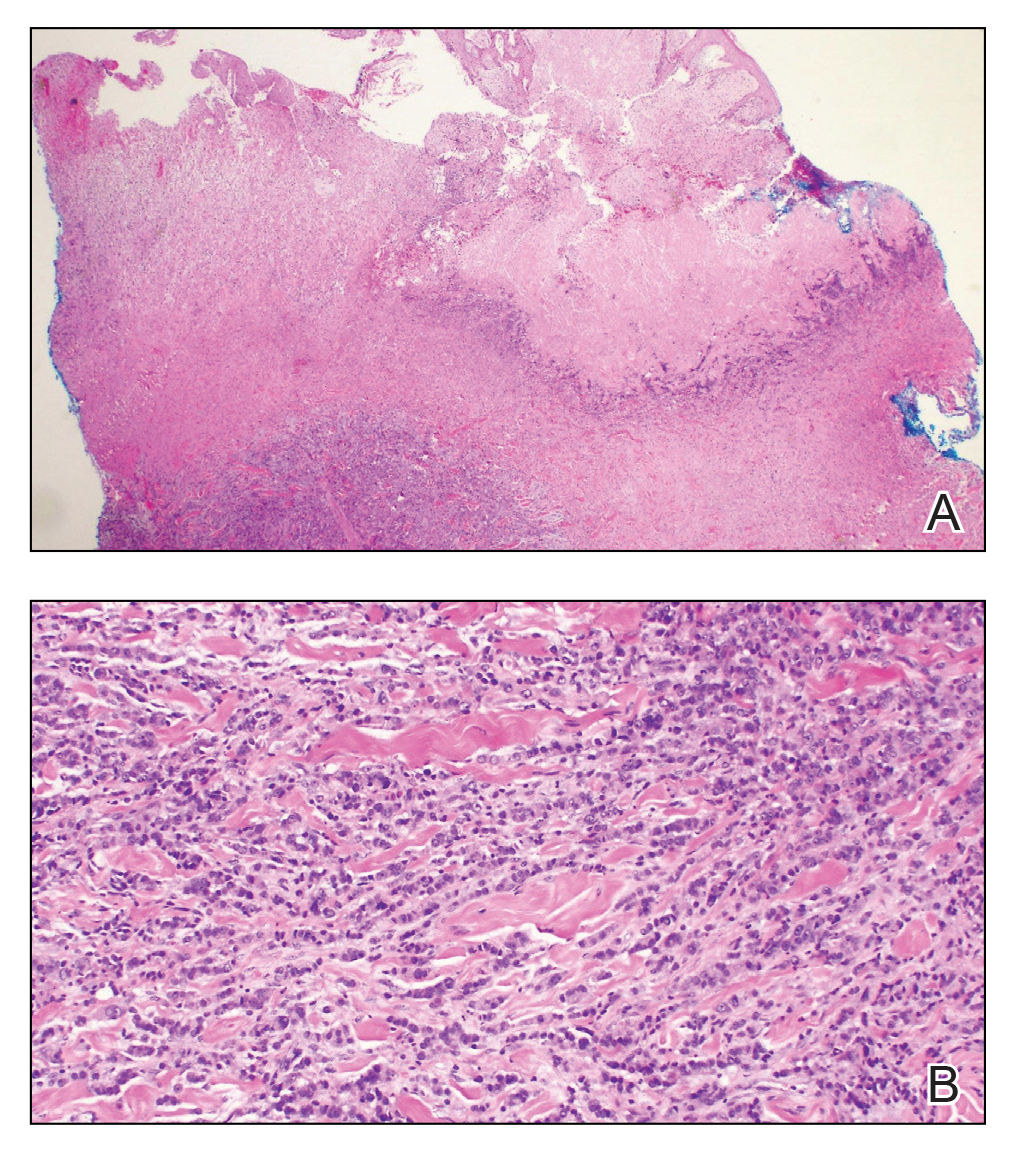
Histopathology demonstrated ulceration of the epidermis with necrosis of the papillary dermis. There was a diffuse infiltration of pleomorphic and atypical epithelioid cells in the reticular dermis (Figure). Focally there was ductal and glandular differentiation. The stroma was sclerotic. At the deep aspect of the biopsy specimen, tumor cells intercalated between collagen bundles in linear strands. Atypical mitoses were common, and necrosis en masse was seen. An immunohistochemical panel also was performed. Tissue from the biopsy was strongly positive for CDX-2 and cytokeratin 20 and diffusely negative for cytokeratin 7, gross cystic disease fluid protein 15, and prostate-specific antigen. The other biopsy was sent for cultures and grew no organisms, which confirmed the diagnosis of cutaneous metastasis from the patient's primary colonic adenocarcinoma. Due to the poor prognosis and his overall poor health, our patient opted for palliative care.
Based on large retrospective studies, the frequency of cutaneous metastasis for patients diagnosed with any malignancy is 0.7% to 9.0%.1-4 The third most common malignancy in both sexes is colorectal cancer, affecting approximately 5% of the US population.3 The frequency of cutaneous metastases from colorectal cancer is 0.81% to 3.9%.1,2,4,5 Generally, cutaneous metastases present within 2 to 3 years from diagnosis of primary malignancy.6,7 The most common sites for cutaneous metastases in a patient with colorectal cancer are the abdomen and pelvic region, often at surgical sites.1-4,6-9
The clinical presentation of cutaneous metastases varies greatly, and as a result, they commonly are misdiagnosed.6,7 Although treatment with many antibiotics and antifungals had failed in our patient, the examination still was concerning for a possible granulomatous infection vs malignancy. With the history of colon cancer, radiation treatment, and chemotherapy, the possible malignancy diagnoses included primary skin cancers, viral tumors, and cutaneous metastasis. The initial evaluations had focused on infectious causes and resulted in 6 weeks of misdiagnosis and inappropriate therapy. Despite cutaneous metastases being uncommon, there should be a high index of suspicion for lesions in patients who have a history of cancer, especially if the lesion does not respond to treatment.2,6,7
Physical examination in our patient showed a high tumor burden as well as evidence of carcinoma erysipeloides on the lower abdomen and thighs, in addition to carcinoma en cuirasse throughout the pubic region. Carcinoma erysipeloides was first described in 1893 in a patient with breast cancer: "The erythematous infiltration of the skin was very superficial, and was attended simply by redness with a slight degree of induration. Until touched by the finger the condition might easily have been taken for a slightly-marked form of erysipelas."10 The clinical findings are a result of lymphatic and vascular obstruction.3,9 The breast is the most common location to find carcinoma erysipeloides.3 It is an unusual occurrence to find it on the abdomen from colonic adenocarcinoma. The term cancer en cuirasse was coined in 1838 to describe the cutaneous manifestation of breast cancer that caused the skin to resemble the metal breastplate of a cuirasser.4 Similar to carcinoma erysipeloides, carcinoma en cuirasse most commonly is found as cutaneous metastasis from breast cancer, not from colonic adenocarcinoma.3
The histologic characteristics of cutaneous metastases in general are similar to the primary malignancy but can be more poorly differentiated.7 Generally, neoplastic cells are seen in the lymphatic and blood vessels, and a large portion of the tumor is confined to the deep dermis and in the subcutaneous fat.3,6 Histologic features of colonic adenocarcinoma metastases can demonstrate a well-differentiated, glandular architecture with mucin-secreting cells.3,8,9 There also is a histologic pattern of neoplastic cells arranging themselves between collagen bundles in linear strands; this finding more commonly is seen in adenocarcinoma of the breast but also was seen in our patient.3,9 With immunohistochemical staining, a truncated panel of cytokeratin 7, cytokeratin 20, and S-100 had a diagnostic accuracy of 100% for cutaneous metastases from colonic adenocarcinoma in one study. The pattern of all colonic adenocarcinomas was cytokeratin 20 positive and cytokeratin 7 and S-100 negative.6
Cutaneous metastases typically demonstrate widespread and rapidly progressive disease.3,9 Survival studies of cutaneous metastases showed that 48% to 66% of patients died within the first 6 months.3,6 Specifically, cutaneous metastases from colorectal cancers showed a median survival of 3 to 5 months.6,7 Currently there are no treatment guidelines for cutaneous metastases.
- Lookingbill DP, Spangler N, Helm K. Cutaneous metastases in patients with metastatic carcinoma: a retrospective study of 4020 patients. J Am Acad Dermatol. 1993;29(2 pt 1):228-236.
- Gul U, Kilic A, Gonul M, et al. Spectrum of cutaneous metastases in 1287 cases of internal malignancies: a study from Turkey. Acta Derm Venereol. 2007;87:160-162.
- Hussein MR. Skin metastasis: a pathologist's perspective. J Cutan Pathol. 2010;37:E1-E20.
- Schwartz RA. Cutaneous metastatic disease. J Am Acad Dermatol. 1995;33(2 pt 1):161-182; quiz 183-186.
- Hu S, Chen G, Wu C, et al. Rates of cutaneous metastases from different internal malignancies: experience from a Taiwanese medical center. J Am Acad Dermatol. 2009;60:379-387.
- Saeed S, Keehn C, Morgan M. Cutaneous metastasis: a clinical, pathological, and immunohistochemical appraisal. J Cutan Pathol. 2004;31:419-430.
- Sariya D, Ruth K, Adams-McDonnell R. Clinicopathologic correlation of cutaneous metastases: experience of a cancer center. Arch Dermatol. 2007;143:613-620.
- Brownstein M, Helwig E. Metastatic tumors of the skin. Cancer. 1972;29:1298-1307.
- McKee PH. Cutaneous metastases. J Cutan Pathol. 1985;12:239-250.
- Hutchinson J. Notes from congresses and continental hospitals: erythema-scirrhus of the skin in association with cancer of the breast. Arch Surg (London). 1893;4:220-222
The Diagnosis: Cutaneous Metastasis
Histopathology demonstrated ulceration of the epidermis with necrosis of the papillary dermis. There was a diffuse infiltration of pleomorphic and atypical epithelioid cells in the reticular dermis (Figure). Focally there was ductal and glandular differentiation. The stroma was sclerotic. At the deep aspect of the biopsy specimen, tumor cells intercalated between collagen bundles in linear strands. Atypical mitoses were common, and necrosis en masse was seen. An immunohistochemical panel also was performed. Tissue from the biopsy was strongly positive for CDX-2 and cytokeratin 20 and diffusely negative for cytokeratin 7, gross cystic disease fluid protein 15, and prostate-specific antigen. The other biopsy was sent for cultures and grew no organisms, which confirmed the diagnosis of cutaneous metastasis from the patient's primary colonic adenocarcinoma. Due to the poor prognosis and his overall poor health, our patient opted for palliative care.
Based on large retrospective studies, the frequency of cutaneous metastasis for patients diagnosed with any malignancy is 0.7% to 9.0%.1-4 The third most common malignancy in both sexes is colorectal cancer, affecting approximately 5% of the US population.3 The frequency of cutaneous metastases from colorectal cancer is 0.81% to 3.9%.1,2,4,5 Generally, cutaneous metastases present within 2 to 3 years from diagnosis of primary malignancy.6,7 The most common sites for cutaneous metastases in a patient with colorectal cancer are the abdomen and pelvic region, often at surgical sites.1-4,6-9
The clinical presentation of cutaneous metastases varies greatly, and as a result, they commonly are misdiagnosed.6,7 Although treatment with many antibiotics and antifungals had failed in our patient, the examination still was concerning for a possible granulomatous infection vs malignancy. With the history of colon cancer, radiation treatment, and chemotherapy, the possible malignancy diagnoses included primary skin cancers, viral tumors, and cutaneous metastasis. The initial evaluations had focused on infectious causes and resulted in 6 weeks of misdiagnosis and inappropriate therapy. Despite cutaneous metastases being uncommon, there should be a high index of suspicion for lesions in patients who have a history of cancer, especially if the lesion does not respond to treatment.2,6,7
Physical examination in our patient showed a high tumor burden as well as evidence of carcinoma erysipeloides on the lower abdomen and thighs, in addition to carcinoma en cuirasse throughout the pubic region. Carcinoma erysipeloides was first described in 1893 in a patient with breast cancer: "The erythematous infiltration of the skin was very superficial, and was attended simply by redness with a slight degree of induration. Until touched by the finger the condition might easily have been taken for a slightly-marked form of erysipelas."10 The clinical findings are a result of lymphatic and vascular obstruction.3,9 The breast is the most common location to find carcinoma erysipeloides.3 It is an unusual occurrence to find it on the abdomen from colonic adenocarcinoma. The term cancer en cuirasse was coined in 1838 to describe the cutaneous manifestation of breast cancer that caused the skin to resemble the metal breastplate of a cuirasser.4 Similar to carcinoma erysipeloides, carcinoma en cuirasse most commonly is found as cutaneous metastasis from breast cancer, not from colonic adenocarcinoma.3
The histologic characteristics of cutaneous metastases in general are similar to the primary malignancy but can be more poorly differentiated.7 Generally, neoplastic cells are seen in the lymphatic and blood vessels, and a large portion of the tumor is confined to the deep dermis and in the subcutaneous fat.3,6 Histologic features of colonic adenocarcinoma metastases can demonstrate a well-differentiated, glandular architecture with mucin-secreting cells.3,8,9 There also is a histologic pattern of neoplastic cells arranging themselves between collagen bundles in linear strands; this finding more commonly is seen in adenocarcinoma of the breast but also was seen in our patient.3,9 With immunohistochemical staining, a truncated panel of cytokeratin 7, cytokeratin 20, and S-100 had a diagnostic accuracy of 100% for cutaneous metastases from colonic adenocarcinoma in one study. The pattern of all colonic adenocarcinomas was cytokeratin 20 positive and cytokeratin 7 and S-100 negative.6
Cutaneous metastases typically demonstrate widespread and rapidly progressive disease.3,9 Survival studies of cutaneous metastases showed that 48% to 66% of patients died within the first 6 months.3,6 Specifically, cutaneous metastases from colorectal cancers showed a median survival of 3 to 5 months.6,7 Currently there are no treatment guidelines for cutaneous metastases.
- Lookingbill DP, Spangler N, Helm K. Cutaneous metastases in patients with metastatic carcinoma: a retrospective study of 4020 patients. J Am Acad Dermatol. 1993;29(2 pt 1):228-236.
- Gul U, Kilic A, Gonul M, et al. Spectrum of cutaneous metastases in 1287 cases of internal malignancies: a study from Turkey. Acta Derm Venereol. 2007;87:160-162.
- Hussein MR. Skin metastasis: a pathologist's perspective. J Cutan Pathol. 2010;37:E1-E20.
- Schwartz RA. Cutaneous metastatic disease. J Am Acad Dermatol. 1995;33(2 pt 1):161-182; quiz 183-186.
- Hu S, Chen G, Wu C, et al. Rates of cutaneous metastases from different internal malignancies: experience from a Taiwanese medical center. J Am Acad Dermatol. 2009;60:379-387.
- Saeed S, Keehn C, Morgan M. Cutaneous metastasis: a clinical, pathological, and immunohistochemical appraisal. J Cutan Pathol. 2004;31:419-430.
- Sariya D, Ruth K, Adams-McDonnell R. Clinicopathologic correlation of cutaneous metastases: experience of a cancer center. Arch Dermatol. 2007;143:613-620.
- Brownstein M, Helwig E. Metastatic tumors of the skin. Cancer. 1972;29:1298-1307.
- McKee PH. Cutaneous metastases. J Cutan Pathol. 1985;12:239-250.
- Hutchinson J. Notes from congresses and continental hospitals: erythema-scirrhus of the skin in association with cancer of the breast. Arch Surg (London). 1893;4:220-222


A 67-year-old man presented with a chronic lesion on the groin of 6 weeks' duration. The patient had a history of type 2 diabetes mellitus and colonic adenocarcinoma diagnosed 4 years prior that was treated with a colectomy, radiation therapy, and chemotherapy. Six weeks prior to the current presentation, the patient first sought treatment of swelling, redness, pain, and a bumpy texture on the groin. He was unsuccessfully managed by several physicians including at a long-term care facility where he was admitted and treated for presumed cellulitis. Attempted treatments included a topical antifungal, fluconazole, ciprofloxacin, metronidazole, cefepime, clindamycin, daptomycin, and vancomycin. The affected area continued to worsen along with the patient's overall health. He was transferred to the hospital for more advanced care and was evaluated by inpatient dermatology. Physical examination revealed firm, pink to red-brown, ulcerating papulonodules that coalesced into a large indurated plaque over the pubis, scrotum, penis, and inguinal folds (top). There also were red-violet, indurated plaques on the lower abdomen and bilateral proximal thighs (bottom). Punch biopsies were taken from the indurated area on the left side of the pubis--one for histopathologic evaluation and the other for bacterial, fungal, atypical mycobacterial, and Nocardia tissue cultures.

Implementation of a Patient Blood Management Program in a Large, Diverse Multi-Hospital System
From BJC HealthCare, St. Louis, MO.
Abstract
Background: There is limited literature relating to patient blood management (PBM) programs in large multi-hospital systems or addressing challenges of implementation across diverse systems comprised of community and academic hospitals.
Objective: To establish a PBM program to improve utilization of blood transfusion units at a multi-hospital system in the Midwest (BJC HealthCare).
Methods: High-impact strategies in establishing the PBM program included formation of Clinical Expert Councils (CECs) of providers, establishment of consensus utilization guidelines, and development of a robust reporting tool. CECs enabled collaboration and facilitated standardization across a complex system of academic, private practice, and tertiary facilities with a diverse community of medical providers. Consensus guidelines and the PBM reporting tool were key to creating meaningful reports to drive provider practice change.
Results: Over the 5 years following implementation of the PBM program, there has been a steady decrease in red blood cell (RBC) utilization. Noticeable changes have taken place at individual hospitals in the system, including reductions in transfusions falling outside guideline parameters from 300 per quarter to less than 8 per quarter at 1 of our community hospitals. No negative impact on patient care has been identified.
Conclusion: In response to current transfusion guidelines and the need for optimizing stewardship of blood product resources, this hospital system successfully implemented a robust PBM program that engaged academic and non-academic community providers and decreased utilization of blood transfusion resources in line with consensus guidelines.
Keywords: quality improvement; RBC transfusion; transfusion practices; provider practice change; utilization trends.
Evidence from clinical trials and published clinical guidelines support the adoption of a restrictive blood transfusion approach in hospitalized, stable patients as best practice.1-5 As such, the development and implementation of patient blood management (PBM) programs has become an increasingly important process improvement for reducing variability in transfusion practices and clinical outcomes.
As recently as 2013, BJC HealthCare, a multi-hospital system in the Midwest, had no standardized, system-wide blood management program, and transfusion practices varied widely across providers and between individual hospitals based on size, patient population, and resources. The system consisted of 13 hospitals, ranging from large tertiary to smaller community and academic hospitals. Although adults constituted the vast majority of the patient population, the hospital system also included a pediatric specialty hospital, St. Louis Children’s Hospital. In addition, some sites were staffed by private practice providers and others by university-based providers, including blood bank medical directors. Due to the diversity of settings and populations, efforts to align transfusion and other practices often faced multiple challenges. However, improving the management of blood transfusions was identified as a key resource stewardship priority in 2013, and implementation of a system-wide program began after extensive discussions and consensus approval by senior hospital system and medical leadership. The primary aim of the program was to optimize overall blood product resource stewardship. Specifically, we sought to control or reduce costs per patient-care episode using strategies that would not negatively impact patient care and could potentially even improve patient outcomes (eg, by avoiding unnecessary transfusions and their attendant risks).
There is a plethora of literature related to the implemention of PBM programs in individual hospitals,6-18 but few reports specifically relate to large multi-hospital health systems,19-21 or directly address the unique challenges of implementation across a diverse system of community and academic hospitals and providers.19 Here, we discuss our experience with establishing a PBM program in a large, diverse, multi-hospital health system, provide examples of innovative strategies, and address challenges faced and lessons learned. Future endeavors of the PBM program at BJC HealthCare are also described.
Setting
BJC HealthCare is one of the largest nonprofit health care organizations in the United States, delivering services to the greater St. Louis, southern Illinois, and mid-Missouri regions, and addressing the health care needs of urban, suburban, and rural communities. As of 2018, the system included 15 hospitals and multiple community health locations comprising more than 3400 staffed beds, 31,500 employees, and 4300 physicians with privileges. The system annually has more than 151,000 hospital admissions, 81,000 outpatient surgery visits, and 537,000 emergency department visits. In addition to inpatient and outpatient care, services include primary care, community health and wellness, workplace health, home health, community mental health, rehabilitation, long-term care, and hospice. As a nonprofit system, BJC is the largest provider of charity care, unreimbursed care, and community benefit in Missouri, highlighting the fact that resource stewardship is a critical issue across the entire system and the communities served.22
PBM Project
Preparation for large-scale change across several hospitals began with creating a framework for the initiative, which consisted of a “burning platform,” a guiding vision, and a coalition. The burning platform identifies the importance and urgency of a change and helps to establish commitment. Between 2012 and 2014, the American Association of Blood Banks (AABB) released new evidence-based guidelines and recommendations calling for more restrictive transfusion practices pertaining to red blood cells (RBCs; ie, a hemoglobin threshold of 7 to 8 g/dL) in both inpatient and outpatient care.2 In addition, use of single-unit transfusions was recognized as best practice by the AABB in the Choosing Wisely campaign.23 Historically, adult patients requiring transfusions were given 2 units in succession. The new recommendations provided a strong basis for changing transfusion practices at BJC. It was believed that aligning transfusion practices with the new guidelines was consistent with the mission and vision of the work: that these changes could lead to optimization of resources, cost control, reductions in unnecessary blood transfusions, and potentially improved care (eg, fewer transfusion-related complications). We used the national guidelines to initiate discussions and to identify clinical conditions and associated laboratory parameters for transfusion therapy.
Once this burning platform was established, a team comprised of physicians, blood bank experts, quality consultants, data analysts, and supply managers, referred to as the Outcomes Team, was formed to lead the change efforts across the system. Initial projects for the team included developing system-wide consensus-based transfusion guidelines, providing education to providers on the new evidence in transfusion practice, and sharing BJC-specific historical utilization data. The guiding principle for the group was that “blood is a valuable resource, but not without risk, and less is more.” In order to disseminate the vision of the initiative across the system, campaign signs with the slogans “7 is the new 10” (referring to the g/dL transfusion threshold) and “1 is the new 2” (referring to the new practice of the preferential transfusion of single units rather than 2 at a time) were displayed in system hospitals.
Last, a guiding coalition of system leaders was needed to help push the initiative forward and sustain the program once fully implemented. Thus, a multidisciplinary PBM Clinical Expert Counciel (CEC) was formed to assist with implementation and maintenance of the program.
Role of PBM Clinical Expert Council
The PBM CEC was designed to improve overall physician and expert engagement and provide a forum where stakeholders from across the system could participate to voice their expert opinion. CECs (which BJC formed in other clinical areas as well) are multidisciplinary teams consisting of clinical, administrative, and technical staff. The open, multidisciplinary structure of the councils allows for collaboration that promotes change across a complex multi-hospital system. Each hospital is represented by key physicians and technical leaders, opening opportunity for both horizontal and vertical partnership.
As part of the overall physician engagement strategy, the PBM CEC was launched across BJC in November 2013 as a decision-making body for gaining system consensus on matters relating to blood management. The initial goals for the PBM CEC were to share information and educate providers and others on the latest evidence, to subsequently debate and develop consensus for guidelines to be applied across BJC, and to identify and adopt gold standard practices to drive and sustain compliance across the system. More specifically, we wanted to focus on how to avoid unnecessary blood transfusions known to be associated with increased risk for adverse reactions, other morbidity, mortality, and longer length of stay. Council members met quarterly to address 6 key drivers: patient safety, informatics and data, quality improvement, efficiencies and workflows, education and competency, and communication and engagement. Members then voted to approve guidelines, policies, and procedures. The group continues to assist in updating and standardizing guidelines and providing input on improving the functionality of the PBM reporting tool.
Development of the PBM Reporting Tool
Providing and sharing data on blood utilization and practices with the CEC and hospital leaders was imperative to driving change. The Outcomes Team deliberated on how best to generate and provide such information, conducting comparisons between selected vendor-based tools and potential internal BJC solutions. After investigation, BJC leadership approved the development of an in-house PBM dashboard tool using Tableau Desktop (Tableau Software, Inc.). The tool consists of an executive page with 5 additional tabs for navigating to the appropriate information (Figure 1 and Figure 2); data within the tool are organized by facility, service, provider, ICD diagnosis, transfusion indication, and the Clinical Classifications Software category, as defined by the Agency for Healthcare Research and Quality.
")
The PBM reporting tool was launched on December 31, 2014. The next priority after the launch was to validate the tool’s blood utilization data and implement enhancements to make the tool more effective for users. A super-user group consisting of blood bank supervisors and managers was established. The goals of the user group were to preview any enhancements before presenting the tool to the larger CEC, test and validate data once new information was added, and share and prioritize future enhancements. User group meetings were held monthly to share best practices and discuss individual facilities’ blood utilization data. In addition, each facility’s representative(s) shared how they were driving changes in provider practice and discussed challenges specific to their facility. Enhancements suggested through the user group included: incorporation of additional lab values into the tool to correspond with other blood products (eg, fibrinogen, hematocrit, international normalized ratio, and platelet count), addition of the specific location where the blood product was administered, and standard naming conventions of locations to allow comparisons across facilities (eg, Emergency Department instead of ED, ER, or EU).

All hospital users were given access to a test version of the reporting tool where they could review enhancements, identify what worked well and what could be done better, and suggest corrections. As changes were made to the hospital lab systems, a sample of data was reviewed and validated with affected facilities to confirm the continued accuracy of the data. To ensure its practicality to users, the tool continues to be improved upon with input from council stakeholders and subject-matter experts.
Measurements
To monitor blood utilization across the health system, we tracked the total RBC units administered by hospital, service, and provider and also tracked pre- and post-transfusion hemoglobin values.
Results
Overall, the system has seen a steady decrease in RBC utilization over the 5 years since the PBM program was implemented (Table

In addition to system-wide improvement, noticeable changes have taken place at individual hospitals in the BJC system. For example, Boone Hospital Center in Columbia, Missouri, began critically reviewing all RBC transfusions starting in 2015 and, to raise awareness, communicating with any provider who transfused a patient outside of transfusion guidelines. Since then, Boone Hospital has seen a dramatic reduction in transfusions considered noncompliant (ie, falling outside guideline parameters), from 300 transfusions per quarter, down to less than 8 per quarter. St. Louis Children’s Hospital also began reviewing blood products utilized by providers that fell outside of the standardized guidelines. At this hospital, physician champions discuss any outliers with the providers involved and use multiple methods for disseminating information to providers, including grand rounds, faculty meetings, and new resident orientations.
Another success has been the partnership between Barnes Jewish St. Peters and Progress West Hospitals in providing PBM education. Their joint effort resulted in implementation of education modules in BJC’s internal learning system, and has provided PBM-related education to more than 367 nurses, blood bank staff, and physicians.
Challenges and Lessons Learned
Implementation of the PBM program was generally successful, but it was not without challenges. One of the biggest challenges was addressing the variation in care and practices across the hospital enterprise. Due to the varying sizes and service goals of individual hospitals, lack of standardization was a significant barrier to change. Gaining trust and buy-in was imperative to increasing compliance with new transfusion policies. The primary concern was finding a balance between respecting physician autonomy and emphasizing and aligning practices with new evidence in the literature. Thus, understanding and applying principles of thoughtful change management was imperative to advancing the framework of the PBM program. The CEC venue enabled collaboration among hospitals and staff and was ultimately used to facilitate the necessary standardization process. To gain the trust of hospital and medical staff, the Outcomes Team conducted several site visits, enabling face-to-face interaction with frontline staff and operational leaders. Moreover, the team’s emphasis on the use of the latest evidence-based guidelines in discussions with hospital and medical staff underscored the need for change.
Frank et al19 describes using an approach similar to our Outcomes Team at the Johns Hopkins Health System. A designated multidisciplinary quality improvement team, referred to as the “clinical community,” worked on implementing best practices for blood management across a system of 5 hospitals. The authors reported similar results, with an overall decrease in number of units transfused, as well as substantial cost savings.19 Our project, along with the project implemented by Frank et al, shows how a “consensus-community” approach, involving stakeholders and various experts across the system, can be be used to align practices among multiple hospitals.
Development of a robust PBM reporting tool was key to creating meaningful monthly reports and driving provider practice change. However, this did require several training sessions, site visits, and computer-based training. Members of the Outcomes Team engaged in one-on-one sessions with tool users as a way of addressing specific areas of concern raised by staff at individual blood banks, and also took part in system-wide initiatives. The team also attended blood bank staff meetings and hospital transfusion committee meetings to educate staff on the evidence and initiative, provide demos of the reporting tool, and allow for a more robust discussion of how the data could be used and shared with other departments. These sessions provided opportunities to identify and prioritize future enhancements, as well as opportunities for continued education and discussion at hospitals, which were critical to ongoing improvement of the reporting tool.
Conclusion and Future Directions
Blood products remain extremely valuable and scarce resources, and all health care professionals must work to prevent unnecessary transfusions and improve clinical outcomes by adhering to the latest evidence-based guidelines. In response to current transfusion guidelines and the need to optimize blood product resources, our system successfully implemented a robust PBM program that engaged both academic and non-academic providers and communities. Several elements of the program helped us overcome the challenges relating to standardization of transfusion practices: consensus-based development of guidelines using the latest scientific evidence; formation and utilization of the CEC venue to gain system-wide consensus around both guidelines and approaches to change; development of a trustworthy and accessible PBM reporting tool (as well as continuing education sessions to improve adoption and utilization of the tool); and ongoing multidisciplinary discussions and support of thoughtful change and sustaining activities. We have seen a system-wide decrease in the number of RBC units transfused (absolute and per case mix-adjusted patient day) since implementing the PBM program, and in the following years have noted a trending decrease in transfusion-related safety events. Although there was a slight increase in reported safety events from 2018 to 2019, this was likely due to the systematic implementation of a new electronic medical record system and improved reporting infrastructure.
Upcoming phases of our system-wide PBM program will include looking at opportunities to improve blood utilization in other specific clinical areas. For example, we have begun discussions with hematology and oncology experts across the system to expand their patient population data within the PBM reporting tool, and to identify areas of opportunity for provider practice change within their specialty. We are also reviewing cardiothoracic surgery transfusion data to identify opportunities for reducing blood utilization in specific clinical scenarios. In addition, we are working to incorporate our 2 newest hospital system members (Memorial Hospital East and Memorial Hospital Belleville) into the PBM program. In collaboration with perioperative leaders across the system, the surgical blood ordering process is being reviewed. The goal of this effort is to reduce blood products ordered in preparation for surgical procedures. We are also currently investigating whether an impact on safety events (ie, reduction in transfusion reactions) can yet be detected. Last, our health care system recently launched a system-wide electronic medical record, and we are eager to see how this will provide us with new methods to monitor and analyze blood administration and utilization data. We look forward to reporting on the expansion of our program and on any clinical outcome improvements gained through avoidance of unnecessary transfusions.
Acknowledgment: The authors thank the leadership within the Center for Clinical Excellence and Supply Chain at BJC HealthCare for their support of this manuscript, as well as all system participants who have contributed to these efforts, especially Mohammad Agha, MD, MHA, current physician leader of the PBM CEC, for his thoughtful edits of this manuscript.
Corresponding author: Audrey A. Gronemeyer, MPH, Center for Clinical Excellence, BJC HealthCare, 8300 Eager Road, Suite 400A, St. Louis, MO 63144; audrey.gronemeyer@bjc.org.
Financial disclosures: None.
1. Carson JL, Grossman BJ, Kleinman S, et al. Red blood cell transfusion: A clinical practice guideline from the AABB*. Ann Intern Med. 2012;157:49-58.
2. Goodnough LT, Levy JH, Murphy MF. Concepts of blood transfusion in adults. Lancet. 2013;381:1845-1854.
3. Hébert PC, Carson JL. Transfusion threshold of 7 g per deciliter—The new normal. N Engl J Med. 2014;371:1459-1461.
4. Gani F, Cerullo M, Ejaz A, et al. Implementation of a blood management program at a tertiary care hospital: Effect on transfusion practices and clinical outcomes among patients undergoing surgery. Ann Surg. 2019;269:1073-1079.
5. Podlasek SJ, Thakkar RN, Rotello LC, et al. Implementing a “why give 2 when 1 will do?” Choosing Wisely campaign. Transfusion. 2016;56:2164.
6. Boral LI, Bernard A, Hjorth T, et al. How do I implement a more restrictive transfusion trigger of hemoglobin level of 7 g/dL at my hospital? Transfusion. 2015;55:937-945.
7. Geissler RG, Kosters C, Franz D, et al. Utilization of blood components in trauma surgery: A single-center, retrospective analysis before and after the implementation of an educative PBM initiative. Transfuse Med Hemother. 2015;42:83-89.
8. Goel R, Cushing MM, Tobian AA. Pediatric patient blood management programs: Not just transfusing little adults. Transfus Med Rev. 2016;30:235-241.
9. Gupta PB, DeMario VM, Amin RM, et al. Patient blood management program improves blood use and clinical outcomes in orthopedic surgery. Anesthesiology. 2018;129;1082-1091.
10. Leahy MF, Roberts H, Mukhtar SA, et al. A pragmatic approach to embedding patient blood management in a tertiary hospital. Transfusion. 2014;54:1133-1145.
11. Leahy MF, Hofmann A, Towler S, et al. Improved outcomes and reduced costs associated with a health-system-wide patient blood management program: A retrospective observational study in four major adult tertiary-care hospitals. Transfusion. 2017;57:1347-1358.
12. Meybohm P, Herrmann E, Steinbicker AU, et al. Patient blood management is associated with a substantial reduction of red blood cell utilization and safe for patient’s outcome: A prospective, multicenter cohort study with a noninferiority design. Ann Surg. 2016;264:203-211.
13. Morgan PN, Coleman PL, Martinez-Garduno CM, et al. Implementation of a patient blood management program in an Australian private hospital orthopedic unit. J Blood Med. 2018;9;83-90.
14. Norgaard A, Stensballe J, de Lichtenberg TH, et al. Three-year follow-up of implementation of evidence-based transfusion practice in a tertiary hospital. Vox Sang. 2017;112:229-239.
15. Meuller MM, Van Remoortel H, Meybohm P, et al. Patient blood management: Recommendations from the 2018 Frankfurt Consensus Conference. JAMA. 2019;321:983-997.
16. Oliver JC, Griffin RL, Hannon T, Marques MB. The success of our patient blood management program depended on an institution-wide change in transfusion practices. Transfusion. 2014;54:2617-2624.
17. Thakkar RN, Lee KH, Ness PM, et al. Relative impact of a patient blood management program on utilization of all three major blood components. Transfusion. 2016;56:2212-2220.
18. Yang WW, Thakkar RN, Gehrie EA, et al. Single-unit transfusions and hemoglobin trigger: relative impact on red cell utilization. Transfusion. 2017;57:1163-1170.
19. Frank SM, Thakkar RN, Podlasek SJ, et al. Implementing a health system-wide patient blood management program with a clinical community approach. Anesthesiology. 2017;127;754-764.
20. Verdecchia NM, Wisniewski MK, Waters JH, et al. Changes in blood product utilization in a seven-hospital system after the implementation of a patient blood management program: A 9-year follow-up. Hematology. 2016;21:490-499.
21. Yazer MH, Waters JH. How do I implement a hospital-based blood management program? Transfusion. 2012;52:1640-1645.
22. BJC HealthCare. Facts and Figures.. BJC HealthCare website. www.bjc.org/About-Us/Facts-Figures. Accessed November 18, 2019.
23. Callum JL, Waters JH, Shaz BH, et al. The AABB recommendations for the Choosing Wisely campaign of the American Board of Internal Medicine. Transfusion. 2014;54:2344-2352.
From BJC HealthCare, St. Louis, MO.
Abstract
Background: There is limited literature relating to patient blood management (PBM) programs in large multi-hospital systems or addressing challenges of implementation across diverse systems comprised of community and academic hospitals.
Objective: To establish a PBM program to improve utilization of blood transfusion units at a multi-hospital system in the Midwest (BJC HealthCare).
Methods: High-impact strategies in establishing the PBM program included formation of Clinical Expert Councils (CECs) of providers, establishment of consensus utilization guidelines, and development of a robust reporting tool. CECs enabled collaboration and facilitated standardization across a complex system of academic, private practice, and tertiary facilities with a diverse community of medical providers. Consensus guidelines and the PBM reporting tool were key to creating meaningful reports to drive provider practice change.
Results: Over the 5 years following implementation of the PBM program, there has been a steady decrease in red blood cell (RBC) utilization. Noticeable changes have taken place at individual hospitals in the system, including reductions in transfusions falling outside guideline parameters from 300 per quarter to less than 8 per quarter at 1 of our community hospitals. No negative impact on patient care has been identified.
Conclusion: In response to current transfusion guidelines and the need for optimizing stewardship of blood product resources, this hospital system successfully implemented a robust PBM program that engaged academic and non-academic community providers and decreased utilization of blood transfusion resources in line with consensus guidelines.
Keywords: quality improvement; RBC transfusion; transfusion practices; provider practice change; utilization trends.
Evidence from clinical trials and published clinical guidelines support the adoption of a restrictive blood transfusion approach in hospitalized, stable patients as best practice.1-5 As such, the development and implementation of patient blood management (PBM) programs has become an increasingly important process improvement for reducing variability in transfusion practices and clinical outcomes.
As recently as 2013, BJC HealthCare, a multi-hospital system in the Midwest, had no standardized, system-wide blood management program, and transfusion practices varied widely across providers and between individual hospitals based on size, patient population, and resources. The system consisted of 13 hospitals, ranging from large tertiary to smaller community and academic hospitals. Although adults constituted the vast majority of the patient population, the hospital system also included a pediatric specialty hospital, St. Louis Children’s Hospital. In addition, some sites were staffed by private practice providers and others by university-based providers, including blood bank medical directors. Due to the diversity of settings and populations, efforts to align transfusion and other practices often faced multiple challenges. However, improving the management of blood transfusions was identified as a key resource stewardship priority in 2013, and implementation of a system-wide program began after extensive discussions and consensus approval by senior hospital system and medical leadership. The primary aim of the program was to optimize overall blood product resource stewardship. Specifically, we sought to control or reduce costs per patient-care episode using strategies that would not negatively impact patient care and could potentially even improve patient outcomes (eg, by avoiding unnecessary transfusions and their attendant risks).
There is a plethora of literature related to the implemention of PBM programs in individual hospitals,6-18 but few reports specifically relate to large multi-hospital health systems,19-21 or directly address the unique challenges of implementation across a diverse system of community and academic hospitals and providers.19 Here, we discuss our experience with establishing a PBM program in a large, diverse, multi-hospital health system, provide examples of innovative strategies, and address challenges faced and lessons learned. Future endeavors of the PBM program at BJC HealthCare are also described.
Setting
BJC HealthCare is one of the largest nonprofit health care organizations in the United States, delivering services to the greater St. Louis, southern Illinois, and mid-Missouri regions, and addressing the health care needs of urban, suburban, and rural communities. As of 2018, the system included 15 hospitals and multiple community health locations comprising more than 3400 staffed beds, 31,500 employees, and 4300 physicians with privileges. The system annually has more than 151,000 hospital admissions, 81,000 outpatient surgery visits, and 537,000 emergency department visits. In addition to inpatient and outpatient care, services include primary care, community health and wellness, workplace health, home health, community mental health, rehabilitation, long-term care, and hospice. As a nonprofit system, BJC is the largest provider of charity care, unreimbursed care, and community benefit in Missouri, highlighting the fact that resource stewardship is a critical issue across the entire system and the communities served.22
PBM Project
Preparation for large-scale change across several hospitals began with creating a framework for the initiative, which consisted of a “burning platform,” a guiding vision, and a coalition. The burning platform identifies the importance and urgency of a change and helps to establish commitment. Between 2012 and 2014, the American Association of Blood Banks (AABB) released new evidence-based guidelines and recommendations calling for more restrictive transfusion practices pertaining to red blood cells (RBCs; ie, a hemoglobin threshold of 7 to 8 g/dL) in both inpatient and outpatient care.2 In addition, use of single-unit transfusions was recognized as best practice by the AABB in the Choosing Wisely campaign.23 Historically, adult patients requiring transfusions were given 2 units in succession. The new recommendations provided a strong basis for changing transfusion practices at BJC. It was believed that aligning transfusion practices with the new guidelines was consistent with the mission and vision of the work: that these changes could lead to optimization of resources, cost control, reductions in unnecessary blood transfusions, and potentially improved care (eg, fewer transfusion-related complications). We used the national guidelines to initiate discussions and to identify clinical conditions and associated laboratory parameters for transfusion therapy.
Once this burning platform was established, a team comprised of physicians, blood bank experts, quality consultants, data analysts, and supply managers, referred to as the Outcomes Team, was formed to lead the change efforts across the system. Initial projects for the team included developing system-wide consensus-based transfusion guidelines, providing education to providers on the new evidence in transfusion practice, and sharing BJC-specific historical utilization data. The guiding principle for the group was that “blood is a valuable resource, but not without risk, and less is more.” In order to disseminate the vision of the initiative across the system, campaign signs with the slogans “7 is the new 10” (referring to the g/dL transfusion threshold) and “1 is the new 2” (referring to the new practice of the preferential transfusion of single units rather than 2 at a time) were displayed in system hospitals.
Last, a guiding coalition of system leaders was needed to help push the initiative forward and sustain the program once fully implemented. Thus, a multidisciplinary PBM Clinical Expert Counciel (CEC) was formed to assist with implementation and maintenance of the program.
Role of PBM Clinical Expert Council
The PBM CEC was designed to improve overall physician and expert engagement and provide a forum where stakeholders from across the system could participate to voice their expert opinion. CECs (which BJC formed in other clinical areas as well) are multidisciplinary teams consisting of clinical, administrative, and technical staff. The open, multidisciplinary structure of the councils allows for collaboration that promotes change across a complex multi-hospital system. Each hospital is represented by key physicians and technical leaders, opening opportunity for both horizontal and vertical partnership.
As part of the overall physician engagement strategy, the PBM CEC was launched across BJC in November 2013 as a decision-making body for gaining system consensus on matters relating to blood management. The initial goals for the PBM CEC were to share information and educate providers and others on the latest evidence, to subsequently debate and develop consensus for guidelines to be applied across BJC, and to identify and adopt gold standard practices to drive and sustain compliance across the system. More specifically, we wanted to focus on how to avoid unnecessary blood transfusions known to be associated with increased risk for adverse reactions, other morbidity, mortality, and longer length of stay. Council members met quarterly to address 6 key drivers: patient safety, informatics and data, quality improvement, efficiencies and workflows, education and competency, and communication and engagement. Members then voted to approve guidelines, policies, and procedures. The group continues to assist in updating and standardizing guidelines and providing input on improving the functionality of the PBM reporting tool.
Development of the PBM Reporting Tool
Providing and sharing data on blood utilization and practices with the CEC and hospital leaders was imperative to driving change. The Outcomes Team deliberated on how best to generate and provide such information, conducting comparisons between selected vendor-based tools and potential internal BJC solutions. After investigation, BJC leadership approved the development of an in-house PBM dashboard tool using Tableau Desktop (Tableau Software, Inc.). The tool consists of an executive page with 5 additional tabs for navigating to the appropriate information (Figure 1 and Figure 2); data within the tool are organized by facility, service, provider, ICD diagnosis, transfusion indication, and the Clinical Classifications Software category, as defined by the Agency for Healthcare Research and Quality.
The PBM reporting tool was launched on December 31, 2014. The next priority after the launch was to validate the tool’s blood utilization data and implement enhancements to make the tool more effective for users. A super-user group consisting of blood bank supervisors and managers was established. The goals of the user group were to preview any enhancements before presenting the tool to the larger CEC, test and validate data once new information was added, and share and prioritize future enhancements. User group meetings were held monthly to share best practices and discuss individual facilities’ blood utilization data. In addition, each facility’s representative(s) shared how they were driving changes in provider practice and discussed challenges specific to their facility. Enhancements suggested through the user group included: incorporation of additional lab values into the tool to correspond with other blood products (eg, fibrinogen, hematocrit, international normalized ratio, and platelet count), addition of the specific location where the blood product was administered, and standard naming conventions of locations to allow comparisons across facilities (eg, Emergency Department instead of ED, ER, or EU).
All hospital users were given access to a test version of the reporting tool where they could review enhancements, identify what worked well and what could be done better, and suggest corrections. As changes were made to the hospital lab systems, a sample of data was reviewed and validated with affected facilities to confirm the continued accuracy of the data. To ensure its practicality to users, the tool continues to be improved upon with input from council stakeholders and subject-matter experts.
Measurements
To monitor blood utilization across the health system, we tracked the total RBC units administered by hospital, service, and provider and also tracked pre- and post-transfusion hemoglobin values.
Results
Overall, the system has seen a steady decrease in RBC utilization over the 5 years since the PBM program was implemented (Table
In addition to system-wide improvement, noticeable changes have taken place at individual hospitals in the BJC system. For example, Boone Hospital Center in Columbia, Missouri, began critically reviewing all RBC transfusions starting in 2015 and, to raise awareness, communicating with any provider who transfused a patient outside of transfusion guidelines. Since then, Boone Hospital has seen a dramatic reduction in transfusions considered noncompliant (ie, falling outside guideline parameters), from 300 transfusions per quarter, down to less than 8 per quarter. St. Louis Children’s Hospital also began reviewing blood products utilized by providers that fell outside of the standardized guidelines. At this hospital, physician champions discuss any outliers with the providers involved and use multiple methods for disseminating information to providers, including grand rounds, faculty meetings, and new resident orientations.
Another success has been the partnership between Barnes Jewish St. Peters and Progress West Hospitals in providing PBM education. Their joint effort resulted in implementation of education modules in BJC’s internal learning system, and has provided PBM-related education to more than 367 nurses, blood bank staff, and physicians.
Challenges and Lessons Learned
Implementation of the PBM program was generally successful, but it was not without challenges. One of the biggest challenges was addressing the variation in care and practices across the hospital enterprise. Due to the varying sizes and service goals of individual hospitals, lack of standardization was a significant barrier to change. Gaining trust and buy-in was imperative to increasing compliance with new transfusion policies. The primary concern was finding a balance between respecting physician autonomy and emphasizing and aligning practices with new evidence in the literature. Thus, understanding and applying principles of thoughtful change management was imperative to advancing the framework of the PBM program. The CEC venue enabled collaboration among hospitals and staff and was ultimately used to facilitate the necessary standardization process. To gain the trust of hospital and medical staff, the Outcomes Team conducted several site visits, enabling face-to-face interaction with frontline staff and operational leaders. Moreover, the team’s emphasis on the use of the latest evidence-based guidelines in discussions with hospital and medical staff underscored the need for change.
Frank et al19 describes using an approach similar to our Outcomes Team at the Johns Hopkins Health System. A designated multidisciplinary quality improvement team, referred to as the “clinical community,” worked on implementing best practices for blood management across a system of 5 hospitals. The authors reported similar results, with an overall decrease in number of units transfused, as well as substantial cost savings.19 Our project, along with the project implemented by Frank et al, shows how a “consensus-community” approach, involving stakeholders and various experts across the system, can be be used to align practices among multiple hospitals.
Development of a robust PBM reporting tool was key to creating meaningful monthly reports and driving provider practice change. However, this did require several training sessions, site visits, and computer-based training. Members of the Outcomes Team engaged in one-on-one sessions with tool users as a way of addressing specific areas of concern raised by staff at individual blood banks, and also took part in system-wide initiatives. The team also attended blood bank staff meetings and hospital transfusion committee meetings to educate staff on the evidence and initiative, provide demos of the reporting tool, and allow for a more robust discussion of how the data could be used and shared with other departments. These sessions provided opportunities to identify and prioritize future enhancements, as well as opportunities for continued education and discussion at hospitals, which were critical to ongoing improvement of the reporting tool.
Conclusion and Future Directions
Blood products remain extremely valuable and scarce resources, and all health care professionals must work to prevent unnecessary transfusions and improve clinical outcomes by adhering to the latest evidence-based guidelines. In response to current transfusion guidelines and the need to optimize blood product resources, our system successfully implemented a robust PBM program that engaged both academic and non-academic providers and communities. Several elements of the program helped us overcome the challenges relating to standardization of transfusion practices: consensus-based development of guidelines using the latest scientific evidence; formation and utilization of the CEC venue to gain system-wide consensus around both guidelines and approaches to change; development of a trustworthy and accessible PBM reporting tool (as well as continuing education sessions to improve adoption and utilization of the tool); and ongoing multidisciplinary discussions and support of thoughtful change and sustaining activities. We have seen a system-wide decrease in the number of RBC units transfused (absolute and per case mix-adjusted patient day) since implementing the PBM program, and in the following years have noted a trending decrease in transfusion-related safety events. Although there was a slight increase in reported safety events from 2018 to 2019, this was likely due to the systematic implementation of a new electronic medical record system and improved reporting infrastructure.
Upcoming phases of our system-wide PBM program will include looking at opportunities to improve blood utilization in other specific clinical areas. For example, we have begun discussions with hematology and oncology experts across the system to expand their patient population data within the PBM reporting tool, and to identify areas of opportunity for provider practice change within their specialty. We are also reviewing cardiothoracic surgery transfusion data to identify opportunities for reducing blood utilization in specific clinical scenarios. In addition, we are working to incorporate our 2 newest hospital system members (Memorial Hospital East and Memorial Hospital Belleville) into the PBM program. In collaboration with perioperative leaders across the system, the surgical blood ordering process is being reviewed. The goal of this effort is to reduce blood products ordered in preparation for surgical procedures. We are also currently investigating whether an impact on safety events (ie, reduction in transfusion reactions) can yet be detected. Last, our health care system recently launched a system-wide electronic medical record, and we are eager to see how this will provide us with new methods to monitor and analyze blood administration and utilization data. We look forward to reporting on the expansion of our program and on any clinical outcome improvements gained through avoidance of unnecessary transfusions.
Acknowledgment: The authors thank the leadership within the Center for Clinical Excellence and Supply Chain at BJC HealthCare for their support of this manuscript, as well as all system participants who have contributed to these efforts, especially Mohammad Agha, MD, MHA, current physician leader of the PBM CEC, for his thoughtful edits of this manuscript.
Corresponding author: Audrey A. Gronemeyer, MPH, Center for Clinical Excellence, BJC HealthCare, 8300 Eager Road, Suite 400A, St. Louis, MO 63144; audrey.gronemeyer@bjc.org.
Financial disclosures: None.
1. Carson JL, Grossman BJ, Kleinman S, et al. Red blood cell transfusion: A clinical practice guideline from the AABB*. Ann Intern Med. 2012;157:49-58.
2. Goodnough LT, Levy JH, Murphy MF. Concepts of blood transfusion in adults. Lancet. 2013;381:1845-1854.
3. Hébert PC, Carson JL. Transfusion threshold of 7 g per deciliter—The new normal. N Engl J Med. 2014;371:1459-1461.
4. Gani F, Cerullo M, Ejaz A, et al. Implementation of a blood management program at a tertiary care hospital: Effect on transfusion practices and clinical outcomes among patients undergoing surgery. Ann Surg. 2019;269:1073-1079.
5. Podlasek SJ, Thakkar RN, Rotello LC, et al. Implementing a “why give 2 when 1 will do?” Choosing Wisely campaign. Transfusion. 2016;56:2164.
6. Boral LI, Bernard A, Hjorth T, et al. How do I implement a more restrictive transfusion trigger of hemoglobin level of 7 g/dL at my hospital? Transfusion. 2015;55:937-945.
7. Geissler RG, Kosters C, Franz D, et al. Utilization of blood components in trauma surgery: A single-center, retrospective analysis before and after the implementation of an educative PBM initiative. Transfuse Med Hemother. 2015;42:83-89.
8. Goel R, Cushing MM, Tobian AA. Pediatric patient blood management programs: Not just transfusing little adults. Transfus Med Rev. 2016;30:235-241.
9. Gupta PB, DeMario VM, Amin RM, et al. Patient blood management program improves blood use and clinical outcomes in orthopedic surgery. Anesthesiology. 2018;129;1082-1091.
10. Leahy MF, Roberts H, Mukhtar SA, et al. A pragmatic approach to embedding patient blood management in a tertiary hospital. Transfusion. 2014;54:1133-1145.
11. Leahy MF, Hofmann A, Towler S, et al. Improved outcomes and reduced costs associated with a health-system-wide patient blood management program: A retrospective observational study in four major adult tertiary-care hospitals. Transfusion. 2017;57:1347-1358.
12. Meybohm P, Herrmann E, Steinbicker AU, et al. Patient blood management is associated with a substantial reduction of red blood cell utilization and safe for patient’s outcome: A prospective, multicenter cohort study with a noninferiority design. Ann Surg. 2016;264:203-211.
13. Morgan PN, Coleman PL, Martinez-Garduno CM, et al. Implementation of a patient blood management program in an Australian private hospital orthopedic unit. J Blood Med. 2018;9;83-90.
14. Norgaard A, Stensballe J, de Lichtenberg TH, et al. Three-year follow-up of implementation of evidence-based transfusion practice in a tertiary hospital. Vox Sang. 2017;112:229-239.
15. Meuller MM, Van Remoortel H, Meybohm P, et al. Patient blood management: Recommendations from the 2018 Frankfurt Consensus Conference. JAMA. 2019;321:983-997.
16. Oliver JC, Griffin RL, Hannon T, Marques MB. The success of our patient blood management program depended on an institution-wide change in transfusion practices. Transfusion. 2014;54:2617-2624.
17. Thakkar RN, Lee KH, Ness PM, et al. Relative impact of a patient blood management program on utilization of all three major blood components. Transfusion. 2016;56:2212-2220.
18. Yang WW, Thakkar RN, Gehrie EA, et al. Single-unit transfusions and hemoglobin trigger: relative impact on red cell utilization. Transfusion. 2017;57:1163-1170.
19. Frank SM, Thakkar RN, Podlasek SJ, et al. Implementing a health system-wide patient blood management program with a clinical community approach. Anesthesiology. 2017;127;754-764.
20. Verdecchia NM, Wisniewski MK, Waters JH, et al. Changes in blood product utilization in a seven-hospital system after the implementation of a patient blood management program: A 9-year follow-up. Hematology. 2016;21:490-499.
21. Yazer MH, Waters JH. How do I implement a hospital-based blood management program? Transfusion. 2012;52:1640-1645.
22. BJC HealthCare. Facts and Figures.. BJC HealthCare website. www.bjc.org/About-Us/Facts-Figures. Accessed November 18, 2019.
23. Callum JL, Waters JH, Shaz BH, et al. The AABB recommendations for the Choosing Wisely campaign of the American Board of Internal Medicine. Transfusion. 2014;54:2344-2352.

Team-Based Hypertension Management in Outpatient Settings
From Western University of Health Sciences College of Pharmacy, Department of Pharmacy Practice and Administration, Pomona, CA.
Abstract
- Objective: To review the current literature regarding the clinical effectiveness and cost-effectiveness of implementing hypertension team-based care (TBC) interventions in the outpatient setting, and discuss challenges to implementation.
- Methods: A literature review was conducted of meta-analyses, systematic reviews, and randomized controlled trials comparing TBC models to usual care for hypertension management.
- Results: Compared to usual care, TBC models have demonstrated greater blood pressure reductions and improved blood pressure control rates. Evidence was strongest for models involving nurses and pharmacists whose roles included medication management, patient education and counseling, coordination of care and follow-up, population health management, and performance measurement with quality improvement. Although TBC results in an increase in health care costs, the overall long-term benefits support the cost-effectiveness of these models over usual care. The most common barriers to TBC implementation include underutilization of technology, stakeholder engagement, and reimbursement issues.
- Conclusion: Hypertension TBC models have been shown to be clinically effective and cost-effective, but continued research comparing different models is warranted to determine which combination of health professionals and interventions is most impactful and cost-effective in practice. An implementation science approach, in which TBC models unique to each organization’s situation are created, will be useful to identify and overcome challenges and provide a solid foundation for sustainment.
Keywords: blood pressure; pharmacist; nurse; nurse practitioner; cost-effectiveness; team-based care.
Approximately 1 in 3 US adults—or about 100 million people—have high blood pressure, and only about half (48%) have their blood pressure under control.1 Effective blood pressure management has been shown to decrease the incidence of stroke, heart attack, and heart failure.2-4 The American College of Cardiology/American Heart Association (ACC/AHA) 2017 blood pressure guidelines recommended lower thresholds for diagnosing hypertension and initiating antihypertensive medication, and intensified the blood pressure goal to less than 130/80 mm Hg.5 Changing practice standards to more intensive blood pressure goals requires significant adjustments by clinicians and health care systems. In fact, new guideline uptake is often delayed, ignored, or sparsely applied.6 Due to this dramatic change in hypertension practice standards, the ACC/AHA guidelines support interdisciplinary team-based care (TBC) for hypertension management.5,7 Additionally, the Centers for Disease Control and Prevention (CDC) and the Community Preventive Services Task Force (CPSTF) promote TBC to improve blood pressure control in their initiatives to prevent heart disease and stroke.8,9
The National Academy of Medicine defines TBC as “the provision of health services to individuals, families, and/or their communities by at least 2 healthcare providers who work collaboratively with patients and their caregivers—to the extent preferred by each patient—to accomplish shared goals within and across settings to achieve coordinated, high-quality care.”10 Specific goals for TBC in hypertension treatment are listed in Table 1, and a checklist of key elements of TBC to consider before implementation are presented in Table 2.

TBC has been shown to have many advantages, including increased access to care due to expanded hours of operation and shorter wait times.11 Team-based models also provide effective and efficient delivery of patient education, behavioral health care, and care coordination.12-14 Patients are more likely to receive high-quality care when multiple providers, each with varied expertise, are on the health care team.11,15 Furthermore, clinicians report improved professional job satisfaction related to their ability to practice in environments where they are encouraged to work at the top of their licenses.16 Consequently, TBC has been accepted as a vital part of the patient-centered medical home (PCMH) model.17-19 Standards set by the National Committee for Quality Assurance (NCQA) include TBC as a requirement health systems must meet in order to achieve the highest level of PCMH recognition. While a team-based approach offers substantial benefits and is recognized as a marker of quality, implementation has presented various challenges, and the sustainability of these models in care settings has been questioned.20

In this article, we review the current literature regarding the clinical effectiveness and cost-effectiveness of implementing hypertension TBC interventions in the outpatient setting. We also discuss the challenges and opportunities of implementing this strategy in health systems and community settings in the United States.
Evidence of Impact and Effectiveness
Various models of hypertension TBC have been shown to increase the proportion of individuals with controlled blood pressure and to lead to a reduction in both systolic (SBP) and diastolic blood pressure (DBP), resulting in a strong recommendation for TBC approaches by the 2017 ACC/AHA blood pressure guidelines.5,21-25 There is great diversity in the types of hypertension treatment models studied, with few utilizing physician specialists and most utilizing nonphysician providers, such as community health workers, physician assistants, nurses, nurse practitioners, dietitians, social workers, and pharmacists.22,26-29 These professionals share duties of hypertension management with primary care physicians to reduce the burden of responsibility for care on any single provider type. TBC is patient-centered, and typically includes interprofessional collaboration, treatment algorithms, adherence counseling, frequent follow-up, home blood pressure monitoring, and patient self-management education.
Numerous studies have supported implementation of TBC in recent years. A systematic review and meta-analysis of 100 trials of hypertension TBC involving 55,920 patients concluded that the most effective blood pressure–lowering strategies use multilevel, multicomponent approaches to address barriers to hypertension control. Nonphysician providers are often involved in measuring blood pressure, ordering and assessing laboratory tests, and titrating medications.30 Compared with usual care, TBC with physician medication titration resulted in reductions in mean SBP and DBP (6.2 mm Hg and 2.7 mm Hg, respectively), while TBC with nonphysician medication titration also resulted in reductions in mean SBP and DBP (7.1 mm Hg and 3.1 mm Hg, respectively). Nurses and pharmacists are specifically mentioned by the 2017 ACC/AHA blood pressure guidelines as essential members of the hypertension treatment team.5 Randomized controlled trials (RCTs) and meta-analyses of TBC involving nurse or pharmacist interventions demonstrated greater reductions in SBP and/or greater attainment of blood pressure goals compared to usual care.21,26,31,32 The literature supports the roles of nurses and pharmacists in hypertension management in all aspects of care, including medication management, patient education and counseling, coordination of care and follow-up, population health management, and performance measurement with quality improvement.33
Nurses
Nurses are commonly part of TBC hypertension management programs. One meta-analysis and systematic review of international RCTs compared nurse, nurse prescriber (United Kingdom), and nurse practitioner interventions for hypertension with usual care. Interventions that included a stepped treatment algorithm and nurse prescribing showed greater reductions in SBP (8.2 mm Hg and 8.9 mm Hg, respectively) compared to usual care.31 Similarly, models that utilized telephone monitoring demonstrated greater achievement of blood pressure targets, while those that involved home monitoring showed significant reductions in blood pressure. Another international meta-analysis and systematic review of 11 nurse-led interventions in hypertensive patients with diabetes demonstrated a 5.8 mm Hg mean decrease in SBP compared to physician-led care. However, nurse-led care was not superior in achievement of study targets.34
A recent meta-analysis and systematic review, performed by Shaw and colleagues, sought to determine whether nurse-led protocols are effective for outpatient management of adults with diabetes, hypertension, and hyperlipidemia. All of the included studies involved a registered nurse who titrated medications by following a protocol, and most were RCTs comparing the nurse protocols to usual care. Overall, mean SBP and DBP decreased by 3.86 mm Hg and 1.56 mm Hg, respectively, while blood glucose and lipid levels were also reduced compared to usual care.24
Limited RCT data have been published since the Shaw et al meta-analysis. A single-blind RCT was performed in an urban community health care center in China among patients with uncontrolled blood pressure (SBP ≥ 140 mm Hg and/or DBP ≥ 90 mm Hg).35 The study group received care via a nurse-led model, which included a delivery design system, decision support, clinical information system, and self-management support, and the control group received usual care. At 12 weeks, patients in the study group had significantly lower blood pressure than control patients, with mean SBP/DBP reduction of 14.37/7.43 mm Hg and 5.10/2.69 mm Hg, respectively (P < 0.01). Improved medication adherence and increased patient satisfaction were other benefits of the nurse-led model.
Nurse case managers (NCM) also play a critical role in hypertension management, coordinating health care services to meet patient health needs. Ogedegbe sought to evaluate the comparative effectiveness of home blood pressure telemonitoring (HBPTM)+NCM versus HBPTM alone on SBP reduction in black and Hispanic stroke survivors.36,37 NCMs evaluated patient profiles, counseled patients on target lifestyle behaviors, and reviewed home blood pressure data. At 6 months, SBP declined by 13.63 mm Hg from baseline in the HBPTM+NCM group and 6.31 mm Hg in the HBPTM alone group (P < 0.0001). At 12 months, SBP in the HBPTM+NCM group declined by 14.76 mm Hg, while blood pressure in the HBPTM alone group declined by 5.53 mm Hg (P < 0.0001).
Pharmacists
Clinical pharmacists are also widely utilized in TBC models for hypertension management. Typical models involve pharmacists entering into collaborative practice agreements with physicians, leading to optimization of medications, avoidance of adverse drug events, and transitional care activities focusing on medication reconciliation and patient education in outpatient settings.30,38 The largest and most recent meta-analysis of pharmacist interventions, conducted in 2014 by Santschi et al,23 combined 2 previous systematic reviews to include a total of 39 RCTs with 14,224 patients.32,39 Pharmacist interventions included patient education, recommendations to physicians, and medication management. Compared with usual care, pharmacist interventions showed greater reductions in SBP (7.6 mm Hg) and DBP (3.9 mm Hg).23
Numerous studies substantiating the impact of pharmacist interventions on clinical outcomes have heavily influenced clinical practice and guideline development. Carter et al conducted a prospective, multi-state, cluster-randomized trial in 32 primary care clinics to evaluate whether clinics randomized to receive the pharmacist-physician collaborative care model (PPCCM) achieved better blood pressure outcomes versus clinics randomized to usual care.25 Investigators enrolled 625 patients with uncontrolled hypertension, 50% of whom had a prior diagnosis of diabetes mellitus or chronic kidney disease. The primary outcome of blood pressure control at 9 months in the intervention clinics compared to the control clinics was 43% and 34%, respectively (P = 0.059). The difference in mean SBP/DBP between the intervention and control clinics for all patients at 9 months was −6.1/−2.9 mm Hg. In a post-hoc analysis of patients with chronic kidney disease and diabetes, the pharmacist-intervention group had a significantly greater mean SBP reduction and higher blood pressure control rates compared to usual care at 9 months.40
A pre-specified secondary analysis from the Carter et al study determined that, in patients from racial minority groups, the mean SBP was 7.3 mm Hg lower in those who received the intervention compared to those in the control group (P = 0.0042).41 In patients with less than 12 years of education, those in the intervention group had a mean SBP 8.1 mm Hg lower than the SBP of those in the control group (P = 0.0001). Similar reductions in blood pressure occurred in patients with low income, Medicaid beneficiaries, or those without insurance. This study demonstrated that pharmacist interventions reduced racial and socioeconomic disparities in blood pressure treatment.
Other studies of pharmacist interventions in underserved populations have yielded positive results. In a retrospective review of uninsured patients, blood pressure control rates in a pharmacist-driven primary care clinic ranked in the 90th percentile of NCQA benchmarks, and was superior to the 2013 reported mean for commercial insurers.42 Similarly, another retrospective cohort study of a PPCCM on time to goal blood pressure in uninsured patients with hypertension showed the median time to blood pressure goal was 36 days in the PPCCM cohort versus 259 days in usual care cohorts (P < 0.001).43 A post-hoc analysis revealed the mean time-in-therapeutic blood pressure range was 46.2% ± 24.3% in the PPCCM group and 24.8% ± 27.4% in the usual care group (P < 0.0001). The blood pressure control rates at 12 months were 89% in the PPCCM group compared with 50% in the usual care group (P < 0.0001).44
Tsuyuki et al conducted the RxACTION study, a multicenter RCT evaluating the effectiveness of enhanced pharmacist care versus usual care in 23 Canadian community pharmacies and outpatient clinics following a 6-month intervention.45 Enhanced pharmacy services included pharmacist assessment of and counseling about cardiovascular disease risk and blood pressure control, review of current antihypertensive medications, and prescribing/titrating drug therapy, as needed, through independent prescriptive authority. Compared to the usual care group (n = 67), the intervention group had a reduction in SBP of 6.6 mm Hg (P = 0.006) and in DBP of 3.2 mm Hg (P = 0.01). This study expanded the pharmacists’ scope of practice, showing evidence for enhancing pharmacist roles on the hypertension care team. Tsuyuki et al also conducted the RxEACH randomized trial, which evaluated community pharmacist cardiovascular risk reduction interventions and showed an improvement in SBP and DBP, with reported results comparable to RxACTION.46
Victor et al conducted the landmark Black Barbershop Study, a cluster RCT involving 319 non-Hispanic black male patients with hypertension from 52 black-owned barbershops.47,48 Barbershops were assigned to 1 of 2 groups. The control group consisted of barbers who encouraged lifestyle modifications and made referrals to primary care providers. The intervention group had pharmacists who met regularly with participants at the barbershops and measured blood pressure, encouraged lifestyle changes, and prescribed drug therapy under collaborative practice agreements with physicians. Both groups demonstrated improvements in blood pressure outcomes, but the intervention group showed greater improvement in SBP and achievement of blood pressure goals compared to the control group. The results in the intervention group proved sustainable over the course of a year, even after the frequency of pharmacists’ visits was reduced. At 6 months, the mean SBP fell by 27.0 mm Hg (to 125.8 mm Hg) in the intervention group, as compared to a 9.3 mm Hg (to 145.4 mm Hg) reduction in the control group (P < 0.001), and blood pressure less than 130/80 mm Hg was achieved among 63.6% of the participants in the intervention group versus 11.7% in the control group (P < 0.001).
This community-level trial brought pharmacists to the barbershop and made them an essential part of the health care team through the endorsement of the barber, who the participants trusted and with whom they had a relationship. Long-standing issues related to distrust of the medical profession by this population were addressed, and trusted community barbershops were utilized as safe spaces for health care delivery. Health care professionals should consider utilizing community locations that other minority populations perceive as social centers and safe places, to reduce health disparities and barriers to care. However, models that bring care to patients need further economic and feasibility evaluations.
Other Health Care Professionals and Future Studies
In addition to models led by nurses and pharmacists, studies have also assessed models of TBC incorporating other health care professionals, including registered dietitians, medical assistants, community health workers, and health coaches (NCT02674464).49,50 Ongoing studies are also looking at the impact of TBC on underserved communities (NCT02674464, NCT03504124). Involving a variety of health care professionals with different communities and populations in TBC studies is warranted to determine the optimal settings in which to utilize different skill sets.
The Impress Study involves nurses who are assessing lifestyle risk and developing an action plan according to a standardized procedure, which may be advantageous given the degree of heterogeneity found in other TBC models.51 There are also studies underway or recently published that compare different components of TBC in order to determine which combination of TBC elements is preferred. Some of these have shown the benefits of using clinical decision-support systems (through a guideline-based treatment protocol) or training programs with ongoing support.52,53 Continued research comparing different TBC models is needed to determine which combination of health professionals and interventions is most impactful in practice.
Cost-Effectiveness
According to the CDC, TBC in hypertension management has proven to be cost-effective.54 Systematic reviews and meta-analyses assessing the cost-effectiveness of TBC in hypertension management have been conducted.26,27,29,55-58 While the general consensus supports this approach as being cost-effective, these determinations are based on studies that are widely heterogeneous. In each of these studies, different types of costs are taken into account when determining cost-effectiveness. The range of costs can be quite wide, depending on how they are calculated, making it difficult to determine the true cost-effectiveness of different TBC models.
Intervention cost is represented by the amount of money spent to implement and maintain the intervention beyond the cost of usual care or the cost without the intervention. For TBC, intervention cost consists of personnel resources such as provider time, patient time, and non-personnel resources, including rent and utilities. Studies show that intervention costs for TBC can range from $35 to $1350 per person per year (mean, $618; median, $428).27,56 One analysis, based on 20 studies comparing TBC to usual care, calculated an intervention cost of $284 per person per year,55 while another study showed an intervention cost of $525 per enrollee per year.56 Intervention cost can vary by the type of provider that is used, the amount of time spent per patient, and the setting where services are provided. Overall, the intervention cost of implementing TBC for hypertension management is consistently higher than the cost of usual care.
Health care cost is another factor to consider. It is the difference in the cost of health care products and services that are utilized in the process of TBC, as compared to care that is provided in the absence of TBC. Health care costs include the costs associated with hospitalizations, outpatient visits, emergency room visits, and medications. One study estimated a median health care cost of hypertension TBC of $65 per person per year.55 Overall, studies evaluating the impact of TBC for hypertension management on health care costs were mixed, with some showing that TBC resulted in an increase in health care cost, and others showing a savings compared to usual care.58 The variability in health care costs was due to the different number of health care components and comorbidities of the patients included in the studies. Also, study duration affected the estimated health care costs of TBC. Most studies did not assess long-term health care cost savings that could be achieved from prolonged blood pressure control.58 When considering both intervention and health care cost, Jacob et al estimated that TBC increased overall net cost by a median value of $329 per person per year.55 While some studies did attribute an overall reduction in health care costs to TBC for hypertension management, on average, team-based models increased health care costs compared to usual care.27,29,55,58,59
However, health care costs do not take into account the long-term reductions in morbidity and mortality or increased quality-adjusted life years (QALY) that result from improved blood pressure control attributed to TBC. In most cost-effectiveness studies, an intervention is considered to be cost-effective if the cost per QALY gained is less than the accepted threshold of $50,000.55 One study estimated that the cost per QALY of TBC in hypertension management is $4763,55,60 while another study estimated a median cost per QALY of $9716 to $13,992.55 A systematic review of 34 international studies estimated the median cost per QALY to be $13,986, ranging from $6683 to $58,610.57 The wide range in cost can be attributed to the variability in interventions, health outcomes used to measure effectiveness, and the settings and countries where the studies were conducted. In another study, a TBC intervention involving pharmacists resulted in a cost per QALY of $26,800.61 The intervention was found to be cost-effective for higher-risk patients, defined as those having diabetes, a smoking history, dyslipidemia, or obesity. For patients who did not have these risk factors, the cost per QALY increased to $43,330.61 Thus, the patient population should be considered before implementing a TBC model. Furthermore, the increased use of technology, allowing for more efficient provision of services and communication between providers, could reduce intervention costs and lead to increased cost efficacy in these models.
The variation in the models used for TBC makes it difficult to draw conclusions on the cost-effectiveness of these interventions. Although it is apparent that TBC in general is cost-effective, more studies are needed comparing different team-based models to determine which specific ones are most cost-effective.
Challenges to Implementation of Team-Based Care
Recognizing and addressing the challenges inherent to a TBC approach is important to the sustainability of such a model within various settings and institutions. Numerous studies conducted on team-based models have identified common challenges that appear to be consistent across multiple settings. These challenges can be categorized as financial, provider-specific, and technology.
Financial Barriers
Although studies have demonstrated the cost-effectiveness of controlling hypertension and preventing serious complications, health systems are still confronted with the challenge of covering the cost for TBC implementation and maintenance.29 The 2 main financial barriers for TBC services are stakeholder engagement and reimbursement for services. According to Kennelty et al, stakeholder engagement is key to the sustainability of the service.27 However, decisions by stakeholders on cost are influenced by many factors, which include available funds, perceived value, and estimates for return on investment. Additionally, interventions must align with the organization’s mission and vision and be feasible to implement, and organizations must have the capacity for administrative support.29 These various financial decisions may greatly influence the sustainability of a TBC model.
The reimbursement challenges for individual providers are an additional barrier to the sustainability of the service. In the United States, most providers are reimbursed via fee-for-service payment plans, but these plans do not reimburse all clinical providers because they are not all recognized as licensed providers.62,63 For example, pharmacists are not recognized by the Centers for Medicare & Medicaid Services as licensed health care providers, which limits their ability to be reimbursed for clinical services provided outside of a traditional dispensing role. Furthermore, state laws determine the services nonphysician providers can offer and how they are recognized for reimbursement by tertiary payers. For instance, pharmacist roles, such as ordering labs and modifying or prescribing medication regimens, vary greatly between states.7,63,64
Financial barriers are a major challenge facing the sustainability of a TBC hypertension service, so including all stakeholders in the decision-making process may improve the organization’s ability to sustain the service.
Provider-Specific Barriers
Notable barriers that are attributed to providers include lack of knowledge, lack of time, lack of initiative to change blood pressure medications, and inability to reach intensive blood pressure goals set in guidelines.29 Studies such as the SPRINT trial have significantly impacted clinical guideline cut-offs for blood pressure, but reaching the intensive blood pressure goals from clinical trials is difficult to emulate in clinical practice.65 In a typical clinical setting, providers may lack the confidence to make adjustments in therapy based on a single blood pressure measurement, and clinical inertia, defined as failure of health care providers to modify therapy when indicated,66 may contribute to the inability to achieve blood pressure goals. Many factors contribute to clinical inertia, including lack of knowledge, time, or clinical protocols on how to modify therapy, causing providers to delay clinical decisions. Implementing site-specific protocols and utilizing hypertension specialist health care professionals in TBC can address the barriers contributing to clinical inertia.
Technology Barriers
A common barrier in a variety of services, but especially prevalent in a TBC service, is access to an electronic health record (EHR) for all providers treating the patient. Some providers who are not directly tied to the same clinical site as the patient’s primary care provider may not have adequate access to the full EHR. For example, pharmacists who are managing hypertension in a TBC model in a community pharmacy may have access only to health information from prescription records. Patient interviews may not provide the pharmacist with adequate information about laboratory results, vitals, and other medical information and history for the patient, making it difficult for the pharmacist to make a proper recommendation for treatment.27 Depending on the setting, communication between providers may be a barrier in achieving optimal outcomes, especially when providers do not have access to a shared medical record.
In addition, patients often lack access to technology used to manage hypertension. Many new technologies exist that aid patients in managing their blood pressure, such as smart phone applications to track blood pressure readings and alarms to remind patients to take their medications. Studies have shown that telemonitoring of blood pressure measurements and management of hypertension, especially in combination with TBC, is effective and reduces costs compared to usual care.67 However, the lack of equal access to the various technologies available may inhibit the success of a TBC hypertension program. Patients may lack access, knowledge, or financial means to utilize the various methods available for managing their hypertension electronically.29
Conclusion
Incorporating nonphysician providers into the health care team for the treatment of hypertension has proven to be more effective than usual care and has been recognized by recent guidelines as a best practice approach to achieving blood pressure goals. Multiple studies have demonstrated that TBC utilizing nurses and pharmacists can improve blood pressure management. While adding members to the team increases health care costs, the long-term benefits of achieving optimal blood pressure goals contribute to the overall cost-effectiveness of TBC strategies over usual care. However, comparisons between different TBC models are warranted to determine which combination of health care professionals and/or interventions is most effective. Cost-analysis estimates are difficult to compare due to widely varied methodology and variance in the models that have been employed. Studies must consider pathways to overcoming reimbursement issues, provider-specific challenges, and technology barriers. Follow-up and monitoring after initiation of drug therapy for hypertension control should include systematic strategies to help improve blood pressure, including use of home blood pressure monitoring, TBC, and telehealth strategies. Future implementation science approaches to hypertension TBC models within specific clinic settings will be useful to identify and overcome challenges and will help to determine the populations who will benefit most, allowing for greater success in sustaining TBC models.
Corresponding author: Shawn R. Smith, PharmD, 309 E. 2nd Street, Pomona, CA 91766; shawnsmith@westernu.edu.
Financial disclosures: None.
1. Fryar CD, Ostchega Y, Hales CM, et al. Hypertension prevalence and control among adults: United States, 2015–2016. NCHS Data Brief. 2017(289):1-8.
2. Ambrosius WT, Sink KM, Foy CG, et al. The design and rationale of a multicenter clinical trial comparing two strategies for control of systolic blood pressure: The Systolic Blood Pressure Intervention Trial (SPRINT). Clin Trials. 2014;11:532-546.
3. Lawes CM, Bennett DA, Feigin VL, Rodgers A. Blood pressure and stroke: an overview of published reviews. Stroke. 2017;35:776-785.
4. Zanchetti A, Thomopoulos C, Parati G. Randomized controlled trials of blood pressure lowering in hypertension: A critical reappraisal. Circ Res. 2015;116:1058-1073.
5. Whelton PK, Carey RM, Aronow WS, et al. 2017 ACC/AHA/AAPA/ABC/ACPM/ AGS/APhA/ASH/ASPC/NMA/PCNA guideline for the prevention, detection, evaluation, and management of high blood pressure in adults: a report of the American College of Cardiology/American Heart Association Task Force on Clinical Practice Guidelines. J Am Coll Cardiol. 2018;71:e127-e248.
6. Grol R. Successes and failures in the implementation of evidence-based guidelines for clinical practice. Med Care. 2001;39:II46-II54.
7. Brush JE, Handberg EM, Biga C, et al. 2015 ACC health policy statement on cardiovascular team-based care and the role of advanced practice providers. J Am Coll Cardiol. 2015;65:2118-2136.
8. Centers for Disease Control and Prevention. Best practices for cardiovascular disease prevention programs: a guide to effective health care system interventions and community programs linked to clinical services, promoting team-based care to improve high blood pressure control. www.cdc.gov/dhdsp/pubs/guides/best-practices/team-based-care.htm. Accessed April 30, 2020.
9. Centers for Disease Control and Prevention. Task Force recommends team-based care for improving blood pressure [press release]. May 15, 2012. www.cdc.gov/media/releases/2012/p0515_bp_control.html
10. Mitchell P, Wynia M, Golden R, et al. Core principles & values of effective team-based health care. 2012. Institute of Medicine, Washington, DC.
11. Campbell SM, Hann M, Hacker J, et al. Identifying predictors of high-quality care in English general practice: observational study. BMJ. 2001;323:784-787.
12. Shojania KG, Ranji SR, McDonald KM, et al. Effects of quality improvement strategies for type 2 diabetes on glycemic control: a meta-regression analysis. JAMA. 2006;296:427-440.
13. Walsh JM, McDonald KM, Shojania KG, et al. Quality improvement strategies for hypertension management: a systematic review. Med Care. 2006;44:646-657.
14. Wagner E. The role of patient care teams in chronic disease management. BMJ. 2000;320:560-572.
15. Coleman K, Reid R. Continuous and team-based healing relationships: improving patient care through teams. In: Phillips KE, Weir V, eds. Safety Net Medical Home Initiative Implementation Guide Series. 2nd ed. Seattle, WA: Qualis Health and The MacColl Center for Health Care Innovation at the Group Health Research Institute; 2013.
16. Sinsky CA, Willard-Grace R, Schutzbank AM, et al. In search of joy in practice: a report of 23 high-functioning primary care practices. Ann Fam Med. 2013;11:272-278
17. Howard J, Etz RS, Crocker JB, et al. Maximizing the patient-centered medical home (PCMH) by choosing words wisely. J Am Board Fam Med. 2016;29:248-253.
18. Solberg LI, Crain AL, Tillema JO, et al. Challenges of medical home transformation reported by 118 patient-centered medical home (PCMH) leaders. J Am Board Fam Med. 2014;27:449-457.
19. Crabtree BF, Chase SM, Wise CG, et al. Evaluation of patient centered medical home practice transformation initiatives. Med Care. 2011;49:10-16.
20. Carter BL. Blood pressure control—implementing a team approach. US Cardiol. 2011;8:108-113.
21. Carter BL, Rogers M, Daly J, et al. The potency of team-based care interventions for hypertension: a meta-analysis. Arch Intern Med. 2009;169:1748-1755.
22. Proia KK, Thota AB, Njie GJ, et al. Team-based care and improved blood pressure control: a community guide systematic review. Am J Prev Med. 2014;47:86-99.
23. Santschi V, Chiolero A, Colosimo AL, et al. Improving blood pressure control through pharmacist interventions: a meta-analysis of randomized controlled trials. J Am Heart Assoc. 2014;3:e000718.
24. Shaw RJ, McDuffie JR, Hendrix CC, et al. Effects of nurse-managed protocols in the outpatient management of adults with chronic conditions: a systematic review and meta-analysis. Ann Intern Med. 2014;161:113-121.
25. Carter BL, Coffey CS, Ardery G, et al. Cluster-randomized trial of a physician/pharmacist collaborative model to improve blood pressure control. Circ Cardiovasc Qual Outcomes. 2015;8:235-243
26. Carter BL, Bosworth HB, Green BB. The hypertension team: the role of the pharmacist, nurse and teamwork in hypertension therapy. J Clin Hypertens. 2012;14:51-65.
27. Kennelty KA, Polgreen LA, Carter BL. Team-based care with pharmacists to improve blood pressure: a review of recent literature. Curr Hypertens Rep. 2018;20:1.
28. Brownstein JN, Chowdhury FM, Norris SL, et al. Effectiveness of community health workers in the care of people with hypertension. Am J Prev Med. 2007;32:435-447.
29. Derington CG, King JB, Bryant KB, et al. Cost-effectiveness and challenges of implementing intensive blood pressure goals and team-based care. Curr Hypertens Rep. 2019;21:91.
30. Mills KT, Obst KM, Shen W, et al. Comparative effectiveness of implementation strategies for blood pressure control in hypertensive patients: a systematic review and meta-analysis. Ann Intern Med. 2018;168:110-120.
31. Clark CE, Smith LFP, Taylor RS, et al. Nurse led interventions to improve control of blood pressure in people with hypertension: systematic review and meta-analysis. BMJ. 2010;341:c3995.
32. Santschi V, Chiolero A, Burnand B, et al. Impact of pharmacist care in the management of cardiovascular disease risk factors: a systematic review and meta-analysis of randomized trials. Arch Intern Med. 2011;171:1441-1453.
33. Dennison Himmelfarb CR, Commodore-Mensah Y, Hill MN. Expanding the role of nurses to improve hypertension care and control globally. Ann Glob Health. 2016;82:243-253.
34. Clark CE, Smith LFP, Taylor RS, Campbell JL. Nurse-led interventions used to improve control of high blood pressure in people with diabetes: a systematic review and meta-analysis. DiabetMed. 2011;28:250-261.
35. Zhu X, Wong FKY, Wu CLH. Development and evaluation of a nurse-led hypertension management model: A randomized controlled trial. Int J Nurs Stud. 2018;77:171-178.
36. Spruill TM, Williams O, Teresi JA, et al. Comparative effectiveness of home blood pressure telemonitoring (HBPTM) plus nurse case management versus HBPTM alone among Black and Hispanic stroke survivors: study protocol for a randomized controlled trial. Trials. 2015;16:97.
37. Ogedegbe G. Comparative effectiveness of home BP telemonitoring plus nurse case management (HBPTM+NCM) versus HBPTM alone on systolic BP (SBP) reduction among minority stroke survivors. International Stroke Conference 2020; February 19-21, 2020; Los Angeles, CA. Abstract LB19.
38. Dunn SP, Birtcher KK, Beavers CJ, et al. The role of the clinical pharmacist in the care of patients with cardiovascular disease. J Am Coll Cardiol. 2015;66:2129-2139.
39. Santschi V, Chiolero A, Paradis G et al. Pharmacist interventions to improve cardiovascular disease risk factors in diabetes: a systematic review and meta-analysis of randomized controlled trials. Diabetes Care. 2012;35:2706-2717.
40. Anderegg MD, Gums TH, Uribe L, et al. Pharmacist intervention for blood pressure control in patients with diabetes and/or chronic kidney disease. Pharmacotherapy. 2018;38:309-318.
41. Anderegg MD, Gums TH, Uribe L et al. Physician-pharmacist collaborative management: narrowing the socioeconomic blood pressure gap. Hypertension. 2016;68:1314-1320.
42. Sisson EM, Dixon DL, Kildow DC, et al. Effectiveness of a pharmacist-physician team-based collaboration to improve long-term blood pressure control at an inner-city safety-net clinic. Pharmacotherapy. 2016;36:342-347.
43. Dixon DL, Sisson EM, Parod ED, et al. Pharmacist-physician collaborative care model and time to goal blood pressure in the uninsured population. J Clin Hypertens (Greenwich). 2018;20:88-95.
44. Dixon DL, Parod ED, Sisson EM et al. Impact of a pharmacist-physician collaborative care model on time-in-therapeutic blood pressure range in patients with hypertension. J Am Coll Clin Pharm. 2020;3:404-409.
45. Tsuyuki RT, Houle SK, Charrois TL, et al. Randomized trial of the effect of pharmacist prescribing on improving blood pressure in the community: the Alberta Clinical Trial in Optimizing Hypertension (RxACTION). Circulation. 2015;132:93-100.
46. Tsuyuki RT, Al Hamarneh YN, Jones CA, et al. The effectiveness of pharmacist interventions on cardiovascular risk: The Multicenter Randomized Controlled RxEACH trial. J Am Coll Cardiol. 2016;67:2846-2854.
47. Victor RG, Lynch K, Li N, et al. A cluster-randomized trial of blood-pressure reduction in black barbershops. N Engl J Med. 2018;378:1291-1301.
48. Victor RG, Blyler CA, Li N et al. Sustainability of blood pressure reduction in black barbershops. Circulation. 2019;139:10-19.
49. Panattoni L, Hurlimann L, Wilson C, et al. Workflow standardization of a novel team care model to improve chronic care: a quasi-experimental study. BMC Health Serv Res. 2017;17:286.
50. Chang AR, Bonaparte H, Yule C. Randomized controlled trial comparing a self-guided vs. dietitian-led approach using web-based tools to lower blood pressure: study design and rationale. International Stroke Conference 2020; February 19-21, 2020; Los Angeles, CA. Abstract P169.
51. Stephen C, Halcomb E, Mcinnes S, et al. Improving blood pressure control in primary care: The ImPress study. Int J Nurs Stud. 2019;95:28-33.
52. He J, Shi X, Lin M. Comparative effectiveness of implementation strategies on cardiovascular risk factor control in patients with diabetes: The D4C cluster randomized trial. International Stroke Conference 2020; February 19-21, 2020; Los Angeles, CA. Abstract 17.
53. Jafar TH, Gandhi M, de Silva HA, et al. A community-based intervention for managing hypertension in rural South Asia. N Engl J Med. 2020;382:717-726.
54. Centers for Disease Control and Prevention. Promoting team-based care to improve high blood pressure control. www.cdc.gov/dhdsp/pubs/guides/best-practices/team-based-care.htm. Accessed April 30, 2020.
55. Jacob V, Chattopadhyay SK, Thota AB, et al. Economics of team-based care in controlling blood pressure: a community guide systematic review. Am J Prev Med. 2015;49:772-783.
56. Dehmer SP, Baker-Goering MM, Maciosek MV, et al. Modeled health and economic impact of team-based care for hypertension. Am J Prev Med. 2016;50(5 suppl 1):S34-S44.
57. Zhang D, Wang G, Joo H. A systematic review of economic evidence on community hypertension interventions. Am J Prev Med. 2017;53:S121-S130.
58. Community Preventive Services Task Force. Cardiovascular disease: team-based care to improve blood pressure control. 2011. www.thecommunityguide.org/findings/cardiovascular-disease-team-based-care-improve-blood-pressure-control. Accessed April 30, 2020.
59. Kulchaitanaroaj P, Brooks JM, Ardery G et al. Incremental costs associated with physician and pharmacist collaboration to improve blood pressure control. Pharmacotherapy. 2012;32:772-780.
60. Mason JM, Freemantle N, Gibson JM, New JP. Specialist nurse-led clinics to improve control of hypertension and hyperlipidemia in diabetes. Diabetes Care. 2005;28:40-46.
61. Kulchaitanaroaj P, Brooks JM, Chaiyakunapruk N et al. Cost-utility analysis of physician-pharmacist collaborative intervention for treating hypertension compared with usual care. J Hypertens. 2017;35:178-187.
62. Lall D, Engel N, Devadasan N, et al. Models of care for chronic conditions in low/middle-income countries: a ‘best fit’ framework synthesis. BMJ Glob Health. 2018;3:e001077.
63. Bodenheimer T, Chen E, Bennett HD. Confronting the growing burden of chronic disease: can the U.S. health care workforce do the job? Health Aff (Millwood). 2009;28:64-74.
64. Smith M, Bates DW, Bodenheimer T, Cleary PD. Why pharmacists belong in the medical home. Health Aff (Millwood). 2010;29:906-913.
65. Wright JT, Williamson JD, Whelton PK, et al. A randomized trial of intensive versus standard blood-pressure control. N Engl J Med. 2015;373:2103-2116.
66. Phillips LS, Branch WT, Cook CB, et al. Clinical inertia. Ann Intern Med. 2001;135:825-834.
67. McManus RJ, Mant J, Franssen M, et al. Efficacy of self-monitored blood pressure, with or without telemonitoring, for titration of antihypertensive medication (TASMINH4): an unmasked randomised controlled trial. Lancet. 2018;391:949-959.
68. Tucker KL, Sheppard JP, Stevens R, et al. Self-monitoring of blood pressure in hypertension: a systematic review and individual patient data meta-analysis. PLoS Med. 2017;14:e1002389.
69. Casey DE, Thomas RJ, Bhalla V, et al. 2019 AHA/ACC clinical performance and quality measures for adults with high blood pressure: a report of the American College of Cardiology/American Heart Association Task Force on Performance Measures. J Am Coll Cardiol. 2019;74:2661-2706.
From Western University of Health Sciences College of Pharmacy, Department of Pharmacy Practice and Administration, Pomona, CA.
Abstract
- Objective: To review the current literature regarding the clinical effectiveness and cost-effectiveness of implementing hypertension team-based care (TBC) interventions in the outpatient setting, and discuss challenges to implementation.
- Methods: A literature review was conducted of meta-analyses, systematic reviews, and randomized controlled trials comparing TBC models to usual care for hypertension management.
- Results: Compared to usual care, TBC models have demonstrated greater blood pressure reductions and improved blood pressure control rates. Evidence was strongest for models involving nurses and pharmacists whose roles included medication management, patient education and counseling, coordination of care and follow-up, population health management, and performance measurement with quality improvement. Although TBC results in an increase in health care costs, the overall long-term benefits support the cost-effectiveness of these models over usual care. The most common barriers to TBC implementation include underutilization of technology, stakeholder engagement, and reimbursement issues.
- Conclusion: Hypertension TBC models have been shown to be clinically effective and cost-effective, but continued research comparing different models is warranted to determine which combination of health professionals and interventions is most impactful and cost-effective in practice. An implementation science approach, in which TBC models unique to each organization’s situation are created, will be useful to identify and overcome challenges and provide a solid foundation for sustainment.
Keywords: blood pressure; pharmacist; nurse; nurse practitioner; cost-effectiveness; team-based care.
Approximately 1 in 3 US adults—or about 100 million people—have high blood pressure, and only about half (48%) have their blood pressure under control.1 Effective blood pressure management has been shown to decrease the incidence of stroke, heart attack, and heart failure.2-4 The American College of Cardiology/American Heart Association (ACC/AHA) 2017 blood pressure guidelines recommended lower thresholds for diagnosing hypertension and initiating antihypertensive medication, and intensified the blood pressure goal to less than 130/80 mm Hg.5 Changing practice standards to more intensive blood pressure goals requires significant adjustments by clinicians and health care systems. In fact, new guideline uptake is often delayed, ignored, or sparsely applied.6 Due to this dramatic change in hypertension practice standards, the ACC/AHA guidelines support interdisciplinary team-based care (TBC) for hypertension management.5,7 Additionally, the Centers for Disease Control and Prevention (CDC) and the Community Preventive Services Task Force (CPSTF) promote TBC to improve blood pressure control in their initiatives to prevent heart disease and stroke.8,9
The National Academy of Medicine defines TBC as “the provision of health services to individuals, families, and/or their communities by at least 2 healthcare providers who work collaboratively with patients and their caregivers—to the extent preferred by each patient—to accomplish shared goals within and across settings to achieve coordinated, high-quality care.”10 Specific goals for TBC in hypertension treatment are listed in Table 1, and a checklist of key elements of TBC to consider before implementation are presented in Table 2.
TBC has been shown to have many advantages, including increased access to care due to expanded hours of operation and shorter wait times.11 Team-based models also provide effective and efficient delivery of patient education, behavioral health care, and care coordination.12-14 Patients are more likely to receive high-quality care when multiple providers, each with varied expertise, are on the health care team.11,15 Furthermore, clinicians report improved professional job satisfaction related to their ability to practice in environments where they are encouraged to work at the top of their licenses.16 Consequently, TBC has been accepted as a vital part of the patient-centered medical home (PCMH) model.17-19 Standards set by the National Committee for Quality Assurance (NCQA) include TBC as a requirement health systems must meet in order to achieve the highest level of PCMH recognition. While a team-based approach offers substantial benefits and is recognized as a marker of quality, implementation has presented various challenges, and the sustainability of these models in care settings has been questioned.20
In this article, we review the current literature regarding the clinical effectiveness and cost-effectiveness of implementing hypertension TBC interventions in the outpatient setting. We also discuss the challenges and opportunities of implementing this strategy in health systems and community settings in the United States.
Evidence of Impact and Effectiveness
Various models of hypertension TBC have been shown to increase the proportion of individuals with controlled blood pressure and to lead to a reduction in both systolic (SBP) and diastolic blood pressure (DBP), resulting in a strong recommendation for TBC approaches by the 2017 ACC/AHA blood pressure guidelines.5,21-25 There is great diversity in the types of hypertension treatment models studied, with few utilizing physician specialists and most utilizing nonphysician providers, such as community health workers, physician assistants, nurses, nurse practitioners, dietitians, social workers, and pharmacists.22,26-29 These professionals share duties of hypertension management with primary care physicians to reduce the burden of responsibility for care on any single provider type. TBC is patient-centered, and typically includes interprofessional collaboration, treatment algorithms, adherence counseling, frequent follow-up, home blood pressure monitoring, and patient self-management education.
Numerous studies have supported implementation of TBC in recent years. A systematic review and meta-analysis of 100 trials of hypertension TBC involving 55,920 patients concluded that the most effective blood pressure–lowering strategies use multilevel, multicomponent approaches to address barriers to hypertension control. Nonphysician providers are often involved in measuring blood pressure, ordering and assessing laboratory tests, and titrating medications.30 Compared with usual care, TBC with physician medication titration resulted in reductions in mean SBP and DBP (6.2 mm Hg and 2.7 mm Hg, respectively), while TBC with nonphysician medication titration also resulted in reductions in mean SBP and DBP (7.1 mm Hg and 3.1 mm Hg, respectively). Nurses and pharmacists are specifically mentioned by the 2017 ACC/AHA blood pressure guidelines as essential members of the hypertension treatment team.5 Randomized controlled trials (RCTs) and meta-analyses of TBC involving nurse or pharmacist interventions demonstrated greater reductions in SBP and/or greater attainment of blood pressure goals compared to usual care.21,26,31,32 The literature supports the roles of nurses and pharmacists in hypertension management in all aspects of care, including medication management, patient education and counseling, coordination of care and follow-up, population health management, and performance measurement with quality improvement.33
Nurses
Nurses are commonly part of TBC hypertension management programs. One meta-analysis and systematic review of international RCTs compared nurse, nurse prescriber (United Kingdom), and nurse practitioner interventions for hypertension with usual care. Interventions that included a stepped treatment algorithm and nurse prescribing showed greater reductions in SBP (8.2 mm Hg and 8.9 mm Hg, respectively) compared to usual care.31 Similarly, models that utilized telephone monitoring demonstrated greater achievement of blood pressure targets, while those that involved home monitoring showed significant reductions in blood pressure. Another international meta-analysis and systematic review of 11 nurse-led interventions in hypertensive patients with diabetes demonstrated a 5.8 mm Hg mean decrease in SBP compared to physician-led care. However, nurse-led care was not superior in achievement of study targets.34
A recent meta-analysis and systematic review, performed by Shaw and colleagues, sought to determine whether nurse-led protocols are effective for outpatient management of adults with diabetes, hypertension, and hyperlipidemia. All of the included studies involved a registered nurse who titrated medications by following a protocol, and most were RCTs comparing the nurse protocols to usual care. Overall, mean SBP and DBP decreased by 3.86 mm Hg and 1.56 mm Hg, respectively, while blood glucose and lipid levels were also reduced compared to usual care.24
Limited RCT data have been published since the Shaw et al meta-analysis. A single-blind RCT was performed in an urban community health care center in China among patients with uncontrolled blood pressure (SBP ≥ 140 mm Hg and/or DBP ≥ 90 mm Hg).35 The study group received care via a nurse-led model, which included a delivery design system, decision support, clinical information system, and self-management support, and the control group received usual care. At 12 weeks, patients in the study group had significantly lower blood pressure than control patients, with mean SBP/DBP reduction of 14.37/7.43 mm Hg and 5.10/2.69 mm Hg, respectively (P < 0.01). Improved medication adherence and increased patient satisfaction were other benefits of the nurse-led model.
Nurse case managers (NCM) also play a critical role in hypertension management, coordinating health care services to meet patient health needs. Ogedegbe sought to evaluate the comparative effectiveness of home blood pressure telemonitoring (HBPTM)+NCM versus HBPTM alone on SBP reduction in black and Hispanic stroke survivors.36,37 NCMs evaluated patient profiles, counseled patients on target lifestyle behaviors, and reviewed home blood pressure data. At 6 months, SBP declined by 13.63 mm Hg from baseline in the HBPTM+NCM group and 6.31 mm Hg in the HBPTM alone group (P < 0.0001). At 12 months, SBP in the HBPTM+NCM group declined by 14.76 mm Hg, while blood pressure in the HBPTM alone group declined by 5.53 mm Hg (P < 0.0001).
Pharmacists
Clinical pharmacists are also widely utilized in TBC models for hypertension management. Typical models involve pharmacists entering into collaborative practice agreements with physicians, leading to optimization of medications, avoidance of adverse drug events, and transitional care activities focusing on medication reconciliation and patient education in outpatient settings.30,38 The largest and most recent meta-analysis of pharmacist interventions, conducted in 2014 by Santschi et al,23 combined 2 previous systematic reviews to include a total of 39 RCTs with 14,224 patients.32,39 Pharmacist interventions included patient education, recommendations to physicians, and medication management. Compared with usual care, pharmacist interventions showed greater reductions in SBP (7.6 mm Hg) and DBP (3.9 mm Hg).23
Numerous studies substantiating the impact of pharmacist interventions on clinical outcomes have heavily influenced clinical practice and guideline development. Carter et al conducted a prospective, multi-state, cluster-randomized trial in 32 primary care clinics to evaluate whether clinics randomized to receive the pharmacist-physician collaborative care model (PPCCM) achieved better blood pressure outcomes versus clinics randomized to usual care.25 Investigators enrolled 625 patients with uncontrolled hypertension, 50% of whom had a prior diagnosis of diabetes mellitus or chronic kidney disease. The primary outcome of blood pressure control at 9 months in the intervention clinics compared to the control clinics was 43% and 34%, respectively (P = 0.059). The difference in mean SBP/DBP between the intervention and control clinics for all patients at 9 months was −6.1/−2.9 mm Hg. In a post-hoc analysis of patients with chronic kidney disease and diabetes, the pharmacist-intervention group had a significantly greater mean SBP reduction and higher blood pressure control rates compared to usual care at 9 months.40
A pre-specified secondary analysis from the Carter et al study determined that, in patients from racial minority groups, the mean SBP was 7.3 mm Hg lower in those who received the intervention compared to those in the control group (P = 0.0042).41 In patients with less than 12 years of education, those in the intervention group had a mean SBP 8.1 mm Hg lower than the SBP of those in the control group (P = 0.0001). Similar reductions in blood pressure occurred in patients with low income, Medicaid beneficiaries, or those without insurance. This study demonstrated that pharmacist interventions reduced racial and socioeconomic disparities in blood pressure treatment.
Other studies of pharmacist interventions in underserved populations have yielded positive results. In a retrospective review of uninsured patients, blood pressure control rates in a pharmacist-driven primary care clinic ranked in the 90th percentile of NCQA benchmarks, and was superior to the 2013 reported mean for commercial insurers.42 Similarly, another retrospective cohort study of a PPCCM on time to goal blood pressure in uninsured patients with hypertension showed the median time to blood pressure goal was 36 days in the PPCCM cohort versus 259 days in usual care cohorts (P < 0.001).43 A post-hoc analysis revealed the mean time-in-therapeutic blood pressure range was 46.2% ± 24.3% in the PPCCM group and 24.8% ± 27.4% in the usual care group (P < 0.0001). The blood pressure control rates at 12 months were 89% in the PPCCM group compared with 50% in the usual care group (P < 0.0001).44
Tsuyuki et al conducted the RxACTION study, a multicenter RCT evaluating the effectiveness of enhanced pharmacist care versus usual care in 23 Canadian community pharmacies and outpatient clinics following a 6-month intervention.45 Enhanced pharmacy services included pharmacist assessment of and counseling about cardiovascular disease risk and blood pressure control, review of current antihypertensive medications, and prescribing/titrating drug therapy, as needed, through independent prescriptive authority. Compared to the usual care group (n = 67), the intervention group had a reduction in SBP of 6.6 mm Hg (P = 0.006) and in DBP of 3.2 mm Hg (P = 0.01). This study expanded the pharmacists’ scope of practice, showing evidence for enhancing pharmacist roles on the hypertension care team. Tsuyuki et al also conducted the RxEACH randomized trial, which evaluated community pharmacist cardiovascular risk reduction interventions and showed an improvement in SBP and DBP, with reported results comparable to RxACTION.46
Victor et al conducted the landmark Black Barbershop Study, a cluster RCT involving 319 non-Hispanic black male patients with hypertension from 52 black-owned barbershops.47,48 Barbershops were assigned to 1 of 2 groups. The control group consisted of barbers who encouraged lifestyle modifications and made referrals to primary care providers. The intervention group had pharmacists who met regularly with participants at the barbershops and measured blood pressure, encouraged lifestyle changes, and prescribed drug therapy under collaborative practice agreements with physicians. Both groups demonstrated improvements in blood pressure outcomes, but the intervention group showed greater improvement in SBP and achievement of blood pressure goals compared to the control group. The results in the intervention group proved sustainable over the course of a year, even after the frequency of pharmacists’ visits was reduced. At 6 months, the mean SBP fell by 27.0 mm Hg (to 125.8 mm Hg) in the intervention group, as compared to a 9.3 mm Hg (to 145.4 mm Hg) reduction in the control group (P < 0.001), and blood pressure less than 130/80 mm Hg was achieved among 63.6% of the participants in the intervention group versus 11.7% in the control group (P < 0.001).
This community-level trial brought pharmacists to the barbershop and made them an essential part of the health care team through the endorsement of the barber, who the participants trusted and with whom they had a relationship. Long-standing issues related to distrust of the medical profession by this population were addressed, and trusted community barbershops were utilized as safe spaces for health care delivery. Health care professionals should consider utilizing community locations that other minority populations perceive as social centers and safe places, to reduce health disparities and barriers to care. However, models that bring care to patients need further economic and feasibility evaluations.
Other Health Care Professionals and Future Studies
In addition to models led by nurses and pharmacists, studies have also assessed models of TBC incorporating other health care professionals, including registered dietitians, medical assistants, community health workers, and health coaches (NCT02674464).49,50 Ongoing studies are also looking at the impact of TBC on underserved communities (NCT02674464, NCT03504124). Involving a variety of health care professionals with different communities and populations in TBC studies is warranted to determine the optimal settings in which to utilize different skill sets.
The Impress Study involves nurses who are assessing lifestyle risk and developing an action plan according to a standardized procedure, which may be advantageous given the degree of heterogeneity found in other TBC models.51 There are also studies underway or recently published that compare different components of TBC in order to determine which combination of TBC elements is preferred. Some of these have shown the benefits of using clinical decision-support systems (through a guideline-based treatment protocol) or training programs with ongoing support.52,53 Continued research comparing different TBC models is needed to determine which combination of health professionals and interventions is most impactful in practice.
Cost-Effectiveness
According to the CDC, TBC in hypertension management has proven to be cost-effective.54 Systematic reviews and meta-analyses assessing the cost-effectiveness of TBC in hypertension management have been conducted.26,27,29,55-58 While the general consensus supports this approach as being cost-effective, these determinations are based on studies that are widely heterogeneous. In each of these studies, different types of costs are taken into account when determining cost-effectiveness. The range of costs can be quite wide, depending on how they are calculated, making it difficult to determine the true cost-effectiveness of different TBC models.
Intervention cost is represented by the amount of money spent to implement and maintain the intervention beyond the cost of usual care or the cost without the intervention. For TBC, intervention cost consists of personnel resources such as provider time, patient time, and non-personnel resources, including rent and utilities. Studies show that intervention costs for TBC can range from $35 to $1350 per person per year (mean, $618; median, $428).27,56 One analysis, based on 20 studies comparing TBC to usual care, calculated an intervention cost of $284 per person per year,55 while another study showed an intervention cost of $525 per enrollee per year.56 Intervention cost can vary by the type of provider that is used, the amount of time spent per patient, and the setting where services are provided. Overall, the intervention cost of implementing TBC for hypertension management is consistently higher than the cost of usual care.
Health care cost is another factor to consider. It is the difference in the cost of health care products and services that are utilized in the process of TBC, as compared to care that is provided in the absence of TBC. Health care costs include the costs associated with hospitalizations, outpatient visits, emergency room visits, and medications. One study estimated a median health care cost of hypertension TBC of $65 per person per year.55 Overall, studies evaluating the impact of TBC for hypertension management on health care costs were mixed, with some showing that TBC resulted in an increase in health care cost, and others showing a savings compared to usual care.58 The variability in health care costs was due to the different number of health care components and comorbidities of the patients included in the studies. Also, study duration affected the estimated health care costs of TBC. Most studies did not assess long-term health care cost savings that could be achieved from prolonged blood pressure control.58 When considering both intervention and health care cost, Jacob et al estimated that TBC increased overall net cost by a median value of $329 per person per year.55 While some studies did attribute an overall reduction in health care costs to TBC for hypertension management, on average, team-based models increased health care costs compared to usual care.27,29,55,58,59
However, health care costs do not take into account the long-term reductions in morbidity and mortality or increased quality-adjusted life years (QALY) that result from improved blood pressure control attributed to TBC. In most cost-effectiveness studies, an intervention is considered to be cost-effective if the cost per QALY gained is less than the accepted threshold of $50,000.55 One study estimated that the cost per QALY of TBC in hypertension management is $4763,55,60 while another study estimated a median cost per QALY of $9716 to $13,992.55 A systematic review of 34 international studies estimated the median cost per QALY to be $13,986, ranging from $6683 to $58,610.57 The wide range in cost can be attributed to the variability in interventions, health outcomes used to measure effectiveness, and the settings and countries where the studies were conducted. In another study, a TBC intervention involving pharmacists resulted in a cost per QALY of $26,800.61 The intervention was found to be cost-effective for higher-risk patients, defined as those having diabetes, a smoking history, dyslipidemia, or obesity. For patients who did not have these risk factors, the cost per QALY increased to $43,330.61 Thus, the patient population should be considered before implementing a TBC model. Furthermore, the increased use of technology, allowing for more efficient provision of services and communication between providers, could reduce intervention costs and lead to increased cost efficacy in these models.
The variation in the models used for TBC makes it difficult to draw conclusions on the cost-effectiveness of these interventions. Although it is apparent that TBC in general is cost-effective, more studies are needed comparing different team-based models to determine which specific ones are most cost-effective.
Challenges to Implementation of Team-Based Care
Recognizing and addressing the challenges inherent to a TBC approach is important to the sustainability of such a model within various settings and institutions. Numerous studies conducted on team-based models have identified common challenges that appear to be consistent across multiple settings. These challenges can be categorized as financial, provider-specific, and technology.
Financial Barriers
Although studies have demonstrated the cost-effectiveness of controlling hypertension and preventing serious complications, health systems are still confronted with the challenge of covering the cost for TBC implementation and maintenance.29 The 2 main financial barriers for TBC services are stakeholder engagement and reimbursement for services. According to Kennelty et al, stakeholder engagement is key to the sustainability of the service.27 However, decisions by stakeholders on cost are influenced by many factors, which include available funds, perceived value, and estimates for return on investment. Additionally, interventions must align with the organization’s mission and vision and be feasible to implement, and organizations must have the capacity for administrative support.29 These various financial decisions may greatly influence the sustainability of a TBC model.
The reimbursement challenges for individual providers are an additional barrier to the sustainability of the service. In the United States, most providers are reimbursed via fee-for-service payment plans, but these plans do not reimburse all clinical providers because they are not all recognized as licensed providers.62,63 For example, pharmacists are not recognized by the Centers for Medicare & Medicaid Services as licensed health care providers, which limits their ability to be reimbursed for clinical services provided outside of a traditional dispensing role. Furthermore, state laws determine the services nonphysician providers can offer and how they are recognized for reimbursement by tertiary payers. For instance, pharmacist roles, such as ordering labs and modifying or prescribing medication regimens, vary greatly between states.7,63,64
Financial barriers are a major challenge facing the sustainability of a TBC hypertension service, so including all stakeholders in the decision-making process may improve the organization’s ability to sustain the service.
Provider-Specific Barriers
Notable barriers that are attributed to providers include lack of knowledge, lack of time, lack of initiative to change blood pressure medications, and inability to reach intensive blood pressure goals set in guidelines.29 Studies such as the SPRINT trial have significantly impacted clinical guideline cut-offs for blood pressure, but reaching the intensive blood pressure goals from clinical trials is difficult to emulate in clinical practice.65 In a typical clinical setting, providers may lack the confidence to make adjustments in therapy based on a single blood pressure measurement, and clinical inertia, defined as failure of health care providers to modify therapy when indicated,66 may contribute to the inability to achieve blood pressure goals. Many factors contribute to clinical inertia, including lack of knowledge, time, or clinical protocols on how to modify therapy, causing providers to delay clinical decisions. Implementing site-specific protocols and utilizing hypertension specialist health care professionals in TBC can address the barriers contributing to clinical inertia.
Technology Barriers
A common barrier in a variety of services, but especially prevalent in a TBC service, is access to an electronic health record (EHR) for all providers treating the patient. Some providers who are not directly tied to the same clinical site as the patient’s primary care provider may not have adequate access to the full EHR. For example, pharmacists who are managing hypertension in a TBC model in a community pharmacy may have access only to health information from prescription records. Patient interviews may not provide the pharmacist with adequate information about laboratory results, vitals, and other medical information and history for the patient, making it difficult for the pharmacist to make a proper recommendation for treatment.27 Depending on the setting, communication between providers may be a barrier in achieving optimal outcomes, especially when providers do not have access to a shared medical record.
In addition, patients often lack access to technology used to manage hypertension. Many new technologies exist that aid patients in managing their blood pressure, such as smart phone applications to track blood pressure readings and alarms to remind patients to take their medications. Studies have shown that telemonitoring of blood pressure measurements and management of hypertension, especially in combination with TBC, is effective and reduces costs compared to usual care.67 However, the lack of equal access to the various technologies available may inhibit the success of a TBC hypertension program. Patients may lack access, knowledge, or financial means to utilize the various methods available for managing their hypertension electronically.29
Conclusion
Incorporating nonphysician providers into the health care team for the treatment of hypertension has proven to be more effective than usual care and has been recognized by recent guidelines as a best practice approach to achieving blood pressure goals. Multiple studies have demonstrated that TBC utilizing nurses and pharmacists can improve blood pressure management. While adding members to the team increases health care costs, the long-term benefits of achieving optimal blood pressure goals contribute to the overall cost-effectiveness of TBC strategies over usual care. However, comparisons between different TBC models are warranted to determine which combination of health care professionals and/or interventions is most effective. Cost-analysis estimates are difficult to compare due to widely varied methodology and variance in the models that have been employed. Studies must consider pathways to overcoming reimbursement issues, provider-specific challenges, and technology barriers. Follow-up and monitoring after initiation of drug therapy for hypertension control should include systematic strategies to help improve blood pressure, including use of home blood pressure monitoring, TBC, and telehealth strategies. Future implementation science approaches to hypertension TBC models within specific clinic settings will be useful to identify and overcome challenges and will help to determine the populations who will benefit most, allowing for greater success in sustaining TBC models.
Corresponding author: Shawn R. Smith, PharmD, 309 E. 2nd Street, Pomona, CA 91766; shawnsmith@westernu.edu.
Financial disclosures: None.
1. Fryar CD, Ostchega Y, Hales CM, et al. Hypertension prevalence and control among adults: United States, 2015–2016. NCHS Data Brief. 2017(289):1-8.
2. Ambrosius WT, Sink KM, Foy CG, et al. The design and rationale of a multicenter clinical trial comparing two strategies for control of systolic blood pressure: The Systolic Blood Pressure Intervention Trial (SPRINT). Clin Trials. 2014;11:532-546.
3. Lawes CM, Bennett DA, Feigin VL, Rodgers A. Blood pressure and stroke: an overview of published reviews. Stroke. 2017;35:776-785.
4. Zanchetti A, Thomopoulos C, Parati G. Randomized controlled trials of blood pressure lowering in hypertension: A critical reappraisal. Circ Res. 2015;116:1058-1073.
5. Whelton PK, Carey RM, Aronow WS, et al. 2017 ACC/AHA/AAPA/ABC/ACPM/ AGS/APhA/ASH/ASPC/NMA/PCNA guideline for the prevention, detection, evaluation, and management of high blood pressure in adults: a report of the American College of Cardiology/American Heart Association Task Force on Clinical Practice Guidelines. J Am Coll Cardiol. 2018;71:e127-e248.
6. Grol R. Successes and failures in the implementation of evidence-based guidelines for clinical practice. Med Care. 2001;39:II46-II54.
7. Brush JE, Handberg EM, Biga C, et al. 2015 ACC health policy statement on cardiovascular team-based care and the role of advanced practice providers. J Am Coll Cardiol. 2015;65:2118-2136.
8. Centers for Disease Control and Prevention. Best practices for cardiovascular disease prevention programs: a guide to effective health care system interventions and community programs linked to clinical services, promoting team-based care to improve high blood pressure control. www.cdc.gov/dhdsp/pubs/guides/best-practices/team-based-care.htm. Accessed April 30, 2020.
9. Centers for Disease Control and Prevention. Task Force recommends team-based care for improving blood pressure [press release]. May 15, 2012. www.cdc.gov/media/releases/2012/p0515_bp_control.html
10. Mitchell P, Wynia M, Golden R, et al. Core principles & values of effective team-based health care. 2012. Institute of Medicine, Washington, DC.
11. Campbell SM, Hann M, Hacker J, et al. Identifying predictors of high-quality care in English general practice: observational study. BMJ. 2001;323:784-787.
12. Shojania KG, Ranji SR, McDonald KM, et al. Effects of quality improvement strategies for type 2 diabetes on glycemic control: a meta-regression analysis. JAMA. 2006;296:427-440.
13. Walsh JM, McDonald KM, Shojania KG, et al. Quality improvement strategies for hypertension management: a systematic review. Med Care. 2006;44:646-657.
14. Wagner E. The role of patient care teams in chronic disease management. BMJ. 2000;320:560-572.
15. Coleman K, Reid R. Continuous and team-based healing relationships: improving patient care through teams. In: Phillips KE, Weir V, eds. Safety Net Medical Home Initiative Implementation Guide Series. 2nd ed. Seattle, WA: Qualis Health and The MacColl Center for Health Care Innovation at the Group Health Research Institute; 2013.
16. Sinsky CA, Willard-Grace R, Schutzbank AM, et al. In search of joy in practice: a report of 23 high-functioning primary care practices. Ann Fam Med. 2013;11:272-278
17. Howard J, Etz RS, Crocker JB, et al. Maximizing the patient-centered medical home (PCMH) by choosing words wisely. J Am Board Fam Med. 2016;29:248-253.
18. Solberg LI, Crain AL, Tillema JO, et al. Challenges of medical home transformation reported by 118 patient-centered medical home (PCMH) leaders. J Am Board Fam Med. 2014;27:449-457.
19. Crabtree BF, Chase SM, Wise CG, et al. Evaluation of patient centered medical home practice transformation initiatives. Med Care. 2011;49:10-16.
20. Carter BL. Blood pressure control—implementing a team approach. US Cardiol. 2011;8:108-113.
21. Carter BL, Rogers M, Daly J, et al. The potency of team-based care interventions for hypertension: a meta-analysis. Arch Intern Med. 2009;169:1748-1755.
22. Proia KK, Thota AB, Njie GJ, et al. Team-based care and improved blood pressure control: a community guide systematic review. Am J Prev Med. 2014;47:86-99.
23. Santschi V, Chiolero A, Colosimo AL, et al. Improving blood pressure control through pharmacist interventions: a meta-analysis of randomized controlled trials. J Am Heart Assoc. 2014;3:e000718.
24. Shaw RJ, McDuffie JR, Hendrix CC, et al. Effects of nurse-managed protocols in the outpatient management of adults with chronic conditions: a systematic review and meta-analysis. Ann Intern Med. 2014;161:113-121.
25. Carter BL, Coffey CS, Ardery G, et al. Cluster-randomized trial of a physician/pharmacist collaborative model to improve blood pressure control. Circ Cardiovasc Qual Outcomes. 2015;8:235-243
26. Carter BL, Bosworth HB, Green BB. The hypertension team: the role of the pharmacist, nurse and teamwork in hypertension therapy. J Clin Hypertens. 2012;14:51-65.
27. Kennelty KA, Polgreen LA, Carter BL. Team-based care with pharmacists to improve blood pressure: a review of recent literature. Curr Hypertens Rep. 2018;20:1.
28. Brownstein JN, Chowdhury FM, Norris SL, et al. Effectiveness of community health workers in the care of people with hypertension. Am J Prev Med. 2007;32:435-447.
29. Derington CG, King JB, Bryant KB, et al. Cost-effectiveness and challenges of implementing intensive blood pressure goals and team-based care. Curr Hypertens Rep. 2019;21:91.
30. Mills KT, Obst KM, Shen W, et al. Comparative effectiveness of implementation strategies for blood pressure control in hypertensive patients: a systematic review and meta-analysis. Ann Intern Med. 2018;168:110-120.
31. Clark CE, Smith LFP, Taylor RS, et al. Nurse led interventions to improve control of blood pressure in people with hypertension: systematic review and meta-analysis. BMJ. 2010;341:c3995.
32. Santschi V, Chiolero A, Burnand B, et al. Impact of pharmacist care in the management of cardiovascular disease risk factors: a systematic review and meta-analysis of randomized trials. Arch Intern Med. 2011;171:1441-1453.
33. Dennison Himmelfarb CR, Commodore-Mensah Y, Hill MN. Expanding the role of nurses to improve hypertension care and control globally. Ann Glob Health. 2016;82:243-253.
34. Clark CE, Smith LFP, Taylor RS, Campbell JL. Nurse-led interventions used to improve control of high blood pressure in people with diabetes: a systematic review and meta-analysis. DiabetMed. 2011;28:250-261.
35. Zhu X, Wong FKY, Wu CLH. Development and evaluation of a nurse-led hypertension management model: A randomized controlled trial. Int J Nurs Stud. 2018;77:171-178.
36. Spruill TM, Williams O, Teresi JA, et al. Comparative effectiveness of home blood pressure telemonitoring (HBPTM) plus nurse case management versus HBPTM alone among Black and Hispanic stroke survivors: study protocol for a randomized controlled trial. Trials. 2015;16:97.
37. Ogedegbe G. Comparative effectiveness of home BP telemonitoring plus nurse case management (HBPTM+NCM) versus HBPTM alone on systolic BP (SBP) reduction among minority stroke survivors. International Stroke Conference 2020; February 19-21, 2020; Los Angeles, CA. Abstract LB19.
38. Dunn SP, Birtcher KK, Beavers CJ, et al. The role of the clinical pharmacist in the care of patients with cardiovascular disease. J Am Coll Cardiol. 2015;66:2129-2139.
39. Santschi V, Chiolero A, Paradis G et al. Pharmacist interventions to improve cardiovascular disease risk factors in diabetes: a systematic review and meta-analysis of randomized controlled trials. Diabetes Care. 2012;35:2706-2717.
40. Anderegg MD, Gums TH, Uribe L, et al. Pharmacist intervention for blood pressure control in patients with diabetes and/or chronic kidney disease. Pharmacotherapy. 2018;38:309-318.
41. Anderegg MD, Gums TH, Uribe L et al. Physician-pharmacist collaborative management: narrowing the socioeconomic blood pressure gap. Hypertension. 2016;68:1314-1320.
42. Sisson EM, Dixon DL, Kildow DC, et al. Effectiveness of a pharmacist-physician team-based collaboration to improve long-term blood pressure control at an inner-city safety-net clinic. Pharmacotherapy. 2016;36:342-347.
43. Dixon DL, Sisson EM, Parod ED, et al. Pharmacist-physician collaborative care model and time to goal blood pressure in the uninsured population. J Clin Hypertens (Greenwich). 2018;20:88-95.
44. Dixon DL, Parod ED, Sisson EM et al. Impact of a pharmacist-physician collaborative care model on time-in-therapeutic blood pressure range in patients with hypertension. J Am Coll Clin Pharm. 2020;3:404-409.
45. Tsuyuki RT, Houle SK, Charrois TL, et al. Randomized trial of the effect of pharmacist prescribing on improving blood pressure in the community: the Alberta Clinical Trial in Optimizing Hypertension (RxACTION). Circulation. 2015;132:93-100.
46. Tsuyuki RT, Al Hamarneh YN, Jones CA, et al. The effectiveness of pharmacist interventions on cardiovascular risk: The Multicenter Randomized Controlled RxEACH trial. J Am Coll Cardiol. 2016;67:2846-2854.
47. Victor RG, Lynch K, Li N, et al. A cluster-randomized trial of blood-pressure reduction in black barbershops. N Engl J Med. 2018;378:1291-1301.
48. Victor RG, Blyler CA, Li N et al. Sustainability of blood pressure reduction in black barbershops. Circulation. 2019;139:10-19.
49. Panattoni L, Hurlimann L, Wilson C, et al. Workflow standardization of a novel team care model to improve chronic care: a quasi-experimental study. BMC Health Serv Res. 2017;17:286.
50. Chang AR, Bonaparte H, Yule C. Randomized controlled trial comparing a self-guided vs. dietitian-led approach using web-based tools to lower blood pressure: study design and rationale. International Stroke Conference 2020; February 19-21, 2020; Los Angeles, CA. Abstract P169.
51. Stephen C, Halcomb E, Mcinnes S, et al. Improving blood pressure control in primary care: The ImPress study. Int J Nurs Stud. 2019;95:28-33.
52. He J, Shi X, Lin M. Comparative effectiveness of implementation strategies on cardiovascular risk factor control in patients with diabetes: The D4C cluster randomized trial. International Stroke Conference 2020; February 19-21, 2020; Los Angeles, CA. Abstract 17.
53. Jafar TH, Gandhi M, de Silva HA, et al. A community-based intervention for managing hypertension in rural South Asia. N Engl J Med. 2020;382:717-726.
54. Centers for Disease Control and Prevention. Promoting team-based care to improve high blood pressure control. www.cdc.gov/dhdsp/pubs/guides/best-practices/team-based-care.htm. Accessed April 30, 2020.
55. Jacob V, Chattopadhyay SK, Thota AB, et al. Economics of team-based care in controlling blood pressure: a community guide systematic review. Am J Prev Med. 2015;49:772-783.
56. Dehmer SP, Baker-Goering MM, Maciosek MV, et al. Modeled health and economic impact of team-based care for hypertension. Am J Prev Med. 2016;50(5 suppl 1):S34-S44.
57. Zhang D, Wang G, Joo H. A systematic review of economic evidence on community hypertension interventions. Am J Prev Med. 2017;53:S121-S130.
58. Community Preventive Services Task Force. Cardiovascular disease: team-based care to improve blood pressure control. 2011. www.thecommunityguide.org/findings/cardiovascular-disease-team-based-care-improve-blood-pressure-control. Accessed April 30, 2020.
59. Kulchaitanaroaj P, Brooks JM, Ardery G et al. Incremental costs associated with physician and pharmacist collaboration to improve blood pressure control. Pharmacotherapy. 2012;32:772-780.
60. Mason JM, Freemantle N, Gibson JM, New JP. Specialist nurse-led clinics to improve control of hypertension and hyperlipidemia in diabetes. Diabetes Care. 2005;28:40-46.
61. Kulchaitanaroaj P, Brooks JM, Chaiyakunapruk N et al. Cost-utility analysis of physician-pharmacist collaborative intervention for treating hypertension compared with usual care. J Hypertens. 2017;35:178-187.
62. Lall D, Engel N, Devadasan N, et al. Models of care for chronic conditions in low/middle-income countries: a ‘best fit’ framework synthesis. BMJ Glob Health. 2018;3:e001077.
63. Bodenheimer T, Chen E, Bennett HD. Confronting the growing burden of chronic disease: can the U.S. health care workforce do the job? Health Aff (Millwood). 2009;28:64-74.
64. Smith M, Bates DW, Bodenheimer T, Cleary PD. Why pharmacists belong in the medical home. Health Aff (Millwood). 2010;29:906-913.
65. Wright JT, Williamson JD, Whelton PK, et al. A randomized trial of intensive versus standard blood-pressure control. N Engl J Med. 2015;373:2103-2116.
66. Phillips LS, Branch WT, Cook CB, et al. Clinical inertia. Ann Intern Med. 2001;135:825-834.
67. McManus RJ, Mant J, Franssen M, et al. Efficacy of self-monitored blood pressure, with or without telemonitoring, for titration of antihypertensive medication (TASMINH4): an unmasked randomised controlled trial. Lancet. 2018;391:949-959.
68. Tucker KL, Sheppard JP, Stevens R, et al. Self-monitoring of blood pressure in hypertension: a systematic review and individual patient data meta-analysis. PLoS Med. 2017;14:e1002389.
69. Casey DE, Thomas RJ, Bhalla V, et al. 2019 AHA/ACC clinical performance and quality measures for adults with high blood pressure: a report of the American College of Cardiology/American Heart Association Task Force on Performance Measures. J Am Coll Cardiol. 2019;74:2661-2706.
An eConsults Program to Improve Patient Access to Specialty Care in an Academic Health System
From the Department of Medicine, University of California, Irvine, Orange, CA.
Abstract
Background: Orange County’s residents have difficulty accessing timely, quality, affordable specialty care services. As the county’s only academic health system, the University of California, Irvine (UCI) aimed to improve specialty care access for the communities it serves by implementing an electronic consultations (eConsults) program that allows primary care providers (PCPs) to efficiently receive specialist recommendations on referral problems that do not require an in-person evaluation.
Objective: To implement an eConsults program at the UCI that enhances access to and the delivery of coordinated specialty care for lower-complexity referral problems.
Methods: We developed custom solutions to integrate eConsults into UCI’s 2 electronic health record platforms. The impact of the eConsults program was assessed by continuously evaluating usage and outcomes. Measures used to track usage included the number of submitted eConsult requests per PCP, the number of completed responses per specialty, and the response time for eConsult requests. Outcome measures included the specialist recommendation (eg, in-office visit, consultation avoided) and physician feedback.
Results: Over 4.5 years, more than 1400 successful eConsults have been completed, and the program has expanded to 17 specialties. The average turnaround time for an eConsult response across all specialties was 1 business day. Moreover, more than 50% of the eConsults received specialty responses within the same day of the eConsult request. Most important, about 80% of eConsult requests were addressed without the need for an in-office visit with a specialist.
Conclusion: The enhanced access to and the delivery of coordinated specialty care provided by eConsults resulted in improved efficiency and specialty access, while likely reducing costs and improving patient satisfaction. The improved communication and collaboration among providers with eConsults has also led to overwhelmingly positive feedback from both PCPs and specialists.
Keywords: electronic consultation; access to care; primary care; specialty referral; telehealth.
Orange County’s growing, aging, and diverse population is driving an increased demand for health care.1 But with the county’s high cost of living and worsening shortage of physicians,1-3 many of its residents are struggling to access timely, quality, affordable care. Access to specialty care services is especially frustrating for many patients and their providers, both primary care providers (PCPs) and specialists, due to problems with the referral process. Many patients experience increased wait times for a visit with a specialist due to poor communication between providers, insufficient guidance on the information or diagnostic results needed by specialists, and lack of care coordination.4-6 One promising approach to overcome these challenges is the use of an electronic consultation, or eConsult, in place of a standard in-person referral. An eConsult is an asynchronous, non-face-to-face, provider-to-provider exchange using a secure electronic communication platform. For appropriate referral problems, the patient is able to receive timely access to specialist expertise through electronic referral by their PCP,7-9 and avoid the time and costs associated with a visit to the specialist,10,11 such as travel, missed work, co-pays, and child-care expenses. Clinical questions addressed using an eConsult system subsequently free up office visit appointment slots, improving access for patients requiring in-office evaluation.8,12
Orange County’s only academic health system, the University of California, Irvine (UCI), serves a population of 3.5 million, and its principal priority is providing the communities in the county (which is the sixth largest in United States) and the surrounding region with the highest quality health care possible. Thus, UCI aimed to improve its referral processes and provide timely access to specialty care for its patients by implementing an eConsults program that allows PCPs to efficiently receive specialist recommendations on referral problems that do not require the specialist to evaluate the patient in person. This report describes our experiences with developing and implementing a custom-built eConsults workflow in UCI’s prior electronic health record (EHR) platform, Allscripts, and subsequently transitioning our mature eConsults program to a new EHR system when UCI adopted Epic. UCI is likely the only academic medical center to have experience in successfully implementing eConsults into 2 different EHR systems.
Setting
UCI’s medical center is a 417-bed acute care hospital providing tertiary and quaternary care, ambulatory and specialty medical clinics, behavioral health care, and rehabilitation services. It is located in Orange, CA, and serves a diverse population of 3.5 million persons with broad health care needs. With more than 400 specialty and primary care physicians, UCI offers a full scope of acute and general care services. It is also the primary teaching location for UCI medical and nursing students, medical residents, and fellows, and is home to Orange County’s only adult Level I and pediatric Level II trauma centers and the regional burn center.
eConsults Program
We designed the initial eConsults program within UCI’s Allscripts EHR platform. Our information technology (IT) build team developed unique “documents-based” eConsults workflows that simplified the process of initiating requests directly from the EHR and facilitated rapid responses from participating specialties. The requesting provider’s eConsults interface was user-friendly, and referring providers were able to initiate an eConsult easily by selecting the customized eConsult icon from the Allscripts main toolbar. To ensure that all relevant information is provided to the specialists, condition-specific templates are embedded in the requesting provider’s eConsults workflow that allow PCPs to enter a focused, patient-specific clinical question and provide guidance on recommended patient information (eg, health history, laboratory results, and digital images) that may help the specialist provide an informed response. The eConsult templates were adapted from standardized forms developed by partner University of California Health Systems in an initiative funded by the University of California Center for Health Quality and Innovation.
To facilitate timely responses from specialists, an innovative notification system was created in the responding provider’s eConsults workflow to automatically send an email to participating specialists when a new eConsult is requested. The responding provider’s workflow also includes an option for the specialist to decline the eConsult if the case is deemed too complex to be addressed electronically. For every completed eConsult that does not result in an in-person patient evaluation, the requesting provider and responding specialist each receives a modest reimbursement, which was initially paid by UCI Health System funds.
Implementation
The design and implementation of the eConsults program began in November 2014, and was guided by a steering committee that included the chair of the department of medicine, chief medical information officer, primary care and specialty physician leads, IT build team, and a project manager. Early on, members of this committee engaged UCI leadership to affirm support for the program and obtain the IT resources needed to build the eConsults workflow. Regular steering committee meetings were established to discuss the design of the workflow, adapt the clinical content of the referral templates, and develop a provider reimbursement plan. After completion of the workflow build, the eConsults system was tested to identify failure points and obtain feedback from users. Prior to going live, the eConsults program was publicized by members of the steering committee through meetings with primary care groups and email communications. Committee members also hosted in-person training and orientation sessions with PCPs and participating specialists, and distributed tip sheets summarizing the steps to complete the PCP and specialist eConsult workflows.
The eConsults workflow build, testing, and launch were completed within 5 months (April 2015; Figure 1). eConsults went live in the 3 initial specialties (endocrinology, cardiology, and rheumatology) that were interested in participating in the first wave of the program. UCI’s eConsults service has subsequently expanded to 17 total specialties (allergy, cardiology, dermatology, endocrinology, gastroenterology, geriatrics, gynecology, hematology, hepatology, infectious disease, nephrology, neurology, palliative care, psychiatry, pulmonary, rheumatology, and sports medicine).

Two and half years after the eConsults program was implemented in Allscripts, UCI adopted a new EHR platform, Epic. By this time, the eConsults service had grown into a mature program with greater numbers of PCP users and submitted eConsults (Figure 2). Using our experience with the Allscripts build, our IT team was able to efficiently transition the eConsults service to the new EHR system. In contrast to the “documents-based” eConsult workflows on Allscripts, our IT team utilized an “orders-based” strategy on Epic, which followed a more traditional approach to requesting a consultation. We re-launched the service in Epic within 3 months (February 2018). However, both platforms utilized user-friendly workflows to achieve similar goals, and the program has continued to grow with respect to the number of users and eConsults.

Measurement/Analysis
The impact of the program was assessed by continuously evaluating usage and outcomes. Measures used to track usage included the number of PCP users, the number of submitted eConsult requests per PCP, and the number of requests per specialty. The response time for eConsult requests and the self-reported amount of time spent by specialists on the response were also tracked. Outcome measures included the specialist recommendation (eg, in-office visit, consultation avoided) and physician feedback. Provider satisfaction was primarily obtained by soliciting feedback from individual eConsult users.
Implementation of this eConsults program constituted a quality improvement activity and did not require Institutional Review Board review.
Results
Since the program was launched in April 2015, more than 1400 eConsults have been completed across 17 specialties (Figure 3). There were 654 completed eConsults on the Allscripts platform, and 808 eConsults have been completed using the Epic platform to date. The busiest eConsult specialties were endocrinology (receiving 276, or 19%, of the eConsults requests), hematology (receiving 249 requests, or 17%), infectious disease (receiving 244 requests, or 17% ), and cardiology (receiving 148 requests, or 10%).

The self-reported amount of time specialists spent on the response was different between the 2 EHR systems (Figure 4). On Allscripts, specialists reported that 23% of eConsults took 10 minutes or less to complete, 47% took 11 to 20 minutes, 23% took 21 to 30 minutes, and 7% took more than 30 minutes. On Epic, specialists reported that 42% of eConsults took 10 minutes or less to complete, 44% took 11 to 20 minutes, 12% took 21 to 30 minutes, and 2% took more than 30 minutes. This difference in time spent fielding eConsults likely represents the subtle nuances between Allscripts’ “documents-based” and Epic’s “orders-based” workflows.
 and Epic (inner ring)")
As a result of the automated notification system that was introduced early in the eConsults implementation process on Allscripts, the specialty response times were much faster than the expected 3 business days’ turnaround goal instituted by the Center for Health Quality and Innovation initiative, regardless of the EHR platform used. In fact, the average turnaround time for an eConsult response across all specialties was 1 business day, which was similar for both EHR systems (Figure 5). Furthermore, more than 50% of the eConsults on both EHR systems received specialist responses within the same day of the eConsult request (63% on Allscripts, 54% on Epic). There was a small decrease in the percentage of same-day responses when we transitioned to Epic, likely because the functionality of an automated notification email could not be restored in Epic. Regardless, the specialty response times on Epic remained expeditious, likely because the automated notifications on Allscripts instilled good practices for the specialists, and regularly checking for new eConsult requests became an ingrained behavior.
 and Epic (inner ring)")
Our most important finding was that approximately 80% of eConsult requests were addressed without the need for an in-office visit with a specialist. This measure was similar for both EHR platforms (83% on Allscripts and 78% on Epic).
Provider feedback has been overwhelmingly positive. PCPs are impressed with the robust educational content of the eConsult responses, since the goal for specialists is to justify their recommendations. Specialists appreciate the convenience and efficiency that eConsults offer, as well as the improved communication and collaboration among physicians. eConsults have been especially beneficial to PCPs at UCI’s Family Health Centers, who are now able to receive subspecialty consultations from UCI specialists despite insurance barriers.
Discussion
Our eConsults program uniquely contrasts with other programs because UCI is likely the only academic medical center to have experience in successfully incorporating eConsults into 2 different EHR systems: initial development of the eConsults workflow in UCI’s existing Allscripts EHR platform, and subsequently transitioning a mature eConsults program to a new EHR system when the institution adopted Epic.
We measured the impact of the eConsults program on access to care by the response time for eConsult requests and the percentage of eConsults that averted an in-office visit with a specialist. We found that the eConsults program at UCI provided our PCPs access to specialist consultations in a timely manner, with much shorter response times than standard in-person referrals. The average turnaround time for an eConsult response we reported is consistent with findings from other studies.12-15 Additionally, our program was able to address about 80% of its eConsults electronically, helping to reduce unnecessary in-person specialist referrals. In the literature, the percentage of eConsults that avoided an in-person specialist visit varies widely.8,12-16
We reported very positive feedback from both PCPs and specialists on UCI’s eConsults service. Similarly, other studies described PCP satisfaction with their respective eConsults programs to be uniformly high,8,9,13,14,17-19 though some reported that the level of satisfaction among specialists was more varied.18-21
Lessons Learned
The successful design and implementation of our eConsults program began with assembling the right clinical champions and technology partners for our steering committee. Establishing regular steering committee meetings helped maintain an appropriate timeline for completion of different aspects of the project. Engaging support from UCI’s leadership also provided us with a dedicated IT team that helped us with the build, training resources, troubleshooting issues, and reporting for the project.
Our experience with implementing the eConsults program on 2 different EHR systems highlighted the importance of creating efficient, user-friendly workflows to foster provider adoption and achieve sustainability. Allscripts’ open platform gave our IT team the ability to create a homegrown solution to implementing an eConsult model that was simple and easy to use. The Epic platform’s interoperability allowed us to leverage our learnings from the Allscripts build to efficiently implement eConsults in Epic.
We also found that providing modest incentive payments or reimbursements to both PCPs and specialists for each completed eConsult helps with both adoption and program sustainability. Initially, credit for the eConsult work was paid by internal UCI Health System funds. Two payers, UC Care (a preferred provider organization plan created just for the University of California) and more recently, the Centers for Medicare & Medicaid Services, have agreed to reimburse for outpatient eConsults. Securing additional payers for reimbursement of the eConsult service will not only ensure the program’s long-term sustainability, but also represents an acknowledgment of the value of eConsults in supporting access to care.
Applicability
Other health care settings that are experiencing issues with specialty care access can successfully implement their own eConsults program by employing strategies similar to those described in this report—assembling the right team, creating user-friendly workflows, and providing incentives. Our advice for successful implementation is to clearly communicate your goals to all involved, including primary care, specialists, leadership, and IT partners, and establish with these stakeholders the appropriate support and resources needed to facilitate the development of the program and overcome any barriers to adoption.
Current Status and Future Directions
Our future plans include continuing to optimize the Epic eConsult backend build and workflows using our experience in Allscripts. We have implemented eConsult workflows for use by graduate medical education trainees and advanced practice providers, with attending supervision. Further work is in progress to optimize these workflows, which will allow for appropriate education and supervision without delaying care. Furthermore, we plan to expand the program to include inpatient-to-inpatient and emergency department-to-inpatient eConsults. We will continue to expand the eConsults program by offering additional specialties, engage providers to encourage ongoing participation, and maximize PCP use by continuing to market the program through regular newsletters and email communications. Finally, the eConsults has served as an effective, important resource in the current era of COVID-19 in several ways: it allows for optimization of specialty input in patient care delivery without subjecting more health care workers to unnecessary exposure; saves on utilization of precious personal protective equipment; and enhances our ability to deal with a potential surge by providing access to specialists remotely and electronically all hours of the day, thus expanding care to the evening and weekend hours.
Acknowledgment: The authors thank our steering committee members (Dr. Ralph Cygan, Dr. Andrew Reikes, Dr. Byron Allen, Dr. George Lawry) and IT build team (Lori Bocchicchio, Meghan van Witsen, Jaymee Zillgitt, Tanya Sickles, Dennis Hoang, Jeanette Lisak-Phillips) for their contributions in the design and implementation of our eConsults program. We also thank additional team members Kurt McArthur and Neaktisia Lee for their assistance with generating reports, and Kathy LaPierre, Jennifer Rios, and Debra Webb Torres for their guidance with compliance and billing issues.
Corresponding author: Alpesh N. Amin, MD, MBA, University of California, Irvine, 101 The City Drive South, Building 26, Room 1000, ZC-4076H, Orange, CA 92868; anamin@uci.edu.
Financial disclosures: None.
1. County of Orange, Health Care Agency, Public Health Services. Orange County Health Profile 2013.
2. Coffman JM, Fix M Ko, M. California physician supply and distribution: headed for a drought? California Health Care Foundation, June 2018.
3. Spetz J, Coffman J, Geyn I. California’s primary care workforce: forecasted supply, demand, and pipeline of trainees, 2016-2030. Healthforce Center at the University of California, San Francisco, August 2017.
4. Gandhi TK, Sittig DF, Franklin M, et al. Communication breakdown in the outpatient referral process. J Gen Intern Med. 2000;15:626-631.
5. McPhee SJ, Lo B, Saika GY, Meltzer R. How good is communication between primary care physicians and subspecialty consultants? Arch Intern Med. 1984;144:1265-1268.
6. Mehrotra A, Forrest CB, Lin CY. Dropping the baton: specialty referrals in the United States. Milbank Q. 2011;89:39-68.
7. Wrenn K, Catschegn S, Cruz M, et al. Analysis of an electronic consultation program at an academic medical centre: Primary care provider questions, specialist responses, and primary care provider actions. J Telemed Telecare. 2017;23: 217-224.
8. Gleason N, Prasad PA, Ackerman S, et al. Adoption and impact of an eConsult system in a fee-for-service setting. Healthc (Amst). 2017;5(1-2):40-45.
9. Stoves J, Connolly J, Cheung CK, et al. Electronic consultation as an alternative to hospital referral for patients with chronic kidney disease: a novel application for networked electronic health records to improve the accessibility and efficiency of healthcare. Qual Saf Health Care. 2010;19: e54.
10. Datta SK, Warshaw EM, Edison KE, et al. Cost and utility analysis of a store-and-forward teledermatology referral system: a randomized clinical trial. JAMA Dermatol. 2015;151:1323-1329.
11. Liddy C, Drosinis P, Deri Armstrong C, et al. What are the cost savings associated with providing access to specialist care through the Champlain BASE eConsult service? A costing evaluation. BMJ Open. 2016;6:e010920.
12. Barnett ML, Yee HF Jr, Mehrotra A, Giboney P. Los Angeles safety-net program eConsult system was rapidly adopted and decreased wait times to see specialists. Health Aff. 2017;36:492-499.
13. Malagrino GD, Chaudhry R, Gardner M, et al. A study of 6,000 electronic specialty consultations for person-centered care at The Mayo Clinic. Int J Person Centered Med. 2012;2:458-466.
14. Keely E, Liddy C, Afkham A. Utilization, benefits, and impact of an e-consultation service across diverse specialties and primary care providers. Telemed J E Health. 2013;19:733-738.
15. Scherpbier-de Haan ND, van Gelder VA, Van Weel C, et al. Initial implementation of a web-based consultation process for patients with chronic kidney disease. Ann Fam Med. 2013;11:151-156.
16. Palen TE, Price D, Shetterly S, Wallace KB. Comparing virtual consults to traditional consults using an electronic health record: an observational case-control study. BMC Med Inform Decis Mak. 2012;12:65.
17. Liddy C, Afkham A, Drosinis P, et al. Impact of and satisfaction with a new eConsult service: a mixed methods study of primary care providers. J Am Board Fam Med. 2015;28:394-403.
18. Angstman KB, Adamson SC, Furst JW, et al. Provider satisfaction with virtual specialist consultations in a family medicine department. Health Care Manag (Frederick). 2009;28:14-18.
19. McAdams M, Cannavo L, Orlander JD. A medical specialty e-consult program in a VA health care system. Fed Pract. 2014; 31:26–31.
20. Keely E, Williams R, Epstein G, et al. Specialist perspectives on Ontario Provincial electronic consultation services. Telemed J E Health. 2019;25:3-10.
21. Kim-Hwang JE, Chen AH, Bell DS, et al. Evaluating electronic referrals for specialty care at a public hospital. J Gen Intern Med. 2010;25:1123-1128.
From the Department of Medicine, University of California, Irvine, Orange, CA.
Abstract
Background: Orange County’s residents have difficulty accessing timely, quality, affordable specialty care services. As the county’s only academic health system, the University of California, Irvine (UCI) aimed to improve specialty care access for the communities it serves by implementing an electronic consultations (eConsults) program that allows primary care providers (PCPs) to efficiently receive specialist recommendations on referral problems that do not require an in-person evaluation.
Objective: To implement an eConsults program at the UCI that enhances access to and the delivery of coordinated specialty care for lower-complexity referral problems.
Methods: We developed custom solutions to integrate eConsults into UCI’s 2 electronic health record platforms. The impact of the eConsults program was assessed by continuously evaluating usage and outcomes. Measures used to track usage included the number of submitted eConsult requests per PCP, the number of completed responses per specialty, and the response time for eConsult requests. Outcome measures included the specialist recommendation (eg, in-office visit, consultation avoided) and physician feedback.
Results: Over 4.5 years, more than 1400 successful eConsults have been completed, and the program has expanded to 17 specialties. The average turnaround time for an eConsult response across all specialties was 1 business day. Moreover, more than 50% of the eConsults received specialty responses within the same day of the eConsult request. Most important, about 80% of eConsult requests were addressed without the need for an in-office visit with a specialist.
Conclusion: The enhanced access to and the delivery of coordinated specialty care provided by eConsults resulted in improved efficiency and specialty access, while likely reducing costs and improving patient satisfaction. The improved communication and collaboration among providers with eConsults has also led to overwhelmingly positive feedback from both PCPs and specialists.
Keywords: electronic consultation; access to care; primary care; specialty referral; telehealth.
Orange County’s growing, aging, and diverse population is driving an increased demand for health care.1 But with the county’s high cost of living and worsening shortage of physicians,1-3 many of its residents are struggling to access timely, quality, affordable care. Access to specialty care services is especially frustrating for many patients and their providers, both primary care providers (PCPs) and specialists, due to problems with the referral process. Many patients experience increased wait times for a visit with a specialist due to poor communication between providers, insufficient guidance on the information or diagnostic results needed by specialists, and lack of care coordination.4-6 One promising approach to overcome these challenges is the use of an electronic consultation, or eConsult, in place of a standard in-person referral. An eConsult is an asynchronous, non-face-to-face, provider-to-provider exchange using a secure electronic communication platform. For appropriate referral problems, the patient is able to receive timely access to specialist expertise through electronic referral by their PCP,7-9 and avoid the time and costs associated with a visit to the specialist,10,11 such as travel, missed work, co-pays, and child-care expenses. Clinical questions addressed using an eConsult system subsequently free up office visit appointment slots, improving access for patients requiring in-office evaluation.8,12
Orange County’s only academic health system, the University of California, Irvine (UCI), serves a population of 3.5 million, and its principal priority is providing the communities in the county (which is the sixth largest in United States) and the surrounding region with the highest quality health care possible. Thus, UCI aimed to improve its referral processes and provide timely access to specialty care for its patients by implementing an eConsults program that allows PCPs to efficiently receive specialist recommendations on referral problems that do not require the specialist to evaluate the patient in person. This report describes our experiences with developing and implementing a custom-built eConsults workflow in UCI’s prior electronic health record (EHR) platform, Allscripts, and subsequently transitioning our mature eConsults program to a new EHR system when UCI adopted Epic. UCI is likely the only academic medical center to have experience in successfully implementing eConsults into 2 different EHR systems.
Setting
UCI’s medical center is a 417-bed acute care hospital providing tertiary and quaternary care, ambulatory and specialty medical clinics, behavioral health care, and rehabilitation services. It is located in Orange, CA, and serves a diverse population of 3.5 million persons with broad health care needs. With more than 400 specialty and primary care physicians, UCI offers a full scope of acute and general care services. It is also the primary teaching location for UCI medical and nursing students, medical residents, and fellows, and is home to Orange County’s only adult Level I and pediatric Level II trauma centers and the regional burn center.
eConsults Program
We designed the initial eConsults program within UCI’s Allscripts EHR platform. Our information technology (IT) build team developed unique “documents-based” eConsults workflows that simplified the process of initiating requests directly from the EHR and facilitated rapid responses from participating specialties. The requesting provider’s eConsults interface was user-friendly, and referring providers were able to initiate an eConsult easily by selecting the customized eConsult icon from the Allscripts main toolbar. To ensure that all relevant information is provided to the specialists, condition-specific templates are embedded in the requesting provider’s eConsults workflow that allow PCPs to enter a focused, patient-specific clinical question and provide guidance on recommended patient information (eg, health history, laboratory results, and digital images) that may help the specialist provide an informed response. The eConsult templates were adapted from standardized forms developed by partner University of California Health Systems in an initiative funded by the University of California Center for Health Quality and Innovation.
To facilitate timely responses from specialists, an innovative notification system was created in the responding provider’s eConsults workflow to automatically send an email to participating specialists when a new eConsult is requested. The responding provider’s workflow also includes an option for the specialist to decline the eConsult if the case is deemed too complex to be addressed electronically. For every completed eConsult that does not result in an in-person patient evaluation, the requesting provider and responding specialist each receives a modest reimbursement, which was initially paid by UCI Health System funds.
Implementation
The design and implementation of the eConsults program began in November 2014, and was guided by a steering committee that included the chair of the department of medicine, chief medical information officer, primary care and specialty physician leads, IT build team, and a project manager. Early on, members of this committee engaged UCI leadership to affirm support for the program and obtain the IT resources needed to build the eConsults workflow. Regular steering committee meetings were established to discuss the design of the workflow, adapt the clinical content of the referral templates, and develop a provider reimbursement plan. After completion of the workflow build, the eConsults system was tested to identify failure points and obtain feedback from users. Prior to going live, the eConsults program was publicized by members of the steering committee through meetings with primary care groups and email communications. Committee members also hosted in-person training and orientation sessions with PCPs and participating specialists, and distributed tip sheets summarizing the steps to complete the PCP and specialist eConsult workflows.
The eConsults workflow build, testing, and launch were completed within 5 months (April 2015; Figure 1). eConsults went live in the 3 initial specialties (endocrinology, cardiology, and rheumatology) that were interested in participating in the first wave of the program. UCI’s eConsults service has subsequently expanded to 17 total specialties (allergy, cardiology, dermatology, endocrinology, gastroenterology, geriatrics, gynecology, hematology, hepatology, infectious disease, nephrology, neurology, palliative care, psychiatry, pulmonary, rheumatology, and sports medicine).
Two and half years after the eConsults program was implemented in Allscripts, UCI adopted a new EHR platform, Epic. By this time, the eConsults service had grown into a mature program with greater numbers of PCP users and submitted eConsults (Figure 2). Using our experience with the Allscripts build, our IT team was able to efficiently transition the eConsults service to the new EHR system. In contrast to the “documents-based” eConsult workflows on Allscripts, our IT team utilized an “orders-based” strategy on Epic, which followed a more traditional approach to requesting a consultation. We re-launched the service in Epic within 3 months (February 2018). However, both platforms utilized user-friendly workflows to achieve similar goals, and the program has continued to grow with respect to the number of users and eConsults.
Measurement/Analysis
The impact of the program was assessed by continuously evaluating usage and outcomes. Measures used to track usage included the number of PCP users, the number of submitted eConsult requests per PCP, and the number of requests per specialty. The response time for eConsult requests and the self-reported amount of time spent by specialists on the response were also tracked. Outcome measures included the specialist recommendation (eg, in-office visit, consultation avoided) and physician feedback. Provider satisfaction was primarily obtained by soliciting feedback from individual eConsult users.
Implementation of this eConsults program constituted a quality improvement activity and did not require Institutional Review Board review.
Results
Since the program was launched in April 2015, more than 1400 eConsults have been completed across 17 specialties (Figure 3). There were 654 completed eConsults on the Allscripts platform, and 808 eConsults have been completed using the Epic platform to date. The busiest eConsult specialties were endocrinology (receiving 276, or 19%, of the eConsults requests), hematology (receiving 249 requests, or 17%), infectious disease (receiving 244 requests, or 17% ), and cardiology (receiving 148 requests, or 10%).
The self-reported amount of time specialists spent on the response was different between the 2 EHR systems (Figure 4). On Allscripts, specialists reported that 23% of eConsults took 10 minutes or less to complete, 47% took 11 to 20 minutes, 23% took 21 to 30 minutes, and 7% took more than 30 minutes. On Epic, specialists reported that 42% of eConsults took 10 minutes or less to complete, 44% took 11 to 20 minutes, 12% took 21 to 30 minutes, and 2% took more than 30 minutes. This difference in time spent fielding eConsults likely represents the subtle nuances between Allscripts’ “documents-based” and Epic’s “orders-based” workflows.
As a result of the automated notification system that was introduced early in the eConsults implementation process on Allscripts, the specialty response times were much faster than the expected 3 business days’ turnaround goal instituted by the Center for Health Quality and Innovation initiative, regardless of the EHR platform used. In fact, the average turnaround time for an eConsult response across all specialties was 1 business day, which was similar for both EHR systems (Figure 5). Furthermore, more than 50% of the eConsults on both EHR systems received specialist responses within the same day of the eConsult request (63% on Allscripts, 54% on Epic). There was a small decrease in the percentage of same-day responses when we transitioned to Epic, likely because the functionality of an automated notification email could not be restored in Epic. Regardless, the specialty response times on Epic remained expeditious, likely because the automated notifications on Allscripts instilled good practices for the specialists, and regularly checking for new eConsult requests became an ingrained behavior.
Our most important finding was that approximately 80% of eConsult requests were addressed without the need for an in-office visit with a specialist. This measure was similar for both EHR platforms (83% on Allscripts and 78% on Epic).
Provider feedback has been overwhelmingly positive. PCPs are impressed with the robust educational content of the eConsult responses, since the goal for specialists is to justify their recommendations. Specialists appreciate the convenience and efficiency that eConsults offer, as well as the improved communication and collaboration among physicians. eConsults have been especially beneficial to PCPs at UCI’s Family Health Centers, who are now able to receive subspecialty consultations from UCI specialists despite insurance barriers.
Discussion
Our eConsults program uniquely contrasts with other programs because UCI is likely the only academic medical center to have experience in successfully incorporating eConsults into 2 different EHR systems: initial development of the eConsults workflow in UCI’s existing Allscripts EHR platform, and subsequently transitioning a mature eConsults program to a new EHR system when the institution adopted Epic.
We measured the impact of the eConsults program on access to care by the response time for eConsult requests and the percentage of eConsults that averted an in-office visit with a specialist. We found that the eConsults program at UCI provided our PCPs access to specialist consultations in a timely manner, with much shorter response times than standard in-person referrals. The average turnaround time for an eConsult response we reported is consistent with findings from other studies.12-15 Additionally, our program was able to address about 80% of its eConsults electronically, helping to reduce unnecessary in-person specialist referrals. In the literature, the percentage of eConsults that avoided an in-person specialist visit varies widely.8,12-16
We reported very positive feedback from both PCPs and specialists on UCI’s eConsults service. Similarly, other studies described PCP satisfaction with their respective eConsults programs to be uniformly high,8,9,13,14,17-19 though some reported that the level of satisfaction among specialists was more varied.18-21
Lessons Learned
The successful design and implementation of our eConsults program began with assembling the right clinical champions and technology partners for our steering committee. Establishing regular steering committee meetings helped maintain an appropriate timeline for completion of different aspects of the project. Engaging support from UCI’s leadership also provided us with a dedicated IT team that helped us with the build, training resources, troubleshooting issues, and reporting for the project.
Our experience with implementing the eConsults program on 2 different EHR systems highlighted the importance of creating efficient, user-friendly workflows to foster provider adoption and achieve sustainability. Allscripts’ open platform gave our IT team the ability to create a homegrown solution to implementing an eConsult model that was simple and easy to use. The Epic platform’s interoperability allowed us to leverage our learnings from the Allscripts build to efficiently implement eConsults in Epic.
We also found that providing modest incentive payments or reimbursements to both PCPs and specialists for each completed eConsult helps with both adoption and program sustainability. Initially, credit for the eConsult work was paid by internal UCI Health System funds. Two payers, UC Care (a preferred provider organization plan created just for the University of California) and more recently, the Centers for Medicare & Medicaid Services, have agreed to reimburse for outpatient eConsults. Securing additional payers for reimbursement of the eConsult service will not only ensure the program’s long-term sustainability, but also represents an acknowledgment of the value of eConsults in supporting access to care.
Applicability
Other health care settings that are experiencing issues with specialty care access can successfully implement their own eConsults program by employing strategies similar to those described in this report—assembling the right team, creating user-friendly workflows, and providing incentives. Our advice for successful implementation is to clearly communicate your goals to all involved, including primary care, specialists, leadership, and IT partners, and establish with these stakeholders the appropriate support and resources needed to facilitate the development of the program and overcome any barriers to adoption.
Current Status and Future Directions
Our future plans include continuing to optimize the Epic eConsult backend build and workflows using our experience in Allscripts. We have implemented eConsult workflows for use by graduate medical education trainees and advanced practice providers, with attending supervision. Further work is in progress to optimize these workflows, which will allow for appropriate education and supervision without delaying care. Furthermore, we plan to expand the program to include inpatient-to-inpatient and emergency department-to-inpatient eConsults. We will continue to expand the eConsults program by offering additional specialties, engage providers to encourage ongoing participation, and maximize PCP use by continuing to market the program through regular newsletters and email communications. Finally, the eConsults has served as an effective, important resource in the current era of COVID-19 in several ways: it allows for optimization of specialty input in patient care delivery without subjecting more health care workers to unnecessary exposure; saves on utilization of precious personal protective equipment; and enhances our ability to deal with a potential surge by providing access to specialists remotely and electronically all hours of the day, thus expanding care to the evening and weekend hours.
Acknowledgment: The authors thank our steering committee members (Dr. Ralph Cygan, Dr. Andrew Reikes, Dr. Byron Allen, Dr. George Lawry) and IT build team (Lori Bocchicchio, Meghan van Witsen, Jaymee Zillgitt, Tanya Sickles, Dennis Hoang, Jeanette Lisak-Phillips) for their contributions in the design and implementation of our eConsults program. We also thank additional team members Kurt McArthur and Neaktisia Lee for their assistance with generating reports, and Kathy LaPierre, Jennifer Rios, and Debra Webb Torres for their guidance with compliance and billing issues.
Corresponding author: Alpesh N. Amin, MD, MBA, University of California, Irvine, 101 The City Drive South, Building 26, Room 1000, ZC-4076H, Orange, CA 92868; anamin@uci.edu.
Financial disclosures: None.
1. County of Orange, Health Care Agency, Public Health Services. Orange County Health Profile 2013.
2. Coffman JM, Fix M Ko, M. California physician supply and distribution: headed for a drought? California Health Care Foundation, June 2018.
3. Spetz J, Coffman J, Geyn I. California’s primary care workforce: forecasted supply, demand, and pipeline of trainees, 2016-2030. Healthforce Center at the University of California, San Francisco, August 2017.
4. Gandhi TK, Sittig DF, Franklin M, et al. Communication breakdown in the outpatient referral process. J Gen Intern Med. 2000;15:626-631.
5. McPhee SJ, Lo B, Saika GY, Meltzer R. How good is communication between primary care physicians and subspecialty consultants? Arch Intern Med. 1984;144:1265-1268.
6. Mehrotra A, Forrest CB, Lin CY. Dropping the baton: specialty referrals in the United States. Milbank Q. 2011;89:39-68.
7. Wrenn K, Catschegn S, Cruz M, et al. Analysis of an electronic consultation program at an academic medical centre: Primary care provider questions, specialist responses, and primary care provider actions. J Telemed Telecare. 2017;23: 217-224.
8. Gleason N, Prasad PA, Ackerman S, et al. Adoption and impact of an eConsult system in a fee-for-service setting. Healthc (Amst). 2017;5(1-2):40-45.
9. Stoves J, Connolly J, Cheung CK, et al. Electronic consultation as an alternative to hospital referral for patients with chronic kidney disease: a novel application for networked electronic health records to improve the accessibility and efficiency of healthcare. Qual Saf Health Care. 2010;19: e54.
10. Datta SK, Warshaw EM, Edison KE, et al. Cost and utility analysis of a store-and-forward teledermatology referral system: a randomized clinical trial. JAMA Dermatol. 2015;151:1323-1329.
11. Liddy C, Drosinis P, Deri Armstrong C, et al. What are the cost savings associated with providing access to specialist care through the Champlain BASE eConsult service? A costing evaluation. BMJ Open. 2016;6:e010920.
12. Barnett ML, Yee HF Jr, Mehrotra A, Giboney P. Los Angeles safety-net program eConsult system was rapidly adopted and decreased wait times to see specialists. Health Aff. 2017;36:492-499.
13. Malagrino GD, Chaudhry R, Gardner M, et al. A study of 6,000 electronic specialty consultations for person-centered care at The Mayo Clinic. Int J Person Centered Med. 2012;2:458-466.
14. Keely E, Liddy C, Afkham A. Utilization, benefits, and impact of an e-consultation service across diverse specialties and primary care providers. Telemed J E Health. 2013;19:733-738.
15. Scherpbier-de Haan ND, van Gelder VA, Van Weel C, et al. Initial implementation of a web-based consultation process for patients with chronic kidney disease. Ann Fam Med. 2013;11:151-156.
16. Palen TE, Price D, Shetterly S, Wallace KB. Comparing virtual consults to traditional consults using an electronic health record: an observational case-control study. BMC Med Inform Decis Mak. 2012;12:65.
17. Liddy C, Afkham A, Drosinis P, et al. Impact of and satisfaction with a new eConsult service: a mixed methods study of primary care providers. J Am Board Fam Med. 2015;28:394-403.
18. Angstman KB, Adamson SC, Furst JW, et al. Provider satisfaction with virtual specialist consultations in a family medicine department. Health Care Manag (Frederick). 2009;28:14-18.
19. McAdams M, Cannavo L, Orlander JD. A medical specialty e-consult program in a VA health care system. Fed Pract. 2014; 31:26–31.
20. Keely E, Williams R, Epstein G, et al. Specialist perspectives on Ontario Provincial electronic consultation services. Telemed J E Health. 2019;25:3-10.
21. Kim-Hwang JE, Chen AH, Bell DS, et al. Evaluating electronic referrals for specialty care at a public hospital. J Gen Intern Med. 2010;25:1123-1128.
Procalcitonin-Guided Antibiotic Discontinuation: An Antimicrobial Stewardship Initiative to Assist Providers
From Western Michigan University, Homer Stryker MD School of Medicine, Kalamazoo, MI (Dr. Vaillant and Dr. Kavanaugh), Ferris State University, Grand Rapids, MI (Dr. Mersfelder), and Bronson Methodist Hospital, Kalamazoo, MI (Dr. Maynard).
Abstract
- Background: Procalcitonin has emerged as an important marker of sepsis and lung infections of bacterial origin. The role of procalcitonin in guiding antibiotic stewardship in lower respiratory tract infections and sepsis has been extensively studied, and use of this biomarker has been shown to decrease antibiotic usage in clinical trials. We sought to evaluate the impact of a pharmacist-driven initiative regarding discontinuation of antibiotics utilizing procalcitonin levels at a community teaching hospital.
- Methods: We retrospectively gathered baseline data on adult patients admitted to a community teaching hospital who were 18 years of age and older, under the care of an inpatient service, and had a single procalcitonin level < 0.25 mcg/L obtained during admission. We then prospectively identified an intervention group of similar patients using a web-based, real-time clinical surveillance system. When a low procalcitonin level was identified in the intervention group, the participating clinical pharmacists screened for antibiotic use and the indication(s), determined whether the antibiotic could be discontinued based on the low procalcitonin level and the absence of another indication for antibiotics, and, when appropriate, contacted the patient’s health care provider via telephone to discuss possible antibiotic discontinuation. The total antibiotic treatment duration was compared between the baseline and intervention groups.
- Results: A total of 172 patients were included in this study (86 in each group). The duration of antibiotic use was not significantly different between the baseline (3.14 ± 4.04 days) and the intervention (3.34 ± 2.8 days) groups (P = 0.1083). Other patient demographics did not influence antibiotic duration.
- Conclusion: Our study did not demonstrate a difference in total antibiotic treatment duration with the utilization of procalcitonin and an oral communication intervention made by a clinical pharmacist at a community-based teaching hospital. Outside of clinical trials, and in the absence of an algorithmic approach, procalcitonin has not consistently been shown to aid in the diagnosis and treatment of infectious diseases. It is important to have a comprehensive antimicrobial stewardship program to reduce antibiotic use and effectively use laboratory values.
Keywords: antibiotic use; bacterial infection; biomarkers; procalcitonin.
Procalcitonin is the precursor of the hormone calcitonin, which is normally produced in the parafollicular cells of the thyroid gland under physiological conditions.1 However, procalcitonin is also released in response to a proinflammatory stimulus, especially that of bacterial origin.1 The source of the procalcitonin surge seen during proinflammatory states is not the parafollicular cells of the thyroid, but rather the neuroendocrine cells of the lung and intestine.1 Stimulants of procalcitonin in these scenarios include bacterial endotoxin, tumor necrosis factor, and interleukin-6.1,2 Due to these observations, procalcitonin has emerged as an important marker of sepsis and lung infections of bacterial origin.3
The role of procalcitonin in guiding antibiotic stewardship in lower respiratory tract infections and sepsis has been extensively studied.4,5 Various randomized controlled trials have shown that antibiotic stewardship guided by procalcitonin levels resulted in lower rates of antibiotic initiation and shorter duration of antibiotic use.4-6 Similar results were obtained in prospective studies evaluating its role in patients with chronic obstructive pulmonary disease and sepsis.7,8 Based on these data, protocol-driven procalcitonin-guided antibiotic stewardship appears beneficial.
Many of these studies employed rigorous protocols. Studies of procalcitonin use in a so-called real-world setting, in which the provider can order and use procalcitonin levels without the use of protocols, are limited. The objective of our study was to evaluate the impact of a pharmacist-driven initiative on discontinuing antibiotics, if indicated, utilizing single procalcitonin measurement results of < 0.25 mcg/L at a community teaching hospital.
Methods
Our study utilized a 2-phase approach. The first phase was a retrospective chart review to establish baseline data regarding adult inpatients with a low procalcitonin level; these patients were randomly selected over a 1-year period (2017). Patients were included if they were 18 years of age or older, under the care of an inpatient service, and had a single procalcitonin level < 0.25 mcg/L obtained during their admission. Patients admitted to the intensive care unit were excluded. In the second phase, we prospectively identified similar patients admitted between January and March 2018 using a web-based, real-time clinical surveillance system. When patients with low procalcitonin levels were identified, 2 participating clinical pharmacists screened for antibiotic use and indication. If it was determined that the antibiotic could be discontinued as a result of the low procalcitonin level and no additional indication for antibiotics was present, the pharmacist contacted the patient’s health care provider via telephone to discuss possible antibiotic discontinuation. Data collected before and after the intervention included total antibiotic treatment duration, white blood cell count, maximum temperature, age, and procalcitonin level.
A sample size of 86 was calculated to provide an alpha of 0.05 and a power of 0.8. A nonparametric Wilcoxon 2-sample test was used to test for a difference in duration of antibiotic treatment between the baseline and intervention groups. A nonparametric test was used due to right-skewed data. All patients were included in the group analysis, regardless of antibiotic use, as the procalcitonin level may have been used in the decision to initiate antibiotics, and this is more representative of a real-world application of the test. This allowed for detection of a significant decrease of 2 days in antibiotic duration post intervention, with a 10% margin to compensate for potential missing data. Data from 86 patients obtained prior to the pharmacist intervention acted as a control comparison group. Statistical analysis was performed using SAS 9.4.
Results
A total of 172 patients were included in this study: 86 patients prior to the intervention, and 86 after implementation. Baseline demographics, laboratory values, vitals, and principal diagnoses for both groups are shown in Table 1 and Table 2. The most common indications for procalcitonin measurement were pneumonia (45.9%), chronic obstructive pulmonary disease (15.7%), and sepsis (14.5%). The remaining diagnoses were encephalopathy, fever and leukocytosis, skin and soft tissue infection, urinary tract infection or pyelonephritis, bone and joint infection, meningitis, intra-abdominal infection, and asthma exacerbation.

Antibiotic therapy was initiated in 68% of the patients overall, 59% in the baseline group and 76% in the intervention group. The duration of antibiotic use was not significantly different between the baseline (3.14 ± 4.04 days) and intervention (3.34 ± 2.8 days) groups (P = 0.1083). Furthermore, antibiotic treatment duration did not vary significantly with patient age, white blood cell count, maximum temperature, or procalcitonin level in either group. Although there was no difference in total antibiotic treatment duration, a post-hoc analysis revealed a 0.6-day decrease in the interval between the date of procalcitonin measurement and the stop date of antibiotics in the intervention group. The average time from admission to obtaining a procalcitonin level was 3 days in the baseline group and 2 days in the intervention group.

Discussion
Our study did not demonstrate a difference in total antibiotic treatment duration with procalcitonin measurement and an oral communication intervention made by a clinical pharmacist at a community teaching hospital with a well-established antimicrobial stewardship program. This may be due to several factors. First, the providers did not receive ongoing education regarding the appropriate use or interpretation of procalcitonin. The procalcitonin result in the electronic health record references the risk for progression to severe sepsis and/or septic shock, but does not indicate how to use procalcitonin as an aid in antibiotic decision-making. However, a recent study in patients with lower respiratory tract infections treated by providers who had been educated on the use of procalcitonin failed to find a reduction in total antibiotic use.9 Second, our study included hospital-wide use of procalcitonin, and was not limited to infections for which procalcitonin use has the strongest evidence (eg, upper respiratory tract infections, pneumonia, sepsis). Thus, providers may have been less likely to use protocolized guidelines. Last, we did not limit the data on antibiotic duration to patients with a procalcitonin level obtained within a defined time frame from antibiotic initiation or time of admission, and some patients had procalcitonin levels measured several days into their hospital stay. While this is likely to have skewed the data in favor of longer antibiotic treatment courses, it also represents a more realistic way in which this laboratory test is being used. Our post-hoc finding of earlier discontinuation of antibiotics after procalcitonin measurement suggests that our intervention may have influenced the decision to discontinue antibiotics. Such an effect may be augmented if procalcitonin is measured earlier in a hospital admission.
Previous studies have also failed to show that the use of procalcitonin decreased duration of antibiotics.9,10 In the aforementioned study regarding real-world outcomes in patients with lower respiratory tract infections, antibiotic duration was not reduced, despite provider education.9 A large observational study that evaluated real-world outcomes in intensive care unit patients did not find decreased antibiotic use or improved outcomes with procalcitonin use.10 With these large studies evaluating the 2 most common infectious diseases for which procalcitonin has previously been found to have clinical benefit, it is important for institutions to re-evaluate how procalcitonin is being utilized by providers. Furthermore, institutions should explore ways to optimize procalcitonin use and decrease unnecessary health care costs. Notably, the current community-acquired pneumonia guidelines recommend against routine use of procalcitonin.11
Conclusion
Outside of clinical trials, and in the absence of an algorithmic approach, procalcitonin has not consistently been shown to aid in the diagnosis or treatment of infectious diseases. It is important to have a comprehensive antimicrobial stewardship program that includes an algorithmic protocol to promote appropriate laboratory testing and reduce total antibiotic use. In addition to improved communication with providers, other interventions need to be investigated to effectively use this biomarker or limit its use.
Acknowledgment: The authors thank the Western Michigan University Department of Epidemiology and Biostatistics for their assistance in preparing this article.
Corresponding author: James Vaillant, MD, Western Michigan University, Homer Stryker MD School of Medicine, 1000 Oakland Drive, Kalamazoo, MI, 49008; james.vaillant@med.wmich.edu.
Financial disclosures: None.
1. Maruna P, Nedelníková K, Gürlich R. Physiology and genetics of procalcitonin. Physiol Res. 2000;(49 suppl 1):S57-S61.
2. Becker KL, Snider R, Nylen ES. Procalcitonin in sepsis and systemic inflammation: a harmful biomarker and a therapeutic target. Br J Pharmacol. 2010;159:253-264.
3. Vijayan AL, Vanimaya RS, Saikant R, et al. Procalcitonin: a promising diagnostic marker for sepsis and antibiotic therapy. J Intensive Care. 2017;5:51.
4. Hey J, Thompson-Leduc P, Kirson NY, et al. Procalcitonin guidance in patients with lower respiratory tract infections: A systematic review and meta-analysis. Clin Chem Lab Med. 2018;56:1200-1209.
5. Schuetz P, Wirz Y, Sager R, et al. Procalcitonin to initiate or discontinue antibiotics in acute respiratory tract infections. Cochrane Database Syst Rev. 2017;10:CD007498.
6. Huang HB, Peng JM, Weng L, et al. Procalcitonin-guided antibiotic therapy in intensive care unit patients: a systematic review and meta-analysis. Ann Intensive Care. 2017;7:114.
7. Stolz D, Christ-Crain M, Bingisser R, et al. Antibiotic treatment of exacerbations of COPD: a randomized, controlled trial comparing procalcitonin-guidance with standard therapy. Chest. 2007;131:9-19.
8. Prkno A, Wacker C, Brunkhorst FM, Schlattmann P. Procalcitonin-guided therapy in intensive care unit patients with severe sepsis and septic shock—a systematic review and meta-analysis. Crit Care. 2013;17:R291.
9. Huang DT, Yealy DM, Filbin MR, et al. Procalcitonin-guided use of antibiotics for lower respiratory tract infections. N Engl J Med. 2018;379:236-249.
10. Chu DC, Mehta AB, Walkey AJ. Practice patterns and outcomes associated with procalcitonin use in critically ill patients with sepsis. Clin Infect Dis. 2017;64:1509-1515.
11. Metlay JP, Waterer GW, Long AC, et al. Diagnosis and treatment of adults with community-acquired pneumonia. An official clinical practice guideline of the American Thoracic Society and Infectious Diseases Society of America. Am J Respir Crit Care Med. 2019;200:e45-e67.
From Western Michigan University, Homer Stryker MD School of Medicine, Kalamazoo, MI (Dr. Vaillant and Dr. Kavanaugh), Ferris State University, Grand Rapids, MI (Dr. Mersfelder), and Bronson Methodist Hospital, Kalamazoo, MI (Dr. Maynard).
Abstract
- Background: Procalcitonin has emerged as an important marker of sepsis and lung infections of bacterial origin. The role of procalcitonin in guiding antibiotic stewardship in lower respiratory tract infections and sepsis has been extensively studied, and use of this biomarker has been shown to decrease antibiotic usage in clinical trials. We sought to evaluate the impact of a pharmacist-driven initiative regarding discontinuation of antibiotics utilizing procalcitonin levels at a community teaching hospital.
- Methods: We retrospectively gathered baseline data on adult patients admitted to a community teaching hospital who were 18 years of age and older, under the care of an inpatient service, and had a single procalcitonin level < 0.25 mcg/L obtained during admission. We then prospectively identified an intervention group of similar patients using a web-based, real-time clinical surveillance system. When a low procalcitonin level was identified in the intervention group, the participating clinical pharmacists screened for antibiotic use and the indication(s), determined whether the antibiotic could be discontinued based on the low procalcitonin level and the absence of another indication for antibiotics, and, when appropriate, contacted the patient’s health care provider via telephone to discuss possible antibiotic discontinuation. The total antibiotic treatment duration was compared between the baseline and intervention groups.
- Results: A total of 172 patients were included in this study (86 in each group). The duration of antibiotic use was not significantly different between the baseline (3.14 ± 4.04 days) and the intervention (3.34 ± 2.8 days) groups (P = 0.1083). Other patient demographics did not influence antibiotic duration.
- Conclusion: Our study did not demonstrate a difference in total antibiotic treatment duration with the utilization of procalcitonin and an oral communication intervention made by a clinical pharmacist at a community-based teaching hospital. Outside of clinical trials, and in the absence of an algorithmic approach, procalcitonin has not consistently been shown to aid in the diagnosis and treatment of infectious diseases. It is important to have a comprehensive antimicrobial stewardship program to reduce antibiotic use and effectively use laboratory values.
Keywords: antibiotic use; bacterial infection; biomarkers; procalcitonin.
Procalcitonin is the precursor of the hormone calcitonin, which is normally produced in the parafollicular cells of the thyroid gland under physiological conditions.1 However, procalcitonin is also released in response to a proinflammatory stimulus, especially that of bacterial origin.1 The source of the procalcitonin surge seen during proinflammatory states is not the parafollicular cells of the thyroid, but rather the neuroendocrine cells of the lung and intestine.1 Stimulants of procalcitonin in these scenarios include bacterial endotoxin, tumor necrosis factor, and interleukin-6.1,2 Due to these observations, procalcitonin has emerged as an important marker of sepsis and lung infections of bacterial origin.3
The role of procalcitonin in guiding antibiotic stewardship in lower respiratory tract infections and sepsis has been extensively studied.4,5 Various randomized controlled trials have shown that antibiotic stewardship guided by procalcitonin levels resulted in lower rates of antibiotic initiation and shorter duration of antibiotic use.4-6 Similar results were obtained in prospective studies evaluating its role in patients with chronic obstructive pulmonary disease and sepsis.7,8 Based on these data, protocol-driven procalcitonin-guided antibiotic stewardship appears beneficial.
Many of these studies employed rigorous protocols. Studies of procalcitonin use in a so-called real-world setting, in which the provider can order and use procalcitonin levels without the use of protocols, are limited. The objective of our study was to evaluate the impact of a pharmacist-driven initiative on discontinuing antibiotics, if indicated, utilizing single procalcitonin measurement results of < 0.25 mcg/L at a community teaching hospital.
Methods
Our study utilized a 2-phase approach. The first phase was a retrospective chart review to establish baseline data regarding adult inpatients with a low procalcitonin level; these patients were randomly selected over a 1-year period (2017). Patients were included if they were 18 years of age or older, under the care of an inpatient service, and had a single procalcitonin level < 0.25 mcg/L obtained during their admission. Patients admitted to the intensive care unit were excluded. In the second phase, we prospectively identified similar patients admitted between January and March 2018 using a web-based, real-time clinical surveillance system. When patients with low procalcitonin levels were identified, 2 participating clinical pharmacists screened for antibiotic use and indication. If it was determined that the antibiotic could be discontinued as a result of the low procalcitonin level and no additional indication for antibiotics was present, the pharmacist contacted the patient’s health care provider via telephone to discuss possible antibiotic discontinuation. Data collected before and after the intervention included total antibiotic treatment duration, white blood cell count, maximum temperature, age, and procalcitonin level.
A sample size of 86 was calculated to provide an alpha of 0.05 and a power of 0.8. A nonparametric Wilcoxon 2-sample test was used to test for a difference in duration of antibiotic treatment between the baseline and intervention groups. A nonparametric test was used due to right-skewed data. All patients were included in the group analysis, regardless of antibiotic use, as the procalcitonin level may have been used in the decision to initiate antibiotics, and this is more representative of a real-world application of the test. This allowed for detection of a significant decrease of 2 days in antibiotic duration post intervention, with a 10% margin to compensate for potential missing data. Data from 86 patients obtained prior to the pharmacist intervention acted as a control comparison group. Statistical analysis was performed using SAS 9.4.
Results
A total of 172 patients were included in this study: 86 patients prior to the intervention, and 86 after implementation. Baseline demographics, laboratory values, vitals, and principal diagnoses for both groups are shown in Table 1 and Table 2. The most common indications for procalcitonin measurement were pneumonia (45.9%), chronic obstructive pulmonary disease (15.7%), and sepsis (14.5%). The remaining diagnoses were encephalopathy, fever and leukocytosis, skin and soft tissue infection, urinary tract infection or pyelonephritis, bone and joint infection, meningitis, intra-abdominal infection, and asthma exacerbation.
Antibiotic therapy was initiated in 68% of the patients overall, 59% in the baseline group and 76% in the intervention group. The duration of antibiotic use was not significantly different between the baseline (3.14 ± 4.04 days) and intervention (3.34 ± 2.8 days) groups (P = 0.1083). Furthermore, antibiotic treatment duration did not vary significantly with patient age, white blood cell count, maximum temperature, or procalcitonin level in either group. Although there was no difference in total antibiotic treatment duration, a post-hoc analysis revealed a 0.6-day decrease in the interval between the date of procalcitonin measurement and the stop date of antibiotics in the intervention group. The average time from admission to obtaining a procalcitonin level was 3 days in the baseline group and 2 days in the intervention group.
Discussion
Our study did not demonstrate a difference in total antibiotic treatment duration with procalcitonin measurement and an oral communication intervention made by a clinical pharmacist at a community teaching hospital with a well-established antimicrobial stewardship program. This may be due to several factors. First, the providers did not receive ongoing education regarding the appropriate use or interpretation of procalcitonin. The procalcitonin result in the electronic health record references the risk for progression to severe sepsis and/or septic shock, but does not indicate how to use procalcitonin as an aid in antibiotic decision-making. However, a recent study in patients with lower respiratory tract infections treated by providers who had been educated on the use of procalcitonin failed to find a reduction in total antibiotic use.9 Second, our study included hospital-wide use of procalcitonin, and was not limited to infections for which procalcitonin use has the strongest evidence (eg, upper respiratory tract infections, pneumonia, sepsis). Thus, providers may have been less likely to use protocolized guidelines. Last, we did not limit the data on antibiotic duration to patients with a procalcitonin level obtained within a defined time frame from antibiotic initiation or time of admission, and some patients had procalcitonin levels measured several days into their hospital stay. While this is likely to have skewed the data in favor of longer antibiotic treatment courses, it also represents a more realistic way in which this laboratory test is being used. Our post-hoc finding of earlier discontinuation of antibiotics after procalcitonin measurement suggests that our intervention may have influenced the decision to discontinue antibiotics. Such an effect may be augmented if procalcitonin is measured earlier in a hospital admission.
Previous studies have also failed to show that the use of procalcitonin decreased duration of antibiotics.9,10 In the aforementioned study regarding real-world outcomes in patients with lower respiratory tract infections, antibiotic duration was not reduced, despite provider education.9 A large observational study that evaluated real-world outcomes in intensive care unit patients did not find decreased antibiotic use or improved outcomes with procalcitonin use.10 With these large studies evaluating the 2 most common infectious diseases for which procalcitonin has previously been found to have clinical benefit, it is important for institutions to re-evaluate how procalcitonin is being utilized by providers. Furthermore, institutions should explore ways to optimize procalcitonin use and decrease unnecessary health care costs. Notably, the current community-acquired pneumonia guidelines recommend against routine use of procalcitonin.11
Conclusion
Outside of clinical trials, and in the absence of an algorithmic approach, procalcitonin has not consistently been shown to aid in the diagnosis or treatment of infectious diseases. It is important to have a comprehensive antimicrobial stewardship program that includes an algorithmic protocol to promote appropriate laboratory testing and reduce total antibiotic use. In addition to improved communication with providers, other interventions need to be investigated to effectively use this biomarker or limit its use.
Acknowledgment: The authors thank the Western Michigan University Department of Epidemiology and Biostatistics for their assistance in preparing this article.
Corresponding author: James Vaillant, MD, Western Michigan University, Homer Stryker MD School of Medicine, 1000 Oakland Drive, Kalamazoo, MI, 49008; james.vaillant@med.wmich.edu.
Financial disclosures: None.
1. Maruna P, Nedelníková K, Gürlich R. Physiology and genetics of procalcitonin. Physiol Res. 2000;(49 suppl 1):S57-S61.
2. Becker KL, Snider R, Nylen ES. Procalcitonin in sepsis and systemic inflammation: a harmful biomarker and a therapeutic target. Br J Pharmacol. 2010;159:253-264.
3. Vijayan AL, Vanimaya RS, Saikant R, et al. Procalcitonin: a promising diagnostic marker for sepsis and antibiotic therapy. J Intensive Care. 2017;5:51.
4. Hey J, Thompson-Leduc P, Kirson NY, et al. Procalcitonin guidance in patients with lower respiratory tract infections: A systematic review and meta-analysis. Clin Chem Lab Med. 2018;56:1200-1209.
5. Schuetz P, Wirz Y, Sager R, et al. Procalcitonin to initiate or discontinue antibiotics in acute respiratory tract infections. Cochrane Database Syst Rev. 2017;10:CD007498.
6. Huang HB, Peng JM, Weng L, et al. Procalcitonin-guided antibiotic therapy in intensive care unit patients: a systematic review and meta-analysis. Ann Intensive Care. 2017;7:114.
7. Stolz D, Christ-Crain M, Bingisser R, et al. Antibiotic treatment of exacerbations of COPD: a randomized, controlled trial comparing procalcitonin-guidance with standard therapy. Chest. 2007;131:9-19.
8. Prkno A, Wacker C, Brunkhorst FM, Schlattmann P. Procalcitonin-guided therapy in intensive care unit patients with severe sepsis and septic shock—a systematic review and meta-analysis. Crit Care. 2013;17:R291.
9. Huang DT, Yealy DM, Filbin MR, et al. Procalcitonin-guided use of antibiotics for lower respiratory tract infections. N Engl J Med. 2018;379:236-249.
10. Chu DC, Mehta AB, Walkey AJ. Practice patterns and outcomes associated with procalcitonin use in critically ill patients with sepsis. Clin Infect Dis. 2017;64:1509-1515.
11. Metlay JP, Waterer GW, Long AC, et al. Diagnosis and treatment of adults with community-acquired pneumonia. An official clinical practice guideline of the American Thoracic Society and Infectious Diseases Society of America. Am J Respir Crit Care Med. 2019;200:e45-e67.
Timing of Surgery in Patients With Asymptomatic Severe Aortic Stenosis
Study Overview
Objective. To determine the timing of surgical intervention in asymptomatic patients with severe aortic stenosis.
Design. Open-label, multicenter, randomized controlled study.
Setting and participants. A total of 145 asymptomatic patients with very severe aortic stenosis were randomly assigned to early surgery or conservative care.
Main outcome measures. The primary endpoint was a composite of operative mortality or death from a cardiovascular cause during follow-up. The major secondary endpoint was death from any cause during follow-up.
Main results. The primary endpoint occurred in 1 of 73 patients (1%) in the early surgery group and 11 of 72 patients (15%) in the conservative care group (hazard ratio [HR], 0.09; 95% confidence interval [CI], 0.01-0.67, P = 0.003). The secondary endpoint occurred in 7% of patients in the early surgery group and 21% of patients in the conservative care group (HR, 0.33; 95% CI, 0.12-0.90).
Conclusion. Among asymptomatic patients with very severe aortic stenosis, the incidence of the composite of operative mortality or death from cardiovascular causes during follow-up was significantly lower among those who underwent early valve replacement surgery compared to those who received conservative care.
Commentary
Aortic stenosis is a progressive disease that can lead to angina, heart failure, and death.1A higher mortality rate is reported in patients with symptomatic aortic stenosis, as compared to patients with asymptomatic disease, and current guidelines require symptoms to be present in order to proceed with aortic valve replacement.2 Management of asymptomatic patients is often determined by the treating physician, with treatment decisions based on multiple factors, such as left ventricular function, stress test results, and the local level of expertise for surgery.2
In this context, the RECOVERY investigators report the findings of their well-designed randomized controlled study assessing patients with asymptomatic severe aortic stenosis, which was defined as aortic valve area ≤ 0.75 cm2 and either transvalvular velocity > 4.5 m/s or a mean gradient ≥ 50 mm Hg. Compared to patients who received conservative care, patients who underwent early valve surgery had a significantly lower rate of a composite of operative mortality or death from any cardiovascular causes during follow-up. Notably, the number needed to treat to prevent 1 death from cardiovascular causes within 4 years was 20.
The strengths of this trial include complete long-term follow-up (> 4 years) and low cross-over rates. Furthermore, as the study targeted a previously understudied population, there were a number of interesting observations, in addition to the primary endpoint. First, the risk of sudden death was high in patients who received conservative care, 4% at 4 years and 14% at 8 years, a finding contrary to the common belief that asymptomatic patients are at lower risk of sudden cardiac death. Second, 74% of patients assigned to initial conservative care required aortic valve replacement during the follow-up period. Furthermore, when the patients assigned to conservative care required surgery, it was often performed emergently (17%), which could have contributed to the higher mortality in this group of patients. Finally, hospitalization for heart failure was more common in patients randomized to conservative care compared to patients with early surgery. These findings will help physicians conduct detailed, informed discussions with their patients regarding the risks/benefits of early surgery versus conservative management.
There are a few limitations of the RECOVERY trial to consider. First, this study investigated the effect of surgical aortic valve replacement; whether its findings can be extended to transcatheter aortic valve replacement (TAVR) requires further investigation. Patients who were enrolled in this study were younger and had fewer comorbidities than typical patients referred for TAVR. Second, all patients included in this study had the most severe form of aortic stenosis (valve area ≤ 0.75 cm2 with either a peak velocity of ≥ 4.5 m/s or mean gradient ≥ 50 mm Hg). Finally, the study was performed in highly experienced centers, as evidenced by a very low (0%) mortality rate after aortic valve replacement. Therefore, the finding may not be applicable to centers that have less experience with aortic valve replacement surgery.
Applications for Clinical Practice
The findings of the RECOVERY trial strongly suggest a mortality benefit of early surgery compared to conservative management in patients with asymptomatic severe aortic stenosis.
–Taishi Hirai, MD
1. Otto CM, Prendergast B. Aortic-valve stenosis--from patients at risk to severe valve obstruction. N Engl J Med. 2014;371:744-756.
2. Nishimura RA, Otto CM, Bonow RO, et al. 2017 AHA/ACC focused update of the 2014 AHA/ACC guideline for the management of patients with valvular heart disease: a report of the American College of Cardiology/American Heart Association Task Force on Clinical Practice Guidelines. Circulation. 2017;135:e1159-e1195.
Study Overview
Objective. To determine the timing of surgical intervention in asymptomatic patients with severe aortic stenosis.
Design. Open-label, multicenter, randomized controlled study.
Setting and participants. A total of 145 asymptomatic patients with very severe aortic stenosis were randomly assigned to early surgery or conservative care.
Main outcome measures. The primary endpoint was a composite of operative mortality or death from a cardiovascular cause during follow-up. The major secondary endpoint was death from any cause during follow-up.
Main results. The primary endpoint occurred in 1 of 73 patients (1%) in the early surgery group and 11 of 72 patients (15%) in the conservative care group (hazard ratio [HR], 0.09; 95% confidence interval [CI], 0.01-0.67, P = 0.003). The secondary endpoint occurred in 7% of patients in the early surgery group and 21% of patients in the conservative care group (HR, 0.33; 95% CI, 0.12-0.90).
Conclusion. Among asymptomatic patients with very severe aortic stenosis, the incidence of the composite of operative mortality or death from cardiovascular causes during follow-up was significantly lower among those who underwent early valve replacement surgery compared to those who received conservative care.
Commentary
Aortic stenosis is a progressive disease that can lead to angina, heart failure, and death.1A higher mortality rate is reported in patients with symptomatic aortic stenosis, as compared to patients with asymptomatic disease, and current guidelines require symptoms to be present in order to proceed with aortic valve replacement.2 Management of asymptomatic patients is often determined by the treating physician, with treatment decisions based on multiple factors, such as left ventricular function, stress test results, and the local level of expertise for surgery.2
In this context, the RECOVERY investigators report the findings of their well-designed randomized controlled study assessing patients with asymptomatic severe aortic stenosis, which was defined as aortic valve area ≤ 0.75 cm2 and either transvalvular velocity > 4.5 m/s or a mean gradient ≥ 50 mm Hg. Compared to patients who received conservative care, patients who underwent early valve surgery had a significantly lower rate of a composite of operative mortality or death from any cardiovascular causes during follow-up. Notably, the number needed to treat to prevent 1 death from cardiovascular causes within 4 years was 20.
The strengths of this trial include complete long-term follow-up (> 4 years) and low cross-over rates. Furthermore, as the study targeted a previously understudied population, there were a number of interesting observations, in addition to the primary endpoint. First, the risk of sudden death was high in patients who received conservative care, 4% at 4 years and 14% at 8 years, a finding contrary to the common belief that asymptomatic patients are at lower risk of sudden cardiac death. Second, 74% of patients assigned to initial conservative care required aortic valve replacement during the follow-up period. Furthermore, when the patients assigned to conservative care required surgery, it was often performed emergently (17%), which could have contributed to the higher mortality in this group of patients. Finally, hospitalization for heart failure was more common in patients randomized to conservative care compared to patients with early surgery. These findings will help physicians conduct detailed, informed discussions with their patients regarding the risks/benefits of early surgery versus conservative management.
There are a few limitations of the RECOVERY trial to consider. First, this study investigated the effect of surgical aortic valve replacement; whether its findings can be extended to transcatheter aortic valve replacement (TAVR) requires further investigation. Patients who were enrolled in this study were younger and had fewer comorbidities than typical patients referred for TAVR. Second, all patients included in this study had the most severe form of aortic stenosis (valve area ≤ 0.75 cm2 with either a peak velocity of ≥ 4.5 m/s or mean gradient ≥ 50 mm Hg). Finally, the study was performed in highly experienced centers, as evidenced by a very low (0%) mortality rate after aortic valve replacement. Therefore, the finding may not be applicable to centers that have less experience with aortic valve replacement surgery.
Applications for Clinical Practice
The findings of the RECOVERY trial strongly suggest a mortality benefit of early surgery compared to conservative management in patients with asymptomatic severe aortic stenosis.
–Taishi Hirai, MD
1. Otto CM, Prendergast B. Aortic-valve stenosis--from patients at risk to severe valve obstruction. N Engl J Med. 2014;371:744-756.
2. Nishimura RA, Otto CM, Bonow RO, et al. 2017 AHA/ACC focused update of the 2014 AHA/ACC guideline for the management of patients with valvular heart disease: a report of the American College of Cardiology/American Heart Association Task Force on Clinical Practice Guidelines. Circulation. 2017;135:e1159-e1195.
How Does Telemedicine Compare to Conventional Follow-Up After General Surgery?
Study Overview
Objective. To compare the impact of conventional versus telemedicine follow-up of general surgery patients in outpatient clinics.
Design. Prospective randomized clinical trial.
Setting and participants. Participants were recruited from Hospital Germans Trias i Pujol, a tertiary care university hospital located in the outskirts of Barcelona (Catalonia, Spain). To be included in this study, participants had to have been treated in the general surgery department, have basic computer knowledge (ability to use e-mail or a social network), have a computer with webcam, and be 18 to 75 years of age, or they had to have a partner who met these criteria. Exclusion criteria included any disability making telemedicine follow-up impossible (eg, blindness, deafness, or mental disability; proctologic treatment; difficulty describing and/or showing complications in the surgical area; and clinical complications before discharge more severe than Clavien Dindo II), as well as withdrawal of consent. Patients who met the criteria and had just been discharged from the hospital were offered the opportunity to enroll by the surgeon in charge. Patients who agreed to participate provided informed consent and were assigned using a computerized block randomization list (allocation ratio 1:1).
Intervention. Time to visit was generally between 2 and 4 weeks after discharge (the interval to the follow-up visit was determined at the discretion of the treating surgeon, but always followed the usual schedule). To conduct the telemedicine follow-up through a video call, a medical cloud-based program fulfilling all European Union security and privacy policies was used. Four surgeons were assigned to perform the telemedicine visits and were trained on how to use the program before the study started. Visit format was the same in both groups: clinical and wound condition were assessed and pathology was discussed (the one difference was that physical exploration was not performed in the telemedicine group).
Main outcome measures. The primary outcome was the feasibility of telemedicine follow-up, and this was measured as the percentage of participants who completed follow-up in their corresponding group by the date scheduled at hospital discharge. Secondary outcomes included a comparison of clinical results and patient satisfaction. To assess the clinical results, extra visits to an outpatient clinic and/or the emergency department during the first 30 days after the follow-up visit were collected.
To evaluate patient satisfaction, a questionnaire was sent via email to the participants after the visit and, if they did not respond, a telephone survey was carried out (if there was no contact after 2 telephone calls, the participants was considered a missing value). The questionnaire was informed by the United Kingdom National Health Service outpatients questionnaire and the Telehealth Usability Questionnaire. It included 27 general questions asked of participants in both groups, plus 8 specific questions for participants in the conventional follow-up group and 14 specific questions for participants in the telemedicine group. To summarize all the included fields in the questionnaires (time to visit and visit length, comfort, tests and procedures performed before and during the visit, transport, waiting time, privacy, dealings with staff, platform usability, telemedicine, and satisfaction), participants were asked to provide a global satisfaction score on a scale from 1 to 5.
Analysis. To compare the groups in terms of proportion of outcomes, a chi-square test was used to analyze categorical variables. To compare medians between the groups, ordinal variables were analyzed using the Mann-Whitney U test. Statistical significance was set at P < 0.05.
Main results. Two-hundred patients were randomly allocated to 1 of the 2 groups, with 100 patients in each group. The groups did not differ significantly based on age (P = 0.836), gender (P = 0.393), or American Society of Anesthesiologists (ASA) score (P = 0.232). Time to visit did not differ significantly between the groups (P = 0.169), and while visits were generally shorter in the telemedicine group, the difference was not significant (P = 0.153). Diagnoses and treatments did not differ significantly between the groups (P = 0.853 and P = 0.461, respectively).
The primary outcome (follow-up feasibility) was achieved in 90% of the conventional follow-up group and in 74% of the telemedicine group (P = 0.003). Of the 10 patients in the conventional follow-up group who did not complete the follow-up, 8 did not attend the visit on the scheduled day and 2 were hospitalized for reasons not related to the study. In the telemedicine group, the 2 main reasons for failure to follow-up were technical difficulties (n = 10) and requests by patients to attend a conventional visit after being allocated to the telemedicine group (n = 10). Among the remaining 6 patients in the telemedicine group who did not attend a visit, 3 visited the outpatient clinic because of a known surgical wound infection before the visit, 2 did not respond to the video call and could not be contacted by other means, and 1 had other face-to-face visits scheduled in different departments of the hospital the same day as the telemedicine appointment.
There were no statistically significant differences in the clinical results of the 164 patients meeting the primary endpoint (P = 0.832). Twelve of the 90 (13.3%) patients in the conventional group attended extra visits after the follow-up, while 9 of the 74 patients (12.1%) in the telemedicine group (P = 0.823) attended extra visits after follow-up. The median global patient satisfaction score was 5 in both the conventional group (range, 2-5) and the telemedicine group (range, 1-5), with no statistically significant differences (P = 0.099). When patients in the telemedicine group were asked if they would accept the use of telemedicine as part of their medical treatment on an ongoing basis, they rated the proposition with a median score of 5 (range, 1-5).
Conclusion. Telemedicine is a feasible and acceptable complementary service to facilitate postoperative management in selected general surgery patients. This option produces good satisfaction rates and maintains clinical outcomes.
Commentary
In recent years, telemedicine has gained increased popularity in both medicine and surgery, affording surgeons greater opportunities for patient care, mentoring, collaboration, and teaching, without the limits of geographic boundaries. Telemedicine can be broadly described as a health care service utilizing telecommunication technologies for the purpose of communicating with and diagnosing and treating patients remotely.1-4 To date, literature on telemedicine in surgical care has been limited.
In their systematic review, published in 2018, Asiri et al identified 24 studies published between 1998 and 2018, which included 3 randomized controlled trials, 3 pilot studies, 4 retrospective studies, and 14 prospective observational studies. In these studies, telemedicine protocols were used for preoperative assessment, diagnostic purposes, or consultation with another surgical department (10 studies); postoperative wound assessment (9 studies); and follow-up in place of conventional clinic visits (5 studies).3 In a 2017 systematic review of telemedicine for post-discharge surgical care, Gunter et al identified 21 studies, which included 3 randomized controlled trials, 6 pilot or feasibility studies, 4 retrospective record reviews, 2 case series, and 6 surveys.4 In these studies, telemedicine protocols were used for scheduled follow-up (10 studies), routine and ongoing monitoring (5 studies), or management of issues that arose after surgery (2 studies). These 2 reviews found telemedicine to be feasible, useful, and acceptable for postoperative evaluation and follow-up among both providers and patients.
Additional benefits noted in these studies included savings in patient travel, time, and cost. Perspectives on savings to the health system were mixed—while clinic time slots may open as a result of follow-up visits being done via telemedicine (resulting in potential improvements in access to surgical services and decreased wait times), there are still significant direct costs for purchasing necessary equipment and for educating and training providers on the use of the equipment. Other published reviews have discussed in greater detail the application, benefits, limitations, and barriers to telemedicine and provided insight from the perspectives of patients, providers, and health care systems.1,2
Because studies on the use of telemedicine are limited, particularly in general surgery, and few of these studies have used a randomized clinical trial design, the present study is an important contribution to the literature. The authors found a significant difference between groups in terms of percentage of completed follow-up visits—90% of conventional follow-up group participants completed their visit versus 74% of telemedicine group participants. However, these differences were primarily attributed to technical difficulties experienced by telemedicine group participants, as well requests to have a conventional follow-up visit. In addition, telemedicine capabilities were limited to video calls via computers and webcams, and it is likely that successful completion of the follow-up visit would have been higher in the telemedicine group had the use of video calls via tablets or smartphones been an option. Perhaps more important, no significant differences were found in clinical outcomes (extra visits within 30 days after the follow-up visit) or patient satisfaction.
A key strength of this study is the use of a randomized clinical trial design to evaluate telemedicine as an alternative method for conducting patient visits following general surgery. Inclusion and exclusion criteria did not impose strict limitations on potential participants. Also, the authors evaluated differences in time to visit, length of visit, clinical results, and patient satisfaction between groups, in addition to the primary measure of completion of the follow-up visit.
This study has important limitations that should be noted as well, particularly related to the study design, some of which are acknowledged by the authors. Because this study was implemented in only 1 hospital, specifically, a tertiary care university hospital on the outskirts of an urban European city, the generalizability of the findings is limited. Also, the likelihood of selection bias is high, as enrollment was not offered to all patients who were discharged from the hospital and met inclusion criteria (limited by patient workload). The comparison of clinical results was limited, as the selected measure focused only on extra visits to an outpatient clinic and/or the emergency department during the first 30 days after the follow-up visit. This chosen measure does not account for less severe clinical results that did not require an additional visit, and does not represent a nuanced comparison of specific clinical indicators. In addition, this measure does not account for clinical complications that may have occurred beyond the 30-day period. Recall bias also was likely, given that the patient satisfaction questionnaire was delivered via email to patients at a later time after the follow-up visit, instead of being administered immediately after the visit. Last, group differences at baseline were assessed based only on age, gender, and ASA score, which does not preclude potential differences related to other factors, such as race/ethnicity, household income, comorbidities, insurance, and zip code. Future research with a similar objective would benefit from a randomized clinical trial design that recruits a wider diversity of patients across different clinic settings and incorporates more nuanced measures of primary and secondary outcomes.
Applications for Clinical Practice
With the ongoing COVID-19 pandemic, the integration of telemedicine capabilities into hospital systems is becoming more widespread and is proceeding at an accelerated pace. This study provides evidence that telemedicine is a feasible and acceptable complementary service to facilitate postoperative management in selected general surgery patients. Assuming that the needed technology and appropriate program training are available, telemedicine should be offered to patients, especially to maximize savings in terms of travel, time, and cost. However, the option for conventional (in-person) follow-up should remain, particularly in cases where there may be barriers to successful follow-up visits via telemedicine, including limited digital literacy, lack of access to necessary equipment, language/communication barriers, complex follow-up treatment, and difficulties in describing or showing complications in the surgical area.
–Katrina F. Mateo, PhD, MPH
1. Williams AM, Bhatti UF, Alam HB, Nikolian VC. The role of telemedicine in postoperative care. mHealth. 2018 May;4:11-11.
2. Huang EY, Knight S, Guetter CR et al. Telemedicine and telementoring in the surgical specialties: A narrative review. Am J Surg. 2019;218:760-766.
3. Asiri A, AlBishi S, AlMadani W, et al. The use of telemedicine in surgical care: A systematic review. Acta Informatica Medica. 2018;26:201-206.
4. Gunter RL, Chouinard S, Fernandes-Taylor S, et al. Current use of telemedicine for post-discharge surgical care: a systematic review. J Am College Surg. 2016;222:915-927.
Study Overview
Objective. To compare the impact of conventional versus telemedicine follow-up of general surgery patients in outpatient clinics.
Design. Prospective randomized clinical trial.
Setting and participants. Participants were recruited from Hospital Germans Trias i Pujol, a tertiary care university hospital located in the outskirts of Barcelona (Catalonia, Spain). To be included in this study, participants had to have been treated in the general surgery department, have basic computer knowledge (ability to use e-mail or a social network), have a computer with webcam, and be 18 to 75 years of age, or they had to have a partner who met these criteria. Exclusion criteria included any disability making telemedicine follow-up impossible (eg, blindness, deafness, or mental disability; proctologic treatment; difficulty describing and/or showing complications in the surgical area; and clinical complications before discharge more severe than Clavien Dindo II), as well as withdrawal of consent. Patients who met the criteria and had just been discharged from the hospital were offered the opportunity to enroll by the surgeon in charge. Patients who agreed to participate provided informed consent and were assigned using a computerized block randomization list (allocation ratio 1:1).
Intervention. Time to visit was generally between 2 and 4 weeks after discharge (the interval to the follow-up visit was determined at the discretion of the treating surgeon, but always followed the usual schedule). To conduct the telemedicine follow-up through a video call, a medical cloud-based program fulfilling all European Union security and privacy policies was used. Four surgeons were assigned to perform the telemedicine visits and were trained on how to use the program before the study started. Visit format was the same in both groups: clinical and wound condition were assessed and pathology was discussed (the one difference was that physical exploration was not performed in the telemedicine group).
Main outcome measures. The primary outcome was the feasibility of telemedicine follow-up, and this was measured as the percentage of participants who completed follow-up in their corresponding group by the date scheduled at hospital discharge. Secondary outcomes included a comparison of clinical results and patient satisfaction. To assess the clinical results, extra visits to an outpatient clinic and/or the emergency department during the first 30 days after the follow-up visit were collected.
To evaluate patient satisfaction, a questionnaire was sent via email to the participants after the visit and, if they did not respond, a telephone survey was carried out (if there was no contact after 2 telephone calls, the participants was considered a missing value). The questionnaire was informed by the United Kingdom National Health Service outpatients questionnaire and the Telehealth Usability Questionnaire. It included 27 general questions asked of participants in both groups, plus 8 specific questions for participants in the conventional follow-up group and 14 specific questions for participants in the telemedicine group. To summarize all the included fields in the questionnaires (time to visit and visit length, comfort, tests and procedures performed before and during the visit, transport, waiting time, privacy, dealings with staff, platform usability, telemedicine, and satisfaction), participants were asked to provide a global satisfaction score on a scale from 1 to 5.
Analysis. To compare the groups in terms of proportion of outcomes, a chi-square test was used to analyze categorical variables. To compare medians between the groups, ordinal variables were analyzed using the Mann-Whitney U test. Statistical significance was set at P < 0.05.
Main results. Two-hundred patients were randomly allocated to 1 of the 2 groups, with 100 patients in each group. The groups did not differ significantly based on age (P = 0.836), gender (P = 0.393), or American Society of Anesthesiologists (ASA) score (P = 0.232). Time to visit did not differ significantly between the groups (P = 0.169), and while visits were generally shorter in the telemedicine group, the difference was not significant (P = 0.153). Diagnoses and treatments did not differ significantly between the groups (P = 0.853 and P = 0.461, respectively).
The primary outcome (follow-up feasibility) was achieved in 90% of the conventional follow-up group and in 74% of the telemedicine group (P = 0.003). Of the 10 patients in the conventional follow-up group who did not complete the follow-up, 8 did not attend the visit on the scheduled day and 2 were hospitalized for reasons not related to the study. In the telemedicine group, the 2 main reasons for failure to follow-up were technical difficulties (n = 10) and requests by patients to attend a conventional visit after being allocated to the telemedicine group (n = 10). Among the remaining 6 patients in the telemedicine group who did not attend a visit, 3 visited the outpatient clinic because of a known surgical wound infection before the visit, 2 did not respond to the video call and could not be contacted by other means, and 1 had other face-to-face visits scheduled in different departments of the hospital the same day as the telemedicine appointment.
There were no statistically significant differences in the clinical results of the 164 patients meeting the primary endpoint (P = 0.832). Twelve of the 90 (13.3%) patients in the conventional group attended extra visits after the follow-up, while 9 of the 74 patients (12.1%) in the telemedicine group (P = 0.823) attended extra visits after follow-up. The median global patient satisfaction score was 5 in both the conventional group (range, 2-5) and the telemedicine group (range, 1-5), with no statistically significant differences (P = 0.099). When patients in the telemedicine group were asked if they would accept the use of telemedicine as part of their medical treatment on an ongoing basis, they rated the proposition with a median score of 5 (range, 1-5).
Conclusion. Telemedicine is a feasible and acceptable complementary service to facilitate postoperative management in selected general surgery patients. This option produces good satisfaction rates and maintains clinical outcomes.
Commentary
In recent years, telemedicine has gained increased popularity in both medicine and surgery, affording surgeons greater opportunities for patient care, mentoring, collaboration, and teaching, without the limits of geographic boundaries. Telemedicine can be broadly described as a health care service utilizing telecommunication technologies for the purpose of communicating with and diagnosing and treating patients remotely.1-4 To date, literature on telemedicine in surgical care has been limited.
In their systematic review, published in 2018, Asiri et al identified 24 studies published between 1998 and 2018, which included 3 randomized controlled trials, 3 pilot studies, 4 retrospective studies, and 14 prospective observational studies. In these studies, telemedicine protocols were used for preoperative assessment, diagnostic purposes, or consultation with another surgical department (10 studies); postoperative wound assessment (9 studies); and follow-up in place of conventional clinic visits (5 studies).3 In a 2017 systematic review of telemedicine for post-discharge surgical care, Gunter et al identified 21 studies, which included 3 randomized controlled trials, 6 pilot or feasibility studies, 4 retrospective record reviews, 2 case series, and 6 surveys.4 In these studies, telemedicine protocols were used for scheduled follow-up (10 studies), routine and ongoing monitoring (5 studies), or management of issues that arose after surgery (2 studies). These 2 reviews found telemedicine to be feasible, useful, and acceptable for postoperative evaluation and follow-up among both providers and patients.
Additional benefits noted in these studies included savings in patient travel, time, and cost. Perspectives on savings to the health system were mixed—while clinic time slots may open as a result of follow-up visits being done via telemedicine (resulting in potential improvements in access to surgical services and decreased wait times), there are still significant direct costs for purchasing necessary equipment and for educating and training providers on the use of the equipment. Other published reviews have discussed in greater detail the application, benefits, limitations, and barriers to telemedicine and provided insight from the perspectives of patients, providers, and health care systems.1,2
Because studies on the use of telemedicine are limited, particularly in general surgery, and few of these studies have used a randomized clinical trial design, the present study is an important contribution to the literature. The authors found a significant difference between groups in terms of percentage of completed follow-up visits—90% of conventional follow-up group participants completed their visit versus 74% of telemedicine group participants. However, these differences were primarily attributed to technical difficulties experienced by telemedicine group participants, as well requests to have a conventional follow-up visit. In addition, telemedicine capabilities were limited to video calls via computers and webcams, and it is likely that successful completion of the follow-up visit would have been higher in the telemedicine group had the use of video calls via tablets or smartphones been an option. Perhaps more important, no significant differences were found in clinical outcomes (extra visits within 30 days after the follow-up visit) or patient satisfaction.
A key strength of this study is the use of a randomized clinical trial design to evaluate telemedicine as an alternative method for conducting patient visits following general surgery. Inclusion and exclusion criteria did not impose strict limitations on potential participants. Also, the authors evaluated differences in time to visit, length of visit, clinical results, and patient satisfaction between groups, in addition to the primary measure of completion of the follow-up visit.
This study has important limitations that should be noted as well, particularly related to the study design, some of which are acknowledged by the authors. Because this study was implemented in only 1 hospital, specifically, a tertiary care university hospital on the outskirts of an urban European city, the generalizability of the findings is limited. Also, the likelihood of selection bias is high, as enrollment was not offered to all patients who were discharged from the hospital and met inclusion criteria (limited by patient workload). The comparison of clinical results was limited, as the selected measure focused only on extra visits to an outpatient clinic and/or the emergency department during the first 30 days after the follow-up visit. This chosen measure does not account for less severe clinical results that did not require an additional visit, and does not represent a nuanced comparison of specific clinical indicators. In addition, this measure does not account for clinical complications that may have occurred beyond the 30-day period. Recall bias also was likely, given that the patient satisfaction questionnaire was delivered via email to patients at a later time after the follow-up visit, instead of being administered immediately after the visit. Last, group differences at baseline were assessed based only on age, gender, and ASA score, which does not preclude potential differences related to other factors, such as race/ethnicity, household income, comorbidities, insurance, and zip code. Future research with a similar objective would benefit from a randomized clinical trial design that recruits a wider diversity of patients across different clinic settings and incorporates more nuanced measures of primary and secondary outcomes.
Applications for Clinical Practice
With the ongoing COVID-19 pandemic, the integration of telemedicine capabilities into hospital systems is becoming more widespread and is proceeding at an accelerated pace. This study provides evidence that telemedicine is a feasible and acceptable complementary service to facilitate postoperative management in selected general surgery patients. Assuming that the needed technology and appropriate program training are available, telemedicine should be offered to patients, especially to maximize savings in terms of travel, time, and cost. However, the option for conventional (in-person) follow-up should remain, particularly in cases where there may be barriers to successful follow-up visits via telemedicine, including limited digital literacy, lack of access to necessary equipment, language/communication barriers, complex follow-up treatment, and difficulties in describing or showing complications in the surgical area.
–Katrina F. Mateo, PhD, MPH
1. Williams AM, Bhatti UF, Alam HB, Nikolian VC. The role of telemedicine in postoperative care. mHealth. 2018 May;4:11-11.
2. Huang EY, Knight S, Guetter CR et al. Telemedicine and telementoring in the surgical specialties: A narrative review. Am J Surg. 2019;218:760-766.
3. Asiri A, AlBishi S, AlMadani W, et al. The use of telemedicine in surgical care: A systematic review. Acta Informatica Medica. 2018;26:201-206.
4. Gunter RL, Chouinard S, Fernandes-Taylor S, et al. Current use of telemedicine for post-discharge surgical care: a systematic review. J Am College Surg. 2016;222:915-927.