User login
Hospitalist Horoscopes

The Prescriptionist
Birthdate: January 1-February 21
Symbol: Rx
There is a disease for every drug. If it’s new, you’re on it. You’re on the pharmacy and therapeutics committee, and when you get journals you read the ads first. You’ve never met a drug rep you didn’t like. You are willing to experiment on yourself if need be; you would have made a great hippie. You like to hang with double Helixes, but you also like to hang heparin, fentanyl, ephedrine, and anything else that will fit in a bag of D5W.
The Statistician
Birthdate: February 22-April 19 (+/-two days)
Symbol: 1A
Evidence-based medicine is your mantra. You will do nothing without a double-blind, randomized multicenter control study. You are a therapeutic nihilist. You read Sherlock Holmes as a child. As you are reading this, you are wondering why you were assigned this month and how they know that this horoscope is correct. What was the control group? Is it a horoscopic placebo effect? You will submit an article to a major journal and have it rejected because your sample size was too small.
The Sentinel
Birthdate: April 20-May 20
Symbol: The Guardsman
You are always alert, but somehow bad things still happen to your patients. Delirious octogenarians fall out of bed and fracture their femurs; mistaken medications are administered, leading to adverse consequences. You admitted a diabetic patient for a below-the-knee amputation. The surgeon did a wonderful job and took off the left leg—too bad it was the wrong patient. The patient who was due for the amputation had an inadvertent orchiectomy. You cannot stop using abbreviations. A JCAHO survey is in your future; perhaps it is a good time for a vacation.
Hirudis
Birthdate: May 21-June 20
Symbol: The Leach
You love to order tests: CAT scans. PET Scans. Ultrasounds and Dopplers. You want contrast? That’s no problem! We’ll just Mucomyst and bicarb the patient. You especially love phlebotomy. Every patient gets full lab every day. You would not want to miss a drop in hemoglobin, even if you caused it with excessive phlebotomy. If the patient is a tough stick, you’ll give it a try. You once found a vein on a particularly cicatricial heroin addict and you are still talking about it. You love Bela Lugosi movies.
The Chairman
Birthdate: June 21-July 20
Symbol: The Gavel
You love committees. Face it—there is not one you don’t want to be on. You like to know what’s going on and want to be involved. You don’t want someone to surprise you. You prefer to run the meeting and talk more than anyone else. As you read this, you think it could have been written more concisely, and you advise the formation of an ad hoc committee for wordsmithing, after which it will be sent to the communications committee, then on to exec. SHM has a place for you.
Nimbus
Birthdate: July 21–August 20 and August 22–September 20
Symbol: The Black Cloud
When you have been on hospital duty, nobody wants to take over the service from you. You always have the most patients. When you are on nights, you have 27 admissions when other people don’t get any. Your patients always get chest pain as you are about to roll over the pager, and it’s guaranteed not to be gas. Your post-op patients get to the floor very late, and they always have ileus, urinary retention, and delirium. You are paged constantly, even on your day off. The computer system just crashed; you must be on call. Your patients love you because you are always there.
The Dumpster
Birthdate: August 21
Symbol: The Garbage Can
You never mind leaving some work for your colleagues; you would not want them to be bored. You are going on vacation and need to leave early to pack, you have a headache and are home sick, or your dog has the flu, can somebody cover? Your discharge summaries are sketchy; you like to have residents so that they can do your paperwork for you. You are on good terms with Inertias and always seem to be changing call nights with Nimbuses.
The Geneticist
Birthdate: September 21-October 20
Symbol: The Double Helix
Face it—you’re twisted, dude. You like things to align nicely; your clothing always matches your shoes. You love consanguinity and the interesting diseases that develop. Nobody knows what you are talking about at parties. You hear hoofbeats (it’s not a horse). Bad news: They just discovered that Linus Pauling was right. DNA is a triple helix.
Inertia
Birthdate: October 21–November 19
Symbol: The Snail
You think the world is changing too fast. You were right about HMOs and still think LBJ made a mistake when he signed Medicare into law. When you are on a committee, you always find something that needs a rewrite. You always want a second review.
If it was good enough for you, it’s good enough for those who follow you. You still write notes by hand and are damned if you’ll learn how to operate a computer.
You are a natural bureaucrat. You love to block Chairmen from getting anything done.
The Techie
Birthdate: November 20 at 6 a.m.-December 31 at 11:59p.m.
Symbol: The Palm Pilot
You are first to embrace a new technology. If it’s embedded, you’ll root it out. You get your news from a podcast, and you have a Blackberry and a Blueberry. You don’t understand how anyone could not like having an electronic health record. Your entire medical school education is saved on a memory card, though you are not sure where it is. Your secret shame: Your vintage VCR still has a blinking red light. You get along well with Chairmen as long as they move your technology request through the committees. You would like to see all Inertias implode. TH
Jamie Newman, MD, FACP, is the physician editor of The Hospitalist, consultant, Hospital Internal Medicine, and assistant professor of internal medicine and medical history, Mayo Clinic College of Medicine at the Mayo Clinic College of Medicine, Rochester, Minn.
In the Literature

Statins for Stroke Prevention
By Paul J. Grant, MD
Amarenco P, Bogousslavsky J, Callahan A III, et al. Stroke Prevention by Aggressive Reduction in Cholesterol Levels (SPARCL) Investigators. High-dose atorvastatin after stroke or transient ischemic attack. N Engl J Med. 2006 Aug 22;355:549-559.
Despite recent advances, the physician’s armamentarium for secondary stroke prevention is limited. The literature regarding optimal blood pressure management for stroke prevention is sparse, and the data addressing the best antiplatelet regimen remain controversial. This is troubling, given the fact that cerebrovascular disease remains the third leading cause of death in the United States.
Although extensive data exists for the benefits of using 3-hydroxy-3-methylglutaryl coenzyme A reductase inhibitors (statins) for the prevention and treatment of cardiovascular disease, little is known about their role in decreasing the risk of stroke. The highly anticipated Stroke Prevention by Aggressive Reduction in Cholesterol Levels (SPARCL) trial sought to determine if statin therapy would decrease the risk of recurrent stroke in patients with no known coronary heart disease.
This prospective, randomized, double-blind, placebo-controlled trial included 4,731 men and women with no history of coronary heart disease. Eligible patients had a history of stroke (ischemic or hemorrhagic) or a transient ischemic attack (TIA) within a one- to six-month period before randomization as diagnosed by a neurologist. All patients required a low-density lipoprotein (LDL) cholesterol level between 100 and 190 mg/dL, while exclusion criteria included atrial fibrillation. Patients were randomized either to a dosage of 80 mg of atorvastatin daily or to a placebo and were followed for a median duration of 4.9 years. The primary endpoint was fatal or nonfatal stroke.
The average patient age in this trial was 63; approximately 60% of the patients were male. A total of 265 patients reached the primary endpoint in the atorvastatin group, versus 311 patients in the placebo group. This translates to an adjusted relative risk reduction of 16% in the primary endpoint for patients receiving atorvastatin (hazard ratio 0.84; 95% confidence interval 0.71 to 0.99; p=0.03). Although there was no difference in overall mortality between the two groups, the incidence of cardiovascular events was significantly lower in those receiving atorvastatin. Interestingly, more hemorrhagic strokes were noted in the atorvastatin group. With respect to safety, no significant differences in serious adverse events were noted. The atorvastatin group did, however, encounter significantly more cases of persistently elevated aspartate aminotransferase (AST) or alanine aminotransferase (ALT), at 2.2% versus 0.5% in the placebo group.
The findings by the SPARCL investigators provide strong evidence that atorvastatin reduces the incidence of stroke recurrence. The mechanism for risk reduction with statin exposure is most likely due to the dramatic lowering of LDL cholesterol. This effect has been shown in numerous trials resulting in the reduction of cardiovascular events. The present trial observed a 53% decrease in LDL cholesterol in the atorvastatin group compared with no change in the placebo arm. In addition to their powerful lipid-lowering role, statins also appear to prevent plaque rupture, optimize endothelial function, and provide anti-inflammatory effects. These are the so-called “pleiotropic effects” of statins and may be another factor contributing to the benefits observed.
Although some physicians are already prescribing statins for stroke patients, the literature supporting this practice has been sparse. The latest guidelines for prevention of stroke in patients with ischemic stroke or TIA were published in February 2006 by the American Heart Association/American Stroke Association Council on Stroke. These guidelines state that patients with a history of ischemic stroke or TIA are “reasonable candidates” for statin therapy. One could argue that these guidelines should now be revised to include a strong recommendation for statin therapy in secondary stroke prevention.
MRSA in the Community
By Matthew T. Harbison, MD
Moran GJ, Krishnadasan A, Gorwitz RJ, et al. EMERGEncy ID Net Study Group. Methicillin-resistant S. aureus infections among patients in the emergency department. N Engl J Med. 2006 Aug 17;355(7):666-674.
Methicillin-resistant Staphylococcus aureus (MRSA) emerged as an issue in the healthcare community not long after the introduction of methicillin in 1959. MRSA has traditionally been thought of as an issue for those individuals who have contact with the healthcare system; however, there is growing evidence that MRSA has become an entity in the greater community at large, affecting individuals who have not spent significant time in healthcare facilities. Descriptions of several community-based outbreaks have led to the understanding that community-associated MRSA has different characteristics than MRSA infections contracted in the hospital setting. The community-associated isolates are resistant to fewer antibiotics, produce different toxins, and have differing genetic complexes responsible for antibiotic resistance. The majority of the community-acquired infections are skin and soft tissue infections, although more serious infections have been reported.
Moran and colleagues conducted a prospective prevalence study in adult patients presenting to emergency departments with skin and soft tissue infections in 11 metropolitan areas in geographically diverse regions of the United States. Eligible patients 18 and older with purulent skin or soft tissue infections of less than one week’s duration had demographic and historical data collected; a wound culture was also taken. If Staphylococcus aureus was isolated, it was further evaluated by the Centers for Disease Control and Prevention (CDC) to characterize antibiotic resistance patterns, toxin production, and the type of staphylococcal cassette chromosome present.
A total of 422 patients were enrolled, with S. aureus isolated in 320 patients (76%). Of those with isolated S. aureus, 78% had MRSA (59% of the total patients enrolled). The individual site prevalence of MRSA ranged from 15 to 74% and was the predominant etiology of skin and soft tissue infections in 10 of 11 emergency departments. MRSA susceptibilities in this study were 100% to trimethoprim-sulfamethoxazole and rifampin, 95% to clindamycin, 92% to tetracycline, 60% to fluoroquinolones, and 6% to erythromycin. The authors point out that clindamycin resistance in one center was 60%; thus, individual site resistance patterns may differ significantly. Treatment data was available for 406 of the 422 patients, with the majority of those treated with incision, drainage, and antibiotics. In 100 of the 175 MRSA patients treated with antibiotics, the choice of agent was discordant with susceptibility patterns. The authors were able to contact 248 patients between two and three weeks after their visits and, of those contacted, 96% reported resolution or improvement of the wound.
Using multivariate logistic-regression analyses, the authors identified several potential risk factors for MRSA infection. These included use of any antibiotic in the past month, underlying illness, history of MRSA infection, close contact with someone with similar infection, and reported spider bite. Interestingly, being a healthcare worker, living in a long-term care facility, and being hospitalized in the past year were not shown to be significant risk factors in this study.
The results of this study highlight the emerging difficulty, which continues to evolve, with antibiotic resistance patterns. The healthcare community must be vigilant to new entities that challenge the traditional views of antibiotic resistance patterns. The high rate of community-acquired MRSA skin and soft tissue infection demonstrated in this study, in addition to the large percentage of patients prescribed antibiotics that were resistant for the strain involved, emphasizes the need to reconsider the empiric antibiotic choices for this patient population. The variability in regional resistance patterns further complicates the issue. Given the high prevalence of MRSA skin and soft tissue infections reported in this study, use of routine wound cultures appears prudent, as does the need for effective follow-up strategies for alteration of antibiotic choice if necessary. At an institutional level, development of surveillance and isolation strategies for community-acquired MRSA should be considered.
More Options for Venous Thromboembolism Treatment
By Kirsten N. Kangelaris, MD
Kearon C, Ginsberg JS, Julian JA, et al. Fixed-Dose Heparin (FIDO) Investigators. Comparison of fixed-dose weight-adjusted unfractionated heparin and low-molecular-weight heparin for acute treatment of venous thromboembolism. JAMA. 2006 Aug 23;296(8):935-942.
The standard approach to using unfractionated heparin (UFH) in the treatment of acute venous thromboembolism as a bridge to warfarin therapy requires continuous intravenous infusion with frequent dose adjustments in response to measurements of activated partial thromboplastin time (aPTT). This therapy inevitably requires inpatient management. Subcutaneous administration of weight-based low molecular weight heparin (LMWH) has been the modality of choice for outpatient treatment of venous thromboembolism because it does not require laboratory monitoring. Its use has been limited by the high cost of treatment, however. A preliminary study, released in 2000 by the FIDO group (Fixed-Dose Heparin Investigators, Kearon and colleagues), suggested that subcutaneously administered UFH could be optimally dosed based on weight rather than monitoring aPTT levels.
This follow-up, randomized, open-label, adjudicator-blinded, multi-centered, non-inferiority trial enrolled 708 patients and compared fixed-dose, subcutaneously administered UFH to LMWH in acute deep venous thrombosis and pulmonary embolism. Administration in both groups was twice daily, subcutaneous, and weight-based. UFH was given as a first dose of 333 U/kg, followed by 250 U/kg every 12 hours. LMWH was administered at a dose of 100 IU/kg every 12 hours. Both treatments overlapped with three months of warfarin therapy, and both could be administered out of hospital.
Exclusion criteria were age <18, contraindication to subcutaneous therapy, active bleeding, life expectancy under three months, long-term anticoagulation therapy, pregnancy, and creatinine level >2.3 mg/dL.
The primary endpoints were efficacy as determined by recurrent venous thromboembolism within three months and safety as determined by major bleeding within 10 days of randomization. A secondary endpoint was relationship of efficacy and safety outcomes to aPTT levels measured on day two to three of therapy for the UFH group.
Results revealed that UFH was statistically non-inferior to LMWH by all endpoints, including treatment duration, efficacy, and safety. At three months, there was no significant difference between the groups in frequency of recurrent venous thromboembolism (3.8% UFH versus 3.4% LMWH), bleeding (1.1% UFH versus 1.4% LMWH), or death. There was no association between aPTT levels and recurrent venous thromboembolism or bleeding.
Limitations of the study included reduced enrollment from the initial study design, though power was adequate due to a lower than expected incidence of recurrent venous thromboembolism in both arms (~3.6% versus the expected 6%); possible biases related to open-label design; and more post-randomization exclusions in the UFH group versus the LMWH group.
In summary, fixed-dose, unmonitored, subcutaneous UFH appears to be an effective, safe alternative to LMWH as a bridge to warfarin therapy for venous thromboembolism. Clinically, this is relevant, because UFH is approximately 15 to 20 times less expensive than LMWH. The authors appropriately call attention to two developments in clinical practice that occurred during the course of the present study and that could potentially limit the use of UFH. These are 1) the dosing option for once-daily LMWH, which improves convenience, and 2) the preference for long-term LMWH therapy over warfarin for treating cancer patients with venous thromboembolism. Despite these exceptions, UFH may prove to be a viable and economic option for venous thromboembolism treatment.
In-Hospital MI Versus MI at Presentation
By Erin M. Galbraith, MD
Maynard C, Lowy E, Rumsfeld J, et al. The prevalence and outcomes of in-hospital acute myocardial infarction in the Department of Veterans Affairs Health System. Arch Intern Med. 2006 Jul 10;166(13):1410-1416.
Much is known about the prevalence, treatment, and prognosis of acute myocardial infarction (AMI) when it occurs in the community and is the presenting diagnosis. Few studies, however, have addressed the epidemiology of in-hospital AMIs. This study by Maynard and colleagues attempts to elucidate the basic epidemiologic characteristics, treatments, and outcomes of patients who suffer in-hospital AMIs.
This retrospective cohort consisted of 7,054 patients who had been discharged with a diagnosis of AMI from 127 Veterans Health Administration (VHA) medical centers between July and August 2003. Patients who had suffered a postoperative MI or were transferred in from another hospital were excluded. Data was obtained from both the electronic and paper medical records. Of the 7,054 patients in the study, 792 (11.2%) had experienced an AMI while hospitalized for other medical problems. These 792 patients were older by approximately 4.5 years and more frequently suffered from heart failure, diabetes, chronic renal insufficiency, COPD, cerebrovascular disease, dementia, and cancer. These patients were less likely, however, to have had a previous MI, to be current smokers, or to have undergone previous angioplasty. They were also less likely to have known lipid disorders or to be taking aspirin or lipid-lowering agents.
Regarding their presentations and management, the patients who suffered in-hospital AMIs had faster heart rates and lower blood pressures. They were also up to 75% less likely to report typical symptoms of cardiac ischemia, including chest pain/pressure, shoulder pain, nausea, and diaphoresis. They were less often seen by an attending cardiologist and had more contraindications to AMI therapy; thus, these patients underwent reperfusion therapy at much lower rates, both initially and at 30 days. Their troponin levels were more frequently elevated, but they were only half as likely to have ST segment elevations at the time of diagnosis. Hospitalizations were longer for the in-hospital group, and there were higher rates of in-hospital cardiogenic shock, cardiac arrest, and death (27.3% versus 8.6%). The 30-day mortality rate was also higher (33% versus 11.9%). Multivariate logistic regression revealed an adjusted odds ratio of 2.0 (95% confidence interval 1.7 to 2.4; p<0.001) for 30-day mortality in those who experienced an in-hospital AMI versus those who presented with an AMI.
Potential reasons for the increased severity of outcomes include, but are not limited to, their many chronic comorbidities, their other acute diagnoses, the failure of the medical team to recognize cardiac ischemia in a timely manner (i.e., higher initial troponins), the inability to treat MIs appropriately secondary to contraindications to acute intervention, and the lack of an attending cardiologist presiding over their medical care. Clearly, further studies are needed to elucidate the causes of death in the 33% of patients who died, because it is unclear whether the patients died of complications from their MIs or as a result of their multiple other medical problems. Knowledge of the extent to which these patients could be managed, both medically and via interventional procedures (and why these therapies were not pursued), would also be of value.
This study emphasizes the importance of recognizing atypical presentations of AMIs and exercising vigilance in pursuing the most aggressive therapy possible, as dictated by a patient’s ability to tolerate medical and procedural interventions.
Hyperglycemia in Heart Failure
By David H. Wesorick, MD
Barsheshet A, Garty M, Grossman E, et al. Admission blood glucose level and mortality among hospitalized nondiabetic patients with heart failure. Arch Intern Med. 2006 Aug 14-28;166(15):1613-1619.
The medical literature strongly suggests that inpatient hyperglycemia is associated with a variety of poor outcomes. Little is known, however, about the relationship between hyperglycemia and heart failure. These investigators examined the association of admission blood glucose and mortality in patients who were admitted to the hospital with acute heart failure.
In this study, 1,122 patients admitted to the hospital with acute heart failure and without diabetes were divided into tertiles depending on their admission blood glucose levels. Diabetes was defined as an admission blood glucose greater than or equal to 200 mg/dl, a known diagnosis of diabetes recorded in the chart, or the presence of anti-diabetic medications on the patient’s medication list. Tertile #1 had an average admission blood glucose of 92 mg/dl (with a range of 54-102); tertile #2 had an average admission blood glucose of 113 mg/dl (with a range of 103-127); and tertile #3 had an average admission blood glucose of 147 mg/dl (with a range of 128-199). Mortality was evaluated according to tertile.
In this study, patients in tertile #3 had significantly higher inpatient mortality (7.2%) than patients in tertile #1 or #2 (3% and 4%, respectively). There was a significant association between hyperglycemia and mortality, even at 60 days follow-up, although not at six and 12 months follow-up. The association remained significant, even when patients with acute MI were excluded. Besides hyperglycemia, the authors noted that increasing age, increasing creatinine, a New York Heart Association (NYHA) functional class of III or IV, and a systolic blood pressure of lower than 115 were also significant, independent predictors of in-hospital mortality in this patient population.
For a hospitalist, the intriguing question is this: Is hyperglycemia just a marker of worse disease, or might it contribute to poorer outcomes? Clearly, hyperglycemia is associated with poorer outcomes in other types of patients, including post-surgical patients, critically ill patients, MI patients, and general medical patients.1 But is hyperglycemia just a marker of more severe illness? In heart failure, perhaps more severe decompensation results in a more profound activation of the sympathetic nervous system and a more vigorous release of stress hormones, such as cortisol and catecholamines. In that case, one might expect a sicker patient to have a higher blood glucose.
More recent studies, however, show that better control of hyperglycemia in some acutely ill patients actually results in improved outcomes, suggesting that the hyperglycemia itself might be contributing to the poorer outcomes in some cases.2-5 Hyperglycemia is known to alter human physiology in a variety of adverse ways.1 For example, hyperglycemia is known to inhibit nitric oxide production and to alter endothelial dysfunction. In a patient with acute heart failure, these alterations might be expected to have a significant effect on outcomes.
This study does not intend to answer these questions, but it does add to our understanding of the association of hyperglycemia and poor outcomes in acutely ill patients. More research is needed to examine whether or not heart failure patients, specifically, will benefit from better glycemic control in the acute setting. TH
References
- Clement S, Braithwaite SS, Magee MF, et al. Management of diabetes and hyperglycemia in hospitals. Diabetes Care. 2004 Feb;27(2):553-591.
- Van den Berghe G, Wouters P, Weekers F, et al. Intensive insulin therapy in the critically ill patients. N Engl J Med. 2001 Nov 8;345(19):1359-1367.
- Van den Berghe G, Wilmer A, Hermans G, et al. Intensive insulin therapy in the medical ICU. N Engl J Med. 2006 Feb 2;354(5):449-461.
- Furnary AP, Zerr KJ, Grunkemeier GL, et al. Continuous intravenous insulin infusion reduces the incidence of deep sternal wound infection in diabetic patients after cardiac surgical procedures. Ann Thorac Surg. 1999 Feb;67(2):352-362.
- Furnary AP, Gao G, Grunkemeier GL, et al. Continuous insulin infusion reduces mortality in patients with diabetes undergoing coronary artery bypass grafting. J Thorac Cardiovasc Surg. 2003 May;125(5):1007-1021.
Children's Hospitalist

Children’s Hospital of Central California (CHCC), Madera, Calif., cuts a wide swath through its 45,000-square-mile catchment area, which overflows with 1 million children. Eight miles northwest of Fresno, it nestles in a wheat field, part of the San Joaquin Valley’s 1.88 million acres of rich farmland that contributes $4 billion annually to California’s economy. Fresno is home to a population that is 60% minority; the city is a multicultural mélange of Hispanics, blacks, and Asians with dozens of languages and homelands.
—Todd Suntrapak


CHCC’s challenge is to continue to attract privately insured patients, who account for 30% of its clients and choose the hospital for its clinical excellence, while serving a 70% majority of publicly insured and uninsured migrant and poor urban families. Even with public payers, national statistics starkly highlight CHCC’s reimbursement quandary: Healthcare expenditures for uninsured and publicly insured immigrants are approximately half those of their U.S.-born counterparts, while immigrant children account for 74% lower per capita expenditures than U.S.-born children.1
CHCC’s patients are treated in an architecturally dramatic hospital organized around an “Our Universe” theme. Bright colors splash everywhere, its low-profile buildings don’t scare children, and cozy lounges and other homey touches are welcoming.
CHCC is organized into four 32-bed “starships.” Starship Discovery covers gastroenterology and infectious diseases, while Starship Apollo’s passengers get 24-hour supervision of cystic fibrosis, bronchitis, syncytial virus, and sleep apnea. In Starship Explorer, hospitalists tend to about 10,000 postoperative patients annually, with cardiovascular, neuro, and orthopedic procedures predominating. Starship Craycroft is dedicated to hematology, oncology, diabetes, and nephrology, as well as clinical trials for cancer, sickle cell anemia, and hemophilia. Hospitalists move readily from one starship to another, rather than being assigned to a service.
Rocky Start
The hospitalists, members of Children’s Hospital Medical Group (an 80-doctor multi-specialty group) are now integral to CCHC, but the program started shakily. According to Don Fields, DO, and chairman of the hospital medicine group, administrators approached him and another physician in 1998, asking them to establish a hospitalist service in anticipation of relocating from Fresno to the new hospital. Moving from a busy downtown location convenient to doctors’ offices to a hospital in rural Madera required more driving for office-based physicians making hospital rounds. Geography and huge practice loads in a medically underserved area created the need for a hospital medicine group.
The physicians, naïve to the challenges, agreed to start a service. “When the program started it wasn’t busy because the attending physicians didn’t have a concept of who hospitalists were and what we did,” recalls Dr. Fields. “We had few patients and were worried we’d be fired because of lack of interest.”

After the hospital’s chief medical officer spread the word to community physicians, doctors started referring in droves. “The community [doctors] realized they didn’t have to take night calls or leave their busy offices to make hospital rounds,” adds Dr. Fields.
A recent feather in CHCC’s cap is Kaiser-Permanente of Fresno’s decision to contract for the hospital medicine group’s services. Alice Calhoun, MD, and CHCC’s hospital medicine group’s co-director, says that “the Kaiser staffers, administrators and clinicians, are total sticklers about outcomes and efficiency, and this recent decision speaks to our reputation and competence.”
Dr. Calhoun joined the hospitalist group early on. Having practiced pediatric emergency medicine for eight years in Wisconsin, she interviewed for a similar position at CHCC but chose the nascent hospitalist program instead. “It was a very large hospital, and I saw huge growth potential for hospitalists,” she says. “There weren’t many rules, and I knew we’d create a niche for ourselves.”
Ralph Diaz, MD, joined the group in 2000. Two years later, he became Children’s Hospital Medical Group’s medical director, dealing with quality issues, patient safety, and revenue enhancement. He even mediates disputes between doctors for the 80-person multi-specialty group. Despite a dual workload as hospitalist and administrator, Dr. Diaz loves his job. “It’s what gets me up in the morning,” he says. “The acuity of illness of the children we treat and the fact that we see everyone—from a yuppie family in one room … to migrant farm workers in another—is exciting.”

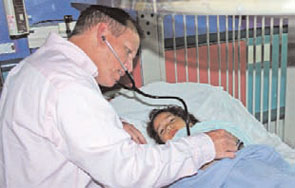

Paramount Efficiency
CHCC’s hospitalist program isn’t an admitting service for community physicians’ convenience. It deals with very sick children, lean and mean reimbursement, $20 million annually in uncompensated care, and little to no financial margin of error. With 70% of its patients funded by Medi-Cal and others uninsured, the hospitalist program, says Todd Suntrapak, the hospital’s COO, needs to be lean and efficient and must retain stellar doctors. “Our population is medically underserved, reimbursements don’t always cover our costs, and we deliver millions of dollars of uncompensated care,” says Suntrapak. “Our hospitalists continue to elevate the quality of care with clinical pathways for over 25 conditions and are constantly improving efficiency.”
Bill Fletcher, CHCC’s director of outcomes and research, has the numbers to support hospitalist efficiency. He explains that hospitalists’ contribution margin, the amount their service line contributes toward overhead, exceeds $500 per patient. With 12,000 inpatients a year, a ballpark estimate of the hospitalists’ contribution if they only saw 60% of them would be $3.6 million, although Fletcher wouldn’t confirm specifics.
“The hospitalists’ contribution is golden. Unlike cardiac surgery, whose high costs could never generate such [a] margin, the hospitalists create enormous value for us,” says Fletcher.
A key efficiency component is compliance with clinical pathways. Fletcher tracks CHCC’s performance against national standards (www.leap froggroup.org) and with its own pathways. “We don’t measure our hospitalists’ performance a lot because they’re so integrated into the hospital,” he says. “But we look at compliance with our 25 clinical pathways [by examining] each case, by [looking at] diagnosis, and [by making sure] it fits the pathway.”
Here’s how the hospitalists stacked up:
Suntrapak reckons the process works. “Our hospitalists are giving excellent, efficient care—particularly with high-volume diagnoses such as asthma, appendectomy, and bronchiolitis,” he notes. With regard to adherence to pathways, Dr. Calhoun says, “If we worked in a vacuum, I wouldn’t like that kind of tracking, but we realize how much is saved by using them.”
In addition to hospitalists standardizing treatment for 25 conditions as a way to promote efficiency, the physicians find that pathways and standing orders free nurses by clearly delineating clinical responsibilities. “Pathways allow nurses to do what they’re trained and authorized to do. By spelling this out clearly, the pathways have cut our pager calls by 50 percent,” notes Dr. Calhoun.
On a systemic level, hospitalists contribute by analyzing data and then recommending ways in which CHCC’s precious resources can be allocated most effectively. For example, this year hospitalists are serving on four bed management subcommittees dedicated to streamlining patient throughput, attempting to flatten barriers to moving kids efficiently from the emergency department (ED) to general floors or ICU and through discharge. Dr. Calhoun’s work group is penning criteria for prioritizing the list of potential recipients of CHCC’s next scarce available bed—will it be a small community hospital, a doctor’s office, or a tertiary care hospital?
Scheduling, a Pleasant Surprise
The hospitalists work a 12-hour block schedule, with seven days on and seven days off, but Dr. Fields says “it works for us because it feels like we have the luxury of a lot of time off.” The doctors are good friends, going scuba diving, traveling, and camping together, and their kids have playdates. Dr. Fields admits that doctors near burnout in the hectic winter months when census climbs, but the friendships among colleagues pull them through. “If someone’s mother is dying, or their children are sick, they know that they’re covered because we’re friends,” he says.
Paul Parker, MD, a group member who commutes from San Diego, does the scheduling three months in advance so that the physicians can plan their lives. All hospitalists have one vacation request guaranteed, and holiday coverage is distributed equitably.
Dr. Diaz points to the positive effect of one unusual twist—starting rotations on Friday. “You learn about patients from your colleagues before the weekend, knowing that major procedures won’t happen until Monday,” he says. “It promotes efficiency, because you can discharge patients on Friday without discharging on Saturday or Sunday, which gets complicated.”
Other ideas that promote efficiency and job satisfaction include running code blues from the ICU, spending only one-half day admitting from the ED, giving night shifts to the doctors who like them, and serving as teaching attendings.
Balancing fiscal discipline with a compensation package that attracts and keeps top-notch pediatric hospitalists isn’t easy; CHCC does it. Hospitalist salaries remain stable, increase, or decrease based on a points accumulation productivity system. For his or her salary to remain stable, a hospitalist needs to earn 300 points monthly by taking admission histories, performing physicals, handling administrative tasks, and so on. The doctors keep records on billing cards; CHCC is moving toward personal digital assistants (PDAs) within the next year or two. The hospitalists are excellent recruiters. They’re hiring last year’s chief resident, and they continue to lure back previous top residents who add to group chemistry.

Children’s Stories
CHCC’s patients present constant challenges for hospitalists, and each young life saved is a story. Vida Vazquez, a one-pound, 10-ounce preemie, spent three months in the NICU and now leads a normal life.
A hospitalist doesn’t have to search her memory for long to find a satisfying case. Dr. Calhoun recently saw a 14-year-old boy with muscular dystrophy and restrictive lung disease who presented with a ruptured appendix.
“His lungs were so bad, and he was so air hungry, with severe stomach distension, but we couldn’t operate on the ruptured appendix because of his other health issues,” she recalls. “He was truly high risk, but we treated him medically and discharged him in seven days. He was smiling, as were the surgeons and the hospitalists, because we got him through it.”
It’s difficult to imagine hospitalists more engaged than CHCC’s. Their professionalism continues to grow. This year they’ve trained to take over sedation duties; they are also managing diabetes ketoacidosis and developing a viral meningitis clinical pathway. Maybe working in starships makes them reach for celestial outcomes. TH
Marlene Piturro regularly writes “Practice Profile.”
Reference
- Mohanty SA, Woolhandler S, Himmelstein DU, et al. Health care expenditures of immigrants in the United States: a nationally representative analysis. Am J Public Health. 2005 Aug:95(8):1431-1438.
Children’s Hospital of Central California (CHCC), Madera, Calif., cuts a wide swath through its 45,000-square-mile catchment area, which overflows with 1 million children. Eight miles northwest of Fresno, it nestles in a wheat field, part of the San Joaquin Valley’s 1.88 million acres of rich farmland that contributes $4 billion annually to California’s economy. Fresno is home to a population that is 60% minority; the city is a multicultural mélange of Hispanics, blacks, and Asians with dozens of languages and homelands.
—Todd Suntrapak
CHCC’s challenge is to continue to attract privately insured patients, who account for 30% of its clients and choose the hospital for its clinical excellence, while serving a 70% majority of publicly insured and uninsured migrant and poor urban families. Even with public payers, national statistics starkly highlight CHCC’s reimbursement quandary: Healthcare expenditures for uninsured and publicly insured immigrants are approximately half those of their U.S.-born counterparts, while immigrant children account for 74% lower per capita expenditures than U.S.-born children.1
CHCC’s patients are treated in an architecturally dramatic hospital organized around an “Our Universe” theme. Bright colors splash everywhere, its low-profile buildings don’t scare children, and cozy lounges and other homey touches are welcoming.
CHCC is organized into four 32-bed “starships.” Starship Discovery covers gastroenterology and infectious diseases, while Starship Apollo’s passengers get 24-hour supervision of cystic fibrosis, bronchitis, syncytial virus, and sleep apnea. In Starship Explorer, hospitalists tend to about 10,000 postoperative patients annually, with cardiovascular, neuro, and orthopedic procedures predominating. Starship Craycroft is dedicated to hematology, oncology, diabetes, and nephrology, as well as clinical trials for cancer, sickle cell anemia, and hemophilia. Hospitalists move readily from one starship to another, rather than being assigned to a service.
Rocky Start
The hospitalists, members of Children’s Hospital Medical Group (an 80-doctor multi-specialty group) are now integral to CCHC, but the program started shakily. According to Don Fields, DO, and chairman of the hospital medicine group, administrators approached him and another physician in 1998, asking them to establish a hospitalist service in anticipation of relocating from Fresno to the new hospital. Moving from a busy downtown location convenient to doctors’ offices to a hospital in rural Madera required more driving for office-based physicians making hospital rounds. Geography and huge practice loads in a medically underserved area created the need for a hospital medicine group.
The physicians, naïve to the challenges, agreed to start a service. “When the program started it wasn’t busy because the attending physicians didn’t have a concept of who hospitalists were and what we did,” recalls Dr. Fields. “We had few patients and were worried we’d be fired because of lack of interest.”
After the hospital’s chief medical officer spread the word to community physicians, doctors started referring in droves. “The community [doctors] realized they didn’t have to take night calls or leave their busy offices to make hospital rounds,” adds Dr. Fields.
A recent feather in CHCC’s cap is Kaiser-Permanente of Fresno’s decision to contract for the hospital medicine group’s services. Alice Calhoun, MD, and CHCC’s hospital medicine group’s co-director, says that “the Kaiser staffers, administrators and clinicians, are total sticklers about outcomes and efficiency, and this recent decision speaks to our reputation and competence.”
Dr. Calhoun joined the hospitalist group early on. Having practiced pediatric emergency medicine for eight years in Wisconsin, she interviewed for a similar position at CHCC but chose the nascent hospitalist program instead. “It was a very large hospital, and I saw huge growth potential for hospitalists,” she says. “There weren’t many rules, and I knew we’d create a niche for ourselves.”
Ralph Diaz, MD, joined the group in 2000. Two years later, he became Children’s Hospital Medical Group’s medical director, dealing with quality issues, patient safety, and revenue enhancement. He even mediates disputes between doctors for the 80-person multi-specialty group. Despite a dual workload as hospitalist and administrator, Dr. Diaz loves his job. “It’s what gets me up in the morning,” he says. “The acuity of illness of the children we treat and the fact that we see everyone—from a yuppie family in one room … to migrant farm workers in another—is exciting.”
Paramount Efficiency
CHCC’s hospitalist program isn’t an admitting service for community physicians’ convenience. It deals with very sick children, lean and mean reimbursement, $20 million annually in uncompensated care, and little to no financial margin of error. With 70% of its patients funded by Medi-Cal and others uninsured, the hospitalist program, says Todd Suntrapak, the hospital’s COO, needs to be lean and efficient and must retain stellar doctors. “Our population is medically underserved, reimbursements don’t always cover our costs, and we deliver millions of dollars of uncompensated care,” says Suntrapak. “Our hospitalists continue to elevate the quality of care with clinical pathways for over 25 conditions and are constantly improving efficiency.”
Bill Fletcher, CHCC’s director of outcomes and research, has the numbers to support hospitalist efficiency. He explains that hospitalists’ contribution margin, the amount their service line contributes toward overhead, exceeds $500 per patient. With 12,000 inpatients a year, a ballpark estimate of the hospitalists’ contribution if they only saw 60% of them would be $3.6 million, although Fletcher wouldn’t confirm specifics.
“The hospitalists’ contribution is golden. Unlike cardiac surgery, whose high costs could never generate such [a] margin, the hospitalists create enormous value for us,” says Fletcher.
A key efficiency component is compliance with clinical pathways. Fletcher tracks CHCC’s performance against national standards (www.leap froggroup.org) and with its own pathways. “We don’t measure our hospitalists’ performance a lot because they’re so integrated into the hospital,” he says. “But we look at compliance with our 25 clinical pathways [by examining] each case, by [looking at] diagnosis, and [by making sure] it fits the pathway.”
Here’s how the hospitalists stacked up:
Suntrapak reckons the process works. “Our hospitalists are giving excellent, efficient care—particularly with high-volume diagnoses such as asthma, appendectomy, and bronchiolitis,” he notes. With regard to adherence to pathways, Dr. Calhoun says, “If we worked in a vacuum, I wouldn’t like that kind of tracking, but we realize how much is saved by using them.”
In addition to hospitalists standardizing treatment for 25 conditions as a way to promote efficiency, the physicians find that pathways and standing orders free nurses by clearly delineating clinical responsibilities. “Pathways allow nurses to do what they’re trained and authorized to do. By spelling this out clearly, the pathways have cut our pager calls by 50 percent,” notes Dr. Calhoun.
On a systemic level, hospitalists contribute by analyzing data and then recommending ways in which CHCC’s precious resources can be allocated most effectively. For example, this year hospitalists are serving on four bed management subcommittees dedicated to streamlining patient throughput, attempting to flatten barriers to moving kids efficiently from the emergency department (ED) to general floors or ICU and through discharge. Dr. Calhoun’s work group is penning criteria for prioritizing the list of potential recipients of CHCC’s next scarce available bed—will it be a small community hospital, a doctor’s office, or a tertiary care hospital?
Scheduling, a Pleasant Surprise
The hospitalists work a 12-hour block schedule, with seven days on and seven days off, but Dr. Fields says “it works for us because it feels like we have the luxury of a lot of time off.” The doctors are good friends, going scuba diving, traveling, and camping together, and their kids have playdates. Dr. Fields admits that doctors near burnout in the hectic winter months when census climbs, but the friendships among colleagues pull them through. “If someone’s mother is dying, or their children are sick, they know that they’re covered because we’re friends,” he says.
Paul Parker, MD, a group member who commutes from San Diego, does the scheduling three months in advance so that the physicians can plan their lives. All hospitalists have one vacation request guaranteed, and holiday coverage is distributed equitably.
Dr. Diaz points to the positive effect of one unusual twist—starting rotations on Friday. “You learn about patients from your colleagues before the weekend, knowing that major procedures won’t happen until Monday,” he says. “It promotes efficiency, because you can discharge patients on Friday without discharging on Saturday or Sunday, which gets complicated.”
Other ideas that promote efficiency and job satisfaction include running code blues from the ICU, spending only one-half day admitting from the ED, giving night shifts to the doctors who like them, and serving as teaching attendings.
Balancing fiscal discipline with a compensation package that attracts and keeps top-notch pediatric hospitalists isn’t easy; CHCC does it. Hospitalist salaries remain stable, increase, or decrease based on a points accumulation productivity system. For his or her salary to remain stable, a hospitalist needs to earn 300 points monthly by taking admission histories, performing physicals, handling administrative tasks, and so on. The doctors keep records on billing cards; CHCC is moving toward personal digital assistants (PDAs) within the next year or two. The hospitalists are excellent recruiters. They’re hiring last year’s chief resident, and they continue to lure back previous top residents who add to group chemistry.
Children’s Stories
CHCC’s patients present constant challenges for hospitalists, and each young life saved is a story. Vida Vazquez, a one-pound, 10-ounce preemie, spent three months in the NICU and now leads a normal life.
A hospitalist doesn’t have to search her memory for long to find a satisfying case. Dr. Calhoun recently saw a 14-year-old boy with muscular dystrophy and restrictive lung disease who presented with a ruptured appendix.
“His lungs were so bad, and he was so air hungry, with severe stomach distension, but we couldn’t operate on the ruptured appendix because of his other health issues,” she recalls. “He was truly high risk, but we treated him medically and discharged him in seven days. He was smiling, as were the surgeons and the hospitalists, because we got him through it.”
It’s difficult to imagine hospitalists more engaged than CHCC’s. Their professionalism continues to grow. This year they’ve trained to take over sedation duties; they are also managing diabetes ketoacidosis and developing a viral meningitis clinical pathway. Maybe working in starships makes them reach for celestial outcomes. TH
Marlene Piturro regularly writes “Practice Profile.”
Reference
- Mohanty SA, Woolhandler S, Himmelstein DU, et al. Health care expenditures of immigrants in the United States: a nationally representative analysis. Am J Public Health. 2005 Aug:95(8):1431-1438.
Influenza Vaccine Availability
The Centers for Disease Control and Prevention (CDC) recently announced that influenza vaccine manufacturers expect to produce and distribute more than 100 million doses of influenza vaccine in the United States between now and early January 2007. Manufacturers have already begun to ship this season’s influenza vaccine, with almost all of the vaccine expected to be shipped and distributed in by the end of November. Influenza manufacturers and major distributors are implementing policies designed to supply some influenza vaccine to all providers who have ordered it.
“As we’ve learned in the past few years, there is always some uncertainty regarding influenza vaccine supplies and distribution,” says Julie Gerberding, MD, CDC director. “It’s often very difficult to predict how much vaccine will be distributed and when, or exactly when, influenza vaccine will be available for those who provide it. However, if the manufacturers' estimates hold, more people than ever before can protect themselves and their loved ones from influenza this year.”
—Julie Gerberding, MD
Influenza vaccine manufacturers’ estimate of more than 100 million doses is at least 17 million more doses of influenza vaccine than has ever been distributed in the past—the previous record was 83.1 million doses in 2003. The estimate exceeds the 81.2 million doses that were distributed last year by about 19 million. As of press time, about 75 million doses were expected to be distributed by the end of October; if that happens, it will be about 15 million more doses than were distributed by the end of October 2005.
“As our recommendations highlight, there are many people who can benefit from the protection an influenza vaccine can provide, especially healthcare providers, children between six months and … five years of age, people with chronic diseases such as diabetes, asthma, and heart disease, and people 50 years old and older,” says Dr. Gerberding. “Our goal, and the goal of those who provide influenza vaccine, is to use every available dose so that we protect as many people as possible.”

According to Lance Rodewald, MD, director of CDC’s Immunization Services Division, the CDC has been working with influenza vaccine manufacturers and distributors to monitor this season’s influenza vaccine supply and the timing of its distribution. In addition, the Food and Drug Administration (FDA) has successfully worked with vaccine manufacturers to increase both the supply and its diversity and to facilitate early availability.
“When and how much vaccine each healthcare provider or clinic receives depends on who they ordered from and when they ordered,” says Dr. Rodewald. “There are many manufacturers and distributors, each of which has different distribution plans and schedules. We expect that some healthcare providers and clinics may get or have more influenza vaccine than others in the first month or so, but people will have plenty of opportunities to be vaccinated during October and November, as well as December or later.”
While the best time for vaccination is in October and November (before the influenza season typically begins), vaccination can still provide protection in December and beyond because, during most years, influenza does not peak until February or later. Because influenza is unpredictable, and because different strains of influenza circulate throughout the flu season, the CDC’s Advisory Committee on Immunization Practices (ACIP) recommends that influenza vaccine be offered throughout the influenza season—even after influenza has appeared or has begun appearing in a community.
Each year in the United States, between 5%-20% of the population is infected with influenza; about 36,000 people die, and more than 200,000 people are hospitalized because of influenza complications.
Because influenza viruses are continuously changing, the strains of virus included in the influenza vaccine are reevaluated each year, and a new vaccine must be formulated for each season. The vaccine is typically made up of three viruses, including one influenza type B virus and two influenza type A virus strains, and each must be grown individually before the three are combined late in the production process. The strains are usually chosen in February, and the vaccine production and preparation process takes about six to eight months. Distribution of influenza vaccine begins as early as August and typically continues throughout November and December.
The viruses in the 2006-2007 influenza vaccine are:
- An A/New Caledonia/20/99 (H1N1)-like virus;
- An A/Wisconsin/67/2005 (H3N2)-like virus (A/Wisconsin/67/2005and A/Hiroshima/52/2005 strains); and
- AB/Malaysia/2506/2004-like virus (B/Malaysia/2506/2004 and B/Ohio/1/2005 strains)
For more information about influenza and influenza vaccine, visit www.cdc.gov/flu. TH
The Centers for Disease Control and Prevention (CDC) recently announced that influenza vaccine manufacturers expect to produce and distribute more than 100 million doses of influenza vaccine in the United States between now and early January 2007. Manufacturers have already begun to ship this season’s influenza vaccine, with almost all of the vaccine expected to be shipped and distributed in by the end of November. Influenza manufacturers and major distributors are implementing policies designed to supply some influenza vaccine to all providers who have ordered it.
“As we’ve learned in the past few years, there is always some uncertainty regarding influenza vaccine supplies and distribution,” says Julie Gerberding, MD, CDC director. “It’s often very difficult to predict how much vaccine will be distributed and when, or exactly when, influenza vaccine will be available for those who provide it. However, if the manufacturers' estimates hold, more people than ever before can protect themselves and their loved ones from influenza this year.”
—Julie Gerberding, MD
Influenza vaccine manufacturers’ estimate of more than 100 million doses is at least 17 million more doses of influenza vaccine than has ever been distributed in the past—the previous record was 83.1 million doses in 2003. The estimate exceeds the 81.2 million doses that were distributed last year by about 19 million. As of press time, about 75 million doses were expected to be distributed by the end of October; if that happens, it will be about 15 million more doses than were distributed by the end of October 2005.
“As our recommendations highlight, there are many people who can benefit from the protection an influenza vaccine can provide, especially healthcare providers, children between six months and … five years of age, people with chronic diseases such as diabetes, asthma, and heart disease, and people 50 years old and older,” says Dr. Gerberding. “Our goal, and the goal of those who provide influenza vaccine, is to use every available dose so that we protect as many people as possible.”
According to Lance Rodewald, MD, director of CDC’s Immunization Services Division, the CDC has been working with influenza vaccine manufacturers and distributors to monitor this season’s influenza vaccine supply and the timing of its distribution. In addition, the Food and Drug Administration (FDA) has successfully worked with vaccine manufacturers to increase both the supply and its diversity and to facilitate early availability.
“When and how much vaccine each healthcare provider or clinic receives depends on who they ordered from and when they ordered,” says Dr. Rodewald. “There are many manufacturers and distributors, each of which has different distribution plans and schedules. We expect that some healthcare providers and clinics may get or have more influenza vaccine than others in the first month or so, but people will have plenty of opportunities to be vaccinated during October and November, as well as December or later.”
While the best time for vaccination is in October and November (before the influenza season typically begins), vaccination can still provide protection in December and beyond because, during most years, influenza does not peak until February or later. Because influenza is unpredictable, and because different strains of influenza circulate throughout the flu season, the CDC’s Advisory Committee on Immunization Practices (ACIP) recommends that influenza vaccine be offered throughout the influenza season—even after influenza has appeared or has begun appearing in a community.
Each year in the United States, between 5%-20% of the population is infected with influenza; about 36,000 people die, and more than 200,000 people are hospitalized because of influenza complications.
Because influenza viruses are continuously changing, the strains of virus included in the influenza vaccine are reevaluated each year, and a new vaccine must be formulated for each season. The vaccine is typically made up of three viruses, including one influenza type B virus and two influenza type A virus strains, and each must be grown individually before the three are combined late in the production process. The strains are usually chosen in February, and the vaccine production and preparation process takes about six to eight months. Distribution of influenza vaccine begins as early as August and typically continues throughout November and December.
The viruses in the 2006-2007 influenza vaccine are:
- An A/New Caledonia/20/99 (H1N1)-like virus;
- An A/Wisconsin/67/2005 (H3N2)-like virus (A/Wisconsin/67/2005and A/Hiroshima/52/2005 strains); and
- AB/Malaysia/2506/2004-like virus (B/Malaysia/2506/2004 and B/Ohio/1/2005 strains)
For more information about influenza and influenza vaccine, visit www.cdc.gov/flu. TH
Stroke Solution
Patients who arrive in the emergency department (ED) following a cerebrovascular event—stroke or transient ischemic attack—present a number of challenges to the hospitalist. In addition to the varied clinical presentations characteristic of stroke itself, many patients with stroke exhibit a number of cardiovascular risk factors, as well as one or more comorbidities (such as diabetes mellitus). In addition, these patients may be receiving multiple medications.
The risk factors for ischemic stroke are broadly consistent with those for other forms of atherothrombotic cardiovascular disease. Strong evidence from recent observational and interventional studies indicates, however, that patients who experience a stroke or an acute myocardial infarction are likely to experience a recurrent event of the same type.1,2 Therefore, it is appropriate for the clinician to select preventive therapy specifically directed at stroke prevention.
The prevention of secondary stroke is an element of acute care, but it straddles the boundaries among acute care, rehabilitation, and primary care. It is, therefore, an arena that fully engages the skills of the hospitalist. Goals of the hospital physician include the following:
- Minimize the risks of medical complications;
- Ensure an effective continuum of care, with smooth transitions among ED treatment, inpatient care, and long-term management in the community setting; and
- Maintain/improve the quality and consistency of care vis-à-vis adherence to established guidelines for secondary stroke prevention.
Assessment and Risk Evaluation
Initial assessment of patients with suspected stroke or transient ischemic attack seeks to eliminate other possible causes of current or recent neurologic deficit and to confirm the basic nature of the event (ischemic or hemorrhagic). Evidence-based guidelines from the American Stroke Association should be followed in the diagnosis and assessment of these patients in the ED.3
The sophistication of risk evaluation for primary and secondary stroke generally lags behind the evaluation used for cardiac events—a disparity noted by a number of stroke researchers who have called for more extensive epidemiologic studies in support of an adequate risk assessment structure.4-7 The use of the Trial of Org 10172 in Acute Stroke Treatment (TOAST) classification structure for ischemic stroke has provided a better footing for such studies; a similar framework is used to guide treatment pathways for secondary prevention8 (See Table 1, p. 33.)
Recent studies generally support hypertension, cigarette smoking, and atrial fibrillation as strong risk factors for first ischemic stroke; however, few studies have been devoted specifically to analysis of secondary stroke risk factors.5,9 One recent study demonstrated that levels of C-reactive protein are strongly predictive of second events after stroke, with the risk in the highest quintile of C-reactive protein (>1.41 mg/mL) more than eight-fold greater than that in the lowest quintile (£0.12 mg/mL).10
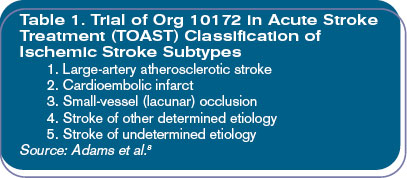
Manage Risk Factors
Several of the risk factors for primary and secondary stroke, including advancing age, male gender, and black and Hispanic racial/ethnic background, are important prognostic determinants. Other important risk factors that are modifiable, at least in theory, include hypertension, smoking, dyslipidemia, obesity, excessive alcohol use, physical inactivity, and impaired glucose tolerance.11
In addition to assessing and managing physical parameters, the clinician should review the patient’s history with regard to contact with the healthcare system. Consider the quality of the patient’s relationship with a primary care provider in light of post-stroke outpatient management. If no such provider exists—or if other concerns are expressed—it may be necessary to help the patient and/or the family in this regard. If evidence reveals that the patient has had problems with medication compliance or regular follow-up, it may be necessary to provide counseling and other support to the patient and family.
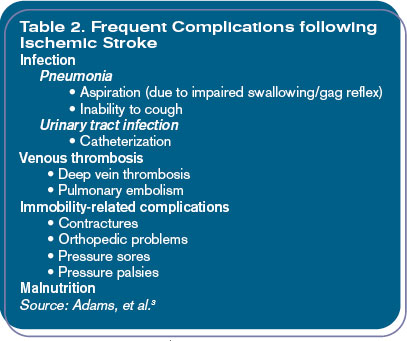
Treatment Decision Making
Approach treatment decisions following stroke or transient ischemic attack in a collaborative, multidisciplinary fashion. The hospitalist should facilitate appropriate consultation and evaluation—not only by neurologists and the medical stroke team but also by physical and/or occupational therapists, speech pathologists, and nutritionists/dieticians as needed. Clarify the roles of the hospital physician, especially in managing the patient through the care continuum systematically, as well as in relation to a specific patient.
Patients with stroke are susceptible to a range of potential complications during hospitalization and beyond—many of which are exacerbated by neurological damage and motor impairment. (See Table 2, p. 34.) These complications are significant contributors to poststroke morbidity and mortality; pulmonary embolism alone accounts for 10% of deaths after stroke, and sepsis secondary to urinary tract infection develops in about 5% of patients with stroke.3
Treatment Approaches
The general approach to secondary stroke prevention should be based on the type of primary stroke that has occurred and should be refined according to specific stroke features and the findings obtained through additional diagnostic workup. (See Table 3, p. 36.)
The nonpharmacologic approach of managing lifestyle-related factors, such as quitting smoking, curbing alcohol consumption, and increasing physical exercise, remains an important element of preventive therapy; patients and their support teams should be encouraged to take an active role in making recommended changes.
As can be seen in Table 3, prevention of secondary events following stroke resulting from a confirmed cardioembolic source is based on anticoagulant (warfarin) therapy. For strokes resulting from carotid atherosclerosis, surgical repair (carotid endarterectomy) is of demonstrated benefit in patients with at least 70% stenosis and should be considered in patients with stenosis greater than 50%. Surgical complication rates can, however, negate any advantage of endarterectomy.11,12
The cornerstone of medical therapy for preventing recurrence after any noncardioembolic ischemic stroke is treatment with antiplatelet (platelet antiaggregation) agents, including aspirin, the thienopyridine derivative clopidogrel, or a combination of aspirin and extended-release dipyridamole.
Studies of aspirin generally suggest that low daily doses provide efficacy comparable or equivalent to that of higher doses, along with a reduced risk for serious adverse events. An example is the Dutch Transient Ischemic Attack (TIA) Trial Study, which randomly assigned 3,131 patients who had experienced a recent stroke or transient ischemic attack to dosages of 30 mg/day or 283 mg/day of aspirin. After a mean follow-up period of 2.6 years, no significant between-group differences were noted with regard to the incidence of the composite outcome measure of vascular death, nonfatal stroke, or nonfatal acute myocardial infarction (14.7% and 15.2%, respectively). However, 24% fewer major bleeding complications and 41% fewer minor bleeding complications were reported with the low dose compared with the higher dose.13
Similarly, the United Kingdom TIA study randomly assigned 2,435 patients with recent transient ischemic attack or minor ischemic stroke to placebo or to aspirin at 1,200 mg/day or 300 mg/day. After a mean follow-up of four years, the aspirin groups were virtually identical with regard to the composite vascular death, nonfatal stroke, or nonfatal acute myocardial infarction endpoint; relative risk reduction for combined aspirin groups versus placebo was 15%. The 1,200 mg/day aspirin group, however, reported a higher rate of upper gastrointestinal symptoms and bleeding episodes.14
Additional support for the efficacy of low-dose aspirin was provided by the Swedish Aspirin Low-Dose Trial (SALT), which randomly assigned 1,360 patients to 75 mg/day of aspirin or a placebo. In aspirin-treated subjects, an 18% reduction versus placebo was observed in the primary endpoint of stroke or death (P=0.02). In addition, aspirin reduced the incidence of a composite secondary outcome (stroke, or two or more transient ischemic attacks within a week, necessitating a change in therapy) by 20% versus placebo (P=0.03).15
The first evaluation of clopidogrel after stroke or transient ischemic attack was the Clopidogrel versus Aspirin in Patients at Risk of Recurrent Ischaemic Events (CAPRIE) study. A total of 19,185 patients with recent stroke/transient ischemic attack, recent myocardial infarction, or peripheral arterial disease were randomly assigned to receive aspirin at 325 mg/day or clopidogrel at 75mg/day; 6,431 patients were in the cerebrovascular disease (stroke/transient ischemic attack) cohort. At follow-up (mean: 1.91 years), a statistically significant benefit was seen for clopidogrel over aspirin in the composite endpoint of ischemic stroke, acute myocardial infarction, or vascular death among all patients (annual incidence rates for composite outcome: clopidogrel, 5.32%; aspirin, 5.83%; absolute risk reduction 0.51%; relative risk reduction 8.7%; P=0.043). The CAPRIE cohort data does show that much of the difference favoring clopidogrel over aspirin was derived from the peripheral artery disease group (relative risk reduction 3.8%; P=0.0028). In the stroke/transient ischemic attack cohort, comparative risk reduction for the composite endpoint was reduced and not statistically significant (relative risk reduction 7.3%; P=0.26).16
The Management of Atherosclerosis with Clopidogrel in High-Risk Patients (MATCH) study was an evaluation of clopidogrel versus clopidogrel plus aspirin in the prevention of secondary stroke. Seven thousand five hundred ninety-nine patients with a history of stroke or transient ischemic attack and other vascular risk factors were randomly assigned to clopidogrel alone or clopidogrel plus aspirin. After a mean follow-up of 18 months, the clopidogrel plus aspirin combination group demonstrated only an insignificant benefit in the composite outcome of rehospitalization for an ischemic event, ischemic stroke, acute myocardial infarction, or vascular death (clopidogrel plus aspirin 15.70%; clopidogrel monotherapy 16.73%; relative risk reduction 6.4%; P=0.244).13 In addition, the clopidogrel plus aspirin combination produced an increased absolute incidence of life-threatening bleeding episodes versus clopidogrel alone (2.6% versus 1.3%) that was greater than the absolute reduction in efficacy outcome events. Therefore, the combination of clopidogrel plus aspirin is not recommended for secondary event prevention after stroke or transient ischemic attack.17,18
In the recently reported Clopidogrel for High Risk and Ischemic Stabilization, Management, and Avoidance (CHARISMA) study, patients with documented coronary disease, cerebrovascular disease, or peripheral artery disease were administered either clopidogrel (75 mg/day) plus aspirin (75–162 mg/day) or aspirin alone.19 The study also included patients with multiple atherosclerotic risk factors but without documented arterial disease.
There was no significant difference between treatment arms regarding the primary composite endpoint of myocardial infarction, stroke, or cardiovascular death. Prespecified subgroup analyses showed a 1% absolute decrease in the incidence of the primary endpoint in patients with documented vascular disease (P=0.046) and an increase of 1.1% in the asymptomatic patients with multiple vascular risk factors (P=0.20) among those patients randomized to combination therapy. Severe bleeding (defined as fatal bleeding, intracranial hemorrhage, or bleeding causing hemodynamic compromise) occurred in 1.7% of patients in the combination therapy arm and 1.3% in the aspirin arm (P=0.09). Moderate bleeding, defined as that necessitating transfusion but not meeting the criteria for severe bleeding, occurred in 2.1% of patients in the combination therapy arm and 1.3% in the aspirin arm (P<0.001). The investigators concluded that clopidogrel plus aspirin provided no significant advantage over aspirin alone in reducing incidence of the primary combined endpoint.
Extended-release dipyridamole in combination with aspirin was evaluated in the European Stroke Prevention Study-2 (ESPS-2). The combination was compared with aspirin alone and with dipyridamole alone, as well as with placebo, in 6,602 patients with a history of stroke or transient ischemic attack. Extended-release dipyridamole and aspirin monotherapy showed similar efficacy in reducing the risk of stroke (relative risk reduction versus placebo: aspirin 18%, P=0.013; extended-release dipyridamole 16%, P=0.039). The extended-release dipyridamole plus aspirin combination, however, showed evidence of additive benefit; the relative risk reduction for stroke with extended-release dipyridamole plus aspirin was 23% versus aspirin alone (P=0.006) and 25% versus extended-release dipyridamole alone (P=0.002). Compared with placebo, the extended-release dipyridamole plus aspirin combination was associated with relative risk reductions of 37% (P<0.001) for stroke and 24% (P<0.001) for stroke or death. This combination reduced the relative risk of stroke over aspirin alone by 23%.20
Despite the apparent additive benefit derived from extended-release dipyridamole plus aspirin, no evidence was found for an increase in adverse outcomes. Adverse gastrointestinal events in the combination therapy group were comparable with those noted with aspirin monotherapy, with an increased incidence of headache.20
As in ESPS-2, the European/Australian Stroke Prevention in Reversible Ischemia Trial (ESPRIT) investigated the combination of aspirin and dipyridamole (principally extended-release dipyridamole). Using a primary combined endpoint of vascular death, nonfatal stroke, nonfatal myocardial infarction, and major bleeding complications, ESPRIT confirmed aspirin plus dipyridamole to be superior to aspirin monotherapy in reducing these complications.21 An overall risk ratio of 0.82 for the composite endpoint (P=0.0003) was determined in a meta-analysis of the trials comparing aspirin alone to aspirin plus dipyridamole.21 (See Figure 1, p. 39.)
An in-progress prospective secondary stroke prevention study, the Prospective Regimen for Effectively Avoiding Second Strokes (PRoFESS) study, which consists of 15,500 patients with a recent history of ischemic stroke, will provide the first head-to-head comparison of clopidogrel monotherapy with the extended-release dipyridamole plus aspirin combination. The two antiplatelet regimens will be evaluated through a 2 x 2 design in the presence and in the absence of the antihypertensive telmisartan, with results expected in 2007. PRoFESS findings should help to clarify the comparative efficacy of clopidogrel versus extended-release dipyridamole plus aspirin with regard to the primary endpoint (time to first stroke recurrence) and a vascular events composite endpoint.
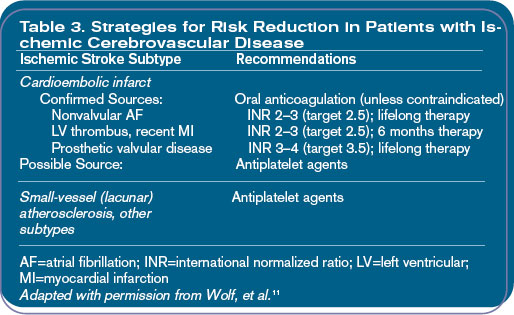
Antiplatelet Treatment Guidelines
The American Academy of Neurology guidelines recommend the use of aspirin within 48 hours of stroke symptom onset (except when tissue plasminogen activator treatment has been used or is anticipated) to reduce mortality and prevent early stroke recurrence.22 A more extensive set of evidence-based guidelines for antiplatelet and antithrombotic use following ischemic stroke, including recommendations for secondary event prevention, was developed in 2004 by the American College of Chest Physicians (ACCP).23 The primary recommendation (Grade 1A) is to provide treatment with an antiplatelet agent (i.e., aspirin at 50 to 325 mg/day, extended-release dipyridamole at 200 mg plus aspirin at 25 mg twice daily, or clopidogrel at 75 mg/day) following noncardioembolic stroke. The ACCP has also suggested that extended-release dipyridamole plus aspirin (Grade 2A) or clopidogrel (Grade 2B) may be preferable to aspirin monotherapy. This suggestion does include the caveat that this “places a relatively high value on a small absolute risk reduction in stroke rates, and a relatively low value on minimizing drug expenditures.”23
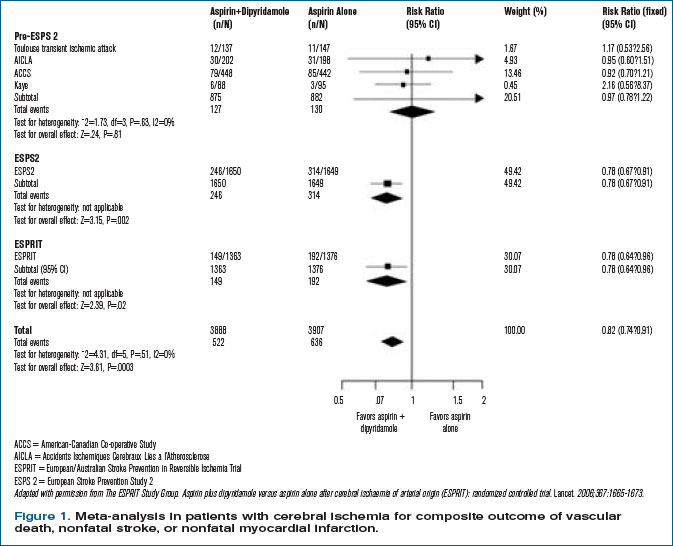
Discharge Planning
When the post-stroke patient is prepared for discharge, place the highest priority on ensuring an effective continuum of care. Comprehensively review all medications, including those prescribed for prevention of secondary events, with the patient and family or caregivers. Explain the purpose of each medication, along with the consequences of poor compliance or discontinuation; reinforce the need for lifelong therapy for stroke prevention and amelioration of stroke risk factors at every opportunity.
A key step in establishing the continuum of care is to gain buy-in from the primary care provider for continuing medical therapy and follow-up. If appropriate, cite current guidelines from the American Academy of Neurology, the American College of Chest Physicians, and the American Stroke Association. Occupational or physical therapy, if indicated, should be planned before discharge and coordinated with the primary care provider for continued follow-up. This evaluation may also result in a recommendation for inpatient rehabilitation or, in the interim, a skilled nursing facility placement.
Given the improvement that many patients realize over the short term, staged discharge to a skilled nursing facility may be followed after a short interval by a stay at an inpatient rehabilitation facility. Coordination of this staged approach must be carefully implemented, as it is easy for this to fall through the cracks during transitions of care.
Conclusion: Stroke Centers and Systems of Care
Managing patients with stroke is in many ways an ideal fit for the hospitalist model. From symptom onset, the patient with stroke challenges traditional approaches to care in multiple ways: variable presentation involving multiple neurologic symptoms, frequent systemic comorbidities and risk factors, highly variable disease course and sequelae, and the need for active and coordinated management throughout the continuum of care. The hospital physician should seek to improve the value of care by ensuring and facilitating consistent management according to established guidelines and by managing the transitions between phases of treatment.
SHM provides numerous valuable tools to the hospital physician for use in improving the care of patients with stroke, including diagnostic and assessment instruments and guidelines, algorithms and pathways for management of patients with stroke, sample standing orders from leading institutions, and resources that can be provided to patients and their families. All are available or downloadable from the SHM Web site, at www.hospitalmedicine.org/AM/Template.cfm?Section=Quality_Improvement_Resource_ Rooms&Template=/ CM/HTMLDisplay.cfm&ContentID=6566. Even (or perhaps especially) in the absence of higher-level systems dedicated to the care of patients with stroke, the hospital physician can serve as a critical linchpin in the optimization of patient outcomes following stroke. TH
Dr. Likosky is executive director, Evergreen Neuroscience Institute, Kirkland, Wash., as well as a hospitalist and neurohospitalist.
References
- Gebel JM Jr. Secondary stroke prevention with antiplatelet therapy with emphasis on the cardiac patient: a neurologist’s view. J Am Coll Cardiol. 2005 Sep 6;46(5):752-755.
- Vickrey BG, Rector TS, Wickstrom SL, et al. Occurrence of secondary ischemic events among persons with atherosclerotic vascular disease. Stroke. 2002 Apr;33(4):901-906.
- Adams HP Jr, Adams RJ, Brott T, et al. Guidelines for the early management of patients with ischemic stroke: A scientific statement from the Stroke Council of the American Stroke Association. Stroke. 2003 Apr;34(4):1056-1083.
- Leira EC, Chang KC, Davis PH, et al. Can we predict early recurrence in acute stroke? Cerebrovasc Dis. 2004;18(2):139-144.
- Pinto A, Tuttolomondo A, Di Raimondo D, et al. Cerebrovascular risk factors and clinical classification of strokes. Semin Vasc Med. 2004 Aug;4(3):287-303.
- Rothwell PM. Incidence, risk factors and prognosis of stroke and TIA: the need for high-quality, large-scale epidemiological studies and meta-analyses. Cerebrovasc Dis. 2003;16(Suppl 3):2-10.
- Schulz UG, Rothwell PM. Differences in vascular risk factors between etiological subtypes of ischemic stroke: importance of population-based studies. Stroke. 2003 Aug;34(8):2050-2059; Epub 2003 Jun 26.
- Adams HP Jr, Bendixen BH, Kappelle LJ, et al. Classification of subtype of acute ischemic stroke. Definitions for use in a multicenter clinical trial. TOAST. Trial of Org 10172 in Acute Stroke Treatment. Stroke. 1993 Jan;24(1):35-41.
- Sacco RL, Benjamin EJ, Broderick JP, et al. American Heart Association Prevention Conference. IV. Prevention and rehabilitation of stroke. Risk factors. Stroke. 1997;28:1507-1517.
- Arenillas JF, Alvarez-Sabin J, Molina CA, et al. C-reactive protein predicts further ischemic events in first-ever transient ischemic attack or stroke patients with intracranial large-artery occlusive disease. Stroke. 2003 Oct;34(10):2463-2468.
- Wolf PA, Clagett GP, Easton JD, et al. Preventing ischemic stroke in patients with prior stroke and transient ischemic attack: a statement for healthcare professionals from the Stroke Council of the American Heart Association. Stroke. 1999;30:1991-1994.
- Chaturvedi S, Bruno A, Feasby T, et al. Carotid endarterectomy—an evidence-based review: report of the Therapeutics and Technology Assessment Sub-committee of the American Academy of Neurology. Neurology. 2005 Sep 27;65(6):794-801.
- The Dutch TIA Trial Study Group. A comparison of two doses of aspirin (30 mg vs. 283 mg a day) in patients after a transient ischemic attack or minor ischemic stroke. N Engl J Med. 1991;325:1261-1266.
- Farrell B, Godwin J, Richards S, et al. The United Kingdom transient ischaemic attack (UK-TIA) aspirin trial: final results. J Neurol Neurosurg Psychiatry. 1991 Dec;54(12):1044-1054.
- The SALT Collaborative Group. Swedish Aspirin Low-Dose Trial (SALT) of 75 mg aspirin as secondary prophylaxis after cerebrovascular ischaemic events. Lancet. 1991 Nov 30;338(8779):1345-1349.
- CAPRIE Steering Committee. A randomised, blinded trial of clopidogrel versus aspirin in patients at risk of ischaemic events (CAPRIE). Lancet. 1996 Nov 16;348(9038):1329-1339.
- Diener HC, Bogousslavsky J, Brass LM, et al. Aspirin and clopidogrel compared with clopidogrel alone after recent ischaemic stroke or transient ischaemic attack in high-risk patients (MATCH): randomised, double-blind, placebo-controlled trial. Lancet. 2004;364:331-337.
- Hankey GJ, Eikelboom JW. Adding aspirin to clopidogrel after TIA and ischemic stroke: benefits do not match risks. Neurology. 2005 Apr 12;64(7):1117-1121.
- Bhatt DL, Fox KA, Hacke W, et al; CHARISMA Investigators. Clopidogrel and aspirin versus aspirin alone for the prevention of atherothrombotic events. N Engl J Med. 2006 Apr 20;354(16):1706-1717.
- Diener HC, Cunha L, Forbes C, et al. European Stroke Prevention Study. 2. Dipyridamole and acetylsalicylic acid in the secondary prevention of stroke. J Neurol Sci. 1996 Nov;143(1-2):1-13.
- Halkes PH, van Gijn J, Kappelle LJ, et al. (ESPRIT Study Group). Aspirin plus dipyridamole versus aspirin alone after cerebral ischaemia of arterial origin (ESPRIT): randomised controlled trial. Lancet. 2006 May 20;367(9523):1665-1673.
- Coull BM, Williams LS, Goldstein LB, et al. Anticoagulants and antiplatelet agents in acute ischemic stroke: report of the Joint Stroke Guideline Development Committee of the American Academy of Neurology and the American Stroke Association (a division of the American Heart Association). Neurology. 2002 Jul 9;59(1):13-22.
- Albers GW, Amarenco P, Easton JD, et al. Antithrombotic and thrombolytic therapy for ischemic stroke: the Seventh ACCP Conference on Antithrombotic and Thrombolytic Therapy. Chest. 2004 Sep;126(3 Suppl):483S-512S.
Patients who arrive in the emergency department (ED) following a cerebrovascular event—stroke or transient ischemic attack—present a number of challenges to the hospitalist. In addition to the varied clinical presentations characteristic of stroke itself, many patients with stroke exhibit a number of cardiovascular risk factors, as well as one or more comorbidities (such as diabetes mellitus). In addition, these patients may be receiving multiple medications.
The risk factors for ischemic stroke are broadly consistent with those for other forms of atherothrombotic cardiovascular disease. Strong evidence from recent observational and interventional studies indicates, however, that patients who experience a stroke or an acute myocardial infarction are likely to experience a recurrent event of the same type.1,2 Therefore, it is appropriate for the clinician to select preventive therapy specifically directed at stroke prevention.
The prevention of secondary stroke is an element of acute care, but it straddles the boundaries among acute care, rehabilitation, and primary care. It is, therefore, an arena that fully engages the skills of the hospitalist. Goals of the hospital physician include the following:
- Minimize the risks of medical complications;
- Ensure an effective continuum of care, with smooth transitions among ED treatment, inpatient care, and long-term management in the community setting; and
- Maintain/improve the quality and consistency of care vis-à-vis adherence to established guidelines for secondary stroke prevention.
Assessment and Risk Evaluation
Initial assessment of patients with suspected stroke or transient ischemic attack seeks to eliminate other possible causes of current or recent neurologic deficit and to confirm the basic nature of the event (ischemic or hemorrhagic). Evidence-based guidelines from the American Stroke Association should be followed in the diagnosis and assessment of these patients in the ED.3
The sophistication of risk evaluation for primary and secondary stroke generally lags behind the evaluation used for cardiac events—a disparity noted by a number of stroke researchers who have called for more extensive epidemiologic studies in support of an adequate risk assessment structure.4-7 The use of the Trial of Org 10172 in Acute Stroke Treatment (TOAST) classification structure for ischemic stroke has provided a better footing for such studies; a similar framework is used to guide treatment pathways for secondary prevention8 (See Table 1, p. 33.)
Recent studies generally support hypertension, cigarette smoking, and atrial fibrillation as strong risk factors for first ischemic stroke; however, few studies have been devoted specifically to analysis of secondary stroke risk factors.5,9 One recent study demonstrated that levels of C-reactive protein are strongly predictive of second events after stroke, with the risk in the highest quintile of C-reactive protein (>1.41 mg/mL) more than eight-fold greater than that in the lowest quintile (£0.12 mg/mL).10
Manage Risk Factors
Several of the risk factors for primary and secondary stroke, including advancing age, male gender, and black and Hispanic racial/ethnic background, are important prognostic determinants. Other important risk factors that are modifiable, at least in theory, include hypertension, smoking, dyslipidemia, obesity, excessive alcohol use, physical inactivity, and impaired glucose tolerance.11
In addition to assessing and managing physical parameters, the clinician should review the patient’s history with regard to contact with the healthcare system. Consider the quality of the patient’s relationship with a primary care provider in light of post-stroke outpatient management. If no such provider exists—or if other concerns are expressed—it may be necessary to help the patient and/or the family in this regard. If evidence reveals that the patient has had problems with medication compliance or regular follow-up, it may be necessary to provide counseling and other support to the patient and family.
Treatment Decision Making
Approach treatment decisions following stroke or transient ischemic attack in a collaborative, multidisciplinary fashion. The hospitalist should facilitate appropriate consultation and evaluation—not only by neurologists and the medical stroke team but also by physical and/or occupational therapists, speech pathologists, and nutritionists/dieticians as needed. Clarify the roles of the hospital physician, especially in managing the patient through the care continuum systematically, as well as in relation to a specific patient.
Patients with stroke are susceptible to a range of potential complications during hospitalization and beyond—many of which are exacerbated by neurological damage and motor impairment. (See Table 2, p. 34.) These complications are significant contributors to poststroke morbidity and mortality; pulmonary embolism alone accounts for 10% of deaths after stroke, and sepsis secondary to urinary tract infection develops in about 5% of patients with stroke.3
Treatment Approaches
The general approach to secondary stroke prevention should be based on the type of primary stroke that has occurred and should be refined according to specific stroke features and the findings obtained through additional diagnostic workup. (See Table 3, p. 36.)
The nonpharmacologic approach of managing lifestyle-related factors, such as quitting smoking, curbing alcohol consumption, and increasing physical exercise, remains an important element of preventive therapy; patients and their support teams should be encouraged to take an active role in making recommended changes.
As can be seen in Table 3, prevention of secondary events following stroke resulting from a confirmed cardioembolic source is based on anticoagulant (warfarin) therapy. For strokes resulting from carotid atherosclerosis, surgical repair (carotid endarterectomy) is of demonstrated benefit in patients with at least 70% stenosis and should be considered in patients with stenosis greater than 50%. Surgical complication rates can, however, negate any advantage of endarterectomy.11,12
The cornerstone of medical therapy for preventing recurrence after any noncardioembolic ischemic stroke is treatment with antiplatelet (platelet antiaggregation) agents, including aspirin, the thienopyridine derivative clopidogrel, or a combination of aspirin and extended-release dipyridamole.
Studies of aspirin generally suggest that low daily doses provide efficacy comparable or equivalent to that of higher doses, along with a reduced risk for serious adverse events. An example is the Dutch Transient Ischemic Attack (TIA) Trial Study, which randomly assigned 3,131 patients who had experienced a recent stroke or transient ischemic attack to dosages of 30 mg/day or 283 mg/day of aspirin. After a mean follow-up period of 2.6 years, no significant between-group differences were noted with regard to the incidence of the composite outcome measure of vascular death, nonfatal stroke, or nonfatal acute myocardial infarction (14.7% and 15.2%, respectively). However, 24% fewer major bleeding complications and 41% fewer minor bleeding complications were reported with the low dose compared with the higher dose.13
Similarly, the United Kingdom TIA study randomly assigned 2,435 patients with recent transient ischemic attack or minor ischemic stroke to placebo or to aspirin at 1,200 mg/day or 300 mg/day. After a mean follow-up of four years, the aspirin groups were virtually identical with regard to the composite vascular death, nonfatal stroke, or nonfatal acute myocardial infarction endpoint; relative risk reduction for combined aspirin groups versus placebo was 15%. The 1,200 mg/day aspirin group, however, reported a higher rate of upper gastrointestinal symptoms and bleeding episodes.14
Additional support for the efficacy of low-dose aspirin was provided by the Swedish Aspirin Low-Dose Trial (SALT), which randomly assigned 1,360 patients to 75 mg/day of aspirin or a placebo. In aspirin-treated subjects, an 18% reduction versus placebo was observed in the primary endpoint of stroke or death (P=0.02). In addition, aspirin reduced the incidence of a composite secondary outcome (stroke, or two or more transient ischemic attacks within a week, necessitating a change in therapy) by 20% versus placebo (P=0.03).15
The first evaluation of clopidogrel after stroke or transient ischemic attack was the Clopidogrel versus Aspirin in Patients at Risk of Recurrent Ischaemic Events (CAPRIE) study. A total of 19,185 patients with recent stroke/transient ischemic attack, recent myocardial infarction, or peripheral arterial disease were randomly assigned to receive aspirin at 325 mg/day or clopidogrel at 75mg/day; 6,431 patients were in the cerebrovascular disease (stroke/transient ischemic attack) cohort. At follow-up (mean: 1.91 years), a statistically significant benefit was seen for clopidogrel over aspirin in the composite endpoint of ischemic stroke, acute myocardial infarction, or vascular death among all patients (annual incidence rates for composite outcome: clopidogrel, 5.32%; aspirin, 5.83%; absolute risk reduction 0.51%; relative risk reduction 8.7%; P=0.043). The CAPRIE cohort data does show that much of the difference favoring clopidogrel over aspirin was derived from the peripheral artery disease group (relative risk reduction 3.8%; P=0.0028). In the stroke/transient ischemic attack cohort, comparative risk reduction for the composite endpoint was reduced and not statistically significant (relative risk reduction 7.3%; P=0.26).16
The Management of Atherosclerosis with Clopidogrel in High-Risk Patients (MATCH) study was an evaluation of clopidogrel versus clopidogrel plus aspirin in the prevention of secondary stroke. Seven thousand five hundred ninety-nine patients with a history of stroke or transient ischemic attack and other vascular risk factors were randomly assigned to clopidogrel alone or clopidogrel plus aspirin. After a mean follow-up of 18 months, the clopidogrel plus aspirin combination group demonstrated only an insignificant benefit in the composite outcome of rehospitalization for an ischemic event, ischemic stroke, acute myocardial infarction, or vascular death (clopidogrel plus aspirin 15.70%; clopidogrel monotherapy 16.73%; relative risk reduction 6.4%; P=0.244).13 In addition, the clopidogrel plus aspirin combination produced an increased absolute incidence of life-threatening bleeding episodes versus clopidogrel alone (2.6% versus 1.3%) that was greater than the absolute reduction in efficacy outcome events. Therefore, the combination of clopidogrel plus aspirin is not recommended for secondary event prevention after stroke or transient ischemic attack.17,18
In the recently reported Clopidogrel for High Risk and Ischemic Stabilization, Management, and Avoidance (CHARISMA) study, patients with documented coronary disease, cerebrovascular disease, or peripheral artery disease were administered either clopidogrel (75 mg/day) plus aspirin (75–162 mg/day) or aspirin alone.19 The study also included patients with multiple atherosclerotic risk factors but without documented arterial disease.
There was no significant difference between treatment arms regarding the primary composite endpoint of myocardial infarction, stroke, or cardiovascular death. Prespecified subgroup analyses showed a 1% absolute decrease in the incidence of the primary endpoint in patients with documented vascular disease (P=0.046) and an increase of 1.1% in the asymptomatic patients with multiple vascular risk factors (P=0.20) among those patients randomized to combination therapy. Severe bleeding (defined as fatal bleeding, intracranial hemorrhage, or bleeding causing hemodynamic compromise) occurred in 1.7% of patients in the combination therapy arm and 1.3% in the aspirin arm (P=0.09). Moderate bleeding, defined as that necessitating transfusion but not meeting the criteria for severe bleeding, occurred in 2.1% of patients in the combination therapy arm and 1.3% in the aspirin arm (P<0.001). The investigators concluded that clopidogrel plus aspirin provided no significant advantage over aspirin alone in reducing incidence of the primary combined endpoint.
Extended-release dipyridamole in combination with aspirin was evaluated in the European Stroke Prevention Study-2 (ESPS-2). The combination was compared with aspirin alone and with dipyridamole alone, as well as with placebo, in 6,602 patients with a history of stroke or transient ischemic attack. Extended-release dipyridamole and aspirin monotherapy showed similar efficacy in reducing the risk of stroke (relative risk reduction versus placebo: aspirin 18%, P=0.013; extended-release dipyridamole 16%, P=0.039). The extended-release dipyridamole plus aspirin combination, however, showed evidence of additive benefit; the relative risk reduction for stroke with extended-release dipyridamole plus aspirin was 23% versus aspirin alone (P=0.006) and 25% versus extended-release dipyridamole alone (P=0.002). Compared with placebo, the extended-release dipyridamole plus aspirin combination was associated with relative risk reductions of 37% (P<0.001) for stroke and 24% (P<0.001) for stroke or death. This combination reduced the relative risk of stroke over aspirin alone by 23%.20
Despite the apparent additive benefit derived from extended-release dipyridamole plus aspirin, no evidence was found for an increase in adverse outcomes. Adverse gastrointestinal events in the combination therapy group were comparable with those noted with aspirin monotherapy, with an increased incidence of headache.20
As in ESPS-2, the European/Australian Stroke Prevention in Reversible Ischemia Trial (ESPRIT) investigated the combination of aspirin and dipyridamole (principally extended-release dipyridamole). Using a primary combined endpoint of vascular death, nonfatal stroke, nonfatal myocardial infarction, and major bleeding complications, ESPRIT confirmed aspirin plus dipyridamole to be superior to aspirin monotherapy in reducing these complications.21 An overall risk ratio of 0.82 for the composite endpoint (P=0.0003) was determined in a meta-analysis of the trials comparing aspirin alone to aspirin plus dipyridamole.21 (See Figure 1, p. 39.)
An in-progress prospective secondary stroke prevention study, the Prospective Regimen for Effectively Avoiding Second Strokes (PRoFESS) study, which consists of 15,500 patients with a recent history of ischemic stroke, will provide the first head-to-head comparison of clopidogrel monotherapy with the extended-release dipyridamole plus aspirin combination. The two antiplatelet regimens will be evaluated through a 2 x 2 design in the presence and in the absence of the antihypertensive telmisartan, with results expected in 2007. PRoFESS findings should help to clarify the comparative efficacy of clopidogrel versus extended-release dipyridamole plus aspirin with regard to the primary endpoint (time to first stroke recurrence) and a vascular events composite endpoint.
Antiplatelet Treatment Guidelines
The American Academy of Neurology guidelines recommend the use of aspirin within 48 hours of stroke symptom onset (except when tissue plasminogen activator treatment has been used or is anticipated) to reduce mortality and prevent early stroke recurrence.22 A more extensive set of evidence-based guidelines for antiplatelet and antithrombotic use following ischemic stroke, including recommendations for secondary event prevention, was developed in 2004 by the American College of Chest Physicians (ACCP).23 The primary recommendation (Grade 1A) is to provide treatment with an antiplatelet agent (i.e., aspirin at 50 to 325 mg/day, extended-release dipyridamole at 200 mg plus aspirin at 25 mg twice daily, or clopidogrel at 75 mg/day) following noncardioembolic stroke. The ACCP has also suggested that extended-release dipyridamole plus aspirin (Grade 2A) or clopidogrel (Grade 2B) may be preferable to aspirin monotherapy. This suggestion does include the caveat that this “places a relatively high value on a small absolute risk reduction in stroke rates, and a relatively low value on minimizing drug expenditures.”23
Discharge Planning
When the post-stroke patient is prepared for discharge, place the highest priority on ensuring an effective continuum of care. Comprehensively review all medications, including those prescribed for prevention of secondary events, with the patient and family or caregivers. Explain the purpose of each medication, along with the consequences of poor compliance or discontinuation; reinforce the need for lifelong therapy for stroke prevention and amelioration of stroke risk factors at every opportunity.
A key step in establishing the continuum of care is to gain buy-in from the primary care provider for continuing medical therapy and follow-up. If appropriate, cite current guidelines from the American Academy of Neurology, the American College of Chest Physicians, and the American Stroke Association. Occupational or physical therapy, if indicated, should be planned before discharge and coordinated with the primary care provider for continued follow-up. This evaluation may also result in a recommendation for inpatient rehabilitation or, in the interim, a skilled nursing facility placement.
Given the improvement that many patients realize over the short term, staged discharge to a skilled nursing facility may be followed after a short interval by a stay at an inpatient rehabilitation facility. Coordination of this staged approach must be carefully implemented, as it is easy for this to fall through the cracks during transitions of care.
Conclusion: Stroke Centers and Systems of Care
Managing patients with stroke is in many ways an ideal fit for the hospitalist model. From symptom onset, the patient with stroke challenges traditional approaches to care in multiple ways: variable presentation involving multiple neurologic symptoms, frequent systemic comorbidities and risk factors, highly variable disease course and sequelae, and the need for active and coordinated management throughout the continuum of care. The hospital physician should seek to improve the value of care by ensuring and facilitating consistent management according to established guidelines and by managing the transitions between phases of treatment.
SHM provides numerous valuable tools to the hospital physician for use in improving the care of patients with stroke, including diagnostic and assessment instruments and guidelines, algorithms and pathways for management of patients with stroke, sample standing orders from leading institutions, and resources that can be provided to patients and their families. All are available or downloadable from the SHM Web site, at www.hospitalmedicine.org/AM/Template.cfm?Section=Quality_Improvement_Resource_ Rooms&Template=/ CM/HTMLDisplay.cfm&ContentID=6566. Even (or perhaps especially) in the absence of higher-level systems dedicated to the care of patients with stroke, the hospital physician can serve as a critical linchpin in the optimization of patient outcomes following stroke. TH
Dr. Likosky is executive director, Evergreen Neuroscience Institute, Kirkland, Wash., as well as a hospitalist and neurohospitalist.
References
- Gebel JM Jr. Secondary stroke prevention with antiplatelet therapy with emphasis on the cardiac patient: a neurologist’s view. J Am Coll Cardiol. 2005 Sep 6;46(5):752-755.
- Vickrey BG, Rector TS, Wickstrom SL, et al. Occurrence of secondary ischemic events among persons with atherosclerotic vascular disease. Stroke. 2002 Apr;33(4):901-906.
- Adams HP Jr, Adams RJ, Brott T, et al. Guidelines for the early management of patients with ischemic stroke: A scientific statement from the Stroke Council of the American Stroke Association. Stroke. 2003 Apr;34(4):1056-1083.
- Leira EC, Chang KC, Davis PH, et al. Can we predict early recurrence in acute stroke? Cerebrovasc Dis. 2004;18(2):139-144.
- Pinto A, Tuttolomondo A, Di Raimondo D, et al. Cerebrovascular risk factors and clinical classification of strokes. Semin Vasc Med. 2004 Aug;4(3):287-303.
- Rothwell PM. Incidence, risk factors and prognosis of stroke and TIA: the need for high-quality, large-scale epidemiological studies and meta-analyses. Cerebrovasc Dis. 2003;16(Suppl 3):2-10.
- Schulz UG, Rothwell PM. Differences in vascular risk factors between etiological subtypes of ischemic stroke: importance of population-based studies. Stroke. 2003 Aug;34(8):2050-2059; Epub 2003 Jun 26.
- Adams HP Jr, Bendixen BH, Kappelle LJ, et al. Classification of subtype of acute ischemic stroke. Definitions for use in a multicenter clinical trial. TOAST. Trial of Org 10172 in Acute Stroke Treatment. Stroke. 1993 Jan;24(1):35-41.
- Sacco RL, Benjamin EJ, Broderick JP, et al. American Heart Association Prevention Conference. IV. Prevention and rehabilitation of stroke. Risk factors. Stroke. 1997;28:1507-1517.
- Arenillas JF, Alvarez-Sabin J, Molina CA, et al. C-reactive protein predicts further ischemic events in first-ever transient ischemic attack or stroke patients with intracranial large-artery occlusive disease. Stroke. 2003 Oct;34(10):2463-2468.
- Wolf PA, Clagett GP, Easton JD, et al. Preventing ischemic stroke in patients with prior stroke and transient ischemic attack: a statement for healthcare professionals from the Stroke Council of the American Heart Association. Stroke. 1999;30:1991-1994.
- Chaturvedi S, Bruno A, Feasby T, et al. Carotid endarterectomy—an evidence-based review: report of the Therapeutics and Technology Assessment Sub-committee of the American Academy of Neurology. Neurology. 2005 Sep 27;65(6):794-801.
- The Dutch TIA Trial Study Group. A comparison of two doses of aspirin (30 mg vs. 283 mg a day) in patients after a transient ischemic attack or minor ischemic stroke. N Engl J Med. 1991;325:1261-1266.
- Farrell B, Godwin J, Richards S, et al. The United Kingdom transient ischaemic attack (UK-TIA) aspirin trial: final results. J Neurol Neurosurg Psychiatry. 1991 Dec;54(12):1044-1054.
- The SALT Collaborative Group. Swedish Aspirin Low-Dose Trial (SALT) of 75 mg aspirin as secondary prophylaxis after cerebrovascular ischaemic events. Lancet. 1991 Nov 30;338(8779):1345-1349.
- CAPRIE Steering Committee. A randomised, blinded trial of clopidogrel versus aspirin in patients at risk of ischaemic events (CAPRIE). Lancet. 1996 Nov 16;348(9038):1329-1339.
- Diener HC, Bogousslavsky J, Brass LM, et al. Aspirin and clopidogrel compared with clopidogrel alone after recent ischaemic stroke or transient ischaemic attack in high-risk patients (MATCH): randomised, double-blind, placebo-controlled trial. Lancet. 2004;364:331-337.
- Hankey GJ, Eikelboom JW. Adding aspirin to clopidogrel after TIA and ischemic stroke: benefits do not match risks. Neurology. 2005 Apr 12;64(7):1117-1121.
- Bhatt DL, Fox KA, Hacke W, et al; CHARISMA Investigators. Clopidogrel and aspirin versus aspirin alone for the prevention of atherothrombotic events. N Engl J Med. 2006 Apr 20;354(16):1706-1717.
- Diener HC, Cunha L, Forbes C, et al. European Stroke Prevention Study. 2. Dipyridamole and acetylsalicylic acid in the secondary prevention of stroke. J Neurol Sci. 1996 Nov;143(1-2):1-13.
- Halkes PH, van Gijn J, Kappelle LJ, et al. (ESPRIT Study Group). Aspirin plus dipyridamole versus aspirin alone after cerebral ischaemia of arterial origin (ESPRIT): randomised controlled trial. Lancet. 2006 May 20;367(9523):1665-1673.
- Coull BM, Williams LS, Goldstein LB, et al. Anticoagulants and antiplatelet agents in acute ischemic stroke: report of the Joint Stroke Guideline Development Committee of the American Academy of Neurology and the American Stroke Association (a division of the American Heart Association). Neurology. 2002 Jul 9;59(1):13-22.
- Albers GW, Amarenco P, Easton JD, et al. Antithrombotic and thrombolytic therapy for ischemic stroke: the Seventh ACCP Conference on Antithrombotic and Thrombolytic Therapy. Chest. 2004 Sep;126(3 Suppl):483S-512S.
Robot Pharmd
One way to reduce medication errors in your hospital pharmacy is to put a robot in charge of stocking and dispensing medication doses. Roughly 300 U.S. hospitals have done just that and have, as a result, seen their in-pharmacy errors drop significantly. In this instance, robots simply don’t make mistakes.
Manufactured by McKesson Automation of Pittsburgh, Pa., ROBOT-Rx is the lead robot: McKesson estimates that 97% to 98% of hospital pharmacies with a medication-dispensing robot are using their product. ROBOT-Rx units installed in hospitals collectively dispense a half billion bar-coded doses, error-free, every year.
Meet Ernie
Evergreen Hospital Medical Center in Kirkland, Wash., is a 235-bed facility with an average daily census of 175. In March 2004, their pharmacy acquired a ROBOT-Rx, which dispenses up to 93% of all patient medications. Called Ernie (short for Evergreen Robot Noticeably Improving Efficiency), the robot does indeed improve pharmacy efficiency.
“Pharmacists still have to review orders, but the robot saves us time in the pharmacy,” says Bob Blanchard, pharmacy director at Evergreen. “Now they can be out on the floor more, where the orders occur, before mistakes happen.”
The biggest benefit of having the robot is an ongoing reduction in errors. “A good hospital pharmacy might have a 0.5% to 1% error rate,” says Blanchard, “but you have to look at the number of doses dispensed. In a busy hospital—like here—the pharmacy dispenses 1,200-1,300 doses a day. Translate that error rate, and you’ve got five or six errors each day.” Since Ernie took over the job of dispensing drugs, the number of medication errors has been reduced by 25%. It’s worth noting, though, that hospitalists and other doctors at Evergreen Hospital have no interaction with Ernie.
What Does It Take to Start Up a Robot?
Ordering and installing the robot and implementing a new system called for an overhaul of the pharmacy—in more ways than one. “It takes a bit of planning to start up,” admits Blanchard. “Very few med[ication]s are sent from the manufacturer with readable barcodes, except for IVs. We bought a couple of packaging machines, which went into the robot.”
The packaging machines are actually part of the robot. The robot is huge and is actually multiple machines working from a single “brain.” The machines parcel the bulk meds into single doses and barcode them as this happens.
A recent Food and Drug Administration (FDA) mandate requires pharmaceutical companies to include a bar code on packaging for medications, but that applies to bulk packages received at a pharmacy, not single doses.
Ernie takes up about 100 square feet in an octagon-shaped room in the hospital pharmacy. The room has 22 computerized drug-dispensing cabinets. In the center is an electronic arm that can rotate and use suction cups to pick up drug packets. The robot will grab a packet and laser-scan the bar code to ensure that it has picked the correct medication. If the bar code doesn’t match, the arm drops the packet on the floor or puts it in a bin for a pharmacist to check.
After verifying the correct bar code, the robot will place the dose into an envelope marked for a specific patient. The robot also restocks packaged doses that have been checked by pharmacists. Ernie receives the latest patient information automatically. “The robot directly interfaces with the pharmacy information system,” explains Rodger Fletcher, ROBOT-Rx product marketing manager at McKesson. “The robot … seamlessly integrates with nearly every other pharmacy information system.”
Take It to the Next Level
Evergreen Hospital has plans to further reduce their medication error rate. “Most errors occur after the drugs leave the pharmacy, on the hospital floor,” states Blanchard. “We see errors with wrong medications, wrong patients, and wrong times.”
The solution for reducing these errors is to implement additional technology. “We want to get bar coding at the bedside, where we scan the patient, medication, and nurse,” he explains. “This will catch any problem at that time, whether it’s the wrong medication, the wrong dose, or the wrong time.”
Getting Ernie installed was an integral part of this solution. “With the robot, we’re partway there. By the end of next year, we hope to have the bedside piece in place. We have all our medications bar-coded; we need basic technology at the bedside,” says Blanchard. “The selection and correct patient information are taken care of by the robot.”
Bar code scanning of medications at bedside is becoming more common. “We’re seeing a lot of momentum for this,” says Fletcher. “Industry statistics show that 7.5% to 10% of all hospitals have implemented [a bedside medication system], and others are universally planning one. The robot was developed with this in mind.”
For now, Evergreen Hospital is happy with the first stage in reducing medication errors: having Ernie sort and dispense patient meds. “It’s been a long time coming,” says Blanchard. TH
Jane Jerrard is a frequent contributor to The Hospitalist.
Lost in Translation
What happens when a person who speaks a language other than English enters a hospital? One who is fortunate enough to enter one of the one-quarter of American hospitals that offer professional interpreters or other language access services can expect to understand what is going on and to communicate comfortably with the care providers. For the approximately 75% of U.S. hospitals remaining, language access has become a common concern as increasing immigration levels expand ethnic groups.
Nearly 52 million people—one in 12—in the United States speak a language other than English at home. In fact, more than 300 languages are spoken in the United States. Basing their calculations on the 2000 census, demographers estimate that the number of people with limited English proficiency (LEP) ranges from 11 million (those who speak English “not well” or “not at all”) to more than 22 million (those who speak English less than “very well”). And those numbers are expected to continue to grow.
The Effects on Healthcare
The growing diversity of the United States population has a direct effect on healthcare providers. In order to provide appropriate and safe care, a provider must rely on accurate information from the patient. Simultaneously, the patient must be able to understand health instructions and treatment options in order to participate in his or her care. Language is the vital bridge in this process.
So what happens, for example, when an English-speaking emergency department physician faces a Spanish-speaking patient seeking medical care? Often, the hospital staff will turn to the patient’s family to act as interpreters. If that is not possible or advisable, the clinician may ask a bilingual staff member to help. This is commonly called dual-role or ad-hoc interpreting because the employee’s primary job in the healthcare organization (whether clinical or non-clinical) involves something other than interpreting.
While ad-hoc interpreters fulfill immediate needs by thoughtfully stepping in and helping out, many are asked to interpret outside their areas of expertise as they interrupt their own work. And an interpreter who has received no specialized training cannot be expected to achieve the same results as a professional interpreter. Simply being bilingual is not enough; professional medical interpreting is a learned skill.
Yet many healthcare organizations across the United States are not prepared to provide professional linguistic access for their patients. This is not to say that care providers would not like a professional interpreter program in the healthcare organization. Providers from a wide range of services have reported that language barriers and inadequate funding of language access services present major problems in ensuring both access to and quality of healthcare for LEP individuals. Funding, in particular, is one of the major reasons healthcare organizations hesitate to implement dedicated interpreter departments.
According to Cynthia Roat, MPH, a national consultant on language access in healthcare, the two major restrictions hindering the implementation of professional linguistic access programs in hospitals today are:
- Lack of funding and
- Lack of qualified interpreters.
“Fortunately the latter problem is being addressed,” she says. “We have established standards of practice for professional competence, and there are training programs for medical interpreters as well as for clinical staff who use interpreters.”
For example, the National Council on Interpreting in Health Care (NCIHC), a leading advocate of medical interpreting, has developed national standards to improve communication between the LEP patient and the healthcare provider. In addition, many technical and community colleges now offer medical interpreting classes, and some medical schools are beginning to offer seminars and courses designed to train clinical staff to work with interpreters. “Working with interpreters is a concrete, clinical skill,” says Roat.
Still, finding the money for this type of program can have a financial impact on healthcare organizations. Adding to that, accreditation agencies such as the Joint Commission on Accreditation of Healthcare Organizations (JCAHO) and the National Committee for Quality Assurance (NCQA) have set compliance standards for language access in terms of its contribution to quality care and patient safety. These compliance standards can also have a financial impact on healthcare organizations.
An even more significant effect may result from the federal government’s mandate to provide language services to LEP individuals. Specifically, Executive Order 13166, “Improving Access to Services for Persons with Limited English Proficiency,” stipulates that hospital and healthcare organizations receiving federal funds are required to provide interpretation services under Title VI of the Civil Rights Act of 1964. Denial of interpreter services to LEP patients is considered a form of discrimination.
In addition, the Office of Minority Health (OMH) within the U.S. Department of Health and Human Services has specified 14 National Standards for Culturally and Linguistically Appropriate Services in Health Care (CLAS) that direct healthcare organizations to make their practices more culturally and linguistically accessible. CLAS standards are organized by themes: Culturally Competent Care, Language Access, and Organizational Support for Cultural Competence. Within this framework, there are three types of obligation: mandates, guidelines, and recommendations. Mandates are current federal requirements for all recipients of federal funds; guidelines are activities recommended by OMH for adoption as mandates by accrediting agencies; and recommendations are standards suggested by OMH for voluntary adoption by healthcare organizations.
Despite its mandates, standards, and recommendations, however, the U.S. government has not included provisions for or suggestions about paying for compliance.
Benefits of a Language Access Program
Nevertheless, in addition to complying with governmental regulations and meeting accreditation standards, hospitals can derive benefits from an interpreter program. First and foremost, using interpreters with LEP individuals allows a hospital to fulfill one of its most important professional obligations: providing the best care possible to each patient. The clinician understands the patient’s symptoms, and the patient understands the doctor’s diagnosis and instructions. Together they can form a partnership to meet the physical, psychological, and cultural needs of the patient and to afford a sense of satisfaction to the caregiver.
Secondly, providing linguistic access can make hospital services more cost effective. Visits are fewer and shorter. There are not as many follow-up appointments or repeat admissions because patients understand their physicians’ instructions. Clinicians avoid unnecessary, inadvisable, or inappropriate tests because they understand the patients’ symptoms. Overuse of emergency department services for primary care decreases because patients are comfortable establishing a more conventional primary care relationship. And, as Roat points out, “if a hospital can develop an access program that does not rely on ad-hoc interpreters, the organization can avoid the hidden costs of lower productivity and higher turnover among those ad-hoc interpreters who are asked to interrupt their regular work to provide language access.”
Finally, there are benefits associated with legal and liability issues. Among them: fewer mistakes in diagnoses and treatment because the patients can communicate with their care providers. Also, patients are able to follow directions correctly and understand the need for follow-up or referrals, thus averting an unnecessary tragedy or potential lawsuit. Glenn Flores, MD, director of the Center for the Advancement of Urban Children and professor of pediatrics, epidemiology, and health at the Medical College of Wisconsin, can cite examples of medical errors attributable to language misunderstandings.
“Lack of language services can affect instructions about giving medications, such as the mother who thought she should apply a cortisone cream to the child’s entire body rather than just to the facial rash,” he says. “There is also the problem of possible overdoses. And a single misinterpreted word in one case led to a $71 million lawsuit in Florida a few years ago. This is a major patient safety issue.”
Another safety issue for hospitals is informed consent. Hospitals that provide language services are more likely to ensure that their LEP patients understand and agree to sign the informed consent form.
Paying for Language Access Services
The benefits of offering language access services may be self-evident, but who pays for them? Certainly not private insurers. At least not yet. But, as professionals in the field, both Roat and Dr. Flores see a need for private insurers to assume part of the financial cost. Although Roat believes the costs should be shared among hospitals/clinics, public financing, and commercial insurers, “Advocates of language access need to start a dialogue with commercial insurers and point to HMOs as examples of how these services are being covered,” she says.
Multiple approaches may be necessary to set up coverage from private insurers. Dr. Flores suggests that one possible course is insurance reimbursement for professional interpreters, paid for by the hour or by the visit. Another alternative might involve establishing contract services with outside agencies, community organizations, or video- or teleconferencing companies to recruit, train, and assign medical interpreters for healthcare organizations. These groups could provide services and bill the insurer directly.
“There are also ways to use public funding,” observes Roat, “and there should be more pressure on the federal government to pony up more money for this.”
Dr. Flores agrees. “Under Medicaid and the State Children’s Health Insurance Program (SCHIP), states may pay for interpreting services and receive federal matching funds of 50% or more,” he says. “Yet only 13 states are taking advantage of this. The other 37 states are missing out on this money.”
Like many of his colleagues, Dr. Flores is also mystified about the government’s reluctance to fully fund interpretation services, pointing out that “a federal report from the Office of Management and Budget (OMB) in 2002 estimated that it would cost an average of $4.04 per physician visit to provide all LEP patients with full language access services.”
Then why hasn’t this been allocated? Dr. Flores acknowledges that there is some recognition and awareness of the situation in Congress, and he thinks there may be some political will as well. He has testified before the Senate about the Hispanic Health Improvement Act, yet the bill has yet to pass. At the moment, there are immigration issues that are impeding political action in these areas.
In the meantime, Dr. Flores suggests that there are other steps that healthcare organizations can take to ease language access problems:
- Recruit bilingual providers in areas with large ethnic populations and offer hiring bonuses for qualified individuals;
- Encourage medical schools to require—and even teach—proficiency in languages other than English. “We should require, as other countries do, that children learn foreign languages,” he says; and
- Do a better job of helping LEP individuals learn English.
Begin the last step by directing LEP patients to the Web site of the National Institute for Literacy and Partners, which matches applicants to literacy and ESL programs within their geographical area.1
“We must debunk the oft-repeated story that professional medical interpreters are too expensive to use, that they charge $400 an hour,” says Roat. “That figure came from an incident in which an interpreter was supposedly working in a very remote area on a weekend and charged for the time, distance, and unusual circumstances. In reality, qualified medical interpreters earn $20 to $25 per hour and are worth every penny. Plus, they save money by reducing time and costs to the institution.” TH
Ann Kepler is based in the Chicago area.
Reference
- National Institute for Literacy, Literacy Directory. Available at: www.literacydirectory.org. Last accessed September 27,2006.
Postcards from the Past
In the early 20th century, postcards quickly gained importance as an economical and rapid form of communication. A small card, often with a colorful image of a city’s most important or beautiful structures and just enough space for a brief message and address, could be sent across town in less than a day for a cent or two.
While postcards became popular collectibles a century ago, interest in them continues today. The Radbill Collection of Hospital Postcards, housed in the Blocker History of Medicine Collections at the Moody Medical Library, University of Texas (UT) Medical Branch, Galveston, documents changing styles in hospital architecture from 1904 to 1994. It also gives an intriguing peek into the lives of the correspondents as they chronicle both daily experiences and traumatic illnesses.


The collection contains approximately 5,400 cards depicting primarily U.S. hospitals and medical centers. Each provides a visual record of a hospital, an asylum, a sanatorium, a health resort, a medical school, or a related building. Many [of these places] no longer exist. All 50 states and nearly 1,100 cities are represented. The work of famous publishers such as Curt Teich of Chicago and E.C. Kropp of Milwaukee can be found.
The oldest card in the collection illustrates Santa Rosa Hospital in San Antonio. It is a “Private Mailing Card,” published between May 19, 1898, and December 24, 1901. Many ways exist to determine the age of a card, including special markings, the amount of postage, and the size of the card itself.
The cards come in many forms, some black and white, others hand colored. Most are standard size, while a few depict longer, panoramic scenes. There are even night views, decorated with glitter to represent stars and moonlight.
The postcard collection dates from 1984, when the library acquired the cards of Samuel X. Radbill, MD, a Philadelphia pediatrician and medical historian. It has grown gradually through donations from individuals, including William H. Helfand of New York City, pharmacist, collector, and consultant to the National Library of Medicine. In 1993, the library welcomed a gift of more than 3,500 cards from Morris M. Weiss, MD, a cardiologist in Louisville, Ky.
The collection is available to researchers interested in the social and architectural history of hospitals as well as the history of patient care and the health sciences in general. A personal computer database allows users to access different types of information. A user may search the database using terms associated with the cards, including hospital name, city and state, and type of hospital.
The Moody Medical Library advances the education, research, patient care, and public service programs of the university by obtaining, applying, and disseminating biomedical information and the tools for its management and use. The library traces its history to the beginnings of the school in 1891, making it the oldest of its kind in Texas. Today, it is the primary source of biomedical information for students and faculty associated with the UT School of Medicine, the Graduate School of Biomedical Sciences, the School of Allied Health Sciences, the School of Nursing, the Marine Biomedical Institute, and the Institute for the Medical Humanities. The library invites inquiries about the postcard collection. For further information, please contact The Blocker History of Medicine Collections, The Moody Medical Library via phone at (409) 772-2397 or via e-mail at ref@utmb.edu. TH
Sarita Oertling is a medical history librarian at The Blocker Collection in Galveston, Texas.
Acknowledgements
The three postcards are from the Radbill Collection of Hospital Postcards, housed in the Blocker History of Medicine Collections, Moody Medical Library, The University of Texas Medical Branch, Galveston, Texas.
Thanks also to Kathleen O’Guinn and Arlene Reynolds of St. Mary’s Medical Center and Kathleen Howat of the Historical Society of Long Beach, Calif. All provided information on the Long Beach Sanitarium card.
Christina Santiago in New York kindly assisted with the research on the Bellevue Hospital card.
I have also learned much from the book Postcards in the Library, edited by Norman D. Stevens (New York: The Haworth Press, Inc.; 1995), and the Internet site “Tips for determining when a U.S. postcard was published,” created by the Center of Southwest Studies at Fort Lewis College, Durango, Colo. Available at: http://swcenter.fortlewis.edu/Images/M194/PostcardDating.htm. Accessed on September 18, 2006.
In the early 20th century, postcards quickly gained importance as an economical and rapid form of communication. A small card, often with a colorful image of a city’s most important or beautiful structures and just enough space for a brief message and address, could be sent across town in less than a day for a cent or two.
While postcards became popular collectibles a century ago, interest in them continues today. The Radbill Collection of Hospital Postcards, housed in the Blocker History of Medicine Collections at the Moody Medical Library, University of Texas (UT) Medical Branch, Galveston, documents changing styles in hospital architecture from 1904 to 1994. It also gives an intriguing peek into the lives of the correspondents as they chronicle both daily experiences and traumatic illnesses.
The collection contains approximately 5,400 cards depicting primarily U.S. hospitals and medical centers. Each provides a visual record of a hospital, an asylum, a sanatorium, a health resort, a medical school, or a related building. Many [of these places] no longer exist. All 50 states and nearly 1,100 cities are represented. The work of famous publishers such as Curt Teich of Chicago and E.C. Kropp of Milwaukee can be found.
The oldest card in the collection illustrates Santa Rosa Hospital in San Antonio. It is a “Private Mailing Card,” published between May 19, 1898, and December 24, 1901. Many ways exist to determine the age of a card, including special markings, the amount of postage, and the size of the card itself.
The cards come in many forms, some black and white, others hand colored. Most are standard size, while a few depict longer, panoramic scenes. There are even night views, decorated with glitter to represent stars and moonlight.
The postcard collection dates from 1984, when the library acquired the cards of Samuel X. Radbill, MD, a Philadelphia pediatrician and medical historian. It has grown gradually through donations from individuals, including William H. Helfand of New York City, pharmacist, collector, and consultant to the National Library of Medicine. In 1993, the library welcomed a gift of more than 3,500 cards from Morris M. Weiss, MD, a cardiologist in Louisville, Ky.
The collection is available to researchers interested in the social and architectural history of hospitals as well as the history of patient care and the health sciences in general. A personal computer database allows users to access different types of information. A user may search the database using terms associated with the cards, including hospital name, city and state, and type of hospital.
The Moody Medical Library advances the education, research, patient care, and public service programs of the university by obtaining, applying, and disseminating biomedical information and the tools for its management and use. The library traces its history to the beginnings of the school in 1891, making it the oldest of its kind in Texas. Today, it is the primary source of biomedical information for students and faculty associated with the UT School of Medicine, the Graduate School of Biomedical Sciences, the School of Allied Health Sciences, the School of Nursing, the Marine Biomedical Institute, and the Institute for the Medical Humanities. The library invites inquiries about the postcard collection. For further information, please contact The Blocker History of Medicine Collections, The Moody Medical Library via phone at (409) 772-2397 or via e-mail at ref@utmb.edu. TH
Sarita Oertling is a medical history librarian at The Blocker Collection in Galveston, Texas.
Acknowledgements
The three postcards are from the Radbill Collection of Hospital Postcards, housed in the Blocker History of Medicine Collections, Moody Medical Library, The University of Texas Medical Branch, Galveston, Texas.
Thanks also to Kathleen O’Guinn and Arlene Reynolds of St. Mary’s Medical Center and Kathleen Howat of the Historical Society of Long Beach, Calif. All provided information on the Long Beach Sanitarium card.
Christina Santiago in New York kindly assisted with the research on the Bellevue Hospital card.
I have also learned much from the book Postcards in the Library, edited by Norman D. Stevens (New York: The Haworth Press, Inc.; 1995), and the Internet site “Tips for determining when a U.S. postcard was published,” created by the Center of Southwest Studies at Fort Lewis College, Durango, Colo. Available at: http://swcenter.fortlewis.edu/Images/M194/PostcardDating.htm. Accessed on September 18, 2006.
Injection Pearls
A 29-year-old male warehouse worker noticed pain in his right lower quadrant. The pain was intense and poorly localized (arrow) and increased with lifting or resisted hip flexion. Appendicitis was diagnosed, but pain persisted post-operatively. Necrotizing fasciitis was suspected, but repeated debridements failed to relieve the pain.
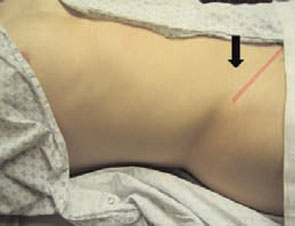
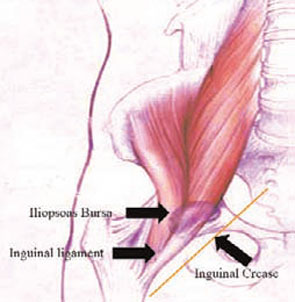
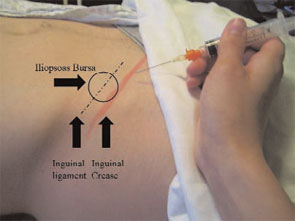


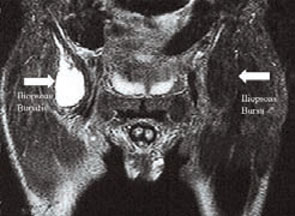
Physical Exam
The inguinal ligament runs parallel to the inguinal crease (pink pencil line—see right). About midway in its length, the ligament became difficult to identify due to an exquisitely tender doughy area (arrow). Palpation of this area reproduced the patent’s symptoms, along with poorly localized lower abdominal pain. An attempted sit-up caused similar symptoms.
Anatomy
The iliopsoas bursa is located where the inguinal ligament, the iliopsoas tendon, and the transversus tendon intersect. An inflamed iliopsoas bursa is palpable as a doughy mass below the midpoint of the length of the inguinal ligament, lateral to the femoral artery. Most often the opposite, unaffected side demonstrates a normal, pencil-thin, easily defined, non-tender inguinal ligament.
Iliopsoas Bursitis/Tendonitis
The iliopsoas bursa is the largest bursa in the body and communicates with the hip joint in 15% of patients. Bursitis/tendonitis is caused by overuse and friction as the tendon rides over the iliopectineal eminence of the pubis. The condition is associated with lifting, unloading trucks, and participating in sports requiring extensive use of the hip flexors (e.g., soccer, ballet, uphill running, hurdling, jumping). Iliopsoas bursitis/tendonitis is characterized by deep groin pain, sometimes radiating to the anterior hip or thigh, and is often accompanied by a snapping sensation. The patient may limp.
The pain is difficult for patients to localize and challenging for clinicians to reproduce. In fact, the average time from the onset of symptoms to diagnosis is 31 to 42 months. It is common for many other diagnoses to be entertained and treated with no improvement. Physical examination will reveal pain on deep palpation over the femoral triangle, where the musculotendinous junction of the iliopsoas can be palpated as a doughy diffuse area of tenderness at the midpoint of the inguinal ligament.
Pain may also be produced when the affected hip is extended or when the supine patient raises his or her heels off the table at about 15 degrees. In the latter position, the only active hip flexor is the iliopsoas.
Imaging
Although these procedures are not necessary for diagnosis, iliopsoas bursitis is best visualized using ultrasound or MRI—either of which will reveal a collection of fluid adjacent to the muscle. Treatment is conservative and consists of rest followed by stretching of the hip flexors and rotators, then strengthening and gradual return to work or sport. As in any overuse injury, biomechanical abnormalities must be sought and corrected. While most patients resolve spontaneously, corticosteroid injections are helpful in about one-third of patients. Rarely, surgical management of recalcitrant cases is warranted.
Iliopsoas Bursitis/Tendonitis Injection
The following procedure should be followed when administering a corticosteroid injection. With the fingers of one hand, identify and isolate the inguinal ligament in the area of doughy discomfort. With the other hand, insert a 1.5-inch needle to its hub, parallel to the ligament, and inject a steroid and lidocaine mixture slowly while withdrawing the needle to avoid inadvertently injecting the ligament or any tendons.
A medium-acting depot steroid gives good, long-lasting relief. A mixture of lidocaine or bupivacaine and the steroid allows for immediate relief, as well as confirmation that the steroid reached its target. TH
Gerhart is a third-year medical student at the Mayo Clinic College of Medicine, and Dr. Ficalora is an associate professor in internal medicine at the Mayo Clinic College of Medicine.
A 29-year-old male warehouse worker noticed pain in his right lower quadrant. The pain was intense and poorly localized (arrow) and increased with lifting or resisted hip flexion. Appendicitis was diagnosed, but pain persisted post-operatively. Necrotizing fasciitis was suspected, but repeated debridements failed to relieve the pain.
Physical Exam
The inguinal ligament runs parallel to the inguinal crease (pink pencil line—see right). About midway in its length, the ligament became difficult to identify due to an exquisitely tender doughy area (arrow). Palpation of this area reproduced the patent’s symptoms, along with poorly localized lower abdominal pain. An attempted sit-up caused similar symptoms.
Anatomy
The iliopsoas bursa is located where the inguinal ligament, the iliopsoas tendon, and the transversus tendon intersect. An inflamed iliopsoas bursa is palpable as a doughy mass below the midpoint of the length of the inguinal ligament, lateral to the femoral artery. Most often the opposite, unaffected side demonstrates a normal, pencil-thin, easily defined, non-tender inguinal ligament.
Iliopsoas Bursitis/Tendonitis
The iliopsoas bursa is the largest bursa in the body and communicates with the hip joint in 15% of patients. Bursitis/tendonitis is caused by overuse and friction as the tendon rides over the iliopectineal eminence of the pubis. The condition is associated with lifting, unloading trucks, and participating in sports requiring extensive use of the hip flexors (e.g., soccer, ballet, uphill running, hurdling, jumping). Iliopsoas bursitis/tendonitis is characterized by deep groin pain, sometimes radiating to the anterior hip or thigh, and is often accompanied by a snapping sensation. The patient may limp.
The pain is difficult for patients to localize and challenging for clinicians to reproduce. In fact, the average time from the onset of symptoms to diagnosis is 31 to 42 months. It is common for many other diagnoses to be entertained and treated with no improvement. Physical examination will reveal pain on deep palpation over the femoral triangle, where the musculotendinous junction of the iliopsoas can be palpated as a doughy diffuse area of tenderness at the midpoint of the inguinal ligament.
Pain may also be produced when the affected hip is extended or when the supine patient raises his or her heels off the table at about 15 degrees. In the latter position, the only active hip flexor is the iliopsoas.
Imaging
Although these procedures are not necessary for diagnosis, iliopsoas bursitis is best visualized using ultrasound or MRI—either of which will reveal a collection of fluid adjacent to the muscle. Treatment is conservative and consists of rest followed by stretching of the hip flexors and rotators, then strengthening and gradual return to work or sport. As in any overuse injury, biomechanical abnormalities must be sought and corrected. While most patients resolve spontaneously, corticosteroid injections are helpful in about one-third of patients. Rarely, surgical management of recalcitrant cases is warranted.
Iliopsoas Bursitis/Tendonitis Injection
The following procedure should be followed when administering a corticosteroid injection. With the fingers of one hand, identify and isolate the inguinal ligament in the area of doughy discomfort. With the other hand, insert a 1.5-inch needle to its hub, parallel to the ligament, and inject a steroid and lidocaine mixture slowly while withdrawing the needle to avoid inadvertently injecting the ligament or any tendons.
A medium-acting depot steroid gives good, long-lasting relief. A mixture of lidocaine or bupivacaine and the steroid allows for immediate relief, as well as confirmation that the steroid reached its target. TH
Gerhart is a third-year medical student at the Mayo Clinic College of Medicine, and Dr. Ficalora is an associate professor in internal medicine at the Mayo Clinic College of Medicine.
History of a Vitamin

What do the Japanese military, a Dutch microbiologist, sick chickens, and rice polishers have in common?
In the 1800s, Europeans colonizing Asia brought with them steam-powered machines that completely polished rice. This rice, which was thought to be superior to unpolished rice, became very popular. As Far Eastern society’s main source of thiamine was polished to oblivion, beriberi became more prevalent and problematic.
At that time, micronutrient deficiency states were still a mystery to physicians. Kanehiro Takaki (October 30, 1849–April 13, 1920), surgeon general of the Japanese Imperial Navy, noticed a connection between sailors’ diets and their development of beriberi. White rice was replaced with barley, vegetables, fish, and meat. The incidence of beriberi dropped swiftly and was eliminated in the Japanese Navy, within six years.

Meanwhile, in the Dutch Indies, beriberi was endemic and crippling. Christiaan Eijkman, a Dutch microbiologist (August 11, 1858–November 5, 1930) who had studied with bacteriologist Robert Koch (December 11, 1843-May 27, 1910) in Berlin, was sent to research the disease in Java. Eijkman was unaware of Takaki’s findings and was convinced that beriberi was an infection.
Eijkman tried to infect chickens with a microorganism isolated from the corpses of two beriberi-related deaths. While he was striving to find the causative pathogen, Eijkman noticed that all chickens, even those having no contact with either the microorganism or other chickens, developed “a disease, in many respects strikingly similar to beriberi in man.” In fact, they had developed polyneuritis. Then, miraculously, they recovered spontaneously.

Eijkman was bewildered by this sequence of events and set out to solve the poultry mystery. He discovered that the chickens, during the time that they had been ill, had been eating leftover cooked, polished white rice from the hospital kitchen. When the cook left, however, his replacement refused to relinquish leftover rice, and they were thereafter given raw, unpolished rice. After this dietary change, the chickens recovered. Eijkman concluded that a substance in unpolished rice protected chickens against infection—he was still searching for the elusive microscopic culprit—and he called this protective substance the “anti-beriberi factor.” He thought unpolished rice contained an antidote to a bacterial toxin.
In 1906, Frederick Hopkins (1861–1947) demonstrated “accessory factors” in food, those nutrients necessary to maintain good health in addition to the carbohydrates, fats, proteins, and minerals that had previously been acknowledged as vital. In 1912, a Polish biochemist, Casimir Funk (1884–1967), thought he had isolated the anti-beriberi factor and named his discovery vitamine, from “vital amine.” Although he hadn’t isolated anti-beriberi factor—it is believed that he isolated nicotinic acid—the name vitamine remained. Eventually, in 1926, researchers were able to isolate the anti-beriberi factor in rice bran extracts. In 1929, Hopkins and Eijkman were awarded the Nobel Prize in Physiology or Medicine for the discovery of vitamins.

Clinicians are now well aware of alcohol abuse and the development of Wernicke’s encephalopathy or Korsakoff amnestic syndrome. Phrases like wet (high output heart failure) and dry (peripheral neuropathy) beriberi were once commonly found on board exams. The clinical presentation of thiamine deficiency isn’t limited to alcoholics. For example, there is evidence that patients with end-stage renal disease on hemodialysis are at risk of becoming thiamine deficient and of developing “unexplained” encephalopathies.1 Patients who suffer congestive heart failure while on long-term diuretics are also at increased risk for thiamine deficiency.2
This account is a classic example of the fascinating way in which the discovery of these essential nutrients has evolved and serves as a wake-up call that emphasizes the current epidemic of malnutrition in hospitalized patients.
Protein energy malnutrition in hospitalized patients is very common. Many studies have demonstrated that the prevalence runs between 30% and 60%, depending on the patient population studied and the assessment tools used. Hospital malnutrition, independent of disease activity, has been linked to increased length of stay and heightened morbidity and mortality. It is disturbing to think that many patients are actually worse off at time of dismissal than they were at admission. Malnutrition often goes unrecognized and even when the problem is acknowledged adequate nutrition is often not provided. Patients are commonly permitted to subsist on very low nutrient intakes.3 The problem of malnutrition is likely grossly underestimated because most studies have not considered micronutrients such as trace elements and vitamins. In addition, the presence of subclinical, yet clinically important, deficiency is expected to be highly prevalent.
Early screening improves the recognition of malnourished patients and provides the opportunity to start treatment at an early stage of hospitalization. Nutritional therapy as part of a comprehensive treatment modality may result in improvement of healthcare quality. In some countries it is also a criterion for assessing the performance of hospitals. In the U.S., for example, nutritional screening in hospitals is required for accreditation by the Joint Commission on Accreditation of Healthcare Organizations and is part of the Minimal Data Set documentation in long-term care facilities.
In most institutions, nutritional screening refers to a rapid and general test that is undertaken by nursing, medical, and other staff, often at first contact with patients. This is in contrast to the detailed nutritional evaluation that is undertaken by nutrition specialists (e.g., dietitians, specialist nutrition nurses, or physicians with an interest in nutrition), often for complex problems and often following nutritional screening. The introduction of a nutrition screening program and documentation of nutritional status may also increase diagnosis-related group (DRG)-based reimbursement.
Unfortunately, a lack of standardized sensitive and specific methodologies to assess for macro- or micronutrient deficiencies makes it difficult to determine how best to screen patients. Recent literature suggests, however, that the use of a short nutrition questionnaire and an undemanding treatment plan improved nutritional care during a hospital stay.4 The use of this strategy reduced the duration of the hospital stay in a subgroup of frail malnourished patients, offering potential improvements in morbidity as well as financial benefits for the hospital.
The lessons of past discoveries should not be lost on modern medicine. Malnutrition can be made a condition of the past through the use of simple screening procedures and uncomplicated treatments. The results will benefit both patients and hospitals. TH
Michelle Schneider is a medical student at the Royal College of Surgeons in Dublin, Ireland. Dr. Egger is a senior associate consultant at the Mayo Clinic College of Medicine.
References
- Hung SC, Hung SH, Tarng DC, et al. Thiamine deficiency and unexplained encephalopathy in hemodialysis and peritoneal dialysis patients. Am J Kidney Dis. 2001;38:941-947.
- Hanninen SA, Darling PB, Sole MJ, et al. The prevalence of thiamin deficiency in hospitalized patients with congestive heart failure. J Am Coll Cardiol. 2006 Jan 17;47(2):354-361.
- Sullivan DH, Sun S, Walls RC. Protein-energy undernutrition among elderly hospitalized patients: a prospective study. JAMA. 1999 Jun;281(21):2013-2019.
- Kruizenga HM, Van Tulder MW, Seidell JC, et al. Effectiveness and cost-effectiveness of early screening and treatment of malnourished patients. Am J Clin Nutr. 2005;82(5):1082-1089.
What do the Japanese military, a Dutch microbiologist, sick chickens, and rice polishers have in common?
In the 1800s, Europeans colonizing Asia brought with them steam-powered machines that completely polished rice. This rice, which was thought to be superior to unpolished rice, became very popular. As Far Eastern society’s main source of thiamine was polished to oblivion, beriberi became more prevalent and problematic.
At that time, micronutrient deficiency states were still a mystery to physicians. Kanehiro Takaki (October 30, 1849–April 13, 1920), surgeon general of the Japanese Imperial Navy, noticed a connection between sailors’ diets and their development of beriberi. White rice was replaced with barley, vegetables, fish, and meat. The incidence of beriberi dropped swiftly and was eliminated in the Japanese Navy, within six years.
Meanwhile, in the Dutch Indies, beriberi was endemic and crippling. Christiaan Eijkman, a Dutch microbiologist (August 11, 1858–November 5, 1930) who had studied with bacteriologist Robert Koch (December 11, 1843-May 27, 1910) in Berlin, was sent to research the disease in Java. Eijkman was unaware of Takaki’s findings and was convinced that beriberi was an infection.
Eijkman tried to infect chickens with a microorganism isolated from the corpses of two beriberi-related deaths. While he was striving to find the causative pathogen, Eijkman noticed that all chickens, even those having no contact with either the microorganism or other chickens, developed “a disease, in many respects strikingly similar to beriberi in man.” In fact, they had developed polyneuritis. Then, miraculously, they recovered spontaneously.
Eijkman was bewildered by this sequence of events and set out to solve the poultry mystery. He discovered that the chickens, during the time that they had been ill, had been eating leftover cooked, polished white rice from the hospital kitchen. When the cook left, however, his replacement refused to relinquish leftover rice, and they were thereafter given raw, unpolished rice. After this dietary change, the chickens recovered. Eijkman concluded that a substance in unpolished rice protected chickens against infection—he was still searching for the elusive microscopic culprit—and he called this protective substance the “anti-beriberi factor.” He thought unpolished rice contained an antidote to a bacterial toxin.
In 1906, Frederick Hopkins (1861–1947) demonstrated “accessory factors” in food, those nutrients necessary to maintain good health in addition to the carbohydrates, fats, proteins, and minerals that had previously been acknowledged as vital. In 1912, a Polish biochemist, Casimir Funk (1884–1967), thought he had isolated the anti-beriberi factor and named his discovery vitamine, from “vital amine.” Although he hadn’t isolated anti-beriberi factor—it is believed that he isolated nicotinic acid—the name vitamine remained. Eventually, in 1926, researchers were able to isolate the anti-beriberi factor in rice bran extracts. In 1929, Hopkins and Eijkman were awarded the Nobel Prize in Physiology or Medicine for the discovery of vitamins.
Clinicians are now well aware of alcohol abuse and the development of Wernicke’s encephalopathy or Korsakoff amnestic syndrome. Phrases like wet (high output heart failure) and dry (peripheral neuropathy) beriberi were once commonly found on board exams. The clinical presentation of thiamine deficiency isn’t limited to alcoholics. For example, there is evidence that patients with end-stage renal disease on hemodialysis are at risk of becoming thiamine deficient and of developing “unexplained” encephalopathies.1 Patients who suffer congestive heart failure while on long-term diuretics are also at increased risk for thiamine deficiency.2
This account is a classic example of the fascinating way in which the discovery of these essential nutrients has evolved and serves as a wake-up call that emphasizes the current epidemic of malnutrition in hospitalized patients.
Protein energy malnutrition in hospitalized patients is very common. Many studies have demonstrated that the prevalence runs between 30% and 60%, depending on the patient population studied and the assessment tools used. Hospital malnutrition, independent of disease activity, has been linked to increased length of stay and heightened morbidity and mortality. It is disturbing to think that many patients are actually worse off at time of dismissal than they were at admission. Malnutrition often goes unrecognized and even when the problem is acknowledged adequate nutrition is often not provided. Patients are commonly permitted to subsist on very low nutrient intakes.3 The problem of malnutrition is likely grossly underestimated because most studies have not considered micronutrients such as trace elements and vitamins. In addition, the presence of subclinical, yet clinically important, deficiency is expected to be highly prevalent.
Early screening improves the recognition of malnourished patients and provides the opportunity to start treatment at an early stage of hospitalization. Nutritional therapy as part of a comprehensive treatment modality may result in improvement of healthcare quality. In some countries it is also a criterion for assessing the performance of hospitals. In the U.S., for example, nutritional screening in hospitals is required for accreditation by the Joint Commission on Accreditation of Healthcare Organizations and is part of the Minimal Data Set documentation in long-term care facilities.
In most institutions, nutritional screening refers to a rapid and general test that is undertaken by nursing, medical, and other staff, often at first contact with patients. This is in contrast to the detailed nutritional evaluation that is undertaken by nutrition specialists (e.g., dietitians, specialist nutrition nurses, or physicians with an interest in nutrition), often for complex problems and often following nutritional screening. The introduction of a nutrition screening program and documentation of nutritional status may also increase diagnosis-related group (DRG)-based reimbursement.
Unfortunately, a lack of standardized sensitive and specific methodologies to assess for macro- or micronutrient deficiencies makes it difficult to determine how best to screen patients. Recent literature suggests, however, that the use of a short nutrition questionnaire and an undemanding treatment plan improved nutritional care during a hospital stay.4 The use of this strategy reduced the duration of the hospital stay in a subgroup of frail malnourished patients, offering potential improvements in morbidity as well as financial benefits for the hospital.
The lessons of past discoveries should not be lost on modern medicine. Malnutrition can be made a condition of the past through the use of simple screening procedures and uncomplicated treatments. The results will benefit both patients and hospitals. TH
Michelle Schneider is a medical student at the Royal College of Surgeons in Dublin, Ireland. Dr. Egger is a senior associate consultant at the Mayo Clinic College of Medicine.
References
- Hung SC, Hung SH, Tarng DC, et al. Thiamine deficiency and unexplained encephalopathy in hemodialysis and peritoneal dialysis patients. Am J Kidney Dis. 2001;38:941-947.
- Hanninen SA, Darling PB, Sole MJ, et al. The prevalence of thiamin deficiency in hospitalized patients with congestive heart failure. J Am Coll Cardiol. 2006 Jan 17;47(2):354-361.
- Sullivan DH, Sun S, Walls RC. Protein-energy undernutrition among elderly hospitalized patients: a prospective study. JAMA. 1999 Jun;281(21):2013-2019.
- Kruizenga HM, Van Tulder MW, Seidell JC, et al. Effectiveness and cost-effectiveness of early screening and treatment of malnourished patients. Am J Clin Nutr. 2005;82(5):1082-1089.