User login
Painful Losses
A 58‐year‐old man presented to the emergency department with a 1‐month history of progressive, severe left hip pain that had become unbearable. The pain was constant and significantly worse with weight‐bearing, and the patient was now confined to bed. He denied back pain, falls, or trauma.
Although hip pain is a common complaint and a frequent manifestation of chronic degenerative joint disease, the debilitating and subacute nature of the pain suggests a potentially more serious underlying cause. Patients and even clinicians may refer to hip pain when the actual symptoms are periarticular, often presenting over the trochanter laterally, or muscular, presenting as posterior pain. The true hip joint is located in the anterior hip and groin area and often causes symptoms that radiate to the buttock. Pain can also be referred to the hip area from the spine, pelvis, or retroperitoneum, so it is crucial not to restrict the differential diagnosis to hip pathology.
Key diagnostic considerations include (1) inflammatory conditions such as trochanteric bursitis or gout; (2) bacterial infection of the hip joint, adjacent bone, or a nearby structure; (3) benign nerve compression (such as meralgia paresthetica); and (4) tumor (particularly myeloma or metastatic disease to the bone, but also potentially a pelvic or spinal mass with nerve compression). Polymyalgia rheumatica and other systemic rheumatologic complaints are a consideration, but because a single joint is involved, these conditions are less likely. The hip would be an unusual location for a first gout flare, and the duration of symptoms would be unusually long for gout. Avascular necrosis should be considered if the patient has received glucocorticoids for his previously diagnosed rheumatologic disease. If the patient is anticoagulated, consideration of spontaneous hematoma is reasonable, but usually this would present over a course of days, not weeks. The absence of trauma makes a fracture of the hip or pelvis less likely, and the insidious progression of symptoms makes a pathologic fracture less likely.
The patient reported 6 months of worsening proximal upper and lower extremity myalgia and weakness, with arthralgia of the hips and shoulders. The weakness was most notable in his proximal lower extremities, although he had remained ambulatory until the hip pain became limiting. He maintained normal use of his arms. The patient denied current rash but noted photosensitivity and a mild facial rash several months earlier. He described having transient mouth sores intermittently for several years. He denied fever, chills, night sweats, weight loss, dyspnea, recent travel, and outdoor exposures. Several months previously, he had been evaluated for these symptoms at another institution and given the diagnoses of rheumatoid arthritis (RA) and systemic lupus erythematosus (SLE). At that time, he had initiated treatment with weekly dosing of methotrexate and etanercept.
The patient's medical history was also notable for hypertension, Graves' disease treated previously with radioiodine ablation, quiescent ulcerative colitis, and depression. Current medications included methotrexate, etanercept, levothyroxine, enalapril, hydrochlorothiazide, fluoxetine, ibuprofen, and oxycodone‐acetaminophen. He denied tobacco, alcohol, and recreational drug use.
Weakness occurring in the proximal lower extremities is the classic distribution for polymyositis and dermatomyositis. In contrast to polymyalgia rheumatica, dermatomyositis and polymyositis do not generally feature severe muscle pain, but they can be associated with a painful polyarthritis. Oral ulcers, photosensitivity, and facial rash are consistent with SLE, but dermatomyositis can also lead to a symmetrical erythema of the eyelids (commonly referred to as a heliotrope rash, named after the flower bearing that name) and sometimes can be associated with photosensitivity. Oral ulcers, particularly the painful ones known as canker sores, are extraordinarily common in the general population, and patients and providers may miss the mucosal lesions of SLE because they are usually painless. As methotrexate and etanercept are immunosuppressive, opportunistic pathogens such as typical or atypical mycobacteria and disseminated fungal infections should be considered, with special attention to the possibility of infection in or near the left hip. Given that SLE and RA rarely coexist, it would be helpful to seek outside medical records to know what the prior serologic evaluation entailed, but it is unlikely that this presentation is a manifestation of a diffuse connective tissue process.
Physical examination should focus on the features of dermatomyositis including heliotrope rash, truncal erythema, and papules over the knuckles (Gottron's papules); objective proximal muscle weakness in the shoulder and hip girdle; and findings that might suggest antisynthetase syndrome such as hyperkeratotic mechanic hand palmar and digital changes, and interstitial crackles on lung exam. If necrotic skin lesions are found, this would raise concern for a disseminated infection. The joints should be examined for inflammation and effusions.
His temperature was 36.6C, heart rate 74 beats per minute, blood pressure 134/76 mm Hg, respiratory rate 16 breaths per minute, and O2 saturation 97% on room air. He was obese but did not have moon facies or a buffalo hump. There were no rashes or mucosal lesions. Active and passive motion of his left hip joint elicited pain with both flexion/extension and internal/external rotation. Muscle strength was limited by pain in the left hip flexors and extenders, but was 5/5 in all other muscle groups. Palpation of the proximal muscles of his arms and legs did not elicit pain. His extremities were without edema, and examination of his shoulders, elbows, wrists, hands, knees, ankles, and feet did not reveal any erythema, synovial thickening, effusion, or deformity. Examination of the heart, chest, and abdomen was normal.
Given the reassuring strength examination, the absence of rashes or skin lesions, and the reassuring joint exam aside from the left hip, a focal infectious, inflammatory, or malignant process seems most likely. The pain with range of motion of the hip does not definitively localize the pathology to the hip joint, because pathology of the nearby structures can lead to pain when the hip is moved. Laboratory evaluation should include a complete blood count to screen for evidence of infection or marrow suppression, complete metabolic panel, and creatine kinase. The history of ulcerative colitis raises the possibility of an enthesitis (inflammation of tendons or ligaments) occurring near the hip. Enthesitis is sometimes a feature of the seronegative spondyloarthropathy‐associated conditions and can occur in the absence of sacroiliitis or spondyloarthropathy.
The patient's myalgias and arthralgias had recently been evaluated in the rheumatology clinic. Laboratory evaluation from that visit was remarkable only for an antinuclear antibody (ANA) test that was positive at a titer of 1:320 in a homogeneous pattern, creatine phosphokinase 366 IU/L (normal range [NR] 38240), and alkaline phosphatase 203 IU/L (NR 30130). All of the following labs from that visit were within normal ranges: cyclic citrullinated peptide, rheumatoid factor, antidouble stranded DNA, aldolase, complement levels, serum and urine protein electrophoresis, thyroglobulin antibody, thyroid microsomal antibody, thyroid‐stimulating hormone, erythrocyte sedimentation rate (10 mm/h), and C‐reactive protein (0.3 mg/dL).
The patient was admitted to the hospital. Initial blood test results on admission included sodium 139 mEq/L, potassium 3.9 mEq/L, chloride 105 mEq/L, bicarbonate 27 mEq/L, urea nitrogen 16 mg/dL, creatinine 0.6 mg/dL, glucose 85 mg/dL, calcium 9.2 mg/dL (NR 8.810.3), phosphate 1.3 mg/dL (NR 2.74.6), albumin 4.7 g/dL (NR 3.54.9), and alkaline phosphatase 195 IU/L (NR 30130). The remainder of a comprehensive metabolic profile, complete blood count with differential, and coagulation studies were all normal.
The homogeneous ANA titer of 1:320 is high enough to raise eyebrows, but is nonspecific for lupus and other ANA‐associated rheumatologic conditions, and may be a red herring, particularly given the low likelihood of a systemic inflammatory process explaining this new focal hip pain. The alkaline phosphatase is only mildly elevated and could be of bone or liver origin. The reassuringly low inflammatory markers are potentially helpful, because if checked now and substantially increased from the prior outpatient visit, they would be suggestive of a new inflammatory process. However, this would not point to a specific cause of inflammation.
Given the focality of the symptoms, imaging is warranted. As opposed to plain films, contrast‐enhanced computed tomography (CT) of the pelvis or magnetic resonance imaging (MRI) may be an efficient first step, because there is low suspicion for fracture and high suspicion for an inflammatory, neoplastic, or infectious process. MRI is more expensive and usually cannot be obtained as rapidly as CT. There is a chance that CT imaging alone will provide enough information to guide the next diagnostic steps, such as aspiration of an abscess or joint, or biopsy of a suspicious lesion. However, for soft tissue lesions and many bone lesions, including osteomyelitis, MRI offers better delineation of pathology.
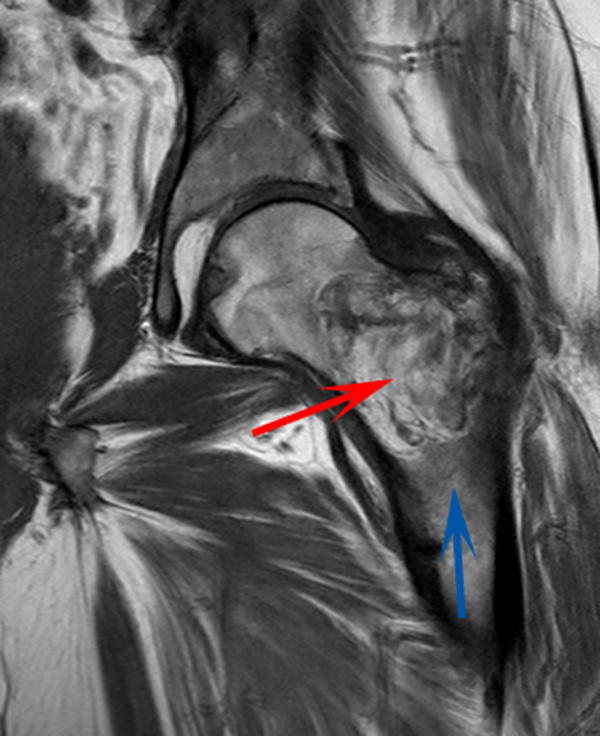
CT scan of the left femur demonstrated a large lytic lesion in the femoral neck that contained macroscopic fat and had an aggressive appearance with significant thinning of the cortex. MRI confirmed these findings and demonstrated a nondisplaced subtrochanteric femur fracture in the proximity of the lesion (Figure 1). Contrast‐enhanced CT scans of the thorax, abdomen, and pelvis revealed no other neoplastic lesions. Prostate‐specific antigen level was normal. The patient's significant hypophosphatemia persisted, with levels dropping to as low as 0.9 mg/dL despite aggressive oral phosphate replacement.
Although hypophosphatemia is often a nonspecific finding in hospitalized patients and is usually of little clinical importance, profound hypophosphatemia that is refractory to supplementation suggests an underlying metabolic disorder. Phosphate levels less than 1.0 mg/dL, particularly if prolonged, can lead to decreased adenosine triphosphate production and subsequent weakness of respiratory and cardiac muscles. Parathyroid hormone (PTH) excess and production of parathyroid hormone‐related protein (PTHrP) by a malignancy can cause profound hypophosphatemia, but are generally associated with hypercalcemia, a finding not seen in this case. Occasionally, tumors can lead to renal phosphate wasting via nonPTH‐related mechanisms. The best characterized example of this is the paraneoplastic syndrome oncogenic osteomalacia caused by tumor production of a fibroblast growth factor. Tumors that lead to this syndrome are usually benign mesenchymal tumors. This patient's tumor may be of this type, causing local destruction and metabolic disturbance. The next step would be consultation with orthopedic surgery for resection of the tumor and total hip arthroplasty with aggressive perioperative repletion of phosphate. Assessment of intact PTH, ionized calcium, 24‐hour urinary phosphate excretion, and even PTHrP levels may help to rule out other etiologies of hypophosphatemia, but given that surgery is needed regardless, it might be reasonable to proceed to the operating room without these diagnostics. If the phosphate levels return to normal postoperatively, then the diagnosis is clear and no further metabolic testing is needed.
PTH level was 47 pg/mL (NR 1065), 25‐hydroxyvitamin D level was 25 ng/mL (NR 2580), and 1,25‐dihydroxyvitamin D level was 18 pg/mL (NR 1872). Urinalysis was normal without proteinuria or glucosuria. A 24‐hour urine collection contained 1936 mg of phosphate (NR 4001200). The ratio of maximum rate of renal tubular reabsorption of phosphate to glomerular filtration rate (TmP/GFR) was 1.3 mg/dL (NR 2.44.2). Tissue obtained by CT‐guided needle biopsy of the femoral mass was consistent with a benign spindle cell neoplasm.
With normal calcium levels, the PTH level is appropriate, and hyperparathyroidism is excluded. The levels of 25‐hydroxyvitamin D and 1‐25‐dihydroxyvitamin D are not low enough to suggest that vitamin D deficiency is driving the impressive hypophosphatemia. What is impressive is the phosphate wasting demonstrated by the 24‐hour urine collection, consistent with paraneoplastic overproduction of fibroblast growth factor 23 (FGF23) by the benign bone tumor. Overproduction of this protein can be detected by blood tests or staining of the tumor specimen, but surgery should be performed as soon as possible independent of any further test results. Once the tumor is resected, phosphate metabolism should normalize.
FGF23 level was 266 RU/mL (NR < 180). The patient was diagnosed with tumor‐induced osteomalacia (TIO). He underwent complete resection of the femoral tumor as well as open reduction and internal fixation of the fracture. After surgery, his symptoms of pain and subjective muscle weakness improved, his serum phosphate level normalized, his need for phosphate supplementation resolved, and his blood levels of FGF23 decreased into the normal range (111 RU/mL). The rapid improvement of his symptoms after surgery suggested that they were related to TIO, and not manifestations of SLE or RA. His immunosuppressant medications were discontinued. Surgical pathology demonstrated a heterogeneous tumor consisting of sheets of uniform spindle cells interspersed with mature adipose tissue. This was diagnosed descriptively as a benign spindle cell and lipomatous neoplasm without further classification. Two months later, the patient was ambulating without pain, and muscle strength was subjectively normal.
DISCUSSION
TIO is a rare paraneoplastic syndrome affecting phosphate and vitamin D metabolism, leading to hypophosphatemia and osteomalacia.[1] TIO is caused by the inappropriate tumor secretion of the phosphatonin hormone, FGF23.
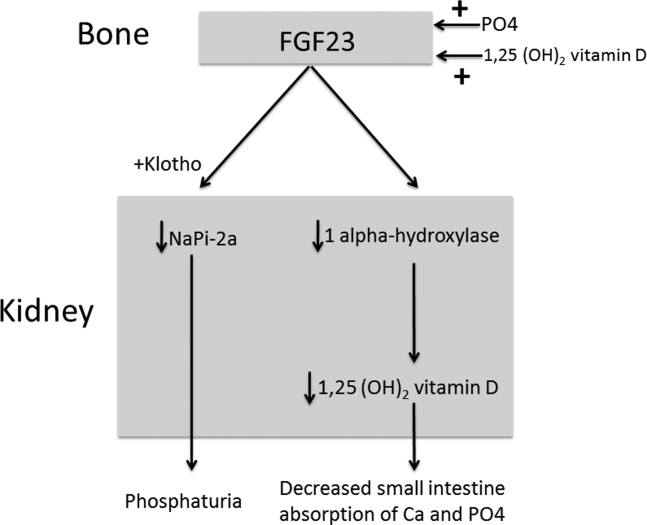
The normal physiology of FGF23 is illustrated in Figure 2. Osteocytes appear to be the primary source of FGF23, but the regulation of FGF23 production is not completely understood. FGF23 production may be influenced by several factors, including 1,25 dihydroxyvitamin D levels, and serum phosphate and PTH concentrations. This hormone binds to the FGF receptor and its coreceptor, Klotho,[2] causing 2 major physiological effects. First, it decreases the expression of the sodium‐phosphate cotransporters in the renal proximal tubular cells,[3, 4] resulting in increased tubular phosphate wasting. This effect appears to be partly PTH dependent.[5] Second, it has effects on vitamin D metabolism, decreasing renal production of activated vitamin D.[3, 4, 6]
In overproduction states, the elevated FGF23 leads to chronically low serum phosphate levels (with renal phosphate wasting) and the clinical syndrome of osteomalacia, manifested by bone pain, fractures, and deformities. Hypophosphatemia can also lead to painful proximal myopathy, cardiorespiratory dysfunction, and a spectrum of neuropsychiatric findings. The clinical findings in TIO are similar to those seen in genetic diseases in which hypophosphatemia results from the same mechanism.[3, 4]
In this case, measurement of the serum phosphate level was important in reaching the diagnosis. Although hypophosphatemia in the hospitalized patient is often easily explained, severe or persistent hypophosphatemia requires a focused evaluation. Causes of hypophosphatemia are categorized in Table 1.[7, 8, 9] In patients with hypophosphatemia that is not explained by the clinical situation (eg, osmotic diuresis, insulin treatment, refeeding syndrome, postparathyroidectomy, chronic diarrhea), measurement of serum calcium, PTH, and 25‐hydroxyvitamin D are used to investigate possible primary or secondary hyperparathyroidism. In addition, low‐normal or low serum 1,25‐dihydroxyvitamin D with normal PTH, normal 25‐hydroxyvitamin D stores, and normal renal function are clues to the presence of TIO. Urine phosphate wasting can be measured by collecting a 24‐hour urine sample. Calculation of the TmP/GFR (a measure of the maximum tubular resorption of phosphate relative to the glomerular filtration rate), as described by the nomogram of Walton and Bijvoet, may improve the accuracy of this assessment and confirm a renal source of the hypophosphatemia.[10]
|
| Internal redistribution |
| Insulin or catecholamine effect (including that related to refeeding syndrome, and infusion of glucose or TPN) |
| Acute respiratory alkalosis |
| Accelerated bone formation or rapid cell proliferation (eg, hungry bone syndrome, leukemic blast crisis, erythropoietin, or granulocyte colony stimulating factor administration) |
| Decreased absorption |
| Poor intake (including that seen in alcoholism*) |
| Vitamin D deficiency |
| Gastrointestinal losses (eg, chronic diarrhea) |
| Malabsorption (eg, phosphate‐binding antacids) |
| Urinary losses |
| Osmotic diuresis (eg, poorly controlled diabetes, acetazolamide) or volume expansion |
| Other diuretics: thiazides, indapamide |
| Hyperparathyroidism |
| Primary |
| Secondary (including vitamin D or calcium deficiency) |
| Parathyroid hormone‐related peptide |
| Renal tubular disease |
| Medications (eg, ethanol,* high‐dose glucocorticoids, cisplatin, bisphosphonates, estrogens, imatinib, acyclovir) |
| Fanconi syndrome |
| Medications inducing Fanconi syndrome: tenofovir, cidofovir, adefovir, aminoglycosides, ifosfamide, tetracyclines, valproic acid |
| Other (eg, postrenal transplant) |
| Excessive phosphatonin hormone activity (eg, hereditary syndromes [rickets], tumor‐induced osteomalacia) |
| Multifactorial causes |
| Alcoholism* |
| Acetaminophen toxicity |
| Parenteral iron administration |
The patient presented here had inappropriate urinary phosphate losses, and laboratory testing ruled out primary and secondary hyperparathyroidism and Fanconi syndrome. The patient was not taking medications known to cause tubular phosphate wasting. The patient's age and clinical history made hereditary syndromes unlikely. Therefore, the urinary phosphate wasting had to be related to an acquired defect in phosphate metabolism. The diagnostic characteristics of TIO are summarized in Table 2.
|
| Patients may present with symptoms of osteomalacia (eg, bone pain, fractures), hypophosphatemia (eg, proximal myopathy), and/or neoplasm. |
| Hypophosphatemia with urinary phosphate wasting. |
| Serum calcium level is usually normal. |
| Serum 1,25‐dihydroxyvitamin D level is usually low or low‐normal. |
| Parathyroid hormone is usually normal. |
| Plasma FGF23 level is elevated. |
| A neoplasm with the appropriate histology is identified, although the osteomalacia syndrome may precede identification of the tumor, which may be occult. |
| The syndrome resolves after complete resection of the tumor. |
The presence of a known neoplasm makes the diagnosis of TIO considerably easier. However, osteomalacia often precedes the tumor diagnosis. In these cases, the discovery of this clinical syndrome necessitates a search for the tumor. The tumors can be small, occult, and often located in the extremities. In addition to standard cross‐sectional imaging, specialized diagnostic modalities can be helpful in localizing culprit tumors. These include F‐18 flourodeoxyglucose positron emission tomography with computed tomography, 111‐Indium octreotide single photon emission CT/CT, 68‐Gallium‐DOTA‐octreotide positron emission tomography with computed tomography, and even selective venous sampling for FGF23 levels.[1, 11] The octreotide tests capitalize on the fact that culprit tumors often express somatostatin receptors.
TIO is most often associated with mesenchymal tumors of the bone or soft tissue. It has also been reported in association with several malignancies (small cell carcinoma, hematologic malignancies, prostate cancer), and with polyostotic fibrous dysplasia, neurofibromatosis, and the epidermal nevus syndrome. The mesenchymal tumors are heterogeneous in appearance and can be variably classified as hemangiopericytomas, hemangiomas, sarcomas, ossifying fibromas, granulomas, giant cell tumors, or osteoblastomas.[1] However, 1 review suggests that most of these tumors actually represent a distinct but heterogeneous, under‐recognized entity that is best classified as a phosphaturic mesenchymal tumor.[11]
TIO is only cured by complete resection of the tumor.[1] Local recurrences have been described, as have rare occurrences of metastatic disease.[1, 12] Medical treatment can be used to normalize serum phosphate levels in patients who are unable to be cured by surgery. The goal is to bring serum phosphate into the low‐normal range via phosphate supplementation (typically 13 g/day of elemental phosphorus is required) and treatment with either calcitriol or alfacalcidol. Due to the inhibition of 1,25‐dihydroxyvitamin D activation in TIO, relatively large doses of calcitriol are needed. A reasonable starting dose of calcitriol is 1.5 g/day, and most patients require 15 to 60 ng/kg per day. Because PTH action is involved in FGF23‐mediated hypophosphatemia, suppression of PTH may also be useful in these patients.[13]
This patient presented with a painful femoral tumor in the setting of muscle and joint pain that had been erroneously attributed to connective tissue disease. However, recognition and thorough evaluation of the patient's hypophosphatemia led to a unifying diagnosis of TIO. This diagnosis altered the surgical approach (emphasizing complete resection to eradicate the FGF23 production) and helped alleviate the patient's painful losses of phosphate.
TEACHING POINTS
- Hypophosphatemia, especially if severe or persistent, should not be dismissed as an unimportant laboratory finding. A focused evaluation should be performed to determine the etiology.
- In patients with unexplained hypophosphatemia, the measurement of serum calcium, parathyroid hormone, and vitamin D levels can identify primary or secondary hyperparathyroidism.
- The differential diagnosis of hypophosphatemia is narrowed if there is clinical evidence of inappropriate urinary phosphate wasting (ie, urinary phosphate levels remain high, despite low serum levels).
- TIO is a rare paraneoplastic syndrome caused by FGF23, a phosphatonin hormone that causes renal phosphate wasting, hypophosphatemia, and osteomalacia.
Disclosure: Nothing to report.
- , , , . Tumor‐induced osteomalacia. Endocr Relat Cancer. 2011;18:R53–R77.
- . The FGF23‐Klotho axis: endocrine regulation of phosphate homeostasis. Nat Rev Endocrinol. 2009;5:611–619.
- , . Genetic disorders of renal phosphate transport. N Engl J Med. 2010;362:2399–2409.
- . The expanding family of hypophosphatemic syndromes. J Bone Miner Metab. 2012;30:1–9.
- , , , , . FGF‐23 is elevated by chronic hyperphosphatemia. J Clin Endocrinol Metab. 2004;89:4489–4492.
- , , , et al. FGF‐23 is a potent regulator of vitamin D metabolism and phosphate homeostasis. J Bone Miner Res. 2004;19:429–435.
- , . Hypophosphatemia: an update on its etiology and treatment. Am J Med. 2005;118:1094–1101.
- , , . In: Melmed S, Polonsky KS, Larsen PR, Kronenberg HM, eds. Williams Textbook of Endocrinology. 12th ed. Philadelphia, PA: Elsevier; 2011:1237–1304.
- , , . Medication‐induced hypophosphatemia: a review. QJM. 2010;103:449–459.
- , . Nomogram for derivation of renal threshold phosphate concentration. Lancet. 1975;2:309–310.
- , , , et al. Improving diagnosis of tumor‐induced osteomalacia with gallium‐68 DOTATATE PET/CT. J Clin Endocrinol Metab. 2013; 98:687–694.
- , , , et al. Most osteomalacia‐associated mesenchymal tumors are a single histopathologic entity: an analysis of 32 cases and a comprehensive review of the literature. Am J Surg Pathol. 2004;28:1–30.
- , , , , , . Cinacalcet in the management of tumor‐induced osteomalacia. J Bone Miner Res. 2007;22:931–937.
A 58‐year‐old man presented to the emergency department with a 1‐month history of progressive, severe left hip pain that had become unbearable. The pain was constant and significantly worse with weight‐bearing, and the patient was now confined to bed. He denied back pain, falls, or trauma.
Although hip pain is a common complaint and a frequent manifestation of chronic degenerative joint disease, the debilitating and subacute nature of the pain suggests a potentially more serious underlying cause. Patients and even clinicians may refer to hip pain when the actual symptoms are periarticular, often presenting over the trochanter laterally, or muscular, presenting as posterior pain. The true hip joint is located in the anterior hip and groin area and often causes symptoms that radiate to the buttock. Pain can also be referred to the hip area from the spine, pelvis, or retroperitoneum, so it is crucial not to restrict the differential diagnosis to hip pathology.
Key diagnostic considerations include (1) inflammatory conditions such as trochanteric bursitis or gout; (2) bacterial infection of the hip joint, adjacent bone, or a nearby structure; (3) benign nerve compression (such as meralgia paresthetica); and (4) tumor (particularly myeloma or metastatic disease to the bone, but also potentially a pelvic or spinal mass with nerve compression). Polymyalgia rheumatica and other systemic rheumatologic complaints are a consideration, but because a single joint is involved, these conditions are less likely. The hip would be an unusual location for a first gout flare, and the duration of symptoms would be unusually long for gout. Avascular necrosis should be considered if the patient has received glucocorticoids for his previously diagnosed rheumatologic disease. If the patient is anticoagulated, consideration of spontaneous hematoma is reasonable, but usually this would present over a course of days, not weeks. The absence of trauma makes a fracture of the hip or pelvis less likely, and the insidious progression of symptoms makes a pathologic fracture less likely.
The patient reported 6 months of worsening proximal upper and lower extremity myalgia and weakness, with arthralgia of the hips and shoulders. The weakness was most notable in his proximal lower extremities, although he had remained ambulatory until the hip pain became limiting. He maintained normal use of his arms. The patient denied current rash but noted photosensitivity and a mild facial rash several months earlier. He described having transient mouth sores intermittently for several years. He denied fever, chills, night sweats, weight loss, dyspnea, recent travel, and outdoor exposures. Several months previously, he had been evaluated for these symptoms at another institution and given the diagnoses of rheumatoid arthritis (RA) and systemic lupus erythematosus (SLE). At that time, he had initiated treatment with weekly dosing of methotrexate and etanercept.
The patient's medical history was also notable for hypertension, Graves' disease treated previously with radioiodine ablation, quiescent ulcerative colitis, and depression. Current medications included methotrexate, etanercept, levothyroxine, enalapril, hydrochlorothiazide, fluoxetine, ibuprofen, and oxycodone‐acetaminophen. He denied tobacco, alcohol, and recreational drug use.
Weakness occurring in the proximal lower extremities is the classic distribution for polymyositis and dermatomyositis. In contrast to polymyalgia rheumatica, dermatomyositis and polymyositis do not generally feature severe muscle pain, but they can be associated with a painful polyarthritis. Oral ulcers, photosensitivity, and facial rash are consistent with SLE, but dermatomyositis can also lead to a symmetrical erythema of the eyelids (commonly referred to as a heliotrope rash, named after the flower bearing that name) and sometimes can be associated with photosensitivity. Oral ulcers, particularly the painful ones known as canker sores, are extraordinarily common in the general population, and patients and providers may miss the mucosal lesions of SLE because they are usually painless. As methotrexate and etanercept are immunosuppressive, opportunistic pathogens such as typical or atypical mycobacteria and disseminated fungal infections should be considered, with special attention to the possibility of infection in or near the left hip. Given that SLE and RA rarely coexist, it would be helpful to seek outside medical records to know what the prior serologic evaluation entailed, but it is unlikely that this presentation is a manifestation of a diffuse connective tissue process.
Physical examination should focus on the features of dermatomyositis including heliotrope rash, truncal erythema, and papules over the knuckles (Gottron's papules); objective proximal muscle weakness in the shoulder and hip girdle; and findings that might suggest antisynthetase syndrome such as hyperkeratotic mechanic hand palmar and digital changes, and interstitial crackles on lung exam. If necrotic skin lesions are found, this would raise concern for a disseminated infection. The joints should be examined for inflammation and effusions.
His temperature was 36.6C, heart rate 74 beats per minute, blood pressure 134/76 mm Hg, respiratory rate 16 breaths per minute, and O2 saturation 97% on room air. He was obese but did not have moon facies or a buffalo hump. There were no rashes or mucosal lesions. Active and passive motion of his left hip joint elicited pain with both flexion/extension and internal/external rotation. Muscle strength was limited by pain in the left hip flexors and extenders, but was 5/5 in all other muscle groups. Palpation of the proximal muscles of his arms and legs did not elicit pain. His extremities were without edema, and examination of his shoulders, elbows, wrists, hands, knees, ankles, and feet did not reveal any erythema, synovial thickening, effusion, or deformity. Examination of the heart, chest, and abdomen was normal.
Given the reassuring strength examination, the absence of rashes or skin lesions, and the reassuring joint exam aside from the left hip, a focal infectious, inflammatory, or malignant process seems most likely. The pain with range of motion of the hip does not definitively localize the pathology to the hip joint, because pathology of the nearby structures can lead to pain when the hip is moved. Laboratory evaluation should include a complete blood count to screen for evidence of infection or marrow suppression, complete metabolic panel, and creatine kinase. The history of ulcerative colitis raises the possibility of an enthesitis (inflammation of tendons or ligaments) occurring near the hip. Enthesitis is sometimes a feature of the seronegative spondyloarthropathy‐associated conditions and can occur in the absence of sacroiliitis or spondyloarthropathy.
The patient's myalgias and arthralgias had recently been evaluated in the rheumatology clinic. Laboratory evaluation from that visit was remarkable only for an antinuclear antibody (ANA) test that was positive at a titer of 1:320 in a homogeneous pattern, creatine phosphokinase 366 IU/L (normal range [NR] 38240), and alkaline phosphatase 203 IU/L (NR 30130). All of the following labs from that visit were within normal ranges: cyclic citrullinated peptide, rheumatoid factor, antidouble stranded DNA, aldolase, complement levels, serum and urine protein electrophoresis, thyroglobulin antibody, thyroid microsomal antibody, thyroid‐stimulating hormone, erythrocyte sedimentation rate (10 mm/h), and C‐reactive protein (0.3 mg/dL).
The patient was admitted to the hospital. Initial blood test results on admission included sodium 139 mEq/L, potassium 3.9 mEq/L, chloride 105 mEq/L, bicarbonate 27 mEq/L, urea nitrogen 16 mg/dL, creatinine 0.6 mg/dL, glucose 85 mg/dL, calcium 9.2 mg/dL (NR 8.810.3), phosphate 1.3 mg/dL (NR 2.74.6), albumin 4.7 g/dL (NR 3.54.9), and alkaline phosphatase 195 IU/L (NR 30130). The remainder of a comprehensive metabolic profile, complete blood count with differential, and coagulation studies were all normal.
The homogeneous ANA titer of 1:320 is high enough to raise eyebrows, but is nonspecific for lupus and other ANA‐associated rheumatologic conditions, and may be a red herring, particularly given the low likelihood of a systemic inflammatory process explaining this new focal hip pain. The alkaline phosphatase is only mildly elevated and could be of bone or liver origin. The reassuringly low inflammatory markers are potentially helpful, because if checked now and substantially increased from the prior outpatient visit, they would be suggestive of a new inflammatory process. However, this would not point to a specific cause of inflammation.
Given the focality of the symptoms, imaging is warranted. As opposed to plain films, contrast‐enhanced computed tomography (CT) of the pelvis or magnetic resonance imaging (MRI) may be an efficient first step, because there is low suspicion for fracture and high suspicion for an inflammatory, neoplastic, or infectious process. MRI is more expensive and usually cannot be obtained as rapidly as CT. There is a chance that CT imaging alone will provide enough information to guide the next diagnostic steps, such as aspiration of an abscess or joint, or biopsy of a suspicious lesion. However, for soft tissue lesions and many bone lesions, including osteomyelitis, MRI offers better delineation of pathology.
CT scan of the left femur demonstrated a large lytic lesion in the femoral neck that contained macroscopic fat and had an aggressive appearance with significant thinning of the cortex. MRI confirmed these findings and demonstrated a nondisplaced subtrochanteric femur fracture in the proximity of the lesion (Figure 1). Contrast‐enhanced CT scans of the thorax, abdomen, and pelvis revealed no other neoplastic lesions. Prostate‐specific antigen level was normal. The patient's significant hypophosphatemia persisted, with levels dropping to as low as 0.9 mg/dL despite aggressive oral phosphate replacement.
Although hypophosphatemia is often a nonspecific finding in hospitalized patients and is usually of little clinical importance, profound hypophosphatemia that is refractory to supplementation suggests an underlying metabolic disorder. Phosphate levels less than 1.0 mg/dL, particularly if prolonged, can lead to decreased adenosine triphosphate production and subsequent weakness of respiratory and cardiac muscles. Parathyroid hormone (PTH) excess and production of parathyroid hormone‐related protein (PTHrP) by a malignancy can cause profound hypophosphatemia, but are generally associated with hypercalcemia, a finding not seen in this case. Occasionally, tumors can lead to renal phosphate wasting via nonPTH‐related mechanisms. The best characterized example of this is the paraneoplastic syndrome oncogenic osteomalacia caused by tumor production of a fibroblast growth factor. Tumors that lead to this syndrome are usually benign mesenchymal tumors. This patient's tumor may be of this type, causing local destruction and metabolic disturbance. The next step would be consultation with orthopedic surgery for resection of the tumor and total hip arthroplasty with aggressive perioperative repletion of phosphate. Assessment of intact PTH, ionized calcium, 24‐hour urinary phosphate excretion, and even PTHrP levels may help to rule out other etiologies of hypophosphatemia, but given that surgery is needed regardless, it might be reasonable to proceed to the operating room without these diagnostics. If the phosphate levels return to normal postoperatively, then the diagnosis is clear and no further metabolic testing is needed.
PTH level was 47 pg/mL (NR 1065), 25‐hydroxyvitamin D level was 25 ng/mL (NR 2580), and 1,25‐dihydroxyvitamin D level was 18 pg/mL (NR 1872). Urinalysis was normal without proteinuria or glucosuria. A 24‐hour urine collection contained 1936 mg of phosphate (NR 4001200). The ratio of maximum rate of renal tubular reabsorption of phosphate to glomerular filtration rate (TmP/GFR) was 1.3 mg/dL (NR 2.44.2). Tissue obtained by CT‐guided needle biopsy of the femoral mass was consistent with a benign spindle cell neoplasm.
With normal calcium levels, the PTH level is appropriate, and hyperparathyroidism is excluded. The levels of 25‐hydroxyvitamin D and 1‐25‐dihydroxyvitamin D are not low enough to suggest that vitamin D deficiency is driving the impressive hypophosphatemia. What is impressive is the phosphate wasting demonstrated by the 24‐hour urine collection, consistent with paraneoplastic overproduction of fibroblast growth factor 23 (FGF23) by the benign bone tumor. Overproduction of this protein can be detected by blood tests or staining of the tumor specimen, but surgery should be performed as soon as possible independent of any further test results. Once the tumor is resected, phosphate metabolism should normalize.
FGF23 level was 266 RU/mL (NR < 180). The patient was diagnosed with tumor‐induced osteomalacia (TIO). He underwent complete resection of the femoral tumor as well as open reduction and internal fixation of the fracture. After surgery, his symptoms of pain and subjective muscle weakness improved, his serum phosphate level normalized, his need for phosphate supplementation resolved, and his blood levels of FGF23 decreased into the normal range (111 RU/mL). The rapid improvement of his symptoms after surgery suggested that they were related to TIO, and not manifestations of SLE or RA. His immunosuppressant medications were discontinued. Surgical pathology demonstrated a heterogeneous tumor consisting of sheets of uniform spindle cells interspersed with mature adipose tissue. This was diagnosed descriptively as a benign spindle cell and lipomatous neoplasm without further classification. Two months later, the patient was ambulating without pain, and muscle strength was subjectively normal.
DISCUSSION
TIO is a rare paraneoplastic syndrome affecting phosphate and vitamin D metabolism, leading to hypophosphatemia and osteomalacia.[1] TIO is caused by the inappropriate tumor secretion of the phosphatonin hormone, FGF23.
The normal physiology of FGF23 is illustrated in Figure 2. Osteocytes appear to be the primary source of FGF23, but the regulation of FGF23 production is not completely understood. FGF23 production may be influenced by several factors, including 1,25 dihydroxyvitamin D levels, and serum phosphate and PTH concentrations. This hormone binds to the FGF receptor and its coreceptor, Klotho,[2] causing 2 major physiological effects. First, it decreases the expression of the sodium‐phosphate cotransporters in the renal proximal tubular cells,[3, 4] resulting in increased tubular phosphate wasting. This effect appears to be partly PTH dependent.[5] Second, it has effects on vitamin D metabolism, decreasing renal production of activated vitamin D.[3, 4, 6]
In overproduction states, the elevated FGF23 leads to chronically low serum phosphate levels (with renal phosphate wasting) and the clinical syndrome of osteomalacia, manifested by bone pain, fractures, and deformities. Hypophosphatemia can also lead to painful proximal myopathy, cardiorespiratory dysfunction, and a spectrum of neuropsychiatric findings. The clinical findings in TIO are similar to those seen in genetic diseases in which hypophosphatemia results from the same mechanism.[3, 4]
In this case, measurement of the serum phosphate level was important in reaching the diagnosis. Although hypophosphatemia in the hospitalized patient is often easily explained, severe or persistent hypophosphatemia requires a focused evaluation. Causes of hypophosphatemia are categorized in Table 1.[7, 8, 9] In patients with hypophosphatemia that is not explained by the clinical situation (eg, osmotic diuresis, insulin treatment, refeeding syndrome, postparathyroidectomy, chronic diarrhea), measurement of serum calcium, PTH, and 25‐hydroxyvitamin D are used to investigate possible primary or secondary hyperparathyroidism. In addition, low‐normal or low serum 1,25‐dihydroxyvitamin D with normal PTH, normal 25‐hydroxyvitamin D stores, and normal renal function are clues to the presence of TIO. Urine phosphate wasting can be measured by collecting a 24‐hour urine sample. Calculation of the TmP/GFR (a measure of the maximum tubular resorption of phosphate relative to the glomerular filtration rate), as described by the nomogram of Walton and Bijvoet, may improve the accuracy of this assessment and confirm a renal source of the hypophosphatemia.[10]
|
| Internal redistribution |
| Insulin or catecholamine effect (including that related to refeeding syndrome, and infusion of glucose or TPN) |
| Acute respiratory alkalosis |
| Accelerated bone formation or rapid cell proliferation (eg, hungry bone syndrome, leukemic blast crisis, erythropoietin, or granulocyte colony stimulating factor administration) |
| Decreased absorption |
| Poor intake (including that seen in alcoholism*) |
| Vitamin D deficiency |
| Gastrointestinal losses (eg, chronic diarrhea) |
| Malabsorption (eg, phosphate‐binding antacids) |
| Urinary losses |
| Osmotic diuresis (eg, poorly controlled diabetes, acetazolamide) or volume expansion |
| Other diuretics: thiazides, indapamide |
| Hyperparathyroidism |
| Primary |
| Secondary (including vitamin D or calcium deficiency) |
| Parathyroid hormone‐related peptide |
| Renal tubular disease |
| Medications (eg, ethanol,* high‐dose glucocorticoids, cisplatin, bisphosphonates, estrogens, imatinib, acyclovir) |
| Fanconi syndrome |
| Medications inducing Fanconi syndrome: tenofovir, cidofovir, adefovir, aminoglycosides, ifosfamide, tetracyclines, valproic acid |
| Other (eg, postrenal transplant) |
| Excessive phosphatonin hormone activity (eg, hereditary syndromes [rickets], tumor‐induced osteomalacia) |
| Multifactorial causes |
| Alcoholism* |
| Acetaminophen toxicity |
| Parenteral iron administration |
The patient presented here had inappropriate urinary phosphate losses, and laboratory testing ruled out primary and secondary hyperparathyroidism and Fanconi syndrome. The patient was not taking medications known to cause tubular phosphate wasting. The patient's age and clinical history made hereditary syndromes unlikely. Therefore, the urinary phosphate wasting had to be related to an acquired defect in phosphate metabolism. The diagnostic characteristics of TIO are summarized in Table 2.
|
| Patients may present with symptoms of osteomalacia (eg, bone pain, fractures), hypophosphatemia (eg, proximal myopathy), and/or neoplasm. |
| Hypophosphatemia with urinary phosphate wasting. |
| Serum calcium level is usually normal. |
| Serum 1,25‐dihydroxyvitamin D level is usually low or low‐normal. |
| Parathyroid hormone is usually normal. |
| Plasma FGF23 level is elevated. |
| A neoplasm with the appropriate histology is identified, although the osteomalacia syndrome may precede identification of the tumor, which may be occult. |
| The syndrome resolves after complete resection of the tumor. |
The presence of a known neoplasm makes the diagnosis of TIO considerably easier. However, osteomalacia often precedes the tumor diagnosis. In these cases, the discovery of this clinical syndrome necessitates a search for the tumor. The tumors can be small, occult, and often located in the extremities. In addition to standard cross‐sectional imaging, specialized diagnostic modalities can be helpful in localizing culprit tumors. These include F‐18 flourodeoxyglucose positron emission tomography with computed tomography, 111‐Indium octreotide single photon emission CT/CT, 68‐Gallium‐DOTA‐octreotide positron emission tomography with computed tomography, and even selective venous sampling for FGF23 levels.[1, 11] The octreotide tests capitalize on the fact that culprit tumors often express somatostatin receptors.
TIO is most often associated with mesenchymal tumors of the bone or soft tissue. It has also been reported in association with several malignancies (small cell carcinoma, hematologic malignancies, prostate cancer), and with polyostotic fibrous dysplasia, neurofibromatosis, and the epidermal nevus syndrome. The mesenchymal tumors are heterogeneous in appearance and can be variably classified as hemangiopericytomas, hemangiomas, sarcomas, ossifying fibromas, granulomas, giant cell tumors, or osteoblastomas.[1] However, 1 review suggests that most of these tumors actually represent a distinct but heterogeneous, under‐recognized entity that is best classified as a phosphaturic mesenchymal tumor.[11]
TIO is only cured by complete resection of the tumor.[1] Local recurrences have been described, as have rare occurrences of metastatic disease.[1, 12] Medical treatment can be used to normalize serum phosphate levels in patients who are unable to be cured by surgery. The goal is to bring serum phosphate into the low‐normal range via phosphate supplementation (typically 13 g/day of elemental phosphorus is required) and treatment with either calcitriol or alfacalcidol. Due to the inhibition of 1,25‐dihydroxyvitamin D activation in TIO, relatively large doses of calcitriol are needed. A reasonable starting dose of calcitriol is 1.5 g/day, and most patients require 15 to 60 ng/kg per day. Because PTH action is involved in FGF23‐mediated hypophosphatemia, suppression of PTH may also be useful in these patients.[13]
This patient presented with a painful femoral tumor in the setting of muscle and joint pain that had been erroneously attributed to connective tissue disease. However, recognition and thorough evaluation of the patient's hypophosphatemia led to a unifying diagnosis of TIO. This diagnosis altered the surgical approach (emphasizing complete resection to eradicate the FGF23 production) and helped alleviate the patient's painful losses of phosphate.
TEACHING POINTS
- Hypophosphatemia, especially if severe or persistent, should not be dismissed as an unimportant laboratory finding. A focused evaluation should be performed to determine the etiology.
- In patients with unexplained hypophosphatemia, the measurement of serum calcium, parathyroid hormone, and vitamin D levels can identify primary or secondary hyperparathyroidism.
- The differential diagnosis of hypophosphatemia is narrowed if there is clinical evidence of inappropriate urinary phosphate wasting (ie, urinary phosphate levels remain high, despite low serum levels).
- TIO is a rare paraneoplastic syndrome caused by FGF23, a phosphatonin hormone that causes renal phosphate wasting, hypophosphatemia, and osteomalacia.
Disclosure: Nothing to report.
- , , , . Tumor‐induced osteomalacia. Endocr Relat Cancer. 2011;18:R53–R77.
- . The FGF23‐Klotho axis: endocrine regulation of phosphate homeostasis. Nat Rev Endocrinol. 2009;5:611–619.
- , . Genetic disorders of renal phosphate transport. N Engl J Med. 2010;362:2399–2409.
- . The expanding family of hypophosphatemic syndromes. J Bone Miner Metab. 2012;30:1–9.
- , , , , . FGF‐23 is elevated by chronic hyperphosphatemia. J Clin Endocrinol Metab. 2004;89:4489–4492.
- , , , et al. FGF‐23 is a potent regulator of vitamin D metabolism and phosphate homeostasis. J Bone Miner Res. 2004;19:429–435.
- , . Hypophosphatemia: an update on its etiology and treatment. Am J Med. 2005;118:1094–1101.
- , , . In: Melmed S, Polonsky KS, Larsen PR, Kronenberg HM, eds. Williams Textbook of Endocrinology. 12th ed. Philadelphia, PA: Elsevier; 2011:1237–1304.
- , , . Medication‐induced hypophosphatemia: a review. QJM. 2010;103:449–459.
- , . Nomogram for derivation of renal threshold phosphate concentration. Lancet. 1975;2:309–310.
- , , , et al. Improving diagnosis of tumor‐induced osteomalacia with gallium‐68 DOTATATE PET/CT. J Clin Endocrinol Metab. 2013; 98:687–694.
- , , , et al. Most osteomalacia‐associated mesenchymal tumors are a single histopathologic entity: an analysis of 32 cases and a comprehensive review of the literature. Am J Surg Pathol. 2004;28:1–30.
- , , , , , . Cinacalcet in the management of tumor‐induced osteomalacia. J Bone Miner Res. 2007;22:931–937.

Glycemic Control in the Hospital
Hyperglycemia is common in hospitalized patients, and hyperglycemia has been associated with poor hospital outcomes. The adverse physiologic effects of acute hyperglycemia are well established1 and several clinical studies have linked hyperglycemia with poor clinical outcomes in certain patient populations.28 Although the optimal target range for inpatient glycemic control has not yet been defined, these studies support the goal of metabolic control for hospital patients. However, there are many barriers to achieving adequate glycemic control in the hospital, and blood glucoses in the hospital are often far from recommended targets.9, 10 One barrier appears to be the low priority given to glycemic control in the hospital. Hyperglycemia in the hospital is often ignored,11 and insulin regimens are often chosen for simplicity as opposed to effectiveness.12 Other barriers to glycemic control in the hospital include the physiologic effects (stress) of acute illness, and the frequent nutritional changes and interruptions that occur.
Most hyperglycemic patients on a general medicine unit are treated with subcutaneous insulin, but the optimal strategy for prescribing insulin in the hospital remains uncertain. A technical review of the literature on the management of diabetes in the hospital setting from 2004 recommends prescribing insulin in a way that mimics physiologic insulin secretion (ie, physiologic or basal‐bolus insulin).1 This approach has been promulgated by experts, but there has been very little research to support these recommendations. One small, randomized trial concluded that a basal‐bolus approach achieved better glycemic control than the use of sliding‐scale insulin alone,13 and 2 quality improvement studies using a before/after design have demonstrated improvements in glycemic control after the implementation of interventions designed to encourage physiologic insulin use.14, 15
In this study we hypothesized that a few simple interventions (education for physicians and nurses, and a standardized insulin order form) would lead to a higher rate of basal‐bolus insulin use and simultaneously improve glycemic control and patient safety.
Methods
Study Design
This study was performed at the University of Michigan Hospital over a 6‐month period, and the protocol was approved by the Institutional Review Board. We performed a quasi‐experimental study comparing 3 patient groups. The intervention group (IG) was subject to all of the interventions discussed below (physician education, nurse education, and the standardized order form). The concurrent control group (CCG) was hospitalized during the same time period as the IG, but was only subject to 1 of the interventions (physician education). These patients were cared for by the same physicians as the IG, but on a different unit where the nurses had not received the education and where the standardized insulin order form was not available. Patients were admitted to the IG unit or the CCG unit via the institution's usual admission process. In addition, we examined an historic control group (HCG) which was hospitalized during the same months of the year, but 2 years prior. The HCG was not subject to any of the interventions.
Interventions
Standardized Subcutaneous Insulin Order Form
This form (Supporting Information Appendix 1) was designed to encourage physicians to prescribe insulin in a physiologic way, providing basal, nutritional, and correctional insulin. The form is based on best practice guidelines,1 and is in agreement with the principles of the inpatient management of diabetes and hyperglycemia endorsed by several professional organizations.16, 17 The form was engineered by a multidisciplinary team, including an endocrinologist, several hospitalists, several nurses, a certified diabetes educator, a pharmacist, and others. It is derived from the extensive experience of the University of Michigan Hospital Intensive Insulin Program (HIIP) in the Division of Endocrinology, and on work done by the Society of Hospital Medicine (SHM) Glycemic Control Task Force.1719 This form was only used in the care of patients in the IG. The form, which was not approved for use on other floors, did not creep to other units. The standardized order form was the only way to order insulin or to modify the insulin regimen on the IG unit. The frequency of review or revision of the insulin orders was left to the discretion of the inpatient physicians.
Physician/Midlevel Provider Education
Physicians and midlevel providers caring for patients in the IG and the CCG were given specific education about the best practice recommendations for the management of diabetes and hyperglycemia in hospitalized patients. This education was based on the principles of anticipatory, physiologic insulin use. On nonhouse staff services, the education was provided to the attending physicians and midlevel providers, and on house staff services, the education was provided to the residents. All physician education was provided by the physician authors (D.W. and R.G.). A summary of the content of the physician education is provided in Supporting Information Appendix 2.
Nurse Education
Nurses caring for patients in the IG were given education similar to that which was provided to the physicians (see above), with an emphasis on practical issues related to delivering physiologic insulin. It included topics such as blood glucose monitoring, and the real‐time manipulation of nutritional insulin doses in accordance with the clinical situation (decision‐making that was specifically delegated to the nursing staff by the order set).
Patients
Patients were eligible for inclusion in the analysis if they met the following inclusion criteria: they were admitted to the inpatient General Internal Medicine Services; subcutaneous insulin was provided to the patient during the hospitalization; they had at least 2 blood glucose values >180 mg/dL; they were discharged from the hospital on a pharmacologic glucose lowering agent (insulin or oral); and their total length‐of‐stay was 3 days to 14 days. Patients were excluded from the analysis if they were admitted with a primary diagnosis of diabetic ketoacidosis, diabetic hyperosmolar state, or hypoglycemia. Up to 10 consecutive days of glucose data were recorded for each patient, and the first day on which blood glucose information was available from the admitting floor was excluded from the analysis. Also, specific patient‐days were not analyzed if there were no bedside glucoses recorded, or if the patient was treated with an IV insulin infusion on that day.
Outcomes
The primary outcome was glycemic control. The primary unit of measure was the patient‐day (ie, all of the information for 1 patient on a single qualifying day). This was done to correct for the phenomenon of frequent repeat testing in response to abnormal values. It also allows for a more clinically relevant description of the actual glycemic control on a given day. Specifically, each patient‐day was categorized as in‐range (70‐180 mg/dL), hyperglycemic (>180 mg/dL), severely hyperglycemic (>250 mg/dL), hypoglycemic (<70 mg/dL), and/or severely hypoglycemic (<50 mg/dL). The primary endpoint was glycemic control in‐range. For a patient‐day to be in‐range, all readings for that particular day were within 70 mg/dL to180 mg/dL. For the readings that were not in the desired range, a minimum of 1 deviant reading in a particular day constituted classification into that category, and a single out‐of‐range patient‐day could be included in 1 or more of the out‐of‐range categories (eg, a patient‐day could be categorized as both severely hyperglycemic and hypoglycemic if it contained glucose readings in both of those ranges).
The day‐weighted mean blood glucose value was also calculated for each of the groups. This calculation utilized the mean blood glucose for each patient‐day, and then averaged these values for each group. These metrics have been endorsed as appropriate measures of glycemic control by the SHM Glycemic Control Task Force.20
Other Data
Several other clinical features were also examined, including the following: primary diagnoses listed in the hospital discharge summary for each patient (3 maximum); possible confounders including patient weight, length‐of‐stay, days receiving tube feeds, days receiving parenteral nutrition, and days during which patients were treated with high‐dose glucocorticoids (>10 mg/day of prednisone, or its equivalent) or oral diabetes medications; and the composition of the insulin regimen on each hospital day. Definitions of insulin regimens are provided in Table 1.
| |
| Any basal insulin day | Any day in which intermediate‐acting or long‐acting, scheduled insulin was given. |
| Basal insulin alone day | A day in which intermediate‐acting or long‐acting insulin was the only scheduled insulin given. |
| Any nutritional insulin day | Any day in which rapid‐acting or short‐acting, scheduled insulin was given. |
| Nutritional insulin alone day | A day in which rapid‐acting or short‐acting insulin was the only scheduled insulin given. |
| Basal plus nutritional day | A day in which both scheduled, intermediate‐acting or long‐acting insulin and scheduled, rapid‐acting or short‐acting insulin were given. |
| Pre‐mixed insulin day | Any day in which a pre‐mixed combination insulin was given. |
| Basal plus nutritional or pre‐mixed insulin day | A composite of the basal plus nutritional day category and the mixed insulin day category described above. This group includes any day in which either a pre‐mixed combination insulin was given OR a day in which both: (a) scheduled, intermediate‐acting or long‐acting and (b) scheduled, rapid‐acting or short‐acting insulin were given. |
| Sliding scale insulin alone day* | Any day when only correctional (as needed) insulin was given. |
Statistical Analysis
Bivariate analyses (chi‐square, and t‐tests) were carried out to compare demographic characteristics of the intervention and control populations. Since there were multiple glucose readings nested within individuals, multilevel mixed‐effects logistic regression was used to evaluate the association between the intervention and outcomes. A 2‐level hierarchical model was developed in which patient‐days were nested within patients; this accounted for the correlation between glycemic control across days for a given patient. Patient‐day was modeled as a random intercept and the log likelihood was estimated using adaptive Gaussian quadrature with 7 integration points. Alpha was set at 0.05, 2‐tailed. The final model was adjusted for gender, age, weight, length‐of‐stay, use of oral diabetes agents, use of sulfonylureas, and use of high‐dose corticosteroids. The use of a nonoral feeding route (eg, tube feeding or parenteral nutrition) was too infrequent to be considered in the adjusted analysis. All analyses were conducted in Stata/IC 10.0 (College Station, TX).
Results
A total of 245 patients provided 1315 patient‐days. Patient demographics are shown in Table 2. The patients' weight, length‐of‐stay, and primary diagnoses were similar across the 3 groups. There was a higher percentage of males in the IG as compared to the HCG.
| IG | CCG | P Value IG vs. CCG | HCG | P Value IG vs. HCG | |
|---|---|---|---|---|---|
| |||||
| Number of patients | 84 | 86 | 75 | ||
| Age, years, mean (SD) | 59.3 (15.3) | 60.4 (15.9) | 0.68 | 59.2 (17.2) | 0.96 |
| Range (n = 245) | 18‐94 | 20‐87 | 24‐92 | ||
| Weight in kg, mean (SD) | 92.2 (29.5) | 89.5 (27.2) | 0.57 | 94.2 (35.4) | 0.69 |
| Range (n = 237) | 40‐198 | 40‐188 | 42‐235 | ||
| Sex, n (%) (n = 245) | 0.17 | 0.04 | |||
| Male | 45 (53.6) | 37 (43.0) | 28 (37.3) | ||
| Female | 39(46.4) | 49 (57.0) | 47 (62.7) | ||
| Length of stay, mean (SD) | 7.6 (3.3) | 7.4 (3.0) | 0.62 | 7.0 (2.5) | 0.14 |
| Range (n = 245) | 4‐15 | 4‐15 | 4‐14 | ||
| Number of diagnoses | 169 | 158 | 160 | ||
| Primary diagnoses, n (%) | 0.56 | 0.10 | |||
| Infections | 40 (23.7) | 45 (28.5) | 49 (30.6) | ||
| Gastrointestinal | 33 (19.5) | 19 (12.0) | 14 (8.8) | ||
| Rheumatologic | 13 (7.7) | 12 (7.6) | 18 (11.2) | ||
| Renal | 14 (8.3) | 10 (6.3) | 16 (10.0) | ||
| Diabetes‐related | 11 (6.5) | 11 (7.0) | 10 (6.2) | ||
| Neurologic | 8 (4.7) | 11 (7.0) | 11 (6.9) | ||
| *Misc/other | 50 (29.6) | 50 (31.6) | 42 (26.3) | ||
Table 3 shows the insulin regimens used in the different groups. The use of basal insulin was similar between groups. Congruent with the goals of the education session and the order set, patients in the IG were more likely to be treated with a combination of basal and nutritional insulin than patients in the other groups. Patients in the HCG were more likely to be treated with a premixed insulin than patients in the other groups. However, even when premixed insulin was categorized as a form of basal plus nutritional insulin and combined into a composite group with the combined basal and nutritional days, this type of regimen remained more common in the IG than in the HCG. The rate of sliding scale insulin use alone (ie, without any scheduled insulin) was similar in the 3 groups.
| Patient‐days on the following | IG (n = 453) | CCG (n = 471) | P Value IG vs. CCG | HCG (n = 391) | P Value IG vs. HCG |
|---|---|---|---|---|---|
| |||||
| Sliding scale alone, n (%) | 105 (23.2) | 130 (27.6) | 0.12 | 89 (22.8) | 0.89 |
| Basal alone, n (%) | 132 (29.1) | 231 (49.0) | <0.01 | 199 (50.9) | <0.01 |
| Nutritional alone, n (%) | 22 (4.9) | 5 (1.1) | <0.01 | 8 (2.0) | 0.03 |
| Basal plus nutritional, n (%) | 166 (36.6) | 71 (15.1) | <0.01 | 14 (3.6) | <0.01 |
| Pre‐mixed insulin included, n (%) | 27 (6.0) | 32 (6.8) | 0.60 | 78 (20.0) | <0.01 |
| No insulin, n (%) | 1 (<1) | 2 (<1) | 0.59 | 3 (<1) | 0.28 |
| Any basal, n (%) | 325 (71.7) | 334 (70.9) | 0.78 | 291 (74.4) | 0.38 |
| Any nutritional, n (%) | 215 (47.5) | 108 (22.9) | <0.01 | 100 (25.6) | <0.01 |
| Basal plus nutritional or pre‐mixed, n (%) | 193 (42.6) | 103 (21.9) | <0.01 | 92 (23.5) | <0.01 |
| Oral diabetes agents, n (%) | 79 (17.4) | 83 (17.6) | 0.94 | 74 (18.9) | 0.58 |
| Sulfonylureas, n (%) | 40 (8.8) | 63 (13.4) | 0.03 | 37 (9.5) | 0.75 |
| Parenteral nutrition/tube feeds, n (%) | 0 (0) | 18 (3.8) | 8 (2.0) | ||
| High dose corticosteroids, n (%) | 66 (14.6) | 93 (19.8) | 0.04 | 51 (13.0) | 0.52 |
Other relevant measures are also shown in Table 3. The use of oral diabetes agents was similar in the 3 groups. The use of a nonoral feeding route (eg, tube feeding or parenteral nutrition) was infrequent.
A comparison of glycemic control in the three groups is shown in Table 4. In contrast to the CCG, patients in the IG experienced more days within the target glucose range (17% vs. 10.6%, P < 0.01), fewer days with severe hyperglycemia (48.3% vs. 59.2%, P < 0.01), and had a lower day‐weighted average blood glucose (195.9 vs. 212.6, P < 0.01). Compared to the HCG, patients in the IG experienced similar rates of hyperglycemia, but fewer hypoglycemic days (5.1% vs. 9.2%, P = 0.02).
| IG (n = 453) | CCG (n = 471) | P Value IG vs. CCG | HCG (n = 391) | P Value IG vs. HCG | |
|---|---|---|---|---|---|
| |||||
| Patient‐days | |||||
| In range, n (%) | 77 (17.0) | 50 (10.6) | <0.01 | 66 (16.9) | 0.98 |
| Out of range, n (%) | 376 (83.0) | 421 (89.4) | <0.01 | 325 (83.1) | 0.98 |
| Hyperglycemic, n (%) | 289 (63.8) | 310 (65.8) | 0.52 | 248 (63.4) | 0.91 |
| Severely hyperglycemic, n (%) | 219 (48.3) | 279 (59.2) | <0.01 | 176 (45.0) | 0.32 |
| Hypoglycemic, n (%) | 23 (5.1) | 36 (7.6) | 0.11 | 36 (9.2) | 0.02 |
| Severely hypoglycemic, n (%) | 13 (2.9) | 10 (2.1) | 0.47 | 15 (3.8) | 0.44 |
| Day weighted average blood glucose (SD) | 195.9 (66.8) | 212.6 (73.4) | <0.01 | 190.5 (63.1) | 0.25 |
The percentages of patients with severe hyperglycemia in each group are shown in Figure 1 by hospital day. Severe hyperglycemia was common, but there was a trend towards a decrease in the prevalence of severe hyperglycemia with increasing hospital days for all study groups, although it was consistently higher in the CCG than in the IG. Figure 2 shows the types of insulin regimens used by hospital day (composite for all groups). The use of basal plus nutritional insulin (the recommended regimen) increased gradually with increasing hospital days. When taken together, the information in both figures support the hypothesis that the use of the recommended insulin regimen may have contributed to the modest improvements in glycemic control seen in the IG.
In the final adjusted regression model, the intervention had a positive impact on glycemic control (Table 5). Subjects in the IG had a 72% increase in the odds of being in the target glucose range when compared to subjects in the CCG (P = 0.01). In addition, subjects in the IG had a 35% reduction in the odds of being severely hyperglycemic when compared to those in the CCG (P < 0.01). Finally, the odds ratio (OR) for being hypoglycemic among intervention subjects was 0.59 (P = 0.06) when compared to subjects in the CCG and 0.48 (P = 0.01) when compared to subjects in the HCG.
| Adjusted OR* IG vs. CCG | 95% CI | P value IG vs. CCG | Adjusted OR* IG vs. HCG | 95% CI | P Value IG vs. HCG | |
|---|---|---|---|---|---|---|
| ||||||
| In range | 1.72 | 1.16,2.55 | 0.01 | 1.08 | 0.74,1.58 | 0.68 |
| Hyperglycemic | 0.93 | 0.70,1.22 | 0.58 | 0.95 | 0.71,1.28 | 0.74 |
| Severely Hyperglycemic | 0.65 | 0.49,0.85 | <0.01 | 1.10 | 0.82,1.47 | 0.52 |
| Hypoglycemic | 0.59 | 0.34,1.02 | 0.06 | 0.48 | 0.27,0.85 | 0.01 |
| Severely Hypoglycemic | 1.36 | 0.59,3.14 | 0.47 | 0.97 | 0.29,1.44 | 0.28 |
Discussion
In this study, we investigated the effects of a standardized insulin order set, coupled with physician and nurse education, on glycemic control in hyperglycemic hospitalized patients. These interventions were designed to encourage a standardized approach to the treatment of hyperglycemia in hospitalized patients, based on the principles of physiologic insulin use, as described above. Our data suggest that the interventions did, indeed, alter the way insulin was prescribed, as more patients in the IG received a combination of basal plus nutritional insulin (the recommended regimen) than in the other groups. These interventions were associated with improved glycemic outcomes in the IG as compared to the CCG. The IG experienced a higher percentage of days in the target range and a trend toward fewer hypoglycemic days than the CCG. Although the IG experienced a similar percentage of days in the target range, it had significantly fewer hypoglycemic days than the HCG.
It is useful to consider the results of our study in the context of 2 other similar studies performed by Schnipper et al.14 and Maynard et al.15 Although each of these 3 studies have different study designs, they are similar in intent (to test the effects of simple quality improvement interventions on glycemic control in the hospital) and results (all showed significant improvements in some aspect of glycemic control). In our study, and the study by Maynard et al.,15 the interventions also led to decreases in the rates of hypoglycemia, whereas Schnipper et al.14 observed no difference in hypoglycemia. Of interest, in each of the three studies the interventions were associated with an increase in the use of some type of scheduled insulin. In our study and the study from Schnipper et al.14 the baseline use of basal insulin was quite high, and the interventions were associated with a significant increase in the addition of nutritional insulin. In the Maynard et al.15 study, the baseline use of sliding scale insulin alone was prevalent, and the interventions resulted in an increase in the use of basal insulin. The results of these studies, taken together, prompt us to conclude that the interventions employed in these studies are likely to lead to more frequent prescription of scheduled (anticipatory) insulin, and a modest improvement in glycemic control, without an increase (and perhaps with a decrease) in hypoglycemia.
A few of our study results are unexpected, or difficult to explain. In contrast to the other studies discussed above, our interventions did not affect the frequency of the use of sliding‐scale insulin alone (without any scheduled insulin), which was similar in the 3 groups. Although the reason for this is uncertain, we hypothesize that the high baseline use of basal insulin in our institution, and the lack of a hard stop preventing the use of sliding scale insulin alone explain this finding. Also, it is difficult to explain why measures of hyperglycemia were similar between the IG and the HCG despite the fact that the HCG was less often treated with a combination of basal and nutritional insulin and more often treated with mixed insulin.
There are several different mechanisms by which the interventions might have resulted in improved glycemic control in the IG compared to CCG. Our data clearly shows that insulin was prescribed differently in the IG, and the more frequent use of a combination of scheduled basal and nutritional insulin might have contributed to the differences between the groups. However, the effects of our interventions clearly went beyond physician education into the realm of true process improvement and standardization. The standardized order form was designed to prompt physicians to use a basal‐bolus insulin regimen. The order form also created nursing expectations of how insulin should be ordered, and clarified the roles of the different insulins that were prescribed.
On the medication administration record, each insulin was labeled as basal insulin (to be given even when fasting) or nutritional insulin (to be given along with the meal). The nurses caring for the IG also attended an education program that reinforced the role of the nurse in the bedside management of insulin administration. Specifically, nurses were taught to assess the premeal blood glucose and the patient's nutritional situation before giving the nutritional insulin (ie, Does the patient have food available? Will he tolerate eating the food?). In situations where is was not clear if the patient would be able to tolerate the ordered nutrition, the order set empowered the nurse to give the nutritional insulin after the meal, and to reduce the dose to match the patient's actual intake. These interventions resulted in some fundamental improvements in the nursing process of delivering insulin to the patient, and these changes might have resulted in improvements via mechanisms that are difficult to directly measure. Since the same physicians cared for both the IG and the CCG, interventions other than physician education clearly contributed to the observed improvements in the IG.
This study was not a randomized study, and there could be important undetected differences between the groups. However, all of the patients were admitted to the General Medicine Inpatient Services and the comparison of the general patient demographics and primary diagnoses between the groups do not suggest major differences.
Although the improvements in glycemic control seen in this study were statistically significant, they were quantitatively modest. The rates of hyperglycemia seen in this study, on the other hand, are quite remarkable. Both the American Diabetes Association and the American College of Endocrinology have recommended that blood glucoses in hospitalized patients not exceed a maximum value of 180 mg/dL, but the day‐weighted average blood glucose in this study was above that for each group. Even in the IG, over 80% of all patient‐days included at least 1 blood glucose value outside of the target range. These data suggest that better strategies for achieving metabolic control in hospitalized patients are needed.
It is worth mentioning that our interventions were not aggressively enforced. While the use of the order set was mandatory for the IG, it was flexible enough to allow for substantial practice variation, especially with respect to the dose of insulin prescribed. Although the education sessions discussed the specifics of insulin dosing in hospitalized patients, the order form did not offer dosing guidelines. It is possible that our interventions may have had a larger impact if a starting dose of insulin had been specified on the form. Although the insulin order form prompted physicians to act, there were no forced functions. Also, not all house staff attended the education sessions for physicians, and there was no feedback provided to physicians related to how they might improve their adherence to the recommendations presented in the educational module. Therefore, it is likely that more aggressive interventions could have led to greater changes in physician practice.
In conclusion, this study demonstrates that interventions including physician and nurse education and a standardized insulin order set can lead to improvement in glycemic control and patient safety in hospitalized patients treated with subcutaneous insulin. However, the observed improvements are modest, and poor metabolic control remains common, despite these interventions. These data suggest that standardization of the process of ordering and delivering subcutaneous insulin in the hospital may lead to a reduction in both hyperglycemia and hypoglycemia. However, it is clear that the interventions used in this study were not potent enough to achieve the recommended glycemic targets for the majority of patients. Additional research is needed to determine the best strategy for achieving safe and effective metabolic control in hospitalized, hyperglycemic, noncritically ill patients.
Acknowledgements
The authors thank David Conway for his work in data collection and management.
- ,,, et al.Management of diabetes and hyperglycemia in hospitals.Diabetes Care.2004;27:553–591.
- ,,, et al.Intensive insulin therapy in the critically ill patients.N Engl J Med.2001;345:1359–1367.
- ,,, et al.Intensive insulin therapy in the medical ICU.N Engl J Med.2006;354:449–461.
- ,,,.Continuous intravenous insulin infusion reduces the incidence of deep sternal wound infection in diabetic patients after cardiac surgical procedures.Ann Thorac Surg.1999;67:352–360; discussion360–352.
- ,,, et al.Continuous insulin infusion reduces mortality in patients with diabetes undergoing coronary artery bypass grafting.J Thorac Cardiovasc Surg.2003;125:1007–1021.
- ,,,,,.Hyperglycemia: an independent marker of in‐hospital mortality in patients with undiagnosed diabetes.J Clin Endocrinol Metab.2002;87:978–982.
- ,,, et al.Early postoperative glucose control predicts nosocomial infection rate in diabetic patients.JPEN J Parenter Enteral Nutr.1998;22:77–81.
- ,,,,,.The relation between hyperglycemia and outcomes in 2,471 patients admitted to the hospital with community‐acquired pneumonia.Diabetes Care.2005;28:810–815.
- ,.Glycemic chaos (not glycemic control) still the rule for inpatient care: how do we stop the insanity?J Hosp Med.2006;1:141–144.
- ,,, et al.Evaluation of hospital glycemic control at US Academic Medical Centers.J Hosp Med.2009;4:35–44.
- ,,, et al.Diabetes care in the hospital: is there clinical inertia?J Hosp Med.2006;1:151–160.
- ,,,,.Inpatient management of diabetes and hyperglycemia among general medicine patients at a large teaching hospital.J Hosp Med.2006;1:145–150.
- ,,, et al.Randomized study of basal‐bolus insulin therapy in the inpatient management of patients with type 2 diabetes (RABBIT 2 trial).Diabetes Care.2007;30:2181–2186.
- ,,,.Effects of a subcutaneous insulin protocol, clinical education, and computerized order set on the quality of inpatient management of hyperglycemia: results of a clinical trial.J Hosp Med.2009;4:16–27.
- ,,,,.Improved inpatient use of basal insulin, reduced hypoglycemia, and improved glycemic control: effect of structured subcutaneous insulin orders and an insulin management algorithm.J Hosp Med.2009;4:3–15.
- ,,, et al.American College of Endocrinology position statement on inpatient diabetes and metabolic control.Endocr Pract.2004;10:77–82.
- Society of Hospital Medicine. Glycemic Control Resource Room. Available at: http://www.hospitalmedicine.org/AM/Template.cfm?Section= Quality_Improvement_Resource_Rooms3(5 Suppl):17–28.
- ,,,.Subcutaneous insulin order sets and protocols: effective design and implementation strategies.J Hosp Med.2008;3(5 Suppl):29–41.
- ,,,,.Society of Hospital Medicine Glycemic Control Task Force summary: practical recommendations for assessing the impact of glycemic control efforts.J Hosp Med.2008;3(5 Suppl):66–75.
Hyperglycemia is common in hospitalized patients, and hyperglycemia has been associated with poor hospital outcomes. The adverse physiologic effects of acute hyperglycemia are well established1 and several clinical studies have linked hyperglycemia with poor clinical outcomes in certain patient populations.28 Although the optimal target range for inpatient glycemic control has not yet been defined, these studies support the goal of metabolic control for hospital patients. However, there are many barriers to achieving adequate glycemic control in the hospital, and blood glucoses in the hospital are often far from recommended targets.9, 10 One barrier appears to be the low priority given to glycemic control in the hospital. Hyperglycemia in the hospital is often ignored,11 and insulin regimens are often chosen for simplicity as opposed to effectiveness.12 Other barriers to glycemic control in the hospital include the physiologic effects (stress) of acute illness, and the frequent nutritional changes and interruptions that occur.
Most hyperglycemic patients on a general medicine unit are treated with subcutaneous insulin, but the optimal strategy for prescribing insulin in the hospital remains uncertain. A technical review of the literature on the management of diabetes in the hospital setting from 2004 recommends prescribing insulin in a way that mimics physiologic insulin secretion (ie, physiologic or basal‐bolus insulin).1 This approach has been promulgated by experts, but there has been very little research to support these recommendations. One small, randomized trial concluded that a basal‐bolus approach achieved better glycemic control than the use of sliding‐scale insulin alone,13 and 2 quality improvement studies using a before/after design have demonstrated improvements in glycemic control after the implementation of interventions designed to encourage physiologic insulin use.14, 15
In this study we hypothesized that a few simple interventions (education for physicians and nurses, and a standardized insulin order form) would lead to a higher rate of basal‐bolus insulin use and simultaneously improve glycemic control and patient safety.
Methods
Study Design
This study was performed at the University of Michigan Hospital over a 6‐month period, and the protocol was approved by the Institutional Review Board. We performed a quasi‐experimental study comparing 3 patient groups. The intervention group (IG) was subject to all of the interventions discussed below (physician education, nurse education, and the standardized order form). The concurrent control group (CCG) was hospitalized during the same time period as the IG, but was only subject to 1 of the interventions (physician education). These patients were cared for by the same physicians as the IG, but on a different unit where the nurses had not received the education and where the standardized insulin order form was not available. Patients were admitted to the IG unit or the CCG unit via the institution's usual admission process. In addition, we examined an historic control group (HCG) which was hospitalized during the same months of the year, but 2 years prior. The HCG was not subject to any of the interventions.
Interventions
Standardized Subcutaneous Insulin Order Form
This form (Supporting Information Appendix 1) was designed to encourage physicians to prescribe insulin in a physiologic way, providing basal, nutritional, and correctional insulin. The form is based on best practice guidelines,1 and is in agreement with the principles of the inpatient management of diabetes and hyperglycemia endorsed by several professional organizations.16, 17 The form was engineered by a multidisciplinary team, including an endocrinologist, several hospitalists, several nurses, a certified diabetes educator, a pharmacist, and others. It is derived from the extensive experience of the University of Michigan Hospital Intensive Insulin Program (HIIP) in the Division of Endocrinology, and on work done by the Society of Hospital Medicine (SHM) Glycemic Control Task Force.1719 This form was only used in the care of patients in the IG. The form, which was not approved for use on other floors, did not creep to other units. The standardized order form was the only way to order insulin or to modify the insulin regimen on the IG unit. The frequency of review or revision of the insulin orders was left to the discretion of the inpatient physicians.
Physician/Midlevel Provider Education
Physicians and midlevel providers caring for patients in the IG and the CCG were given specific education about the best practice recommendations for the management of diabetes and hyperglycemia in hospitalized patients. This education was based on the principles of anticipatory, physiologic insulin use. On nonhouse staff services, the education was provided to the attending physicians and midlevel providers, and on house staff services, the education was provided to the residents. All physician education was provided by the physician authors (D.W. and R.G.). A summary of the content of the physician education is provided in Supporting Information Appendix 2.
Nurse Education
Nurses caring for patients in the IG were given education similar to that which was provided to the physicians (see above), with an emphasis on practical issues related to delivering physiologic insulin. It included topics such as blood glucose monitoring, and the real‐time manipulation of nutritional insulin doses in accordance with the clinical situation (decision‐making that was specifically delegated to the nursing staff by the order set).
Patients
Patients were eligible for inclusion in the analysis if they met the following inclusion criteria: they were admitted to the inpatient General Internal Medicine Services; subcutaneous insulin was provided to the patient during the hospitalization; they had at least 2 blood glucose values >180 mg/dL; they were discharged from the hospital on a pharmacologic glucose lowering agent (insulin or oral); and their total length‐of‐stay was 3 days to 14 days. Patients were excluded from the analysis if they were admitted with a primary diagnosis of diabetic ketoacidosis, diabetic hyperosmolar state, or hypoglycemia. Up to 10 consecutive days of glucose data were recorded for each patient, and the first day on which blood glucose information was available from the admitting floor was excluded from the analysis. Also, specific patient‐days were not analyzed if there were no bedside glucoses recorded, or if the patient was treated with an IV insulin infusion on that day.
Outcomes
The primary outcome was glycemic control. The primary unit of measure was the patient‐day (ie, all of the information for 1 patient on a single qualifying day). This was done to correct for the phenomenon of frequent repeat testing in response to abnormal values. It also allows for a more clinically relevant description of the actual glycemic control on a given day. Specifically, each patient‐day was categorized as in‐range (70‐180 mg/dL), hyperglycemic (>180 mg/dL), severely hyperglycemic (>250 mg/dL), hypoglycemic (<70 mg/dL), and/or severely hypoglycemic (<50 mg/dL). The primary endpoint was glycemic control in‐range. For a patient‐day to be in‐range, all readings for that particular day were within 70 mg/dL to180 mg/dL. For the readings that were not in the desired range, a minimum of 1 deviant reading in a particular day constituted classification into that category, and a single out‐of‐range patient‐day could be included in 1 or more of the out‐of‐range categories (eg, a patient‐day could be categorized as both severely hyperglycemic and hypoglycemic if it contained glucose readings in both of those ranges).
The day‐weighted mean blood glucose value was also calculated for each of the groups. This calculation utilized the mean blood glucose for each patient‐day, and then averaged these values for each group. These metrics have been endorsed as appropriate measures of glycemic control by the SHM Glycemic Control Task Force.20
Other Data
Several other clinical features were also examined, including the following: primary diagnoses listed in the hospital discharge summary for each patient (3 maximum); possible confounders including patient weight, length‐of‐stay, days receiving tube feeds, days receiving parenteral nutrition, and days during which patients were treated with high‐dose glucocorticoids (>10 mg/day of prednisone, or its equivalent) or oral diabetes medications; and the composition of the insulin regimen on each hospital day. Definitions of insulin regimens are provided in Table 1.
| |
| Any basal insulin day | Any day in which intermediate‐acting or long‐acting, scheduled insulin was given. |
| Basal insulin alone day | A day in which intermediate‐acting or long‐acting insulin was the only scheduled insulin given. |
| Any nutritional insulin day | Any day in which rapid‐acting or short‐acting, scheduled insulin was given. |
| Nutritional insulin alone day | A day in which rapid‐acting or short‐acting insulin was the only scheduled insulin given. |
| Basal plus nutritional day | A day in which both scheduled, intermediate‐acting or long‐acting insulin and scheduled, rapid‐acting or short‐acting insulin were given. |
| Pre‐mixed insulin day | Any day in which a pre‐mixed combination insulin was given. |
| Basal plus nutritional or pre‐mixed insulin day | A composite of the basal plus nutritional day category and the mixed insulin day category described above. This group includes any day in which either a pre‐mixed combination insulin was given OR a day in which both: (a) scheduled, intermediate‐acting or long‐acting and (b) scheduled, rapid‐acting or short‐acting insulin were given. |
| Sliding scale insulin alone day* | Any day when only correctional (as needed) insulin was given. |
Statistical Analysis
Bivariate analyses (chi‐square, and t‐tests) were carried out to compare demographic characteristics of the intervention and control populations. Since there were multiple glucose readings nested within individuals, multilevel mixed‐effects logistic regression was used to evaluate the association between the intervention and outcomes. A 2‐level hierarchical model was developed in which patient‐days were nested within patients; this accounted for the correlation between glycemic control across days for a given patient. Patient‐day was modeled as a random intercept and the log likelihood was estimated using adaptive Gaussian quadrature with 7 integration points. Alpha was set at 0.05, 2‐tailed. The final model was adjusted for gender, age, weight, length‐of‐stay, use of oral diabetes agents, use of sulfonylureas, and use of high‐dose corticosteroids. The use of a nonoral feeding route (eg, tube feeding or parenteral nutrition) was too infrequent to be considered in the adjusted analysis. All analyses were conducted in Stata/IC 10.0 (College Station, TX).
Results
A total of 245 patients provided 1315 patient‐days. Patient demographics are shown in Table 2. The patients' weight, length‐of‐stay, and primary diagnoses were similar across the 3 groups. There was a higher percentage of males in the IG as compared to the HCG.
| IG | CCG | P Value IG vs. CCG | HCG | P Value IG vs. HCG | |
|---|---|---|---|---|---|
| |||||
| Number of patients | 84 | 86 | 75 | ||
| Age, years, mean (SD) | 59.3 (15.3) | 60.4 (15.9) | 0.68 | 59.2 (17.2) | 0.96 |
| Range (n = 245) | 18‐94 | 20‐87 | 24‐92 | ||
| Weight in kg, mean (SD) | 92.2 (29.5) | 89.5 (27.2) | 0.57 | 94.2 (35.4) | 0.69 |
| Range (n = 237) | 40‐198 | 40‐188 | 42‐235 | ||
| Sex, n (%) (n = 245) | 0.17 | 0.04 | |||
| Male | 45 (53.6) | 37 (43.0) | 28 (37.3) | ||
| Female | 39(46.4) | 49 (57.0) | 47 (62.7) | ||
| Length of stay, mean (SD) | 7.6 (3.3) | 7.4 (3.0) | 0.62 | 7.0 (2.5) | 0.14 |
| Range (n = 245) | 4‐15 | 4‐15 | 4‐14 | ||
| Number of diagnoses | 169 | 158 | 160 | ||
| Primary diagnoses, n (%) | 0.56 | 0.10 | |||
| Infections | 40 (23.7) | 45 (28.5) | 49 (30.6) | ||
| Gastrointestinal | 33 (19.5) | 19 (12.0) | 14 (8.8) | ||
| Rheumatologic | 13 (7.7) | 12 (7.6) | 18 (11.2) | ||
| Renal | 14 (8.3) | 10 (6.3) | 16 (10.0) | ||
| Diabetes‐related | 11 (6.5) | 11 (7.0) | 10 (6.2) | ||
| Neurologic | 8 (4.7) | 11 (7.0) | 11 (6.9) | ||
| *Misc/other | 50 (29.6) | 50 (31.6) | 42 (26.3) | ||
Table 3 shows the insulin regimens used in the different groups. The use of basal insulin was similar between groups. Congruent with the goals of the education session and the order set, patients in the IG were more likely to be treated with a combination of basal and nutritional insulin than patients in the other groups. Patients in the HCG were more likely to be treated with a premixed insulin than patients in the other groups. However, even when premixed insulin was categorized as a form of basal plus nutritional insulin and combined into a composite group with the combined basal and nutritional days, this type of regimen remained more common in the IG than in the HCG. The rate of sliding scale insulin use alone (ie, without any scheduled insulin) was similar in the 3 groups.
| Patient‐days on the following | IG (n = 453) | CCG (n = 471) | P Value IG vs. CCG | HCG (n = 391) | P Value IG vs. HCG |
|---|---|---|---|---|---|
| |||||
| Sliding scale alone, n (%) | 105 (23.2) | 130 (27.6) | 0.12 | 89 (22.8) | 0.89 |
| Basal alone, n (%) | 132 (29.1) | 231 (49.0) | <0.01 | 199 (50.9) | <0.01 |
| Nutritional alone, n (%) | 22 (4.9) | 5 (1.1) | <0.01 | 8 (2.0) | 0.03 |
| Basal plus nutritional, n (%) | 166 (36.6) | 71 (15.1) | <0.01 | 14 (3.6) | <0.01 |
| Pre‐mixed insulin included, n (%) | 27 (6.0) | 32 (6.8) | 0.60 | 78 (20.0) | <0.01 |
| No insulin, n (%) | 1 (<1) | 2 (<1) | 0.59 | 3 (<1) | 0.28 |
| Any basal, n (%) | 325 (71.7) | 334 (70.9) | 0.78 | 291 (74.4) | 0.38 |
| Any nutritional, n (%) | 215 (47.5) | 108 (22.9) | <0.01 | 100 (25.6) | <0.01 |
| Basal plus nutritional or pre‐mixed, n (%) | 193 (42.6) | 103 (21.9) | <0.01 | 92 (23.5) | <0.01 |
| Oral diabetes agents, n (%) | 79 (17.4) | 83 (17.6) | 0.94 | 74 (18.9) | 0.58 |
| Sulfonylureas, n (%) | 40 (8.8) | 63 (13.4) | 0.03 | 37 (9.5) | 0.75 |
| Parenteral nutrition/tube feeds, n (%) | 0 (0) | 18 (3.8) | 8 (2.0) | ||
| High dose corticosteroids, n (%) | 66 (14.6) | 93 (19.8) | 0.04 | 51 (13.0) | 0.52 |
Other relevant measures are also shown in Table 3. The use of oral diabetes agents was similar in the 3 groups. The use of a nonoral feeding route (eg, tube feeding or parenteral nutrition) was infrequent.
A comparison of glycemic control in the three groups is shown in Table 4. In contrast to the CCG, patients in the IG experienced more days within the target glucose range (17% vs. 10.6%, P < 0.01), fewer days with severe hyperglycemia (48.3% vs. 59.2%, P < 0.01), and had a lower day‐weighted average blood glucose (195.9 vs. 212.6, P < 0.01). Compared to the HCG, patients in the IG experienced similar rates of hyperglycemia, but fewer hypoglycemic days (5.1% vs. 9.2%, P = 0.02).
| IG (n = 453) | CCG (n = 471) | P Value IG vs. CCG | HCG (n = 391) | P Value IG vs. HCG | |
|---|---|---|---|---|---|
| |||||
| Patient‐days | |||||
| In range, n (%) | 77 (17.0) | 50 (10.6) | <0.01 | 66 (16.9) | 0.98 |
| Out of range, n (%) | 376 (83.0) | 421 (89.4) | <0.01 | 325 (83.1) | 0.98 |
| Hyperglycemic, n (%) | 289 (63.8) | 310 (65.8) | 0.52 | 248 (63.4) | 0.91 |
| Severely hyperglycemic, n (%) | 219 (48.3) | 279 (59.2) | <0.01 | 176 (45.0) | 0.32 |
| Hypoglycemic, n (%) | 23 (5.1) | 36 (7.6) | 0.11 | 36 (9.2) | 0.02 |
| Severely hypoglycemic, n (%) | 13 (2.9) | 10 (2.1) | 0.47 | 15 (3.8) | 0.44 |
| Day weighted average blood glucose (SD) | 195.9 (66.8) | 212.6 (73.4) | <0.01 | 190.5 (63.1) | 0.25 |
The percentages of patients with severe hyperglycemia in each group are shown in Figure 1 by hospital day. Severe hyperglycemia was common, but there was a trend towards a decrease in the prevalence of severe hyperglycemia with increasing hospital days for all study groups, although it was consistently higher in the CCG than in the IG. Figure 2 shows the types of insulin regimens used by hospital day (composite for all groups). The use of basal plus nutritional insulin (the recommended regimen) increased gradually with increasing hospital days. When taken together, the information in both figures support the hypothesis that the use of the recommended insulin regimen may have contributed to the modest improvements in glycemic control seen in the IG.
In the final adjusted regression model, the intervention had a positive impact on glycemic control (Table 5). Subjects in the IG had a 72% increase in the odds of being in the target glucose range when compared to subjects in the CCG (P = 0.01). In addition, subjects in the IG had a 35% reduction in the odds of being severely hyperglycemic when compared to those in the CCG (P < 0.01). Finally, the odds ratio (OR) for being hypoglycemic among intervention subjects was 0.59 (P = 0.06) when compared to subjects in the CCG and 0.48 (P = 0.01) when compared to subjects in the HCG.
| Adjusted OR* IG vs. CCG | 95% CI | P value IG vs. CCG | Adjusted OR* IG vs. HCG | 95% CI | P Value IG vs. HCG | |
|---|---|---|---|---|---|---|
| ||||||
| In range | 1.72 | 1.16,2.55 | 0.01 | 1.08 | 0.74,1.58 | 0.68 |
| Hyperglycemic | 0.93 | 0.70,1.22 | 0.58 | 0.95 | 0.71,1.28 | 0.74 |
| Severely Hyperglycemic | 0.65 | 0.49,0.85 | <0.01 | 1.10 | 0.82,1.47 | 0.52 |
| Hypoglycemic | 0.59 | 0.34,1.02 | 0.06 | 0.48 | 0.27,0.85 | 0.01 |
| Severely Hypoglycemic | 1.36 | 0.59,3.14 | 0.47 | 0.97 | 0.29,1.44 | 0.28 |
Discussion
In this study, we investigated the effects of a standardized insulin order set, coupled with physician and nurse education, on glycemic control in hyperglycemic hospitalized patients. These interventions were designed to encourage a standardized approach to the treatment of hyperglycemia in hospitalized patients, based on the principles of physiologic insulin use, as described above. Our data suggest that the interventions did, indeed, alter the way insulin was prescribed, as more patients in the IG received a combination of basal plus nutritional insulin (the recommended regimen) than in the other groups. These interventions were associated with improved glycemic outcomes in the IG as compared to the CCG. The IG experienced a higher percentage of days in the target range and a trend toward fewer hypoglycemic days than the CCG. Although the IG experienced a similar percentage of days in the target range, it had significantly fewer hypoglycemic days than the HCG.
It is useful to consider the results of our study in the context of 2 other similar studies performed by Schnipper et al.14 and Maynard et al.15 Although each of these 3 studies have different study designs, they are similar in intent (to test the effects of simple quality improvement interventions on glycemic control in the hospital) and results (all showed significant improvements in some aspect of glycemic control). In our study, and the study by Maynard et al.,15 the interventions also led to decreases in the rates of hypoglycemia, whereas Schnipper et al.14 observed no difference in hypoglycemia. Of interest, in each of the three studies the interventions were associated with an increase in the use of some type of scheduled insulin. In our study and the study from Schnipper et al.14 the baseline use of basal insulin was quite high, and the interventions were associated with a significant increase in the addition of nutritional insulin. In the Maynard et al.15 study, the baseline use of sliding scale insulin alone was prevalent, and the interventions resulted in an increase in the use of basal insulin. The results of these studies, taken together, prompt us to conclude that the interventions employed in these studies are likely to lead to more frequent prescription of scheduled (anticipatory) insulin, and a modest improvement in glycemic control, without an increase (and perhaps with a decrease) in hypoglycemia.
A few of our study results are unexpected, or difficult to explain. In contrast to the other studies discussed above, our interventions did not affect the frequency of the use of sliding‐scale insulin alone (without any scheduled insulin), which was similar in the 3 groups. Although the reason for this is uncertain, we hypothesize that the high baseline use of basal insulin in our institution, and the lack of a hard stop preventing the use of sliding scale insulin alone explain this finding. Also, it is difficult to explain why measures of hyperglycemia were similar between the IG and the HCG despite the fact that the HCG was less often treated with a combination of basal and nutritional insulin and more often treated with mixed insulin.
There are several different mechanisms by which the interventions might have resulted in improved glycemic control in the IG compared to CCG. Our data clearly shows that insulin was prescribed differently in the IG, and the more frequent use of a combination of scheduled basal and nutritional insulin might have contributed to the differences between the groups. However, the effects of our interventions clearly went beyond physician education into the realm of true process improvement and standardization. The standardized order form was designed to prompt physicians to use a basal‐bolus insulin regimen. The order form also created nursing expectations of how insulin should be ordered, and clarified the roles of the different insulins that were prescribed.
On the medication administration record, each insulin was labeled as basal insulin (to be given even when fasting) or nutritional insulin (to be given along with the meal). The nurses caring for the IG also attended an education program that reinforced the role of the nurse in the bedside management of insulin administration. Specifically, nurses were taught to assess the premeal blood glucose and the patient's nutritional situation before giving the nutritional insulin (ie, Does the patient have food available? Will he tolerate eating the food?). In situations where is was not clear if the patient would be able to tolerate the ordered nutrition, the order set empowered the nurse to give the nutritional insulin after the meal, and to reduce the dose to match the patient's actual intake. These interventions resulted in some fundamental improvements in the nursing process of delivering insulin to the patient, and these changes might have resulted in improvements via mechanisms that are difficult to directly measure. Since the same physicians cared for both the IG and the CCG, interventions other than physician education clearly contributed to the observed improvements in the IG.
This study was not a randomized study, and there could be important undetected differences between the groups. However, all of the patients were admitted to the General Medicine Inpatient Services and the comparison of the general patient demographics and primary diagnoses between the groups do not suggest major differences.
Although the improvements in glycemic control seen in this study were statistically significant, they were quantitatively modest. The rates of hyperglycemia seen in this study, on the other hand, are quite remarkable. Both the American Diabetes Association and the American College of Endocrinology have recommended that blood glucoses in hospitalized patients not exceed a maximum value of 180 mg/dL, but the day‐weighted average blood glucose in this study was above that for each group. Even in the IG, over 80% of all patient‐days included at least 1 blood glucose value outside of the target range. These data suggest that better strategies for achieving metabolic control in hospitalized patients are needed.
It is worth mentioning that our interventions were not aggressively enforced. While the use of the order set was mandatory for the IG, it was flexible enough to allow for substantial practice variation, especially with respect to the dose of insulin prescribed. Although the education sessions discussed the specifics of insulin dosing in hospitalized patients, the order form did not offer dosing guidelines. It is possible that our interventions may have had a larger impact if a starting dose of insulin had been specified on the form. Although the insulin order form prompted physicians to act, there were no forced functions. Also, not all house staff attended the education sessions for physicians, and there was no feedback provided to physicians related to how they might improve their adherence to the recommendations presented in the educational module. Therefore, it is likely that more aggressive interventions could have led to greater changes in physician practice.
In conclusion, this study demonstrates that interventions including physician and nurse education and a standardized insulin order set can lead to improvement in glycemic control and patient safety in hospitalized patients treated with subcutaneous insulin. However, the observed improvements are modest, and poor metabolic control remains common, despite these interventions. These data suggest that standardization of the process of ordering and delivering subcutaneous insulin in the hospital may lead to a reduction in both hyperglycemia and hypoglycemia. However, it is clear that the interventions used in this study were not potent enough to achieve the recommended glycemic targets for the majority of patients. Additional research is needed to determine the best strategy for achieving safe and effective metabolic control in hospitalized, hyperglycemic, noncritically ill patients.
Acknowledgements
The authors thank David Conway for his work in data collection and management.
- ,,, et al.Management of diabetes and hyperglycemia in hospitals.Diabetes Care.2004;27:553–591.
- ,,, et al.Intensive insulin therapy in the critically ill patients.N Engl J Med.2001;345:1359–1367.
- ,,, et al.Intensive insulin therapy in the medical ICU.N Engl J Med.2006;354:449–461.
- ,,,.Continuous intravenous insulin infusion reduces the incidence of deep sternal wound infection in diabetic patients after cardiac surgical procedures.Ann Thorac Surg.1999;67:352–360; discussion360–352.
- ,,, et al.Continuous insulin infusion reduces mortality in patients with diabetes undergoing coronary artery bypass grafting.J Thorac Cardiovasc Surg.2003;125:1007–1021.
- ,,,,,.Hyperglycemia: an independent marker of in‐hospital mortality in patients with undiagnosed diabetes.J Clin Endocrinol Metab.2002;87:978–982.
- ,,, et al.Early postoperative glucose control predicts nosocomial infection rate in diabetic patients.JPEN J Parenter Enteral Nutr.1998;22:77–81.
- ,,,,,.The relation between hyperglycemia and outcomes in 2,471 patients admitted to the hospital with community‐acquired pneumonia.Diabetes Care.2005;28:810–815.
- ,.Glycemic chaos (not glycemic control) still the rule for inpatient care: how do we stop the insanity?J Hosp Med.2006;1:141–144.
- ,,, et al.Evaluation of hospital glycemic control at US Academic Medical Centers.J Hosp Med.2009;4:35–44.
- ,,, et al.Diabetes care in the hospital: is there clinical inertia?J Hosp Med.2006;1:151–160.
- ,,,,.Inpatient management of diabetes and hyperglycemia among general medicine patients at a large teaching hospital.J Hosp Med.2006;1:145–150.
- ,,, et al.Randomized study of basal‐bolus insulin therapy in the inpatient management of patients with type 2 diabetes (RABBIT 2 trial).Diabetes Care.2007;30:2181–2186.
- ,,,.Effects of a subcutaneous insulin protocol, clinical education, and computerized order set on the quality of inpatient management of hyperglycemia: results of a clinical trial.J Hosp Med.2009;4:16–27.
- ,,,,.Improved inpatient use of basal insulin, reduced hypoglycemia, and improved glycemic control: effect of structured subcutaneous insulin orders and an insulin management algorithm.J Hosp Med.2009;4:3–15.
- ,,, et al.American College of Endocrinology position statement on inpatient diabetes and metabolic control.Endocr Pract.2004;10:77–82.
- Society of Hospital Medicine. Glycemic Control Resource Room. Available at: http://www.hospitalmedicine.org/AM/Template.cfm?Section= Quality_Improvement_Resource_Rooms3(5 Suppl):17–28.
- ,,,.Subcutaneous insulin order sets and protocols: effective design and implementation strategies.J Hosp Med.2008;3(5 Suppl):29–41.
- ,,,,.Society of Hospital Medicine Glycemic Control Task Force summary: practical recommendations for assessing the impact of glycemic control efforts.J Hosp Med.2008;3(5 Suppl):66–75.
Copyright © 2010 Society of Hospital Medicine

SC Insulin Order Sets and Protocols
Inpatient glycemic control and hypoglycemia are issues with well deserved increased attention in recent years. Prominent guidelines and technical reviews have been published,13 and a recent, randomized controlled trial demonstrated the superiority of basal bolus insulin regimens compared to sliding‐scale regimens.4 Effective glycemic control for inpatients has remained elusive in most medical centers. Recent reports57 detail clinical inertia and the continued widespread use of sliding‐scale subcutaneous insulin regimens, as opposed to the anticipatory, physiologic basal‐nutrition‐correction dose insulin regimens endorsed by these reviews.
Inpatient glycemic control faces a number of barriers, including fears of inducing hypoglycemia, uneven knowledge and training among staff, and competing institutional and patient priorities. These barriers occur in the background of an inherently complex inpatient environment that poses unique challenges in maintaining safe glycemic control. Patients frequently move across a variety of care teams and geographic locations during a single inpatient stay, giving rise to multiple opportunities for failed communication, incomplete handoffs, and inconsistent treatment. In addition, insulin requirements may change dramatically due to variations in the stress of illness, exposure to medications that effect glucose levels, and varied forms of nutritional intake with frequent interruption. Although insulin is recognized as one of the medications most likely to be associated with adverse events in the hospital, many hospitals do not have protocols or order sets in place to standardize its use.
A Call to Action consensus conference,8, 9 hosted by the American Association of Clinical Endocrinologists (AACE) and the American Diabetes Association (ADA), brought together many thought leaders and organizations, including representation from the Society of Hospital Medicine (SHM), to address these barriers and to outline components necessary for successful implementation of a program to improve inpatient glycemic control in the face of these difficulties. Institutional insulin management protocols and standardized insulin order sets (supported by appropriate educational efforts) were identified as key interventions. It may be tempting to quickly deploy a generic insulin order set in an effort to improve care. This often results in mediocre results, due to inadequate incorporation of standardization and guidance into the order set and other documentation tools, and uneven use of the order set.
The SHM Glycemic Control Task Force (GCTF) recommends the following steps for developing and implementing successful protocols and order sets addressing the needs of the noncritical care inpatient with diabetes/hyperglycemia.
-
Form a steering committee for this work, and assess the current processes of care.
-
Identify best practices and preferred regimens to manage diabetes and hyperglycemia in the hospital.
-
Integrate best practices and preferred institutional choices into an inpatient glycemic control protocol. Crystallize your protocol into a one page summary.
-
Place guidance from your protocol into the flow of work, by integrating it into standardized subcutaneous insulin order sets and other documentation and treatment tools.
-
Monitor the use of your order sets and protocol. Intervene actively on nonadherents to your protocol and those with poor glycemic control, and revise your protocol/order sets as needed.
IDENTIFYING AND INCORPORATING KEY CONCEPTS AND BEST PRACTICES
A protocol is a document that endorses specific monitoring and treatment strategies in a given institution. This potentially extensive document should provide guidance for transitions, special situations (like steroids and total parenteral nutrition [TPN]) and should outline preferred insulin regimens for all of the most common nutritional situations. One of the most difficult parts of creating a protocol is the assimilation of all of the important information on which to base decisions. Your protocol and order set will be promoting a set of clinical practices. Fortunately, the current best practice for noncritical care hyperglycemic patients has been summarized by several authoritative sources,13, 811 including references from the SHM Glycemic Task Force published in this supplement.4, 12
Table 1 summarizes the key concepts that should be emphasized in a protocol for subcutaneous insulin management in the hospital. We recommend embedding guidance from your protocol into order sets, the medication administration record, and educational materials. Although the details contained in a protocol and order set might vary from one institution to another, the key concepts should not. The remainder of this article provides practical information about how these concepts and guidance for how preferred insulin regimens should be included in these tools. Appendices 1 and 2 give examples of an institutional one‐page summary protocol and subcutaneous insulin order set, respectively.
| 1. Establish a target range for blood glucose levels. |
| 2. Standardize monitoring of glucose levels and assessment of long‐term control (HbA1c). |
| 3. Incorporate nutritional management. |
| 4. Prompt clinicians to consider discontinuing oral antihyperglycemic medications. |
| 5. Prescribe physiologic (basal‐nutrition‐correction) insulin regimens. |
| a. Choose a total daily dose (TDD). |
| b. Divide the TDD into physiologic components of insulin therapy and provide basal and nutritional/correction separately. |
| c. Choose and dose a basal insulin. |
| d. Choose and dose a nutritional (prandial) insulin |
|
i. Match exactly to nutritional intake (see Table 2). |
| ii. Include standing orders to allow nurses to hold nutritional insulin for nutritional interruptions and to modify nutritional insulin depending on the actual nutritional intake. |
| e. Add correction insulin |
| i. Match to an estimate of the patients insulin sensitivity using prefabricated scales. |
| ii. Use the same insulin as nutritional insulin. |
| 6. Miscellaneous |
| a. Manage hypoglycemia in a standardized fashion and adjust regimen to prevent recurrences. |
| b. Provide diabetes education and appropriate consultation. |
| c. Coordinate glucose testing, nutrition delivery, and insulin administration. |
| d. Tailor discharge treatment regimens to the patient's individual circumstances and arrange for proper follow‐up. |
Standardize the Monitoring of Blood Glucose Values and Glucosylated Hemoglobin
Guidance for the coordination of glucose testing, nutrition delivery, and insulin administration, should be integrated into your protocols, and order sets. For noncritical care areas, the minimal frequency for blood glucose monitoring for patients who are eating is before meals and at bedtime. For the patient designated nothing by mouth (NPO) or the patient on continuous tube feeding, the type of nutritional/correction insulin used should drive the minimum frequency (every 4‐6 hours if rapid acting analog insulins [RAA‐I] are used, and every 6 hours if regular insulin is used). Directions for administering scheduled RAA‐I immediately before or immediately after nutrition delivery should be incorporated into protocols, order sets, and medication administration records. Unfortunately, having this guidance in the order sets and protocols does not automatically translate into its being carried out in the real world. Wide variability in the coordination of glucose monitoring, nutritional delivery, and insulin administration is common, so monitoring the process to make sure the protocol is followed is important.
Obtaining a glucosylated hemoglobin (HbA1c) level is important in gauging how well the patient's outpatient regimen is maintaining glycemic control, distinguishing stress hyperglycemia from established diabetes, and guiding the inpatient approach to glycemic control. ADA guidelines2, 3 endorse obtaining HbA1c levels of inpatients if these levels are not already available from the month prior to admission.
Establish a Target Range for Blood Glucose in NonCritical Care Areas
It is important to adopt a glycemic target that is institution‐wide, for critical care areas and noncritical care areas alike. Your glycemic target need not be identical to the ADA/AACE glycemic targets, but should be similar to them.
Examples of institutional glycemic targets for noncritical care areas:
-
Preprandial target 90‐130 mg/dL, maximum random glucose <180 mg/dL (ADA/AACE consensus target)
-
90‐150 mg/dL (a target used in some hospitals)
-
Preprandial target 90‐130 mg/dL for most patients, 100‐150 mg/dL if there are hypoglycemia risk factors, and <180 mg/dL if comfort‐care or end‐of‐life care (a more refined target, allowing for customization based on patient characteristics).
Your multidisciplinary glycemic control steering committee should pick the glycemic target it can most successfully implement and disseminate. It is fine to start with a conservative target and then ratchet down the goals as the environment becomes more accepting of the concept of tighter control of blood glucose in the hospital.
Although the choice of glycemic target is somewhat arbitrary, establishing an institutional glycemic target is critical to motivate clinical action. Your committee should design interventions, for instances when a patient's glycemic target is consistently not being met, including an assignment of responsibility.
Prompt Clinicians to Consider Discontinuing Oral Agents
Oral antihyperglycemic agents, in general, are difficult to quickly titrate to effect, and have side effects that limit their use in the hospital. In contrast, insulin acts rapidly and can be used in virtually all patients and clinical situations, making it the treatment of choice for treatment of hyperglycemia in the hospital.3, 11, 12 In certain circumstances, it may be entirely appropriate to continue a well‐controlled patient on his or her prior outpatient oral regimen. It is often also reasonable to resume oral agents in some patients when preparing for hospital discharge.
Incorporate Nutritional Management
Because diet is so integral to the management of diabetes and hyperglycemia, diet orders should be embedded in all diabetes or insulin‐related order sets. Diets with the same amount of carbohydrate with each meal should be the default rule for patients with diabetes. Nutritionist consultation should be considered and easy to access for patients with malnutrition, obesity, and other common conditions of the inpatient with diabetes.
Access Diabetes Education and Appropriate Consultation
Diabetes education should be offered to all hyperglycemic patients with normal mental status, complete with written materials, a listing of community resources, and survival skills. Consultation with physicians in internal medicine or endocrinology for difficult‐to‐control cases, or for cases in which the primary physician of record is not familiar with (or not adherent to) principles of inpatient glycemic management, should be very easy to obtain, or perhaps mandated, depending on your institution‐specific environment.
Prescribe Physiologic (Basal‐Nutritional‐Correction Dose) Insulin Regimens
Physiologic insulin use is the backbone of the recommended best practice for diabetes and hyperglycemia management in the hospital. The principles of such regimens are summarized elsewhere in this supplement.12 These principles will not be reiterated in detail here, but the major concepts that should be integrated into the protocols and order sets will be highlighted.
Choose a Total Daily Dose
Clinicians need guidance on how much subcutaneous insulin they should give a patient. These doses are well known from clinical experience and the published literature. The fear of hypoglycemia usually results in substantial underdosing of insulin, or total avoidance of scheduled insulin on admission. Your team should provide guidance for how much insulin to start a patient on when it is unclear from past experience how much insulin the patient needs. Waiting a few days to see how much insulin is required via sliding‐scale‐only regimens is a bad practice that should be discouraged for patients whose glucose values are substantially above the glycemic target. The total daily dose (TDD) can be estimated in several different ways (as demonstrated in Appendix 1 and 2), and protocols should make this step very clear for clinicians. Providing a specific location on the order set to declare the TDD may help ensure this step gets done more reliably. Some institutions with computer physician order entry (CPOE) provide assistance with calculating the TDD and the allocation of basal and nutritional components, based on data the ordering physician inputs into the system.
Select and Dose a Basal Insulin
Your protocol should describe how the TDD should be divided between basal and nutritional insulin. We generally recommend 50% of the TDD be given as basal insulin, with the other 50% administered on a scheduled basis to cover glycemic excursions from nutritional intake. The 50/50 rule is simple and generally works well, and should be widely promoted. However, there are exceptions to this rule that should be incorporated into your full protocol and educational programs. The order set should have separate steps for ordering basal insulin, nutritional insulin, and correction insulin. The advantage to providing these insulin components separately is that it allows them to be independently manipulated (eg, if a patient is unable to tolerate a meal, nutritional insulin is held, but basal insulin and correction insulin are continued).
The SHM GCTF specifically endorses long acting insulin (glargine and detemir) as the preferred basal insulin in the hospital setting, thus discouraging the use of neutral protamine Hagedorn (NPH) insulin and fixed combination insulin formulations (Table 2). In the absence of randomized controlled trials demonstrating superiority of the glargine or detemir to NPH insulin in the hospital, this endorsement deserves some further explanation. Although we believe that correctly dosed NPH containing insulin regimens can attain effective and safe glycemic control in the hospital setting, it is more difficult to standardize their use and adjust for fluctuations in nutritional intake. Glargine and detemir have much less pronounced spikes in their effect than NPH, rendering them relatively peakless in comparison. This pharmacokinetic profile allows for continued dosing with minimal or no correction when nutrition intake is variable, and allow for consistent reinforcement of the basal‐nutritional‐correction insulin concept.
| Nutritional situation | Necessary insulin components | Preferred regimen* |
|---|---|---|
| ||
| NPO (or clear liquids) | Basal insulin: 50% of TDD. Nutritional insulin: None. | Basal insulin: glargine given once daily or detemir given twice daily. Nutritional insulin: None. Correctional insulin: Regular insulin q 6 hours or RAA insulin q 4 hours. Other comments: Dextrose infusion (e.g., D5 containing solution at 75‐150 cc/hour) recommended when nutrition is held. An IV insulin infusion is preferred for management of prolonged fasts or fasting type 1 diabetes patients. |
| Eating meals | Basal insulin: 50% of TDD. Nutritional insulin: 50% of TDD, divided equally before each meal. | Basal insulin: glargine given once daily or detemir given twice daily. Nutritional insulin: RAA insulin with meals. Correctional insulin: RAA insulin q AC and HS (reduced dose at HS). |
| Bolus tube feeds | Basal insulin: 40% of TDD. Nutritional insulin: 60% of the TDD, divided equally before each bolus feed. | Basal insulin: glargine given once daily or detemir given twice daily. Nutritional insulin: RAA insulin with each bolus. Correctional insulin: RAA insulin with each bolus. |
| Continuous tube feeds | Basal insulin: 40% (conservative) of TDD. Nutritional insulin: 60% of the TDD in divided doses. | Basal insulin: glargine given once daily or detemir given twice daily. Nutritional insulin: RAA insulin q 4 hours or regular insulin q 6 hours. Correctional insulin: Should match nutritional insulin choice. |
| Parenteral nutrition | Insulin is usually given parenterally, with the nutrition | Initially, a separate insulin drip allows for accurate dose‐finding. Then, 80% of amount determined as TDD using drip is added to subsequent TPN bags as regular insulin. Use correctional subcutaneous insulin doses cautiously, in addition. |
There are some caveats to this general recommendation. First, patients who are well controlled on home regimens with NPH basal insulin can (and sometimes should) stay on the regimen that has worked well for them. However, extra vigilance in reducing the dose for reductions in nutrition is required, because NPH is generally used to cover both nutritional and basal requirements. Second, extensive experience with glargine and detemir are not available in obstetric populations. They are not U.S. Food and Drug Administration (FDA) approved for use in pregnant patients and formally carry a Class C rating, whereas NPH insulin has been used safely in obstetric populations for decades. Third, the insulin regimen used as an inpatient is not necessarily the preferred regimen to prescribe at discharge: cost, patient preferences, HbA1c level, and other factors should be considered in making this choice.
Select and Dose a Nutritional (Prandial) Insulin
The step for ordering nutritional insulin should assist the clinician in matching the insulin to the type of nutrition that the patient is receiving. For example, rapid‐acting insulin analogs are preferred over regular insulin in the eating patient, in view of their more physiologic profile, which averts the insulin stacking that can occur with regular insulin. If regular insulin is used as the preferred institutional choice for eating patients, the lunchtime dose should be reduced or eliminated altogether, to eliminate insulin stacking.
Table 2 outlines the SHM GCTF preferred regimens for different nutritional situations.
There should be a standing order for nutritional insulin to be held when nutrition is interrupted, whether intentional or unintentional. Patients with interrupted tube feedings could have standing orders for a dextrose infusion to replace the tube feeding carbohydrate load and prevent hypoglycemia. Ideally, there should also be a standing order allowing for real‐time management of the patient with uncertain nutritional intake. For example, when a patient's premeal assessment reveals that she may not tolerate the meal, the patient should be allowed to attempt to eat, and then the nutritional insulin should be given after the meal, in proportion to the amount of food that was eaten. This type of order will require significant nursing education and process redesign in many hospitals, but is essential for matching nutritional insulin to actual intake.
Add Correction Insulin
There is no convincing evidence for the benefit of correction (sliding‐scale) insulin in the inpatient setting, although a randomized trial demonstrating the superiority of basal/nutritional insulin regimens to sliding‐scale only regimens did incorporate a correction insulin scale as an adjunct to the superior basal/nutritional regimen.4 The SHM GCTF again emphasizes that control of hyperglycemia should be proactive and anticipatory of insulin needs, rather than reactive to hyperglycemia. Nonetheless, unexpected hyperglycemic excursions are common, and the use of correction insulin remains a pervasive and arguably logical practice. If correction insulin is used, it should be ordered as a separate step after considering basal and nutrition insulin needs. The doses of scheduled insulin should be adjusted regularly if correction insulin is consistently being required. Ideally, the prescriber should choose a preformatted corrective insulin scale, based on the patient's insulin sensitivity (Appendix 2). There should be a prompt to use the same type of insulin that is being used for nutritional insulin, and there should be instructions that this insulin is given in addition to the basal and nutritional insulin to correct for hyperglycemia. Nocturnal correction‐dose scales should be reduced in the eating patient.
Even after limiting insulin regimens to those in Table 2, multidisciplinary glycemic control teams are still left with several options within these SHM‐preferred regimens. We recommend that your team choose a single, institutionally‐preferred basal‐nutritional‐correction insulin combination for each situation.
Choosing one preferred option for these situations is advantageous because:
-
You can communicate preferred regimens more simply and succinctly to all staff.
-
You eliminate all inappropriate choices for insulin regimens for that situation, as well as some other less preferred, but acceptable choices.
-
You can encourage regimens that are most economical (by promoting the insulin regimens that reflect your hospital formulary choices).
-
Staff members can become very familiar with a few regimens, instead of being confused by a multitude of them. They can identify variations from your preferred choices and target these patients for extra scrutiny and actions should they fail to meet glycemic targets.
Although virtually every institution can provide specific guidance on insulin management in a protocol, there are tradeoffs inherent in how restrictive you can be in pushing these preferred choices in your order sets. Should you eliminate alternate basal or nutritional insulin choices from your order sets? As you integrate more and more of your preferred algorithm and regimens into your order set, you will gain incremental improvement in the standardization of inpatient insulin management. However, you reduce not only variability in ordering, but also the choices available to your prescribers and patients, and in effect you are pushing the providers to use an insulin regimen that often differs from the patient's outpatient regimen. If your institution is not yet ready to go with a single preferred insulin, simply listing your preferred insulin first with the annotation preferred can be enough to increase the use of the preferred insulin.
We endorse building the most protocol‐driven, proscriptive, insulin order set that the Glycemic Control Steering Committee believes their medical staff will accept. There are some caveats to this endorsement. First, there must be extra efforts on the backend of the admission, to ensure that the antihyperglycemic regimen is tailored to the unique needs of the patient (this is discussed further below). Second, a protocol‐driven approach is not a substitute for a good educational program for health care providers or well‐informed clinical judgment. Education should reinforce major concepts driving the protocol and should also highlight exceptions to the rule. Variance from the protocol endorsed choices should be allowed (and even encouraged) when the variance is driven by patient factors (as opposed to provider whim). Learning from this variance is a key concept in refining protocols. Education ideally should not be limited to only protocol‐endorsed choices, as staff should be familiar with the full range of antihyperglycemia regimens seen in inpatient and outpatient settings.
Special Situations
Most of the preferred regimens for different situations are outlined in Table 2 in a straightforward manner, and can be depicted in your protocols and order sets in the same way. Some conditions have enough complexity, however, that you will have difficulty placing all of the details into your one‐page protocol and order set. Details should be placed on your more detailed protocol, and educational programs should include the topics outlined below. Although insulin infusion is often the option that would provide the most reliable and expedient control of hyperglycemia in these special situations, it is an option not available in many noncritical care settings. Therefore, the discussion is limited to subcutaneous insulin control regimens.
Patient on Continuous Tube Feeding
The SHM GCTF endorses glargine or detemir as the basal insulin of choice for this setting. The nutritional and correction insulin of choice is either an RAA‐I every 4 hours (q4h), or regular insulin every 6 hours (q6h). We endorse this choice because it retains the basal‐nutritional‐correction dose concept, generally allows for continued basal insulin use if the tube feedings become interrupted, and is amenable to building a consistent institutional protocol.
There are some important caveats to this recommendation. First, realize that almost any regimen that provides a stable insulin supply would be acceptable, and many institutions will use glargine or detemir to cover both basal and nutritional needs. The downside to using large boluses of long‐acting insulin in this clinical situation is that any unexpected interruption of the feedings will necessitate prolonged infusions of dextrate 10% solution (D10) to avoid hypoglycemia
Second, because of the glycemic load inherent in tube feedings, maintenance of glycemic control in the setting of enteral feeding may be best managed by providing a higher percentage of the TDD as nutritional insulin. In these cases, ratios of basal to nutritional insulin of 40:60, or even less basal insulin, may be appropriate.
Glucocorticoid Therapy
High‐dose glucocorticoids are strongly associated with increased insulin requirements. The degree of hyperglycemia induced by steroids varies significantly from patient to patient, and the pattern of hyperglycemia will vary depending on the pattern of steroid administration. The general principle to keep in mind is that the hyperglycemia induced by a steroid dose will peak 8‐12 hours after it is given, so insulin regimens to address this should take this effect into account. For example, giving a long‐acting basal insulin like glargine to accommodate the hyperglycemic effect of a steroid bolus given in the morning would be inappropriate because the steroid effect would wane and then disappear overnight, leading to insulin‐induced hypoglycemia. NPH insulin can be ideal in this setting, either by itself, or by layering it on top of an existing regimen.
Another caveat: glucocorticoids exert their predominate effect on insulin sensitivity in muscle (as opposed to the liver), and as a result, have their most notable effect on postprandial glucose. For this reason, the best insulin regimens for this situation may use proportionally less basal insulin and more nutritional insulin. One common regimen calls for keeping the basal insulin dose the same as the preglucocorticoid dose, while escalating the RAA insulin dose at lunch and dinner.
Given the complexities of covering steroid‐induced hyperglycemia and its high prevalence in certain populations (such as transplantation patients and patients undergoing chemotherapy), this would be an excellent area on which to focus expertise. Examples include routine endocrinology consultation, intervention by a special glycemic control team, or incorporating routine glucose monitoring and triggers for initiating insulin infusion into the protocols for chemotherapy and transplantation patients.
Regiment the Management of Hypoglycemia
Hypoglycemia is defined by the ADA as a blood glucose of 70 mg/dL or less, based on the physiologic changes that can occur at this glucose level, even in subjectively asymptomatic patients.3 Protocols for management of hypoglycemia should be linked to your diabetes/hyperglycemia protocols. There are many hypoglycemia protocols available for review in the SHM Glycemic Control Resource Room and Glycemic Control Implementation Guide.10 Some common themes for effective implementation stand out. First, the protocols need to walk the balance between simplicity of use, and the need to provide instructions that will provide guidance in a variety of patient situations. Second, the protocols need to be nurse driven, so that nurses can initiate treatment without waiting for a physician order. Third, education and instruction regarding recognition of risk factors, and avoidance of hypoglycemia are needed to support a successful protocol. Importantly, any hypoglycemic event should lead to a reconsideration of the current anti‐hyperglycemic regimen so that future events can be prevented.
Plan for Discharge and Provide Guidance for the Transition
Your institution should have policies and procedures outlining all the steps needed to complete the important transition out of the hospital. At a minimum, this planning should include adequate education (including a learner assessment), appropriate follow‐up, referral to community resources, and a discharge glycemic control regimen that is tailored to the educational, financial, and motivational profile of a patient. The more your inpatient insulin management is driven by protocol, the more likely it is the patient will be on an inpatient treatment plan that differs from their outpatient regimen; therefore, it is even more important to plan this transition carefully and reliably.
Communicating the accurate hyperglycemia related diagnosis and related problems to the primary care provider is important for good care, perhaps even more so for patients who had hyperglycemia while hospitalized without a prior diagnosis of diabetes. Some centers place a prompt for hyperglycemia related diagnosis in the order set and/or discharge paperwork, to remind the clinician to convey the diagnosis to the primary provider, and to encourage more complete documentation. Improved documentation can also improve the business case for glycemic control, along with other strategies outlined elsewhere in this supplement.13
Transitions in care (including transitions out of the hospital and off of infusion insulin) are discussed in more detail14, 15 elsewhere in this supplement. The principles outlined in these references should be incorporated into your institutional protocol. Briefly, not all patients require or are capable of intensive basal‐bolus regimens upon discharge. The HbA1c can be very valuable in arriving at the optimal outpatient regimen.14 The capacities and preferences of the patient and the context of his or her outpatient care environment (including the preferences of the primary care provider) must be taken into consideration as an outpatient management program is planned.
PULLING IT ALL TOGETHER: MAKE SURE YOUR PROTOCOL/ORDER SET IS EASY TO USE AND WIDELY UTILIZED
When standardizing hospital management of diabetes and hyperglycemia, we recommend building the full protocol first, then crystallizing the protocol into a one‐page summary that can be widely disseminated. The protocol guidance is then incorporated into the order set and nursing medical administration record (MAR). Again, we recommend the most proscriptive and protocol‐driven order set feasible within the constraints of medical staff support. The example order set in Appendix 2 illustrates this approach along with other desirable features:
-
Check‐box simplicity on when to order appropriate glucose monitoring.
-
Prompt for the proper hyperglycemia‐related diagnosis.
-
Prompts to document diagnosis and to order HbA1c level.
-
Use of encouraged insulin terminology: basal, prandial (or nutritional), and correction. Language is a powerful thing, and just getting staff to use these terms goes a long way toward the more physiologic prescribing of insulin.
-
Statement/reminder of a glycemic goal.
-
Prompts and contact information for appropriate consultation.
-
Elimination of unapproved abbreviations (such as U for units).
-
Stating both generic and brand names of insulin preparations.
-
Important timing cues for administration of insulin.
-
Several correction‐dose scales suitable for different insulin sensitivities. One size does NOT fit all.
-
Incorporation of a simple hypoglycemia protocol into the order set.
-
Insulin dosing guidelines available at the point of care (in this case, on the back of the order set).
Additional nursing‐specific cues (such as an admonition to never mix glargine insulin with other types of insulin) can also be included in the MAR whenever glargine is ordered.
Once you have protocols and order sets to guide providers, you need to assure that they are used for the majority of hyperglycemic patients. Educational programs should introduce your interventions and the rationale for them. In order to make your method the default method of care, your team should survey all preprinted or CPOE insulin order sets of your institution. A review of postoperative, transfer, and admission order sets that all services use may reveal a half‐dozen or more embedded sliding‐scale insulin order sets that should be removed, with prompts to use the standardized insulin order set being placed in their stead.
Computerized order sets present both challenges and opportunities. Wording limitations and the scrolling nature can make concepts less clear, yet there is a capability for incorporating a hierarchical structure that allows for guiding the user through a more algorithmic approach. There is also a capacity to provide assistance with dosing calculations that do not exist in the paper world. Education remains of key importance for both methods.
MONITOR THE USE AND EFFECTIVENESS OF YOUR PROTOCOLS AND ORDER SETS
Creating and implementing protocols, order sets, and other tools is not the end of the journey to improve care. It is important to monitor order set utilization, insulin use patterns, and parameters measuring glycemic control and hypoglycemia, as outlined in more detail in another article in this supplement.16 In addition to summary data every month or so, we recommend daily reports that spur action in near real time. Triggers such as uncontrolled hyperglycemia, markedly elevated HbA1c levels, and nonphysiologic insulin regimens should initiate consultation, extra diabetes education, or referral to a glucose control team. If appropriate consultation is not readily available, the glycemic control steering group should lobby the administration to bolster this capability. Qualitative feedback from the frontline caregivers, as well as this quantitative data, can assist the local glycemic control champions in designing even more effective protocols, order sets, focused educational efforts, and concurrent mitigation of suboptimal care.
CONCLUSION
Diabetes, hyperglycemia, and iatrogenic hypoglycemia are common and important conditions affecting the noncritically ill inpatient. Interventional trials to validate the recommended noncritical care unit glycemic targets are needed. Although there is a growing consensus on best practices to care for these patients, numerous barriers and the complexity of caring for inpatients hamper the reliability of best practice delivery. Institutional protocols and protocol driven subcutaneous insulin orders, when implemented with the strategies outlined here, can be the key to delivering these best practices more reliably.
Appendix
- American College of Endocrinology Task Force on Inpatient Diabetes and Metabolic Control.American College of Endocrinology Position Statement on Inpatient Diabetes and Metabolic Control.Endocr Pract.2004;10:77–82.
- ,,,,,,.Management of diabetes and hyperglycemia in hospitals.Diabetes Care.2004;27:553–591.
- American Diabetes Association.Standards of Medical Carein Diabetes‐2006.Diabetes Care.2006;29(suppl 1):s4–s42.
- ,,, et al.Randomized study of basal‐bolus insulin therapy in the inpatient management of patients with type 2 diabetes (RABBIT 2 Trial).Diabetes Care.2007;30:2181–2186.
- ,,,,.Inpatient management of diabetes and hyperglycemia among general medicine patients at a large teaching hospital.J Hosp Med.2006;1:145–150.
- ,,, et al.Diabetes care in the hospital: is there clinical inertia?J Hosp Med.2006;1:151–160.
- ,,, et al.Diabetes care in hospitalized non‐critically ill patients: more evidence for clinical inertia and negative therapeutic momentum.JHosp Med.2007;2:203–211.
- Inpatient Diabetes and Glycemic Control: A Call to Action Conference. Position Statement. AACE, February2006. Available at: http://www.aace.com/meetings/consensus/IIDC/IDGC0207.pdf. Accessed October, 2006.
- Proceedings of the American College of Endocrinology and American Diabetes Association Consensus Conference, Washington, DC, January 30–31, 2006. Endocr Pract.2006; 12(suppl 3):3–13.
- Society of Hospital Medicine Glycemic Control Task Force. Implementation Guide: Improving Glycemic Control, Preventing Hypoglycemia, and Optimizing Care of the Inpatient with Hyperglycemia and Diabetes. Published January 2007 on the Society of Hospital Medicine website. Available at: http://www.hospitalmedicine.org. Accessed August,2007.
- .Management of hyperglycemia in the hospital setting.N Engl J Med.2006;355:1903–1911.
- ,,,,.Management of diabetes and hyperglycemia in the hospital: a practical guide to subcutaneous insulin use in the non‐critically ill adult patient.J Hosp Med.2008;3(5):S17–S28.
- ,.Practical strategies for developing the business case for hospital glycemic control teams.J Hosp Med2008;3(5):S76–S83.
- ,,,.Bridge over troubled waters: safe and effective transitions of the inpatient with hyperglycemia.J Hosp Med.2008;3(5):S55–S65.
- ,,,.Designing and implementing insulin infusion protocols and order sets.J Hosp Med.2008;3(5):S42–S54.
- ,,,,,.SHM Glycemic Control Task Force summary: practical recommendations for assessing the impact of glycemic control efforts.J Hosp Med.2008;3(5):S66–S75.
Inpatient glycemic control and hypoglycemia are issues with well deserved increased attention in recent years. Prominent guidelines and technical reviews have been published,13 and a recent, randomized controlled trial demonstrated the superiority of basal bolus insulin regimens compared to sliding‐scale regimens.4 Effective glycemic control for inpatients has remained elusive in most medical centers. Recent reports57 detail clinical inertia and the continued widespread use of sliding‐scale subcutaneous insulin regimens, as opposed to the anticipatory, physiologic basal‐nutrition‐correction dose insulin regimens endorsed by these reviews.
Inpatient glycemic control faces a number of barriers, including fears of inducing hypoglycemia, uneven knowledge and training among staff, and competing institutional and patient priorities. These barriers occur in the background of an inherently complex inpatient environment that poses unique challenges in maintaining safe glycemic control. Patients frequently move across a variety of care teams and geographic locations during a single inpatient stay, giving rise to multiple opportunities for failed communication, incomplete handoffs, and inconsistent treatment. In addition, insulin requirements may change dramatically due to variations in the stress of illness, exposure to medications that effect glucose levels, and varied forms of nutritional intake with frequent interruption. Although insulin is recognized as one of the medications most likely to be associated with adverse events in the hospital, many hospitals do not have protocols or order sets in place to standardize its use.
A Call to Action consensus conference,8, 9 hosted by the American Association of Clinical Endocrinologists (AACE) and the American Diabetes Association (ADA), brought together many thought leaders and organizations, including representation from the Society of Hospital Medicine (SHM), to address these barriers and to outline components necessary for successful implementation of a program to improve inpatient glycemic control in the face of these difficulties. Institutional insulin management protocols and standardized insulin order sets (supported by appropriate educational efforts) were identified as key interventions. It may be tempting to quickly deploy a generic insulin order set in an effort to improve care. This often results in mediocre results, due to inadequate incorporation of standardization and guidance into the order set and other documentation tools, and uneven use of the order set.
The SHM Glycemic Control Task Force (GCTF) recommends the following steps for developing and implementing successful protocols and order sets addressing the needs of the noncritical care inpatient with diabetes/hyperglycemia.
-
Form a steering committee for this work, and assess the current processes of care.
-
Identify best practices and preferred regimens to manage diabetes and hyperglycemia in the hospital.
-
Integrate best practices and preferred institutional choices into an inpatient glycemic control protocol. Crystallize your protocol into a one page summary.
-
Place guidance from your protocol into the flow of work, by integrating it into standardized subcutaneous insulin order sets and other documentation and treatment tools.
-
Monitor the use of your order sets and protocol. Intervene actively on nonadherents to your protocol and those with poor glycemic control, and revise your protocol/order sets as needed.
IDENTIFYING AND INCORPORATING KEY CONCEPTS AND BEST PRACTICES
A protocol is a document that endorses specific monitoring and treatment strategies in a given institution. This potentially extensive document should provide guidance for transitions, special situations (like steroids and total parenteral nutrition [TPN]) and should outline preferred insulin regimens for all of the most common nutritional situations. One of the most difficult parts of creating a protocol is the assimilation of all of the important information on which to base decisions. Your protocol and order set will be promoting a set of clinical practices. Fortunately, the current best practice for noncritical care hyperglycemic patients has been summarized by several authoritative sources,13, 811 including references from the SHM Glycemic Task Force published in this supplement.4, 12
Table 1 summarizes the key concepts that should be emphasized in a protocol for subcutaneous insulin management in the hospital. We recommend embedding guidance from your protocol into order sets, the medication administration record, and educational materials. Although the details contained in a protocol and order set might vary from one institution to another, the key concepts should not. The remainder of this article provides practical information about how these concepts and guidance for how preferred insulin regimens should be included in these tools. Appendices 1 and 2 give examples of an institutional one‐page summary protocol and subcutaneous insulin order set, respectively.
| 1. Establish a target range for blood glucose levels. |
| 2. Standardize monitoring of glucose levels and assessment of long‐term control (HbA1c). |
| 3. Incorporate nutritional management. |
| 4. Prompt clinicians to consider discontinuing oral antihyperglycemic medications. |
| 5. Prescribe physiologic (basal‐nutrition‐correction) insulin regimens. |
| a. Choose a total daily dose (TDD). |
| b. Divide the TDD into physiologic components of insulin therapy and provide basal and nutritional/correction separately. |
| c. Choose and dose a basal insulin. |
| d. Choose and dose a nutritional (prandial) insulin |
|
i. Match exactly to nutritional intake (see Table 2). |
| ii. Include standing orders to allow nurses to hold nutritional insulin for nutritional interruptions and to modify nutritional insulin depending on the actual nutritional intake. |
| e. Add correction insulin |
| i. Match to an estimate of the patients insulin sensitivity using prefabricated scales. |
| ii. Use the same insulin as nutritional insulin. |
| 6. Miscellaneous |
| a. Manage hypoglycemia in a standardized fashion and adjust regimen to prevent recurrences. |
| b. Provide diabetes education and appropriate consultation. |
| c. Coordinate glucose testing, nutrition delivery, and insulin administration. |
| d. Tailor discharge treatment regimens to the patient's individual circumstances and arrange for proper follow‐up. |
Standardize the Monitoring of Blood Glucose Values and Glucosylated Hemoglobin
Guidance for the coordination of glucose testing, nutrition delivery, and insulin administration, should be integrated into your protocols, and order sets. For noncritical care areas, the minimal frequency for blood glucose monitoring for patients who are eating is before meals and at bedtime. For the patient designated nothing by mouth (NPO) or the patient on continuous tube feeding, the type of nutritional/correction insulin used should drive the minimum frequency (every 4‐6 hours if rapid acting analog insulins [RAA‐I] are used, and every 6 hours if regular insulin is used). Directions for administering scheduled RAA‐I immediately before or immediately after nutrition delivery should be incorporated into protocols, order sets, and medication administration records. Unfortunately, having this guidance in the order sets and protocols does not automatically translate into its being carried out in the real world. Wide variability in the coordination of glucose monitoring, nutritional delivery, and insulin administration is common, so monitoring the process to make sure the protocol is followed is important.
Obtaining a glucosylated hemoglobin (HbA1c) level is important in gauging how well the patient's outpatient regimen is maintaining glycemic control, distinguishing stress hyperglycemia from established diabetes, and guiding the inpatient approach to glycemic control. ADA guidelines2, 3 endorse obtaining HbA1c levels of inpatients if these levels are not already available from the month prior to admission.
Establish a Target Range for Blood Glucose in NonCritical Care Areas
It is important to adopt a glycemic target that is institution‐wide, for critical care areas and noncritical care areas alike. Your glycemic target need not be identical to the ADA/AACE glycemic targets, but should be similar to them.
Examples of institutional glycemic targets for noncritical care areas:
-
Preprandial target 90‐130 mg/dL, maximum random glucose <180 mg/dL (ADA/AACE consensus target)
-
90‐150 mg/dL (a target used in some hospitals)
-
Preprandial target 90‐130 mg/dL for most patients, 100‐150 mg/dL if there are hypoglycemia risk factors, and <180 mg/dL if comfort‐care or end‐of‐life care (a more refined target, allowing for customization based on patient characteristics).
Your multidisciplinary glycemic control steering committee should pick the glycemic target it can most successfully implement and disseminate. It is fine to start with a conservative target and then ratchet down the goals as the environment becomes more accepting of the concept of tighter control of blood glucose in the hospital.
Although the choice of glycemic target is somewhat arbitrary, establishing an institutional glycemic target is critical to motivate clinical action. Your committee should design interventions, for instances when a patient's glycemic target is consistently not being met, including an assignment of responsibility.
Prompt Clinicians to Consider Discontinuing Oral Agents
Oral antihyperglycemic agents, in general, are difficult to quickly titrate to effect, and have side effects that limit their use in the hospital. In contrast, insulin acts rapidly and can be used in virtually all patients and clinical situations, making it the treatment of choice for treatment of hyperglycemia in the hospital.3, 11, 12 In certain circumstances, it may be entirely appropriate to continue a well‐controlled patient on his or her prior outpatient oral regimen. It is often also reasonable to resume oral agents in some patients when preparing for hospital discharge.
Incorporate Nutritional Management
Because diet is so integral to the management of diabetes and hyperglycemia, diet orders should be embedded in all diabetes or insulin‐related order sets. Diets with the same amount of carbohydrate with each meal should be the default rule for patients with diabetes. Nutritionist consultation should be considered and easy to access for patients with malnutrition, obesity, and other common conditions of the inpatient with diabetes.
Access Diabetes Education and Appropriate Consultation
Diabetes education should be offered to all hyperglycemic patients with normal mental status, complete with written materials, a listing of community resources, and survival skills. Consultation with physicians in internal medicine or endocrinology for difficult‐to‐control cases, or for cases in which the primary physician of record is not familiar with (or not adherent to) principles of inpatient glycemic management, should be very easy to obtain, or perhaps mandated, depending on your institution‐specific environment.
Prescribe Physiologic (Basal‐Nutritional‐Correction Dose) Insulin Regimens
Physiologic insulin use is the backbone of the recommended best practice for diabetes and hyperglycemia management in the hospital. The principles of such regimens are summarized elsewhere in this supplement.12 These principles will not be reiterated in detail here, but the major concepts that should be integrated into the protocols and order sets will be highlighted.
Choose a Total Daily Dose
Clinicians need guidance on how much subcutaneous insulin they should give a patient. These doses are well known from clinical experience and the published literature. The fear of hypoglycemia usually results in substantial underdosing of insulin, or total avoidance of scheduled insulin on admission. Your team should provide guidance for how much insulin to start a patient on when it is unclear from past experience how much insulin the patient needs. Waiting a few days to see how much insulin is required via sliding‐scale‐only regimens is a bad practice that should be discouraged for patients whose glucose values are substantially above the glycemic target. The total daily dose (TDD) can be estimated in several different ways (as demonstrated in Appendix 1 and 2), and protocols should make this step very clear for clinicians. Providing a specific location on the order set to declare the TDD may help ensure this step gets done more reliably. Some institutions with computer physician order entry (CPOE) provide assistance with calculating the TDD and the allocation of basal and nutritional components, based on data the ordering physician inputs into the system.
Select and Dose a Basal Insulin
Your protocol should describe how the TDD should be divided between basal and nutritional insulin. We generally recommend 50% of the TDD be given as basal insulin, with the other 50% administered on a scheduled basis to cover glycemic excursions from nutritional intake. The 50/50 rule is simple and generally works well, and should be widely promoted. However, there are exceptions to this rule that should be incorporated into your full protocol and educational programs. The order set should have separate steps for ordering basal insulin, nutritional insulin, and correction insulin. The advantage to providing these insulin components separately is that it allows them to be independently manipulated (eg, if a patient is unable to tolerate a meal, nutritional insulin is held, but basal insulin and correction insulin are continued).
The SHM GCTF specifically endorses long acting insulin (glargine and detemir) as the preferred basal insulin in the hospital setting, thus discouraging the use of neutral protamine Hagedorn (NPH) insulin and fixed combination insulin formulations (Table 2). In the absence of randomized controlled trials demonstrating superiority of the glargine or detemir to NPH insulin in the hospital, this endorsement deserves some further explanation. Although we believe that correctly dosed NPH containing insulin regimens can attain effective and safe glycemic control in the hospital setting, it is more difficult to standardize their use and adjust for fluctuations in nutritional intake. Glargine and detemir have much less pronounced spikes in their effect than NPH, rendering them relatively peakless in comparison. This pharmacokinetic profile allows for continued dosing with minimal or no correction when nutrition intake is variable, and allow for consistent reinforcement of the basal‐nutritional‐correction insulin concept.
| Nutritional situation | Necessary insulin components | Preferred regimen* |
|---|---|---|
| ||
| NPO (or clear liquids) | Basal insulin: 50% of TDD. Nutritional insulin: None. | Basal insulin: glargine given once daily or detemir given twice daily. Nutritional insulin: None. Correctional insulin: Regular insulin q 6 hours or RAA insulin q 4 hours. Other comments: Dextrose infusion (e.g., D5 containing solution at 75‐150 cc/hour) recommended when nutrition is held. An IV insulin infusion is preferred for management of prolonged fasts or fasting type 1 diabetes patients. |
| Eating meals | Basal insulin: 50% of TDD. Nutritional insulin: 50% of TDD, divided equally before each meal. | Basal insulin: glargine given once daily or detemir given twice daily. Nutritional insulin: RAA insulin with meals. Correctional insulin: RAA insulin q AC and HS (reduced dose at HS). |
| Bolus tube feeds | Basal insulin: 40% of TDD. Nutritional insulin: 60% of the TDD, divided equally before each bolus feed. | Basal insulin: glargine given once daily or detemir given twice daily. Nutritional insulin: RAA insulin with each bolus. Correctional insulin: RAA insulin with each bolus. |
| Continuous tube feeds | Basal insulin: 40% (conservative) of TDD. Nutritional insulin: 60% of the TDD in divided doses. | Basal insulin: glargine given once daily or detemir given twice daily. Nutritional insulin: RAA insulin q 4 hours or regular insulin q 6 hours. Correctional insulin: Should match nutritional insulin choice. |
| Parenteral nutrition | Insulin is usually given parenterally, with the nutrition | Initially, a separate insulin drip allows for accurate dose‐finding. Then, 80% of amount determined as TDD using drip is added to subsequent TPN bags as regular insulin. Use correctional subcutaneous insulin doses cautiously, in addition. |
There are some caveats to this general recommendation. First, patients who are well controlled on home regimens with NPH basal insulin can (and sometimes should) stay on the regimen that has worked well for them. However, extra vigilance in reducing the dose for reductions in nutrition is required, because NPH is generally used to cover both nutritional and basal requirements. Second, extensive experience with glargine and detemir are not available in obstetric populations. They are not U.S. Food and Drug Administration (FDA) approved for use in pregnant patients and formally carry a Class C rating, whereas NPH insulin has been used safely in obstetric populations for decades. Third, the insulin regimen used as an inpatient is not necessarily the preferred regimen to prescribe at discharge: cost, patient preferences, HbA1c level, and other factors should be considered in making this choice.
Select and Dose a Nutritional (Prandial) Insulin
The step for ordering nutritional insulin should assist the clinician in matching the insulin to the type of nutrition that the patient is receiving. For example, rapid‐acting insulin analogs are preferred over regular insulin in the eating patient, in view of their more physiologic profile, which averts the insulin stacking that can occur with regular insulin. If regular insulin is used as the preferred institutional choice for eating patients, the lunchtime dose should be reduced or eliminated altogether, to eliminate insulin stacking.
Table 2 outlines the SHM GCTF preferred regimens for different nutritional situations.
There should be a standing order for nutritional insulin to be held when nutrition is interrupted, whether intentional or unintentional. Patients with interrupted tube feedings could have standing orders for a dextrose infusion to replace the tube feeding carbohydrate load and prevent hypoglycemia. Ideally, there should also be a standing order allowing for real‐time management of the patient with uncertain nutritional intake. For example, when a patient's premeal assessment reveals that she may not tolerate the meal, the patient should be allowed to attempt to eat, and then the nutritional insulin should be given after the meal, in proportion to the amount of food that was eaten. This type of order will require significant nursing education and process redesign in many hospitals, but is essential for matching nutritional insulin to actual intake.
Add Correction Insulin
There is no convincing evidence for the benefit of correction (sliding‐scale) insulin in the inpatient setting, although a randomized trial demonstrating the superiority of basal/nutritional insulin regimens to sliding‐scale only regimens did incorporate a correction insulin scale as an adjunct to the superior basal/nutritional regimen.4 The SHM GCTF again emphasizes that control of hyperglycemia should be proactive and anticipatory of insulin needs, rather than reactive to hyperglycemia. Nonetheless, unexpected hyperglycemic excursions are common, and the use of correction insulin remains a pervasive and arguably logical practice. If correction insulin is used, it should be ordered as a separate step after considering basal and nutrition insulin needs. The doses of scheduled insulin should be adjusted regularly if correction insulin is consistently being required. Ideally, the prescriber should choose a preformatted corrective insulin scale, based on the patient's insulin sensitivity (Appendix 2). There should be a prompt to use the same type of insulin that is being used for nutritional insulin, and there should be instructions that this insulin is given in addition to the basal and nutritional insulin to correct for hyperglycemia. Nocturnal correction‐dose scales should be reduced in the eating patient.
Even after limiting insulin regimens to those in Table 2, multidisciplinary glycemic control teams are still left with several options within these SHM‐preferred regimens. We recommend that your team choose a single, institutionally‐preferred basal‐nutritional‐correction insulin combination for each situation.
Choosing one preferred option for these situations is advantageous because:
-
You can communicate preferred regimens more simply and succinctly to all staff.
-
You eliminate all inappropriate choices for insulin regimens for that situation, as well as some other less preferred, but acceptable choices.
-
You can encourage regimens that are most economical (by promoting the insulin regimens that reflect your hospital formulary choices).
-
Staff members can become very familiar with a few regimens, instead of being confused by a multitude of them. They can identify variations from your preferred choices and target these patients for extra scrutiny and actions should they fail to meet glycemic targets.
Although virtually every institution can provide specific guidance on insulin management in a protocol, there are tradeoffs inherent in how restrictive you can be in pushing these preferred choices in your order sets. Should you eliminate alternate basal or nutritional insulin choices from your order sets? As you integrate more and more of your preferred algorithm and regimens into your order set, you will gain incremental improvement in the standardization of inpatient insulin management. However, you reduce not only variability in ordering, but also the choices available to your prescribers and patients, and in effect you are pushing the providers to use an insulin regimen that often differs from the patient's outpatient regimen. If your institution is not yet ready to go with a single preferred insulin, simply listing your preferred insulin first with the annotation preferred can be enough to increase the use of the preferred insulin.
We endorse building the most protocol‐driven, proscriptive, insulin order set that the Glycemic Control Steering Committee believes their medical staff will accept. There are some caveats to this endorsement. First, there must be extra efforts on the backend of the admission, to ensure that the antihyperglycemic regimen is tailored to the unique needs of the patient (this is discussed further below). Second, a protocol‐driven approach is not a substitute for a good educational program for health care providers or well‐informed clinical judgment. Education should reinforce major concepts driving the protocol and should also highlight exceptions to the rule. Variance from the protocol endorsed choices should be allowed (and even encouraged) when the variance is driven by patient factors (as opposed to provider whim). Learning from this variance is a key concept in refining protocols. Education ideally should not be limited to only protocol‐endorsed choices, as staff should be familiar with the full range of antihyperglycemia regimens seen in inpatient and outpatient settings.
Special Situations
Most of the preferred regimens for different situations are outlined in Table 2 in a straightforward manner, and can be depicted in your protocols and order sets in the same way. Some conditions have enough complexity, however, that you will have difficulty placing all of the details into your one‐page protocol and order set. Details should be placed on your more detailed protocol, and educational programs should include the topics outlined below. Although insulin infusion is often the option that would provide the most reliable and expedient control of hyperglycemia in these special situations, it is an option not available in many noncritical care settings. Therefore, the discussion is limited to subcutaneous insulin control regimens.
Patient on Continuous Tube Feeding
The SHM GCTF endorses glargine or detemir as the basal insulin of choice for this setting. The nutritional and correction insulin of choice is either an RAA‐I every 4 hours (q4h), or regular insulin every 6 hours (q6h). We endorse this choice because it retains the basal‐nutritional‐correction dose concept, generally allows for continued basal insulin use if the tube feedings become interrupted, and is amenable to building a consistent institutional protocol.
There are some important caveats to this recommendation. First, realize that almost any regimen that provides a stable insulin supply would be acceptable, and many institutions will use glargine or detemir to cover both basal and nutritional needs. The downside to using large boluses of long‐acting insulin in this clinical situation is that any unexpected interruption of the feedings will necessitate prolonged infusions of dextrate 10% solution (D10) to avoid hypoglycemia
Second, because of the glycemic load inherent in tube feedings, maintenance of glycemic control in the setting of enteral feeding may be best managed by providing a higher percentage of the TDD as nutritional insulin. In these cases, ratios of basal to nutritional insulin of 40:60, or even less basal insulin, may be appropriate.
Glucocorticoid Therapy
High‐dose glucocorticoids are strongly associated with increased insulin requirements. The degree of hyperglycemia induced by steroids varies significantly from patient to patient, and the pattern of hyperglycemia will vary depending on the pattern of steroid administration. The general principle to keep in mind is that the hyperglycemia induced by a steroid dose will peak 8‐12 hours after it is given, so insulin regimens to address this should take this effect into account. For example, giving a long‐acting basal insulin like glargine to accommodate the hyperglycemic effect of a steroid bolus given in the morning would be inappropriate because the steroid effect would wane and then disappear overnight, leading to insulin‐induced hypoglycemia. NPH insulin can be ideal in this setting, either by itself, or by layering it on top of an existing regimen.
Another caveat: glucocorticoids exert their predominate effect on insulin sensitivity in muscle (as opposed to the liver), and as a result, have their most notable effect on postprandial glucose. For this reason, the best insulin regimens for this situation may use proportionally less basal insulin and more nutritional insulin. One common regimen calls for keeping the basal insulin dose the same as the preglucocorticoid dose, while escalating the RAA insulin dose at lunch and dinner.
Given the complexities of covering steroid‐induced hyperglycemia and its high prevalence in certain populations (such as transplantation patients and patients undergoing chemotherapy), this would be an excellent area on which to focus expertise. Examples include routine endocrinology consultation, intervention by a special glycemic control team, or incorporating routine glucose monitoring and triggers for initiating insulin infusion into the protocols for chemotherapy and transplantation patients.
Regiment the Management of Hypoglycemia
Hypoglycemia is defined by the ADA as a blood glucose of 70 mg/dL or less, based on the physiologic changes that can occur at this glucose level, even in subjectively asymptomatic patients.3 Protocols for management of hypoglycemia should be linked to your diabetes/hyperglycemia protocols. There are many hypoglycemia protocols available for review in the SHM Glycemic Control Resource Room and Glycemic Control Implementation Guide.10 Some common themes for effective implementation stand out. First, the protocols need to walk the balance between simplicity of use, and the need to provide instructions that will provide guidance in a variety of patient situations. Second, the protocols need to be nurse driven, so that nurses can initiate treatment without waiting for a physician order. Third, education and instruction regarding recognition of risk factors, and avoidance of hypoglycemia are needed to support a successful protocol. Importantly, any hypoglycemic event should lead to a reconsideration of the current anti‐hyperglycemic regimen so that future events can be prevented.
Plan for Discharge and Provide Guidance for the Transition
Your institution should have policies and procedures outlining all the steps needed to complete the important transition out of the hospital. At a minimum, this planning should include adequate education (including a learner assessment), appropriate follow‐up, referral to community resources, and a discharge glycemic control regimen that is tailored to the educational, financial, and motivational profile of a patient. The more your inpatient insulin management is driven by protocol, the more likely it is the patient will be on an inpatient treatment plan that differs from their outpatient regimen; therefore, it is even more important to plan this transition carefully and reliably.
Communicating the accurate hyperglycemia related diagnosis and related problems to the primary care provider is important for good care, perhaps even more so for patients who had hyperglycemia while hospitalized without a prior diagnosis of diabetes. Some centers place a prompt for hyperglycemia related diagnosis in the order set and/or discharge paperwork, to remind the clinician to convey the diagnosis to the primary provider, and to encourage more complete documentation. Improved documentation can also improve the business case for glycemic control, along with other strategies outlined elsewhere in this supplement.13
Transitions in care (including transitions out of the hospital and off of infusion insulin) are discussed in more detail14, 15 elsewhere in this supplement. The principles outlined in these references should be incorporated into your institutional protocol. Briefly, not all patients require or are capable of intensive basal‐bolus regimens upon discharge. The HbA1c can be very valuable in arriving at the optimal outpatient regimen.14 The capacities and preferences of the patient and the context of his or her outpatient care environment (including the preferences of the primary care provider) must be taken into consideration as an outpatient management program is planned.
PULLING IT ALL TOGETHER: MAKE SURE YOUR PROTOCOL/ORDER SET IS EASY TO USE AND WIDELY UTILIZED
When standardizing hospital management of diabetes and hyperglycemia, we recommend building the full protocol first, then crystallizing the protocol into a one‐page summary that can be widely disseminated. The protocol guidance is then incorporated into the order set and nursing medical administration record (MAR). Again, we recommend the most proscriptive and protocol‐driven order set feasible within the constraints of medical staff support. The example order set in Appendix 2 illustrates this approach along with other desirable features:
-
Check‐box simplicity on when to order appropriate glucose monitoring.
-
Prompt for the proper hyperglycemia‐related diagnosis.
-
Prompts to document diagnosis and to order HbA1c level.
-
Use of encouraged insulin terminology: basal, prandial (or nutritional), and correction. Language is a powerful thing, and just getting staff to use these terms goes a long way toward the more physiologic prescribing of insulin.
-
Statement/reminder of a glycemic goal.
-
Prompts and contact information for appropriate consultation.
-
Elimination of unapproved abbreviations (such as U for units).
-
Stating both generic and brand names of insulin preparations.
-
Important timing cues for administration of insulin.
-
Several correction‐dose scales suitable for different insulin sensitivities. One size does NOT fit all.
-
Incorporation of a simple hypoglycemia protocol into the order set.
-
Insulin dosing guidelines available at the point of care (in this case, on the back of the order set).
Additional nursing‐specific cues (such as an admonition to never mix glargine insulin with other types of insulin) can also be included in the MAR whenever glargine is ordered.
Once you have protocols and order sets to guide providers, you need to assure that they are used for the majority of hyperglycemic patients. Educational programs should introduce your interventions and the rationale for them. In order to make your method the default method of care, your team should survey all preprinted or CPOE insulin order sets of your institution. A review of postoperative, transfer, and admission order sets that all services use may reveal a half‐dozen or more embedded sliding‐scale insulin order sets that should be removed, with prompts to use the standardized insulin order set being placed in their stead.
Computerized order sets present both challenges and opportunities. Wording limitations and the scrolling nature can make concepts less clear, yet there is a capability for incorporating a hierarchical structure that allows for guiding the user through a more algorithmic approach. There is also a capacity to provide assistance with dosing calculations that do not exist in the paper world. Education remains of key importance for both methods.
MONITOR THE USE AND EFFECTIVENESS OF YOUR PROTOCOLS AND ORDER SETS
Creating and implementing protocols, order sets, and other tools is not the end of the journey to improve care. It is important to monitor order set utilization, insulin use patterns, and parameters measuring glycemic control and hypoglycemia, as outlined in more detail in another article in this supplement.16 In addition to summary data every month or so, we recommend daily reports that spur action in near real time. Triggers such as uncontrolled hyperglycemia, markedly elevated HbA1c levels, and nonphysiologic insulin regimens should initiate consultation, extra diabetes education, or referral to a glucose control team. If appropriate consultation is not readily available, the glycemic control steering group should lobby the administration to bolster this capability. Qualitative feedback from the frontline caregivers, as well as this quantitative data, can assist the local glycemic control champions in designing even more effective protocols, order sets, focused educational efforts, and concurrent mitigation of suboptimal care.
CONCLUSION
Diabetes, hyperglycemia, and iatrogenic hypoglycemia are common and important conditions affecting the noncritically ill inpatient. Interventional trials to validate the recommended noncritical care unit glycemic targets are needed. Although there is a growing consensus on best practices to care for these patients, numerous barriers and the complexity of caring for inpatients hamper the reliability of best practice delivery. Institutional protocols and protocol driven subcutaneous insulin orders, when implemented with the strategies outlined here, can be the key to delivering these best practices more reliably.
Appendix
- American College of Endocrinology Task Force on Inpatient Diabetes and Metabolic Control.American College of Endocrinology Position Statement on Inpatient Diabetes and Metabolic Control.Endocr Pract.2004;10:77–82.
- ,,,,,,.Management of diabetes and hyperglycemia in hospitals.Diabetes Care.2004;27:553–591.
- American Diabetes Association.Standards of Medical Carein Diabetes‐2006.Diabetes Care.2006;29(suppl 1):s4–s42.
- ,,, et al.Randomized study of basal‐bolus insulin therapy in the inpatient management of patients with type 2 diabetes (RABBIT 2 Trial).Diabetes Care.2007;30:2181–2186.
- ,,,,.Inpatient management of diabetes and hyperglycemia among general medicine patients at a large teaching hospital.J Hosp Med.2006;1:145–150.
- ,,, et al.Diabetes care in the hospital: is there clinical inertia?J Hosp Med.2006;1:151–160.
- ,,, et al.Diabetes care in hospitalized non‐critically ill patients: more evidence for clinical inertia and negative therapeutic momentum.JHosp Med.2007;2:203–211.
- Inpatient Diabetes and Glycemic Control: A Call to Action Conference. Position Statement. AACE, February2006. Available at: http://www.aace.com/meetings/consensus/IIDC/IDGC0207.pdf. Accessed October, 2006.
- Proceedings of the American College of Endocrinology and American Diabetes Association Consensus Conference, Washington, DC, January 30–31, 2006. Endocr Pract.2006; 12(suppl 3):3–13.
- Society of Hospital Medicine Glycemic Control Task Force. Implementation Guide: Improving Glycemic Control, Preventing Hypoglycemia, and Optimizing Care of the Inpatient with Hyperglycemia and Diabetes. Published January 2007 on the Society of Hospital Medicine website. Available at: http://www.hospitalmedicine.org. Accessed August,2007.
- .Management of hyperglycemia in the hospital setting.N Engl J Med.2006;355:1903–1911.
- ,,,,.Management of diabetes and hyperglycemia in the hospital: a practical guide to subcutaneous insulin use in the non‐critically ill adult patient.J Hosp Med.2008;3(5):S17–S28.
- ,.Practical strategies for developing the business case for hospital glycemic control teams.J Hosp Med2008;3(5):S76–S83.
- ,,,.Bridge over troubled waters: safe and effective transitions of the inpatient with hyperglycemia.J Hosp Med.2008;3(5):S55–S65.
- ,,,.Designing and implementing insulin infusion protocols and order sets.J Hosp Med.2008;3(5):S42–S54.
- ,,,,,.SHM Glycemic Control Task Force summary: practical recommendations for assessing the impact of glycemic control efforts.J Hosp Med.2008;3(5):S66–S75.
In the Literature

Statins for Stroke Prevention
By Paul J. Grant, MD
Amarenco P, Bogousslavsky J, Callahan A III, et al. Stroke Prevention by Aggressive Reduction in Cholesterol Levels (SPARCL) Investigators. High-dose atorvastatin after stroke or transient ischemic attack. N Engl J Med. 2006 Aug 22;355:549-559.
Despite recent advances, the physician’s armamentarium for secondary stroke prevention is limited. The literature regarding optimal blood pressure management for stroke prevention is sparse, and the data addressing the best antiplatelet regimen remain controversial. This is troubling, given the fact that cerebrovascular disease remains the third leading cause of death in the United States.
Although extensive data exists for the benefits of using 3-hydroxy-3-methylglutaryl coenzyme A reductase inhibitors (statins) for the prevention and treatment of cardiovascular disease, little is known about their role in decreasing the risk of stroke. The highly anticipated Stroke Prevention by Aggressive Reduction in Cholesterol Levels (SPARCL) trial sought to determine if statin therapy would decrease the risk of recurrent stroke in patients with no known coronary heart disease.
This prospective, randomized, double-blind, placebo-controlled trial included 4,731 men and women with no history of coronary heart disease. Eligible patients had a history of stroke (ischemic or hemorrhagic) or a transient ischemic attack (TIA) within a one- to six-month period before randomization as diagnosed by a neurologist. All patients required a low-density lipoprotein (LDL) cholesterol level between 100 and 190 mg/dL, while exclusion criteria included atrial fibrillation. Patients were randomized either to a dosage of 80 mg of atorvastatin daily or to a placebo and were followed for a median duration of 4.9 years. The primary endpoint was fatal or nonfatal stroke.
The average patient age in this trial was 63; approximately 60% of the patients were male. A total of 265 patients reached the primary endpoint in the atorvastatin group, versus 311 patients in the placebo group. This translates to an adjusted relative risk reduction of 16% in the primary endpoint for patients receiving atorvastatin (hazard ratio 0.84; 95% confidence interval 0.71 to 0.99; p=0.03). Although there was no difference in overall mortality between the two groups, the incidence of cardiovascular events was significantly lower in those receiving atorvastatin. Interestingly, more hemorrhagic strokes were noted in the atorvastatin group. With respect to safety, no significant differences in serious adverse events were noted. The atorvastatin group did, however, encounter significantly more cases of persistently elevated aspartate aminotransferase (AST) or alanine aminotransferase (ALT), at 2.2% versus 0.5% in the placebo group.
The findings by the SPARCL investigators provide strong evidence that atorvastatin reduces the incidence of stroke recurrence. The mechanism for risk reduction with statin exposure is most likely due to the dramatic lowering of LDL cholesterol. This effect has been shown in numerous trials resulting in the reduction of cardiovascular events. The present trial observed a 53% decrease in LDL cholesterol in the atorvastatin group compared with no change in the placebo arm. In addition to their powerful lipid-lowering role, statins also appear to prevent plaque rupture, optimize endothelial function, and provide anti-inflammatory effects. These are the so-called “pleiotropic effects” of statins and may be another factor contributing to the benefits observed.
Although some physicians are already prescribing statins for stroke patients, the literature supporting this practice has been sparse. The latest guidelines for prevention of stroke in patients with ischemic stroke or TIA were published in February 2006 by the American Heart Association/American Stroke Association Council on Stroke. These guidelines state that patients with a history of ischemic stroke or TIA are “reasonable candidates” for statin therapy. One could argue that these guidelines should now be revised to include a strong recommendation for statin therapy in secondary stroke prevention.
MRSA in the Community
By Matthew T. Harbison, MD
Moran GJ, Krishnadasan A, Gorwitz RJ, et al. EMERGEncy ID Net Study Group. Methicillin-resistant S. aureus infections among patients in the emergency department. N Engl J Med. 2006 Aug 17;355(7):666-674.
Methicillin-resistant Staphylococcus aureus (MRSA) emerged as an issue in the healthcare community not long after the introduction of methicillin in 1959. MRSA has traditionally been thought of as an issue for those individuals who have contact with the healthcare system; however, there is growing evidence that MRSA has become an entity in the greater community at large, affecting individuals who have not spent significant time in healthcare facilities. Descriptions of several community-based outbreaks have led to the understanding that community-associated MRSA has different characteristics than MRSA infections contracted in the hospital setting. The community-associated isolates are resistant to fewer antibiotics, produce different toxins, and have differing genetic complexes responsible for antibiotic resistance. The majority of the community-acquired infections are skin and soft tissue infections, although more serious infections have been reported.
Moran and colleagues conducted a prospective prevalence study in adult patients presenting to emergency departments with skin and soft tissue infections in 11 metropolitan areas in geographically diverse regions of the United States. Eligible patients 18 and older with purulent skin or soft tissue infections of less than one week’s duration had demographic and historical data collected; a wound culture was also taken. If Staphylococcus aureus was isolated, it was further evaluated by the Centers for Disease Control and Prevention (CDC) to characterize antibiotic resistance patterns, toxin production, and the type of staphylococcal cassette chromosome present.
A total of 422 patients were enrolled, with S. aureus isolated in 320 patients (76%). Of those with isolated S. aureus, 78% had MRSA (59% of the total patients enrolled). The individual site prevalence of MRSA ranged from 15 to 74% and was the predominant etiology of skin and soft tissue infections in 10 of 11 emergency departments. MRSA susceptibilities in this study were 100% to trimethoprim-sulfamethoxazole and rifampin, 95% to clindamycin, 92% to tetracycline, 60% to fluoroquinolones, and 6% to erythromycin. The authors point out that clindamycin resistance in one center was 60%; thus, individual site resistance patterns may differ significantly. Treatment data was available for 406 of the 422 patients, with the majority of those treated with incision, drainage, and antibiotics. In 100 of the 175 MRSA patients treated with antibiotics, the choice of agent was discordant with susceptibility patterns. The authors were able to contact 248 patients between two and three weeks after their visits and, of those contacted, 96% reported resolution or improvement of the wound.
Using multivariate logistic-regression analyses, the authors identified several potential risk factors for MRSA infection. These included use of any antibiotic in the past month, underlying illness, history of MRSA infection, close contact with someone with similar infection, and reported spider bite. Interestingly, being a healthcare worker, living in a long-term care facility, and being hospitalized in the past year were not shown to be significant risk factors in this study.
The results of this study highlight the emerging difficulty, which continues to evolve, with antibiotic resistance patterns. The healthcare community must be vigilant to new entities that challenge the traditional views of antibiotic resistance patterns. The high rate of community-acquired MRSA skin and soft tissue infection demonstrated in this study, in addition to the large percentage of patients prescribed antibiotics that were resistant for the strain involved, emphasizes the need to reconsider the empiric antibiotic choices for this patient population. The variability in regional resistance patterns further complicates the issue. Given the high prevalence of MRSA skin and soft tissue infections reported in this study, use of routine wound cultures appears prudent, as does the need for effective follow-up strategies for alteration of antibiotic choice if necessary. At an institutional level, development of surveillance and isolation strategies for community-acquired MRSA should be considered.
More Options for Venous Thromboembolism Treatment
By Kirsten N. Kangelaris, MD
Kearon C, Ginsberg JS, Julian JA, et al. Fixed-Dose Heparin (FIDO) Investigators. Comparison of fixed-dose weight-adjusted unfractionated heparin and low-molecular-weight heparin for acute treatment of venous thromboembolism. JAMA. 2006 Aug 23;296(8):935-942.
The standard approach to using unfractionated heparin (UFH) in the treatment of acute venous thromboembolism as a bridge to warfarin therapy requires continuous intravenous infusion with frequent dose adjustments in response to measurements of activated partial thromboplastin time (aPTT). This therapy inevitably requires inpatient management. Subcutaneous administration of weight-based low molecular weight heparin (LMWH) has been the modality of choice for outpatient treatment of venous thromboembolism because it does not require laboratory monitoring. Its use has been limited by the high cost of treatment, however. A preliminary study, released in 2000 by the FIDO group (Fixed-Dose Heparin Investigators, Kearon and colleagues), suggested that subcutaneously administered UFH could be optimally dosed based on weight rather than monitoring aPTT levels.
This follow-up, randomized, open-label, adjudicator-blinded, multi-centered, non-inferiority trial enrolled 708 patients and compared fixed-dose, subcutaneously administered UFH to LMWH in acute deep venous thrombosis and pulmonary embolism. Administration in both groups was twice daily, subcutaneous, and weight-based. UFH was given as a first dose of 333 U/kg, followed by 250 U/kg every 12 hours. LMWH was administered at a dose of 100 IU/kg every 12 hours. Both treatments overlapped with three months of warfarin therapy, and both could be administered out of hospital.
Exclusion criteria were age <18, contraindication to subcutaneous therapy, active bleeding, life expectancy under three months, long-term anticoagulation therapy, pregnancy, and creatinine level >2.3 mg/dL.
The primary endpoints were efficacy as determined by recurrent venous thromboembolism within three months and safety as determined by major bleeding within 10 days of randomization. A secondary endpoint was relationship of efficacy and safety outcomes to aPTT levels measured on day two to three of therapy for the UFH group.
Results revealed that UFH was statistically non-inferior to LMWH by all endpoints, including treatment duration, efficacy, and safety. At three months, there was no significant difference between the groups in frequency of recurrent venous thromboembolism (3.8% UFH versus 3.4% LMWH), bleeding (1.1% UFH versus 1.4% LMWH), or death. There was no association between aPTT levels and recurrent venous thromboembolism or bleeding.
Limitations of the study included reduced enrollment from the initial study design, though power was adequate due to a lower than expected incidence of recurrent venous thromboembolism in both arms (~3.6% versus the expected 6%); possible biases related to open-label design; and more post-randomization exclusions in the UFH group versus the LMWH group.
In summary, fixed-dose, unmonitored, subcutaneous UFH appears to be an effective, safe alternative to LMWH as a bridge to warfarin therapy for venous thromboembolism. Clinically, this is relevant, because UFH is approximately 15 to 20 times less expensive than LMWH. The authors appropriately call attention to two developments in clinical practice that occurred during the course of the present study and that could potentially limit the use of UFH. These are 1) the dosing option for once-daily LMWH, which improves convenience, and 2) the preference for long-term LMWH therapy over warfarin for treating cancer patients with venous thromboembolism. Despite these exceptions, UFH may prove to be a viable and economic option for venous thromboembolism treatment.
In-Hospital MI Versus MI at Presentation
By Erin M. Galbraith, MD
Maynard C, Lowy E, Rumsfeld J, et al. The prevalence and outcomes of in-hospital acute myocardial infarction in the Department of Veterans Affairs Health System. Arch Intern Med. 2006 Jul 10;166(13):1410-1416.
Much is known about the prevalence, treatment, and prognosis of acute myocardial infarction (AMI) when it occurs in the community and is the presenting diagnosis. Few studies, however, have addressed the epidemiology of in-hospital AMIs. This study by Maynard and colleagues attempts to elucidate the basic epidemiologic characteristics, treatments, and outcomes of patients who suffer in-hospital AMIs.
This retrospective cohort consisted of 7,054 patients who had been discharged with a diagnosis of AMI from 127 Veterans Health Administration (VHA) medical centers between July and August 2003. Patients who had suffered a postoperative MI or were transferred in from another hospital were excluded. Data was obtained from both the electronic and paper medical records. Of the 7,054 patients in the study, 792 (11.2%) had experienced an AMI while hospitalized for other medical problems. These 792 patients were older by approximately 4.5 years and more frequently suffered from heart failure, diabetes, chronic renal insufficiency, COPD, cerebrovascular disease, dementia, and cancer. These patients were less likely, however, to have had a previous MI, to be current smokers, or to have undergone previous angioplasty. They were also less likely to have known lipid disorders or to be taking aspirin or lipid-lowering agents.
Regarding their presentations and management, the patients who suffered in-hospital AMIs had faster heart rates and lower blood pressures. They were also up to 75% less likely to report typical symptoms of cardiac ischemia, including chest pain/pressure, shoulder pain, nausea, and diaphoresis. They were less often seen by an attending cardiologist and had more contraindications to AMI therapy; thus, these patients underwent reperfusion therapy at much lower rates, both initially and at 30 days. Their troponin levels were more frequently elevated, but they were only half as likely to have ST segment elevations at the time of diagnosis. Hospitalizations were longer for the in-hospital group, and there were higher rates of in-hospital cardiogenic shock, cardiac arrest, and death (27.3% versus 8.6%). The 30-day mortality rate was also higher (33% versus 11.9%). Multivariate logistic regression revealed an adjusted odds ratio of 2.0 (95% confidence interval 1.7 to 2.4; p<0.001) for 30-day mortality in those who experienced an in-hospital AMI versus those who presented with an AMI.
Potential reasons for the increased severity of outcomes include, but are not limited to, their many chronic comorbidities, their other acute diagnoses, the failure of the medical team to recognize cardiac ischemia in a timely manner (i.e., higher initial troponins), the inability to treat MIs appropriately secondary to contraindications to acute intervention, and the lack of an attending cardiologist presiding over their medical care. Clearly, further studies are needed to elucidate the causes of death in the 33% of patients who died, because it is unclear whether the patients died of complications from their MIs or as a result of their multiple other medical problems. Knowledge of the extent to which these patients could be managed, both medically and via interventional procedures (and why these therapies were not pursued), would also be of value.
This study emphasizes the importance of recognizing atypical presentations of AMIs and exercising vigilance in pursuing the most aggressive therapy possible, as dictated by a patient’s ability to tolerate medical and procedural interventions.
Hyperglycemia in Heart Failure
By David H. Wesorick, MD
Barsheshet A, Garty M, Grossman E, et al. Admission blood glucose level and mortality among hospitalized nondiabetic patients with heart failure. Arch Intern Med. 2006 Aug 14-28;166(15):1613-1619.
The medical literature strongly suggests that inpatient hyperglycemia is associated with a variety of poor outcomes. Little is known, however, about the relationship between hyperglycemia and heart failure. These investigators examined the association of admission blood glucose and mortality in patients who were admitted to the hospital with acute heart failure.
In this study, 1,122 patients admitted to the hospital with acute heart failure and without diabetes were divided into tertiles depending on their admission blood glucose levels. Diabetes was defined as an admission blood glucose greater than or equal to 200 mg/dl, a known diagnosis of diabetes recorded in the chart, or the presence of anti-diabetic medications on the patient’s medication list. Tertile #1 had an average admission blood glucose of 92 mg/dl (with a range of 54-102); tertile #2 had an average admission blood glucose of 113 mg/dl (with a range of 103-127); and tertile #3 had an average admission blood glucose of 147 mg/dl (with a range of 128-199). Mortality was evaluated according to tertile.
In this study, patients in tertile #3 had significantly higher inpatient mortality (7.2%) than patients in tertile #1 or #2 (3% and 4%, respectively). There was a significant association between hyperglycemia and mortality, even at 60 days follow-up, although not at six and 12 months follow-up. The association remained significant, even when patients with acute MI were excluded. Besides hyperglycemia, the authors noted that increasing age, increasing creatinine, a New York Heart Association (NYHA) functional class of III or IV, and a systolic blood pressure of lower than 115 were also significant, independent predictors of in-hospital mortality in this patient population.
For a hospitalist, the intriguing question is this: Is hyperglycemia just a marker of worse disease, or might it contribute to poorer outcomes? Clearly, hyperglycemia is associated with poorer outcomes in other types of patients, including post-surgical patients, critically ill patients, MI patients, and general medical patients.1 But is hyperglycemia just a marker of more severe illness? In heart failure, perhaps more severe decompensation results in a more profound activation of the sympathetic nervous system and a more vigorous release of stress hormones, such as cortisol and catecholamines. In that case, one might expect a sicker patient to have a higher blood glucose.
More recent studies, however, show that better control of hyperglycemia in some acutely ill patients actually results in improved outcomes, suggesting that the hyperglycemia itself might be contributing to the poorer outcomes in some cases.2-5 Hyperglycemia is known to alter human physiology in a variety of adverse ways.1 For example, hyperglycemia is known to inhibit nitric oxide production and to alter endothelial dysfunction. In a patient with acute heart failure, these alterations might be expected to have a significant effect on outcomes.
This study does not intend to answer these questions, but it does add to our understanding of the association of hyperglycemia and poor outcomes in acutely ill patients. More research is needed to examine whether or not heart failure patients, specifically, will benefit from better glycemic control in the acute setting. TH
References
- Clement S, Braithwaite SS, Magee MF, et al. Management of diabetes and hyperglycemia in hospitals. Diabetes Care. 2004 Feb;27(2):553-591.
- Van den Berghe G, Wouters P, Weekers F, et al. Intensive insulin therapy in the critically ill patients. N Engl J Med. 2001 Nov 8;345(19):1359-1367.
- Van den Berghe G, Wilmer A, Hermans G, et al. Intensive insulin therapy in the medical ICU. N Engl J Med. 2006 Feb 2;354(5):449-461.
- Furnary AP, Zerr KJ, Grunkemeier GL, et al. Continuous intravenous insulin infusion reduces the incidence of deep sternal wound infection in diabetic patients after cardiac surgical procedures. Ann Thorac Surg. 1999 Feb;67(2):352-362.
- Furnary AP, Gao G, Grunkemeier GL, et al. Continuous insulin infusion reduces mortality in patients with diabetes undergoing coronary artery bypass grafting. J Thorac Cardiovasc Surg. 2003 May;125(5):1007-1021.