User login
ECT wipes out 30 years of memories
Woman loses 30 years of memories after electroconvulsive therapy
Richland County (SC) Circuit Court
A 55-year old woman with a history of depression underwent successful electroconvulsive therapy (ECT) after her husband and father died. Six months later she became depressed, and a new psychiatrist referred her to his partner for additional ECT treatments.
The partner administered outpatient ECT at a hospital daily for 10 days. The referring psychiatrist wrote in the patient’s chart that the patient experienced memory loss and severe cognitive problems during the initial ECT regimen but did not report this development to his partner and allegedly encouraged the patient to continue ECT.
After the second round of ECT treatments, the patient suffered brain damage and lost all her memories from the past 30 years—including the births of her children and her job skills—leaving her unable to work.
In court, the patient claimed ECT should be administered no more than three times a week, and the referring psychiatrist should have told his partner about the patient’s memory problems.
- The case was settled for $18,000
Dr. Grant’s observations
Although this case concerns ECT, the claim is based on negligence—that is, the psychiatrist did not fulfill his duty to care for the patient. The negligence claim focused on how the treatment was implemented, not whether ECT was appropriate for this woman’s depression.
ECT’s response rate ranges from 50% to 60%1 among patients who did not respond to one or more antidepressant trials. Symptomatic improvement usually is faster with ECT than with pharmacotherapy2 when ECT is administered three times per week. Mortality rates with ECT are similar to those associated with minor surgery.1
In addition to being an effective and safe treatment for depression, ECT rarely is a basis for malpractice. One study found that only 4 (0.2%) of 1,700 psychiatric malpractice claims filed between 1984 and 1990 concerned ECT’s side effects, complications, or appropriateness.3 Few patients who receive ECT file a malpractice claim because most are satisfied with the treatment; approximately 80% of ECT patients say they would consent to ECT again.4,5 In fact, one might consider withholding ECT from severely depressed patients grounds for malpractice.
Although safe and effective, ECT could present health risks that you need to discuss with patients. In particular, cognitive problems such as delirium and impaired attention and memory may result.1
Cognitive impairment risk in ect
ECT’s more severe cognitive side effects stem from:
- bilateral electrode placement
- sine wave stimulation
- suprathreshold stimulus intensity
- administration >3 times per week
- large numbers of treatments, usually >20 in an acute treatment course
- some medications, such as lithium carbonate and anticholinergics6
- pre-existing neurologic diseases such as Alzheimer’s or Parkinson’s disease.1
The magnitude of retrograde amnesia often is greatest immediately after treatment. Patients are more likely to forget public information such as current events than personal information.10 The effects usually subside over time, and older memories are more likely to be recovered than more recent ones. ECT can cause permanent memory loss, particularly after bilateral electrode placement, suprathreshold stimulus intensity, sine wave stimulation, or large numbers of treatments—usually more than 20.
Ensuring adequate informed consent when delivering ECT or before referring a patient for treatment can help prevent a malpractice claim. Although specific requirements for ECT consent vary by jurisdiction, follow these general principles:1
- Provide the patient adequate information. Explain the reasons for ECT, describe the procedure including choice of stimulus electrode placement, offer alternative treatments, and explain the risks, benefits, anticipated number of treatments, relapse risk, and need for continuing treatment.
- Make sure the patient is capable of understanding and acting reasonably on this information and knows he or she can refuse treatment at any time.
- Tell the patient that a successful outcome is not guaranteed.
- Describe the likelihood and potential severity of major risks associated with ECT, including mortality, cardiovascular and CNS problems, and minor side effects such as headache, muscle aches, or nausea.
- Be sure the patient understands that consent is voluntary and can be withdrawn. The patient should know that he or she is also consenting to emergency treatment.
- Tell patients about possible behavioral restrictions—such as needing a friend or family member to monitor the patient or not being able to drive a car—that may be necessary during evaluation, treatment, and recuperation.
Although ECT might impair memory, it can improve neuropsychological domains such as global cognitive status and measures of general intelligence.11 Also, there is no evidence that ECT causes lasting problems in executive functioning, abstract reasoning, creativity, semantic memory, implicit memory, or skill acquisition or retention. Long-term negative effects on ability to learn and retain new information are unlikely.1
Avoiding an ect related malpractice claim
To reduce the possibility of a malpractice claim after ECT:
- Inform the patient about the risk of cognitive side effects as part of the informed consent process (Box).
- Assess the patient’s orientation and memory functions before and throughout ECT. In the above case, the referring psychiatrist had a duty to inform the psychiatrist administering ECT about the patient’s memory problems and recommend decreasing or discontinuing ECT.
- Consider a patient’s mood state, which may influence how ECT patients rate their memory.12 Ask about symptoms of depression. Patients with cognitive complaints such as subjective memory loss are more likely than those without such problems to have depression symptoms.1
- Do not administer ECT more than 3 times per week. No evidence supports more frequent use, and daily ECT may increase cognitive problems.1 The psychiatrist in the above case was negligent in providing a treatment frequency with no scientific support or medical rationale.
- Verify that the physician is qualified to perform ECT. Hospitals must ensure ECT quality and safety and should have a written plan for providing and maintaining ECT privileges.
- Involve the family when appropriate. Family members often care for patients during outpatient ECT. Give patients and family members literature describing ECT. Allow them time to consider the procedure, then schedule an appointment to answer questions.
1. American Psychiatric Association. The practice of electroconvulsive therapy: recommendations for treatment, training, and privileging, 2nd ed. Washington, DC: American Psychiatric Publishing; 2001.
2. Nobler MS, Sackeim HA, Moeller JR, et al. Quantifying the speed of symptomatic improvement with electroconvulsive therapy: comparison of alternative statistical methods. Convuls Ther 1997;13:208-21.
3. Slawson P. Psychiatric malpractice and ECT: a review of 1,700 claims. Convuls Ther 1991;7:255-61.
4. Freeman CP, Cheshire KE. Attitude studies on electroconvulsive therapy. Convuls Ther. 1986;2:31-42.
5. Pettinati HM, Tanburello TA, Ruetsch CR, et al. Patient attitudes toward electroconvulsive therapy. Psychopharmacol Bull. 1994;30:471-5.
6. Small JG, Kellams JJ, Milstein V, et al. Complications with electroconvulsive treatment combined with lithium. Biol Psychiatry 1980;15:103-12.
7. Sobin C, Sackeim HA, Prudic J, et al. Predictors of retrograde amnesia following ECT. Am J Psychiatry 1995;152:995-1001.
8. Donahue JC. Electroconvulsive therapy and memory loss: anatomy of a debate. J ECT 2000;16:133-43.
9. Sackeim HA. Memory and ECT: from polarization to reconciliation. J ECT 2000;16:87-96.
10. Lisanby SH, Maddox JH, Prudic J, et al. The effects of electroconvulsive therapy on memory of autobiographical and public events. Arch Gen Psychiatry 2000;57:581-90.
11. Sackeim HA, Prudic J, Devanand DP, et al. Effects of stimulus intensity and electrode placement on the efficacy and cognitive effects of electroconvulsive therapy. N Engl J Med 1993;328:839-46.
12. Coleman EA, Sackeim HA, Prudic J, et al. Subjective memory complaints before and after electroconvulsive therapy. Biol Psychiatry 1996;39:346-56.
Woman loses 30 years of memories after electroconvulsive therapy
Richland County (SC) Circuit Court
A 55-year old woman with a history of depression underwent successful electroconvulsive therapy (ECT) after her husband and father died. Six months later she became depressed, and a new psychiatrist referred her to his partner for additional ECT treatments.
The partner administered outpatient ECT at a hospital daily for 10 days. The referring psychiatrist wrote in the patient’s chart that the patient experienced memory loss and severe cognitive problems during the initial ECT regimen but did not report this development to his partner and allegedly encouraged the patient to continue ECT.
After the second round of ECT treatments, the patient suffered brain damage and lost all her memories from the past 30 years—including the births of her children and her job skills—leaving her unable to work.
In court, the patient claimed ECT should be administered no more than three times a week, and the referring psychiatrist should have told his partner about the patient’s memory problems.
- The case was settled for $18,000
Dr. Grant’s observations
Although this case concerns ECT, the claim is based on negligence—that is, the psychiatrist did not fulfill his duty to care for the patient. The negligence claim focused on how the treatment was implemented, not whether ECT was appropriate for this woman’s depression.
ECT’s response rate ranges from 50% to 60%1 among patients who did not respond to one or more antidepressant trials. Symptomatic improvement usually is faster with ECT than with pharmacotherapy2 when ECT is administered three times per week. Mortality rates with ECT are similar to those associated with minor surgery.1
In addition to being an effective and safe treatment for depression, ECT rarely is a basis for malpractice. One study found that only 4 (0.2%) of 1,700 psychiatric malpractice claims filed between 1984 and 1990 concerned ECT’s side effects, complications, or appropriateness.3 Few patients who receive ECT file a malpractice claim because most are satisfied with the treatment; approximately 80% of ECT patients say they would consent to ECT again.4,5 In fact, one might consider withholding ECT from severely depressed patients grounds for malpractice.
Although safe and effective, ECT could present health risks that you need to discuss with patients. In particular, cognitive problems such as delirium and impaired attention and memory may result.1
Cognitive impairment risk in ect
ECT’s more severe cognitive side effects stem from:
- bilateral electrode placement
- sine wave stimulation
- suprathreshold stimulus intensity
- administration >3 times per week
- large numbers of treatments, usually >20 in an acute treatment course
- some medications, such as lithium carbonate and anticholinergics6
- pre-existing neurologic diseases such as Alzheimer’s or Parkinson’s disease.1
The magnitude of retrograde amnesia often is greatest immediately after treatment. Patients are more likely to forget public information such as current events than personal information.10 The effects usually subside over time, and older memories are more likely to be recovered than more recent ones. ECT can cause permanent memory loss, particularly after bilateral electrode placement, suprathreshold stimulus intensity, sine wave stimulation, or large numbers of treatments—usually more than 20.
Ensuring adequate informed consent when delivering ECT or before referring a patient for treatment can help prevent a malpractice claim. Although specific requirements for ECT consent vary by jurisdiction, follow these general principles:1
- Provide the patient adequate information. Explain the reasons for ECT, describe the procedure including choice of stimulus electrode placement, offer alternative treatments, and explain the risks, benefits, anticipated number of treatments, relapse risk, and need for continuing treatment.
- Make sure the patient is capable of understanding and acting reasonably on this information and knows he or she can refuse treatment at any time.
- Tell the patient that a successful outcome is not guaranteed.
- Describe the likelihood and potential severity of major risks associated with ECT, including mortality, cardiovascular and CNS problems, and minor side effects such as headache, muscle aches, or nausea.
- Be sure the patient understands that consent is voluntary and can be withdrawn. The patient should know that he or she is also consenting to emergency treatment.
- Tell patients about possible behavioral restrictions—such as needing a friend or family member to monitor the patient or not being able to drive a car—that may be necessary during evaluation, treatment, and recuperation.
Although ECT might impair memory, it can improve neuropsychological domains such as global cognitive status and measures of general intelligence.11 Also, there is no evidence that ECT causes lasting problems in executive functioning, abstract reasoning, creativity, semantic memory, implicit memory, or skill acquisition or retention. Long-term negative effects on ability to learn and retain new information are unlikely.1
Avoiding an ect related malpractice claim
To reduce the possibility of a malpractice claim after ECT:
- Inform the patient about the risk of cognitive side effects as part of the informed consent process (Box).
- Assess the patient’s orientation and memory functions before and throughout ECT. In the above case, the referring psychiatrist had a duty to inform the psychiatrist administering ECT about the patient’s memory problems and recommend decreasing or discontinuing ECT.
- Consider a patient’s mood state, which may influence how ECT patients rate their memory.12 Ask about symptoms of depression. Patients with cognitive complaints such as subjective memory loss are more likely than those without such problems to have depression symptoms.1
- Do not administer ECT more than 3 times per week. No evidence supports more frequent use, and daily ECT may increase cognitive problems.1 The psychiatrist in the above case was negligent in providing a treatment frequency with no scientific support or medical rationale.
- Verify that the physician is qualified to perform ECT. Hospitals must ensure ECT quality and safety and should have a written plan for providing and maintaining ECT privileges.
- Involve the family when appropriate. Family members often care for patients during outpatient ECT. Give patients and family members literature describing ECT. Allow them time to consider the procedure, then schedule an appointment to answer questions.
1. American Psychiatric Association. The practice of electroconvulsive therapy: recommendations for treatment, training, and privileging, 2nd ed. Washington, DC: American Psychiatric Publishing; 2001.
2. Nobler MS, Sackeim HA, Moeller JR, et al. Quantifying the speed of symptomatic improvement with electroconvulsive therapy: comparison of alternative statistical methods. Convuls Ther 1997;13:208-21.
3. Slawson P. Psychiatric malpractice and ECT: a review of 1,700 claims. Convuls Ther 1991;7:255-61.
4. Freeman CP, Cheshire KE. Attitude studies on electroconvulsive therapy. Convuls Ther. 1986;2:31-42.
5. Pettinati HM, Tanburello TA, Ruetsch CR, et al. Patient attitudes toward electroconvulsive therapy. Psychopharmacol Bull. 1994;30:471-5.
6. Small JG, Kellams JJ, Milstein V, et al. Complications with electroconvulsive treatment combined with lithium. Biol Psychiatry 1980;15:103-12.
7. Sobin C, Sackeim HA, Prudic J, et al. Predictors of retrograde amnesia following ECT. Am J Psychiatry 1995;152:995-1001.
8. Donahue JC. Electroconvulsive therapy and memory loss: anatomy of a debate. J ECT 2000;16:133-43.
9. Sackeim HA. Memory and ECT: from polarization to reconciliation. J ECT 2000;16:87-96.
10. Lisanby SH, Maddox JH, Prudic J, et al. The effects of electroconvulsive therapy on memory of autobiographical and public events. Arch Gen Psychiatry 2000;57:581-90.
11. Sackeim HA, Prudic J, Devanand DP, et al. Effects of stimulus intensity and electrode placement on the efficacy and cognitive effects of electroconvulsive therapy. N Engl J Med 1993;328:839-46.
12. Coleman EA, Sackeim HA, Prudic J, et al. Subjective memory complaints before and after electroconvulsive therapy. Biol Psychiatry 1996;39:346-56.
Locum Terrans

Dr. Mann looked out the reinforced window at the acutely curving horizon. He saw a vista of lifeless craters under a harsh gray sky. Robotic equipment excavated along the sides of the craters for rare minerals. For about the thousandth time he asked himself what he was doing on this god-forsaken asteroid. He looked down at his scheduling terminal. Three patients were listed on his roster for the day: two burns and a fracture. They were all basic humanoids—what a bore.
When Hugh Mann was hired as a locum, he was excited. He had trained in humanoid medicine as well as xeno-geno-biology. He was in the top half of his class at the University of Ganymede—no easy accomplishment in a galaxy of overachieving life forms. His minority status as a native Terran had helped him get into school, but his sheer determination and long hours had made him successful.
He had served during the Great Rigellian War, followed by 10 solar standard years of private practice on Ios-3. Now he was getting fed up with the assortment of life forms he was treating. Dealing with the usual high platinum levels, impacted crillobars, and tentacular torsion had grown old. Even the few human patients who were grateful for a physician of their own species wasn’t enough to keep him satisfied.
When the invitation to work for Pro Lo—interstellar Locums—arrived on his screen, he was ready for adventure. An asteroid mine in the outer ring of Nebulon sounded exotic. He knew the choice locations went to those doctors who had worked with the company for years, but it was worth the risk. Or so he had thought. The mine colony was dull. There was no nightlife, not even any vaguely humanoid females for recreation. Two more weeks and his three-month tour of duty would be over. It had been at best unexciting, but he had made some serious dinars. Maybe the next assignment would be more interesting.
His self-pity was interrupted by his greatest source of annoyance. It was the pathetic excuse for a robot assistant with which he had been saddled. Some perverse designer had come up with the Old Chap 7. Perhaps the basic model had been a fairly functional assistant—175 years ago. This one had been modified to resemble an old Earth-style English butler, down to the bowler, umbrella (like it ever rained on this rock) and “Cheerio!” vernacular. He shook his head in dismay. The robot looked at him and printed out “Stiff upper lip old bean.” Dr. Mann just groaned. Worse than its pseudo-British façade, the robotic unit was severely out of date. The data banks were loaded with the Annals of Interstellar Medicine for the past 500 years, but nothing for the past three decades. That might be interesting for an archivist, but he had never seen any value in studying history. He’d taken to calling the robot Jeeves.
Dr. Mann looked out the window again at the star-filled sky. Suddenly there was a great flash of light at the horizon line. Alarms started to blare. A message came across the screen. A small asteroid had hit an Imperial transport vehicle. An emergency docking at mine base Nebulon was requested.
The mine’s director, an obstreperous Vegan named Weezul, barged into Dr. Mann’s clinic space, nervously rubbing his furry tentacles.
“Get ready for action,” he bellowed. “We have a VILF coming.”
A very important life form? This was what Dr. Mann had been waiting for. Then the bad news: The vessel had been transporting the Rigellian ambassador. This was bad news on multiple fronts. Dr. Mann had never treated a Rigellian, though he’d seen a lot of them incinerated during the war. They were allies—at least for now.
Dr. Mann called Jeeves over, and they reviewed what information there was about these enormous creatures. The Rigellian races evolved in a low gravity environment and were huge—often 24 meters or longer. They were aquatic and had two lower limbs and four upper. They had a circulatory system with a carbon monoxide-based metabolism and some strange religious beliefs about modern medicine.
The damaged ship’s lifeboat landed with two passengers—the captain and the Rigellian ambassador himself—as well as an entourage of support, translator, and protocol robots. Talk about extreme VILFs!
The captain’s injury seemed minor. An Iogan, his thick outer cortex had been lacerated. Iogans tend to have an unpleasant personality, and the captain was no exception. His rigid mouth worked to form Lingua words Dr. Mann could understand: “Don’t worry about me you fool, see to the ambassador.” Good advice, coming from a creature that looked like a giant lima bean.
The ambassador lay floating in a large, rapidly improvised tub of clear oil, supporting its large body in the higher artificial gravity of the asteroid. It would take hours to decrease the radial spin of the mine to diminish the gravitational pull to more tolerable levels. The left lower appendage was out of alignment. Donning a somewhat snug space suit, Dr. Mann climbed into the tub. With great difficulty he manipulated the injured limb. To his credit, the ambassador never winced. Dr. Mann had no way to image the limb with its tough cartilage. It would not fit into the mine’s limited scanner facility, and the portable unit would not function in liquid. Using an elastic waterproof wrap he managed to put the limb back into alignment. He hoped it would be sufficient.
Dr. Mann wanted to give the ambassador something for pain. The protocol robot came forward. “Rigellians will accept no medicine that is not derived from their home world.” Dr. Mann never liked to have a patient of any life form in pain, but if the ambassador could stand it, so could he.
Dr. Mann climbed out of the tank and checked on the captain. Jeeves had finished the dressing and had administered Iogian pain medication from stock. “I hope you are not allergic,” Dr. Mann quipped to the captain, who glared in response.
It looked like the emergency was over. Dr. Mann was pleased with himself.
Suddenly, though, things got ugly. It started with the captain. His normally green skin became spotted with blue wheals. It looked like an allergic reaction to the pain medication. Dr. Mann had Jeeves administer Moruvian pineal extract. It usually did the trick on these sentient legumes.
Dr. Mann thought he’d better check the ambassador. When he walked over to the tank something seemed wrong. The injured limb had grown to twice its normal size, and the ambassador seemed to be struggling to respire. A grim realization hit Dr. Mann: A clot had formed in the limb and embolized to the ambassador’s breathing apparatus.
Dr. Mann ran to Jeeves and accessed the medical data banks. There was nothing about the Rigellian coagulation cascade. Jeeves’ bank had only a few vague references to Rigellian physiology. The species refusal to use medication only made things worse. If he did not act quickly his patient might die. And Dr. Mann did not want to be responsible for a resumption of interstellar conflict.
He stared at Jeeves. He had never seen a robot look nervous before, but the Old Chap 7 was showing some odd behavior, taking off his hat and spinning his umbrella. Dr. Mann tried to concentrate. He had Jeeves pull up everything he had on the treatment of embolism. The modern treatment was to inject clot-eating bacteria, modified to the specie. This was out of the question; the nearest xeno-genome lab was two days from the asteroid.
He looked further back in the medical journals. Before bacteria lysis it was Q-beam radiation, and before that mini-robots with lasers. He had no Q-beam facility and rigging up mini-robots with lasers would take at least two days.
Jeeves poked him with his umbrella. What was wrong with the crazy robot? Dr. Mann had gone all the way back to the 20th century looking for an option. Then it hit him. He had read about something called an IVC filter. Perhaps he could fashion something to block the ambassador’s oversize vessel—but what? Jeeves poked him again.
Dr. Mann grabbed the umbrella from the robot and was about to snap it in two when an idea hit him. He pulled the fabric from the metal skeleton, ran to the radiation sterilizer, and sanitized the remains of the umbrella. One hour later it was inserted in the ambassador’s main vessel, ready to catch any further errant clot. Hopefully he’d live until a cruiser with a well-stocked sickbay arrived
Dr. Mann stared at Jeeves. Perhaps he had been wrong about his robot assistant. It had helped save the ambassador. Then Dr. Mann checked the captain, noticing for the first time how ancient the being looked. The captain had worsened acutely, its breathing labored, a sick wheezing sound coming past the rigid fiber that made up the upper part of its mouth.
Dr. Mann grabbed an intubation tube. The captain needed to be on a ventilator. Luckily Dr. Mann had had experience with this type of geriatric vegetable-like creature. He tried three times unsuccessfully, but managed on the fourth to slide the tube pass the rigid maxilla.
Dr. Mann sat on the floor. He was exhausted by the efforts of the day, especially the stressful intubation. Jeeves rolled over to him, and placed his bowler on Dr. Mann’s head. With a sly robotic wink his print out read, “Stiff upper lip, old bean” TH
Jamie Newman, MD, FACP, is the physician editor of The Hospitalist, consultant, Hospital Internal Medicine, and assistant professor of internal medicine and medical history, Mayo Clinic College of Medicine, Rochester, Minn.
Production-Based Compensation for Hospitalists Overlooked Too Often?

Should hospitalists, or doctors in general, be compensated based on their production? This question has received increased attention in the last few years. A major criticism of production-based compensation is that it is essentially a system that pays doctors for doing more, not for doing better. There is a growing interest in shifting at least some of physician (and hospital) compensation to a system based on the quality of care delivered.
At this point it isn’t entirely clear how all of this will play out in the coming years. What is clear is that for the time being the financial health of our practices is very dependent on our production (as well as other factors such as financial support from a hospital). So until Medicare and other payers change their system of physician reimbursement, I think it can be a good idea in many practices for at least some of a hospitalist’s income to be based on production because that helps connect him/her to the economic health of the practice.
In my May 2006 column (p. 50) I suggested that you consider production-based compensation because it can allow you and your partners to take more control of decisions about how hard you want to work and when you want to add additional doctors to your group. Most production-based compensation formulas allow doctors in the same group to work different amounts, such as working a different number of days on the schedule, and carrying different patient loads. In contrast, groups in which the hospitalists have a fixed salary (or one with a very small production-based component) usually require the doctors to work the same number of days on the schedule, and try to ensure all doctors have similar daily patient load.
When I discuss this idea with hospitalists around the country they often express concern that it would be too risky to go on a production-based salary system. They say things like, “I can’t go on production because I can’t control how many patients are referred to our practice.”
While it’s true that we have little control over patient volume from one day to the next, we have significant control over volume for any lengthy interval such as a year. If you provide good service to referring doctors and usually accept referrals graciously you will have a much higher volume than if you regularly resist referrals.
And I’ll bet that the majority of the other doctors at your hospital can’t precisely control their patient volume, but their compensation is based entirely on individual production. This is true of many emergency department and radiology practices, and some medical subspecialty groups. Why should hospitalist practice be different?
Another misconception about production-based compensation is that it is synonymous with foregoing any financial support from your hospital or other sponsoring institution. It isn’t. You can still pay individual doctors on productivity and include financial support from the hospital. For example, if the doctors are paid $55 for every wRVU generated, then $40 of that might come from professional fee collections, and $15 from the hospital (employer).
Others fear that a salary based on production will cause doctors to work at unreasonably high workloads, leading to poor patient care or patient satisfaction, or less efficient use of hospital resources (e.g., keep patients in the hospital longer). This is a potential risk, but not a common problem in my experience. There can also be concern that compensation based on productivity will cause the doctors within a group to compete with one another for patients (and income), leading to stress within the group. This is an uncommon problem, and—if it occurs within your group—it probably means that there are too many doctors in your practice (or that you should market the practice to attract more patients) rather than proving that productivity-based compensation is a bad idea.
But an explanation that clarifies objections to productivity-based compensation certainly isn’t enough of a reason to support it. You need to be convinced of some of its benefits. Hospitalists who aren’t used to being paid based in part or in whole on production tend to see it as a very stressful—or even oppressive—way to be paid. But I hope to convince you it is actually liberating.
In the absence of a production component, many groups try hard to ensure that every doctor works the same amount. For example, a group that pays a fixed annual salary to all doctors typically encourages or insists that each doctor must work almost the same amount. But when paid on production, each doctor in the group can, within reasonable boundaries, decide how much he or she wants to work. Of course all of the group’s work must be taken care of, but in nearly every group some doctors are probably willing to work a little more and others a little less than the average workload for the group.
Nearly 15 years ago, before I married and had children, I got hooked on the idea of learning to fly airplanes. Wow, did I enjoy it. But it is pretty time consuming to get a pilot’s license, to say nothing of the expense. There were a number of days that I was to be the admitting doctor for our practice, but great weather and an available plane and instructor would lure me away. On a number of occasions at 4 or 5 p.m. I called my partner who had gone home for the day and said, “Chuck, would you be willing to cover admissions so I can go flying?” He usually said “sure,” at which point I’d tell him that there were already two patients waiting in the ED.
This system made both of us happy. After nine months I was a licensed pilot and for that year my partner had a much higher income than I did. We both got what we wanted, and paying ourselves on production is what made this possible. If we were in a group with a fixed salary I can’t imagine he would have been willing to help me out so often (if ever), and I would have been limited to taking flying lessons only on my days off. Or I would have needed to pay my partner back by making up the evenings he covered for me.
My point in telling this story is that so many people think of paying hospitalists based entirely, or in part, on production is just a way to get them to maintain unreasonably high work loads. But I think it simply liberates the doctor to decide for himself what the right workload is, while owning the economic consequences of that choice. It allowed me the opportunity to work less.
A few hospitalists paid on production might choose badly and choose to work at an unreasonable (or unsafe) pace, but nearly all will make reasonable decisions. And members of a group can periodically adjust their workload up or down according to their need at the time; there is no requirement to work at the same load year after year. In fact, my partners and I in Florida didn’t even keep track of precisely how often each of us was on call over the year because there wasn’t any reason it needed to be the same for each person. (We did make some effort to distribute call evenly, but didn’t worry when it never worked out just right because each doctor could take more or less call and see a corresponding change in income).
I realize that there is no perfect compensation system, and one based on production can have shortcomings. But I think too many hospitalists assume the only reasonable system is one such as a fixed annual salary, or an hourly rate, or some method that intentionally avoids paying for productivity. You should think about how liberating productivity compensation can be. Basing a significant portion (say 40% or more—or even 100%) on productivity might be a good idea for you.
And there is nothing about productivity-based compensation that interferes with also providing financial reward for good quality of care. I’m a fan of both. If payers increasingly use quality of care as the basis for physician reimbursement in the future, individual physician compensation formulas should be based more on quality than production. TH
Dr. Nelson has been a practicing hospitalist since 1988 and is a co-founder and past-president of SHM. He is a principal in Nelson/Flores Associates, a national hospitalist practice management consulting firm. This column represents his views and is not intended to reflect an official position of SHM.
Pediatric Special Section
Meningococcal Disease in Peds
By J. Christopher Day, MD
Thompson, MJ, Ninis N, Perera R, et al. Clinical recognition of meningococcal disease in children and adolescents. Lancet. 2006 Feb 6;367(9508)397-403.
Data from medical records and parental questionnaires were examined to determine the time course and prevalence of signs and symptoms in meningococcal disease (sepsis and meningitis) in 448 children in Wales, England, and Northern Ireland.
The authors note that classic clinical features of the disease appear late in the illness. The symptoms that appear earliest (fever, poor feeding, nausea, vomiting, coryza, sore throat) are very non-specific, but somewhat later symptoms of sepsis including leg pains, cold hands and feet, and abnormal skin color appear before the classical clinical features in 72% of the children studied. The authors hope that recognition of these features can lead to earlier diagnosis and treatment of this severe disease.
Treatment of Infant Botulism
Arnon SS, Schechter R, Maslanka SE, et al. Human botulism immune globulin for the treatment of infant botulism. N Engl J Med. 2006 Feb 2;354((5):462-471.
This is is a report of a randomized, double-blind, placebo controlled trial of the use of human botulism immune globulin intravenous (BIG-IV) used for the treatment of infant botulism. The study was performed on 122 infants with (initially) suspected and (later) laboratory confirmed infant botulism. BIG-IV was given within three days of hospital admission. The authors also performed an open-label study of 382 laboratory confirmed cases. Some of these began treatment as late as 18 days after hospital admission.
In the randomized trial, outcomes compared with placebo included a reduction in hospital stay from 5.7 weeks to 2.6 weeks (P<0.001); a reduction in the mean duration of intensive care by 3.2 weeks (P<0.001); the mean duration of mechanical ventilation by 2.6 weeks (P= 0.01); the mean duration of tube or intravenous feeding by 6.4 weeks; and the mean hospital charges per patient by $88,600 (P<0.001).
The only notable adverse event perhaps related to treatment was a transient blush-like erythematous rash. In the open-label study, treatment given within three days of hospital admission shortened the mean length of stay by approximately one week more than did treatment given four to seven days after admission. BIG-IV is now licensed as BabyBIG. The authors recommend treatment as soon as possible after hospital admission.—JCD
Eczema: Wet Wraps Versus Conventional Treatment
Hindley D, Galloway G, Murray J, et al. A randomised study of “wet wraps” versus conventional treatment for atopic eczema. Arch Dis Child. 2006 Feb;91(2):164-168.
The authors were interested in comparing the efficacy and parent perception of ease of application of conventional treatment (emulsifying ointments and topical steroids) with wet wraps (tubular retention bandages applied wet as occlusive dressings over emulsifying ointments) and topical steroids for exacerbations of eczema.
Fifty children were enrolled and randomized to either treatment group. Treatment was continued and patients were followed for one month. The change in eczema severity was scored using a previously published scale (SCORAD) for assessing severity. No differences were noted between the two groups, though the study had a number of limitations including use of only one potency of steroid (1% hydrocortisone) limiting generalizability, the length of treatment (regimens vary in length), and patient drop-outs (five dropped out—all in the wet wrap group).
Parents felt wet wraps were harder to use. The authors do note that there may be clinical situations (they mention short term treatment of acute erythrodermic eczema) where wet wraps are a useful option. There appear to be no advantages in the group studied over a four-week period and the disadvantages likely include parental perception of difficulty of use and a possibility of increased skin infections.—JCD
A Study of Dehydrated Peds
Mallory MD, Kadish H, Zebrack M, Nelson D. Use of a pediatric observation unit for treatment of children with dehydration caused by gastroenteritis. Pediatr Emerg Care. 2006 Jan;22(1):1-6.
A case-control study was performed to examine 467 admissions to an observation unit in patients with dehydration from vomiting or diarrhea from presumed gastroenteritis. Patients were presumably admitted to the observation unit (staffed by emergency department personnel) if they were believed to require more rehydration than could be reasonably offered in the emergency department itself.
Controls were defined as those patients able to be discharged home from the observation unit within 24 hours and cases as those patients that required subsequent inpatient admission. Nineteen percent of the patients studied required inpatient admission.
One of the goals of the study was to determine variables useful in distinguishing patients who would require subsequent inpatient admission from those who would be discharged home from the observation unit. No such variables were found.
Variables studied included oral intake prior to presentation, urine output at presentation, symptoms at presentation (vomiting versus diarrhea versus both), predominant symptoms (vomiting versus diarrhea versus no predominance), duration of symptoms, abdomen tender to palpation (yes/no), previous visit within five days (yes/no), age, vital signs, bicarbonate levels, and mean sodium levels.—JCD
Routine Neuroimaging: Little Value When Evaluating Febrile Seizures
By Stevie Wilson, RN, CPNP
Teng D, Dayan P, Tyler S, et al. Risk of intracranial pathologic conditions requiring emergency intervention after a first complex febrile seizure episode among children. Pediatrics. 2006;117(2):304-308.
Febrile seizures occur in up to 5% of all children. One-third of febrile seizures are classified as complex (i.e., having multiple seizures, prolonged duration, or focal seizures). Complex febrile seizures have been associated with an increased risk of recurrent febrile seizures and epilepsy. However, they have not been associated with pathologic intracranial lesions that require emergency surgical intervention.
Previous studies suggest that intracranial abnormalities are rare among simple febrile seizures. The American Academy of Pediatrics (AAP) recommends against the use of neuroimaging with simple seizures, however, practice guidelines for emergency neuroimaging for complex seizures do not exist. The objective of this study was to determine the likelihood of a significant intracranial condition requiring emergency intervention in children with the first complex febrile seizure.
A retrospective review of prospectively collected data was performed for 71 children who presented to the pediatric emergency department after a first complex febrile seizure. None of the 71 patients had a pathologic intracranial lesion that required emergency intervention. The authors therefore concluded that the risk of pathologic intracranial conditions requiring emergency intervention is low, suggesting that routine emergency neuroimaging for this population is unnecessary.
Managing Bronchiolitis above Sea Level
Choudhuri JA, Ogden LG, Ruttenber JA, et al. Effect of altitude on hospitalizations for respiratory syncytial virus infection. Pediatrics. 2006;117(2):349-356.
This interesting study sought to evaluate the effect altitude has on hospitalizations for RSV infection. A multivariate analysis was obtained and suggests that the rate of hospitalization for RSV increased by 25% among infants who were younger than one year of age for every 1,000 meters of altitude. The risk of RSV-associated hospitalization was highest at elevations above 2,500 meters.—SW
Dilemmas for Wheezing Peds
By Chris Miller, MD
Oymar K, Halvorsen T, Aksnes L. Mast cell activation and leukotriene secretion in wheezing infants. Relation to respiratory syncytial virus and outcome. Pediatr Allergy Immunol. 2006 Feb;17(1):37-42.
The wheezing infant is a common problem in pediatric medicine; however, the long-term outcome and risk for recurrent wheezing remains unclear. The authors of this study assert that the risk for recurrent wheezing may be related to the type of inflammation and specific underlying virus during the initial wheezing episode.
Several studies have evaluated the specific contribution of eosinophils to respiratory inflammation in the wheezing child. These studies have found that eosinophilic inflammation may play a role in the airway hyper-reactivity in a child with persistent wheezing. Conversely, little information is available regarding mast cell involvement. This prospective study was designed to assess mast cell activation, in relation to respiratory syncytial virus (RSV) infection and persistent wheezing in wheezing infants.
Researchers enrolled 106 wheezing infants who were subsequently admitted to the hospital. None of these infants had a prior history of wheezing. Infants with prior history of atopic disease, lung disease, or signs of bacterial infection were excluded. RSV testing of nasopharyngeal mucous was performed. Sixty-seven (63%) of the wheezing infants had RSV. An additional 23 healthy infants were selected as controls.
To assess the extent of mast cell activation, urinary prostaglandin F2 (U-PGF2) was measured. To assess for leukotriene secretion urinary leukotriene 4 (U-LTE4) was measured. To evaluate for persistence or reoccurrence of wheezing, a 20-month post-hospitalization follow-up was done. One hundred and three (97%) of the previously hospitalized wheezing infants were available for the follow-up.
The authors used the term “persistent wheezing” to describe those children who experienced at least three wheezing episodes including the first hospitalization. These recurrences were identified either by parental report utilizing a standardized questionnaire or physician/hospitalization records. The remaining children were considered “transient wheezers.”
Review of the data regarding U-PGF2, a specific marker for mast cell activation, showed U-PGF2 to be greatest in the RSV positive patients, followed by the RSV negative patients and finally by the control group. U-LTE4, and thus leukotriene involvement, was also found to be significantly elevated in both the RSV positive and negative wheezing infants compared with the controls. No significant difference was found in U-LTE4 between RSV-positive infants and RSV-negative infants. The transient wheezing infant had a higher U-PGF2 than the persistent wheezing infant. Transient wheezers also had a higher U-LTE4 compared with persistent wheezers, although this was not statistically significant.
With univariate regression analysis positive predictive factors for persistent wheezing included increasing age, RSV negative disease, parental atopy, and male gender. Negative predictive factors for persistent wheezing included an elevated U-PGF2 level.
In discussion the authors conclude that mast cell activation and leukotriene secretion is present in a wheezing infant as noted by increased U-PGF2 and U-LTE4 levels, respectively. Higher U-PGF2 levels in RSV-positive patients indicates that mast cell activation may play a bigger part in the inflammatory process of RSV-induced wheezing compared with non-RSV induced wheezing. Leukotrienes appear to be involved in both RSV and non-RSV wheezing infants. Despite these results, mast cell activation and leukotriene secretion do not appear to be associated with persistent wheezing.
Limitations of this interesting study include the small sample size, apparent lack of follow-up with the control patients, and the diagnosis of recurrent wheezing episodes being characterized by the parents.
Influenza Pneumonia in Pediatric Patients
Lahti E, Peltola V, Virkki R, et al. Influenza pneumonia. Pediatr Infect Dis J. 2006 Feb;25(2):160-164.
Influenza and pneumonia are common in children. The objective of this study was to describe the frequency and characteristics of laboratory-documented and radiographically proven influenza-associated pneumonia in children.
This retrospective, single site study was conducted at Turku University Hospital (Finland). Chart reviews of both inpatient and outpatient visits of children younger than 16 were performed for a 24-year period between 1980 through 2003. Children with influenza A or B antigen detected nasopharyngeal aspirates were identified. Also children with chest radiographs obtained during their influenza infection were identified. Clinical findings upon initial presentation were summarized, in addition to laboratory values for white blood cell count (WBC) and C-reactive protein (CRP).
A total of 936 patients with virologically confirmed influenza were identified. Of this total, 79% had influenza A and the remaining had influenza B. Chest radiographs were reported on 400 (43%) of these patients. Of the 400 films, 228 were initially read as having infiltrates. However, during over-reading of the films 70 chest radiographs did not have an infiltrate and an additional 24 films could not be found. In summary, 134 children had both confirmed influenza and radiographically proven pneumonia. Thus 14% of the children with influenza who also had a chest radiograph had pneumonia.
Clinical findings of the 134 patients with influenza and pneumonia were similar among those with influenza A or B. The most common symptoms were fever (98%), cough (84%), and rhinorrhea (65%). The classical findings of headaches and myalgias were difficult to uncover due to the young age of the patients (median age 2.2 years). Of the 134 identified patients with influenza and pneumonia only 27% presented with dyspnea and 22% with tachypnea. Crackles were heard in 22%, rhonchi in 43%, and decreased breath sounds in 10%. No abnormal auscultation findings were found in 32% of the children. Sixty-eight percent of the study population was admitted to the hospital. The rate of hospitalization was greater for the younger patients. One-third of the patients had received antibiotics prior to enrollment, and 80% of the children received antibiotics during the hospitalization or at time of discharge. Four children required ventilator therapy. One patient with muscular dystrophy died of severe pneumonia.
Laboratory assessment found that 89% of the children had WBC less than 15 x 109/liter. CRP values were normal or only slightly increased in 55% of the children. Three children (2%) had laboratory-documented concomitant bacterial infections. Of these three cases two were due to bacteremia and one to a positive tracheal aspirate. Five children (7%) had double viral infections.
In this hospital-based study 14% of the patients with influenza had radiographically proven pneumonia. The authors found that in contrast with what we know about adults with influenza pneumonia, data shows influenza pneumonia in children is generally a benign disease. The greater burden of disease tends to be in the children younger than three years of age. Respiratory clinical findings may be absent in light of radiographically proven pneumonia. Laboratory findings show that most children with influenza pneumonia have normal WBC counts and normal to only slightly elevated CRP levels.
Shortcomings of this informative study include the lack of direct evidence in proving that the presence of influenza in the upper respiratory tract is directly associated with the infiltrate of the lower respiratory tract. The data may also be skewed because fewer than one-half of the patients with influenza had chest radiographs. The authors’ conclusions demonstrated that clinical findings did not correlate well with radiographically proven infiltrates.—CM
Bradycardia During Methadone Therapy in an Infant
By Lisa Carney, MD
Wheeler AD, Tobias JD. Bradycardia during methadone therapy in an infant. Pediatr Crit Care Med. 2006;7(1):83-85.
This retrospective case report demonstrates the occurrence of bradycardia associated with the use of methadone administered to prevent withdrawal in an infant with physical tolerance following long-term opioid therapy in the PICU setting.
The authors describe the onset of sinus bradycardia in an infant following the initiation of methadone therapy as a transition for intravenous fentanyl administration. The onset of bradycardia was temporally related to standard doses of methadone. These episodes resolved with tactile stimulation. No other pathologic conditions were noted that could have been responsible for the bradycardia. Additionally, the episodes resolved with cessation of methadone therapy. It is unlikely that the bradycardia was merely a manifestation of deep sedation with methadone because the infant’s sedation scores were the same as when he had been receiving fentanyl, a time during which no bradycardia was noted.
When administering opioids, the clinician generally focuses on adverse effects such as respiratory depression, slowing of gastrointestinal motility, and physical dependence. But because methadone’s three-dimensional structure shares similarities with calcium channel antagonists, bradycardia may occur—especially at higher doses. This effect has been reported in the adult literature; however, this is the first report in an infant.
As pediatric hospitalists, we may receive a patient in transfer from the PICU who was recently started on methadone therapy. Given the relatively high frequency of this scenario, it is unclear why bradycardia has not been previously reported in the pediatric population. It may be that the effect was not attributed to methadone and in the majority of cases the slowing of the heart rate was likely to have been innocuous from a physiologic standpoint. What may be more significant is the unnecessary investigation into the etiology of the bradycardia if its relationship to methadone is not appreciated. However, there may be a subset of patients who will not tolerate the bradycardia. Thus, close monitoring is suggested during methadone therapy.
Innoculation Conundrums
Halperin SA, Sweet L, Baxendale D, et al. How soon after a prior tetanus-diphtheria vaccination can one give adult formulation tetanus-diphtheria-acellular pertussis vaccine? Pediatr Infect Dis J. 2006 Mar;25(3):195-200.
Adult tetanus/diphtheria toxoids and acellular pertussis vaccines (Tdap) have been developed to prevent pertussis in adolescents and adults. There are concerns that unacceptable rates of severe injection site reactions, including Arthus-type reactions might occur if Tdap is administered too soon after a previous tetanus/diphtheria toxoid vaccine, such as TD or Td.
This study was conducted via a school-based program where more than 7,000 children/adolescents in grades three-12 were enrolled. These students received Tdap vaccine at intervals from previous vaccination with TD or Td of either 18 months-nine years or greater than/equal to 10 years. The 18 month-nine year interval was further divided into eight cohorts. One cohort per year two to nine (+/- 0.5 years) since receipt of the last TD/Td. Approximately 85% of the students provided accurate documentation of adverse events. There were no serious/major adverse events. There were no differences in reports of fever. Injection site erythema and swelling were slightly and statistically significantly increased with those participants with the most recent prior TD/Td. The increase in these localized injection site events ranged from 3.75%-10.3%.
In summary, although there is a slight increase in injection site events with decreasing interval since a previous immunization, Tdap can be safely administered at intervals of greater than or equal to 18 months since a previous TD/Td vaccine.—LC
Viral Occurrences in Young Children
Wolf DG, Greenberg D, Kalkstein D, et al. Comparison of human metapneumovirus, respiratory syncytial virus and influenza A virus lower respiratory tract infections in hospitalized young children. Pediatr Infect Dis J. 2006;25(4):320-324.
The authors compared the clinical and demographic features of children with lower respiratory tract infection (LRI) caused by human metapneumovirus (HMPV), respiratory syncytial virus (RSV), and influenza A virus and sought to determine whether coinfection by HMPV and other respiratory viruses leads to increased disease severity.
This prospective study enrolled 516 children <5 years old who were admitted with LRI at the Soroka University Medical Center in Israel during a one-year period from November 2001 through October 2002. At least one virus was detected in 57% of the enrolled patients.
Of those 293 patients, the viral breakdown was as follows: HMPV (13%), RSV (20%), influenza A (15%), parainfluenza (7%), and adenovirus (2%). The seasonal distribution of HMPV infections resembled those of RSV and influenza with peak incidence between November and March. Twenty-four percent of the HMPV children had co-infections with other respiratory viruses, most commonly RSV.
HMPV patients were older than RSV patients (17.6 +/- 16.8 months versus 10.5 +/- 11.8 months). HMPV was associated with wheezing and hypoxemia at a rate similar to that of RSV and higher than that of influenza A. Atelectasis was more common among HMPV (40%) than among RSV and influenza patients (13%). HMPV was more often associated with a diagnosis of pneumonia than RSV and influenza. HMPV was also more often associated with a diagnosis of asthma and less often with a diagnosis of bronchiolitis than RSV, even when corrected for age. Children who had a co-infection with HMPV had a higher rate of gastrointestinal symptoms but did not show a more severe respiratory picture.
In conclusion, the clinical pattern of HMPV (wheezing, hypoxemia) more closely resembles that of RSV than that of influenza A LRI. Additionally, there was no difference in disease severity between children with HMPV and RSV infection. However, the differences in age, radiographic findings, and clinical diagnosis suggest that HMPV pathogenesis may differ from that of RSV.—LC
Kawasaki Disease in Infants Younger Than Six Months
By Judith Waldman, DO
Chang FY, Hwang B, Chen SJ, et al. Characteristics of Kawasaki disease in infants younger than six months of age. Pediatr Infect Dis J. 2006 Mar;25(3):241-244.
Pi-Chang Lee, MD, and colleagues compared the clinical manifestations, laboratory results, echocardiographic findings, treatment, and outcome between two groups of patients hospitalized with Kawasaki disease. Group one consisted of 20 patients younger than six months. Group two consisted of 100 patients older than six months. The data was collected by chart review.
Researchers found that the time from onset of disease to diagnosis was longer in infants younger than six months. Patients less than six months of age had a higher incidence of incomplete Kawasaki disease. A presentation of full diagnostic criteria within 10 days occurred more frequently in patients greater than six months of age. There was no significant difference in major clinical manifestations between the two groups. However, the frequency of gallbladder hydrops was higher in patients older than six months of age.
Group one had higher white blood cell counts, platelet counts, and triglyceride concentrations and lower hemoglobin values. Group one had higher incidence of coronary involvement, including irregular surface and/or perivascular brightness of coronary artery wall, coronary dilatation, and aneurysm formation. There was no significant difference in giant aneurysm formation between the two groups. Group one had a higher incidence of pericardial effusion and tricuspid regurgitation/mitral regurgitation. Fewer patients received IVIG within 10 days in the younger age group. Diagnostic delay and incomplete presentation postponed IVIG in the patients less than six months of age.
New recommendations pertaining to the diagnosis and treatment of Kawasaki disease in the American Academy of Pediatric’s Red Book in 2006 should be beneficial in making a more rapid diagnosis and thus more timely treatment. In the past, diagnosis of Kawasaki required five full days of fever. Now, IVIG can be started after four days of fever if the patient meets four out of the five total criteria for disease. In cases of incomplete Kawasaki disease, physicians should base diagnosis and treatment on laboratory test results instead of visible symptoms. Obtain a baseline echo as usual. The laboratory criteria are albumin 3 g/dL or less, anemia, high alanine amino transferase, platelets after 7 days to 450,000/mm3 or greater, WBC count is 15,000 mm3 or greater, and urine 10 WBC/high powered field or greater. For patients who do not respond to 2g/kg of IVIG, the new recommendation is to retreat these patients with another 2g/kg of IVIG or use pulse steroid therapy. Look for these recommendations in the new 2006 Red Book. TH
A Program in Transition
We work best when we remember who hired us and why. As hospital medicine matures, the goals of those who write the paychecks will continue to shape programs, even when this basic economic truth may be obscured by a program’s fast growth. That is why the 10 hospitalists at Nashua-based Southern New Hampshire Medical Center (SNHMC) work differently than their peers in other systems. They are employed by a unique joint venture of New Hampshire’s two largest multispecialty medical groups: Foundation Medical Partners of Nashua and Lebanon-based Dartmouth-Hitchcock.

Population Growth
The SNHMC hospital medicine group filled a definite need. As Tom Wilhelmson, SNHMC’s CEO and president explains it, Nashua’s population has grown tremendously—25% in the 1980s and an additional 14% in the 1990s—thanks to an influx of young families and industries relocating to business-friendly New Hampshire. During the growth spurt the area needed doctors—particularly primary care physicians. To attract physicians, in 1992 the hospital helped form Foundation Medical Partners (FMP), a large multispecialty group. Based on a private practice model, FMP physicians now cover 22 suburbs in the primary and nine in secondary service areas that serve 225,000 people. SNHMC is FMP’s safety net, negotiating malpractice rates, giving physicians access to capital, and helping with cash flow when a big payer is slow.
The hospital and FMP grew steadily, boosting hospital market share from 40% in the 1980s to 62% today. Michael Marshall, MD, medical director of the 134-physician FMP, saw it thrive.
“We were opening offices farther and farther from the hospital,” he recalls. “In 2002, when doctors’ drive times exceeded 30 minutes, we realized that hospitalists could relieve primary care doctors from hospital work.”
Issues, Options, and Resolutions
SNHMC and FMP considered these options for starting a hospitalist program:
Issue: Starting a hospitalist program from scratch.
Options:
- Hire them as hospital employees;
- Contract with a regional or national hospitalist company;
- Encourage formation of a hospital medicine group;
- Worry about Dartmouth-Hitchcock starting a program; or
- Make hospitalists FMP partners.
Resolution: Hospitalists would be FMP partners; therefore, approach Dartmouth-Hitchcock about a joint venture hospitalist program.
At the time, Dartmouth-Hitchcock, New Hampshire’s only academic medical center and FMP’s chief competition had made significant inroads in Nashua. Dartmouth-Hitchcock embraced the joint venture along with an even split of any necessary subsidies. In 2003 Wilhelmson and Dr. Marshall hired Stewart Fulton, DO, and a second career physician straight from residency, as their hospitalist medical director.
Dr. Fulton was the solo hospitalist and had a goal of assuming hospital duties for 20+ family care physicians in his first year:
Issue: Freeing a large number of primary care physicians from hospital rounds.
Specific problems:
- Dr. Fulton’s pager went off incessantly;
- He was inundated with work;
- He routinely worked 12-hour days and longer; and
- Many FMP physicians still made hospital rounds and covered call to handle patient volume.
Resolution: Hire more hospitalists.
Suneetha Kammila, MD, straight out of residency, became FMP’s second hospitalist. “All was chaos,” recalls Dr. Kammila. “The hospital was very busy; there was no proper system to get the census or see lab work; and we ran from floor to floor. I stayed because Stewart [Fulton] and I worked well together, and I thought we’d eventually succeed.”
Issue: Adding a second hospitalist.
Potential results:
- Hospitalists could see more patients;
- Inadequate systems could not be changed this soon;
- Specialists could be enlisted to deal with the volume of patients.
Resolution: Hire more hospitalists.
Soon after Dr. Kammila’s arrival, FMP added a third hospitalist who didn’t gel. “We increased our patient volume, but the third hire wasn’t a good communicator and didn’t fit. I couldn’t leave the hospital until 8 p.m. most days and I was exhausted,” says Dr. Fulton.
Joohahn John Kim, MD, became the replacement third hospitalist and meshed with Drs. Fulton and Kammila. Soon two additional hospitalists came on board. Eighteen months into the program, there were five hospitalists—a critical mass.
Issue: Growing the hospitalist group to critical mass and beyond.
Results:
- More bodies enabled hospitalists to have defined shifts;
- The laid-back personalities of the hospitalists emerged, and they forged a strong collegiality;
- They covered several more office practices;
- They began to interact more with other hospitalists and less with specialists;
- The groundwork was set for more growth; and
- Growth to 10 hospitalists would enable the seven on/seven off coverage that everyone wanted.
Doubling the number of hospitalists so quickly raised new issues. Divided into two teams of five, each group had little contact with the other team or with their FMP partners. To bridge the divide, shortly after the hospitalist cadre grew to 10, administrators threw an after-hours cocktail party for medical staff to build camaraderie among all FMP physicians.
Issue: Communication and continuity of care were not optimal.
Specific problems:
- The two hospitalist teams didn’t work together;
- Hospitalists and their office-based colleagues didn’t know each other;
- Productivity needed to be discussed; and
- Some long-term patients were unhappy about being treated by hospitalists rather than their primary physicians.
Resolution: More networking events to bring physicians together, along with daily e-mails from hospitalists to primary care physicians.
More contact among physicians revealed other issues. Terry Buchanan, MD, an FMP family practice physician whose three-provider office is several miles from SNHMC, is relieved that hospitalists freed him from hospital work. However, he says, “Not having hospital work gives a better quality of life, but we’ve lost income [from hospitalized patients] that we’re expected to recover with more outpatients.”
Another concern is losing clinical skills associated with acute care. “I don’t feel I’d be as marketable if I wanted a career change,” he adds.
Unique Metrics
No matter what the yardstick, measuring a hospital medicine program’s value is tough, particularly one transitioning to 24/7 coverage. Still, the familiar metrics of reducing average length of stay (ALOS), cutting costs, and quality improvement are not SNHMC’s ultimate gauge. In fact, ALOS has increased, from 4.15 days in 2004 to 4.26 days in 2005. Yet FMP and Dartmouth-Hitchcock gladly continue underwriting the gap between hospitalist compensation and revenues—a gap of about $30,000 per capita annually.
Issue: Customary hospitalist metrics are not the sole drivers at SNHMC.
Specific problems:
- Average length of stay was up;
- Cost cutting was not a predominant metric;
- Volume and productivity were not chief metrics; and
- Joint venture partners continued to subsidize the hospitalist program.
Resolution: The medical groups continue to support the hospitalist program as it adjusts to 24/7, with a commitment to add four more hospitalists.
Downplaying customary metrics doesn’t mean that SNHMC’s hospitalists don’t compare favorably with their peers. They do. On CMS core measures for four congestive heart failure indicators, SNHMC outperforms its state counterparts by 73% versus 65%; on community-acquired pneumonia guidelines by 54%-46%; and on surgical infection prevention by 64%-53%. Only on the six benchmarks for treating myocardial infarction does SNHMC fall short, by 85% to the 89 for other New Hampshire hospitals.
The Growth Conundrum
Moving to 24/7 coverage has challenged SNHMC, as it has other hospitalist programs. Dead time at night, when the ED and hospital floors fall silent, has to be paid for. So do the peaks and valleys of patient load.
Issue: Patient load variability makes hospitalist programs costly.
Specific Problems:
- Admissions and discharges can bunch and create bottlenecks; and
- Hospitalists are too busy at times and not seeing enough patients at other times.

Resolution: For SNHMC, examine possible response to variability, including:
- Hire/redeploy nurses and/or secretaries for discharge paperwork;
- Create a four-hour chest pain unit staffed by physician assistants;
- Re-examine seven on/seven off staffing. Does another model work better?
- Create a convenient care center separate from the ED;
- Hire moonlighters for night shifts;
- Serve more referring physicians to boost productivity; and/or
- Enlist pulmonologists to assist with ED surges.
Having peeked beneath the surface of SNHMC’s hospitalist program’s performance what lies at the heart of its success—or of its failure? By conventional vision, it’s curious; ALOS actually increased, 30+ internists still cover their hospitalized patients, admissions peaks and valleys, and program subsidies for the foreseeable future.
None of that fazes Sue DeSocio, FMP’s president and COO, who laments the dearth of benchmarking tools that accurately reflect the impact of hospitalist programs.
“At the beginning, we were sure we had everything down pat. We’d keep the hospitalists very busy and with a complement of four, we’d break even. Not even close,” she says. But she judges the program a success, as do Dr. Marshall and Wilhelmson, because it addressed FMP’s family practice physicians’ need to focus on their outpatient practices and avoid hospital work.
Patient satisfaction and hospitalist job satisfaction are high and RN turnover is nearly 12% lower than other New Hampshire hospitals. SNHMC avoided a hospitalist turf war with a successful joint venture with its chief competitor, and, perhaps most importantly, incorporated the hospitalists into FMP’s multi-specialty practice rather than taking the easy way out with outside contracting. Or you check with Drs. Fulton and Kammila, who plunged into the chaos of a start-up, worked impossibly long days, and are still there today because they believe in how they’re practicing medicine. TH
Marlene Piturro regularly writes “Practice Profiles” for The Hospitalist.
We work best when we remember who hired us and why. As hospital medicine matures, the goals of those who write the paychecks will continue to shape programs, even when this basic economic truth may be obscured by a program’s fast growth. That is why the 10 hospitalists at Nashua-based Southern New Hampshire Medical Center (SNHMC) work differently than their peers in other systems. They are employed by a unique joint venture of New Hampshire’s two largest multispecialty medical groups: Foundation Medical Partners of Nashua and Lebanon-based Dartmouth-Hitchcock.
Population Growth
The SNHMC hospital medicine group filled a definite need. As Tom Wilhelmson, SNHMC’s CEO and president explains it, Nashua’s population has grown tremendously—25% in the 1980s and an additional 14% in the 1990s—thanks to an influx of young families and industries relocating to business-friendly New Hampshire. During the growth spurt the area needed doctors—particularly primary care physicians. To attract physicians, in 1992 the hospital helped form Foundation Medical Partners (FMP), a large multispecialty group. Based on a private practice model, FMP physicians now cover 22 suburbs in the primary and nine in secondary service areas that serve 225,000 people. SNHMC is FMP’s safety net, negotiating malpractice rates, giving physicians access to capital, and helping with cash flow when a big payer is slow.
The hospital and FMP grew steadily, boosting hospital market share from 40% in the 1980s to 62% today. Michael Marshall, MD, medical director of the 134-physician FMP, saw it thrive.
“We were opening offices farther and farther from the hospital,” he recalls. “In 2002, when doctors’ drive times exceeded 30 minutes, we realized that hospitalists could relieve primary care doctors from hospital work.”
Issues, Options, and Resolutions
SNHMC and FMP considered these options for starting a hospitalist program:
Issue: Starting a hospitalist program from scratch.
Options:
- Hire them as hospital employees;
- Contract with a regional or national hospitalist company;
- Encourage formation of a hospital medicine group;
- Worry about Dartmouth-Hitchcock starting a program; or
- Make hospitalists FMP partners.
Resolution: Hospitalists would be FMP partners; therefore, approach Dartmouth-Hitchcock about a joint venture hospitalist program.
At the time, Dartmouth-Hitchcock, New Hampshire’s only academic medical center and FMP’s chief competition had made significant inroads in Nashua. Dartmouth-Hitchcock embraced the joint venture along with an even split of any necessary subsidies. In 2003 Wilhelmson and Dr. Marshall hired Stewart Fulton, DO, and a second career physician straight from residency, as their hospitalist medical director.
Dr. Fulton was the solo hospitalist and had a goal of assuming hospital duties for 20+ family care physicians in his first year:
Issue: Freeing a large number of primary care physicians from hospital rounds.
Specific problems:
- Dr. Fulton’s pager went off incessantly;
- He was inundated with work;
- He routinely worked 12-hour days and longer; and
- Many FMP physicians still made hospital rounds and covered call to handle patient volume.
Resolution: Hire more hospitalists.
Suneetha Kammila, MD, straight out of residency, became FMP’s second hospitalist. “All was chaos,” recalls Dr. Kammila. “The hospital was very busy; there was no proper system to get the census or see lab work; and we ran from floor to floor. I stayed because Stewart [Fulton] and I worked well together, and I thought we’d eventually succeed.”
Issue: Adding a second hospitalist.
Potential results:
- Hospitalists could see more patients;
- Inadequate systems could not be changed this soon;
- Specialists could be enlisted to deal with the volume of patients.
Resolution: Hire more hospitalists.
Soon after Dr. Kammila’s arrival, FMP added a third hospitalist who didn’t gel. “We increased our patient volume, but the third hire wasn’t a good communicator and didn’t fit. I couldn’t leave the hospital until 8 p.m. most days and I was exhausted,” says Dr. Fulton.
Joohahn John Kim, MD, became the replacement third hospitalist and meshed with Drs. Fulton and Kammila. Soon two additional hospitalists came on board. Eighteen months into the program, there were five hospitalists—a critical mass.
Issue: Growing the hospitalist group to critical mass and beyond.
Results:
- More bodies enabled hospitalists to have defined shifts;
- The laid-back personalities of the hospitalists emerged, and they forged a strong collegiality;
- They covered several more office practices;
- They began to interact more with other hospitalists and less with specialists;
- The groundwork was set for more growth; and
- Growth to 10 hospitalists would enable the seven on/seven off coverage that everyone wanted.
Doubling the number of hospitalists so quickly raised new issues. Divided into two teams of five, each group had little contact with the other team or with their FMP partners. To bridge the divide, shortly after the hospitalist cadre grew to 10, administrators threw an after-hours cocktail party for medical staff to build camaraderie among all FMP physicians.
Issue: Communication and continuity of care were not optimal.
Specific problems:
- The two hospitalist teams didn’t work together;
- Hospitalists and their office-based colleagues didn’t know each other;
- Productivity needed to be discussed; and
- Some long-term patients were unhappy about being treated by hospitalists rather than their primary physicians.
Resolution: More networking events to bring physicians together, along with daily e-mails from hospitalists to primary care physicians.
More contact among physicians revealed other issues. Terry Buchanan, MD, an FMP family practice physician whose three-provider office is several miles from SNHMC, is relieved that hospitalists freed him from hospital work. However, he says, “Not having hospital work gives a better quality of life, but we’ve lost income [from hospitalized patients] that we’re expected to recover with more outpatients.”
Another concern is losing clinical skills associated with acute care. “I don’t feel I’d be as marketable if I wanted a career change,” he adds.
Unique Metrics
No matter what the yardstick, measuring a hospital medicine program’s value is tough, particularly one transitioning to 24/7 coverage. Still, the familiar metrics of reducing average length of stay (ALOS), cutting costs, and quality improvement are not SNHMC’s ultimate gauge. In fact, ALOS has increased, from 4.15 days in 2004 to 4.26 days in 2005. Yet FMP and Dartmouth-Hitchcock gladly continue underwriting the gap between hospitalist compensation and revenues—a gap of about $30,000 per capita annually.
Issue: Customary hospitalist metrics are not the sole drivers at SNHMC.
Specific problems:
- Average length of stay was up;
- Cost cutting was not a predominant metric;
- Volume and productivity were not chief metrics; and
- Joint venture partners continued to subsidize the hospitalist program.
Resolution: The medical groups continue to support the hospitalist program as it adjusts to 24/7, with a commitment to add four more hospitalists.
Downplaying customary metrics doesn’t mean that SNHMC’s hospitalists don’t compare favorably with their peers. They do. On CMS core measures for four congestive heart failure indicators, SNHMC outperforms its state counterparts by 73% versus 65%; on community-acquired pneumonia guidelines by 54%-46%; and on surgical infection prevention by 64%-53%. Only on the six benchmarks for treating myocardial infarction does SNHMC fall short, by 85% to the 89 for other New Hampshire hospitals.
The Growth Conundrum
Moving to 24/7 coverage has challenged SNHMC, as it has other hospitalist programs. Dead time at night, when the ED and hospital floors fall silent, has to be paid for. So do the peaks and valleys of patient load.
Issue: Patient load variability makes hospitalist programs costly.
Specific Problems:
- Admissions and discharges can bunch and create bottlenecks; and
- Hospitalists are too busy at times and not seeing enough patients at other times.
Resolution: For SNHMC, examine possible response to variability, including:
- Hire/redeploy nurses and/or secretaries for discharge paperwork;
- Create a four-hour chest pain unit staffed by physician assistants;
- Re-examine seven on/seven off staffing. Does another model work better?
- Create a convenient care center separate from the ED;
- Hire moonlighters for night shifts;
- Serve more referring physicians to boost productivity; and/or
- Enlist pulmonologists to assist with ED surges.
Having peeked beneath the surface of SNHMC’s hospitalist program’s performance what lies at the heart of its success—or of its failure? By conventional vision, it’s curious; ALOS actually increased, 30+ internists still cover their hospitalized patients, admissions peaks and valleys, and program subsidies for the foreseeable future.
None of that fazes Sue DeSocio, FMP’s president and COO, who laments the dearth of benchmarking tools that accurately reflect the impact of hospitalist programs.
“At the beginning, we were sure we had everything down pat. We’d keep the hospitalists very busy and with a complement of four, we’d break even. Not even close,” she says. But she judges the program a success, as do Dr. Marshall and Wilhelmson, because it addressed FMP’s family practice physicians’ need to focus on their outpatient practices and avoid hospital work.
Patient satisfaction and hospitalist job satisfaction are high and RN turnover is nearly 12% lower than other New Hampshire hospitals. SNHMC avoided a hospitalist turf war with a successful joint venture with its chief competitor, and, perhaps most importantly, incorporated the hospitalists into FMP’s multi-specialty practice rather than taking the easy way out with outside contracting. Or you check with Drs. Fulton and Kammila, who plunged into the chaos of a start-up, worked impossibly long days, and are still there today because they believe in how they’re practicing medicine. TH
Marlene Piturro regularly writes “Practice Profiles” for The Hospitalist.
In the Literature
Repeat Testing for C. Diff?
By Jeff Glasheen, MD
Mohan SS, McDermott BP, Parchuri S, et al. Lack of value of repeat stool testing for Clostridium difficile toxin. Am J Med. 2006 Apr;119(4):356.e7-356.e8
Clostridium difficile is a common complication of antibiotic and chemotherapeutic use, especially in hospitalized patients. Yet most nosocomial diarrhea is not caused by C. difficile. Most antibiotics can cause loose stools through changes in the gastrointestinal flora that result in inadequate digestion and absorption of carbohydrates and a resultant osmotic diarrhea. Further, antibiotics such as erythromycin and amoxicillin/clavulanate may result in diarrhea via increases in GI tract motility. While osmotic and motility causes of diarrhea tend to improve with antibiotic discontinuation, C. difficile-associated diarrhea is associated with significant morbidity that often continues until adequately treated.
Thus having a test that differentiates between C. difficile and non-clostridial diarrhea is essential. The most commonly used test is the enzyme immunoassay (EIA) that detects toxins A and B. The sensitivity and specificity of this test has been reported to range between 50%-90% and 70%-95%, respectively. The authors of this paper evaluated the utility of repeat EIA testing in patients with a one negative test in the setting of nosocomial diarrhea associated with antibiotic use.
The authors reviewed 474 sequential EIA tests for C. difficile in 396 patients over a 10-month period at a large university-affiliated community hospital with an EIA sensitivity and specificity of 80%-90% and 80%-95%, respectively. Tests were considered to be “repeat” if they occurred within seven days of the original negative test. Of the 78 repeat tests (16.5% of all tests), only one was positive, resulting in a 0.8% conversion rate. At an institutional cost of $128 per test the total cost of EIA testing over the 10-month period was $60,672. The cost of repeat testing alone was $9,984. The authors conclude that there is limited value—and high cost—in repeat EIA testing and that alternative sources of diarrhea should be sought or we should repeat EIA testing in patients with continued nosocomial diarrhea and a negative EIA test.
While prior studies have shown incremental benefit of retesting for C. difficile with the EIA assay, this study’s authors conclude that repeat “C. difficile testing is not clinically justified and is economically wasteful.” Unfortunately, the authors did not utilize a strong enough research design to defend this statement. From the data presented, all we can conclude is that repeat testing with an EIA assay did not add significant value to the diagnostic workup. The lack of a negative gold standard test, such as the cytotoxin assay or follow up outcomes, such as resolution of diarrhea, leaves the reader pondering if the repeat EIA assays were negative because the patients did not have C. difficile or because the test was not sensitive enough to detect the toxin. The reported sensitivity for the EIA assay used was 80-90%, meaning that 10%-20% of patients with C. difficile disease would have had a false negative test. While a second negative test would lower the likelihood of true disease, it would not lower it enough in a patient with a high pre-test probability of disease to sufficiently rule out the disease such that further testing is indicated.
Additionally, while we can extrapolate that the EIA test was of little utility to the patients studied here, no patient-specific data is presented. Thus it is difficult to determine if our patient population is represented in the study. More knowledge about the patients would allow the reader to use published prediction rules to better delineate how likely it was that this cohort was at high risk for having toxin-mediated diarrhea. Perhaps a more reasonable approach to this clinical conundrum would be to send the repeat stool test for a cytotoxin assay or to treat the patient empirically in situations where either the likelihood of disease or the disease burden is high.
Stroke after MI
By Ethan Cumbler, MD
Witt BJ, Ballman KV, Brown RD Jr, et al. The incidence of stroke after myocardial infarction: a meta-analysis. Am J Med. 2006 Apr;119(4):354.e1-9.
Stroke and myocardial infarction (MI) share many of the risk factors leading to atherosclerosis, including hypertension, hyperlipidemia, diabetes, tobacco abuse, and age. Logically, patients at risk for one event would also be at risk for the other, yet this interaction appears to be more complex. The study by Witt, et al., aims to elucidate the rate of in-hospital stroke in patients initially admitted with an MI.
The authors analyzed 22 observational studies of myocardial infarction that recorded the incidence of cerebrovascular accidents after acute MI. Clinical trials were excluded from the analysis in order to provide representation of an unselected population. Of the trials reviewed, 11 were included in the analysis of in-hospital strokes, three for the 30-day time point, and two for the one-year time point. The other trials used different time points and were not included in the analysis. The patients had a mean age ranging between 59 and 72.7 years, and all had a predominance of males. The rate of in-hospital stroke was 11.1 events per 1,000 hospitalizations. This incidence rose to 12.2/1,000 at 30 days and 21.4/1,000 at one year.
Plausible hypotheses for why the rate of cerebrovascular accident would be particularly high in the post-MI period include the potential for localized wall motion dysmotility or low flow leading to intracardiac thrombosis, event-related arrhythmia, or procedure-related embolic events. The studies from which this meta-analysis was derived were not designed in such a way for a causal relationship to be identified. However, age, diabetes, hypertension, prior stroke, anterior location of MI, atrial fibrillation, heart failure, and nonwhite race were all found to have an association with increased risk for stroke. Interestingly, angina on presentation was associated with an apparent decreased risk, theorized to potentially be due to ischemic preconditioning.
While this study shares the usual limitations of meta-analyses of observational studies, the authors have done an excellent summation of the data available including both English and non-English language articles in the analysis. Notably, the review included studies spanning more than 25 years and, thus, included data from studies done in the era prior to modern therapy for cardiac ischemia including potent antiplatelet and statin therapy. The three studies with in-hospital time points started in the 1990s had a lower average rate of stroke, which may reflect the effect of more potent anti-platelet agents used in today’s therapy for acute coronary syndromes.
The implication for the hospitalist is to recognize that patients admitted for MI are at high risk for stroke during the index hospitalization. A low threshold for suspicion of a cerebrovascular event needs to be maintained for post-MI patients with new neurologic symptoms. Future studies will be needed to address the risk/benefit of anticoagulation in high-risk patients for stroke following a myocardial infarction.
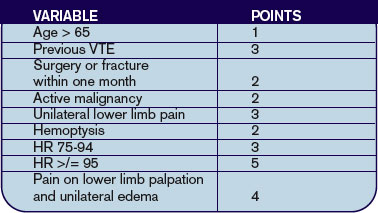
Predicting PE in the ED Using Revised Geneva Score
By Jeffrey Carter, MD
Le Gal G, Righini M, Roy PM, et al. Prediction of pulmonary embolism in the emergency department: the revised Geneva score. Ann Intern Med. 2006 Feb 7;144(3):165-171.
Introduction: Pulmonary embolism remains a common life-threatening disorder with imperfect diagnostic modalities and strategies. Much of the current literature focuses on the development and validation of clinical probability assessments that identify low-risk patients who can be safely managed without invasive testing or lung scanning.
Two common scoring systems include the Geneva and Wells criteria, which employ a combination of historical information, clinical and laboratory data to stratify patients into three risk groups.1,2 It has recently been shown that a single negative D-dimer test safely excludes patients with suspected VTE in a large cohort, with a three-month follow-up rate of VTE of 0%.3 Criticism of current clinical probability assessment strategies include the inclusion of subjective criteria or the need for blood gas values.1,2 In this paper, the authors sought to derive and validate a scoring system based on readily available objective clinical data.
Methods: The cohort evaluated in this study consists of the same 965 patients used to prospectively evaluate an emergency department diagnostic strategy of VTE.3 Patients presenting to the emergency ward with complaints of chest pain or shortness of breath were evaluated with a standard diagnostic workup that included a checklist of demographic and historical information, signs and symptoms possibly consistent with VTE, ABG, chest X-ray, and EKG results, as well as the likelihood of another diagnosis. However, the goal was to create a scoring system based on readily available objective data, so ABG, chest X-ray and electrocardiogram results were not evaluated as possible components of the score. Clinical variables associated with pulmonary embolism were evaluated for statistical significance in both a univariate and multivariate model. These variables were then validated both internally and with an external cohort.
Results: The incidence of VTE was 23% (222/965). Ten clinical variables were found to be statistically significantly associated with VTE; these comprise the Revised Geneva Score.
Clinical probability is based on points: 0-3 is low probability; 4-10 is intermediate probability, and >10 is high probability. Low, intermediate, and high clinical probabilities had respective rates of VTE of 8%, 28%, and 74%. These percentages were found in the validation cohort and were similar to those in the derivation cohort.
Discussion: This study focuses on the derivation and validation of a clinical scoring system that can provide a numerical estimate of likelihood of VTE. The diagnostic strategy by which VTE is confirmed or excluded is from derivation cohort and is published elsewhere.3 In that study patients classified as no VTE and not treated had a 90-day risk of VTE of 1%. The nine-point revised Geneva score does indeed provide an accurate assessment of risk of VTE, and can thus help guide clinical decision-making. However it is not clear that the revised Geneva score will help decrease invasive diagnostic tests. In the low-risk group, 8% is too great a risk of a life-threatening illness to forego further diagnostic evaluation. Coupled with a negative ELISA D-dimer, exclusion of these patients is safe, but these patients cannot be safely excluded without risk stratification.3
References
- Wells PS, Anderson DR, Rodger M, et al. Derivation of a simple clinical model to categorize patients’ probability of pulmonary embolism: increasing the model’s utility with the SimpliRED D-dimer. Thromb Haemost. 2000 Mar;83:416-420.
- Wicki J, Perneger TV, Junof AF, et al. Assessing clinical probability of pulmonary embolism in the emergency ward: a simple score. Arch Intern Med. 2001 Jan 8;161(1):92-97.
- Perrier A, Roy PM, Aujesky D, et al. Diagnosing pulmonary embolism in outpatients with clinical assessment, D-dimer measurement, venous ultrasound and helical computed tomography: a multicenter management study. Am J Med. 2004 Mar 1;116(5):291-299.
LMWH for Inpatient Palliative Care
By Jeanie Youngwerth, MD
Noble SI, Nelson A, Turner C, et al. Acceptability of low molecular weight heparin thromboprophylaxis for patients receiving palliative care: qualitative study. BMJ. 2006 Mar 11:332(7541);577-580.ePub 2006 Feb 3.
Venous thromboembolism is a major risk factor for patients with malignancy. VTE may reduce survival time in patients receiving palliative care, with one in seven inpatients with cancer dying from pulmonary embolism. The American College of Chest Physicians recommend low molecular weight heparin (LMWH) in hospitalized patients with cancer as level 1A evidence in their 2004 consensus statement on VTE. There are no thromboprophylaxis guidelines in the United Kingdom. Many physicians view daily injections of LMWH as unnecessary distress for palliative care patients. This study focused on what inpatients with advanced cancer receiving palliative care thought about the effect of thromboprophylaxis on overall quality of life.
This was a qualitative study of 28 inpatients receiving palliative care who had advanced metastatic cancer and who were in a regional cancer center in Wales. The patients had received LMWH for at least five consecutive days. The patients were audiotaped and then had semi-structured interviews transcribed regarding cancer treatments they had received. These interviews covered the patients’ insight into prognosis, their understanding of thromboprophylaxis, their beliefs concerning the effects of thromboprophylaxis on overall quality of life, and the negative aspects of heparin treatment.
The main outcome measures were recurring themes of the effect of thromboprophylaxis on overall quality of life. Major themes identified were insight into prognosis, knowledge and understanding of thromboprophylaxis, acceptability of heparin thromboprophylaxis, reassurance, and optimism. Minor themes identified were bruising, negative impact of antiembolic stockings, and anger at paternalistic views toward terminally ill patients.
Most patients showed clear insight into the nature of their condition and understood heparin prophylaxis for VTE. Many patients identified immobility and surgery as VTE risk factors, with little understanding of cancer as a risk factor. All knew that VTE could cause death, but none were aware of the common symptoms. All patients found LMWH thromboprophylaxis acceptable. Patients believed taking measures to prevent symptoms might improve their quality of life and felt that the medical team had not given up on them.
The only negative experiences of LMWH thromboprophylaxis was bruising. All of the patients who wore antiembolic stockings during previous admissions found them uncomfortable. Patients expressed their need to be involved in decision-making, particularly with respect to withdrawal or non-administration of treatment.
This small, qualitative study showed that, contrary to many physicians’ beliefs, patients in palliative care units believe that LMWH injections are acceptable as thromboprophylaxis, but antiembolic stockings are not. The effect of daily injections had little or no effect on the quality of life, with many patients having positive feelings that things were being done to prevent new problems from occurring.
This study was limited by the small sample size, the qualitative nature that could introduce interpretation bias, and the fact that only patients using LMWH were included. Additionally, the United Kingdom has aggressively educated the public on the risks of VTE associated with long flights such that baseline knowledge may differ in other parts of the world. Resource utilization, including drug costs and length of stay, as well as effect on mortality were not studied.
The implications for hospitalists are that many inpatients with advanced cancer receiving palliative care may find LMWH thromboprophylaxis acceptable therapy, and that discussions with the patient regarding this option should be explored together.
Cost Analysis: Intensive Glycemic Control in Critically Ill Adults
By Whitney Woodmansee, MD
Krinsley JS, Jones, RL. Cost analysis of intensive glycemic control in critically ill adult patients. Chest. 2006;129:644-650.
Several studies have demonstrated improved outcomes and decreased mortality in ICU patients treated with intensive control of blood glucose levels. This study sought to identify the costs associated with intensive glycemic control in the ICU.
An ICU patient database was analyzed for cost data related to intensive glycemic control. A baseline group of 800 consecutive ICU patients admitted prior to initiation (baseline) of an intensive glucose management (blood glucose levels between 80-140 mg/dl protocol were compared with a treatment group of 800 consecutive patients admitted after initiation of the protocol). Previously reported outcomes of these patients demonstrated significant improvement in mortality with tight glycemic control. Costs related to ICU and non-ICU length of stay; duration of mechanical ventilation; and all laboratory, pharmacy, and radiology services were analyzed between groups. Resource utilization was determined by assessing charges from the database and adjusting for inflation and applying Medicare cost, charge ratios for each category, and fiscal year. Costs associated with the intensive glycemic control protocol were determined. Unfortunately, only cost estimates for insulin and associated disposable supplies for each group were available for analysis.
Baseline and treatment populations did not differ significantly regarding demographics such as age, gender, race, admitting diagnosis, diabetes prevalence, or APACHE II scores. There were fewer patients in the treatment group that required mechanical ventilation during their ICU stay (40.6% versus 33.6%). Intensive glucose management was associated with a 13.9% reduction in total ICU days and duration of mechanical ventilation (median of two days decreased to 1.7 days p=0.045). There was a $1,580 adjusted cost savings per patient in the intensive treatment group compared with the baseline group (p<0.001). This reduction in cost was primarily driven by a decrease in laboratory and radiology costs in the ventilated patients. There were nonsignificant cost reductions in the unventilated patients.
Intensive control of hyperglycemia in the hospitalized ICU patient appears to be associated with reduction of morbidity and mortality. This suggests that tight glycemic control also leads to reductions in overall patient care costs—particularly in the ventilated ICU patient. Although not a randomized control trial, database analysis of costs and resource utilization demonstrated an overall cost savings in the treatment group (after initiation of an intensive glycemic control protocol) compared with the baseline group (before protocol initiation). One caveat is that the authors used estimates when determining the costs associated with the implementation of the intensive glucose management protocol. Nevertheless, intensive glycemic control was associated with an overall reduction in patient costs related to decreased ICU days and mechanical ventilation as well as resource utilization in a patient population already shown to have improved mortality. These results, if confirmed, suggest that tight glycemic control in the ICU is cost effective and should become standard medical practice. TH
Repeat Testing for C. Diff?
By Jeff Glasheen, MD
Mohan SS, McDermott BP, Parchuri S, et al. Lack of value of repeat stool testing for Clostridium difficile toxin. Am J Med. 2006 Apr;119(4):356.e7-356.e8
Clostridium difficile is a common complication of antibiotic and chemotherapeutic use, especially in hospitalized patients. Yet most nosocomial diarrhea is not caused by C. difficile. Most antibiotics can cause loose stools through changes in the gastrointestinal flora that result in inadequate digestion and absorption of carbohydrates and a resultant osmotic diarrhea. Further, antibiotics such as erythromycin and amoxicillin/clavulanate may result in diarrhea via increases in GI tract motility. While osmotic and motility causes of diarrhea tend to improve with antibiotic discontinuation, C. difficile-associated diarrhea is associated with significant morbidity that often continues until adequately treated.
Thus having a test that differentiates between C. difficile and non-clostridial diarrhea is essential. The most commonly used test is the enzyme immunoassay (EIA) that detects toxins A and B. The sensitivity and specificity of this test has been reported to range between 50%-90% and 70%-95%, respectively. The authors of this paper evaluated the utility of repeat EIA testing in patients with a one negative test in the setting of nosocomial diarrhea associated with antibiotic use.
The authors reviewed 474 sequential EIA tests for C. difficile in 396 patients over a 10-month period at a large university-affiliated community hospital with an EIA sensitivity and specificity of 80%-90% and 80%-95%, respectively. Tests were considered to be “repeat” if they occurred within seven days of the original negative test. Of the 78 repeat tests (16.5% of all tests), only one was positive, resulting in a 0.8% conversion rate. At an institutional cost of $128 per test the total cost of EIA testing over the 10-month period was $60,672. The cost of repeat testing alone was $9,984. The authors conclude that there is limited value—and high cost—in repeat EIA testing and that alternative sources of diarrhea should be sought or we should repeat EIA testing in patients with continued nosocomial diarrhea and a negative EIA test.
While prior studies have shown incremental benefit of retesting for C. difficile with the EIA assay, this study’s authors conclude that repeat “C. difficile testing is not clinically justified and is economically wasteful.” Unfortunately, the authors did not utilize a strong enough research design to defend this statement. From the data presented, all we can conclude is that repeat testing with an EIA assay did not add significant value to the diagnostic workup. The lack of a negative gold standard test, such as the cytotoxin assay or follow up outcomes, such as resolution of diarrhea, leaves the reader pondering if the repeat EIA assays were negative because the patients did not have C. difficile or because the test was not sensitive enough to detect the toxin. The reported sensitivity for the EIA assay used was 80-90%, meaning that 10%-20% of patients with C. difficile disease would have had a false negative test. While a second negative test would lower the likelihood of true disease, it would not lower it enough in a patient with a high pre-test probability of disease to sufficiently rule out the disease such that further testing is indicated.
Additionally, while we can extrapolate that the EIA test was of little utility to the patients studied here, no patient-specific data is presented. Thus it is difficult to determine if our patient population is represented in the study. More knowledge about the patients would allow the reader to use published prediction rules to better delineate how likely it was that this cohort was at high risk for having toxin-mediated diarrhea. Perhaps a more reasonable approach to this clinical conundrum would be to send the repeat stool test for a cytotoxin assay or to treat the patient empirically in situations where either the likelihood of disease or the disease burden is high.
Stroke after MI
By Ethan Cumbler, MD
Witt BJ, Ballman KV, Brown RD Jr, et al. The incidence of stroke after myocardial infarction: a meta-analysis. Am J Med. 2006 Apr;119(4):354.e1-9.
Stroke and myocardial infarction (MI) share many of the risk factors leading to atherosclerosis, including hypertension, hyperlipidemia, diabetes, tobacco abuse, and age. Logically, patients at risk for one event would also be at risk for the other, yet this interaction appears to be more complex. The study by Witt, et al., aims to elucidate the rate of in-hospital stroke in patients initially admitted with an MI.
The authors analyzed 22 observational studies of myocardial infarction that recorded the incidence of cerebrovascular accidents after acute MI. Clinical trials were excluded from the analysis in order to provide representation of an unselected population. Of the trials reviewed, 11 were included in the analysis of in-hospital strokes, three for the 30-day time point, and two for the one-year time point. The other trials used different time points and were not included in the analysis. The patients had a mean age ranging between 59 and 72.7 years, and all had a predominance of males. The rate of in-hospital stroke was 11.1 events per 1,000 hospitalizations. This incidence rose to 12.2/1,000 at 30 days and 21.4/1,000 at one year.
Plausible hypotheses for why the rate of cerebrovascular accident would be particularly high in the post-MI period include the potential for localized wall motion dysmotility or low flow leading to intracardiac thrombosis, event-related arrhythmia, or procedure-related embolic events. The studies from which this meta-analysis was derived were not designed in such a way for a causal relationship to be identified. However, age, diabetes, hypertension, prior stroke, anterior location of MI, atrial fibrillation, heart failure, and nonwhite race were all found to have an association with increased risk for stroke. Interestingly, angina on presentation was associated with an apparent decreased risk, theorized to potentially be due to ischemic preconditioning.
While this study shares the usual limitations of meta-analyses of observational studies, the authors have done an excellent summation of the data available including both English and non-English language articles in the analysis. Notably, the review included studies spanning more than 25 years and, thus, included data from studies done in the era prior to modern therapy for cardiac ischemia including potent antiplatelet and statin therapy. The three studies with in-hospital time points started in the 1990s had a lower average rate of stroke, which may reflect the effect of more potent anti-platelet agents used in today’s therapy for acute coronary syndromes.
The implication for the hospitalist is to recognize that patients admitted for MI are at high risk for stroke during the index hospitalization. A low threshold for suspicion of a cerebrovascular event needs to be maintained for post-MI patients with new neurologic symptoms. Future studies will be needed to address the risk/benefit of anticoagulation in high-risk patients for stroke following a myocardial infarction.
Predicting PE in the ED Using Revised Geneva Score
By Jeffrey Carter, MD
Le Gal G, Righini M, Roy PM, et al. Prediction of pulmonary embolism in the emergency department: the revised Geneva score. Ann Intern Med. 2006 Feb 7;144(3):165-171.
Introduction: Pulmonary embolism remains a common life-threatening disorder with imperfect diagnostic modalities and strategies. Much of the current literature focuses on the development and validation of clinical probability assessments that identify low-risk patients who can be safely managed without invasive testing or lung scanning.
Two common scoring systems include the Geneva and Wells criteria, which employ a combination of historical information, clinical and laboratory data to stratify patients into three risk groups.1,2 It has recently been shown that a single negative D-dimer test safely excludes patients with suspected VTE in a large cohort, with a three-month follow-up rate of VTE of 0%.3 Criticism of current clinical probability assessment strategies include the inclusion of subjective criteria or the need for blood gas values.1,2 In this paper, the authors sought to derive and validate a scoring system based on readily available objective clinical data.
Methods: The cohort evaluated in this study consists of the same 965 patients used to prospectively evaluate an emergency department diagnostic strategy of VTE.3 Patients presenting to the emergency ward with complaints of chest pain or shortness of breath were evaluated with a standard diagnostic workup that included a checklist of demographic and historical information, signs and symptoms possibly consistent with VTE, ABG, chest X-ray, and EKG results, as well as the likelihood of another diagnosis. However, the goal was to create a scoring system based on readily available objective data, so ABG, chest X-ray and electrocardiogram results were not evaluated as possible components of the score. Clinical variables associated with pulmonary embolism were evaluated for statistical significance in both a univariate and multivariate model. These variables were then validated both internally and with an external cohort.
Results: The incidence of VTE was 23% (222/965). Ten clinical variables were found to be statistically significantly associated with VTE; these comprise the Revised Geneva Score.
Clinical probability is based on points: 0-3 is low probability; 4-10 is intermediate probability, and >10 is high probability. Low, intermediate, and high clinical probabilities had respective rates of VTE of 8%, 28%, and 74%. These percentages were found in the validation cohort and were similar to those in the derivation cohort.
Discussion: This study focuses on the derivation and validation of a clinical scoring system that can provide a numerical estimate of likelihood of VTE. The diagnostic strategy by which VTE is confirmed or excluded is from derivation cohort and is published elsewhere.3 In that study patients classified as no VTE and not treated had a 90-day risk of VTE of 1%. The nine-point revised Geneva score does indeed provide an accurate assessment of risk of VTE, and can thus help guide clinical decision-making. However it is not clear that the revised Geneva score will help decrease invasive diagnostic tests. In the low-risk group, 8% is too great a risk of a life-threatening illness to forego further diagnostic evaluation. Coupled with a negative ELISA D-dimer, exclusion of these patients is safe, but these patients cannot be safely excluded without risk stratification.3
References
- Wells PS, Anderson DR, Rodger M, et al. Derivation of a simple clinical model to categorize patients’ probability of pulmonary embolism: increasing the model’s utility with the SimpliRED D-dimer. Thromb Haemost. 2000 Mar;83:416-420.
- Wicki J, Perneger TV, Junof AF, et al. Assessing clinical probability of pulmonary embolism in the emergency ward: a simple score. Arch Intern Med. 2001 Jan 8;161(1):92-97.
- Perrier A, Roy PM, Aujesky D, et al. Diagnosing pulmonary embolism in outpatients with clinical assessment, D-dimer measurement, venous ultrasound and helical computed tomography: a multicenter management study. Am J Med. 2004 Mar 1;116(5):291-299.
LMWH for Inpatient Palliative Care
By Jeanie Youngwerth, MD
Noble SI, Nelson A, Turner C, et al. Acceptability of low molecular weight heparin thromboprophylaxis for patients receiving palliative care: qualitative study. BMJ. 2006 Mar 11:332(7541);577-580.ePub 2006 Feb 3.
Venous thromboembolism is a major risk factor for patients with malignancy. VTE may reduce survival time in patients receiving palliative care, with one in seven inpatients with cancer dying from pulmonary embolism. The American College of Chest Physicians recommend low molecular weight heparin (LMWH) in hospitalized patients with cancer as level 1A evidence in their 2004 consensus statement on VTE. There are no thromboprophylaxis guidelines in the United Kingdom. Many physicians view daily injections of LMWH as unnecessary distress for palliative care patients. This study focused on what inpatients with advanced cancer receiving palliative care thought about the effect of thromboprophylaxis on overall quality of life.
This was a qualitative study of 28 inpatients receiving palliative care who had advanced metastatic cancer and who were in a regional cancer center in Wales. The patients had received LMWH for at least five consecutive days. The patients were audiotaped and then had semi-structured interviews transcribed regarding cancer treatments they had received. These interviews covered the patients’ insight into prognosis, their understanding of thromboprophylaxis, their beliefs concerning the effects of thromboprophylaxis on overall quality of life, and the negative aspects of heparin treatment.
The main outcome measures were recurring themes of the effect of thromboprophylaxis on overall quality of life. Major themes identified were insight into prognosis, knowledge and understanding of thromboprophylaxis, acceptability of heparin thromboprophylaxis, reassurance, and optimism. Minor themes identified were bruising, negative impact of antiembolic stockings, and anger at paternalistic views toward terminally ill patients.
Most patients showed clear insight into the nature of their condition and understood heparin prophylaxis for VTE. Many patients identified immobility and surgery as VTE risk factors, with little understanding of cancer as a risk factor. All knew that VTE could cause death, but none were aware of the common symptoms. All patients found LMWH thromboprophylaxis acceptable. Patients believed taking measures to prevent symptoms might improve their quality of life and felt that the medical team had not given up on them.
The only negative experiences of LMWH thromboprophylaxis was bruising. All of the patients who wore antiembolic stockings during previous admissions found them uncomfortable. Patients expressed their need to be involved in decision-making, particularly with respect to withdrawal or non-administration of treatment.
This small, qualitative study showed that, contrary to many physicians’ beliefs, patients in palliative care units believe that LMWH injections are acceptable as thromboprophylaxis, but antiembolic stockings are not. The effect of daily injections had little or no effect on the quality of life, with many patients having positive feelings that things were being done to prevent new problems from occurring.
This study was limited by the small sample size, the qualitative nature that could introduce interpretation bias, and the fact that only patients using LMWH were included. Additionally, the United Kingdom has aggressively educated the public on the risks of VTE associated with long flights such that baseline knowledge may differ in other parts of the world. Resource utilization, including drug costs and length of stay, as well as effect on mortality were not studied.
The implications for hospitalists are that many inpatients with advanced cancer receiving palliative care may find LMWH thromboprophylaxis acceptable therapy, and that discussions with the patient regarding this option should be explored together.
Cost Analysis: Intensive Glycemic Control in Critically Ill Adults
By Whitney Woodmansee, MD
Krinsley JS, Jones, RL. Cost analysis of intensive glycemic control in critically ill adult patients. Chest. 2006;129:644-650.
Several studies have demonstrated improved outcomes and decreased mortality in ICU patients treated with intensive control of blood glucose levels. This study sought to identify the costs associated with intensive glycemic control in the ICU.
An ICU patient database was analyzed for cost data related to intensive glycemic control. A baseline group of 800 consecutive ICU patients admitted prior to initiation (baseline) of an intensive glucose management (blood glucose levels between 80-140 mg/dl protocol were compared with a treatment group of 800 consecutive patients admitted after initiation of the protocol). Previously reported outcomes of these patients demonstrated significant improvement in mortality with tight glycemic control. Costs related to ICU and non-ICU length of stay; duration of mechanical ventilation; and all laboratory, pharmacy, and radiology services were analyzed between groups. Resource utilization was determined by assessing charges from the database and adjusting for inflation and applying Medicare cost, charge ratios for each category, and fiscal year. Costs associated with the intensive glycemic control protocol were determined. Unfortunately, only cost estimates for insulin and associated disposable supplies for each group were available for analysis.
Baseline and treatment populations did not differ significantly regarding demographics such as age, gender, race, admitting diagnosis, diabetes prevalence, or APACHE II scores. There were fewer patients in the treatment group that required mechanical ventilation during their ICU stay (40.6% versus 33.6%). Intensive glucose management was associated with a 13.9% reduction in total ICU days and duration of mechanical ventilation (median of two days decreased to 1.7 days p=0.045). There was a $1,580 adjusted cost savings per patient in the intensive treatment group compared with the baseline group (p<0.001). This reduction in cost was primarily driven by a decrease in laboratory and radiology costs in the ventilated patients. There were nonsignificant cost reductions in the unventilated patients.
Intensive control of hyperglycemia in the hospitalized ICU patient appears to be associated with reduction of morbidity and mortality. This suggests that tight glycemic control also leads to reductions in overall patient care costs—particularly in the ventilated ICU patient. Although not a randomized control trial, database analysis of costs and resource utilization demonstrated an overall cost savings in the treatment group (after initiation of an intensive glycemic control protocol) compared with the baseline group (before protocol initiation). One caveat is that the authors used estimates when determining the costs associated with the implementation of the intensive glucose management protocol. Nevertheless, intensive glycemic control was associated with an overall reduction in patient costs related to decreased ICU days and mechanical ventilation as well as resource utilization in a patient population already shown to have improved mortality. These results, if confirmed, suggest that tight glycemic control in the ICU is cost effective and should become standard medical practice. TH
Evidenced-Based Medicine for the Hospitalist
Editors’ note: We inadvertently published part 2 of the “Statistics in the Literature” (May 2006, p. 15) series installments in May (p. 15) out of order. In fact, the following series installment should have preceded the installment we published in May. Therefore, the following series installment is the last in the EBM series. We apologize for any inconvenience.
Why Do Statistical Methods Matter?
Critical appraisal of the literature does not stop with evaluation of bias and review of results. While it would be nice to simply trust that the reported methods in a paper tell the whole story, this approach would be inconsistent with the core principle of EBM: a global attitude of enlightened skepticism. Statistics in the literature should be subject to the same appraisal as every other aspect of a study.
But is such detail truly necessary? If a paper meets the standard criteria for validity, can’t we assume that the statistics are also valid? Most of us would like to be able to just accept that the P values and confidence intervals we see in a paper are appropriate. Even EBM experts tend to feel this way, as evidenced by the statement in Sackett, et al. (1998) that “if good [study] methods were used, the investigators probably went to the effort to use good statistics.” Unfortunately, repeated studies of the statistical methods reported in literature across many fields suggest that up to 50% of papers contain major statistical flaws, many of which could affect the conclusions of the paper. This occurs even in top-tier journals, so no source is immune.
This problem is compounded by the fact that the statistical knowledge of the average clinician is quite limited. Journals certainly have a responsibility to ensure the presentation of valid research, but how many of us (as reader or reviewer) are qualified to assess the statistical methodology from which a study’s conclusions result? It’s trouble enough to work through the critical appraisal process outlined in the previous installments of this series, let alone dig deeper into how the results were generated.
In fact each reader must act as his or her own judge of a study’s ultimate value, and ignorance of basic statistical principles cannot be an excuse for accepting faulty research. Remember, we make patient care decisions based on our reviews of the literature, so there is a very real incentive to ensure we apply the best evidence both epidemiologically and statistically: Our patients are counting on us. With this in mind, we will conclude this series with a two-part discussion of some of the core statistical concepts to consider when evaluating a paper.
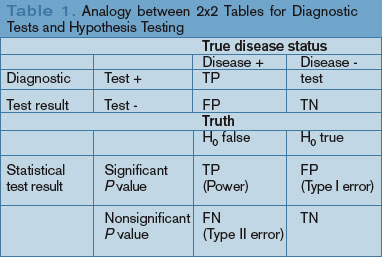
Commonly Reported Statistical Terms
P values: The P value is perhaps the most widely reported yet least understood statistical measure. Consider a comparison of a new treatment with placebo: The null hypothesis (H0) is the hypothesis of null effect, usually meaning that the treatment effect equals the placebo effect. The technical definition of a P value is the probability of observing at least as extreme a result as that found in your study if this null hypothesis were true. The condition in italics is crucial: Remember, we never know if the null hypothesis is true (and if we did, there would be no need for further research).
Usually, however, the P value is interpreted incorrectly as the probability that a study’s results could have occurred due to chance alone, with no mention of the condition. Thus, a P value of 0.05 is thought (wrongly) to mean that there is a 5% chance that the study’s results are wrong.
Of course, rather than the probability of the data we observed assuming the null hypothesis were true (our friend the P value), we want to know the probability that a reported result is true given the data we observed. To illustrate this point, most clinicians have little difficulty with the idea that sensitivity and specificity are only part of the story for a diagnostic test. Recall that specificity is the probability of a negative test result assuming the patient does not have the disease. We need to know the prevalence of disease to be able to convert this into a negative predictive value directly relevant to patient care: the probability of not having the disease given our negative test result (likelihood ratios do this all in one step, but accomplish the same thing).
The analogy between diagnostic test characteristics and statistical test characteristics is presented graphically. (See Table 1, p. 28.) Without the prevalence term (in this case, the probability that the null hypothesis is true) P values do not answer our research question any better than specificity tells us how likely a patient is to be free of a disease. For a patient with a high pre-test probability of disease, a highly specific test that returns a negative result is more likely to represent a false negative than a true negative, despite the high specificity. Similarly, a statistically significant P value from a study in which the hypothesis in question is itself questionable is more likely to represent a false conclusion than a true one. This has resulted in one author’s recent statement that “most published research findings are false.”1 Solutions to these P value issues may lie in the field of Bayesian methods, but to date these approaches have proven too complicated for routine use. P values remain useful and are the common language for reporting results, but it is important to recognize that they do not directly answer the research questions we often think they answer.
Confidence intervals: Confidence intervals provide more information than P values by offering a range of values within which the “truth” is likely to be found. The technical definition of a confidence interval is complicated and confusing even to many statisticians. Generally speaking, however, confidence intervals are derived from the same methodology as P values and correlate with P values as follows: If the confidence interval crosses the point of equivalence (e.g., a relative risk of 1 or an absolute risk reduction of 0), the P value will not be statistically significant at the same level. Therefore, a 95% confidence interval for a relative risk that crosses 1 correlates with a P value greater than 0.05. Conversely, if the confidence interval does not cross this line, the P value will be statistically significant.
The additional information offered by the confidence interval relates to the width of the interval. Wider confidence intervals suggest that less faith should be placed on specific point estimates of a treatment’s effect, while narrower confidence intervals suggest that we can be more sure where the true effect lies (i.e., our estimate of the treatment effect is more precise). However, because confidence intervals are derived from the same statistical methods as P values, they are also subject to the problems previously described for P values.
A dose of common sense: Statistics serve as a way to condense research findings into easily digestible end products; however, the important parts of any paper come well before the first P value is generated. Good research requires good design, and only then can sound statistical approaches provide valid insights into complex study results. In addition, for a study’s results to be applied to our patients, not only must the design and analysis be appropriate, but we must also carefully consider issues beyond the aims of most studies, including value judgments.
Summary
Classically, EBM has focused on careful critical appraisal of study design, with relatively little consideration of the analytic approaches that provide a study’s results. Statistics can clarify study results, but if applied improperly can invalidate even a well-designed study. It is important for clinicians to recognize that statistics should also be evaluated critically when attempting to apply research findings to the care of our patients. TH
Dr. West practices in the Division of General Internal Medicine, Mayo Clinic College of Medicine, Rochester, Minn.
Reference
- Ioannidis JPA. Why most research findings are false. PLoS Med. 2005;2:e124.
Editors’ note: We inadvertently published part 2 of the “Statistics in the Literature” (May 2006, p. 15) series installments in May (p. 15) out of order. In fact, the following series installment should have preceded the installment we published in May. Therefore, the following series installment is the last in the EBM series. We apologize for any inconvenience.
Why Do Statistical Methods Matter?
Critical appraisal of the literature does not stop with evaluation of bias and review of results. While it would be nice to simply trust that the reported methods in a paper tell the whole story, this approach would be inconsistent with the core principle of EBM: a global attitude of enlightened skepticism. Statistics in the literature should be subject to the same appraisal as every other aspect of a study.
But is such detail truly necessary? If a paper meets the standard criteria for validity, can’t we assume that the statistics are also valid? Most of us would like to be able to just accept that the P values and confidence intervals we see in a paper are appropriate. Even EBM experts tend to feel this way, as evidenced by the statement in Sackett, et al. (1998) that “if good [study] methods were used, the investigators probably went to the effort to use good statistics.” Unfortunately, repeated studies of the statistical methods reported in literature across many fields suggest that up to 50% of papers contain major statistical flaws, many of which could affect the conclusions of the paper. This occurs even in top-tier journals, so no source is immune.
This problem is compounded by the fact that the statistical knowledge of the average clinician is quite limited. Journals certainly have a responsibility to ensure the presentation of valid research, but how many of us (as reader or reviewer) are qualified to assess the statistical methodology from which a study’s conclusions result? It’s trouble enough to work through the critical appraisal process outlined in the previous installments of this series, let alone dig deeper into how the results were generated.
In fact each reader must act as his or her own judge of a study’s ultimate value, and ignorance of basic statistical principles cannot be an excuse for accepting faulty research. Remember, we make patient care decisions based on our reviews of the literature, so there is a very real incentive to ensure we apply the best evidence both epidemiologically and statistically: Our patients are counting on us. With this in mind, we will conclude this series with a two-part discussion of some of the core statistical concepts to consider when evaluating a paper.
Commonly Reported Statistical Terms
P values: The P value is perhaps the most widely reported yet least understood statistical measure. Consider a comparison of a new treatment with placebo: The null hypothesis (H0) is the hypothesis of null effect, usually meaning that the treatment effect equals the placebo effect. The technical definition of a P value is the probability of observing at least as extreme a result as that found in your study if this null hypothesis were true. The condition in italics is crucial: Remember, we never know if the null hypothesis is true (and if we did, there would be no need for further research).
Usually, however, the P value is interpreted incorrectly as the probability that a study’s results could have occurred due to chance alone, with no mention of the condition. Thus, a P value of 0.05 is thought (wrongly) to mean that there is a 5% chance that the study’s results are wrong.
Of course, rather than the probability of the data we observed assuming the null hypothesis were true (our friend the P value), we want to know the probability that a reported result is true given the data we observed. To illustrate this point, most clinicians have little difficulty with the idea that sensitivity and specificity are only part of the story for a diagnostic test. Recall that specificity is the probability of a negative test result assuming the patient does not have the disease. We need to know the prevalence of disease to be able to convert this into a negative predictive value directly relevant to patient care: the probability of not having the disease given our negative test result (likelihood ratios do this all in one step, but accomplish the same thing).
The analogy between diagnostic test characteristics and statistical test characteristics is presented graphically. (See Table 1, p. 28.) Without the prevalence term (in this case, the probability that the null hypothesis is true) P values do not answer our research question any better than specificity tells us how likely a patient is to be free of a disease. For a patient with a high pre-test probability of disease, a highly specific test that returns a negative result is more likely to represent a false negative than a true negative, despite the high specificity. Similarly, a statistically significant P value from a study in which the hypothesis in question is itself questionable is more likely to represent a false conclusion than a true one. This has resulted in one author’s recent statement that “most published research findings are false.”1 Solutions to these P value issues may lie in the field of Bayesian methods, but to date these approaches have proven too complicated for routine use. P values remain useful and are the common language for reporting results, but it is important to recognize that they do not directly answer the research questions we often think they answer.
Confidence intervals: Confidence intervals provide more information than P values by offering a range of values within which the “truth” is likely to be found. The technical definition of a confidence interval is complicated and confusing even to many statisticians. Generally speaking, however, confidence intervals are derived from the same methodology as P values and correlate with P values as follows: If the confidence interval crosses the point of equivalence (e.g., a relative risk of 1 or an absolute risk reduction of 0), the P value will not be statistically significant at the same level. Therefore, a 95% confidence interval for a relative risk that crosses 1 correlates with a P value greater than 0.05. Conversely, if the confidence interval does not cross this line, the P value will be statistically significant.
The additional information offered by the confidence interval relates to the width of the interval. Wider confidence intervals suggest that less faith should be placed on specific point estimates of a treatment’s effect, while narrower confidence intervals suggest that we can be more sure where the true effect lies (i.e., our estimate of the treatment effect is more precise). However, because confidence intervals are derived from the same statistical methods as P values, they are also subject to the problems previously described for P values.
A dose of common sense: Statistics serve as a way to condense research findings into easily digestible end products; however, the important parts of any paper come well before the first P value is generated. Good research requires good design, and only then can sound statistical approaches provide valid insights into complex study results. In addition, for a study’s results to be applied to our patients, not only must the design and analysis be appropriate, but we must also carefully consider issues beyond the aims of most studies, including value judgments.
Summary
Classically, EBM has focused on careful critical appraisal of study design, with relatively little consideration of the analytic approaches that provide a study’s results. Statistics can clarify study results, but if applied improperly can invalidate even a well-designed study. It is important for clinicians to recognize that statistics should also be evaluated critically when attempting to apply research findings to the care of our patients. TH
Dr. West practices in the Division of General Internal Medicine, Mayo Clinic College of Medicine, Rochester, Minn.
Reference
- Ioannidis JPA. Why most research findings are false. PLoS Med. 2005;2:e124.
Death by Numbers
The Centers for Disease Control and Prevention’s (CDC) National Center for Health Statistics (NCHS) recently released “Deaths: Preliminary Data for 2004.” This report includes information from approximately 90% of the death records provided by all 50 states and the District of Columbia in 2004. The death certificate information provided by physicians, coroners, medical examiners, and funeral directors serves as the source for all death record information. A complete report is due to be released in May 2005 and will include data for the United States territories of Puerto Rico, the Virgin Islands, Guam, American Samoa, and the Northern Marianas.
This preliminary report contains information dealing with the absolute number of deaths, age-adjusted death rates, and life expectancy. The absolute number of deaths allows for the calculation of death rates based on total population figures using the 2000 census data and estimations for population changes in the intervening years. Age-adjusted death rates account for the changing age distribution of the population of the United States over time and make comparisons between years and tracking of trends more useful.
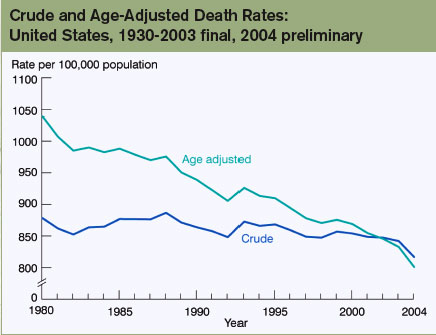
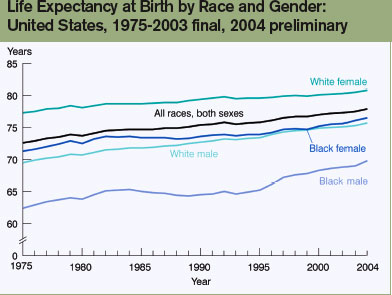
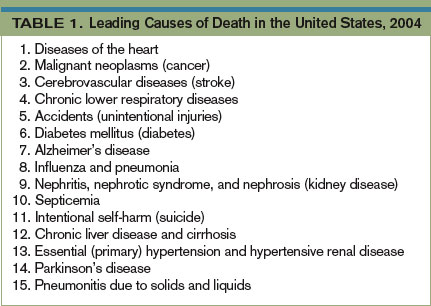
The absolute (crude) death rate in the United States for 2004 is reportedly expected to be 2,398,343 people. This is a decrease of 49,495 (about 2%) from the 2003 figures, one of the biggest year-to-year declines in decades. The age-adjusted death rate is down from 832.7/100,000 deaths in 2003 to 801.0/100,000 deaths in 2004, a drop of 3.8%. These rates in 2004, for both absolute and age adjusted deaths, represent all-time record lows and continuing a trend toward lower and lower rates of death. (See “Crude and Age-Adjusted Death Rates,” p. 26.) All racial groups for both genders analyzed showed decreases in death rates ranging from the largest decrease of 6.2% in Hispanic women to the smallest decrease of 3.2% in non-Hispanic white women.
The preliminary estimate for life expectancy at birth in 2004 has improved to 77.9 years, the highest life expectancy recorded. Women continue to have an increased life expectancy compared with men (80.4 years versus 75.2 years) but this gender gap of 5.2 years is the smallest since 1946. Breakdown by race and gender for white and black men and women also shows gains in life expectancy for all groups with the largest gains appearing for black men with an increase of 0.8 years from 69.0 in 2003 to 69.8 in 2004. (See “Life Expectancy at Birth by Race and Gender,” above.) There remains a significant difference of 5.0 years (78.3 years versus 73.3 years) between white and black life expectancy.
Also included in this report are the data dealing with cause of death and a listing of the 15 leading causes of death in the United States in 2004. (See Table 1, above.) These top 15 causes of death account for almost 83% of all deaths for 2004 in the United States. The preliminary figures show an increase in the number of deaths caused by hypertension—up 2.7% from 2003, and Alzheimer’s disease—up 1.4%. All other categories showed a decrease in the number of deaths, ranging from the smallest decline of 0.7% in kidney disease to the largest decline of 6.5% occurring in cerebrovascular disease. The only change in order of cause of death in the top 15 is the change of Alzheimer’s disease moving up from the number-eight position to number seven and a drop of influenza/pneumonia into the number-eight position. Also of note to geriatric hospitalists is cause of death number 15: aspiration. TH
Dr. Ruff is a resident, internal medicine, at the Mayo Clinic College of Medicine, Rochester, Minn.
Resource
- Miniño AM, Heron M, Smith BL. Deaths: Preliminary data for 2004. CDC. National Center for Health Statistics: Health E-Stats. Released April 19, 2006. Available at www.cdc.gov/nchs/products/pubs/pubd/hestats/prelimdeaths04/preliminarydeaths04.htm. Last accessed May 30, 2006.
The Centers for Disease Control and Prevention’s (CDC) National Center for Health Statistics (NCHS) recently released “Deaths: Preliminary Data for 2004.” This report includes information from approximately 90% of the death records provided by all 50 states and the District of Columbia in 2004. The death certificate information provided by physicians, coroners, medical examiners, and funeral directors serves as the source for all death record information. A complete report is due to be released in May 2005 and will include data for the United States territories of Puerto Rico, the Virgin Islands, Guam, American Samoa, and the Northern Marianas.
This preliminary report contains information dealing with the absolute number of deaths, age-adjusted death rates, and life expectancy. The absolute number of deaths allows for the calculation of death rates based on total population figures using the 2000 census data and estimations for population changes in the intervening years. Age-adjusted death rates account for the changing age distribution of the population of the United States over time and make comparisons between years and tracking of trends more useful.
The absolute (crude) death rate in the United States for 2004 is reportedly expected to be 2,398,343 people. This is a decrease of 49,495 (about 2%) from the 2003 figures, one of the biggest year-to-year declines in decades. The age-adjusted death rate is down from 832.7/100,000 deaths in 2003 to 801.0/100,000 deaths in 2004, a drop of 3.8%. These rates in 2004, for both absolute and age adjusted deaths, represent all-time record lows and continuing a trend toward lower and lower rates of death. (See “Crude and Age-Adjusted Death Rates,” p. 26.) All racial groups for both genders analyzed showed decreases in death rates ranging from the largest decrease of 6.2% in Hispanic women to the smallest decrease of 3.2% in non-Hispanic white women.
The preliminary estimate for life expectancy at birth in 2004 has improved to 77.9 years, the highest life expectancy recorded. Women continue to have an increased life expectancy compared with men (80.4 years versus 75.2 years) but this gender gap of 5.2 years is the smallest since 1946. Breakdown by race and gender for white and black men and women also shows gains in life expectancy for all groups with the largest gains appearing for black men with an increase of 0.8 years from 69.0 in 2003 to 69.8 in 2004. (See “Life Expectancy at Birth by Race and Gender,” above.) There remains a significant difference of 5.0 years (78.3 years versus 73.3 years) between white and black life expectancy.
Also included in this report are the data dealing with cause of death and a listing of the 15 leading causes of death in the United States in 2004. (See Table 1, above.) These top 15 causes of death account for almost 83% of all deaths for 2004 in the United States. The preliminary figures show an increase in the number of deaths caused by hypertension—up 2.7% from 2003, and Alzheimer’s disease—up 1.4%. All other categories showed a decrease in the number of deaths, ranging from the smallest decline of 0.7% in kidney disease to the largest decline of 6.5% occurring in cerebrovascular disease. The only change in order of cause of death in the top 15 is the change of Alzheimer’s disease moving up from the number-eight position to number seven and a drop of influenza/pneumonia into the number-eight position. Also of note to geriatric hospitalists is cause of death number 15: aspiration. TH
Dr. Ruff is a resident, internal medicine, at the Mayo Clinic College of Medicine, Rochester, Minn.
Resource
- Miniño AM, Heron M, Smith BL. Deaths: Preliminary data for 2004. CDC. National Center for Health Statistics: Health E-Stats. Released April 19, 2006. Available at www.cdc.gov/nchs/products/pubs/pubd/hestats/prelimdeaths04/preliminarydeaths04.htm. Last accessed May 30, 2006.
Unlock a Career in Administration
Working hospitalists frequently find themselves leading quality initiatives, writing care protocols, sitting on a variety of committees, or engaged in other activities aimed at improving the hospital environment as a whole—not just the care of individual patients. Some even direct their hospital medicine group.
For many hospitalists, such activities may be auditions for progressively greater management responsibilities, eventually leading to physician executive positions, perhaps even leaving clinical practice behind. Experience as a hospitalist can be helpful when moving up the career ladder, say those who have followed this path, but advances also pose trade-offs in their working lives.
Hospital medicine can offer some of the best opportunities in all of healthcare for physicians to transition into administrative or executive positions, says SHM CEO Larry Wellikson, MD, FACP. “I believe that in 15 years or less, a quarter of hospital CEOs and half of hospital chief medical officers will have started their careers as hospitalists,” he predicts.
Such demand for hospitalists-turned-executives raises important implications for the field, and for SHM because many who make the transition will lack formal management training, says Dr. Wellikson.
“I keep hearing from 37-year-old hospitalists who are sitting at the table with healthcare management types,” he adds. “They feel they are at a distinct disadvantage because they never learned the essential management skills.”
SHM plans to explore collaborations with other healthcare organizations to develop a comprehensive management curriculum that could be completed by working hospitalists during one weekend a month over the course of several years. SHM already offers a four-day intensive Leadership Academy. (See “Society Pages,” p. 8.)
Defining Moments
Some of those who have made the transition say management is the last thing they expected to do when they entered medicine. One of these hospitalists is Russell L. Holman, MD, SHM president-elect and senior vice president and national medical director of Cogent Healthcare, Irvine, Calif.
“I believe my career has been marked by a series of defining moments, with one opportunity following another,” he says. “If you had asked me 15 years ago if I would be in this position, I’d have said, ‘Hell no!’ I had absolutely no interest in the business side of medicine and, frankly, I found it boring.”
Dr. Holman was initially drawn to internal medicine for the opportunity to establish long-term relationships with his patients, but then found that his residency training had really prepared him more for working in the hospital.
“I also found myself drawn to the challenge of the hospital environment and its very ill patients, with the opportunity to establish rapport and trust in a short period of time and achieve significant improvements in their care quickly,” he explains. He was also drawn to the environment. “I viewed the hospital as a complex setting to navigate, and I saw a lot of opportunities for improvement overall—which was also an opportunity for professional growth and accomplishment.”
During Dr. Holman’s year as chief resident, he realized that meetings with administrators and non-physician clinical personnel could be vehicles to accomplish larger goals. “I also began to experience the vicarious rewards that can be achieved from the accomplishments of others through the administrator’s role of making it easier for them to do their jobs,” he says.
Along the way, Dr. Holman’s mentors encouraged him to recognize an aptitude for management and seek additional opportunities to practice it. On his own, he recognized his need for professional development opportunities to acquire management skills. He took weekend seminars and attended conferences to help him learn how to run effective team meetings, communicate with colleagues, and approach financial reports. Combined interests in teaching and management led Dr. Holman to the chair of the SHM Leadership Development Task Force. He became course director for its Leadership Academy, first offered in 2005.
The Ideal Hospitalist Program
Stacy Goldsholl, MD, president of the Hospital Medicine Division of TeamHealth, Knoxville, Tenn., was a working hospitalist for 11 years before making the move.
“Along the way, I started to develop a real sense of what my own ideal hospital medicine program would look like, not just in terms of clinical excellence, but also physician professional satisfaction,” she says. Dr. Goldsholl worked in several hospitalist groups in different parts of the country, running one group and later setting up an 11-member hospitalist practice from scratch in Pennsylvania, with a 50% time commitment for administrative work.
“How did I prepare for that role? A lot of it is seat-of-your-pants, although a mentor had pointed me toward a physician management training course,” she said. Last year Dr. Goldsholl joined TeamHealth and became 100% administrative. “It’s a double-edged sword, giving up the clinical piece. Part of the success of any physician executive is having a passion for patient care. Clinical work is something I definitely miss. But the higher goal is to impact larger health systems.”
Dr. Goldsholl’s current job includes standardizing TeamHealth’s hospitalist practices nationwide, providing leadership for regional directors, and reporting on quality indicators. “But the biggest piece of my current job is business development—going out to meet with clients,” she explains. Those clients include hospital executives and potential acquisition partners.
“Is this a path for other hospitalists?” asks Dr. Goldsholl. “Absolutely. Not necessarily my exact role, but jobs like vice president of medical affairs for a hospital, patient safety officer, CEO, or medical director of a medical company. Those positions will be filled by hospitalists. Physicians who choose to be hospitalists already see themselves as change agents, so many will gravitate toward a leadership role. Young hospitalists with that same passion, once they come to understand the health care system, it ignites their passion to make things better on a larger scale.”
Hospitalist David Bowman, MD, has been executive director of the Tucson, Ariz., Region of IPC—the Hospitalist Company since 2000, after playing major roles in establishing medical practices and a physician’s organization. Today he is the only physician among the company’s executive directors. “Those guys are smart,” he says. “They look at medicine from a higher level.”
Dr. Bowman, like Drs. Holman and Goldsholl, sometimes thinks about pursuing a master’s degree. But he is reluctant to take the time away from what he is now doing.
“I don’t think I could go further than I have without the letters MBA after my name,” he speculates. “But I’m happy enough where I am and, if need be, I could still go back to hospitalist work.”
Dr. Bowman found his initial foray into administration as head of a five-member group practice. “At 7:30 at night I’d be signing checks,” he recalls. “If there was any money left over, the last check would be my own salary.”
Today his position is 75% administrative and 25% clinical. He has been able to get his fill of clinical work by taking hospitalist shifts evenings and weekends. “I don’t want to lose my medical skills, but I like administration much more than I thought I would,” he says. “What I have learned is just how much it takes to support the physician who walks up to the patient’s chart, opens it, writes an order for an MRI of the brain, and then closes the chart again. It’s mind-boggling how complex the system is in supporting that 30-second action—how many other people are involved in making it happen, all of the areas for potential error. That’s why we work so hard on patient safety—which has to start at the top and flow from there.”
Career Crossroads
Finding a significant administrative role is not an all-or-nothing proposition for working hospitalists, although directors of group practices sometimes struggle for their colleagues’ recognition of their need for dedicated administrative time.
Doctors face two significant crossroads as they gain progressive administrative responsibilities. For those with demanding executive positions, it may become necessary to give up clinical practice—a painful choice for doctors who have devoted years to mastering medical care. Physician executives eventually may also face the need to obtain a management degree such as an MBA or a master’s of health administration—or else find other, less time-consuming ways to learn essential management skills.
Patrick Cawley, MD, is a hospitalist who has not given up clinical work, even while his administrative responsibilities have grown. In his current position as executive medical director of Medical University of South Carolina (MUSC) Medical Center, Charleston, clinical duties take up about 30% of the job. He is just a couple of courses short of completing an MBA from the University of Massachusetts.
“Basically, I’m the hospital’s chief medical officer,” says Dr. Cawley. “A chief medical officer attends a lot of meetings. Most of my day is spent interacting with different people in the hospital—other administrators or one-on-one with physicians. My purview is quality, patient safety, and clinical effectiveness—providing the strategic vision for those activities and some level of detail in working projects through the system.” The role is part cheerleader and part task-master, he says, requiring skills in communications, negotiations and conflict management.
“There’s no doubt that I’m having trouble carving out 30% of my time for clinical work,” admits Dr. Cawley. “You end up missing a meeting here and there, and that’s not good. I know I’ll have to decrease my clinical time eventually.”
For now, however, Dr. Cawley is able to find clinical time in two- to three-hour increments, primarily for teaching and rounding with residents.
“Chief medical officers argue about this all the time: Should you be practicing medicine or not?” he says. “My personal take is that I prefer to do some clinical work. It keeps me involved in the day-to-day problems of physicians and the operations of the hospital. I don’t think I’ll ever give it up completely. For physician leaders, it’s important to be respected clinically, and it gives you a step up in professional relations.”
Dilemmas and Downsides
Research by Timothy Hoff of the University at Albany, N.Y., and others suggests that physician executives who continue to see patients part-time are happier in their jobs, says Winthrop Whitcomb, MD, a hospitalist at Mercy Medical Center in Springfield, Mass. Dr. Whitcomb is a member of SHM’s Career Satisfaction Task Force, which is also studying the issue. Also, when clinical commitments shrink, it can be a challenge to remain current with clinical skills, medical literature, and advances in healthcare technology and computerization.
“There is a danger in dropping out of medicine and pigeonholing yourself too early in your career—especially if you are taking an administrative job for the wrong reasons, such as temporary job frustrations,” warns Dr. Whitcomb. “It’s very hard to come back to clinical practice after giving it up.”
SHM’s Career Satisfaction Task Force is developing a career satisfaction self-assessment tool that would help working hospitalists make clearer assessments of the dilemmas of considering a career change.
Physician executives need to be clear on their loyalties as well as their stakeholders, adds Dr. Wellikson, who gave up his clinical practice in 2000. “At the end of the day, my value to my company was not in taking care of patients,” he says. “Yes, you need to keep yourself real in your relations with other doctors—but seeing patients is not the only way to do that. We don’t need Lee Iacocca building the cars he sells, even though he started as an automobile engineer.”
Dr. Wellikson reminds hospitalists that management “isn’t all fun and games. Your group expects you to fight for them. Not everybody sees you in the best light. Sometimes leadership can be lonely, and there’s no road map. You can’t always say ‘yes.’ Sometimes you need to fire colleagues.”
How to Get Started
When working hospitalists get exposed to administrative or quality improvement projects and opportunities, some of those projects will be successful and satisfying, while others will not. But even if their goal isn’t to become the CEO of a national organization, they can gain a sense of their interests and aptitudes. Other part-time administrative roles include associate medical director of a group practice, quality officer for the hospital, or medical director of informatics.
Just look around the hospital and see what’s broken, suggests Dr. Cawley. “Or else go down to the quality department and volunteer your services,” he advises. “There are innumerable tasks that need to be done. I would recommend starting small. Do projects that involve small groups working together. As the projects get bigger, they will involve more people, more resources, more measurement tools. This will then give you a sense of whether you want to continue in management.”
When a hospitalist gets appointed to a quality committee, it is important to be an active contributor. “Take a forward stance. Prepare for the meetings,” adds Dr. Holman. Go back to your constituency and have an active discussion about the project. By that very experience you will be viewed as a leader—and recognized leaders are the people who are given larger-scale opportunities.”
Dr. Goldsholl insists, “The way to be successful as a leader is to continue to be passionate about patient care. At the same time, continue to develop yourself with the tools and skills needed to make the case for hospital medicine. If you can do both, your chances of success are higher.”
It is also important to develop people skills—some of which can be learned. “Did I have all of those skills in the beginning?” asks Dr. Goldsholl. “Absolutely not. A certain maturity and ability to be flexible were acquired over time. At first I did not know how important it was in the first five minutes of a business conversation to ask the person I’m talking to about their children. That’s something else I didn’t learn in medical school.” TH
Larry Beresford is based in Oakland, Calif.
100,000 Lives Campaign Reduces VAP
In January 2005, the Institute for Healthcare Improvement (IHI) launched an ambitious campaign aimed at preventing unnecessary patient deaths and improving U.S. healthcare. Since then, IHI estimates that more than 122,300 lives have been saved.
Known as the “100,000 Lives Campaign,” the movement encourages hospitals to use evidence-based clinical interventions with the goal of preventing 100,000 avoidable deaths by June 2006. These interventions focus on six areas, one that includes the prevention of ventilator-associated pneumonia (VAP).
According to the IHI Web site, VAP occurs in up to 15% of patients receiving mechanical ventilation, making it a relatively common problem. Although data vary on how many fatalities result directly from VAP, it is widely agreed that those patients who are the sickest and using mechanical ventilators the longest run the greatest risk of dying from VAP or its related complications.
“If someone is on the ventilator one day, their risk is relatively low, but for each additional day they’re on the ventilator there’s a small increasing percentage that they will develop pneumonia,” says Greg Martin, MD, a pulmonary and critical care specialist at Atlanta’s Grady Memorial and Crawford Long hospitals. For the sickest patients who are on the respirator longest (for days or even weeks), the risk can add up quickly and become “quite substantial,” says Dr. Martin.
This risk is why IHI has encouraged hospitals to use what is known as a “ventilator bundle” to reduce the incidence of VAP in all mechanically ventilated patients unless the bundle is contraindicated. The ventilator bundle includes four components. The first two seek to prevent VAP, and the latter two seek to prevent VAP-related complications through prophylaxis of peptic ulcer disease (PUD) and deep vein thrombosis (DVT), unless contraindicated.
The first preventative component calls for elevating the head of the patient’s bed to 30 to 45 degrees, thereby reducing aspiration of gastric secretions. “If you look at all the interventions, it’s probably the most effective and simplest of them all—and costs nearly nothing,” says Dr. Martin.
Not quite as simple but proven effective, the IHI’s second component calls for sedation vacations; that is, interrupting or reducing the amount of sedation patients receive each day so they can be evaluated daily for extubation. Dr. Martin says studies show that sedation vacations allow many patients to come off the respirator more quickly and spend less time in the ICU, thereby saving money, time, and lives.
Vicki Spuhler, nurse manager of the respiratory ICU at Latter Day Saints Hospital, part of Intermountain Healthcare in Salt Lake City, says, “When the bundle is consistently applied, we consistently see a significant drop in VAP. Each element is important. But it’s the bundling and consistent, reliable application of the elements that make it effective.”
Joe McCannon, “100,000 Lives Campaign” manager, says several of the more than 3,100 participating hospitals have gone six months (some a year) with no reports of VAP.
“What that kind of result says to hospitals around the country is there are no more excuses,” explains McCannon. “You can’t say because of the type of facility we are, because of the type of resources we have, we can’t make this change.”
If using the ventilator bundle is proving effective, why is the bundle not used more often? “People don’t do it (use the bundle) for whole host of reasons,” says John P. Kress, MD, director of pulmonary and critical care procedure service at the University of Chicago’s Department of Medicine. “Those reasons run the spectrum from lack of awareness of the literature to skepticism about the quality of the studies to skepticism about the widespread applicability.”
Yet, these healthcare providers may want to carefully consider why they’re not using the ventilator bundle—or at least parts of it, he says. Sometimes hospitals aren’t in the position to apply all of the components; they’re not practical. But if that’s the case, institutions or individuals who claim there are difficulties may very well want to look long and hard at those problems. “They should think about ways to change the landscape so they can apply these things,” says Dr. Kress. “We need to take the evidence we have and apply it in a careful, thoughtful way to individual patients, and see what happens, and then respond in a careful way. You can’t blindly follow a protocol. You have to modify the individual protocol depending on the circumstances. A protocol is not a mindless cookbook. It’s a starting point, a launch pad.” TH
Robin Tricoles is managing editor of the Journal of Hospital Medicine.