User login
Community‐Acquired Pneumonia
Pneumonia may well be called the friend of the aged. Taken off by it in an acute, short, not often painful illness, the old man escapes those cold gradations of decay so distressing of himself and to his friends.
William Osler, MD, 1898
Community‐acquired pneumonia (CAP) is commonly defined as an infection of the pulmonary parenchyma that is associated with at least some symptoms and signs of acute infection, accompanied by the presence of an acute infiltrate on chest radiograph, in a patient not hospitalized or residing in a long‐term‐care facility for 14 days prior to the onset of symptoms.1 CAP continues to be a common and serious illness, causing substantial morbidity and mortality in the adult population. There are an estimated 56 million cases a year in the United States, with greater than 1 million hospitalizations. Community‐acquired pneumonia is one of the most common admitting diagnoses among adults, and with a 30‐day mortality between 10% and 14% for patients admitted to the hospital, it is the leading cause of infectious death in the United States.2 In elderly patients, hospitalization for CAP portends a poor long‐term prognosis. In a Medicare database, the 1‐year mortality for patients with CAP was nearly 40%, compared to 29% in patients with other diagnoses.3 Community‐acquired pneumonia is a model illness in hospital medicineit is a common disease that allows for evidence‐based and cost‐effective management. In addition, many national organizations have proposed multiple quality indicators for community‐acquired pneumonia, thus providing an opportunity for institutional quality improvement. This review article outlines the assessment and management of patients admitted to the hospital with community‐acquired pneumonia.
Etiology
Although many pathogens can cause community‐acquired pneumonia, the clinical syndromes and microbiology of CAP have traditionally been characterized as either typical or atypical. The typical organisms include Streptococcus pneumoniae, Haemophilus influenzae, and Moraxella catarrhalis, and the atypical organisms include Chlamydia spp., Mycoplasma pneumoniae, Legionella spp., and viruses. This historical distinction has recently come into question. It is now clear that the presenting symptoms, signs, and basic laboratory findings (including the chest radiograph) cannot be reliably used to predict the etiologic pathogen or to distinguish typical from atypical organisms.4 Rather, the specific causative agent of CAP depends more on the degree of patient illness. Table 1 shows what prospective studies with comprehensive diagnostic strategies determined to be the most common pathogens in patients hospitalized for CAP in ICU and non‐ICU settings.5 Streptococcus pneumoniae remains the most common cause of CAP in hospitalized patients and is the most common cause of fatal pneumonia, whereas Legionella spp. is a common cause of severe CAP, more often found in patients requiring admission to the intensive care unit. Gram‐negative bacilli can cause CAP in elderly patients and those recently treated with broad‐spectrum antibiotics or with underlying lung disease. Notably, though, despite improved diagnostic testing, only one quarter of all admitted patients with CAP have the etiologic agent defined, and therefore empiric therapy should be directed broadly at the most likely organisms.6
| Non‐ICU inpatients | ICU inpatients (severe) |
|---|---|
| S. pneumoniae | S. pneumoniae |
| M. pneumoniae | Legionella spp |
| C. pneumoniae | H. influenzae |
| H. influenzae | Gram‐negative bacilli |
| Legionella spp | S. aureus |
| Aspiration | |
| Respiratory viruses |
Clinical Presentation
Patients admitted to the hospital with CAP typically present with a brief history of respiratory complaints, including cough (greater than 90%), dyspnea (66%), sputum production (66%), and pleuritic chest pain (50%); see Table 2.7, 8 In 10%30% of patients, nonrespiratory complaints predominate, including headache, myalgias, fatigue, and gastrointestinal symptoms.6 Elderly patients, an increasing percentage of hospitalized patients, are less likely to present with typical CAP symptoms (such as cough) and more likely to have altered mental status as a presenting symptom.9
| Symptoms | Signs (exam) |
|---|---|
| Cough 90% | Fever 80% |
| Dyspnea 66% | Tachypnea 70% |
| Sputum 66% | Tachycardia 50% |
| Pleuritic chest pain 50% | Focal lung exam >90% |
On physical examination, patients with CAP usually have signs of fever (80%), tachypnea (70%), and tachycardia (50%); see Table 2. Most will have a focal lung exam (>90%) with findings ranging from crackles to bronchial breath sounds.10 No exam finding is specific for the diagnosis of pneumonia, but the absence of fever, tachycardia, and tachypnea significantly reduces the probability of CAP in patients with suspected pneumonia.10 Furthermore, similar to the clinical history, the physical examination of elderly patients with community‐acquired pneumonia is not specific or sensitive for the diagnosis of CAP. For example, up to 40% of elderly patients subsequently determined to have CAP may not have fever.11
Leukocytosis is common in patients with CAP; however, its absence does not rule out disease.12 A number of guidelines recommend laboratory evaluation of electrolytes, urea nitrogen, creatinine, liver enzymes, and bilirubin, although these are used primarily for prognostication and are not specifically useful in the diagnosis of CAP.
DIAGNOSIS
Differential Diagnosis
Given the nonspecific nature of the symptoms and signs associated with CAP, there is no single clinical feature or combination of clinical features that adequately rules in or out the diagnosis of CAP. Consequently, the differential diagnosis to be considered in patients with suspected CAP is broad. Noninfectious diseases can often present with similar clinical syndromes; these include congestive heart failure, exacerbation of chronic obstructive pulmonary disease (COPD), asthma, pulmonary embolism, and hypersensitivity pneumonitis. These diseases can often be distinguished with a thorough history and physical examination.
In addition, other upper‐ and lower‐airway infectious diseases can have similar nonspecific signs and symptoms. In particular, pneumonia must often be differentiated from acute bronchitis, which as a diagnosis accounts for up to 40% of patients evaluated for cough (versus 5% for pneumonia).10 Patients with acute bronchitis frequently do not present with high fevers or hypoxia and in general will not benefit from antibiotic therapy.13 Patients believed to have community‐acquired pneumonia might also be suffering from other pneumonia syndromes including aspiration pneumonia, postobstructive pneumonia, and pneumonia in immunocompromised patients (eg, those with HIV, on steroids, receiving chemotherapy). Determining the correct diagnosis can have implications for therapy and prognosis.
Diagnostic Studies
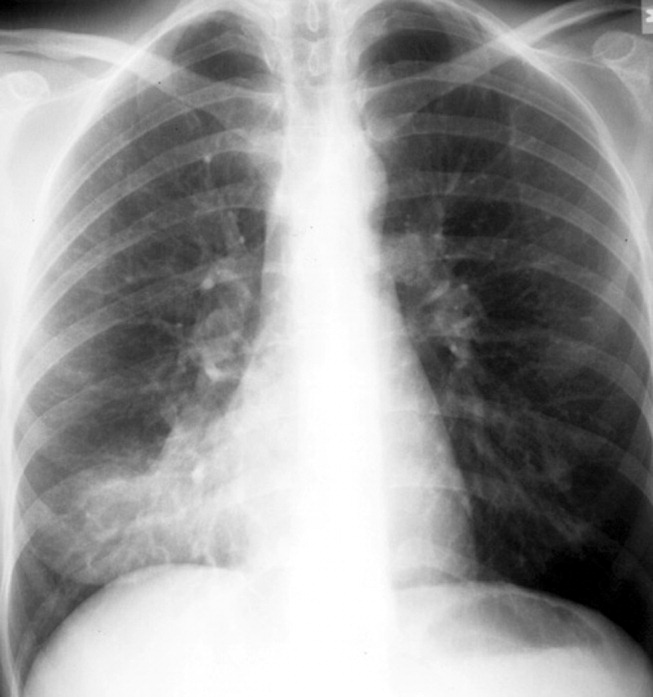
The diagnosis of community‐acquired pneumonia requires that a patient have both signs and symptoms consistent with pulmonary infection and evidence of a new radiographic infiltrate. Therefore, most guidelines recommend that all patients with a possible diagnosis of CAP be evaluated with chest radiography.1, 14, 15
The specific radiographic findings in community‐acquired pneumonia range from lobar consolidation to hazy focal infiltrate to diffuse bilateral interstitial opacities (see Figure 1). Although chest radiography has traditionally been considered the gold standard for the diagnosis of CAP, its exact performance characteristics are unknown, and it is clearly not 100% sensitive or 100% specific. The utility of the chest radiograph can be limited by patient body habitus, underlying lung disease, or dehydration. Computed tomography (CT) scanning, although not recommended for routine use, can identify pulmonary consolidation in up to 30% of patients with a normal or equivocal chest radiograph in whom pneumonia is suspected and can also identify complications of pneumonia including an empyema or pulmonary abscess.16
Limitations in the performance of the chest radiograph have resulted in an interest in the diagnostic performance of serologic markers of infection such as C‐reactive protein (CRP), procalcitonin, and soluble triggering receptor expressed on myeloid cells (s‐TREM).1719 Preliminary evidence suggests these inflammatory markers may ultimately prove useful in differentiating infectious from noninfectious pulmonary processes, but regular use of these new tests cannot currently be recommended.
Most expert guidelines state that 2 sets of blood cultures should be taken and analyzed prior to antibiotic administration in all patients admitted to the hospital with suspected community‐acquired pneumonia.1, 14, 15 Isolation of bacteria from blood cultures in CAP is a very specific way to identify a causative organism in order to subsequently narrow therapy and also identifies a high‐risk group of patients because bacteremia is associated with increased mortality. Obtaining blood cultures within 24 hours of admission has been associated with 10% lower odds of 30‐day mortality in patients with CAP,20 and as a result, drawing blood cultures prior to antibiotic administration is a national quality indicator for CAP.
There are, however, a number of problems with the routine acquisition of blood cultures in all patients admitted with CAP. Practically, the cultures can be difficult to obtain, can potentially delay the initiation of antibiotics, and are often contaminated, which has been shown to increase both cost and length of stay.21, 22 The yield is generally low: the true‐positive bacteremia rate for admitted patients with CAP ranges from 6% to 9%, and the culture results rarely change management or outcomes.23, 24 Given these limitations, many have argued that blood cultures should be obtained with a more targeted approach. A recent study used a Medicare database to create a decision‐support tool to help maximize the value of blood cultures in CAP.25 The predictors of a positive blood culture are shown in Table 3. Not obtaining cultures on patients who had received prior antibiotics or had no risk factors resulted in about 40% fewer overall cultures while identifying approximately 90% of bacteremias. In their guidelines, the British Thoracic Society (BTS) advocates a similar strategy, recommending blood cultures be omitted in nonsevere pneumonia and in patients without comorbidities.15, 26 Although recommendations vary for non‐severe CAP in hospitalized patients, all professional society guidelines agree that blood cultures should be obtained in critically ill patients, and if cultures are obtained, they should be drawn prior to antibiotics.1, 14, 15, 26
| Comorbidities |
| Liver disease |
| Vital signs |
| Systolic blood pressure < 90 mm Hg |
| Temperature < 35C or 40C |
| Pulse 125 beats/min |
| Laboratory and radiographic data |
| Blood urea nitrogen (BUN) 30 mg/dL |
| Sodium < 130 mmol/L |
| White blood cells < 5000/mm3 or > 20,000/mm3 |
| Prior use of antibiotics (negative predictor) |
Substantial controversy surrounds the utility of routine sputum gram stains and cultures for patients admitted to the hospital with CAP. The Infectious Disease Society of America (IDSA) and the British Thoracic Society (BTS) both recommend that all patients admitted to the hospital with community‐acquired pneumonia should have a gram stain and culture of expectorated sputum.1, 15, 26 Both organizations argue sputum collection is a simple and inexpensive procedure that can potentially identify pathogenic organisms and can affect both initial and long‐term antibiotic therapy. Most notably, they highlight gram stain specificity of greater than 80% for pneumococcal pneumonia. Conversely, the American Thoracic Society (ATS) argues that sputum gram stains and cultures generally have low sensitivity, specificity, and positive predictive value.14 Furthermore, they argue the utility of sputum testing is also limited practically; in one study 30% of patients could not produce an adequate sputum specimen and up to 30% had received prior antibiotic therapy, substantially reducing the yield.27 In another study, good‐quality sputum with a predominant morphotype could be obtained in only 14% of patients admitted with CAP.28 However, targeting sputum analysis to patients who have not received prior antibiotics and are able to produce an adequate sample improved the yield significantly.29 In addition, with increasing rates of antibiotic resistance among common community isolates (ie, S. Pneumoniae) and the increasing prevalence of infecting organisms not targeted by routine empiric therapy (methicillin‐resistant Staphylococcus Aureus [MRSA]), isolation of potential causative pathogens is increasingly important. We believe that severely ill patients with CAP (such as patients admitted to the ICU), as well as patients with identifiable risk factors for uncommon or drug‐resistant pathogens (eg, Pseudomonas aeruginosa, enteric gram‐negative rods, MRSA, etc.) should have sputum sent for gram stain and culture. Ideally, sputum obtained for gram stain and culture should be:
-
Prior to antibiotic therapy,
-
A deep‐cough, expectorated specimen,
-
A purulent specimen (>25 polymorphonucleacytes and less than 10 squamous cells per high‐powered field), and
-
Rapidly transported to the laboratory.
Subsequent gram stain and culture results should be interpreted in the specific clinical context and antibiotic choices targeted appropriately.
Alternative Diagnostic Tests
In recent years, there has been growth in additional diagnostic tests targeting specific organisms. The pneumococcal urinary antigen assay is a relatively sensitive (50%80%) and highly specific (90%) test for the detection of pneumococcal pneumonia, when compared with conventional diagnostic methods.27 The test is simple, convenient, rapid ( 15 min), and, with its high specificity, may allow for more focused antimicrobial therapy early in management. Current limitations include the possibility of false‐positive tests in patients colonized with S. pneumoniae or infected with other streptococcal species, as well as the inability to determine antibiotic sensitivity from positive tests. Updated IDSA and BTS guidelines state pneumococcal urinary antigen testing is an acceptable adjunct to other diagnostic tests, but blood and sputum analyses should still be performed.26, 27 For patients with suspected Legionella pneumonia (primarily critically ill and immunocompromised patients or in association with regional outbreaks), the urinary Legionella antigen assay is the test of choice, which detects 80%95% of community‐acquired cases of Legionnaires' disease with a specificity of 90%.27
During the winter months (typically from October to March), rapid antigen testing for influenza is generally recommended for patients with signs or symptoms consistent with influenza.27 The sensitivity of these tests is approximately 50%70%, so negative test results do not exclude the diagnosis, but results can be important epidemiologically and therapeutically (differentiating influenza A and B strains).27 Diagnostic tests targeting other common CAP pathogens, such as serologic tests for Mycoplasma pneumoniae or Chlamydia spp, should not be routinely performed. Testing for less common causative pathogens such as Mycobacterium tuberculosis should only be employed in the appropriate clinical setting.
ADMISSION DECISION
Once the diagnosis of CAP has been made, the initial site where treatment will occur, whether the hospital or the home, must be determined. The decision to hospitalize should be based on 3 factors: 1) evaluation of the safety of home treatment, 2) calculation of the Pneumonia Severity Index (PSI), and 3) clinical judgment of the physician.27 The PSI, or PORT (Pneumonia Outcomes Research Team) score, is a validated prediction rule that quantifies mortality and allows for risk stratification of patients with community‐acquired pneumonia.2 The PSI combines clinical history, physical examination, and laboratory data at the time of admission to divide patients into 5 risk classes and to estimate 30‐day mortality (Figure 2), which ranges from 0.1% of patients in risk class I to 27.0% in risk class V.2
On the basis of the estimated prognosis and in the absence of concerns about home safety or comorbidities, patients in risk classes I, II, and III should be managed at home. Many prospective trials have shown that implementation of PSI significantly increases the number of low‐risk patients managed outside the hospital, with no differences in quality of life, complications, readmissions, or short‐term mortality.30, 31 Most recently, a trial randomizing patients in risk classes II and III to treatment in the hospital or at home found no significant differences in clinical outcomes but did find that patients were more satisfied with care at home.32 Because the number of patients with CAP being treated at home is increasing, the American College of Chest Physicians recently published a consensus statement on the management of community‐acquired pneumonia in the home.33 All national guidelines for the management of community‐acquired pneumonia recommend using the PSI to help determine the initial location of treatment, with the caveat that using the prediction rule should never supersede clinical judgment in the decision about whether to admit.1, 14, 15, 26, 27 A practical decision tree for the use of the PSI is shown in Figure 3.
There are no reliable prediction rules for deciding on whether admission to the intensive care unit is necessary. Hemodynamic instability requiring resuscitation and monitoring or respiratory failure requiring ventilatory support are clear indications for ICU admission. Additional variables such as tachypnea (respiratory rate 30), altered mental status, multilobar disease, and azotemia are associated with severe CAP and should prompt consideration of ICU admission, especially when 2 or more variables coexist.14
TREATMENT
Initial Treatment
Once the admission decision is made and the initial diagnostic tests are completed (including blood and sputum cultures), patients with presumed community‐acquired pneumonia should receive necessary supportive care (O2, intravenous fluids, etc.) and prompt antimicrobial therapy. Antibiotics should be administered within 4 hours of arrival to patients with suspected CAP, as such prompt administration may be associated with shorter in‐hospital stays and decreased 30‐day mortality.34, 35 Regulatory organizations such as the Joint Commission on Accreditation of Healthcare Organizations (JCAHO) and the Center for Medicare Services (CMS) have made delivery of antibiotics in less than 4 hours a hospital quality measure.
Despite diagnostic testing, the specific etiologic agent causing the pneumonia of a patient remains unknown in up to 75% of those admitted to the hospital.14 Most expert guidelines therefore recommend broad‐spectrum empiric therapy targeting both the typical and the atypical organisms that commonly cause CAP (Table 1).
Recommendations for empiric antibiotics are driven by 2 key factors: antibiotic resistance by S. pneumoniae and the results of studies of CAP treatment outcomes. Historically, patients with suspected community‐acquired pneumonia were treated with penicillin with generally good outcomes. Recently, the rate of S. pneumoniae isolates resistant to penicillin has risen dramatically in the United States, ranging between 20% and 30%, with high‐level resistance (MIC 4 mg/L) as high as 5.7%.36, 37 Concurrently, the rates of resistance of S. pneumoniae to many other antibiotics commonly used to treat CAP have also risen.37 Despite increasing resistance overall, most U.S. pneumococcal isolates have low resistance to third‐generation cephalosporins and fluoroquinolones with enhanced activity against S. pneumoniae.3638 In addition, despite increasing resistance by pneumococcal isolates to penicillin, several observational studies have shown that regardless of initial therapy, resistance to penicillin as well as third‐generation cephalosporins is not associated with higher mortality or worse outcomes when controlled for other risk factors for drug resistance.39, 40 An exception to that rule is pneumococcal isolates that are very highly resistant to PCN (MIC 4 mg/dL). At least one study has shown that patients with such isolates may be at higher risk for adverse outcomes and should probably not be treated with penicillins.1, 14, 15, 41 However, nationally, fewer than 6% of pneumococcal isolates have this level of resistance.37
The rationale for empiric broad‐spectrum coverage against both typical and atypical organisms has arisen from many retrospective and observational studies that have suggested that there is clinical benefit and improved outcomes with such regimens. One large retrospective study showed that in elderly patients with CAP, fluoroquinolone monotherapy was associated with lower 30‐day mortality when compared to monotherapy with a third‐generation cephalosporin.34 Adding an extended‐spectrum macrolide (eg, azithromycin) to an extended‐spectrum ‐lactam (eg, ceftriaxone) in the treatment of patients hospitalized with nonsevere CAP also appears to be associated with improved outcomes. Adding a macrolide has resulted in shorter lengths of stay (LOS), less treatment failure, and lower mortality.34, 4244 Similarly, according to unpublished observations, adding doxycycline to a ‐lactam as initial therapy was associated with a benefit of decreased mortality.45 The presumed etiology of the benefit has been the addition of specific coverage of atypical organisms, such as Mycoplasma pneumoniae and Chlamydia pneumoniae, which are common causes of CAP (Table 1). Others have proposed that the benefit of therapy with macrolides may be derived from the inherent anti‐inflammatory properties of macrolides.46 Because research has shown a benefit of dual versus monotherapy across a spectrum of antibiotics, others have proposed the benefit is simply a result of receiving double antibiotic coverage. In particular, 2 studies found a benefit of reduced mortality from combination therapy over monotherapy in bacteremic pneumococcal pneumonia.47, 48
Yet the accumulated evidence for adding coverage of atypical organisms has been only retrospective and observational. Because of this, the recommendation to routinely add antibiotics active against atypical organisms has been questioned by some. Two recent meta‐analyses and a systematic review examined all the available data on the need for atypical coverage in the treatment of patients with community‐acquired pneumonia.4951 Surprisingly, none showed a benefit in clinical efficacy or survival in patients treated with agents active against both atypical and typical organisms when compared to regimens with only typical coverage. In subset analyses, there was a benefit to providing empiric atypical coverage in patients subsequently shown to have Legionella spp. as a causative pathogen. However, this organism was uncommon in all 3 studies. Unfortunately, most studies included in the meta‐analyses compared fluoroquinolone or macrolide monotherapy with third‐generation cephalosporin monotherapy. There have been no high‐quality randomized, controlled trials of the treatment of hospitalized patients with CAP assessing combination therapy covering both typical and atypical organisms with monotherapy targeting typical organisms alone. High‐quality trials are warranted.
Despite the recent articles questioning the importance of atypical coverage, citing the substantial retrospective data and the general inability to identify causative organisms in most cases of CAP, adding a second agent with atypical coverage to a ‐lactam currently appears to be the most efficacious empiric treatment for CAP. Nearly all expert guidelines for the management of community‐acquired pneumonia recommend this empiric approach.1, 14, 27
Table 4 displays our recommendations for the treatment of community‐acquired pneumonia requiring hospitalization. Before implementation of these guidelines, hospitalists should consult with their infectious disease experts and consider local resistance patterns. In general, a typical adult patient with non‐severe CAP without additional risk factors should receive a parenteral extended‐spectrum ‐lactam plus either doxycycline or an advanced macrolide (see Table 4). Extended‐spectrum ‐lactams include cefotaxime, ceftriaxone, ampicillin‐sulbactam, and ertapenem. A respiratory fluoroquinolone as a single agent can be used for non‐ICU patients with CAP, but some agencies, including the Centers for Disease Control (CDC), discourage routine use of these agents in all patients secondary to concerns about cost and increasing gram‐negative rod fluoroquinolone resistance.52, 53
| Patient group | Empiric antibiotic therapy |
|---|---|
| |
| Inpatient, non‐ICU | ‐Lactama + either doxycycline or an advanced macrolideb |
| Severe ‐lactam allergyc | Respiratory fluoroquinoloned |
| Inpatient, ICU | |
| No risk for Pseudomonas | ‐Lactam + either an advanced macrolide or a respiratory fluoroquinolone |
| Severe ‐lactam allergy | Respiratory fluoroquinolone + clindamycin |
| Pseudomonas risk factorse | Antipseudomonal ‐lactamf + an antipseudomonal fluoroquinoloneg |
| Severe ‐lactam allergy | Aztreonam + a respiratory fluoroquinolone |
| MRSA risk factorsh | Add vancomycin to above regimens |
| From nursing home | Should be treated as nosocomial/health‐care‐associated pneumonia |
| Aspiration pneumonia | ‐Lactam or respiratory fluoroquinolone clindamycini |
Patients hospitalized with severe CAP who require ICU‐level care are at increased risk of Legionella spp. and drug‐resistant S. pneumoniae, which must be reflected in their initial antibiotic therapy.5 Patients with severe pneumonia should receive an intravenous extended‐spectrum ‐lactam plus either an intravenous macrolide or an intravenous respiratory fluoroquinolone.
All patients with severe CAP who are admitted to the intensive care unit should be routinely screened for risk factors for Pseudomonas aeruginosa. The known risk factors for pseudomonal infection are: bronchiectasis, immunosuppression including more than 10 mg/day of prednisone, malnutrition, and treatment with broad‐spectrum antibiotics in the last month.14 Those at risk for Pseudomonas aeruginosa or other resistant gram‐negative rod infection should be treated with an antipseudomonal ‐lactam plus an antipseudomonal fluoroquinolone. Many patients with severe CAP have risk factors for MRSA infection including recent prolonged hospitalization, recent use of broad‐spectrum antibiotics, and significant underlying lung disease, which should be considered in choosing initial antibiotic therapy.54 In addition, there have been reports of patients without underlying risk factors presenting with severe community‐acquired MRSA pneumonia. Many of these patients were younger and the MRSA pneumonia was associated with a necrotizing or cavitary disease requiring prolonged ICU stays.5558 In such cases or if an institution's rate of methicillin resistance in S. aureus community isolates is high (>15%20%), it may be appropriate to add initial empiric MRSA coverage for patients admitted to the ICU with CAP.55
Some patients will have unique risk factors and clinical presentations, which may require modification of these empiric recommendations. Several studies found 5%15% of cases of community‐acquired pneumonia to be aspiration pneumonia.57 Risk factors for aspiration events include, among others, dysphagia, history of stroke, altered level of consciousness, poor dentition, and tube feeding. Aspiration pneumonia traditionally was believed to be secondary to oral anaerobes, but recent research suggests gram‐positive cocci and gram‐negative rods are the predominant organisms.58 Antibiotic therapy in patients with clear aspiration pneumonia should be directed at these microbes with an extended‐spectrum ‐lactam (eg, ceftriaxone) or a respiratory fluoroquinolone (eg, levofloxacin or moxifloxacin). Anaerobic bacterial coverage can be added in patients with severe periodontal disease, alcoholism, concern for empyema, or evidence of aspiration with pulmonary abscess.58
Patients residing in long‐term care facilities are at high risk of contracting pneumonia. The microbiology of infections acquired in nursing facilities is similar to that in hospital‐acquired cases.59, 60 As a result, patients who develop pneumonia in institutional settings such as nursing homes should be treated with broad‐spectrum antibiotics, including coverage for MRSA.
Subsequent Treatment
Initial empiric antibiotic treatment should be modified based on the results of diagnostic testing. Although the specific etiologic agent is determined in only 25% of cases of CAP,35 when an organism is isolated, antibiotic coverage should be narrowed to cover that particular organism with an antibiotic with adequate lung penetration. Evidence suggests clinicians often do not adjust or narrow antibiotics based on sensitivity results, potentially breeding resistant organisms.61
Patients hospitalized with CAP usually improve quickly if they receive early, appropriate antibiotic therapy and supportive care. Excluding patients with severe CAP requiring intensive care unit admission, most patients resolve their tachycardia, tachypnea, and fever by day 2 or 3.62 Recent practice experience, evidence, and published guidelines14, 27 all indicate that patients can safely be transitioned to oral antibiotic therapy earlier in their hospital course. Table 5 outlines criteria that can be used to identify patients who have had an adequate response to parenteral therapy and can be considered for a switch to oral antibiotics. If these criteria are met, patients have less than a 1% chance of clinical deterioration necessitating admission to an ICU or transitional care unit.62 When an etiologic organism is not identified, oral therapy should reflect a spectrum of coverage to that of the initial intravenous therapy. In some cases, this may require use of more than one oral agent. We have had success, however, transitioning non‐ICU patients initially treated with intravenous ceftriaxone plus oral doxycycline, typically for 4872 hours, to oral doxycycline monotherapy at discharge.45
| Stable vital signs and clinical criteria for 24 hours |
| Temperature 37.8C (100F) |
| Heart rate 100 beats per minute |
| Respiratory rate 24 breaths per minute |
| Systolic blood pressure 90 mm Hg |
| Oxygen saturation (on room air) 90% |
| Ability to take oral medications |
There have been a limited number of high‐quality randomized trials examining the optimal duration of treatment for community‐acquired pneumonia. Most practice guidelines recommend 710 days for patients with CAP requiring hospitalization, with 14 days for documented Mycoplasma pneumoniae or Chlamydia pneumoniae. One recent randomized trial of patients with mild to severe CAP showed a short course of high‐dose levofloxacin (750 mg daily 5 days) was at least as effective as normal dosing (500 mg daily 10 days).63 Clinical experience with high‐dose levofloxacin is limited, but this regimen can be considered because it may reduce costs and exposure to antibiotics. When diagnosed, Legionella is usually treated for 1021 days, but 14 days is adequate with macrolides because of their long half‐life.27 Patients with more virulent pathogens like Staphylococcus aureus or Pseudomonas aeruginosa or other suppurative complications should be treated for at least 14 days.1, 14, 15, 27 In determining length of therapy, clinicians should use these durations of treatment as guides, and to individualize therapy, they should always consider patient age and frailty, comorbid conditions, severity of illness, and hospital course.
Failure to Respond
Although most patients hospitalized for CAP will improve rapidly and reach clinical stability in 23 days, some patients fail to respond. Some studies have estimated that failure to improve or clinical deterioration occurs in 5%10% of patients in the first 23 days.64 The common reasons for clinical decline or nonresponse to treatment, highlighted in Table 6, are:
-
Incorrect diagnosis: Illnesses such as congestive heart failure, pulmonary embolism, neoplasms, and hypersensitivity pneumonitis can mimick CAP.
-
Inadequate antibiotic selection: The etiologic agent may be resistant to empiric antibiotic selections. Examples would include methicillin‐resistant Staphylococcus aureus (MRSA) or multiresistant gram‐negative bacilli.
-
Unusual pathogen: CAP syndromes can be caused by myriad unusual organisms including Pneumocystis jirovecii, mycobacterium tuberculosis, endemic fungal infections (eg, coccidioidomycosis), and nocardiosis.
-
Complications of pneumonia: Specific complications of CAP include empyema, pulmonary abscess, extrapulmonary spread including meningitis or endocarditis, or other organ dysfunctions such as renal failure or myocardial infarction.
-
Inadequate host response: Despite appropriate antibiotic and supportive therapy, patients with CAP often fail to respond.
| Incorrect diagnosis of CAP. |
| Inadequate or inappropriate antibiotic selection for CAP. |
| Unusual pathogen causing CAP. |
| Pulmonary or extrapulmonary complication of CAP. |
| Inadequate or poor host response. |
Progressive pneumonia despite appropriate therapy and empyema were the most common causes of failure to respond in the first 72 hours in a recent study.64 Risk factors for early failure were older age (>65 years), Pneumonia Severity Index > 90, Legionella pneumonia, gram‐negative pneumonia, and initial antimicrobial therapy discordant with final culture and susceptibility results. The initial evaluation of the nonresponding patient should address these common causes and is likely to include additional imaging (CT), sampling of potential extrapulmonary infection (thoracentesis), and, in some cases, bronchoscopy.
DISCHARGE/FOLLOW‐UP PLANS
Patients hospitalized for community‐acquired pneumonia can be safely discharged when they have reached clinical stability, are able to tolerate oral medications, have no other active comorbid conditions, and have safe, close, appropriate outpatient follow‐up (see Table 7). Clinical pathways employing these discharge criteria have been found to be safe and effective in reducing the length of stay for CAP. Most important, patients should have met most if not all of the vital sign and clinical criteria noted in Table 5 in the criteria for switching to oral therapy. Patients with 2 or more abnormal vital signs (instabilities) within 24 hours prior to discharge are at high risk of readmission and mortality, but those with one or no abnormal vital signs generally have good outcomes.65 Absent other clinical factors or extenuating circumstances (persistent hypoxia, poor functional status, etc.), most patients with CAP should reach clinical stability by day 3 or 4, be considered for a switch to oral therapy, and, if stable, be discharged shortly thereafter.
| Patients should: |
|
Meet clinical criteria in Table V. |
| Be able to tolerate oral medications (no need to observe for 24 hours on oral therapy). |
| Have no evidence of active comorbid conditions (myocardial ischemia, pulmonary edema, etc.). |
| Have a normal mental status (or have returned to their baseline). |
| Have safe, appropriate outpatient follow‐up. |
When patients with CAP are discharged from the hospital, they should be counseled about the expected course of recovery. Most important, patients and families must be informed that many symptoms of CAP may persist well after hospitalization. In one study, up to 80% of patients reported persistent cough and fatigue 1 week after discharge, and up to 50% still had dyspnea and sputum production. In some, the cough can last for 46 weeks.8
All patients discharged after treatment of community‐acquired pneumonia should have follow‐up with their outpatient provider. The physician responsible for their inpatient care should communicate directly with the provider and outline the hospital course, the discharge medications, and the duration of antibiotic therapy. There is no specific time frame within which patients must be seen, but follow‐up should be dictated by patient age, comorbidities, clinical stability at discharge, and degree of illness. The American Thoracic Society guidelines do recommend patients with a substantial smoking history who are hospitalized with CAP have a follow‐up chest radiograph 46 weeks after discharge to establish a radiographic baseline and exclude the possibility of underlying malignancy.14 However, several studies have suggested that radiographic resolution may take 3 or more months in some patients, especially the elderly and those with multilobar disease.66
PREVENTION
Prevention of community‐acquired pneumonia and pneumonic syndromes has traditionally relied on vaccination with the polysaccharide pneumococcal pneumonia vaccine and the seasonal influenza vaccine. The vaccine for S. pneumoniae used in adults is composed of the 23 serotypes that cause 85%90% of the invasive pneumococcal infections in the United States. Although in randomized trials the vaccine has not consistently prevented community‐acquired pneumonia or death in elderly patients or those with comorbidities, it likely prevents invasive pneumococcal infection.67 National guidelines and the CDC recommend the pneumococcal vaccine be given to all patients older than 65 years and those with chronic medical conditions.1, 14, 15
The seasonal influenza vaccine has clearly been shown to decrease influenza‐related illness in elderly and high‐risk patient populations. As well, in a meta‐analysis and a large observational study of patients older than 65 years, vaccination against influenza prevented pneumonia, hospitalization, and death.68, 69 Vaccination of health care workers may also confer a benefit to elderly patients of reduced mortality. The CDC recommends the influenza vaccine for all patients more than 50 years old, those with comorbidities, those at high risk for influenza, and health care workers in both inpatient and outpatient settings.
Pneumococcal and influenza vaccination have traditionally been relegated to the outpatient setting. National guidelines and the CDC recommend vaccination of all eligible hospitalized patients. Vaccination is safe and effective with almost any medical illness, and both vaccines can be given simultaneously at discharge.69 Both JCAHO and CMS have defined administration of the pneumococcal and influenza vaccines to patients hospitalized with CAP as a quality measure. Using standing orders is the most effective means of ensuring vaccination.
Some evidence suggests that tobacco smokers are at increased risk of invasive pneumococcal disease or pneumonia.70 Patients hospitalized (for all illnesses, but for CAP in particular) should be counseled about smoking cessation and offered pharmacotherapy and outpatient follow‐up. And, finally, recent observational data suggests that use of acid suppressive therapy, including proton pump inhibitors and H‐2 receptor antagonists, may be associated with an increased risk of developing CAP.71 Patients using these agents who are admitted with CAP should have their indications for treatment reviewed, especially when the pneumonia has been recurrent and there is no clear indication for continued use of acid suppressive therapy, in which case they should be discontinued in the hospital.
CONCLUSIONS
Community‐acquired pneumonia remains a common cause for hospitalization of adult patients, with significant associated morbidity and mortality. Although there are multiple expert guidelines for the management of community‐acquired pneumonia, further research is urgently needed. Clinicians need improved diagnostic tests that enable an earlier and more accurate diagnosis of CAP. In addition, the etiologic agent causing CAP is rarely discovered; improved microbiologic studies might enable antibiotic therapy to be targeted to the organisms responsible. High‐quality randomized, controlled trials examining empiric antibiotic therapy in CAP are needed, especially related to the addition of agents covering atypical organisms. Last, the general management of patients hospitalized with CAP is marked by significant heterogeneity, and research and initiatives focusing on improving the quality and process of care of patients with CAP are needed.
- ,,,,,.Guidelines from the Infectious Disease Society of America. Practice guidelines for the management of community‐acquired pneumonia.Clin Infect Dis.2000;31:347–382.
- ,,, et al.A prediction rule to identify low‐risk patients with community‐acquired pneumonia.N Engl J Med.1997;336:243–250.
- ,,, et al.Pneumonia: still the old man's friend?Arch Intern Med.2003;163:317–323.
- ,,, et al.New and emerging etiologies for community‐acquired pneumonia with implications for therapy. A prospective multicenter study of 359 cases.Medicine.1990;69:307–316.
- .Community‐acquired pneumonia.Lancet.2003;362:1991–2001.
- ,,, et al.Processes and outcomes of care for patients with community‐acquired pneumonia: results from the Pneumonia Patient Outcomes Research Team (PORT) cohort study.Arch Intern Med.1999;159:970–980.
- ,.Management of community‐acquired pneumonia.N Engl J Med.2002;347:2039–2045.
- ,,, et al.Measuring symptomatic and functional recovery in patients with community‐acquired pneumonia.J Gen Intern Med.1997;12:423–430.
- ,,, et al.Influence of age on symptoms at presentation with patients with community‐acquired pneumonia.Arch Intern Med.1997;157:1453–1459.
- ,,.Does this patient have community‐acquired pneumonia? Diagnosing pneumonia by history and physical examination.JAMA.1997;278:1440–1445.
- ,,, et al.Community‐acquired pneumonia in very elderly patients: causative organisms, clinical characteristics, and outcomes.Medicine.2003;82:159–169.
- ,.Testing strategies in the initial management of patients with community‐acquired pneumonia.Ann Intern Med.2003;138:109–118.
- ,.Uncomplicated acute bronchitis.Ann Intern Med.2000;133:981–991.
- ,,, et al.American Thoracic Society: Guidelines for the management of community‐acquired pneumonia: diagnosis, assessment of severity, antimicrobial therapy, and prevention.Am J Respir Crit Care Med.2001;163:1730–1754.
- ,,, et al.British Thoracic Society guidelines for the management of community acquired pneumonia in adults.Thorax.2001;56:Suppl. 4,IV1–IV64.
- ,,,,.High‐resolution computed tomography for the diagnosis of community‐acquired pneumonia.Clin Infect Dis.1998;27:358–363.
- ,,, et al.Performance of a bedside C‐reactive protein test in the diagnosis of community‐acquired pneumonia in adults with acute cough.Am J Med.2004;116:529–535.
- ,,, et al.Effect of procalcitonin‐guided treatment on antibiotic use and outcome in lower respiratory tract infections: cluster‐randomised, single‐blinded intervention trial.Lancet.2004;363:600–607.
- ,,, et al.Soluble triggering receptor expressed on myeloid cells and the diagnosis of pneumonia.N Engl J Med.2004:350:451–458.
- ,,, et al.Quality of care, process, and outcomes in elderly patients with pneumonia.JAMA.1997;278:2080–2084.
- ,,,.Limited usefulness of initial blood cultures in community acquired pneumonia.Emerg Med J.2004;21:446–448.
- ,,.Contaminant blood cultures and resource utilization. The true consequences of false‐positive results.JAMA.1991;265:365–369.
- ,,, et al.The contribution of blood cultures to the clinical management of adult patients admitted to the hospital with community‐acquired pneumonia: a prospective observational study.Chest.2003;123:1142–1150.
- ,,, et al.Clinical utility of blood cultures in adult patients with community‐acquired pneumonia without defined underlying risks.Chest.1995;108:932–936.
- ,,,.Predicting bacteremia in patients with community‐acquired pneumonia.Am J Respir Crit Care Med.2004;169:342–347.
- British Thoracic Society. BTS Guidelines for the management of community acquired pneumonia in adults—2004 update. Available at: www.brit‐thoracic.org/guidelines.
- ,,,,,.Guidelines from the Infectious Disease Society of America. Update of guidelines for the management of community‐acquired pneumonia in immunocompetent adults.Clin Infect Dis.2003;37:1405–1433.
- ,,, et al.Assessment of the usefulness of sputum culture for diagnosis of community‐acquired pneumonia using the PORT predictive scoring system.Arch Intern Med.2004;164:1807–1811.
- ,,.Diagnostic value of microscopic examination of gram‐stained sputum and sputum cultures in patients with bacteremic pneumococcal pneumonia.Clin Infect Dis.2004;39(2):165–169.
- ,,, et al.Safely increasing the proportion of patients with community‐acquired pneumonia treated as outpatients: an interventional trial.Arch Intern Med.1998;158:1350–1356.
- ,,, et al.A critical pathway for treatment of community‐acquired pneumonia.JAMA.2000;283:2654–2655.
- ,,, et al.Outpatient care compared with hospitalization for community‐acquired pneumonia. A randomized control trial in low‐risk patients.Ann Intern Med.2005;142:165–172.
- ,,.Management of community‐acquired pneumonia in the home.Chest.2005;127:1752–1763.
- ,,,,.Associations between initial antimicrobial therapy and medical outcomes for hospitalized elderly patients with pneumonia.Arch Intern Med.1999;159:2562–2572.
- ,,,,.Timing of antibiotic administration and outcomes for Medicare patients hospitalized with community‐acquired pneumonia.Arch Intern Med.2004;164:637–644.
- ,,, et al.Increasing prevalence of multidrug‐resistant Streptococcus pneumoniae in the United States.N Engl J Med.2000;343:1917–1924.
- ,,, et al.Susceptibility patterns of Streptococcus pneumoniae isolates in North America (2002–2003): contemporary in vitro activities of amoxicillin/clavulanate and 15 other antimicrobial agents.Int J Antimicrob Agents.2005;25(4):282–289.
- ,,, et al.Antimicrobial resistance among Streptococcus pneumoniae in the United States: have we begun to turn the corner on resistance to certain antimicrobial classes?Clin Infect Dis.2005;41(2):139–148.
- ,,, et al.Pneumonia acquired in the community through drug‐resistant Streptococcus pneumoniae.Am J Respir Crit Care.1999;159:1835–1842.
- ,,, et al.Drug‐resistant pneumococcal pneumonia: clinical relevance and related factors.Clin Infect Dis.2004;38:787–798.
- ,,, et al.Mortality from invasive pneumococcal pneumonia in the era of antibiotic resistance, 1995–1997.Am J Public Health.2000;90(2):223–9.
- ,,, et al.Lower mortality among patients with community‐acquired pneumonia treated with a macrolide plus a beta‐lactam agent versus a beta‐lactam alone.Eur J Clin Microbiol Infect Dis2005;24:190–195.
- ,,,.Impact of initial antibiotic choice on clinical outcomes in community‐acquired pneumonia: analysis of a hospital claims‐made database.Chest.2003;123:1503–1511.
- ,,,.Antimicrobial selection for hospitalized patients with presumed community‐acquired pneumonia: a survey of nonteaching US community hospitals.Ann Pharmacother2000;34:446–452.
- ,,,,.J Hosp Med.2006;1:7–12.
- .Anti‐inflammatory effects of macrolides—an underappreciated benefit in the treatment of community‐acquired respiratory tract infections and chronic inflammatory pulmonary conditions?J Antimicrob Chemother.2005;55:10–21.
- ,,, et al.Addition of a macrolide to a beta‐lactam based empirical antibiotic regimen is associated with lover in‐hospital mortality for patients with bacteremic pneumococcal pneumonia.Clin Infect Dis.2003;36:389–395.
- ,,, et al.Combination antibiotic therapy lowers mortality among severely ill patients with pneumococcal bacteremia.Am J Respir Crit Care Med.2004;170:440–444.
- ,,,.Empiric antibiotic coverage of atypical pathogens for community‐acquired pneumonia in hospitalized adults.Cochrane Database Syst Rev.2005;2:CD004418.pub2.
- ,,.Effectiveness of β lactam antibiotics compared with antibiotics active against atypical pathogens in non‐severe community‐acquired pneumonia: meta‐analysis.Br Med J.2005;330:456.
- ,,,.Empirical atypical coverage for inpatients with community‐acquired pneumonia.Arch Intern Med.2005;165:1992–2000.
- ,,, et al.Antibiotic resistance among gram‐negative bacilli in US intensive care units: implications for fluoroquinolone use.JAMA.2003;289:885–888.
- ,,, et al.First‐generation fluoroquinolone use and subsequent emergence of multiple drug‐resistant bacteria in the intensive care unit.Crit Care Med.2005;33(2):283–289.
- ,.Etiology of community‐acquired pneumonia.Clin Chest Med.2005;26:47–55.
- .Community‐associated methicillin‐resistant Staphylococcus aureus: not only a cause of skin infections, also a new cause of pneumonia.Curr Opin Infect Dis.2005;18:123–124.
- ,,, et al.Severe community‐onset pneumonia in healthy adults caused by methicillin‐resistant Staphylococcus aureus carrying the Panton‐Valentine leukocidin genes.Clin Infect Dis.2005;40(1):100–107.
- ,,,.Fatal community‐associated methicillin‐resistant Staphylococcus aureus pneumonia in an immunocompetent young adult.Ann Emerg Med.2005;46:401–404.
- .Aspiration pneumonitis and aspiration pneumonia.N Engl J Med.2001;344:665–671.
- ,,, et al.Health care‐associated bloodstream infections in adults: a reason to change the accepted definition of community‐acquired infections.Ann Intern Med.2002;137:791–797.
- American Thoracic Society and theInfectious Diseases Society of America.Guidelines for the management of adults with hospital‐acquired, ventilator‐acquired, and healthcare‐associated pneumonia.Am J Respir Crit Care Med.2005;171:388–416.
- ,,, et al.Blood culture and susceptibility results and allergy history do not influence fluoroquinolone use in the treatment of community‐acquired pneumonia.Pharmacotherapy.2005;25(1):59–66.
- ,,, et al.Time to clinical stability in patients hospitalized with community‐acquired pneumonia: implications for practice guidelines.JAMA.1998;279:1452–1457.
- ,,, et al.High‐dose, short‐course levofloxacin for community‐acquired pneumonia: a new treatment paradigm.Clin Infect Dis.2003;37:752–760.
- ,,, et al.Causes and factors associated with early failure in hospitalized patients with community‐acquired pneumonia.Arch Intern Med.2004;164:502–508.
- ,,, et al.Instability on hospital discharge and the risk of adverse outcomes in patients with pneumonia.Arch Intern Med.2002;162:1278–1284.
- ,,,.Radiographic resolution of community‐acquired bacterial pneumonia in the elderly.J Am Geriatr Soc.2004;52(2):224–229.
- ,,,.Vaccines for preventing pneumococcal infection in adults.Cochrane Database Syst Rev.2003;4:CD000422.
- ,,,,.The efficacy of influenza vaccine in elderly persons: a meta‐analysis and review of the literature.Ann Intern Med.1995;123:518–527.
- ,,, et al.Influenza vaccination and reduction in hospitalizations for cardiac disease and stroke among the elderly.N Engl J Med.2003;348:1322–1332.
- ,,,.Proportion of community‐acquired pneumonia cases attributable to tobacco smoking.Chest.1999;116:375–379.
- ,,, et al.Risk of community‐acquired pneumonia and use of gastric acid‐suppressive drugs.JAMA.2004;292:1955–1960.
Pneumonia may well be called the friend of the aged. Taken off by it in an acute, short, not often painful illness, the old man escapes those cold gradations of decay so distressing of himself and to his friends.
William Osler, MD, 1898
Community‐acquired pneumonia (CAP) is commonly defined as an infection of the pulmonary parenchyma that is associated with at least some symptoms and signs of acute infection, accompanied by the presence of an acute infiltrate on chest radiograph, in a patient not hospitalized or residing in a long‐term‐care facility for 14 days prior to the onset of symptoms.1 CAP continues to be a common and serious illness, causing substantial morbidity and mortality in the adult population. There are an estimated 56 million cases a year in the United States, with greater than 1 million hospitalizations. Community‐acquired pneumonia is one of the most common admitting diagnoses among adults, and with a 30‐day mortality between 10% and 14% for patients admitted to the hospital, it is the leading cause of infectious death in the United States.2 In elderly patients, hospitalization for CAP portends a poor long‐term prognosis. In a Medicare database, the 1‐year mortality for patients with CAP was nearly 40%, compared to 29% in patients with other diagnoses.3 Community‐acquired pneumonia is a model illness in hospital medicineit is a common disease that allows for evidence‐based and cost‐effective management. In addition, many national organizations have proposed multiple quality indicators for community‐acquired pneumonia, thus providing an opportunity for institutional quality improvement. This review article outlines the assessment and management of patients admitted to the hospital with community‐acquired pneumonia.
Etiology
Although many pathogens can cause community‐acquired pneumonia, the clinical syndromes and microbiology of CAP have traditionally been characterized as either typical or atypical. The typical organisms include Streptococcus pneumoniae, Haemophilus influenzae, and Moraxella catarrhalis, and the atypical organisms include Chlamydia spp., Mycoplasma pneumoniae, Legionella spp., and viruses. This historical distinction has recently come into question. It is now clear that the presenting symptoms, signs, and basic laboratory findings (including the chest radiograph) cannot be reliably used to predict the etiologic pathogen or to distinguish typical from atypical organisms.4 Rather, the specific causative agent of CAP depends more on the degree of patient illness. Table 1 shows what prospective studies with comprehensive diagnostic strategies determined to be the most common pathogens in patients hospitalized for CAP in ICU and non‐ICU settings.5 Streptococcus pneumoniae remains the most common cause of CAP in hospitalized patients and is the most common cause of fatal pneumonia, whereas Legionella spp. is a common cause of severe CAP, more often found in patients requiring admission to the intensive care unit. Gram‐negative bacilli can cause CAP in elderly patients and those recently treated with broad‐spectrum antibiotics or with underlying lung disease. Notably, though, despite improved diagnostic testing, only one quarter of all admitted patients with CAP have the etiologic agent defined, and therefore empiric therapy should be directed broadly at the most likely organisms.6
| Non‐ICU inpatients | ICU inpatients (severe) |
|---|---|
| S. pneumoniae | S. pneumoniae |
| M. pneumoniae | Legionella spp |
| C. pneumoniae | H. influenzae |
| H. influenzae | Gram‐negative bacilli |
| Legionella spp | S. aureus |
| Aspiration | |
| Respiratory viruses |
Clinical Presentation
Patients admitted to the hospital with CAP typically present with a brief history of respiratory complaints, including cough (greater than 90%), dyspnea (66%), sputum production (66%), and pleuritic chest pain (50%); see Table 2.7, 8 In 10%30% of patients, nonrespiratory complaints predominate, including headache, myalgias, fatigue, and gastrointestinal symptoms.6 Elderly patients, an increasing percentage of hospitalized patients, are less likely to present with typical CAP symptoms (such as cough) and more likely to have altered mental status as a presenting symptom.9
| Symptoms | Signs (exam) |
|---|---|
| Cough 90% | Fever 80% |
| Dyspnea 66% | Tachypnea 70% |
| Sputum 66% | Tachycardia 50% |
| Pleuritic chest pain 50% | Focal lung exam >90% |
On physical examination, patients with CAP usually have signs of fever (80%), tachypnea (70%), and tachycardia (50%); see Table 2. Most will have a focal lung exam (>90%) with findings ranging from crackles to bronchial breath sounds.10 No exam finding is specific for the diagnosis of pneumonia, but the absence of fever, tachycardia, and tachypnea significantly reduces the probability of CAP in patients with suspected pneumonia.10 Furthermore, similar to the clinical history, the physical examination of elderly patients with community‐acquired pneumonia is not specific or sensitive for the diagnosis of CAP. For example, up to 40% of elderly patients subsequently determined to have CAP may not have fever.11
Leukocytosis is common in patients with CAP; however, its absence does not rule out disease.12 A number of guidelines recommend laboratory evaluation of electrolytes, urea nitrogen, creatinine, liver enzymes, and bilirubin, although these are used primarily for prognostication and are not specifically useful in the diagnosis of CAP.
DIAGNOSIS
Differential Diagnosis
Given the nonspecific nature of the symptoms and signs associated with CAP, there is no single clinical feature or combination of clinical features that adequately rules in or out the diagnosis of CAP. Consequently, the differential diagnosis to be considered in patients with suspected CAP is broad. Noninfectious diseases can often present with similar clinical syndromes; these include congestive heart failure, exacerbation of chronic obstructive pulmonary disease (COPD), asthma, pulmonary embolism, and hypersensitivity pneumonitis. These diseases can often be distinguished with a thorough history and physical examination.
In addition, other upper‐ and lower‐airway infectious diseases can have similar nonspecific signs and symptoms. In particular, pneumonia must often be differentiated from acute bronchitis, which as a diagnosis accounts for up to 40% of patients evaluated for cough (versus 5% for pneumonia).10 Patients with acute bronchitis frequently do not present with high fevers or hypoxia and in general will not benefit from antibiotic therapy.13 Patients believed to have community‐acquired pneumonia might also be suffering from other pneumonia syndromes including aspiration pneumonia, postobstructive pneumonia, and pneumonia in immunocompromised patients (eg, those with HIV, on steroids, receiving chemotherapy). Determining the correct diagnosis can have implications for therapy and prognosis.
Diagnostic Studies
The diagnosis of community‐acquired pneumonia requires that a patient have both signs and symptoms consistent with pulmonary infection and evidence of a new radiographic infiltrate. Therefore, most guidelines recommend that all patients with a possible diagnosis of CAP be evaluated with chest radiography.1, 14, 15
The specific radiographic findings in community‐acquired pneumonia range from lobar consolidation to hazy focal infiltrate to diffuse bilateral interstitial opacities (see Figure 1). Although chest radiography has traditionally been considered the gold standard for the diagnosis of CAP, its exact performance characteristics are unknown, and it is clearly not 100% sensitive or 100% specific. The utility of the chest radiograph can be limited by patient body habitus, underlying lung disease, or dehydration. Computed tomography (CT) scanning, although not recommended for routine use, can identify pulmonary consolidation in up to 30% of patients with a normal or equivocal chest radiograph in whom pneumonia is suspected and can also identify complications of pneumonia including an empyema or pulmonary abscess.16
Limitations in the performance of the chest radiograph have resulted in an interest in the diagnostic performance of serologic markers of infection such as C‐reactive protein (CRP), procalcitonin, and soluble triggering receptor expressed on myeloid cells (s‐TREM).1719 Preliminary evidence suggests these inflammatory markers may ultimately prove useful in differentiating infectious from noninfectious pulmonary processes, but regular use of these new tests cannot currently be recommended.
Most expert guidelines state that 2 sets of blood cultures should be taken and analyzed prior to antibiotic administration in all patients admitted to the hospital with suspected community‐acquired pneumonia.1, 14, 15 Isolation of bacteria from blood cultures in CAP is a very specific way to identify a causative organism in order to subsequently narrow therapy and also identifies a high‐risk group of patients because bacteremia is associated with increased mortality. Obtaining blood cultures within 24 hours of admission has been associated with 10% lower odds of 30‐day mortality in patients with CAP,20 and as a result, drawing blood cultures prior to antibiotic administration is a national quality indicator for CAP.
There are, however, a number of problems with the routine acquisition of blood cultures in all patients admitted with CAP. Practically, the cultures can be difficult to obtain, can potentially delay the initiation of antibiotics, and are often contaminated, which has been shown to increase both cost and length of stay.21, 22 The yield is generally low: the true‐positive bacteremia rate for admitted patients with CAP ranges from 6% to 9%, and the culture results rarely change management or outcomes.23, 24 Given these limitations, many have argued that blood cultures should be obtained with a more targeted approach. A recent study used a Medicare database to create a decision‐support tool to help maximize the value of blood cultures in CAP.25 The predictors of a positive blood culture are shown in Table 3. Not obtaining cultures on patients who had received prior antibiotics or had no risk factors resulted in about 40% fewer overall cultures while identifying approximately 90% of bacteremias. In their guidelines, the British Thoracic Society (BTS) advocates a similar strategy, recommending blood cultures be omitted in nonsevere pneumonia and in patients without comorbidities.15, 26 Although recommendations vary for non‐severe CAP in hospitalized patients, all professional society guidelines agree that blood cultures should be obtained in critically ill patients, and if cultures are obtained, they should be drawn prior to antibiotics.1, 14, 15, 26
| Comorbidities |
| Liver disease |
| Vital signs |
| Systolic blood pressure < 90 mm Hg |
| Temperature < 35C or 40C |
| Pulse 125 beats/min |
| Laboratory and radiographic data |
| Blood urea nitrogen (BUN) 30 mg/dL |
| Sodium < 130 mmol/L |
| White blood cells < 5000/mm3 or > 20,000/mm3 |
| Prior use of antibiotics (negative predictor) |
Substantial controversy surrounds the utility of routine sputum gram stains and cultures for patients admitted to the hospital with CAP. The Infectious Disease Society of America (IDSA) and the British Thoracic Society (BTS) both recommend that all patients admitted to the hospital with community‐acquired pneumonia should have a gram stain and culture of expectorated sputum.1, 15, 26 Both organizations argue sputum collection is a simple and inexpensive procedure that can potentially identify pathogenic organisms and can affect both initial and long‐term antibiotic therapy. Most notably, they highlight gram stain specificity of greater than 80% for pneumococcal pneumonia. Conversely, the American Thoracic Society (ATS) argues that sputum gram stains and cultures generally have low sensitivity, specificity, and positive predictive value.14 Furthermore, they argue the utility of sputum testing is also limited practically; in one study 30% of patients could not produce an adequate sputum specimen and up to 30% had received prior antibiotic therapy, substantially reducing the yield.27 In another study, good‐quality sputum with a predominant morphotype could be obtained in only 14% of patients admitted with CAP.28 However, targeting sputum analysis to patients who have not received prior antibiotics and are able to produce an adequate sample improved the yield significantly.29 In addition, with increasing rates of antibiotic resistance among common community isolates (ie, S. Pneumoniae) and the increasing prevalence of infecting organisms not targeted by routine empiric therapy (methicillin‐resistant Staphylococcus Aureus [MRSA]), isolation of potential causative pathogens is increasingly important. We believe that severely ill patients with CAP (such as patients admitted to the ICU), as well as patients with identifiable risk factors for uncommon or drug‐resistant pathogens (eg, Pseudomonas aeruginosa, enteric gram‐negative rods, MRSA, etc.) should have sputum sent for gram stain and culture. Ideally, sputum obtained for gram stain and culture should be:
-
Prior to antibiotic therapy,
-
A deep‐cough, expectorated specimen,
-
A purulent specimen (>25 polymorphonucleacytes and less than 10 squamous cells per high‐powered field), and
-
Rapidly transported to the laboratory.
Subsequent gram stain and culture results should be interpreted in the specific clinical context and antibiotic choices targeted appropriately.
Alternative Diagnostic Tests
In recent years, there has been growth in additional diagnostic tests targeting specific organisms. The pneumococcal urinary antigen assay is a relatively sensitive (50%80%) and highly specific (90%) test for the detection of pneumococcal pneumonia, when compared with conventional diagnostic methods.27 The test is simple, convenient, rapid ( 15 min), and, with its high specificity, may allow for more focused antimicrobial therapy early in management. Current limitations include the possibility of false‐positive tests in patients colonized with S. pneumoniae or infected with other streptococcal species, as well as the inability to determine antibiotic sensitivity from positive tests. Updated IDSA and BTS guidelines state pneumococcal urinary antigen testing is an acceptable adjunct to other diagnostic tests, but blood and sputum analyses should still be performed.26, 27 For patients with suspected Legionella pneumonia (primarily critically ill and immunocompromised patients or in association with regional outbreaks), the urinary Legionella antigen assay is the test of choice, which detects 80%95% of community‐acquired cases of Legionnaires' disease with a specificity of 90%.27
During the winter months (typically from October to March), rapid antigen testing for influenza is generally recommended for patients with signs or symptoms consistent with influenza.27 The sensitivity of these tests is approximately 50%70%, so negative test results do not exclude the diagnosis, but results can be important epidemiologically and therapeutically (differentiating influenza A and B strains).27 Diagnostic tests targeting other common CAP pathogens, such as serologic tests for Mycoplasma pneumoniae or Chlamydia spp, should not be routinely performed. Testing for less common causative pathogens such as Mycobacterium tuberculosis should only be employed in the appropriate clinical setting.
ADMISSION DECISION
Once the diagnosis of CAP has been made, the initial site where treatment will occur, whether the hospital or the home, must be determined. The decision to hospitalize should be based on 3 factors: 1) evaluation of the safety of home treatment, 2) calculation of the Pneumonia Severity Index (PSI), and 3) clinical judgment of the physician.27 The PSI, or PORT (Pneumonia Outcomes Research Team) score, is a validated prediction rule that quantifies mortality and allows for risk stratification of patients with community‐acquired pneumonia.2 The PSI combines clinical history, physical examination, and laboratory data at the time of admission to divide patients into 5 risk classes and to estimate 30‐day mortality (Figure 2), which ranges from 0.1% of patients in risk class I to 27.0% in risk class V.2
On the basis of the estimated prognosis and in the absence of concerns about home safety or comorbidities, patients in risk classes I, II, and III should be managed at home. Many prospective trials have shown that implementation of PSI significantly increases the number of low‐risk patients managed outside the hospital, with no differences in quality of life, complications, readmissions, or short‐term mortality.30, 31 Most recently, a trial randomizing patients in risk classes II and III to treatment in the hospital or at home found no significant differences in clinical outcomes but did find that patients were more satisfied with care at home.32 Because the number of patients with CAP being treated at home is increasing, the American College of Chest Physicians recently published a consensus statement on the management of community‐acquired pneumonia in the home.33 All national guidelines for the management of community‐acquired pneumonia recommend using the PSI to help determine the initial location of treatment, with the caveat that using the prediction rule should never supersede clinical judgment in the decision about whether to admit.1, 14, 15, 26, 27 A practical decision tree for the use of the PSI is shown in Figure 3.
There are no reliable prediction rules for deciding on whether admission to the intensive care unit is necessary. Hemodynamic instability requiring resuscitation and monitoring or respiratory failure requiring ventilatory support are clear indications for ICU admission. Additional variables such as tachypnea (respiratory rate 30), altered mental status, multilobar disease, and azotemia are associated with severe CAP and should prompt consideration of ICU admission, especially when 2 or more variables coexist.14
TREATMENT
Initial Treatment
Once the admission decision is made and the initial diagnostic tests are completed (including blood and sputum cultures), patients with presumed community‐acquired pneumonia should receive necessary supportive care (O2, intravenous fluids, etc.) and prompt antimicrobial therapy. Antibiotics should be administered within 4 hours of arrival to patients with suspected CAP, as such prompt administration may be associated with shorter in‐hospital stays and decreased 30‐day mortality.34, 35 Regulatory organizations such as the Joint Commission on Accreditation of Healthcare Organizations (JCAHO) and the Center for Medicare Services (CMS) have made delivery of antibiotics in less than 4 hours a hospital quality measure.
Despite diagnostic testing, the specific etiologic agent causing the pneumonia of a patient remains unknown in up to 75% of those admitted to the hospital.14 Most expert guidelines therefore recommend broad‐spectrum empiric therapy targeting both the typical and the atypical organisms that commonly cause CAP (Table 1).
Recommendations for empiric antibiotics are driven by 2 key factors: antibiotic resistance by S. pneumoniae and the results of studies of CAP treatment outcomes. Historically, patients with suspected community‐acquired pneumonia were treated with penicillin with generally good outcomes. Recently, the rate of S. pneumoniae isolates resistant to penicillin has risen dramatically in the United States, ranging between 20% and 30%, with high‐level resistance (MIC 4 mg/L) as high as 5.7%.36, 37 Concurrently, the rates of resistance of S. pneumoniae to many other antibiotics commonly used to treat CAP have also risen.37 Despite increasing resistance overall, most U.S. pneumococcal isolates have low resistance to third‐generation cephalosporins and fluoroquinolones with enhanced activity against S. pneumoniae.3638 In addition, despite increasing resistance by pneumococcal isolates to penicillin, several observational studies have shown that regardless of initial therapy, resistance to penicillin as well as third‐generation cephalosporins is not associated with higher mortality or worse outcomes when controlled for other risk factors for drug resistance.39, 40 An exception to that rule is pneumococcal isolates that are very highly resistant to PCN (MIC 4 mg/dL). At least one study has shown that patients with such isolates may be at higher risk for adverse outcomes and should probably not be treated with penicillins.1, 14, 15, 41 However, nationally, fewer than 6% of pneumococcal isolates have this level of resistance.37
The rationale for empiric broad‐spectrum coverage against both typical and atypical organisms has arisen from many retrospective and observational studies that have suggested that there is clinical benefit and improved outcomes with such regimens. One large retrospective study showed that in elderly patients with CAP, fluoroquinolone monotherapy was associated with lower 30‐day mortality when compared to monotherapy with a third‐generation cephalosporin.34 Adding an extended‐spectrum macrolide (eg, azithromycin) to an extended‐spectrum ‐lactam (eg, ceftriaxone) in the treatment of patients hospitalized with nonsevere CAP also appears to be associated with improved outcomes. Adding a macrolide has resulted in shorter lengths of stay (LOS), less treatment failure, and lower mortality.34, 4244 Similarly, according to unpublished observations, adding doxycycline to a ‐lactam as initial therapy was associated with a benefit of decreased mortality.45 The presumed etiology of the benefit has been the addition of specific coverage of atypical organisms, such as Mycoplasma pneumoniae and Chlamydia pneumoniae, which are common causes of CAP (Table 1). Others have proposed that the benefit of therapy with macrolides may be derived from the inherent anti‐inflammatory properties of macrolides.46 Because research has shown a benefit of dual versus monotherapy across a spectrum of antibiotics, others have proposed the benefit is simply a result of receiving double antibiotic coverage. In particular, 2 studies found a benefit of reduced mortality from combination therapy over monotherapy in bacteremic pneumococcal pneumonia.47, 48
Yet the accumulated evidence for adding coverage of atypical organisms has been only retrospective and observational. Because of this, the recommendation to routinely add antibiotics active against atypical organisms has been questioned by some. Two recent meta‐analyses and a systematic review examined all the available data on the need for atypical coverage in the treatment of patients with community‐acquired pneumonia.4951 Surprisingly, none showed a benefit in clinical efficacy or survival in patients treated with agents active against both atypical and typical organisms when compared to regimens with only typical coverage. In subset analyses, there was a benefit to providing empiric atypical coverage in patients subsequently shown to have Legionella spp. as a causative pathogen. However, this organism was uncommon in all 3 studies. Unfortunately, most studies included in the meta‐analyses compared fluoroquinolone or macrolide monotherapy with third‐generation cephalosporin monotherapy. There have been no high‐quality randomized, controlled trials of the treatment of hospitalized patients with CAP assessing combination therapy covering both typical and atypical organisms with monotherapy targeting typical organisms alone. High‐quality trials are warranted.
Despite the recent articles questioning the importance of atypical coverage, citing the substantial retrospective data and the general inability to identify causative organisms in most cases of CAP, adding a second agent with atypical coverage to a ‐lactam currently appears to be the most efficacious empiric treatment for CAP. Nearly all expert guidelines for the management of community‐acquired pneumonia recommend this empiric approach.1, 14, 27
Table 4 displays our recommendations for the treatment of community‐acquired pneumonia requiring hospitalization. Before implementation of these guidelines, hospitalists should consult with their infectious disease experts and consider local resistance patterns. In general, a typical adult patient with non‐severe CAP without additional risk factors should receive a parenteral extended‐spectrum ‐lactam plus either doxycycline or an advanced macrolide (see Table 4). Extended‐spectrum ‐lactams include cefotaxime, ceftriaxone, ampicillin‐sulbactam, and ertapenem. A respiratory fluoroquinolone as a single agent can be used for non‐ICU patients with CAP, but some agencies, including the Centers for Disease Control (CDC), discourage routine use of these agents in all patients secondary to concerns about cost and increasing gram‐negative rod fluoroquinolone resistance.52, 53
| Patient group | Empiric antibiotic therapy |
|---|---|
| |
| Inpatient, non‐ICU | ‐Lactama + either doxycycline or an advanced macrolideb |
| Severe ‐lactam allergyc | Respiratory fluoroquinoloned |
| Inpatient, ICU | |
| No risk for Pseudomonas | ‐Lactam + either an advanced macrolide or a respiratory fluoroquinolone |
| Severe ‐lactam allergy | Respiratory fluoroquinolone + clindamycin |
| Pseudomonas risk factorse | Antipseudomonal ‐lactamf + an antipseudomonal fluoroquinoloneg |
| Severe ‐lactam allergy | Aztreonam + a respiratory fluoroquinolone |
| MRSA risk factorsh | Add vancomycin to above regimens |
| From nursing home | Should be treated as nosocomial/health‐care‐associated pneumonia |
| Aspiration pneumonia | ‐Lactam or respiratory fluoroquinolone clindamycini |
Patients hospitalized with severe CAP who require ICU‐level care are at increased risk of Legionella spp. and drug‐resistant S. pneumoniae, which must be reflected in their initial antibiotic therapy.5 Patients with severe pneumonia should receive an intravenous extended‐spectrum ‐lactam plus either an intravenous macrolide or an intravenous respiratory fluoroquinolone.
All patients with severe CAP who are admitted to the intensive care unit should be routinely screened for risk factors for Pseudomonas aeruginosa. The known risk factors for pseudomonal infection are: bronchiectasis, immunosuppression including more than 10 mg/day of prednisone, malnutrition, and treatment with broad‐spectrum antibiotics in the last month.14 Those at risk for Pseudomonas aeruginosa or other resistant gram‐negative rod infection should be treated with an antipseudomonal ‐lactam plus an antipseudomonal fluoroquinolone. Many patients with severe CAP have risk factors for MRSA infection including recent prolonged hospitalization, recent use of broad‐spectrum antibiotics, and significant underlying lung disease, which should be considered in choosing initial antibiotic therapy.54 In addition, there have been reports of patients without underlying risk factors presenting with severe community‐acquired MRSA pneumonia. Many of these patients were younger and the MRSA pneumonia was associated with a necrotizing or cavitary disease requiring prolonged ICU stays.5558 In such cases or if an institution's rate of methicillin resistance in S. aureus community isolates is high (>15%20%), it may be appropriate to add initial empiric MRSA coverage for patients admitted to the ICU with CAP.55
Some patients will have unique risk factors and clinical presentations, which may require modification of these empiric recommendations. Several studies found 5%15% of cases of community‐acquired pneumonia to be aspiration pneumonia.57 Risk factors for aspiration events include, among others, dysphagia, history of stroke, altered level of consciousness, poor dentition, and tube feeding. Aspiration pneumonia traditionally was believed to be secondary to oral anaerobes, but recent research suggests gram‐positive cocci and gram‐negative rods are the predominant organisms.58 Antibiotic therapy in patients with clear aspiration pneumonia should be directed at these microbes with an extended‐spectrum ‐lactam (eg, ceftriaxone) or a respiratory fluoroquinolone (eg, levofloxacin or moxifloxacin). Anaerobic bacterial coverage can be added in patients with severe periodontal disease, alcoholism, concern for empyema, or evidence of aspiration with pulmonary abscess.58
Patients residing in long‐term care facilities are at high risk of contracting pneumonia. The microbiology of infections acquired in nursing facilities is similar to that in hospital‐acquired cases.59, 60 As a result, patients who develop pneumonia in institutional settings such as nursing homes should be treated with broad‐spectrum antibiotics, including coverage for MRSA.
Subsequent Treatment
Initial empiric antibiotic treatment should be modified based on the results of diagnostic testing. Although the specific etiologic agent is determined in only 25% of cases of CAP,35 when an organism is isolated, antibiotic coverage should be narrowed to cover that particular organism with an antibiotic with adequate lung penetration. Evidence suggests clinicians often do not adjust or narrow antibiotics based on sensitivity results, potentially breeding resistant organisms.61
Patients hospitalized with CAP usually improve quickly if they receive early, appropriate antibiotic therapy and supportive care. Excluding patients with severe CAP requiring intensive care unit admission, most patients resolve their tachycardia, tachypnea, and fever by day 2 or 3.62 Recent practice experience, evidence, and published guidelines14, 27 all indicate that patients can safely be transitioned to oral antibiotic therapy earlier in their hospital course. Table 5 outlines criteria that can be used to identify patients who have had an adequate response to parenteral therapy and can be considered for a switch to oral antibiotics. If these criteria are met, patients have less than a 1% chance of clinical deterioration necessitating admission to an ICU or transitional care unit.62 When an etiologic organism is not identified, oral therapy should reflect a spectrum of coverage to that of the initial intravenous therapy. In some cases, this may require use of more than one oral agent. We have had success, however, transitioning non‐ICU patients initially treated with intravenous ceftriaxone plus oral doxycycline, typically for 4872 hours, to oral doxycycline monotherapy at discharge.45
| Stable vital signs and clinical criteria for 24 hours |
| Temperature 37.8C (100F) |
| Heart rate 100 beats per minute |
| Respiratory rate 24 breaths per minute |
| Systolic blood pressure 90 mm Hg |
| Oxygen saturation (on room air) 90% |
| Ability to take oral medications |
There have been a limited number of high‐quality randomized trials examining the optimal duration of treatment for community‐acquired pneumonia. Most practice guidelines recommend 710 days for patients with CAP requiring hospitalization, with 14 days for documented Mycoplasma pneumoniae or Chlamydia pneumoniae. One recent randomized trial of patients with mild to severe CAP showed a short course of high‐dose levofloxacin (750 mg daily 5 days) was at least as effective as normal dosing (500 mg daily 10 days).63 Clinical experience with high‐dose levofloxacin is limited, but this regimen can be considered because it may reduce costs and exposure to antibiotics. When diagnosed, Legionella is usually treated for 1021 days, but 14 days is adequate with macrolides because of their long half‐life.27 Patients with more virulent pathogens like Staphylococcus aureus or Pseudomonas aeruginosa or other suppurative complications should be treated for at least 14 days.1, 14, 15, 27 In determining length of therapy, clinicians should use these durations of treatment as guides, and to individualize therapy, they should always consider patient age and frailty, comorbid conditions, severity of illness, and hospital course.
Failure to Respond
Although most patients hospitalized for CAP will improve rapidly and reach clinical stability in 23 days, some patients fail to respond. Some studies have estimated that failure to improve or clinical deterioration occurs in 5%10% of patients in the first 23 days.64 The common reasons for clinical decline or nonresponse to treatment, highlighted in Table 6, are:
-
Incorrect diagnosis: Illnesses such as congestive heart failure, pulmonary embolism, neoplasms, and hypersensitivity pneumonitis can mimick CAP.
-
Inadequate antibiotic selection: The etiologic agent may be resistant to empiric antibiotic selections. Examples would include methicillin‐resistant Staphylococcus aureus (MRSA) or multiresistant gram‐negative bacilli.
-
Unusual pathogen: CAP syndromes can be caused by myriad unusual organisms including Pneumocystis jirovecii, mycobacterium tuberculosis, endemic fungal infections (eg, coccidioidomycosis), and nocardiosis.
-
Complications of pneumonia: Specific complications of CAP include empyema, pulmonary abscess, extrapulmonary spread including meningitis or endocarditis, or other organ dysfunctions such as renal failure or myocardial infarction.
-
Inadequate host response: Despite appropriate antibiotic and supportive therapy, patients with CAP often fail to respond.
| Incorrect diagnosis of CAP. |
| Inadequate or inappropriate antibiotic selection for CAP. |
| Unusual pathogen causing CAP. |
| Pulmonary or extrapulmonary complication of CAP. |
| Inadequate or poor host response. |
Progressive pneumonia despite appropriate therapy and empyema were the most common causes of failure to respond in the first 72 hours in a recent study.64 Risk factors for early failure were older age (>65 years), Pneumonia Severity Index > 90, Legionella pneumonia, gram‐negative pneumonia, and initial antimicrobial therapy discordant with final culture and susceptibility results. The initial evaluation of the nonresponding patient should address these common causes and is likely to include additional imaging (CT), sampling of potential extrapulmonary infection (thoracentesis), and, in some cases, bronchoscopy.
DISCHARGE/FOLLOW‐UP PLANS
Patients hospitalized for community‐acquired pneumonia can be safely discharged when they have reached clinical stability, are able to tolerate oral medications, have no other active comorbid conditions, and have safe, close, appropriate outpatient follow‐up (see Table 7). Clinical pathways employing these discharge criteria have been found to be safe and effective in reducing the length of stay for CAP. Most important, patients should have met most if not all of the vital sign and clinical criteria noted in Table 5 in the criteria for switching to oral therapy. Patients with 2 or more abnormal vital signs (instabilities) within 24 hours prior to discharge are at high risk of readmission and mortality, but those with one or no abnormal vital signs generally have good outcomes.65 Absent other clinical factors or extenuating circumstances (persistent hypoxia, poor functional status, etc.), most patients with CAP should reach clinical stability by day 3 or 4, be considered for a switch to oral therapy, and, if stable, be discharged shortly thereafter.
| Patients should: |
|
Meet clinical criteria in Table V. |
| Be able to tolerate oral medications (no need to observe for 24 hours on oral therapy). |
| Have no evidence of active comorbid conditions (myocardial ischemia, pulmonary edema, etc.). |
| Have a normal mental status (or have returned to their baseline). |
| Have safe, appropriate outpatient follow‐up. |
When patients with CAP are discharged from the hospital, they should be counseled about the expected course of recovery. Most important, patients and families must be informed that many symptoms of CAP may persist well after hospitalization. In one study, up to 80% of patients reported persistent cough and fatigue 1 week after discharge, and up to 50% still had dyspnea and sputum production. In some, the cough can last for 46 weeks.8
All patients discharged after treatment of community‐acquired pneumonia should have follow‐up with their outpatient provider. The physician responsible for their inpatient care should communicate directly with the provider and outline the hospital course, the discharge medications, and the duration of antibiotic therapy. There is no specific time frame within which patients must be seen, but follow‐up should be dictated by patient age, comorbidities, clinical stability at discharge, and degree of illness. The American Thoracic Society guidelines do recommend patients with a substantial smoking history who are hospitalized with CAP have a follow‐up chest radiograph 46 weeks after discharge to establish a radiographic baseline and exclude the possibility of underlying malignancy.14 However, several studies have suggested that radiographic resolution may take 3 or more months in some patients, especially the elderly and those with multilobar disease.66
PREVENTION
Prevention of community‐acquired pneumonia and pneumonic syndromes has traditionally relied on vaccination with the polysaccharide pneumococcal pneumonia vaccine and the seasonal influenza vaccine. The vaccine for S. pneumoniae used in adults is composed of the 23 serotypes that cause 85%90% of the invasive pneumococcal infections in the United States. Although in randomized trials the vaccine has not consistently prevented community‐acquired pneumonia or death in elderly patients or those with comorbidities, it likely prevents invasive pneumococcal infection.67 National guidelines and the CDC recommend the pneumococcal vaccine be given to all patients older than 65 years and those with chronic medical conditions.1, 14, 15
The seasonal influenza vaccine has clearly been shown to decrease influenza‐related illness in elderly and high‐risk patient populations. As well, in a meta‐analysis and a large observational study of patients older than 65 years, vaccination against influenza prevented pneumonia, hospitalization, and death.68, 69 Vaccination of health care workers may also confer a benefit to elderly patients of reduced mortality. The CDC recommends the influenza vaccine for all patients more than 50 years old, those with comorbidities, those at high risk for influenza, and health care workers in both inpatient and outpatient settings.
Pneumococcal and influenza vaccination have traditionally been relegated to the outpatient setting. National guidelines and the CDC recommend vaccination of all eligible hospitalized patients. Vaccination is safe and effective with almost any medical illness, and both vaccines can be given simultaneously at discharge.69 Both JCAHO and CMS have defined administration of the pneumococcal and influenza vaccines to patients hospitalized with CAP as a quality measure. Using standing orders is the most effective means of ensuring vaccination.
Some evidence suggests that tobacco smokers are at increased risk of invasive pneumococcal disease or pneumonia.70 Patients hospitalized (for all illnesses, but for CAP in particular) should be counseled about smoking cessation and offered pharmacotherapy and outpatient follow‐up. And, finally, recent observational data suggests that use of acid suppressive therapy, including proton pump inhibitors and H‐2 receptor antagonists, may be associated with an increased risk of developing CAP.71 Patients using these agents who are admitted with CAP should have their indications for treatment reviewed, especially when the pneumonia has been recurrent and there is no clear indication for continued use of acid suppressive therapy, in which case they should be discontinued in the hospital.
CONCLUSIONS
Community‐acquired pneumonia remains a common cause for hospitalization of adult patients, with significant associated morbidity and mortality. Although there are multiple expert guidelines for the management of community‐acquired pneumonia, further research is urgently needed. Clinicians need improved diagnostic tests that enable an earlier and more accurate diagnosis of CAP. In addition, the etiologic agent causing CAP is rarely discovered; improved microbiologic studies might enable antibiotic therapy to be targeted to the organisms responsible. High‐quality randomized, controlled trials examining empiric antibiotic therapy in CAP are needed, especially related to the addition of agents covering atypical organisms. Last, the general management of patients hospitalized with CAP is marked by significant heterogeneity, and research and initiatives focusing on improving the quality and process of care of patients with CAP are needed.
- ,,,,,.Guidelines from the Infectious Disease Society of America. Practice guidelines for the management of community‐acquired pneumonia.Clin Infect Dis.2000;31:347–382.
- ,,, et al.A prediction rule to identify low‐risk patients with community‐acquired pneumonia.N Engl J Med.1997;336:243–250.
- ,,, et al.Pneumonia: still the old man's friend?Arch Intern Med.2003;163:317–323.
- ,,, et al.New and emerging etiologies for community‐acquired pneumonia with implications for therapy. A prospective multicenter study of 359 cases.Medicine.1990;69:307–316.
- .Community‐acquired pneumonia.Lancet.2003;362:1991–2001.
- ,,, et al.Processes and outcomes of care for patients with community‐acquired pneumonia: results from the Pneumonia Patient Outcomes Research Team (PORT) cohort study.Arch Intern Med.1999;159:970–980.
- ,.Management of community‐acquired pneumonia.N Engl J Med.2002;347:2039–2045.
- ,,, et al.Measuring symptomatic and functional recovery in patients with community‐acquired pneumonia.J Gen Intern Med.1997;12:423–430.
- ,,, et al.Influence of age on symptoms at presentation with patients with community‐acquired pneumonia.Arch Intern Med.1997;157:1453–1459.
- ,,.Does this patient have community‐acquired pneumonia? Diagnosing pneumonia by history and physical examination.JAMA.1997;278:1440–1445.
- ,,, et al.Community‐acquired pneumonia in very elderly patients: causative organisms, clinical characteristics, and outcomes.Medicine.2003;82:159–169.
- ,.Testing strategies in the initial management of patients with community‐acquired pneumonia.Ann Intern Med.2003;138:109–118.
- ,.Uncomplicated acute bronchitis.Ann Intern Med.2000;133:981–991.
- ,,, et al.American Thoracic Society: Guidelines for the management of community‐acquired pneumonia: diagnosis, assessment of severity, antimicrobial therapy, and prevention.Am J Respir Crit Care Med.2001;163:1730–1754.
- ,,, et al.British Thoracic Society guidelines for the management of community acquired pneumonia in adults.Thorax.2001;56:Suppl. 4,IV1–IV64.
- ,,,,.High‐resolution computed tomography for the diagnosis of community‐acquired pneumonia.Clin Infect Dis.1998;27:358–363.
- ,,, et al.Performance of a bedside C‐reactive protein test in the diagnosis of community‐acquired pneumonia in adults with acute cough.Am J Med.2004;116:529–535.
- ,,, et al.Effect of procalcitonin‐guided treatment on antibiotic use and outcome in lower respiratory tract infections: cluster‐randomised, single‐blinded intervention trial.Lancet.2004;363:600–607.
- ,,, et al.Soluble triggering receptor expressed on myeloid cells and the diagnosis of pneumonia.N Engl J Med.2004:350:451–458.
- ,,, et al.Quality of care, process, and outcomes in elderly patients with pneumonia.JAMA.1997;278:2080–2084.
- ,,,.Limited usefulness of initial blood cultures in community acquired pneumonia.Emerg Med J.2004;21:446–448.
- ,,.Contaminant blood cultures and resource utilization. The true consequences of false‐positive results.JAMA.1991;265:365–369.
- ,,, et al.The contribution of blood cultures to the clinical management of adult patients admitted to the hospital with community‐acquired pneumonia: a prospective observational study.Chest.2003;123:1142–1150.
- ,,, et al.Clinical utility of blood cultures in adult patients with community‐acquired pneumonia without defined underlying risks.Chest.1995;108:932–936.
- ,,,.Predicting bacteremia in patients with community‐acquired pneumonia.Am J Respir Crit Care Med.2004;169:342–347.
- British Thoracic Society. BTS Guidelines for the management of community acquired pneumonia in adults—2004 update. Available at: www.brit‐thoracic.org/guidelines.
- ,,,,,.Guidelines from the Infectious Disease Society of America. Update of guidelines for the management of community‐acquired pneumonia in immunocompetent adults.Clin Infect Dis.2003;37:1405–1433.
- ,,, et al.Assessment of the usefulness of sputum culture for diagnosis of community‐acquired pneumonia using the PORT predictive scoring system.Arch Intern Med.2004;164:1807–1811.
- ,,.Diagnostic value of microscopic examination of gram‐stained sputum and sputum cultures in patients with bacteremic pneumococcal pneumonia.Clin Infect Dis.2004;39(2):165–169.
- ,,, et al.Safely increasing the proportion of patients with community‐acquired pneumonia treated as outpatients: an interventional trial.Arch Intern Med.1998;158:1350–1356.
- ,,, et al.A critical pathway for treatment of community‐acquired pneumonia.JAMA.2000;283:2654–2655.
- ,,, et al.Outpatient care compared with hospitalization for community‐acquired pneumonia. A randomized control trial in low‐risk patients.Ann Intern Med.2005;142:165–172.
- ,,.Management of community‐acquired pneumonia in the home.Chest.2005;127:1752–1763.
- ,,,,.Associations between initial antimicrobial therapy and medical outcomes for hospitalized elderly patients with pneumonia.Arch Intern Med.1999;159:2562–2572.
- ,,,,.Timing of antibiotic administration and outcomes for Medicare patients hospitalized with community‐acquired pneumonia.Arch Intern Med.2004;164:637–644.
- ,,, et al.Increasing prevalence of multidrug‐resistant Streptococcus pneumoniae in the United States.N Engl J Med.2000;343:1917–1924.
- ,,, et al.Susceptibility patterns of Streptococcus pneumoniae isolates in North America (2002–2003): contemporary in vitro activities of amoxicillin/clavulanate and 15 other antimicrobial agents.Int J Antimicrob Agents.2005;25(4):282–289.
- ,,, et al.Antimicrobial resistance among Streptococcus pneumoniae in the United States: have we begun to turn the corner on resistance to certain antimicrobial classes?Clin Infect Dis.2005;41(2):139–148.
- ,,, et al.Pneumonia acquired in the community through drug‐resistant Streptococcus pneumoniae.Am J Respir Crit Care.1999;159:1835–1842.
- ,,, et al.Drug‐resistant pneumococcal pneumonia: clinical relevance and related factors.Clin Infect Dis.2004;38:787–798.
- ,,, et al.Mortality from invasive pneumococcal pneumonia in the era of antibiotic resistance, 1995–1997.Am J Public Health.2000;90(2):223–9.
- ,,, et al.Lower mortality among patients with community‐acquired pneumonia treated with a macrolide plus a beta‐lactam agent versus a beta‐lactam alone.Eur J Clin Microbiol Infect Dis2005;24:190–195.
- ,,,.Impact of initial antibiotic choice on clinical outcomes in community‐acquired pneumonia: analysis of a hospital claims‐made database.Chest.2003;123:1503–1511.
- ,,,.Antimicrobial selection for hospitalized patients with presumed community‐acquired pneumonia: a survey of nonteaching US community hospitals.Ann Pharmacother2000;34:446–452.
- ,,,,.J Hosp Med.2006;1:7–12.
- .Anti‐inflammatory effects of macrolides—an underappreciated benefit in the treatment of community‐acquired respiratory tract infections and chronic inflammatory pulmonary conditions?J Antimicrob Chemother.2005;55:10–21.
- ,,, et al.Addition of a macrolide to a beta‐lactam based empirical antibiotic regimen is associated with lover in‐hospital mortality for patients with bacteremic pneumococcal pneumonia.Clin Infect Dis.2003;36:389–395.
- ,,, et al.Combination antibiotic therapy lowers mortality among severely ill patients with pneumococcal bacteremia.Am J Respir Crit Care Med.2004;170:440–444.
- ,,,.Empiric antibiotic coverage of atypical pathogens for community‐acquired pneumonia in hospitalized adults.Cochrane Database Syst Rev.2005;2:CD004418.pub2.
- ,,.Effectiveness of β lactam antibiotics compared with antibiotics active against atypical pathogens in non‐severe community‐acquired pneumonia: meta‐analysis.Br Med J.2005;330:456.
- ,,,.Empirical atypical coverage for inpatients with community‐acquired pneumonia.Arch Intern Med.2005;165:1992–2000.
- ,,, et al.Antibiotic resistance among gram‐negative bacilli in US intensive care units: implications for fluoroquinolone use.JAMA.2003;289:885–888.
- ,,, et al.First‐generation fluoroquinolone use and subsequent emergence of multiple drug‐resistant bacteria in the intensive care unit.Crit Care Med.2005;33(2):283–289.
- ,.Etiology of community‐acquired pneumonia.Clin Chest Med.2005;26:47–55.
- .Community‐associated methicillin‐resistant Staphylococcus aureus: not only a cause of skin infections, also a new cause of pneumonia.Curr Opin Infect Dis.2005;18:123–124.
- ,,, et al.Severe community‐onset pneumonia in healthy adults caused by methicillin‐resistant Staphylococcus aureus carrying the Panton‐Valentine leukocidin genes.Clin Infect Dis.2005;40(1):100–107.
- ,,,.Fatal community‐associated methicillin‐resistant Staphylococcus aureus pneumonia in an immunocompetent young adult.Ann Emerg Med.2005;46:401–404.
- .Aspiration pneumonitis and aspiration pneumonia.N Engl J Med.2001;344:665–671.
- ,,, et al.Health care‐associated bloodstream infections in adults: a reason to change the accepted definition of community‐acquired infections.Ann Intern Med.2002;137:791–797.
- American Thoracic Society and theInfectious Diseases Society of America.Guidelines for the management of adults with hospital‐acquired, ventilator‐acquired, and healthcare‐associated pneumonia.Am J Respir Crit Care Med.2005;171:388–416.
- ,,, et al.Blood culture and susceptibility results and allergy history do not influence fluoroquinolone use in the treatment of community‐acquired pneumonia.Pharmacotherapy.2005;25(1):59–66.
- ,,, et al.Time to clinical stability in patients hospitalized with community‐acquired pneumonia: implications for practice guidelines.JAMA.1998;279:1452–1457.
- ,,, et al.High‐dose, short‐course levofloxacin for community‐acquired pneumonia: a new treatment paradigm.Clin Infect Dis.2003;37:752–760.
- ,,, et al.Causes and factors associated with early failure in hospitalized patients with community‐acquired pneumonia.Arch Intern Med.2004;164:502–508.
- ,,, et al.Instability on hospital discharge and the risk of adverse outcomes in patients with pneumonia.Arch Intern Med.2002;162:1278–1284.
- ,,,.Radiographic resolution of community‐acquired bacterial pneumonia in the elderly.J Am Geriatr Soc.2004;52(2):224–229.
- ,,,.Vaccines for preventing pneumococcal infection in adults.Cochrane Database Syst Rev.2003;4:CD000422.
- ,,,,.The efficacy of influenza vaccine in elderly persons: a meta‐analysis and review of the literature.Ann Intern Med.1995;123:518–527.
- ,,, et al.Influenza vaccination and reduction in hospitalizations for cardiac disease and stroke among the elderly.N Engl J Med.2003;348:1322–1332.
- ,,,.Proportion of community‐acquired pneumonia cases attributable to tobacco smoking.Chest.1999;116:375–379.
- ,,, et al.Risk of community‐acquired pneumonia and use of gastric acid‐suppressive drugs.JAMA.2004;292:1955–1960.

Lean Health Care
Toyota is widely recognized as one of the most successful companies in the world. Its automobiles have consistently placed at or near the top of the quality and customer satisfaction rankings published by J.D. Power and Associates and Consumer Reports. Toyota constantly focuses on the safety and well‐being of its employees and the quality of its cars through its relentless dedication to continuous improvement in everything it does. Toyota has recently become the world's number two auto manufacturer, and the company's net profit margin was more than 8 times that of the industry average. 1
How has Toyota been able to achieve such remarkable results in product quality, market share, and profit margins? Jeffrey Liker, in his book The Toyota Way, described the world‐renowned Toyota production system as supported by 2 pillars: continuous improvement and respect for people. The end result is a learning organization that values employee contributions and continuously strives to produce products of higher quality at lower cost. 1, 2 Lean production is the generic term used to describe the principles and methods of the Toyota Production System. Lean production has been implemented to improve performance in a broad array of industries, from aerospace and aluminum refining to financial services and insurance. The philosophy of lean thinking, which is derived from the Toyota Production System, is rapidly gaining a following among health care leaders, with a number of hospitals and medical groups around the country adopting a version of lean production as their systematic approach to improving quality and efficiency. In the coming years, the application of lean principles and methods could have a transformational effect on how health care is delivered, with the potential for dramatic gains in quality, safety, efficiency, and appropriateness.
LEAN CONCEPTS
To understand how lean production can be applied to improve the delivery of health care, some of the fundamental concepts and practice of lean must first be explained. 3, 4 The first step in a lean improvement initiative is to understand value as defined by our customers. 5 In clinical care delivery, external customers include patients, families, payers, and regulators. Internal customers include physicians, nurses, clerks, and others involved in the care process. What customers value usually includes care that is of high quality, safe, efficient and appropriate. The second step typically is to go to the workplace and observe firsthand how the process now operates. 6 As the flow of the process from beginning to end is seen, the observer learns to see and to understand the multiple areas of delay, inefficiency, and waste that may exist. 7, 8 A representational flowchart called a current‐state value stream map (CS VSM) is created to make the work visible and to depict graphically all the individual steps necessary to complete the process from beginning to end. It is important that the CS VSM be a factual depiction of how an entire process flows created by those who actually work in that process. The CS VSM does not state any exceptions to or provide any explanations for why certain steps are taken. It does include key measures such as process time (the actual time it takes to complete a particular step of the process), lead time (the total time it takes to complete the entire process, including waiting time), and first‐time quality (the percentage of time in which that step of the process is completed without defect); (see Figure 1).
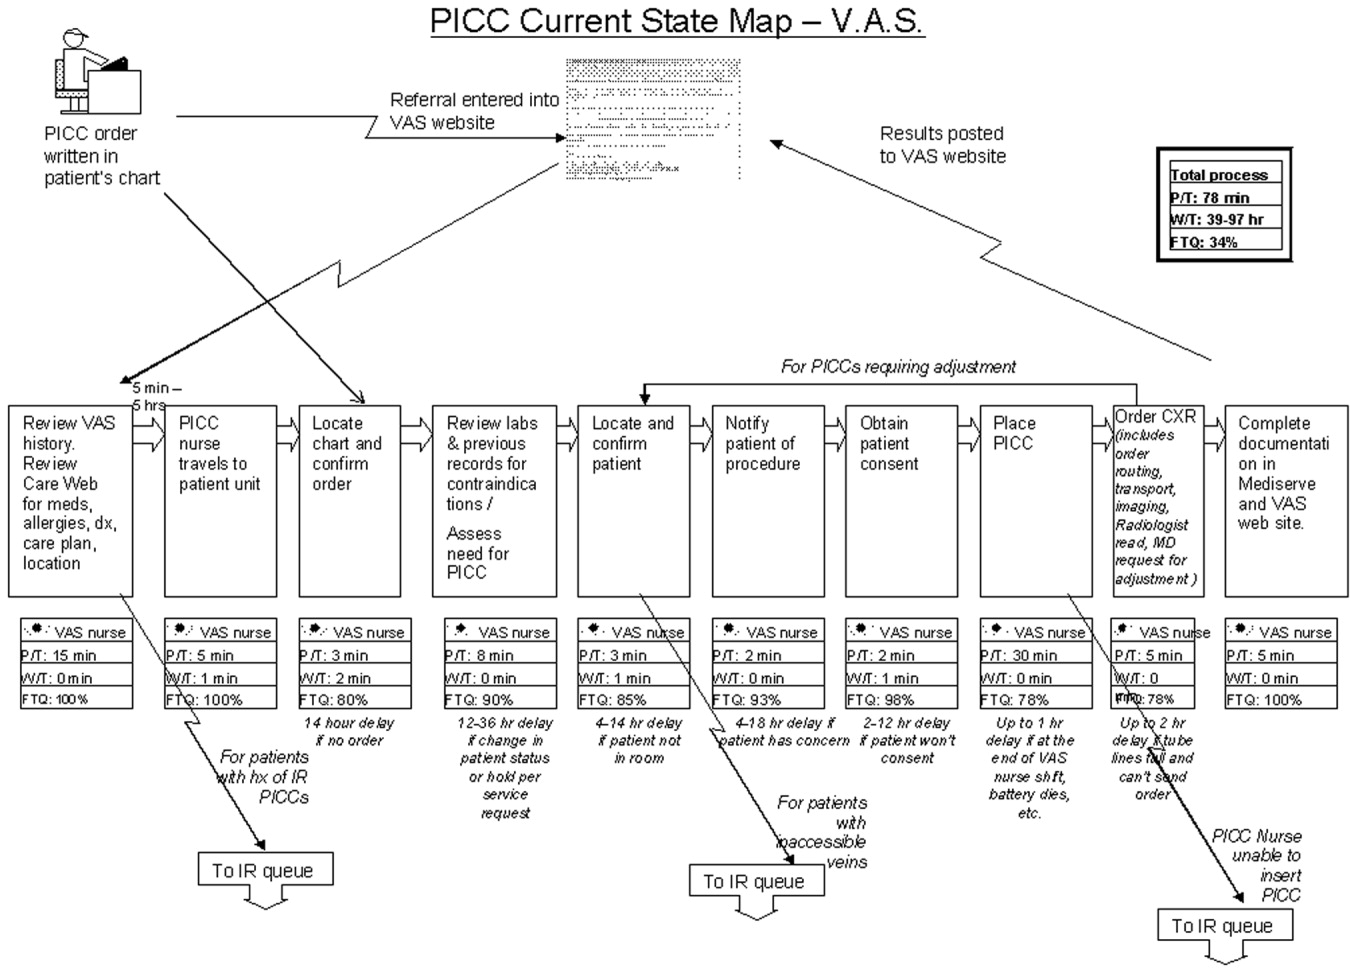
In the hands of an improvement team, the current state map becomes a powerful tool that allows participants to systematically recognize and categorize waste. The CS VSM also allows workers to visualize how much opportunity there is for improving the existing process. Working from the CS VSM, the team members can identify specific areas of waste, delay, causes of error, and inefficiency. The team then brainstorms ideas for improvement, proposing how steps of the process might be combined, eliminated, error‐proofed, or otherwise improved to transform waste into value from the customer's perspective. In the third step, the team seeks to achieve the flow state in which the steps of the process follow one another without stopping. All ideas are welcomed at this stage and are placed on the current state map itself or arrayed elsewhere for consideration. Using the ideas generated by the team, a new and better process is designed and depicted on a flow map called the future‐state value stream map (FS VSM). 9, 10 The FS VSM represents an improved and streamlined or ideal way in which the process could be accomplished, as best the team was able to envision at this point (see Figure 2). Ideally, the process described in the FS VSM also allows customers to pull value when they need goods or services provided by the organization, rather than having to do the usual requesting and waiting seen in health care and other service industries. Creating processes from which customers pull what they need is the fourth step in lean design.
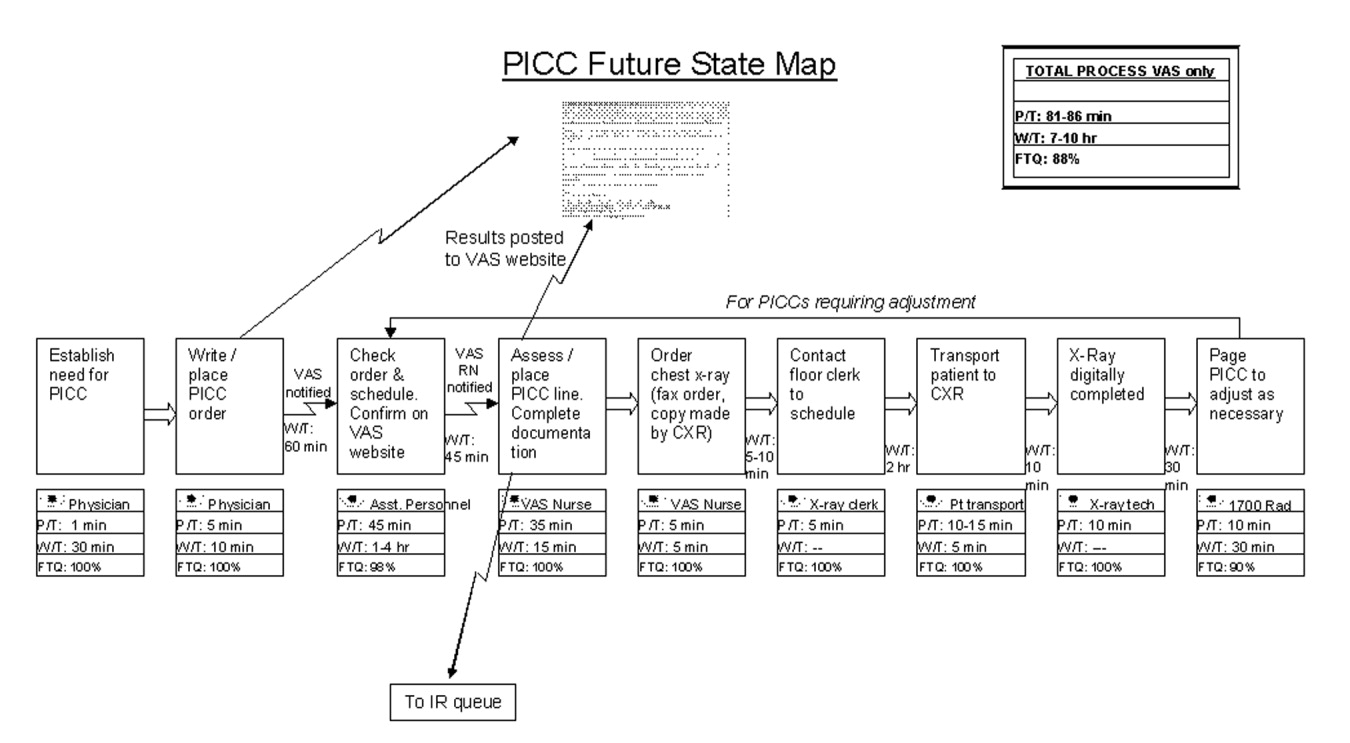
Once a future state map is devised and approved, the critical work of rapid deployment of an implementation plan for reaching the future state begins. An implementation plan explicitly identifies who is responsible for what aspect of implementation. Usually a senior leader or leadership group sponsoring the project is responsible for encouraging team members to think beyond their historical (and often political) limits and to support the team in overcoming barriers outside its control. As the individuals return to work and attempt to implement the new solutions, however, they will likely encounter areas of resistance and ambiguity that require creative solutions. The implementation phase focuses on and encourages the individual worker to experiment and work toward a solution that can be broadly adopted and disseminated for use as a standardized solution by all workers facing similar situations. 11, 12 Through this experimental development and dissemination of solutions, the agreed‐to future‐state map is revised. In this way the old future‐state map plays the role of the new current‐state map. There is an ongoing, continuous loop between the current‐ and future‐state maps through implementation and testing to develop the ideal way in which the process should flow toward the final product or service (see Figure 3). The fifth step, pursuing perfection, requires this continuous loop of all workers improving everything they do, every day. The hardest of all the steps, pursuing perfection requires an organization to commit to process improvement and the elimination of defects and waste on a daily and permanent basis. 5
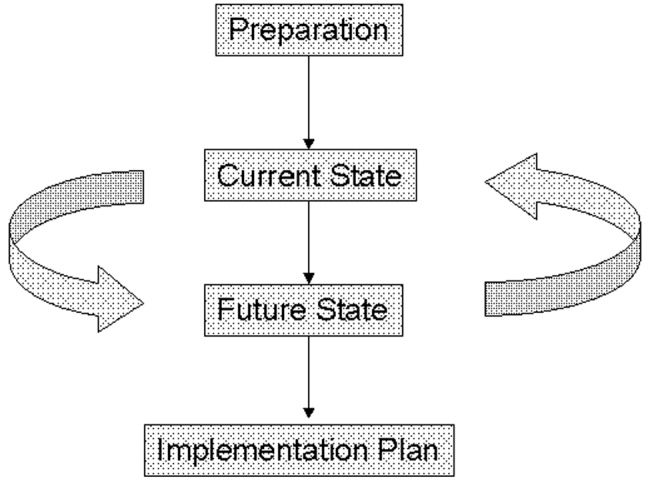
The steps outlined above provide only the basic foundations of lean concepts, of course. A detailed description of learning about and applying lean within one's own organization requires further study and help. Readers interested in learning more about value stream mapping are referred to a workbook by Mike Rother and John Shook called Learning to See, Value Stream Mapping to Create Value and Eliminate Muda. 4 Further, there are consultants with lean expertise who are available to help hospitals get started on the lean journey.
The management philosophy of lean production methods has ties to other operational and quality‐improvement models such as total quality management (TQM)/continuous quality improvement (CQI), developed by W. E. Deming, and Six Sigma, developed by Motorola and General Electric. Although there are several overlapping points of philosophy and techniques, a feature distinguishing lean from these other models is in its value stream approach to driving change and eliminating waste within the process of providing a product for the customer. Lean is unique in its focus on the specification of value from the customer's perspective and on the identification and categorization of waste and its transformation to value using specific tools. The lean approach encourages individuals within the organization (from top to bottom) to learn to see the flow of their product's process and thus to help to identify areas of waste, with the ultimate goal of creating a product with built‐in quality with the least amount of waste. Both Six Sigma and TQM/CQI focus on the delivery of a high‐quality product. Once a system has been studied and standardized, Six Sigma utilizes rigorous statistical and data measurements to drive quality improvements in product delivery. 13 Total quality management/continuous quality improvement engages the entire organization in delivering a high‐quality product from the customer's standpoint by getting everyone in the organization involved in the continuous improvement effort. 14 Lean thinking builds directly on the plandocheckact cycle of CQI but adds tools to identify and transform waste, supplies metrics of timing and resources, and, most important, focuses intently on the creation of value as defined by the customer. A more detailed comparison of lean philosophy with these other quality‐improvement management philosophies is beyond the scope of this article on the introduction of lean methods for hospitals.
DOES HEALTH CARE NEED LEAN THINKERS?
So, should health care try to emulate the successes of an automobile manufacturing company? Before answering this question, consider the following about the health care system as we know it and the significant challenges it faces.
-
A key take‐home message of the Institute of Medicine's 1999 report, To Err Is Human: Building a Safer Health System, was that errors are caused by poorly designed systems. 15
-
The Centers for Medicare and Medicaid Services (CMS) reported that the cost of health care is rising rapidly and that the rate of growth is not sustainable. 16
-
Studies by the RAND Corporation demonstrated considerable variability in the practice of medicine, raising important questions about the appropriateness and necessity of some medical care and procedures. 17, 18
-
In Crossing the Quality Chasm: a New Health System for the 21st Century, the Institute of Medicine concluded that today's health care system functions at far lower levels than it can and should and recommended 6 aims for improving the health care system: health care should be safe, effective, patient centered, timely, efficient, and equitable. 19 This report is rich in detail about what the ideal health care system should look like and how application of lean philosophy and tools can help hospitals and physicians achieve that vision.
Although these challenges reflect a view of the health care system at a very macro level, the mechanism and process of driving change will need to be initiated at the more local and organizational level. Lean production focuses on the goal of continuously transforming waste into value from the customer's perspective. It provides a rigorous and systematic approach to process improvement, error proofing, and waste reduction. Manufacturing companies such as Toyota and Alcoa and financial service organizations such as Vanguard have enjoyed tremendous success in implementing lean production, reporting gains in both quality and efficiency. 11 It is time for health care leaders and practitioners to evaluate how lean techniques can be adapted and applied to addressing the pressing challenges of safety, quality, efficiency, and appropriateness in order to improve system reliability and timeliness. As hospitalists, we are at the forefront of these challenges and therefore are in a prime position to lead the change in how health care delivery is improved continuously using a rigorous system such as the Toyota production system.
LEAN IN HEALTH CARE: EXAMPLES OF SOME EARLY RESULTS
Lean health care is still a very novel concept to most health care institutions; however, there have been some early adopters of lean health care, and some of their experiences are described here:
-
At Virginia Mason Medical Center (VMMC) in Seattle, Washington, changes implemented using lean production methods have resulted in decreased incidence of ventilator‐associated pneumoniafrom 34 cases with 5 deaths in 2002 to 4 cases with 1 death in 2004. This led to a cost reduction of nearly a half‐million dollars. VMMC has also reported increased profit margins and improvement in space utilization at its cancer center, enabling 57% more patients to be seen in the same allotted space; and it is now taking measures to decrease the number of medication errors by standardizing and mistake‐proofing the process of ordering, delivering, and administering medications, all using lean techniques. 12, 20
-
At Park Nicollet Health Services (PNHS) in Minneapolis, Minnesota, implementation of lean production has enabled improved patient access through flow improvements. Results include increasing the number of CT and MRI scans performed per day by 2 and 1, respectively; creating a capacity for 10 additional chemotherapy and antibiotic infusion patients per day in the cancer center; reducing the waiting time of patients from 122 to 52 minutes at the urgent care clinic; standardizing surgical instrument use by the general surgery group, which resulted in processing more than 40,000 fewer instruments each month. These improvements achieved through applying lean concepts have resulted in Park Nicollet being recognized by the American Medical Group Association (AMGA) with its top‐rated Acclaim Award. 21 In addition, PNHS has been able to achieve a record 3.9% operating margin, which equates to a $7.5 million profit in 2004.
-
In Pittsburgh, Pennsylvania, a group of hospitals participating in the Pittsburgh Regional Healthcare Initiative (PRHI) have implemented lean concepts to minimize the risk of developing central catheterrelated bloodstream infections. Several hospitals have been able to cut the incidence of central line infections by 50%‐90% through implementation of lean production methods. 12
-
At Community Medical Center in Missoula, Montana, a series of pilot projects have been initiated to test lean methods. Some of the early results have demonstrated a reduction in turnaround time for pathology reports from the anatomical pathology lab from 5 to 2 days, a reduction in the number of steps and therefore the time from medication order to treatment initiation from 4 hours to 12 minutes, and a reduction in time for unit clerks to process new physician orders from an average of 43 minutes to 10 minutes during the hospital's busiest hours. 22
Implications for Hospitalists
Clinical practice in the hospital setting is process rich and provides abundant opportunities for improving the delivery of patient care. As hospitalists grow in number and increase their presence in the hospital setting, many are being asked to serve on hospital management committees to develop and implement ideas that will improve operations in the inpatient venue. As they serve in this vital capacity, hospitalists should ask themselves the following question about their practice settings:
-
How often are hospital discharges prolonged because of the inability to obtain or schedule a vital test?
-
How often does a planned discharge get delayed because of poor planning for what the patient may need just prior to or after discharge?
-
How often do errors occur in medications received by or prescribed for patients after discharge?
-
How often do preventable nosocomial infections or medical errors occur in the hospital setting?
-
How often are patients readmitted to the hospital for the same illness or a related illness because of errors in communicating the accurate discharge instructions to the patient?
These are just a few examples of suboptimal care that results from suboptimal processes in many hospital settings and for which a rigorous process improvement methodology, such as lean production, could improve quality, safety, efficiency, and appropriate delivery of care. From quality and safety points of view, prevention of medical errors and nosocomial infections can lead to improved mortality and morbidity rates, as well as to significant cost savings for the health care system.
THE MICHIGAN LEAN EXPERIENCE
In the past year, the University of Michigan has begun to use lean production methods to improve the care of patients across various venues of hospitalization and flow toward discharge. Delays in placement of peripherally inserted central catheters (PICC) were associated with delays in appropriate and timely administration of intravenous medication, as well as in delays in discharges home or to extended‐care facilities (ECF) for continuation of medical care post‐hospitalization. Since the initiation of the lean PICC initiative, when adjusted for increased volume of demand, for 3 consecutive months 90%95% of the PICC lines have been inserted within 24 hours of request. This is a remarkable achievement, given that in the previous 12 months only 50%70% of PICC lines were placed within 24 hours of request. Even without adjusting for volume of demand, the lean PICC initiative has resulted in a 36% decrease in the average time to line placement and in a 50% decrease in the number of PICC referrals to interventional radiology (IR), thus decreasing the workload of a constrained resource.
As with all lean improvement projects, the entire value stream map was assessed in order to identify areas of intervention that would enhance the final product of the process for the patient (in this case, placing a PICC line as timely as possible). As we evaluated this value stream, one step in the process, occurring prior to placement of the line, appeared to be significantly wasteful: when the PICC nurse needed to search for data (such as locating a patient's chart for the order and reviewing labs and medication records) and to ensure that the patient was in his/her room and prepared for line placement. This step appeared to be inefficient use of the time of technically skilled individuals. The future state map of this process implemented the addition of an assisting individual who would ensure that these prework issues were prepared and completed in advance for the PICC nurses, thus making maximum use of the time of these skilled individuals in placing PICC lines, not in performing unskilled work. Another area where an intervention was believed beneficial was streamlining the process of chest x‐ray (CXR) ordering and reading in order to obtain PICC line confirmation. Performance of the previous process was not standardized and led to delays. The future state proposed a standard method of writing an order for a CXR, a standard method for getting that order to the radiology department, and a standard method for reading the films for dictation. This prevented the confusion and rework that had previously occurred. A last example of an intervention is that the PICC nurses began to internally defer to more experienced nurses if a less experienced nurse could not successfully place a PICC line in a patient. Previously, an unsuccessful attempt at bedside PICC placement warranted an IR referral, thus increasing the demand on an already constrained resource. This intervention by the PICC nurses drove down referrals to the IR suite by 50%. Although this may have led to a small increase in rework early in the process, it has led to a significant reduction in work downstream in the process. Thus, we believe that the overall work flow process has been served well by this intervention. As depicted in Figure 3, the lean process improvement method seeks to have continuous improvement, with the old future‐state map taking on the role of the new current‐state map. Since the initial development of these value stream maps, we have been working toward developing and implementing new areas of intervention, which will lead to new future‐state maps and to further improvement of this process, as the demand for PICC lines continues to rise.
Another critical segment in the care of hospitalized patients is the discharge process, including coordination of care to an outpatient or extended care facility (ECF) setting, which has several potential areas of disconnect that could result inpatients having untoward complications requiring rehospitalization, higher morbidity, or prolongation of suffering from their illnesses. The University of Michigan sees a tremendous opportunity to make a significant impact on patient care in this realm and has just initiated a lean project on the coordination of care. Team members on this project will be relevant process stakeholders, including those representing hospitalists, discharge planning, nursing, social work, a related home nursing company, a home infusion service, an ECF, ambulatory care, pharmacy, case management, nutrition, utilization review, patients and their families, and clinic physicians. The overall goal of the project is to optimize patient care from hospitalization to discharge and transfer of care to the outpatient setting.
CHALLENGES
The application of management philosophy and operational concepts from the manufacturing industry to health care may be a conceptual stretch for many in the health care community. Hence, both cultural and practical barriers likely will have to be overcome before lean techniques can enjoy widespread use.
On the cultural front, it will be necessary to overcome the most likely arguments against the applicability of lean manufacturing concepts to the health care sector such as people are not automobiles and each patient is unique. Yet there has been considerable success in applying lean production concepts in other service industries such as insurance and financial services, with exceptionally favorable results reported, 11, 23 and early adopters of the lean concept in health care have credited lean management concepts with their early successes, as described above.
There are also the organizational and professional cultural differences that separate the health care industry from other sectors that have incorporated lean into their practice. Health care professionals, however, are highly dedicated and motivated to providing their patients with the best possible care and are already accustomed to constant experimentation and new data driving change in the way that care is provided. Lean production concepts and tools should not be foreign to health care professionals who already understand systems thinking.
Other challenges may come from those arguing that lean is just cutting and layoffs in disguise. It is often feared that when an organization decides to go lean, the underlying goals are to cut costs and to lay off a segment of the labor force. The term lean is often misunderstood in this respect, and it is important that the phrase be explained accurately in its context and application. Some individuals wonder whether the implementation of lean production efforts means they are working themselves out of employment. A key component of the successful application of lean production methods is assuring that as process flows and operations are improved, job descriptions and duties of individuals may be redirected, but their employment will not be lost
Finally, the multiple segments of health care are often fragmented into individually functioning units operating as autonomous silos. Lean teaches that optimizing the performance of an individual area is insufficient, that the entire process flow, which requires cooperation of multiple operating units, must be improved in order to achieve meaningful and sustained improvement in performance. This is a new way of thinking that requires behavioral change for the many who are used to thinking narrowly about the performance of their own unit. The larger organization must recognize and eliminate disincentives to breaking down the silo mentality. In health care organizations, however, providers and staff across functional departments share the same ultimate goal of delivering the very best care possible to patients within the constraint of available resources. Lean provides a management philosophy, powerful tools, and an accountability structure for working toward this goal. The organization, however, must be committed from the highest levels to making the lean transformation. 1
Ultimately, health care shares with manufacturing companies such as Toyota the challenge of producing the highest‐quality products (clinical outcomes) within an environment of constrained resources, while managing a complex business operation and assuring the safety and satisfaction of workers and customers (patients). Both industries need highly reliable systems that will ultimately lead to higher quality and greater safety, efficiency, and appropriateness.
CONCLUSION
The health care industry should learn about and consider adoption of lean techniques in order to improve its processes. More specifically, hospitals are prime locales for reaping the benefits of implementation of lean production, which can significantly affect how health care is delivered to patients. Toyota and other lean exemplars in the manufacturing industry have achieved a high level of success by utilizing the practice of lean. Early results from health care organizations suggest that utilizing lean production methods can lead to substantial improvements in the quality and efficiency of health care. To determine if the magnitude of success experienced by Toyota and other lean exemplars can also be achieved in the health care sector, it will be necessary to continuously test and evaluate the impact lean health care can have. In the hospital setting, where hospitalists are at the forefront of delivering care, it is incumbent on the hospitalist community to evaluate whether these techniques can make a difference in the quality, efficiency, and safety of the care provided to patients.
Lean thinking is still a novel idea to those in the health care sector, and as early adopters of this promising management model, we are very optimistic about the benefits of applying lean concepts in our hospital. Some of the first published reports and results presented on the benefits of lean in individual organizations are encouraging; however, as health care is a scientific community, we believe that future work should undergo rigorous evaluation on the benefits of lean and that such future works should be shared among the health care community through peer‐reviewed and published works.
Acknowledgements
The authors wish to thank the peripherally inserted central catheter (PICC) team for the use of their current and future state maps on PICC line placements that were created for the lean project.
- . The Toyota Way. Madison, Wisc: McGraw‐Hill; 2004.
- , . Decoding the DNA of the Toyota Production System. Harv Bus Rev. 1999; 77( 5): 97–.
- , . The Complete Lean Enterprise, Value Stream Mapping for Administrative and Office Processes. New York, NY: Productivity Press; 2004.
- , . Learning to See, Value‐Stream Mapping to Create Value and Eliminate Muda. Brookline, Mass: The Lean Enterprise Institute, Inc; 2003.
- , . Lean Thinking, Banish Waste and Create Wealth in Your Corporation. 2nd ed. New York, NY: Free Press; 2003.
- NAM. Getting started on the lean journey: first, take a walk! [NAM.org Web site]. Available at http://www.nam.org/s_nam/doc1.asp?CID=200253sect 15.
- . Fixing health care from the inside, today. Harv Bus Rev. 2005; 83( 9): 78– 91.
- Six Sigma—what is Six Sigma? Available at http://www.isixsigma.com/sixsigma/six_sigma.asp. Accessed 2005.
- Overview of the Continuous Quality Improvement Program. 2005. Available at http://www.med.umich.edu/i/exec/cqi/overview.htm. Accessed 2005.
- Kohn LT , Corrigan J , Donaldson MS , eds. To Err Is human: Building a Safer Health System. Washington, DC: National Academy Press; 2000.
- . Testimony of Mark B. McClellan, MD, PhD, Administrator, before the House Ways and Means Subcommittee on Health on Value‐Based Purchasing for Physicians under Medicare. Washington, DC: Centers for Medicare July 21, 2005.
- , , , et al. Does inappropriate use explain geographic variations in the use of health care services? A study of three procedures.[see comment]. JAMA. 1987; 258: 2533– 2537.
- , , , et al. Variations in the use of medical and surgical services by the Medicare population. N Engl J Med. 1986; 314( 5): 285– 290.
- Committee on Quality Health Care in America, Institute of Medicine. Crossing the Quality Chasm: a New Health System for the 21st Century. Washington, DC: National Academy Press; 2001.
- Institute for Healthcare Improvement. Going Lean in Health Care. White Paper. Boston, MA: Institute for Healthcare Improvement; January and February 2005.
- Lean Production at Park Nicollet. Available at http://www.parknicollet.com/media/leanProduction.cfm. Accessed March, 2005.
- , , . Reducing waste and errors: piloting lean principles at Intermountain Healthcare. Jt Comm J Qual Patient Saf. 2005; 31( 5): 249– 257.
- . The lean service machine. Harv Bus Rev. 2003; 81( 10): 123– 129, 38 .
Toyota is widely recognized as one of the most successful companies in the world. Its automobiles have consistently placed at or near the top of the quality and customer satisfaction rankings published by J.D. Power and Associates and Consumer Reports. Toyota constantly focuses on the safety and well‐being of its employees and the quality of its cars through its relentless dedication to continuous improvement in everything it does. Toyota has recently become the world's number two auto manufacturer, and the company's net profit margin was more than 8 times that of the industry average. 1
How has Toyota been able to achieve such remarkable results in product quality, market share, and profit margins? Jeffrey Liker, in his book The Toyota Way, described the world‐renowned Toyota production system as supported by 2 pillars: continuous improvement and respect for people. The end result is a learning organization that values employee contributions and continuously strives to produce products of higher quality at lower cost. 1, 2 Lean production is the generic term used to describe the principles and methods of the Toyota Production System. Lean production has been implemented to improve performance in a broad array of industries, from aerospace and aluminum refining to financial services and insurance. The philosophy of lean thinking, which is derived from the Toyota Production System, is rapidly gaining a following among health care leaders, with a number of hospitals and medical groups around the country adopting a version of lean production as their systematic approach to improving quality and efficiency. In the coming years, the application of lean principles and methods could have a transformational effect on how health care is delivered, with the potential for dramatic gains in quality, safety, efficiency, and appropriateness.
LEAN CONCEPTS
To understand how lean production can be applied to improve the delivery of health care, some of the fundamental concepts and practice of lean must first be explained. 3, 4 The first step in a lean improvement initiative is to understand value as defined by our customers. 5 In clinical care delivery, external customers include patients, families, payers, and regulators. Internal customers include physicians, nurses, clerks, and others involved in the care process. What customers value usually includes care that is of high quality, safe, efficient and appropriate. The second step typically is to go to the workplace and observe firsthand how the process now operates. 6 As the flow of the process from beginning to end is seen, the observer learns to see and to understand the multiple areas of delay, inefficiency, and waste that may exist. 7, 8 A representational flowchart called a current‐state value stream map (CS VSM) is created to make the work visible and to depict graphically all the individual steps necessary to complete the process from beginning to end. It is important that the CS VSM be a factual depiction of how an entire process flows created by those who actually work in that process. The CS VSM does not state any exceptions to or provide any explanations for why certain steps are taken. It does include key measures such as process time (the actual time it takes to complete a particular step of the process), lead time (the total time it takes to complete the entire process, including waiting time), and first‐time quality (the percentage of time in which that step of the process is completed without defect); (see Figure 1).
In the hands of an improvement team, the current state map becomes a powerful tool that allows participants to systematically recognize and categorize waste. The CS VSM also allows workers to visualize how much opportunity there is for improving the existing process. Working from the CS VSM, the team members can identify specific areas of waste, delay, causes of error, and inefficiency. The team then brainstorms ideas for improvement, proposing how steps of the process might be combined, eliminated, error‐proofed, or otherwise improved to transform waste into value from the customer's perspective. In the third step, the team seeks to achieve the flow state in which the steps of the process follow one another without stopping. All ideas are welcomed at this stage and are placed on the current state map itself or arrayed elsewhere for consideration. Using the ideas generated by the team, a new and better process is designed and depicted on a flow map called the future‐state value stream map (FS VSM). 9, 10 The FS VSM represents an improved and streamlined or ideal way in which the process could be accomplished, as best the team was able to envision at this point (see Figure 2). Ideally, the process described in the FS VSM also allows customers to pull value when they need goods or services provided by the organization, rather than having to do the usual requesting and waiting seen in health care and other service industries. Creating processes from which customers pull what they need is the fourth step in lean design.
Once a future state map is devised and approved, the critical work of rapid deployment of an implementation plan for reaching the future state begins. An implementation plan explicitly identifies who is responsible for what aspect of implementation. Usually a senior leader or leadership group sponsoring the project is responsible for encouraging team members to think beyond their historical (and often political) limits and to support the team in overcoming barriers outside its control. As the individuals return to work and attempt to implement the new solutions, however, they will likely encounter areas of resistance and ambiguity that require creative solutions. The implementation phase focuses on and encourages the individual worker to experiment and work toward a solution that can be broadly adopted and disseminated for use as a standardized solution by all workers facing similar situations. 11, 12 Through this experimental development and dissemination of solutions, the agreed‐to future‐state map is revised. In this way the old future‐state map plays the role of the new current‐state map. There is an ongoing, continuous loop between the current‐ and future‐state maps through implementation and testing to develop the ideal way in which the process should flow toward the final product or service (see Figure 3). The fifth step, pursuing perfection, requires this continuous loop of all workers improving everything they do, every day. The hardest of all the steps, pursuing perfection requires an organization to commit to process improvement and the elimination of defects and waste on a daily and permanent basis. 5
The steps outlined above provide only the basic foundations of lean concepts, of course. A detailed description of learning about and applying lean within one's own organization requires further study and help. Readers interested in learning more about value stream mapping are referred to a workbook by Mike Rother and John Shook called Learning to See, Value Stream Mapping to Create Value and Eliminate Muda. 4 Further, there are consultants with lean expertise who are available to help hospitals get started on the lean journey.
The management philosophy of lean production methods has ties to other operational and quality‐improvement models such as total quality management (TQM)/continuous quality improvement (CQI), developed by W. E. Deming, and Six Sigma, developed by Motorola and General Electric. Although there are several overlapping points of philosophy and techniques, a feature distinguishing lean from these other models is in its value stream approach to driving change and eliminating waste within the process of providing a product for the customer. Lean is unique in its focus on the specification of value from the customer's perspective and on the identification and categorization of waste and its transformation to value using specific tools. The lean approach encourages individuals within the organization (from top to bottom) to learn to see the flow of their product's process and thus to help to identify areas of waste, with the ultimate goal of creating a product with built‐in quality with the least amount of waste. Both Six Sigma and TQM/CQI focus on the delivery of a high‐quality product. Once a system has been studied and standardized, Six Sigma utilizes rigorous statistical and data measurements to drive quality improvements in product delivery. 13 Total quality management/continuous quality improvement engages the entire organization in delivering a high‐quality product from the customer's standpoint by getting everyone in the organization involved in the continuous improvement effort. 14 Lean thinking builds directly on the plandocheckact cycle of CQI but adds tools to identify and transform waste, supplies metrics of timing and resources, and, most important, focuses intently on the creation of value as defined by the customer. A more detailed comparison of lean philosophy with these other quality‐improvement management philosophies is beyond the scope of this article on the introduction of lean methods for hospitals.
DOES HEALTH CARE NEED LEAN THINKERS?
So, should health care try to emulate the successes of an automobile manufacturing company? Before answering this question, consider the following about the health care system as we know it and the significant challenges it faces.
-
A key take‐home message of the Institute of Medicine's 1999 report, To Err Is Human: Building a Safer Health System, was that errors are caused by poorly designed systems. 15
-
The Centers for Medicare and Medicaid Services (CMS) reported that the cost of health care is rising rapidly and that the rate of growth is not sustainable. 16
-
Studies by the RAND Corporation demonstrated considerable variability in the practice of medicine, raising important questions about the appropriateness and necessity of some medical care and procedures. 17, 18
-
In Crossing the Quality Chasm: a New Health System for the 21st Century, the Institute of Medicine concluded that today's health care system functions at far lower levels than it can and should and recommended 6 aims for improving the health care system: health care should be safe, effective, patient centered, timely, efficient, and equitable. 19 This report is rich in detail about what the ideal health care system should look like and how application of lean philosophy and tools can help hospitals and physicians achieve that vision.
Although these challenges reflect a view of the health care system at a very macro level, the mechanism and process of driving change will need to be initiated at the more local and organizational level. Lean production focuses on the goal of continuously transforming waste into value from the customer's perspective. It provides a rigorous and systematic approach to process improvement, error proofing, and waste reduction. Manufacturing companies such as Toyota and Alcoa and financial service organizations such as Vanguard have enjoyed tremendous success in implementing lean production, reporting gains in both quality and efficiency. 11 It is time for health care leaders and practitioners to evaluate how lean techniques can be adapted and applied to addressing the pressing challenges of safety, quality, efficiency, and appropriateness in order to improve system reliability and timeliness. As hospitalists, we are at the forefront of these challenges and therefore are in a prime position to lead the change in how health care delivery is improved continuously using a rigorous system such as the Toyota production system.
LEAN IN HEALTH CARE: EXAMPLES OF SOME EARLY RESULTS
Lean health care is still a very novel concept to most health care institutions; however, there have been some early adopters of lean health care, and some of their experiences are described here:
-
At Virginia Mason Medical Center (VMMC) in Seattle, Washington, changes implemented using lean production methods have resulted in decreased incidence of ventilator‐associated pneumoniafrom 34 cases with 5 deaths in 2002 to 4 cases with 1 death in 2004. This led to a cost reduction of nearly a half‐million dollars. VMMC has also reported increased profit margins and improvement in space utilization at its cancer center, enabling 57% more patients to be seen in the same allotted space; and it is now taking measures to decrease the number of medication errors by standardizing and mistake‐proofing the process of ordering, delivering, and administering medications, all using lean techniques. 12, 20
-
At Park Nicollet Health Services (PNHS) in Minneapolis, Minnesota, implementation of lean production has enabled improved patient access through flow improvements. Results include increasing the number of CT and MRI scans performed per day by 2 and 1, respectively; creating a capacity for 10 additional chemotherapy and antibiotic infusion patients per day in the cancer center; reducing the waiting time of patients from 122 to 52 minutes at the urgent care clinic; standardizing surgical instrument use by the general surgery group, which resulted in processing more than 40,000 fewer instruments each month. These improvements achieved through applying lean concepts have resulted in Park Nicollet being recognized by the American Medical Group Association (AMGA) with its top‐rated Acclaim Award. 21 In addition, PNHS has been able to achieve a record 3.9% operating margin, which equates to a $7.5 million profit in 2004.
-
In Pittsburgh, Pennsylvania, a group of hospitals participating in the Pittsburgh Regional Healthcare Initiative (PRHI) have implemented lean concepts to minimize the risk of developing central catheterrelated bloodstream infections. Several hospitals have been able to cut the incidence of central line infections by 50%‐90% through implementation of lean production methods. 12
-
At Community Medical Center in Missoula, Montana, a series of pilot projects have been initiated to test lean methods. Some of the early results have demonstrated a reduction in turnaround time for pathology reports from the anatomical pathology lab from 5 to 2 days, a reduction in the number of steps and therefore the time from medication order to treatment initiation from 4 hours to 12 minutes, and a reduction in time for unit clerks to process new physician orders from an average of 43 minutes to 10 minutes during the hospital's busiest hours. 22
Implications for Hospitalists
Clinical practice in the hospital setting is process rich and provides abundant opportunities for improving the delivery of patient care. As hospitalists grow in number and increase their presence in the hospital setting, many are being asked to serve on hospital management committees to develop and implement ideas that will improve operations in the inpatient venue. As they serve in this vital capacity, hospitalists should ask themselves the following question about their practice settings:
-
How often are hospital discharges prolonged because of the inability to obtain or schedule a vital test?
-
How often does a planned discharge get delayed because of poor planning for what the patient may need just prior to or after discharge?
-
How often do errors occur in medications received by or prescribed for patients after discharge?
-
How often do preventable nosocomial infections or medical errors occur in the hospital setting?
-
How often are patients readmitted to the hospital for the same illness or a related illness because of errors in communicating the accurate discharge instructions to the patient?
These are just a few examples of suboptimal care that results from suboptimal processes in many hospital settings and for which a rigorous process improvement methodology, such as lean production, could improve quality, safety, efficiency, and appropriate delivery of care. From quality and safety points of view, prevention of medical errors and nosocomial infections can lead to improved mortality and morbidity rates, as well as to significant cost savings for the health care system.
THE MICHIGAN LEAN EXPERIENCE
In the past year, the University of Michigan has begun to use lean production methods to improve the care of patients across various venues of hospitalization and flow toward discharge. Delays in placement of peripherally inserted central catheters (PICC) were associated with delays in appropriate and timely administration of intravenous medication, as well as in delays in discharges home or to extended‐care facilities (ECF) for continuation of medical care post‐hospitalization. Since the initiation of the lean PICC initiative, when adjusted for increased volume of demand, for 3 consecutive months 90%95% of the PICC lines have been inserted within 24 hours of request. This is a remarkable achievement, given that in the previous 12 months only 50%70% of PICC lines were placed within 24 hours of request. Even without adjusting for volume of demand, the lean PICC initiative has resulted in a 36% decrease in the average time to line placement and in a 50% decrease in the number of PICC referrals to interventional radiology (IR), thus decreasing the workload of a constrained resource.
As with all lean improvement projects, the entire value stream map was assessed in order to identify areas of intervention that would enhance the final product of the process for the patient (in this case, placing a PICC line as timely as possible). As we evaluated this value stream, one step in the process, occurring prior to placement of the line, appeared to be significantly wasteful: when the PICC nurse needed to search for data (such as locating a patient's chart for the order and reviewing labs and medication records) and to ensure that the patient was in his/her room and prepared for line placement. This step appeared to be inefficient use of the time of technically skilled individuals. The future state map of this process implemented the addition of an assisting individual who would ensure that these prework issues were prepared and completed in advance for the PICC nurses, thus making maximum use of the time of these skilled individuals in placing PICC lines, not in performing unskilled work. Another area where an intervention was believed beneficial was streamlining the process of chest x‐ray (CXR) ordering and reading in order to obtain PICC line confirmation. Performance of the previous process was not standardized and led to delays. The future state proposed a standard method of writing an order for a CXR, a standard method for getting that order to the radiology department, and a standard method for reading the films for dictation. This prevented the confusion and rework that had previously occurred. A last example of an intervention is that the PICC nurses began to internally defer to more experienced nurses if a less experienced nurse could not successfully place a PICC line in a patient. Previously, an unsuccessful attempt at bedside PICC placement warranted an IR referral, thus increasing the demand on an already constrained resource. This intervention by the PICC nurses drove down referrals to the IR suite by 50%. Although this may have led to a small increase in rework early in the process, it has led to a significant reduction in work downstream in the process. Thus, we believe that the overall work flow process has been served well by this intervention. As depicted in Figure 3, the lean process improvement method seeks to have continuous improvement, with the old future‐state map taking on the role of the new current‐state map. Since the initial development of these value stream maps, we have been working toward developing and implementing new areas of intervention, which will lead to new future‐state maps and to further improvement of this process, as the demand for PICC lines continues to rise.
Another critical segment in the care of hospitalized patients is the discharge process, including coordination of care to an outpatient or extended care facility (ECF) setting, which has several potential areas of disconnect that could result inpatients having untoward complications requiring rehospitalization, higher morbidity, or prolongation of suffering from their illnesses. The University of Michigan sees a tremendous opportunity to make a significant impact on patient care in this realm and has just initiated a lean project on the coordination of care. Team members on this project will be relevant process stakeholders, including those representing hospitalists, discharge planning, nursing, social work, a related home nursing company, a home infusion service, an ECF, ambulatory care, pharmacy, case management, nutrition, utilization review, patients and their families, and clinic physicians. The overall goal of the project is to optimize patient care from hospitalization to discharge and transfer of care to the outpatient setting.
CHALLENGES
The application of management philosophy and operational concepts from the manufacturing industry to health care may be a conceptual stretch for many in the health care community. Hence, both cultural and practical barriers likely will have to be overcome before lean techniques can enjoy widespread use.
On the cultural front, it will be necessary to overcome the most likely arguments against the applicability of lean manufacturing concepts to the health care sector such as people are not automobiles and each patient is unique. Yet there has been considerable success in applying lean production concepts in other service industries such as insurance and financial services, with exceptionally favorable results reported, 11, 23 and early adopters of the lean concept in health care have credited lean management concepts with their early successes, as described above.
There are also the organizational and professional cultural differences that separate the health care industry from other sectors that have incorporated lean into their practice. Health care professionals, however, are highly dedicated and motivated to providing their patients with the best possible care and are already accustomed to constant experimentation and new data driving change in the way that care is provided. Lean production concepts and tools should not be foreign to health care professionals who already understand systems thinking.
Other challenges may come from those arguing that lean is just cutting and layoffs in disguise. It is often feared that when an organization decides to go lean, the underlying goals are to cut costs and to lay off a segment of the labor force. The term lean is often misunderstood in this respect, and it is important that the phrase be explained accurately in its context and application. Some individuals wonder whether the implementation of lean production efforts means they are working themselves out of employment. A key component of the successful application of lean production methods is assuring that as process flows and operations are improved, job descriptions and duties of individuals may be redirected, but their employment will not be lost
Finally, the multiple segments of health care are often fragmented into individually functioning units operating as autonomous silos. Lean teaches that optimizing the performance of an individual area is insufficient, that the entire process flow, which requires cooperation of multiple operating units, must be improved in order to achieve meaningful and sustained improvement in performance. This is a new way of thinking that requires behavioral change for the many who are used to thinking narrowly about the performance of their own unit. The larger organization must recognize and eliminate disincentives to breaking down the silo mentality. In health care organizations, however, providers and staff across functional departments share the same ultimate goal of delivering the very best care possible to patients within the constraint of available resources. Lean provides a management philosophy, powerful tools, and an accountability structure for working toward this goal. The organization, however, must be committed from the highest levels to making the lean transformation. 1
Ultimately, health care shares with manufacturing companies such as Toyota the challenge of producing the highest‐quality products (clinical outcomes) within an environment of constrained resources, while managing a complex business operation and assuring the safety and satisfaction of workers and customers (patients). Both industries need highly reliable systems that will ultimately lead to higher quality and greater safety, efficiency, and appropriateness.
CONCLUSION
The health care industry should learn about and consider adoption of lean techniques in order to improve its processes. More specifically, hospitals are prime locales for reaping the benefits of implementation of lean production, which can significantly affect how health care is delivered to patients. Toyota and other lean exemplars in the manufacturing industry have achieved a high level of success by utilizing the practice of lean. Early results from health care organizations suggest that utilizing lean production methods can lead to substantial improvements in the quality and efficiency of health care. To determine if the magnitude of success experienced by Toyota and other lean exemplars can also be achieved in the health care sector, it will be necessary to continuously test and evaluate the impact lean health care can have. In the hospital setting, where hospitalists are at the forefront of delivering care, it is incumbent on the hospitalist community to evaluate whether these techniques can make a difference in the quality, efficiency, and safety of the care provided to patients.
Lean thinking is still a novel idea to those in the health care sector, and as early adopters of this promising management model, we are very optimistic about the benefits of applying lean concepts in our hospital. Some of the first published reports and results presented on the benefits of lean in individual organizations are encouraging; however, as health care is a scientific community, we believe that future work should undergo rigorous evaluation on the benefits of lean and that such future works should be shared among the health care community through peer‐reviewed and published works.
Acknowledgements
The authors wish to thank the peripherally inserted central catheter (PICC) team for the use of their current and future state maps on PICC line placements that were created for the lean project.
- . The Toyota Way. Madison, Wisc: McGraw‐Hill; 2004.
- , . Decoding the DNA of the Toyota Production System. Harv Bus Rev. 1999; 77( 5): 97–.
- , . The Complete Lean Enterprise, Value Stream Mapping for Administrative and Office Processes. New York, NY: Productivity Press; 2004.
- , . Learning to See, Value‐Stream Mapping to Create Value and Eliminate Muda. Brookline, Mass: The Lean Enterprise Institute, Inc; 2003.
- , . Lean Thinking, Banish Waste and Create Wealth in Your Corporation. 2nd ed. New York, NY: Free Press; 2003.
- NAM. Getting started on the lean journey: first, take a walk! [NAM.org Web site]. Available at http://www.nam.org/s_nam/doc1.asp?CID=200253sect 15.
- . Fixing health care from the inside, today. Harv Bus Rev. 2005; 83( 9): 78– 91.
- Six Sigma—what is Six Sigma? Available at http://www.isixsigma.com/sixsigma/six_sigma.asp. Accessed 2005.
- Overview of the Continuous Quality Improvement Program. 2005. Available at http://www.med.umich.edu/i/exec/cqi/overview.htm. Accessed 2005.
- Kohn LT , Corrigan J , Donaldson MS , eds. To Err Is human: Building a Safer Health System. Washington, DC: National Academy Press; 2000.
- . Testimony of Mark B. McClellan, MD, PhD, Administrator, before the House Ways and Means Subcommittee on Health on Value‐Based Purchasing for Physicians under Medicare. Washington, DC: Centers for Medicare July 21, 2005.
- , , , et al. Does inappropriate use explain geographic variations in the use of health care services? A study of three procedures.[see comment]. JAMA. 1987; 258: 2533– 2537.
- , , , et al. Variations in the use of medical and surgical services by the Medicare population. N Engl J Med. 1986; 314( 5): 285– 290.
- Committee on Quality Health Care in America, Institute of Medicine. Crossing the Quality Chasm: a New Health System for the 21st Century. Washington, DC: National Academy Press; 2001.
- Institute for Healthcare Improvement. Going Lean in Health Care. White Paper. Boston, MA: Institute for Healthcare Improvement; January and February 2005.
- Lean Production at Park Nicollet. Available at http://www.parknicollet.com/media/leanProduction.cfm. Accessed March, 2005.
- , , . Reducing waste and errors: piloting lean principles at Intermountain Healthcare. Jt Comm J Qual Patient Saf. 2005; 31( 5): 249– 257.
- . The lean service machine. Harv Bus Rev. 2003; 81( 10): 123– 129, 38 .

Quality of Inpatient Diabetes Management
Diabetes mellitus is a common comorbidity of hospitalization; in 2003 diabetes was a secondary diagnosis in 17.8% of all adult hospital discharges.1 When undiagnosed diabetes is included, the prevalence of inpatient diabetes or hyperglycemia may be as high as 38%.2 Recent studies show that hyperglycemia in hospitalized patients complicates numerous illnesses and is an independent predictor of adverse outcomes.3 Treatment of inpatient hyperglycemia improves outcomes, including mortality, for patients in surgical intensive care units4 and possibly for those admitted for myocardial infarction.5, 6 For these reasons, the American Diabetes Association and the American College of Endocrinology now recommend that glucose levels of all patients admitted to non‐critical‐care units be maintained below 180 mg/dL.3, 7
Evidence‐based recommendations for achieving these goals include effective protocols for subcutaneous insulin therapy for patients who do not require continuous intravenous insulin infusion. Components of these protocols include use of basal insulin and scheduled nutritional insulin, avoiding use of supplemental (sliding‐scale) insulin alone (which has been shown to be ineffective and possibly deleterious in prior studies),8 and adjustment of insulin orders to reflect nutritional intake, insulin sensitivity, and previous response to therapy.7
We conducted this study to evaluate the current state of glycemic control and adherence to current recommendations on a general medicine service run by hospitalists in a busy teaching hospital. We also sought to correlate insulin‐ordering practices with the quality of glycemic control in these patients.
METHODS
Setting and Participants
This prospective cohort study was conducted at Brigham and Women's Hospital (BWH) from August 1 through September 30, 2004. Eligible subjects were patients admitted to 3 General Medicine Service (GMS) teams with either a known diagnosis of diabetes or inpatient hyperglycemia (random glucose > 200 mg/dL). Patients admitted for diabetic ketoacidosis, hyperosmolar hyperglycemic state, or gestational diabetes were excluded. Members of the BWH/Faulkner Hospitalist Service are the teaching attendings on these 3 teams (each consisting of 2 interns and 1 junior or senior resident) and are the attendings of record for approximately 90% of the patients on these teams. A research assistant identified potential subjects each weekday from the daily computerized sign‐out system used by all medical residents by searching for diabetes on the patient summary, a diabetic medication in the automatically abstracted medication list, or a laboratory glucose value greater than 200 mg/dL from automatically abstracted daily laboratory results. Eligibility criteria were confirmed by medical record review, and any question of eligibility was reviewed with the principal investigator. This study was approved by the BWH Institutional Review Board; patient consent was not deemed necessary for this study given the relatively nonsensitive nature of the data (eg, glucose control, insulin orders), the noninvasive means of collecting it (eg, chart review), and the steps taken by research personnel to minimize any breach in patient confidentiality.
Measurements
We abstracted clinical data on each eligible subject for up to 5 days on GMS. Several data sources were used, including physician admission notes, the hospital's computerized clinical data system, nursing notes, vital sign sheets, the medication administration record, and personal communication with nurses about any missing or discrepant data. Up to 4 routine bedside blood glucose measurements were recorded each day: the measurements taken before meals and at bedtime for patients eating discrete meals or the measurements closest to 6 AM, noon, 6 PM, and midnight for patients not eating or receiving continuous nutrition. Additional measurements were not recorded to avoid ascertainment bias caused by follow‐up testing of abnormal glucose values.
Study outcomes included the percentage of glucose readings below 60 mg/dL (hypoglycemia) and greater than 180 mg/dL (hyperglycemia). Use of several types of insulin ordering practices were also recorded: use of basal insulin (ie, long‐acting agents such as NPH and insulin glargine), scheduled prandial insulin (eg, regular insulin, insulin lispro, and insulin aspart given before each meal), daily adjustments to insulin orders, use of different insulin sliding scales for patients with different daily insulin requirements, orders to hold or adjust insulin doses in patients not eating, and the percentage of the total daily insulin dose given as basal insulin.
Other patient variables collected were age, sex, weight; medical comorbidities (using a modified Charlson score)9; severity of illness (using a simplified APACHE III score)8; admission diagnosis; baseline HbA1C (taken at or within 6 months of admission); severe complications of diabetes (blindness, dialysis, renal transplant, amputation due to peripheral vascular disease, vascular bypass surgery); diabetic medications prior to admission (none, oral agents only, or any insulin use); daily inpatient use of oral or intravenous steroids, oral diabetic medications, dextrose‐containing intravenous fluids, tube feeds, inpatient total parenteral nutrition, and general nutritional intake (all, most, some, little, or none for each meal).
Statistical Analysis
Characteristics of the study subjects and process and outcome measures were analyzed descriptively using rates, means with standard deviations, and medians with interquartile ranges as appropriate. We also analyzed outcomes by patient‐day to determine daily trends during the course of hospitalization. In these analyses, we used the Mantel‐Haenszel chi‐square test for the dichotomous variables (eg, daily use of any basal insulin) and univariable linear regression with general linear models clustered by patient, that is, repeated‐measures analysis, for the continuous variables. We used an arcsin(square‐root) transformation for those continuous outcomes that were percentages (eg, percentage of glucose readings > 180 mg/dL) and logarithmic transformation for right‐tailed continuous variables (eg, total number of units of insulin administered).
To determine the effects of various insulin‐ordering practices on glucose control, we also performed multivariable analysis of mean glucose levels per patient‐day. We chose mean glucose rather than rates of specific glucose ranges as the outcome because of the low rate of hypoglycemia and the additional sensitivity of this method. First, univariable analysis was performed using the Student's t test, analysis of variance, or Spearman correlation as appropriate for each predictor. Multiple linear regression models were then constructed, using variables significant in the univariable testing at the P < .10 level. Confounding variables that changed beta coefficients by 10% or more were retained, whereas collinear terms were removed by hand; patient age and sex were also retained in the models as a priori selected confounding variables.
As with the repeated‐measures analysis, we used general linear models, accounting for within‐patient clustering, with an exchangeable correlation structure. In addition, standard regression techniques could not be applied to the basal insulin variable because use of basal insulin is a mediator of subsequently lower glucose levels but often is the result of previously elevated glucose levels. Instead, we used a marginal structural model,10, 11 weighting the usual regression analysis to statistically remove the effect of confounding by indication. The weights for this analysis were based on the inverse probability of use of basal insulin, given previous glucose levels and prior use of basal insulin and were estimated from a separate logistic regression analysis. Results were considered significant at P < .05 except as noted above. SAS version 8.1 (Cary, NC) was used for all analyses.
RESULTS
We prospectively identified 123 patients for the study. Subsequently, 16 patients were excluded, 11 who did not have diabetes or inpatient hyperglycemia (most of whom had been placed on insulin prophylactically to avoid steroid‐induced hyperglycemia), 2 who were admitted for diabetic ketoacidosis, 2 who were not on GMS teams 13, and 1 whose data could not be accessed. Characteristics of the remaining 107 study subjects are shown in Table 1. The mean age of the subjects was 65.2 years; 55% were men. Nine patients had no previous diagnosis of diabetes, 43% were taking insulin prior to admission, 14% had severe diabetic complications, and the median HbA1C was 7.
| Characteristic | |
|---|---|
| |
| Age, mean (SD), y | 65.2 (14.5) |
| Male | 59/107 (55) |
| No diagnosis of diabetes at admission | 9/107 (8) |
| Preadmission diabetes medication regimen: | |
| None | 24/106 (22) |
| Oral medications only | 36/106 (34) |
| Insulin | 46/106 (43) |
| HbA1C, median (IQR) | 7 (6, 8) |
| Diabetic complications | 15/107 (14) |
| Hospital length of stay, median (IQR), d | 5 (3, 7) |
| Charlson score, mean (SD) | 5.3 (3.0) |
| APACHE III score, mean (SD) | 36.9 (15.6) |
Regarding insulin‐ordering practices (Table 2), 47 patients (43%) had basal insulin prescribed, while 4% of patients had an order for scheduled mealtime short‐ or rapid‐acting insulin. Of the 89 patients on sliding‐scale insulin, 80 (90%) had orders written for the default sliding scale built into the computerized physician order entry system at BWH. There was no correlation between intensity of the sliding scale and the patient's total daily insulin dose (data not shown). Of the patients on sliding‐scale insulin, 47% were prescribed basal insulin, 39% were prescribed oral agents, and 23% were prescribed neither.
| Measure | |
|---|---|
| |
| Process | |
| Any basal insulin during hospitalization | 47/107 (43) |
| Separate nutritional insulin order | 4/107 (3.7) |
| Change in dose to any insulin order during hospitalization if any hyper‐ or hypoglycemia | 26/75 (35) |
| Standard sliding scale from hospital computer order set | 80/89 (90) |
| Any oral diabetic agents during hospitalization | 39/107 (36) |
| Outcomes | |
| Any hyperglycemia (glucose > 180 mg/dL) | 74/98 (76) |
| 0%20% of readings | 20/98 (20) |
| 20%40% | 19/98 (19) |
| 40%60% | 19/98 (19) |
| 60%80% | 6/98 (6.1) |
| Greater than 80% | 10/98 (10) |
| Any hypoglycemia (glucose < 60 mg/dL) | 11/98 (11) |
| 0%20% of readings | 9/98 (9.2) |
| 20%40% | 2/98 (2.0) |
Regarding glucose control, 317 of 1022 glucose meter readings (31%) were greater than 180 mg/dL, and the mean rate of glucose readings greater than 180 mg/dL per patient was also 31%. Approximately three quarters of all patients had at least one routine glucose reading greater than 180 mg/dL, and 35% of patients had at least 40% of their routine glucose readings greater than 180 mg/dL (Table 2). Twelve of 1022 readings (1.2%) were less than 60 mg/dL, and 11% of patients had at least one glucose reading less than 60 mg/dL (Table 2).
Despite a relatively constant percentage of glucose readings greater than 180 mg/dL per patient over the first 5 days of hospitalization (25%36% each day), we found no evidence of change in the percentage of patients prescribed basal insulin or the percentage of insulin given as basal insulin, and there was a small but significant increase in the total amount of insulin prescribed (Table 3). Of the 75 patients with at least one episode of hypo‐ or hyperglycemia, 43 (57%) were ever prescribed basal insulin, 29 (39%) were prescribed oral diabetes agents, and only 26 (35%) had any change to their insulin regimen during the first 5 days of their hospitalization on GMS. Of the 47 patients prescribed basal insulin in the hospital, 41 had been taking insulin prior to admission.
| Hospital day | P value for Trend | |||||
|---|---|---|---|---|---|---|
| 1 | 2 | 3 | 4 | 5 | ||
| ||||||
| Number of patients | 107 | 105 | 85 | 66 | 48 | |
| Mean adjusted total daily insulin units* | 17 | 22 | 23 | 20 | 27 | 0.03 |
| Patients prescribed any basal insulin (%) | 29/79 (37) | 41/93 (44) | 33/74 (45) | 27/57 (47) | 20/43 (47) | 0.18 |
| Mean % of total insulin dose consisting of basal insulin | 35 | 42 | 38 | 39 | 33 | 0.80 |
| Mean % glucose readings < 60 mg/dL | 2 | 1 | 1 | 0 | 1 | 0.13 |
| Mean % glucose readings> 180 mg/dL | 36 | 34 | 29 | 25 | 32 | 0.13 |
In a multivariable analysis of the mean glucose reading per patient‐day, we found several predictors of lower glucose readings, including diet‐controlled diabetes prior to admission and prescription of oral hypoglycemic medications in the hospital. We also found several predictors of higher glucose readings, including severe diabetic complications and higher glucose level at admission. Finally, we noted variation both by medical team (each composed of 1 medical attending, 1 resident, and 2 interns) and by floor of the hospital (each staffed by a different cadre of nurses). Adjusting for these factors (as well as for the daily use of dextrose‐containing intravenous fluids and steroids, sex, age, Charlson comorbidity score, APACHE 3 score, prior diagnosis of diabetes, HbA1C level, and length of hospital stay) use of sliding‐scale insulin alone (eg, without scheduled basal or nutritional insulin) was associated with a daily average glucose reading that was 20 mg/dL higher than that for those prescribed scheduled insulin or those not prescribed a sliding scale at all (95% confidence interval, 5.035 mg/dL; Table 4). In a separate analysis, adjusting for the same clinical factors, we could find no relationship between change in daily dose of basal insulin and change in daily average glucose level (data not shown).
| Characteristic | Effect size (95% CI)* | P value |
|---|---|---|
| ||
| Sliding scale insulin alone | 20 (5.035) | 0.01 |
| Oral diabetes regimen during hospitalization | 22 (413.0) | 0.02 |
| Diet‐controlled diabetes prior to admission | 32 (577.6) | 0.01 |
| No prior diagnosis of diabetes | 28 (3.260) | 0.08 |
| Complications of diabetes | 44 (2167) | < 0.001 |
| HbA1C | 6.1 (120.0073) | 0.05 |
| Admission glucose | 0.19 (0.0670.31) | 0.002 |
| Medical Team‖ | 47 (6727) | < 0.001 |
| Hospital Floor | 46 (6824) | < 0.001 |
DISCUSSION
In this observational study, we found several deficiencies in the management of diabetes and hyperglycemia among hospitalized patients on a hospitalist‐run general medical service. These deficiencies were both in processes of care (eg, limited use of basal and especially nutritional insulin) and in outcomes (ie, glycemic control) compared with national guidelines. We also found evidence of clinical inertia when comparing outpatient to inpatient regimens, when evaluating daily changes in management, and when evaluating responses to previous hyperglycemia. Finally, we demonstrated that use of an insulin sliding scale by itself was associated with worse glycemic control after extensive adjustment for a variety of clinical factors.
Of note, other than the use of sliding‐scale insulin by itself, we could not find a relationship between specific daily adjustments to insulin orders and daily glycemic control in this study. However, we did find differences in glycemic control by medical team and by floor (the latter a proxy for nursing staff). This suggests that glycemic control depends on the exact details of how insulin is managed, rather than on crude measures of insulin adjustment such as change in dose in response to hyperglycemia. These findings also suggest that interventions focused on medical and nursing staff may be able to improve inpatient glycemic control.
The association between the use of oral diabetic agents and improved glucose control was notable and could represent an actual benefit of these agents (especially when added to sliding‐scale insulin by itself) and/or the result of uncontrolled confounding (ie, as a marker of well‐controlled diabetes). Further study is needed to distinguish among these possibilities.
Previous studies have shown evidence of poor inpatient glycemic control as well as the deleterious effects of sliding‐scale insulin by itself.8 This study is perhaps most notable for the suggestion that little, if anything, has changed over the previous decade in this area, despite recent well‐done observational and randomized controlled trials demonstrating the hazards of inpatient hyperglycemia and the publication of expert consensus statements on inpatient glucose management. Strategies to improve glucose control have been investigated to a greater extent in intensive care units12, 13 than on general medical wards,14 perhaps because the strength of evidence is strongest in this setting. Without such strong evidence for general medical patients, factors such as clinician fear of hypoglycemia, clinical inertia, and resistance to institutional change may play predominant roles.
Clinical inertia (ie, recognition of the problem but failure to act)15 has been demonstrated previously in the outpatient management of diabetes16, 17; this study provides evidence of the phenomenon in the inpatient setting. Work by Phillips and colleagues15 has shown that clinical inertia results from at least 3 problems: overestimation of care provided; use of soft reasons to avoid intensification of therapy; and lack of education, training, and practice organization aimed at achieving specific goals. All 3 problems likely contribute to clinical inertia in inpatient diabetes management. Revised educational programs; systems for improving care such as reminders, flow sheets, and order sets; and performance feedback can help address clinical inertia and improve care.15
This study should be viewed in light of its limitations, including relatively small sample size, thus limiting our ability to detect other possible significant predictors of glycemic control, and the use of a single institution, thus limiting generalizability. However, recent data from the University HealthSystem Consortium revealed that our institution was typical of the 37 participating academic medical centers in that study.18 In addition, only 9 patients were identified without a prior diagnosis of diabetes, raising the possibility that some patients with undiagnosed diabetes were missed in our study. However, our search strategy included a daily review of automatically abstracted laboratory values, making this possibility less likely. Strengths of this study include its prospective data collection methods with rigorous inclusion criteria, collection of detailed clinical data, and use of a novel statistical technique to more accurately assess the complex relationship between insulin use and glycemic control, appropriately adjusting for confounding by indication caused by prior glucose measurements.
Future research should focus on patient, clinician, and system barriers to improving inpatient glycemic management, using the clinical inertia framework as a starting point, and on the creation of insulin protocols that can be used and proven effective in the non‐ICU inpatient setting. Also needed are improved measures of the quality of glycemic control, insulin orders, and daily insulin adjustment.
In conclusion, inpatient glycemic management was shown to be in need of improvement. Institutionwide quality improvement efforts should probably target both physician and nursing behavior and should focus on increasing use of basal and nutritional insulin, as proposed in recent guidelines, avoiding use of sliding‐scale insulin by itself, and performing daily insulin adjustment in response to previous hypo‐ or hyperglycemia. Hospitalists can play a major role in these institutionwide quality improvement efforts.
Acknowledgements
We thank Paul Szumita, PharmD, and LeRoi Hicks, MD, MPH, for assistance with the conception of this project and E. John Orav, PhD, for statistical assistance.
- Agency for Healthcare Research and Quality. HCUPnet, Healthcare Cost and Utilization Project. 8/17/2005. Available at: http://www.ahrq.gov/HCUPnet/. Accessed November 29,2005.
- ,,,,,.Hyperglycemia: an independent marker of in‐hospital mortality in patients with undiagnosed diabetes.J Clin Endocrinol Metab.2002;87:978–982.
- ,,, et al.Management of diabetes and hyperglycemia in hospitals.Diabetes Care.2004;27:553–597.
- ,,, et al.Intensive insulin therapy in the critically ill patients.N Engl J Med.2001;345:1359–1367.
- .Prospective randomised study of intensive insulin treatment on long term survival after acute myocardial infarction in patients with diabetes mellitus. DIGAMI (Diabetes Mellitus, Insulin Glucose Infusion in Acute Myocardial Infarction) Study Group.Br Med J.1997;314:1512–1515.
- ,,, et al.Intense metabolic control by means of insulin in patients with diabetes mellitus and acute myocardial infarction (DIGAMI 2): effects on mortality and morbidity.Eur Heart J2005;26:650–661.
- ,,, et al.American College of Endocrinology position statement on inpatient diabetes and metabolic control.Endocr Pract.2004;10(Suppl2):4–9.
- ,,.Glycemic control and sliding scale insulin use in medical inpatients with diabetes mellitus.Arch Intern Med.1997;157:545–552.
- ,,,,.Can comorbidity be measured by questionnaire rather than medical record review?Med Care.1996;34:73–84.
- ,,.Marginal structural models to estimate the joint causal effect of nonrandomized treatments.J Am Stat Assoc—App Case Stud.2001;96:440–448.
- .Correction for non‐compliance in equivalence trials.Stat Med.1998;17:269–302; discussion87–89.
- ,,, et al.Implementation of a safe and effective insulin infusion protocol in a medical intensive care unit.Diabetes Care.2004;27:461–7.
- .Effect of an intensive glucose management protocol on the mortality of critically ill adult patients.Mayo Clin Proc.2004;79:992–1000.
- ,,,.Eliminating inpatient sliding‐scale insulin: a reeducation project with medical house staff.Diabetes Care.2005;28:1008–1011.
- ,,, et al.Clinical inertia.Ann Intern Med.2001;135:825–834.
- ,,,,.Diabetes in urban African‐Americans. XV. Identification of barriers to provider adherence to management protocols.Diabetes Care.1999;22:1617–1620.
- ,,, et al.Clinical inertia in the management of type 2 diabetes metabolic risk factors.Diabet Med.2004;21:150–155.
- University HealthSystem Consortium.Glycemic control 2005 findings and conclusions. Paper presented at Glycemic Control 2005 Knowledge Transfer Meeting. August 19,2005, Chicago, IL.
Diabetes mellitus is a common comorbidity of hospitalization; in 2003 diabetes was a secondary diagnosis in 17.8% of all adult hospital discharges.1 When undiagnosed diabetes is included, the prevalence of inpatient diabetes or hyperglycemia may be as high as 38%.2 Recent studies show that hyperglycemia in hospitalized patients complicates numerous illnesses and is an independent predictor of adverse outcomes.3 Treatment of inpatient hyperglycemia improves outcomes, including mortality, for patients in surgical intensive care units4 and possibly for those admitted for myocardial infarction.5, 6 For these reasons, the American Diabetes Association and the American College of Endocrinology now recommend that glucose levels of all patients admitted to non‐critical‐care units be maintained below 180 mg/dL.3, 7
Evidence‐based recommendations for achieving these goals include effective protocols for subcutaneous insulin therapy for patients who do not require continuous intravenous insulin infusion. Components of these protocols include use of basal insulin and scheduled nutritional insulin, avoiding use of supplemental (sliding‐scale) insulin alone (which has been shown to be ineffective and possibly deleterious in prior studies),8 and adjustment of insulin orders to reflect nutritional intake, insulin sensitivity, and previous response to therapy.7
We conducted this study to evaluate the current state of glycemic control and adherence to current recommendations on a general medicine service run by hospitalists in a busy teaching hospital. We also sought to correlate insulin‐ordering practices with the quality of glycemic control in these patients.
METHODS
Setting and Participants
This prospective cohort study was conducted at Brigham and Women's Hospital (BWH) from August 1 through September 30, 2004. Eligible subjects were patients admitted to 3 General Medicine Service (GMS) teams with either a known diagnosis of diabetes or inpatient hyperglycemia (random glucose > 200 mg/dL). Patients admitted for diabetic ketoacidosis, hyperosmolar hyperglycemic state, or gestational diabetes were excluded. Members of the BWH/Faulkner Hospitalist Service are the teaching attendings on these 3 teams (each consisting of 2 interns and 1 junior or senior resident) and are the attendings of record for approximately 90% of the patients on these teams. A research assistant identified potential subjects each weekday from the daily computerized sign‐out system used by all medical residents by searching for diabetes on the patient summary, a diabetic medication in the automatically abstracted medication list, or a laboratory glucose value greater than 200 mg/dL from automatically abstracted daily laboratory results. Eligibility criteria were confirmed by medical record review, and any question of eligibility was reviewed with the principal investigator. This study was approved by the BWH Institutional Review Board; patient consent was not deemed necessary for this study given the relatively nonsensitive nature of the data (eg, glucose control, insulin orders), the noninvasive means of collecting it (eg, chart review), and the steps taken by research personnel to minimize any breach in patient confidentiality.
Measurements
We abstracted clinical data on each eligible subject for up to 5 days on GMS. Several data sources were used, including physician admission notes, the hospital's computerized clinical data system, nursing notes, vital sign sheets, the medication administration record, and personal communication with nurses about any missing or discrepant data. Up to 4 routine bedside blood glucose measurements were recorded each day: the measurements taken before meals and at bedtime for patients eating discrete meals or the measurements closest to 6 AM, noon, 6 PM, and midnight for patients not eating or receiving continuous nutrition. Additional measurements were not recorded to avoid ascertainment bias caused by follow‐up testing of abnormal glucose values.
Study outcomes included the percentage of glucose readings below 60 mg/dL (hypoglycemia) and greater than 180 mg/dL (hyperglycemia). Use of several types of insulin ordering practices were also recorded: use of basal insulin (ie, long‐acting agents such as NPH and insulin glargine), scheduled prandial insulin (eg, regular insulin, insulin lispro, and insulin aspart given before each meal), daily adjustments to insulin orders, use of different insulin sliding scales for patients with different daily insulin requirements, orders to hold or adjust insulin doses in patients not eating, and the percentage of the total daily insulin dose given as basal insulin.
Other patient variables collected were age, sex, weight; medical comorbidities (using a modified Charlson score)9; severity of illness (using a simplified APACHE III score)8; admission diagnosis; baseline HbA1C (taken at or within 6 months of admission); severe complications of diabetes (blindness, dialysis, renal transplant, amputation due to peripheral vascular disease, vascular bypass surgery); diabetic medications prior to admission (none, oral agents only, or any insulin use); daily inpatient use of oral or intravenous steroids, oral diabetic medications, dextrose‐containing intravenous fluids, tube feeds, inpatient total parenteral nutrition, and general nutritional intake (all, most, some, little, or none for each meal).
Statistical Analysis
Characteristics of the study subjects and process and outcome measures were analyzed descriptively using rates, means with standard deviations, and medians with interquartile ranges as appropriate. We also analyzed outcomes by patient‐day to determine daily trends during the course of hospitalization. In these analyses, we used the Mantel‐Haenszel chi‐square test for the dichotomous variables (eg, daily use of any basal insulin) and univariable linear regression with general linear models clustered by patient, that is, repeated‐measures analysis, for the continuous variables. We used an arcsin(square‐root) transformation for those continuous outcomes that were percentages (eg, percentage of glucose readings > 180 mg/dL) and logarithmic transformation for right‐tailed continuous variables (eg, total number of units of insulin administered).
To determine the effects of various insulin‐ordering practices on glucose control, we also performed multivariable analysis of mean glucose levels per patient‐day. We chose mean glucose rather than rates of specific glucose ranges as the outcome because of the low rate of hypoglycemia and the additional sensitivity of this method. First, univariable analysis was performed using the Student's t test, analysis of variance, or Spearman correlation as appropriate for each predictor. Multiple linear regression models were then constructed, using variables significant in the univariable testing at the P < .10 level. Confounding variables that changed beta coefficients by 10% or more were retained, whereas collinear terms were removed by hand; patient age and sex were also retained in the models as a priori selected confounding variables.
As with the repeated‐measures analysis, we used general linear models, accounting for within‐patient clustering, with an exchangeable correlation structure. In addition, standard regression techniques could not be applied to the basal insulin variable because use of basal insulin is a mediator of subsequently lower glucose levels but often is the result of previously elevated glucose levels. Instead, we used a marginal structural model,10, 11 weighting the usual regression analysis to statistically remove the effect of confounding by indication. The weights for this analysis were based on the inverse probability of use of basal insulin, given previous glucose levels and prior use of basal insulin and were estimated from a separate logistic regression analysis. Results were considered significant at P < .05 except as noted above. SAS version 8.1 (Cary, NC) was used for all analyses.
RESULTS
We prospectively identified 123 patients for the study. Subsequently, 16 patients were excluded, 11 who did not have diabetes or inpatient hyperglycemia (most of whom had been placed on insulin prophylactically to avoid steroid‐induced hyperglycemia), 2 who were admitted for diabetic ketoacidosis, 2 who were not on GMS teams 13, and 1 whose data could not be accessed. Characteristics of the remaining 107 study subjects are shown in Table 1. The mean age of the subjects was 65.2 years; 55% were men. Nine patients had no previous diagnosis of diabetes, 43% were taking insulin prior to admission, 14% had severe diabetic complications, and the median HbA1C was 7.
| Characteristic | |
|---|---|
| |
| Age, mean (SD), y | 65.2 (14.5) |
| Male | 59/107 (55) |
| No diagnosis of diabetes at admission | 9/107 (8) |
| Preadmission diabetes medication regimen: | |
| None | 24/106 (22) |
| Oral medications only | 36/106 (34) |
| Insulin | 46/106 (43) |
| HbA1C, median (IQR) | 7 (6, 8) |
| Diabetic complications | 15/107 (14) |
| Hospital length of stay, median (IQR), d | 5 (3, 7) |
| Charlson score, mean (SD) | 5.3 (3.0) |
| APACHE III score, mean (SD) | 36.9 (15.6) |
Regarding insulin‐ordering practices (Table 2), 47 patients (43%) had basal insulin prescribed, while 4% of patients had an order for scheduled mealtime short‐ or rapid‐acting insulin. Of the 89 patients on sliding‐scale insulin, 80 (90%) had orders written for the default sliding scale built into the computerized physician order entry system at BWH. There was no correlation between intensity of the sliding scale and the patient's total daily insulin dose (data not shown). Of the patients on sliding‐scale insulin, 47% were prescribed basal insulin, 39% were prescribed oral agents, and 23% were prescribed neither.
| Measure | |
|---|---|
| |
| Process | |
| Any basal insulin during hospitalization | 47/107 (43) |
| Separate nutritional insulin order | 4/107 (3.7) |
| Change in dose to any insulin order during hospitalization if any hyper‐ or hypoglycemia | 26/75 (35) |
| Standard sliding scale from hospital computer order set | 80/89 (90) |
| Any oral diabetic agents during hospitalization | 39/107 (36) |
| Outcomes | |
| Any hyperglycemia (glucose > 180 mg/dL) | 74/98 (76) |
| 0%20% of readings | 20/98 (20) |
| 20%40% | 19/98 (19) |
| 40%60% | 19/98 (19) |
| 60%80% | 6/98 (6.1) |
| Greater than 80% | 10/98 (10) |
| Any hypoglycemia (glucose < 60 mg/dL) | 11/98 (11) |
| 0%20% of readings | 9/98 (9.2) |
| 20%40% | 2/98 (2.0) |
Regarding glucose control, 317 of 1022 glucose meter readings (31%) were greater than 180 mg/dL, and the mean rate of glucose readings greater than 180 mg/dL per patient was also 31%. Approximately three quarters of all patients had at least one routine glucose reading greater than 180 mg/dL, and 35% of patients had at least 40% of their routine glucose readings greater than 180 mg/dL (Table 2). Twelve of 1022 readings (1.2%) were less than 60 mg/dL, and 11% of patients had at least one glucose reading less than 60 mg/dL (Table 2).
Despite a relatively constant percentage of glucose readings greater than 180 mg/dL per patient over the first 5 days of hospitalization (25%36% each day), we found no evidence of change in the percentage of patients prescribed basal insulin or the percentage of insulin given as basal insulin, and there was a small but significant increase in the total amount of insulin prescribed (Table 3). Of the 75 patients with at least one episode of hypo‐ or hyperglycemia, 43 (57%) were ever prescribed basal insulin, 29 (39%) were prescribed oral diabetes agents, and only 26 (35%) had any change to their insulin regimen during the first 5 days of their hospitalization on GMS. Of the 47 patients prescribed basal insulin in the hospital, 41 had been taking insulin prior to admission.
| Hospital day | P value for Trend | |||||
|---|---|---|---|---|---|---|
| 1 | 2 | 3 | 4 | 5 | ||
| ||||||
| Number of patients | 107 | 105 | 85 | 66 | 48 | |
| Mean adjusted total daily insulin units* | 17 | 22 | 23 | 20 | 27 | 0.03 |
| Patients prescribed any basal insulin (%) | 29/79 (37) | 41/93 (44) | 33/74 (45) | 27/57 (47) | 20/43 (47) | 0.18 |
| Mean % of total insulin dose consisting of basal insulin | 35 | 42 | 38 | 39 | 33 | 0.80 |
| Mean % glucose readings < 60 mg/dL | 2 | 1 | 1 | 0 | 1 | 0.13 |
| Mean % glucose readings> 180 mg/dL | 36 | 34 | 29 | 25 | 32 | 0.13 |
In a multivariable analysis of the mean glucose reading per patient‐day, we found several predictors of lower glucose readings, including diet‐controlled diabetes prior to admission and prescription of oral hypoglycemic medications in the hospital. We also found several predictors of higher glucose readings, including severe diabetic complications and higher glucose level at admission. Finally, we noted variation both by medical team (each composed of 1 medical attending, 1 resident, and 2 interns) and by floor of the hospital (each staffed by a different cadre of nurses). Adjusting for these factors (as well as for the daily use of dextrose‐containing intravenous fluids and steroids, sex, age, Charlson comorbidity score, APACHE 3 score, prior diagnosis of diabetes, HbA1C level, and length of hospital stay) use of sliding‐scale insulin alone (eg, without scheduled basal or nutritional insulin) was associated with a daily average glucose reading that was 20 mg/dL higher than that for those prescribed scheduled insulin or those not prescribed a sliding scale at all (95% confidence interval, 5.035 mg/dL; Table 4). In a separate analysis, adjusting for the same clinical factors, we could find no relationship between change in daily dose of basal insulin and change in daily average glucose level (data not shown).
| Characteristic | Effect size (95% CI)* | P value |
|---|---|---|
| ||
| Sliding scale insulin alone | 20 (5.035) | 0.01 |
| Oral diabetes regimen during hospitalization | 22 (413.0) | 0.02 |
| Diet‐controlled diabetes prior to admission | 32 (577.6) | 0.01 |
| No prior diagnosis of diabetes | 28 (3.260) | 0.08 |
| Complications of diabetes | 44 (2167) | < 0.001 |
| HbA1C | 6.1 (120.0073) | 0.05 |
| Admission glucose | 0.19 (0.0670.31) | 0.002 |
| Medical Team‖ | 47 (6727) | < 0.001 |
| Hospital Floor | 46 (6824) | < 0.001 |
DISCUSSION
In this observational study, we found several deficiencies in the management of diabetes and hyperglycemia among hospitalized patients on a hospitalist‐run general medical service. These deficiencies were both in processes of care (eg, limited use of basal and especially nutritional insulin) and in outcomes (ie, glycemic control) compared with national guidelines. We also found evidence of clinical inertia when comparing outpatient to inpatient regimens, when evaluating daily changes in management, and when evaluating responses to previous hyperglycemia. Finally, we demonstrated that use of an insulin sliding scale by itself was associated with worse glycemic control after extensive adjustment for a variety of clinical factors.
Of note, other than the use of sliding‐scale insulin by itself, we could not find a relationship between specific daily adjustments to insulin orders and daily glycemic control in this study. However, we did find differences in glycemic control by medical team and by floor (the latter a proxy for nursing staff). This suggests that glycemic control depends on the exact details of how insulin is managed, rather than on crude measures of insulin adjustment such as change in dose in response to hyperglycemia. These findings also suggest that interventions focused on medical and nursing staff may be able to improve inpatient glycemic control.
The association between the use of oral diabetic agents and improved glucose control was notable and could represent an actual benefit of these agents (especially when added to sliding‐scale insulin by itself) and/or the result of uncontrolled confounding (ie, as a marker of well‐controlled diabetes). Further study is needed to distinguish among these possibilities.
Previous studies have shown evidence of poor inpatient glycemic control as well as the deleterious effects of sliding‐scale insulin by itself.8 This study is perhaps most notable for the suggestion that little, if anything, has changed over the previous decade in this area, despite recent well‐done observational and randomized controlled trials demonstrating the hazards of inpatient hyperglycemia and the publication of expert consensus statements on inpatient glucose management. Strategies to improve glucose control have been investigated to a greater extent in intensive care units12, 13 than on general medical wards,14 perhaps because the strength of evidence is strongest in this setting. Without such strong evidence for general medical patients, factors such as clinician fear of hypoglycemia, clinical inertia, and resistance to institutional change may play predominant roles.
Clinical inertia (ie, recognition of the problem but failure to act)15 has been demonstrated previously in the outpatient management of diabetes16, 17; this study provides evidence of the phenomenon in the inpatient setting. Work by Phillips and colleagues15 has shown that clinical inertia results from at least 3 problems: overestimation of care provided; use of soft reasons to avoid intensification of therapy; and lack of education, training, and practice organization aimed at achieving specific goals. All 3 problems likely contribute to clinical inertia in inpatient diabetes management. Revised educational programs; systems for improving care such as reminders, flow sheets, and order sets; and performance feedback can help address clinical inertia and improve care.15
This study should be viewed in light of its limitations, including relatively small sample size, thus limiting our ability to detect other possible significant predictors of glycemic control, and the use of a single institution, thus limiting generalizability. However, recent data from the University HealthSystem Consortium revealed that our institution was typical of the 37 participating academic medical centers in that study.18 In addition, only 9 patients were identified without a prior diagnosis of diabetes, raising the possibility that some patients with undiagnosed diabetes were missed in our study. However, our search strategy included a daily review of automatically abstracted laboratory values, making this possibility less likely. Strengths of this study include its prospective data collection methods with rigorous inclusion criteria, collection of detailed clinical data, and use of a novel statistical technique to more accurately assess the complex relationship between insulin use and glycemic control, appropriately adjusting for confounding by indication caused by prior glucose measurements.
Future research should focus on patient, clinician, and system barriers to improving inpatient glycemic management, using the clinical inertia framework as a starting point, and on the creation of insulin protocols that can be used and proven effective in the non‐ICU inpatient setting. Also needed are improved measures of the quality of glycemic control, insulin orders, and daily insulin adjustment.
In conclusion, inpatient glycemic management was shown to be in need of improvement. Institutionwide quality improvement efforts should probably target both physician and nursing behavior and should focus on increasing use of basal and nutritional insulin, as proposed in recent guidelines, avoiding use of sliding‐scale insulin by itself, and performing daily insulin adjustment in response to previous hypo‐ or hyperglycemia. Hospitalists can play a major role in these institutionwide quality improvement efforts.
Acknowledgements
We thank Paul Szumita, PharmD, and LeRoi Hicks, MD, MPH, for assistance with the conception of this project and E. John Orav, PhD, for statistical assistance.
- Agency for Healthcare Research and Quality. HCUPnet, Healthcare Cost and Utilization Project. 8/17/2005. Available at: http://www.ahrq.gov/HCUPnet/. Accessed November 29,2005.
- ,,,,,.Hyperglycemia: an independent marker of in‐hospital mortality in patients with undiagnosed diabetes.J Clin Endocrinol Metab.2002;87:978–982.
- ,,, et al.Management of diabetes and hyperglycemia in hospitals.Diabetes Care.2004;27:553–597.
- ,,, et al.Intensive insulin therapy in the critically ill patients.N Engl J Med.2001;345:1359–1367.
- .Prospective randomised study of intensive insulin treatment on long term survival after acute myocardial infarction in patients with diabetes mellitus. DIGAMI (Diabetes Mellitus, Insulin Glucose Infusion in Acute Myocardial Infarction) Study Group.Br Med J.1997;314:1512–1515.
- ,,, et al.Intense metabolic control by means of insulin in patients with diabetes mellitus and acute myocardial infarction (DIGAMI 2): effects on mortality and morbidity.Eur Heart J2005;26:650–661.
- ,,, et al.American College of Endocrinology position statement on inpatient diabetes and metabolic control.Endocr Pract.2004;10(Suppl2):4–9.
- ,,.Glycemic control and sliding scale insulin use in medical inpatients with diabetes mellitus.Arch Intern Med.1997;157:545–552.
- ,,,,.Can comorbidity be measured by questionnaire rather than medical record review?Med Care.1996;34:73–84.
- ,,.Marginal structural models to estimate the joint causal effect of nonrandomized treatments.J Am Stat Assoc—App Case Stud.2001;96:440–448.
- .Correction for non‐compliance in equivalence trials.Stat Med.1998;17:269–302; discussion87–89.
- ,,, et al.Implementation of a safe and effective insulin infusion protocol in a medical intensive care unit.Diabetes Care.2004;27:461–7.
- .Effect of an intensive glucose management protocol on the mortality of critically ill adult patients.Mayo Clin Proc.2004;79:992–1000.
- ,,,.Eliminating inpatient sliding‐scale insulin: a reeducation project with medical house staff.Diabetes Care.2005;28:1008–1011.
- ,,, et al.Clinical inertia.Ann Intern Med.2001;135:825–834.
- ,,,,.Diabetes in urban African‐Americans. XV. Identification of barriers to provider adherence to management protocols.Diabetes Care.1999;22:1617–1620.
- ,,, et al.Clinical inertia in the management of type 2 diabetes metabolic risk factors.Diabet Med.2004;21:150–155.
- University HealthSystem Consortium.Glycemic control 2005 findings and conclusions. Paper presented at Glycemic Control 2005 Knowledge Transfer Meeting. August 19,2005, Chicago, IL.
Copyright © 2006 Society of Hospital Medicine
Hospitalized Patients Choose CPR
Respect for patient autonomy is a primary ethical principle guiding the practice of medicine in the United States.1. The Patient Self‐Determination Act (PSDA), enacted to enhance autonomy at the end of life, has not fulfilled its promise for a number of reasons.24 No state mandates that on admission, hospitalized patients be asked to provide informed consent for end‐of‐life procedures. Despite informed consent being a requirement for all other invasive procedures when there is sufficient opportunity to obtain it (eg, in nonemergent situations with a capable patient),5 cardiopulmonary resuscitation (CPR) and mechanical ventilation are assumed, until otherwise stipulated, to be procedures that all patients want. It also has been assumed that patients would believe that a request for informed consent for such procedures on hospital admission implied they had significant risk of cardiopulmonary failure and that this would discourage or disturb acutely ill patients.6 Another impediment to obtaining informed consent is that many physicians may not have sufficient time or level of comfort to be able to routinely approach end‐of‐life discussions. In this prospective study, we hypothesized that acutely ill medical patients would be willing to provide informed consent for CPR and mechanical ventilation and to create written advance directives.
METHODS
This study was approved by the hospital's institutional review board. Patients admitted to the Department of Medicine from December 2003 through February 2004 were candidates for this study. Patients admitted for cardiac catheterization (and similar same‐day medical procedures) or critical illness (admitted to intensive care units) were excluded from the study. In our hospital, all patients are asked by admitting personnel (clerk and nurse) whether they already have advance directives. Some patients are also queried by their physicians about whether they wish to have CPR in the event of cardiopulmonary arrest during hospitalization. Patients who are not asked are assumed to be full codes, that is, they are to receive CPR and mechanical ventilation in the event of cardiac and respiratory failure. For those who are asked, there are generally 3 possible outcomes: (1) the patient chooses to accept CPR and mechanical ventilation, and nothing further is documented; (2) the patient chooses a code status, and it is documented in the admission orders and/or a formal code designation form with a progress note describing the discussion; or (3) the patient defers the decision.
Our data processing department generated a daily list of the patients admitted to the hospital on the previous day. Patients satisfying inclusion criteria were randomized (by a random number generator) to the intervention or the control group. Medical records of all patients were examined to ascertain demographic information, admission Acute Physiology and Chronic Health Evaluation (APACHE) II score, primary diagnosis, number of comorbid illnesses, and documentation of whether the patient had a preexisting advance directive or wishes regarding CPR and mechanical ventilation for that admission.
Patients in the control group were not approached by study personnel, but medical records were surveyed for their in‐hospital outcomes and changes in code or advance directive status. Patients randomized to the intervention arm were approached by 1 of 4 study physicians, who read from a script detailed information about life‐sustaining therapies and advance directives (see Appendix). This script was developed with hospital clinician‐experts and approved by members of the Department of Medicine.
Patients whose primary language was not English were interviewed through in‐house or 3‐way telephone (remote) translators. All patients in the treatment group were assessed during the scripted intervention to ascertain whether they had the capacity to make informed decisions, which was determined based on their ability: (a) to understand the information presented, (b) to consider the information in relation to their personal values, and (c) to communicate their wishes. If personnel doubted an individual's capacity in any of these 3 areas, then he or she was not included in the study (ie, excluded after randomization). In the control group, patients with documented dementia or delirium were also excluded.
As specified in the script, patients in the intervention group were asked at the end of the interview whether they wished to choose their in‐hospital CPR status for that admission. If a patient definitely wanted to change the status indicated in the hospital record, study personnel would communicate the patient's wishes to the admitting physician. Attending physicians were given the opportunity to speak with their patients before changing a code status, but if the physicians agreed with the change, study personnel would document it in the formal orders. Patients were also asked whether they wished to create advance directives; if so, staff from the hospital's patient relations department would meet with them to draft the documents.
The following outcomes were measured: 1) willingness of patients assigned to the intervention group to listen to the script about end‐of‐life/life‐sustaining therapies; 2) opinions of patients about whether the information in the intervention was useful versus whether it was disturbing; 3) the frequency with which patients who had proactively received the information chose or changed their code status; and 4) the frequency with which patients without a preexisting advance directive created one while hospitalized. Simple proportions of each of these variables (ie, observed number divided by total number) in the intervention and control groups were compared using software that calculates the significance of the difference between two percentages (Statistica). The demographics of the patients were compared using the unpaired Student's t test. A P value of < .05 was considered statistically significant.
RESULTS
A total of 585 patients admitted to the Department of Medicine between December 2003 and February 2004 were randomized for the study. Patients were excluded if they had insufficient capacity (133) or if they were rapidly discharged from the hospital (155). Patients who were excluded tended to be more ill (APACHE 8.1 vs. 7.3, P = .06) and were more likely to die while hospitalized (8% vs. 4%, P = .04). A total of 297 patients were included in the study, 136 in the intervention group and 161 in the control group. Baseline characteristics were similar between the 2 groups (see Table 1).
| Characteristic | Intervention (n = 136) | Control (n = 161) | P value |
|---|---|---|---|
| |||
| Age (median) | 65 | 69 | 0.2 |
| <65 years old | 67 (49%) | 67 (42%) | 0.2 |
| Sex | |||
| Female | 63 (46%) | 87 (54%) | 0.2 |
| Ethnicity/Race | |||
| White, non‐Hispanic | 104 (77%) | 113 (70%) | 0.2 |
| Black, non‐Hispanic | 21 (15%) | 24 (15%) | 1.0 |
| Hispanic | 10 (7%) | 20 (12%) | 0.2 |
| Asian and other | 1 (1%) | 4 (2%) | 0.5 |
| Religion | |||
| Catholic | 81 (60%) | 97 (60%) | 1.0 |
| Protestant | 42 (31%) | 43 (27%) | 0.5 |
| Jewish | 7 (5%) | 7 (4%) | 0.7 |
| Buddhist/other | 0 | 2 (1%) | 0.2 |
| Unknown/refused | 6 (4%) | 12 (7%) | 0.3 |
| Education | |||
| Postgrad | 7 (5%) | 4 (3%) | 0.2 |
| College | 39 (29%) | 44 (27%) | 0.7 |
| High school | 61 (45%) | 77 (48%) | 0.6 |
| Elementary | 15 (11%) | 20 (12%) | 0.8 |
| Not known | 14 (10%) | 16 (10%) | 1.0 |
| Admitting Diagnosis | |||
| MI/CAD/ACS | 23 (17%) | 34 (25%) | 0.09 |
| Pneumonia | 16 (12%) | 25 (16%) | 0.3 |
| CHF | 12 (9%) | 6 (4%) | 0.08 |
| Afib/aflutter | 5 (4%) | 15 (9%) | 0.09 |
| GI bleeding | 8 (6%) | 13 (8%) | 0.5 |
| CVA/CVD | 7 (5%) | 12 (7%) | 0.5 |
| Cancer | 7 (5%) | 10 (6%) | 0.7 |
| COPD | 6 (4%) | 10 (6%) | 0.4 |
| Dehydration | 5 (4%) | 8 (5%) | 0.7 |
| DVT | 3 (2%) | 7 (4%) | 0.3 |
| APACHE II score (median) | 6 | 7 | 0.4 |
| Number of comorbidities (median) | 1 | 1 | 0.9 |
| In‐hospital mortality (rate) | 0.05 | 0.08 | 0.3 |
Did Patients Find Information About End‐of‐Life Issues Useful?
Of the 136 patients in the intervention group, 133 (98%) willingly discussed CPR and mechanical ventilation, and 112 (82%) found the information useful. Only 6 patients stated that they were disturbed by the information, 3 of whom refused to discuss CPR and mechanical ventilation. Twelve patients offered no opinion (positive or negative) about the information.
Did Patients Who Received the Intervention Clarify Their CPR Preference?
Of the 136 patients in the intervention arm, 49 (36%) had explicit documentation of their code status on admission, compared to 55 of the 161 patients in the control group (34%; P = .7). Documentation included listing the CPR status in the admission orders or in a completed code designation form. After receiving the intervention, 125 of the 136 patients in the intervention arm (92%) clarified their preferences about CPR and mechanical ventilation.
Of the 49 patients in the intervention group who had documented CPR status on admission, 48 were listed as full code (both CPR and mechanical ventilation), and 1 was documented as refusing both CPR and mechanical ventilation. Of the 48 patients who were full codes, 3 stated they did not want CPR and mechanical ventilation under any circumstances after the intervention. Their preferences were subsequently documented as formal orders. The remaining 45 (94%) stayed full codes (see Figure 1).

Of the 87 patients in the intervention group who had no explicit documentation of CPR status on hospital admission, 76 clarified their preference and 11 did not. Of the 76 patients, 71 wished to receive both CPR and mechanical ventilation, and 5 wanted neither. The status of the latter as no code, no ventilator was subsequently documented in the medical record with the consent of their attending physicians. One of these 5 patients became increasingly ill during hospitalization, with reduced capacity, and family members later asked that he receive only comfort care.
Of the 161 patients in the control group, 55 (34%) had documentation of their code status (ie, to receive CPR if needed) in the admission hospital record. By the end of hospitalization, 1 patient requested no CPR and no mechanical ventilation, and 2 received comfort care with cessation of other active life‐prolonging interventions. Of the 106 without initial code documentation, 4 were later documented as being no code, no ventilator and 2 as being comfort care (see Figure 1).
Did Patients Create Advance Directives?
Thirty‐four of the 136 patients in the intervention group, and 33 of the 161 patients in the control group had advance directives prior to hospital admission. As a result of the intervention, 13 of the 102 patients without previous advance directives created them, compared with 1 of the 128 patients in the control group (P < .001).
DISCUSSION
This study demonstrates that most (95%) hospitalized medical patients welcomed the opportunity to provide prospective informed consent for CPR and mechanical ventilation. Although only a small minority (4%) opted out of CPR/mechanical ventilation, a majority (92%) of those who received the educational intervention chose to accept those therapies if required. This study also demonstrates that hospitalization can be one point‐of‐care where patients can consider and create advance directives. The results of this study are consistent with those of the SUPPORT group4 and other7 studies about patient interest in making choices on CPR. Our study suggests that physicians can elicit patients' wishes about and record formal orders on CPR around the time of hospital admission.
The default action has been to administer CPR and mechanical ventilation after cardiopulmonary failure or arrest, that is, patients receive these procedures unless they state explicitly that they do not want them. Unlike with all other invasive procedures, no national regulation mandates obtaining informed consent prospectively, when possible, for these treatments, because it is assumed that patients would want these therapies rather than the alternative (ie, death). Indeed, it is appropriate to perform lifesaving procedures in emergencies without consent if the patient lacks capacity and a surrogate decision maker cannot be contacted quickly. This clinical approach is consistent with medical ethics: to err on the side of life when a patient's wishes are unknown or unclear. Nonetheless, having a full code as the default action denies patients the opportunity to provide informed consent for these highly invasive procedures because there often is ample opportunity to ask their permission. If patient self‐determination is the categorical imperative of American medicine, then current practice violates that principle at the moment when it may be most important, that is, when a patient's decision about whether to risk life‐sustaining therapies could promote survival or prolong dying. Our study demonstrates that a simple interventionsimply askingpromotes a decision and therefore patient autonomy in most cases.
When patients have opted for life‐sustaining therapies that subsequently have been administered or when patients have received such therapies by default, physicians and patients can be left in 2 situations. In one outcome the patient retains capacity, and the dialogue about life‐sustaining therapies can continue between patient and physician. In the second, frequent scenario, the patient is incapacitated. Until patient capacity can be restored, the physician must work with surrogate decision makers and preexisting advance directives to infer a patient's wishes about continuation of life‐sustaining care. Our data demonstrate that hospital admission is one point‐of‐care at which patients can be offered and can complete, albeit in small numbers, advance directives.8 Previous work with our patients demonstrated that many patients misunderstood advance directives and the degree of effort required to create them.9 We reasoned that more patients might create advance directives if we offered the service for free during hospitalization. We were very surprised at how infrequently patients created advance directives in this study, although this finding is consistent with others in the published literature.8 It is speculated that hospitalized patients may feel too ill to exert themselves and/or are not psychologically prepared to consider end‐of‐life directives (ie, I came to the hospital to get better, not to consider what should be done when I'm terminal ). Some patients may not trust physicians to use advance directives reliably.4, 10
Our study had several important limitations. First, and most important, not all patients who were randomized were enrolled in the study. The most common reasons for exclusion were rapid discharge from the hospital and mental status change calling into question a patient's capacity to make end‐of‐life decisions. Nonetheless, it is only competent patients who can be engaged to decide these questions for themselves. Surrogates (ie, loved ones), guided by advance directives, are left to address resuscitation decisions for those lacking capacity. In addition, patients' predilections may change with time,11 especially as death becomes more imminent. However, insofar as many patients have several hospital admissions as they approach the end of life and are more likely to possess capacity to consider CPR decisions during early admissions, their choices can be recorded repeatedly over time (with each admission or even as status changes during an admission) to inform decisions if they develop incapacity. Little more can be done to enhance autonomy regarding CPR beyond repeatedly educating and asking, as disease and specific illnesses progress. It can be argued that this intervention had little real overall effectmost patients who would have received CPR by default did in fact want it when informed and asked. This is an ethically problematic position for two reasons: it neglects the right of patients to decide for themselves, and it potentially subjects the small group of patients who would reject CPR if asked to an unwanted risky procedure (ie, one that may prolong dying). Another limitation of the present study is that patients were approached by doctors‐in‐training with whom they had had no prior therapeutic relationship. Although it would have been optimal for patients to be approached by their primary care physicians, this was not feasible. Even if we could have convinced all of our medical staff members to implement the intervention, it is unlikely that all would have adhered to a study script, which is what enabled standardization of the information shared with patients. Some physicians may disagree with the script's content. But the goal of this study was not to determine if specific information would affect outcomes; rather, it was to determine if patients were receptive to discussing these issues and making proactive choices regarding life‐sustaining therapies during hospitalization for acute illness. It is possible that using different scripts delivered by different personnel, ideally the patients' own doctors, might have elicited even greater rates of consent and proactive decision making. Finally, the degree to which these results can be generalized may vary based on the population sampled. White and well‐educated patients are more likely to engage in end‐of‐life decision making than non‐White and poorly educated patients.9, 12
In conclusion, this study suggests that capable patients hospitalized for medical problems are willing to give informed consent for (or reject) CPR and mechanical ventilation in the event of cardiopulmonary failure. The approach of the study was very simple. It took roughly 510 minutes to inform patients and elicit their choices. Allowing patients to choose, rather than assuming that CPR is the choice of patients by default, strenuously honors patient autonomy. If these findings are replicated in larger cohorts and at different centers, there would be little justification for not informing patients about and asking them to choose their CPR preferences for each hospitalization. In the meantime, caregivers might consider the appropriateness of addressing these issues when they admit acutely ill patients to the hospital.
APPENDIX
The Scripted Intervention
Good morning. My name is _____________, and I am a research doctor working with colleagues in the Department of Medicine. Doctors here are conducting this research project to increase your opportunities to make choices about what to do if you get very sick during hospitalization. We have no reason to think that this may happen to you, but my purpose is to discuss what if. Do you wish to talk about this now?
If no then:
Should I return later to talk about this with you, or would you prefer not to talk about it at all during your stay with us.
If yes then:
Sometimes patients can become very sick very suddenly, and there isn't enough time to explain treatment options. Again, we have no reason to think that this may happen to you, but my purpose is to discuss what if. There are 2 situations to consider: what to do if your heart stops and what to do if you have difficulty breathing and can't tell us what you want. CPR (or cardiopulmonary resuscitation) is the procedure performed when the heart stops. It involves repeatedly pressing and using electrical shocks on the chest and giving medicines to try to restart the heart. A tube is also placed through the mouth or nose into the lungs so that a breathing machine can pump air into the lungs. CPR may be lifesaving. However, according to most published studies, CPR leads to successful discharge from the hospital for less than 20% of patients. Some patients who survive may have damage to vital organs as a result of the heart stopping. The alternative to receiving CPR is to be allowed to die without attempts at resuscitation. Do you understand what I've said? Should your heart stop during this hospitalization, would you like us to perform CPR on you? [If patient indicates no CPR, the interviewer will repeat: Then you do not want CPR if your heart stops. If patient indicates CPR, the interviewer will repeat: Then you want CPR if your heart stops.]
Breathing machines are used when patients cannot breathe by themselves. Use of these machines usually requires placing a tube through the mouth or nose into the lungs. Breathing machines are used to support patients while doctors try to repair the lungs. These machines are removed if or when patients can breathe on their own. If the condition that has caused your breathing to fail is not likely to improve with treatment, then it may be impossible to ever successfully remove your from the machine. Also, once you are on a breathing machine, you will be unable to speak, and it may be difficult to communicate your wishes. The alternative to going on the breathing machine if you have difficulty breathing is to provide you with oxygen and to use medicines to keep you comfortable. If you are unable to breathe under your own power, you cannot live very long, but our staff will do everything possible to maintain your comfort. Do you understand what I've said? Would you like us to place you on a breathing machine if you cannot breathe on your own and cannot tell us what to do during this hospitalization? [If patient indicates no mechanical ventilation, the interviewer will repeat: Then you do not want to go on a breathing machine if your breathing fails even if it means you will die. If patient indicates he/she wants mechanical ventilation, the interviewer will repeat: Then you want to go on a breathing machine if your breathing fails.]
I can also help you to create a living will, if you wish. Living wills are written documents that can help guide doctors on what to do if you become terminally ill (that is, if there is no chance of recovery). Living wills can also tell doctors whom you want to make decisions on your behalf if you become very sick and cannot speak for yourself. They can also be written to reflect your wishes if you become seriously ill with a nonterminal condition. Would you like me to help you create a living will for you?
Has your doctor had this discussion with you before? If so, when? Did this discussion disturb you? Did you find this information useful?
- National Institutes of Health. The Belmont Report. Available at: http://www.nihtraining.com/ohsrsite/guidelines/belmont.html. Accessed March 4,2005.
- Omnibus Budget Reconciliation Act of 1990, Sect. 4206: Medicare Provider Agreements Assuring the Implementation of a Patient's Right to Participate in and Direct Health Care Decisions Affecting the Patient Sect. 4751: Requirements for Advanced Directives under State Plans for Medical Assistance. US Statute Large.1990;104:1388/115–117,204–206.
- ,,, et al.Do advance directives provide instructions that direct care?SUPPORT Investigators.J Am Geriatr Soc.1997;45:508–512.
- The Support Investigators.A controlled trial to improve care for seriously ill hospitalized patients. The study to understand prognoses and preferences for outcomes and risks of treatments (SUPPORT).JAMA.1995;274:1591–1598.
- Joint Commission Accreditation of Hospital Organizations.Informed Consent.Washington, DC:JCAHO;2000:12.
- .On living wills.Conn Med.2003;67:291–292.
- ,,,.The effect of hospital admission on the opinions and knowledge of elderly patients regarding cardiopulmonary resuscitation.Age Ageing.1997;26:429–434.
- ,,.Influencing advance directive completion rates in non‐terminally ill patients: a systematic review.J Crit Care.2004;19:1–9.
- ,,, et al.Patients' understanding of advance directives and cardiopulmonary resuscitation.J Crit Care.2005;20:26–34.
- ,,,.The role of advance directives and families in end‐of‐life decision in critical care units.Conn Med.2003;67:531–534.
- ,,, et al.Factors associated with change in resuscitation preference of seriously ill patients. The SUPPORT Investigators.Arch Intern Med.1996;156:1558–1564.
- ,,,.Persistence of racial disparities in advance care plan documents among nursing home residents.J Am Geriatr Soc.2002;50:378–381.
Respect for patient autonomy is a primary ethical principle guiding the practice of medicine in the United States.1. The Patient Self‐Determination Act (PSDA), enacted to enhance autonomy at the end of life, has not fulfilled its promise for a number of reasons.24 No state mandates that on admission, hospitalized patients be asked to provide informed consent for end‐of‐life procedures. Despite informed consent being a requirement for all other invasive procedures when there is sufficient opportunity to obtain it (eg, in nonemergent situations with a capable patient),5 cardiopulmonary resuscitation (CPR) and mechanical ventilation are assumed, until otherwise stipulated, to be procedures that all patients want. It also has been assumed that patients would believe that a request for informed consent for such procedures on hospital admission implied they had significant risk of cardiopulmonary failure and that this would discourage or disturb acutely ill patients.6 Another impediment to obtaining informed consent is that many physicians may not have sufficient time or level of comfort to be able to routinely approach end‐of‐life discussions. In this prospective study, we hypothesized that acutely ill medical patients would be willing to provide informed consent for CPR and mechanical ventilation and to create written advance directives.
METHODS
This study was approved by the hospital's institutional review board. Patients admitted to the Department of Medicine from December 2003 through February 2004 were candidates for this study. Patients admitted for cardiac catheterization (and similar same‐day medical procedures) or critical illness (admitted to intensive care units) were excluded from the study. In our hospital, all patients are asked by admitting personnel (clerk and nurse) whether they already have advance directives. Some patients are also queried by their physicians about whether they wish to have CPR in the event of cardiopulmonary arrest during hospitalization. Patients who are not asked are assumed to be full codes, that is, they are to receive CPR and mechanical ventilation in the event of cardiac and respiratory failure. For those who are asked, there are generally 3 possible outcomes: (1) the patient chooses to accept CPR and mechanical ventilation, and nothing further is documented; (2) the patient chooses a code status, and it is documented in the admission orders and/or a formal code designation form with a progress note describing the discussion; or (3) the patient defers the decision.
Our data processing department generated a daily list of the patients admitted to the hospital on the previous day. Patients satisfying inclusion criteria were randomized (by a random number generator) to the intervention or the control group. Medical records of all patients were examined to ascertain demographic information, admission Acute Physiology and Chronic Health Evaluation (APACHE) II score, primary diagnosis, number of comorbid illnesses, and documentation of whether the patient had a preexisting advance directive or wishes regarding CPR and mechanical ventilation for that admission.
Patients in the control group were not approached by study personnel, but medical records were surveyed for their in‐hospital outcomes and changes in code or advance directive status. Patients randomized to the intervention arm were approached by 1 of 4 study physicians, who read from a script detailed information about life‐sustaining therapies and advance directives (see Appendix). This script was developed with hospital clinician‐experts and approved by members of the Department of Medicine.
Patients whose primary language was not English were interviewed through in‐house or 3‐way telephone (remote) translators. All patients in the treatment group were assessed during the scripted intervention to ascertain whether they had the capacity to make informed decisions, which was determined based on their ability: (a) to understand the information presented, (b) to consider the information in relation to their personal values, and (c) to communicate their wishes. If personnel doubted an individual's capacity in any of these 3 areas, then he or she was not included in the study (ie, excluded after randomization). In the control group, patients with documented dementia or delirium were also excluded.
As specified in the script, patients in the intervention group were asked at the end of the interview whether they wished to choose their in‐hospital CPR status for that admission. If a patient definitely wanted to change the status indicated in the hospital record, study personnel would communicate the patient's wishes to the admitting physician. Attending physicians were given the opportunity to speak with their patients before changing a code status, but if the physicians agreed with the change, study personnel would document it in the formal orders. Patients were also asked whether they wished to create advance directives; if so, staff from the hospital's patient relations department would meet with them to draft the documents.
The following outcomes were measured: 1) willingness of patients assigned to the intervention group to listen to the script about end‐of‐life/life‐sustaining therapies; 2) opinions of patients about whether the information in the intervention was useful versus whether it was disturbing; 3) the frequency with which patients who had proactively received the information chose or changed their code status; and 4) the frequency with which patients without a preexisting advance directive created one while hospitalized. Simple proportions of each of these variables (ie, observed number divided by total number) in the intervention and control groups were compared using software that calculates the significance of the difference between two percentages (Statistica). The demographics of the patients were compared using the unpaired Student's t test. A P value of < .05 was considered statistically significant.
RESULTS
A total of 585 patients admitted to the Department of Medicine between December 2003 and February 2004 were randomized for the study. Patients were excluded if they had insufficient capacity (133) or if they were rapidly discharged from the hospital (155). Patients who were excluded tended to be more ill (APACHE 8.1 vs. 7.3, P = .06) and were more likely to die while hospitalized (8% vs. 4%, P = .04). A total of 297 patients were included in the study, 136 in the intervention group and 161 in the control group. Baseline characteristics were similar between the 2 groups (see Table 1).
| Characteristic | Intervention (n = 136) | Control (n = 161) | P value |
|---|---|---|---|
| |||
| Age (median) | 65 | 69 | 0.2 |
| <65 years old | 67 (49%) | 67 (42%) | 0.2 |
| Sex | |||
| Female | 63 (46%) | 87 (54%) | 0.2 |
| Ethnicity/Race | |||
| White, non‐Hispanic | 104 (77%) | 113 (70%) | 0.2 |
| Black, non‐Hispanic | 21 (15%) | 24 (15%) | 1.0 |
| Hispanic | 10 (7%) | 20 (12%) | 0.2 |
| Asian and other | 1 (1%) | 4 (2%) | 0.5 |
| Religion | |||
| Catholic | 81 (60%) | 97 (60%) | 1.0 |
| Protestant | 42 (31%) | 43 (27%) | 0.5 |
| Jewish | 7 (5%) | 7 (4%) | 0.7 |
| Buddhist/other | 0 | 2 (1%) | 0.2 |
| Unknown/refused | 6 (4%) | 12 (7%) | 0.3 |
| Education | |||
| Postgrad | 7 (5%) | 4 (3%) | 0.2 |
| College | 39 (29%) | 44 (27%) | 0.7 |
| High school | 61 (45%) | 77 (48%) | 0.6 |
| Elementary | 15 (11%) | 20 (12%) | 0.8 |
| Not known | 14 (10%) | 16 (10%) | 1.0 |
| Admitting Diagnosis | |||
| MI/CAD/ACS | 23 (17%) | 34 (25%) | 0.09 |
| Pneumonia | 16 (12%) | 25 (16%) | 0.3 |
| CHF | 12 (9%) | 6 (4%) | 0.08 |
| Afib/aflutter | 5 (4%) | 15 (9%) | 0.09 |
| GI bleeding | 8 (6%) | 13 (8%) | 0.5 |
| CVA/CVD | 7 (5%) | 12 (7%) | 0.5 |
| Cancer | 7 (5%) | 10 (6%) | 0.7 |
| COPD | 6 (4%) | 10 (6%) | 0.4 |
| Dehydration | 5 (4%) | 8 (5%) | 0.7 |
| DVT | 3 (2%) | 7 (4%) | 0.3 |
| APACHE II score (median) | 6 | 7 | 0.4 |
| Number of comorbidities (median) | 1 | 1 | 0.9 |
| In‐hospital mortality (rate) | 0.05 | 0.08 | 0.3 |
Did Patients Find Information About End‐of‐Life Issues Useful?
Of the 136 patients in the intervention group, 133 (98%) willingly discussed CPR and mechanical ventilation, and 112 (82%) found the information useful. Only 6 patients stated that they were disturbed by the information, 3 of whom refused to discuss CPR and mechanical ventilation. Twelve patients offered no opinion (positive or negative) about the information.
Did Patients Who Received the Intervention Clarify Their CPR Preference?
Of the 136 patients in the intervention arm, 49 (36%) had explicit documentation of their code status on admission, compared to 55 of the 161 patients in the control group (34%; P = .7). Documentation included listing the CPR status in the admission orders or in a completed code designation form. After receiving the intervention, 125 of the 136 patients in the intervention arm (92%) clarified their preferences about CPR and mechanical ventilation.
Of the 49 patients in the intervention group who had documented CPR status on admission, 48 were listed as full code (both CPR and mechanical ventilation), and 1 was documented as refusing both CPR and mechanical ventilation. Of the 48 patients who were full codes, 3 stated they did not want CPR and mechanical ventilation under any circumstances after the intervention. Their preferences were subsequently documented as formal orders. The remaining 45 (94%) stayed full codes (see Figure 1).
Of the 87 patients in the intervention group who had no explicit documentation of CPR status on hospital admission, 76 clarified their preference and 11 did not. Of the 76 patients, 71 wished to receive both CPR and mechanical ventilation, and 5 wanted neither. The status of the latter as no code, no ventilator was subsequently documented in the medical record with the consent of their attending physicians. One of these 5 patients became increasingly ill during hospitalization, with reduced capacity, and family members later asked that he receive only comfort care.
Of the 161 patients in the control group, 55 (34%) had documentation of their code status (ie, to receive CPR if needed) in the admission hospital record. By the end of hospitalization, 1 patient requested no CPR and no mechanical ventilation, and 2 received comfort care with cessation of other active life‐prolonging interventions. Of the 106 without initial code documentation, 4 were later documented as being no code, no ventilator and 2 as being comfort care (see Figure 1).
Did Patients Create Advance Directives?
Thirty‐four of the 136 patients in the intervention group, and 33 of the 161 patients in the control group had advance directives prior to hospital admission. As a result of the intervention, 13 of the 102 patients without previous advance directives created them, compared with 1 of the 128 patients in the control group (P < .001).
DISCUSSION
This study demonstrates that most (95%) hospitalized medical patients welcomed the opportunity to provide prospective informed consent for CPR and mechanical ventilation. Although only a small minority (4%) opted out of CPR/mechanical ventilation, a majority (92%) of those who received the educational intervention chose to accept those therapies if required. This study also demonstrates that hospitalization can be one point‐of‐care where patients can consider and create advance directives. The results of this study are consistent with those of the SUPPORT group4 and other7 studies about patient interest in making choices on CPR. Our study suggests that physicians can elicit patients' wishes about and record formal orders on CPR around the time of hospital admission.
The default action has been to administer CPR and mechanical ventilation after cardiopulmonary failure or arrest, that is, patients receive these procedures unless they state explicitly that they do not want them. Unlike with all other invasive procedures, no national regulation mandates obtaining informed consent prospectively, when possible, for these treatments, because it is assumed that patients would want these therapies rather than the alternative (ie, death). Indeed, it is appropriate to perform lifesaving procedures in emergencies without consent if the patient lacks capacity and a surrogate decision maker cannot be contacted quickly. This clinical approach is consistent with medical ethics: to err on the side of life when a patient's wishes are unknown or unclear. Nonetheless, having a full code as the default action denies patients the opportunity to provide informed consent for these highly invasive procedures because there often is ample opportunity to ask their permission. If patient self‐determination is the categorical imperative of American medicine, then current practice violates that principle at the moment when it may be most important, that is, when a patient's decision about whether to risk life‐sustaining therapies could promote survival or prolong dying. Our study demonstrates that a simple interventionsimply askingpromotes a decision and therefore patient autonomy in most cases.
When patients have opted for life‐sustaining therapies that subsequently have been administered or when patients have received such therapies by default, physicians and patients can be left in 2 situations. In one outcome the patient retains capacity, and the dialogue about life‐sustaining therapies can continue between patient and physician. In the second, frequent scenario, the patient is incapacitated. Until patient capacity can be restored, the physician must work with surrogate decision makers and preexisting advance directives to infer a patient's wishes about continuation of life‐sustaining care. Our data demonstrate that hospital admission is one point‐of‐care at which patients can be offered and can complete, albeit in small numbers, advance directives.8 Previous work with our patients demonstrated that many patients misunderstood advance directives and the degree of effort required to create them.9 We reasoned that more patients might create advance directives if we offered the service for free during hospitalization. We were very surprised at how infrequently patients created advance directives in this study, although this finding is consistent with others in the published literature.8 It is speculated that hospitalized patients may feel too ill to exert themselves and/or are not psychologically prepared to consider end‐of‐life directives (ie, I came to the hospital to get better, not to consider what should be done when I'm terminal ). Some patients may not trust physicians to use advance directives reliably.4, 10
Our study had several important limitations. First, and most important, not all patients who were randomized were enrolled in the study. The most common reasons for exclusion were rapid discharge from the hospital and mental status change calling into question a patient's capacity to make end‐of‐life decisions. Nonetheless, it is only competent patients who can be engaged to decide these questions for themselves. Surrogates (ie, loved ones), guided by advance directives, are left to address resuscitation decisions for those lacking capacity. In addition, patients' predilections may change with time,11 especially as death becomes more imminent. However, insofar as many patients have several hospital admissions as they approach the end of life and are more likely to possess capacity to consider CPR decisions during early admissions, their choices can be recorded repeatedly over time (with each admission or even as status changes during an admission) to inform decisions if they develop incapacity. Little more can be done to enhance autonomy regarding CPR beyond repeatedly educating and asking, as disease and specific illnesses progress. It can be argued that this intervention had little real overall effectmost patients who would have received CPR by default did in fact want it when informed and asked. This is an ethically problematic position for two reasons: it neglects the right of patients to decide for themselves, and it potentially subjects the small group of patients who would reject CPR if asked to an unwanted risky procedure (ie, one that may prolong dying). Another limitation of the present study is that patients were approached by doctors‐in‐training with whom they had had no prior therapeutic relationship. Although it would have been optimal for patients to be approached by their primary care physicians, this was not feasible. Even if we could have convinced all of our medical staff members to implement the intervention, it is unlikely that all would have adhered to a study script, which is what enabled standardization of the information shared with patients. Some physicians may disagree with the script's content. But the goal of this study was not to determine if specific information would affect outcomes; rather, it was to determine if patients were receptive to discussing these issues and making proactive choices regarding life‐sustaining therapies during hospitalization for acute illness. It is possible that using different scripts delivered by different personnel, ideally the patients' own doctors, might have elicited even greater rates of consent and proactive decision making. Finally, the degree to which these results can be generalized may vary based on the population sampled. White and well‐educated patients are more likely to engage in end‐of‐life decision making than non‐White and poorly educated patients.9, 12
In conclusion, this study suggests that capable patients hospitalized for medical problems are willing to give informed consent for (or reject) CPR and mechanical ventilation in the event of cardiopulmonary failure. The approach of the study was very simple. It took roughly 510 minutes to inform patients and elicit their choices. Allowing patients to choose, rather than assuming that CPR is the choice of patients by default, strenuously honors patient autonomy. If these findings are replicated in larger cohorts and at different centers, there would be little justification for not informing patients about and asking them to choose their CPR preferences for each hospitalization. In the meantime, caregivers might consider the appropriateness of addressing these issues when they admit acutely ill patients to the hospital.
APPENDIX
The Scripted Intervention
Good morning. My name is _____________, and I am a research doctor working with colleagues in the Department of Medicine. Doctors here are conducting this research project to increase your opportunities to make choices about what to do if you get very sick during hospitalization. We have no reason to think that this may happen to you, but my purpose is to discuss what if. Do you wish to talk about this now?
If no then:
Should I return later to talk about this with you, or would you prefer not to talk about it at all during your stay with us.
If yes then:
Sometimes patients can become very sick very suddenly, and there isn't enough time to explain treatment options. Again, we have no reason to think that this may happen to you, but my purpose is to discuss what if. There are 2 situations to consider: what to do if your heart stops and what to do if you have difficulty breathing and can't tell us what you want. CPR (or cardiopulmonary resuscitation) is the procedure performed when the heart stops. It involves repeatedly pressing and using electrical shocks on the chest and giving medicines to try to restart the heart. A tube is also placed through the mouth or nose into the lungs so that a breathing machine can pump air into the lungs. CPR may be lifesaving. However, according to most published studies, CPR leads to successful discharge from the hospital for less than 20% of patients. Some patients who survive may have damage to vital organs as a result of the heart stopping. The alternative to receiving CPR is to be allowed to die without attempts at resuscitation. Do you understand what I've said? Should your heart stop during this hospitalization, would you like us to perform CPR on you? [If patient indicates no CPR, the interviewer will repeat: Then you do not want CPR if your heart stops. If patient indicates CPR, the interviewer will repeat: Then you want CPR if your heart stops.]
Breathing machines are used when patients cannot breathe by themselves. Use of these machines usually requires placing a tube through the mouth or nose into the lungs. Breathing machines are used to support patients while doctors try to repair the lungs. These machines are removed if or when patients can breathe on their own. If the condition that has caused your breathing to fail is not likely to improve with treatment, then it may be impossible to ever successfully remove your from the machine. Also, once you are on a breathing machine, you will be unable to speak, and it may be difficult to communicate your wishes. The alternative to going on the breathing machine if you have difficulty breathing is to provide you with oxygen and to use medicines to keep you comfortable. If you are unable to breathe under your own power, you cannot live very long, but our staff will do everything possible to maintain your comfort. Do you understand what I've said? Would you like us to place you on a breathing machine if you cannot breathe on your own and cannot tell us what to do during this hospitalization? [If patient indicates no mechanical ventilation, the interviewer will repeat: Then you do not want to go on a breathing machine if your breathing fails even if it means you will die. If patient indicates he/she wants mechanical ventilation, the interviewer will repeat: Then you want to go on a breathing machine if your breathing fails.]
I can also help you to create a living will, if you wish. Living wills are written documents that can help guide doctors on what to do if you become terminally ill (that is, if there is no chance of recovery). Living wills can also tell doctors whom you want to make decisions on your behalf if you become very sick and cannot speak for yourself. They can also be written to reflect your wishes if you become seriously ill with a nonterminal condition. Would you like me to help you create a living will for you?
Has your doctor had this discussion with you before? If so, when? Did this discussion disturb you? Did you find this information useful?
- National Institutes of Health. The Belmont Report. Available at: http://www.nihtraining.com/ohsrsite/guidelines/belmont.html. Accessed March 4,2005.
- Omnibus Budget Reconciliation Act of 1990, Sect. 4206: Medicare Provider Agreements Assuring the Implementation of a Patient's Right to Participate in and Direct Health Care Decisions Affecting the Patient Sect. 4751: Requirements for Advanced Directives under State Plans for Medical Assistance. US Statute Large.1990;104:1388/115–117,204–206.
- ,,, et al.Do advance directives provide instructions that direct care?SUPPORT Investigators.J Am Geriatr Soc.1997;45:508–512.
- The Support Investigators.A controlled trial to improve care for seriously ill hospitalized patients. The study to understand prognoses and preferences for outcomes and risks of treatments (SUPPORT).JAMA.1995;274:1591–1598.
- Joint Commission Accreditation of Hospital Organizations.Informed Consent.Washington, DC:JCAHO;2000:12.
- .On living wills.Conn Med.2003;67:291–292.
- ,,,.The effect of hospital admission on the opinions and knowledge of elderly patients regarding cardiopulmonary resuscitation.Age Ageing.1997;26:429–434.
- ,,.Influencing advance directive completion rates in non‐terminally ill patients: a systematic review.J Crit Care.2004;19:1–9.
- ,,, et al.Patients' understanding of advance directives and cardiopulmonary resuscitation.J Crit Care.2005;20:26–34.
- ,,,.The role of advance directives and families in end‐of‐life decision in critical care units.Conn Med.2003;67:531–534.
- ,,, et al.Factors associated with change in resuscitation preference of seriously ill patients. The SUPPORT Investigators.Arch Intern Med.1996;156:1558–1564.
- ,,,.Persistence of racial disparities in advance care plan documents among nursing home residents.J Am Geriatr Soc.2002;50:378–381.
Copyright © 2006 Society of Hospital Medicine
Hospital Diabetes Care
Persons with diabetes have a greater risk of being hospitalized than do nondiabetic persons,1 and hospitalization was a major contributor to health care utilization and costs of patients with diabetes. In 1997, diabetes was the fourth most common comorbid condition in hospitalized patients nationwide. In 2001 in the United States, 562,000 hospital discharges listed diabetes as a principal diagnosis, and more than 4 million discharges listed diabetes in any diagnostic field.24 Nearly one third of diabetes patients may require 2 or more hospitalizations a year,5 and inpatient stays are the largest expense incurred by persons with this disease.6, 7 A substantial number of hospitalized persons are found to have unrecognized diabetes or to develop hyperglycemia during an inpatient stay.8, 9
The severity of hyperglycemia in the hospital has been linked to numerous adverse outcomes in various clinical situations, and recent studies have demonstrated the potential benefits of achieving good glucose control in the inpatient setting.10, 11 Moreover, specific inpatient‐directed interventions can improve the delivery of diabetes care.1216
Unlike the quality of outpatient diabetes care, which has been extensively profiled,1723 little is actually known about inpatient management. However, earlier reports suggested that hyperglycemia is frequently overlooked by health care personnel.8, 24 To develop intervention and educational programs will require insight into how diabetes is being addressed in the hospital. Thus, we undertook a retrospective chart review of inpatients with a discharge diagnosis of diabetes or hyperglycemia in order to assess whether these conditions were being documented and whether glucose management was being addressed.
METHODS
Setting
Our regional referral, academic teaching hospital is a 200‐bed facility in metropolitan Phoenix, Arizona. All adult general medical and surgical specialties are represented at this hospital, including renal, liver, and pancreas transplantation, a level‐2 trauma center, and an inpatient rehabilitation unit. Inpatient care is provided either by postgraduate trainees (residents) or through a separate faculty service; physician assistants and nurse‐practitioners also deliver care. Residents may be supervised by either hospitalist or nonhospitalist attendings. An electronic medical record links outpatient and inpatient records, radiology studies, and laboratory results.
Patient Selection
The study was approved by the Mayo Clinic Institutional Review Board. Patients discharged from our facility during 2003 with a diagnosis code from the International Classification of Diseases, 9th revision, Clinical Modification (ICD‐9‐CM) either for diabetes (ICD‐9‐CM code 250.0) or for hyperglycemia (ICD‐9‐CM code 790.6) were identified in a search of the hospital's electronic records. Data fields retrieved included patient age at admission, ethnicity/race, length of stay, total charges, and type of hospital service with primary responsibility for the patient's care. Because of the large number of available records, we randomly selected 5% of the total for chart review.20, 25, 26
Data Collection
Using an approach similar to that used by others,8 we reviewed admission notes, daily progress notes, and discharge summaries in order to establish whether the practitioner had recorded diabetes or hyperglycemia in the patient's chart. Subjective, objective, assessment, and plan components of notes were reviewed, and credit was given for having addressed diabetes or hyperglycemia if there was any documentation. For patients admitted for elective inpatient procedures, a preoperative outpatient evaluation conducted within 30 days of the hospitalization was counted as the admission note.
Practitioners typically make therapeutic decisions about hyperglycemia management of inpatients on the basis of daily bedside glucose measurements. In our institution, bedside glucose monitoring is performed with an instrument that scans and records patient identification, followed by direct downloading to our laboratory database. We determined whether bedside glucose levels were ordered and if so, whether they were then recorded in the daily progress notes. We determined the frequency of blood glucose measurements. Notes were examined to determine whether an assessment of hyperglycemia was made (defined as any comment in the progress note that addressed the severity of hyperglycemia or the adequacy of glucose control), and written orders were reviewed to establish any therapeutic changes. On completion of the chart reviews and entry of abstracted data into an electronic file, a link was made to the laboratory database to obtain information on bedside glucose values. We report data on notes written by the inpatient team with the principal caretaking responsibility for the patient (the primary service).
Data Analysis
Four primary outcome measures were of particular interest. First, we analyzed the percentage of patients who had diabetes or hyperglycemia documented in admission, daily progress, or discharge notes. Second, we determined the proportion of patients for whom bedside glucose measurements were ordered. Third, we calculated the percentage of patients with a written assessment of glycemic control. Finally, we examined the proportion of patients who had a change in therapy for treatment of hyperglycemia. Change in therapy was defined as any increase or decrease in the doses of an oral agent or insulin that occurred between admission day orders and the active orders on the day of discharge.
We determined the proportion of patients who had at least one hypoglycemic (glucose <70, <60, <50, <40 mg/dL) or hyperglycemic (>200, >250, >300, >350, >400 mg/dL) measurement documented by bedside monitoring. We also calculated the frequency of hypoglycemic and hyperglycemic values as the number of events per person per 100 measurements; as suggested by others,27 this approach to assessing glycemic control allows adjustment for different numbers of measurements across individuals and captures information on multiple episodes of hypo‐ or hyperglycemia in a single patient. All available bedside glucose values were averaged to determine the overall level of glucose control for the hospitalization and were divided into 3 intervals using cut points based on tertiles; the differences in the proportion of patients who had changes made in diabetes therapy was determined across tertiles using the 2 test. We determined the odds of changing therapy in the second and third tertiles of average bedside glucose relative to the first tertile. Differences in any continuous variables were evaluated using nonparametric methods (Mann‐Whitney test). Cases from all primary services were analyzed in aggregate.
RESULTS
General Patient Characteristics
Of all the patient hospitalization records for 2003, 1812 had a discharge diagnosis of diabetes or hyperglycemia. A random sample of 5% of these 1812 records yielded 90 records for chart review. The mean patient age was 68 years; 53% were male, and 90% were white.. Average length of stay was 4.8 days (Table 1). No significant differences in age, length of stay, sex, race, or source of admission (all P > .1) were detected between the 90 cases undergoing chart review and those cases that were not selected. On admission day, 63% of the patients were placed on insulin therapy, 17% on combination treatment of oral agents and insulin, and 7% on oral agents; the remaining 13% did not receive pharmacotherapy to treat their hyperglycemia. Thus, 80% were placed on insulin on the day they were admitted. By the day of discharge, 61% of the patients were on insulin therapy, either alone or in combination with oral agents. Of those on insulin therapy during their hospital stay, 35% were on a scheduled program of long‐ plus short‐acting insulin, and 65% were only on a sliding scale program.
| Characteristic | Value* |
|---|---|
| |
| Mean age (years) | 68 |
| Mean length of stay (days) | 4.8 |
| Men | 53 |
| White | 90 |
| Diabetes therapy at admission | |
| Insulin only | 63 |
| Oral agents only | 7 |
| Combination oral agents and insulin | 17 |
| Diet | 13 |
| Source of admission | |
| Physician office or clinic | 46 |
| Emergency room | 46 |
| Transfer | 8 |
| Primary service | |
| General medical | 41 |
| Surgical | 31 |
| Other | 28 |
| Teaching service | 48 |
Most patients were admitted through either an outpatient clinic (46%) or the emergency department (46%), with the remainder coming as transfers from other facilities (Table 1). Most inpatients were cared for by a general medical team (general internal or family medicine, 41%), whereas 31% were managed by one of the surgical specialties, and 28% were under the care of other specialties (eg, cardiology, transplantation, rehabilitation). Once hospitalized, most patients (94%) stayed on the original admitting service throughout their stay; 48% of patients were on a service staffed by a postgraduate trainee (Table 1). Two patients required a brief stay in the intensive care unit, but otherwise the sample was made up of noncritically ill patients.
Fifteen patients had their hemoglobin A1c measured in the hospital, with mean A1c of 7.0% 1.4%, whereas 57 patients had a documented preadmission hemoglobin A1c (average time before admission 29 weeks); their average A1c was 6.9% 1.2% (not shown).
Documentation of Diabetes
Of the 90 patients whose records were reviewed, 81 had preexisting diabetes, 3 had a diagnosis of metabolic syndrome or abnormal glucose tolerance, and 6 had hyperglycemia that developed during the admission hospitalization. When admission notes of persons with known diabetes or abnormal glucose tolerance were examined (Fig. 1), diabetes was documented in 96%. In the daily progress notes of the primary service, 62% of patients had diabetes documented at least once during their hospitalization, whereas the records of 38% had no mention of diabetes. When only those patients with known diabetes or evidence of inpatient hyperglycemia were considered, documentation of the diabetic condition was made in 60% of discharge summaries, and the need for follow‐up was noted in just 20% (Fig. 1).

Fifty‐seven percent (n = 51) of the 90 patients whose records were sampled had had some type of consultant involved with their care, but only 13% had had an endocrinology consultation. For 27 patients (30% of all 90 cases), diabetes or hyperglycemia was documented in a consultant's note; thus, there was evidence that the issue of glucose management was being addressed by someone other than a member of the primary team and that someone was not necessarily an endocrinologist. When excluding those patients whose consultant addressed diabetes or hyperglycemia, only 53% had documentation of the problems recorded in the daily progress notes (data not shown).
Recording and Assessment of Glucose Values
Most of the 90 patients whose records were reviewed (86%; n = 79) had documentation in physician orders for bedside glucose monitoring during their hospital stay (Fig. 2), and 53% had bedside glucose levels recorded in at least one daily progress note, whereas documentation was absent in 47%. A written assessment of glucose control was found in the records of 52% of the hospitalized patients; 48% lacked any evaluation of the severity of their hyperglycemia (Fig. 2). Excluding data listed from consultants, bedside glucose data was recorded for 53% of patients, and an assessment of glycemic control was made for 41%.
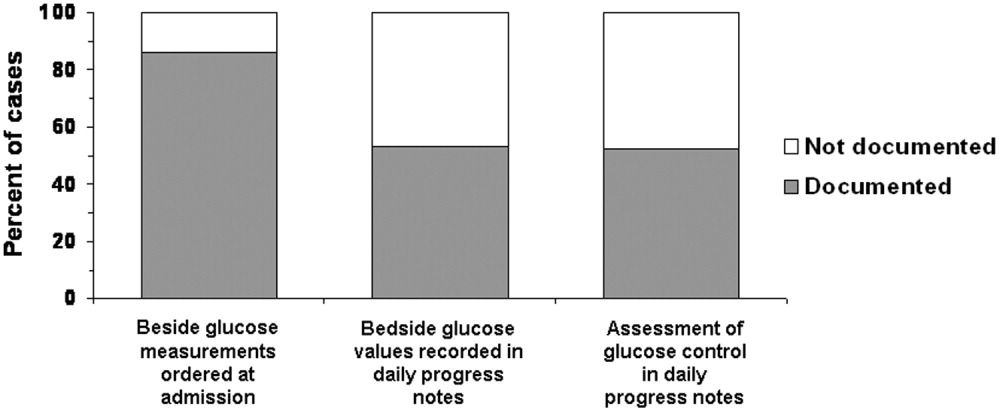
Glycemic Control
The average daily number of bedside glucose measurements was 4, while the daily frequency of blood glucose tests was only 1; an average of 10 bedside readings were obtained per patient. The mean bedside glucose value (averaged over the length of stay) was 170 mg/dL. At the time of admission, 33% of patients had a bedside glucose value >200 mg/dL (Fig 3, top panel), and 27% had a value >200 mg/dL before discharge (Fig 3, middle panel). Based on the bedside glucose averaged over the length of stay, 29% of patients had persistent hyperglycemia (Fig. 3, bottom panel).
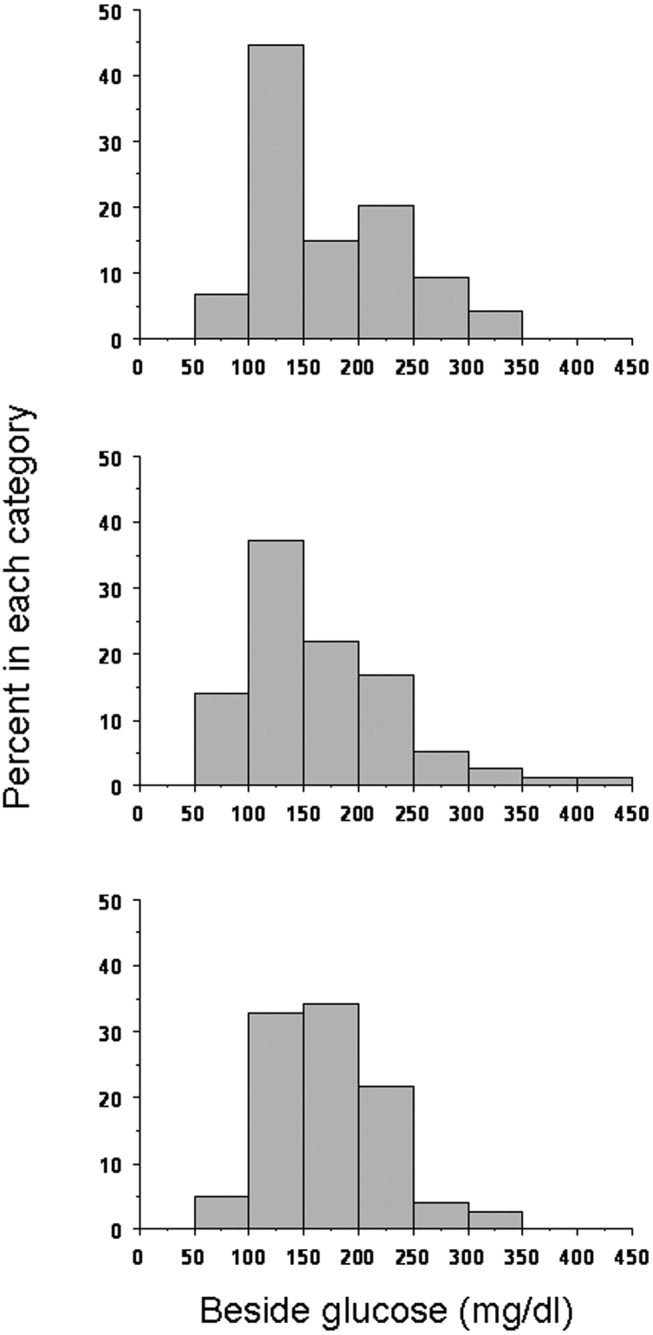
Hypoglycemia was rare. Only 11% of patients had at least one bedside measurement that was <70 mg/dL; 5% a measurement of <60 mg/dL, 4% a measurement of <50 mg/dL, and 1% a measurement of <40 mg/dL (Fig. 4). The frequency of values <70 mg/dL was 1.1 per person per 100 measurements; of values <60 mg/dL, 0.66; of values <50 mg/dL, 0.18; and of values <40 mg/dL, 0.08. In contrast, hyperglycemia was common: 71% of patients had at least one value >200 mg/dL; 43% at least one value >250 mg/dLl 24% at least one value >300 mg/dL; 20% at least one value >350 mg/dL; and 9% at least one value >400 mg/dL (Fig. 4). The frequency of hyperglycemic events was 28.2 per person per 100 measurements for values >200 mg/dL, 11.2 for values >250 mg/dL, 5.3 for values >300 mg/dL, 2.4 for values >350 mg/dL, and 1.1 for values >400 mg/dL.
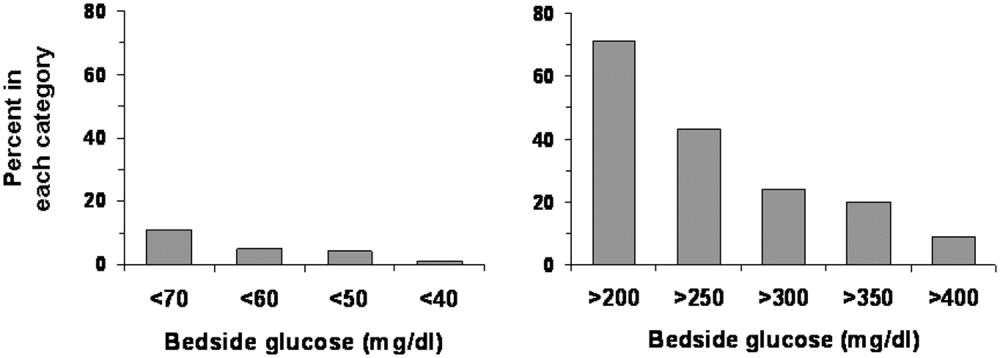
Changes in Therapy
Overall, changes were made in the hyperglycemia therapy of only 34% of patients. Treatment was changed for 50% of patients who had at least one glucose reading >200 mg/dL, and 89% of patients who had at least one glucose reading <70 mg/dL. Figure 5 shows whether changes in treatment occurred by tertiles of average bedside glucose. The percentage of patients with a change in therapy increased with worse hyperglycemia, although 32% in the third tertile still had not had a change in treatment. The odds of those in the second tertile having a change in therapy (compared with those in the first tertile) were 1.9 (95% confidence interval 0.556.25, P = .32), but were 5.6 (95% confidence interval 1.6818.7, P = .005) for patients in the third tertile. The frequency of glucose values <70 mg/dL was 1.8 per person per 100 measurements for patients in the first tertile, 1.1 for patients in the second tertile, but only 0.29 per person per 100 measurements for patients in the third tertile. The average number of glucose measurements >200 mg/dL per person was 2.9 per 100 measurements for patients in the first tertile, 22.7 for patients in the second tertile, and 60.0 for patients in the third tertile (not shown).
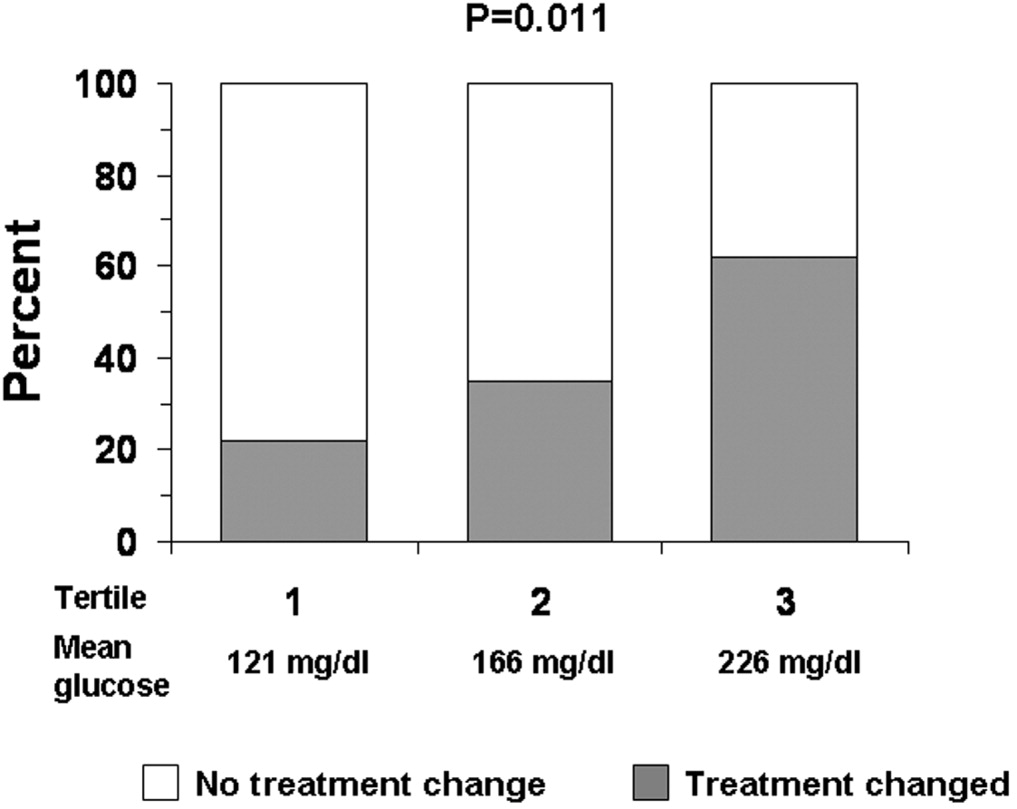
DISCUSSION
Just as clinical trials in the outpatient setting have demonstrated the benefits of good glycemic control,2830 recent studies have also suggested that treatment of hyperglycemia during hospitalization can improve outcomes.10, 11 Consequently, there has been increased attention to the management of glucose in the hospital, with recognition of the need for inpatient‐specific standards for diabetes care.10, 11, 31 Optimization of management and of education about diabetes and hyperglycemia in the hospital requires better understanding of current care practices in order to determine where to direct interventions.
Nearly all the 90 patients whose records we reviewed had preexisting diabetes or a known potential glucose abnormality that was documented either at the time of, or just prior to, hospital admission. The observation that most patients had orders for bedside glucose monitoring also indicated that practitioners were aware of the diagnosis when the patient was admitted. Although clinicians seemed to be aware of the potential problem of glucoseand the majority of clinicians did some trackinga substantial number of hospitalizations (nearly 40%) had no documentation of diabetes or hyperglycemia after admission. If diabetes was not the principal reason for hospitalization, it is possible that the primary team did not focus on managing hyperglycemia. Nonetheless, the hospital encounter does represent an opportunity to address glucose management and perhaps improve care and outcomes, even if the patient was admitted for an unrelated condition.32 Because the average length of stay was almost 5 days, there should have been sufficient time to address diabetes in most patients.
Although most patients had the condition of their diabetes documented in their discharge notes, a substantial proportion of the discharge notes did not mention an outpatient plan to follow up on the diabetes or hyperglycemia. A recent study suggested that direct referral for outpatient diabetes services increased the chances of patient follow‐up.33 Educating practitioners about the need to emphasize to patients the importance of diabetes postdischarge care is a program that could be developed and implemented in the hospital setting.
Although bedside glucose monitoring was appropriately ordered in most instances, the actual recording of values and the assessment of glucose control were documented in the records of only about half the patients during their hospitalizations. Moreover, even among patients who had high bedside glucose levels, changes in therapy often did not occur. Clinician concern about inducing hypoglycemia in hospitalized patients has been cited as a factor limiting the intensification of treatment for diabetes.34 The frequency in our facility of documented low blood glucose values was small, although there may have been unrecognized episodes. However, missed events were probably unusual, given the daily average of 4 bedside glucose measurements per patient, ongoing nursing staff contact with patients, and a formal policy to document and treat hypoglycemia. We found that hyperglycemia was far more common than hypoglycemia and that there were likely many opportunities to control blood glucose more rigorously.
Practitioners appeared to be responding to hypoglycemia, as a large proportion of the patients with a glucose reading of <70 mg/dL had a change in therapy. However, the response to hyperglycemia was delayedthe odds of therapy being changed were significant only for patients whose glucose levels were in the third tertile. Despite evidence of hyperglycemia and the low frequency of hypoglycemia of those whose glucose levels were in the second and third tertiles, a substantial proportion of patients did not have their therapy changed. Combined with the observation that glucose data and diabetes were often not documented, our data suggest that there may be a problem of clinical inertia in the inpatient setting. Clinical inertia has been defined as not initiating or intensifying therapy when doing so is indicated.35, 36 Other reports have also documented clinical inertia in the outpatient environment.23, 3741 Overcoming clinical inertia, at least in regard to diabetes management, can improve glycemic control in patients.35 To improve the management of hyperglycemia in the hospital, educational interventions must be developed to teach health care practitioners effective strategies for glucose reduction. We did not quantify the changes in therapy (eg, how much insulin was changed or in what direction), only whether a change had been made. The observation that the proportion of cases on insulin at discharge was less than on admission day suggests that there may actually have been deintensification of therapy taking placesome of the cases in which therapy was changed, therefore, likely included instances of negative therapeutic momentum despite evidence of hyperglycemia. The control of inpatient hyperglycemia will likely require frequent changes in therapy, as it does in the outpatient setting, and detailed information about treatment strategies actually employed will be necessary to design educational programs.
One limitation of our analysis was that the study was retrospective, which did not allow assessment of the reasons underlying the behavior of the clinicians, such as why they did not document diabetes or change therapy. We selected a 5% sample for our study as per common methods.20, 25, 26 Thus, although the 90 patients making up the sample were randomly selected and were not different demographically from the larger population of patients admitted with diabetes, the number of cases we reviewed was small compared with the actual number of discharged patients with diabetes. Cases were diagnosed by diagnosis codes; therefore, it is likely that some diabetes cases were missed, and other patients with hyperglycemia may not have had the diagnosis even documented.8, 24 Our study design and sample size precluded a comparison of outcomes between cases with in which a consultant was involved with those in which a consultant was not involved or a comparison of cases according to type of consultant involved.1216 Finally, our study focused on noncritically ill patients; thus, our findings cannot be generalized to care provided in the intensive care unit.
There are no definitive guidelines on what method (ie, blood or bedside glucose) should be used to evaluate glycemic control in the hospital. The methods we used here can serve as means to benchmark and track improvement in glycemic control. The observations that most patients had bedside glucose monitoring ordered and that the frequency of these measurements was high compared with the frequency of actual blood glucose assessments support the idea that practitioners favored this method to evaluate the level of glycemic control in the hospital. In practice, it is bedside glucose evaluation that clinicians use to make decisions about day‐to‐day treatment of hyperglycemia. In our facility, the method for bedside glucose monitoring is standardized and is part of a quality assurance program. Moreover, the high average frequency of bedside blood glucose determination increased the chance of detecting hyper‐ and hypoglycemic events.
Current guidelines provide suggestions about target pre‐ and postprandial glucose levels for noncritically ill patients.11 However, these targets are not universally recognized.42 For instance, the Institutes for Healthcare Improvement's Prevent Surgical Site Infections initiative defines a glucose level of <200 mg/dL as its target perioperative glucose control level.43 In practice, it can be difficult to assess glucose control in terms of pre‐ and postprandial categories. Although bedside glucose monitoring in our facility is typically ordered before meals and at bedtime, in many cases prolonged periods of patient fasting, disrupted meal schedules, mismatching insulin with meals, and use of continuous parental and enteral nutritional support all make it difficult to assess pre‐ and postprandial glycemic control retrospectively. Hence, we used as our measures the value of the bedside glucose averaged over the length of the hospital stay and the number of hyper‐ and hypoglycemic events.
In general, our study was hampered by a lack of hospital‐specific process measures to evaluate the quality of inpatient diabetes care. Process measures such as the frequency of hemoglobin A1c monitoring or performance of ophthalmologic examinations,1723 which are commonly used to assess quality of diabetes care in the outpatient arena, may not be optimal variables for evaluating care in the hospital. New methods to guide efforts to improve the quality of inpatient management of diabetes and hyperglycemia are needed.
Despite these limitations, our analysis was helpful in providing direction about how to enhance the care of hospitalized patients with hyperglycemia or known diabetes. Constructing institution‐specific management guidelines for the care of inpatient diabetes and hyperglycemia would provide a yardstick against which to measure the care provided by both the hospital and the individual clinician. Educational programs can be developed to increase awareness among practitioners of the importance of inpatient glucose control and of the need to improve ongoing documentation of the problem. Exploring practitioner barriers to treatment of inpatient hyperglycemia should be an essential component of this educational process. Finally, consensus strategies on when to initiate and change therapy should be designed so that hyperglycemia in the hospital can be managed more effectively. All these areas must be addressed to assure delivery of the highest‐quality inpatient care to patients with diabetes.
- ,,,,.Diabetes‐related hospitalization and hospital utilization. In:Diabetes in America: National Diabetes Data Group.2nd ed.Bethesda (MD):National Institutes of Health, National Institute of Diabetes and Digestive and Kidney Diseases;1995:553–563.
- .Hospitalization in the United States, 1997: HCUP fact book no. 1: diagnosis, charges, length of stay, insurance coverage, discharge status, inhospital deaths.Rockville (MD):Agency for Healthcare Research and Quality;2000.
- Centers for Disease Control and Prevention. Hospitalization for diabetes as first‐listed diagnosis. Available from: http://www.cdc.gov/diabetes/statistics/dmfirst/table1.htm. Accessed: June 2,2005.
- Centers for Disease Control and Prevention. Hospitalizations for diabetes as any‐listed diagnosis. Available from: http://www.cdc.gov/diabetes/statistics/dmany/fig1.htm. Accessed: June 2,2005.
- ,,,.Multiple hospitalizations for patients with diabetes.Diabetes Care.2003;26:1421–1426.
- ,,,.Excess costs of medical care for patients with diabetes in a managed care population.Diabetes Care.1997;20:1396–1402.
- ,,,American Diabetes Association.Economic costs of diabetes in the US in 2002.Diabetes Care.2003;26:917–932.
- ,,,,.Unrecognized diabetes among hospitalized patients.Diabetes Care.1998;21:246–249.
- ,,,,,.Hyperglycemia: an independent marker of in‐hospital mortality in patients with undiagnosed diabetes.J Clin Endocrinol Metab.2002;87:978–982.
- ,,,,,,American Diabetes Association Diabetes in Hospitals Writing Committee, et al.Management of diabetes and hyperglycemia in hospitals.Diabetes Care.2004;27:553–591. Erratum in: Diabetes Care. 2004;27:856 and Diabetes Care. 2004;27:1255.
- ,,,,,,American College of Endocrinology Task Force on Inpatient Diabetes Metabolic Control, et al.American College of Endocrinology position statement on inpatient diabetes and metabolic control.Endocr Pract.2004;10:77–82.
- ,,,.Effect of physician specialty on outcomes in diabetic ketoacidosis.Diabetes Care.1999;22:1790–1795.
- ,,,.Impact of endocrine and diabetes team consultation on hospital length of stay for patients with diabetes.Am J Med.1995;99:22–28.
- ,,.Effects of an intervention by a diabetes team in hospitalized patients with diabetes.Diabetes Care.1997;20:1553–1555.
- ,.Nursing case management: an innovative model of care for hospitalized patients with diabetes.Diabetes Educ.1993;19:517–521.
- ,,,,.Evaluation of a hospital diabetes specialist nursing service: a randomized controlled trial.Diabet Med.2001;18:301–307.
- ,,,,,.Variation in office‐based quality. A claims‐based profile of care provided to Medicare patients with diabetes.JAMA.1995;273:1503–1508.
- ,,,,,, et al.Outpatient management of diabetes mellitus in five Arizona Medicare managed care plans.Am J Med Qual.1996;11:87–93.
- ,,,.Quality of outpatient care provided to diabetic patients: a health maintenance organization experience.Diabetes Care.1996;19:601–6.
- United States General Accounting Office: report to the Chairman, Subcommittee on Health and Environment, Committee on Commerce, House of Representatives.Medicare: most beneficiaries with diabetes do not receive recommended monitoring services. GAO/HEHS‐97–48.1997.
- ,,,,.Care of patients with type II diabetes: a study of family physicians' compliance with clinical practice guidelines.J Fam Pract.1997;44:374–381.
- ,,,,,.A diabetes report card for the United States: quality of care in the 1990s.Ann Intern Med.2002;136:565–574.
- ,,,University HealthSystem Consortium (UHC) Diabetes Benchmarking Project Team.Quality of diabetes care in U.S. academic medical centers: low rates of medical regimen change.Diabetes Care.2005;28:337–442.
- ,,,.An audit of the management and outcome of hospital inpatients with diabetes: resource planning implications for the diabetes care team.Diabet Med.1992;9:753–755.
- .Improving outcomes in public health practice: strategy and methods.Gaithersburg (MD):Aspen Publishers;1997:175–213.
- ,,,,,.Outpatient diabetes management of Medicare beneficiaries in four Mississippi fee‐for‐service primary care clinics.J Miss State Med Assoc.1999;40:8–13.
- ,,.Glycemic control and sliding scale insulin use in medical inpatients with diabetes mellitus.Arch Intern Med.1997;157:545–552.
- The Diabetes Control and Complications Trial Research Group.The effect of intensive treatment of diabetes on the development and progression of long‐term complications in insulin‐dependent diabetes mellitus.N Engl J Med.1993;329:977–986.
- UK Prospective Diabetes Study (UKPDS) Group.Intensive blood‐glucose control with sulphonylureas or insulin compared with conventional treatment and risk of complications in patients with type 2 diabetes (UKPDS 33).Lancet.1998;352:837–53. Erratum in: Lancet. 1999;354:602.
- UK Prospective Diabetes Study (UKPDS) Group.Effect of intensive blood‐glucose control with metformin on complications in overweight patients with type 2 diabetes (UKPDS 34).Lancet.1998;352:854–65. Erratum in: Lancet. 1998;352:1557.
- ,,.Current standards of care for inpatient glycemic management and metabolic control: is it time for definite standards and targets?Endocr Pract.2004;10(Suppl 2):10–12.
- ,.Windows of opportunity to improve diabetes care when patients with diabetes are hospitalized for other conditions.Diabetes Care.2001;24:1371–1376.
- ,,, et al.Inpatient to outpatient transfer of care in urban patients with diabetes: patterns and determinants of immediate postdischarge follow‐up.Arch Intern Med.2004;164:447–453.
- ,,, et al.Hospital hypoglycemia: not only treatment but also prevention.Endocr Pract.2004;10(Suppl 2):89–99.
- ,,, et al.Diabetes in urban African‐Americans. XVI. Overcoming clinical inertia improves glycemic control in patients with type 2 diabetes.Diabetes Care.1999;22:1494–1500.
- ,,, et al.Clinical inertia.Ann Intern Med.2001;135:825–834.
- .Management of older hypertensive patients: is there a difference in approach?J Clin Hypertens (Greenwich).2003;5(Suppl 4):11–16.
- ,,, et al.Narrowing the gap in hypertension: effectiveness of a complex antihypertensive program in the elderly.Dis Manag.2004;7:235–243.
- ,,, et al.Clinical inertia in the management of Type 2 diabetes metabolic risk factors.Diabet Med.2004;21:150–155.
- ,.Clinical inertia: errors of omission in drug therapy.Am J Health Syst Pharm.2004;61:401–404.
- .Overcome clinical inertia to control systolic blood pressure.Arch Intern Med.2003;163:2677–2678.
- ,.Counterpoint: inpatient glucose management: a premature call to arms?Diabetes Care.2005;28:976–979.
- Institute for Healthcare Improvement. Getting started kit: prevent surgical site infections. Available from: www.ihi.org/NR/rdonlyres/00EBAF1F‐A29F‐4822‐ABCE‐829573255AB8/0/SSIHowtoGuideFINAL.pdf. Accessed June 2,2005.
Persons with diabetes have a greater risk of being hospitalized than do nondiabetic persons,1 and hospitalization was a major contributor to health care utilization and costs of patients with diabetes. In 1997, diabetes was the fourth most common comorbid condition in hospitalized patients nationwide. In 2001 in the United States, 562,000 hospital discharges listed diabetes as a principal diagnosis, and more than 4 million discharges listed diabetes in any diagnostic field.24 Nearly one third of diabetes patients may require 2 or more hospitalizations a year,5 and inpatient stays are the largest expense incurred by persons with this disease.6, 7 A substantial number of hospitalized persons are found to have unrecognized diabetes or to develop hyperglycemia during an inpatient stay.8, 9
The severity of hyperglycemia in the hospital has been linked to numerous adverse outcomes in various clinical situations, and recent studies have demonstrated the potential benefits of achieving good glucose control in the inpatient setting.10, 11 Moreover, specific inpatient‐directed interventions can improve the delivery of diabetes care.1216
Unlike the quality of outpatient diabetes care, which has been extensively profiled,1723 little is actually known about inpatient management. However, earlier reports suggested that hyperglycemia is frequently overlooked by health care personnel.8, 24 To develop intervention and educational programs will require insight into how diabetes is being addressed in the hospital. Thus, we undertook a retrospective chart review of inpatients with a discharge diagnosis of diabetes or hyperglycemia in order to assess whether these conditions were being documented and whether glucose management was being addressed.
METHODS
Setting
Our regional referral, academic teaching hospital is a 200‐bed facility in metropolitan Phoenix, Arizona. All adult general medical and surgical specialties are represented at this hospital, including renal, liver, and pancreas transplantation, a level‐2 trauma center, and an inpatient rehabilitation unit. Inpatient care is provided either by postgraduate trainees (residents) or through a separate faculty service; physician assistants and nurse‐practitioners also deliver care. Residents may be supervised by either hospitalist or nonhospitalist attendings. An electronic medical record links outpatient and inpatient records, radiology studies, and laboratory results.
Patient Selection
The study was approved by the Mayo Clinic Institutional Review Board. Patients discharged from our facility during 2003 with a diagnosis code from the International Classification of Diseases, 9th revision, Clinical Modification (ICD‐9‐CM) either for diabetes (ICD‐9‐CM code 250.0) or for hyperglycemia (ICD‐9‐CM code 790.6) were identified in a search of the hospital's electronic records. Data fields retrieved included patient age at admission, ethnicity/race, length of stay, total charges, and type of hospital service with primary responsibility for the patient's care. Because of the large number of available records, we randomly selected 5% of the total for chart review.20, 25, 26
Data Collection
Using an approach similar to that used by others,8 we reviewed admission notes, daily progress notes, and discharge summaries in order to establish whether the practitioner had recorded diabetes or hyperglycemia in the patient's chart. Subjective, objective, assessment, and plan components of notes were reviewed, and credit was given for having addressed diabetes or hyperglycemia if there was any documentation. For patients admitted for elective inpatient procedures, a preoperative outpatient evaluation conducted within 30 days of the hospitalization was counted as the admission note.
Practitioners typically make therapeutic decisions about hyperglycemia management of inpatients on the basis of daily bedside glucose measurements. In our institution, bedside glucose monitoring is performed with an instrument that scans and records patient identification, followed by direct downloading to our laboratory database. We determined whether bedside glucose levels were ordered and if so, whether they were then recorded in the daily progress notes. We determined the frequency of blood glucose measurements. Notes were examined to determine whether an assessment of hyperglycemia was made (defined as any comment in the progress note that addressed the severity of hyperglycemia or the adequacy of glucose control), and written orders were reviewed to establish any therapeutic changes. On completion of the chart reviews and entry of abstracted data into an electronic file, a link was made to the laboratory database to obtain information on bedside glucose values. We report data on notes written by the inpatient team with the principal caretaking responsibility for the patient (the primary service).
Data Analysis
Four primary outcome measures were of particular interest. First, we analyzed the percentage of patients who had diabetes or hyperglycemia documented in admission, daily progress, or discharge notes. Second, we determined the proportion of patients for whom bedside glucose measurements were ordered. Third, we calculated the percentage of patients with a written assessment of glycemic control. Finally, we examined the proportion of patients who had a change in therapy for treatment of hyperglycemia. Change in therapy was defined as any increase or decrease in the doses of an oral agent or insulin that occurred between admission day orders and the active orders on the day of discharge.
We determined the proportion of patients who had at least one hypoglycemic (glucose <70, <60, <50, <40 mg/dL) or hyperglycemic (>200, >250, >300, >350, >400 mg/dL) measurement documented by bedside monitoring. We also calculated the frequency of hypoglycemic and hyperglycemic values as the number of events per person per 100 measurements; as suggested by others,27 this approach to assessing glycemic control allows adjustment for different numbers of measurements across individuals and captures information on multiple episodes of hypo‐ or hyperglycemia in a single patient. All available bedside glucose values were averaged to determine the overall level of glucose control for the hospitalization and were divided into 3 intervals using cut points based on tertiles; the differences in the proportion of patients who had changes made in diabetes therapy was determined across tertiles using the 2 test. We determined the odds of changing therapy in the second and third tertiles of average bedside glucose relative to the first tertile. Differences in any continuous variables were evaluated using nonparametric methods (Mann‐Whitney test). Cases from all primary services were analyzed in aggregate.
RESULTS
General Patient Characteristics
Of all the patient hospitalization records for 2003, 1812 had a discharge diagnosis of diabetes or hyperglycemia. A random sample of 5% of these 1812 records yielded 90 records for chart review. The mean patient age was 68 years; 53% were male, and 90% were white.. Average length of stay was 4.8 days (Table 1). No significant differences in age, length of stay, sex, race, or source of admission (all P > .1) were detected between the 90 cases undergoing chart review and those cases that were not selected. On admission day, 63% of the patients were placed on insulin therapy, 17% on combination treatment of oral agents and insulin, and 7% on oral agents; the remaining 13% did not receive pharmacotherapy to treat their hyperglycemia. Thus, 80% were placed on insulin on the day they were admitted. By the day of discharge, 61% of the patients were on insulin therapy, either alone or in combination with oral agents. Of those on insulin therapy during their hospital stay, 35% were on a scheduled program of long‐ plus short‐acting insulin, and 65% were only on a sliding scale program.
| Characteristic | Value* |
|---|---|
| |
| Mean age (years) | 68 |
| Mean length of stay (days) | 4.8 |
| Men | 53 |
| White | 90 |
| Diabetes therapy at admission | |
| Insulin only | 63 |
| Oral agents only | 7 |
| Combination oral agents and insulin | 17 |
| Diet | 13 |
| Source of admission | |
| Physician office or clinic | 46 |
| Emergency room | 46 |
| Transfer | 8 |
| Primary service | |
| General medical | 41 |
| Surgical | 31 |
| Other | 28 |
| Teaching service | 48 |
Most patients were admitted through either an outpatient clinic (46%) or the emergency department (46%), with the remainder coming as transfers from other facilities (Table 1). Most inpatients were cared for by a general medical team (general internal or family medicine, 41%), whereas 31% were managed by one of the surgical specialties, and 28% were under the care of other specialties (eg, cardiology, transplantation, rehabilitation). Once hospitalized, most patients (94%) stayed on the original admitting service throughout their stay; 48% of patients were on a service staffed by a postgraduate trainee (Table 1). Two patients required a brief stay in the intensive care unit, but otherwise the sample was made up of noncritically ill patients.
Fifteen patients had their hemoglobin A1c measured in the hospital, with mean A1c of 7.0% 1.4%, whereas 57 patients had a documented preadmission hemoglobin A1c (average time before admission 29 weeks); their average A1c was 6.9% 1.2% (not shown).
Documentation of Diabetes
Of the 90 patients whose records were reviewed, 81 had preexisting diabetes, 3 had a diagnosis of metabolic syndrome or abnormal glucose tolerance, and 6 had hyperglycemia that developed during the admission hospitalization. When admission notes of persons with known diabetes or abnormal glucose tolerance were examined (Fig. 1), diabetes was documented in 96%. In the daily progress notes of the primary service, 62% of patients had diabetes documented at least once during their hospitalization, whereas the records of 38% had no mention of diabetes. When only those patients with known diabetes or evidence of inpatient hyperglycemia were considered, documentation of the diabetic condition was made in 60% of discharge summaries, and the need for follow‐up was noted in just 20% (Fig. 1).
Fifty‐seven percent (n = 51) of the 90 patients whose records were sampled had had some type of consultant involved with their care, but only 13% had had an endocrinology consultation. For 27 patients (30% of all 90 cases), diabetes or hyperglycemia was documented in a consultant's note; thus, there was evidence that the issue of glucose management was being addressed by someone other than a member of the primary team and that someone was not necessarily an endocrinologist. When excluding those patients whose consultant addressed diabetes or hyperglycemia, only 53% had documentation of the problems recorded in the daily progress notes (data not shown).
Recording and Assessment of Glucose Values
Most of the 90 patients whose records were reviewed (86%; n = 79) had documentation in physician orders for bedside glucose monitoring during their hospital stay (Fig. 2), and 53% had bedside glucose levels recorded in at least one daily progress note, whereas documentation was absent in 47%. A written assessment of glucose control was found in the records of 52% of the hospitalized patients; 48% lacked any evaluation of the severity of their hyperglycemia (Fig. 2). Excluding data listed from consultants, bedside glucose data was recorded for 53% of patients, and an assessment of glycemic control was made for 41%.
Glycemic Control
The average daily number of bedside glucose measurements was 4, while the daily frequency of blood glucose tests was only 1; an average of 10 bedside readings were obtained per patient. The mean bedside glucose value (averaged over the length of stay) was 170 mg/dL. At the time of admission, 33% of patients had a bedside glucose value >200 mg/dL (Fig 3, top panel), and 27% had a value >200 mg/dL before discharge (Fig 3, middle panel). Based on the bedside glucose averaged over the length of stay, 29% of patients had persistent hyperglycemia (Fig. 3, bottom panel).
Hypoglycemia was rare. Only 11% of patients had at least one bedside measurement that was <70 mg/dL; 5% a measurement of <60 mg/dL, 4% a measurement of <50 mg/dL, and 1% a measurement of <40 mg/dL (Fig. 4). The frequency of values <70 mg/dL was 1.1 per person per 100 measurements; of values <60 mg/dL, 0.66; of values <50 mg/dL, 0.18; and of values <40 mg/dL, 0.08. In contrast, hyperglycemia was common: 71% of patients had at least one value >200 mg/dL; 43% at least one value >250 mg/dLl 24% at least one value >300 mg/dL; 20% at least one value >350 mg/dL; and 9% at least one value >400 mg/dL (Fig. 4). The frequency of hyperglycemic events was 28.2 per person per 100 measurements for values >200 mg/dL, 11.2 for values >250 mg/dL, 5.3 for values >300 mg/dL, 2.4 for values >350 mg/dL, and 1.1 for values >400 mg/dL.
Changes in Therapy
Overall, changes were made in the hyperglycemia therapy of only 34% of patients. Treatment was changed for 50% of patients who had at least one glucose reading >200 mg/dL, and 89% of patients who had at least one glucose reading <70 mg/dL. Figure 5 shows whether changes in treatment occurred by tertiles of average bedside glucose. The percentage of patients with a change in therapy increased with worse hyperglycemia, although 32% in the third tertile still had not had a change in treatment. The odds of those in the second tertile having a change in therapy (compared with those in the first tertile) were 1.9 (95% confidence interval 0.556.25, P = .32), but were 5.6 (95% confidence interval 1.6818.7, P = .005) for patients in the third tertile. The frequency of glucose values <70 mg/dL was 1.8 per person per 100 measurements for patients in the first tertile, 1.1 for patients in the second tertile, but only 0.29 per person per 100 measurements for patients in the third tertile. The average number of glucose measurements >200 mg/dL per person was 2.9 per 100 measurements for patients in the first tertile, 22.7 for patients in the second tertile, and 60.0 for patients in the third tertile (not shown).
DISCUSSION
Just as clinical trials in the outpatient setting have demonstrated the benefits of good glycemic control,2830 recent studies have also suggested that treatment of hyperglycemia during hospitalization can improve outcomes.10, 11 Consequently, there has been increased attention to the management of glucose in the hospital, with recognition of the need for inpatient‐specific standards for diabetes care.10, 11, 31 Optimization of management and of education about diabetes and hyperglycemia in the hospital requires better understanding of current care practices in order to determine where to direct interventions.
Nearly all the 90 patients whose records we reviewed had preexisting diabetes or a known potential glucose abnormality that was documented either at the time of, or just prior to, hospital admission. The observation that most patients had orders for bedside glucose monitoring also indicated that practitioners were aware of the diagnosis when the patient was admitted. Although clinicians seemed to be aware of the potential problem of glucoseand the majority of clinicians did some trackinga substantial number of hospitalizations (nearly 40%) had no documentation of diabetes or hyperglycemia after admission. If diabetes was not the principal reason for hospitalization, it is possible that the primary team did not focus on managing hyperglycemia. Nonetheless, the hospital encounter does represent an opportunity to address glucose management and perhaps improve care and outcomes, even if the patient was admitted for an unrelated condition.32 Because the average length of stay was almost 5 days, there should have been sufficient time to address diabetes in most patients.
Although most patients had the condition of their diabetes documented in their discharge notes, a substantial proportion of the discharge notes did not mention an outpatient plan to follow up on the diabetes or hyperglycemia. A recent study suggested that direct referral for outpatient diabetes services increased the chances of patient follow‐up.33 Educating practitioners about the need to emphasize to patients the importance of diabetes postdischarge care is a program that could be developed and implemented in the hospital setting.
Although bedside glucose monitoring was appropriately ordered in most instances, the actual recording of values and the assessment of glucose control were documented in the records of only about half the patients during their hospitalizations. Moreover, even among patients who had high bedside glucose levels, changes in therapy often did not occur. Clinician concern about inducing hypoglycemia in hospitalized patients has been cited as a factor limiting the intensification of treatment for diabetes.34 The frequency in our facility of documented low blood glucose values was small, although there may have been unrecognized episodes. However, missed events were probably unusual, given the daily average of 4 bedside glucose measurements per patient, ongoing nursing staff contact with patients, and a formal policy to document and treat hypoglycemia. We found that hyperglycemia was far more common than hypoglycemia and that there were likely many opportunities to control blood glucose more rigorously.
Practitioners appeared to be responding to hypoglycemia, as a large proportion of the patients with a glucose reading of <70 mg/dL had a change in therapy. However, the response to hyperglycemia was delayedthe odds of therapy being changed were significant only for patients whose glucose levels were in the third tertile. Despite evidence of hyperglycemia and the low frequency of hypoglycemia of those whose glucose levels were in the second and third tertiles, a substantial proportion of patients did not have their therapy changed. Combined with the observation that glucose data and diabetes were often not documented, our data suggest that there may be a problem of clinical inertia in the inpatient setting. Clinical inertia has been defined as not initiating or intensifying therapy when doing so is indicated.35, 36 Other reports have also documented clinical inertia in the outpatient environment.23, 3741 Overcoming clinical inertia, at least in regard to diabetes management, can improve glycemic control in patients.35 To improve the management of hyperglycemia in the hospital, educational interventions must be developed to teach health care practitioners effective strategies for glucose reduction. We did not quantify the changes in therapy (eg, how much insulin was changed or in what direction), only whether a change had been made. The observation that the proportion of cases on insulin at discharge was less than on admission day suggests that there may actually have been deintensification of therapy taking placesome of the cases in which therapy was changed, therefore, likely included instances of negative therapeutic momentum despite evidence of hyperglycemia. The control of inpatient hyperglycemia will likely require frequent changes in therapy, as it does in the outpatient setting, and detailed information about treatment strategies actually employed will be necessary to design educational programs.
One limitation of our analysis was that the study was retrospective, which did not allow assessment of the reasons underlying the behavior of the clinicians, such as why they did not document diabetes or change therapy. We selected a 5% sample for our study as per common methods.20, 25, 26 Thus, although the 90 patients making up the sample were randomly selected and were not different demographically from the larger population of patients admitted with diabetes, the number of cases we reviewed was small compared with the actual number of discharged patients with diabetes. Cases were diagnosed by diagnosis codes; therefore, it is likely that some diabetes cases were missed, and other patients with hyperglycemia may not have had the diagnosis even documented.8, 24 Our study design and sample size precluded a comparison of outcomes between cases with in which a consultant was involved with those in which a consultant was not involved or a comparison of cases according to type of consultant involved.1216 Finally, our study focused on noncritically ill patients; thus, our findings cannot be generalized to care provided in the intensive care unit.
There are no definitive guidelines on what method (ie, blood or bedside glucose) should be used to evaluate glycemic control in the hospital. The methods we used here can serve as means to benchmark and track improvement in glycemic control. The observations that most patients had bedside glucose monitoring ordered and that the frequency of these measurements was high compared with the frequency of actual blood glucose assessments support the idea that practitioners favored this method to evaluate the level of glycemic control in the hospital. In practice, it is bedside glucose evaluation that clinicians use to make decisions about day‐to‐day treatment of hyperglycemia. In our facility, the method for bedside glucose monitoring is standardized and is part of a quality assurance program. Moreover, the high average frequency of bedside blood glucose determination increased the chance of detecting hyper‐ and hypoglycemic events.
Current guidelines provide suggestions about target pre‐ and postprandial glucose levels for noncritically ill patients.11 However, these targets are not universally recognized.42 For instance, the Institutes for Healthcare Improvement's Prevent Surgical Site Infections initiative defines a glucose level of <200 mg/dL as its target perioperative glucose control level.43 In practice, it can be difficult to assess glucose control in terms of pre‐ and postprandial categories. Although bedside glucose monitoring in our facility is typically ordered before meals and at bedtime, in many cases prolonged periods of patient fasting, disrupted meal schedules, mismatching insulin with meals, and use of continuous parental and enteral nutritional support all make it difficult to assess pre‐ and postprandial glycemic control retrospectively. Hence, we used as our measures the value of the bedside glucose averaged over the length of the hospital stay and the number of hyper‐ and hypoglycemic events.
In general, our study was hampered by a lack of hospital‐specific process measures to evaluate the quality of inpatient diabetes care. Process measures such as the frequency of hemoglobin A1c monitoring or performance of ophthalmologic examinations,1723 which are commonly used to assess quality of diabetes care in the outpatient arena, may not be optimal variables for evaluating care in the hospital. New methods to guide efforts to improve the quality of inpatient management of diabetes and hyperglycemia are needed.
Despite these limitations, our analysis was helpful in providing direction about how to enhance the care of hospitalized patients with hyperglycemia or known diabetes. Constructing institution‐specific management guidelines for the care of inpatient diabetes and hyperglycemia would provide a yardstick against which to measure the care provided by both the hospital and the individual clinician. Educational programs can be developed to increase awareness among practitioners of the importance of inpatient glucose control and of the need to improve ongoing documentation of the problem. Exploring practitioner barriers to treatment of inpatient hyperglycemia should be an essential component of this educational process. Finally, consensus strategies on when to initiate and change therapy should be designed so that hyperglycemia in the hospital can be managed more effectively. All these areas must be addressed to assure delivery of the highest‐quality inpatient care to patients with diabetes.
- ,,,,.Diabetes‐related hospitalization and hospital utilization. In:Diabetes in America: National Diabetes Data Group.2nd ed.Bethesda (MD):National Institutes of Health, National Institute of Diabetes and Digestive and Kidney Diseases;1995:553–563.
- .Hospitalization in the United States, 1997: HCUP fact book no. 1: diagnosis, charges, length of stay, insurance coverage, discharge status, inhospital deaths.Rockville (MD):Agency for Healthcare Research and Quality;2000.
- Centers for Disease Control and Prevention. Hospitalization for diabetes as first‐listed diagnosis. Available from: http://www.cdc.gov/diabetes/statistics/dmfirst/table1.htm. Accessed: June 2,2005.
- Centers for Disease Control and Prevention. Hospitalizations for diabetes as any‐listed diagnosis. Available from: http://www.cdc.gov/diabetes/statistics/dmany/fig1.htm. Accessed: June 2,2005.
- ,,,.Multiple hospitalizations for patients with diabetes.Diabetes Care.2003;26:1421–1426.
- ,,,.Excess costs of medical care for patients with diabetes in a managed care population.Diabetes Care.1997;20:1396–1402.
- ,,,American Diabetes Association.Economic costs of diabetes in the US in 2002.Diabetes Care.2003;26:917–932.
- ,,,,.Unrecognized diabetes among hospitalized patients.Diabetes Care.1998;21:246–249.
- ,,,,,.Hyperglycemia: an independent marker of in‐hospital mortality in patients with undiagnosed diabetes.J Clin Endocrinol Metab.2002;87:978–982.
- ,,,,,,American Diabetes Association Diabetes in Hospitals Writing Committee, et al.Management of diabetes and hyperglycemia in hospitals.Diabetes Care.2004;27:553–591. Erratum in: Diabetes Care. 2004;27:856 and Diabetes Care. 2004;27:1255.
- ,,,,,,American College of Endocrinology Task Force on Inpatient Diabetes Metabolic Control, et al.American College of Endocrinology position statement on inpatient diabetes and metabolic control.Endocr Pract.2004;10:77–82.
- ,,,.Effect of physician specialty on outcomes in diabetic ketoacidosis.Diabetes Care.1999;22:1790–1795.
- ,,,.Impact of endocrine and diabetes team consultation on hospital length of stay for patients with diabetes.Am J Med.1995;99:22–28.
- ,,.Effects of an intervention by a diabetes team in hospitalized patients with diabetes.Diabetes Care.1997;20:1553–1555.
- ,.Nursing case management: an innovative model of care for hospitalized patients with diabetes.Diabetes Educ.1993;19:517–521.
- ,,,,.Evaluation of a hospital diabetes specialist nursing service: a randomized controlled trial.Diabet Med.2001;18:301–307.
- ,,,,,.Variation in office‐based quality. A claims‐based profile of care provided to Medicare patients with diabetes.JAMA.1995;273:1503–1508.
- ,,,,,, et al.Outpatient management of diabetes mellitus in five Arizona Medicare managed care plans.Am J Med Qual.1996;11:87–93.
- ,,,.Quality of outpatient care provided to diabetic patients: a health maintenance organization experience.Diabetes Care.1996;19:601–6.
- United States General Accounting Office: report to the Chairman, Subcommittee on Health and Environment, Committee on Commerce, House of Representatives.Medicare: most beneficiaries with diabetes do not receive recommended monitoring services. GAO/HEHS‐97–48.1997.
- ,,,,.Care of patients with type II diabetes: a study of family physicians' compliance with clinical practice guidelines.J Fam Pract.1997;44:374–381.
- ,,,,,.A diabetes report card for the United States: quality of care in the 1990s.Ann Intern Med.2002;136:565–574.
- ,,,University HealthSystem Consortium (UHC) Diabetes Benchmarking Project Team.Quality of diabetes care in U.S. academic medical centers: low rates of medical regimen change.Diabetes Care.2005;28:337–442.
- ,,,.An audit of the management and outcome of hospital inpatients with diabetes: resource planning implications for the diabetes care team.Diabet Med.1992;9:753–755.
- .Improving outcomes in public health practice: strategy and methods.Gaithersburg (MD):Aspen Publishers;1997:175–213.
- ,,,,,.Outpatient diabetes management of Medicare beneficiaries in four Mississippi fee‐for‐service primary care clinics.J Miss State Med Assoc.1999;40:8–13.
- ,,.Glycemic control and sliding scale insulin use in medical inpatients with diabetes mellitus.Arch Intern Med.1997;157:545–552.
- The Diabetes Control and Complications Trial Research Group.The effect of intensive treatment of diabetes on the development and progression of long‐term complications in insulin‐dependent diabetes mellitus.N Engl J Med.1993;329:977–986.
- UK Prospective Diabetes Study (UKPDS) Group.Intensive blood‐glucose control with sulphonylureas or insulin compared with conventional treatment and risk of complications in patients with type 2 diabetes (UKPDS 33).Lancet.1998;352:837–53. Erratum in: Lancet. 1999;354:602.
- UK Prospective Diabetes Study (UKPDS) Group.Effect of intensive blood‐glucose control with metformin on complications in overweight patients with type 2 diabetes (UKPDS 34).Lancet.1998;352:854–65. Erratum in: Lancet. 1998;352:1557.
- ,,.Current standards of care for inpatient glycemic management and metabolic control: is it time for definite standards and targets?Endocr Pract.2004;10(Suppl 2):10–12.
- ,.Windows of opportunity to improve diabetes care when patients with diabetes are hospitalized for other conditions.Diabetes Care.2001;24:1371–1376.
- ,,, et al.Inpatient to outpatient transfer of care in urban patients with diabetes: patterns and determinants of immediate postdischarge follow‐up.Arch Intern Med.2004;164:447–453.
- ,,, et al.Hospital hypoglycemia: not only treatment but also prevention.Endocr Pract.2004;10(Suppl 2):89–99.
- ,,, et al.Diabetes in urban African‐Americans. XVI. Overcoming clinical inertia improves glycemic control in patients with type 2 diabetes.Diabetes Care.1999;22:1494–1500.
- ,,, et al.Clinical inertia.Ann Intern Med.2001;135:825–834.
- .Management of older hypertensive patients: is there a difference in approach?J Clin Hypertens (Greenwich).2003;5(Suppl 4):11–16.
- ,,, et al.Narrowing the gap in hypertension: effectiveness of a complex antihypertensive program in the elderly.Dis Manag.2004;7:235–243.
- ,,, et al.Clinical inertia in the management of Type 2 diabetes metabolic risk factors.Diabet Med.2004;21:150–155.
- ,.Clinical inertia: errors of omission in drug therapy.Am J Health Syst Pharm.2004;61:401–404.
- .Overcome clinical inertia to control systolic blood pressure.Arch Intern Med.2003;163:2677–2678.
- ,.Counterpoint: inpatient glucose management: a premature call to arms?Diabetes Care.2005;28:976–979.
- Institute for Healthcare Improvement. Getting started kit: prevent surgical site infections. Available from: www.ihi.org/NR/rdonlyres/00EBAF1F‐A29F‐4822‐ABCE‐829573255AB8/0/SSIHowtoGuideFINAL.pdf. Accessed June 2,2005.
Copyright © 2006 Society of Hospital Medicine
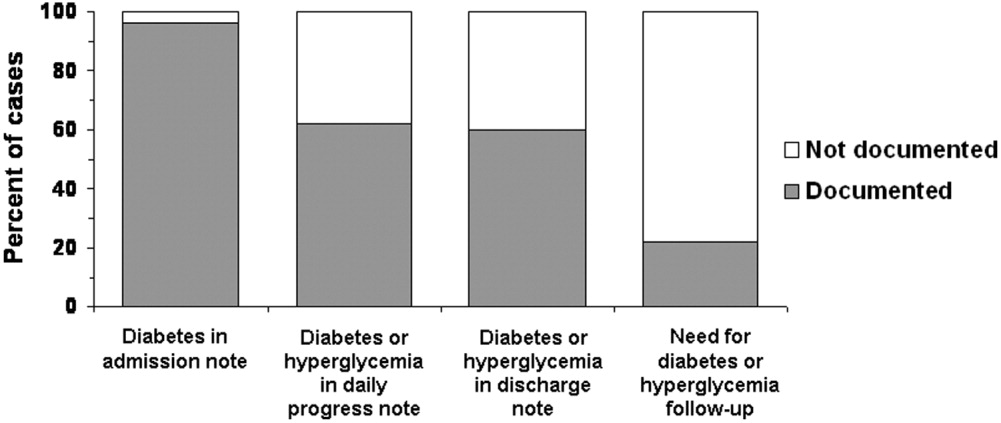
Editorial
Insanity: doing the same thing over and over again and expecting different results.Albert Einstein
Diabetes is one of the most common diagnoses in hospitalized patients.1 A third of all persons admitted to urban general hospitals have glucose levels qualifying them for the diagnosis of diabetes, and a third of these hyperglycemic patients have not previously been diagnosed with diabetes.2 The impact of hyperglycemia on the mortality rate of hospitalized patients has been increasingly appreciated. Extensive evidence from observational studies indicates that hyperglycemia in patients with or without a history of diabetes is a marker of a poor clinical outcome.38 In addition, the results of prospective randomized trials in patients with critical illness or those undergoing coronary bypass surgery suggest that aggressive glycemic control improves clinical outcomes including reductions in: a) short‐ and long‐term mortality, b) multiorgan failure and systemic infection, and c) length of hospitalization.7, 911
The importance of glycemic control is not limited to patients in critical care areas but may also apply to patients admitted to general surgical and medical wards. The development of hyperglycemia in such patients with or without a history of diabetes has been associated with prolonged hospital stay, infection, disability after hospital discharge, and death.12, 13 In general‐surgical patients, serum glucose > 220 mg/dL on postoperative day 1 has been shown to be a sensitive, albeit nonspecific, predictor of the development of serious postoperative hospital‐acquired infection.14 A retrospective review of 1886 admissions to a community hospital in Atlanta, Georgia, found an 18‐fold increase in mortality in hyperglycemic patients without a history of diabetes and a 2.5‐fold increase in mortality in patients with known diabetes compared with controls.2 A meta‐analysis of 26 studies identified an association of admission glucose > 110 mg/dL with the increased mortality of patients hospitalized for acute stroke.15 More recently, hyperglycemia on admission was also shown to be independently associated with adverse outcomes in patients with community acquired pneumonia.16, 17
In view of the increasing evidence supporting better glycemic control in the hospital, the American Association of Clinical Endocrinologists (AACE) in late 2003 convened a consensus conference on the inpatient with diabetes, cosponsored or supported by other prominent professional organizations, including the Society of Hospital Medicine (SHM). An expert panel agreed on and published glycemic targets and recommendations for inpatient management of hyperglycemia.18 The American Diabetes Association (ADA) subsequently published an excellent technical review evaluating the evidence and outlining treatment, monitoring, and educational strategies13 for the hospitalized patient, and these recommendations were largely incorporated into the 2005 ADA Clinical Practice Guidelines for Hospitalized Patients.19 The recommended glycemic targets for hospitalized patients in the intensive care unit are between 80 and 110 mg/dL. In noncritical care settings a preprandial glucose of 90130 mg/dL (midpoint 110 mg/dL) and a postprandial or random glucose of less than 180 mg/dL are the recommended glycemic targets. Physiologic and safe insulin regimen strategies for virtually all patient situations were succinctly presented. Although there have been modest (and occasionally dramatic) improvements in glycemic control in several institutions, the reviews and guidelines have not yet resulted in widespread change in clinical practice on the inpatient wards.
Two retrospective studies from prestigious medical institutions reported in this issue of the Journal of Hospital Medicine dramatically illustrate that glycemic control and insulin‐ordering practices in general medicine services continue to be deficient and underscore the contribution of physician inertia in the management of hyperglycemia in noncritically ill patients.20, 21 From their findings and experiences in our institutions, you should expect the following at your institution unless you have embarked on an organized program to improve noncritical care inpatient glycemic control.
-
Around one third of your patients with hyperglycemia have a mean glucose of more than 200 mg/dL during their hospital stay.
-
Despite these out‐of‐control values, 60% of your inpatients will remain on a static regimen of sliding‐scale insulin over the duration of their stay. Unfortunately, this degree of hyperglycemia is not protective for hypoglycemic episodes.
-
Around 10% of your monitored ward inpatients will have at least one hypoglycemic episode during their stay. Many of these episodes will be precipitated by poor coordination of nutrition and insulin administration and nonsensical insulin regimens that lead to insulin stacking.
-
Discharge summaries and plans will include mention and follow‐up of hyperglycemia only a minority of the time.
-
Your nursing and medical staffs are unevenly educated about the proper use of insulin, even though insulin errors are very common, and insulin is one of the top 3 drugs involved in adverse drug events in your institution.
-
Transitions in care will lead to an inconsistent approach to glycemic control, leaving some of your patients confused and others just plain angry.
The ubiquitous use of the insulin sliding scale as the single routine response for controlling hyperglycemia in inpatients has been discredited for a long time.2224 Strong terms have been used the condemnation of this method: mindless medicine, paralysis of thought, and action without benefit, for example.25, 26 Yet this remains the most popular default regimen in most institutions across the country. Clinical inertia is defined as not initiating or intensifying therapy when doing so is indicated,27, 28 and that term certainly applies to glycemic control practices and the continued heavy use of sliding‐scale insulin across the nation.
Why is clinical inertia so strong in this area? Why have well‐done practice guidelines and reviews not eradicated the use of sliding‐scale insulin? First, hyperglycemia is rarely the focus of care during the hospital stay, as the overwhelming majority of hospitalizations of patients with hyperglycemia occur for comorbid conditions.2, 29 Second, fear of hypoglycemia constitutes a major barrier to efforts to improve glycemic control in hospitalized patients, especially in those with poor caloric intake.13, 30 Third, practitioners initiate sliding‐scale insulin regimens, even though this has been a thoroughly discredited approach, simply because it is the easiest thing to do in their current practice environment.31
How do we break this inertia and redesign our practice environment in such a way that using a more physiologic and sensible insulin regimen is the easiest thing to do? It starts with local physician leadership. On noncritical care wards, hospitalists and endocrinologists are the natural candidates to own the issue of inpatient diabetes care. These physician leaders need to garner appropriate institutional support, form a multidisciplinary steering committee or team, and formulate interventions.
Implementing a standardized subcutaneous insulin order set promoting the use of scheduled insulin therapy is a key intervention in the inpatient management of diabetes. These order sets should encourage basal replacement insulin therapy (ie, NPH, glargine, detemir) and scheduled nutritional/prandial short‐/rapid‐acting insulin (ie, regular, aspart, lispro, glulisine). The order set should also state the glycemic target, eliminate improper abbreviations and notations, incorporate a hypoglycemia protocol, and provide a range of default correction insulin dosage scales appropriate for varied levels of insulin sensitivity. Examples of such order sets are widely available.13, 32 This simple intervention can result in a tripling of insulin regimens including scheduled basal insulin, substantial subsequent improvement in glycemic control on the hospital floor, and significant reduction in hypoglycemic event rates.
The standardized order set can be much more effective when it is complemented by institution‐specific algorithms, protocols, and policies that support their effective use. These tools must not merely exist; they must be widely disseminated and used and, if possible, embedded in the order set. They should outline the calculation of insulin dosages, define recommended insulin regimens for patients with different forms of nutritional intake, guide transitions from insulin infusion to subcutaneous regimens, and enhance discharge planning and education.
The SHM, AACE, ADA, and other organizations are partnering to create a compendium of tested tools and strategies to assist hospitalists and their hospitals in these and other interventions and to assist them in devising reliable and practical metrics to gauge the impact of their efforts. These tools and a guidebook to walk teams through the improvement process step by step should be available on the SHM (
Look around and take stock. Does your hospital have standardized subcutaneous insulin order sets, algorithms and protocols supporting the order set, a multidisciplinary team tasked with improving insulin safety and glycemic control, and metrics to gauge whether your efforts are making a difference? Expecting better results without these essential elements is not only foolhardy but fits Einstein's definition of insanity: doing the same thing over and over again and expecting different results. Let's stop this sliding‐scale insulin insanity now.
- ,,, et al.Diabetes trends in the U.S.: 1990–1998.Diabetes Care.2000;23:1278–1283.
- ,,,,,.Hyperglycemia: an independent marker of in‐hospital mortality in patients with undiagnosed diabetes.J Clin Endocrinol Metab.2002;87:978–982.
- ,,,Outcomes and perioperative hyperglycemia in patients with or without diabetes mellitus undergoing coronary artery bypass grafting.Ann Thorac Surg.2003;75:1392–1399.
- ,,,.Glucose control and mortality in critically ill patients.JAMA.2003;290:2041–2047.
- ,,.Admission plasma glucose. Independent risk factor for long‐term prognosis after myocardial infarction even in nondiabetic patients.Diabetes Care.1999;22:1827–1831.
- ,.ICU care for patients with diabetes.Curr Opin Endocrinol.2004;11:75–81.
- ,,, et al.Intensive insulin therapy in the critically ill patients.N Engl J Med.2001;345:1359–1367.
- ,,, et al.Intensive insulin therapy in the medical ICU.N Engl J Med.2006;354:449–461.
- .Association between hyperglycemia and increased hospital mortality in a heterogeneous population of critically ill patients.Mayo Clin Proc.2003;78:1471–1478.
- ,,, et al.Randomized trial of insulin‐glucose infusion followed by subcutaneous insulin treatment in diabetic patients with acute myocardial infarction (DIGAMI study): effects on mortality at 1 year.J Am Coll Cardiol.1995;26(1):57–65.
- ,,, et al.Continuous insulin infusion reduces mortality in patients with diabetes undergoing coronary artery bypass grafting.J Thorac Cardiovasc Surg.2003;125:1007–1021.
- ,,,.Hyperglycemia is associated with adverse outcomes in patients receiving total parenteral nutrition.Diabetes Care.2005;28:2367–2371.
- ,,, et al.Management of diabetes and hyperglycemia in hospitals.Diabetes Care.2004;27:553–597.
- ,,, et al.Early postoperative glucose control predicts nosocomial infection rate in diabetic patients.JPEN J Parenter Enteral Nutr.1998;22(2):77–81.
- ,,,,.Stress hyperglycemia and prognosis of stroke in nondiabetic and diabetic patients: a systematic overview.Stroke.2001;32:2426–2432.
- ,,,,.Etiology and outcome of community‐acquired pneumonia in patients with diabetes mellitus.Chest.2005;128:3233–3239.
- ,,,,,.The relation between hyperglycemia and outcomes in 2,471 patients admitted to the hospital with community‐acquired pneumonia.Diabetes Care.2005;28:810–815.
- ,,, et al.American College of Endocrinology position statement on inpatient diabetes and metabolic control.Endocr Pract.2004;10(Suppl 2):4–9.
- Standards of medical care in diabetes—2006.Diabetes Care.2006;29(Suppl 1):S4–S42.
- ,,.Glycemic control and sliding scale insulin use in medical inpatients with diabetes mellitus.Arch Intern Med.1997;157:545–552.
- ,,,,.Inpatient management of diabetes and hyperglycemia among general medicine patients at a large teaching hospital.J Hosp Med.2006;1:145–150.
- ,,, et al.Diabetes care in the hospital: Is there clinical inertia?J Hosp Med.2006;1:151–160.
- ,.Are sliding‐scale insulin regimens a recipe for diabetic instability?Lancet.1997;349:1555.
- ,,,.Eliminating inpatient sliding‐scale insulin: a reeducation project with medical house staff.Diabetes Care.2005;28:1008–1011.
- ,,,,.Efficacy of sliding‐scale insulin therapy: a comparison with prospective regimens.Fam Pract Res J.1994;14:313–322.
- .Action without benefit. The sliding scale of insulin use.Arch Intern Med.1997;157:489.
- ,,, et al.Clinical inertia.Ann Intern Med.2001;135:825–834.
- ,,,,.Clinical inertia in response to inadequate glycemic control: do specialists differ from primary care physicians?Diabetes Care.2005;28:600–606.
- ,,,,.Unrecognized diabetes among hospitalized patients.Diabetes Care.1998;21:246–249.
- ,,,.Drug‐induced hypoglycemic coma in 102 diabetic patients.Arch Intern Med.1999;159:281–284.
- ,.Hospital management of diabetes.Endocrinol Metab Clin North Am.2000;29:745–770.
- ,,, et al.Hospital hypoglycemia: not only treatment but also prevention.Endocr Pract.2004;10(Suppl 2):89–99.
Insanity: doing the same thing over and over again and expecting different results.Albert Einstein
Diabetes is one of the most common diagnoses in hospitalized patients.1 A third of all persons admitted to urban general hospitals have glucose levels qualifying them for the diagnosis of diabetes, and a third of these hyperglycemic patients have not previously been diagnosed with diabetes.2 The impact of hyperglycemia on the mortality rate of hospitalized patients has been increasingly appreciated. Extensive evidence from observational studies indicates that hyperglycemia in patients with or without a history of diabetes is a marker of a poor clinical outcome.38 In addition, the results of prospective randomized trials in patients with critical illness or those undergoing coronary bypass surgery suggest that aggressive glycemic control improves clinical outcomes including reductions in: a) short‐ and long‐term mortality, b) multiorgan failure and systemic infection, and c) length of hospitalization.7, 911
The importance of glycemic control is not limited to patients in critical care areas but may also apply to patients admitted to general surgical and medical wards. The development of hyperglycemia in such patients with or without a history of diabetes has been associated with prolonged hospital stay, infection, disability after hospital discharge, and death.12, 13 In general‐surgical patients, serum glucose > 220 mg/dL on postoperative day 1 has been shown to be a sensitive, albeit nonspecific, predictor of the development of serious postoperative hospital‐acquired infection.14 A retrospective review of 1886 admissions to a community hospital in Atlanta, Georgia, found an 18‐fold increase in mortality in hyperglycemic patients without a history of diabetes and a 2.5‐fold increase in mortality in patients with known diabetes compared with controls.2 A meta‐analysis of 26 studies identified an association of admission glucose > 110 mg/dL with the increased mortality of patients hospitalized for acute stroke.15 More recently, hyperglycemia on admission was also shown to be independently associated with adverse outcomes in patients with community acquired pneumonia.16, 17
In view of the increasing evidence supporting better glycemic control in the hospital, the American Association of Clinical Endocrinologists (AACE) in late 2003 convened a consensus conference on the inpatient with diabetes, cosponsored or supported by other prominent professional organizations, including the Society of Hospital Medicine (SHM). An expert panel agreed on and published glycemic targets and recommendations for inpatient management of hyperglycemia.18 The American Diabetes Association (ADA) subsequently published an excellent technical review evaluating the evidence and outlining treatment, monitoring, and educational strategies13 for the hospitalized patient, and these recommendations were largely incorporated into the 2005 ADA Clinical Practice Guidelines for Hospitalized Patients.19 The recommended glycemic targets for hospitalized patients in the intensive care unit are between 80 and 110 mg/dL. In noncritical care settings a preprandial glucose of 90130 mg/dL (midpoint 110 mg/dL) and a postprandial or random glucose of less than 180 mg/dL are the recommended glycemic targets. Physiologic and safe insulin regimen strategies for virtually all patient situations were succinctly presented. Although there have been modest (and occasionally dramatic) improvements in glycemic control in several institutions, the reviews and guidelines have not yet resulted in widespread change in clinical practice on the inpatient wards.
Two retrospective studies from prestigious medical institutions reported in this issue of the Journal of Hospital Medicine dramatically illustrate that glycemic control and insulin‐ordering practices in general medicine services continue to be deficient and underscore the contribution of physician inertia in the management of hyperglycemia in noncritically ill patients.20, 21 From their findings and experiences in our institutions, you should expect the following at your institution unless you have embarked on an organized program to improve noncritical care inpatient glycemic control.
-
Around one third of your patients with hyperglycemia have a mean glucose of more than 200 mg/dL during their hospital stay.
-
Despite these out‐of‐control values, 60% of your inpatients will remain on a static regimen of sliding‐scale insulin over the duration of their stay. Unfortunately, this degree of hyperglycemia is not protective for hypoglycemic episodes.
-
Around 10% of your monitored ward inpatients will have at least one hypoglycemic episode during their stay. Many of these episodes will be precipitated by poor coordination of nutrition and insulin administration and nonsensical insulin regimens that lead to insulin stacking.
-
Discharge summaries and plans will include mention and follow‐up of hyperglycemia only a minority of the time.
-
Your nursing and medical staffs are unevenly educated about the proper use of insulin, even though insulin errors are very common, and insulin is one of the top 3 drugs involved in adverse drug events in your institution.
-
Transitions in care will lead to an inconsistent approach to glycemic control, leaving some of your patients confused and others just plain angry.
The ubiquitous use of the insulin sliding scale as the single routine response for controlling hyperglycemia in inpatients has been discredited for a long time.2224 Strong terms have been used the condemnation of this method: mindless medicine, paralysis of thought, and action without benefit, for example.25, 26 Yet this remains the most popular default regimen in most institutions across the country. Clinical inertia is defined as not initiating or intensifying therapy when doing so is indicated,27, 28 and that term certainly applies to glycemic control practices and the continued heavy use of sliding‐scale insulin across the nation.
Why is clinical inertia so strong in this area? Why have well‐done practice guidelines and reviews not eradicated the use of sliding‐scale insulin? First, hyperglycemia is rarely the focus of care during the hospital stay, as the overwhelming majority of hospitalizations of patients with hyperglycemia occur for comorbid conditions.2, 29 Second, fear of hypoglycemia constitutes a major barrier to efforts to improve glycemic control in hospitalized patients, especially in those with poor caloric intake.13, 30 Third, practitioners initiate sliding‐scale insulin regimens, even though this has been a thoroughly discredited approach, simply because it is the easiest thing to do in their current practice environment.31
How do we break this inertia and redesign our practice environment in such a way that using a more physiologic and sensible insulin regimen is the easiest thing to do? It starts with local physician leadership. On noncritical care wards, hospitalists and endocrinologists are the natural candidates to own the issue of inpatient diabetes care. These physician leaders need to garner appropriate institutional support, form a multidisciplinary steering committee or team, and formulate interventions.
Implementing a standardized subcutaneous insulin order set promoting the use of scheduled insulin therapy is a key intervention in the inpatient management of diabetes. These order sets should encourage basal replacement insulin therapy (ie, NPH, glargine, detemir) and scheduled nutritional/prandial short‐/rapid‐acting insulin (ie, regular, aspart, lispro, glulisine). The order set should also state the glycemic target, eliminate improper abbreviations and notations, incorporate a hypoglycemia protocol, and provide a range of default correction insulin dosage scales appropriate for varied levels of insulin sensitivity. Examples of such order sets are widely available.13, 32 This simple intervention can result in a tripling of insulin regimens including scheduled basal insulin, substantial subsequent improvement in glycemic control on the hospital floor, and significant reduction in hypoglycemic event rates.
The standardized order set can be much more effective when it is complemented by institution‐specific algorithms, protocols, and policies that support their effective use. These tools must not merely exist; they must be widely disseminated and used and, if possible, embedded in the order set. They should outline the calculation of insulin dosages, define recommended insulin regimens for patients with different forms of nutritional intake, guide transitions from insulin infusion to subcutaneous regimens, and enhance discharge planning and education.
The SHM, AACE, ADA, and other organizations are partnering to create a compendium of tested tools and strategies to assist hospitalists and their hospitals in these and other interventions and to assist them in devising reliable and practical metrics to gauge the impact of their efforts. These tools and a guidebook to walk teams through the improvement process step by step should be available on the SHM (
Look around and take stock. Does your hospital have standardized subcutaneous insulin order sets, algorithms and protocols supporting the order set, a multidisciplinary team tasked with improving insulin safety and glycemic control, and metrics to gauge whether your efforts are making a difference? Expecting better results without these essential elements is not only foolhardy but fits Einstein's definition of insanity: doing the same thing over and over again and expecting different results. Let's stop this sliding‐scale insulin insanity now.
- ,,, et al.Diabetes trends in the U.S.: 1990–1998.Diabetes Care.2000;23:1278–1283.
- ,,,,,.Hyperglycemia: an independent marker of in‐hospital mortality in patients with undiagnosed diabetes.J Clin Endocrinol Metab.2002;87:978–982.
- ,,,Outcomes and perioperative hyperglycemia in patients with or without diabetes mellitus undergoing coronary artery bypass grafting.Ann Thorac Surg.2003;75:1392–1399.
- ,,,.Glucose control and mortality in critically ill patients.JAMA.2003;290:2041–2047.
- ,,.Admission plasma glucose. Independent risk factor for long‐term prognosis after myocardial infarction even in nondiabetic patients.Diabetes Care.1999;22:1827–1831.
- ,.ICU care for patients with diabetes.Curr Opin Endocrinol.2004;11:75–81.
- ,,, et al.Intensive insulin therapy in the critically ill patients.N Engl J Med.2001;345:1359–1367.
- ,,, et al.Intensive insulin therapy in the medical ICU.N Engl J Med.2006;354:449–461.
- .Association between hyperglycemia and increased hospital mortality in a heterogeneous population of critically ill patients.Mayo Clin Proc.2003;78:1471–1478.
- ,,, et al.Randomized trial of insulin‐glucose infusion followed by subcutaneous insulin treatment in diabetic patients with acute myocardial infarction (DIGAMI study): effects on mortality at 1 year.J Am Coll Cardiol.1995;26(1):57–65.
- ,,, et al.Continuous insulin infusion reduces mortality in patients with diabetes undergoing coronary artery bypass grafting.J Thorac Cardiovasc Surg.2003;125:1007–1021.
- ,,,.Hyperglycemia is associated with adverse outcomes in patients receiving total parenteral nutrition.Diabetes Care.2005;28:2367–2371.
- ,,, et al.Management of diabetes and hyperglycemia in hospitals.Diabetes Care.2004;27:553–597.
- ,,, et al.Early postoperative glucose control predicts nosocomial infection rate in diabetic patients.JPEN J Parenter Enteral Nutr.1998;22(2):77–81.
- ,,,,.Stress hyperglycemia and prognosis of stroke in nondiabetic and diabetic patients: a systematic overview.Stroke.2001;32:2426–2432.
- ,,,,.Etiology and outcome of community‐acquired pneumonia in patients with diabetes mellitus.Chest.2005;128:3233–3239.
- ,,,,,.The relation between hyperglycemia and outcomes in 2,471 patients admitted to the hospital with community‐acquired pneumonia.Diabetes Care.2005;28:810–815.
- ,,, et al.American College of Endocrinology position statement on inpatient diabetes and metabolic control.Endocr Pract.2004;10(Suppl 2):4–9.
- Standards of medical care in diabetes—2006.Diabetes Care.2006;29(Suppl 1):S4–S42.
- ,,.Glycemic control and sliding scale insulin use in medical inpatients with diabetes mellitus.Arch Intern Med.1997;157:545–552.
- ,,,,.Inpatient management of diabetes and hyperglycemia among general medicine patients at a large teaching hospital.J Hosp Med.2006;1:145–150.
- ,,, et al.Diabetes care in the hospital: Is there clinical inertia?J Hosp Med.2006;1:151–160.
- ,.Are sliding‐scale insulin regimens a recipe for diabetic instability?Lancet.1997;349:1555.
- ,,,.Eliminating inpatient sliding‐scale insulin: a reeducation project with medical house staff.Diabetes Care.2005;28:1008–1011.
- ,,,,.Efficacy of sliding‐scale insulin therapy: a comparison with prospective regimens.Fam Pract Res J.1994;14:313–322.
- .Action without benefit. The sliding scale of insulin use.Arch Intern Med.1997;157:489.
- ,,, et al.Clinical inertia.Ann Intern Med.2001;135:825–834.
- ,,,,.Clinical inertia in response to inadequate glycemic control: do specialists differ from primary care physicians?Diabetes Care.2005;28:600–606.
- ,,,,.Unrecognized diabetes among hospitalized patients.Diabetes Care.1998;21:246–249.
- ,,,.Drug‐induced hypoglycemic coma in 102 diabetic patients.Arch Intern Med.1999;159:281–284.
- ,.Hospital management of diabetes.Endocrinol Metab Clin North Am.2000;29:745–770.
- ,,, et al.Hospital hypoglycemia: not only treatment but also prevention.Endocr Pract.2004;10(Suppl 2):89–99.
Cost Utility of Enoxaparin for DVT Prophylaxis
Several groups of medical patients at risk for venous thromboembolism (VTE) while hospitalized have been identified. These include patients with certain acute medical illnesses such as acute myocardial infarction, stroke, or chronic obstructive pulmonary disease and those with acute medical illness combined with additional risk factors including advanced age, cancer, obesity, or prior VTE.13
Heparin‐induced thrombocytopenia (HIT) and heparin‐induced thrombocytopenia with thrombosis (HITT), a spectrum of disease also known as type 2 HIT, are potentially devastating hematologic consequences of VTE prophylaxis that result from heparin binding to platelet factor IV, leading to IgG antibodymediated platelet activation.46 These complications manifest along a spectrum from thrombocytopenia alone (HIT) to more severe sequelae that include death, amputation, venous and arterial thrombosis. Unfractionated heparin (UFH) has traditionally been used for VTE prophylaxis in these populations at risk. More recently, evidence has indicated that enoxaparin, a low‐molecular‐weight heparin, is at least as effective for VTE prophylaxis1, 7 and carries a significantly lower risk for the development of the complications of HIT and HITT. Despite the superior side‐effect profile of enoxaparin, many institutions encourage the use of heparin for DVT prophylaxis because of its lower price. However, when the costs of treating these complications are considered, using unfractionated heparin may actually be more costly.
Two studies of the cost effectiveness of heparin compared with enoxaparin when used for VTE prophylaxis in medical inpatients have recently been published.8, 9 However, one of these studies focused only on pharmacy‐related costs and did not consider patient‐related outcomes, and the other was published by a for‐profit research company. Studies of treatment with enoxaparin versus UFH in other medical settings, including non‐Q‐wave myocardial infarction10 and treatment of acute deep‐vein thrombosis,11 suggest that enoxaparin is more cost effective. Studies of prophylaxis of surgical patients have been contradictory. Data suggest that in orthopedic patients the use of enoxaparin is more cost effective for both short‐ and long‐term VTE prophylaxis,1214 but low‐dose heparin appeared more cost effective for patients undergoing colorectal surgery, in large part because of an assumption of a smaller risk of bleeding.15
The purpose of this analysis was to determine the cost utility of heparin compared with enoxaparin for VTE prophylaxis for medical inpatients at risk. In such an analysis, it is important to consider the possibly different meanings that entities may attach to cost utility and effectiveness according to their different roles in the health care system. Individual institutions pay inpatient medication costs, but they often do not directly bear the costs of complications of treatment and may actually receive reimbursements for them. In contrast, payers must provide that reimbursement. For this reason, costs were analyzed from 2 perspectives, that of a payer (Medicare) and that of a health care system or institution.
METHODS
This protocol was declared exempt by the Institutional Review Board at the University of Texas Health Science Center at San Antonio.
Estimates of Effectiveness
Estimates of effectiveness include those related both to efficacy in preventing VTE, and those related to adverse drug events. They are summarized in Table 1.
| Base Case | Range for Sensitivity Analysis | |
|---|---|---|
| Rate of development of HIT on heparin | 2.70% | 0.80%4.90% |
| Rate of development of HIT on enoxaparin | 0.30% | 0.09%0.54% |
| Rate of progression to HITT | 40% | 25%50% |
| Mortality rate despite treatment, HITT | 8% | 0%20% |
| Assumed extension in length of stayHIT | 1 day | 05 days |
| Assumed extension in length of stayHITT | 7 days | 510 days |
| Life expectancy (2001) | 77.2 years | |
| Average age of medical inpatient | 71.9 years | |
| QALY adjustment for: | ||
| CHFsevere | 0.6 | |
| COPD | 0.4 | |
| Cancer | 0.9 |
Assumptions about the efficacy of heparin and enoxaparin when used for VTE prophylaxis were based on the following published data. The rate of development of VTE reported in the Medenox trial, 5.5%,1 is consistent with rates reported for patients receiving heparin (2%13%).1618 More recently, the PRINCE study demonstrated that enoxaparin was at least as effective as heparin in patients with severe heart failure or respiratory disease and was more effective in the former group of patients.7 Finally, data from patients with acute stroke indicated that low‐molecular‐weight heparins are at least as effective as heparin for this indication.19, 20 Equal efficacy was assumed for this analysis for several reasons, primarily to avoid the creation or amplification of errors through the introduction of more assumptions about the proportion of patients with specific diagnoses and about the magnitude and range of differences in efficacy. Only one study has examined the relative efficacy in patients with congestive heart failure, and not all the results of studies in stroke patients pointed to enoxaparin having improved efficacy. Therefore, making valid assumptions about the magnitude of the difference between the drugs on the basis of the available evidence may not be possible.
It was also assumed that aside from HIT and HITT, the 2 drugs had the same rates of adverse events, including bleeding complications, in this patient population.1
A Medline search combining MeSH terms thrombocytopenia and heparin was done to find the appropriate incidence of HIT and HITT. The resulting group was further limited in 3 separate searches using the terms prophylaxis (keyword), incidence (MeSH term), and thromboembolism or venous thrombosis (MeSH terms). Heparin‐induced thrombocytopenia was searched for as a keyword and combined with the MeSH term prophylaxis in a separate search. Finally, reference lists were searched to find additional articles.
The range of reported rates of development of HIT among patients receiving heparin was wide. In part, this is related to the different subgroups of patients studied and to the inclusion of patients receiving both prophylaxis and treatment doses of heparin. The one study that looked specifically at medical inpatients included patients receiving treatment‐dose heparin. The rate of HIT in this study was 0.8%.21 A study of both prophylactic and therapeutic use in neurologic patients reported a rate of 2.5%.22 Studies specific to VTE prophylaxis in surgical patients reported a range of 0.8%4.9%.2326 Based on these results, a rate of 2.7%, the median of the reported ranges, was used for the base case, and 0.8% and 4.9% were used for sensitivity analysis.
The reported rates of progression to thrombosis for patients with HIT ranged from 25 to more than 50%.21, 27, 28 A median rate of 40% was used for the base case, and 25% and 50% were used for sensitivity analysis. It was assumed that 0.3% of patients receiving enoxaparin developed HIT, 1/9 as frequently as those receiving heparin,24, 25, 29 but that the same percentage of those with HIT would develop thrombosis.
Mortality secondary to thrombosis in patients with untreated HIT has been reported to be 4%5%.30, 31 All‐cause mortality in untreated patients with HITT has been reported to be as high as >20%,31, 32 but in treated patients it has been reported as 8%.30 A mortality rate of 8% for HITT despite treatment was assumed with a range in the sensitivity analysis from 0% to 20%.
Life expectancy data were obtained from the National Center for Health Statistics, and the average age of medical inpatients potentially eligible for DVT prophylaxis was calculated from this data. The catalog of preference scores was obtained from the Cost Effectiveness Analysis Registry at the Harvard Center for Risk Analysis.33 These preference scores adjust the quality of a year of life for chronic diseases and provide a more accurate assessment of quality‐adjusted life years.
It was assumed that patients with HIT alone would be treated with argatroban, consistent with evidence that this is superior to withdrawal of heparin alone in patients with HIT.28 Using other agents such as lepirudin for the treatment of HIT was not considered in this analysis because there is no data on which to base their efficacy in patients with HIT.
For treatment of patients with HITT, again only the use of argatroban was considered. Though other agents are as efficacious in treating HITT, they are also more expensive. Therefore, using argatroban allowed for a more conservative estimate.
Platelet counts typically fall after 5 days of heparin administration in patients developing HIT34 and typically recover within 35 days of initiation of treatment.4, 29 In the past, patients may not have been kept in the hospital for resolution of their platelet count. However, with evidence that HIT should be aggressively treated, patients with HIT will likely have a longer length of stay. A study of treatment of HIT reported a mean time on argatroban of 57 days.23 This is greater than the average length of stay for medical diagnosis, which is 45 days.35 Therefore, an additional length of stay of 1 day was assumed for patients given a diagnosis of HIT, with a range of 05 days used for the sensitivity analysis. An additional length of stay totaling 7 days was assumed for those with thrombosis, based on patients requiring 7 days of argatroban therapy for treatment of HITT in a recent study.28
Estimates of Costs
Costs were analyzed from institutional and Medicare perspectives. Only direct medical expenditures related to hospitalization were considered; indirect patient costs resulting from the sequelae of HITT, while potentially severe, were not included. An incremental analysis was performed to express the increase in resources used when a person develops HIT/T, with the final result expressed as a daily cost of each medication. Cost assumptions are summarized in Table 2.
| Medicarerelated | Institutionrelated | |||
|---|---|---|---|---|
| Base case | Range | Base case | Range | |
| Additional reimbursement for HIT (if considered a complicating condition) | $ 765.06 | $ 0.00 | $ 765.06 | $0.00 |
| Additional reimbursement for HITT (if coagulation disorder DRG used) | $1135.56 | $ 0.00 | $1135.56 | $0.00 |
| Primary provider visit (99232) | $ 54.89 | $33.00$ 78.04 | n/a | |
| Consultant initial visit (99254) | $ 140.39 | $35.84$193.03 | n/a | |
| Consultant followup (99263) | $ 44.80 | $22.40$ 66.09 | n/a | |
| Medication (per day) | ||||
| Heparin | n/a | $ 4.00 | ||
| Enoxaparin | n/a | $ 84.00 | ||
| Argatroban | n/a | $ 150.00 | ||
| Coumadin | n/a | $ 0.50 | ||
| Laboratory tests (per test) | ||||
| Complete blood count | n/a | $ 2.14 | ||
| Prothrombin time/partial thromboplastin time | n/a | $ 9.85 | ||
| Opportunity cost per additional day of hospitalization (if hospital at capacity) | n/a | $1096.72 | ||
Medicare Related
Diagnosis‐related group (DRG) reimbursement to institutions and physicians were considered the only payer‐related costs. These were based on the 2005 Medicare reimbursement.36 Costs related to laboratory, medication, or other diagnostic studies were assumed to be covered by the DRG payment and not to be billed separately.
The average Medicare reimbursement to institutions for all diagnosis‐related groups is the national standard number, or $4971.81. To determine the additional potential charges resulting from the development of HIT, it was considered a complicating condition. The average adjustment factor for complicating conditions of medical diagnoses is .1539, leading to an increase in charges of $765.06. No additional adjustments for geographic location were made. Sensitivity analysis was performed with no additional reimbursement for HIT as a complicating condition.
To quantify additional charges related to caring for patients with HITT, we used the amount of additional charges for the coagulation disorder DRG (#397) above those of the average reimbursement. This amount is $1135.56, the difference between the higher charge of $6107.37 for this DRG, and the national standard number. Sensitivity analysis with no additional charges was performed.
Physician charges used were based on the 2004 Medicare reimbursement.36 It was assumed that each patient with HIT would have a daily visit of moderate complexity (CPT 99232), which carries a reimbursement rate of $54.89. Patients with thrombotic complications were assumed to also have a hematology consult consisting of one initial visit and one followup, both of midlevel complexity (CPTs 99253 and 99262). The reimbursement rates for these visits are $97.45 and $44.80. Sensitivity analysis using both lower‐ and higher‐level visits was performed (Table 2).
Based on the above DRG and physician reimbursements, the total cost to Medicare of treating a patient with HIT is $820.05 and of treating a patient with HITT is $1749.98. For the situation in which a patient with HIT also developed HITT, only the cost of reimbursement for HITT was modeled.
Hospital‐Related
To calculate the benefit or cost to an institution, 2 scenarios were modeled. In the first scenario, only the DRG‐related revenues collected and the costs of caring for patients with HIT/T were considered. The revenues used are described above. The cost of medications at a multi‐institutional health care system (MIHCS) was obtained from the pharmacy and used in this analysis. This system is composed of a network of urban and suburban acute care facilities with academic affiliations with 2 universities. Costs are representative of the entire system. The cost of heparin is $2.00 per unit dose; daily cost for b.i.d. prophylaxis is $4.00. The cost of one daily dose of enoxaparin is $84.00. One unit (50 mg) of argatroban costs $50.00. For a 70‐kg man at a standard dosing rate of 2 g/kg per minute, the daily cost would be approximately $150.00. The daily cost of coumadin was estimated at $0.50 regardless of the dose. The cost of laboratory tests within the MIHCS is $2.14 per complete blood count and $9.85 for each PT/PTT.
Other costs, such as those related to the additional time spent by nursing and pharmacy staff in the mixing and administration of argatroban or caring for patients with HIT and HITT were not included in this analysis, as it was believed that they would have no impact on actual staffing levels and would not lead to a tangible or easily quantifiable increase in expenditures.
In the second scenario, the potential loss of income from additional days of hospitalization for HIT and HITT was considered. An institution could potentially lose money if a patient with HIT or HITT stayed longer than the number of days that is economically attractive given the DRG reimbursement. In this scenario, a longer length of stay of a patient with HIT or HITT could lead to the bed not being used by other patients for whom the hospital could be collecting revenue. This would only be applicable with high occupancy rates. The average revenue per day that a hospital could receive for a patient was calculated by dividing the average reimbursement, $4971.81, by the average length of stay for medical inpatients, 4.5 days. This amount is $1096.72. The amount of additional reimbursement for a complicating condition, $754.06, then covers 0.7 days of additional hospitalization. As described above, the average additional reimbursement for using the coagulation disorder DRG for patients with HITT, instead of using the DRG for which they were otherwise admitted, was $1135.56. This would cover an additional 1.04 days of hospitalization. If the hospital stay of patients with HIT/T were to be longer, an amount computed as $1096.72 multiplied by the number of additional days of hospitalization was considered a loss of income borne by the hospital.
Sensitivity Analysis
Sensitivity analysis was performed to ensure the validity of results over a range of values and to assess the effect of medication prices on our findings. The analysis used these parameters, both alone and in combination: rate of development of HIT, rate of development on enoxaparin compared with on heparin, percentage of those with HIT who developed thrombosis, mortality related to HITT, length of stay of patients with both HIT and HITT, reimbursement rates, and costs of medication.
RESULTS
The decision tree used for the base‐case analysis is shown in Figure 1. The gain in quality‐adjusted life years (QALYs) for medical patients who used enoxaparin rather than heparin for VTE prophylaxis was 0.00629 (approximately 55 hours). This was based on the decrease in HITT‐related premature death resulting from the use of enoxaparin. From a payer perspective, the daily cost of enoxaparin is $3.58, compared with $32.18 for heparin. The difference is a savings of $28.61, leading to a savings/QALY of $4550.17. Therefore, the use of enoxaparin is both more effective and less costly.

Sensitivity analysis showed that from a payer perspective, enoxaparin remained both less costly and more effective in all cases. The factors that had the largest impact on cost/QALY were incidence of HIT and rate of thrombosis among those with HIT. Decreasing length of stay to 0 for patients with HIT, decreasing reimbursement to $0 for both HIT and HITT, and billing at a high or low level did not change the general finding. Decreasing the cost of enoxaparin or heparin also did not affect these findings. The results of the sensitivity analysis are summarized in Table 3.
| Enoxaparin (cost/day) | Heparin (cost/day) | QALYs saved | Savings/QALY | |
|---|---|---|---|---|
| Base case | $3.58 | $32.18 | 0.00629 | $4550.17 |
| Sensitivity analysis | ||||
| Incidence of HIT | $1.06$6.49 | $ 9.54$58.11 | 0.001860.01141 | $4550.17 |
| Progression of HIT to HITT | $3.12$3.77 | $28.05$33.95 | 0.003930.00786 | $6344.53$3840.30 |
| Level of physician visit billed | $3.23$3.81 | $28.45$34.27 | 0.00629 | $4021.85$4844.35 |
| HIT length of stay | $3.48$3.64 | $31.30$32.78 | 0.00629 | $4424.46$4633.98 |
| No reimbursement for HIT | $2.13 | $19.20 | 0.00629 | $2713.90 |
| No reimbursement for HITT | $0.77 | $ 6.93 | 0.00629 | $ 980.05 |
From an institutional perspective, the effect of considering the costs of HIT and HITT did not necessarily make enoxaparin a more attractive choice. When potential reimbursement for drug‐related complications was considered, an institution actually make $7.27/day by choosing heparin, whereas the cost of enoxaparin decreases only minimally from $84.00 to $82.75/day (Table 4). Factoring opportunity costs into the analysis showed that an institution does not make money by using heparin, but heparin still costs less on a daily basis. This finding changes only at rates of HIT over 4%.
| Heparin | Enoxaparin | |||
|---|---|---|---|---|
| Drug cost alone | Drug cost + cost of increased LOS | Drug cost alone | Drug cost + cost of increased LOS | |
| Base case | ($7.27) | $72.33 | $82.75 | $91.59 |
| Sensitivity Analysis | ||||
| Incidence of HIT | $ 0.66($16.45) | $24.25$128.01 | $83.63$81.75 | $86.25$ 97.18 |
| Length of stay HIT | ($ 7.27) | $42.72$190.78 | $82.75 | $88.30$104.75 |
| Length of stay HITT | ($ 7.27) | $48.64$101.57 | $82.75 | $88.96$ 95.54 |
| Drug costs below which enoxaparin is more attractive | $ 0.50$ 4.00 | $ 0.50$ 4.00 | $33.00$37.00 | < $1.00 |
Sensitivity analyses of institutional costs are summarized in Table 4. These analyses demonstrated that potential increases in length of stay for patients with HIT or HITT could make heparin less attractive when opportunity costs to the hospital are considered. If the additional length of stay for patients with HIT increased to greater than 1.75 days or the additional length of stay for those with HITT increased to more than 9 days, heparin becomes a less attractive choice. Loss of reimbursement for HIT or HITT alone does not make enoxaparin less costly than heparin.
Sensitivity analysis also demonstrated that variation in the price of enoxaparin could potentially make heparin less attractive. If the price of heparin were held constant at $4.00/day, enoxaparin would become less costly at a price of $37.00. If the price of heparin were to decrease to as low as $0.50/day, the price at which enoxaparin would be more attractive decreased to $33.00. These prices are only applicable when the opportunity costs of having occupied beds are consideredthat is, only when an institution is operating at full capacity. When this is not the case, enoxaparin would have to cost less than $1.00 to be more financially attractive than heparin. In practical terms, unless a hospital is at full capacity and needs hospital beds for other patients, the cost of enoxaparin would have to be less than $1 for an institution to choose it instead of heparin.
DISCUSSION
This study demonstrates that from a payer perspective, there is greater cost utility in the use of enoxaparin in place of heparin for the prevention of venous thromboembolism in at‐risk medical patients. This benefit is based on a single advantage of enoxaparin: its decreased tendency to cause HIT/T. Despite the simplicity of this assumption, it is well supported by published data. Sensitivity analyses supported the finding that enoxaparin was a superior choice in all scenarios modeled. This payer data can be extrapolated to a societal level because the costs used were based on Medicare reimbursements.
The benefit of using enoxaparin when expressed in an absolute number of quality‐adjusted life years was small, approximately 55 hours. This reflects that although the effects of HIT and HITT are potentially devastating, they occur infrequently. However, our calculation was conservative in several respects. We calculated the highest possible average age for a medical inpatient based on the available statistics. This was done to ensure that we were not overestimating the number of QALYs saved by preventing death secondary to HITT. We also considered only 2 outcomes of HITT: death and recovery. This underestimates the significant potential thrombotic complications, notably amputation or other loss of function, which would increase the number of QALYs saved by using enoxaparin. The inclusion of these complications would only strengthen this finding. Finally, we assumed equal efficacy for heparin and enoxaparin. The inclusion of superior efficacy of enoxaparin in subpopulations of medical inpatients would again only strengthen this finding.
Apart from the price of the medication, the incidence of HIT had the largest impact on costs and QALYs saved in the sensitivity analysis. Studies specific to VTE prophylaxis in medical inpatients could better define the incidence of HIT/T in this population, but this would not change our overall finding.
From an institutional perspective, the choice of heparin or enoxaparin is more complicated. In most but not all scenarios, the use of heparin appears to be more financially attractive. The prices of enoxaparin and heparin, the additional length of stay required to care for patients with HIT and HITT, and the percentage of total beds occupied all affect this decision. Several pieces of cost data, specifically those related to medication and laboratory testing, were specific to an MIHCS health care system, the type considered in the analysis and could potentially limit the applicability of this study to other institutions. However, the sensitivity analysis demonstrated that the cost of enoxaparin would have to be at least 60% lower, below $33/day, before affecting our conclusion, and then only if an institution were at full capacity. Thus, we expect that our results are generally applicable.
The potential limitations of this study are related to the assumptions required. However, our efficacy assumptions were conservatively based on published data. It is possible that a decrease in the rate of thrombosis if all cases of HIT were treated with argatroban could affect our findings. However, in the study by Lewis et al., the complication rate for those with HIT in the treatment group was 28% (versus 38.8% in the untreated group), consistent with rates used in our sensitivity analysis. DRG and physician reimbursements are based on published Medicare data. The greatest variation is likely to be in drug cost, as different institutions may negotiate lower prices. From a payer perspective, drug costs do not affect the conclusions; from an institutional perspective, drug cost may make the choice a complicated one. One factor not included in our analysis that may affect this decision is the possible impact of legal action on the medications institutions choose for VTE prophylaxis. Because the potential consequences of HITT can be so devastating, an institution could have difficulty defending the choice of heparin when an equally effective alternative with fewer adverse events was available. A settlement of $1 million could potentially pay for prophylaxis with enoxaparin for at least 2500 patients.
This analysis has highlighted one of the unfortunate paradoxes caused by the different, potentially competing incentives in our health care system. Payers and institutions often face different financial incentives. From a hospital's perspective, it may cost less to use an intervention that can potentially cause a greater number of complications and higher payer costs. We believe that for VTE prophylaxis for medical inpatients, improved patient outcomes coupled with decreased payer/societal costs argue strongly for the use of enoxaparin over unfractionated heparin and outweigh any institutional benefits.
- ,,, et al.A comparison of enoxaparin with placebo for the prevention of venous thromboembolism in acutely ill medical patients.N Eng J Med.1999;322:793–800.
- .Recommendations for prophylaxis of venous thromboembolism: International consensus and the American College of Chest Physicians Fifth Consensus Conference on Antithrombotic therapy.Curr Opin Pulm Med.2000;6:314–320.
- ,,, et al.Risk factors for venous thromboembolism in hospitalized patients with acute medical illness: analysis of the MEDENOX study.Arch Intern Med.2004;164:963–968.
- .Heparin–induced thrombocytopenia: pathogenesis and management.Br J Haematology.1003;121:535–555.
- .Heparin–induced thrombocytopenia diagnosis and management.Circulation.2004;110:e454–e458.
- .New approaches to the diagnosis of heparin–induced thrombocytopenia.Chest.2005;27(2 suppl):35S–45S.
- ,,, et al.Randomized comparison of enoxaparin with unfractionated heparin for the prevention of venous thromboembolism in medical patients with heart failure or severe respiratory disease.Am Heart J.2003;145:614–621.
- ,.Cost–effectiveness analysis of deep vein thrombosis prophylaxis in internal medicine patients.Thrombosis Res.1999;94:65–68.
- ,.,.Cost effectiveness of thromboprophylaxis with low–molecular–weight heparin versus unfractionated heparin in acutely ill medical inpatients.Am J Manag Care.2004;10:632–642.
- ,,, et al.Economic assessment of low–molecular–weight heparin (enoxaparin) versus unfractionated heparin in acute coronary syndrome patients: results from the ESSENCE Randomized Trial.Circulation.1998;97:1702–1707.
- ,, et al.Management of acute proximal deep vein thrombosis: pharmacoeconomic evaluation of outpatient treatment with enoxaparin vs inpatient treatment with unfractionated heparin.Chest.2002;122(1);108–114.
- ,,, et al.Prevention of deep–vein thrombosis following total hip replacement surgery with enoxaparin versus unfractionated heparin: a pharmacoeconomic evaluation.Ann Pharmacother.1994:28(2):271–275.
- ,.Cost–effectiveness of prolonged out–of–hospital prophylaxis with low–molecular–weight heparin following total hip replacement.Haemostasis.2000;30(suppl 2):130–135.
- ,,, et al.Cost effectiveness of a low–molecular–weight heparin in prolonged prophylaxis against deep vein thrombosis after total hip replacement.Pharmacoeconomics.1998;13:81–89.
- ,,, et al.Economic analysis of low–dose heparin vs the low–molecular–weight heparin enoxaparin for prevention of venous thromboembolism after colorectal surgery.Arch Intern Med.1999;159:1221–1228.
- .High risk of the critically ill for venous thromboembolism.Crit Care Med.1982;10:448–450.
- ,,, et al.Prevention of deep vein thrombosis in medical patients by low dose heparin.Scott Med J.1981;26:115–117.
- ,,, et al.Prevalence and prevention of deep venous thrombosis of the lower extremities in high–risk pulmonary patients.Angiology.1988;39:505–513.
- ,,, et al.A double–blind randomized trial of ORG 10172 low–molecular weight heparinoid versus unfractionated heparin in the prevention of deep venous thrombosis in patients with thrombotic stroke.Thromb Haemost.1991;65(suppl):753.
- ,,, et al.A double–blind and randomized placebo controlled trial of low molecular weight heparin once daily to prevent deep vein thrombosis in acute ischemic stroke.Semin Thromb Hemost.1990;16(suppl):25–33.
- ,,, et al.The incidence of heparin–induced thrombocytopenia in hospitalized medical patients treated with subcutaneous unfractionated heparin: a prospective cohort study.Blood.2003;101:2955–2959.
- ,,, et al.Heparin–induced thrombocytopenia in neurologic disease treated with unfractionated heparin.Neurology.2004;62:657–659.
- ,,, et al.Subcutaneous heparin versus low–molecular–weight heparin as thromboprophylaxis in patients undergoing colorectal surgery.Ann Surg2001;233:438–44.
- ,,, et al.Heparin–induced thrombocytopenia inpatients treated with low–molecular weight heparin or unfractionated heparin.N Eng J Med.1995;332:1330–1335.
- ,,, et al.An improved definition of heparin–induced thrombocytopenia in postoperative orthopedic patients.Arch Intern Med.2003;163:2518–2524.
- ,,, et al.Impact of patient population on the risk for heparin–induced thrombocytopenia.Blood.2000;96:1703–1708.
- ,,, et al.Heparin–induced thrombocytopenia and thrombosis: incidence, analysis of risk factors, and clinical outcomes in 108 consecutive patients treated at a single institution.Am J Hematol.1997;56(1):12–16.
- .., et al.Argatroban anticoagulation in patients with heparin–induced thrombocytopenia.Arch Intern Med.2003:163:1849–1856.
- ,,, et al.Antibodies to platelet factor 4–heparin after cardiopulmonary bypass in patients anticoagulated with unfractionated heparin or a low–molecular–weight heparin: clinical implications for heparin–induced thrombocytopenia.Circulation.1999;99:2530–2536.
- ,,, et.Al. Argatroban anticoagulant therapy in patients with heparin–induced thrombocytopenia.Circulation.2001;103:1838–1843.
- ,.A 14 year study of heparin–induced thrombocytopenia.Am J Med.1996;101:502–507.
- ,,, et al.Failure of early heparin cessation as treatment for heparin–induced thrombocytopenia.Am J Med.1999;106:629–635.
- CEA Registry,Harvard Center for Risk Analysis. Available at: http://www.hcra.harvard.edu/pdf/preferencescores.pdf.
- .Temporal aspects of heparin–induced thrombocytopenia.N Eng J Med.2001;344:1286–1292.
- National Center for Health Statistics. Available at: http://www.cdc.gov/nchs/.
- Centers for Medicare and Medicaid Services. Available at: http://www.cms.hhs.gov/.
Several groups of medical patients at risk for venous thromboembolism (VTE) while hospitalized have been identified. These include patients with certain acute medical illnesses such as acute myocardial infarction, stroke, or chronic obstructive pulmonary disease and those with acute medical illness combined with additional risk factors including advanced age, cancer, obesity, or prior VTE.13
Heparin‐induced thrombocytopenia (HIT) and heparin‐induced thrombocytopenia with thrombosis (HITT), a spectrum of disease also known as type 2 HIT, are potentially devastating hematologic consequences of VTE prophylaxis that result from heparin binding to platelet factor IV, leading to IgG antibodymediated platelet activation.46 These complications manifest along a spectrum from thrombocytopenia alone (HIT) to more severe sequelae that include death, amputation, venous and arterial thrombosis. Unfractionated heparin (UFH) has traditionally been used for VTE prophylaxis in these populations at risk. More recently, evidence has indicated that enoxaparin, a low‐molecular‐weight heparin, is at least as effective for VTE prophylaxis1, 7 and carries a significantly lower risk for the development of the complications of HIT and HITT. Despite the superior side‐effect profile of enoxaparin, many institutions encourage the use of heparin for DVT prophylaxis because of its lower price. However, when the costs of treating these complications are considered, using unfractionated heparin may actually be more costly.
Two studies of the cost effectiveness of heparin compared with enoxaparin when used for VTE prophylaxis in medical inpatients have recently been published.8, 9 However, one of these studies focused only on pharmacy‐related costs and did not consider patient‐related outcomes, and the other was published by a for‐profit research company. Studies of treatment with enoxaparin versus UFH in other medical settings, including non‐Q‐wave myocardial infarction10 and treatment of acute deep‐vein thrombosis,11 suggest that enoxaparin is more cost effective. Studies of prophylaxis of surgical patients have been contradictory. Data suggest that in orthopedic patients the use of enoxaparin is more cost effective for both short‐ and long‐term VTE prophylaxis,1214 but low‐dose heparin appeared more cost effective for patients undergoing colorectal surgery, in large part because of an assumption of a smaller risk of bleeding.15
The purpose of this analysis was to determine the cost utility of heparin compared with enoxaparin for VTE prophylaxis for medical inpatients at risk. In such an analysis, it is important to consider the possibly different meanings that entities may attach to cost utility and effectiveness according to their different roles in the health care system. Individual institutions pay inpatient medication costs, but they often do not directly bear the costs of complications of treatment and may actually receive reimbursements for them. In contrast, payers must provide that reimbursement. For this reason, costs were analyzed from 2 perspectives, that of a payer (Medicare) and that of a health care system or institution.
METHODS
This protocol was declared exempt by the Institutional Review Board at the University of Texas Health Science Center at San Antonio.
Estimates of Effectiveness
Estimates of effectiveness include those related both to efficacy in preventing VTE, and those related to adverse drug events. They are summarized in Table 1.
| Base Case | Range for Sensitivity Analysis | |
|---|---|---|
| Rate of development of HIT on heparin | 2.70% | 0.80%4.90% |
| Rate of development of HIT on enoxaparin | 0.30% | 0.09%0.54% |
| Rate of progression to HITT | 40% | 25%50% |
| Mortality rate despite treatment, HITT | 8% | 0%20% |
| Assumed extension in length of stayHIT | 1 day | 05 days |
| Assumed extension in length of stayHITT | 7 days | 510 days |
| Life expectancy (2001) | 77.2 years | |
| Average age of medical inpatient | 71.9 years | |
| QALY adjustment for: | ||
| CHFsevere | 0.6 | |
| COPD | 0.4 | |
| Cancer | 0.9 |
Assumptions about the efficacy of heparin and enoxaparin when used for VTE prophylaxis were based on the following published data. The rate of development of VTE reported in the Medenox trial, 5.5%,1 is consistent with rates reported for patients receiving heparin (2%13%).1618 More recently, the PRINCE study demonstrated that enoxaparin was at least as effective as heparin in patients with severe heart failure or respiratory disease and was more effective in the former group of patients.7 Finally, data from patients with acute stroke indicated that low‐molecular‐weight heparins are at least as effective as heparin for this indication.19, 20 Equal efficacy was assumed for this analysis for several reasons, primarily to avoid the creation or amplification of errors through the introduction of more assumptions about the proportion of patients with specific diagnoses and about the magnitude and range of differences in efficacy. Only one study has examined the relative efficacy in patients with congestive heart failure, and not all the results of studies in stroke patients pointed to enoxaparin having improved efficacy. Therefore, making valid assumptions about the magnitude of the difference between the drugs on the basis of the available evidence may not be possible.
It was also assumed that aside from HIT and HITT, the 2 drugs had the same rates of adverse events, including bleeding complications, in this patient population.1
A Medline search combining MeSH terms thrombocytopenia and heparin was done to find the appropriate incidence of HIT and HITT. The resulting group was further limited in 3 separate searches using the terms prophylaxis (keyword), incidence (MeSH term), and thromboembolism or venous thrombosis (MeSH terms). Heparin‐induced thrombocytopenia was searched for as a keyword and combined with the MeSH term prophylaxis in a separate search. Finally, reference lists were searched to find additional articles.
The range of reported rates of development of HIT among patients receiving heparin was wide. In part, this is related to the different subgroups of patients studied and to the inclusion of patients receiving both prophylaxis and treatment doses of heparin. The one study that looked specifically at medical inpatients included patients receiving treatment‐dose heparin. The rate of HIT in this study was 0.8%.21 A study of both prophylactic and therapeutic use in neurologic patients reported a rate of 2.5%.22 Studies specific to VTE prophylaxis in surgical patients reported a range of 0.8%4.9%.2326 Based on these results, a rate of 2.7%, the median of the reported ranges, was used for the base case, and 0.8% and 4.9% were used for sensitivity analysis.
The reported rates of progression to thrombosis for patients with HIT ranged from 25 to more than 50%.21, 27, 28 A median rate of 40% was used for the base case, and 25% and 50% were used for sensitivity analysis. It was assumed that 0.3% of patients receiving enoxaparin developed HIT, 1/9 as frequently as those receiving heparin,24, 25, 29 but that the same percentage of those with HIT would develop thrombosis.
Mortality secondary to thrombosis in patients with untreated HIT has been reported to be 4%5%.30, 31 All‐cause mortality in untreated patients with HITT has been reported to be as high as >20%,31, 32 but in treated patients it has been reported as 8%.30 A mortality rate of 8% for HITT despite treatment was assumed with a range in the sensitivity analysis from 0% to 20%.
Life expectancy data were obtained from the National Center for Health Statistics, and the average age of medical inpatients potentially eligible for DVT prophylaxis was calculated from this data. The catalog of preference scores was obtained from the Cost Effectiveness Analysis Registry at the Harvard Center for Risk Analysis.33 These preference scores adjust the quality of a year of life for chronic diseases and provide a more accurate assessment of quality‐adjusted life years.
It was assumed that patients with HIT alone would be treated with argatroban, consistent with evidence that this is superior to withdrawal of heparin alone in patients with HIT.28 Using other agents such as lepirudin for the treatment of HIT was not considered in this analysis because there is no data on which to base their efficacy in patients with HIT.
For treatment of patients with HITT, again only the use of argatroban was considered. Though other agents are as efficacious in treating HITT, they are also more expensive. Therefore, using argatroban allowed for a more conservative estimate.
Platelet counts typically fall after 5 days of heparin administration in patients developing HIT34 and typically recover within 35 days of initiation of treatment.4, 29 In the past, patients may not have been kept in the hospital for resolution of their platelet count. However, with evidence that HIT should be aggressively treated, patients with HIT will likely have a longer length of stay. A study of treatment of HIT reported a mean time on argatroban of 57 days.23 This is greater than the average length of stay for medical diagnosis, which is 45 days.35 Therefore, an additional length of stay of 1 day was assumed for patients given a diagnosis of HIT, with a range of 05 days used for the sensitivity analysis. An additional length of stay totaling 7 days was assumed for those with thrombosis, based on patients requiring 7 days of argatroban therapy for treatment of HITT in a recent study.28
Estimates of Costs
Costs were analyzed from institutional and Medicare perspectives. Only direct medical expenditures related to hospitalization were considered; indirect patient costs resulting from the sequelae of HITT, while potentially severe, were not included. An incremental analysis was performed to express the increase in resources used when a person develops HIT/T, with the final result expressed as a daily cost of each medication. Cost assumptions are summarized in Table 2.
| Medicarerelated | Institutionrelated | |||
|---|---|---|---|---|
| Base case | Range | Base case | Range | |
| Additional reimbursement for HIT (if considered a complicating condition) | $ 765.06 | $ 0.00 | $ 765.06 | $0.00 |
| Additional reimbursement for HITT (if coagulation disorder DRG used) | $1135.56 | $ 0.00 | $1135.56 | $0.00 |
| Primary provider visit (99232) | $ 54.89 | $33.00$ 78.04 | n/a | |
| Consultant initial visit (99254) | $ 140.39 | $35.84$193.03 | n/a | |
| Consultant followup (99263) | $ 44.80 | $22.40$ 66.09 | n/a | |
| Medication (per day) | ||||
| Heparin | n/a | $ 4.00 | ||
| Enoxaparin | n/a | $ 84.00 | ||
| Argatroban | n/a | $ 150.00 | ||
| Coumadin | n/a | $ 0.50 | ||
| Laboratory tests (per test) | ||||
| Complete blood count | n/a | $ 2.14 | ||
| Prothrombin time/partial thromboplastin time | n/a | $ 9.85 | ||
| Opportunity cost per additional day of hospitalization (if hospital at capacity) | n/a | $1096.72 | ||
Medicare Related
Diagnosis‐related group (DRG) reimbursement to institutions and physicians were considered the only payer‐related costs. These were based on the 2005 Medicare reimbursement.36 Costs related to laboratory, medication, or other diagnostic studies were assumed to be covered by the DRG payment and not to be billed separately.
The average Medicare reimbursement to institutions for all diagnosis‐related groups is the national standard number, or $4971.81. To determine the additional potential charges resulting from the development of HIT, it was considered a complicating condition. The average adjustment factor for complicating conditions of medical diagnoses is .1539, leading to an increase in charges of $765.06. No additional adjustments for geographic location were made. Sensitivity analysis was performed with no additional reimbursement for HIT as a complicating condition.
To quantify additional charges related to caring for patients with HITT, we used the amount of additional charges for the coagulation disorder DRG (#397) above those of the average reimbursement. This amount is $1135.56, the difference between the higher charge of $6107.37 for this DRG, and the national standard number. Sensitivity analysis with no additional charges was performed.
Physician charges used were based on the 2004 Medicare reimbursement.36 It was assumed that each patient with HIT would have a daily visit of moderate complexity (CPT 99232), which carries a reimbursement rate of $54.89. Patients with thrombotic complications were assumed to also have a hematology consult consisting of one initial visit and one followup, both of midlevel complexity (CPTs 99253 and 99262). The reimbursement rates for these visits are $97.45 and $44.80. Sensitivity analysis using both lower‐ and higher‐level visits was performed (Table 2).
Based on the above DRG and physician reimbursements, the total cost to Medicare of treating a patient with HIT is $820.05 and of treating a patient with HITT is $1749.98. For the situation in which a patient with HIT also developed HITT, only the cost of reimbursement for HITT was modeled.
Hospital‐Related
To calculate the benefit or cost to an institution, 2 scenarios were modeled. In the first scenario, only the DRG‐related revenues collected and the costs of caring for patients with HIT/T were considered. The revenues used are described above. The cost of medications at a multi‐institutional health care system (MIHCS) was obtained from the pharmacy and used in this analysis. This system is composed of a network of urban and suburban acute care facilities with academic affiliations with 2 universities. Costs are representative of the entire system. The cost of heparin is $2.00 per unit dose; daily cost for b.i.d. prophylaxis is $4.00. The cost of one daily dose of enoxaparin is $84.00. One unit (50 mg) of argatroban costs $50.00. For a 70‐kg man at a standard dosing rate of 2 g/kg per minute, the daily cost would be approximately $150.00. The daily cost of coumadin was estimated at $0.50 regardless of the dose. The cost of laboratory tests within the MIHCS is $2.14 per complete blood count and $9.85 for each PT/PTT.
Other costs, such as those related to the additional time spent by nursing and pharmacy staff in the mixing and administration of argatroban or caring for patients with HIT and HITT were not included in this analysis, as it was believed that they would have no impact on actual staffing levels and would not lead to a tangible or easily quantifiable increase in expenditures.
In the second scenario, the potential loss of income from additional days of hospitalization for HIT and HITT was considered. An institution could potentially lose money if a patient with HIT or HITT stayed longer than the number of days that is economically attractive given the DRG reimbursement. In this scenario, a longer length of stay of a patient with HIT or HITT could lead to the bed not being used by other patients for whom the hospital could be collecting revenue. This would only be applicable with high occupancy rates. The average revenue per day that a hospital could receive for a patient was calculated by dividing the average reimbursement, $4971.81, by the average length of stay for medical inpatients, 4.5 days. This amount is $1096.72. The amount of additional reimbursement for a complicating condition, $754.06, then covers 0.7 days of additional hospitalization. As described above, the average additional reimbursement for using the coagulation disorder DRG for patients with HITT, instead of using the DRG for which they were otherwise admitted, was $1135.56. This would cover an additional 1.04 days of hospitalization. If the hospital stay of patients with HIT/T were to be longer, an amount computed as $1096.72 multiplied by the number of additional days of hospitalization was considered a loss of income borne by the hospital.
Sensitivity Analysis
Sensitivity analysis was performed to ensure the validity of results over a range of values and to assess the effect of medication prices on our findings. The analysis used these parameters, both alone and in combination: rate of development of HIT, rate of development on enoxaparin compared with on heparin, percentage of those with HIT who developed thrombosis, mortality related to HITT, length of stay of patients with both HIT and HITT, reimbursement rates, and costs of medication.
RESULTS
The decision tree used for the base‐case analysis is shown in Figure 1. The gain in quality‐adjusted life years (QALYs) for medical patients who used enoxaparin rather than heparin for VTE prophylaxis was 0.00629 (approximately 55 hours). This was based on the decrease in HITT‐related premature death resulting from the use of enoxaparin. From a payer perspective, the daily cost of enoxaparin is $3.58, compared with $32.18 for heparin. The difference is a savings of $28.61, leading to a savings/QALY of $4550.17. Therefore, the use of enoxaparin is both more effective and less costly.
Sensitivity analysis showed that from a payer perspective, enoxaparin remained both less costly and more effective in all cases. The factors that had the largest impact on cost/QALY were incidence of HIT and rate of thrombosis among those with HIT. Decreasing length of stay to 0 for patients with HIT, decreasing reimbursement to $0 for both HIT and HITT, and billing at a high or low level did not change the general finding. Decreasing the cost of enoxaparin or heparin also did not affect these findings. The results of the sensitivity analysis are summarized in Table 3.
| Enoxaparin (cost/day) | Heparin (cost/day) | QALYs saved | Savings/QALY | |
|---|---|---|---|---|
| Base case | $3.58 | $32.18 | 0.00629 | $4550.17 |
| Sensitivity analysis | ||||
| Incidence of HIT | $1.06$6.49 | $ 9.54$58.11 | 0.001860.01141 | $4550.17 |
| Progression of HIT to HITT | $3.12$3.77 | $28.05$33.95 | 0.003930.00786 | $6344.53$3840.30 |
| Level of physician visit billed | $3.23$3.81 | $28.45$34.27 | 0.00629 | $4021.85$4844.35 |
| HIT length of stay | $3.48$3.64 | $31.30$32.78 | 0.00629 | $4424.46$4633.98 |
| No reimbursement for HIT | $2.13 | $19.20 | 0.00629 | $2713.90 |
| No reimbursement for HITT | $0.77 | $ 6.93 | 0.00629 | $ 980.05 |
From an institutional perspective, the effect of considering the costs of HIT and HITT did not necessarily make enoxaparin a more attractive choice. When potential reimbursement for drug‐related complications was considered, an institution actually make $7.27/day by choosing heparin, whereas the cost of enoxaparin decreases only minimally from $84.00 to $82.75/day (Table 4). Factoring opportunity costs into the analysis showed that an institution does not make money by using heparin, but heparin still costs less on a daily basis. This finding changes only at rates of HIT over 4%.
| Heparin | Enoxaparin | |||
|---|---|---|---|---|
| Drug cost alone | Drug cost + cost of increased LOS | Drug cost alone | Drug cost + cost of increased LOS | |
| Base case | ($7.27) | $72.33 | $82.75 | $91.59 |
| Sensitivity Analysis | ||||
| Incidence of HIT | $ 0.66($16.45) | $24.25$128.01 | $83.63$81.75 | $86.25$ 97.18 |
| Length of stay HIT | ($ 7.27) | $42.72$190.78 | $82.75 | $88.30$104.75 |
| Length of stay HITT | ($ 7.27) | $48.64$101.57 | $82.75 | $88.96$ 95.54 |
| Drug costs below which enoxaparin is more attractive | $ 0.50$ 4.00 | $ 0.50$ 4.00 | $33.00$37.00 | < $1.00 |
Sensitivity analyses of institutional costs are summarized in Table 4. These analyses demonstrated that potential increases in length of stay for patients with HIT or HITT could make heparin less attractive when opportunity costs to the hospital are considered. If the additional length of stay for patients with HIT increased to greater than 1.75 days or the additional length of stay for those with HITT increased to more than 9 days, heparin becomes a less attractive choice. Loss of reimbursement for HIT or HITT alone does not make enoxaparin less costly than heparin.
Sensitivity analysis also demonstrated that variation in the price of enoxaparin could potentially make heparin less attractive. If the price of heparin were held constant at $4.00/day, enoxaparin would become less costly at a price of $37.00. If the price of heparin were to decrease to as low as $0.50/day, the price at which enoxaparin would be more attractive decreased to $33.00. These prices are only applicable when the opportunity costs of having occupied beds are consideredthat is, only when an institution is operating at full capacity. When this is not the case, enoxaparin would have to cost less than $1.00 to be more financially attractive than heparin. In practical terms, unless a hospital is at full capacity and needs hospital beds for other patients, the cost of enoxaparin would have to be less than $1 for an institution to choose it instead of heparin.
DISCUSSION
This study demonstrates that from a payer perspective, there is greater cost utility in the use of enoxaparin in place of heparin for the prevention of venous thromboembolism in at‐risk medical patients. This benefit is based on a single advantage of enoxaparin: its decreased tendency to cause HIT/T. Despite the simplicity of this assumption, it is well supported by published data. Sensitivity analyses supported the finding that enoxaparin was a superior choice in all scenarios modeled. This payer data can be extrapolated to a societal level because the costs used were based on Medicare reimbursements.
The benefit of using enoxaparin when expressed in an absolute number of quality‐adjusted life years was small, approximately 55 hours. This reflects that although the effects of HIT and HITT are potentially devastating, they occur infrequently. However, our calculation was conservative in several respects. We calculated the highest possible average age for a medical inpatient based on the available statistics. This was done to ensure that we were not overestimating the number of QALYs saved by preventing death secondary to HITT. We also considered only 2 outcomes of HITT: death and recovery. This underestimates the significant potential thrombotic complications, notably amputation or other loss of function, which would increase the number of QALYs saved by using enoxaparin. The inclusion of these complications would only strengthen this finding. Finally, we assumed equal efficacy for heparin and enoxaparin. The inclusion of superior efficacy of enoxaparin in subpopulations of medical inpatients would again only strengthen this finding.
Apart from the price of the medication, the incidence of HIT had the largest impact on costs and QALYs saved in the sensitivity analysis. Studies specific to VTE prophylaxis in medical inpatients could better define the incidence of HIT/T in this population, but this would not change our overall finding.
From an institutional perspective, the choice of heparin or enoxaparin is more complicated. In most but not all scenarios, the use of heparin appears to be more financially attractive. The prices of enoxaparin and heparin, the additional length of stay required to care for patients with HIT and HITT, and the percentage of total beds occupied all affect this decision. Several pieces of cost data, specifically those related to medication and laboratory testing, were specific to an MIHCS health care system, the type considered in the analysis and could potentially limit the applicability of this study to other institutions. However, the sensitivity analysis demonstrated that the cost of enoxaparin would have to be at least 60% lower, below $33/day, before affecting our conclusion, and then only if an institution were at full capacity. Thus, we expect that our results are generally applicable.
The potential limitations of this study are related to the assumptions required. However, our efficacy assumptions were conservatively based on published data. It is possible that a decrease in the rate of thrombosis if all cases of HIT were treated with argatroban could affect our findings. However, in the study by Lewis et al., the complication rate for those with HIT in the treatment group was 28% (versus 38.8% in the untreated group), consistent with rates used in our sensitivity analysis. DRG and physician reimbursements are based on published Medicare data. The greatest variation is likely to be in drug cost, as different institutions may negotiate lower prices. From a payer perspective, drug costs do not affect the conclusions; from an institutional perspective, drug cost may make the choice a complicated one. One factor not included in our analysis that may affect this decision is the possible impact of legal action on the medications institutions choose for VTE prophylaxis. Because the potential consequences of HITT can be so devastating, an institution could have difficulty defending the choice of heparin when an equally effective alternative with fewer adverse events was available. A settlement of $1 million could potentially pay for prophylaxis with enoxaparin for at least 2500 patients.
This analysis has highlighted one of the unfortunate paradoxes caused by the different, potentially competing incentives in our health care system. Payers and institutions often face different financial incentives. From a hospital's perspective, it may cost less to use an intervention that can potentially cause a greater number of complications and higher payer costs. We believe that for VTE prophylaxis for medical inpatients, improved patient outcomes coupled with decreased payer/societal costs argue strongly for the use of enoxaparin over unfractionated heparin and outweigh any institutional benefits.
- ,,, et al.A comparison of enoxaparin with placebo for the prevention of venous thromboembolism in acutely ill medical patients.N Eng J Med.1999;322:793–800.
- .Recommendations for prophylaxis of venous thromboembolism: International consensus and the American College of Chest Physicians Fifth Consensus Conference on Antithrombotic therapy.Curr Opin Pulm Med.2000;6:314–320.
- ,,, et al.Risk factors for venous thromboembolism in hospitalized patients with acute medical illness: analysis of the MEDENOX study.Arch Intern Med.2004;164:963–968.
- .Heparin–induced thrombocytopenia: pathogenesis and management.Br J Haematology.1003;121:535–555.
- .Heparin–induced thrombocytopenia diagnosis and management.Circulation.2004;110:e454–e458.
- .New approaches to the diagnosis of heparin–induced thrombocytopenia.Chest.2005;27(2 suppl):35S–45S.
- ,,, et al.Randomized comparison of enoxaparin with unfractionated heparin for the prevention of venous thromboembolism in medical patients with heart failure or severe respiratory disease.Am Heart J.2003;145:614–621.
- ,.Cost–effectiveness analysis of deep vein thrombosis prophylaxis in internal medicine patients.Thrombosis Res.1999;94:65–68.
- ,.,.Cost effectiveness of thromboprophylaxis with low–molecular–weight heparin versus unfractionated heparin in acutely ill medical inpatients.Am J Manag Care.2004;10:632–642.
- ,,, et al.Economic assessment of low–molecular–weight heparin (enoxaparin) versus unfractionated heparin in acute coronary syndrome patients: results from the ESSENCE Randomized Trial.Circulation.1998;97:1702–1707.
- ,, et al.Management of acute proximal deep vein thrombosis: pharmacoeconomic evaluation of outpatient treatment with enoxaparin vs inpatient treatment with unfractionated heparin.Chest.2002;122(1);108–114.
- ,,, et al.Prevention of deep–vein thrombosis following total hip replacement surgery with enoxaparin versus unfractionated heparin: a pharmacoeconomic evaluation.Ann Pharmacother.1994:28(2):271–275.
- ,.Cost–effectiveness of prolonged out–of–hospital prophylaxis with low–molecular–weight heparin following total hip replacement.Haemostasis.2000;30(suppl 2):130–135.
- ,,, et al.Cost effectiveness of a low–molecular–weight heparin in prolonged prophylaxis against deep vein thrombosis after total hip replacement.Pharmacoeconomics.1998;13:81–89.
- ,,, et al.Economic analysis of low–dose heparin vs the low–molecular–weight heparin enoxaparin for prevention of venous thromboembolism after colorectal surgery.Arch Intern Med.1999;159:1221–1228.
- .High risk of the critically ill for venous thromboembolism.Crit Care Med.1982;10:448–450.
- ,,, et al.Prevention of deep vein thrombosis in medical patients by low dose heparin.Scott Med J.1981;26:115–117.
- ,,, et al.Prevalence and prevention of deep venous thrombosis of the lower extremities in high–risk pulmonary patients.Angiology.1988;39:505–513.
- ,,, et al.A double–blind randomized trial of ORG 10172 low–molecular weight heparinoid versus unfractionated heparin in the prevention of deep venous thrombosis in patients with thrombotic stroke.Thromb Haemost.1991;65(suppl):753.
- ,,, et al.A double–blind and randomized placebo controlled trial of low molecular weight heparin once daily to prevent deep vein thrombosis in acute ischemic stroke.Semin Thromb Hemost.1990;16(suppl):25–33.
- ,,, et al.The incidence of heparin–induced thrombocytopenia in hospitalized medical patients treated with subcutaneous unfractionated heparin: a prospective cohort study.Blood.2003;101:2955–2959.
- ,,, et al.Heparin–induced thrombocytopenia in neurologic disease treated with unfractionated heparin.Neurology.2004;62:657–659.
- ,,, et al.Subcutaneous heparin versus low–molecular–weight heparin as thromboprophylaxis in patients undergoing colorectal surgery.Ann Surg2001;233:438–44.
- ,,, et al.Heparin–induced thrombocytopenia inpatients treated with low–molecular weight heparin or unfractionated heparin.N Eng J Med.1995;332:1330–1335.
- ,,, et al.An improved definition of heparin–induced thrombocytopenia in postoperative orthopedic patients.Arch Intern Med.2003;163:2518–2524.
- ,,, et al.Impact of patient population on the risk for heparin–induced thrombocytopenia.Blood.2000;96:1703–1708.
- ,,, et al.Heparin–induced thrombocytopenia and thrombosis: incidence, analysis of risk factors, and clinical outcomes in 108 consecutive patients treated at a single institution.Am J Hematol.1997;56(1):12–16.
- .., et al.Argatroban anticoagulation in patients with heparin–induced thrombocytopenia.Arch Intern Med.2003:163:1849–1856.
- ,,, et al.Antibodies to platelet factor 4–heparin after cardiopulmonary bypass in patients anticoagulated with unfractionated heparin or a low–molecular–weight heparin: clinical implications for heparin–induced thrombocytopenia.Circulation.1999;99:2530–2536.
- ,,, et.Al. Argatroban anticoagulant therapy in patients with heparin–induced thrombocytopenia.Circulation.2001;103:1838–1843.
- ,.A 14 year study of heparin–induced thrombocytopenia.Am J Med.1996;101:502–507.
- ,,, et al.Failure of early heparin cessation as treatment for heparin–induced thrombocytopenia.Am J Med.1999;106:629–635.
- CEA Registry,Harvard Center for Risk Analysis. Available at: http://www.hcra.harvard.edu/pdf/preferencescores.pdf.
- .Temporal aspects of heparin–induced thrombocytopenia.N Eng J Med.2001;344:1286–1292.
- National Center for Health Statistics. Available at: http://www.cdc.gov/nchs/.
- Centers for Medicare and Medicaid Services. Available at: http://www.cms.hhs.gov/.
Copyright © 2006 Society of Hospital Medicine
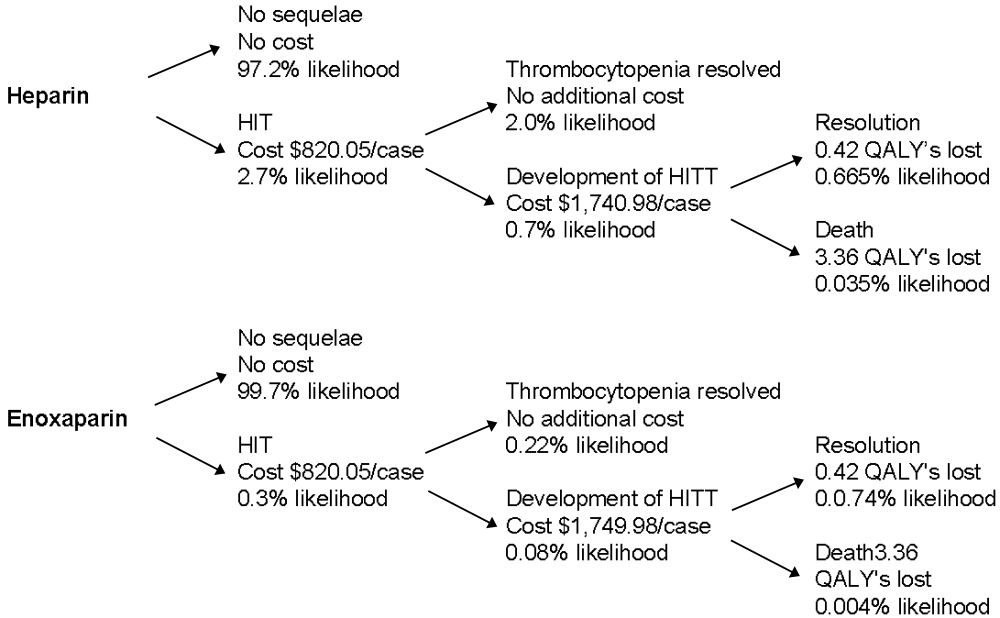
Editorial
People willingly believe what they wish.
Chinese fortune cookie
Being a hospitalist provides us with many rewards in life: a secure job, decent income, intellectually stimulating experiences at work, and gratification from helping the patients we encounter. Importantly, without patients none of this would be possible. Their role in our work lives and their personal experience in the hospital vary dramatically from ours, and that experience may be relatively invisible to many of us. Be honesthave you fully recognized the apprehension and even terror experienced by some patients when nightfall sweeps through the hospital wards and the commotion and attention of the day shift dissipates?1 Have you been fully aware of the desperate need of patients or their family members for timely communication of understandable information in the midst of critical illness?2 We willingly believe what we wishpatients and their families are having a comforting experience while hospitalized, and we are doing wonderful jobs as hospitalists caring for them. However, the lay press indicates that the patient's perception may differ radically from this reassuring point of view.3
To comprehend fully the hospital experience of patients and their families, we can benefit from them telling us their stories. The narrative stories from a patient1 and the wife of a patient2 clearly convey the apprehension and fear both patients and their loved ones suffer. Without this appreciation, we cannot empathetically deliver the care patients deserve. Not surprisingly, as medical technology guides physicians to focus more on the disease instead of the person, a backlash of an increasing emphasis on patient‐centered care is emerging.4, 5 Through short essays on illuminating experiences of physicians, patients, or families of patients, I hope to bring the patient's perspective to the forefront of hospital medicine care. View from the Hospital Bed can educate us about patients' perspectives on the experience of being hospitalized. We can also learn from the families of patients in View from the Hospital Room. The next time you recognize that a patient or family member has a potent story to tell (good or bad), encourage them to send it to us at the Journal of Hospital Medicine.
For the secret of the care of the patient is in caring for the patient.
Francis W. Peabody, MD
October 21, 1925
- .Uncharted waters.J Hosp Med.2006;1:136–137.
- .Hospitals foreign soil for those who don't work there.J Hosp Med.1006;1:70–72.
- .In the hospital, a degrading shift from person to patient.New York Times. Aug. 16,2005.
- .Towards a global definition of patient centred care.Br Med J.2001;322:444–445.
- ,.Engaging patients in medical decision making.Br Med J.2001;323:584–585.
People willingly believe what they wish.
Chinese fortune cookie
Being a hospitalist provides us with many rewards in life: a secure job, decent income, intellectually stimulating experiences at work, and gratification from helping the patients we encounter. Importantly, without patients none of this would be possible. Their role in our work lives and their personal experience in the hospital vary dramatically from ours, and that experience may be relatively invisible to many of us. Be honesthave you fully recognized the apprehension and even terror experienced by some patients when nightfall sweeps through the hospital wards and the commotion and attention of the day shift dissipates?1 Have you been fully aware of the desperate need of patients or their family members for timely communication of understandable information in the midst of critical illness?2 We willingly believe what we wishpatients and their families are having a comforting experience while hospitalized, and we are doing wonderful jobs as hospitalists caring for them. However, the lay press indicates that the patient's perception may differ radically from this reassuring point of view.3
To comprehend fully the hospital experience of patients and their families, we can benefit from them telling us their stories. The narrative stories from a patient1 and the wife of a patient2 clearly convey the apprehension and fear both patients and their loved ones suffer. Without this appreciation, we cannot empathetically deliver the care patients deserve. Not surprisingly, as medical technology guides physicians to focus more on the disease instead of the person, a backlash of an increasing emphasis on patient‐centered care is emerging.4, 5 Through short essays on illuminating experiences of physicians, patients, or families of patients, I hope to bring the patient's perspective to the forefront of hospital medicine care. View from the Hospital Bed can educate us about patients' perspectives on the experience of being hospitalized. We can also learn from the families of patients in View from the Hospital Room. The next time you recognize that a patient or family member has a potent story to tell (good or bad), encourage them to send it to us at the Journal of Hospital Medicine.
For the secret of the care of the patient is in caring for the patient.
Francis W. Peabody, MD
October 21, 1925
- .Uncharted waters.J Hosp Med.2006;1:136–137.
- .Hospitals foreign soil for those who don't work there.J Hosp Med.1006;1:70–72.
- .In the hospital, a degrading shift from person to patient.New York Times. Aug. 16,2005.
- .Towards a global definition of patient centred care.Br Med J.2001;322:444–445.
- ,.Engaging patients in medical decision making.Br Med J.2001;323:584–585.
Bluebonnet Revisited

Editor’s note: It has been several years since the story you are about to read took place, but my experiences as a hospitalist have given me a new perspective to this bittersweet tale.
My wife and I never contemplated a future without her. She was a part of our new family. Aside from a few rough black spots that needed to be removed, she seemed in perfect shape. She had been at our wedding, and we had spent countless days sunning on the beach and taking long drives with her through the Texas Hill Country spotting wildflowers. The Hill Country is where she got her nickname. Everyone called her Bluebonnet; the name just seemed to fit her. She brought special meaning to the number 69. People who saw her would just stop and wave. We were proud to be seen with her.
I left the house one fateful morning and found her in the street, motionless. I did everything I could to get her to move. I was sure she was dead. I could not get her to turn over. I ran inside and called for help. It seemed like forever until I could get someone on the phone. It was not long until the emergency vehicle arrived. A few quick maneuvers were made to get her going, but the efforts seemed doomed to failure. My wife and I watched sadly as she was carried away. Driving behind those eerie flashing lights, not a word was spoken.

We spent forever in a cheerless waiting room with antiquated magazines and lukewarm bitter coffee. The television mounted high on the wall blared a moronic game show. Imagining the worst-case scenario was far scarier than knowing the truth. Finally, a young man came to talk to us. His uniform was splattered with stains, and he looked like he hadn’t slept in a few days. He bellowed our name across the waiting room. I guessed there would be no privacy here.
He said that Bluebonnet was not going anywhere soon. He mentioned something about giving fluids and checking levels, but we did not understand the terminology. He said a specimen of fluid looked milky and the differential seemed abnormal and a pressure measurement was high. Was this supposed to mean something to us? He talked so fast, and no matter whether you know the lingo or not, when it’s a loved one it’s hard to concentrate.
Another hour went by. I stared at the receptionist, but she would not let me catch her eye. Sometime later, another man came out to meet with us. He wore a clean uniform and looked less harried. He said he was a Specialist in this kind of problem. What kind of problem was unclear to me. He never told us his name.
He started with the good news. He told us that Bluebonnet was responding now, that her balance was good, though her joints were worn out and that she had no gross motor abnormalities. It could be a disk problem, but probably not. This all seemed like good news. But then came the kicker; he had heard something strange during his evaluation. It was an odd rumbling sound and the Specialist wanted another opinion. He wanted the Expert.
By now we had accepted the fact that we were not going anywhere. We had been absorbed into the system, a fixture in the waiting room. Another set of pale faces was now illuminated by the television screen, searching for information, hoping for good news, but not expecting it. The coffee was starting to seem not that bad.
When the Expert came out he was friendly and invited us to watch while he made his comprehensive evaluation. He seemed thorough and competent. He did not ask us any questions; perhaps his colleagues had filled him in. Bluebonnet was not going to be doing any talking, that was obvious. The Expert’s nonchalant demeanor evaporated as he pulled his hand out from beneath her, his finger covered in something black and tarry. He suggested more testing and hooked her up to an erratically beeping monitor. He told us that his evaluation might take a while, and perhaps we should leave. He would call us when he had a better picture of what was going on. We sadly trudged home.
When we returned the next day we met with the Expert again. He said he had found the problem. Bluebonnet needed her valve replaced. As best I could understand it, there were two problems: The valve would not open completely so flow was obstructed, and the valve would not close completely either. I put my head on my wife’s more stoic shoulder and began to cry. We were not ready to make this kind of decision; Bluebonnet seemed too old for a procedure this aggressive.
We reminisced about the good times and the bad. We considered the cost and risks. There was no guarantee that a valve replacement would do the trick. A time comes in existence when the good memories can outweigh common sense. In the end, however, I had them remove her from the monitors. I drove her home, not knowing what to expect.
The next month was fairly quiet. I made sure she was turned over as much as possible. There were no problems, but she barely went out. It seemed like she was missing her usual spark. One warm Sunday, with much trepidation, I took her shopping. Half way to the mall she started to cough, then shook uncontrollably. I looked frantically around; what would I do if she died right in the street? I was in luck however, there was a small facility right on the corner and I nervously pulled into the entrance.
It was a small, private place. A few friends had gone there and were pleased with the results. It was run by an efficient young woman who immediately helped us. She ran the facility on her own—no big corporation telling her what to do and monitoring her bottom line. She listened to the whole story, and checked out Bluebonnet thoroughly. She patted Bluebonnet affectionately; you could tell she cared. She smiled as she told us that the new valve would last for years. It was not the valve at all, only bad gas.
We had several more years with her, and then she was gone. But we never forgot our time with our 1969 Cadillac convertible, Bluebonnet.
Rust in peace. TH
Jamie Newman, MD, FACP, is the physician editor of The Hospitalist, consultant, Hospital Internal Medicine, and assistant professor of internal medicine and medical history, Mayo Clinic College of Medicine, Rochester, Minn.
Editor’s note: It has been several years since the story you are about to read took place, but my experiences as a hospitalist have given me a new perspective to this bittersweet tale.
My wife and I never contemplated a future without her. She was a part of our new family. Aside from a few rough black spots that needed to be removed, she seemed in perfect shape. She had been at our wedding, and we had spent countless days sunning on the beach and taking long drives with her through the Texas Hill Country spotting wildflowers. The Hill Country is where she got her nickname. Everyone called her Bluebonnet; the name just seemed to fit her. She brought special meaning to the number 69. People who saw her would just stop and wave. We were proud to be seen with her.
I left the house one fateful morning and found her in the street, motionless. I did everything I could to get her to move. I was sure she was dead. I could not get her to turn over. I ran inside and called for help. It seemed like forever until I could get someone on the phone. It was not long until the emergency vehicle arrived. A few quick maneuvers were made to get her going, but the efforts seemed doomed to failure. My wife and I watched sadly as she was carried away. Driving behind those eerie flashing lights, not a word was spoken.
We spent forever in a cheerless waiting room with antiquated magazines and lukewarm bitter coffee. The television mounted high on the wall blared a moronic game show. Imagining the worst-case scenario was far scarier than knowing the truth. Finally, a young man came to talk to us. His uniform was splattered with stains, and he looked like he hadn’t slept in a few days. He bellowed our name across the waiting room. I guessed there would be no privacy here.
He said that Bluebonnet was not going anywhere soon. He mentioned something about giving fluids and checking levels, but we did not understand the terminology. He said a specimen of fluid looked milky and the differential seemed abnormal and a pressure measurement was high. Was this supposed to mean something to us? He talked so fast, and no matter whether you know the lingo or not, when it’s a loved one it’s hard to concentrate.
Another hour went by. I stared at the receptionist, but she would not let me catch her eye. Sometime later, another man came out to meet with us. He wore a clean uniform and looked less harried. He said he was a Specialist in this kind of problem. What kind of problem was unclear to me. He never told us his name.
He started with the good news. He told us that Bluebonnet was responding now, that her balance was good, though her joints were worn out and that she had no gross motor abnormalities. It could be a disk problem, but probably not. This all seemed like good news. But then came the kicker; he had heard something strange during his evaluation. It was an odd rumbling sound and the Specialist wanted another opinion. He wanted the Expert.
By now we had accepted the fact that we were not going anywhere. We had been absorbed into the system, a fixture in the waiting room. Another set of pale faces was now illuminated by the television screen, searching for information, hoping for good news, but not expecting it. The coffee was starting to seem not that bad.
When the Expert came out he was friendly and invited us to watch while he made his comprehensive evaluation. He seemed thorough and competent. He did not ask us any questions; perhaps his colleagues had filled him in. Bluebonnet was not going to be doing any talking, that was obvious. The Expert’s nonchalant demeanor evaporated as he pulled his hand out from beneath her, his finger covered in something black and tarry. He suggested more testing and hooked her up to an erratically beeping monitor. He told us that his evaluation might take a while, and perhaps we should leave. He would call us when he had a better picture of what was going on. We sadly trudged home.
When we returned the next day we met with the Expert again. He said he had found the problem. Bluebonnet needed her valve replaced. As best I could understand it, there were two problems: The valve would not open completely so flow was obstructed, and the valve would not close completely either. I put my head on my wife’s more stoic shoulder and began to cry. We were not ready to make this kind of decision; Bluebonnet seemed too old for a procedure this aggressive.
We reminisced about the good times and the bad. We considered the cost and risks. There was no guarantee that a valve replacement would do the trick. A time comes in existence when the good memories can outweigh common sense. In the end, however, I had them remove her from the monitors. I drove her home, not knowing what to expect.
The next month was fairly quiet. I made sure she was turned over as much as possible. There were no problems, but she barely went out. It seemed like she was missing her usual spark. One warm Sunday, with much trepidation, I took her shopping. Half way to the mall she started to cough, then shook uncontrollably. I looked frantically around; what would I do if she died right in the street? I was in luck however, there was a small facility right on the corner and I nervously pulled into the entrance.
It was a small, private place. A few friends had gone there and were pleased with the results. It was run by an efficient young woman who immediately helped us. She ran the facility on her own—no big corporation telling her what to do and monitoring her bottom line. She listened to the whole story, and checked out Bluebonnet thoroughly. She patted Bluebonnet affectionately; you could tell she cared. She smiled as she told us that the new valve would last for years. It was not the valve at all, only bad gas.
We had several more years with her, and then she was gone. But we never forgot our time with our 1969 Cadillac convertible, Bluebonnet.
Rust in peace. TH
Jamie Newman, MD, FACP, is the physician editor of The Hospitalist, consultant, Hospital Internal Medicine, and assistant professor of internal medicine and medical history, Mayo Clinic College of Medicine, Rochester, Minn.
Hospital Med in the Land of Rocky Top
If a busy doctor is a happy doctor, then the hospitalists in the Methodist Medical Group at Methodist Hospital in Oak Ridge, Tenn., are ecstatic. Chris Frost, MD, the hospital medicine group’s chief hospitalist and medical director, has seen the group’s average daily census climb to 70, then 90, and now 100 patients. Fortunately, the group is growing, too, from nine full-time employees in late October 2005 to 12 before year-end, a projection for 15 by first quarter 2006, and several intensivists to help by March.
The hospital itself has grown as well: It’s in the midst of a $40 million renovation and expansion started in 2004. By August 2006, Methodist Medical will have 230 new private rooms, 12 beds in a new acute care unit, and an emergency department twice the size of its predecessor.

—Chris Frost, MD
How It Started
Methodist Medical Group has been shaped by Oak Ridge’s traditions and demographics. Nestled between the Great Smokey and Cumberland Mountains, Oak Ridge was one of three research and production sites for the Manhattan Project (an effort by the United States, in conjunction with Canada and the United Kingdom to develop nuclear weapons). At its height, Oak Ridge had 75,000 inhabitants. Now its population is 28,000, with a Medicare age group that comprises 42% more of its population than the average Tennessee city. It continues as a magnet for scientists, and its physicians—both office-based and hospitalists—form a close-knit community.

Given its dynamics and demographics, when Oak Ridge’s primary care physicians asked Methodist Hospital in 1993 for help in admitting their patients, the hospital responded affirmatively. Hospital President Jan McNally, BSN, MHA, recalls how things unfolded. “Dr. Richard Dew, a highly respected primary practice physician with a busy office, wanted to change his life. His son had died and he decided to close his office, but he wanted to stay in medicine in Oak Ridge. He agreed to practice inpatient medicine at Methodist,” she explains. “The beauty of it was that he was universally respected. Barriers to the program fell because the admitting doctors and the patients all knew him.”
When Dr. Dew retired in 2002, Anthony Garton, MD, who closed his solo practice to join Dr. Dew as Methodist’s second hospitalist, stayed on. Dr. Garton became a hospitalist because “office procedures just brought me to break even financially. Only the things I did that didn’t have office overhead, such as being medical director at a nursing home and doing physicals for Boeing, made sense financially.” Dr. Garton, who worked with a nephrology group for 13 years, made a smooth transition to a hospitalist career.
From the hospitalist program’s inception, Methodist turned to Team Health, Inc., of Knoxville, an outsourcer of medical personnel, for staffing. Team Health Vice President Kenneth Burns saw a natural fit; his firm already supplied Methodist’s emergency department physicians.
“We understood the problems faced by Methodist’s ED docs,” says Burns. “Patients got stuck there and couldn’t be admitted rapidly to inpatient floors.”
He identified the hospitalist’s necessary skills as an ability to cooperate with community physicians, and an interest in improving processes to boost care quality and decrease costs. Methodist’s hospitalists have been independent contractors since the program’s inception. They receive hourly wages plus incentives based on productivity and metrics negotiated with hospital administrators.
Team Health recently rethought the model as potential recruits balked. In 2006 Methodist’s hospitalists became employees, with health benefits and defined contribution plans. Hospitalist Helen Bidawid, MD, says being employees improves recruiting because many doctors—particularly those just out of residency—find getting loans, buying health insurance, and other business associated with independent contractor status troublesome.
Symbiosis

The relationship of Methodist’s hospitalist program to Oak Ridge’s community physicians has changed over the years. Early on the group hired a hospitalist Dr. Garton describes as “very bright, knew his medicine, and would wow them in academia, but he antagonized the local docs. He left after one year and that was good because our census got low.”
Tact wasn’t that hospitalist’s long suit, and the community doctors who were uncomfortable with him didn’t refer many patients to the hospitalists. With the odd man out, hiring new hospitalists such as Joel Perkerson, MD, put the program back on track.

Dr. Perkerson left an office practice he had been in for 12 years. “I was drowning in paperwork, and it was so frustrating,” he says. “I couldn’t get my homework done or help my son, who was struggling academically.”
Having been both an office- and a hospital-based physician in Oak Ridge, he says it’s too hectic to do both. Being a hospitalist is challenging enough.
“It’s like the movie ‘Field of Dreams.’ Build it, and they will come. Demand keeps growing for our services and we all work a lot of hours,” he says, crediting the increasing load both to Dr. Frost’s leadership, which has made the subspecialists comfortable with the hospitalists’ management of medically complex patients, and to ex-TennCare patients flooding the emergency department. (See “When Politics Collide with Healthcare,” p. 38.)
Under Dr. Frost’s direction (he took over as medical director in 2003 after being recruited as assistant medical director), the hospitalist program has thrived. Dr. Frost has built relationships with Oak Ridge’s subspecialists, particularly pulmonologists, hematologists, oncologists, gastroenterologists, and orthopedists. Typical of Dr. Frost’s leadership is his response to Oak Ridge’s only pulmonary group imploding from six physicians to two. The hospitalists now admit all the group’s patients and Dr. Frost worked with Team Health to recruit intensivists for those very ill patients.
“I’m very pleased with the growth of the hospitalist program,” says Dr. Frost. “We feel empowered that more and more primary care doctors and subspecialists are allowing us to admit and take an active role in managing their patients.”
Tackling one problem that has bedeviled other hospitalist programs, Jan McNally has added a mechanism to ensure cooperation from referring doctors. She expects referring subspecialists to come for consults ASAP when a hospitalist calls.
“We must have that commitment from specialists,” she says. “We have about 15 percent who are laggards, but we will impose disciplinary action if they don’t come when called.”
Dr. Frost favors specialists willing to turn their patients over to the hospitalists in order to improve care quality. He diligently writes care guidelines, focuses on core measures, has deepened discussion of end-of-life care issues, and built such strong esprit de corps that the hospitalists willingly work long and irregular schedules until more physicians arrive. Helen Bidawid, MD, who has been a Methodist hospitalist for about a year, enjoys the hospitalist group, doesn’t mind pitching in to support her colleagues, and says “we function very well together. We watch out for all of our patients, share our responsibilities, and ask each other for help.”
Dr. Bidawid, who was in a non-supportive hospitalist group before her current position, asked herself before she arrived at Methodist: “’Will I be nurtured here or thrown to the wolves?’ Fortunately, I found a very supportive environment.”
With the course set, Dr. Frost still has challenges ahead. There’s growing patient volume, more complex cases to co-manage, carve-outs such as cardiology, neurology, and stroke care, and TennCare disenrollees to contend with.
“Our goal is to add value to Methodist Medical Center,” he says. “As a 24/7 hospitalist program, we help the medical community to be more profitable by enabling them to see more patients in the office and doing more procedures in the hospital. Better communication between physicians, patients, and their families benefits everyone and, we hope, will grow Methodist’s market share.” TH
Marlene Piturro is based in New York.
Quality Counts

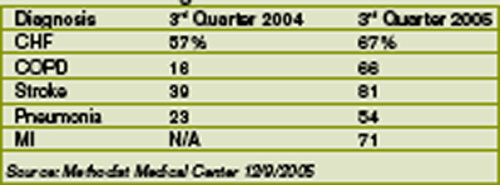
Methodist Medical ranks #1 in Tennessee on its compliance with Medicare core measures. Coletta Manning, RN, MHA, Methodist’s director of outcomes management, provided these data to show how they did it: (Table 1)
Manning cites this caveat in interpreting the data: When a patient is admitted and a diagnosis associated with a core measure is not made until the second day of hospitalization, the case isn’t considered in compliance. An example is abdominal pain that on further examination turns out to be caused by a myocardial infarction. If that were the case, the core measure of giving aspirin immediately would not be met because the diagnosis was not made within the first 24 hours of admission. “We get dinged sometimes,” says Manning.
Internally, the hospitalists measure their performance on compliance with the group’s own care design (critical pathway) utilization. Dr. Frost is pleased with the hospitalists’ growing acceptance of care designs and is working with Team Health on a sophisticated computer system to help the hospitalists use
If a busy doctor is a happy doctor, then the hospitalists in the Methodist Medical Group at Methodist Hospital in Oak Ridge, Tenn., are ecstatic. Chris Frost, MD, the hospital medicine group’s chief hospitalist and medical director, has seen the group’s average daily census climb to 70, then 90, and now 100 patients. Fortunately, the group is growing, too, from nine full-time employees in late October 2005 to 12 before year-end, a projection for 15 by first quarter 2006, and several intensivists to help by March.
The hospital itself has grown as well: It’s in the midst of a $40 million renovation and expansion started in 2004. By August 2006, Methodist Medical will have 230 new private rooms, 12 beds in a new acute care unit, and an emergency department twice the size of its predecessor.
—Chris Frost, MD
How It Started
Methodist Medical Group has been shaped by Oak Ridge’s traditions and demographics. Nestled between the Great Smokey and Cumberland Mountains, Oak Ridge was one of three research and production sites for the Manhattan Project (an effort by the United States, in conjunction with Canada and the United Kingdom to develop nuclear weapons). At its height, Oak Ridge had 75,000 inhabitants. Now its population is 28,000, with a Medicare age group that comprises 42% more of its population than the average Tennessee city. It continues as a magnet for scientists, and its physicians—both office-based and hospitalists—form a close-knit community.
Given its dynamics and demographics, when Oak Ridge’s primary care physicians asked Methodist Hospital in 1993 for help in admitting their patients, the hospital responded affirmatively. Hospital President Jan McNally, BSN, MHA, recalls how things unfolded. “Dr. Richard Dew, a highly respected primary practice physician with a busy office, wanted to change his life. His son had died and he decided to close his office, but he wanted to stay in medicine in Oak Ridge. He agreed to practice inpatient medicine at Methodist,” she explains. “The beauty of it was that he was universally respected. Barriers to the program fell because the admitting doctors and the patients all knew him.”
When Dr. Dew retired in 2002, Anthony Garton, MD, who closed his solo practice to join Dr. Dew as Methodist’s second hospitalist, stayed on. Dr. Garton became a hospitalist because “office procedures just brought me to break even financially. Only the things I did that didn’t have office overhead, such as being medical director at a nursing home and doing physicals for Boeing, made sense financially.” Dr. Garton, who worked with a nephrology group for 13 years, made a smooth transition to a hospitalist career.
From the hospitalist program’s inception, Methodist turned to Team Health, Inc., of Knoxville, an outsourcer of medical personnel, for staffing. Team Health Vice President Kenneth Burns saw a natural fit; his firm already supplied Methodist’s emergency department physicians.
“We understood the problems faced by Methodist’s ED docs,” says Burns. “Patients got stuck there and couldn’t be admitted rapidly to inpatient floors.”
He identified the hospitalist’s necessary skills as an ability to cooperate with community physicians, and an interest in improving processes to boost care quality and decrease costs. Methodist’s hospitalists have been independent contractors since the program’s inception. They receive hourly wages plus incentives based on productivity and metrics negotiated with hospital administrators.
Team Health recently rethought the model as potential recruits balked. In 2006 Methodist’s hospitalists became employees, with health benefits and defined contribution plans. Hospitalist Helen Bidawid, MD, says being employees improves recruiting because many doctors—particularly those just out of residency—find getting loans, buying health insurance, and other business associated with independent contractor status troublesome.
Symbiosis
The relationship of Methodist’s hospitalist program to Oak Ridge’s community physicians has changed over the years. Early on the group hired a hospitalist Dr. Garton describes as “very bright, knew his medicine, and would wow them in academia, but he antagonized the local docs. He left after one year and that was good because our census got low.”
Tact wasn’t that hospitalist’s long suit, and the community doctors who were uncomfortable with him didn’t refer many patients to the hospitalists. With the odd man out, hiring new hospitalists such as Joel Perkerson, MD, put the program back on track.
Dr. Perkerson left an office practice he had been in for 12 years. “I was drowning in paperwork, and it was so frustrating,” he says. “I couldn’t get my homework done or help my son, who was struggling academically.”
Having been both an office- and a hospital-based physician in Oak Ridge, he says it’s too hectic to do both. Being a hospitalist is challenging enough.
“It’s like the movie ‘Field of Dreams.’ Build it, and they will come. Demand keeps growing for our services and we all work a lot of hours,” he says, crediting the increasing load both to Dr. Frost’s leadership, which has made the subspecialists comfortable with the hospitalists’ management of medically complex patients, and to ex-TennCare patients flooding the emergency department. (See “When Politics Collide with Healthcare,” p. 38.)
Under Dr. Frost’s direction (he took over as medical director in 2003 after being recruited as assistant medical director), the hospitalist program has thrived. Dr. Frost has built relationships with Oak Ridge’s subspecialists, particularly pulmonologists, hematologists, oncologists, gastroenterologists, and orthopedists. Typical of Dr. Frost’s leadership is his response to Oak Ridge’s only pulmonary group imploding from six physicians to two. The hospitalists now admit all the group’s patients and Dr. Frost worked with Team Health to recruit intensivists for those very ill patients.
“I’m very pleased with the growth of the hospitalist program,” says Dr. Frost. “We feel empowered that more and more primary care doctors and subspecialists are allowing us to admit and take an active role in managing their patients.”
Tackling one problem that has bedeviled other hospitalist programs, Jan McNally has added a mechanism to ensure cooperation from referring doctors. She expects referring subspecialists to come for consults ASAP when a hospitalist calls.
“We must have that commitment from specialists,” she says. “We have about 15 percent who are laggards, but we will impose disciplinary action if they don’t come when called.”
Dr. Frost favors specialists willing to turn their patients over to the hospitalists in order to improve care quality. He diligently writes care guidelines, focuses on core measures, has deepened discussion of end-of-life care issues, and built such strong esprit de corps that the hospitalists willingly work long and irregular schedules until more physicians arrive. Helen Bidawid, MD, who has been a Methodist hospitalist for about a year, enjoys the hospitalist group, doesn’t mind pitching in to support her colleagues, and says “we function very well together. We watch out for all of our patients, share our responsibilities, and ask each other for help.”
Dr. Bidawid, who was in a non-supportive hospitalist group before her current position, asked herself before she arrived at Methodist: “’Will I be nurtured here or thrown to the wolves?’ Fortunately, I found a very supportive environment.”
With the course set, Dr. Frost still has challenges ahead. There’s growing patient volume, more complex cases to co-manage, carve-outs such as cardiology, neurology, and stroke care, and TennCare disenrollees to contend with.
“Our goal is to add value to Methodist Medical Center,” he says. “As a 24/7 hospitalist program, we help the medical community to be more profitable by enabling them to see more patients in the office and doing more procedures in the hospital. Better communication between physicians, patients, and their families benefits everyone and, we hope, will grow Methodist’s market share.” TH
Marlene Piturro is based in New York.
Quality Counts
Methodist Medical ranks #1 in Tennessee on its compliance with Medicare core measures. Coletta Manning, RN, MHA, Methodist’s director of outcomes management, provided these data to show how they did it: (Table 1)
Manning cites this caveat in interpreting the data: When a patient is admitted and a diagnosis associated with a core measure is not made until the second day of hospitalization, the case isn’t considered in compliance. An example is abdominal pain that on further examination turns out to be caused by a myocardial infarction. If that were the case, the core measure of giving aspirin immediately would not be met because the diagnosis was not made within the first 24 hours of admission. “We get dinged sometimes,” says Manning.
Internally, the hospitalists measure their performance on compliance with the group’s own care design (critical pathway) utilization. Dr. Frost is pleased with the hospitalists’ growing acceptance of care designs and is working with Team Health on a sophisticated computer system to help the hospitalists use