User login
Laboratory tests in rheumatology: A rational approach
Laboratory tests are often ordered inappropriately for patients in whom a rheumatologic illness is suspected; this occurs in both primary and secondary care.1 Some tests are available both singly and as part of a battery of tests screening healthy people without symptoms.
The problem: negative test results are by no means always reassuring, and false-positive results raise the risks of unnecessary anxiety for patients and clinicians, needless referrals, and potential morbidity due to further unnecessary testing and exposure to wrong treatments.2 Clinicians should be aware of the pitfalls of these tests in order to choose them wisely and interpret the results correctly.
This article provides practical guidance on requesting and interpreting some common tests in rheumatology, with the aid of case vignettes.
RHEUMATOID FACTOR AND ANTICITRULLINATED PEPTIDE ANTIBODY
A 41-year-old woman, previously in good health, presents to her primary care practitioner with a 6-week history of pain and swelling in her hands and early morning stiffness lasting about 2 hours. She denies having any extraarticular symptoms. Physical examination reveals synovitis across her right metacarpophalangeal joints, proximal interphalangeal joint of the left middle finger, and left wrist. The primary care physician is concerned that her symptoms might be due to rheumatoid arthritis.
Would testing for rheumatoid factor and anticitrullinated peptide antibody be useful in this patient?
Rheumatoid factor is an antibody (immunoglobulin M, IgG, or IgA) targeted against the Fc fragment of IgG.3 It was so named because it was originally detected in patients with rheumatoid arthritis, but it is neither sensitive nor specific for this condition. A meta-analysis of more than 5,000 patients with rheumatoid arthritis reported that rheumatoid factor testing had a sensitivity of 69% and specificity of 85%.4

Anticitrullinated peptide antibody, on the other hand, is much more specific for rheumatoid arthritis (95%), as it is seldom seen in other conditions, but its sensitivity is similar to that of rheumatoid factor (68%).4–6 A positive result would thus lend strength to the diagnosis of rheumatoid arthritis, but a negative result would not exclude it.
Approach to early arthritis
When faced with a patient with early arthritis, some key questions to ask include7,8:
Is this an inflammatory or a mechanical problem? Inflammatory arthritis is suggested by joint swelling that is not due to trauma or bony hypertrophy, early morning stiffness lasting longer than 30 minutes, and elevated inflammatory markers (erythrocyte sedimentation rate or C-reactive protein). Involvement of the small joints of the hands and feet may be suggested by pain on compression of the metacarpophalangeal and metatarsophalangeal joints, respectively.
Is there a definite identifiable underlying cause for the inflammatory arthritis? The pattern of development of joint symptoms or the presence of extraarticular symptoms may suggest an underlying problem such as gout, psoriatic arthritis, systemic lupus erythematosus, or sarcoidosis.
If the arthritis is undifferentiated (ie, there is no definite identifiable cause), is it likely to remit or persist? This is perhaps the most important question to ask in order to prognosticate. Patients with risk factors for persistent disease, ie, for development of rheumatoid arthritis, should be referred to a rheumatologist early for timely institution of disease-modifying antirheumatic drug therapy.9 Multiple studies have shown that patients in whom this therapy is started early have much better clinical, functional, and radiologic outcomes than those in whom it is delayed.10–12
The revised American College of Rheumatology and European League Against Rheumatism criteria13 include the following factors as predictors of persistence:
- Number of involved joints (with greater weight given to involvement of small joints)
- Duration of symptoms 6 weeks or longer
- Elevated acute-phase response (erythrocyte sedimentation rate or C-reactive protein level)
- A positive serologic test (either rheumatoid factor or anticitrullinated peptide antibody).
If both rheumatoid factor and anticitrullinated peptide antibody are positive in a patient with early undifferentiated arthritis, the risk of progression to rheumatoid arthritis is almost 100%, thus underscoring the importance of testing for these antibodies.5,6 Referral to a rheumatologist should, however, not be delayed in patients with negative test results (more than one-third of patients with rheumatoid arthritis may be negative for both), and should be considered in those with inflammatory joint symptoms persisting longer than 6 weeks, especially with involvement of the small joints (sparing the distal interphalangeals) and elevated acute-phase response.
Rheumatoid factor in healthy people without symptoms
In some countries, testing for rheumatoid factor is offered as part of a battery of screening tests in healthy people who have no symptoms, a practice that should be strongly discouraged.
Multiple studies, both prospective and retrospective, have demonstrated that both rheumatoid factor and anticitrullinated peptide antibody may be present several years before the clinical diagnosis of rheumatoid arthritis.6,14–16 But the risk of developing rheumatoid arthritis for asymptomatic individuals who are rheumatoid factor-positive depends on the rheumatoid factor titer, positive family history of rheumatoid arthritis in first-degree relatives, and copresence of anticitrullinated peptide antibody. The absolute risk, nevertheless, is still very small. In some, there might be an alternative explanation such as undiagnosed Sjögren syndrome or hepatitis C.
In any event, no strategy is currently available that is proven to prevent the development of rheumatoid arthritis, and there is no role for disease-modifying therapy during the preclinical phase.16
Back to our patient
Blood testing in our patient reveals normal complete blood cell counts, aminotransferase levels, and serum creatinine concentration; findings on urinalysis are normal. Her erythrocyte sedimentation rate is 56 mm/hour (reference range 0–15), and her C-reactive protein level is 26 mg/dL (normal < 3). Testing is negative for rheumatoid factor and anticitrullinated peptide antibody.
Although her rheumatoid factor and anticitrullinated peptide antibody tests are negative, she is referred to a rheumatologist because she has predictors of persistent disease, ie, symptom duration of 6 weeks, involvement of the small joints of the hands, and elevated erythrocyte sedimentation rate and C-reactive protein. The rheumatologist checks her parvovirus serology, which is negative.
The patient is given parenteral depot corticosteroid therapy, to which she responds briefly. Because her symptoms persist and continue to worsen, methotrexate treatment is started after an additional 6 weeks.
ANTINUCLEAR ANTIBODY
A 37-year-old woman presents to her primary care physician with the complaint of tiredness. She has a family history of systemic lupus erythematosus in her sister and maternal aunt. She is understandably worried about lupus because of the family history and is asking to be tested for it.
Would testing for antinuclear antibody be reasonable?
Antinuclear antibody is not a single antibody but rather a family of autoantibodies that are directed against nuclear constituents such as single- or double-stranded deoxyribonucleic acid (dsDNA), histones, centromeres, proteins complexed with ribonucleic acid (RNA), and enzymes such as topoisomerase.17,18
Protein antigens complexed with RNA and some enzymes in the nucleus are also known as extractable nuclear antigens (ENAs). They include Ro, La, Sm, Jo-1, RNP, and ScL-70 and are named after the patient in whom they were first discovered (Robert, Lavine, Smith, and John), the antigen that is targeted (ribonucleoprotein or RNP), and the disease with which they are associated (anti-ScL-70 or antitopoisomerase in diffuse cutaneous scleroderma).
Antinuclear antibody testing is commonly requested to exclude connective tissue diseases such as lupus, but the clinician needs to be aware of the following points:
Antinuclear antibody may be encountered in conditions other than lupus
These include19:
- Other autoimmune diseases such as rheumatoid arthritis, primary Sjögren syndrome, systemic sclerosis, autoimmune thyroid disease, and myasthenia gravis
- Infection with organisms that share the epitope with self-antigens (molecular mimicry)
- Cancers
- Drugs such as hydralazine, procainamide, and minocycline.
Antinuclear antibody might also be produced by the healthy immune system from time to time to clear the nuclear debris that is extruded from aging cells.
A study in healthy individuals20 reported a prevalence of positive antinuclear antibody of 32% at a titer of 1/40, 15% at a titer of 1/80, 7% at a titer of 1/160, and 3% at a titer of 1/320. Importantly, a positive result was more common among family members of patients with autoimmune connective tissue diseases.21 Hence, a positive antinuclear antibody result does not always mean lupus.
Antinuclear antibody testing is highly sensitive for lupus
With current laboratory methods, antinuclear antibody testing has a sensitivity close to 100%. Hence, a negative result virtually rules out lupus.
Two methods are commonly used to test for antinuclear antibody: indirect immunofluorescence and enzyme-linked immunosorbent assay (ELISA).22 While human epithelial (Hep2) cells are used as the source of antigen in immunofluorescence, purified nuclear antigens coated on multiple-well plates are used in ELISA.
Although ELISA is simpler to perform, immunofluorescence has a slightly better sensitivity (because the Hep2 cells express a wide range of antigens) and is still considered the gold standard. As expected, the higher sensitivity occurs at the cost of reduced specificity (about 60%), so antinuclear antibody will also be detected in all the other conditions listed above.23
To improve the specificity of antinuclear antibody testing, laboratories report titers (the highest dilution of the test serum that tested positive); a cutoff of greater than 1/80 is generally considered significant.
Do not order antinuclear antibody testing indiscriminately


To sum up, the antinuclear antibody test should be requested only in patients with involvement of multiple organ systems. Although a negative result would make it extremely unlikely that the clinical presentation is due to lupus, a positive result is insufficient on its own to make a diagnosis of lupus.
Diagnosing lupus is straightforward when patients present with a specific manifestation such as inflammatory arthritis, photosensitive skin rash, hemolytic anemia, thrombocytopenia, or nephritis, or with specific antibodies such as those against dsDNA or Sm. Patients who present with nonspecific symptoms such as arthralgia or tiredness with a positive antinuclear antibody and negative anti-dsDNA and anti-Sm may present difficulties even for the specialist.25–27
Back to our patient
Our patient denies arthralgia. She has no extraarticular symptoms such as skin rashes, oral ulcers, sicca symptoms, muscle weakness, Raynaud phenomenon, pleuritic chest pain, or breathlessness. Findings on physical examination and urinalysis are unremarkable.
Her primary care physician decides to check her complete blood cell count, erythrocyte sedimentation rate, and thyroid-stimulating hormone level. Although she is reassured that her tiredness is not due to lupus, she insists on getting an antinuclear antibody test.
Her complete blood cell counts are normal. Her erythrocyte sedimentation rate is 6 mm/hour. However, her thyroid-stimulating hormone level is elevated, and subsequent testing shows low free thyroxine and positive thyroid peroxidase antibodies. The antinuclear antibody is positive in a titer of 1/80 and negative for anti-dsDNA and anti-ENA.
We explain to her that the positive antinuclear antibody is most likely related to her autoimmune thyroid disease. She is referred to an endocrinologist.
ANTIPHOSPHOLIPID ANTIBODIES
A 24-year-old woman presents to the emergency department with acute unprovoked deep vein thrombosis in her right leg, confirmed by ultrasonography. She has no history of previous thrombosis, and the relevant family history is unremarkable. She has never been pregnant. Her platelet count is 84 × 109/L (reference range 150–400), and her baseline activated partial thromboplastin time is prolonged at 62 seconds (reference range 23.0–32.4). The rest of her blood counts and her prothrombin time, liver enzyme levels, and serum creatinine level are normal.
Should this patient be tested for antiphospholipid antibodies?
Antiphospholipid antibodies are important because of their association with thrombotic risk (both venous and arterial) and pregnancy morbidity. The name is a misnomer, as these antibodies are targeted against some proteins that are bound to phospholipids and not only to the phospholipids themselves.
According to the modified Sapporo criteria for the classification of antiphospholipid syndrome,28 antiphospholipid antibodies should remain persistently positive on at least 2 separate occasions at least 12 weeks apart for the result to be considered significant because some infections and drugs may be associated with the transient presence of antiphospholipid antibodies.
Screening for antiphospholipid antibodies should include testing for IgM and IgG anticardiolipin antibodies, lupus anticoagulant, and IgM and IgG beta-2 glycoprotein I antibodies.29,30
Anticardiolipin antibodies
Anticardiolipin (aCL) antibodies may be targeted either against beta-2 glycoprotein I (beta-2GPI) that is bound to cardiolipin (a phospholipid) or against cardiolipin alone; the former is more specific. Antibodies directed against cardiolipin alone are usually transient and are associated with infections and drugs. The result is considered significant only when anticardiolipin antibodies are present in a medium to high titer (> 40 IgG phospholipid units or IgM phospholipid units, or > 99th percentile).
Lupus anticoagulant
The antibody with “lupus anticoagulant activity” is targeted against prothrombin plus phospholipid or beta-2GPI plus phospholipid. The test for it is a functional assay involving 3 steps:
Demonstrating the prolongation of a phospholipid-dependent coagulation assay like the activated partial thromboplastin time (aPTT). (This may explain the prolongation of aPTT in the patient described in the vignette.) Although the presence of lupus anticoagulant is associated with thrombosis, it is called an “anticoagulant” because of this in vitro prolongation of phospholipid-dependent coagulation assays.
Mixing study. The phospholipid-dependent coagulation assay could be prolonged because of either the deficiency of a coagulation factor or the presence of the antiphospholipid antibodies. This can be differentiated by mixing the patient’s plasma with normal plasma (which will have all the clotting factors) in a 1:1 ratio. If the coagulation assay remains prolonged after the addition of normal plasma, clotting factor deficiency can be excluded.
Addition of a phospholipid. If the prolongation of the coagulation assay is due to the presence of an antiphospholipid antibody, addition of extra phospholipid will correct this.
Beta-2 glycoprotein I antibody (anti-beta-2GPI)
The beta-2GPI that is not bound to the cardiolipin can be detected by separately testing for beta-2GPI (the anticardiolipin test only detects the beta-2GPI that is bound to the cardiolipin). The result is considered significant if beta-2GPI is present in a medium to high titer (> 99th percentile).
Studies have shown that antiphospholipid antibodies may be present in 1% to 5% of apparently healthy people in the general population.31 These are usually low-titer anticardiolipin or anti-beta-GPI IgM antibodies that are not associated with thrombosis or adverse pregnancy outcomes. Hence, the term antiphospholipid syndrome should be reserved for those who have had at least 1 episode of thrombosis or pregnancy morbidity and persistent antiphospholipid antibodies, and not those who have asymptomatic or transient antiphospholipid antibodies.
Triple positivity (positive anticardiolipin, lupus anticoagulant, and anti-beta-2GPI) seems to be associated with the highest risk of thrombosis, with a 10-year cumulative incidence of 37.1% (95% confidence interval [CI] 19.9–54.3) for a first thrombotic event,32 and 44.2% (95% CI 38.6–49.8) for recurrent thrombosis.33
The association with thrombosis is stronger for lupus anticoagulant than with the other 2 antibodies, with different studies34 finding an odds ratio ranging from 5 to 16. A positive lupus anticoagulant test with or without a moderate to high titer of anticardiolipin or anti-beta-2GPI IgM or IgG constitutes a high-risk profile, while a moderate to high titer of anticardiolipin or anti-beta-2GPI IgM or IgG constitutes a moderate-risk profile. A low titer of anticardiolipin or anti-beta-2GPI IgM or IgG constitutes a low-risk profile that may not be associated with thrombosis.35
Antiphospholipid syndrome is important to recognize because of the need for long-term anticoagulation to prevent recurrence.36 It may be primary, when it occurs on its own, or secondary, when it occurs in association with another autoimmune disease such as lupus.
Venous events in antiphospholipid syndrome most commonly manifest as lower-limb deep vein thrombosis or pulmonary embolism, while arterial events most commonly manifest as stroke or transient ischemic attack.37 Obstetric manifestations may include not only miscarriage and stillbirth, but also preterm delivery, intrauterine growth retardation, and preeclampsia, all occurring due to placental insufficiency.
The frequency of antiphospholipid antibodies has been estimated as 13.5% in patients with stroke, 11% with myocardial infarction, 9.5% with deep vein thrombosis, and 6% for those with pregnancy morbidity.38
Some noncriteria manifestations have also been recognized in antiphospholipid syndrome, such as thrombocytopenia, cardiac vegetations (Libman-Sachs endocarditis), livedo reticularis, and nephropathy.

Back to our patient
Our patient’s anticardiolipin IgG test is negative, while her lupus anticoagulant and beta-2GPI IgG are positive. She has no clinical or laboratory features suggesting lupus.
She is started on warfarin. After 3 months, the warfarin is interrupted for several days, and she is retested for all 3 antiphospholipid antibodies. Her beta-2GPI I IgG and lupus anticoagulant tests are again positive. Because of the persistent antiphospholipid antibody positivity and clinical history of deep vein thrombosis, her condition is diagnosed as primary antiphospholipid syndrome. She is advised to continue anticoagulant therapy indefinitely.
ANTINEUTROPHIL CYTOPLASMIC ANTIBODY
A 34-year-old man who is an injecting drug user presents with a 2-week history of fever, malaise, and generalized arthralgia. There are no localizing symptoms of infection. Notable findings on examination include a temperature of 38.0°C (100.4°F), needle track marks in his arms, nonblanching vasculitic rash in his legs, and a systolic murmur over the precordium.
His white blood cell count is 15.3 × 10⁹/L (reference range 3.7–11.0), and his C-reactive protein level is 234 mg/dL (normal < 3). Otherwise, results of blood cell counts, liver enzyme tests, renal function tests, urinalysis, and chest radiography are normal.
Two sets of blood cultures are drawn. Transthoracic echocardiography and the antineutrophil cytoplasmic antibody (ANCA) test are requested, as are screening tests for human immunodeficiency virus, hepatitis B, and hepatitis C.
Was the ANCA test indicated in this patient?
ANCAs are autoantibodies against antigens located in the cytoplasmic granules of neutrophils and monocytes. They are associated with small-vessel vasculitides such as granulomatosis with polyangiitis (GPA), microscopic polyangiitis (MPA), eosinophilic granulomatosis with polyangiitis (EGPA), and isolated pauciimmune crescentic glomerulonephritis, all collectively known as ANCA-associated vasculitis (AAV).39
Laboratory methods to detect ANCA include indirect immunofluorescence and antigen-specific enzyme immunoassays. Indirect immunofluorescence only tells us whether or not an antibody that is targeting a cytoplasmic antigen is present. Based on the indirect immunofluorescent pattern, ANCA can be classified as follows:
- Perinuclear or p-ANCA (if the targeted antigen is located just around the nucleus and extends into it)
- Cytoplasmic or c-ANCA (if the targeted antigen is located farther away from the nucleus)
- Atypical ANCA (if the indirect immunofluorescent pattern does not fit with either p-ANCA or c-ANCA).
Indirect immunofluorescence does not give information about the exact antigen that is targeted; this can only be obtained by performing 1 of the antigen-specific immunoassays. The target antigen for c-ANCA is usually proteinase-3 (PR3), while that for p-ANCA could be myeloperoxidase (MPO), cathepsin, lysozyme, lactoferrin, or bactericidal permeability inhibitor. Anti-PR3 is highly specific for GPA, while anti-MPO is usually associated with MPA and EGPA. Less commonly, anti-PR3 may be seen in patients with MPA and anti-MPO in those with GPA. Hence, there is an increasing trend toward classifying ANCA-associated vasculitis into PR3-associated or MPO-associated vasculitis rather than as GPA, MPA, EGPA, or renal-limited vasculitis.40
Several audits have shown that the ANCA test is widely misused and requested indiscriminately to rule out vasculitis. This results in a lower positive predictive value, possible harm to patients due to increased false-positive rates, and increased burden on the laboratory.41–43 At least 2 separate groups have demonstrated that a gating policy that refuses ANCA testing in patients without clinical evidence of systemic vasculitis can reduce the number of inappropriate requests, improve the diagnostic yield, and make it more clinically relevant and cost-effective.44,45
The clinician should bear in mind that:

Current guidelines recommend using one of the antigen-specific assays for PR3 and MPO as the primary screening method.48 Until recently, indirect immunofluorescence was used to screen for ANCA-associated vasculitis, and positive results were confirmed by ELISA to detect ANCAs specific for PR3 and MPO,49 but this is no longer recommended because of recent evidence suggesting a large variability between the different indirect immunofluorescent methods and improved diagnostic performance of the antigen-specific assays.
In a large multicenter study by Damoiseaux et al, the specificity with the different antigen-specific immunoassays was 98% to 99% for PR3-ANCA and 96% to 99% for MPO-ANCA.50
ANCA-associated vasculitis should not be considered excluded if the PR3 and MPO-ANCA are negative. In the Damoiseaux study, about 11% to 15% of patients with GPA and 8% to 24% of patients with MPA tested negative for both PR3 and MPO-ANCA.50
If the ANCA result is negative and clinical suspicion for ANCA-associated vasculitis is high, the clinician may wish to consider requesting another immunoassay method or indirect immunofluorescence. Results of indirect immunofluorescent testing results may be positive in those with a negative immunoassay, and vice versa.

Thus, the ANCA result should always be interpreted in the context of the whole clinical picture.51 Biopsy should still be considered the gold standard for the diagnosis of ANCA-associated vasculitis. The ANCA titer can help to improve clinical interpretation, because the likelihood of ANCA-associated vasculitis increases with higher levels of PR3 and MPO-ANCA.52
Back to our patient
Our patient’s blood cultures grow methicillin-sensitive Staphylococcus aureus in both sets after 48 hours. Transthoracic echocardiography reveals vegetations around the tricuspid valve, with no evidence of valvular regurgitation. The diagnosis is right-sided infective endocarditis. He is started on appropriate antibiotics.
Tests for human immunodeficiency virus, hepatitis B, and hepatitis C are negative. The ANCA test is positive for MPO-ANCA at 28 IU/mL (normal < 10).
The positive ANCA is thought to be related to the infective endocarditis. His vasculitis is most likely secondary to infective endocarditis and not ANCA-associated vasculitis. The ANCA test need not have been requested in the first place.
HUMAN LEUKOCYTE ANTIGEN-B27
A 22-year-old man presents to his primary care physician with a 4-month history of gradually worsening low back pain associated with early morning stiffness lasting more than 2 hours. He has no peripheral joint symptoms.
In the last 2 years, he has had 2 separate episodes of uveitis. There is a family history of ankylosing spondylitis in his father. Examination reveals global restriction of lumbar movements but is otherwise unremarkable. Magnetic resonance imaging (MRI) of the lumbar spine and sacroiliac joints is normal.
Should this patient be tested for human leukocyte antigen-B27 (HLA-B27)?
The major histocompatibility complex (MHC) is a gene complex that is present in all animals. It encodes proteins that help with immunologic tolerance. HLA simply refers to the human version of the MHC.53 The HLA gene complex, located on chromosome 6, is categorized into class I, class II, and class III. HLA-B is one of the 3 class I genes. Thus, a positive HLA-B27 result simply means that the particular gene is present in that person.
HLA-B27 is strongly associated with ankylosing spondylitis, also known as axial spondyloarthropathy.54 Other genes also contribute to the pathogenesis of ankylosing spondylitis, but HLA-B27 is present in more than 90% of patients with this disease and is by far considered the most important. The association is not as strong for peripheral spondyloarthropathy, with studies reporting a frequency of up to 75% for reactive arthritis and inflammatory bowel disease-associated arthritis, and up to 50% for psoriatic arthritis and uveitis.55
About 9% of healthy, asymptomatic individuals may have HLA-B27, so the mere presence of this gene is not evidence of disease.56 There may be up to a 20-fold increased risk of ankylosing spondylitis among those who are HLA-B27-positive.57
Some HLA genes have many different alleles, each of which is given a number (explaining the number 27 that follows the B). Closely related alleles that differ from one another by only a few amino-acid substitutions are then categorized together, thus accounting for more than 100 subtypes of HLA-B27 (designated from HLA-B*2701 to HLA-B*27106). These subtypes vary in frequency among different racial groups, and the population prevalence of ankylosing spondylitis parallels the frequency of HLA-B27.58 The most common subtype seen in white people and American Indians is B*2705. HLA-B27 is rare in blacks, explaining the rarity of ankylosing spondylitis in this population. Further examples include HLA-B*2704, which is seen in Asians, and HLA-B*2702, seen in Mediterranean populations. Not all subtypes of HLA-B27 are associated with disease, and some, like HLA-B*2706, may also be protective.
When should the clinician consider testing for HLA-B27?

Peripheral spondyloarthropathy may present with arthritis, enthesitis (eg, heel pain due to inflammation at the site of insertion of the Achilles tendon or plantar fascia), or dactylitis (“sausage” swelling of the whole finger or toe due to extension of inflammation beyond the margins of the joint). Other clues may include psoriasis, inflammatory bowel disease, history of preceding gastrointestinal or genitourinary infection, family history of similar conditions, and history of recurrent uveitis.
For the initial assessment of patients who have inflammatory back pain, plain radiography of the sacroiliac joints is considered the gold standard.59 If plain radiography does not show evidence of sacroiliitis, MRI of the sacroiliac joints should be considered. While plain radiography can reveal only structural changes such as sclerosis, erosions, and ankylosis, MRI is useful to evaluate for early inflammatory changes such as bone marrow edema. Imaging the lumbar spine is not necessary, as the sacroiliac joints are almost invariably involved in axial spondyloarthropathy, and lesions seldom occur in the lumbar spine in isolation.60
The diagnosis of ankylosing spondylitis previously relied on confirmatory imaging features, but based on the new International Society classification criteria,61–63 which can be applied to patients with more than 3 months of back pain and age of onset of symptoms before age 45, patients can be classified as having 1 of the following:
- Radiographic axial spondyloarthropathy, if they have evidence of sacroiliitis on imaging plus 1 other feature of spondyloarthropathy
- Nonradiographic axial spondyloarthropathy, if they have a positive HLA-B27 plus 2 other features of spondyloarthropathy (Table 7).
These new criteria have a sensitivity of 82.9% and specificity of 84.4%.62,63 The disease burden of radiographic and nonradiographic axial spondyloarthropathy has been shown to be similar, suggesting that they are part of the same disease spectrum. Thus, the HLA-B27 test is useful to make a diagnosis of axial spondyloarthropathy even in the absence of imaging features and could be requested in patients with 2 or more features of spondyloarthropathy. In the absence of imaging features and a negative HLA-B27 result, however, the patient cannot be classified as having axial spondyloarthropathy.
Back to our patient
The absence of radiographic evidence would not exclude axial spondyloarthropathy in our patient. The HLA-B27 test is requested because of the inflammatory back pain and the presence of 2 spondyloarthropathy features (uveitis and the family history) and is reported to be positive. His disease is classified as nonradiographic axial spondyloarthropathy.
He is started on regular naproxen and is referred to a physiotherapist. After 1 month, he reports significant symptomatic improvement. He asks if he can be retested for HLA-B27 to see if it has become negative. We tell him that there is no point in repeating it, as it is a gene and will not disappear.
SUMMARY: CONSIDER THE CLINICAL PICTURE
When approaching a patient suspected of having a rheumatologic disease, a clinician should first consider the clinical presentation and the intended purpose of each test. The tests, in general, might serve several purposes. They might help to:
Increase the likelihood of the diagnosis in question. For example, a positive rheumatoid factor or anticitrullinated peptide antibody can help diagnose rheumatoid arthritis in a patient with early polyarthritis, a positive HLA-B27 can help diagnose ankylosing spondylitis in patients with inflammatory back pain and normal imaging, and a positive ANCA can help diagnose ANCA-associated vasculitis in a patient with glomerulonephritis.
Reduce the likelihood of the diagnosis in question. For example, a negative antinuclear antibody test reduces the likelihood of lupus in a patient with joint pains.
Monitor the condition. For example DNA antibodies can be used to monitor the activity of lupus.
Plan the treatment strategy. For example, one might consider lifelong anticoagulation if antiphospholipid antibodies are persistently positive in a patient with thrombosis.
Prognosticate. For example, positive rheumatoid factor and anticitrullinated peptide antibody increase the risk of erosive rheumatoid arthritis.
If the test was requested in the absence of a clear indication and the result is positive, it is important to bear in mind the potential pitfalls associated with that test and not attach a diagnostic label prematurely. None of the tests can confirm or exclude a condition, so the results should always be interpreted in the context of the whole clinical picture.
- American College of Rheumatology Ad Hoc Committee on Immunologic Testing Guidelines. Guidelines for immunologic laboratory testing in the rheumatic diseases: an introduction. Arthritis Rheum 2002; 47(4):429–433. doi:10.1002/art.10381
- Rang M. The Ulysses syndrome. Can Med Assoc J 1972; 106(2):122–123. pmid:5058884
- Ingegnoli F, Castelli R, Gualtierotti R. Rheumatoid factors: clinical applications. Dis Markers 2013; 35(6):727–734. doi:10.1155/2013/726598
- Nishimura K, Sugiyama D, Kogata Y, et al. Meta-analysis: diagnostic accuracy of anti-cyclic citrullinated peptide antibody and rheumatoid factor for rheumatoid arthritis. Ann Intern Med 2007; 146(11):797–808. pmid:17548411
- Taylor P, Gartemann J, Hsieh J, Creeden J. A systematic review of serum biomarkers anti-cyclic citrullinated Peptide and rheumatoid factor as tests for rheumatoid arthritis. Autoimmune Dis 2011; 2011:815038. doi:10.4061/2011/815038
- Rantapää-Dahlqvist S, de Jong BA, Berglin E, et al. Antibodies against cyclic citrullinated peptide and IgA rheumatoid factor predict the development of rheumatoid arthritis. Arthritis Rheum 2003; 48(10):2741–2749. doi:10.1002/art.11223
- Suresh E. Diagnosis of early rheumatoid arthritis: what the non-specialist needs to know. J R Soc Med 2004; 97(9):421–424. doi:10.1258/jrsm.97.9.421
- Emery P, Breedveld FC, Dougados M, Kalden JR, Schiff MH, Smolen JS. Early referral recommendation for newly diagnosed rheumatoid arthritis: evidence based development of a clinical guide. Ann Rheum Dis 2002; 61(4):290–297. pmid:11874828
- Combe B, Landewe R, Daien CI, et al. 2016 update of the EULAR recommendations for the management of early arthritis. Ann Rheum Dis 2017; 76(6):948–959. doi:10.1136/annrheumdis-2016-210602
- Egsmose C, Lund B, Borg G, et al. Patients with rheumatoid arthritis benefit from early 2nd line therapy: 5 year follow up of a prospective double blind placebo controlled study. J Rheumatol 1995; 22(12):2208–2213. pmid:8835550
- van der Heide A, Jacobs JW, Bijlsma JW, et al. The effectiveness of early treatment with “second-line” antirheumatic drugs. A randomized, controlled trial. Ann Intern Med 1996; 124(8):699–707. pmid:8633829
- Andreson JJ, Wells G, Verhoeven AC, Felson DT. Factors predicting response to treatment in rheumatoid arthritis: the importance of disease duration. Arthritis Rheum 2000; 43(1):22–29. doi:10.1002/1529-0131(200001)43:1<22::AID-ANR4>3.0.CO;2-9
- Aletaha D, Neogi T, Silman AJ, et al. 2010 Rheumatoid arthritis classification criteria: an American College of Rheumatology/European League Against Rheumatism collaborative initiative. Arthritis Rheum 2010; 62(9):2569–2581. doi:10.1002/art.27584
- Nielen MM, van Schaardenburg D, Reesink HW, et al. Specific autoantibodies precede the symptoms of rheumatoid arthritis: a study of serial measurements in blood donors. Arthritis Rheum 2004; 50(2):380–386. doi:10.1002/art.20018
- del Puente A, Knowler WC, Pettitt DJ, Bennett PH. The incidence of rheumatoid arthritis is predicted by rheumatoid factor titer in a longitudinal population study. Arthritis Rheum 1988; 31(10):1239–1244. pmid:3178905
- Deane KD, Norris JM, Holers VM. Preclinical rheumatoid arthritis: identification, evaluation, and future directions for investigation. Rheum Dis Clin North Am 2010; 36(2):213–241. doi:10.1016/j.rdc.2010.02.001
- Kavanaugh A, Tomar R, Reveille J, Solomon DH, Homburger HA. Guidelines for clinical use of the antinuclear antibody test and tests for specific autoantibodies to nuclear antigens. American College of Pathologists. Arch Pathol Lab Med 2000; 124(1):71–81. doi:10.1043/0003-9985(2000)124<0071:GFCUOT>2.0.CO;2
- Suresh E. Systemic lupus erythematosus: diagnosis for the non-specialist. Br J Hosp Med (Lond) 2007; 68(10):538–541. doi:10.12968/hmed.2007.68.10.27324
- Illei GG, Klippel JH. Why is the ANA result positive? Bull Rheum Dis 1999; 48(1):1–4. pmid:10028188
- Tan EM, Feltkamp TE, Smolen JS, et al. Range of antinuclear antibodies in “healthy” individuals. Arthritis Rheum 1997; 40(9):1601–1611. doi:10.1002/art.1780400909
- Langkilde H, Voss A, Heegaard N, Laustrup H. Autoantibodies persist in relatives to systemic lupus erythematosus patients during 12 years follow-up. Lupus 2017; 26(7):723–728. doi:10.1177/0961203316676378
- Rondeel JM. Immunofluorescence versus ELISA for the detection of antinuclear antigens. Expert Rev Mol Diagn 2002; 2(3):226–232. doi:10.1586/14737159.2.3.226
- Solomon DH, Kavanaugh AJ, Schur PH; American College of Rheumatology Ad Hoc Committee on Immunologic Testing Guidelines. Evidence-based guidelines for the use of immunologic tests: antinuclear antibody testing. Arthritis Rheum 2002; 47(4):434–444. doi:10.1002/art.10561
- Slater CA, Davis RB, Shmerling RH. Antinuclear antibody testing. A study of clinical utility. Arch Intern Med 1996; 156(13):1421–1425. pmid:8678710
- Maddison PJ. Is it SLE? Best Pract Res Clin Rheumatol 2002; 16(2):167–180. doi:10.1053/berh.2001.0219
- Price E, Walker E. Diagnostic vertigo: the journey to diagnosis in systemic lupus erythematosus. Health (London) 2014; 18(3):223–239. doi:10.1177/1363459313488008
- Blumenthal DE. Tired, aching, ANA-positive: does your patient have lupus or fibromyalgia? Cleve Clin J Med 2002; 69(2):143–146, 151–152. pmid:11990644
- Miyakis S, Lockshin MD, Atsumi T, et al. International consensus statement on an update of the classification criteria for definite antiphospholipid syndrome (APS). J Thromb Haemost 2006; 4(2):295–306. doi:10.1111/j.1538-7836.2006.01753.x
- Keeling D, Mackie I, Moore GW, Greer IA, Greaves M; British Committee for Standards in Haematology. Guidelines on the investigation and management of antiphospholipid syndrome. Br J Haematol 2012; 157(1):47–58. doi:10.1111/j.1365-2141.2012.09037.x
- Giannakopoulos B, Passam F, Iannou Y, Krillis SA. How we diagnose the antiphospholipid syndrome. Blood 2009; 113(5):985–994. doi:10.1182/blood-2007-12-129627
- Biggioggero M, Meroni PL. The geoepidemiology of the antiphospholipid antibody syndrome. Autoimmun Rev 2010; 9(5):A299–A304. doi:10.1016/j.autrev.2009.11.013
- Pengo V, Ruffatti A, Legnani C, et al. Incidence of a first thromboembolic event in asymptomatic carriers of high-risk antiphospholipid antibody profile: a multicenter prospective study. Blood 2011; 118(17):4714–4718. doi:10.1182/blood-2011-03-340232
- Pengo V, Ruffatti A, Legnani C, et al. Clinical course of high-risk patients diagnosed with antiphospholipid syndrome. J Thromb Haemost 2010; 8(2):237–242. doi:10.1111/j.1538-7836.2009.03674.x
- Galli M, Luciani D, Bertolini G, Barbui T. Lupus anticoagulants are stronger risk factors for thrombosis than anticardiolipin antibodies in the antiphospholipid syndrome: a systematic review of the literature. Blood 2003; 101(5):1827–1832. doi:10.1182/blood-2002-02-0441
- Garcia D, Erkan D. Diagnosis and management of the antiphospholipid syndrome. N Engl J Med 2018; 378(21):2010–2021. doi:10.1056/NEJMra1705454
- Garcia D, Akl EA, Carr R, Kearon C. Antiphospholipid antibodies and the risk of recurrence after a first episode of venous thromboembolism: a systematic review. Blood 2013; 122(5):817–824. doi:10.1182/blood-2013-04-496257
- Cervera R. Lessons from the “Euro-Phospholipid” project. Autoimmun Rev 2008; 7(3):174–178. doi:10.1016/j.autrev.2007.11.011
- Andreoli L, Chighizola CB, Banzato A, Pons-Estel GJ, Ramire de Jesus G, Erkan D. Estimated frequency of antiphospholipid antibodies in patients with pregnancy morbidity, stroke, myocardial infarction, and deep vein thrombosis: a critical review of the literature. Arthritis Care Res (Hoboken) 2013; 65(11):1869–1873. doi:10.1002/acr.22066
- Miller A, Chan M, Wiik A, Misbah SA, Luqmani RA. An approach to the diagnosis and management of systemic vasculitis. Clin Exp Immunol 2010; 160(2):143–160. doi:10.1111/j.1365-2249.2009.04078.x
- Cornec D, Cornec-Le-Gall E, Fervenza FC, Specks U. ANCA-associated vasculitis—clinical utility of using ANCA specificity to classify patients. Nat Rev Rheumatol 2016; 12(10):570–579. doi:10.1038/nrrheum.2016.123
- Edgar JD, McMillan SA, Bruce IN, Conlan SK. An audit of ANCA in routine clinical practice. Postgrad Med J 1995; 71(840):605–612. pmid:8545289
- McLaren JS, Stimson RH, McRorie ER, Coia JE, Luqmani RA. The diagnostic value of anti-neutrophil cytoplasmic testing in a routine clinical setting. QJM 2001; 94(11):615–621. pmid:11704691
- Mandl LA, Solomon DH, Smith EL, Lew RA, Katz JN, Shmerling RH. Using antineutrophil cytoplasmic antibody testing to diagnose vasculitis: can test-ordering guidelines improve diagnostic accuracy? Arch Intern Med 2002; 162(13):1509–1514. pmid:12090888
- Sinclair D, Saas M, Stevens JM. The effect of a symptom related “gated policy” on ANCA requests in routine clinical practice. J Clin Pathol 2004; 57(2):131–134. pmid:14747434
- Arnold DF, Timms A, Luqmani R, Misbah SA. Does a gating policy for ANCA overlook patients with ANCA associated vasculitis? An audit of 263 patients. J Clin Pathol 2010; 63(8):678–680. doi:10.1136/jcp.2009.072504
- Savige J, Gills D, Benson E, et al. International consensus statement on testing and reporting of antineutrophil cytoplasmic antibodies (ANCA). Am J Clin Pathol 1999; 111(4):507–513. pmid:10191771
- Robinson PC, Steele RH. Appropriateness of antineutrophil cytoplasmic antibody testing in a tertiary hospital. J Clin Pathol 2009; 62(8):743–745. doi:10.1136/jcp.2009.064485
- Bossuyt X, Cohen Tervaert JW, Arimura Y, et al. Position paper: revised 2017 international consensus on testing of ANCAs in granulomatosis with polyangiitis and microscopic polyangiitis. Nat Rev Rheumatol 2017; 13(11):683–692. doi:10.1038/nrrheum.2017.140
- Hagen EC, Daha MR, Hermans J, et al. Diagnostic value of standardized assays for anti-neutrophil cytoplasmic antibodies in idiopathic systemic vasculitis. EC/BCR Project for ANCA Assay Standardization. Kidney Int 1998; 53(3):743–753. doi:10.1046/j.1523-1755.1998.00807.x
- Damoiseaux J, Csemok E, Rasmussen N, et al. Detection of antineutrophil antibodies (ANCAs): a multicentre European Vasculitis Study Group (EUVAS) evaluation of the value of indirect immunofluorescence (IIF) versus antigen specific immunoassays. Ann Rheum Dis 2017; 76(4):647–653. doi:10.1136/annrheumdis-2016-209507
- Suresh E. Diagnostic approach to patients with suspected vasculitis. Postgrad Med J 2006; 82(970):483–488. doi:10.1136/pgmj.2005.042648
- Vermeersch P, Blockmans D, Bossuyt X. Use of likelihood ratios can improve the clinical usefulness of enzyme immunoassays for the diagnosis of small-vessel vasculitis. Clin Chem 2009; 55(10):1886–1888. doi:10.1373/clinchem.2009.130583
- Bowness P. HLA-B27. Annu Rev Immunol 2015; 33:29–48. doi:10.1146/annurev-immunol-032414-112110
- Sieper J, Poddubnyy D. Axial spondyloarthritis. Lancet 2017; 390(10089):73–84. doi:10.1016/S0140-6736(16)31591-4
- Khan MA. Thoughts concerning the early diagnosis of ankylosing spondylitis and related diseases. Clin Exp Rheumatol 2002; 20(6 suppl 28):S6–S10. pmid:12463439
- Braun J, Bollow M, Remlinger G, et al. Prevalence of spondyloarthropathies in HLA-B27 positive and negative blood donors. Arthritis Rheum 1998; 41(1):58–67. doi:10.1002/1529-0131(199801)41:1<58::AID-ART8>3.0.CO;2-G
- van der Linden SM, Valkenburg HA, de Jongh BM, Cats A. The risk of developing ankylosing spondylitis in HLA-B27 positive individuals. A comparison of relatives of spondylitis patients with the general population. Arthritis Rheum 1984; 27(3):241–249. pmid:6608352
- Sheehan NJ. HLA-B27: what’s new? Rheumatology (Oxford) 2010; 49(4):621–631. doi:10.1093/rheumatology/kep450
- Baraliakos X, Maksymmowych WP. Imaging in the diagnosis and management of axial spondyloarthritis. Best Pract Res Clin Rheumatol 2016; 30(4):608–623. doi:10.1016/j.berh.2016.09.011
- Mandl P, Navarro-Compan V, Terslev L, et al; European League Against Rheumatism (EULAR). EULAR recommendations for the use of imaging in the diagnosis and management of spondyloarthritis in clinical practice. Ann Rheum Dis 2015; 74(7):1327–1339. doi:10.1136/annrheumdis-2014-206971
- McAllister K, Goodson N, Warburton I, Rogers G. Spondyloarthritis: diagnosis and management: summary of NICE guidance. BMJ 2017; 356:j839. doi:10.1136/bmj.j839
- Poddubnyy D, van Tubergen A, Landewé R, Sieper J, van der Heijde D; Assessment of SpondyloArthritis international Society (ASAS). Development of an ASAS-endorsed recommendation for the early referral of patients with a suspicion of axial spondyloarthritis. Ann Rheum Dis 2015; 74(8):1483–1487. doi:10.1136/annrheumdis-2014-207151
- Rudwaleit M, van der Heijde D, Landewe R, et al. The development of Assessment of SpondyloArthritis International Society classification criteria for axial spondyloarthritis (part II): validation and final selection. Ann Rheum Dis 2009; 68(6):777–783. doi:10.1136/ard.2009.108233
Laboratory tests are often ordered inappropriately for patients in whom a rheumatologic illness is suspected; this occurs in both primary and secondary care.1 Some tests are available both singly and as part of a battery of tests screening healthy people without symptoms.
The problem: negative test results are by no means always reassuring, and false-positive results raise the risks of unnecessary anxiety for patients and clinicians, needless referrals, and potential morbidity due to further unnecessary testing and exposure to wrong treatments.2 Clinicians should be aware of the pitfalls of these tests in order to choose them wisely and interpret the results correctly.
This article provides practical guidance on requesting and interpreting some common tests in rheumatology, with the aid of case vignettes.
RHEUMATOID FACTOR AND ANTICITRULLINATED PEPTIDE ANTIBODY
A 41-year-old woman, previously in good health, presents to her primary care practitioner with a 6-week history of pain and swelling in her hands and early morning stiffness lasting about 2 hours. She denies having any extraarticular symptoms. Physical examination reveals synovitis across her right metacarpophalangeal joints, proximal interphalangeal joint of the left middle finger, and left wrist. The primary care physician is concerned that her symptoms might be due to rheumatoid arthritis.
Would testing for rheumatoid factor and anticitrullinated peptide antibody be useful in this patient?
Rheumatoid factor is an antibody (immunoglobulin M, IgG, or IgA) targeted against the Fc fragment of IgG.3 It was so named because it was originally detected in patients with rheumatoid arthritis, but it is neither sensitive nor specific for this condition. A meta-analysis of more than 5,000 patients with rheumatoid arthritis reported that rheumatoid factor testing had a sensitivity of 69% and specificity of 85%.4
Anticitrullinated peptide antibody, on the other hand, is much more specific for rheumatoid arthritis (95%), as it is seldom seen in other conditions, but its sensitivity is similar to that of rheumatoid factor (68%).4–6 A positive result would thus lend strength to the diagnosis of rheumatoid arthritis, but a negative result would not exclude it.
Approach to early arthritis
When faced with a patient with early arthritis, some key questions to ask include7,8:
Is this an inflammatory or a mechanical problem? Inflammatory arthritis is suggested by joint swelling that is not due to trauma or bony hypertrophy, early morning stiffness lasting longer than 30 minutes, and elevated inflammatory markers (erythrocyte sedimentation rate or C-reactive protein). Involvement of the small joints of the hands and feet may be suggested by pain on compression of the metacarpophalangeal and metatarsophalangeal joints, respectively.
Is there a definite identifiable underlying cause for the inflammatory arthritis? The pattern of development of joint symptoms or the presence of extraarticular symptoms may suggest an underlying problem such as gout, psoriatic arthritis, systemic lupus erythematosus, or sarcoidosis.
If the arthritis is undifferentiated (ie, there is no definite identifiable cause), is it likely to remit or persist? This is perhaps the most important question to ask in order to prognosticate. Patients with risk factors for persistent disease, ie, for development of rheumatoid arthritis, should be referred to a rheumatologist early for timely institution of disease-modifying antirheumatic drug therapy.9 Multiple studies have shown that patients in whom this therapy is started early have much better clinical, functional, and radiologic outcomes than those in whom it is delayed.10–12
The revised American College of Rheumatology and European League Against Rheumatism criteria13 include the following factors as predictors of persistence:
- Number of involved joints (with greater weight given to involvement of small joints)
- Duration of symptoms 6 weeks or longer
- Elevated acute-phase response (erythrocyte sedimentation rate or C-reactive protein level)
- A positive serologic test (either rheumatoid factor or anticitrullinated peptide antibody).
If both rheumatoid factor and anticitrullinated peptide antibody are positive in a patient with early undifferentiated arthritis, the risk of progression to rheumatoid arthritis is almost 100%, thus underscoring the importance of testing for these antibodies.5,6 Referral to a rheumatologist should, however, not be delayed in patients with negative test results (more than one-third of patients with rheumatoid arthritis may be negative for both), and should be considered in those with inflammatory joint symptoms persisting longer than 6 weeks, especially with involvement of the small joints (sparing the distal interphalangeals) and elevated acute-phase response.
Rheumatoid factor in healthy people without symptoms
In some countries, testing for rheumatoid factor is offered as part of a battery of screening tests in healthy people who have no symptoms, a practice that should be strongly discouraged.
Multiple studies, both prospective and retrospective, have demonstrated that both rheumatoid factor and anticitrullinated peptide antibody may be present several years before the clinical diagnosis of rheumatoid arthritis.6,14–16 But the risk of developing rheumatoid arthritis for asymptomatic individuals who are rheumatoid factor-positive depends on the rheumatoid factor titer, positive family history of rheumatoid arthritis in first-degree relatives, and copresence of anticitrullinated peptide antibody. The absolute risk, nevertheless, is still very small. In some, there might be an alternative explanation such as undiagnosed Sjögren syndrome or hepatitis C.
In any event, no strategy is currently available that is proven to prevent the development of rheumatoid arthritis, and there is no role for disease-modifying therapy during the preclinical phase.16
Back to our patient
Blood testing in our patient reveals normal complete blood cell counts, aminotransferase levels, and serum creatinine concentration; findings on urinalysis are normal. Her erythrocyte sedimentation rate is 56 mm/hour (reference range 0–15), and her C-reactive protein level is 26 mg/dL (normal < 3). Testing is negative for rheumatoid factor and anticitrullinated peptide antibody.
Although her rheumatoid factor and anticitrullinated peptide antibody tests are negative, she is referred to a rheumatologist because she has predictors of persistent disease, ie, symptom duration of 6 weeks, involvement of the small joints of the hands, and elevated erythrocyte sedimentation rate and C-reactive protein. The rheumatologist checks her parvovirus serology, which is negative.
The patient is given parenteral depot corticosteroid therapy, to which she responds briefly. Because her symptoms persist and continue to worsen, methotrexate treatment is started after an additional 6 weeks.
ANTINUCLEAR ANTIBODY
A 37-year-old woman presents to her primary care physician with the complaint of tiredness. She has a family history of systemic lupus erythematosus in her sister and maternal aunt. She is understandably worried about lupus because of the family history and is asking to be tested for it.
Would testing for antinuclear antibody be reasonable?
Antinuclear antibody is not a single antibody but rather a family of autoantibodies that are directed against nuclear constituents such as single- or double-stranded deoxyribonucleic acid (dsDNA), histones, centromeres, proteins complexed with ribonucleic acid (RNA), and enzymes such as topoisomerase.17,18
Protein antigens complexed with RNA and some enzymes in the nucleus are also known as extractable nuclear antigens (ENAs). They include Ro, La, Sm, Jo-1, RNP, and ScL-70 and are named after the patient in whom they were first discovered (Robert, Lavine, Smith, and John), the antigen that is targeted (ribonucleoprotein or RNP), and the disease with which they are associated (anti-ScL-70 or antitopoisomerase in diffuse cutaneous scleroderma).
Antinuclear antibody testing is commonly requested to exclude connective tissue diseases such as lupus, but the clinician needs to be aware of the following points:
Antinuclear antibody may be encountered in conditions other than lupus
These include19:
- Other autoimmune diseases such as rheumatoid arthritis, primary Sjögren syndrome, systemic sclerosis, autoimmune thyroid disease, and myasthenia gravis
- Infection with organisms that share the epitope with self-antigens (molecular mimicry)
- Cancers
- Drugs such as hydralazine, procainamide, and minocycline.
Antinuclear antibody might also be produced by the healthy immune system from time to time to clear the nuclear debris that is extruded from aging cells.
A study in healthy individuals20 reported a prevalence of positive antinuclear antibody of 32% at a titer of 1/40, 15% at a titer of 1/80, 7% at a titer of 1/160, and 3% at a titer of 1/320. Importantly, a positive result was more common among family members of patients with autoimmune connective tissue diseases.21 Hence, a positive antinuclear antibody result does not always mean lupus.
Antinuclear antibody testing is highly sensitive for lupus
With current laboratory methods, antinuclear antibody testing has a sensitivity close to 100%. Hence, a negative result virtually rules out lupus.
Two methods are commonly used to test for antinuclear antibody: indirect immunofluorescence and enzyme-linked immunosorbent assay (ELISA).22 While human epithelial (Hep2) cells are used as the source of antigen in immunofluorescence, purified nuclear antigens coated on multiple-well plates are used in ELISA.
Although ELISA is simpler to perform, immunofluorescence has a slightly better sensitivity (because the Hep2 cells express a wide range of antigens) and is still considered the gold standard. As expected, the higher sensitivity occurs at the cost of reduced specificity (about 60%), so antinuclear antibody will also be detected in all the other conditions listed above.23
To improve the specificity of antinuclear antibody testing, laboratories report titers (the highest dilution of the test serum that tested positive); a cutoff of greater than 1/80 is generally considered significant.
Do not order antinuclear antibody testing indiscriminately
To sum up, the antinuclear antibody test should be requested only in patients with involvement of multiple organ systems. Although a negative result would make it extremely unlikely that the clinical presentation is due to lupus, a positive result is insufficient on its own to make a diagnosis of lupus.
Diagnosing lupus is straightforward when patients present with a specific manifestation such as inflammatory arthritis, photosensitive skin rash, hemolytic anemia, thrombocytopenia, or nephritis, or with specific antibodies such as those against dsDNA or Sm. Patients who present with nonspecific symptoms such as arthralgia or tiredness with a positive antinuclear antibody and negative anti-dsDNA and anti-Sm may present difficulties even for the specialist.25–27
Back to our patient
Our patient denies arthralgia. She has no extraarticular symptoms such as skin rashes, oral ulcers, sicca symptoms, muscle weakness, Raynaud phenomenon, pleuritic chest pain, or breathlessness. Findings on physical examination and urinalysis are unremarkable.
Her primary care physician decides to check her complete blood cell count, erythrocyte sedimentation rate, and thyroid-stimulating hormone level. Although she is reassured that her tiredness is not due to lupus, she insists on getting an antinuclear antibody test.
Her complete blood cell counts are normal. Her erythrocyte sedimentation rate is 6 mm/hour. However, her thyroid-stimulating hormone level is elevated, and subsequent testing shows low free thyroxine and positive thyroid peroxidase antibodies. The antinuclear antibody is positive in a titer of 1/80 and negative for anti-dsDNA and anti-ENA.
We explain to her that the positive antinuclear antibody is most likely related to her autoimmune thyroid disease. She is referred to an endocrinologist.
ANTIPHOSPHOLIPID ANTIBODIES
A 24-year-old woman presents to the emergency department with acute unprovoked deep vein thrombosis in her right leg, confirmed by ultrasonography. She has no history of previous thrombosis, and the relevant family history is unremarkable. She has never been pregnant. Her platelet count is 84 × 109/L (reference range 150–400), and her baseline activated partial thromboplastin time is prolonged at 62 seconds (reference range 23.0–32.4). The rest of her blood counts and her prothrombin time, liver enzyme levels, and serum creatinine level are normal.
Should this patient be tested for antiphospholipid antibodies?
Antiphospholipid antibodies are important because of their association with thrombotic risk (both venous and arterial) and pregnancy morbidity. The name is a misnomer, as these antibodies are targeted against some proteins that are bound to phospholipids and not only to the phospholipids themselves.
According to the modified Sapporo criteria for the classification of antiphospholipid syndrome,28 antiphospholipid antibodies should remain persistently positive on at least 2 separate occasions at least 12 weeks apart for the result to be considered significant because some infections and drugs may be associated with the transient presence of antiphospholipid antibodies.
Screening for antiphospholipid antibodies should include testing for IgM and IgG anticardiolipin antibodies, lupus anticoagulant, and IgM and IgG beta-2 glycoprotein I antibodies.29,30
Anticardiolipin antibodies
Anticardiolipin (aCL) antibodies may be targeted either against beta-2 glycoprotein I (beta-2GPI) that is bound to cardiolipin (a phospholipid) or against cardiolipin alone; the former is more specific. Antibodies directed against cardiolipin alone are usually transient and are associated with infections and drugs. The result is considered significant only when anticardiolipin antibodies are present in a medium to high titer (> 40 IgG phospholipid units or IgM phospholipid units, or > 99th percentile).
Lupus anticoagulant
The antibody with “lupus anticoagulant activity” is targeted against prothrombin plus phospholipid or beta-2GPI plus phospholipid. The test for it is a functional assay involving 3 steps:
Demonstrating the prolongation of a phospholipid-dependent coagulation assay like the activated partial thromboplastin time (aPTT). (This may explain the prolongation of aPTT in the patient described in the vignette.) Although the presence of lupus anticoagulant is associated with thrombosis, it is called an “anticoagulant” because of this in vitro prolongation of phospholipid-dependent coagulation assays.
Mixing study. The phospholipid-dependent coagulation assay could be prolonged because of either the deficiency of a coagulation factor or the presence of the antiphospholipid antibodies. This can be differentiated by mixing the patient’s plasma with normal plasma (which will have all the clotting factors) in a 1:1 ratio. If the coagulation assay remains prolonged after the addition of normal plasma, clotting factor deficiency can be excluded.
Addition of a phospholipid. If the prolongation of the coagulation assay is due to the presence of an antiphospholipid antibody, addition of extra phospholipid will correct this.
Beta-2 glycoprotein I antibody (anti-beta-2GPI)
The beta-2GPI that is not bound to the cardiolipin can be detected by separately testing for beta-2GPI (the anticardiolipin test only detects the beta-2GPI that is bound to the cardiolipin). The result is considered significant if beta-2GPI is present in a medium to high titer (> 99th percentile).
Studies have shown that antiphospholipid antibodies may be present in 1% to 5% of apparently healthy people in the general population.31 These are usually low-titer anticardiolipin or anti-beta-GPI IgM antibodies that are not associated with thrombosis or adverse pregnancy outcomes. Hence, the term antiphospholipid syndrome should be reserved for those who have had at least 1 episode of thrombosis or pregnancy morbidity and persistent antiphospholipid antibodies, and not those who have asymptomatic or transient antiphospholipid antibodies.
Triple positivity (positive anticardiolipin, lupus anticoagulant, and anti-beta-2GPI) seems to be associated with the highest risk of thrombosis, with a 10-year cumulative incidence of 37.1% (95% confidence interval [CI] 19.9–54.3) for a first thrombotic event,32 and 44.2% (95% CI 38.6–49.8) for recurrent thrombosis.33
The association with thrombosis is stronger for lupus anticoagulant than with the other 2 antibodies, with different studies34 finding an odds ratio ranging from 5 to 16. A positive lupus anticoagulant test with or without a moderate to high titer of anticardiolipin or anti-beta-2GPI IgM or IgG constitutes a high-risk profile, while a moderate to high titer of anticardiolipin or anti-beta-2GPI IgM or IgG constitutes a moderate-risk profile. A low titer of anticardiolipin or anti-beta-2GPI IgM or IgG constitutes a low-risk profile that may not be associated with thrombosis.35
Antiphospholipid syndrome is important to recognize because of the need for long-term anticoagulation to prevent recurrence.36 It may be primary, when it occurs on its own, or secondary, when it occurs in association with another autoimmune disease such as lupus.
Venous events in antiphospholipid syndrome most commonly manifest as lower-limb deep vein thrombosis or pulmonary embolism, while arterial events most commonly manifest as stroke or transient ischemic attack.37 Obstetric manifestations may include not only miscarriage and stillbirth, but also preterm delivery, intrauterine growth retardation, and preeclampsia, all occurring due to placental insufficiency.
The frequency of antiphospholipid antibodies has been estimated as 13.5% in patients with stroke, 11% with myocardial infarction, 9.5% with deep vein thrombosis, and 6% for those with pregnancy morbidity.38
Some noncriteria manifestations have also been recognized in antiphospholipid syndrome, such as thrombocytopenia, cardiac vegetations (Libman-Sachs endocarditis), livedo reticularis, and nephropathy.
Back to our patient
Our patient’s anticardiolipin IgG test is negative, while her lupus anticoagulant and beta-2GPI IgG are positive. She has no clinical or laboratory features suggesting lupus.
She is started on warfarin. After 3 months, the warfarin is interrupted for several days, and she is retested for all 3 antiphospholipid antibodies. Her beta-2GPI I IgG and lupus anticoagulant tests are again positive. Because of the persistent antiphospholipid antibody positivity and clinical history of deep vein thrombosis, her condition is diagnosed as primary antiphospholipid syndrome. She is advised to continue anticoagulant therapy indefinitely.
ANTINEUTROPHIL CYTOPLASMIC ANTIBODY
A 34-year-old man who is an injecting drug user presents with a 2-week history of fever, malaise, and generalized arthralgia. There are no localizing symptoms of infection. Notable findings on examination include a temperature of 38.0°C (100.4°F), needle track marks in his arms, nonblanching vasculitic rash in his legs, and a systolic murmur over the precordium.
His white blood cell count is 15.3 × 10⁹/L (reference range 3.7–11.0), and his C-reactive protein level is 234 mg/dL (normal < 3). Otherwise, results of blood cell counts, liver enzyme tests, renal function tests, urinalysis, and chest radiography are normal.
Two sets of blood cultures are drawn. Transthoracic echocardiography and the antineutrophil cytoplasmic antibody (ANCA) test are requested, as are screening tests for human immunodeficiency virus, hepatitis B, and hepatitis C.
Was the ANCA test indicated in this patient?
ANCAs are autoantibodies against antigens located in the cytoplasmic granules of neutrophils and monocytes. They are associated with small-vessel vasculitides such as granulomatosis with polyangiitis (GPA), microscopic polyangiitis (MPA), eosinophilic granulomatosis with polyangiitis (EGPA), and isolated pauciimmune crescentic glomerulonephritis, all collectively known as ANCA-associated vasculitis (AAV).39
Laboratory methods to detect ANCA include indirect immunofluorescence and antigen-specific enzyme immunoassays. Indirect immunofluorescence only tells us whether or not an antibody that is targeting a cytoplasmic antigen is present. Based on the indirect immunofluorescent pattern, ANCA can be classified as follows:
- Perinuclear or p-ANCA (if the targeted antigen is located just around the nucleus and extends into it)
- Cytoplasmic or c-ANCA (if the targeted antigen is located farther away from the nucleus)
- Atypical ANCA (if the indirect immunofluorescent pattern does not fit with either p-ANCA or c-ANCA).
Indirect immunofluorescence does not give information about the exact antigen that is targeted; this can only be obtained by performing 1 of the antigen-specific immunoassays. The target antigen for c-ANCA is usually proteinase-3 (PR3), while that for p-ANCA could be myeloperoxidase (MPO), cathepsin, lysozyme, lactoferrin, or bactericidal permeability inhibitor. Anti-PR3 is highly specific for GPA, while anti-MPO is usually associated with MPA and EGPA. Less commonly, anti-PR3 may be seen in patients with MPA and anti-MPO in those with GPA. Hence, there is an increasing trend toward classifying ANCA-associated vasculitis into PR3-associated or MPO-associated vasculitis rather than as GPA, MPA, EGPA, or renal-limited vasculitis.40
Several audits have shown that the ANCA test is widely misused and requested indiscriminately to rule out vasculitis. This results in a lower positive predictive value, possible harm to patients due to increased false-positive rates, and increased burden on the laboratory.41–43 At least 2 separate groups have demonstrated that a gating policy that refuses ANCA testing in patients without clinical evidence of systemic vasculitis can reduce the number of inappropriate requests, improve the diagnostic yield, and make it more clinically relevant and cost-effective.44,45
The clinician should bear in mind that:
Current guidelines recommend using one of the antigen-specific assays for PR3 and MPO as the primary screening method.48 Until recently, indirect immunofluorescence was used to screen for ANCA-associated vasculitis, and positive results were confirmed by ELISA to detect ANCAs specific for PR3 and MPO,49 but this is no longer recommended because of recent evidence suggesting a large variability between the different indirect immunofluorescent methods and improved diagnostic performance of the antigen-specific assays.
In a large multicenter study by Damoiseaux et al, the specificity with the different antigen-specific immunoassays was 98% to 99% for PR3-ANCA and 96% to 99% for MPO-ANCA.50
ANCA-associated vasculitis should not be considered excluded if the PR3 and MPO-ANCA are negative. In the Damoiseaux study, about 11% to 15% of patients with GPA and 8% to 24% of patients with MPA tested negative for both PR3 and MPO-ANCA.50
If the ANCA result is negative and clinical suspicion for ANCA-associated vasculitis is high, the clinician may wish to consider requesting another immunoassay method or indirect immunofluorescence. Results of indirect immunofluorescent testing results may be positive in those with a negative immunoassay, and vice versa.
Thus, the ANCA result should always be interpreted in the context of the whole clinical picture.51 Biopsy should still be considered the gold standard for the diagnosis of ANCA-associated vasculitis. The ANCA titer can help to improve clinical interpretation, because the likelihood of ANCA-associated vasculitis increases with higher levels of PR3 and MPO-ANCA.52
Back to our patient
Our patient’s blood cultures grow methicillin-sensitive Staphylococcus aureus in both sets after 48 hours. Transthoracic echocardiography reveals vegetations around the tricuspid valve, with no evidence of valvular regurgitation. The diagnosis is right-sided infective endocarditis. He is started on appropriate antibiotics.
Tests for human immunodeficiency virus, hepatitis B, and hepatitis C are negative. The ANCA test is positive for MPO-ANCA at 28 IU/mL (normal < 10).
The positive ANCA is thought to be related to the infective endocarditis. His vasculitis is most likely secondary to infective endocarditis and not ANCA-associated vasculitis. The ANCA test need not have been requested in the first place.
HUMAN LEUKOCYTE ANTIGEN-B27
A 22-year-old man presents to his primary care physician with a 4-month history of gradually worsening low back pain associated with early morning stiffness lasting more than 2 hours. He has no peripheral joint symptoms.
In the last 2 years, he has had 2 separate episodes of uveitis. There is a family history of ankylosing spondylitis in his father. Examination reveals global restriction of lumbar movements but is otherwise unremarkable. Magnetic resonance imaging (MRI) of the lumbar spine and sacroiliac joints is normal.
Should this patient be tested for human leukocyte antigen-B27 (HLA-B27)?
The major histocompatibility complex (MHC) is a gene complex that is present in all animals. It encodes proteins that help with immunologic tolerance. HLA simply refers to the human version of the MHC.53 The HLA gene complex, located on chromosome 6, is categorized into class I, class II, and class III. HLA-B is one of the 3 class I genes. Thus, a positive HLA-B27 result simply means that the particular gene is present in that person.
HLA-B27 is strongly associated with ankylosing spondylitis, also known as axial spondyloarthropathy.54 Other genes also contribute to the pathogenesis of ankylosing spondylitis, but HLA-B27 is present in more than 90% of patients with this disease and is by far considered the most important. The association is not as strong for peripheral spondyloarthropathy, with studies reporting a frequency of up to 75% for reactive arthritis and inflammatory bowel disease-associated arthritis, and up to 50% for psoriatic arthritis and uveitis.55
About 9% of healthy, asymptomatic individuals may have HLA-B27, so the mere presence of this gene is not evidence of disease.56 There may be up to a 20-fold increased risk of ankylosing spondylitis among those who are HLA-B27-positive.57
Some HLA genes have many different alleles, each of which is given a number (explaining the number 27 that follows the B). Closely related alleles that differ from one another by only a few amino-acid substitutions are then categorized together, thus accounting for more than 100 subtypes of HLA-B27 (designated from HLA-B*2701 to HLA-B*27106). These subtypes vary in frequency among different racial groups, and the population prevalence of ankylosing spondylitis parallels the frequency of HLA-B27.58 The most common subtype seen in white people and American Indians is B*2705. HLA-B27 is rare in blacks, explaining the rarity of ankylosing spondylitis in this population. Further examples include HLA-B*2704, which is seen in Asians, and HLA-B*2702, seen in Mediterranean populations. Not all subtypes of HLA-B27 are associated with disease, and some, like HLA-B*2706, may also be protective.
When should the clinician consider testing for HLA-B27?
Peripheral spondyloarthropathy may present with arthritis, enthesitis (eg, heel pain due to inflammation at the site of insertion of the Achilles tendon or plantar fascia), or dactylitis (“sausage” swelling of the whole finger or toe due to extension of inflammation beyond the margins of the joint). Other clues may include psoriasis, inflammatory bowel disease, history of preceding gastrointestinal or genitourinary infection, family history of similar conditions, and history of recurrent uveitis.
For the initial assessment of patients who have inflammatory back pain, plain radiography of the sacroiliac joints is considered the gold standard.59 If plain radiography does not show evidence of sacroiliitis, MRI of the sacroiliac joints should be considered. While plain radiography can reveal only structural changes such as sclerosis, erosions, and ankylosis, MRI is useful to evaluate for early inflammatory changes such as bone marrow edema. Imaging the lumbar spine is not necessary, as the sacroiliac joints are almost invariably involved in axial spondyloarthropathy, and lesions seldom occur in the lumbar spine in isolation.60
The diagnosis of ankylosing spondylitis previously relied on confirmatory imaging features, but based on the new International Society classification criteria,61–63 which can be applied to patients with more than 3 months of back pain and age of onset of symptoms before age 45, patients can be classified as having 1 of the following:
- Radiographic axial spondyloarthropathy, if they have evidence of sacroiliitis on imaging plus 1 other feature of spondyloarthropathy
- Nonradiographic axial spondyloarthropathy, if they have a positive HLA-B27 plus 2 other features of spondyloarthropathy (Table 7).
These new criteria have a sensitivity of 82.9% and specificity of 84.4%.62,63 The disease burden of radiographic and nonradiographic axial spondyloarthropathy has been shown to be similar, suggesting that they are part of the same disease spectrum. Thus, the HLA-B27 test is useful to make a diagnosis of axial spondyloarthropathy even in the absence of imaging features and could be requested in patients with 2 or more features of spondyloarthropathy. In the absence of imaging features and a negative HLA-B27 result, however, the patient cannot be classified as having axial spondyloarthropathy.
Back to our patient
The absence of radiographic evidence would not exclude axial spondyloarthropathy in our patient. The HLA-B27 test is requested because of the inflammatory back pain and the presence of 2 spondyloarthropathy features (uveitis and the family history) and is reported to be positive. His disease is classified as nonradiographic axial spondyloarthropathy.
He is started on regular naproxen and is referred to a physiotherapist. After 1 month, he reports significant symptomatic improvement. He asks if he can be retested for HLA-B27 to see if it has become negative. We tell him that there is no point in repeating it, as it is a gene and will not disappear.
SUMMARY: CONSIDER THE CLINICAL PICTURE
When approaching a patient suspected of having a rheumatologic disease, a clinician should first consider the clinical presentation and the intended purpose of each test. The tests, in general, might serve several purposes. They might help to:
Increase the likelihood of the diagnosis in question. For example, a positive rheumatoid factor or anticitrullinated peptide antibody can help diagnose rheumatoid arthritis in a patient with early polyarthritis, a positive HLA-B27 can help diagnose ankylosing spondylitis in patients with inflammatory back pain and normal imaging, and a positive ANCA can help diagnose ANCA-associated vasculitis in a patient with glomerulonephritis.
Reduce the likelihood of the diagnosis in question. For example, a negative antinuclear antibody test reduces the likelihood of lupus in a patient with joint pains.
Monitor the condition. For example DNA antibodies can be used to monitor the activity of lupus.
Plan the treatment strategy. For example, one might consider lifelong anticoagulation if antiphospholipid antibodies are persistently positive in a patient with thrombosis.
Prognosticate. For example, positive rheumatoid factor and anticitrullinated peptide antibody increase the risk of erosive rheumatoid arthritis.
If the test was requested in the absence of a clear indication and the result is positive, it is important to bear in mind the potential pitfalls associated with that test and not attach a diagnostic label prematurely. None of the tests can confirm or exclude a condition, so the results should always be interpreted in the context of the whole clinical picture.
- American College of Rheumatology Ad Hoc Committee on Immunologic Testing Guidelines. Guidelines for immunologic laboratory testing in the rheumatic diseases: an introduction. Arthritis Rheum 2002; 47(4):429–433. doi:10.1002/art.10381
- Rang M. The Ulysses syndrome. Can Med Assoc J 1972; 106(2):122–123. pmid:5058884
- Ingegnoli F, Castelli R, Gualtierotti R. Rheumatoid factors: clinical applications. Dis Markers 2013; 35(6):727–734. doi:10.1155/2013/726598
- Nishimura K, Sugiyama D, Kogata Y, et al. Meta-analysis: diagnostic accuracy of anti-cyclic citrullinated peptide antibody and rheumatoid factor for rheumatoid arthritis. Ann Intern Med 2007; 146(11):797–808. pmid:17548411
- Taylor P, Gartemann J, Hsieh J, Creeden J. A systematic review of serum biomarkers anti-cyclic citrullinated Peptide and rheumatoid factor as tests for rheumatoid arthritis. Autoimmune Dis 2011; 2011:815038. doi:10.4061/2011/815038
- Rantapää-Dahlqvist S, de Jong BA, Berglin E, et al. Antibodies against cyclic citrullinated peptide and IgA rheumatoid factor predict the development of rheumatoid arthritis. Arthritis Rheum 2003; 48(10):2741–2749. doi:10.1002/art.11223
- Suresh E. Diagnosis of early rheumatoid arthritis: what the non-specialist needs to know. J R Soc Med 2004; 97(9):421–424. doi:10.1258/jrsm.97.9.421
- Emery P, Breedveld FC, Dougados M, Kalden JR, Schiff MH, Smolen JS. Early referral recommendation for newly diagnosed rheumatoid arthritis: evidence based development of a clinical guide. Ann Rheum Dis 2002; 61(4):290–297. pmid:11874828
- Combe B, Landewe R, Daien CI, et al. 2016 update of the EULAR recommendations for the management of early arthritis. Ann Rheum Dis 2017; 76(6):948–959. doi:10.1136/annrheumdis-2016-210602
- Egsmose C, Lund B, Borg G, et al. Patients with rheumatoid arthritis benefit from early 2nd line therapy: 5 year follow up of a prospective double blind placebo controlled study. J Rheumatol 1995; 22(12):2208–2213. pmid:8835550
- van der Heide A, Jacobs JW, Bijlsma JW, et al. The effectiveness of early treatment with “second-line” antirheumatic drugs. A randomized, controlled trial. Ann Intern Med 1996; 124(8):699–707. pmid:8633829
- Andreson JJ, Wells G, Verhoeven AC, Felson DT. Factors predicting response to treatment in rheumatoid arthritis: the importance of disease duration. Arthritis Rheum 2000; 43(1):22–29. doi:10.1002/1529-0131(200001)43:1<22::AID-ANR4>3.0.CO;2-9
- Aletaha D, Neogi T, Silman AJ, et al. 2010 Rheumatoid arthritis classification criteria: an American College of Rheumatology/European League Against Rheumatism collaborative initiative. Arthritis Rheum 2010; 62(9):2569–2581. doi:10.1002/art.27584
- Nielen MM, van Schaardenburg D, Reesink HW, et al. Specific autoantibodies precede the symptoms of rheumatoid arthritis: a study of serial measurements in blood donors. Arthritis Rheum 2004; 50(2):380–386. doi:10.1002/art.20018
- del Puente A, Knowler WC, Pettitt DJ, Bennett PH. The incidence of rheumatoid arthritis is predicted by rheumatoid factor titer in a longitudinal population study. Arthritis Rheum 1988; 31(10):1239–1244. pmid:3178905
- Deane KD, Norris JM, Holers VM. Preclinical rheumatoid arthritis: identification, evaluation, and future directions for investigation. Rheum Dis Clin North Am 2010; 36(2):213–241. doi:10.1016/j.rdc.2010.02.001
- Kavanaugh A, Tomar R, Reveille J, Solomon DH, Homburger HA. Guidelines for clinical use of the antinuclear antibody test and tests for specific autoantibodies to nuclear antigens. American College of Pathologists. Arch Pathol Lab Med 2000; 124(1):71–81. doi:10.1043/0003-9985(2000)124<0071:GFCUOT>2.0.CO;2
- Suresh E. Systemic lupus erythematosus: diagnosis for the non-specialist. Br J Hosp Med (Lond) 2007; 68(10):538–541. doi:10.12968/hmed.2007.68.10.27324
- Illei GG, Klippel JH. Why is the ANA result positive? Bull Rheum Dis 1999; 48(1):1–4. pmid:10028188
- Tan EM, Feltkamp TE, Smolen JS, et al. Range of antinuclear antibodies in “healthy” individuals. Arthritis Rheum 1997; 40(9):1601–1611. doi:10.1002/art.1780400909
- Langkilde H, Voss A, Heegaard N, Laustrup H. Autoantibodies persist in relatives to systemic lupus erythematosus patients during 12 years follow-up. Lupus 2017; 26(7):723–728. doi:10.1177/0961203316676378
- Rondeel JM. Immunofluorescence versus ELISA for the detection of antinuclear antigens. Expert Rev Mol Diagn 2002; 2(3):226–232. doi:10.1586/14737159.2.3.226
- Solomon DH, Kavanaugh AJ, Schur PH; American College of Rheumatology Ad Hoc Committee on Immunologic Testing Guidelines. Evidence-based guidelines for the use of immunologic tests: antinuclear antibody testing. Arthritis Rheum 2002; 47(4):434–444. doi:10.1002/art.10561
- Slater CA, Davis RB, Shmerling RH. Antinuclear antibody testing. A study of clinical utility. Arch Intern Med 1996; 156(13):1421–1425. pmid:8678710
- Maddison PJ. Is it SLE? Best Pract Res Clin Rheumatol 2002; 16(2):167–180. doi:10.1053/berh.2001.0219
- Price E, Walker E. Diagnostic vertigo: the journey to diagnosis in systemic lupus erythematosus. Health (London) 2014; 18(3):223–239. doi:10.1177/1363459313488008
- Blumenthal DE. Tired, aching, ANA-positive: does your patient have lupus or fibromyalgia? Cleve Clin J Med 2002; 69(2):143–146, 151–152. pmid:11990644
- Miyakis S, Lockshin MD, Atsumi T, et al. International consensus statement on an update of the classification criteria for definite antiphospholipid syndrome (APS). J Thromb Haemost 2006; 4(2):295–306. doi:10.1111/j.1538-7836.2006.01753.x
- Keeling D, Mackie I, Moore GW, Greer IA, Greaves M; British Committee for Standards in Haematology. Guidelines on the investigation and management of antiphospholipid syndrome. Br J Haematol 2012; 157(1):47–58. doi:10.1111/j.1365-2141.2012.09037.x
- Giannakopoulos B, Passam F, Iannou Y, Krillis SA. How we diagnose the antiphospholipid syndrome. Blood 2009; 113(5):985–994. doi:10.1182/blood-2007-12-129627
- Biggioggero M, Meroni PL. The geoepidemiology of the antiphospholipid antibody syndrome. Autoimmun Rev 2010; 9(5):A299–A304. doi:10.1016/j.autrev.2009.11.013
- Pengo V, Ruffatti A, Legnani C, et al. Incidence of a first thromboembolic event in asymptomatic carriers of high-risk antiphospholipid antibody profile: a multicenter prospective study. Blood 2011; 118(17):4714–4718. doi:10.1182/blood-2011-03-340232
- Pengo V, Ruffatti A, Legnani C, et al. Clinical course of high-risk patients diagnosed with antiphospholipid syndrome. J Thromb Haemost 2010; 8(2):237–242. doi:10.1111/j.1538-7836.2009.03674.x
- Galli M, Luciani D, Bertolini G, Barbui T. Lupus anticoagulants are stronger risk factors for thrombosis than anticardiolipin antibodies in the antiphospholipid syndrome: a systematic review of the literature. Blood 2003; 101(5):1827–1832. doi:10.1182/blood-2002-02-0441
- Garcia D, Erkan D. Diagnosis and management of the antiphospholipid syndrome. N Engl J Med 2018; 378(21):2010–2021. doi:10.1056/NEJMra1705454
- Garcia D, Akl EA, Carr R, Kearon C. Antiphospholipid antibodies and the risk of recurrence after a first episode of venous thromboembolism: a systematic review. Blood 2013; 122(5):817–824. doi:10.1182/blood-2013-04-496257
- Cervera R. Lessons from the “Euro-Phospholipid” project. Autoimmun Rev 2008; 7(3):174–178. doi:10.1016/j.autrev.2007.11.011
- Andreoli L, Chighizola CB, Banzato A, Pons-Estel GJ, Ramire de Jesus G, Erkan D. Estimated frequency of antiphospholipid antibodies in patients with pregnancy morbidity, stroke, myocardial infarction, and deep vein thrombosis: a critical review of the literature. Arthritis Care Res (Hoboken) 2013; 65(11):1869–1873. doi:10.1002/acr.22066
- Miller A, Chan M, Wiik A, Misbah SA, Luqmani RA. An approach to the diagnosis and management of systemic vasculitis. Clin Exp Immunol 2010; 160(2):143–160. doi:10.1111/j.1365-2249.2009.04078.x
- Cornec D, Cornec-Le-Gall E, Fervenza FC, Specks U. ANCA-associated vasculitis—clinical utility of using ANCA specificity to classify patients. Nat Rev Rheumatol 2016; 12(10):570–579. doi:10.1038/nrrheum.2016.123
- Edgar JD, McMillan SA, Bruce IN, Conlan SK. An audit of ANCA in routine clinical practice. Postgrad Med J 1995; 71(840):605–612. pmid:8545289
- McLaren JS, Stimson RH, McRorie ER, Coia JE, Luqmani RA. The diagnostic value of anti-neutrophil cytoplasmic testing in a routine clinical setting. QJM 2001; 94(11):615–621. pmid:11704691
- Mandl LA, Solomon DH, Smith EL, Lew RA, Katz JN, Shmerling RH. Using antineutrophil cytoplasmic antibody testing to diagnose vasculitis: can test-ordering guidelines improve diagnostic accuracy? Arch Intern Med 2002; 162(13):1509–1514. pmid:12090888
- Sinclair D, Saas M, Stevens JM. The effect of a symptom related “gated policy” on ANCA requests in routine clinical practice. J Clin Pathol 2004; 57(2):131–134. pmid:14747434
- Arnold DF, Timms A, Luqmani R, Misbah SA. Does a gating policy for ANCA overlook patients with ANCA associated vasculitis? An audit of 263 patients. J Clin Pathol 2010; 63(8):678–680. doi:10.1136/jcp.2009.072504
- Savige J, Gills D, Benson E, et al. International consensus statement on testing and reporting of antineutrophil cytoplasmic antibodies (ANCA). Am J Clin Pathol 1999; 111(4):507–513. pmid:10191771
- Robinson PC, Steele RH. Appropriateness of antineutrophil cytoplasmic antibody testing in a tertiary hospital. J Clin Pathol 2009; 62(8):743–745. doi:10.1136/jcp.2009.064485
- Bossuyt X, Cohen Tervaert JW, Arimura Y, et al. Position paper: revised 2017 international consensus on testing of ANCAs in granulomatosis with polyangiitis and microscopic polyangiitis. Nat Rev Rheumatol 2017; 13(11):683–692. doi:10.1038/nrrheum.2017.140
- Hagen EC, Daha MR, Hermans J, et al. Diagnostic value of standardized assays for anti-neutrophil cytoplasmic antibodies in idiopathic systemic vasculitis. EC/BCR Project for ANCA Assay Standardization. Kidney Int 1998; 53(3):743–753. doi:10.1046/j.1523-1755.1998.00807.x
- Damoiseaux J, Csemok E, Rasmussen N, et al. Detection of antineutrophil antibodies (ANCAs): a multicentre European Vasculitis Study Group (EUVAS) evaluation of the value of indirect immunofluorescence (IIF) versus antigen specific immunoassays. Ann Rheum Dis 2017; 76(4):647–653. doi:10.1136/annrheumdis-2016-209507
- Suresh E. Diagnostic approach to patients with suspected vasculitis. Postgrad Med J 2006; 82(970):483–488. doi:10.1136/pgmj.2005.042648
- Vermeersch P, Blockmans D, Bossuyt X. Use of likelihood ratios can improve the clinical usefulness of enzyme immunoassays for the diagnosis of small-vessel vasculitis. Clin Chem 2009; 55(10):1886–1888. doi:10.1373/clinchem.2009.130583
- Bowness P. HLA-B27. Annu Rev Immunol 2015; 33:29–48. doi:10.1146/annurev-immunol-032414-112110
- Sieper J, Poddubnyy D. Axial spondyloarthritis. Lancet 2017; 390(10089):73–84. doi:10.1016/S0140-6736(16)31591-4
- Khan MA. Thoughts concerning the early diagnosis of ankylosing spondylitis and related diseases. Clin Exp Rheumatol 2002; 20(6 suppl 28):S6–S10. pmid:12463439
- Braun J, Bollow M, Remlinger G, et al. Prevalence of spondyloarthropathies in HLA-B27 positive and negative blood donors. Arthritis Rheum 1998; 41(1):58–67. doi:10.1002/1529-0131(199801)41:1<58::AID-ART8>3.0.CO;2-G
- van der Linden SM, Valkenburg HA, de Jongh BM, Cats A. The risk of developing ankylosing spondylitis in HLA-B27 positive individuals. A comparison of relatives of spondylitis patients with the general population. Arthritis Rheum 1984; 27(3):241–249. pmid:6608352
- Sheehan NJ. HLA-B27: what’s new? Rheumatology (Oxford) 2010; 49(4):621–631. doi:10.1093/rheumatology/kep450
- Baraliakos X, Maksymmowych WP. Imaging in the diagnosis and management of axial spondyloarthritis. Best Pract Res Clin Rheumatol 2016; 30(4):608–623. doi:10.1016/j.berh.2016.09.011
- Mandl P, Navarro-Compan V, Terslev L, et al; European League Against Rheumatism (EULAR). EULAR recommendations for the use of imaging in the diagnosis and management of spondyloarthritis in clinical practice. Ann Rheum Dis 2015; 74(7):1327–1339. doi:10.1136/annrheumdis-2014-206971
- McAllister K, Goodson N, Warburton I, Rogers G. Spondyloarthritis: diagnosis and management: summary of NICE guidance. BMJ 2017; 356:j839. doi:10.1136/bmj.j839
- Poddubnyy D, van Tubergen A, Landewé R, Sieper J, van der Heijde D; Assessment of SpondyloArthritis international Society (ASAS). Development of an ASAS-endorsed recommendation for the early referral of patients with a suspicion of axial spondyloarthritis. Ann Rheum Dis 2015; 74(8):1483–1487. doi:10.1136/annrheumdis-2014-207151
- Rudwaleit M, van der Heijde D, Landewe R, et al. The development of Assessment of SpondyloArthritis International Society classification criteria for axial spondyloarthritis (part II): validation and final selection. Ann Rheum Dis 2009; 68(6):777–783. doi:10.1136/ard.2009.108233
KEY POINTS
- If a test was requested without a clear indication and the result is positive, it is important to bear in mind the potential pitfalls associated with that test; immunologic tests have limited specificity.
- A positive rheumatoid factor or anticitrullinated peptide antibody test can help diagnose rheumatoid arthritis in a patient with early polyarthritis.
- A positive HLA-B27 test can help diagnose ankylosing spondylitis in patients with inflammatory back pain and normal imaging.
- Positive antinuclear cytoplasmic antibody (ANCA) can help diagnose ANCA-associated vasculitis in a patient with glomerulonephritis.
- A negative antinuclear antibody test reduces the likelihood of lupus in a patient with joint pain.

A paraneoplastic potassium and acid-base disturbance
NOTE: The scenario presented here is partly based on cases reported elsewhere by Martínez-Valles et al1 and Fernández-Rodríguez et al.2
A 55-year-old man is admitted to the hospital with generalized malaise, paresthesias, and severe hypertension. He says he had experienced agitation along with weakness on exertion 24 hours before presentation to the emergency department, with subsequent onset of paresthesias in his lower extremities and perioral area.
He is already known to have mild chronic obstructive pulmonary disease, with a ratio of forced expiratory volume in 1 second (FEV1)to forced vital capacity (FVC) of less than 70% and an FEV1 85% of predicted. In addition, he was recently diagnosed with diabetes, resistant hypertension requiring maximum doses of 3 agents (a calcium channel blocker, an angiotensin-converting enzyme inhibitor, and a loop diuretic), and hyperlipidemia.
He is a current smoker with a 30-pack-year smoking history. He does not use alcohol. His family history is noncontributory.

ASSESSING ACID-BASE DISORDERS
1. What type of acid-base disorder does this patient have?
- Metabolic acidosis
- Respiratory acidosis
- Metabolic alkalosis
- Respiratory alkalosis
The patient has metabolic alkalosis.
A 5-step approach

1. Acidosis or alkalosis? The patient’s arterial pH is 7.5, which is alkalemic because it is higher than 7.44.
2. Metabolic or respiratory? The primary process in our patient is overwhelmingly metabolic, as his partial pressure of carbon dioxide (Pco2) is slightly elevated, a direction that would cause acidosis, not alkalosis.
3. The anion gap (the serum sodium concentration minus the sum of the chloride and bicarbonate concentrations) is normal at 8 mmol/L (DRG:HYBRiD-XL Immunoassay and Clinical Chemistry Analyzer, reference range 8–16).
4. Is the disturbance compensated? We have determined that this patient has a metabolic alkalemia; the question now is whether there is any compensation for the primary disturbance.
In metabolic alkalosis, the Pco2 may increase by approximately 0.6 mm Hg (range 0.5–0.8) above the nominal normal level of 40 mm Hg for each 1-mmol/L increase in bicarbonate above the nominal normal level of 25 mmol/L.4 If the patient requires oxygen, the calculation may be unreliable, however, as hypoxemia may have an overriding influence on respiratory drive.
Patients with chronically high Pco2 levels such as those with chronic obstructive pulmonary disease can become accustomed to high carbon dioxide levels and lose their hyper-
capnic respiratory drive. Giving oxygen supplementation is thought to decrease respiratory drive in these patients, so that they will breathe slower and retain more carbon dioxide. There is some degree of respiratory compensation for metabolic alkalosis that occurs by breathing less, though it is limited overall—even in very alkalotic patients, breathing less results in CO2 retention, which, by displacing O2 molecules in the alveoli, will in turn result in hypoxia. The brain then senses the hypoxia and makes one breathe faster, thereby limiting this compensation.
This patient’s serum bicarbonate level is 40 mmol/L, or 15 mmol/L higher than the nominal normal level. If he is compensating, his Pco2 should be 40 + (15 × 0.6) = 49 mm Hg, and in fact it is 51 mm Hg, which is within the normal range of expected compensation (47.5–52 mm Hg). Therefore, yes, he is compensating for the primary disturbance.
5. In metabolic acidosis, is there a delta gap? As our patient has metabolic alkalosis, not acidosis, this question does not apply in this case.
WHICH TEST TO FIND THE CAUSE?
2. Which is the best test to order next to determine the cause of this patient’s hypokalemic metabolic alkalosis?
- Serum magnesium level
- Spot urine chloride
- Renal ultrasonography
- 24-hour urine collection for sodium, potassium, and chloride

The patient’s loop diuretic is withheld for 12 hours and a spot urine chloride is obtained, which is reported as 44 mmol/L. This high value suggests that a volume-independent hypokalemic metabolic alkalosis is present with potassium depletion.
As for the other answer choices:
Serum magnesium. Though hypomagnesemia can cause hypokalemia due to lack of inhibition of renal outer medullary potassium channels and subsequent increased excretion of potassium in the apical tubular membrane, it is not independently associated with acid-base disturbances.5
Renal ultrasonography gives information about structural kidney disease but is of limited utility in identifying the cause of hypokalemic metabolic alkalosis.
A 24-hour urine collection is unnecessary in this setting and would ultimately result in delay in diagnosis, as spot urine chloride is a more efficient means of rapidly distinguishing volume-responsive vs volume-independent causes of hypokalemic metabolic alkalosis.6
IS HIS HYPERTENSION SECONDARY? IF SO, WHAT IS THE CAUSE?
Several features of this case suggest that the patient’s hypertension is secondary rather than primary. It is of recent onset. The patient’s family history is noncontributory, and his hypertension is resistant to the use of maximum doses of 3 antihypertensive agents.
3. Which of the following causes of secondary hypertension is not commonly associated with hypokalemia and metabolic alkalosis?
- Hyperaldosteronism
- Liddle syndrome
- Cushing syndrome
- Renal parenchymal disease
- Chronic licorice ingestion
Renal parenchymal disease is a cause of resistant hypertension, but it is not characterized by metabolic alkalosis, hypokalemia, and elevated urine chloride,7 while the others listed here—hyperaldosteronism, Liddle syndrome, Cushing syndrome, and chronic licorice ingestion—are. Other common causes of resistant hypertension without these metabolic abnormalities include obstructive sleep apnea, alcohol abuse, and nonadherence to treatment.
While treatment of hypertension with loop diuretics can result in hypokalemia and metabolic alkalosis due to the effect of these drugs on potassium reabsorption in the loop of Henle, the patient’s hypokalemia persisted after this agent was withdrawn.8
Causes of hypokalemic metabolic alkalosis with and without hypertension are further delineated in Figure 1.
Additional diagnostic testing: Plasma renin and plasma aldosterone
At this juncture, the differential diagnosis for this patient’s potassium depletion, metabolic alkalosis, high urine chloride, and hypertension has been narrowed to primary or secondary hyperaldosteronism, surreptitious mineralocorticoid ingestion, Cushing syndrome, licorice ingestion, Liddle syndrome, or one of the 3 hydroxylase deficiencies (11-, 17-, and 21-) (Figure 1).

Although clues in the history, physical examination, and imaging may suggest a specific cause of his abnormal laboratory values, the next step in the diagnostic workup is to measure the plasma renin and aldosterone levels (Table 3).
HYPERALDOSTERONISM
4. Hyperaldosteronism is associated with which of the following patterns of renin and aldosterone values?
- High renin, high aldosterone, normal ratio of plasma aldosterone concentration (PAC) to plasma renin activity (PRA)
- Low renin, low aldosterone, normal PAC–PRA ratio
- Low renin, high aldosterone, high PAC–PRA ratio
- High renin, low aldosterone, low PAC–PRA ratio
The pattern of low renin, high aldosterone, and high PAC–PRA ratio is associated with hyperaldosteronism.
Primary hyperaldosteronism
Primary hyperaldosteronism is one of the most common causes of resistant hypertension and is underappreciated, being diagnosed in up to 20% of patients referred to hypertension specialty clinics.7 Potassium levels may be normal, likely contributing to its lack of recognition in this target population.
Primary hyperaldosteronism should be suspected in patients who have a plasma aldosterone PAC–PRA ratio greater than 20 with elevated plasma aldosterone concentrations
(> 15 ng/dL).
Persistently elevated aldosterone levels in the setting of elevated plasma volume is proof that aldosterone secretion is independent of the renin-angiotensin-aldosterone axis, and therefore is autonomous (secondary to adrenal tumor or hyperplasia). Further testing in the form of oral salt loading, saline infusion, or fludrocortisone (a sodium-retaining steroid) administration is thus required to confirm inappropriate, autonomous aldosterone secretion.9
After establishing the diagnosis of primary hyperaldosteronism, one should determine the subtype (ie, due to an adrenal carcinoma, unilateral hypersecreting adenoma, or unilateral or bilateral hyperplasia). Further testing includes adrenal computed tomography (CT) to rule out adrenal carcinomas, which are suspected with adenomas larger than 4 cm. Though part of the diagnostic workup, CT as a means of confirmational testing alone does not preclude the possibility of bilateral adrenal hyperplasia in some patients, even in the presence of an adrenal adenoma. For this reason, adrenal venous sampling is required to definitively determine whether the condition is due to a hypersecreting adrenal adenoma or unilateral or bilateral hyperplasia.9,10
Treatment of primary hyperaldosteronism depends on the subtype of the disease and involves salt restriction in addition to an aldosterone antagonist (spironolactone or eplerenone in the case of bilateral disease) or surgery (unilateral disease).9,11,12
Secondary hyperaldosteronism
Secondary hyperaldosteronism should be suspected when plasma renin and aldosterone levels are both elevated with a PAC–PRA ratio less than 10.
This pattern is most commonly seen with diuretic use but can also be a consequence of renal artery stenosis or, rarely, a renin-secreting tumor.13 Renal artery stenosis is a common finding in patients with hypertension undergoing cardiac catheterization, which is not surprising as more than 90% of such stenoses are atherosclerotic.7 Renin-secreting tumors are exceedingly rare, with fewer than 100 cases reported in the literature, and are more common in younger individuals.13
Our patient has low-normal aldosterone and plasma renin
On further testing, this patient’s plasma aldosterone level is 2.55 ng/dL (normal < 15 ng/dL), his plasma renin activity is 0.53 ng/mL/hour (normal 0.2–2.8 ng/mL/hour), and his PAC–PRA ratio is therefore 4.81.
The categories discussed thus far have included primary and secondary hyperaldosteronism, which typically do not present with low to normal levels of both renin and aldosterone. Surreptitious mineralocorticoid use could present in this manner, but is unlikely in this patient, whose medications do not include fludrocortisone.
The low-normal values thus lead to consideration of a third category: apparent mineralocorticoid excess. Diseases in this category such as Cushing disease or adrenocorticotropic hormone (ACTH) excess are characterized by increases in corticosteroids so that the potassium depletion, metabolic alkalosis, and hypertension are not a consequence of renin and aldosterone but rather the excess corticosteroids.14
Causes of apparent mineralocorticoid excess
There are several possible causes of mineralocorticoid excess associated with hypertension and hypokalemic metabolic alkalosis not due to renin and aldosterone.
Chronic licorice ingestion in high volumes is one such cause and is thought to result in inhibition of 11B-hydroxysteroid dehydrogenase or possibly cortisol oxidase by licorice’s active component, glycyrrhetinic acid. This inhibition results in an inability to convert cortisol to cortisone. The cortisol excess binds to mineralocorticoid receptors, and acting like aldosterone, results in hypertension and hypokalemic metabolic alkalosis as well as feedback inhibition of renin and aldosterone levels.15
Partial hydroxylase deficiencies, though rare, should also be considered as a cause of hypokalemic metabolic alkalosis, hypertension, and, potentially, hirsutism and clitoromegaly in women. They can be diagnosed with elevated levels of 17-ketosteroids and dehydroepiandrosterone sulfate, both of which, in excess, may act on aldosterone receptors in a manner similar to cortisol.16
Liddle syndrome, a rare autosomal dominant condition, may also present with suppressed levels of both renin and aldosterone. In contrast to the disorders of nonaldosterone mineralocorticoid excess, however, the sodium channel defect in Liddle syndrome is characterized by a primary increase in sodium reabsorption in the collecting tubule and potassium wasting. The resultant volume expansion leads to suppressed renin and aldosterone levels and hypertension with low potassium and elevated bicarbonate concentrations.17
Liddle syndrome is commonly diagnosed in childhood but may go unrecognized due to occasional absence of hypokalemia at presentation. Potassium-sparing diuretics such as amiloride or triamterene are the mainstays of treatment.18


Rates of cardiovascular and all-cause mortality are increased in patients with long-term hypercortisolism, even after plasma concentrations of cortisol are normalized.21
Figure 2 shows the cascade of the hypothalamic-pituitary-adrenal axis.
TESTING FOR HYPERCORTISOLISM IN OUR PATIENT
Given the patient’s clinical presentation and laboratory and imaging findings with normal plasma renin and aldosterone levels, a workup for suspected hypercortisolism is initiated.
Initial diagnostic testing for hypercortisolism depends on the degree of clinical suspicion. In those with low probability of the disease, testing should consist of 1 of the following, as a single negative test may be sufficient to rule out the disease:
- 24-hour urinary cortisol levels
- Overnight dexamethasone suppression testing
- Late-night salivary cortisol measurements.
In those with a high index of suspicion, 2 of the aforementioned tests should be performed, as 1 normal result may not be sufficient to exclude the diagnosis.22,23
A 24-hour urinary cortisol collection and overnight dexamethasone suppression test are obtained. His 24-hour urinary free cortisol level is elevated at 6,600 µg (normal 4–100), and suppression testing with 8 mg of dexamethasone (a form of “high-dose” testing)demonstrates only an 8% decline in serum cortisol levels. Cortisol should generally drop more than 90%.
Morning serum cortisol concentration is less than 5 µg/dL (140 nmol/L) in most patients with Cushing disease (ie, a pituitary tumor), and is usually undetectable in normal subjects. Only about 50% of neuroendocrine ACTH-secreting tumors will suppress with this test.
The patient’s clinical presentation, in conjunction with his diagnostic testing, are thus consistent with Cushing syndrome.
CUSHING SYNDROME
Cushing syndrome is most often exogenous or iatrogenic, ie, a result of supraphysiologic doses of glucocorticoids used to treat a variety of inflammatory, autoimmune, and neoplastic conditions.
Endogenous Cushing syndrome, on the other hand, is rare, with an estimated prevalence of 0.7 to 2.4 cases per million per year. ACTH-dependent causes account for 80% of endogenous Cushing syndrome cases, with ACTH-secreting pituitary adenomas (Cushing disease) accounting for 75% to 80% and ectopic ACTH secretion accounting for 15% to 20%. Less than 1% of cases are due to tumors that produce corticotropin-releasing hormone (CRH).
ACTH-independent Cushing syndrome is diagnosed in 20% of endogenous cases and is most commonly caused by a unilateral adrenal tumor. Rare causes of ACTH-independent disease include adrenal carcinoma, McCune-Albright syndrome, and adrenal hyperplasia.24
The patient’s ACTH is high
To determine whether this is an ACTH-dependent or independent process, the next step is to order an ACTH level. His ACTH level is high at 107 pg/mL (normal < 46 pg/mL), confirming the diagnosis of ACTH-dependent Cushing syndrome.
To find out if this ACTH-dependent process is due to a pituitary adenoma, magnetic resonance imaging (MRI) of the pituitary is obtained but is normal.
Large masses (> 6 mm) strongly suggest Cushing disease, but these tumors are often small and may be missed even with more advanced imaging techniques. Corticotropin-secreting adenomas arising from normal cells in the pituitary retain some sensitivity to glucocorticoid negative feedback and CRH stimulation, and thus high-dose dexamethasone suppression testing in conjunction with CRH stimulation testing can be used to differentiate Cushing disease from ectopic ACTH secretion.24,25 Both of these tests have poor diagnostic accuracy, however, and thus inferior petrosal sampling remains the gold standard for the diagnosis of Cushing disease.

ACTH-SECRETING TUMORS
5. Cushing syndrome due to ectopic ACTH secretion is most commonly attributed to which of the following tumors?
- Small-cell lung carcinoma
- Pancreatic carcinoma
- Medullary thyroid carcinoma
- Gastrinoma
Severe cases of Cushing syndrome are often attributable to ectopic ACTH secretion due to an underlying malignancy, most commonly small-cell lung carcinoma or neuroendocrine tumors of pulmonary origin. Other causes include pancreatic and thymic neuroendocrine tumors, gastrinomas, and medullary thyroid carcinoma.25,26
Because most ACTH-producing tumors are intrathoracic, initial imaging in cases of suspected ectopic ACTH secretion should focus on the chest, with CT the usual first choice. Octreotide scintigraphy can also be useful in localizing disease, as many neuroendocrine tumors express somatostatin receptors. Specialized positron-emission tomography scans may also be helpful in tumor identification.24
TREATMENT OF CUSHING SYNDROME DUE TO ECTOPIC ACTH SECRETION
6. Which of the following is most appropriate medical therapy for suppression of cortisol secretion in Cushing syndrome due to ectopic ACTH secretion?
- Spironolactone
- Dexamethasone
- Somatostatin
- Estrogen
- Ketoconazole
Hyperglycemia, hypokalemia, hypertension, psychiatric disturbances, venous thromboembolism, and systemic infections appear to be common in ectopic ACTH syndrome and often correlate with the degree of hypercortisolemia. Severe Cushing syndrome due to ectopic ACTH secretion is an emergency requiring prompt control of cortisol secretion.
First-line treatments include steroidogenesis inhibitors (ketoconazole, metyrapone, etomidate, mitotane) and glucocorticoid receptor antagonists (mifepristone). High-dose spironolactone and eplerenone can also be used to treat the hypertension and hypokalemia associated with mineralocorticoid receptor stimulation. Definitive treatment involves surgical resection, chemotherapy, or radiotherapy when applicable.24,25
After confirmation of the diagnosis, the patient is prescribed ketoconazole and spironolactone, with substantial improvement. He subsequently is started on combination chemotherapy and radiation therapy for his small-cell lung carcinoma.
DISCUSSION
The differential diagnosis for hypokalemia is broad and relies on information obtained during the history and physical examination, followed by interpretation of selected laboratory results. Myriad pathologies in diverse organ systems, eg, diarrhea, renal tubular acidosis, and adrenal disease, may be responsible for a low serum potassium. Further categorizing potassium depletion on the basis of an associated acid-base disturbance, such as metabolic alkalosis, allows one to use an algorithmic approach that can identify specific etiologies responsible for both the potassium and the acid-base disturbances.
Using the spot urine chloride in the setting of hypokalemic metabolic alkalosis with or without hypertension can narrow the differential diagnosis and allow additional clinical findings to guide clinical problem-solving and decision-making, even for conditions not commonly encountered in routine medical practice.
Obtaining renin and aldosterone measurements in patients with potassium depletion, metabolic alkalosis, high urine chloride excretion, and hypertension permits further categorization into 3 clinical groups: elevated aldosterone and renin (secondary hyperaldosteronism), elevated aldosterone and low renin (primary hyperaldosteronism), or apparent mineralocorticoid excess wherein neither renin nor aldosterone are responsible for the syndrome.
The patient in our case had apparent mineralocorticoid excess as a consequence of an ACTH-producing small-cell carcinoma.
- Martínez-Valles MA, Palafox-Cazarez A, Paredes-Avina JA. Severe hypokalemia, metabolic alkalosis and hypertension in a 54 year old male with ectopic ACTH syndrome: a case report. Cases J 2009; 2:6174. doi:10.4076/1757-1626-2-6174
- Fernández-Rodríguez E, Villar-Taibo R, Pinal-Osorio I, et al. Severe hypertension and hypokalemia as first clinical manifestations in ectopic Cushing’s syndrome. Arq Bras Endocrinol Metabol 2008; 52(6):1066–1070. pmid:18820819
- Mani S, Rutecki GW. A patient with altered mental status and an acid-base disturbance. Cleve Clin J Med 2017; 84(1):27–34. doi:10.3949/ccjm.84a.16042
- Adrogué HJ, Madias NE. Secondary responses to altered acid-base status: the rules of engagement. J Am Soc Nephrol 2010; 21(6):920–923. doi:10.1681/ASN.2009121211
- Huang CL, Kuo E. Mechanism of hypokalemia in magnesium deficiency. J Am Soc Nephrol 2007; 18(10):2649–2652. doi:10.1681/ASN.2007070792
- Rose BD. Metabolic alkalosis. In: Clinical Physiology of Acid-Base and Electrolyte Disorders. 4th ed. New York, NY: McGraw-Hill, Health Professions Division; 1994:515.
- Calhoun DA, Jones D, Textor S, et al; American Heart Association Professional Education Committee. Resistant hypertension: diagnosis, evaluation, and treatment: a scientific statement from the American Heart Association Professional Education Committee of the Council for High Blood Pressure Research. Circulation 2008; 117(25):e510–e526. doi:10.1161/CIRCULATIONAHA.108.189141
- Koeppen BM, Stanton BA. Physiology of diuretic action. In: Renal Physiology. 5th ed. Philadelphia, PA: Elsevier Inc; 2013:167–178.
- Blumenfeld JD, Sealey JE, Schlussel Y, et al. Diagnosis and treatment of primary hyperaldosteronism. Ann Intern Med 1994; 121(11):877–885. pmid:7978702
- Kempers MJ, Lenders JW, van Outheusden L, et al. Systematic review: diagnostic procedures to differentiate unilateral from bilateral adrenal abnormality in primary aldosteronism. Ann Intern Med 2009; 151(5):329–337. pmid:19721021
- Karagiannis A, Tziomalos K, Papageorgiou A, et al. Spironolactone versus eplerenone for the treatment of idiopathic hyperaldosteronism. Expert Opin Pharmacother 2008; 9(4):509–515. doi:10.1517/14656566.9.4.509
- Sawka AM, Young WF, Thompson GB, et al. Primary aldosteronism: factors associated with normalization of blood pressure after surgery. Ann Intern Med 2001; 135(4):258–261. pmid:11511140
- Haab F, Duclos JM, Guyenne T, Plouin PF, Corvol P. Renin secreting tumors: diagnosis, conservative surgical approach and long-term results. J Urol 1995; 153(6):1781–1784. pmid:7752315
- Sabbadin C, Armanini D. Syndromes that mimic an excess of mineralocorticoids. High Blood Press Cardiovasc Prev 2016; 23(3):231–235. doi:10.1007/s40292-016-0160-5
- Apostolakos JM, Caines LC. Apparent mineralocorticoid excess syndrome: a case of resistant hypertension from licorice tea consumption. J Clin Hypertens (Greenwich) 2016; 18(10):991–993. doi:10.1111/jch.12841
- Glatt K, Garzon DL, Popovic J. Congenital adrenal hyperplasia due to 21-hydroxylase deficiency. J Spec Pediatr Nurs 2005; 10(3):104–114. doi:10.1111/j.1744-6155.2005.00022.x
- Findling JW, Raff H, Hansson JH, Lifton RP. Liddle’s syndrome: prospective genetic screening and suppressed aldosterone secretion in an extended kindred. J Clin Endocrinol Metab 1997; 82(4):1071–1074. doi:10.1210/jcem.82.4.3862
- Wang C, Chan TK, Yeung RT, Coghlan JP, Scoggins BA, Stockigt JR. The effect of triamterene and sodium intake on renin, aldosterone, and erythrocyte sodium transport in Liddle’s syndrome. J Clin Endocrinol Metab 1981; 52(5):1027–1032. doi:10.1210/jcem-52-5-1027
- Torpy DJ, Mullen N, Ilias I, Nieman LK. Association of hypertension and hypokalemia with Cushing’s syndrome caused by ectopic ACTH secretion: a series of 58 cases. Ann N Y Acad Sci 2002; 970:134–144. pmid:12381548
- Saruta T, Suzuki H, Handa M, Igarashi Y, Kondo K, Senba S. Multiple factors contribute to the pathogenesis of hypertension in Cushing’s syndrome. J Clin Endocrinol Metab 1986; 62(2):275–279. doi:10.1210/jcem-62-2-275
- Clayton RN, Jones PW, Reulen RC, et al. Mortality in patients with Cushing’s disease more than 10 years after remission: a multicentre, multinational, retrospective cohort study. Lancet Diabetes Endocrinol 2016; 4(7):569–576. doi:10.1016/S2213-8587(16)30005-5
- Baid SK, Rubino D, Sinaii N, Ramsey S, Frank A, Nieman LK. Specificity of screening tests for Cushing’s syndrome in an overweight and obese population. J Clin Endocrinol Metab 2009; 94(10):3857–3864. doi:10.1210/jc.2008-2766
- Nieman LK, Biller BM, Findling JW, et al. The diagnosis of Cushing’s syndrome: an Endocrine Society Clinical Practice Guideline. J Clin Endocrinol Metab 2008; 93(5):1526–1540. doi:10.1210/jc.2008-0125
- Sharma ST, Nieman LK, Feelders RA. Cushing’s syndrome: epidemiology and developments in disease management. Clin Epidemiol 2015; 7:281–293. doi:10.2147/CLEP.S44336
- Tavares Bello C, van der Poest Clement E, Feelders R. Severe Cushing’s syndrome and bilateral pulmonary nodules: beyond ectopic ACTH. Endocrinol Diabetes Metab Case Rep 2017; pii:17–0100. doi:10.1530/EDM-17-0100
- Sathyakumar S, Paul TV, Asha HS, et al. Ectopic Cushing syndrome: a 10-year experience from a tertiary care center in southern India. Endocr Pract 2017; 23(8):907–914. doi:10.4158/EP161677.OR
NOTE: The scenario presented here is partly based on cases reported elsewhere by Martínez-Valles et al1 and Fernández-Rodríguez et al.2
A 55-year-old man is admitted to the hospital with generalized malaise, paresthesias, and severe hypertension. He says he had experienced agitation along with weakness on exertion 24 hours before presentation to the emergency department, with subsequent onset of paresthesias in his lower extremities and perioral area.
He is already known to have mild chronic obstructive pulmonary disease, with a ratio of forced expiratory volume in 1 second (FEV1)to forced vital capacity (FVC) of less than 70% and an FEV1 85% of predicted. In addition, he was recently diagnosed with diabetes, resistant hypertension requiring maximum doses of 3 agents (a calcium channel blocker, an angiotensin-converting enzyme inhibitor, and a loop diuretic), and hyperlipidemia.
He is a current smoker with a 30-pack-year smoking history. He does not use alcohol. His family history is noncontributory.
ASSESSING ACID-BASE DISORDERS
1. What type of acid-base disorder does this patient have?
- Metabolic acidosis
- Respiratory acidosis
- Metabolic alkalosis
- Respiratory alkalosis
The patient has metabolic alkalosis.
A 5-step approach
1. Acidosis or alkalosis? The patient’s arterial pH is 7.5, which is alkalemic because it is higher than 7.44.
2. Metabolic or respiratory? The primary process in our patient is overwhelmingly metabolic, as his partial pressure of carbon dioxide (Pco2) is slightly elevated, a direction that would cause acidosis, not alkalosis.
3. The anion gap (the serum sodium concentration minus the sum of the chloride and bicarbonate concentrations) is normal at 8 mmol/L (DRG:HYBRiD-XL Immunoassay and Clinical Chemistry Analyzer, reference range 8–16).
4. Is the disturbance compensated? We have determined that this patient has a metabolic alkalemia; the question now is whether there is any compensation for the primary disturbance.
In metabolic alkalosis, the Pco2 may increase by approximately 0.6 mm Hg (range 0.5–0.8) above the nominal normal level of 40 mm Hg for each 1-mmol/L increase in bicarbonate above the nominal normal level of 25 mmol/L.4 If the patient requires oxygen, the calculation may be unreliable, however, as hypoxemia may have an overriding influence on respiratory drive.
Patients with chronically high Pco2 levels such as those with chronic obstructive pulmonary disease can become accustomed to high carbon dioxide levels and lose their hyper-
capnic respiratory drive. Giving oxygen supplementation is thought to decrease respiratory drive in these patients, so that they will breathe slower and retain more carbon dioxide. There is some degree of respiratory compensation for metabolic alkalosis that occurs by breathing less, though it is limited overall—even in very alkalotic patients, breathing less results in CO2 retention, which, by displacing O2 molecules in the alveoli, will in turn result in hypoxia. The brain then senses the hypoxia and makes one breathe faster, thereby limiting this compensation.
This patient’s serum bicarbonate level is 40 mmol/L, or 15 mmol/L higher than the nominal normal level. If he is compensating, his Pco2 should be 40 + (15 × 0.6) = 49 mm Hg, and in fact it is 51 mm Hg, which is within the normal range of expected compensation (47.5–52 mm Hg). Therefore, yes, he is compensating for the primary disturbance.
5. In metabolic acidosis, is there a delta gap? As our patient has metabolic alkalosis, not acidosis, this question does not apply in this case.
WHICH TEST TO FIND THE CAUSE?
2. Which is the best test to order next to determine the cause of this patient’s hypokalemic metabolic alkalosis?
- Serum magnesium level
- Spot urine chloride
- Renal ultrasonography
- 24-hour urine collection for sodium, potassium, and chloride
The patient’s loop diuretic is withheld for 12 hours and a spot urine chloride is obtained, which is reported as 44 mmol/L. This high value suggests that a volume-independent hypokalemic metabolic alkalosis is present with potassium depletion.
As for the other answer choices:
Serum magnesium. Though hypomagnesemia can cause hypokalemia due to lack of inhibition of renal outer medullary potassium channels and subsequent increased excretion of potassium in the apical tubular membrane, it is not independently associated with acid-base disturbances.5
Renal ultrasonography gives information about structural kidney disease but is of limited utility in identifying the cause of hypokalemic metabolic alkalosis.
A 24-hour urine collection is unnecessary in this setting and would ultimately result in delay in diagnosis, as spot urine chloride is a more efficient means of rapidly distinguishing volume-responsive vs volume-independent causes of hypokalemic metabolic alkalosis.6
IS HIS HYPERTENSION SECONDARY? IF SO, WHAT IS THE CAUSE?
Several features of this case suggest that the patient’s hypertension is secondary rather than primary. It is of recent onset. The patient’s family history is noncontributory, and his hypertension is resistant to the use of maximum doses of 3 antihypertensive agents.
3. Which of the following causes of secondary hypertension is not commonly associated with hypokalemia and metabolic alkalosis?
- Hyperaldosteronism
- Liddle syndrome
- Cushing syndrome
- Renal parenchymal disease
- Chronic licorice ingestion
Renal parenchymal disease is a cause of resistant hypertension, but it is not characterized by metabolic alkalosis, hypokalemia, and elevated urine chloride,7 while the others listed here—hyperaldosteronism, Liddle syndrome, Cushing syndrome, and chronic licorice ingestion—are. Other common causes of resistant hypertension without these metabolic abnormalities include obstructive sleep apnea, alcohol abuse, and nonadherence to treatment.
While treatment of hypertension with loop diuretics can result in hypokalemia and metabolic alkalosis due to the effect of these drugs on potassium reabsorption in the loop of Henle, the patient’s hypokalemia persisted after this agent was withdrawn.8
Causes of hypokalemic metabolic alkalosis with and without hypertension are further delineated in Figure 1.
Additional diagnostic testing: Plasma renin and plasma aldosterone
At this juncture, the differential diagnosis for this patient’s potassium depletion, metabolic alkalosis, high urine chloride, and hypertension has been narrowed to primary or secondary hyperaldosteronism, surreptitious mineralocorticoid ingestion, Cushing syndrome, licorice ingestion, Liddle syndrome, or one of the 3 hydroxylase deficiencies (11-, 17-, and 21-) (Figure 1).
Although clues in the history, physical examination, and imaging may suggest a specific cause of his abnormal laboratory values, the next step in the diagnostic workup is to measure the plasma renin and aldosterone levels (Table 3).
HYPERALDOSTERONISM
4. Hyperaldosteronism is associated with which of the following patterns of renin and aldosterone values?
- High renin, high aldosterone, normal ratio of plasma aldosterone concentration (PAC) to plasma renin activity (PRA)
- Low renin, low aldosterone, normal PAC–PRA ratio
- Low renin, high aldosterone, high PAC–PRA ratio
- High renin, low aldosterone, low PAC–PRA ratio
The pattern of low renin, high aldosterone, and high PAC–PRA ratio is associated with hyperaldosteronism.
Primary hyperaldosteronism
Primary hyperaldosteronism is one of the most common causes of resistant hypertension and is underappreciated, being diagnosed in up to 20% of patients referred to hypertension specialty clinics.7 Potassium levels may be normal, likely contributing to its lack of recognition in this target population.
Primary hyperaldosteronism should be suspected in patients who have a plasma aldosterone PAC–PRA ratio greater than 20 with elevated plasma aldosterone concentrations
(> 15 ng/dL).
Persistently elevated aldosterone levels in the setting of elevated plasma volume is proof that aldosterone secretion is independent of the renin-angiotensin-aldosterone axis, and therefore is autonomous (secondary to adrenal tumor or hyperplasia). Further testing in the form of oral salt loading, saline infusion, or fludrocortisone (a sodium-retaining steroid) administration is thus required to confirm inappropriate, autonomous aldosterone secretion.9
After establishing the diagnosis of primary hyperaldosteronism, one should determine the subtype (ie, due to an adrenal carcinoma, unilateral hypersecreting adenoma, or unilateral or bilateral hyperplasia). Further testing includes adrenal computed tomography (CT) to rule out adrenal carcinomas, which are suspected with adenomas larger than 4 cm. Though part of the diagnostic workup, CT as a means of confirmational testing alone does not preclude the possibility of bilateral adrenal hyperplasia in some patients, even in the presence of an adrenal adenoma. For this reason, adrenal venous sampling is required to definitively determine whether the condition is due to a hypersecreting adrenal adenoma or unilateral or bilateral hyperplasia.9,10
Treatment of primary hyperaldosteronism depends on the subtype of the disease and involves salt restriction in addition to an aldosterone antagonist (spironolactone or eplerenone in the case of bilateral disease) or surgery (unilateral disease).9,11,12
Secondary hyperaldosteronism
Secondary hyperaldosteronism should be suspected when plasma renin and aldosterone levels are both elevated with a PAC–PRA ratio less than 10.
This pattern is most commonly seen with diuretic use but can also be a consequence of renal artery stenosis or, rarely, a renin-secreting tumor.13 Renal artery stenosis is a common finding in patients with hypertension undergoing cardiac catheterization, which is not surprising as more than 90% of such stenoses are atherosclerotic.7 Renin-secreting tumors are exceedingly rare, with fewer than 100 cases reported in the literature, and are more common in younger individuals.13
Our patient has low-normal aldosterone and plasma renin
On further testing, this patient’s plasma aldosterone level is 2.55 ng/dL (normal < 15 ng/dL), his plasma renin activity is 0.53 ng/mL/hour (normal 0.2–2.8 ng/mL/hour), and his PAC–PRA ratio is therefore 4.81.
The categories discussed thus far have included primary and secondary hyperaldosteronism, which typically do not present with low to normal levels of both renin and aldosterone. Surreptitious mineralocorticoid use could present in this manner, but is unlikely in this patient, whose medications do not include fludrocortisone.
The low-normal values thus lead to consideration of a third category: apparent mineralocorticoid excess. Diseases in this category such as Cushing disease or adrenocorticotropic hormone (ACTH) excess are characterized by increases in corticosteroids so that the potassium depletion, metabolic alkalosis, and hypertension are not a consequence of renin and aldosterone but rather the excess corticosteroids.14
Causes of apparent mineralocorticoid excess
There are several possible causes of mineralocorticoid excess associated with hypertension and hypokalemic metabolic alkalosis not due to renin and aldosterone.
Chronic licorice ingestion in high volumes is one such cause and is thought to result in inhibition of 11B-hydroxysteroid dehydrogenase or possibly cortisol oxidase by licorice’s active component, glycyrrhetinic acid. This inhibition results in an inability to convert cortisol to cortisone. The cortisol excess binds to mineralocorticoid receptors, and acting like aldosterone, results in hypertension and hypokalemic metabolic alkalosis as well as feedback inhibition of renin and aldosterone levels.15
Partial hydroxylase deficiencies, though rare, should also be considered as a cause of hypokalemic metabolic alkalosis, hypertension, and, potentially, hirsutism and clitoromegaly in women. They can be diagnosed with elevated levels of 17-ketosteroids and dehydroepiandrosterone sulfate, both of which, in excess, may act on aldosterone receptors in a manner similar to cortisol.16
Liddle syndrome, a rare autosomal dominant condition, may also present with suppressed levels of both renin and aldosterone. In contrast to the disorders of nonaldosterone mineralocorticoid excess, however, the sodium channel defect in Liddle syndrome is characterized by a primary increase in sodium reabsorption in the collecting tubule and potassium wasting. The resultant volume expansion leads to suppressed renin and aldosterone levels and hypertension with low potassium and elevated bicarbonate concentrations.17
Liddle syndrome is commonly diagnosed in childhood but may go unrecognized due to occasional absence of hypokalemia at presentation. Potassium-sparing diuretics such as amiloride or triamterene are the mainstays of treatment.18
Rates of cardiovascular and all-cause mortality are increased in patients with long-term hypercortisolism, even after plasma concentrations of cortisol are normalized.21
Figure 2 shows the cascade of the hypothalamic-pituitary-adrenal axis.
TESTING FOR HYPERCORTISOLISM IN OUR PATIENT
Given the patient’s clinical presentation and laboratory and imaging findings with normal plasma renin and aldosterone levels, a workup for suspected hypercortisolism is initiated.
Initial diagnostic testing for hypercortisolism depends on the degree of clinical suspicion. In those with low probability of the disease, testing should consist of 1 of the following, as a single negative test may be sufficient to rule out the disease:
- 24-hour urinary cortisol levels
- Overnight dexamethasone suppression testing
- Late-night salivary cortisol measurements.
In those with a high index of suspicion, 2 of the aforementioned tests should be performed, as 1 normal result may not be sufficient to exclude the diagnosis.22,23
A 24-hour urinary cortisol collection and overnight dexamethasone suppression test are obtained. His 24-hour urinary free cortisol level is elevated at 6,600 µg (normal 4–100), and suppression testing with 8 mg of dexamethasone (a form of “high-dose” testing)demonstrates only an 8% decline in serum cortisol levels. Cortisol should generally drop more than 90%.
Morning serum cortisol concentration is less than 5 µg/dL (140 nmol/L) in most patients with Cushing disease (ie, a pituitary tumor), and is usually undetectable in normal subjects. Only about 50% of neuroendocrine ACTH-secreting tumors will suppress with this test.
The patient’s clinical presentation, in conjunction with his diagnostic testing, are thus consistent with Cushing syndrome.
CUSHING SYNDROME
Cushing syndrome is most often exogenous or iatrogenic, ie, a result of supraphysiologic doses of glucocorticoids used to treat a variety of inflammatory, autoimmune, and neoplastic conditions.
Endogenous Cushing syndrome, on the other hand, is rare, with an estimated prevalence of 0.7 to 2.4 cases per million per year. ACTH-dependent causes account for 80% of endogenous Cushing syndrome cases, with ACTH-secreting pituitary adenomas (Cushing disease) accounting for 75% to 80% and ectopic ACTH secretion accounting for 15% to 20%. Less than 1% of cases are due to tumors that produce corticotropin-releasing hormone (CRH).
ACTH-independent Cushing syndrome is diagnosed in 20% of endogenous cases and is most commonly caused by a unilateral adrenal tumor. Rare causes of ACTH-independent disease include adrenal carcinoma, McCune-Albright syndrome, and adrenal hyperplasia.24
The patient’s ACTH is high
To determine whether this is an ACTH-dependent or independent process, the next step is to order an ACTH level. His ACTH level is high at 107 pg/mL (normal < 46 pg/mL), confirming the diagnosis of ACTH-dependent Cushing syndrome.
To find out if this ACTH-dependent process is due to a pituitary adenoma, magnetic resonance imaging (MRI) of the pituitary is obtained but is normal.
Large masses (> 6 mm) strongly suggest Cushing disease, but these tumors are often small and may be missed even with more advanced imaging techniques. Corticotropin-secreting adenomas arising from normal cells in the pituitary retain some sensitivity to glucocorticoid negative feedback and CRH stimulation, and thus high-dose dexamethasone suppression testing in conjunction with CRH stimulation testing can be used to differentiate Cushing disease from ectopic ACTH secretion.24,25 Both of these tests have poor diagnostic accuracy, however, and thus inferior petrosal sampling remains the gold standard for the diagnosis of Cushing disease.
ACTH-SECRETING TUMORS
5. Cushing syndrome due to ectopic ACTH secretion is most commonly attributed to which of the following tumors?
- Small-cell lung carcinoma
- Pancreatic carcinoma
- Medullary thyroid carcinoma
- Gastrinoma
Severe cases of Cushing syndrome are often attributable to ectopic ACTH secretion due to an underlying malignancy, most commonly small-cell lung carcinoma or neuroendocrine tumors of pulmonary origin. Other causes include pancreatic and thymic neuroendocrine tumors, gastrinomas, and medullary thyroid carcinoma.25,26
Because most ACTH-producing tumors are intrathoracic, initial imaging in cases of suspected ectopic ACTH secretion should focus on the chest, with CT the usual first choice. Octreotide scintigraphy can also be useful in localizing disease, as many neuroendocrine tumors express somatostatin receptors. Specialized positron-emission tomography scans may also be helpful in tumor identification.24
TREATMENT OF CUSHING SYNDROME DUE TO ECTOPIC ACTH SECRETION
6. Which of the following is most appropriate medical therapy for suppression of cortisol secretion in Cushing syndrome due to ectopic ACTH secretion?
- Spironolactone
- Dexamethasone
- Somatostatin
- Estrogen
- Ketoconazole
Hyperglycemia, hypokalemia, hypertension, psychiatric disturbances, venous thromboembolism, and systemic infections appear to be common in ectopic ACTH syndrome and often correlate with the degree of hypercortisolemia. Severe Cushing syndrome due to ectopic ACTH secretion is an emergency requiring prompt control of cortisol secretion.
First-line treatments include steroidogenesis inhibitors (ketoconazole, metyrapone, etomidate, mitotane) and glucocorticoid receptor antagonists (mifepristone). High-dose spironolactone and eplerenone can also be used to treat the hypertension and hypokalemia associated with mineralocorticoid receptor stimulation. Definitive treatment involves surgical resection, chemotherapy, or radiotherapy when applicable.24,25
After confirmation of the diagnosis, the patient is prescribed ketoconazole and spironolactone, with substantial improvement. He subsequently is started on combination chemotherapy and radiation therapy for his small-cell lung carcinoma.
DISCUSSION
The differential diagnosis for hypokalemia is broad and relies on information obtained during the history and physical examination, followed by interpretation of selected laboratory results. Myriad pathologies in diverse organ systems, eg, diarrhea, renal tubular acidosis, and adrenal disease, may be responsible for a low serum potassium. Further categorizing potassium depletion on the basis of an associated acid-base disturbance, such as metabolic alkalosis, allows one to use an algorithmic approach that can identify specific etiologies responsible for both the potassium and the acid-base disturbances.
Using the spot urine chloride in the setting of hypokalemic metabolic alkalosis with or without hypertension can narrow the differential diagnosis and allow additional clinical findings to guide clinical problem-solving and decision-making, even for conditions not commonly encountered in routine medical practice.
Obtaining renin and aldosterone measurements in patients with potassium depletion, metabolic alkalosis, high urine chloride excretion, and hypertension permits further categorization into 3 clinical groups: elevated aldosterone and renin (secondary hyperaldosteronism), elevated aldosterone and low renin (primary hyperaldosteronism), or apparent mineralocorticoid excess wherein neither renin nor aldosterone are responsible for the syndrome.
The patient in our case had apparent mineralocorticoid excess as a consequence of an ACTH-producing small-cell carcinoma.
- Martínez-Valles MA, Palafox-Cazarez A, Paredes-Avina JA. Severe hypokalemia, metabolic alkalosis and hypertension in a 54 year old male with ectopic ACTH syndrome: a case report. Cases J 2009; 2:6174. doi:10.4076/1757-1626-2-6174
- Fernández-Rodríguez E, Villar-Taibo R, Pinal-Osorio I, et al. Severe hypertension and hypokalemia as first clinical manifestations in ectopic Cushing’s syndrome. Arq Bras Endocrinol Metabol 2008; 52(6):1066–1070. pmid:18820819
- Mani S, Rutecki GW. A patient with altered mental status and an acid-base disturbance. Cleve Clin J Med 2017; 84(1):27–34. doi:10.3949/ccjm.84a.16042
- Adrogué HJ, Madias NE. Secondary responses to altered acid-base status: the rules of engagement. J Am Soc Nephrol 2010; 21(6):920–923. doi:10.1681/ASN.2009121211
- Huang CL, Kuo E. Mechanism of hypokalemia in magnesium deficiency. J Am Soc Nephrol 2007; 18(10):2649–2652. doi:10.1681/ASN.2007070792
- Rose BD. Metabolic alkalosis. In: Clinical Physiology of Acid-Base and Electrolyte Disorders. 4th ed. New York, NY: McGraw-Hill, Health Professions Division; 1994:515.
- Calhoun DA, Jones D, Textor S, et al; American Heart Association Professional Education Committee. Resistant hypertension: diagnosis, evaluation, and treatment: a scientific statement from the American Heart Association Professional Education Committee of the Council for High Blood Pressure Research. Circulation 2008; 117(25):e510–e526. doi:10.1161/CIRCULATIONAHA.108.189141
- Koeppen BM, Stanton BA. Physiology of diuretic action. In: Renal Physiology. 5th ed. Philadelphia, PA: Elsevier Inc; 2013:167–178.
- Blumenfeld JD, Sealey JE, Schlussel Y, et al. Diagnosis and treatment of primary hyperaldosteronism. Ann Intern Med 1994; 121(11):877–885. pmid:7978702
- Kempers MJ, Lenders JW, van Outheusden L, et al. Systematic review: diagnostic procedures to differentiate unilateral from bilateral adrenal abnormality in primary aldosteronism. Ann Intern Med 2009; 151(5):329–337. pmid:19721021
- Karagiannis A, Tziomalos K, Papageorgiou A, et al. Spironolactone versus eplerenone for the treatment of idiopathic hyperaldosteronism. Expert Opin Pharmacother 2008; 9(4):509–515. doi:10.1517/14656566.9.4.509
- Sawka AM, Young WF, Thompson GB, et al. Primary aldosteronism: factors associated with normalization of blood pressure after surgery. Ann Intern Med 2001; 135(4):258–261. pmid:11511140
- Haab F, Duclos JM, Guyenne T, Plouin PF, Corvol P. Renin secreting tumors: diagnosis, conservative surgical approach and long-term results. J Urol 1995; 153(6):1781–1784. pmid:7752315
- Sabbadin C, Armanini D. Syndromes that mimic an excess of mineralocorticoids. High Blood Press Cardiovasc Prev 2016; 23(3):231–235. doi:10.1007/s40292-016-0160-5
- Apostolakos JM, Caines LC. Apparent mineralocorticoid excess syndrome: a case of resistant hypertension from licorice tea consumption. J Clin Hypertens (Greenwich) 2016; 18(10):991–993. doi:10.1111/jch.12841
- Glatt K, Garzon DL, Popovic J. Congenital adrenal hyperplasia due to 21-hydroxylase deficiency. J Spec Pediatr Nurs 2005; 10(3):104–114. doi:10.1111/j.1744-6155.2005.00022.x
- Findling JW, Raff H, Hansson JH, Lifton RP. Liddle’s syndrome: prospective genetic screening and suppressed aldosterone secretion in an extended kindred. J Clin Endocrinol Metab 1997; 82(4):1071–1074. doi:10.1210/jcem.82.4.3862
- Wang C, Chan TK, Yeung RT, Coghlan JP, Scoggins BA, Stockigt JR. The effect of triamterene and sodium intake on renin, aldosterone, and erythrocyte sodium transport in Liddle’s syndrome. J Clin Endocrinol Metab 1981; 52(5):1027–1032. doi:10.1210/jcem-52-5-1027
- Torpy DJ, Mullen N, Ilias I, Nieman LK. Association of hypertension and hypokalemia with Cushing’s syndrome caused by ectopic ACTH secretion: a series of 58 cases. Ann N Y Acad Sci 2002; 970:134–144. pmid:12381548
- Saruta T, Suzuki H, Handa M, Igarashi Y, Kondo K, Senba S. Multiple factors contribute to the pathogenesis of hypertension in Cushing’s syndrome. J Clin Endocrinol Metab 1986; 62(2):275–279. doi:10.1210/jcem-62-2-275
- Clayton RN, Jones PW, Reulen RC, et al. Mortality in patients with Cushing’s disease more than 10 years after remission: a multicentre, multinational, retrospective cohort study. Lancet Diabetes Endocrinol 2016; 4(7):569–576. doi:10.1016/S2213-8587(16)30005-5
- Baid SK, Rubino D, Sinaii N, Ramsey S, Frank A, Nieman LK. Specificity of screening tests for Cushing’s syndrome in an overweight and obese population. J Clin Endocrinol Metab 2009; 94(10):3857–3864. doi:10.1210/jc.2008-2766
- Nieman LK, Biller BM, Findling JW, et al. The diagnosis of Cushing’s syndrome: an Endocrine Society Clinical Practice Guideline. J Clin Endocrinol Metab 2008; 93(5):1526–1540. doi:10.1210/jc.2008-0125
- Sharma ST, Nieman LK, Feelders RA. Cushing’s syndrome: epidemiology and developments in disease management. Clin Epidemiol 2015; 7:281–293. doi:10.2147/CLEP.S44336
- Tavares Bello C, van der Poest Clement E, Feelders R. Severe Cushing’s syndrome and bilateral pulmonary nodules: beyond ectopic ACTH. Endocrinol Diabetes Metab Case Rep 2017; pii:17–0100. doi:10.1530/EDM-17-0100
- Sathyakumar S, Paul TV, Asha HS, et al. Ectopic Cushing syndrome: a 10-year experience from a tertiary care center in southern India. Endocr Pract 2017; 23(8):907–914. doi:10.4158/EP161677.OR
Subclinical hypothyroidism: When to treat
Whether subclinical hypothyroidism is clinically important and should be treated remains controversial. Studies have differed in their findings, and although most have found this condition to be associated with a variety of adverse outcomes, large randomized controlled trials are needed to clearly demonstrate its clinical impact in various age groups and the benefit of levothyroxine therapy.
Currently, the best practical approach is to base treatment decisions on the magnitude of elevation of thyroid-stimulating hormone (TSH) and whether the patient has thyroid autoantibodies and associated comorbid conditions.
HIGH TSH, NORMAL FREE T4 LEVELS
Subclinical hypothyroidism is defined by elevated TSH along with a normal free thyroxine (T4).1
The hypothalamic-pituitary-thyroid axis is a balanced homeostatic system, and TSH and thyroid hormone levels have an inverse log-linear relation: if free T4 and triiodothyronine (T3) levels go down even a little, TSH levels go up a lot.2
TSH secretion is pulsatile and has a circadian rhythm: serum TSH levels are 50% higher at night and early in the morning than during the rest of the day. Thus, repeated measurements in the same patient can vary by as much as half of the reference range.3
WHAT IS THE UPPER LIMIT OF NORMAL FOR TSH?
The upper limit of normal for TSH, defined as the 97.5th percentile, is approximately 4 or 5 mIU/L depending on the laboratory and the population, but some experts believe it should be lower.3
In favor of a lower upper limit: the distribution of serum TSH levels in the healthy general population does not seem to be a typical bell-shaped Gaussian curve, but rather has a tail at the high end. Some argue that some of the individuals with values in the upper end of the normal range may actually have undiagnosed hypothyroidism and that the upper 97.5th percentile cutoff would be 2.5 mIU/L if these people were excluded.4 Also, TSH levels higher than 2.5 mIU/L have been associated with a higher prevalence of antithyroid antibodies and a higher risk of clinical hypothyroidism.5
On the other hand, lowering the upper limit of normal to 2.5 mIU/L would result in 4 times as many people receiving a diagnosis of subclinical hypothyroidism, or 22 to 28 million people in the United States.4,6 Thus, lowering the cutoff may lead to unnecessary therapy and could even harm from overtreatment.
Another argument against lowering the upper limit of normal for TSH is that, with age, serum TSH levels shift higher.7 The third National Health and Nutrition Education Survey (NHANES III) found that the 97.5th percentile for serum TSH was 3.56 mIU/L for age group 20 to 29 but 7.49 mIU/L for octogenarians.7,8
It has been suggested that the upper limit of normal for TSH be adjusted for age, race, sex, and iodine intake.3 Currently available TSH reference ranges are not adjusted for these variables, and there is not enough evidence to suggest age-appropriate ranges,9 although higher TSH cutoffs for treatment are advised in elderly patients.10 Interestingly, higher TSH in older people has been linked to lower mortality rates in some studies.11
Authors of the NHANES III8 and Hanford Thyroid Disease study12 have proposed a cutoff of 4.1 mIU/L for the upper limit of normal for serum TSH in patients with negative antithyroid antibodies and normal findings on thyroid ultrasonography.
SUBCLINICAL HYPOTHYROIDISM IS COMMON
In different studies, the prevalence of subclinical hypothyroidism has been as low as 4% and as high as 20%.1,8,13 The prevalence is higher in women and increases with age.8 It is higher in iodine-sufficient areas, and it increases in iodine-deficient areas with iodine supplementation.14 Genetics also plays a role, as subclinical hypothyroidism is more common in white people than in African Americans.8
A difficulty in estimating the prevalence is the disagreement about the cutoff for TSH, which may differ from that in the general population in certain subgroups such as adolescents, the elderly, and pregnant women.10,15
A VARIETY OF CAUSES
The most common cause of subclinical hypothyroidism, accounting for 60% to 80% of cases, is Hashimoto (autoimmune) thyroiditis,2 in which thyroid peroxidase antibodies are usually present.2,16

Also important to rule out are false-positive elevations due to substances that interfere with TSH assays (eg, heterophile antibodies, rheumatoid factor, biotin, macro-TSH); reversible causes such as the recovery phase of euthyroid sick syndrome; subacute, painless, or postpartum thyroiditis; central hypo- or hyperthyroidism; and thyroid hormone resistance.
SUBCLINICAL HYPOTHYROIDISM CAN RESOLVE OR PROGRESS
“Subclinical” suggests that the disease is in its early stage, with changes in TSH already apparent but decreases in thyroid hormone levels yet to come.17 And indeed, subclinical hypothyroidism can progress to overt hypothyroidism,18 although it has been reported to resolve spontaneously in half of cases within 2 years,19 typically in patients with TSH values of 4 to 6 mIU/L.20 The rate of progression to overt hypothyroidism is estimated to be 33% to 55% over 10 to 20 years of follow-up.18

Figure 1 shows the natural history of subclinical hypothyroidism.1
GUIDELINES FOR SCREENING DIFFER
Guidelines differ on screening for thyroid disease in the general population, owing to lack of large-scale randomized controlled trials showing treatment benefit in otherwise-healthy people with mildly elevated TSH values.
Various professional societies have adopted different criteria for aggressive case-finding in patients at risk of thyroid disease. Risk factors include family history of thyroid disease, neck irradiation, partial thyroidectomy, dyslipidemia, atrial fibrillation, unexplained weight loss, hyperprolactinemia, autoimmune disorders, and use of medications affecting thyroid function.23
The US Preventive Services Task Force in 2014 found insufficient evidence on the benefits and harms of screening.24
The American Thyroid Association (ATA) recommends screening adults starting at age 35, with repeat testing every 5 years in patients who have no signs or symptoms of hypothyroidism, and more frequently in those who do.25
The American Association of Clinical Endocrinologists recommends screening in women and older patients. Their guidelines and those of the ATA also suggest screening people at high risk of thyroid disease due to risk factors such as history of autoimmune diseases, neck irradiation, or medications affecting thyroid function.26
The American Academy of Family Physicians recommends screening after age 60.18
The American College of Physicians recommends screening patients over age 50 who have symptoms.18
Our approach. Although evidence is lacking to recommend routine screening in adults, aggressive case-finding and treatment in patients at risk of thyroid disease can, we believe, offset the risks associated with subclinical hypothyroidism.24
CLINICAL PRESENTATION
About 70% of patients with subclinical hypothyroidism have no symptoms.13
Tiredness was more common in subclinical hypothyroid patients with TSH levels lower than 10 mIU/L compared with euthyroid controls in 1 study, but other studies have been unable to replicate this finding.27,28
Other frequently reported symptoms include dry skin, cognitive slowing, poor memory, muscle weakness, cold intolerance, constipation, puffy eyes, and hoarseness.13
The evidence in favor of levothyroxine therapy to improve symptoms in subclinical hypothyroidism has varied, with some studies showing an improvement in symptom scores compared with placebo, while others have not shown any benefit.29–31
In one study, the average TSH value for patients whose symptoms did not improve with therapy was 4.6 mIU/L.31 An explanation for the lack of effect in this group may be that the TSH values for these patients were in the high-normal range. Also, because most subclinical hypothyroid patients have no symptoms, it is difficult to ascertain symptomatic improvement. Though it is possible to conclude that levothyroxine therapy has a limited role in this group, it is important to also consider the suggestive evidence that untreated subclinical hypothyroidism may lead to increased morbidity and mortality.
ADVERSE EFFECTS OF SUBCLINICAL HYPOTHYROIDISM, EFFECTS OF THERAPY

INDIVIDUALIZED MANAGEMENT AND SHARED DECISION-MAKING
The management of subclinical hypothyroidism should be individualized on the basis of extent of thyroid dysfunction, comorbid conditions, risk factors, and patient preference.118 Shared decision-making is key, weighing the risks and benefits of levothyroxine treatment and the patient’s goals.

The risks of treatment should be kept in mind and explained to the patient. Levothyroxine has a narrow therapeutic range, causing a possibility of overreplacement, and a half-life of 7 days that can cause dosing errors to have longer effect.118,119
Adherence can be a challenge. The drug needs to be taken on an empty stomach because foods and supplements interfere with its absorption.118,120 In addition, the cost of medication, frequent biochemical monitoring, and possible need for titration can add to financial burden.
When choosing the dose, one should consider the degree of hypothyroidism or TSH elevation and the patient’s weight, and adjust the dose gently.
If the TSH is high-normal
It is proposed that a TSH range of 3 to 5 mIU/L overlaps with normal thyroid function in a great segment of the population, and at this level it is probably not associated with clinically significant consequences. For these reasons, levothyroxine therapy is not thought to be beneficial for those with TSH in this range.
Pollock et al121 found that, in patients with symptoms suggesting hypothyroidism and TSH values in the upper end of the normal range, there was no improvement in cognitive function or psychological well-being after 12 weeks of levothyroxine therapy.
However, due to the concern for possible adverse maternal and fetal outcomes and low IQ in children of pregnant patients with subclinical hypothyroidism, levothyroxine therapy is advised in those who are pregnant or planning pregnancy who have TSH levels higher than 2.5 mIU/L, especially if they have thyroid peroxidase antibody. Levothyroxine therapy is not recommended for pregnant patients with negative thyroid peroxidase antibody and TSH within the pregnancy-specific range or less than 4 mIU/L if the reference ranges are unavailable.
Keep in mind that, even at these TSH values, there is risk of progression to overt hypothyroidism, especially in the presence of thyroid peroxidase antibody, so patients in this group should be monitored closely.
If TSH is mildly elevated
The evidence to support levothyroxine therapy in patients with subclinical hypothyroidism with TSH levels less than 10 mIU/L remains inconclusive, and the decision to treat should be based on clinical judgment.2 The studies that have looked at the benefit of treating subclinical hypothyroidism in terms of cardiac, neuromuscular, cognitive, and neuropsychiatric outcomes have included patients with a wide range of TSH levels, and some of these studies were not stratified on the basis of degree of TSH elevation.
The risk that subclinical hypothyroidism will progress to overt hypothyroidism in patients with TSH higher than 8 mIU/L is high, and in 70% of these patients, the TSH level rises to more than 10 mIU/L within 4 years. Early treatment should be considered if the TSH is higher than 7 or 8 mIU/L.
If TSH is higher than 10 mIU/L

Figure 2 outlines an algorithmic approach to subclinical hypothyroidism in nonpregnant patients as suggested by Peeters.122
- Cooper DS, Biondi B. Subclinical thyroid disease. Lancet 2012; 379(9821):1142–1154. doi:10.1016/S0140-6736(11)60276-6
- Fatourechi V. Subclinical hypothyroidism: an update for primary care physicians. Mayo Clin Proc 2009; 84(1):65–71. doi:10.4065/84.1.65
- Laurberg P, Andersen S, Carle A, Karmisholt J, Knudsen N, Pedersen IB. The TSH upper reference limit: where are we at? Nat Rev Endocrinol 2011; 7(4):232–239. doi:10.1038/nrendo.2011.13
- Wartofsky L, Dickey RA. The evidence for a narrower thyrotropin reference range is compelling. J Clin Endocrinol Metab 2005; 90(9):5483–5488. doi:10.1210/jc.2005-0455
- Spencer CA, Hollowell JG, Kazarosyan M, Braverman LE. National Health and Nutrition Examination Survey III thyroid-stimulating hormone (TSH)-thyroperoxidase antibody relationships demonstrate that TSH upper reference limits may be skewed by occult thyroid dysfunction. J Clin Endocrinol Metab 2007; 92(11):4236–4240. doi:10.1210/jc.2007-0287
- Fatourechi V, Klee GG, Grebe SK, et al. Effects of reducing the upper limit of normal TSH values. JAMA 2003; 290(24):3195–3196. doi:10.1001/jama.290.24.3195-a
- Surks MI, Hollowell JG. Age-specific distribution of serum thyrotropin and antithyroid antibodies in the US population: implications for the prevalence of subclinical hypothyroidism. J Clin Endocrinol Metab 2007; 92(12):4575–4582. doi:10.1210/jc.2007-1499
- Hollowell JG, Staehling NW, Flanders WD, et al. Serum TSH, T(4), and thyroid antibodies in the United States population (1988 to 1994): National Health and Nutrition Examination Survey (NHANES III). J Clin Endocrinol Metab 2002; 87(2):489–499. doi:10.1210/jcem.87.2.8182
- Jonklaas J, Bianco AC, Bauer AJ, et al; American Thyroid Association Task Force on Thyroid Hormone Replacement. Guidelines for the treatment of hypothyroidism: prepared by the American Thyroid Association Task Force on Thyroid Hormone Replacement. Thyroid 2014; 24(12):1670–1751. doi:10.1089/thy.2014.0028
- Hennessey JV, Espaillat R. Diagnosis and management of subclinical hypothyroidism in elderly adults: a review of the literature. J Am Geriatr Soc 2015; 63(8):1663–1673. doi:10.1111/jgs.13532
- Razvi S, Shakoor A, Vanderpump M, Weaver JU, Pearce SH. The influence of age on the relationship between subclinical hypothyroidism and ischemic heart disease: a metaanalysis. J Clin Endocrinol Metab 2008; 93(8):2998–3007. doi:10.1210/jc.2008-0167
- Hamilton TE, Davis S, Onstad L, Kopecky KJ. Thyrotropin levels in a population with no clinical, autoantibody, or ultrasonographic evidence of thyroid disease: implications for the diagnosis of subclinical hypothyroidism. J Clin Endocrinol Metab 2008; 93(4):1224–1230. doi:10.1210/jc.2006-2300
- Canaris GJ, Manowitz NR, Mayor G, Ridgway EC. The Colorado thyroid disease prevalence study. Arch Intern Med 2000; 160(4):526–534. pmid:10695693
- Teng W, Shan Z, Teng X, et al. Effect of iodine intake on thyroid diseases in China. N Engl J Med 2006; 354(26):2783–2793. doi:10.1056/NEJMoa054022
- Negro R, Stagnaro-Green A. Diagnosis and management of subclinical hypothyroidism in pregnancy. BMJ 2014; 349:g4929. doi:10.1136/bmj.g4929
- Baumgartner C, Blum MR, Rodondi N. Subclinical hypothyroidism: summary of evidence in 2014. Swiss Med Wkly 2014; 144:w14058. doi:10.4414/smw.2014.14058
- Stedman TL. Stedman’s Medical Dictionary. 28th ed. Baltimore, MD: Lippincott Williams and Wilkins; 2006.
- Raza SA, Mahmood N. Subclinical hypothyroidism: controversies to consensus. Indian J Endocrinol Metab 2013; 17(suppl 3):S636–S642. doi:10.4103/2230-8210.123555
- Huber G, Staub JJ, Meier C, et al. Prospective study of the spontaneous course of subclinical hypothyroidism: prognostic value of thyrotropin, thyroid reserve, and thyroid antibodies. J Clin Endocrinol Metab 2002; 87(7):3221–3226. doi:10.1210/jcem.87.7.8678
- Diez JJ, Iglesias P, Burman KD. Spontaneous normalization of thyrotropin concentrations in patients with subclinical hypothyroidism. J Clin Endocrinol Metab 2005; 90(7):4124–4127. doi:10.1210/jc.2005-0375
- Vanderpump MP, Tunbridge WM, French JM, et al. The incidence of thyroid disorders in the community: a twenty-year follow-up of the Whickham survey. Clin Endocrinol (Oxf) 1995; 43(1):55–68. pmid:7641412
- Li Y, Teng D, Shan Z, et al. Antithyroperoxidase and antithyroglobulin antibodies in a five-year follow-up survey of populations with different iodine intakes. J Clin Endocrinol Metab 2008; 93(5):1751–1757. doi:10.1210/jc.2007-2368
- Hennessey JV, Klein I, Woeber KA, Cobin R, Garber JR. Aggressive case finding: a clinical strategy for the documentation of thyroid dysfunction. Ann Intern Med 2015; 163(4):311–312. doi:10.7326/M15-0762
- Rugge JB, Bougatsos C, Chou R. Screening and treatment of thyroid dysfunction: an evidence review for the US.Preventive Services Task Force. Ann Intern Med 2015; 162(1):35–45. doi:10.7326/M14-1456
- Ladenson PW, Singer PA, Ain KB, et al. American Thyroid Association guidelines for detection of thyroid dysfunction. Arch Intern Med 2000; 160(11):1573–1575. pmid:10847249
- Garber JR, Cobin RH, Gharib H, et al; American Association of Clinical Endocrinologists and American Thyroid Association Taskforce on Hypothyroidism in Adults. Clinical practice guidelines for hypothyroidism in adults: cosponsored by the American Association of Clinical Endocrinologists and the American Thyroid Association. Endocr Pract 2012; 18(6):988–1028. doi:10.4158/EP12280.GL
- Jorde R, Waterloo K, Storhaug H, Nyrnes A, Sundsfjord J, Jenssen TG. Neuropsychological function and symptoms in subjects with subclinical hypothyroidism and the effect of thyroxine treatment. J Clin Endocrinol Metab 2006; 91(1):145–153. doi:10.1210/jc.2005-1775
- Joffe RT, Pearce EN, Hennessey JV, Ryan JJ, Stern RA. Subclinical hypothyroidism, mood, and cognition in older adults: a review. Int J Geriatr Psychiatry 2013; 28(2):111–118. doi:10.1002/gps.3796
- Cooper DS, Halpern R, Wood LC, Levin AA, Ridgway EC. L-thyroxine therapy in subclinical hypothyroidism. A double-blind, placebo-controlled trial. Ann Intern Med 1984; 101(1):18–24. pmid:6428290
- Nystrom E, Caidahl K, Fager G, Wikkelso C, Lundberg PA, Lindstedt G. A double-blind cross-over 12-month study of L-thyroxine treatment of women with ‘subclinical’ hypothyroidism. Clin Endocrinol (Oxf) 1988; 29(1):63–75. pmid:3073880
- Monzani F, Del Guerra P, Caraccio N, et al. Subclinical hypothyroidism: neurobehavioral features and beneficial effect of L-thyroxine treatment. Clin Investig 1993; 71(5):367–371. pmid:8508006
- Biondi B. Thyroid and obesity: an intriguing relationship. J Clin Endocrinol Metab 2010; 95(8):3614–3617. doi:10.1210/jc.2010-1245
- Erdogan M, Canataroglu A, Ganidagli S, Kulaksizoglu M. Metabolic syndrome prevalence in subclinic and overt hypothyroid patients and the relation among metabolic syndrome parameters. J Endocrinol Invest 2011; 34(7):488–492. doi:10.3275/7202
- Javed Z, Sathyapalan T. Levothyroxine treatment of mild subclinical hypothyroidism: a review of potential risks and benefits. Ther Adv Endocrinol Metab 2016; 7(1):12–23. doi:10.1177/2042018815616543
- Pearce SH, Brabant G, Duntas LH, et al. 2013 ETA guideline: management of subclinical hypothyroidism. Eur Thyroid J 2013; 2(4):215–228. doi:10.1159/000356507
- Wang C. The relationship between type 2 diabetes mellitus and related thyroid diseases. J Diabetes Res 2013; 2013:390534. doi:10.1155/2013/390534
- Razvi S, Weaver JU, Vanderpump MP, Pearce SH. The incidence of ischemic heart disease and mortality in people with subclinical hypothyroidism: reanalysis of the Whickham survey cohort. J Clin Endocrinol Metab 2010; 95(4):1734–1740. doi:10.1210/jc.2009-1749
- Bindels AJ, Westendorp RG, Frolich M, Seidell JC, Blokstra A, Smelt AH. The prevalence of subclinical hypothyroidism at different total plasma cholesterol levels in middle aged men and women: a need for case-finding? Clin Endocrinol (Oxf) 1999; 50(2):217–220. pmid:10396365
- Pearce EN. Hypothyroidism and dyslipidemia: modern concepts and approaches. Curr Cardiol Rep 2004; 6(6):451–456. pmid:15485607
- Pearce EN. Update in lipid alterations in subclinical hypothyroidism. J Clin Endocrinol Metab 2012; 97(2):326–333. doi:10.1210/jc.2011-2532
- Rizos CV, Elisaf MS, Liberopoulos EN. Effects of thyroid dysfunction on lipid profile. Open Cardiovasc Med J 2011; 5:76–84. doi:10.2174/1874192401105010076
- Peppa M, Betsi G, Dimitriadis G. Lipid abnormalities and cardiometabolic risk in patients with overt and subclinical thyroid disease. J Lipids 2011; 2011:575840. doi:10.1155/2011/575840
- Asvold BO, Vatten LJ, Nilsen TI, Bjoro T. The association between TSH within the reference range and serum lipid concentrations in a population-based study. the HUNT study. Eur J Endocrinol 2007;1 56(2):181–186. doi:10.1530/eje.1.02333
- Danese MD, Ladenson PW, Meinert CL, Powe NR. Clinical review 115: effect of thyroxine therapy on serum lipoproteins in patients with mild thyroid failure: a quantitative review of the literature. J Clin Endocrinol Metab 2000; 85(9):2993–3001. doi:10.1210/jcem.85.9.6841
- Razvi S, Ingoe L, Keeka G, Oates C, McMillan C, Weaver JU. The beneficial effect of L-thyroxine on cardiovascular risk factors, endothelial function, and quality of life in subclinical hypothyroidism: randomized, crossover trial. J Clin Endocrinol Metab 2007; 92(5):1715–1723. doi:10.1210/jc.2006-1869
- Abreu IM, Lau E, de Sousa Pinto B, Carvalho D. Subclinical hypothyroidism: to treat or not to treat, that is the question! A systematic review with meta-analysis on lipid profile. Endocr Connect 2017; 6(3):188–199. doi:10.1530/EC-17-0028
- Robison CD, Bair TL, Horne BD, et al. Hypothyroidism as a risk factor for statin intolerance. J Clin Lipidol 2014; 8(4):401–407. doi:10.1016/j.jacl.2014.05.005
- Hak AE, Pols HA, Visser TJ, Drexhage HA, Hofman A, Witteman JC. Subclinical hypothyroidism is an independent risk factor for atherosclerosis and myocardial infarction in elderly women: the Rotterdam study. Ann Intern Med 2000; 132(4):270–278. pmid:10681281
- Boekholdt SM, Titan SM, Wiersinga WM, et al. Initial thyroid status and cardiovascular risk factors: the EPIC-Norfolk prospective population study. Clin Endocrinol (Oxf) 2010; 72(3):404–410. doi:10.1111/j.1365-2265.2009.03640.x
- Andersen MN, Olsen AM, Madsen JC, et al. Levothyroxine substitution in patients with subclinical hypothyroidism and the risk of myocardial infarction and mortality. PLoS One 2015; 10(6):e0129793. doi:10.1371/journal.pone.0129793
- Biondi B. Cardiovascular effects of mild hypothyroidism. Thyroid 2007; 17(7):625–630. doi:10.1089/thy.2007.0158
- Brenta G, Mutti LA, Schnitman M, Fretes O, Perrone A, Matute ML. Assessment of left ventricular diastolic function by radionuclide ventriculography at rest and exercise in subclinical hypothyroidism, and its response to L-thyroxine therapy. Am J Cardiol 2003; 91(11):1327–1330. pmid:12767425
- Taddei S, Caraccio N, Virdis A, et al. Impaired endothelium-dependent vasodilatation in subclinical hypothyroidism: beneficial effect of levothyroxine therapy. J Clin Endocrinol Metab 2003; 88(8):3731–3737. doi:10.1210/jc.2003-030039
- Gao N, Zhang W, Zhang YZ, Yang Q, Chen SH. Carotid intima-media thickness in patients with subclinical hypothyroidism: a meta-analysis. Atherosclerosis 2013; 227(1):18–25. doi:10.1016/j.atherosclerosis.2012.10.070
- Biondi B, Cooper DS. The clinical significance of subclinical thyroid dysfunction. Endocr Rev 2008; 29(1):76–131. doi:10.1210/er.2006-0043
- Chaker L, Baumgartner C, den Elzen WP, et al; Thyroid Studies Collaboration. Subclinical hypothyroidism and the risk of stroke events and fatal stroke: an individual participant data analysis. J Clin Endocrinol Metab 2015; 100(6):2181–2191. doi:10.1210/jc.2015-1438
- Monzani F, Di Bello V, Caraccio N, et al. Effect of levothyroxine on cardiac function and structure in subclinical hypothyroidism: a double blind, placebo-controlled study. J Clin Endocrinol Metab 2001; 86(3):1110–1115. doi:10.1210/jcem.86.3.7291
- Parle JV, Maisonneuve P, Sheppard MC, Boyle P, Franklyn JA. Prediction of all-cause and cardiovascular mortality in elderly people from one low serum thyrotropin result: a 10-year cohort study. Lancet 2001; 358(9285):861-865. doi:10.1016/S0140-6736(01)06067-6
- Razvi S, Weaver JU, Butler TJ, Pearce SH. Levothyroxine treatment of subclinical hypothyroidism, fatal and nonfatal cardiovascular events, and mortality. Arch Intern Med 2012; 172(10):811–817. doi:10.1001/archinternmed.2012.1159
- Pasqualetti G, Tognini S, Polini A, Caraccio N, Monzani F. Is subclinical hypothyroidism a cardiovascular risk factor in the elderly? J Clin Endocrinol Metab 2013; 98(6):2256–2266. doi:10.1210/jc.2012-3818
- Mooijaart SP, IEMO 80-plus Thyroid Trial Collaboration. Subclinical thyroid disorders. Lancet 2012; 380(9839):335. doi:10.1016/S0140-6736(12)61241-0
- Rodondi N, Bauer DC. Subclinical hypothyroidism and cardiovascular risk: how to end the controversy. J Clin Endocrinol Metab 2013; 98(6):2267–2269. doi:10.1210/jc.2013-1875
- Rodondi N, Newman AB, Vittinghoff E, et al. Subclinical hypothyroidism and the risk of heart failure, other cardiovascular events, and death. Arch Intern Med 2005; 165(21):2460–2466. doi:10.1001/archinte.165.21.2460
- Rodondi N, Bauer DC, Cappola AR, et al. Subclinical thyroid dysfunction, cardiac function, and the risk of heart failure. The Cardiovascular Health study. J Am Coll Cardiol 2008; 52(14):1152–1159. doi:10.1016/j.jacc.2008.07.009
- Haggerty JJ Jr, Garbutt JC, Evans DL, et al. Subclinical hypothyroidism: a review of neuropsychiatric aspects. Int J Psychiatry Med 1990; 20(2):193–208. doi:10.2190/ADLY-1UU0-1A8L-HPXY
- Baldini IM, Vita A, Mauri MC, et al. Psychopathological and cognitive features in subclinical hypothyroidism. Prog Neuropsychopharmacol Biol Psychiatry 1997; 21(6):925–935. pmid:9380789
- del Ser Quijano T, Delgado C, Martinez Espinosa S, Vazquez C. Cognitive deficiency in mild hypothyroidism. Neurologia 2000; 15(5):193–198. Spanish. pmid:10850118
- Correia N, Mullally S, Cooke G, et al. Evidence for a specific defect in hippocampal memory in overt and subclinical hypothyroidism. J Clin Endocrinol Metab 2009; 94(10):3789–3797. doi:10.1210/jc.2008-2702
- Aghili R, Khamseh ME, Malek M, et al. Changes of subtests of Wechsler memory scale and cognitive function in subjects with subclinical hypothyroidism following treatment with levothyroxine. Arch Med Sci 2012; 8(6):1096–1101. doi:10.5114/aoms.2012.32423
- Pasqualetti G, Pagano G, Rengo G, Ferrara N, Monzani F. Subclinical hypothyroidism and cognitive impairment: systematic review and meta-analysis. J Clin Endocrinol Metab 2015; 100(11):4240–4248. doi:10.1210/jc.2015-2046
- Christ-Crain M, Meier C, Huber PR, Staub J, Muller B. Effect of L-thyroxine replacement therapy on surrogate markers of skeletal and cardiac function in subclinical hypothyroidism. Endocrinologist 2004; 14(3):161–166. doi:10.1097/01.ten.0000127932.31710.4f
- Brennan MD, Powell C, Kaufman KR, Sun PC, Bahn RS, Nair KS. The impact of overt and subclinical hyperthyroidism on skeletal muscle. Thyroid 2006; 16(4):375–380. doi:10.1089/thy.2006.16.375
- Reuters VS, Teixeira Pde F, Vigario PS, et al. Functional capacity and muscular abnormalities in subclinical hypothyroidism. Am J Med Sci 2009; 338(4):259–263. doi:10.1097/MAJ.0b013e3181af7c7c
- Mainenti MR, Vigario PS, Teixeira PF, Maia MD, Oliveira FP, Vaisman M. Effect of levothyroxine replacement on exercise performance in subclinical hypothyroidism. J Endocrinol Invest 2009; 32(5):470–473. doi:10.3275/6106
- Lankhaar JA, de Vries WR, Jansen JA, Zelissen PM, Backx FJ. Impact of overt and subclinical hypothyroidism on exercise tolerance: a systematic review. Res Q Exerc Sport 2014; 85(3):365–389. doi:10.1080/02701367.2014.930405
- Lee JS, Buzkova P, Fink HA, et al. Subclinical thyroid dysfunction and incident hip fracture in older adults. Arch Intern Med 2010; 170(21):1876–1883. doi:10.1001/archinternmed.2010.424
- Svare A, Nilsen TI, Asvold BO, et al. Does thyroid function influence fracture risk? Prospective data from the HUNT2 study, Norway. Eur J Endocrinol 2013; 169(6):845–852. doi:10.1530/EJE-13-0546
- Di Mase R, Cerbone M, Improda N, et al. Bone health in children with long-term idiopathic subclinical hypothyroidism. Ital J Pediatr 2012; 38:56. doi:10.1186/1824-7288-38-56
- Boelaert K. The association between serum TSH concentration and thyroid cancer. Endocr Relat Cancer 2009; 16(4):1065–1072. doi:10.1677/ERC-09-0150
- Haymart MR, Glinberg SL, Liu J, Sippel RS, Jaume JC, Chen H. Higher serum TSH in thyroid cancer patients occurs independent of age and correlates with extrathyroidal extension. Clin Endocrinol (Oxf) 2009; 71(3):434–439. doi:10.1111/j.1365-2265.2008.03489.x
- Fiore E, Vitti P. Serum TSH and risk of papillary thyroid cancer in nodular thyroid disease. J Clin Endocrinol Metab 2012; 97(4):1134–1145. doi:10.1210/jc.2011-2735
- Fiore E, Rago T, Provenzale MA, et al. L-thyroxine-treated patients with nodular goiter have lower serum TSH and lower frequency of papillary thyroid cancer: results of a cross-sectional study on 27,914 patients. Endocr Relat Cancer 2010; 17(1):231–239. doi:10.1677/ERC-09-0251
- Hercbergs AH, Ashur-Fabian O, Garfield D. Thyroid hormones and cancer: clinical studies of hypothyroidism in oncology. Curr Opin Endocrinol Diabetes Obes 2010; 17(5):432–436. doi:10.1097/MED.0b013e32833d9710
- Thvilum M, Brandt F, Brix TH, Hegedus L. A review of the evidence for and against increased mortality in hypothyroidism. Nat Rev Endocrinol 2012; 8(7):417–424. doi:10.1038/nrendo.2012.29
- Stott DJ, Rodondi N, Kearney PM, et al; TRUST Study Group. Thyroid hormone therapy for older adults with subclinical hypothyroidism. N Engl J Med 2017; 376(26):2534–2544. doi:10.1056/NEJMoa1603825
- Practice Committee of the American Society for Reproductive Medicine. Subclinical hypothyroidism in the infertile female population: a guideline. Fertil Steril 2015; 104(3):545–753. doi:10.1016/j.fertnstert.2015.05.028
- Stagnaro-Green A, Abalovich M, Alexander E, et al; American Thyroid Association Taskforce on Thyroid Disease During Pregnancy and Postpartum. Guidelines of the American Thyroid Association for the diagnosis and management of thyroid disease during pregnancy and postpartum. Thyroid 2011; 21(10):1081–1125. doi:10.1089/thy.2011.0087
- Goldsmith RE, Sturgis SH, Lerman J, Stanbury JB. The menstrual pattern in thyroid disease. J Clin Endocrinol Metab. 1952; 12(7):846-855. doi:10.1210/jcem-12-7-846
- Plowden TC, Schisterman EF, Sjaarda LA, et al. Subclinical hypothyroidism and thyroid autoimmunity are not associated with fecundity, pregnancy loss, or live birth. J Clin Endocrinol Metab 2016; 101(6):2358–2365. doi:10.1210/jc.2016-1049
- Alexander EK, Pearce EN, Brent GA, et al. 2017 Guidelines of the American Thyroid Association for the diagnosis and management of thyroid disease during pregnancy and the postpartum. Thyroid 2017; 27(3):315–389. doi:10.1089/thy.2016.0457
- Negro R, Formoso G, Mangieri T, Pezzarossa A, Dazzi D, Hassan H. Levothyroxine treatment in euthyroid pregnant women with autoimmune thyroid disease: effects on obstetrical complications. J Clin Endocrinol Metab 2006; 91(7):2587–2591. doi:10.1210/jc.2005-1603
- Panesar NS, Li CY, Rogers MS. Reference intervals for thyroid hormones in pregnant Chinese women. Ann Clin Biochem 2001; 38(pt 4):329–332. doi:10.1258/0004563011900830
- Lepoutre T, Debieve F, Gruson D, Daumerie C. Reduction of miscarriages through universal screening and treatment of thyroid autoimmune diseases. Gynecol Obstet Invest 2012; 74(4):265–273. doi:10.1159/000343759
- De Groot L, Abalovich M, Alexander EK, et al. Management of thyroid dysfunction during pregnancy and postpartum: an Endocrine Society clinical practice guideline. J Clin Endocrinol Metab 2012; 97(8):2543–2565. doi:10.1210/jc.2011-2803
- Crawford NM, Steiner AZ. Thyroid autoimmunity and reproductive function. Semin Reprod Med 2016; 34(6):343–350. doi:10.1055/s-0036-1593485
- Maraka S, Ospina NM, O’Keeffe DT, et al. Subclinical hypothyroidism in pregnancy: a systematic review and meta-analysis. Thyroid 2016; 26(4):580–590. doi:10.1089/thy.2015.0418
- Wiles KS, Jarvis S, Nelson-Piercy C. Are we overtreating subclinical hypothyroidism in pregnancy? BMJ 2015; 351:h4726. doi:10.1136/bmj.h4726
- Tudela CM, Casey BM, McIntire DD, Cunningham FG. Relationship of subclinical thyroid disease to the incidence of gestational diabetes. Obstet Gynecol 2012; 119(5):983–988. doi:10.1097/AOG.0b013e318250aeeb
- Lazarus J, Brown RS, Daumerie C, Hubalewska-Dydejczyk A, Negro R, Vaidya B. 2014 European Thyroid Association guidelines for the management of subclinical hypothyroidism in pregnancy and in children. Eur Thyroid J 2014; 3(2):76–94. doi:10.1159/000362597
- Karakosta P, Alegakis D, Georgiou V, et al. Thyroid dysfunction and autoantibodies in early pregnancy are associated with increased risk of gestational diabetes and adverse birth outcomes. J Clin Endocrinol Metab 2012; 97(12):4464–4472. doi:10.1210/jc.2012-2540
- Toulis KA, Stagnaro-Green A, Negro R. Maternal subclinical hypothyroidsm and gestational diabetes mellitus: a meta-analysis. Endocr Pract 2014; 20(7):703–714. doi:10.4158/EP13440.RA
- van den Boogaard E, Vissenberg R, Land JA, et al. Significance of subclinical thyroid dysfunction and thyroid autoimmunity before conception and in early pregnancy: a systematic review. Hum Reprod Update 2011; 17(5):605–619. doi:10.1093/humupd/dmr024
- Wilson KL, Casey BM, McIntire DD, Halvorson LM, Cunningham FG. Subclinical thyroid disease and the incidence of hypertension in pregnancy. Obstet Gynecol 2012; 119(2 Pt 1):315–320. doi:10.1097/AOG.0b013e318240de6a
- Ashoor G, Maiz N, Rotas M, Jawdat F, Nicolaides KH. Maternal thyroid function at 11 to 13 weeks of gestation and subsequent fetal death. Thyroid 2010; 20(9):989–993. doi:10.1089/thy.2010.0058
- Casey BM, Dashe JS, Wells CE, et al. Subclinical hypothyroidism and pregnancy outcomes. Obstet Gynecol 2005; 105(2):239–245. doi:10.1097/01.AOG.0000152345.99421.22
- Negro R, Schwartz A, Gismondi R, Tinelli A, Mangieri T, Stagnaro-Green A. Increased pregnancy loss rate in thyroid antibody negative women with TSH levels between 2.5 and 5.0 in the first trimester of pregnancy. J Clin Endocrinol Metab 2010; 95(9):E44–E48. doi:10.1210/jc.2010-0340
- Su PY, Huang K, Hao JH, et al. Maternal thyroid function in the first twenty weeks of pregnancy and subsequent fetal and infant development: a prospective population-based cohort study in China. J Clin Endocrinol Metab 2011; 96(10):3234–3241. doi:10.1210/jc.2011-0274
- Allan WC, Haddow JE, Palomaki GE, et al. Maternal thyroid deficiency and pregnancy complications: implications for population screening. J Med Screen 2000; 7(3):127–130. doi:10.1136/jms.7.3.127
- Benhadi N, Wiersinga WM, Reitsma JB, Vrijkotte TG, Bonsel GJ. Higher maternal TSH levels in pregnancy are associated with increased risk for miscarriage, fetal or neonatal death. Eur J Endocrinol 2009; 160(6):985–991. doi:10.1530/EJE-08-0953
- Korevaar TI, Medici M, de Rijke YB, et al. Ethnic differences in maternal thyroid parameters during pregnancy: the generation R study. J Clin Endocrinol Metab 2013; 98(9):3678–3686. doi:10.1210/jc.2013-2005
- Cleary-Goldman J, Malone FD, Lambert-Messerlian G, et al. Maternal thyroid hypofunction and pregnancy outcome. Obstet Gynecol 2008; 112(1):85–92. doi:10.1097/AOG.0b013e3181788dd7
- Li Y, Shan Z, Teng W, et al. Abnormalities of maternal thyroid function during pregnancy affect neuropsychological development of their children at 25-30 months. Clin Endocrinol (Oxf) 2010; 72(6):825–829. doi:10.1111/j.1365-2265.2009.03743.x
- Haddow JE, Palomaki GE, Allan WC, et al. Maternal thyroid deficiency during pregnancy and subsequent neuropsychological development of the child. N Engl J Med 1999; 341(8):549–555. doi:10.1056/NEJM199908193410801
- Henrichs J, Bongers-Schokking JJ, Schenk JJ, et al. Maternal thyroid function during early pregnancy and cognitive functioning in early childhood: the generation R study. J Clin Endocrinol Metab 2010; 95(9):4227–4234. doi:10.1210/jc.2010-0415
- Behrooz HG, Tohidi M, Mehrabi Y, Behrooz EG, Tehranidoost M, Azizi F. Subclinical hypothyroidism in pregnancy: intellectual development of offspring. Thyroid 2011; 21(10):1143–1147. doi:10.1089/thy.2011.0053
- Julvez J, Alvarez-Pedrerol M, Rebagliato M, et al. Thyroxine levels during pregnancy in healthy women and early child neurodevelopment. Epidemiology 2013; 24(1):150–157. doi:10.1097/EDE.0b013e318276ccd3
- Casey BM, Thom EA, Peaceman AM, et al; Eunice Kennedy Shriver National Institute of Child Health and Human Development Maternal–Fetal Medicine Units Network. Treatment of subclinical hypothyroidism or hypothyroxinemia in pregnancy. N Engl J Med 2017; 376(9):815–825. doi:10.1056/NEJMoa1606205
- Burns RB, Bates CK, Hartzband P, Smetana GW. Should we treat for subclinical hypothyroidism?: Grand rounds discussion from Beth Israel Deaconess Medical Center. Ann Intern Med 2016; 164(11):764–770. doi:10.7326/M16-0857
- Kucukler FK, Akbaba G, Arduc A, Simsek Y, Guler S. Evaluation of the common mistakes made by patients in the use of levothyroxine. Eur J Intern Med 2014; 25(9):e107–e108. doi:10.1016/j.ejim.2014.09.002
- McMillan M, Rotenberg KS, Vora K, et al. Comorbidities, concomitant medications, and diet as factors affecting levothyroxine therapy: results of the CONTROL surveillance project. Drugs R D 2016; 16(1):53–68. doi:10.1007/s40268-015-0116-6
- Pollock MA, Sturrock A, Marshall K, et al. Thyroxine treatment in patients with symptoms of hypothyroidism but thyroid function tests within the reference range: Randomised double blind placebo controlled crossover trial. BMJ 2001; 323(7318):891–895. pmid:11668132
- Peeters RP. Subclinical hypothyroidism. N Engl J Med 2017; 376(26):2556–2565. doi:10.1056/NEJMcp1611144
Whether subclinical hypothyroidism is clinically important and should be treated remains controversial. Studies have differed in their findings, and although most have found this condition to be associated with a variety of adverse outcomes, large randomized controlled trials are needed to clearly demonstrate its clinical impact in various age groups and the benefit of levothyroxine therapy.
Currently, the best practical approach is to base treatment decisions on the magnitude of elevation of thyroid-stimulating hormone (TSH) and whether the patient has thyroid autoantibodies and associated comorbid conditions.
HIGH TSH, NORMAL FREE T4 LEVELS
Subclinical hypothyroidism is defined by elevated TSH along with a normal free thyroxine (T4).1
The hypothalamic-pituitary-thyroid axis is a balanced homeostatic system, and TSH and thyroid hormone levels have an inverse log-linear relation: if free T4 and triiodothyronine (T3) levels go down even a little, TSH levels go up a lot.2
TSH secretion is pulsatile and has a circadian rhythm: serum TSH levels are 50% higher at night and early in the morning than during the rest of the day. Thus, repeated measurements in the same patient can vary by as much as half of the reference range.3
WHAT IS THE UPPER LIMIT OF NORMAL FOR TSH?
The upper limit of normal for TSH, defined as the 97.5th percentile, is approximately 4 or 5 mIU/L depending on the laboratory and the population, but some experts believe it should be lower.3
In favor of a lower upper limit: the distribution of serum TSH levels in the healthy general population does not seem to be a typical bell-shaped Gaussian curve, but rather has a tail at the high end. Some argue that some of the individuals with values in the upper end of the normal range may actually have undiagnosed hypothyroidism and that the upper 97.5th percentile cutoff would be 2.5 mIU/L if these people were excluded.4 Also, TSH levels higher than 2.5 mIU/L have been associated with a higher prevalence of antithyroid antibodies and a higher risk of clinical hypothyroidism.5
On the other hand, lowering the upper limit of normal to 2.5 mIU/L would result in 4 times as many people receiving a diagnosis of subclinical hypothyroidism, or 22 to 28 million people in the United States.4,6 Thus, lowering the cutoff may lead to unnecessary therapy and could even harm from overtreatment.
Another argument against lowering the upper limit of normal for TSH is that, with age, serum TSH levels shift higher.7 The third National Health and Nutrition Education Survey (NHANES III) found that the 97.5th percentile for serum TSH was 3.56 mIU/L for age group 20 to 29 but 7.49 mIU/L for octogenarians.7,8
It has been suggested that the upper limit of normal for TSH be adjusted for age, race, sex, and iodine intake.3 Currently available TSH reference ranges are not adjusted for these variables, and there is not enough evidence to suggest age-appropriate ranges,9 although higher TSH cutoffs for treatment are advised in elderly patients.10 Interestingly, higher TSH in older people has been linked to lower mortality rates in some studies.11
Authors of the NHANES III8 and Hanford Thyroid Disease study12 have proposed a cutoff of 4.1 mIU/L for the upper limit of normal for serum TSH in patients with negative antithyroid antibodies and normal findings on thyroid ultrasonography.
SUBCLINICAL HYPOTHYROIDISM IS COMMON
In different studies, the prevalence of subclinical hypothyroidism has been as low as 4% and as high as 20%.1,8,13 The prevalence is higher in women and increases with age.8 It is higher in iodine-sufficient areas, and it increases in iodine-deficient areas with iodine supplementation.14 Genetics also plays a role, as subclinical hypothyroidism is more common in white people than in African Americans.8
A difficulty in estimating the prevalence is the disagreement about the cutoff for TSH, which may differ from that in the general population in certain subgroups such as adolescents, the elderly, and pregnant women.10,15
A VARIETY OF CAUSES
The most common cause of subclinical hypothyroidism, accounting for 60% to 80% of cases, is Hashimoto (autoimmune) thyroiditis,2 in which thyroid peroxidase antibodies are usually present.2,16
Also important to rule out are false-positive elevations due to substances that interfere with TSH assays (eg, heterophile antibodies, rheumatoid factor, biotin, macro-TSH); reversible causes such as the recovery phase of euthyroid sick syndrome; subacute, painless, or postpartum thyroiditis; central hypo- or hyperthyroidism; and thyroid hormone resistance.
SUBCLINICAL HYPOTHYROIDISM CAN RESOLVE OR PROGRESS
“Subclinical” suggests that the disease is in its early stage, with changes in TSH already apparent but decreases in thyroid hormone levels yet to come.17 And indeed, subclinical hypothyroidism can progress to overt hypothyroidism,18 although it has been reported to resolve spontaneously in half of cases within 2 years,19 typically in patients with TSH values of 4 to 6 mIU/L.20 The rate of progression to overt hypothyroidism is estimated to be 33% to 55% over 10 to 20 years of follow-up.18
Figure 1 shows the natural history of subclinical hypothyroidism.1
GUIDELINES FOR SCREENING DIFFER
Guidelines differ on screening for thyroid disease in the general population, owing to lack of large-scale randomized controlled trials showing treatment benefit in otherwise-healthy people with mildly elevated TSH values.
Various professional societies have adopted different criteria for aggressive case-finding in patients at risk of thyroid disease. Risk factors include family history of thyroid disease, neck irradiation, partial thyroidectomy, dyslipidemia, atrial fibrillation, unexplained weight loss, hyperprolactinemia, autoimmune disorders, and use of medications affecting thyroid function.23
The US Preventive Services Task Force in 2014 found insufficient evidence on the benefits and harms of screening.24
The American Thyroid Association (ATA) recommends screening adults starting at age 35, with repeat testing every 5 years in patients who have no signs or symptoms of hypothyroidism, and more frequently in those who do.25
The American Association of Clinical Endocrinologists recommends screening in women and older patients. Their guidelines and those of the ATA also suggest screening people at high risk of thyroid disease due to risk factors such as history of autoimmune diseases, neck irradiation, or medications affecting thyroid function.26
The American Academy of Family Physicians recommends screening after age 60.18
The American College of Physicians recommends screening patients over age 50 who have symptoms.18
Our approach. Although evidence is lacking to recommend routine screening in adults, aggressive case-finding and treatment in patients at risk of thyroid disease can, we believe, offset the risks associated with subclinical hypothyroidism.24
CLINICAL PRESENTATION
About 70% of patients with subclinical hypothyroidism have no symptoms.13
Tiredness was more common in subclinical hypothyroid patients with TSH levels lower than 10 mIU/L compared with euthyroid controls in 1 study, but other studies have been unable to replicate this finding.27,28
Other frequently reported symptoms include dry skin, cognitive slowing, poor memory, muscle weakness, cold intolerance, constipation, puffy eyes, and hoarseness.13
The evidence in favor of levothyroxine therapy to improve symptoms in subclinical hypothyroidism has varied, with some studies showing an improvement in symptom scores compared with placebo, while others have not shown any benefit.29–31
In one study, the average TSH value for patients whose symptoms did not improve with therapy was 4.6 mIU/L.31 An explanation for the lack of effect in this group may be that the TSH values for these patients were in the high-normal range. Also, because most subclinical hypothyroid patients have no symptoms, it is difficult to ascertain symptomatic improvement. Though it is possible to conclude that levothyroxine therapy has a limited role in this group, it is important to also consider the suggestive evidence that untreated subclinical hypothyroidism may lead to increased morbidity and mortality.
ADVERSE EFFECTS OF SUBCLINICAL HYPOTHYROIDISM, EFFECTS OF THERAPY
INDIVIDUALIZED MANAGEMENT AND SHARED DECISION-MAKING
The management of subclinical hypothyroidism should be individualized on the basis of extent of thyroid dysfunction, comorbid conditions, risk factors, and patient preference.118 Shared decision-making is key, weighing the risks and benefits of levothyroxine treatment and the patient’s goals.
The risks of treatment should be kept in mind and explained to the patient. Levothyroxine has a narrow therapeutic range, causing a possibility of overreplacement, and a half-life of 7 days that can cause dosing errors to have longer effect.118,119
Adherence can be a challenge. The drug needs to be taken on an empty stomach because foods and supplements interfere with its absorption.118,120 In addition, the cost of medication, frequent biochemical monitoring, and possible need for titration can add to financial burden.
When choosing the dose, one should consider the degree of hypothyroidism or TSH elevation and the patient’s weight, and adjust the dose gently.
If the TSH is high-normal
It is proposed that a TSH range of 3 to 5 mIU/L overlaps with normal thyroid function in a great segment of the population, and at this level it is probably not associated with clinically significant consequences. For these reasons, levothyroxine therapy is not thought to be beneficial for those with TSH in this range.
Pollock et al121 found that, in patients with symptoms suggesting hypothyroidism and TSH values in the upper end of the normal range, there was no improvement in cognitive function or psychological well-being after 12 weeks of levothyroxine therapy.
However, due to the concern for possible adverse maternal and fetal outcomes and low IQ in children of pregnant patients with subclinical hypothyroidism, levothyroxine therapy is advised in those who are pregnant or planning pregnancy who have TSH levels higher than 2.5 mIU/L, especially if they have thyroid peroxidase antibody. Levothyroxine therapy is not recommended for pregnant patients with negative thyroid peroxidase antibody and TSH within the pregnancy-specific range or less than 4 mIU/L if the reference ranges are unavailable.
Keep in mind that, even at these TSH values, there is risk of progression to overt hypothyroidism, especially in the presence of thyroid peroxidase antibody, so patients in this group should be monitored closely.
If TSH is mildly elevated
The evidence to support levothyroxine therapy in patients with subclinical hypothyroidism with TSH levels less than 10 mIU/L remains inconclusive, and the decision to treat should be based on clinical judgment.2 The studies that have looked at the benefit of treating subclinical hypothyroidism in terms of cardiac, neuromuscular, cognitive, and neuropsychiatric outcomes have included patients with a wide range of TSH levels, and some of these studies were not stratified on the basis of degree of TSH elevation.
The risk that subclinical hypothyroidism will progress to overt hypothyroidism in patients with TSH higher than 8 mIU/L is high, and in 70% of these patients, the TSH level rises to more than 10 mIU/L within 4 years. Early treatment should be considered if the TSH is higher than 7 or 8 mIU/L.
If TSH is higher than 10 mIU/L
Figure 2 outlines an algorithmic approach to subclinical hypothyroidism in nonpregnant patients as suggested by Peeters.122
- Cooper DS, Biondi B. Subclinical thyroid disease. Lancet 2012; 379(9821):1142–1154. doi:10.1016/S0140-6736(11)60276-6
- Fatourechi V. Subclinical hypothyroidism: an update for primary care physicians. Mayo Clin Proc 2009; 84(1):65–71. doi:10.4065/84.1.65
- Laurberg P, Andersen S, Carle A, Karmisholt J, Knudsen N, Pedersen IB. The TSH upper reference limit: where are we at? Nat Rev Endocrinol 2011; 7(4):232–239. doi:10.1038/nrendo.2011.13
- Wartofsky L, Dickey RA. The evidence for a narrower thyrotropin reference range is compelling. J Clin Endocrinol Metab 2005; 90(9):5483–5488. doi:10.1210/jc.2005-0455
- Spencer CA, Hollowell JG, Kazarosyan M, Braverman LE. National Health and Nutrition Examination Survey III thyroid-stimulating hormone (TSH)-thyroperoxidase antibody relationships demonstrate that TSH upper reference limits may be skewed by occult thyroid dysfunction. J Clin Endocrinol Metab 2007; 92(11):4236–4240. doi:10.1210/jc.2007-0287
- Fatourechi V, Klee GG, Grebe SK, et al. Effects of reducing the upper limit of normal TSH values. JAMA 2003; 290(24):3195–3196. doi:10.1001/jama.290.24.3195-a
- Surks MI, Hollowell JG. Age-specific distribution of serum thyrotropin and antithyroid antibodies in the US population: implications for the prevalence of subclinical hypothyroidism. J Clin Endocrinol Metab 2007; 92(12):4575–4582. doi:10.1210/jc.2007-1499
- Hollowell JG, Staehling NW, Flanders WD, et al. Serum TSH, T(4), and thyroid antibodies in the United States population (1988 to 1994): National Health and Nutrition Examination Survey (NHANES III). J Clin Endocrinol Metab 2002; 87(2):489–499. doi:10.1210/jcem.87.2.8182
- Jonklaas J, Bianco AC, Bauer AJ, et al; American Thyroid Association Task Force on Thyroid Hormone Replacement. Guidelines for the treatment of hypothyroidism: prepared by the American Thyroid Association Task Force on Thyroid Hormone Replacement. Thyroid 2014; 24(12):1670–1751. doi:10.1089/thy.2014.0028
- Hennessey JV, Espaillat R. Diagnosis and management of subclinical hypothyroidism in elderly adults: a review of the literature. J Am Geriatr Soc 2015; 63(8):1663–1673. doi:10.1111/jgs.13532
- Razvi S, Shakoor A, Vanderpump M, Weaver JU, Pearce SH. The influence of age on the relationship between subclinical hypothyroidism and ischemic heart disease: a metaanalysis. J Clin Endocrinol Metab 2008; 93(8):2998–3007. doi:10.1210/jc.2008-0167
- Hamilton TE, Davis S, Onstad L, Kopecky KJ. Thyrotropin levels in a population with no clinical, autoantibody, or ultrasonographic evidence of thyroid disease: implications for the diagnosis of subclinical hypothyroidism. J Clin Endocrinol Metab 2008; 93(4):1224–1230. doi:10.1210/jc.2006-2300
- Canaris GJ, Manowitz NR, Mayor G, Ridgway EC. The Colorado thyroid disease prevalence study. Arch Intern Med 2000; 160(4):526–534. pmid:10695693
- Teng W, Shan Z, Teng X, et al. Effect of iodine intake on thyroid diseases in China. N Engl J Med 2006; 354(26):2783–2793. doi:10.1056/NEJMoa054022
- Negro R, Stagnaro-Green A. Diagnosis and management of subclinical hypothyroidism in pregnancy. BMJ 2014; 349:g4929. doi:10.1136/bmj.g4929
- Baumgartner C, Blum MR, Rodondi N. Subclinical hypothyroidism: summary of evidence in 2014. Swiss Med Wkly 2014; 144:w14058. doi:10.4414/smw.2014.14058
- Stedman TL. Stedman’s Medical Dictionary. 28th ed. Baltimore, MD: Lippincott Williams and Wilkins; 2006.
- Raza SA, Mahmood N. Subclinical hypothyroidism: controversies to consensus. Indian J Endocrinol Metab 2013; 17(suppl 3):S636–S642. doi:10.4103/2230-8210.123555
- Huber G, Staub JJ, Meier C, et al. Prospective study of the spontaneous course of subclinical hypothyroidism: prognostic value of thyrotropin, thyroid reserve, and thyroid antibodies. J Clin Endocrinol Metab 2002; 87(7):3221–3226. doi:10.1210/jcem.87.7.8678
- Diez JJ, Iglesias P, Burman KD. Spontaneous normalization of thyrotropin concentrations in patients with subclinical hypothyroidism. J Clin Endocrinol Metab 2005; 90(7):4124–4127. doi:10.1210/jc.2005-0375
- Vanderpump MP, Tunbridge WM, French JM, et al. The incidence of thyroid disorders in the community: a twenty-year follow-up of the Whickham survey. Clin Endocrinol (Oxf) 1995; 43(1):55–68. pmid:7641412
- Li Y, Teng D, Shan Z, et al. Antithyroperoxidase and antithyroglobulin antibodies in a five-year follow-up survey of populations with different iodine intakes. J Clin Endocrinol Metab 2008; 93(5):1751–1757. doi:10.1210/jc.2007-2368
- Hennessey JV, Klein I, Woeber KA, Cobin R, Garber JR. Aggressive case finding: a clinical strategy for the documentation of thyroid dysfunction. Ann Intern Med 2015; 163(4):311–312. doi:10.7326/M15-0762
- Rugge JB, Bougatsos C, Chou R. Screening and treatment of thyroid dysfunction: an evidence review for the US.Preventive Services Task Force. Ann Intern Med 2015; 162(1):35–45. doi:10.7326/M14-1456
- Ladenson PW, Singer PA, Ain KB, et al. American Thyroid Association guidelines for detection of thyroid dysfunction. Arch Intern Med 2000; 160(11):1573–1575. pmid:10847249
- Garber JR, Cobin RH, Gharib H, et al; American Association of Clinical Endocrinologists and American Thyroid Association Taskforce on Hypothyroidism in Adults. Clinical practice guidelines for hypothyroidism in adults: cosponsored by the American Association of Clinical Endocrinologists and the American Thyroid Association. Endocr Pract 2012; 18(6):988–1028. doi:10.4158/EP12280.GL
- Jorde R, Waterloo K, Storhaug H, Nyrnes A, Sundsfjord J, Jenssen TG. Neuropsychological function and symptoms in subjects with subclinical hypothyroidism and the effect of thyroxine treatment. J Clin Endocrinol Metab 2006; 91(1):145–153. doi:10.1210/jc.2005-1775
- Joffe RT, Pearce EN, Hennessey JV, Ryan JJ, Stern RA. Subclinical hypothyroidism, mood, and cognition in older adults: a review. Int J Geriatr Psychiatry 2013; 28(2):111–118. doi:10.1002/gps.3796
- Cooper DS, Halpern R, Wood LC, Levin AA, Ridgway EC. L-thyroxine therapy in subclinical hypothyroidism. A double-blind, placebo-controlled trial. Ann Intern Med 1984; 101(1):18–24. pmid:6428290
- Nystrom E, Caidahl K, Fager G, Wikkelso C, Lundberg PA, Lindstedt G. A double-blind cross-over 12-month study of L-thyroxine treatment of women with ‘subclinical’ hypothyroidism. Clin Endocrinol (Oxf) 1988; 29(1):63–75. pmid:3073880
- Monzani F, Del Guerra P, Caraccio N, et al. Subclinical hypothyroidism: neurobehavioral features and beneficial effect of L-thyroxine treatment. Clin Investig 1993; 71(5):367–371. pmid:8508006
- Biondi B. Thyroid and obesity: an intriguing relationship. J Clin Endocrinol Metab 2010; 95(8):3614–3617. doi:10.1210/jc.2010-1245
- Erdogan M, Canataroglu A, Ganidagli S, Kulaksizoglu M. Metabolic syndrome prevalence in subclinic and overt hypothyroid patients and the relation among metabolic syndrome parameters. J Endocrinol Invest 2011; 34(7):488–492. doi:10.3275/7202
- Javed Z, Sathyapalan T. Levothyroxine treatment of mild subclinical hypothyroidism: a review of potential risks and benefits. Ther Adv Endocrinol Metab 2016; 7(1):12–23. doi:10.1177/2042018815616543
- Pearce SH, Brabant G, Duntas LH, et al. 2013 ETA guideline: management of subclinical hypothyroidism. Eur Thyroid J 2013; 2(4):215–228. doi:10.1159/000356507
- Wang C. The relationship between type 2 diabetes mellitus and related thyroid diseases. J Diabetes Res 2013; 2013:390534. doi:10.1155/2013/390534
- Razvi S, Weaver JU, Vanderpump MP, Pearce SH. The incidence of ischemic heart disease and mortality in people with subclinical hypothyroidism: reanalysis of the Whickham survey cohort. J Clin Endocrinol Metab 2010; 95(4):1734–1740. doi:10.1210/jc.2009-1749
- Bindels AJ, Westendorp RG, Frolich M, Seidell JC, Blokstra A, Smelt AH. The prevalence of subclinical hypothyroidism at different total plasma cholesterol levels in middle aged men and women: a need for case-finding? Clin Endocrinol (Oxf) 1999; 50(2):217–220. pmid:10396365
- Pearce EN. Hypothyroidism and dyslipidemia: modern concepts and approaches. Curr Cardiol Rep 2004; 6(6):451–456. pmid:15485607
- Pearce EN. Update in lipid alterations in subclinical hypothyroidism. J Clin Endocrinol Metab 2012; 97(2):326–333. doi:10.1210/jc.2011-2532
- Rizos CV, Elisaf MS, Liberopoulos EN. Effects of thyroid dysfunction on lipid profile. Open Cardiovasc Med J 2011; 5:76–84. doi:10.2174/1874192401105010076
- Peppa M, Betsi G, Dimitriadis G. Lipid abnormalities and cardiometabolic risk in patients with overt and subclinical thyroid disease. J Lipids 2011; 2011:575840. doi:10.1155/2011/575840
- Asvold BO, Vatten LJ, Nilsen TI, Bjoro T. The association between TSH within the reference range and serum lipid concentrations in a population-based study. the HUNT study. Eur J Endocrinol 2007;1 56(2):181–186. doi:10.1530/eje.1.02333
- Danese MD, Ladenson PW, Meinert CL, Powe NR. Clinical review 115: effect of thyroxine therapy on serum lipoproteins in patients with mild thyroid failure: a quantitative review of the literature. J Clin Endocrinol Metab 2000; 85(9):2993–3001. doi:10.1210/jcem.85.9.6841
- Razvi S, Ingoe L, Keeka G, Oates C, McMillan C, Weaver JU. The beneficial effect of L-thyroxine on cardiovascular risk factors, endothelial function, and quality of life in subclinical hypothyroidism: randomized, crossover trial. J Clin Endocrinol Metab 2007; 92(5):1715–1723. doi:10.1210/jc.2006-1869
- Abreu IM, Lau E, de Sousa Pinto B, Carvalho D. Subclinical hypothyroidism: to treat or not to treat, that is the question! A systematic review with meta-analysis on lipid profile. Endocr Connect 2017; 6(3):188–199. doi:10.1530/EC-17-0028
- Robison CD, Bair TL, Horne BD, et al. Hypothyroidism as a risk factor for statin intolerance. J Clin Lipidol 2014; 8(4):401–407. doi:10.1016/j.jacl.2014.05.005
- Hak AE, Pols HA, Visser TJ, Drexhage HA, Hofman A, Witteman JC. Subclinical hypothyroidism is an independent risk factor for atherosclerosis and myocardial infarction in elderly women: the Rotterdam study. Ann Intern Med 2000; 132(4):270–278. pmid:10681281
- Boekholdt SM, Titan SM, Wiersinga WM, et al. Initial thyroid status and cardiovascular risk factors: the EPIC-Norfolk prospective population study. Clin Endocrinol (Oxf) 2010; 72(3):404–410. doi:10.1111/j.1365-2265.2009.03640.x
- Andersen MN, Olsen AM, Madsen JC, et al. Levothyroxine substitution in patients with subclinical hypothyroidism and the risk of myocardial infarction and mortality. PLoS One 2015; 10(6):e0129793. doi:10.1371/journal.pone.0129793
- Biondi B. Cardiovascular effects of mild hypothyroidism. Thyroid 2007; 17(7):625–630. doi:10.1089/thy.2007.0158
- Brenta G, Mutti LA, Schnitman M, Fretes O, Perrone A, Matute ML. Assessment of left ventricular diastolic function by radionuclide ventriculography at rest and exercise in subclinical hypothyroidism, and its response to L-thyroxine therapy. Am J Cardiol 2003; 91(11):1327–1330. pmid:12767425
- Taddei S, Caraccio N, Virdis A, et al. Impaired endothelium-dependent vasodilatation in subclinical hypothyroidism: beneficial effect of levothyroxine therapy. J Clin Endocrinol Metab 2003; 88(8):3731–3737. doi:10.1210/jc.2003-030039
- Gao N, Zhang W, Zhang YZ, Yang Q, Chen SH. Carotid intima-media thickness in patients with subclinical hypothyroidism: a meta-analysis. Atherosclerosis 2013; 227(1):18–25. doi:10.1016/j.atherosclerosis.2012.10.070
- Biondi B, Cooper DS. The clinical significance of subclinical thyroid dysfunction. Endocr Rev 2008; 29(1):76–131. doi:10.1210/er.2006-0043
- Chaker L, Baumgartner C, den Elzen WP, et al; Thyroid Studies Collaboration. Subclinical hypothyroidism and the risk of stroke events and fatal stroke: an individual participant data analysis. J Clin Endocrinol Metab 2015; 100(6):2181–2191. doi:10.1210/jc.2015-1438
- Monzani F, Di Bello V, Caraccio N, et al. Effect of levothyroxine on cardiac function and structure in subclinical hypothyroidism: a double blind, placebo-controlled study. J Clin Endocrinol Metab 2001; 86(3):1110–1115. doi:10.1210/jcem.86.3.7291
- Parle JV, Maisonneuve P, Sheppard MC, Boyle P, Franklyn JA. Prediction of all-cause and cardiovascular mortality in elderly people from one low serum thyrotropin result: a 10-year cohort study. Lancet 2001; 358(9285):861-865. doi:10.1016/S0140-6736(01)06067-6
- Razvi S, Weaver JU, Butler TJ, Pearce SH. Levothyroxine treatment of subclinical hypothyroidism, fatal and nonfatal cardiovascular events, and mortality. Arch Intern Med 2012; 172(10):811–817. doi:10.1001/archinternmed.2012.1159
- Pasqualetti G, Tognini S, Polini A, Caraccio N, Monzani F. Is subclinical hypothyroidism a cardiovascular risk factor in the elderly? J Clin Endocrinol Metab 2013; 98(6):2256–2266. doi:10.1210/jc.2012-3818
- Mooijaart SP, IEMO 80-plus Thyroid Trial Collaboration. Subclinical thyroid disorders. Lancet 2012; 380(9839):335. doi:10.1016/S0140-6736(12)61241-0
- Rodondi N, Bauer DC. Subclinical hypothyroidism and cardiovascular risk: how to end the controversy. J Clin Endocrinol Metab 2013; 98(6):2267–2269. doi:10.1210/jc.2013-1875
- Rodondi N, Newman AB, Vittinghoff E, et al. Subclinical hypothyroidism and the risk of heart failure, other cardiovascular events, and death. Arch Intern Med 2005; 165(21):2460–2466. doi:10.1001/archinte.165.21.2460
- Rodondi N, Bauer DC, Cappola AR, et al. Subclinical thyroid dysfunction, cardiac function, and the risk of heart failure. The Cardiovascular Health study. J Am Coll Cardiol 2008; 52(14):1152–1159. doi:10.1016/j.jacc.2008.07.009
- Haggerty JJ Jr, Garbutt JC, Evans DL, et al. Subclinical hypothyroidism: a review of neuropsychiatric aspects. Int J Psychiatry Med 1990; 20(2):193–208. doi:10.2190/ADLY-1UU0-1A8L-HPXY
- Baldini IM, Vita A, Mauri MC, et al. Psychopathological and cognitive features in subclinical hypothyroidism. Prog Neuropsychopharmacol Biol Psychiatry 1997; 21(6):925–935. pmid:9380789
- del Ser Quijano T, Delgado C, Martinez Espinosa S, Vazquez C. Cognitive deficiency in mild hypothyroidism. Neurologia 2000; 15(5):193–198. Spanish. pmid:10850118
- Correia N, Mullally S, Cooke G, et al. Evidence for a specific defect in hippocampal memory in overt and subclinical hypothyroidism. J Clin Endocrinol Metab 2009; 94(10):3789–3797. doi:10.1210/jc.2008-2702
- Aghili R, Khamseh ME, Malek M, et al. Changes of subtests of Wechsler memory scale and cognitive function in subjects with subclinical hypothyroidism following treatment with levothyroxine. Arch Med Sci 2012; 8(6):1096–1101. doi:10.5114/aoms.2012.32423
- Pasqualetti G, Pagano G, Rengo G, Ferrara N, Monzani F. Subclinical hypothyroidism and cognitive impairment: systematic review and meta-analysis. J Clin Endocrinol Metab 2015; 100(11):4240–4248. doi:10.1210/jc.2015-2046
- Christ-Crain M, Meier C, Huber PR, Staub J, Muller B. Effect of L-thyroxine replacement therapy on surrogate markers of skeletal and cardiac function in subclinical hypothyroidism. Endocrinologist 2004; 14(3):161–166. doi:10.1097/01.ten.0000127932.31710.4f
- Brennan MD, Powell C, Kaufman KR, Sun PC, Bahn RS, Nair KS. The impact of overt and subclinical hyperthyroidism on skeletal muscle. Thyroid 2006; 16(4):375–380. doi:10.1089/thy.2006.16.375
- Reuters VS, Teixeira Pde F, Vigario PS, et al. Functional capacity and muscular abnormalities in subclinical hypothyroidism. Am J Med Sci 2009; 338(4):259–263. doi:10.1097/MAJ.0b013e3181af7c7c
- Mainenti MR, Vigario PS, Teixeira PF, Maia MD, Oliveira FP, Vaisman M. Effect of levothyroxine replacement on exercise performance in subclinical hypothyroidism. J Endocrinol Invest 2009; 32(5):470–473. doi:10.3275/6106
- Lankhaar JA, de Vries WR, Jansen JA, Zelissen PM, Backx FJ. Impact of overt and subclinical hypothyroidism on exercise tolerance: a systematic review. Res Q Exerc Sport 2014; 85(3):365–389. doi:10.1080/02701367.2014.930405
- Lee JS, Buzkova P, Fink HA, et al. Subclinical thyroid dysfunction and incident hip fracture in older adults. Arch Intern Med 2010; 170(21):1876–1883. doi:10.1001/archinternmed.2010.424
- Svare A, Nilsen TI, Asvold BO, et al. Does thyroid function influence fracture risk? Prospective data from the HUNT2 study, Norway. Eur J Endocrinol 2013; 169(6):845–852. doi:10.1530/EJE-13-0546
- Di Mase R, Cerbone M, Improda N, et al. Bone health in children with long-term idiopathic subclinical hypothyroidism. Ital J Pediatr 2012; 38:56. doi:10.1186/1824-7288-38-56
- Boelaert K. The association between serum TSH concentration and thyroid cancer. Endocr Relat Cancer 2009; 16(4):1065–1072. doi:10.1677/ERC-09-0150
- Haymart MR, Glinberg SL, Liu J, Sippel RS, Jaume JC, Chen H. Higher serum TSH in thyroid cancer patients occurs independent of age and correlates with extrathyroidal extension. Clin Endocrinol (Oxf) 2009; 71(3):434–439. doi:10.1111/j.1365-2265.2008.03489.x
- Fiore E, Vitti P. Serum TSH and risk of papillary thyroid cancer in nodular thyroid disease. J Clin Endocrinol Metab 2012; 97(4):1134–1145. doi:10.1210/jc.2011-2735
- Fiore E, Rago T, Provenzale MA, et al. L-thyroxine-treated patients with nodular goiter have lower serum TSH and lower frequency of papillary thyroid cancer: results of a cross-sectional study on 27,914 patients. Endocr Relat Cancer 2010; 17(1):231–239. doi:10.1677/ERC-09-0251
- Hercbergs AH, Ashur-Fabian O, Garfield D. Thyroid hormones and cancer: clinical studies of hypothyroidism in oncology. Curr Opin Endocrinol Diabetes Obes 2010; 17(5):432–436. doi:10.1097/MED.0b013e32833d9710
- Thvilum M, Brandt F, Brix TH, Hegedus L. A review of the evidence for and against increased mortality in hypothyroidism. Nat Rev Endocrinol 2012; 8(7):417–424. doi:10.1038/nrendo.2012.29
- Stott DJ, Rodondi N, Kearney PM, et al; TRUST Study Group. Thyroid hormone therapy for older adults with subclinical hypothyroidism. N Engl J Med 2017; 376(26):2534–2544. doi:10.1056/NEJMoa1603825
- Practice Committee of the American Society for Reproductive Medicine. Subclinical hypothyroidism in the infertile female population: a guideline. Fertil Steril 2015; 104(3):545–753. doi:10.1016/j.fertnstert.2015.05.028
- Stagnaro-Green A, Abalovich M, Alexander E, et al; American Thyroid Association Taskforce on Thyroid Disease During Pregnancy and Postpartum. Guidelines of the American Thyroid Association for the diagnosis and management of thyroid disease during pregnancy and postpartum. Thyroid 2011; 21(10):1081–1125. doi:10.1089/thy.2011.0087
- Goldsmith RE, Sturgis SH, Lerman J, Stanbury JB. The menstrual pattern in thyroid disease. J Clin Endocrinol Metab. 1952; 12(7):846-855. doi:10.1210/jcem-12-7-846
- Plowden TC, Schisterman EF, Sjaarda LA, et al. Subclinical hypothyroidism and thyroid autoimmunity are not associated with fecundity, pregnancy loss, or live birth. J Clin Endocrinol Metab 2016; 101(6):2358–2365. doi:10.1210/jc.2016-1049
- Alexander EK, Pearce EN, Brent GA, et al. 2017 Guidelines of the American Thyroid Association for the diagnosis and management of thyroid disease during pregnancy and the postpartum. Thyroid 2017; 27(3):315–389. doi:10.1089/thy.2016.0457
- Negro R, Formoso G, Mangieri T, Pezzarossa A, Dazzi D, Hassan H. Levothyroxine treatment in euthyroid pregnant women with autoimmune thyroid disease: effects on obstetrical complications. J Clin Endocrinol Metab 2006; 91(7):2587–2591. doi:10.1210/jc.2005-1603
- Panesar NS, Li CY, Rogers MS. Reference intervals for thyroid hormones in pregnant Chinese women. Ann Clin Biochem 2001; 38(pt 4):329–332. doi:10.1258/0004563011900830
- Lepoutre T, Debieve F, Gruson D, Daumerie C. Reduction of miscarriages through universal screening and treatment of thyroid autoimmune diseases. Gynecol Obstet Invest 2012; 74(4):265–273. doi:10.1159/000343759
- De Groot L, Abalovich M, Alexander EK, et al. Management of thyroid dysfunction during pregnancy and postpartum: an Endocrine Society clinical practice guideline. J Clin Endocrinol Metab 2012; 97(8):2543–2565. doi:10.1210/jc.2011-2803
- Crawford NM, Steiner AZ. Thyroid autoimmunity and reproductive function. Semin Reprod Med 2016; 34(6):343–350. doi:10.1055/s-0036-1593485
- Maraka S, Ospina NM, O’Keeffe DT, et al. Subclinical hypothyroidism in pregnancy: a systematic review and meta-analysis. Thyroid 2016; 26(4):580–590. doi:10.1089/thy.2015.0418
- Wiles KS, Jarvis S, Nelson-Piercy C. Are we overtreating subclinical hypothyroidism in pregnancy? BMJ 2015; 351:h4726. doi:10.1136/bmj.h4726
- Tudela CM, Casey BM, McIntire DD, Cunningham FG. Relationship of subclinical thyroid disease to the incidence of gestational diabetes. Obstet Gynecol 2012; 119(5):983–988. doi:10.1097/AOG.0b013e318250aeeb
- Lazarus J, Brown RS, Daumerie C, Hubalewska-Dydejczyk A, Negro R, Vaidya B. 2014 European Thyroid Association guidelines for the management of subclinical hypothyroidism in pregnancy and in children. Eur Thyroid J 2014; 3(2):76–94. doi:10.1159/000362597
- Karakosta P, Alegakis D, Georgiou V, et al. Thyroid dysfunction and autoantibodies in early pregnancy are associated with increased risk of gestational diabetes and adverse birth outcomes. J Clin Endocrinol Metab 2012; 97(12):4464–4472. doi:10.1210/jc.2012-2540
- Toulis KA, Stagnaro-Green A, Negro R. Maternal subclinical hypothyroidsm and gestational diabetes mellitus: a meta-analysis. Endocr Pract 2014; 20(7):703–714. doi:10.4158/EP13440.RA
- van den Boogaard E, Vissenberg R, Land JA, et al. Significance of subclinical thyroid dysfunction and thyroid autoimmunity before conception and in early pregnancy: a systematic review. Hum Reprod Update 2011; 17(5):605–619. doi:10.1093/humupd/dmr024
- Wilson KL, Casey BM, McIntire DD, Halvorson LM, Cunningham FG. Subclinical thyroid disease and the incidence of hypertension in pregnancy. Obstet Gynecol 2012; 119(2 Pt 1):315–320. doi:10.1097/AOG.0b013e318240de6a
- Ashoor G, Maiz N, Rotas M, Jawdat F, Nicolaides KH. Maternal thyroid function at 11 to 13 weeks of gestation and subsequent fetal death. Thyroid 2010; 20(9):989–993. doi:10.1089/thy.2010.0058
- Casey BM, Dashe JS, Wells CE, et al. Subclinical hypothyroidism and pregnancy outcomes. Obstet Gynecol 2005; 105(2):239–245. doi:10.1097/01.AOG.0000152345.99421.22
- Negro R, Schwartz A, Gismondi R, Tinelli A, Mangieri T, Stagnaro-Green A. Increased pregnancy loss rate in thyroid antibody negative women with TSH levels between 2.5 and 5.0 in the first trimester of pregnancy. J Clin Endocrinol Metab 2010; 95(9):E44–E48. doi:10.1210/jc.2010-0340
- Su PY, Huang K, Hao JH, et al. Maternal thyroid function in the first twenty weeks of pregnancy and subsequent fetal and infant development: a prospective population-based cohort study in China. J Clin Endocrinol Metab 2011; 96(10):3234–3241. doi:10.1210/jc.2011-0274
- Allan WC, Haddow JE, Palomaki GE, et al. Maternal thyroid deficiency and pregnancy complications: implications for population screening. J Med Screen 2000; 7(3):127–130. doi:10.1136/jms.7.3.127
- Benhadi N, Wiersinga WM, Reitsma JB, Vrijkotte TG, Bonsel GJ. Higher maternal TSH levels in pregnancy are associated with increased risk for miscarriage, fetal or neonatal death. Eur J Endocrinol 2009; 160(6):985–991. doi:10.1530/EJE-08-0953
- Korevaar TI, Medici M, de Rijke YB, et al. Ethnic differences in maternal thyroid parameters during pregnancy: the generation R study. J Clin Endocrinol Metab 2013; 98(9):3678–3686. doi:10.1210/jc.2013-2005
- Cleary-Goldman J, Malone FD, Lambert-Messerlian G, et al. Maternal thyroid hypofunction and pregnancy outcome. Obstet Gynecol 2008; 112(1):85–92. doi:10.1097/AOG.0b013e3181788dd7
- Li Y, Shan Z, Teng W, et al. Abnormalities of maternal thyroid function during pregnancy affect neuropsychological development of their children at 25-30 months. Clin Endocrinol (Oxf) 2010; 72(6):825–829. doi:10.1111/j.1365-2265.2009.03743.x
- Haddow JE, Palomaki GE, Allan WC, et al. Maternal thyroid deficiency during pregnancy and subsequent neuropsychological development of the child. N Engl J Med 1999; 341(8):549–555. doi:10.1056/NEJM199908193410801
- Henrichs J, Bongers-Schokking JJ, Schenk JJ, et al. Maternal thyroid function during early pregnancy and cognitive functioning in early childhood: the generation R study. J Clin Endocrinol Metab 2010; 95(9):4227–4234. doi:10.1210/jc.2010-0415
- Behrooz HG, Tohidi M, Mehrabi Y, Behrooz EG, Tehranidoost M, Azizi F. Subclinical hypothyroidism in pregnancy: intellectual development of offspring. Thyroid 2011; 21(10):1143–1147. doi:10.1089/thy.2011.0053
- Julvez J, Alvarez-Pedrerol M, Rebagliato M, et al. Thyroxine levels during pregnancy in healthy women and early child neurodevelopment. Epidemiology 2013; 24(1):150–157. doi:10.1097/EDE.0b013e318276ccd3
- Casey BM, Thom EA, Peaceman AM, et al; Eunice Kennedy Shriver National Institute of Child Health and Human Development Maternal–Fetal Medicine Units Network. Treatment of subclinical hypothyroidism or hypothyroxinemia in pregnancy. N Engl J Med 2017; 376(9):815–825. doi:10.1056/NEJMoa1606205
- Burns RB, Bates CK, Hartzband P, Smetana GW. Should we treat for subclinical hypothyroidism?: Grand rounds discussion from Beth Israel Deaconess Medical Center. Ann Intern Med 2016; 164(11):764–770. doi:10.7326/M16-0857
- Kucukler FK, Akbaba G, Arduc A, Simsek Y, Guler S. Evaluation of the common mistakes made by patients in the use of levothyroxine. Eur J Intern Med 2014; 25(9):e107–e108. doi:10.1016/j.ejim.2014.09.002
- McMillan M, Rotenberg KS, Vora K, et al. Comorbidities, concomitant medications, and diet as factors affecting levothyroxine therapy: results of the CONTROL surveillance project. Drugs R D 2016; 16(1):53–68. doi:10.1007/s40268-015-0116-6
- Pollock MA, Sturrock A, Marshall K, et al. Thyroxine treatment in patients with symptoms of hypothyroidism but thyroid function tests within the reference range: Randomised double blind placebo controlled crossover trial. BMJ 2001; 323(7318):891–895. pmid:11668132
- Peeters RP. Subclinical hypothyroidism. N Engl J Med 2017; 376(26):2556–2565. doi:10.1056/NEJMcp1611144
KEY POINTS
- From 4% to 20% of adults have subclinical hypothyroidism, with a higher prevalence in women, older people, and those with thyroid autoimmunity.
- Subclinical hypothyroidism can progress to overt hypothyroidism, especially if antithyroid antibodies are present, and has been associated with adverse metabolic, cardiovascular, reproductive, maternal-fetal, neuromuscular, and cognitive abnormalities and lower quality of life.
- Some studies have suggested that levothyroxine therapy is beneficial, but others have not, possibly owing to variability in study designs, sample sizes, and patient populations.
- Further trials are needed to clearly demonstrate the clinical impact of subclinical hypothyroidism and the effect of levothyroxine therapy.

Managing malignant pleural effusion
Managing patients with malignant pleural effusion can be challenging. Symptoms are often distressing, and its presence signifies advanced disease. Median survival after diagnosis is 4 to 9 months,1–3 although prognosis varies considerably depending on the type and stage of the malignancy.
How patients are best managed depends on clinical circumstances. Physicians should consider the risks and benefits of each option while keeping in mind realistic goals of care.
This article uses brief case presentations to review management strategies for malignant pleural effusion.
CANCER IS A COMMON CAUSE OF PLEURAL EFFUSION
Physicians and surgeons, especially in tertiary care hospitals, must often manage malignant pleural effusion.4 Malignancy is the third leading cause of pleural effusion after heart failure and pneumonia, accounting for 44% to 77% of exudates.5 Although pleural effusion can arise secondary to many different malignancies, the most common causes are lung cancer in men and breast cancer in women; these cancers account for about 75% of all cases of malignant pleural effusion.6,7
A WOMAN ON CHEMOTHERAPY WITH ASYMPTOMATIC PLEURAL EFFUSION
An 18-year-old woman with non-Hodgkin lymphoma has received her first cycle of chemotherapy and is now admitted to the hospital for diarrhea. A routine chest radiograph reveals a left-sided pleural effusion covering one-third of the thoracic cavity. She is asymptomatic and reports no shortness of breath at rest or with exertion. Her oxygen saturation level is above 92% on room air without supplemental oxygen.
Thoracentesis reveals an exudative effusion, and cytologic study shows malignant lymphoid cells, consistent with a malignant pleural effusion. Cultures are negative.
What is the appropriate next step to manage this patient’s effusion?
Observation is reasonable
This patient is experiencing no symptoms and has just begun chemotherapy for her lymphoma. Malignant pleural effusion associated with lymphoma, small-cell lung cancer, and breast cancer is most sensitive to chemotherapy.5 For patients who do not have symptoms from the pleural effusion and who are scheduled to receive further chemotherapy, a watch-and-wait approach is reasonable.
It is important to follow the patient for developing symptoms and obtain serial imaging to evaluate for an increase in the effusion size. We recommend repeat imaging at 2- to 4-week intervals, and sooner if symptoms develop.
If progression is evident or if the patient’s oncologist indicates that the cancer is unresponsive to systemic therapy, further intervention may be necessary with one of the options discussed below.
A MAN WITH LUNG CANCER WITH PLEURAL EFFUSION, LUNG COLLAPSE
 and collapsed lung (blue ar-row), along with midline shift.")
A 42-year-old man with a history of lung cancer is admitted for worsening shortness of breath. Chest radiography reveals a large left-sided pleural effusion with complete collapse of the left lung and contralateral shift of midline structures (Figure 1). Large-volume thoracentesis improves his symptoms. Pleural fluid cytology is positive for malignant cells. A repeat chest radiograph shows incomplete expansion of the left lung, thick pleura, and pneumothorax, indicating a trapped lung (ie, one unable to expand fully). Two weeks later, his symptoms recur, and chest radiography reveals a recurrent effusion.
How should this effusion be managed?
Indwelling pleural catheter placement
In a retrospective cohort study,8 malignant pleural effusion recurred in 97% of patients within 1 month (mean, 4.2 days) of therapeutic aspiration, highlighting the need for definitive treatment.
In the absence of lung expansion, pleurodesis is rarely successful, and placing an indwelling pleural catheter in symptomatic patients is the preferred strategy. The US Food and Drug Administration approved this use in 1997.9
Indwelling pleural catheters are narrow (15.5 French, or about 5 mm in diameter) and soft (made of silicone), with distal fenestrations. The distal end remains positioned in the pleural cavity to enable drainage of pleural fluid. The middle portion passes through subcutaneous tissue, where a polyester cuff prevents dislodgement and infection. The proximal end of the catheter remains outside the patient’s skin and is connected to a 1-way valve that prevents air or fluid flow into the pleural cavity.
Pleural fluid is typically drained every 2 or 3 days for palliation. Patients must be educated about home drainage and proper catheter care.
Indwelling pleural catheters are now initial therapy for many
Although indwelling pleural catheters were first used for patients who were not candidates for pleurodesis, they are now increasingly used as first-line therapy.
Since these devices were introduced, several clinical series including more than 800 patients have found that their use for malignant pleural infusion led to symptomatic improvement in 89% to 100% of cases, with 90% of patients needing no subsequent pleural procedures after catheter insertion.10–13
Davies et al14 randomized 106 patients with malignant pleural effusion to either receive an indwelling pleural catheter or undergo pleurodesis. In the first 6 weeks, the 2 groups had about the same incidence of dyspnea, but the catheter group had less dyspnea at 6 months, shorter index hospitalization (0 vs 4 days), fewer hospital days in the first year for treatment-related complications (1 vs 4.5 days), and fewer patients needing follow-up pleural procedures (6% vs 22%). On the other hand, adverse events were more frequent in the indwelling pleural catheter group (40% vs 13%). The most frequent events were pleural infection, cellulitis, and catheter blockage.
Fysh et al15 also compared indwelling pleural catheter insertion and pleurodesis (based on patient choice) in patients with malignant pleural effusion. As in the previous trial, those who received a catheter required significantly fewer days in the hospital and fewer additional pleural procedures than those who received pleurodesis. Safety profiles and symptom control were comparable.
Indwelling pleural catheters have several other advantages. They have been found to be more cost-effective than talc pleurodesis in patients not expected to live long (survival < 14 weeks).16 Patients with an indwelling pleural catheter can receive chemotherapy, and concurrent treatment does not increase risk of infection.17 And a systematic review18 found a 46% rate of autopleurodesis at a median of 52 days after insertion of an indwelling pleural catheter.
Drainage rate may need to be moderated
Chest pain has been reported with the use of indwelling pleural catheters, related to rapid drainage of the effusion in the setting of failed reexpansion of the trapped lung due to thickened pleura. Drainage schedules may need to be adjusted, with more frequent draining of smaller volumes, to control dyspnea without causing significant pain.
A WOMAN WITH RECURRENT PLEURAL EFFUSION, GOOD PROGNOSIS
A 55-year-old woman with a history of breast cancer presents with shortness of breath. Chest radiography reveals a right-sided effusion, which on thoracentesis is found to be malignant. After fluid removal, repeat chest radiography shows complete lung expansion.
One month later, she returns with symptoms and recurrence of the effusion. Ultrasonography does not reveal any adhesions in the pleural space. Her oncologist informs you that her expected survival is in years.
What is the next step?
Chemical pleurodesis
Chemical pleurodesis involves introducing a sclerosant into the pleural space to provoke an intense inflammatory response, creating adhesions and fibrosis that will obliterate the space. The sclerosing agent (typically talc) can be delivered by tube thoracostomy, video-assisted thoracic surgery (VATS), or medical pleuroscopy. Although the latter 2 methods allow direct visualization of the pleural space and, in theory, a more even distribution of the sclerosing agent, current evidence does not favor 1 option over the other,19 and practice patterns vary between institutions.
Tube thoracostomy. Typically, the sclerosing agent is administered once a chest radiograph shows lung reexpansion, and tube output of pleural fluid is less than 150 mL/day.19 However, some studies indicate that if pleural apposition can be confirmed using ultrasonography, then sclerosant administration at that time leads to optimal pleurodesis efficacy and shorter hospitalization.20,21
VATS is usually done in the operating room with the patient under general anesthesia. A double-lumen endotracheal tube allows for single-lung ventilation; a camera is then inserted into the pleural space of the collapsed lung. Multiple ports of entry are usually employed, and the entire pleural space can be visualized and the sclerosing agent instilled uniformly. The surgeon may alternatively choose to perform mechanical pleurodesis, which entails abrading the visceral and parietal pleura with dry gauze to provoke diffuse petechial hemorrhage and an inflammatory reaction. VATS can also be used to perform biopsy, lobectomy, and pneumonectomy.
Medical pleuroscopy. Medical pleuroscopy is usually done using local anesthesia with the patient awake, moderately sedated, and not intubated. Because no double-lumen endotracheal tube is used, lung collapse may not be complete, making it difficult to completely visualize the entire pleural surfaces.
Although no randomized study of VATS vs medical pleuroscopy exists, a retrospective case-matched study22 comparing VATS (under general anesthesia) to single-port VATS (under local anesthesia) noted equivalent rates of pleurodesis. However, the local anesthesia group had a lower perioperative mortality rate (0% vs 2.3%), a lower postoperative major morbidity rate (5.2% vs 9%), earlier improvement in quality of life, and shorter hospitalization (3 vs 5 days).22 In general, the diagnostic sensitivity of pleuroscopy for pleural malignancy is similar to that of VATS (93% vs 97%).23,24
A MAN WITH PLEURAL EFFUSION AND A POOR PROGNOSIS
A 60-year-old man with metastatic pancreatic cancer is brought to the clinic for worsening shortness of breath over the past 2 months. During that time, he has lost 6 kg and has become bedridden.
On examination, he has severe cachexia and is significantly short of breath at rest with associated hypoxia. His oncologist expects him to survive less than 3 months.
His laboratory investigations reveal hypoalbuminemia and leukocytosis. A chest radiograph shows a large left-sided pleural effusion that was not present 2 months ago.
What should be done for him?
Thoracentesis, repeat as needed
Malignant pleural effusion causing dyspnea is not uncommon in certain advanced malignancies and may contribute to significant suffering at the end of life. A study of 298 patients with malignant pleural effusion noted that the presence of leukocytosis, hypoalbuminemia, and hypoxemia was associated with a poorer prognosis. Patients having all 3 factors had a median survival of 42 days.25
Thoracentesis, the least invasive option that may improve dyspnea, can be done in the clinic setting and is a reasonable strategy for patients with advanced cancer and an expected survival of less than 3 months.26 Although recurrence is expected, it may take up to a few weeks, and repeat thoracentesis can be performed as needed.
- Roberts ME, Neville E, Berrisford RG, Antunes G, Ali NJ; BTS Pleural Disease Guideline Group. Management of a malignant pleural effusion: British Thoracic Society pleural disease guideline 2010. Thorax 2010; 65(suppl 2):ii32–ii40. doi:10.1136/thx.2010.136994
- Ruckdeschel JC. Management of malignant pleural effusions. Semin Oncol 1995; 22(2 suppl 3):58–63. pmid:7740322
- Bielsa S, Martín-Juan J, Porcel JM, Rodríguez-Panadero F. Diagnostic and prognostic implications of pleural adhesions in malignant effusions. J Thorac Oncol 2008; 3(11):1251–1256. doi:10.1097/JTO.0b013e318189f53d
- 35th Annual meeting of the European Association for the Study of Diabetes. Brussels, Belgium, 28 September–2 October, 1999. Abstracts. Diabetologia 1999;42(suppl 1):A1–A354. pmid:10505080
- Antony VB, Loddenkemper R, Astoul P, et al. Management of malignant pleural effusions. Eur Respir J 2001; 18(2):402–419. pmid:11529302
- Sahn SA. Malignancy metastatic to the pleura. Clin Chest Med 1998; 19(2):351–361. pmid:9646986
- Sahn SA. Pleural diseases related to metastatic malignancies. Eur Respir J 1997; 10(8):1907–1913. pmid:9272937
- Anderson CB, Philpott GW, Ferguson TB. The treatment of malignant pleural effusions. Cancer 1974; 33(4):916–922. pmid:4362107
- Uzbeck MH, Almeida FA, Sarkiss MG, et al. Management of malignant pleural effusions. Adv Ther 2010; 27(6):334–347. doi:10.1007/S12325-010-0031-8
- Suzuki K, Servais EL, Rizk NP, et al. Palliation and pleurodesis in malignant pleural effusion: the role for tunneled pleural catheters. J Thorac Oncol 2011; 6(4):762–767. doi:10.1097/JTO.0b013e31820d614f
- Tremblay A, Michaud G. Single-center experience with 250 tunnelled pleural catheter insertions for malignant pleural effusion. Chest 2006; 129(2):362–368. doi:10.1378/chest.129.2.362
- Warren WH, Kalimi R, Khodadadian LM, Kim AW. Management of malignant pleural effusions using the Pleur(x) catheter. Ann Thorac Surg 2008; 85(3):1049–1055 doi:10.1016/j.athoracsur.2007.11.039
- Murthy SC, Okereke I, Mason DP, Rice TW. A simple solution for complicated pleural effusions. J Thorac Oncol 2006; 1(7):697–700. pmid:17409939
- Davies HE, Mishra EK, Kahan BC, et al. Effect of an indwelling pleural catheter vs chest tube and talc pleurodesis for relieving dyspnea in patients with malignant pleural effusion: the TIME2 randomized controlled trial. JAMA 2012; 307(22):2383–2389. doi:10.1001/jama.2012.5535
- Fysh ETH, Waterer GW, Kendall PA, et al. Indwelling pleural catheters reduce inpatient days over pleurodesis for malignant pleural effusion. Chest 2012; 142(2):394–400. doi:10.1378/chest.11-2657
- Olfert JA, Penz ED, Manns BJ, et al. Cost-effectiveness of indwelling pleural catheter compared with talc in malignant pleural effusion. Respirology 2017; 22(4):764–770. doi:10.1111/resp.12962
- Morel A, Mishra E, Medley L, et al. Chemotherapy should not be withheld from patients with an indwelling pleural catheter for malignant pleural effusion. Thorax 2011; 66(5):448–449. doi:10.1136/thx.2009.133504
- Van Meter MEM, McKee KY, Kohlwes RJ. Efficacy and safety of tunneled pleural catheters in adults with malignant pleural effusions: a systematic review. J Gen Intern Med 2011; 26(1):70–76. doi:10.1007/s11606-010-1472-0
- Lee YCG, Baumann MH, Maskell NA, et al. Pleurodesis practice for malignant pleural effusions in five English-speaking countries. Chest 2003; 124(6):2229–2238. pmid:14665505
- Villanueva AG, Gray AW Jr, Shahian DM, Williamson WA, Beamis JF Jr. Efficacy of short term versus long term tube thoracostomy drainage before tetracycline pleurodesis in the treatment of malignant pleural effusions. Thorax 1994; 49(1):23–25. pmid:7512285
- Sartori S, Tombesi P, Tassinari D, et al. Sonographically guided small-bore chest tubes and sonographic monitoring for rapid sclerotherapy of recurrent malignant pleural effusions. J Ultrasound Med 2004; 23(9):1171–1176. pmid:15328431
- Mineo TC, Sellitri F, Tacconi F, Ambrogi V. Quality of life and outcomes after nonintubated versus intubated video-thoracoscopic pleurodesis for malignant pleural effusion: comparison by a case-matched study. J Palliat Med 2014; 17(7):761–768. doi:10.1089/jpm.2013.0617
- Michaud G, Berkowitz DM, Ernst A. Pleuroscopy for diagnosis and therapy for pleural effusions. Chest 2010; 138(5):1242–1246. doi:10.1378/chest.10-1259
- Bhatnagar R, Maskell NA. Medical pleuroscopy. Clin Chest Med 2013; 34(3):487–500. doi:10.1016/j.ccm.2013.04.001
- Pilling JE, Dusmet ME, Ladas G, Goldstraw P. Prognostic factors for survival after surgical palliation of malignant pleural effusion. J Thorac Oncol 2010; 5(10):1544–1550. doi:10.1097/JTO.0b013e3181e95cb8
- Beyea A, Winzelberg G, Stafford RE. To drain or not to drain: an evidence-based approach to palliative procedures for the management of malignant pleural effusions. J Pain Symptom Manage 2012; 44(2):301–306. doi:10.1016/j.jpainsymman.2012.05.002
Managing patients with malignant pleural effusion can be challenging. Symptoms are often distressing, and its presence signifies advanced disease. Median survival after diagnosis is 4 to 9 months,1–3 although prognosis varies considerably depending on the type and stage of the malignancy.
How patients are best managed depends on clinical circumstances. Physicians should consider the risks and benefits of each option while keeping in mind realistic goals of care.
This article uses brief case presentations to review management strategies for malignant pleural effusion.
CANCER IS A COMMON CAUSE OF PLEURAL EFFUSION
Physicians and surgeons, especially in tertiary care hospitals, must often manage malignant pleural effusion.4 Malignancy is the third leading cause of pleural effusion after heart failure and pneumonia, accounting for 44% to 77% of exudates.5 Although pleural effusion can arise secondary to many different malignancies, the most common causes are lung cancer in men and breast cancer in women; these cancers account for about 75% of all cases of malignant pleural effusion.6,7
A WOMAN ON CHEMOTHERAPY WITH ASYMPTOMATIC PLEURAL EFFUSION
An 18-year-old woman with non-Hodgkin lymphoma has received her first cycle of chemotherapy and is now admitted to the hospital for diarrhea. A routine chest radiograph reveals a left-sided pleural effusion covering one-third of the thoracic cavity. She is asymptomatic and reports no shortness of breath at rest or with exertion. Her oxygen saturation level is above 92% on room air without supplemental oxygen.
Thoracentesis reveals an exudative effusion, and cytologic study shows malignant lymphoid cells, consistent with a malignant pleural effusion. Cultures are negative.
What is the appropriate next step to manage this patient’s effusion?
Observation is reasonable
This patient is experiencing no symptoms and has just begun chemotherapy for her lymphoma. Malignant pleural effusion associated with lymphoma, small-cell lung cancer, and breast cancer is most sensitive to chemotherapy.5 For patients who do not have symptoms from the pleural effusion and who are scheduled to receive further chemotherapy, a watch-and-wait approach is reasonable.
It is important to follow the patient for developing symptoms and obtain serial imaging to evaluate for an increase in the effusion size. We recommend repeat imaging at 2- to 4-week intervals, and sooner if symptoms develop.
If progression is evident or if the patient’s oncologist indicates that the cancer is unresponsive to systemic therapy, further intervention may be necessary with one of the options discussed below.
A MAN WITH LUNG CANCER WITH PLEURAL EFFUSION, LUNG COLLAPSE
A 42-year-old man with a history of lung cancer is admitted for worsening shortness of breath. Chest radiography reveals a large left-sided pleural effusion with complete collapse of the left lung and contralateral shift of midline structures (Figure 1). Large-volume thoracentesis improves his symptoms. Pleural fluid cytology is positive for malignant cells. A repeat chest radiograph shows incomplete expansion of the left lung, thick pleura, and pneumothorax, indicating a trapped lung (ie, one unable to expand fully). Two weeks later, his symptoms recur, and chest radiography reveals a recurrent effusion.
How should this effusion be managed?
Indwelling pleural catheter placement
In a retrospective cohort study,8 malignant pleural effusion recurred in 97% of patients within 1 month (mean, 4.2 days) of therapeutic aspiration, highlighting the need for definitive treatment.
In the absence of lung expansion, pleurodesis is rarely successful, and placing an indwelling pleural catheter in symptomatic patients is the preferred strategy. The US Food and Drug Administration approved this use in 1997.9
Indwelling pleural catheters are narrow (15.5 French, or about 5 mm in diameter) and soft (made of silicone), with distal fenestrations. The distal end remains positioned in the pleural cavity to enable drainage of pleural fluid. The middle portion passes through subcutaneous tissue, where a polyester cuff prevents dislodgement and infection. The proximal end of the catheter remains outside the patient’s skin and is connected to a 1-way valve that prevents air or fluid flow into the pleural cavity.
Pleural fluid is typically drained every 2 or 3 days for palliation. Patients must be educated about home drainage and proper catheter care.
Indwelling pleural catheters are now initial therapy for many
Although indwelling pleural catheters were first used for patients who were not candidates for pleurodesis, they are now increasingly used as first-line therapy.
Since these devices were introduced, several clinical series including more than 800 patients have found that their use for malignant pleural infusion led to symptomatic improvement in 89% to 100% of cases, with 90% of patients needing no subsequent pleural procedures after catheter insertion.10–13
Davies et al14 randomized 106 patients with malignant pleural effusion to either receive an indwelling pleural catheter or undergo pleurodesis. In the first 6 weeks, the 2 groups had about the same incidence of dyspnea, but the catheter group had less dyspnea at 6 months, shorter index hospitalization (0 vs 4 days), fewer hospital days in the first year for treatment-related complications (1 vs 4.5 days), and fewer patients needing follow-up pleural procedures (6% vs 22%). On the other hand, adverse events were more frequent in the indwelling pleural catheter group (40% vs 13%). The most frequent events were pleural infection, cellulitis, and catheter blockage.
Fysh et al15 also compared indwelling pleural catheter insertion and pleurodesis (based on patient choice) in patients with malignant pleural effusion. As in the previous trial, those who received a catheter required significantly fewer days in the hospital and fewer additional pleural procedures than those who received pleurodesis. Safety profiles and symptom control were comparable.
Indwelling pleural catheters have several other advantages. They have been found to be more cost-effective than talc pleurodesis in patients not expected to live long (survival < 14 weeks).16 Patients with an indwelling pleural catheter can receive chemotherapy, and concurrent treatment does not increase risk of infection.17 And a systematic review18 found a 46% rate of autopleurodesis at a median of 52 days after insertion of an indwelling pleural catheter.
Drainage rate may need to be moderated
Chest pain has been reported with the use of indwelling pleural catheters, related to rapid drainage of the effusion in the setting of failed reexpansion of the trapped lung due to thickened pleura. Drainage schedules may need to be adjusted, with more frequent draining of smaller volumes, to control dyspnea without causing significant pain.
A WOMAN WITH RECURRENT PLEURAL EFFUSION, GOOD PROGNOSIS
A 55-year-old woman with a history of breast cancer presents with shortness of breath. Chest radiography reveals a right-sided effusion, which on thoracentesis is found to be malignant. After fluid removal, repeat chest radiography shows complete lung expansion.
One month later, she returns with symptoms and recurrence of the effusion. Ultrasonography does not reveal any adhesions in the pleural space. Her oncologist informs you that her expected survival is in years.
What is the next step?
Chemical pleurodesis
Chemical pleurodesis involves introducing a sclerosant into the pleural space to provoke an intense inflammatory response, creating adhesions and fibrosis that will obliterate the space. The sclerosing agent (typically talc) can be delivered by tube thoracostomy, video-assisted thoracic surgery (VATS), or medical pleuroscopy. Although the latter 2 methods allow direct visualization of the pleural space and, in theory, a more even distribution of the sclerosing agent, current evidence does not favor 1 option over the other,19 and practice patterns vary between institutions.
Tube thoracostomy. Typically, the sclerosing agent is administered once a chest radiograph shows lung reexpansion, and tube output of pleural fluid is less than 150 mL/day.19 However, some studies indicate that if pleural apposition can be confirmed using ultrasonography, then sclerosant administration at that time leads to optimal pleurodesis efficacy and shorter hospitalization.20,21
VATS is usually done in the operating room with the patient under general anesthesia. A double-lumen endotracheal tube allows for single-lung ventilation; a camera is then inserted into the pleural space of the collapsed lung. Multiple ports of entry are usually employed, and the entire pleural space can be visualized and the sclerosing agent instilled uniformly. The surgeon may alternatively choose to perform mechanical pleurodesis, which entails abrading the visceral and parietal pleura with dry gauze to provoke diffuse petechial hemorrhage and an inflammatory reaction. VATS can also be used to perform biopsy, lobectomy, and pneumonectomy.
Medical pleuroscopy. Medical pleuroscopy is usually done using local anesthesia with the patient awake, moderately sedated, and not intubated. Because no double-lumen endotracheal tube is used, lung collapse may not be complete, making it difficult to completely visualize the entire pleural surfaces.
Although no randomized study of VATS vs medical pleuroscopy exists, a retrospective case-matched study22 comparing VATS (under general anesthesia) to single-port VATS (under local anesthesia) noted equivalent rates of pleurodesis. However, the local anesthesia group had a lower perioperative mortality rate (0% vs 2.3%), a lower postoperative major morbidity rate (5.2% vs 9%), earlier improvement in quality of life, and shorter hospitalization (3 vs 5 days).22 In general, the diagnostic sensitivity of pleuroscopy for pleural malignancy is similar to that of VATS (93% vs 97%).23,24
A MAN WITH PLEURAL EFFUSION AND A POOR PROGNOSIS
A 60-year-old man with metastatic pancreatic cancer is brought to the clinic for worsening shortness of breath over the past 2 months. During that time, he has lost 6 kg and has become bedridden.
On examination, he has severe cachexia and is significantly short of breath at rest with associated hypoxia. His oncologist expects him to survive less than 3 months.
His laboratory investigations reveal hypoalbuminemia and leukocytosis. A chest radiograph shows a large left-sided pleural effusion that was not present 2 months ago.
What should be done for him?
Thoracentesis, repeat as needed
Malignant pleural effusion causing dyspnea is not uncommon in certain advanced malignancies and may contribute to significant suffering at the end of life. A study of 298 patients with malignant pleural effusion noted that the presence of leukocytosis, hypoalbuminemia, and hypoxemia was associated with a poorer prognosis. Patients having all 3 factors had a median survival of 42 days.25
Thoracentesis, the least invasive option that may improve dyspnea, can be done in the clinic setting and is a reasonable strategy for patients with advanced cancer and an expected survival of less than 3 months.26 Although recurrence is expected, it may take up to a few weeks, and repeat thoracentesis can be performed as needed.
- Roberts ME, Neville E, Berrisford RG, Antunes G, Ali NJ; BTS Pleural Disease Guideline Group. Management of a malignant pleural effusion: British Thoracic Society pleural disease guideline 2010. Thorax 2010; 65(suppl 2):ii32–ii40. doi:10.1136/thx.2010.136994
- Ruckdeschel JC. Management of malignant pleural effusions. Semin Oncol 1995; 22(2 suppl 3):58–63. pmid:7740322
- Bielsa S, Martín-Juan J, Porcel JM, Rodríguez-Panadero F. Diagnostic and prognostic implications of pleural adhesions in malignant effusions. J Thorac Oncol 2008; 3(11):1251–1256. doi:10.1097/JTO.0b013e318189f53d
- 35th Annual meeting of the European Association for the Study of Diabetes. Brussels, Belgium, 28 September–2 October, 1999. Abstracts. Diabetologia 1999;42(suppl 1):A1–A354. pmid:10505080
- Antony VB, Loddenkemper R, Astoul P, et al. Management of malignant pleural effusions. Eur Respir J 2001; 18(2):402–419. pmid:11529302
- Sahn SA. Malignancy metastatic to the pleura. Clin Chest Med 1998; 19(2):351–361. pmid:9646986
- Sahn SA. Pleural diseases related to metastatic malignancies. Eur Respir J 1997; 10(8):1907–1913. pmid:9272937
- Anderson CB, Philpott GW, Ferguson TB. The treatment of malignant pleural effusions. Cancer 1974; 33(4):916–922. pmid:4362107
- Uzbeck MH, Almeida FA, Sarkiss MG, et al. Management of malignant pleural effusions. Adv Ther 2010; 27(6):334–347. doi:10.1007/S12325-010-0031-8
- Suzuki K, Servais EL, Rizk NP, et al. Palliation and pleurodesis in malignant pleural effusion: the role for tunneled pleural catheters. J Thorac Oncol 2011; 6(4):762–767. doi:10.1097/JTO.0b013e31820d614f
- Tremblay A, Michaud G. Single-center experience with 250 tunnelled pleural catheter insertions for malignant pleural effusion. Chest 2006; 129(2):362–368. doi:10.1378/chest.129.2.362
- Warren WH, Kalimi R, Khodadadian LM, Kim AW. Management of malignant pleural effusions using the Pleur(x) catheter. Ann Thorac Surg 2008; 85(3):1049–1055 doi:10.1016/j.athoracsur.2007.11.039
- Murthy SC, Okereke I, Mason DP, Rice TW. A simple solution for complicated pleural effusions. J Thorac Oncol 2006; 1(7):697–700. pmid:17409939
- Davies HE, Mishra EK, Kahan BC, et al. Effect of an indwelling pleural catheter vs chest tube and talc pleurodesis for relieving dyspnea in patients with malignant pleural effusion: the TIME2 randomized controlled trial. JAMA 2012; 307(22):2383–2389. doi:10.1001/jama.2012.5535
- Fysh ETH, Waterer GW, Kendall PA, et al. Indwelling pleural catheters reduce inpatient days over pleurodesis for malignant pleural effusion. Chest 2012; 142(2):394–400. doi:10.1378/chest.11-2657
- Olfert JA, Penz ED, Manns BJ, et al. Cost-effectiveness of indwelling pleural catheter compared with talc in malignant pleural effusion. Respirology 2017; 22(4):764–770. doi:10.1111/resp.12962
- Morel A, Mishra E, Medley L, et al. Chemotherapy should not be withheld from patients with an indwelling pleural catheter for malignant pleural effusion. Thorax 2011; 66(5):448–449. doi:10.1136/thx.2009.133504
- Van Meter MEM, McKee KY, Kohlwes RJ. Efficacy and safety of tunneled pleural catheters in adults with malignant pleural effusions: a systematic review. J Gen Intern Med 2011; 26(1):70–76. doi:10.1007/s11606-010-1472-0
- Lee YCG, Baumann MH, Maskell NA, et al. Pleurodesis practice for malignant pleural effusions in five English-speaking countries. Chest 2003; 124(6):2229–2238. pmid:14665505
- Villanueva AG, Gray AW Jr, Shahian DM, Williamson WA, Beamis JF Jr. Efficacy of short term versus long term tube thoracostomy drainage before tetracycline pleurodesis in the treatment of malignant pleural effusions. Thorax 1994; 49(1):23–25. pmid:7512285
- Sartori S, Tombesi P, Tassinari D, et al. Sonographically guided small-bore chest tubes and sonographic monitoring for rapid sclerotherapy of recurrent malignant pleural effusions. J Ultrasound Med 2004; 23(9):1171–1176. pmid:15328431
- Mineo TC, Sellitri F, Tacconi F, Ambrogi V. Quality of life and outcomes after nonintubated versus intubated video-thoracoscopic pleurodesis for malignant pleural effusion: comparison by a case-matched study. J Palliat Med 2014; 17(7):761–768. doi:10.1089/jpm.2013.0617
- Michaud G, Berkowitz DM, Ernst A. Pleuroscopy for diagnosis and therapy for pleural effusions. Chest 2010; 138(5):1242–1246. doi:10.1378/chest.10-1259
- Bhatnagar R, Maskell NA. Medical pleuroscopy. Clin Chest Med 2013; 34(3):487–500. doi:10.1016/j.ccm.2013.04.001
- Pilling JE, Dusmet ME, Ladas G, Goldstraw P. Prognostic factors for survival after surgical palliation of malignant pleural effusion. J Thorac Oncol 2010; 5(10):1544–1550. doi:10.1097/JTO.0b013e3181e95cb8
- Beyea A, Winzelberg G, Stafford RE. To drain or not to drain: an evidence-based approach to palliative procedures for the management of malignant pleural effusions. J Pain Symptom Manage 2012; 44(2):301–306. doi:10.1016/j.jpainsymman.2012.05.002
KEY POINTS
- Asymptomatic pleural effusion in patients currently on chemotherapy does not require treatment but should be monitored for progression.
- Indwelling pleural catheters are best used to treat effusion with lung collapse and are increasingly used as first-line therapy in other settings.
- Chemical or mechanical pleurodesis results in filling the pleural space to prevent further fluid accumulation and can be accomplished by one of several methods.
- For patients near the end of life, simple thoracentesis, repeated as needed, is a reasonable strategy.
Breast augmentation surgery: Clinical considerations
At present, 300,000 US women undergo breast augmentation surgery each year,1 making this the second most common aesthetic procedure in women (after liposuction),2–4 and making it extremely likely that clinicians will encounter women who have breast implants. In addition, approximately 110,000 women undergo breast reconstructive surgery after mastectomy, of whom more than 88,000 (81%) receive implants (2016 data).5
This review discusses the evolution of breast implants, their complications, and key considerations with regard to aesthetic and reconstructive breast surgery, as the principles are similar.
EVOLUTION OF IMPLANTS
Reports of breast augmentation surgery, also known as augmentation mammoplasty, date back to 1895, when a fatty tumor (lipoma) was successfully transplanted from a patient’s back to a breast defect in a mastectomy patient.2,3,6,7 In the 1930s, implantation of a glass ball into a patient’s breast marked the first implant-based breast augmentation.6 By 1954, attempts at breast augmentation using local dermal-fat flaps, adipose tissue, and even omentum were described.
Alloplastic materials gained popularity throughout the 1950s and 1960s and included polyurethane, polytetrafluoroethylene (Teflon), and other synthetics. Adverse reactions associated with alloplastic materials were plentiful: local tissue reactions, distortion of the breast mound, increased firmness, and discomfort all contributed to the eventual discontinuation of their use. The history of alloplastic breast augmentation also included epoxy resin, shellac, beeswax, paraffin, rubber, petroleum jelly, and liquefied silicone. Outcomes were not good, and many patients ultimately needed mastectomy.7
The first modern breast prosthesis was developed in 1961, and since then, implant composition and design have evolved significantly.8
From silicone to saline, and back again
The first silicone gel implants, introduced in the early 1960s,8–19 had high complication rates—some centers reported an incidence of capsular contracture of up to 70%.8,11 This is a foreign body reaction in which pathologic scar tissue encases the implant, causing it to distort, appear misshapen, harden, and even become painful.11 Attempts to minimize this reaction led to later generations of silicone implants with polyurethane shells.12
Inflatable implants filled with sterile saline solution were originally developed in France in 1965. Unlike silicone implants, saline implants have undergone minimal changes since their inception, and grew in popularity during the 1970s in view of the high rates of capsular contracture with silicone implants.8 However, saline implants have their own problems, and as they became increasingly popular, deflation and the unnatural feel of saline sparked a renewed interest in silicone gel.
By the late 1980s, the thinner-shelled generation of silicone implants displayed its own frustrating complications including implant rupture, capsular contracture, infection, and possible systemic and disseminated granulomatous disease. From 1992 to 2006, the US Food and Drug Administration (FDA) placed a moratorium on silicone implants due to concerns about a possible link with autoimmune and connective tissue diseases and the possible carcinogenic nature of silicone.

While silicone implants were prohibited in the United States, development continued abroad, and eventually the moratorium was lifted after several meta-analyses failed to reveal any link regarding the aforementioned concerns.13
Today, silicone gel implants dominate the world market.14 In the United States, approximately 60% of implants contain silicone gel filler, and trends are similar in Europe.7

Table 1 summarizes the evolution of silicone breast implants over the last 50 years.2,6,11,12Table 2 lists the advantages and disadvantages of silicone and saline breast implants.2,6,8,15
CURRENT IMPLANT OPTIONS
Currently, 3 companies (Allergan, Mentor, Sientra) manufacture and distribute breast implants and implant-associated products such as tissue expanders and sizers in the US market.6
Another company, Motiva, makes an implant that is available in Europe, Asia, and Australia, and the device is currently undergoing a 10-year clinical trial in the United States that began recruiting patients in 16 centers in April 2018.16 Pending final approval, the Cleveland Clinic Department of Plastic Surgery may be among the centers involved in the clinical trial of the Motiva implant. Innovations in the Motiva implant include a high-performance shell that maintains consistent strength and includes a proprietary barrier layer, improved silicone gel filler, 3-D imprinted surface texturing, and an implant shape that adapts with vertical and horizontal movement. It also contains radio-frequency identification transponders that can transmit data about the implant wirelessly.17–19
Surface (textured vs smooth)
Developed in the 1980s, texturing of the implant surface disrupts capsule formation around the prosthesis. Additionally, texturing stabilizes an anatomically shaped (teardrop) implant within the breast pocket, reducing malrotation.20,21
The first textured implants were covered with polyurethane foam, but they were ultimately withdrawn from the US market because of concern for in vivo degradation to carcinogenic compounds. The focus subsequently turned to texturing implant shells by mechanically creating pores of different sizes. Smooth implants, by contrast, are manufactured by repeatedly dipping the implant shell into liquid silicone.2
The capsular contraction rate has been shown to be lower with textured silicone than with smooth silicone (number needed to treat = 7–9), and evidence suggests a lower risk of needing a secondary procedure.21
Form-stable vs fluid-form
Silicone is a polymer. The physical properties of polymers vary greatly and depend on the length of the individual chains and the degree to which those chains are cross-linked. Liquid silicone contains short chains and sparse cross-linking, resulting in an oily compound well suited for lubrication. Silicone gel contains longer chains and more cross-linking and is therefore more viscous.
In “form-stable” implants, the silicone interior has sufficient chain length and cross-linking to retain the designed shape even at rest,2 but they require slightly larger incisions.7 “Fluid-form” refers to an implant with silicone filler with shorter chain length, less cross-linking, and more fluidity.6
Shell
As with silicone fillers, the properties of silicone implant shells also depend on chain length and cross-linking within the polymer. Silicone elastomer shells (Table 1) contain extensively cross-linked chains that impart a flexible yet rubbery character. Silicone elastomers can also be found in facial implants and tissue expanders.2
Implant shape (round vs anatomic)
The shape of an implant is determined by the gel distribution inside of it. To understand gel distribution and implant shape, one must understand the gel-shell ratio. This ratio increases as cohesivity of the filler increases, and it represents increased bonding of the gel filler to the shell and a preserved implant shape at rest.
The gel-shell ratio varies among manufacturers, and a less-viscous filler may be more prone to rippling or loss of upper pole fullness in some patients. For this reason, careful analysis, patient and implant selection, and discussion of complications remain paramount.2
No anatomically shaped implant is manufactured with a smooth shell, but rather with a textured shell that resists malrotation.6,15 However, in the United States, 95% of patients receive round implants.16
PATIENT ASSESSMENT
Before breast augmentation surgery, the surgeon assesses a number of factors—physical and psychosocial—and helps the patient choose a type and size of implant. The surgeon and patient also plan where the implants will be placed—ie, above or beneath the chest wall muscle—and where the incisions will be made. Every decision is made in close consultation with the patient, taking into account the patient’s desires and expectations, as well as what the patient’s anatomy allows. An integral component of this shared decision-making process is a discussion of the possible complications, and often photographs to better illustrate what to expect postoperatively.
Psychosocial factors
One must consider the patient’s psychology, motivations for surgery, and emotional stability. Here, we look for underlying body dysmorphic disorder; excessive or unusual encouragement to undergo the procedure by a spouse, friends, or others; a history of other aesthetic procedures; unrealistic expectations; and other factors influencing the desire to undergo this surgery.
Choosing an implant
Implant selection must take into account the patient’s height, weight,7 and overall body morphology: taller patients and those with wider hips or shoulders usually require larger implants. A reliable method for determining the appropriate implant must include the current breast shape, dimensions, volume, skin elasticity, soft-tissue thickness, and overall body habitus. Ultimately, the most important considerations include breast base diameter, implant volume,20 and soft-tissue envelope.

Preoperative sizing can involve placing sample implants within a brassiere so that the patient can preview possible outcomes. This method is particularly effective in minimizing dissatisfaction because it shares ownership of the decision-making process.15
A computerized implant selection program available in Europe suggests a “best-fit” implant based on a clinician’s measurements.7
Anatomic placement

Traditionally, plastic surgeons place breast implants either beneath the pectoralis major muscle (submuscular placement) or over the pectoralis8 but beneath the glandular breast parenchyma (subglandular placement) (Figure 2).7
Advantages of submuscular placement are a smoother transition of the upper breast pole from the chest wall and less rippling visible through the skin, due to the additional muscular coverage of the implant. Another advantage is that capsular contraction rates are lower with submuscular placement, likely due to possible contamination of implants by lactiferous ductal microbes when accessing the subglandular plane.14,20 Disadvantages are pronounced discomfort after surgery and animation deformities with muscle contraction, particularly in young, highly active patients.

A popular modification of submuscular placement involves creating a surgical dissection plane between the subglandular tissue and the pectoralis major fascia. This “dualplane” approach allows the parenchyma to retract superiorly and reduce breast ptosis.7
Incisions

Table 3 highlights important considerations with regard to incision location.15,20,21
ANTIBIOTICS
Many surgeons give a single prophylactic dose of antibiotic before surgery, a practice that some studies have shown to be effective in reducing the risk of infection.15 However, the benefit of routine postoperative use of antibiotics remains unsubstantiated15: postoperative antibiotic use does not appear to protect against infection, capsular contracture, or overall complications in primary or secondary breast augmentation surgery.20
PERIOPERATIVE PERIOD
At our institution, breast augmentation surgery is an ambulatory procedure—the patient goes home the same day unless circumstances such as pain control warrant admission. This is, however, according to surgeon preference, and differs on a case-by-case basis. General anesthesia is the standard of care.15
POSTOPERATIVE PERIOD
In the immediate postoperative period, patients are instructed to wear a surgical bra for up to 6 weeks to allow stable scarring. Early mobilization is encouraged.7,15 Depending on the patient’s situation, recovery, and healing, she may be out of work for about 1 week, sometimes more, sometimes less.
Additional instructions are surgeon-specific. However, the patient is instructed to avoid bathing, swimming, immersion in water, and wearing underwire brassieres that could impair healing of an inferior incision; instead, patients are often instructed to wear a surgical bra provided on the day of surgery until cleared in the clinic.
Showering is allowed the next day or the second day after surgery, and of course there is no driving while on narcotics. Additionally, patients are counseled extensively regarding hematoma formation and the signs and symptoms of infection.
Patients are typically seen in clinic 1 week after surgery.
The cost of surgery may be $5,000 to $6,000 but can vary significantly from center to center depending on who the patient sees and where, and whether the patient presents for breast reconstruction after cancer or repair of congenital anomalies, or in certain cases of transgender surgery. The patient is typically responsible for the fee, but again this depends on the patient, indications, and particular insurance concerns.
IMPLANT LONGEVITY AND RUPTURE
In the United States, implant rupture rates range from 1.1% to 17.7% at 6 to 10 years after primary augmentation, 2.9% to 14.7% after revision augmentation, 1.5% to 35.4% after primary breast reconstruction, and 0% to 19.6% after revision reconstruction.11
Unfortunately, the existence of multiple implant manufacturers, numerous implant generations, and poorly standardized screening protocols and reporting systems make the true rate of implant rupture difficult to assess without definitive imaging or implant retrieval.11
Damage from surgical instrumentation during implantation is the most common cause of silicone breast implant rupture (50% to 64% of cases).22 Other causes include underfilling and fold flaw from capsular contracture.
Leakage of silicone gel filler may be confined to the periprosthetic capsule (intracapsular rupture) or extend beyond and into the breast parenchyma (extracapsular rupture). One study reported that only 10% of intracapsular ruptures progressed extracapsularly, while 84% of patients with extracapsular involvement remained stable for up to 2 years,23 indicating that intracapsular rupture may not portend worsening disease.11
Implant rupture occurs silently in most cases, with no clinically detectable signs or symptoms. In other cases, patients may present with alterations in breast shape and size, sudden asymmetry, firmness, pronounced capsular contracture, contour irregularity, or pain.
Aside from physical examination, comprehensive diagnostic testing includes imaging—ultrasonography, mammography, computed tomography, and magnetic resonance imaging (MRI). Of these, MRI is the method of choice, with sensitivity and specificity exceeding 90% for detecting implant rupture.11 Classic findings on MRI include the “linguine” sign from a deflating implant shell, or the teardrop sign from implant sagging. Classic findings on ultrasonography include the “snowstorm” sign of extracapsular rupture and the “stepladder” sign of intracapsular rupture.
Mammography effectively detects free silicone in breast tissue with extracapsular rupture (25% of ruptures according to some studies)23; however, it cannot detect rupture within the implant capsule. As an aside, submuscular implant placement may interfere less with screening mammography than subglandular implants do.14,24
Current FDA recommendations to detect implant rupture encourage women with silicone breast implants to undergo screening 3 years after implantation and then every 2 years thereafter; no long-term monitoring is suggested for saline implants.15 Many plastic surgeons evaluate silicone breast implant patients every 1 to 2 years for contracture and rupture.8 Of note, capsular contracture impairs the effectiveness of ultrasonography and may require MRI confirmation.11
If implant rupture is confirmed, the current recommendation is to remove the implant and the capsule. Another implant may be placed depending on the patient’s preference. Rigorous washout remains a key feature of any surgical intervention for ruptured breast implants; however, in the event of extracapsular rupture, resection of silicone granulomas may also be required.11
Reoperation rates for primary breast augmentation surgery approach 20% and are even higher for secondary augmentation over a patient’s lifetime—the highest rate of all aesthetic procedures.7,14
CAPSULAR CONTRACTURE
Capsular contracture is the most common complication of breast augmentation,25 typically presenting within the first postoperative year,26,27 and the risk increases over time.28 It occurs with both silicone and saline breast implants.
In some studies, the incidence exceeded 4% in the first 2 years after surgery,29 and nearly 50% by 10 years.30 Other studies found rates of 0% to 20% over 13 years.20
The etiology is not well understood and is presumed to be multifactorial, with proposed mechanisms and factors that include bacterial contamination, surface texturing, the implant pocket selected, the incision type, drain placement, antibiotic use, and smoking.25
A meta-analysis from 17,000 implants found that the risk of capsular contracture was significantly higher when an implant was placed in a subglandular pocket than in a submuscular pocket,22,26 and that although texturing decreased capsular contracture compared with smooth implants, the effect was modest when a textured or smooth implant was placed in a submuscular location.28 With regard to incision location, studies have reported that the incidence of capsular contracture is highest with transaxillary and periareolar incisions, and lowest with inframammary incisions.20,21
The leading theory is that contamination of the implant (primarily from the mammary ducts) results in biofilm formation. Subclinical hematoma surrounding the implant may also provide key bacterial nutrients.20
Textured implants induce a greater inflammatory response in the capsular tissue, resulting in a thicker capsule; however, contracture rates remain lower with textured than with smooth implants.14,31 Interestingly, lower rates of capsular contracture have been observed with later-generation, cohesive-gel, form-stable implants than with those of earlier generations.12
Although more research is needed, silicone implants appear to confer a higher risk of capsular contracture than saline implants.14,20
Irrigating the breast pocket intraoperatively with triple antibiotic solution (bacitracin, cefazolin, and gentamicin) before placing the implant may decrease the capsular contracture rate.15,20
Treatments for capsular contracture include pocket modifications such as capsulotomy (making releasing, relaxing incisions in the scar capsule encasing the implant), capsulectomy (removing portions of or the entire capsule), and replacing the implant in the other pocket (ie, if the original implant was subglandular, the replacement is placed in the submuscular pocket). Patients who have contractures that fail to respond to these treatments may ultimately benefit from implant removal and autologous reconstruction (autoaugmentation) rather than implant replacement.32,33
ADDITIONAL COMPLICATIONS
Other complications include infection, malposition, rippling, seroma, hematoma, and sensory alterations.
Irrigation during the implantation procedure with a triple antibiotic solution consisting of bacitracin, gentamycin, and cephalexin in normal saline decreases infection and seroma rates.15,20,34
Some surgeons also choose to irrigate the pocket with a betadine solution, or to cleanse the skin with betadine and place sterile towels and redrape before inserting the implant. Additionally, many prefer using a sterile device much like a pastry funnel called a Keller funnel to insert the implant into the breast pocket.35
Infection is less common with cosmetic augmentations than with implant-based breast reconstruction, likely because of healthier, well-vascularized tissue in patients undergoing cosmetic surgery than in those undergoing mastectomy.14
Seroma is thought to be a consequence of texturing, and more so with macro- vs microtexturing. Though poorly understood, an association between texturing and double capsules has also been reported.12,20
After primary breast augmentation, 10-year follow-up rates of capsular contracture, seroma, rippling, and malposition vary across the 3 major silicone implant manufacturers.12 Hematoma and infection occur in less than 1% of primary augmentation patients.15
Malposition of the implant over time is less frequent with textured implants because of the higher coefficient of friction compared with smooth implants.6,8,15
Visible skin rippling may be a consequence of texturing and also of thin body habitus, eg, in patients with a body mass index less than 18.5 kg/m2. If the soft-tissue layer of the breast is thin, the natural rippling of smooth saline implant shells are more likely to show when placed in the subglandular pocket. Form-stable implants, by contrast, resist rippling.12,15
Large implants and extensive lateral dissection can cause alterations in nipple sensation and sensory loss within lower breast pole skin. Axillary incisions may traumatize or damage the intercostobrachial nerve, resulting in upper inner arm sensory aberrations.
Ultimately, the 10-year incidence of secondary surgery ranges from 0% to 36% and the 10-year incidence of capsular contracture ranges from 11% to 19%.15 Additional cosmetic complaints after augmentation with implants include enlargement of the areola and engorgement of breast veins.14
BREAST CANCER AND DETECTION
Patients with or without implants do not seem to differ with regard to breast cancer stage upon detection, tumor burden, recurrence, or survival. However, more patients with implants may present with palpable masses, invasive tumors, axillary metastasis, and falsely negative mammograms.
Breast implants may actually facilitate cancer detection on physical examination by providing a more dense or stable surface upon which to palpate the breast tissue. Although they do not necessarily impair mastectomy or breast reconstruction, they may result in an increased rate of revision surgery after breast conservation therapy.24,36 Mammography remains the standard of care for radiologic diagnosis but can be further supported by MRI and ultrasonography if necessary in patients with implants.
AUTOIMMUNE DISEASES
Although concerns persist, multiple studies have demonstrated the safety of fourth- and fifth-generation silicone breast implants with regard to autoimmune disease.7
In various clinical studies in mastectomy patients who underwent breast reconstruction with either silicone implants or autologous tissue, no difference was found with regard to the incidence of autoimmune diseases.2 Additionally, in meta-analyses of data from more than 87,000 women, no association was found between connective tissue disease and silicone breast implants.2,11 One study11,23 noted no increase in autoantibodies in patients with undamaged silicone implants vs patients who experienced rupture.
Studies have also demonstrated that in children born to mothers with breast implants, the risk of rheumatic disease, esophageal disorders, congenital malformations, and death during the perinatal period is comparable with that in controls.37 Another study, examining breastfeeding in women with silicone breast implants, showed no significant difference in silicon levels (used as a proxy for silicone) in breast milk compared with controls without implants; silicon levels were found to be significantly higher in cow’s milk and store-bought formulas.38
BREAST IMPLANT-ASSOCIATED ANAPLASTIC LARGE-CELL LYMPHOMA
Breast implant-associated anaplastic large-cell lymphoma (BIA-ALCL) is a subtype of T-cell lymphoma that develops in tissue adjacent to breast implants. It typically presents as breast swelling 2 to 38 years (mean of 8 years) after implant insertion.39,40 The swelling may be secondary to periprosthetic seroma formation or, more rarely, palpable disease in the axilla. Patients occasionally complain of pain and, rarely, constitutional symptoms.20 BIA-ALCL is not a disease of the surrounding breast tissue, but rather of the fibrous periprosthetic capsule.21
Of note, there is no documented case involving smooth implants,41–43 but it may be related to fifth-generation textured implants.6 At present, it is not possible to definitively state which implant is associated with this condition; hence, more data are needed, and this association is currently under study.
The absolute risk of BIA-ALCL was reported in a Dutch study39 as 1 in 35,000 by age 50, 1 in 12,000 by age 70, and 1 in 7,000 by age 75, with a number needed to harm of 6,920. Overall lifetime risk was estimated at 1 in 30,000 for women with textured implants in a 2015 US study.40 In comparison, breast cancer risk is about 1 in 8 women. There is no apparent predilection for patients who underwent cosmetic augmentation vs reconstruction, or who received silicone vs saline implants.
The diagnosis is confirmed by ultrasonographically guided fine-needle aspiration of seroma fluid and subsequent immunohistochemical testing for CD30-positive and ALK-negative T lymphocytes. Other than positron-emission tomography for staging after diagnosis confirmation, imaging is ineffective. Expert opinion does not recommend routine screening unless the aforementioned symptoms arise.
Treatment involves implant removal and total capsulectomy, with samples sent for pathology study with cytokeratin staining.12 Of note, in all cases of BIA-ALCL in which the disease was limited to the circumscribed scar tissue of the breast capsule, complete surgical excision has proved curative, whereas incomplete capsulectomy portends a greater risk of recurrence and decreased survival.44
In cases of advanced or recurrent ALCL, diagnosed late or inappropriately, the National Comprehensive Cancer Network recommends a multidisciplinary approach involving adjuvant chemotherapy and radiation.44 Anecdotally, at our institution, we have recently treated several cases of advanced ALCL presenting with invasive chest wall masses with extirpative surgery and subsequent reconstruction with the assistance of our thoracic surgery colleagues, as well as the aforementioned multidisciplinary approach using adjuvant therapy.
The mechanism of this malignancy is currently under investigation, but the current theory implicates an exaggerated lymphoproliferative response to bacterial contamination of the capsule superimposed upon genetic factors in susceptible patients.42,43
National societies advise plastic surgeons to discuss the risk of BIA-ALCL with all patients at the time of breast augmentation consultation and to report all confirmed cases to the PROFILE registry (Patient Registry and Outcomes for Breast Implants and Anaplastic Large Cell Lymphoma Etiology and Epidemiology).45
ARE PATIENTS HAPPIER AFTERWARD?
Studies have shown that after undergoing breast augmentation surgery, patients note improvement in body image, and satisfaction rates range from 85% to 95% with respect to self-confidence and body image.46 An evaluation of patient responses on the validated BREAST-Q Augmentation Questionnaire showed the following satisfaction rates: breasts 83%, psychosocial well-being 88%, and sexual functioning 81%.15
Although epidemiologic studies have reported higher suicide rates in women with cosmetic breast implants, this likely stems from preoperative psychological factors and underscores the role of psychiatric referral in patients with a mental health history or in those whom the surgeon deems it necessary.46
Several high-quality studies have demonstrated that quality of life and psychosocial functioning (including depression) markedly improve after breast augmentation surgery.47 Among a cohort of Norwegian patients, breast implant surgery resulted in improved motivation to perform daily activities, as well as improved quality of life from both a psychosocial and aesthetic perspective.48 Interestingly, a recent study reported that patients who underwent breast implant surgery alone reported greater satisfaction and psychosocial quality of life than patients who underwent combination breast augmentation and mastopexy (breast-lifting) surgery.49
Additional data are needed to refine our understanding of the complex interplay between psychosocial factors before and after surgery in patients seeking and undergoing breast augmentation procedures.
- Derby BM, Codner MA. Textured silicone breast implant use in primary augmentation: core data update and review. Plast Reconstr Surg 2015; 135(1):113–124. doi:10.1097/PRS.0000000000000832
- Maxwell GP, Gabriel A. Breast implant design. Gland Surg 2017; 6(2):148–153. doi:10.21037/gs.2016.11.09
- Gabriel A, Maxwell GP. The evolution of breast implants. Clin Plast Surg 2015; 42(4):399–404. doi:10.1016/j.cps.2015.06.015
- American Society of Plastic Surgeons. Procedural statistics trends 1992–2012. www.plasticsurgery.org/documents/News/Statistics/2012/plastic-surgery-statistics-full-report-2012.pdf. Accessed January 17, 2019.
- American Society of Plastic Surgeons. Plastic surgery statistics report 2016. www.plasticsurgery.org/documents/News/Statistics/2016/plastic-surgery-statistics-full-report-2016.pdf. Accessed January 17, 2019.
- Henderson PW, Nash D, Laskowski M, Grant RT. Objective comparison of commercially available breast implant devices. Aesthetic Plast Surg 2015; 39(5):724–732. doi:10.1007/s00266-015-0537-1
- Adams WP Jr, Mallucci P. Breast augmentation. Plast Reconstr Surg 2012; 130(4):597e–611e. doi:10.1097/PRS.0b013e318262f607
- Spear SL, Jespersen MR. Breast implants: saline or silicone? Aesthet Surg J 2010; 30(4):557–570. doi:10.1177/1090820X10380401
- Cronin TD, Gerow FJ. Augmentation mammaplasty: a new “natural feel” prosthesis. In: Transactions of the Third International Conference of Plastic Surgery: October 13–18, 1963, Washington, DC.
- Maxwell GP, Gabriel A. The evolution of breast implants. Plast Reconstr Surg 2014; 134(suppl 1):12S–17S. doi:10.1097/PRS.0000000000000348
- Hillard C, Fowler JD, Barta R, Cunningham B. Silicone breast implant rupture: a review. Gland Surg 2017; 6(2):163–168. doi:10.21037/gs.2016.09.12
- Derby BM, Codner MA. Textured silicone breast implant use in primary augmentation: core data update and review. Plast Reconstr Surg 2015; 135(1):113–124. doi:10.1097/PRS.0000000000000832
- Tugwell P, Wells G, Peterson J, et al. Do silicone breast implants cause rheumatologic disorders? A systematic review for a court-appointed national science panel. Arthritis Rheum 2001; 44(11):2477–2484. pmid:11710703
- Alpert BS, Lalonde DH. MOC-PS(SM) CME article: breast augmentation. Plast Reconstr Surg 2008; 121(suppl 4):1–7. doi:10.1097/01.prs.0000305933.31540.5d
- Hidalgo DA, Spector JA. Breast augmentation. Plast Reconstr Surg 2014; 133(4):567e–583e. doi:10.1097/PRS.0000000000000033
- ClinicalTrials.gov. Study of the safety and effectiveness of Motiva Implants®. https://clinicaltrials.gov/ct2/show/NCT03579901. Accessed January 17, 2019.
- Establishment Labs. Motiva Implants. https://motivaimplants.com/why-motiva/innovation-for-enhanced-safety/. Accessed January 17, 2019.
- Sforza M, Zaccheddu R, Alleruzzo A, et al. Preliminary 3-year evaluation of experience with silksurface and velvetsurface Motiva silicone breast implants: a single-center experience with 5813 consecutive breast augmentation cases. Aesthet Surg J 2018; 38(suppl 2):S62–S73. doi:10.1093/asj/sjx150
- Huemer GM, Wenny R, Aitzetmüller MM, Duscher D. Motiva ergonomix round silksurface silicone breast implants: outcome analysis of 100 primary breast augmentations over 3 years and technical considerations. Plast Reconstr Surg 2018; 141(6):831e–842e. doi:10.1097/PRS.0000000000004367
- Lista F, Ahmad J. Evidence-based medicine: augmentation mammaplasty. Plast Reconstr Surg 2013; 132(6):1684–1696. doi:10.1097/PRS.0b013e3182a80880
- Namnoum JD, Largent J, Kaplan HM, Oefelein MG, Brown MH. Primary breast augmentation clinical trial outcomes stratified by surgical incision, anatomical placement and implant device type. J Plast Reconstr Aesthet Surg 2013; 66(9):1165–1172. doi:10.1016/j.bjps.2013.04.046
- Handel N, Garcia ME, Wixtrom R. Breast implant rupture: causes, incidence, clinical impact, and management. Plast Reconstr Surg 2013; 132(5):1128–1137. doi:10.1097/PRS.0b013e3182a4c243
- Hölmich LR, Friis S, Fryzek JP, et al. Incidence of silicone breast implant rupture. Arch Surg 2003; 138(7):801–806. doi:10.1001/archsurg.138.7.801
- Mccarthy CM, Pusic AL, Disa JJ, Cordeiro PG, Cody HS 3rd, Mehrara B. Breast cancer in the previously augmented breast. Plast Reconstr Surg 2007; 119(1):49–58. doi:10.1097/01.prs.0000244748.38742.1f
- Egeberg A, Sørensen JA. The impact of breast implant location on the risk of capsular contraction. Ann Plast Surg 2016; 77(2):255–259. doi:10.1097/SAP.0000000000000227
- Wickman M. Rapid versus slow tissue expansion for breast reconstruction: a three-year follow-up. Plast Reconstr Surg 1995; 95(4):712–718. pmid:7892316
- Kjøller K, Hölmich LR, Jacobsen PH, et al. Epidemiological investigation of local complications after cosmetic breast implant surgery in Denmark. Ann Plast Surg 2002; 48(3):229–237. pmid:11862025
- Handel N, Jensen JA, Black Q, Waisman JR, Silverstein MJ. The fate of breast implants: a critical analysis of complications and outcomes. Plast Reconstr Surg 1995; 96(7):1521–1533. pmid:7480271
- Henriksen TF, Hölmich LR, Fryzek JP, et al. Incidence and severity of short-term complications after breast augmentation: results from a nationwide breast implant registry. Ann Plast Surg 2003; 51(6):531–539. doi:10.1097/01.sap.0000096446.44082.60
- Fernandes JR, Salinas HM, Broelsch GF, et al. Prevention of capsular contracture with photochemical tissue passivation. Plast Reconstr Surg 2014; 133(3):571–577. doi:10.1097/01.prs.0000438063.31043.79
- Wong CH, Samuel M, Tan BK, Song C. Capsular contracture in subglandular breast augmentation with textured versus smooth breast implants: a systematic review. Plast Reconstr Surg 2006; 118(5):1224–1236. doi:10.1097/01.prs.0000237013.50283.d2
- Gurunluoglu R, Sacak B, Arton J. Outcomes analysis of patients undergoing autoaugmentation after breast implant removal. Plast Reconstr Surg 2013; 132(2):304–315. doi:10.1097/PRS.0b013e31829e7d9e
- Gurunluoglu R, Shafighi M, Schwabegger A, Ninkovic M. Secondary breast reconstruction with deepithelialized free flaps from the lower abdomen for intractable capsular contracture and maintenance of breast volume. J Reconstr Microsurg 2005; 21(1):35–41. doi:10.1055/s-2005-862779
- Adams WP Jr, Rios JL, Smith SJ. Enhancing patient outcomes in aesthetic reconstructive breast surgery using triple antibiotic breast irrigation: six-year prospective clinical study. Plast Reconstru Surg 2006; 118(7 suppl):46S–52S. doi:10.1097/01.prs.0000185671.51993.7e
- Moyer HR, Ghazi B, Saunders N, Losken A. Contamination in smooth gel breast implant placement: testing a funnel versus digital insertion technique in a cadaver model. Aesthet Surg J 2012; 32(2):194–199. doi:10.1177/1090820X11434505
- Handel N. The effect of silicone implants on the diagnosis, prognosis, and treatment of breast cancer. Plast Reconstr Surg 2007; 120(7 suppl 1):81S–93S. doi:10.1097/01.prs.0000286578.94102.2b
- Kjøller K, Friis S, Lipworth L, Mclaughlin JK, Olsen JH. Adverse health outcomes in offspring of mothers with cosmetic breast implants: a review. Plast Reconstr Surg 2007; 120(7 suppl 1):129S–134S. doi:10.1097/01.prs.0000286571.93392.00
- Semple JL. Breast-feeding and silicone implants. Plast Reconstr Surg 2007; 120(7 suppl 1):123S–128S. doi:10.1097/01.prs.0000286579.27852.ed
- de Boer M, van leeuwen FE, Hauptmann M, et al. Breast implants and the risk of anaplastic large-cell lymphoma in the breast. JAMA Oncol 2018; 4(3):335–341. doi:10.1001/jamaoncol.2017.4510
- McCarthy CM, Horwitz SM. Association of breast implants with anaplastic large-cell lymphoma. JAMA Oncol 2018; 4(3):341–342. doi:10.1001/jamaoncol.2017.4467
- American Society of Plastic Surgeons. BIA-ALCL physician resources. www.plasticsurgery.org/for-medical-professionals/health-policy/bia-alcl-physician-resources. Accessed December 17, 2018.
- The American Society for Aesthetic Plastic Surgery, Inc. Member FAQs: latest information on ALCL. www.surgery.org/sites/default/files/Member-FAQs_1.pdf. Accessed January 17, 2019.
- The American Society of Plastic Surgeons. BIA-ALCL resources: summary and quick facts. www.plasticsurgery.org/for-medical-professionals/health-policy/bia-alcl-summary-and-quick-facts. Accessed January 17, 2019.
- National Comprehensive Cancer Network. T-cell lymphomas. www.nccn.org/professionals/physician_gls/pdf/t-cell.pdf.
- The Plastic Surgery Foundation PROFILE Registry. www.thepsf.org/research/registries/profile. Accessed January 17, 2019.
- Sarwer DB. The psychological aspects of cosmetic breast augmentation. Plast Reconstr Surg 2007; 120(7 suppl 1):110S–117S. doi:10.1097/01.prs.0000286591.05612.72
- Rohrich RJ, Adams WP, Potter JK. A review of psychological outcomes and suicide in aesthetic breast augmentation. Plast Reconstr Surg 2007; 119(1):401–408. doi:10.1097/01.prs.0000245342.06662.00
- Kalaaji A, Bjertness CB, Nordahl C, Olafsen K. Survey of breast implant patients: characteristics, depression rate, and quality of life. Aesthet Surg J 2013; 33(2):252–257. doi:10.1177/1090820X12473106
- Kalaaji A, Dreyer S, Brinkmann J, Maric I, Nordahl C, Olafsen K. Quality of life after breast enlargement with implants versus augmentation mastopexy: a comparative study. Aesthet Surg J 2018; 38(12):1304–1315. doi:10.1093/asj/sjy047
At present, 300,000 US women undergo breast augmentation surgery each year,1 making this the second most common aesthetic procedure in women (after liposuction),2–4 and making it extremely likely that clinicians will encounter women who have breast implants. In addition, approximately 110,000 women undergo breast reconstructive surgery after mastectomy, of whom more than 88,000 (81%) receive implants (2016 data).5
This review discusses the evolution of breast implants, their complications, and key considerations with regard to aesthetic and reconstructive breast surgery, as the principles are similar.
EVOLUTION OF IMPLANTS
Reports of breast augmentation surgery, also known as augmentation mammoplasty, date back to 1895, when a fatty tumor (lipoma) was successfully transplanted from a patient’s back to a breast defect in a mastectomy patient.2,3,6,7 In the 1930s, implantation of a glass ball into a patient’s breast marked the first implant-based breast augmentation.6 By 1954, attempts at breast augmentation using local dermal-fat flaps, adipose tissue, and even omentum were described.
Alloplastic materials gained popularity throughout the 1950s and 1960s and included polyurethane, polytetrafluoroethylene (Teflon), and other synthetics. Adverse reactions associated with alloplastic materials were plentiful: local tissue reactions, distortion of the breast mound, increased firmness, and discomfort all contributed to the eventual discontinuation of their use. The history of alloplastic breast augmentation also included epoxy resin, shellac, beeswax, paraffin, rubber, petroleum jelly, and liquefied silicone. Outcomes were not good, and many patients ultimately needed mastectomy.7
The first modern breast prosthesis was developed in 1961, and since then, implant composition and design have evolved significantly.8
From silicone to saline, and back again
The first silicone gel implants, introduced in the early 1960s,8–19 had high complication rates—some centers reported an incidence of capsular contracture of up to 70%.8,11 This is a foreign body reaction in which pathologic scar tissue encases the implant, causing it to distort, appear misshapen, harden, and even become painful.11 Attempts to minimize this reaction led to later generations of silicone implants with polyurethane shells.12
Inflatable implants filled with sterile saline solution were originally developed in France in 1965. Unlike silicone implants, saline implants have undergone minimal changes since their inception, and grew in popularity during the 1970s in view of the high rates of capsular contracture with silicone implants.8 However, saline implants have their own problems, and as they became increasingly popular, deflation and the unnatural feel of saline sparked a renewed interest in silicone gel.
By the late 1980s, the thinner-shelled generation of silicone implants displayed its own frustrating complications including implant rupture, capsular contracture, infection, and possible systemic and disseminated granulomatous disease. From 1992 to 2006, the US Food and Drug Administration (FDA) placed a moratorium on silicone implants due to concerns about a possible link with autoimmune and connective tissue diseases and the possible carcinogenic nature of silicone.
While silicone implants were prohibited in the United States, development continued abroad, and eventually the moratorium was lifted after several meta-analyses failed to reveal any link regarding the aforementioned concerns.13
Today, silicone gel implants dominate the world market.14 In the United States, approximately 60% of implants contain silicone gel filler, and trends are similar in Europe.7
Table 1 summarizes the evolution of silicone breast implants over the last 50 years.2,6,11,12Table 2 lists the advantages and disadvantages of silicone and saline breast implants.2,6,8,15
CURRENT IMPLANT OPTIONS
Currently, 3 companies (Allergan, Mentor, Sientra) manufacture and distribute breast implants and implant-associated products such as tissue expanders and sizers in the US market.6
Another company, Motiva, makes an implant that is available in Europe, Asia, and Australia, and the device is currently undergoing a 10-year clinical trial in the United States that began recruiting patients in 16 centers in April 2018.16 Pending final approval, the Cleveland Clinic Department of Plastic Surgery may be among the centers involved in the clinical trial of the Motiva implant. Innovations in the Motiva implant include a high-performance shell that maintains consistent strength and includes a proprietary barrier layer, improved silicone gel filler, 3-D imprinted surface texturing, and an implant shape that adapts with vertical and horizontal movement. It also contains radio-frequency identification transponders that can transmit data about the implant wirelessly.17–19
Surface (textured vs smooth)
Developed in the 1980s, texturing of the implant surface disrupts capsule formation around the prosthesis. Additionally, texturing stabilizes an anatomically shaped (teardrop) implant within the breast pocket, reducing malrotation.20,21
The first textured implants were covered with polyurethane foam, but they were ultimately withdrawn from the US market because of concern for in vivo degradation to carcinogenic compounds. The focus subsequently turned to texturing implant shells by mechanically creating pores of different sizes. Smooth implants, by contrast, are manufactured by repeatedly dipping the implant shell into liquid silicone.2
The capsular contraction rate has been shown to be lower with textured silicone than with smooth silicone (number needed to treat = 7–9), and evidence suggests a lower risk of needing a secondary procedure.21
Form-stable vs fluid-form
Silicone is a polymer. The physical properties of polymers vary greatly and depend on the length of the individual chains and the degree to which those chains are cross-linked. Liquid silicone contains short chains and sparse cross-linking, resulting in an oily compound well suited for lubrication. Silicone gel contains longer chains and more cross-linking and is therefore more viscous.
In “form-stable” implants, the silicone interior has sufficient chain length and cross-linking to retain the designed shape even at rest,2 but they require slightly larger incisions.7 “Fluid-form” refers to an implant with silicone filler with shorter chain length, less cross-linking, and more fluidity.6
Shell
As with silicone fillers, the properties of silicone implant shells also depend on chain length and cross-linking within the polymer. Silicone elastomer shells (Table 1) contain extensively cross-linked chains that impart a flexible yet rubbery character. Silicone elastomers can also be found in facial implants and tissue expanders.2
Implant shape (round vs anatomic)
The shape of an implant is determined by the gel distribution inside of it. To understand gel distribution and implant shape, one must understand the gel-shell ratio. This ratio increases as cohesivity of the filler increases, and it represents increased bonding of the gel filler to the shell and a preserved implant shape at rest.
The gel-shell ratio varies among manufacturers, and a less-viscous filler may be more prone to rippling or loss of upper pole fullness in some patients. For this reason, careful analysis, patient and implant selection, and discussion of complications remain paramount.2
No anatomically shaped implant is manufactured with a smooth shell, but rather with a textured shell that resists malrotation.6,15 However, in the United States, 95% of patients receive round implants.16
PATIENT ASSESSMENT
Before breast augmentation surgery, the surgeon assesses a number of factors—physical and psychosocial—and helps the patient choose a type and size of implant. The surgeon and patient also plan where the implants will be placed—ie, above or beneath the chest wall muscle—and where the incisions will be made. Every decision is made in close consultation with the patient, taking into account the patient’s desires and expectations, as well as what the patient’s anatomy allows. An integral component of this shared decision-making process is a discussion of the possible complications, and often photographs to better illustrate what to expect postoperatively.
Psychosocial factors
One must consider the patient’s psychology, motivations for surgery, and emotional stability. Here, we look for underlying body dysmorphic disorder; excessive or unusual encouragement to undergo the procedure by a spouse, friends, or others; a history of other aesthetic procedures; unrealistic expectations; and other factors influencing the desire to undergo this surgery.
Choosing an implant
Implant selection must take into account the patient’s height, weight,7 and overall body morphology: taller patients and those with wider hips or shoulders usually require larger implants. A reliable method for determining the appropriate implant must include the current breast shape, dimensions, volume, skin elasticity, soft-tissue thickness, and overall body habitus. Ultimately, the most important considerations include breast base diameter, implant volume,20 and soft-tissue envelope.
Preoperative sizing can involve placing sample implants within a brassiere so that the patient can preview possible outcomes. This method is particularly effective in minimizing dissatisfaction because it shares ownership of the decision-making process.15
A computerized implant selection program available in Europe suggests a “best-fit” implant based on a clinician’s measurements.7
Anatomic placement
Traditionally, plastic surgeons place breast implants either beneath the pectoralis major muscle (submuscular placement) or over the pectoralis8 but beneath the glandular breast parenchyma (subglandular placement) (Figure 2).7
Advantages of submuscular placement are a smoother transition of the upper breast pole from the chest wall and less rippling visible through the skin, due to the additional muscular coverage of the implant. Another advantage is that capsular contraction rates are lower with submuscular placement, likely due to possible contamination of implants by lactiferous ductal microbes when accessing the subglandular plane.14,20 Disadvantages are pronounced discomfort after surgery and animation deformities with muscle contraction, particularly in young, highly active patients.
A popular modification of submuscular placement involves creating a surgical dissection plane between the subglandular tissue and the pectoralis major fascia. This “dualplane” approach allows the parenchyma to retract superiorly and reduce breast ptosis.7
Incisions
Table 3 highlights important considerations with regard to incision location.15,20,21
ANTIBIOTICS
Many surgeons give a single prophylactic dose of antibiotic before surgery, a practice that some studies have shown to be effective in reducing the risk of infection.15 However, the benefit of routine postoperative use of antibiotics remains unsubstantiated15: postoperative antibiotic use does not appear to protect against infection, capsular contracture, or overall complications in primary or secondary breast augmentation surgery.20
PERIOPERATIVE PERIOD
At our institution, breast augmentation surgery is an ambulatory procedure—the patient goes home the same day unless circumstances such as pain control warrant admission. This is, however, according to surgeon preference, and differs on a case-by-case basis. General anesthesia is the standard of care.15
POSTOPERATIVE PERIOD
In the immediate postoperative period, patients are instructed to wear a surgical bra for up to 6 weeks to allow stable scarring. Early mobilization is encouraged.7,15 Depending on the patient’s situation, recovery, and healing, she may be out of work for about 1 week, sometimes more, sometimes less.
Additional instructions are surgeon-specific. However, the patient is instructed to avoid bathing, swimming, immersion in water, and wearing underwire brassieres that could impair healing of an inferior incision; instead, patients are often instructed to wear a surgical bra provided on the day of surgery until cleared in the clinic.
Showering is allowed the next day or the second day after surgery, and of course there is no driving while on narcotics. Additionally, patients are counseled extensively regarding hematoma formation and the signs and symptoms of infection.
Patients are typically seen in clinic 1 week after surgery.
The cost of surgery may be $5,000 to $6,000 but can vary significantly from center to center depending on who the patient sees and where, and whether the patient presents for breast reconstruction after cancer or repair of congenital anomalies, or in certain cases of transgender surgery. The patient is typically responsible for the fee, but again this depends on the patient, indications, and particular insurance concerns.
IMPLANT LONGEVITY AND RUPTURE
In the United States, implant rupture rates range from 1.1% to 17.7% at 6 to 10 years after primary augmentation, 2.9% to 14.7% after revision augmentation, 1.5% to 35.4% after primary breast reconstruction, and 0% to 19.6% after revision reconstruction.11
Unfortunately, the existence of multiple implant manufacturers, numerous implant generations, and poorly standardized screening protocols and reporting systems make the true rate of implant rupture difficult to assess without definitive imaging or implant retrieval.11
Damage from surgical instrumentation during implantation is the most common cause of silicone breast implant rupture (50% to 64% of cases).22 Other causes include underfilling and fold flaw from capsular contracture.
Leakage of silicone gel filler may be confined to the periprosthetic capsule (intracapsular rupture) or extend beyond and into the breast parenchyma (extracapsular rupture). One study reported that only 10% of intracapsular ruptures progressed extracapsularly, while 84% of patients with extracapsular involvement remained stable for up to 2 years,23 indicating that intracapsular rupture may not portend worsening disease.11
Implant rupture occurs silently in most cases, with no clinically detectable signs or symptoms. In other cases, patients may present with alterations in breast shape and size, sudden asymmetry, firmness, pronounced capsular contracture, contour irregularity, or pain.
Aside from physical examination, comprehensive diagnostic testing includes imaging—ultrasonography, mammography, computed tomography, and magnetic resonance imaging (MRI). Of these, MRI is the method of choice, with sensitivity and specificity exceeding 90% for detecting implant rupture.11 Classic findings on MRI include the “linguine” sign from a deflating implant shell, or the teardrop sign from implant sagging. Classic findings on ultrasonography include the “snowstorm” sign of extracapsular rupture and the “stepladder” sign of intracapsular rupture.
Mammography effectively detects free silicone in breast tissue with extracapsular rupture (25% of ruptures according to some studies)23; however, it cannot detect rupture within the implant capsule. As an aside, submuscular implant placement may interfere less with screening mammography than subglandular implants do.14,24
Current FDA recommendations to detect implant rupture encourage women with silicone breast implants to undergo screening 3 years after implantation and then every 2 years thereafter; no long-term monitoring is suggested for saline implants.15 Many plastic surgeons evaluate silicone breast implant patients every 1 to 2 years for contracture and rupture.8 Of note, capsular contracture impairs the effectiveness of ultrasonography and may require MRI confirmation.11
If implant rupture is confirmed, the current recommendation is to remove the implant and the capsule. Another implant may be placed depending on the patient’s preference. Rigorous washout remains a key feature of any surgical intervention for ruptured breast implants; however, in the event of extracapsular rupture, resection of silicone granulomas may also be required.11
Reoperation rates for primary breast augmentation surgery approach 20% and are even higher for secondary augmentation over a patient’s lifetime—the highest rate of all aesthetic procedures.7,14
CAPSULAR CONTRACTURE
Capsular contracture is the most common complication of breast augmentation,25 typically presenting within the first postoperative year,26,27 and the risk increases over time.28 It occurs with both silicone and saline breast implants.
In some studies, the incidence exceeded 4% in the first 2 years after surgery,29 and nearly 50% by 10 years.30 Other studies found rates of 0% to 20% over 13 years.20
The etiology is not well understood and is presumed to be multifactorial, with proposed mechanisms and factors that include bacterial contamination, surface texturing, the implant pocket selected, the incision type, drain placement, antibiotic use, and smoking.25
A meta-analysis from 17,000 implants found that the risk of capsular contracture was significantly higher when an implant was placed in a subglandular pocket than in a submuscular pocket,22,26 and that although texturing decreased capsular contracture compared with smooth implants, the effect was modest when a textured or smooth implant was placed in a submuscular location.28 With regard to incision location, studies have reported that the incidence of capsular contracture is highest with transaxillary and periareolar incisions, and lowest with inframammary incisions.20,21
The leading theory is that contamination of the implant (primarily from the mammary ducts) results in biofilm formation. Subclinical hematoma surrounding the implant may also provide key bacterial nutrients.20
Textured implants induce a greater inflammatory response in the capsular tissue, resulting in a thicker capsule; however, contracture rates remain lower with textured than with smooth implants.14,31 Interestingly, lower rates of capsular contracture have been observed with later-generation, cohesive-gel, form-stable implants than with those of earlier generations.12
Although more research is needed, silicone implants appear to confer a higher risk of capsular contracture than saline implants.14,20
Irrigating the breast pocket intraoperatively with triple antibiotic solution (bacitracin, cefazolin, and gentamicin) before placing the implant may decrease the capsular contracture rate.15,20
Treatments for capsular contracture include pocket modifications such as capsulotomy (making releasing, relaxing incisions in the scar capsule encasing the implant), capsulectomy (removing portions of or the entire capsule), and replacing the implant in the other pocket (ie, if the original implant was subglandular, the replacement is placed in the submuscular pocket). Patients who have contractures that fail to respond to these treatments may ultimately benefit from implant removal and autologous reconstruction (autoaugmentation) rather than implant replacement.32,33
ADDITIONAL COMPLICATIONS
Other complications include infection, malposition, rippling, seroma, hematoma, and sensory alterations.
Irrigation during the implantation procedure with a triple antibiotic solution consisting of bacitracin, gentamycin, and cephalexin in normal saline decreases infection and seroma rates.15,20,34
Some surgeons also choose to irrigate the pocket with a betadine solution, or to cleanse the skin with betadine and place sterile towels and redrape before inserting the implant. Additionally, many prefer using a sterile device much like a pastry funnel called a Keller funnel to insert the implant into the breast pocket.35
Infection is less common with cosmetic augmentations than with implant-based breast reconstruction, likely because of healthier, well-vascularized tissue in patients undergoing cosmetic surgery than in those undergoing mastectomy.14
Seroma is thought to be a consequence of texturing, and more so with macro- vs microtexturing. Though poorly understood, an association between texturing and double capsules has also been reported.12,20
After primary breast augmentation, 10-year follow-up rates of capsular contracture, seroma, rippling, and malposition vary across the 3 major silicone implant manufacturers.12 Hematoma and infection occur in less than 1% of primary augmentation patients.15
Malposition of the implant over time is less frequent with textured implants because of the higher coefficient of friction compared with smooth implants.6,8,15
Visible skin rippling may be a consequence of texturing and also of thin body habitus, eg, in patients with a body mass index less than 18.5 kg/m2. If the soft-tissue layer of the breast is thin, the natural rippling of smooth saline implant shells are more likely to show when placed in the subglandular pocket. Form-stable implants, by contrast, resist rippling.12,15
Large implants and extensive lateral dissection can cause alterations in nipple sensation and sensory loss within lower breast pole skin. Axillary incisions may traumatize or damage the intercostobrachial nerve, resulting in upper inner arm sensory aberrations.
Ultimately, the 10-year incidence of secondary surgery ranges from 0% to 36% and the 10-year incidence of capsular contracture ranges from 11% to 19%.15 Additional cosmetic complaints after augmentation with implants include enlargement of the areola and engorgement of breast veins.14
BREAST CANCER AND DETECTION
Patients with or without implants do not seem to differ with regard to breast cancer stage upon detection, tumor burden, recurrence, or survival. However, more patients with implants may present with palpable masses, invasive tumors, axillary metastasis, and falsely negative mammograms.
Breast implants may actually facilitate cancer detection on physical examination by providing a more dense or stable surface upon which to palpate the breast tissue. Although they do not necessarily impair mastectomy or breast reconstruction, they may result in an increased rate of revision surgery after breast conservation therapy.24,36 Mammography remains the standard of care for radiologic diagnosis but can be further supported by MRI and ultrasonography if necessary in patients with implants.
AUTOIMMUNE DISEASES
Although concerns persist, multiple studies have demonstrated the safety of fourth- and fifth-generation silicone breast implants with regard to autoimmune disease.7
In various clinical studies in mastectomy patients who underwent breast reconstruction with either silicone implants or autologous tissue, no difference was found with regard to the incidence of autoimmune diseases.2 Additionally, in meta-analyses of data from more than 87,000 women, no association was found between connective tissue disease and silicone breast implants.2,11 One study11,23 noted no increase in autoantibodies in patients with undamaged silicone implants vs patients who experienced rupture.
Studies have also demonstrated that in children born to mothers with breast implants, the risk of rheumatic disease, esophageal disorders, congenital malformations, and death during the perinatal period is comparable with that in controls.37 Another study, examining breastfeeding in women with silicone breast implants, showed no significant difference in silicon levels (used as a proxy for silicone) in breast milk compared with controls without implants; silicon levels were found to be significantly higher in cow’s milk and store-bought formulas.38
BREAST IMPLANT-ASSOCIATED ANAPLASTIC LARGE-CELL LYMPHOMA
Breast implant-associated anaplastic large-cell lymphoma (BIA-ALCL) is a subtype of T-cell lymphoma that develops in tissue adjacent to breast implants. It typically presents as breast swelling 2 to 38 years (mean of 8 years) after implant insertion.39,40 The swelling may be secondary to periprosthetic seroma formation or, more rarely, palpable disease in the axilla. Patients occasionally complain of pain and, rarely, constitutional symptoms.20 BIA-ALCL is not a disease of the surrounding breast tissue, but rather of the fibrous periprosthetic capsule.21
Of note, there is no documented case involving smooth implants,41–43 but it may be related to fifth-generation textured implants.6 At present, it is not possible to definitively state which implant is associated with this condition; hence, more data are needed, and this association is currently under study.
The absolute risk of BIA-ALCL was reported in a Dutch study39 as 1 in 35,000 by age 50, 1 in 12,000 by age 70, and 1 in 7,000 by age 75, with a number needed to harm of 6,920. Overall lifetime risk was estimated at 1 in 30,000 for women with textured implants in a 2015 US study.40 In comparison, breast cancer risk is about 1 in 8 women. There is no apparent predilection for patients who underwent cosmetic augmentation vs reconstruction, or who received silicone vs saline implants.
The diagnosis is confirmed by ultrasonographically guided fine-needle aspiration of seroma fluid and subsequent immunohistochemical testing for CD30-positive and ALK-negative T lymphocytes. Other than positron-emission tomography for staging after diagnosis confirmation, imaging is ineffective. Expert opinion does not recommend routine screening unless the aforementioned symptoms arise.
Treatment involves implant removal and total capsulectomy, with samples sent for pathology study with cytokeratin staining.12 Of note, in all cases of BIA-ALCL in which the disease was limited to the circumscribed scar tissue of the breast capsule, complete surgical excision has proved curative, whereas incomplete capsulectomy portends a greater risk of recurrence and decreased survival.44
In cases of advanced or recurrent ALCL, diagnosed late or inappropriately, the National Comprehensive Cancer Network recommends a multidisciplinary approach involving adjuvant chemotherapy and radiation.44 Anecdotally, at our institution, we have recently treated several cases of advanced ALCL presenting with invasive chest wall masses with extirpative surgery and subsequent reconstruction with the assistance of our thoracic surgery colleagues, as well as the aforementioned multidisciplinary approach using adjuvant therapy.
The mechanism of this malignancy is currently under investigation, but the current theory implicates an exaggerated lymphoproliferative response to bacterial contamination of the capsule superimposed upon genetic factors in susceptible patients.42,43
National societies advise plastic surgeons to discuss the risk of BIA-ALCL with all patients at the time of breast augmentation consultation and to report all confirmed cases to the PROFILE registry (Patient Registry and Outcomes for Breast Implants and Anaplastic Large Cell Lymphoma Etiology and Epidemiology).45
ARE PATIENTS HAPPIER AFTERWARD?
Studies have shown that after undergoing breast augmentation surgery, patients note improvement in body image, and satisfaction rates range from 85% to 95% with respect to self-confidence and body image.46 An evaluation of patient responses on the validated BREAST-Q Augmentation Questionnaire showed the following satisfaction rates: breasts 83%, psychosocial well-being 88%, and sexual functioning 81%.15
Although epidemiologic studies have reported higher suicide rates in women with cosmetic breast implants, this likely stems from preoperative psychological factors and underscores the role of psychiatric referral in patients with a mental health history or in those whom the surgeon deems it necessary.46
Several high-quality studies have demonstrated that quality of life and psychosocial functioning (including depression) markedly improve after breast augmentation surgery.47 Among a cohort of Norwegian patients, breast implant surgery resulted in improved motivation to perform daily activities, as well as improved quality of life from both a psychosocial and aesthetic perspective.48 Interestingly, a recent study reported that patients who underwent breast implant surgery alone reported greater satisfaction and psychosocial quality of life than patients who underwent combination breast augmentation and mastopexy (breast-lifting) surgery.49
Additional data are needed to refine our understanding of the complex interplay between psychosocial factors before and after surgery in patients seeking and undergoing breast augmentation procedures.
- Derby BM, Codner MA. Textured silicone breast implant use in primary augmentation: core data update and review. Plast Reconstr Surg 2015; 135(1):113–124. doi:10.1097/PRS.0000000000000832
- Maxwell GP, Gabriel A. Breast implant design. Gland Surg 2017; 6(2):148–153. doi:10.21037/gs.2016.11.09
- Gabriel A, Maxwell GP. The evolution of breast implants. Clin Plast Surg 2015; 42(4):399–404. doi:10.1016/j.cps.2015.06.015
- American Society of Plastic Surgeons. Procedural statistics trends 1992–2012. www.plasticsurgery.org/documents/News/Statistics/2012/plastic-surgery-statistics-full-report-2012.pdf. Accessed January 17, 2019.
- American Society of Plastic Surgeons. Plastic surgery statistics report 2016. www.plasticsurgery.org/documents/News/Statistics/2016/plastic-surgery-statistics-full-report-2016.pdf. Accessed January 17, 2019.
- Henderson PW, Nash D, Laskowski M, Grant RT. Objective comparison of commercially available breast implant devices. Aesthetic Plast Surg 2015; 39(5):724–732. doi:10.1007/s00266-015-0537-1
- Adams WP Jr, Mallucci P. Breast augmentation. Plast Reconstr Surg 2012; 130(4):597e–611e. doi:10.1097/PRS.0b013e318262f607
- Spear SL, Jespersen MR. Breast implants: saline or silicone? Aesthet Surg J 2010; 30(4):557–570. doi:10.1177/1090820X10380401
- Cronin TD, Gerow FJ. Augmentation mammaplasty: a new “natural feel” prosthesis. In: Transactions of the Third International Conference of Plastic Surgery: October 13–18, 1963, Washington, DC.
- Maxwell GP, Gabriel A. The evolution of breast implants. Plast Reconstr Surg 2014; 134(suppl 1):12S–17S. doi:10.1097/PRS.0000000000000348
- Hillard C, Fowler JD, Barta R, Cunningham B. Silicone breast implant rupture: a review. Gland Surg 2017; 6(2):163–168. doi:10.21037/gs.2016.09.12
- Derby BM, Codner MA. Textured silicone breast implant use in primary augmentation: core data update and review. Plast Reconstr Surg 2015; 135(1):113–124. doi:10.1097/PRS.0000000000000832
- Tugwell P, Wells G, Peterson J, et al. Do silicone breast implants cause rheumatologic disorders? A systematic review for a court-appointed national science panel. Arthritis Rheum 2001; 44(11):2477–2484. pmid:11710703
- Alpert BS, Lalonde DH. MOC-PS(SM) CME article: breast augmentation. Plast Reconstr Surg 2008; 121(suppl 4):1–7. doi:10.1097/01.prs.0000305933.31540.5d
- Hidalgo DA, Spector JA. Breast augmentation. Plast Reconstr Surg 2014; 133(4):567e–583e. doi:10.1097/PRS.0000000000000033
- ClinicalTrials.gov. Study of the safety and effectiveness of Motiva Implants®. https://clinicaltrials.gov/ct2/show/NCT03579901. Accessed January 17, 2019.
- Establishment Labs. Motiva Implants. https://motivaimplants.com/why-motiva/innovation-for-enhanced-safety/. Accessed January 17, 2019.
- Sforza M, Zaccheddu R, Alleruzzo A, et al. Preliminary 3-year evaluation of experience with silksurface and velvetsurface Motiva silicone breast implants: a single-center experience with 5813 consecutive breast augmentation cases. Aesthet Surg J 2018; 38(suppl 2):S62–S73. doi:10.1093/asj/sjx150
- Huemer GM, Wenny R, Aitzetmüller MM, Duscher D. Motiva ergonomix round silksurface silicone breast implants: outcome analysis of 100 primary breast augmentations over 3 years and technical considerations. Plast Reconstr Surg 2018; 141(6):831e–842e. doi:10.1097/PRS.0000000000004367
- Lista F, Ahmad J. Evidence-based medicine: augmentation mammaplasty. Plast Reconstr Surg 2013; 132(6):1684–1696. doi:10.1097/PRS.0b013e3182a80880
- Namnoum JD, Largent J, Kaplan HM, Oefelein MG, Brown MH. Primary breast augmentation clinical trial outcomes stratified by surgical incision, anatomical placement and implant device type. J Plast Reconstr Aesthet Surg 2013; 66(9):1165–1172. doi:10.1016/j.bjps.2013.04.046
- Handel N, Garcia ME, Wixtrom R. Breast implant rupture: causes, incidence, clinical impact, and management. Plast Reconstr Surg 2013; 132(5):1128–1137. doi:10.1097/PRS.0b013e3182a4c243
- Hölmich LR, Friis S, Fryzek JP, et al. Incidence of silicone breast implant rupture. Arch Surg 2003; 138(7):801–806. doi:10.1001/archsurg.138.7.801
- Mccarthy CM, Pusic AL, Disa JJ, Cordeiro PG, Cody HS 3rd, Mehrara B. Breast cancer in the previously augmented breast. Plast Reconstr Surg 2007; 119(1):49–58. doi:10.1097/01.prs.0000244748.38742.1f
- Egeberg A, Sørensen JA. The impact of breast implant location on the risk of capsular contraction. Ann Plast Surg 2016; 77(2):255–259. doi:10.1097/SAP.0000000000000227
- Wickman M. Rapid versus slow tissue expansion for breast reconstruction: a three-year follow-up. Plast Reconstr Surg 1995; 95(4):712–718. pmid:7892316
- Kjøller K, Hölmich LR, Jacobsen PH, et al. Epidemiological investigation of local complications after cosmetic breast implant surgery in Denmark. Ann Plast Surg 2002; 48(3):229–237. pmid:11862025
- Handel N, Jensen JA, Black Q, Waisman JR, Silverstein MJ. The fate of breast implants: a critical analysis of complications and outcomes. Plast Reconstr Surg 1995; 96(7):1521–1533. pmid:7480271
- Henriksen TF, Hölmich LR, Fryzek JP, et al. Incidence and severity of short-term complications after breast augmentation: results from a nationwide breast implant registry. Ann Plast Surg 2003; 51(6):531–539. doi:10.1097/01.sap.0000096446.44082.60
- Fernandes JR, Salinas HM, Broelsch GF, et al. Prevention of capsular contracture with photochemical tissue passivation. Plast Reconstr Surg 2014; 133(3):571–577. doi:10.1097/01.prs.0000438063.31043.79
- Wong CH, Samuel M, Tan BK, Song C. Capsular contracture in subglandular breast augmentation with textured versus smooth breast implants: a systematic review. Plast Reconstr Surg 2006; 118(5):1224–1236. doi:10.1097/01.prs.0000237013.50283.d2
- Gurunluoglu R, Sacak B, Arton J. Outcomes analysis of patients undergoing autoaugmentation after breast implant removal. Plast Reconstr Surg 2013; 132(2):304–315. doi:10.1097/PRS.0b013e31829e7d9e
- Gurunluoglu R, Shafighi M, Schwabegger A, Ninkovic M. Secondary breast reconstruction with deepithelialized free flaps from the lower abdomen for intractable capsular contracture and maintenance of breast volume. J Reconstr Microsurg 2005; 21(1):35–41. doi:10.1055/s-2005-862779
- Adams WP Jr, Rios JL, Smith SJ. Enhancing patient outcomes in aesthetic reconstructive breast surgery using triple antibiotic breast irrigation: six-year prospective clinical study. Plast Reconstru Surg 2006; 118(7 suppl):46S–52S. doi:10.1097/01.prs.0000185671.51993.7e
- Moyer HR, Ghazi B, Saunders N, Losken A. Contamination in smooth gel breast implant placement: testing a funnel versus digital insertion technique in a cadaver model. Aesthet Surg J 2012; 32(2):194–199. doi:10.1177/1090820X11434505
- Handel N. The effect of silicone implants on the diagnosis, prognosis, and treatment of breast cancer. Plast Reconstr Surg 2007; 120(7 suppl 1):81S–93S. doi:10.1097/01.prs.0000286578.94102.2b
- Kjøller K, Friis S, Lipworth L, Mclaughlin JK, Olsen JH. Adverse health outcomes in offspring of mothers with cosmetic breast implants: a review. Plast Reconstr Surg 2007; 120(7 suppl 1):129S–134S. doi:10.1097/01.prs.0000286571.93392.00
- Semple JL. Breast-feeding and silicone implants. Plast Reconstr Surg 2007; 120(7 suppl 1):123S–128S. doi:10.1097/01.prs.0000286579.27852.ed
- de Boer M, van leeuwen FE, Hauptmann M, et al. Breast implants and the risk of anaplastic large-cell lymphoma in the breast. JAMA Oncol 2018; 4(3):335–341. doi:10.1001/jamaoncol.2017.4510
- McCarthy CM, Horwitz SM. Association of breast implants with anaplastic large-cell lymphoma. JAMA Oncol 2018; 4(3):341–342. doi:10.1001/jamaoncol.2017.4467
- American Society of Plastic Surgeons. BIA-ALCL physician resources. www.plasticsurgery.org/for-medical-professionals/health-policy/bia-alcl-physician-resources. Accessed December 17, 2018.
- The American Society for Aesthetic Plastic Surgery, Inc. Member FAQs: latest information on ALCL. www.surgery.org/sites/default/files/Member-FAQs_1.pdf. Accessed January 17, 2019.
- The American Society of Plastic Surgeons. BIA-ALCL resources: summary and quick facts. www.plasticsurgery.org/for-medical-professionals/health-policy/bia-alcl-summary-and-quick-facts. Accessed January 17, 2019.
- National Comprehensive Cancer Network. T-cell lymphomas. www.nccn.org/professionals/physician_gls/pdf/t-cell.pdf.
- The Plastic Surgery Foundation PROFILE Registry. www.thepsf.org/research/registries/profile. Accessed January 17, 2019.
- Sarwer DB. The psychological aspects of cosmetic breast augmentation. Plast Reconstr Surg 2007; 120(7 suppl 1):110S–117S. doi:10.1097/01.prs.0000286591.05612.72
- Rohrich RJ, Adams WP, Potter JK. A review of psychological outcomes and suicide in aesthetic breast augmentation. Plast Reconstr Surg 2007; 119(1):401–408. doi:10.1097/01.prs.0000245342.06662.00
- Kalaaji A, Bjertness CB, Nordahl C, Olafsen K. Survey of breast implant patients: characteristics, depression rate, and quality of life. Aesthet Surg J 2013; 33(2):252–257. doi:10.1177/1090820X12473106
- Kalaaji A, Dreyer S, Brinkmann J, Maric I, Nordahl C, Olafsen K. Quality of life after breast enlargement with implants versus augmentation mastopexy: a comparative study. Aesthet Surg J 2018; 38(12):1304–1315. doi:10.1093/asj/sjy047
- Derby BM, Codner MA. Textured silicone breast implant use in primary augmentation: core data update and review. Plast Reconstr Surg 2015; 135(1):113–124. doi:10.1097/PRS.0000000000000832
- Maxwell GP, Gabriel A. Breast implant design. Gland Surg 2017; 6(2):148–153. doi:10.21037/gs.2016.11.09
- Gabriel A, Maxwell GP. The evolution of breast implants. Clin Plast Surg 2015; 42(4):399–404. doi:10.1016/j.cps.2015.06.015
- American Society of Plastic Surgeons. Procedural statistics trends 1992–2012. www.plasticsurgery.org/documents/News/Statistics/2012/plastic-surgery-statistics-full-report-2012.pdf. Accessed January 17, 2019.
- American Society of Plastic Surgeons. Plastic surgery statistics report 2016. www.plasticsurgery.org/documents/News/Statistics/2016/plastic-surgery-statistics-full-report-2016.pdf. Accessed January 17, 2019.
- Henderson PW, Nash D, Laskowski M, Grant RT. Objective comparison of commercially available breast implant devices. Aesthetic Plast Surg 2015; 39(5):724–732. doi:10.1007/s00266-015-0537-1
- Adams WP Jr, Mallucci P. Breast augmentation. Plast Reconstr Surg 2012; 130(4):597e–611e. doi:10.1097/PRS.0b013e318262f607
- Spear SL, Jespersen MR. Breast implants: saline or silicone? Aesthet Surg J 2010; 30(4):557–570. doi:10.1177/1090820X10380401
- Cronin TD, Gerow FJ. Augmentation mammaplasty: a new “natural feel” prosthesis. In: Transactions of the Third International Conference of Plastic Surgery: October 13–18, 1963, Washington, DC.
- Maxwell GP, Gabriel A. The evolution of breast implants. Plast Reconstr Surg 2014; 134(suppl 1):12S–17S. doi:10.1097/PRS.0000000000000348
- Hillard C, Fowler JD, Barta R, Cunningham B. Silicone breast implant rupture: a review. Gland Surg 2017; 6(2):163–168. doi:10.21037/gs.2016.09.12
- Derby BM, Codner MA. Textured silicone breast implant use in primary augmentation: core data update and review. Plast Reconstr Surg 2015; 135(1):113–124. doi:10.1097/PRS.0000000000000832
- Tugwell P, Wells G, Peterson J, et al. Do silicone breast implants cause rheumatologic disorders? A systematic review for a court-appointed national science panel. Arthritis Rheum 2001; 44(11):2477–2484. pmid:11710703
- Alpert BS, Lalonde DH. MOC-PS(SM) CME article: breast augmentation. Plast Reconstr Surg 2008; 121(suppl 4):1–7. doi:10.1097/01.prs.0000305933.31540.5d
- Hidalgo DA, Spector JA. Breast augmentation. Plast Reconstr Surg 2014; 133(4):567e–583e. doi:10.1097/PRS.0000000000000033
- ClinicalTrials.gov. Study of the safety and effectiveness of Motiva Implants®. https://clinicaltrials.gov/ct2/show/NCT03579901. Accessed January 17, 2019.
- Establishment Labs. Motiva Implants. https://motivaimplants.com/why-motiva/innovation-for-enhanced-safety/. Accessed January 17, 2019.
- Sforza M, Zaccheddu R, Alleruzzo A, et al. Preliminary 3-year evaluation of experience with silksurface and velvetsurface Motiva silicone breast implants: a single-center experience with 5813 consecutive breast augmentation cases. Aesthet Surg J 2018; 38(suppl 2):S62–S73. doi:10.1093/asj/sjx150
- Huemer GM, Wenny R, Aitzetmüller MM, Duscher D. Motiva ergonomix round silksurface silicone breast implants: outcome analysis of 100 primary breast augmentations over 3 years and technical considerations. Plast Reconstr Surg 2018; 141(6):831e–842e. doi:10.1097/PRS.0000000000004367
- Lista F, Ahmad J. Evidence-based medicine: augmentation mammaplasty. Plast Reconstr Surg 2013; 132(6):1684–1696. doi:10.1097/PRS.0b013e3182a80880
- Namnoum JD, Largent J, Kaplan HM, Oefelein MG, Brown MH. Primary breast augmentation clinical trial outcomes stratified by surgical incision, anatomical placement and implant device type. J Plast Reconstr Aesthet Surg 2013; 66(9):1165–1172. doi:10.1016/j.bjps.2013.04.046
- Handel N, Garcia ME, Wixtrom R. Breast implant rupture: causes, incidence, clinical impact, and management. Plast Reconstr Surg 2013; 132(5):1128–1137. doi:10.1097/PRS.0b013e3182a4c243
- Hölmich LR, Friis S, Fryzek JP, et al. Incidence of silicone breast implant rupture. Arch Surg 2003; 138(7):801–806. doi:10.1001/archsurg.138.7.801
- Mccarthy CM, Pusic AL, Disa JJ, Cordeiro PG, Cody HS 3rd, Mehrara B. Breast cancer in the previously augmented breast. Plast Reconstr Surg 2007; 119(1):49–58. doi:10.1097/01.prs.0000244748.38742.1f
- Egeberg A, Sørensen JA. The impact of breast implant location on the risk of capsular contraction. Ann Plast Surg 2016; 77(2):255–259. doi:10.1097/SAP.0000000000000227
- Wickman M. Rapid versus slow tissue expansion for breast reconstruction: a three-year follow-up. Plast Reconstr Surg 1995; 95(4):712–718. pmid:7892316
- Kjøller K, Hölmich LR, Jacobsen PH, et al. Epidemiological investigation of local complications after cosmetic breast implant surgery in Denmark. Ann Plast Surg 2002; 48(3):229–237. pmid:11862025
- Handel N, Jensen JA, Black Q, Waisman JR, Silverstein MJ. The fate of breast implants: a critical analysis of complications and outcomes. Plast Reconstr Surg 1995; 96(7):1521–1533. pmid:7480271
- Henriksen TF, Hölmich LR, Fryzek JP, et al. Incidence and severity of short-term complications after breast augmentation: results from a nationwide breast implant registry. Ann Plast Surg 2003; 51(6):531–539. doi:10.1097/01.sap.0000096446.44082.60
- Fernandes JR, Salinas HM, Broelsch GF, et al. Prevention of capsular contracture with photochemical tissue passivation. Plast Reconstr Surg 2014; 133(3):571–577. doi:10.1097/01.prs.0000438063.31043.79
- Wong CH, Samuel M, Tan BK, Song C. Capsular contracture in subglandular breast augmentation with textured versus smooth breast implants: a systematic review. Plast Reconstr Surg 2006; 118(5):1224–1236. doi:10.1097/01.prs.0000237013.50283.d2
- Gurunluoglu R, Sacak B, Arton J. Outcomes analysis of patients undergoing autoaugmentation after breast implant removal. Plast Reconstr Surg 2013; 132(2):304–315. doi:10.1097/PRS.0b013e31829e7d9e
- Gurunluoglu R, Shafighi M, Schwabegger A, Ninkovic M. Secondary breast reconstruction with deepithelialized free flaps from the lower abdomen for intractable capsular contracture and maintenance of breast volume. J Reconstr Microsurg 2005; 21(1):35–41. doi:10.1055/s-2005-862779
- Adams WP Jr, Rios JL, Smith SJ. Enhancing patient outcomes in aesthetic reconstructive breast surgery using triple antibiotic breast irrigation: six-year prospective clinical study. Plast Reconstru Surg 2006; 118(7 suppl):46S–52S. doi:10.1097/01.prs.0000185671.51993.7e
- Moyer HR, Ghazi B, Saunders N, Losken A. Contamination in smooth gel breast implant placement: testing a funnel versus digital insertion technique in a cadaver model. Aesthet Surg J 2012; 32(2):194–199. doi:10.1177/1090820X11434505
- Handel N. The effect of silicone implants on the diagnosis, prognosis, and treatment of breast cancer. Plast Reconstr Surg 2007; 120(7 suppl 1):81S–93S. doi:10.1097/01.prs.0000286578.94102.2b
- Kjøller K, Friis S, Lipworth L, Mclaughlin JK, Olsen JH. Adverse health outcomes in offspring of mothers with cosmetic breast implants: a review. Plast Reconstr Surg 2007; 120(7 suppl 1):129S–134S. doi:10.1097/01.prs.0000286571.93392.00
- Semple JL. Breast-feeding and silicone implants. Plast Reconstr Surg 2007; 120(7 suppl 1):123S–128S. doi:10.1097/01.prs.0000286579.27852.ed
- de Boer M, van leeuwen FE, Hauptmann M, et al. Breast implants and the risk of anaplastic large-cell lymphoma in the breast. JAMA Oncol 2018; 4(3):335–341. doi:10.1001/jamaoncol.2017.4510
- McCarthy CM, Horwitz SM. Association of breast implants with anaplastic large-cell lymphoma. JAMA Oncol 2018; 4(3):341–342. doi:10.1001/jamaoncol.2017.4467
- American Society of Plastic Surgeons. BIA-ALCL physician resources. www.plasticsurgery.org/for-medical-professionals/health-policy/bia-alcl-physician-resources. Accessed December 17, 2018.
- The American Society for Aesthetic Plastic Surgery, Inc. Member FAQs: latest information on ALCL. www.surgery.org/sites/default/files/Member-FAQs_1.pdf. Accessed January 17, 2019.
- The American Society of Plastic Surgeons. BIA-ALCL resources: summary and quick facts. www.plasticsurgery.org/for-medical-professionals/health-policy/bia-alcl-summary-and-quick-facts. Accessed January 17, 2019.
- National Comprehensive Cancer Network. T-cell lymphomas. www.nccn.org/professionals/physician_gls/pdf/t-cell.pdf.
- The Plastic Surgery Foundation PROFILE Registry. www.thepsf.org/research/registries/profile. Accessed January 17, 2019.
- Sarwer DB. The psychological aspects of cosmetic breast augmentation. Plast Reconstr Surg 2007; 120(7 suppl 1):110S–117S. doi:10.1097/01.prs.0000286591.05612.72
- Rohrich RJ, Adams WP, Potter JK. A review of psychological outcomes and suicide in aesthetic breast augmentation. Plast Reconstr Surg 2007; 119(1):401–408. doi:10.1097/01.prs.0000245342.06662.00
- Kalaaji A, Bjertness CB, Nordahl C, Olafsen K. Survey of breast implant patients: characteristics, depression rate, and quality of life. Aesthet Surg J 2013; 33(2):252–257. doi:10.1177/1090820X12473106
- Kalaaji A, Dreyer S, Brinkmann J, Maric I, Nordahl C, Olafsen K. Quality of life after breast enlargement with implants versus augmentation mastopexy: a comparative study. Aesthet Surg J 2018; 38(12):1304–1315. doi:10.1093/asj/sjy047
KEY POINTS
- Nearly 300,000 breast augmentation surgeries are performed annually, making this the second most common aesthetic procedure in US women (after liposuction).
- Today, silicone gel implants dominate the world market, and in the United States, approximately 60% of implants contain silicone gel filler.
- Capsular contracture is the most common complication of breast augmentation, typically presenting within the first postoperative year and with increasing risk over time. It occurs with both silicone and saline breast implants.
- Numerous studies have demonstrated the safety of silicone breast implants with regard to autoimmune disease incidence. However, the risk of associated anaplastic large-cell lymphoma must be discussed at every consultation, and confirmed cases should be reported to a national registry.
Heart failure guidelines: What you need to know about the 2017 focused update
In 2017, the American College of Cardiology (ACC), American Heart Association (AHA), and Heart Failure Society of America (HFSA) jointly released a focused update1 of the 2013 ACC/AHA guideline for managing heart failure.2 This is the second focused update of the 2013 guidelines; the first update,3 in 2016, covered 2 new drugs (sacubitril-valsartan and ivabradine) for chronic stage C heart failure with reduced ejection fraction (HFrEF).
Rather than focus on new medication classes, this second update provides recommendations regarding:
- Preventing the progression to left ventricular dysfunction or heart failure in patients at high risk (stage A) through screening with B-type natriuretic peptide (BNP) and aiming for more aggressive blood pressure control
- Inpatient biomarker use
- Medications in heart failure with preserved ejection fraction (HFpEF, or diastolic heart failure)
- Blood pressure targets in stage C heart failure
- Managing important comorbidities such as iron deficiency and sleep-disordered breathing to decrease morbidity, improve functional capacity, and enhance quality of life.
These guidelines and the data that underlie them are explored below. We also discuss potential applications to the management of hospitalization for acute decompensated heart failure (ADHF).
COMMON, COSTLY, AND DEBILITATING
Heart failure—defined by the ACC/AHA as the complex clinical syndrome that results from any structural or functional impairment of ventricular filling or ejection of blood—remains one of the most common, costly, and debilitating diseases in the United States.2 Based on National Health and Nutrition Examination Survey data from 2011 to 2014, an estimated 6.5 million US adults have it, with projections of more than 8 million by 2030.4,5 More than 960,000 new cases are thought to occur annually, with a lifetime risk of developing it of roughly 20% to 45%.6
Despite ever-growing familiarity and some significant strides in management, the death rate in this syndrome is substantial. After admissions for heart failure (which number 1 million per year), the mortality rate is roughly 10% at 1 year and 40% at 5 years.6 Also staggering are the associated costs, with $30.7 billion attributed to heart failure in 2012 and a projected $69.7 billion annually by 2030.5 Thus, we must direct efforts not only to treatment, but also to prevention.

Preventive efforts would target patients with ACC/AHA stage A heart failure—those at high risk for developing but currently without evidence of structural heart disease or heart failure symptoms (Table 1).7 This group may represent up to one-third of the US adult population, or 75 million people, when including the well-recognized risk factors of coronary artery disease, hypertension, diabetes mellitus, and chronic kidney disease in those without left ventricular dysfunction or heart failure.8
BIOMARKERS FOR PREVENTION
Past ACC/AHA heart failure guidelines2 have included recommendations on the use of biomarkers to aid in diagnosis and prognosis and, to a lesser degree, to guide treatment of heart failure. Largely based on 2 trials (see below), the 2017 guidelines go further, issuing a recommendation on the use of natriuretic peptide biomarkers in a screening strategy to prompt early intervention and prevent the progression to clinical heart failure in high-risk patients (stage A heart failure).
The PONTIAC trial
The NT-proBNP Selected Prevention of Cardiac Events in a Population of Diabetic Patients Without a History of Cardiac Disease (PONTIAC) trial9 randomized 300 outpatients with type 2 diabetes mellitus and an elevated N-terminal proBNP (NT-proBNP) level (> 125 pg/mL) to standard medical care vs standard care plus intensive up-titration of renin-angiotensin system antagonists and beta-blockers in a cardiac clinic over 2 years.
Earlier studies10 had shown NT-proBNP levels to have predictive value for cardiac events in diabetic patients, while the neurohormonal treatments were thought to have an established record of preventing primary and secondary cardiovascular events. In PONTIAC, a significant reduction was seen in the primary end point of hospitalization or death due to cardiac disease (hazard ratio [HR] 0.351, P = .044), as well as in the secondary end point of hospitalization due to heart failure (P < .05), in the aggressive-intervention group. These results laid the foundation for the larger St. Vincent’s Screening to Prevent Heart Failure (STOP-HF) trial.11
The STOP-HF trial
The STOP-HF trial randomized 1,235 outpatients who were at high risk but without left ventricular dysfunction or heart failure symptoms (stage A) to annual screening alone vs annual screening plus BNP testing, in which a BNP level higher than 50 pg/mL triggered echocardiography and evaluation by a cardiologist who would then assist with medications.11
Eligible patients were over age 40 and had 1 or more of the following risk factors:
- Diabetes mellitus
- Hypertension
- Hypercholesterolemia
- Obesity (body mass index > 30 kg/m2)
- Vascular disease (coronary, cerebral, or peripheral arterial disease)
- Arrhythmia requiring treatment
- Moderate to severe valvular disease.
After a mean follow-up of 4.3 years, the primary end point, ie, asymptomatic left ventricular dysfunction with or without newly diagnosed heart failure, was found in 9.7% of the control group and in only 5.9% of the intervention group with BNP screening, a 42% relative risk reduction (P = .013).
Similarly, the incidence of secondary end points of emergency hospitalization for a cardiovascular event (arrhythmia, transient ischemic attack, stroke, myocardial infarction, peripheral or pulmonary thrombosis or embolization, or heart failure) was also lower at 45.2 vs 24.4 per 1,000 patient-years, a 46% relative risk reduction.
An important difference in medications between the 2 groups was an increase in subsequently prescribed renin-angiotensin-aldosterone system therapy, mainly consisting of angiotensin II receptor blockers (ARBs), in those with elevated BNP in the intervention group. Notably, blood pressure was about the same in the 2 groups.11
Although these findings are encouraging, larger studies are needed, as the lack of blinding, low event rates, and small absolute risk reduction make the results difficult to generalize.
New or modified recommendations for screening

Employing this novel prevention strategy in the extremely large number of patients with stage A heart failure, thought to be up to one-third of the US adult population, may serve as a way to best direct and utilize limited medical resources.8
BIOMARKERS FOR PROGNOSIS OR ADDED RISK STRATIFICATION
The 2013 guidelines2 recognized that a significant body of work had accumulated showing that natriuretic peptide levels can predict outcomes in both chronic and acute heart failure. Thus, in both conditions, the guidelines contained separate class Ia recommendations to obtain a natriuretic peptide level, troponin level, or both to establish prognosis or disease severity.
The 2017 update1 underscores the importance of timing in measuring natriuretic peptide levels during admission for ADHF, with emphasis on obtaining them at admission and at discharge for acute and postdischarge prognosis. The completely new class IIa recommendation to obtain a predischarge natriuretic peptide level for postdischarge prognosis was based on a number of observational studies, some of which we explore below.
The ELAN-HF meta-analysis
The European Collaboration on Acute Decompensated Heart Failure (ELAN-HF)12 performed a meta-analysis to develop a discharge prognostication score for ADHF that included both absolute level and percent change in natriuretic peptide levels at the time of discharge.
Using data from 7 prospective cohorts totaling 1,301 patients, the authors found that incorporation of these values into a subsequently validated risk model led to significant improvements in the ability to predict the end points of all-cause mortality and the combined end point of all-cause mortality or first readmission for a cardiovascular reason within 180 days.
The OPTIMIZE-HF retrospective analysis
Data from the Organized Program to Initiate Lifesaving Treatment in Hospitalized Patients With Heart Failure (OPTIMIZE-HF) were retrospectively analyzed13 to determine whether postdischarge outcomes were best predicted by natriuretic peptide levels at admission or discharge or by the relative change in natriuretic peptide level. More than 7,000 patients age 65 or older, in 220 hospitals, were included, and Cox prediction models were compared using clinical variables alone or in combination with the natriuretic peptide levels.
The model that included the discharge natriuretic peptide level was found to be the most predictive, with a c-index of 0.693 for predicting mortality and a c-index of 0.606 for mortality or rehospitalization at 1 year.
New or modified recommendations on biomarkers for prognosis
The 2017 update1 modified the earlier recommendation to obtain a natriuretic peptide or troponin level or both at admission for ADHF to establish prognosis. This now has a class Ia recommendation, emphasizing that such levels be obtained on admission. In addition, a new class IIa recommendation is made to obtain a predischarge natriuretic peptide level for postdischarge prognosis. The former class Ia recommendation to obtain a natriuretic peptide level in chronic heart failure to establish prognosis or disease severity remains unchanged.
Also worth noting is what the 2017 update does not recommend in regard to obtaining biomarker levels. It emphasizes that many patients, particularly those with advanced (stage D) heart failure, have a poor prognosis that is well established with or without biomarker levels. Additionally, there are many cardiac and noncardiac causes of natriuretic peptide elevation; thus, clinical judgment remains paramount.
The 2017 update1 also cautions against setting targets of percent change in or absolute levels of natriuretic peptide at discharge despite observational and retrospective studies demonstrating better outcomes when levels are reduced, as treating for any specific target has never been studied in a large prospective study. Thus, doing so may result in unintended harm. Rather, clinical judgment and optimization of guideline-directed management and therapy are encouraged (Table 2).
PHARMACOLOGIC TREATMENT FOR STAGE C HFpEF
Although the 2013 guidelines2 contain many class I recommendations for various medications in chronic HFrEF, not a single such recommendation is found for chronic HFpEF. A review by Okwuosa et al7 covered HFrEF, including the most recent additions on which the 2016 update was based, sacubitril-valsartan and ivabradine. The 2016 update was similarly devoid of recommendations regarding specific medications in HFpEF, leaving only the 2013 class IIb recommendation to consider using an ARB to decrease hospitalizations in HFpEF.
Evidence behind this recommendation came from the Candesartan in Heart Failure Assessment of Reduction in Mortality and Morbidity program’s randomized controlled trial in 3,025 patients with New York Heart Association (NYHA) class II to IV heart failure and left ventricular ejection fraction over 40%, who were treated with candesartan or placebo.14 Over a median follow-up of 36.6 months, there was no significant difference in the primary composite outcome of cardiovascular death or admission for heart failure, but significantly fewer patients in the candesartan arm were admitted (230 vs 270, P = .017). Thus the recommendation.
Although this finding was encouraging, it was clear that no blockbuster drug for HFpEF had been identified. Considering that roughly half of all heart failure patients have preserved ejection fraction, the discovery of such a drug for HFpEF would be met with much excitement.15 Subsequently, other medication classes have been evaluated in the hope of benefit, allowing the 2017 update to provide specific recommendations for aldosterone antagonists, nitrates, and phosphodiesterase-5 inhibitors in HFpEF.
ALDOSTERONE ANTAGONISTS FOR HFpEF
Mineralocorticoid receptor antagonists had previously been shown to significantly reduce morbidity and mortality rates in patients with HFrEF.16 In addition to aldosterone’s effects on sodium retention and many other pathophysiologic mechanisms relating to heart failure, this hormone is also known to play a role in promoting myocardial fibrosis.17 Accordingly, some have wondered whether aldosterone antagonists could improve diastolic dysfunction, and perhaps outcomes, in HFpEF.
The Aldo-DHF trial
The Aldosterone Receptor Blockade in Diastolic Heart Failure (Aldo-DHF) trial investigated whether the aldosterone antagonist spironolactone would improve diastolic function or maximal exercise capacity in chronic HFpEF.18 It randomized 422 ambulatory patients with NYHA stage II or III heart failure, preserved left ventricular ejection fraction (≥ 50%), and echocardiographic evidence of diastolic dysfunction to receive spironolactone 25 mg daily or placebo.
Although no significant difference was seen in maximal exercise capacity, follow-up over 1 year nevertheless showed significant improvement in echocardiographic diastolic dysfunction (E/e') and perhaps reverse remodeling (decreased left ventricular mass index). These improvements spurred larger trials powered to detect whether clinical outcomes could also be improved.
The TOPCAT trial
The Treatment of Preserved Cardiac Function Heart Failure With an Aldosterone Antagonist (TOPCAT) trial19 was a large, multicenter, international, double-blind, placebo-controlled trial that investigated whether spironolactone could improve clinical outcomes in HFpEF. It randomized 3,445 patients with symptomatic heart failure and left ventricular ejection fraction of 45% or more to spironolactone 15 to 45 mg daily or placebo.
The effect on a composite primary outcome of death from cardiovascular cause, aborted cardiac arrest, or hospitalization for heart failure was evaluated over a mean follow-up of 3.3 years, with only a small (HR 0.89), nonclinically significant reduction evident. Those in the spironolactone group did have a significantly lower incidence of hospitalization for heart failure (12.0% vs 14.2%, P = .04).
Although the results were disappointing in this essentially negative trial, significant regional variations evident on post hoc analysis prompted further investigation and much controversy since the trial’s publication in 2014.
Participants came in roughly equal proportions from the Americas (United States, Canada, Brazil, and Argentina—51%) and from Russia and Georgia (49%), but outcomes between the two groups were markedly different. Concern was first raised when immediate review discovered a 4-fold lower rate of the primary outcome in the placebo groups from Russia and Georgia (8.4%), a rate in fact similar to that in patients without heart failure.19 This led to further exploration that identified other red flags that called into question the data integrity from the non-American sites.20
Not only did patients receiving spironolactone in Russia and Georgia not experience the reduction in clinical outcomes seen in their American counterparts, they also did not manifest the expected elevations in potassium and creatinine, and spironolactone metabolites were undetectable in almost one-third of patients.21
These findings prompted a post hoc analysis that included only the 51% (1,767 patients) of the study population coming from the Americas; in this subgroup, treatment with spironolactone was associated with a statistically significant 18% relative risk reduction in the primary composite outcome, a 26% reduction in cardiovascular mortality, and an 18% reduction in hospitalization for heart failure.20
New or modified recommendations on aldosterone receptor antagonists

Nitrates and phosphodiesterase-5 inhibitors
Earlier studies indicated that long-acting nitrates are prescribed in 15% to 50% of patients with HFpEF, perhaps based on extrapolation from studies in HFrEF suggesting that they might improve exercise intolerance.22 Some have speculated that the hemodynamic effects of nitrates, such as decreasing pulmonary congestion, might improve exercise intolerance in those with the stiff ventricles of HFpEF as well, prompting further study.
The NEAT-HFpEF trial
The Nitrate’s Effect on Activity Tolerance in Heart Failure With Preserved Ejection Fraction (NEAT-HFpEF) trial22 investigated whether extended-release isosorbide mononitrate would increase daily activity levels in patients with HFpEF. This double-blind, crossover study randomized 110 patients with HFpEF (ejection fraction ≥ 50%) and persistent dyspnea to escalating doses of isosorbide mononitrate or placebo over 6 weeks, then to the other arm for another 6 weeks. Daily activity levels during the 120-mg phase were measured with a continuously worn accelerometer.
No beneficial effect of nitrates was evident, with a nonsignificant trend towards decreased activity levels, a significant decrease in hours of activity per day (–0.30 hours, P = .02), and no change in the other secondary end points such as quality-of-life score, 6-minute walk distance, or natriuretic peptide level.
Suggested explanations for these negative findings include the possibility of rapid dose escalation leading to increased subtle side effects (headache, dizziness, fatigue) that, in turn, decreased activity. Additionally, given the imprecise diagnostic criteria for HFpEF, difficulties with patient selection may have led to inclusion of a large number of patients without elevated left-sided filling pressures.23
The RELAX trial
The Phosphodiesterase-5 Inhibition to Improve Clinical Status and Exercise Capacity in Heart Failure With Preserved Ejection Fraction (RELAX) trial24 investigated whether the phosphodiesterase-5 inhibitor sildenafil would improve exercise capacity in HFpEF. Improvements in both exercise capacity and clinical outcomes had already been seen in earlier trials in patients with pulmonary hypertension, as well as in those with HFrEF.25 A smaller study in HFpEF patients with pulmonary hypertension was also encouraging.26
Thus, it was disappointing that, after randomizing 216 outpatients with HFpEF to sildenafil or placebo for 24 weeks, no benefit was seen in the primary end point of change in peak oxygen consumption or in secondary end points of change in 6-minute walk distance or composite clinical score. Unlike in NEAT-HFpEF, patients here were required to have elevated natriuretic peptide levels or elevated invasively measured filling pressures.
The study authors speculated that pulmonary arterial hypertension and right ventricular systolic failure might need to be significant for patients with HFpEF to benefit from phosphodiesterase-5 inhibitors, with their known effects of dilation of pulmonary vasculature and increasing contractility of the right ventricle.24
New or modified recommendations on nitrates or phosphodiesterase-5 drugs
Given these disappointing results, the 2017 update provides a class III (no benefit) recommendation against the routine use of nitrates or phosphodiesterase-5 inhibitors to improve exercise tolerance or quality of life in HFpEF, citing them as ineffective (Table 3).1
IRON DEFICIENCY IN HEART FAILURE
Not only is iron deficiency present in roughly 50% of patients with symptomatic heart failure (stage C and D HFrEF),27 it is also associated with increased heart failure symptoms such as fatigue and exercise intolerance,28 reduced functional capacity, decreased quality of life, and increased mortality.
Notably, this association exists regardless of the hemoglobin level.29 In fact, even in those without heart failure or anemia, iron deficiency alone results in worsened aerobic performance, exercise intolerance, and increased fatigue.30 Conversely, improvement in symptoms, exercise tolerance, and cognition have been shown with repletion of iron stores in such patients.31
At the time of the 2013 guidelines, only a single large trial of intravenous iron in HFrEF and iron deficiency had been carried out (see below), and although the results were promising, it was felt that the evidence base on which to make recommendations was inadequate. Thus, recommendations were deferred until more data could be obtained.
Of note, in all the trials discussed below, iron deficiency was diagnosed in the setting of heart failure as ferritin less than 100 mg/mL (absolute iron deficiency) or as ferritin 100 to 300 mg/mL with transferrin saturation less than 20% (relative deficiency).32
The CONFIRM-HF trial
As in the Ferinject Assessment in Patients With Iron Deficiency and Chronic Heart Failure (FAIR-HF) trial,33 the subsequent Ferric Carboxymaltose Evaluation on Performance in Patients With Iron Deficiency in Combination With Chronic Heart Failure (CONFIRM-HF) trial34 involved the intravenous infusion of iron (ferric carboxymaltose) in outpatients with symptomatic HFrEF and iron deficiency. It showed that benefits remained evident with a more objective primary end point (change in 6-minute walk test distance at 24 weeks), and that such benefits were sustained, as seen in numerous secondary end points related to functional capacity at 52 weeks. Benefits in CONFIRM-HF were evident independently from anemia, specifically whether hemoglobin was under or over 12 g/dL.
Although these results were promising, it remained unclear whether such improvements could be obtained with a much easier to administer, more readily available, and less expensive oral iron formulation.
The IRONOUT-HF trial
The Iron Repletion Effects on Oxygen Uptake in Heart Failure (IRONOUT-HF) trial35 investigated whether oral, rather than intravenous, iron supplementation could improve peak exercise capacity in patients with HFrEF and iron deficiency. This double-blind, placebo-controlled trial randomized 225 patients with NYHA class II to IV HFrEF and iron deficiency to treatment with oral iron polysaccharide (150 mg twice daily) or placebo for 16 weeks.
Contrary to the supportive findings above, no significant change was seen in the primary end point of change in peak oxygen uptake or in any of the secondary end points (change in 6-minute walk, quality of life). Also, despite a 15-fold increase in the amount of iron administered in oral form compared with intravenously, little change was evident in the indices of iron stores over the course of the study, with only a 3% increase in transferrin saturation and an 11 ng/mL increase in ferritin. The intravenous trials resulted in a 4-fold greater increase in transferrin saturation and a 20-fold greater increase in ferritin.36
What keeps heart failure patients from absorbing oral iron? It is unclear why oral iron administration in HFrEF, such as in IRONOUT-HF, seems to be so ineffective, but hepcidin—a protein hormone made by the liver that shuts down intestinal iron absorption and iron release from macrophages—may play a central role.37 When iron stores are adequate, hepcidin is upregulated to prevent iron overload. However, hepcidin is also increased in inflammatory states, and chronic heart failure is often associated with inflammation.
With this in mind, the IRONOUT-HF investigators measured baseline hepcidin levels at the beginning and at the end of the 16 weeks and found that high baseline hepcidin levels predicted poorer response to oral iron. Other inflammatory mediators, such as interleukin 6, may also play a role.38,39 Unlike oral iron formulations such as iron polysaccharide, intravenous iron (ferric carboxymaltose) bypasses these regulatory mechanisms, which may partly explain its much more significant effect on the indices of iron stores and outcomes.
New or modified recommendations on iron
The 2017 update1 makes recommendations regarding iron deficiency and anemia in heart failure for the first time.
A class IIb recommendation states that it might be reasonable to treat NYHA class II and III heart failure patients with iron deficiency with intravenous iron to improve functional status and quality of life. A strong recommendation has been deferred until more is known about morbidity and mortality effects from adequately powered trials, some of which are under way and explored further below.
The 2017 update also withholds any recommendations regarding oral iron supplementation in heart failure, citing an uncertain evidence base. Certainly, the subsequent IRONOUT-HF trial does not lend enthusiasm for this approach.
Lastly, given the lack of benefit coupled with the increased risk of thromboembolic events evident in a trial of darbepoetin alfa vs placebo in non-iron deficiency-related anemia in HFrEF,40,41 the 2017 update provides a class III (no benefit) recommendation against using erythropoietin-stimulating agents in heart failure and anemia.
HYPERTENSION IN HEART FAILURE
The 2013 guidelines for the management of heart failure simply provided a class I recommendation to control hypertension and lipid disorders in accordance with contemporary guidelines to lower the risk of heart failure.1
SPRINT
The Systolic Blood Pressure Intervention Trial (SPRINT)42 sought to determine whether a lower systolic blood pressure target (120 vs 140 mm Hg) would reduce clinical events in patients at high risk for cardiovascular events but without diabetes mellitus. Patients at high risk were defined as over age 75, or with known vascular disease, chronic kidney disease, or a Framingham Risk Score higher than 15%. This multicenter, open-label controlled trial randomized 9,361 patients to intensive treatment (goal systolic blood pressure < 120 mm Hg) or standard treatment (goal systolic blood pressure < 140 mm Hg).
SPRINT was stopped early at a median follow-up of 3.26 years when a 25% relative risk reduction in the primary composite outcome of myocardial infarction, other acute coronary syndromes, stroke, heart failure, or death from cardiovascular causes became evident in the intensive-treatment group (1.65% vs 2.19% per year, HR 0.75, P < .0001).
All-cause mortality was also lower in the intensive-treatment group (HR 0.73, P = .003), while the incidence of serious adverse events (hypotension, syncope, electrolyte abnormalities, acute kidney injury, and noninjurious falls) was only slightly higher (38.3% vs 37.1%, P = .25). Most pertinent, a significant 38% relative risk reduction in heart failure and a 43% relative risk reduction in cardiovascular events were also evident.
Of note, blood pressure measurements were taken as the average of 3 measurements obtained by an automated cuff taken after the patient had been sitting quietly alone in a room for 5 minutes.
New or modified recommendations on hypertension in heart failure
Given the impressive 25% relative risk reduction in myocardial infarction, other acute coronary syndromes, stroke, heart failure, or death from cardiovascular causes in SPRINT,42 the 2017 update1 incorporated the intensive targets of SPRINT into its recommendations. However, to compensate for what are expected to be higher blood pressures obtained in real-world clinical practice as opposed to the near-perfect conditions used in SPRINT, a slightly higher blood pressure goal of less than 130/80 mm Hg was set.

Although not specifically included in SPRINT, given the lack of trial data on specific blood pressure targets in HFrEF and the decreased cardiovascular events noted above, a class I (level of evidence C, expert opinion) recommendation to target a goal systolic blood pressure less than 130 mm Hg in stage C HFrEF with hypertension is also given. Standard guideline-directed medications in the treatment of HFrEF are to be used (Table 4).
Similarly, a new class I (level of evidence C, expert opinion) recommendation is given for hypertension in HFpEF to target a systolic blood pressure of less than 130 mm Hg, with special mention to first manage any element of volume overload with diuretics. Other than avoiding nitrates (unless used for angina) and phosphodiesterase inhibitors, it is noted that few data exist to guide the choice of antihypertensive further, although perhaps renin-angiotensin-aldosterone system inhibition, especially aldosterone antagonists, may be considered. These recommendations are fully in line with the 2017 ACC/AHA high blood pressure clinical practice guidelines,43 ie, that renin-angiotensin-aldosterone system inhibition with an angiotensin-converting enzyme (ACE) inhibitor or ARB and especially mineralocorticoid receptor antagonists would be the preferred choice (Table 4).
SLEEP-DISORDERED BREATHING IN HEART FAILURE
Sleep-disordered breathing, either obstructive sleep apnea (OSA) or central sleep apnea, is quite commonly associated with symptomatic HFrEF.44 Whereas OSA is found in roughly 18% and central sleep apnea in 1% of the general population, sleep-disordered breathing is found in nearly 60% of patients with HFrEF, with some studies showing a nearly equal proportion of OSA and central sleep apnea.45 A similar prevalence is seen in HFpEF, although with a much higher proportion of OSA.46 Central sleep apnea tends to be a marker of more severe heart failure, as it is strongly associated with severe cardiac systolic dysfunction and worse functional capacity.47
Not surprisingly, the underlying mechanism of central sleep apnea is quite different from that of OSA. Whereas OSA predominantly occurs because of repeated obstruction of the pharynx due to nocturnal pharyngeal muscle relaxation, no such airway patency issues or strained breathing patterns exist in central sleep apnea. Central sleep apnea, which can manifest as Cheyne-Stokes respirations, is thought to occur due to an abnormal ventilatory control system with complex pathophysiology such as altered sensitivity of central chemoreceptors to carbon dioxide, interplay of pulmonary congestion, subsequent hyperventilation, and prolonged circulation times due to reduced cardiac output.48
What the two types of sleep-disordered breathing have in common is an association with negative health outcomes. Both appear to induce inflammation and sympathetic nervous system activity via oxidative stress from intermittent nocturnal hypoxemia and hypercapnea.49 OSA was already known to be associated with significant morbidity and mortality rates in the general population,50 and central sleep apnea had been identified as an independent predictor of mortality in HFrEF.51

At the time of the 2013 guidelines, only small or observational studies with limited results had been done evaluating treatment effects of continuous positive airway pressure therapy (CPAP) on OSA and central sleep apnea. Given the relative paucity of data, only a single class IIa recommendation stating that CPAP could be beneficial to increase left ventricular ejection fraction and functional status in concomitant sleep apnea and heart failure was given in 2013. However, many larger trials were under way,52–59 some with surprising results such as a significant increase in cardiovascular and all-cause mortality (Table 5).54
New or modified recommendations on sleep-disordered breathing

Given the common association with heart failure (60%)45 and the marked variation in response to treatment, including potential for harm with adaptive servo-ventilation and central sleep apnea, a class IIa recommendation is made stating that it is reasonable to obtain a formal sleep study in any patient with symptomatic (NYHA class II–IV) heart failure.1
Due to the potential for harm with adaptive servo-ventilation in patients with central sleep apnea and NYHA class II to IV HFrEF, a class III (harm) recommendation is made against its use.
Largely based on the results of the Sleep Apnea Cardiovascular Endpoints (SAVE) trial,56 a class IIb, level of evidence B-R (moderate, based on randomized trials) recommendation is given, stating that the use of CPAP in those with OSA and known cardiovascular disease may be reasonable to improve sleep quality and reduce daytime sleepiness.
POTENTIAL APPLICATIONS IN ACUTE DECOMPENSATED HEART FAILURE
Although the 2017 update1 is directed mostly toward managing chronic heart failure, it is worth considering how it might apply to the management of ADHF.
SHOULD WE USE BIOMARFER TARGETS TO GUIDE THERAPY IN ADHF?
The 2017 update1 does offer direct recommendations regarding the use of biomarker levels during admissions for ADHF. Mainly, they emphasize that the admission biomarker levels provide valuable information regarding acute prognosis and risk stratification (class I recommendation), while natriuretic peptide levels just before discharge provide the same for the postdischarge timeframe (class IIa recommendation).
The update also explicitly cautions against using a natriuretic peptide level-guided treatment strategy, such as setting targets for predischarge absolute level or percent change in level of natriuretic peptides during admissions for ADHF. Although observational and retrospective studies have shown better outcomes when levels are reduced at discharge, treating for any specific inpatient target has never been tested in any large, prospective study; thus, doing so could result in unintended harm.
So what do we know?
McQuade et al systematic review
McQuade et al57 performed a systematic review of more than 40 ADHF trials, which showed that, indeed, patients who achieved a target absolute natriuretic peptide level (BNP ≤ 250 pg/mL) or percent reduction (≥ 30%) at time of discharge had significantly improved outcomes such as reduced postdischarge all-cause mortality and rehospitalization rates. However, these were mostly prospective cohort studies that did not use any type of natriuretic peptide level-guided treatment protocol, leaving it unclear whether such a strategy could positively influence outcomes.
For this reason, both McQuade et al57 and, in an accompanying editorial, Felker et al58 called for properly designed, randomized controlled trials to investigate such a strategy. Felker noted that only 2 such phase II trials in ADHF have been completed,59,60 with unconvincing results.
PRIMA II
The Multicenter, Randomized Clinical Trial to Study the Impact of In-hospital Guidance for Acute Decompensated Heart Failure Treatment by a Predefined NT-ProBNP Target on the Reduction of Readmission and Mortality Rates (PRIMA II)60 randomized patients to natriuretic peptide level-guided treatment or standard care during admission for ADHF.
Many participants (60%) reached the predetermined target of 30% reduction in natriuretic peptide levels at the time of clinical stabilization and randomization; 405 patients were randomized. Patients in the natriuretic peptide level-guided treatment group underwent a prespecified treatment algorithm, with repeat natriuretic peptide levels measured again after the protocol.
Natriuretic peptide-guided therapy failed to show any significant benefit in any clinical outcomes, including the primary composite end point of mortality or heart failure readmissions at 180 days (36% vs 38%, HR 0.99, 95% confidence interval 0.72–1.36). Consistent with the review by McQuade et al,57 achieving the 30% reduction in natriuretic peptide at discharge, in either arm, was associated with a better prognosis, with significantly lower mortality and readmission rates at 180 days (HR 0.39 for rehospitalization or death, 95% confidence interval 0.27–0.55).
As in the observational studies, those who achieved the target natriuretic peptide level at the time of discharge had a better prognosis than those who did not, but neither study showed an improvement in clinical outcomes using a natriuretic peptide level-targeting treatment strategy.
No larger randomized controlled trial results are available for guided therapy in ADHF. However, additional insight may be gained from a subsequent trial61 that evaluated biomarker-guided titration of guideline-directed medical therapy in outpatients with chronic HFrEF.
The GUIDE-IT trial
That trial, the Guiding Evidence Based Therapy Using Biomarker Intensified Treatment in Heart Failure (GUIDE-IT)61 trial, was a large multicenter attempt to determine whether a natriuretic peptide-guided treatment strategy was more effective than standard care in the management of 894 high-risk outpatients with chronic HFrEF. Earlier, promising results had been obtained in a meta-analysis62 of more than 11 similar trials in 2,000 outpatients, with a decreased mortality rate (HR 0.62) seen in the biomarker-guided arm. However, the results had not been definitive due to being underpowered.62
Unfortunately, the results of GUIDE-IT were disappointing, with no significant difference in either the combined primary end point of mortality or hospitalization for heart failure, or the secondary end points evident at 15 months, prompting early termination for futility.61 Among other factors, the study authors postulated that this may have partly resulted from a patient population with more severe heart failure and resultant azotemia, limiting the ability to titrate neurohormonal medications to the desired dosage.
The question of whether patients who cannot achieve such biomarker targets need more intensive therapy or whether their heart failure is too severe to respond adequately echoes the question often raised in discussions of inpatient biomarker-guided therapy.58 Thus, only limited insight is gained, and it remains unclear whether a natriuretic peptide-guided treatment strategy can improve outpatient or inpatient outcomes. Until this is clarified, clinical judgment and optimization of guideline-directed management and therapy should remain the bedrock of treatment.
SHOULD ALDOSTERONE ANTAGONISTS BE USED IN ACUTE HFpEF?
Given the encouraging results in chronic HFpEF from post hoc analyses of TOPCAT, are there any additional recent data suggesting a role for aldosterone antagonists such as spironolactone in acute HFpEF?
The ATHENA-HF trial
The Aldosterone Targeted Neurohormonal Combined With Natriuresis Therapy in Heart Failure (ATHENA-HF) trial63 compared treatment with high-dose spironolactone (100 mg) for 96 hours vs usual care in 360 patients with ADHF. The patient population included those with HFrEF and HFpEF, and usual care included low-dose spironolactone (12.5–25 mg) in roughly 15% of patients. High-dose mineralocorticoid receptor antagonists have been shown to overcome diuretic resistance, improve pulmonary vascular congestion, and partially combat the adverse neurohormonal activation seen in ADHF.
Unfortunately, the trial was completely neutral in regard to the primary end point of reduction in natriuretic peptide levels as well as to the secondary end points of 30-day mortality rate, heart failure readmission, clinical congestion scores, urine output, and change in weight. No suggestion of additional benefit was seen in subgroup analysis of patients with acute HFpEF (ejection fraction > 45%), which yielded similar results.63
Given these lackluster findings, routine use of high-dose spironolactone in ADHF is not recommended.64 However, the treatment was well tolerated, without significant adverse effects of hyperkalemia or kidney injury, leaving the door open as to whether it may have utility in selected patients with diuretic resistance.
Should ARNIs and ivabradine be started during ADHF admissions?
The first half of the focused update3 of the 2013 guidelines,2 reviewed by Okwuosa et al,7 provided recommendations for the use of sacubitril-valsartan, an angiotensin-neprilysin inhibitor (ARNI), and ivabradine, a selective sinoatrial node If channel inhibitor, in chronic HFrEF.
Sacubitril-valsartan was given a class I recommendation for use in patients with NYHA class II or III chronic HFrEF who tolerate an ACE inhibitor or an ARB. This recommendation was given largely based on the benefits in mortality and heart failure hospitalizations seen in PARADIGM-HF (the Prospective Comparison of ARNI With ACEI to Determine Impact on Global Mortality and Morbidity in Heart Failure)65 compared with enalapril (HR 0.80, 95% CI 0.73–0.87, P < .001).
There is currently no recommendation on initiation or use of ARNIs during admissions for ADHF, but a recent trial may lend some insight.66
THE PIONEER-HF trial
The Comparison of Sacubitril/Valsartan vs Enalapril on Effect on NT-proBNP in Patients Stabilized From an Acute Heart Failure Episode (PIONEER-HF) trial66 randomized patients admitted for acute HFrEF, once stabilized, to sacubitril-valsartan or enalapril. Encouragingly, the percentage change of natriuretic peptide levels from the time of inpatient initiation to 4 and 8 weeks thereafter, the primary efficacy end point, was 46.7% with sacubitril-valsartan versus 25.3% with enalapril alone (ratio of change 0.71, 95% CI 0.63–0.81, P < .001). Although not powered for such, a prespecified analysis of a composite of clinical outcomes was also favorable for sacubitril-valsartan, largely driven by a 44% decreased rate of rehospitalization. More definitive, and quite reassuring, was that no significant difference was seen in the key safety outcomes of worsening renal function, hyperkalemia, symptomatic hypotension, and angioedema. These results were also applicable to the one-third of study participants who had no former diagnosis of heart failure, the one-third identifying as African American, and the one-third who had not been taking an ACE inhibitor or ARB. These results, taken together with the notion that at study completion the patients become similar to those included in PARADIGM-HF, have led some to assert that PIONEER-HF has the potential to change clinical practice.
Ivabradine was given a class IIa recommendation for use in patients with NYHA class II or III chronic HFrEF with a resting heart rate of at least 70 bpm, in sinus rhythm, despite being on optimal medical therapy including a beta-blocker at a maximum tolerated dose.
This recommendation was largely based on SHIFT (Systolic Heart Failure Treatment With the If Inhibitor Ivabradine Trial), which randomized patients to ivabradine or placebo to evaluate the effects of isolated lowering of the heart rate on the composite primary outcome of cardiovascular death or hospitalization. A significant reduction was seen in the ivabradine arm (HR 0.82, 95% CI 0.75–0.90, P < .0001), mainly driven by decreased hospitalizations.67
Subsequently, a small unblinded single-center study was undertaken to evaluate the efficacy and safety of initiating ivabradine during admissions for ADHF.68
THE ETHIC-AHF trial
The Effect of Early Treatment With Ivabradine Combined With Beta-Blockers vs Beta-Blockers Alone in Patients Hospitalized With Heart Failure and Reduced Left Ventricular Ejection Fraction (ETHIC-AHF) trial68 sought to determine the safety and effectiveness of early coadministration of ivabradine with beta-blockers in patients with acute HFrEF.
This single-center, unblinded study randomized 71 patients to ivabradine and beta-blockade or beta-blockade alone upon clinical stabilization (24–48 hours) after admission for acute decompensated HFrEF.
The primary end point was heart rate at 28 days, with the ivabradine group showing a statistically significant decrease (64 vs 70 bpm, P = .01), which persisted at 4 months. There was no significant difference in the secondary end points of adverse drug effects or the composite of clinical event outcomes (all-cause mortality, admission for heart failure or cardiovascular cause), but a number of surrogate end points including left ventricular ejection fraction, BNP level, and NYHA functional class at 4 months showed mild improvement.
Although this study provided evidence that the coadministration of ivabradine and a beta-blocker is safe and was positive in regard to clinical outcomes, the significant limitations due to its size and study design (single-center, unblinded, 4-month follow-up) simply serve to support the pursuit of larger studies with more stringent design and longer follow-up in order to determine the clinical efficacy.
The PRIME-HF trial
The Predischarge Initiation of Ivabradine in the Management of Heart Failure (PRIME-HF) trial69 is a randomized, open-label, multicenter trial comparing standard care vs the initiation of ivabradine before discharge, but after clinical stabilization, during admissions for ADHF in patients with chronic HFrEF (left ventricular ejection fraction ≤ 35%). At subsequent outpatient visits, the dosage can be modified in the ivabradine group, or ivabradine can be initiated at the provider’s discretion in the usual-care group.
PRIME-HF is attempting to determine whether initiating ivabradine before discharge will result in more patients taking ivabradine at 180 days, its primary end point, as well as in changes in secondary end points including heart rate and patient-centered outcomes. The study is active, with reporting expected in 2019.
As these trials all come to completion, it will not be long before we have further guidance regarding the inpatient initiation of these new and exciting therapeutic agents.
SHOULD INTRAVENOUS IRON BE GIVEN DURING ADHF ADMISSIONS?
Given the high prevalence of iron deficiency in symptomatic HFrEF, its independent association with mortality, improvements in quality of life and functional capacity suggested by repleting with intravenous iron (in FAIR-HF and CONFIRM-HF), the seeming inefficacy of oral iron in IRONOUT, and the logistical challenges of intravenous administration during standard clinic visits, could giving intravenous iron soon be incorporated into admissions for ADHF?
Caution has been advised for several reasons. As discussed above, larger randomized controlled trials powered to detect more definitive clinical end points such as death and the rate of hospitalization are still needed before a stronger recommendation can be made for intravenous iron in HFrEF. Also, without such data, it seems unwise to add the considerable economic burden of routinely assessing for iron deficiency and providing intravenous iron during ADHF admissions to the already staggering costs of heart failure.

The effects seen on morbidity and mortality that become evident in these trials over the next 5 years will help determine future guidelines and whether intravenous iron is routinely administered in bridge clinics, during inpatient admissions for ADHF, or not at all in patients with HFrEF and iron deficiency.
INTERNISTS ARE KEY
Heart failure remains one of the most common, morbid, complex, and costly diseases in the United States, and its prevalence is expected only to increase.4,5 The 2017 update1 of the 2013 guideline2 for the management of heart failure provides recommendations aimed not only at management of heart failure, but also at its comorbidities and, for the first time ever, at its prevention.
Internists provide care for the majority of heart failure patients, as well as for their comorbidities, and are most often the first to come into contact with patients at high risk of developing heart failure. Thus, a thorough understanding of these guidelines and how to apply them to the management of acute decompensated heart failure is of critical importance.
- Yancy CW, Jessup M, Bozkurt B, et al. 2017 ACC/AHA/HFSA focused update of the 2013 ACCF/AHA Guideline for the Management of Heart Failure: a report of the American College of Cardiology/American Heart Association Task Force on Clinical Practice Guidelines and the Heart Failure Society of America. J Am Coll Cardiol 2017; 70(6):776–803. doi:10.1016/j.jacc.2017.04.025
- Yancy CW, Jessup M, Bozkurt B, et al; American College of Cardiology Foundation/American Heart Association Task Force on Practice Guidelines. 2013 ACCF/AHA guideline for the management of heart failure: a report of the American College of Cardiology Foundation/American Heart Association Task Force on Practice Guidelines. Circulation 2013; 128(16):e240–e327. doi:10.1161/CIR.0b013e31829e8776
- Yancy CW, Jessup M, Bozkurt B, et al. 2016 ACC/AHA/HFSA focused update on new pharmacological therapy for heart failure: an update of the 2013 ACCF/AHA Guideline for the Management of Heart Failure: a report of the American College of Cardiology/American Heart Association Task Force on Clinical Practice Guidelines and the Heart Failure Society of America. Circulation 2016; 134(13):e282–e293. doi:10.1161/CIR.0000000000000435
- Benjamin EJ, Blaha MJ, Chiuve SE, et al; American Heart Association Statistics Committee and Stroke Statistics Subcommittee. Heart disease and stroke statistics—2017 update: a report from the American Heart Association. Circulation 2017; 135(10):e146–e603. doi:10.1161/CIR.0000000000000485
- Heidenreich PA, Albert NM, Allen LA, et al; American Heart Association Advocacy Coordinating Committee; Council on Arteriosclerosis, Thrombosis and Vascular Biology; Council on Cardiovascular Radiology and Intervention; Council on Clinical Cardiology; Council on Epidemiology and Prevention; Stroke Council. Forecasting the impact of heart failure in the United States: a policy statement from the American Heart Association. Circ Heart Fail 2013; 6(3):606–619. doi:10.1161/HHF.0b013e318291329a
- Huffman MD, Berry JD, Ning H, et al. Lifetime risk for heart failure among white and black Americans: cardiovascular lifetime risk pooling project. J Am Coll Cardiol 2013; 61(14):1510–1517. doi:10.1016/j.jacc.2013.01.022
- Okwuosa IS, Princewill O, Nwabueze C, et al. The ABCs of managing systolic heart failure: past, present, and future. Cleve Clin J Med 2016; 83(10):753–765. doi:10.3949/ccjm.83a.16006
- Kovell LC, Juraschek SP, Russell SD. Stage A heart failure is not adequately recognized in US adults: analysis of the National Health and Nutrition Examination Surveys, 2007–2010. PLoS One 2015; 10(7):e0132228. doi:10.1371/journal.pone.0132228
- Huelsmann M, Neuhold S, Resl M, et al. PONTIAC (NT-proBNP selected prevention of cardiac events in a population of diabetic patients without a history of cardiac disease): a prospective randomized controlled trial. J Am Coll Cardiol 2013; 62(15):1365–1372. doi:10.1016/j.jacc.2013.05.069
- Clodi M, Resl M, Neuhold S, et al. A comparison of NT-proBNP and albuminuria for predicting cardiac events in patients with diabetes mellitus. Eur J Prev Cardiol 2012; 19(5):944–951. doi:10.1177/1741826711420015
- Ledwidge M, Gallagher J, Conlon C, et al. Natriuretic peptide-based screening and collaborative care for heart failure: the STOP-HF randomized trial. JAMA 2013; 310(1):66–74. doi:10.1001/jama.2013.7588
- Salah K, Kok WE, Eurlings LW, et al. A novel discharge risk model for patients hospitalised for acute decompensated heart failure incorporating N-terminal pro-B-type natriuretic peptide levels: a European coLlaboration on Acute decompeNsated Heart Failure: ELAN-HF Score. Heart 2014; 100(2):115–125. doi:10.1136/heartjnl-2013-303632
- Kociol RD, Horton JR, Fonarow GC, et al. Admission, discharge, or change in B-type natriuretic peptide and long-term outcomes: data from Organized Program to Initiate Lifesaving Treatment in Hospitalized Patients with Heart Failure (OPTIMIZE-HF) linked to Medicare claims. Circ Heart Fail 2011; 4(5):628–636. doi:10.1161/CIRCHEARTFAILURE.111.962290
- Yusuf S, Pfeffer MA, Swedberg K, et al; CHARM Investigators and Committees. Effects of candesartan in patients with chronic heart failure and preserved left-ventricular ejection fraction: the CHARM-Preserved Trial. Lancet 2003; 362(9386):777–781. doi:10.1016/S0140-6736(03)14285-7
- Owan TE, Hodge DO, Herges RM, Jacobsen SJ, Roger VL, Redfield MM. Trends in prevalence and outcome of heart failure with preserved ejection fraction. N Engl J Med 2006; 355(3):251–259. doi:10.1056/NEJMoa052256
- Pitt B, Zannad F, Remme WJ, et al. The effect of spironolactone on morbidity and mortality in patients with severe heart failure. Randomized Aldactone Evaluation Study Investigators. N Engl J Med 1999; 341(10):709–717. doi:10.1056/NEJM199909023411001
- MacFadyen RJ, Barr CS, Struthers AD. Aldosterone blockade reduces vascular collagen turnover, improves heart rate variability and reduces early morning rise in heart rate in heart failure patients. Cardiovasc Res 1997; 35(1):30–34. pmid:9302344
- Edelmann F, Wachter R, Schmidt AG, et al; Aldo-DHF Investigators. Effect of spironolactone on diastolic function and exercise capacity in patients with heart failure with preserved ejection fraction: the Aldo-DHF randomized controlled trial. JAMA 2013; 309(8):781–791. doi:10.1001/jama.2013.905
- Pitt B, Pfeffer MA, Assmann SF, et al; TOPCAT Investigators. Spironolactone for heart failure with preserved ejection fraction. N Engl J Med 2014; 370(15):1383–1392. doi:10.1056/NEJMoa1313731
- Pfeffer MA, Claggett B, Assmann SF, et al. Regional variation in patients and outcomes in the Treatment of Preserved Cardiac Function Heart Failure With an Aldosterone Antagonist (TOPCAT) trial. Circulation 2015; 31(1):34–42. doi:10.1161/CIRCULATIONAHA.114.013255
- de Denus S, O’Meara E, Desai AS, et al. Spironolactone metabolites in TOPCAT—new insights into regional variation. N Engl J Med 2017; 376(17):1690–1692. doi:10.1056/NEJMc1612601
- Redfield MM, Anstrom KJ, Levine JA, et al; NHLBI Heart Failure Clinical Research Network. Isosorbide mononitrate in heart failure with preserved ejection fraction. N Engl J Med 2015; 373(24):2314–2324. doi:10.1056/NEJMoa1510774
- Walton-Shirley M. Succinct thoughts on NEAT-HFpEF: true, true, and unrelated? Medscape 2015. https://www.medscape.com/viewarticle/854116. Accessed January 17, 2019.
- Redfield MM, Chen HH, Borlaug BA, et al. Effect of phosphodiesterase-5 inhibition on exercise capacity and clinical status in heart failure with preserved ejection fraction: a randomized clinical trial. JAMA 2013; 309(12):1268–1277. doi:10.1001/jama.2013.2024
- Guazzi M, Vicenzi M, Arena R, Guazzi MD. PDE5 inhibition with sildenafil improves left ventricular diastolic function, cardiac geometry, and clinical status in patients with stable systolic heart failure: results of a 1-year, prospective, randomized, placebo controlled study. Circ Heart Fail 2011; 4(1):8–17. doi:10.1161/CIRCHEARTFAILURE.110.944694
- Guazzi M, Vicenzi M, Arena R, Guazzi MD. Pulmonary hypertension in heart failure with preserved ejection fraction: a target of phosphodiesterase-5 inhibition in a 1-year study. Circulation 2011; 124(2):164–174. doi:10.1161/CIRCULATIONAHA.110.983866
- Klip IT, Comin-Colet J, Voors AA, et al. Iron deficiency in chronic heart failure: an international pooled analysis. Am Heart J 2013; 165(4):575–582.e3. doi:10.1016/j.ahj.2013.01.017
- Jankowska EA, von Haehling S, Anker SD, Macdougall IC, Ponikowski P. Iron deficiency and heart failure: diagnostic dilemmas and therapeutic perspectives. Eur Heart J 2013; 34(11):816–829. doi:10.1093/eurheartj/ehs224
- Jankowska EA, Rozentryt P, Witkowska A, et al. Iron deficiency predicts impaired exercise capacity in patients with systolic chronic heart failure. J Card Fail 2011; 17(11):899–906. doi:10.1016/j.cardfail.2011.08.003
- Haas JD, Brownlie T 4th. Iron deficiency and reduced work capacity: a critical review of the research to determine a causal relationship. J Nutr 2001; 131(2S–2):676S-690S. doi:10.1093/jn/131.2.676S
- Davies KJ, Maguire JJ, Brooks GA, Dallman PR, Packer L. Muscle mitochondrial bioenergetics, oxygen supply, and work capacity during dietary iron deficiency and repletion. Am J Physiol 1982; 242(6):E418–E427. doi:10.1152/ajpendo.1982.242.6.E418
- Drozd M, Jankowska EA, Banasiak W, Ponikowski P. Iron therapy in patients with heart failure and iron deficiency: review of iron preparations for practitioners. Am J Cardiovasc Drugs 2017; 17(3):183–201. doi:10.1007/s40256-016-0211-2
- Anker SD, Comin Colet J, Filippatos G, et al; FAIR-HF Trial Investigators. Ferric carboxymaltose in patients with heart failure and iron deficiency. N Engl J Med 2009; 361(25):2436–2448. doi:10.1056/NEJMoa0908355
- Ponikowski P, van Veldhuisen DJ, Comin-Colet J, et al; CONFIRM-HF Investigators. Beneficial effects of long-term intravenous iron therapy with ferric carboxymaltose in patients with symptomatic heart failure and iron deficiency. Eur Heart J 2015; 36(11):657–668. doi:10.1093/eurheartj/ehu385
- Lewis GD, Malhotra R, Hernandez AF, et al; NHLBI Heart Failure Clinical Research Network. Effect of Oral Iron Repletion on Exercise Capacity in Patients With Heart Failure With Reduced Ejection Fraction and Iron Deficiency: The IRONOUT HF randomized clinical trial. JAMA 2017; 317(19):1958–1966. doi:10.1001/jama.2017.5427
- Wendling P. Iron supplementation in HF: trials support IV but not oral. Medscape 2016. https://www.medscape.com/viewarticle/872088. Accessed January 17, 2019.
- Ganz T. Hepcidin and iron regulation, 10 years later. Blood 2011; 117(17):4425–4433. doi:10.1182/blood-2011-01-258467
- Jankowska EA, Kasztura M, Sokolski M, et al. Iron deficiency defined as depleted iron stores accompanied by unmet cellular iron requirements identifies patients at the highest risk of death after an episode of acute heart failure. Eur Heart J 2014; 35(36):2468–2476. doi:10.1093/eurheartj/ehu235
- Jankowska EA, Malyszko J, Ardehali H, et al. Iron status in patients with chronic heart failure. Eur Heart J 2013; 34(11):827–834. doi:10.1093/eurheartj/ehs377
- Swedberg K, Young JB, Anand IS, et al. Treatment of anemia with darbepoetin alfa in systolic heart failure. N Engl J Med 2013; 368(13):1210–1219. doi:10.1056/NEJMoa1214865
- Ghali JK, Anand IS, Abraham WT, et al; Study of Anemia in Heart Failure Trial (STAMINA-HeFT) Group. Randomized double-blind trial of darbepoetin alfa in patients with symptomatic heart failure and anemia. Circulation 2008; 117(4):526–535. doi:10.1161/CIRCULATIONAHA.107.698514
- SPRINT Research Group; Wright JT Jr, Williamson JD, Whelton PK, et al. A randomized trial of intensive versus standard blood pressure control. N Engl J Med 2015; 373(22):2103–2116. doi:10.1056/NEJMoa1511939
- Whelton PK, Carey RM, Arnow WS, et al. 2017 ACC/AHA/AAPA/ABC/ACPM/AGS/APhA/ASH/ASPC/NMA/PCNA guideline for the prevention, detection, evaluation, and management of high blood pressure in adults: a report of the American College of Cardiology/American Heart Association Task Force on Clinical Practice Guidelines. J Am Coll Cardiol 2018; 71(19):e127–e248. doi:10.1016/j.jacc.2017.11.006
- Young T, Shahar E, Nieto FJ, et al; Sleep Heart Health Study Research Group. Predictors of sleep-disordered breathing in community dwelling adults: the Sleep Heart Health Study. Arch Intern Med 2002; 162(8):893–900. pmid:11966340
- MacDonald M, Fang J, Pittman SD, White DP, Malhotra A.The current prevalence of sleep disordered breathing in congestive heart failure patients treated with beta-blockers. J Clin Sleep Med 2008; 4(1):38-42. pmid:18350960
- Bitter T, Faber L, Hering D, Langer C, Horstkotte D, Oldenburg O. Sleep-disordered breathing in heart failure with normal left ventricular ejection fraction. Eur J Heart Fail 2009; 11(6):602–608. doi:10.1093/eurjhf/hfp057
- Sin DD, Fitzgerald F, Parker JD, Newton G, Floras JS, Bradley TD. Risk factors for central and obstructive sleep apnea in 450 men and women with congestive heart failure. Am J Respir Crit Care Med 1999; 160(4):1101–1106. doi:10.1164/ajrccm.160.4.9903020
- Ng AC, Freedman SB. Sleep disordered breathing in chronic heart failure. Heart Fail Rev 2009; 14(2):89–99. doi:10.1007/s10741-008-9096-8
- Kasai T, Bradley TD. Obstructive sleep apnea and heart failure: pathophysiologic and therapeutic implications. J Am Coll Cardiol 2011; 57(2):119–127. doi:10.1016/j.jacc.2010.08.627
- Marin JM, Carrizo SJ, Vicente E, Agusti AG. Long-term cardiovascular outcomes in men with obstructive sleep apnoea-hypopnoea with or without treatment with continuous positive airway pressure: an observational study. Lancet 2005; 365(9464):1046–1053. doi:10.1016/S0140-6736(05)71141-7
- Javaheri S, Shukla R, Zeigler H, Wexler L. Central sleep apnea, right ventricular dysfunction, and low diastolic blood pressure are predictors of mortality in systolic heart failure. J Am Coll Cardiol 2007; 49(20):2028–2034. doi:10.1016/j.jacc.2007.01.084
- Bradley TD, Logan AG, Kimoff RJ, et al; CANPAP Investigators. Continuous positive airway pressure for central sleep apnea and heart failure. N Engl J Med 2005; 353(19):2025–2033. doi:10.1056/NEJMoa051001
- Arzt M, Floras JS, Logan AG, et al; CANPAP Investigators. Suppression of central sleep apnea by continuous positive airway pressure and transplant-free survival in heart failure: a post hoc analysis of the Canadian Continuous Positive Airway Pressure for Patients with Central Sleep Apnea and Heart Failure Trial (CANPAP). Circulation 2007; 115(25):3173–3180. doi:10.1161/CIRCULATIONAHA.106.683482
- Cowie MR, Woehrle H, Wegscheider K, et al. Adaptive servo-ventilation for central sleep apnea in systolic heart failure. N Engl J Med 2015; 373(12):1095–1105. doi:10.1056/NEJMoa1506459
- O’Connor CM, Whellan DJ, Fiuzat M, et al. Cardiovascular outcomes with minute ventilation-targeted adaptive servo-ventilation therapy in heart failure: the CAT-HF Trial. J Am Coll Cardiol 2017; 69(12):1577–1587. doi:10.1016/j.jacc.2017.01.041
- McEvoy RD, Antic NA, Heeley E, et al; SAVE Investigators and Coordinators. CPAP for prevention of cardiovascular events in obstructive sleep apnea. N Engl J Med 2016; 375(10):919–931. doi:10.1056/NEJMoa1606599
- McQuade CN, Mizus M, Wald JW, Goldberg L, Jessup M, Umscheid CA. Brain-type natriuretic peptide and amino-terminal pro-brain-type natriuretic peptide discharge thresholds for acute decompensated heart failure: a systematic review. Ann Intern Med 2017; 166(3):180–190. doi:10.7326/M16-1468
- Felker GM, Whellan DJ. Inpatient management of heart failure: are we shooting at the right target? Ann Intern Med 2017; 166(3):223–224. doi:10.7326/M16-2667
- Carubelli V, Lombardi C, Lazzarini V, et al. N-terminal pro-B-type natriuretic peptide-guided therapy in patients hospitalized for acute heart failure. J Cardiovasc Med (Hagerstown) 2016; 17(11):828–839. doi:10.2459/JCM.0000000000000419
- Stienen S, Salah K, Moons AH, et al. Rationale and design of PRIMA II: a multicenter, randomized clinical trial to study the impact of in-hospital guidance for acute decompensated heart failure treatment by a predefined NT-PRoBNP target on the reduction of readmIssion and mortality rates. Am Heart J 2014; 168(1):30–36. doi:10.1016/j.ahj.2014.04.008
- Felker GM, Anstrom KJ, Adams KF, et al. Effect of natriuretic peptide-guided therapy on hospitalization or cardiovascular mortality in high-risk patients with heart failure and reduced ejection fraction: a randomized clinical trial. JAMA 2017; 318(8):713–720. doi:10.1001/jama.2017.10565
- Troughton RW, Frampton CM, Brunner-La Rocca HP, et al. Effect of B-type natriuretic peptide-guided treatment of chronic heart failure on total mortality and hospitalization: an individual patient meta-analysis. Eur Heart J 2014; 35(23):1559–1567. doi:10.1093/eurheartj/ehu090
- van Vliet AA, Donker AJ, Nauta JJ, Verheugt FW. Spironolactone in congestive heart failure refractory to high-dose loop diuretic and low-dose angiotensin-converting enzyme inhibitor. Am J Cardiol 1993; 71(3):21A–28A. pmid:8422000
- Butler J, Anstrom KJ, Felker GM, et al; National Heart Lung and Blood Institute Heart Failure Clinical Research Network. Efficacy and safety of spironolactone in acute heart failure. The ATHENA-HF randomized clinical trial. JAMA Cardiol 2017; 2(9):950–958. doi:10.1001/jamacardio.2017.2198
- McMurray JJ, Packer M, Desai AS, et al; PARADIGM-HF Investigators and Committees. Angiotensin-neprilysin inhibition versus enalapril in heart failure. N Engl J Med 2014; 371(11):993–1004. doi:10.1056/NEJMoa1409077
- ClinicalTrials.gov. ComParIson Of Sacubitril/valsartaN Versus Enalapril on Effect on NTpRo-BNP in patients stabilized from an acute Heart Failure episode (PIONEER-HF). https://clinicaltrials.gov/ct2/show/NCT02554890. Accessed January 17, 2019.
- Swedberg K, Komajda M, Böhm M, et al; SHIFT Investigators. Ivabradine and outcomes in chronic heart failure (SHIFT): a randomised placebo-controlled study. Lancet 2010; 376(9744):875–885. doi:10.1016/S0140-6736(10)61198-1
- Hidalgo FJ, Anguita M, Castillo JC, et al. Effect of early treatment with ivabradine combined with beta-blockers versus beta-blockers alone in patients hospitalised with heart failure and reduced left ventricular ejection fraction (ETHIC-AHF): a randomised study. Int J Cardiol 2016; 217:7–11. doi:10.1016/j.ijcard.2016.04.136
- ClinicalTrials.gov. Predischarge Initiation of Ivabradine in the Management of Heart Failure (PRIME-HF). https://clinicaltrials.gov/ct2/show/NCT02827500. Accessed January 17, 2019.
- Anker SD, Kirwan BA, van Veldhuisen DJ, et al. Effects of ferric carboxymaltose on hospitalisations and mortality rates in iron-deficient heart failure patients: an individual patient data meta-analysis. Eur J Heart Fail 2018; 20(1):125–133. doi:10.1002/ejhf.823
- ClinicalTrials.gov. Intravenous Iron in Patients With Systolic Heart Failure and Iron Deficiency to Improve Morbidity and Mortality (FAIR-HF2). https://clinicaltrials.gov/ct2/show/NCT03036462. Accessed January 17, 2019.
- ClinicalTrials.gov. Study to Compare Ferric Carboxymaltose With Placebo in Patients With Acute Heart Failure and Iron Deficiency (AFFIRM-AHF). https://clinicaltrials.gov/ct2/show/record/NCT02937454. Accessed January 17, 2019.
- ClinicalTrials.gov. Randomized Placebo-controlled Trial of Ferric Carboxymaltose as Treatment for Heart Failure With Iron Deficiency (HEART-FID). https://clinicaltrials.gov/ct2/show/NCT03037931. Accessed January 17, 2019.
- ClinicalTrials.gov. Intravenous Iron Treatment in Patients With Heart Failure and Iron Deficiency (IRONMAN). https://clinicaltrials.gov/ct2/show/NCT02642562. Accessed January 17, 2019.
In 2017, the American College of Cardiology (ACC), American Heart Association (AHA), and Heart Failure Society of America (HFSA) jointly released a focused update1 of the 2013 ACC/AHA guideline for managing heart failure.2 This is the second focused update of the 2013 guidelines; the first update,3 in 2016, covered 2 new drugs (sacubitril-valsartan and ivabradine) for chronic stage C heart failure with reduced ejection fraction (HFrEF).
Rather than focus on new medication classes, this second update provides recommendations regarding:
- Preventing the progression to left ventricular dysfunction or heart failure in patients at high risk (stage A) through screening with B-type natriuretic peptide (BNP) and aiming for more aggressive blood pressure control
- Inpatient biomarker use
- Medications in heart failure with preserved ejection fraction (HFpEF, or diastolic heart failure)
- Blood pressure targets in stage C heart failure
- Managing important comorbidities such as iron deficiency and sleep-disordered breathing to decrease morbidity, improve functional capacity, and enhance quality of life.
These guidelines and the data that underlie them are explored below. We also discuss potential applications to the management of hospitalization for acute decompensated heart failure (ADHF).
COMMON, COSTLY, AND DEBILITATING
Heart failure—defined by the ACC/AHA as the complex clinical syndrome that results from any structural or functional impairment of ventricular filling or ejection of blood—remains one of the most common, costly, and debilitating diseases in the United States.2 Based on National Health and Nutrition Examination Survey data from 2011 to 2014, an estimated 6.5 million US adults have it, with projections of more than 8 million by 2030.4,5 More than 960,000 new cases are thought to occur annually, with a lifetime risk of developing it of roughly 20% to 45%.6
Despite ever-growing familiarity and some significant strides in management, the death rate in this syndrome is substantial. After admissions for heart failure (which number 1 million per year), the mortality rate is roughly 10% at 1 year and 40% at 5 years.6 Also staggering are the associated costs, with $30.7 billion attributed to heart failure in 2012 and a projected $69.7 billion annually by 2030.5 Thus, we must direct efforts not only to treatment, but also to prevention.
Preventive efforts would target patients with ACC/AHA stage A heart failure—those at high risk for developing but currently without evidence of structural heart disease or heart failure symptoms (Table 1).7 This group may represent up to one-third of the US adult population, or 75 million people, when including the well-recognized risk factors of coronary artery disease, hypertension, diabetes mellitus, and chronic kidney disease in those without left ventricular dysfunction or heart failure.8
BIOMARKERS FOR PREVENTION
Past ACC/AHA heart failure guidelines2 have included recommendations on the use of biomarkers to aid in diagnosis and prognosis and, to a lesser degree, to guide treatment of heart failure. Largely based on 2 trials (see below), the 2017 guidelines go further, issuing a recommendation on the use of natriuretic peptide biomarkers in a screening strategy to prompt early intervention and prevent the progression to clinical heart failure in high-risk patients (stage A heart failure).
The PONTIAC trial
The NT-proBNP Selected Prevention of Cardiac Events in a Population of Diabetic Patients Without a History of Cardiac Disease (PONTIAC) trial9 randomized 300 outpatients with type 2 diabetes mellitus and an elevated N-terminal proBNP (NT-proBNP) level (> 125 pg/mL) to standard medical care vs standard care plus intensive up-titration of renin-angiotensin system antagonists and beta-blockers in a cardiac clinic over 2 years.
Earlier studies10 had shown NT-proBNP levels to have predictive value for cardiac events in diabetic patients, while the neurohormonal treatments were thought to have an established record of preventing primary and secondary cardiovascular events. In PONTIAC, a significant reduction was seen in the primary end point of hospitalization or death due to cardiac disease (hazard ratio [HR] 0.351, P = .044), as well as in the secondary end point of hospitalization due to heart failure (P < .05), in the aggressive-intervention group. These results laid the foundation for the larger St. Vincent’s Screening to Prevent Heart Failure (STOP-HF) trial.11
The STOP-HF trial
The STOP-HF trial randomized 1,235 outpatients who were at high risk but without left ventricular dysfunction or heart failure symptoms (stage A) to annual screening alone vs annual screening plus BNP testing, in which a BNP level higher than 50 pg/mL triggered echocardiography and evaluation by a cardiologist who would then assist with medications.11
Eligible patients were over age 40 and had 1 or more of the following risk factors:
- Diabetes mellitus
- Hypertension
- Hypercholesterolemia
- Obesity (body mass index > 30 kg/m2)
- Vascular disease (coronary, cerebral, or peripheral arterial disease)
- Arrhythmia requiring treatment
- Moderate to severe valvular disease.
After a mean follow-up of 4.3 years, the primary end point, ie, asymptomatic left ventricular dysfunction with or without newly diagnosed heart failure, was found in 9.7% of the control group and in only 5.9% of the intervention group with BNP screening, a 42% relative risk reduction (P = .013).
Similarly, the incidence of secondary end points of emergency hospitalization for a cardiovascular event (arrhythmia, transient ischemic attack, stroke, myocardial infarction, peripheral or pulmonary thrombosis or embolization, or heart failure) was also lower at 45.2 vs 24.4 per 1,000 patient-years, a 46% relative risk reduction.
An important difference in medications between the 2 groups was an increase in subsequently prescribed renin-angiotensin-aldosterone system therapy, mainly consisting of angiotensin II receptor blockers (ARBs), in those with elevated BNP in the intervention group. Notably, blood pressure was about the same in the 2 groups.11
Although these findings are encouraging, larger studies are needed, as the lack of blinding, low event rates, and small absolute risk reduction make the results difficult to generalize.
New or modified recommendations for screening
Employing this novel prevention strategy in the extremely large number of patients with stage A heart failure, thought to be up to one-third of the US adult population, may serve as a way to best direct and utilize limited medical resources.8
BIOMARKERS FOR PROGNOSIS OR ADDED RISK STRATIFICATION
The 2013 guidelines2 recognized that a significant body of work had accumulated showing that natriuretic peptide levels can predict outcomes in both chronic and acute heart failure. Thus, in both conditions, the guidelines contained separate class Ia recommendations to obtain a natriuretic peptide level, troponin level, or both to establish prognosis or disease severity.
The 2017 update1 underscores the importance of timing in measuring natriuretic peptide levels during admission for ADHF, with emphasis on obtaining them at admission and at discharge for acute and postdischarge prognosis. The completely new class IIa recommendation to obtain a predischarge natriuretic peptide level for postdischarge prognosis was based on a number of observational studies, some of which we explore below.
The ELAN-HF meta-analysis
The European Collaboration on Acute Decompensated Heart Failure (ELAN-HF)12 performed a meta-analysis to develop a discharge prognostication score for ADHF that included both absolute level and percent change in natriuretic peptide levels at the time of discharge.
Using data from 7 prospective cohorts totaling 1,301 patients, the authors found that incorporation of these values into a subsequently validated risk model led to significant improvements in the ability to predict the end points of all-cause mortality and the combined end point of all-cause mortality or first readmission for a cardiovascular reason within 180 days.
The OPTIMIZE-HF retrospective analysis
Data from the Organized Program to Initiate Lifesaving Treatment in Hospitalized Patients With Heart Failure (OPTIMIZE-HF) were retrospectively analyzed13 to determine whether postdischarge outcomes were best predicted by natriuretic peptide levels at admission or discharge or by the relative change in natriuretic peptide level. More than 7,000 patients age 65 or older, in 220 hospitals, were included, and Cox prediction models were compared using clinical variables alone or in combination with the natriuretic peptide levels.
The model that included the discharge natriuretic peptide level was found to be the most predictive, with a c-index of 0.693 for predicting mortality and a c-index of 0.606 for mortality or rehospitalization at 1 year.
New or modified recommendations on biomarkers for prognosis
The 2017 update1 modified the earlier recommendation to obtain a natriuretic peptide or troponin level or both at admission for ADHF to establish prognosis. This now has a class Ia recommendation, emphasizing that such levels be obtained on admission. In addition, a new class IIa recommendation is made to obtain a predischarge natriuretic peptide level for postdischarge prognosis. The former class Ia recommendation to obtain a natriuretic peptide level in chronic heart failure to establish prognosis or disease severity remains unchanged.
Also worth noting is what the 2017 update does not recommend in regard to obtaining biomarker levels. It emphasizes that many patients, particularly those with advanced (stage D) heart failure, have a poor prognosis that is well established with or without biomarker levels. Additionally, there are many cardiac and noncardiac causes of natriuretic peptide elevation; thus, clinical judgment remains paramount.
The 2017 update1 also cautions against setting targets of percent change in or absolute levels of natriuretic peptide at discharge despite observational and retrospective studies demonstrating better outcomes when levels are reduced, as treating for any specific target has never been studied in a large prospective study. Thus, doing so may result in unintended harm. Rather, clinical judgment and optimization of guideline-directed management and therapy are encouraged (Table 2).
PHARMACOLOGIC TREATMENT FOR STAGE C HFpEF
Although the 2013 guidelines2 contain many class I recommendations for various medications in chronic HFrEF, not a single such recommendation is found for chronic HFpEF. A review by Okwuosa et al7 covered HFrEF, including the most recent additions on which the 2016 update was based, sacubitril-valsartan and ivabradine. The 2016 update was similarly devoid of recommendations regarding specific medications in HFpEF, leaving only the 2013 class IIb recommendation to consider using an ARB to decrease hospitalizations in HFpEF.
Evidence behind this recommendation came from the Candesartan in Heart Failure Assessment of Reduction in Mortality and Morbidity program’s randomized controlled trial in 3,025 patients with New York Heart Association (NYHA) class II to IV heart failure and left ventricular ejection fraction over 40%, who were treated with candesartan or placebo.14 Over a median follow-up of 36.6 months, there was no significant difference in the primary composite outcome of cardiovascular death or admission for heart failure, but significantly fewer patients in the candesartan arm were admitted (230 vs 270, P = .017). Thus the recommendation.
Although this finding was encouraging, it was clear that no blockbuster drug for HFpEF had been identified. Considering that roughly half of all heart failure patients have preserved ejection fraction, the discovery of such a drug for HFpEF would be met with much excitement.15 Subsequently, other medication classes have been evaluated in the hope of benefit, allowing the 2017 update to provide specific recommendations for aldosterone antagonists, nitrates, and phosphodiesterase-5 inhibitors in HFpEF.
ALDOSTERONE ANTAGONISTS FOR HFpEF
Mineralocorticoid receptor antagonists had previously been shown to significantly reduce morbidity and mortality rates in patients with HFrEF.16 In addition to aldosterone’s effects on sodium retention and many other pathophysiologic mechanisms relating to heart failure, this hormone is also known to play a role in promoting myocardial fibrosis.17 Accordingly, some have wondered whether aldosterone antagonists could improve diastolic dysfunction, and perhaps outcomes, in HFpEF.
The Aldo-DHF trial
The Aldosterone Receptor Blockade in Diastolic Heart Failure (Aldo-DHF) trial investigated whether the aldosterone antagonist spironolactone would improve diastolic function or maximal exercise capacity in chronic HFpEF.18 It randomized 422 ambulatory patients with NYHA stage II or III heart failure, preserved left ventricular ejection fraction (≥ 50%), and echocardiographic evidence of diastolic dysfunction to receive spironolactone 25 mg daily or placebo.
Although no significant difference was seen in maximal exercise capacity, follow-up over 1 year nevertheless showed significant improvement in echocardiographic diastolic dysfunction (E/e') and perhaps reverse remodeling (decreased left ventricular mass index). These improvements spurred larger trials powered to detect whether clinical outcomes could also be improved.
The TOPCAT trial
The Treatment of Preserved Cardiac Function Heart Failure With an Aldosterone Antagonist (TOPCAT) trial19 was a large, multicenter, international, double-blind, placebo-controlled trial that investigated whether spironolactone could improve clinical outcomes in HFpEF. It randomized 3,445 patients with symptomatic heart failure and left ventricular ejection fraction of 45% or more to spironolactone 15 to 45 mg daily or placebo.
The effect on a composite primary outcome of death from cardiovascular cause, aborted cardiac arrest, or hospitalization for heart failure was evaluated over a mean follow-up of 3.3 years, with only a small (HR 0.89), nonclinically significant reduction evident. Those in the spironolactone group did have a significantly lower incidence of hospitalization for heart failure (12.0% vs 14.2%, P = .04).
Although the results were disappointing in this essentially negative trial, significant regional variations evident on post hoc analysis prompted further investigation and much controversy since the trial’s publication in 2014.
Participants came in roughly equal proportions from the Americas (United States, Canada, Brazil, and Argentina—51%) and from Russia and Georgia (49%), but outcomes between the two groups were markedly different. Concern was first raised when immediate review discovered a 4-fold lower rate of the primary outcome in the placebo groups from Russia and Georgia (8.4%), a rate in fact similar to that in patients without heart failure.19 This led to further exploration that identified other red flags that called into question the data integrity from the non-American sites.20
Not only did patients receiving spironolactone in Russia and Georgia not experience the reduction in clinical outcomes seen in their American counterparts, they also did not manifest the expected elevations in potassium and creatinine, and spironolactone metabolites were undetectable in almost one-third of patients.21
These findings prompted a post hoc analysis that included only the 51% (1,767 patients) of the study population coming from the Americas; in this subgroup, treatment with spironolactone was associated with a statistically significant 18% relative risk reduction in the primary composite outcome, a 26% reduction in cardiovascular mortality, and an 18% reduction in hospitalization for heart failure.20
New or modified recommendations on aldosterone receptor antagonists
Nitrates and phosphodiesterase-5 inhibitors
Earlier studies indicated that long-acting nitrates are prescribed in 15% to 50% of patients with HFpEF, perhaps based on extrapolation from studies in HFrEF suggesting that they might improve exercise intolerance.22 Some have speculated that the hemodynamic effects of nitrates, such as decreasing pulmonary congestion, might improve exercise intolerance in those with the stiff ventricles of HFpEF as well, prompting further study.
The NEAT-HFpEF trial
The Nitrate’s Effect on Activity Tolerance in Heart Failure With Preserved Ejection Fraction (NEAT-HFpEF) trial22 investigated whether extended-release isosorbide mononitrate would increase daily activity levels in patients with HFpEF. This double-blind, crossover study randomized 110 patients with HFpEF (ejection fraction ≥ 50%) and persistent dyspnea to escalating doses of isosorbide mononitrate or placebo over 6 weeks, then to the other arm for another 6 weeks. Daily activity levels during the 120-mg phase were measured with a continuously worn accelerometer.
No beneficial effect of nitrates was evident, with a nonsignificant trend towards decreased activity levels, a significant decrease in hours of activity per day (–0.30 hours, P = .02), and no change in the other secondary end points such as quality-of-life score, 6-minute walk distance, or natriuretic peptide level.
Suggested explanations for these negative findings include the possibility of rapid dose escalation leading to increased subtle side effects (headache, dizziness, fatigue) that, in turn, decreased activity. Additionally, given the imprecise diagnostic criteria for HFpEF, difficulties with patient selection may have led to inclusion of a large number of patients without elevated left-sided filling pressures.23
The RELAX trial
The Phosphodiesterase-5 Inhibition to Improve Clinical Status and Exercise Capacity in Heart Failure With Preserved Ejection Fraction (RELAX) trial24 investigated whether the phosphodiesterase-5 inhibitor sildenafil would improve exercise capacity in HFpEF. Improvements in both exercise capacity and clinical outcomes had already been seen in earlier trials in patients with pulmonary hypertension, as well as in those with HFrEF.25 A smaller study in HFpEF patients with pulmonary hypertension was also encouraging.26
Thus, it was disappointing that, after randomizing 216 outpatients with HFpEF to sildenafil or placebo for 24 weeks, no benefit was seen in the primary end point of change in peak oxygen consumption or in secondary end points of change in 6-minute walk distance or composite clinical score. Unlike in NEAT-HFpEF, patients here were required to have elevated natriuretic peptide levels or elevated invasively measured filling pressures.
The study authors speculated that pulmonary arterial hypertension and right ventricular systolic failure might need to be significant for patients with HFpEF to benefit from phosphodiesterase-5 inhibitors, with their known effects of dilation of pulmonary vasculature and increasing contractility of the right ventricle.24
New or modified recommendations on nitrates or phosphodiesterase-5 drugs
Given these disappointing results, the 2017 update provides a class III (no benefit) recommendation against the routine use of nitrates or phosphodiesterase-5 inhibitors to improve exercise tolerance or quality of life in HFpEF, citing them as ineffective (Table 3).1
IRON DEFICIENCY IN HEART FAILURE
Not only is iron deficiency present in roughly 50% of patients with symptomatic heart failure (stage C and D HFrEF),27 it is also associated with increased heart failure symptoms such as fatigue and exercise intolerance,28 reduced functional capacity, decreased quality of life, and increased mortality.
Notably, this association exists regardless of the hemoglobin level.29 In fact, even in those without heart failure or anemia, iron deficiency alone results in worsened aerobic performance, exercise intolerance, and increased fatigue.30 Conversely, improvement in symptoms, exercise tolerance, and cognition have been shown with repletion of iron stores in such patients.31
At the time of the 2013 guidelines, only a single large trial of intravenous iron in HFrEF and iron deficiency had been carried out (see below), and although the results were promising, it was felt that the evidence base on which to make recommendations was inadequate. Thus, recommendations were deferred until more data could be obtained.
Of note, in all the trials discussed below, iron deficiency was diagnosed in the setting of heart failure as ferritin less than 100 mg/mL (absolute iron deficiency) or as ferritin 100 to 300 mg/mL with transferrin saturation less than 20% (relative deficiency).32
The CONFIRM-HF trial
As in the Ferinject Assessment in Patients With Iron Deficiency and Chronic Heart Failure (FAIR-HF) trial,33 the subsequent Ferric Carboxymaltose Evaluation on Performance in Patients With Iron Deficiency in Combination With Chronic Heart Failure (CONFIRM-HF) trial34 involved the intravenous infusion of iron (ferric carboxymaltose) in outpatients with symptomatic HFrEF and iron deficiency. It showed that benefits remained evident with a more objective primary end point (change in 6-minute walk test distance at 24 weeks), and that such benefits were sustained, as seen in numerous secondary end points related to functional capacity at 52 weeks. Benefits in CONFIRM-HF were evident independently from anemia, specifically whether hemoglobin was under or over 12 g/dL.
Although these results were promising, it remained unclear whether such improvements could be obtained with a much easier to administer, more readily available, and less expensive oral iron formulation.
The IRONOUT-HF trial
The Iron Repletion Effects on Oxygen Uptake in Heart Failure (IRONOUT-HF) trial35 investigated whether oral, rather than intravenous, iron supplementation could improve peak exercise capacity in patients with HFrEF and iron deficiency. This double-blind, placebo-controlled trial randomized 225 patients with NYHA class II to IV HFrEF and iron deficiency to treatment with oral iron polysaccharide (150 mg twice daily) or placebo for 16 weeks.
Contrary to the supportive findings above, no significant change was seen in the primary end point of change in peak oxygen uptake or in any of the secondary end points (change in 6-minute walk, quality of life). Also, despite a 15-fold increase in the amount of iron administered in oral form compared with intravenously, little change was evident in the indices of iron stores over the course of the study, with only a 3% increase in transferrin saturation and an 11 ng/mL increase in ferritin. The intravenous trials resulted in a 4-fold greater increase in transferrin saturation and a 20-fold greater increase in ferritin.36
What keeps heart failure patients from absorbing oral iron? It is unclear why oral iron administration in HFrEF, such as in IRONOUT-HF, seems to be so ineffective, but hepcidin—a protein hormone made by the liver that shuts down intestinal iron absorption and iron release from macrophages—may play a central role.37 When iron stores are adequate, hepcidin is upregulated to prevent iron overload. However, hepcidin is also increased in inflammatory states, and chronic heart failure is often associated with inflammation.
With this in mind, the IRONOUT-HF investigators measured baseline hepcidin levels at the beginning and at the end of the 16 weeks and found that high baseline hepcidin levels predicted poorer response to oral iron. Other inflammatory mediators, such as interleukin 6, may also play a role.38,39 Unlike oral iron formulations such as iron polysaccharide, intravenous iron (ferric carboxymaltose) bypasses these regulatory mechanisms, which may partly explain its much more significant effect on the indices of iron stores and outcomes.
New or modified recommendations on iron
The 2017 update1 makes recommendations regarding iron deficiency and anemia in heart failure for the first time.
A class IIb recommendation states that it might be reasonable to treat NYHA class II and III heart failure patients with iron deficiency with intravenous iron to improve functional status and quality of life. A strong recommendation has been deferred until more is known about morbidity and mortality effects from adequately powered trials, some of which are under way and explored further below.
The 2017 update also withholds any recommendations regarding oral iron supplementation in heart failure, citing an uncertain evidence base. Certainly, the subsequent IRONOUT-HF trial does not lend enthusiasm for this approach.
Lastly, given the lack of benefit coupled with the increased risk of thromboembolic events evident in a trial of darbepoetin alfa vs placebo in non-iron deficiency-related anemia in HFrEF,40,41 the 2017 update provides a class III (no benefit) recommendation against using erythropoietin-stimulating agents in heart failure and anemia.
HYPERTENSION IN HEART FAILURE
The 2013 guidelines for the management of heart failure simply provided a class I recommendation to control hypertension and lipid disorders in accordance with contemporary guidelines to lower the risk of heart failure.1
SPRINT
The Systolic Blood Pressure Intervention Trial (SPRINT)42 sought to determine whether a lower systolic blood pressure target (120 vs 140 mm Hg) would reduce clinical events in patients at high risk for cardiovascular events but without diabetes mellitus. Patients at high risk were defined as over age 75, or with known vascular disease, chronic kidney disease, or a Framingham Risk Score higher than 15%. This multicenter, open-label controlled trial randomized 9,361 patients to intensive treatment (goal systolic blood pressure < 120 mm Hg) or standard treatment (goal systolic blood pressure < 140 mm Hg).
SPRINT was stopped early at a median follow-up of 3.26 years when a 25% relative risk reduction in the primary composite outcome of myocardial infarction, other acute coronary syndromes, stroke, heart failure, or death from cardiovascular causes became evident in the intensive-treatment group (1.65% vs 2.19% per year, HR 0.75, P < .0001).
All-cause mortality was also lower in the intensive-treatment group (HR 0.73, P = .003), while the incidence of serious adverse events (hypotension, syncope, electrolyte abnormalities, acute kidney injury, and noninjurious falls) was only slightly higher (38.3% vs 37.1%, P = .25). Most pertinent, a significant 38% relative risk reduction in heart failure and a 43% relative risk reduction in cardiovascular events were also evident.
Of note, blood pressure measurements were taken as the average of 3 measurements obtained by an automated cuff taken after the patient had been sitting quietly alone in a room for 5 minutes.
New or modified recommendations on hypertension in heart failure
Given the impressive 25% relative risk reduction in myocardial infarction, other acute coronary syndromes, stroke, heart failure, or death from cardiovascular causes in SPRINT,42 the 2017 update1 incorporated the intensive targets of SPRINT into its recommendations. However, to compensate for what are expected to be higher blood pressures obtained in real-world clinical practice as opposed to the near-perfect conditions used in SPRINT, a slightly higher blood pressure goal of less than 130/80 mm Hg was set.
Although not specifically included in SPRINT, given the lack of trial data on specific blood pressure targets in HFrEF and the decreased cardiovascular events noted above, a class I (level of evidence C, expert opinion) recommendation to target a goal systolic blood pressure less than 130 mm Hg in stage C HFrEF with hypertension is also given. Standard guideline-directed medications in the treatment of HFrEF are to be used (Table 4).
Similarly, a new class I (level of evidence C, expert opinion) recommendation is given for hypertension in HFpEF to target a systolic blood pressure of less than 130 mm Hg, with special mention to first manage any element of volume overload with diuretics. Other than avoiding nitrates (unless used for angina) and phosphodiesterase inhibitors, it is noted that few data exist to guide the choice of antihypertensive further, although perhaps renin-angiotensin-aldosterone system inhibition, especially aldosterone antagonists, may be considered. These recommendations are fully in line with the 2017 ACC/AHA high blood pressure clinical practice guidelines,43 ie, that renin-angiotensin-aldosterone system inhibition with an angiotensin-converting enzyme (ACE) inhibitor or ARB and especially mineralocorticoid receptor antagonists would be the preferred choice (Table 4).
SLEEP-DISORDERED BREATHING IN HEART FAILURE
Sleep-disordered breathing, either obstructive sleep apnea (OSA) or central sleep apnea, is quite commonly associated with symptomatic HFrEF.44 Whereas OSA is found in roughly 18% and central sleep apnea in 1% of the general population, sleep-disordered breathing is found in nearly 60% of patients with HFrEF, with some studies showing a nearly equal proportion of OSA and central sleep apnea.45 A similar prevalence is seen in HFpEF, although with a much higher proportion of OSA.46 Central sleep apnea tends to be a marker of more severe heart failure, as it is strongly associated with severe cardiac systolic dysfunction and worse functional capacity.47
Not surprisingly, the underlying mechanism of central sleep apnea is quite different from that of OSA. Whereas OSA predominantly occurs because of repeated obstruction of the pharynx due to nocturnal pharyngeal muscle relaxation, no such airway patency issues or strained breathing patterns exist in central sleep apnea. Central sleep apnea, which can manifest as Cheyne-Stokes respirations, is thought to occur due to an abnormal ventilatory control system with complex pathophysiology such as altered sensitivity of central chemoreceptors to carbon dioxide, interplay of pulmonary congestion, subsequent hyperventilation, and prolonged circulation times due to reduced cardiac output.48
What the two types of sleep-disordered breathing have in common is an association with negative health outcomes. Both appear to induce inflammation and sympathetic nervous system activity via oxidative stress from intermittent nocturnal hypoxemia and hypercapnea.49 OSA was already known to be associated with significant morbidity and mortality rates in the general population,50 and central sleep apnea had been identified as an independent predictor of mortality in HFrEF.51
At the time of the 2013 guidelines, only small or observational studies with limited results had been done evaluating treatment effects of continuous positive airway pressure therapy (CPAP) on OSA and central sleep apnea. Given the relative paucity of data, only a single class IIa recommendation stating that CPAP could be beneficial to increase left ventricular ejection fraction and functional status in concomitant sleep apnea and heart failure was given in 2013. However, many larger trials were under way,52–59 some with surprising results such as a significant increase in cardiovascular and all-cause mortality (Table 5).54
New or modified recommendations on sleep-disordered breathing
Given the common association with heart failure (60%)45 and the marked variation in response to treatment, including potential for harm with adaptive servo-ventilation and central sleep apnea, a class IIa recommendation is made stating that it is reasonable to obtain a formal sleep study in any patient with symptomatic (NYHA class II–IV) heart failure.1
Due to the potential for harm with adaptive servo-ventilation in patients with central sleep apnea and NYHA class II to IV HFrEF, a class III (harm) recommendation is made against its use.
Largely based on the results of the Sleep Apnea Cardiovascular Endpoints (SAVE) trial,56 a class IIb, level of evidence B-R (moderate, based on randomized trials) recommendation is given, stating that the use of CPAP in those with OSA and known cardiovascular disease may be reasonable to improve sleep quality and reduce daytime sleepiness.
POTENTIAL APPLICATIONS IN ACUTE DECOMPENSATED HEART FAILURE
Although the 2017 update1 is directed mostly toward managing chronic heart failure, it is worth considering how it might apply to the management of ADHF.
SHOULD WE USE BIOMARFER TARGETS TO GUIDE THERAPY IN ADHF?
The 2017 update1 does offer direct recommendations regarding the use of biomarker levels during admissions for ADHF. Mainly, they emphasize that the admission biomarker levels provide valuable information regarding acute prognosis and risk stratification (class I recommendation), while natriuretic peptide levels just before discharge provide the same for the postdischarge timeframe (class IIa recommendation).
The update also explicitly cautions against using a natriuretic peptide level-guided treatment strategy, such as setting targets for predischarge absolute level or percent change in level of natriuretic peptides during admissions for ADHF. Although observational and retrospective studies have shown better outcomes when levels are reduced at discharge, treating for any specific inpatient target has never been tested in any large, prospective study; thus, doing so could result in unintended harm.
So what do we know?
McQuade et al systematic review
McQuade et al57 performed a systematic review of more than 40 ADHF trials, which showed that, indeed, patients who achieved a target absolute natriuretic peptide level (BNP ≤ 250 pg/mL) or percent reduction (≥ 30%) at time of discharge had significantly improved outcomes such as reduced postdischarge all-cause mortality and rehospitalization rates. However, these were mostly prospective cohort studies that did not use any type of natriuretic peptide level-guided treatment protocol, leaving it unclear whether such a strategy could positively influence outcomes.
For this reason, both McQuade et al57 and, in an accompanying editorial, Felker et al58 called for properly designed, randomized controlled trials to investigate such a strategy. Felker noted that only 2 such phase II trials in ADHF have been completed,59,60 with unconvincing results.
PRIMA II
The Multicenter, Randomized Clinical Trial to Study the Impact of In-hospital Guidance for Acute Decompensated Heart Failure Treatment by a Predefined NT-ProBNP Target on the Reduction of Readmission and Mortality Rates (PRIMA II)60 randomized patients to natriuretic peptide level-guided treatment or standard care during admission for ADHF.
Many participants (60%) reached the predetermined target of 30% reduction in natriuretic peptide levels at the time of clinical stabilization and randomization; 405 patients were randomized. Patients in the natriuretic peptide level-guided treatment group underwent a prespecified treatment algorithm, with repeat natriuretic peptide levels measured again after the protocol.
Natriuretic peptide-guided therapy failed to show any significant benefit in any clinical outcomes, including the primary composite end point of mortality or heart failure readmissions at 180 days (36% vs 38%, HR 0.99, 95% confidence interval 0.72–1.36). Consistent with the review by McQuade et al,57 achieving the 30% reduction in natriuretic peptide at discharge, in either arm, was associated with a better prognosis, with significantly lower mortality and readmission rates at 180 days (HR 0.39 for rehospitalization or death, 95% confidence interval 0.27–0.55).
As in the observational studies, those who achieved the target natriuretic peptide level at the time of discharge had a better prognosis than those who did not, but neither study showed an improvement in clinical outcomes using a natriuretic peptide level-targeting treatment strategy.
No larger randomized controlled trial results are available for guided therapy in ADHF. However, additional insight may be gained from a subsequent trial61 that evaluated biomarker-guided titration of guideline-directed medical therapy in outpatients with chronic HFrEF.
The GUIDE-IT trial
That trial, the Guiding Evidence Based Therapy Using Biomarker Intensified Treatment in Heart Failure (GUIDE-IT)61 trial, was a large multicenter attempt to determine whether a natriuretic peptide-guided treatment strategy was more effective than standard care in the management of 894 high-risk outpatients with chronic HFrEF. Earlier, promising results had been obtained in a meta-analysis62 of more than 11 similar trials in 2,000 outpatients, with a decreased mortality rate (HR 0.62) seen in the biomarker-guided arm. However, the results had not been definitive due to being underpowered.62
Unfortunately, the results of GUIDE-IT were disappointing, with no significant difference in either the combined primary end point of mortality or hospitalization for heart failure, or the secondary end points evident at 15 months, prompting early termination for futility.61 Among other factors, the study authors postulated that this may have partly resulted from a patient population with more severe heart failure and resultant azotemia, limiting the ability to titrate neurohormonal medications to the desired dosage.
The question of whether patients who cannot achieve such biomarker targets need more intensive therapy or whether their heart failure is too severe to respond adequately echoes the question often raised in discussions of inpatient biomarker-guided therapy.58 Thus, only limited insight is gained, and it remains unclear whether a natriuretic peptide-guided treatment strategy can improve outpatient or inpatient outcomes. Until this is clarified, clinical judgment and optimization of guideline-directed management and therapy should remain the bedrock of treatment.
SHOULD ALDOSTERONE ANTAGONISTS BE USED IN ACUTE HFpEF?
Given the encouraging results in chronic HFpEF from post hoc analyses of TOPCAT, are there any additional recent data suggesting a role for aldosterone antagonists such as spironolactone in acute HFpEF?
The ATHENA-HF trial
The Aldosterone Targeted Neurohormonal Combined With Natriuresis Therapy in Heart Failure (ATHENA-HF) trial63 compared treatment with high-dose spironolactone (100 mg) for 96 hours vs usual care in 360 patients with ADHF. The patient population included those with HFrEF and HFpEF, and usual care included low-dose spironolactone (12.5–25 mg) in roughly 15% of patients. High-dose mineralocorticoid receptor antagonists have been shown to overcome diuretic resistance, improve pulmonary vascular congestion, and partially combat the adverse neurohormonal activation seen in ADHF.
Unfortunately, the trial was completely neutral in regard to the primary end point of reduction in natriuretic peptide levels as well as to the secondary end points of 30-day mortality rate, heart failure readmission, clinical congestion scores, urine output, and change in weight. No suggestion of additional benefit was seen in subgroup analysis of patients with acute HFpEF (ejection fraction > 45%), which yielded similar results.63
Given these lackluster findings, routine use of high-dose spironolactone in ADHF is not recommended.64 However, the treatment was well tolerated, without significant adverse effects of hyperkalemia or kidney injury, leaving the door open as to whether it may have utility in selected patients with diuretic resistance.
Should ARNIs and ivabradine be started during ADHF admissions?
The first half of the focused update3 of the 2013 guidelines,2 reviewed by Okwuosa et al,7 provided recommendations for the use of sacubitril-valsartan, an angiotensin-neprilysin inhibitor (ARNI), and ivabradine, a selective sinoatrial node If channel inhibitor, in chronic HFrEF.
Sacubitril-valsartan was given a class I recommendation for use in patients with NYHA class II or III chronic HFrEF who tolerate an ACE inhibitor or an ARB. This recommendation was given largely based on the benefits in mortality and heart failure hospitalizations seen in PARADIGM-HF (the Prospective Comparison of ARNI With ACEI to Determine Impact on Global Mortality and Morbidity in Heart Failure)65 compared with enalapril (HR 0.80, 95% CI 0.73–0.87, P < .001).
There is currently no recommendation on initiation or use of ARNIs during admissions for ADHF, but a recent trial may lend some insight.66
THE PIONEER-HF trial
The Comparison of Sacubitril/Valsartan vs Enalapril on Effect on NT-proBNP in Patients Stabilized From an Acute Heart Failure Episode (PIONEER-HF) trial66 randomized patients admitted for acute HFrEF, once stabilized, to sacubitril-valsartan or enalapril. Encouragingly, the percentage change of natriuretic peptide levels from the time of inpatient initiation to 4 and 8 weeks thereafter, the primary efficacy end point, was 46.7% with sacubitril-valsartan versus 25.3% with enalapril alone (ratio of change 0.71, 95% CI 0.63–0.81, P < .001). Although not powered for such, a prespecified analysis of a composite of clinical outcomes was also favorable for sacubitril-valsartan, largely driven by a 44% decreased rate of rehospitalization. More definitive, and quite reassuring, was that no significant difference was seen in the key safety outcomes of worsening renal function, hyperkalemia, symptomatic hypotension, and angioedema. These results were also applicable to the one-third of study participants who had no former diagnosis of heart failure, the one-third identifying as African American, and the one-third who had not been taking an ACE inhibitor or ARB. These results, taken together with the notion that at study completion the patients become similar to those included in PARADIGM-HF, have led some to assert that PIONEER-HF has the potential to change clinical practice.
Ivabradine was given a class IIa recommendation for use in patients with NYHA class II or III chronic HFrEF with a resting heart rate of at least 70 bpm, in sinus rhythm, despite being on optimal medical therapy including a beta-blocker at a maximum tolerated dose.
This recommendation was largely based on SHIFT (Systolic Heart Failure Treatment With the If Inhibitor Ivabradine Trial), which randomized patients to ivabradine or placebo to evaluate the effects of isolated lowering of the heart rate on the composite primary outcome of cardiovascular death or hospitalization. A significant reduction was seen in the ivabradine arm (HR 0.82, 95% CI 0.75–0.90, P < .0001), mainly driven by decreased hospitalizations.67
Subsequently, a small unblinded single-center study was undertaken to evaluate the efficacy and safety of initiating ivabradine during admissions for ADHF.68
THE ETHIC-AHF trial
The Effect of Early Treatment With Ivabradine Combined With Beta-Blockers vs Beta-Blockers Alone in Patients Hospitalized With Heart Failure and Reduced Left Ventricular Ejection Fraction (ETHIC-AHF) trial68 sought to determine the safety and effectiveness of early coadministration of ivabradine with beta-blockers in patients with acute HFrEF.
This single-center, unblinded study randomized 71 patients to ivabradine and beta-blockade or beta-blockade alone upon clinical stabilization (24–48 hours) after admission for acute decompensated HFrEF.
The primary end point was heart rate at 28 days, with the ivabradine group showing a statistically significant decrease (64 vs 70 bpm, P = .01), which persisted at 4 months. There was no significant difference in the secondary end points of adverse drug effects or the composite of clinical event outcomes (all-cause mortality, admission for heart failure or cardiovascular cause), but a number of surrogate end points including left ventricular ejection fraction, BNP level, and NYHA functional class at 4 months showed mild improvement.
Although this study provided evidence that the coadministration of ivabradine and a beta-blocker is safe and was positive in regard to clinical outcomes, the significant limitations due to its size and study design (single-center, unblinded, 4-month follow-up) simply serve to support the pursuit of larger studies with more stringent design and longer follow-up in order to determine the clinical efficacy.
The PRIME-HF trial
The Predischarge Initiation of Ivabradine in the Management of Heart Failure (PRIME-HF) trial69 is a randomized, open-label, multicenter trial comparing standard care vs the initiation of ivabradine before discharge, but after clinical stabilization, during admissions for ADHF in patients with chronic HFrEF (left ventricular ejection fraction ≤ 35%). At subsequent outpatient visits, the dosage can be modified in the ivabradine group, or ivabradine can be initiated at the provider’s discretion in the usual-care group.
PRIME-HF is attempting to determine whether initiating ivabradine before discharge will result in more patients taking ivabradine at 180 days, its primary end point, as well as in changes in secondary end points including heart rate and patient-centered outcomes. The study is active, with reporting expected in 2019.
As these trials all come to completion, it will not be long before we have further guidance regarding the inpatient initiation of these new and exciting therapeutic agents.
SHOULD INTRAVENOUS IRON BE GIVEN DURING ADHF ADMISSIONS?
Given the high prevalence of iron deficiency in symptomatic HFrEF, its independent association with mortality, improvements in quality of life and functional capacity suggested by repleting with intravenous iron (in FAIR-HF and CONFIRM-HF), the seeming inefficacy of oral iron in IRONOUT, and the logistical challenges of intravenous administration during standard clinic visits, could giving intravenous iron soon be incorporated into admissions for ADHF?
Caution has been advised for several reasons. As discussed above, larger randomized controlled trials powered to detect more definitive clinical end points such as death and the rate of hospitalization are still needed before a stronger recommendation can be made for intravenous iron in HFrEF. Also, without such data, it seems unwise to add the considerable economic burden of routinely assessing for iron deficiency and providing intravenous iron during ADHF admissions to the already staggering costs of heart failure.
The effects seen on morbidity and mortality that become evident in these trials over the next 5 years will help determine future guidelines and whether intravenous iron is routinely administered in bridge clinics, during inpatient admissions for ADHF, or not at all in patients with HFrEF and iron deficiency.
INTERNISTS ARE KEY
Heart failure remains one of the most common, morbid, complex, and costly diseases in the United States, and its prevalence is expected only to increase.4,5 The 2017 update1 of the 2013 guideline2 for the management of heart failure provides recommendations aimed not only at management of heart failure, but also at its comorbidities and, for the first time ever, at its prevention.
Internists provide care for the majority of heart failure patients, as well as for their comorbidities, and are most often the first to come into contact with patients at high risk of developing heart failure. Thus, a thorough understanding of these guidelines and how to apply them to the management of acute decompensated heart failure is of critical importance.
- Yancy CW, Jessup M, Bozkurt B, et al. 2017 ACC/AHA/HFSA focused update of the 2013 ACCF/AHA Guideline for the Management of Heart Failure: a report of the American College of Cardiology/American Heart Association Task Force on Clinical Practice Guidelines and the Heart Failure Society of America. J Am Coll Cardiol 2017; 70(6):776–803. doi:10.1016/j.jacc.2017.04.025
- Yancy CW, Jessup M, Bozkurt B, et al; American College of Cardiology Foundation/American Heart Association Task Force on Practice Guidelines. 2013 ACCF/AHA guideline for the management of heart failure: a report of the American College of Cardiology Foundation/American Heart Association Task Force on Practice Guidelines. Circulation 2013; 128(16):e240–e327. doi:10.1161/CIR.0b013e31829e8776
- Yancy CW, Jessup M, Bozkurt B, et al. 2016 ACC/AHA/HFSA focused update on new pharmacological therapy for heart failure: an update of the 2013 ACCF/AHA Guideline for the Management of Heart Failure: a report of the American College of Cardiology/American Heart Association Task Force on Clinical Practice Guidelines and the Heart Failure Society of America. Circulation 2016; 134(13):e282–e293. doi:10.1161/CIR.0000000000000435
- Benjamin EJ, Blaha MJ, Chiuve SE, et al; American Heart Association Statistics Committee and Stroke Statistics Subcommittee. Heart disease and stroke statistics—2017 update: a report from the American Heart Association. Circulation 2017; 135(10):e146–e603. doi:10.1161/CIR.0000000000000485
- Heidenreich PA, Albert NM, Allen LA, et al; American Heart Association Advocacy Coordinating Committee; Council on Arteriosclerosis, Thrombosis and Vascular Biology; Council on Cardiovascular Radiology and Intervention; Council on Clinical Cardiology; Council on Epidemiology and Prevention; Stroke Council. Forecasting the impact of heart failure in the United States: a policy statement from the American Heart Association. Circ Heart Fail 2013; 6(3):606–619. doi:10.1161/HHF.0b013e318291329a
- Huffman MD, Berry JD, Ning H, et al. Lifetime risk for heart failure among white and black Americans: cardiovascular lifetime risk pooling project. J Am Coll Cardiol 2013; 61(14):1510–1517. doi:10.1016/j.jacc.2013.01.022
- Okwuosa IS, Princewill O, Nwabueze C, et al. The ABCs of managing systolic heart failure: past, present, and future. Cleve Clin J Med 2016; 83(10):753–765. doi:10.3949/ccjm.83a.16006
- Kovell LC, Juraschek SP, Russell SD. Stage A heart failure is not adequately recognized in US adults: analysis of the National Health and Nutrition Examination Surveys, 2007–2010. PLoS One 2015; 10(7):e0132228. doi:10.1371/journal.pone.0132228
- Huelsmann M, Neuhold S, Resl M, et al. PONTIAC (NT-proBNP selected prevention of cardiac events in a population of diabetic patients without a history of cardiac disease): a prospective randomized controlled trial. J Am Coll Cardiol 2013; 62(15):1365–1372. doi:10.1016/j.jacc.2013.05.069
- Clodi M, Resl M, Neuhold S, et al. A comparison of NT-proBNP and albuminuria for predicting cardiac events in patients with diabetes mellitus. Eur J Prev Cardiol 2012; 19(5):944–951. doi:10.1177/1741826711420015
- Ledwidge M, Gallagher J, Conlon C, et al. Natriuretic peptide-based screening and collaborative care for heart failure: the STOP-HF randomized trial. JAMA 2013; 310(1):66–74. doi:10.1001/jama.2013.7588
- Salah K, Kok WE, Eurlings LW, et al. A novel discharge risk model for patients hospitalised for acute decompensated heart failure incorporating N-terminal pro-B-type natriuretic peptide levels: a European coLlaboration on Acute decompeNsated Heart Failure: ELAN-HF Score. Heart 2014; 100(2):115–125. doi:10.1136/heartjnl-2013-303632
- Kociol RD, Horton JR, Fonarow GC, et al. Admission, discharge, or change in B-type natriuretic peptide and long-term outcomes: data from Organized Program to Initiate Lifesaving Treatment in Hospitalized Patients with Heart Failure (OPTIMIZE-HF) linked to Medicare claims. Circ Heart Fail 2011; 4(5):628–636. doi:10.1161/CIRCHEARTFAILURE.111.962290
- Yusuf S, Pfeffer MA, Swedberg K, et al; CHARM Investigators and Committees. Effects of candesartan in patients with chronic heart failure and preserved left-ventricular ejection fraction: the CHARM-Preserved Trial. Lancet 2003; 362(9386):777–781. doi:10.1016/S0140-6736(03)14285-7
- Owan TE, Hodge DO, Herges RM, Jacobsen SJ, Roger VL, Redfield MM. Trends in prevalence and outcome of heart failure with preserved ejection fraction. N Engl J Med 2006; 355(3):251–259. doi:10.1056/NEJMoa052256
- Pitt B, Zannad F, Remme WJ, et al. The effect of spironolactone on morbidity and mortality in patients with severe heart failure. Randomized Aldactone Evaluation Study Investigators. N Engl J Med 1999; 341(10):709–717. doi:10.1056/NEJM199909023411001
- MacFadyen RJ, Barr CS, Struthers AD. Aldosterone blockade reduces vascular collagen turnover, improves heart rate variability and reduces early morning rise in heart rate in heart failure patients. Cardiovasc Res 1997; 35(1):30–34. pmid:9302344
- Edelmann F, Wachter R, Schmidt AG, et al; Aldo-DHF Investigators. Effect of spironolactone on diastolic function and exercise capacity in patients with heart failure with preserved ejection fraction: the Aldo-DHF randomized controlled trial. JAMA 2013; 309(8):781–791. doi:10.1001/jama.2013.905
- Pitt B, Pfeffer MA, Assmann SF, et al; TOPCAT Investigators. Spironolactone for heart failure with preserved ejection fraction. N Engl J Med 2014; 370(15):1383–1392. doi:10.1056/NEJMoa1313731
- Pfeffer MA, Claggett B, Assmann SF, et al. Regional variation in patients and outcomes in the Treatment of Preserved Cardiac Function Heart Failure With an Aldosterone Antagonist (TOPCAT) trial. Circulation 2015; 31(1):34–42. doi:10.1161/CIRCULATIONAHA.114.013255
- de Denus S, O’Meara E, Desai AS, et al. Spironolactone metabolites in TOPCAT—new insights into regional variation. N Engl J Med 2017; 376(17):1690–1692. doi:10.1056/NEJMc1612601
- Redfield MM, Anstrom KJ, Levine JA, et al; NHLBI Heart Failure Clinical Research Network. Isosorbide mononitrate in heart failure with preserved ejection fraction. N Engl J Med 2015; 373(24):2314–2324. doi:10.1056/NEJMoa1510774
- Walton-Shirley M. Succinct thoughts on NEAT-HFpEF: true, true, and unrelated? Medscape 2015. https://www.medscape.com/viewarticle/854116. Accessed January 17, 2019.
- Redfield MM, Chen HH, Borlaug BA, et al. Effect of phosphodiesterase-5 inhibition on exercise capacity and clinical status in heart failure with preserved ejection fraction: a randomized clinical trial. JAMA 2013; 309(12):1268–1277. doi:10.1001/jama.2013.2024
- Guazzi M, Vicenzi M, Arena R, Guazzi MD. PDE5 inhibition with sildenafil improves left ventricular diastolic function, cardiac geometry, and clinical status in patients with stable systolic heart failure: results of a 1-year, prospective, randomized, placebo controlled study. Circ Heart Fail 2011; 4(1):8–17. doi:10.1161/CIRCHEARTFAILURE.110.944694
- Guazzi M, Vicenzi M, Arena R, Guazzi MD. Pulmonary hypertension in heart failure with preserved ejection fraction: a target of phosphodiesterase-5 inhibition in a 1-year study. Circulation 2011; 124(2):164–174. doi:10.1161/CIRCULATIONAHA.110.983866
- Klip IT, Comin-Colet J, Voors AA, et al. Iron deficiency in chronic heart failure: an international pooled analysis. Am Heart J 2013; 165(4):575–582.e3. doi:10.1016/j.ahj.2013.01.017
- Jankowska EA, von Haehling S, Anker SD, Macdougall IC, Ponikowski P. Iron deficiency and heart failure: diagnostic dilemmas and therapeutic perspectives. Eur Heart J 2013; 34(11):816–829. doi:10.1093/eurheartj/ehs224
- Jankowska EA, Rozentryt P, Witkowska A, et al. Iron deficiency predicts impaired exercise capacity in patients with systolic chronic heart failure. J Card Fail 2011; 17(11):899–906. doi:10.1016/j.cardfail.2011.08.003
- Haas JD, Brownlie T 4th. Iron deficiency and reduced work capacity: a critical review of the research to determine a causal relationship. J Nutr 2001; 131(2S–2):676S-690S. doi:10.1093/jn/131.2.676S
- Davies KJ, Maguire JJ, Brooks GA, Dallman PR, Packer L. Muscle mitochondrial bioenergetics, oxygen supply, and work capacity during dietary iron deficiency and repletion. Am J Physiol 1982; 242(6):E418–E427. doi:10.1152/ajpendo.1982.242.6.E418
- Drozd M, Jankowska EA, Banasiak W, Ponikowski P. Iron therapy in patients with heart failure and iron deficiency: review of iron preparations for practitioners. Am J Cardiovasc Drugs 2017; 17(3):183–201. doi:10.1007/s40256-016-0211-2
- Anker SD, Comin Colet J, Filippatos G, et al; FAIR-HF Trial Investigators. Ferric carboxymaltose in patients with heart failure and iron deficiency. N Engl J Med 2009; 361(25):2436–2448. doi:10.1056/NEJMoa0908355
- Ponikowski P, van Veldhuisen DJ, Comin-Colet J, et al; CONFIRM-HF Investigators. Beneficial effects of long-term intravenous iron therapy with ferric carboxymaltose in patients with symptomatic heart failure and iron deficiency. Eur Heart J 2015; 36(11):657–668. doi:10.1093/eurheartj/ehu385
- Lewis GD, Malhotra R, Hernandez AF, et al; NHLBI Heart Failure Clinical Research Network. Effect of Oral Iron Repletion on Exercise Capacity in Patients With Heart Failure With Reduced Ejection Fraction and Iron Deficiency: The IRONOUT HF randomized clinical trial. JAMA 2017; 317(19):1958–1966. doi:10.1001/jama.2017.5427
- Wendling P. Iron supplementation in HF: trials support IV but not oral. Medscape 2016. https://www.medscape.com/viewarticle/872088. Accessed January 17, 2019.
- Ganz T. Hepcidin and iron regulation, 10 years later. Blood 2011; 117(17):4425–4433. doi:10.1182/blood-2011-01-258467
- Jankowska EA, Kasztura M, Sokolski M, et al. Iron deficiency defined as depleted iron stores accompanied by unmet cellular iron requirements identifies patients at the highest risk of death after an episode of acute heart failure. Eur Heart J 2014; 35(36):2468–2476. doi:10.1093/eurheartj/ehu235
- Jankowska EA, Malyszko J, Ardehali H, et al. Iron status in patients with chronic heart failure. Eur Heart J 2013; 34(11):827–834. doi:10.1093/eurheartj/ehs377
- Swedberg K, Young JB, Anand IS, et al. Treatment of anemia with darbepoetin alfa in systolic heart failure. N Engl J Med 2013; 368(13):1210–1219. doi:10.1056/NEJMoa1214865
- Ghali JK, Anand IS, Abraham WT, et al; Study of Anemia in Heart Failure Trial (STAMINA-HeFT) Group. Randomized double-blind trial of darbepoetin alfa in patients with symptomatic heart failure and anemia. Circulation 2008; 117(4):526–535. doi:10.1161/CIRCULATIONAHA.107.698514
- SPRINT Research Group; Wright JT Jr, Williamson JD, Whelton PK, et al. A randomized trial of intensive versus standard blood pressure control. N Engl J Med 2015; 373(22):2103–2116. doi:10.1056/NEJMoa1511939
- Whelton PK, Carey RM, Arnow WS, et al. 2017 ACC/AHA/AAPA/ABC/ACPM/AGS/APhA/ASH/ASPC/NMA/PCNA guideline for the prevention, detection, evaluation, and management of high blood pressure in adults: a report of the American College of Cardiology/American Heart Association Task Force on Clinical Practice Guidelines. J Am Coll Cardiol 2018; 71(19):e127–e248. doi:10.1016/j.jacc.2017.11.006
- Young T, Shahar E, Nieto FJ, et al; Sleep Heart Health Study Research Group. Predictors of sleep-disordered breathing in community dwelling adults: the Sleep Heart Health Study. Arch Intern Med 2002; 162(8):893–900. pmid:11966340
- MacDonald M, Fang J, Pittman SD, White DP, Malhotra A.The current prevalence of sleep disordered breathing in congestive heart failure patients treated with beta-blockers. J Clin Sleep Med 2008; 4(1):38-42. pmid:18350960
- Bitter T, Faber L, Hering D, Langer C, Horstkotte D, Oldenburg O. Sleep-disordered breathing in heart failure with normal left ventricular ejection fraction. Eur J Heart Fail 2009; 11(6):602–608. doi:10.1093/eurjhf/hfp057
- Sin DD, Fitzgerald F, Parker JD, Newton G, Floras JS, Bradley TD. Risk factors for central and obstructive sleep apnea in 450 men and women with congestive heart failure. Am J Respir Crit Care Med 1999; 160(4):1101–1106. doi:10.1164/ajrccm.160.4.9903020
- Ng AC, Freedman SB. Sleep disordered breathing in chronic heart failure. Heart Fail Rev 2009; 14(2):89–99. doi:10.1007/s10741-008-9096-8
- Kasai T, Bradley TD. Obstructive sleep apnea and heart failure: pathophysiologic and therapeutic implications. J Am Coll Cardiol 2011; 57(2):119–127. doi:10.1016/j.jacc.2010.08.627
- Marin JM, Carrizo SJ, Vicente E, Agusti AG. Long-term cardiovascular outcomes in men with obstructive sleep apnoea-hypopnoea with or without treatment with continuous positive airway pressure: an observational study. Lancet 2005; 365(9464):1046–1053. doi:10.1016/S0140-6736(05)71141-7
- Javaheri S, Shukla R, Zeigler H, Wexler L. Central sleep apnea, right ventricular dysfunction, and low diastolic blood pressure are predictors of mortality in systolic heart failure. J Am Coll Cardiol 2007; 49(20):2028–2034. doi:10.1016/j.jacc.2007.01.084
- Bradley TD, Logan AG, Kimoff RJ, et al; CANPAP Investigators. Continuous positive airway pressure for central sleep apnea and heart failure. N Engl J Med 2005; 353(19):2025–2033. doi:10.1056/NEJMoa051001
- Arzt M, Floras JS, Logan AG, et al; CANPAP Investigators. Suppression of central sleep apnea by continuous positive airway pressure and transplant-free survival in heart failure: a post hoc analysis of the Canadian Continuous Positive Airway Pressure for Patients with Central Sleep Apnea and Heart Failure Trial (CANPAP). Circulation 2007; 115(25):3173–3180. doi:10.1161/CIRCULATIONAHA.106.683482
- Cowie MR, Woehrle H, Wegscheider K, et al. Adaptive servo-ventilation for central sleep apnea in systolic heart failure. N Engl J Med 2015; 373(12):1095–1105. doi:10.1056/NEJMoa1506459
- O’Connor CM, Whellan DJ, Fiuzat M, et al. Cardiovascular outcomes with minute ventilation-targeted adaptive servo-ventilation therapy in heart failure: the CAT-HF Trial. J Am Coll Cardiol 2017; 69(12):1577–1587. doi:10.1016/j.jacc.2017.01.041
- McEvoy RD, Antic NA, Heeley E, et al; SAVE Investigators and Coordinators. CPAP for prevention of cardiovascular events in obstructive sleep apnea. N Engl J Med 2016; 375(10):919–931. doi:10.1056/NEJMoa1606599
- McQuade CN, Mizus M, Wald JW, Goldberg L, Jessup M, Umscheid CA. Brain-type natriuretic peptide and amino-terminal pro-brain-type natriuretic peptide discharge thresholds for acute decompensated heart failure: a systematic review. Ann Intern Med 2017; 166(3):180–190. doi:10.7326/M16-1468
- Felker GM, Whellan DJ. Inpatient management of heart failure: are we shooting at the right target? Ann Intern Med 2017; 166(3):223–224. doi:10.7326/M16-2667
- Carubelli V, Lombardi C, Lazzarini V, et al. N-terminal pro-B-type natriuretic peptide-guided therapy in patients hospitalized for acute heart failure. J Cardiovasc Med (Hagerstown) 2016; 17(11):828–839. doi:10.2459/JCM.0000000000000419
- Stienen S, Salah K, Moons AH, et al. Rationale and design of PRIMA II: a multicenter, randomized clinical trial to study the impact of in-hospital guidance for acute decompensated heart failure treatment by a predefined NT-PRoBNP target on the reduction of readmIssion and mortality rates. Am Heart J 2014; 168(1):30–36. doi:10.1016/j.ahj.2014.04.008
- Felker GM, Anstrom KJ, Adams KF, et al. Effect of natriuretic peptide-guided therapy on hospitalization or cardiovascular mortality in high-risk patients with heart failure and reduced ejection fraction: a randomized clinical trial. JAMA 2017; 318(8):713–720. doi:10.1001/jama.2017.10565
- Troughton RW, Frampton CM, Brunner-La Rocca HP, et al. Effect of B-type natriuretic peptide-guided treatment of chronic heart failure on total mortality and hospitalization: an individual patient meta-analysis. Eur Heart J 2014; 35(23):1559–1567. doi:10.1093/eurheartj/ehu090
- van Vliet AA, Donker AJ, Nauta JJ, Verheugt FW. Spironolactone in congestive heart failure refractory to high-dose loop diuretic and low-dose angiotensin-converting enzyme inhibitor. Am J Cardiol 1993; 71(3):21A–28A. pmid:8422000
- Butler J, Anstrom KJ, Felker GM, et al; National Heart Lung and Blood Institute Heart Failure Clinical Research Network. Efficacy and safety of spironolactone in acute heart failure. The ATHENA-HF randomized clinical trial. JAMA Cardiol 2017; 2(9):950–958. doi:10.1001/jamacardio.2017.2198
- McMurray JJ, Packer M, Desai AS, et al; PARADIGM-HF Investigators and Committees. Angiotensin-neprilysin inhibition versus enalapril in heart failure. N Engl J Med 2014; 371(11):993–1004. doi:10.1056/NEJMoa1409077
- ClinicalTrials.gov. ComParIson Of Sacubitril/valsartaN Versus Enalapril on Effect on NTpRo-BNP in patients stabilized from an acute Heart Failure episode (PIONEER-HF). https://clinicaltrials.gov/ct2/show/NCT02554890. Accessed January 17, 2019.
- Swedberg K, Komajda M, Böhm M, et al; SHIFT Investigators. Ivabradine and outcomes in chronic heart failure (SHIFT): a randomised placebo-controlled study. Lancet 2010; 376(9744):875–885. doi:10.1016/S0140-6736(10)61198-1
- Hidalgo FJ, Anguita M, Castillo JC, et al. Effect of early treatment with ivabradine combined with beta-blockers versus beta-blockers alone in patients hospitalised with heart failure and reduced left ventricular ejection fraction (ETHIC-AHF): a randomised study. Int J Cardiol 2016; 217:7–11. doi:10.1016/j.ijcard.2016.04.136
- ClinicalTrials.gov. Predischarge Initiation of Ivabradine in the Management of Heart Failure (PRIME-HF). https://clinicaltrials.gov/ct2/show/NCT02827500. Accessed January 17, 2019.
- Anker SD, Kirwan BA, van Veldhuisen DJ, et al. Effects of ferric carboxymaltose on hospitalisations and mortality rates in iron-deficient heart failure patients: an individual patient data meta-analysis. Eur J Heart Fail 2018; 20(1):125–133. doi:10.1002/ejhf.823
- ClinicalTrials.gov. Intravenous Iron in Patients With Systolic Heart Failure and Iron Deficiency to Improve Morbidity and Mortality (FAIR-HF2). https://clinicaltrials.gov/ct2/show/NCT03036462. Accessed January 17, 2019.
- ClinicalTrials.gov. Study to Compare Ferric Carboxymaltose With Placebo in Patients With Acute Heart Failure and Iron Deficiency (AFFIRM-AHF). https://clinicaltrials.gov/ct2/show/record/NCT02937454. Accessed January 17, 2019.
- ClinicalTrials.gov. Randomized Placebo-controlled Trial of Ferric Carboxymaltose as Treatment for Heart Failure With Iron Deficiency (HEART-FID). https://clinicaltrials.gov/ct2/show/NCT03037931. Accessed January 17, 2019.
- ClinicalTrials.gov. Intravenous Iron Treatment in Patients With Heart Failure and Iron Deficiency (IRONMAN). https://clinicaltrials.gov/ct2/show/NCT02642562. Accessed January 17, 2019.
KEY POINTS
- Despite advances in treatment, heart failure remains highly morbid, common, and costly. Prevention is key.
- Strategies to prevent progression to clinical heart failure in high-risk patients include new blood pressure targets (< 130/80 mm Hg) and B-type natriuretic peptide screening to prompt referral to a cardiovascular specialist.
- An aldosterone receptor antagonist might be considered to decrease hospitalizations in appropriately selected stage C HFpEF patients. Routine use of nitrates or phosphodiesterase-5 inhibitors in such patients is not recommended.
- Outpatient intravenous iron infusions are reasonable in persistently symptomatic New York Heart Association stage II to III heart failure with reduced ejection fraction (HFrEF) to improve functional capacity and quality of life.
- The new systolic blood pressure target is less than 130 mm Hg for stage A heart failure, stage C HFrEF, and stage C HFpEF.

Monoclonal gammopathy of undetermined significance: A primary care guide


MGUS is present in 3% to 4% of the population over age 50 and is more common in older men, African Americans, and Africans.1–6
The overall risk of progression to myeloma and related disorders is less than or equal to 1% per year depending on the subtype of the M protein (higher risk with IgM than non-IgM and light-chain MGUS).7,8 While the risk of malignant transformation is low, multiple myeloma is almost always preceded by the presence of an asymptomatic and often unrecognized monoclonal protein.
WHEN SHOULD WE LOOK FOR AN M PROTEIN?
An M protein is typically an incidental finding when a patient is being assessed for any of a number of presenting symptoms or conditions. A large retrospective study9 found that screening for MGUS was mostly performed by internal medicine physicians. The indications for testing were anemia, bone-related issues, elevated creatinine, elevated erythrocyte sedimentation rate, and neuropathy.

A low anion gap is not a major indicator of an M protein unless in a high concentration, in which case other manifestations would be present, such as renal failure, which would guide the diagnosis. Polyclonal hypergammaglobulinemia as a cause of low anion gap is far more common than MGUS.
HOW SHOULD WE SCREEN FOR AN M PROTEIN?

Serum protein electrophoresis is an initial test used to identify an M protein and has a key role in quantifying it (Figure 2). An M protein appears as a narrow spike on the agarose gel and should be distinguished from the broad band seen in polyclonal gammopathies associated with cirrhosis and chronic infectious and inflammatory conditions, among others.12 A major disadvantage of serum protein electrophoresis is that it cannot detect an M protein in very low concentrations or determine its identity.
Serum immunofixation is more sensitive than serum protein electrophoresis and should always be ordered in conjunction with it, mostly to ensure detecting tiny amounts of M protein and to identify the type of its heavy chain and light-chain components.13
The serum free light-chain assay is also considered an essential part of the screening process to detect light-chain MGUS and light-chain myeloma. As many as 16% of myeloma patients secrete only light chains, which may not be identified on serum immunofixation.3,6,7,10,14,15 In general, a low kappa-lambda ratio (< 0.26) indicates the overproduction of lambda light chains, and a high ratio (> 1.65) indicates the overproduction of kappa light chains.
The serum free light-chain assay helps detect abnormal secretion of monoclonal light chains before they appear in the urine once the kidney tubules become saturated and unable to reabsorb them.
Of note, the free light-chain ratio can be abnormal (< 0.26 or > 1.65) in chronic kidney disease. Thus, it may be challenging to discern whether an abnormal light-chain ratio is related to impaired light-chain clearance by the kidneys or to MGUS. In general, kappa light chains are more elevated than lambda light chains in chronic kidney disease, but the ratio should not be considerably skewed. A kappa-lambda ratio below 0.37 or above 3 is rarely seen in chronic kidney disease and should prompt workup for MGUS.16
Tests in combination. The sensitivity of screening for M proteins ranges from 82% with serum protein electrophoresis alone to 93% with the addition of serum immunofixation and to 98% with the serum free light-chain assay.15 The latter can replace urine protein electrophoresis and immunofixation when screening for M protein, given its higher sensitivity.15,17 An important caveat is that urine dipstick testing does not detect urine light chains.

Table 3 lists the initial laboratory tests required in patients with MGUS.
WHAT IS THE DIFFERENTIAL DIAGNOSIS OF MONOCLONAL GAMMOPATHIES?

that feature an M protein and would otherwise require treatment (Table 4). The differential diagnosis includes smoldering multiple myeloma, symptomatic multiple myeloma, Waldenström macroglobulinemia, light-chain amyloidosis, low-grade B-cell lymphoproliferative disorders, a variety of monoclonal protein-related kidney disorders, and plasmacytomas.10,14
MGUS
Based on the International Myeloma Working Group consensus, a formal diagnosis of MGUS is established when a serum M protein is detected and measured at a concentration less than 3 g/dL on serum protein electrophoresis along with less than 10% clonal plasma cells in the bone marrow.1–6,14,18,19 Nevertheless, bone marrow biopsy can be omitted in certain patients as discussed below. The absence of myeloma-related organ damage—particularly osteolytic bone lesions, anemia, otherwise unexplained renal failure, and hypercalcemia—is fundamental and necessary for a diagnosis of MGUS.
Smoldering multiple myeloma
Compared with patients with MGUS, patients with smoldering multiple myeloma have higher M protein concentrations (≥ 3 g/dL) or 10% or more clonal plasma cells in the marrow or both, and are at higher risk of progression to symptomatic multiple myeloma. Nevertheless, like patients with MGUS, they have no myeloma symptoms or evidence of end-organ damage.
Symptomatic multiple myeloma
By definition, patients with multiple myeloma develop organ damage related to their malignancy and need therapy to halt disease progression. Multiple myeloma causes clinical manifestations through cellular infiltration of the bone and bone marrow (anemia, osteolysis, and hypercalcemia) and light chain-induced toxicity (renal tubular damage and cast nephropathy).
In 2014, the definition of multiple myeloma was updated to include 3 new myeloma-defining events that herald a significantly higher risk of progression from smoldering to symptomatic multiple myeloma, and now constitute an integral part of the diagnosis of symptomatic multiple myeloma. These are:
- Focal lesions (> 1 lesion larger than 5 mm) visible on magnetic resonance imaging
- ≥ 60% clonal plasma cells on bone marrow biopsy
- Ratio of involved to uninvolved serum free light chains ≥ 100 (the involved light chain is the one detected on serum protein electrophoresis and immunofixation).14
Bone pain, symptoms of anemia, and decreased urine output may suggest myeloma, but are not diagnostic. Although the “CRAB” criteria (elevated calcium, renal failure, anemia, and bone lesions) define multiple myeloma, the presence of anemia, hypercalcemia, or renal dysfunction do not by themselves mark transformation from MGUS to multiple myeloma. Thus, other causes need to be considered, since the risk of transformation is so low. Importantly, hyperparathyroidism must be ruled out if hypercalcemia is present in a patient with MGUS.10
Waldenström macroglobulinemia
Waldenström macroglobulinemia, also called lymphoplasmacytic lymphoma, is an indolent non-Hodgkin B-cell lymphoma that can invade the marrow, liver, spleen, and lymph nodes, leading to anemia and organomegaly. It features a monoclonal IgM protein that can be associated with increased blood viscosity, cold agglutinin disease, peripheral neuropathy, and cryoglobulinemia.
Waldenström macroglobulinemia should be suspected in any patient with IgM type M protein and symptoms related to hyperviscosity (headache, blurry vision, lightheadedness, shortness of breath, unexplained epistaxis, gum bleeding); systemic symptoms (fever, weight loss, and night sweats); and abdominal pain (due to organomegaly).23
Monoclonal gammopathy of renal significance
Monoclonal gammopathy of renal significance (MGRS) is a newly recognized entity defined by kidney dysfunction associated with an M protein without evidence of myeloma or other lymphoid disorders.24 Multiple disorders have been included in this category with different underlying mechanisms of kidney injury. This entity is beyond the scope of this discussion.
Light-chain amyloidosis
Misfolded light-chain deposition leading to organ dysfunction is the hallmark of light-chain amyloidosis, which constitutes a subset of MGRS. An abnormal light-chain ratio, especially if skewed toward lambda should trigger an investigation for light-chain amyloidosis.10
Abnormal light chains may infiltrate any organ or tissue, but of greatest concern is infiltration of the myocardium with ensuing heart failure manifestations. N-terminal pro-B-type natriuretic peptide (NT-proBNP) is a sensitive marker for cardiac amyloidosis in the presence of suggestive features on transthoracic echocardiography (eg, left ventricular hypertrophy) but is not specific as it can be elevated in heart failure regardless of the underlying cause.10
Glomerular injury with nephrotic syndrome may also point toward renal involvement by light-chain amyloidosis and establishes a key distinctive factor from myeloma in which tubular injury is the main mechanism of kidney dysfunction.
Clinical clues for light-chain amyloidosis include heart failure symptoms, neuropathy, and macroglossia. If any of these symptoms and signs is present, we recommend electrocardiography (look for low voltage in limb leads), transthoracic echocardiography, measuring the NT-proBNP level, and urinalysis to look for albuminuria. Notably, carpal tunnel syndrome may be a very early clinical manifestation of amyloidosis, but by itself it is nonspecific. Light-chain amyloidosis is a common cause of macroglossia in adults.10,25
Neuropathy associated with M proteins is a clinical entity related to a multitude of disorders that may necessitate treating the underlying cellular clone responsible for the secretion of the toxic M protein. These disorders include light-chain amyloidosis, POEMS (polyneuropathy, organomegaly, endocrinopathy, M protein, and skin changes or sclerotic bone lesions) syndrome, and IgM-related neuropathies with anti-myelin-associated glycoprotein antibodies.3,10,11,14
Notably, weight loss and fatigue in a patient with MGUS may be the first signs of light-chain amyloidosis or Waldenström macroglobulinemia and should prompt further evaluation.25
HOW ARE PATIENTS WITH MGUS RISK-STRATIFIED AND FOLLOWED?
Research has helped to refine the diagnostic workup and recognize subsets of patients with MGUS at different risks of progression to myeloma and related disorders. Factors predicting progression are 1,6,7,26,27:
- The amount of the M protein
- The type of M protein (IgG vs non-IgG)
- An abnormal free light-chain ratio.

Half of patients with MGUS fall into the low-risk category, which is defined by IgG-type serum M protein in a concentration less than 1.5 g/dL and a normal serum free light-chain ratio (kappa-lambda 0.26–1.65).5,27 The absolute risk of progression at 20 years is only 5% for patients with low-risk MGUS, compared with 58% in patients with high-risk MGUS (positive for all 3 risk factors).5
The presence of less than 10% plasma cells in the bone marrow is required to satisfy the definition of MGUS, but bone marrow biopsy can be omitted for patients with low-risk MGUS, given the slim chance of finding a significant percentage of clonal plasma cells in the marrow and the inherently low risk of progression.5,10 Skeletal surveys are often deferred for low-risk MGUS, but we obtain them in all our patients to ensure the absence of plasmacytomas, which need to be treated (typically with radiotherapy). Importantly, patients with unexplained bone pain (mostly in long bones, ribs, and spine, whereas joints are not typically involved) and a normal skeletal survey should undergo advanced imaging (whole-body magnetic resonance imaging or whole-body positron emission tomography and computed tomography) to detect bone lesions otherwise missed on plain radiography.28,29
Most of the recommendations regarding follow-up are based on expert opinion, given the lack of randomized data. Most experts agree that all patients should be reevaluated 6 months after an M protein is detected, with laboratory surveillance tests (complete blood cell count, serum creatinine, serum calcium level, serum protein electrophoresis, and serum free light chains). Low-risk patients with a stable M protein level can be followed every 2 to 3 years.
Suspect malignant progression if the serum M protein level increases by 50% or more (with an absolute increase of ≥ 0.5 g/dL); the serum M protein level is 3 g/dL or higher; the serum free light-chain ratio is more than 100; or the patient has unexplained anemia, elevated creatinine, bone pain, fracture, or hypercalcemia.
Patients at intermediate or high risk should be followed annually after the initial 6-month visit.5,7,10
A recent study highlighted the importance of risk stratification in reducing the costs associated with an overzealous diagnostic workup of patients with low-risk MGUS.30 These savings are in addition to a reduction in patient anticipation and anxiety that universally occur before invasive procedures.
THE ROLE OF THE PRIMARY CARE PROVIDER AND THE HEMATOLOGIST
Once an M protein is identified, a comprehensive history, physical examination, and laboratory tests (serum protein electrophoresis to quantify the protein, serum immunofixation, serum free light chains, complete blood cell count, calcium, and creatinine) should be done, taking into consideration the differential diagnosis of monoclonal gammopathies discussed above. After MGUS is confirmed, the patient should be risk-stratified to determine the need for bone marrow biopsy and to predict the risk of progression to more serious conditions.
Referral to a hematologist is warranted for patients with intermediate- and high-risk MGUS, patients with abnormal serum free light-chain ratios, and those who show evidence of malignant progression. Patients with intermediate- and high-risk MGUS could be referred for bone marrow biopsy before assessment by a hematologist. The primary care provider may continue to follow patients with low-risk MGUS who do not display clinical or laboratory evidence of myeloma or related disorders.

The importance of educating patients to report any new worrisome symptom (eg, fatigue, neuropathy, weight loss, night sweats, bone pain) cannot be overemphasized, as some patients may progress to myeloma or other disorders between follow-up visits.
- van de Donk NW, Palumbo A, Johnsen HE, et al; European Myeloma Network. The clinical relevance and management of monoclonal gammopathy of undetermined significance and related disorders: recommendations from the European Myeloma Network. Haematologica 2014; 99(6):984–996. doi:10.3324/haematol.2013.100552
- International Myeloma Working Group. Criteria for the classification of monoclonal gammopathies, multiple myeloma and related disorders: a report of the International Myeloma Working Group. Br J Haematol 2003; 121(5):749–757. pmid:12780789
- Rajan AM, Rajkumar SV. Diagnostic evaluation of monoclonal gammopathy of undetermined significance. Eur J Haematol 2013; 91(6):561–562. doi:10.1111/ejh.12198
- Kyle RA, Rajkumar SV. Monoclonal gammopathy of undetermined significance. Br J Haematol 2006; 134(6):573–589. doi:10.1111/j.1365-2141.2006.06235.x
- Kyle RA, Durie BG, Rajkumar SV, et al; International Myeloma Working Group. Monoclonal gammopathy of undetermined significance (MGUS) and smoldering (asymptomatic) multiple myeloma: IMWG consensus perspectives risk factors for progression and guidelines for monitoring and management. Leukemia 2010; 24(6):1121–1127. doi:10.1038/leu.2010.60
- Bird J, Behrens J, Westin J, et al; Haemato-oncology Task Force of the British Committee for Standards in Haematology, UK Myeloma Forum and Nordic Myeloma Study Group. UK Myeloma Forum (UKMF) and Nordic Myeloma Study Group (NMSG): guidelines for the investigation of newly detected M-proteins and the management of monoclonal gammopathy of undetermined significance (MGUS). Br J Haematol 2009; 147(1):22–42. doi:10.1111/j.1365-2141.2009.07807.x
- Rajkumar SV, Kyle RA, Buadi FK. Advances in the diagnosis, classification, risk stratification, and management of monoclonal gammopathy of undetermined significance: implications for recategorizing disease entities in the presence of evolving scientific evidence. Mayo Clin Proc 2010; 85(10):945–948. doi:10.4065/mcp.2010.0520
- Kyle RA, Therneau TM, Rajkumar SV, et al. A long-term study of prognosis in monoclonal gammopathy of undetermined significance. N Engl J Med 2002; 346(8):564–569. doi:10.1056/NEJMoa01133202
- Doyle LM, Gundrum JD, Farnen JP, Wright LJ, Kranig JAI, Go RS. Determining why and which clinicians order serum protein electrophoresis (SPEP), subsequent diagnoses based on indications, and clinical significance of routine follow-up: a study of patients with monoclonal gammopathy of undetermined significance (MGUS). Blood 2009; 114(22):Abstr 4883. www.bloodjournal.org/content/114/22/4883. Accessed December 4, 2018.
- Merlini G, Palladini G. Differential diagnosis of monoclonal gammopathy of undetermined significance. Hematology Am Soc Hematol Educ Program 2012; 2012:595–603. doi:10.1182/asheducation-2012.1.595
- Glavey SV, Leung N. Monoclonal gammopathy: the good, the bad and the ugly. Blood Rev 2016; 30(3):223–231. doi:10.1016/j.blre.2015.12.001
- Dispenzieri A, Gertz MA, Therneau TM, Kyle RA. Retrospective cohort study of 148 patients with polyclonal gammopathy. Mayo Clin Proc 2001; 76(5):476–487. doi:10.4065/76.5.476
- Merlini G, Stone MJ. Dangerous small B-cell clones. Blood 2006; 108(8):2520–2530. doi:10.1182/blood-2006-03-001164
- Rajkumar SV, Dimopoulos MA, Palumbo A, et al. International Myeloma Working Group updated criteria for the diagnosis of multiple myeloma. Lancet Oncol 2014; 15(12):e538–e548. doi:10.1016/S1470-2045(14)70442-5
- Kyle RA, Gertz MA, Witzig TE, et al. Review of 1027 patients with newly diagnosed multiple myeloma. Mayo Clin Proc 2003; 78(1):21–33. doi:10.4065/78.1.21
- Hutchison CA, Harding S, Hewins P, et al. Quantitative assessment of serum and urinary polyclonal free light chains in patients with chronic kidney disease. Clin J Am Soc Nephrol 2008; 3(6):1684–1690. doi:10.2215/CJN.02290508
- Katzmann JA, Dispenzieri A, Kyle RA, et al. Elimination of the need for urine studies in the screening algorithm for monoclonal gammopathies by using serum immunofixation and free light chain assays. Mayo Clin Proc 2006; 81(12):1575–1578. doi:10.4065/81.12.1575
- Berenson JR, Anderson KC, Audell RA, et al. Monoclonal gammopathy of undetermined significance: a consensus statement. Br J Haematol 2010; 150(1):28–38. doi:10.1111/j.1365-2141.2010.08207.x
- Mangiacavalli S, Cocito F, Pochintesta L, et al. Monoclonal gammopathy of undetermined significance: a new proposal of workup. Eur J Haematol 2013; 91(4):356–360. doi:10.1111/ejh.12172
- Bianchi G, Kyle RA, Colby CL, et al. Impact of optimal follow-up of monoclonal gammopathy of undetermined significance on early diagnosis and prevention of myeloma-related complications. Blood 2010;116:2019–2025. doi:10.1182/blood-2010-04-277566
- Rosiñol L, Cibeira MT, Montoto S, et al. Monoclonal gammopathy of undetermined significance: predictors of malignant transformation and recognition of an evolving type characterized by a progressive increase in M protein size. Mayo Clin Proc 2007; 82(4):428–434. doi:10.4065/82.4.428
- Vanderschueren S, Mylle M, Dierickx D, et al. Monoclonal gammopathy of undetermined significance: significant beyond hematology. Mayo Clin Proc 2009; 84(9):842–845. doi:10.4065/84.9.842
- Kyle RA, Rajkumar SV. Monoclonal gammopathy of undetermined significance and smouldering multiple myeloma: emphasis on risk factors for progression. Br J Haematol 2007; 139(5):730–743. doi:10.1111/j.1365-2141.2007.06873.x
- Leung N, Bridoux F, Hutchison CA, et al; International Kidney and Monoclonal Gammopathy Research Group. Monoclonal gammopathy of renal significance: when MGUS is no longer undetermined or insignificant. Blood. 2012; 120(22):4292–4295. doi:10.1182/blood-2012-07-445304
- Merlini G, Wechalekar AD, Palladini G. Systemic light chain amyloidosis: an update for treating physicians. Blood 2013; 121(26):5124–5130. doi:10.1182/blood-2013-01-453001
- Dispenzieri A, Katzmann JA, Kyle RA, et al. Prevalence and risk of progression of light-chain monoclonal gammopathy of undetermined significance: a retrospective population-based cohort study. Lancet 2010; 375(9727):1721–1728. doi:10.1016/S0140-6736(10)60482-5
- Rajkumar SV, Kyle RA, Therneau TM, et al. Serum free light chain ratio is an independent risk factor for progression in monoclonal gammopathy of undetermined significance. Blood 2005; 106(3):812–817. doi:10.1182/blood-2005-03-1038
- Dimopoulos MA, Hillengass J, Usmani S, et al. Role of magnetic resonance imaging in the management of patients with multiple myeloma: a consensus statement. J Clin Oncol 2015; 33(6):657–664. doi:10.1200/JCO.2014.57.9961
- Dimopoulos M, Kyle R, Fermand JP, et al. Consensus recommendations for standard investigative workup: report of the International Myeloma Workshop Consensus Panel 3. Blood 2011; 117(18):4701–4705. doi:10.1182/blood-2010-10-299529
- Pompa T, Maddox M, Woodard A, et al. Cost effectiveness in low risk MGUS patients. Blood 2016; 128:2360. http://www.bloodjournal.org/content/128/22/2360. Accessed December 4, 2018.
MGUS is present in 3% to 4% of the population over age 50 and is more common in older men, African Americans, and Africans.1–6
The overall risk of progression to myeloma and related disorders is less than or equal to 1% per year depending on the subtype of the M protein (higher risk with IgM than non-IgM and light-chain MGUS).7,8 While the risk of malignant transformation is low, multiple myeloma is almost always preceded by the presence of an asymptomatic and often unrecognized monoclonal protein.
WHEN SHOULD WE LOOK FOR AN M PROTEIN?
An M protein is typically an incidental finding when a patient is being assessed for any of a number of presenting symptoms or conditions. A large retrospective study9 found that screening for MGUS was mostly performed by internal medicine physicians. The indications for testing were anemia, bone-related issues, elevated creatinine, elevated erythrocyte sedimentation rate, and neuropathy.
A low anion gap is not a major indicator of an M protein unless in a high concentration, in which case other manifestations would be present, such as renal failure, which would guide the diagnosis. Polyclonal hypergammaglobulinemia as a cause of low anion gap is far more common than MGUS.
HOW SHOULD WE SCREEN FOR AN M PROTEIN?
Serum protein electrophoresis is an initial test used to identify an M protein and has a key role in quantifying it (Figure 2). An M protein appears as a narrow spike on the agarose gel and should be distinguished from the broad band seen in polyclonal gammopathies associated with cirrhosis and chronic infectious and inflammatory conditions, among others.12 A major disadvantage of serum protein electrophoresis is that it cannot detect an M protein in very low concentrations or determine its identity.
Serum immunofixation is more sensitive than serum protein electrophoresis and should always be ordered in conjunction with it, mostly to ensure detecting tiny amounts of M protein and to identify the type of its heavy chain and light-chain components.13
The serum free light-chain assay is also considered an essential part of the screening process to detect light-chain MGUS and light-chain myeloma. As many as 16% of myeloma patients secrete only light chains, which may not be identified on serum immunofixation.3,6,7,10,14,15 In general, a low kappa-lambda ratio (< 0.26) indicates the overproduction of lambda light chains, and a high ratio (> 1.65) indicates the overproduction of kappa light chains.
The serum free light-chain assay helps detect abnormal secretion of monoclonal light chains before they appear in the urine once the kidney tubules become saturated and unable to reabsorb them.
Of note, the free light-chain ratio can be abnormal (< 0.26 or > 1.65) in chronic kidney disease. Thus, it may be challenging to discern whether an abnormal light-chain ratio is related to impaired light-chain clearance by the kidneys or to MGUS. In general, kappa light chains are more elevated than lambda light chains in chronic kidney disease, but the ratio should not be considerably skewed. A kappa-lambda ratio below 0.37 or above 3 is rarely seen in chronic kidney disease and should prompt workup for MGUS.16
Tests in combination. The sensitivity of screening for M proteins ranges from 82% with serum protein electrophoresis alone to 93% with the addition of serum immunofixation and to 98% with the serum free light-chain assay.15 The latter can replace urine protein electrophoresis and immunofixation when screening for M protein, given its higher sensitivity.15,17 An important caveat is that urine dipstick testing does not detect urine light chains.
Table 3 lists the initial laboratory tests required in patients with MGUS.
WHAT IS THE DIFFERENTIAL DIAGNOSIS OF MONOCLONAL GAMMOPATHIES?
that feature an M protein and would otherwise require treatment (Table 4). The differential diagnosis includes smoldering multiple myeloma, symptomatic multiple myeloma, Waldenström macroglobulinemia, light-chain amyloidosis, low-grade B-cell lymphoproliferative disorders, a variety of monoclonal protein-related kidney disorders, and plasmacytomas.10,14
MGUS
Based on the International Myeloma Working Group consensus, a formal diagnosis of MGUS is established when a serum M protein is detected and measured at a concentration less than 3 g/dL on serum protein electrophoresis along with less than 10% clonal plasma cells in the bone marrow.1–6,14,18,19 Nevertheless, bone marrow biopsy can be omitted in certain patients as discussed below. The absence of myeloma-related organ damage—particularly osteolytic bone lesions, anemia, otherwise unexplained renal failure, and hypercalcemia—is fundamental and necessary for a diagnosis of MGUS.
Smoldering multiple myeloma
Compared with patients with MGUS, patients with smoldering multiple myeloma have higher M protein concentrations (≥ 3 g/dL) or 10% or more clonal plasma cells in the marrow or both, and are at higher risk of progression to symptomatic multiple myeloma. Nevertheless, like patients with MGUS, they have no myeloma symptoms or evidence of end-organ damage.
Symptomatic multiple myeloma
By definition, patients with multiple myeloma develop organ damage related to their malignancy and need therapy to halt disease progression. Multiple myeloma causes clinical manifestations through cellular infiltration of the bone and bone marrow (anemia, osteolysis, and hypercalcemia) and light chain-induced toxicity (renal tubular damage and cast nephropathy).
In 2014, the definition of multiple myeloma was updated to include 3 new myeloma-defining events that herald a significantly higher risk of progression from smoldering to symptomatic multiple myeloma, and now constitute an integral part of the diagnosis of symptomatic multiple myeloma. These are:
- Focal lesions (> 1 lesion larger than 5 mm) visible on magnetic resonance imaging
- ≥ 60% clonal plasma cells on bone marrow biopsy
- Ratio of involved to uninvolved serum free light chains ≥ 100 (the involved light chain is the one detected on serum protein electrophoresis and immunofixation).14
Bone pain, symptoms of anemia, and decreased urine output may suggest myeloma, but are not diagnostic. Although the “CRAB” criteria (elevated calcium, renal failure, anemia, and bone lesions) define multiple myeloma, the presence of anemia, hypercalcemia, or renal dysfunction do not by themselves mark transformation from MGUS to multiple myeloma. Thus, other causes need to be considered, since the risk of transformation is so low. Importantly, hyperparathyroidism must be ruled out if hypercalcemia is present in a patient with MGUS.10
Waldenström macroglobulinemia
Waldenström macroglobulinemia, also called lymphoplasmacytic lymphoma, is an indolent non-Hodgkin B-cell lymphoma that can invade the marrow, liver, spleen, and lymph nodes, leading to anemia and organomegaly. It features a monoclonal IgM protein that can be associated with increased blood viscosity, cold agglutinin disease, peripheral neuropathy, and cryoglobulinemia.
Waldenström macroglobulinemia should be suspected in any patient with IgM type M protein and symptoms related to hyperviscosity (headache, blurry vision, lightheadedness, shortness of breath, unexplained epistaxis, gum bleeding); systemic symptoms (fever, weight loss, and night sweats); and abdominal pain (due to organomegaly).23
Monoclonal gammopathy of renal significance
Monoclonal gammopathy of renal significance (MGRS) is a newly recognized entity defined by kidney dysfunction associated with an M protein without evidence of myeloma or other lymphoid disorders.24 Multiple disorders have been included in this category with different underlying mechanisms of kidney injury. This entity is beyond the scope of this discussion.
Light-chain amyloidosis
Misfolded light-chain deposition leading to organ dysfunction is the hallmark of light-chain amyloidosis, which constitutes a subset of MGRS. An abnormal light-chain ratio, especially if skewed toward lambda should trigger an investigation for light-chain amyloidosis.10
Abnormal light chains may infiltrate any organ or tissue, but of greatest concern is infiltration of the myocardium with ensuing heart failure manifestations. N-terminal pro-B-type natriuretic peptide (NT-proBNP) is a sensitive marker for cardiac amyloidosis in the presence of suggestive features on transthoracic echocardiography (eg, left ventricular hypertrophy) but is not specific as it can be elevated in heart failure regardless of the underlying cause.10
Glomerular injury with nephrotic syndrome may also point toward renal involvement by light-chain amyloidosis and establishes a key distinctive factor from myeloma in which tubular injury is the main mechanism of kidney dysfunction.
Clinical clues for light-chain amyloidosis include heart failure symptoms, neuropathy, and macroglossia. If any of these symptoms and signs is present, we recommend electrocardiography (look for low voltage in limb leads), transthoracic echocardiography, measuring the NT-proBNP level, and urinalysis to look for albuminuria. Notably, carpal tunnel syndrome may be a very early clinical manifestation of amyloidosis, but by itself it is nonspecific. Light-chain amyloidosis is a common cause of macroglossia in adults.10,25
Neuropathy associated with M proteins is a clinical entity related to a multitude of disorders that may necessitate treating the underlying cellular clone responsible for the secretion of the toxic M protein. These disorders include light-chain amyloidosis, POEMS (polyneuropathy, organomegaly, endocrinopathy, M protein, and skin changes or sclerotic bone lesions) syndrome, and IgM-related neuropathies with anti-myelin-associated glycoprotein antibodies.3,10,11,14
Notably, weight loss and fatigue in a patient with MGUS may be the first signs of light-chain amyloidosis or Waldenström macroglobulinemia and should prompt further evaluation.25
HOW ARE PATIENTS WITH MGUS RISK-STRATIFIED AND FOLLOWED?
Research has helped to refine the diagnostic workup and recognize subsets of patients with MGUS at different risks of progression to myeloma and related disorders. Factors predicting progression are 1,6,7,26,27:
- The amount of the M protein
- The type of M protein (IgG vs non-IgG)
- An abnormal free light-chain ratio.
Half of patients with MGUS fall into the low-risk category, which is defined by IgG-type serum M protein in a concentration less than 1.5 g/dL and a normal serum free light-chain ratio (kappa-lambda 0.26–1.65).5,27 The absolute risk of progression at 20 years is only 5% for patients with low-risk MGUS, compared with 58% in patients with high-risk MGUS (positive for all 3 risk factors).5
The presence of less than 10% plasma cells in the bone marrow is required to satisfy the definition of MGUS, but bone marrow biopsy can be omitted for patients with low-risk MGUS, given the slim chance of finding a significant percentage of clonal plasma cells in the marrow and the inherently low risk of progression.5,10 Skeletal surveys are often deferred for low-risk MGUS, but we obtain them in all our patients to ensure the absence of plasmacytomas, which need to be treated (typically with radiotherapy). Importantly, patients with unexplained bone pain (mostly in long bones, ribs, and spine, whereas joints are not typically involved) and a normal skeletal survey should undergo advanced imaging (whole-body magnetic resonance imaging or whole-body positron emission tomography and computed tomography) to detect bone lesions otherwise missed on plain radiography.28,29
Most of the recommendations regarding follow-up are based on expert opinion, given the lack of randomized data. Most experts agree that all patients should be reevaluated 6 months after an M protein is detected, with laboratory surveillance tests (complete blood cell count, serum creatinine, serum calcium level, serum protein electrophoresis, and serum free light chains). Low-risk patients with a stable M protein level can be followed every 2 to 3 years.
Suspect malignant progression if the serum M protein level increases by 50% or more (with an absolute increase of ≥ 0.5 g/dL); the serum M protein level is 3 g/dL or higher; the serum free light-chain ratio is more than 100; or the patient has unexplained anemia, elevated creatinine, bone pain, fracture, or hypercalcemia.
Patients at intermediate or high risk should be followed annually after the initial 6-month visit.5,7,10
A recent study highlighted the importance of risk stratification in reducing the costs associated with an overzealous diagnostic workup of patients with low-risk MGUS.30 These savings are in addition to a reduction in patient anticipation and anxiety that universally occur before invasive procedures.
THE ROLE OF THE PRIMARY CARE PROVIDER AND THE HEMATOLOGIST
Once an M protein is identified, a comprehensive history, physical examination, and laboratory tests (serum protein electrophoresis to quantify the protein, serum immunofixation, serum free light chains, complete blood cell count, calcium, and creatinine) should be done, taking into consideration the differential diagnosis of monoclonal gammopathies discussed above. After MGUS is confirmed, the patient should be risk-stratified to determine the need for bone marrow biopsy and to predict the risk of progression to more serious conditions.
Referral to a hematologist is warranted for patients with intermediate- and high-risk MGUS, patients with abnormal serum free light-chain ratios, and those who show evidence of malignant progression. Patients with intermediate- and high-risk MGUS could be referred for bone marrow biopsy before assessment by a hematologist. The primary care provider may continue to follow patients with low-risk MGUS who do not display clinical or laboratory evidence of myeloma or related disorders.
The importance of educating patients to report any new worrisome symptom (eg, fatigue, neuropathy, weight loss, night sweats, bone pain) cannot be overemphasized, as some patients may progress to myeloma or other disorders between follow-up visits.
- van de Donk NW, Palumbo A, Johnsen HE, et al; European Myeloma Network. The clinical relevance and management of monoclonal gammopathy of undetermined significance and related disorders: recommendations from the European Myeloma Network. Haematologica 2014; 99(6):984–996. doi:10.3324/haematol.2013.100552
- International Myeloma Working Group. Criteria for the classification of monoclonal gammopathies, multiple myeloma and related disorders: a report of the International Myeloma Working Group. Br J Haematol 2003; 121(5):749–757. pmid:12780789
- Rajan AM, Rajkumar SV. Diagnostic evaluation of monoclonal gammopathy of undetermined significance. Eur J Haematol 2013; 91(6):561–562. doi:10.1111/ejh.12198
- Kyle RA, Rajkumar SV. Monoclonal gammopathy of undetermined significance. Br J Haematol 2006; 134(6):573–589. doi:10.1111/j.1365-2141.2006.06235.x
- Kyle RA, Durie BG, Rajkumar SV, et al; International Myeloma Working Group. Monoclonal gammopathy of undetermined significance (MGUS) and smoldering (asymptomatic) multiple myeloma: IMWG consensus perspectives risk factors for progression and guidelines for monitoring and management. Leukemia 2010; 24(6):1121–1127. doi:10.1038/leu.2010.60
- Bird J, Behrens J, Westin J, et al; Haemato-oncology Task Force of the British Committee for Standards in Haematology, UK Myeloma Forum and Nordic Myeloma Study Group. UK Myeloma Forum (UKMF) and Nordic Myeloma Study Group (NMSG): guidelines for the investigation of newly detected M-proteins and the management of monoclonal gammopathy of undetermined significance (MGUS). Br J Haematol 2009; 147(1):22–42. doi:10.1111/j.1365-2141.2009.07807.x
- Rajkumar SV, Kyle RA, Buadi FK. Advances in the diagnosis, classification, risk stratification, and management of monoclonal gammopathy of undetermined significance: implications for recategorizing disease entities in the presence of evolving scientific evidence. Mayo Clin Proc 2010; 85(10):945–948. doi:10.4065/mcp.2010.0520
- Kyle RA, Therneau TM, Rajkumar SV, et al. A long-term study of prognosis in monoclonal gammopathy of undetermined significance. N Engl J Med 2002; 346(8):564–569. doi:10.1056/NEJMoa01133202
- Doyle LM, Gundrum JD, Farnen JP, Wright LJ, Kranig JAI, Go RS. Determining why and which clinicians order serum protein electrophoresis (SPEP), subsequent diagnoses based on indications, and clinical significance of routine follow-up: a study of patients with monoclonal gammopathy of undetermined significance (MGUS). Blood 2009; 114(22):Abstr 4883. www.bloodjournal.org/content/114/22/4883. Accessed December 4, 2018.
- Merlini G, Palladini G. Differential diagnosis of monoclonal gammopathy of undetermined significance. Hematology Am Soc Hematol Educ Program 2012; 2012:595–603. doi:10.1182/asheducation-2012.1.595
- Glavey SV, Leung N. Monoclonal gammopathy: the good, the bad and the ugly. Blood Rev 2016; 30(3):223–231. doi:10.1016/j.blre.2015.12.001
- Dispenzieri A, Gertz MA, Therneau TM, Kyle RA. Retrospective cohort study of 148 patients with polyclonal gammopathy. Mayo Clin Proc 2001; 76(5):476–487. doi:10.4065/76.5.476
- Merlini G, Stone MJ. Dangerous small B-cell clones. Blood 2006; 108(8):2520–2530. doi:10.1182/blood-2006-03-001164
- Rajkumar SV, Dimopoulos MA, Palumbo A, et al. International Myeloma Working Group updated criteria for the diagnosis of multiple myeloma. Lancet Oncol 2014; 15(12):e538–e548. doi:10.1016/S1470-2045(14)70442-5
- Kyle RA, Gertz MA, Witzig TE, et al. Review of 1027 patients with newly diagnosed multiple myeloma. Mayo Clin Proc 2003; 78(1):21–33. doi:10.4065/78.1.21
- Hutchison CA, Harding S, Hewins P, et al. Quantitative assessment of serum and urinary polyclonal free light chains in patients with chronic kidney disease. Clin J Am Soc Nephrol 2008; 3(6):1684–1690. doi:10.2215/CJN.02290508
- Katzmann JA, Dispenzieri A, Kyle RA, et al. Elimination of the need for urine studies in the screening algorithm for monoclonal gammopathies by using serum immunofixation and free light chain assays. Mayo Clin Proc 2006; 81(12):1575–1578. doi:10.4065/81.12.1575
- Berenson JR, Anderson KC, Audell RA, et al. Monoclonal gammopathy of undetermined significance: a consensus statement. Br J Haematol 2010; 150(1):28–38. doi:10.1111/j.1365-2141.2010.08207.x
- Mangiacavalli S, Cocito F, Pochintesta L, et al. Monoclonal gammopathy of undetermined significance: a new proposal of workup. Eur J Haematol 2013; 91(4):356–360. doi:10.1111/ejh.12172
- Bianchi G, Kyle RA, Colby CL, et al. Impact of optimal follow-up of monoclonal gammopathy of undetermined significance on early diagnosis and prevention of myeloma-related complications. Blood 2010;116:2019–2025. doi:10.1182/blood-2010-04-277566
- Rosiñol L, Cibeira MT, Montoto S, et al. Monoclonal gammopathy of undetermined significance: predictors of malignant transformation and recognition of an evolving type characterized by a progressive increase in M protein size. Mayo Clin Proc 2007; 82(4):428–434. doi:10.4065/82.4.428
- Vanderschueren S, Mylle M, Dierickx D, et al. Monoclonal gammopathy of undetermined significance: significant beyond hematology. Mayo Clin Proc 2009; 84(9):842–845. doi:10.4065/84.9.842
- Kyle RA, Rajkumar SV. Monoclonal gammopathy of undetermined significance and smouldering multiple myeloma: emphasis on risk factors for progression. Br J Haematol 2007; 139(5):730–743. doi:10.1111/j.1365-2141.2007.06873.x
- Leung N, Bridoux F, Hutchison CA, et al; International Kidney and Monoclonal Gammopathy Research Group. Monoclonal gammopathy of renal significance: when MGUS is no longer undetermined or insignificant. Blood. 2012; 120(22):4292–4295. doi:10.1182/blood-2012-07-445304
- Merlini G, Wechalekar AD, Palladini G. Systemic light chain amyloidosis: an update for treating physicians. Blood 2013; 121(26):5124–5130. doi:10.1182/blood-2013-01-453001
- Dispenzieri A, Katzmann JA, Kyle RA, et al. Prevalence and risk of progression of light-chain monoclonal gammopathy of undetermined significance: a retrospective population-based cohort study. Lancet 2010; 375(9727):1721–1728. doi:10.1016/S0140-6736(10)60482-5
- Rajkumar SV, Kyle RA, Therneau TM, et al. Serum free light chain ratio is an independent risk factor for progression in monoclonal gammopathy of undetermined significance. Blood 2005; 106(3):812–817. doi:10.1182/blood-2005-03-1038
- Dimopoulos MA, Hillengass J, Usmani S, et al. Role of magnetic resonance imaging in the management of patients with multiple myeloma: a consensus statement. J Clin Oncol 2015; 33(6):657–664. doi:10.1200/JCO.2014.57.9961
- Dimopoulos M, Kyle R, Fermand JP, et al. Consensus recommendations for standard investigative workup: report of the International Myeloma Workshop Consensus Panel 3. Blood 2011; 117(18):4701–4705. doi:10.1182/blood-2010-10-299529
- Pompa T, Maddox M, Woodard A, et al. Cost effectiveness in low risk MGUS patients. Blood 2016; 128:2360. http://www.bloodjournal.org/content/128/22/2360. Accessed December 4, 2018.
KEY POINTS
- MGUS is the most common of the monoclonal gammopathies.
- The overall risk of MGUS progressing to myeloma and other lymphoproliferative disorders is 1% per year.
- Low-risk MGUS is defined by an immunoglobulin G monoclonal protein at a concentration less than 1.5 g/dL and a normal serum free light-chain ratio.
- Low-risk MGUS carries a much lower risk of progression than intermediate- and high-risk MGUS, may not require subspecialty referral, and can be followed by the outpatient provider.
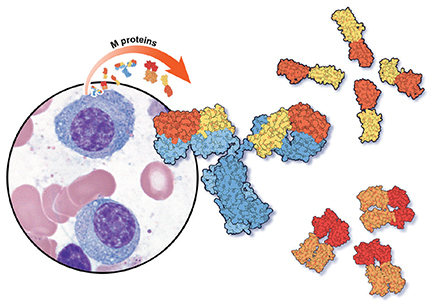
Hypertension guidelines: Treat patients, not numbers
When treating high blood pressure, how low should we try to go? Debate continues about optimal blood pressure goals after publication of guidelines from the American College of Cardiology and American Heart Association (ACC/AHA) in 2017 that set or permitted a treatment goal of less than 130 mm Hg, depending on the population.1
In this article, we summarize the evolution of hypertension guidelines and the evidence behind them.
HOW THE GOALS EVOLVED
JNC 7, 2003: 140/90 or 130/80
The seventh report of the Joint National Committee on Prevention, Detection, Evaluation, and Treatment of High Blood Pressure (JNC 7),2 published in 2003, specified treatment goals of:
- < 140/90 mm Hg for most patients
- < 130/80 mm Hg for those with diabetes or chronic kidney disease.

JNC 7 provided much-needed clarity and uniformity to managing hypertension. Since then, various scientific groups have published their own guidelines (Table 1).1–9
ACC/AHA/CDC 2014: 140/90
In 2014, the ACC, AHA, and US Centers for Disease Control and Prevention (CDC) published an evidence-based algorithm for hypertension management.3 As in JNC 7, they suggested a blood pressure goal of less than 140/90 mm Hg, lifestyle modification, and polytherapy, eg, a thiazide diuretic for stage 1 hypertension (< 160/100 mm Hg) and combination therapy with a thiazide diuretic and an angiotensin-converting enzyme (ACE) inhibitor, angiotensin II receptor blocker (ARB), or calcium channel blocker for stage 2 hypertension (≥ 160/100 mm Hg).
JNC 8 2014: 140/90 or 150/90
Soon after, the much-anticipated report of the panel members appointed to the eighth JNC (JNC 8) was published.4 Previous JNC reports were written and published under the auspices of the National Heart, Lung, and Blood Institute, but while the JNC 8 report was being prepared, this government body announced it would no longer publish guidelines.
In contrast to JNC 7, the JNC 8 panel based its recommendations on a systematic review of randomized clinical trials. However, the process and methodology were controversial, especially as the panel excluded some important clinical trials from the analysis.
JNC 8 relaxed the targets in several subgroups, such as patients over age 60 and those with diabetes and chronic kidney disease, due to a lack of definitive evidence on the impact of blood pressure targets lower than 140/90 mm Hg in these groups. Thus, their goals were:
- < 140/90 mm Hg for patients under age 60
- < 150/90 mm Hg for patients age 60 and older.

Of note, a minority of the JNC 8 panel disagreed with the new targets and provided evidence for keeping the systolic blood pressure target below 140 mm Hg for patients 60 and older.5 Further, the JNC 8 report was not endorsed by several important societies, ie, the AHA, ACC, National Heart, Lung, and Blood Institute, and American Society of Hypertension (ASH). These issues compromised the acceptance and applicability of the guidelines.
ASH/ISH 2014: 140/90 or 150/90
Also in 2014, the ASH and the International Society of Hypertension released their own report.6 Their goals:
- < 140/90 mm Hg for most patients
- < 150/90 mm Hg for patients age 80 and older.
AHA/ACC/ASH 2015: Goals in subgroups
In 2015, the AHA, ACC, and ASH released a joint scientific statement outlining hypertension goals for specific patient populations7:
- < 150/90 mm Hg for those age 80 and older
- < 140/90 mm Hg for those with coronary artery disease
- < 130/80 mm Hg for those with comorbidities such as diabetes and cardiovascular disease.
ADA 2016: Goals for patients with diabetes
In 2016, the American Diabetes Association (ADA) set the following blood pressure goals for patients with diabetes8:
- < 140/90 mm Hg for adults with diabetes
- < 130/80 mm Hg for younger adults with diabetes and adults with a high risk of cardiovascular disease
- 120–160/80–105 mm Hg for pregnant patients with diabetes and preexisting hypertension who are treated with antihypertensive therapy.
ACP/AAFP 2017: Systolic 150 or 130
In 2017, the American College of Physicians (ACP) and the American Academy of Family Physicians (AAFP) recommended a relaxed systolic blood pressure target, ie, below 150 mm Hg, for adults over age 60, but a tighter goal of less than 140 mm Hg for the same age group if they have transient ischemic attack, stroke, or high cardiovascular risk.9
ACC/AHA 2017: 130/80
The 2017 ACC/AHA guidelines recommended a more aggressive goal of below 130/80 for all, including patients age 65 and older.1
This is a class I (strong) recommendation for patients with known cardiovascular disease or a 10-year risk of a cardiovascular event of 10% or higher, with a B-R level of evidence for the systolic goal (ie, moderate-quality, based on systematic review of randomized controlled trials) and a C-EO level of evidence for the diastolic goal (ie, based on expert opinion).
For patients who do not have cardiovascular disease and who are at lower risk of it, this is a class IIb (weak) recommendation, ie, it “may be reasonable,” with a B-NR level of evidence (moderate-quality, based on nonrandomized studies) for the systolic goal and C-EO (expert opinion) for the diastolic goal.
For many patients, this involves drug treatment. For those with known cardiovascular disease or a 10-year risk of an atherosclerotic cardiovascular disease event of 10% or higher, the ACC/AHA guidelines say that drug treatment “is recommended” if their average blood pressure is 130/80 mm Hg or higher (class I recommendation, based on strong evidence for the systolic threshold and expert option for the diastolic). For those without cardiovascular disease and at lower risk, drug treatment is recommended if their average blood pressure is 140/90 mm Hg or higher (also class I, but based on limited data).
EVERYONE AGREES ON LIFESTYLE
Although the guidelines differ in their blood pressure targets, they consistently recommend lifestyle modifications.
Lifestyle modifications, first described in JNC 7, included weight loss, sodium restriction, and the DASH diet, which is rich in fruits, vegetables, low-fat dairy products, whole grains, poultry, and fish, and low in red meat, sweets, cholesterol, and total and saturated fat.2
These recommendations were based on results from 3 large randomized controlled trials in patients with and without hypertension.10–12 In patients with no history of hypertension, interventions to promote weight loss and sodium restriction significantly reduced blood pressure and the incidence of hypertension (the latter by as much as 77%) compared with usual care.10,11
In patients with and without hypertension, lowering sodium intake in conjunction with the DASH diet was associated with substantially larger reductions in systolic blood pressure.12
The recommendation to lower sodium intake has not changed in the guideline revisions. Meanwhile, other modifications have been added, such as incorporating both aerobic and resistance exercise and moderating alcohol intake. These recommendations have a class I level of evidence (ie, strongest level) in the 2017 ACC/AHA guidelines.1
HYPERTENSION BEGINS AT 130/80
The definition of hypertension changed in the 2017 ACC/AHA guidelines1: previously set at 140/90 mm Hg or higher, it is now 130/80 mm Hg or higher for all age groups. Adults with systolic blood pressure of 130 to 139 mm Hg or diastolic blood pressure of 80 to 89 mm Hg are now classified as having stage 1 hypertension.
Under the new definition, the number of US adults who have hypertension expanded to 45.6% of the general population,13 up from 31.9% under the JNC 7 definition. Thus, overall, 103.3 million US adults now have hypertension, compared with 72.2 million under the JNC 7 criteria.
In addition, the new guidelines expanded the population of adults for whom antihypertensive drug treatment is recommended to 36.2% (81.9 million). However, this represents only a 1.9% absolute increase over the JNC 7 recommendations (34.3%) and a 5.1% absolute increase over the JNC 8 recommendations.14
SPRINT: INTENSIVE TREATMENT IS BENEFICIAL
The new ACC/AHA guidelines1 were based on evidence from several trials, including the Systolic Blood Pressure Intervention Trial (SPRINT).15
This multicenter trial investigated the effect of intensive blood pressure treatment on cardiovascular disease risk.16 The primary outcome was a composite of myocardial infarction, acute coronary syndrome, stroke, and heart failure.
The trial enrolled 9,361 participants at least 50 years of age with systolic blood pressure 130 mm Hg or higher and at least 1 additional risk factor for cardiovascular disease. It excluded anyone with a history of diabetes mellitus, stroke, symptomatic heart failure, or end-stage renal disease.
Two interventions were compared:
- Intensive treatment, with a systolic blood pressure goal of less than 120 mm Hg: the protocol called for polytherapy, even for participants who were 75 or older if their blood pressure was 140 mm Hg or higher
- Standard treatment, with a systolic blood pressure goal of less than 140 mm Hg: it used polytherapy for patients whose systolic blood pressure was 160 mm Hg or higher.
The trial was intended to last 5 years but was stopped early at a median of 3.26 years owing to a significantly lower rate of the primary composite outcome in the intensive-treatment group: 1.65% per year vs 2.19%, a 25% relative risk reduction (P < .001) or a 0.54% absolute risk reduction. We calculate the number needed to treat (NNT) for 1 year to prevent 1 event as 185, and over the 3.26 years of the trial, the investigators calculated the NNT as 61. Similarly, the rate of death from any cause was also lower with intensive treatment, 1.03% per year vs 1.40% per year, a 27% relative risk reduction (P = .003) or a 0.37% absolute risk reduction, NNT 270.
Using these findings, Bress et al16 estimated that implementing intensive blood pressure goals could prevent 107,500 deaths annually.
The downside is adverse effects. In SPRINT,15 the intensive-treatment group experienced significantly higher rates of serious adverse effects than the standard-treatment group, ie:
- Hypotension 2.4% vs 1.4%, P = .001
- Syncope 2.3% vs 1.7%, P = .05
- Electrolyte abnormalities 3.1% vs 2.3%, P = .02)
- Acute kidney injury or kidney failure 4.1% vs 2.5%, P < .001
- Any treatment-related adverse event 4.7% vs 2.5%, P = .001.
Thus, Bress et al16 estimated that fully implementing the intensive-treatment goals could cause an additional 56,100 episodes of hypotension per year, 34,400 cases of syncope, 43,400 serious electrolyte disorders, and 88,700 cases of acute kidney injury. All told, about 3 million Americans could suffer a serious adverse effect under the intensive-treatment goals.
SPRINT caveats and limitations
SPRINT15 was stopped early, after 3.26 years instead of the planned 5 years. The true risk-benefit ratio may have been different if the trial had been extended longer.
In addition, SPRINT used automated office blood pressure measurements in which patients were seated alone and a device (Model 907, Omron Healthcare) took 3 blood pressure measurements at 1-minute intervals after 5 minutes of quiet rest. This was designed to reduce elevated blood pressure readings in the presence of a healthcare professional in a medical setting (ie, “white coat” hypertension).
Many physicians are still taking blood pressure manually, which tends to give higher readings. Therefore, if they aim for a lower goal, they may risk overtreating the patient.
About 50% of patients did not achieve the target systolic blood pressure (< 120 mm Hg) despite receiving an average of 2.8 antihypertensive medications in the intensive-treatment group and 1.8 in the standard-treatment group. The use of antihypertensive medications, however, was not a controlled variable in the trial, and practitioners chose the appropriate drugs for their patients.
Diastolic pressure, which can be markedly lower in older hypertensive patients, was largely ignored, although lower diastolic pressure may have contributed to higher syncope rates in response to alpha blockers and calcium blockers.
Moreover, the trial excluded those with significant comorbidities and those younger than 50 (the mean age was 67.9), which limits the generalizability of the results.
JNC 8 VS SPRINT GOALS: WHAT'S THE EFFECT ON OUTCOMES?
JNC 84 recommended a relaxed target of less than 140/90 mm Hg for adults younger than 60, including those with chronic kidney disease or diabetes, and less than 150/90 mm Hg for adults 60 and older. The SPRINT findings upended those recommendations, showing that intensive treatment in adults age 75 or older significantly improved the composite cardiovascular disease outcome (2.59 vs 3.85 events per year; P < .001) and all-cause mortality (1.78 vs 2.63 events per year; P < .05) compared with standard treatment.17 Also, a subset review of SPRINT trial data found no difference in benefit based on chronic kidney disease status.18
A meta-analysis of 74 clinical trials (N = 306,273) offers a compromise between the SPRINT findings and the JNC 8 recommendations.19 It found that the beneficial effect of blood pressure treatment depended on the patient’s baseline systolic blood pressure. In those with a baseline systolic pressure of 160 mm Hg or higher, treatment reduced cardiovascular mortality by about 15% (relative risk [RR] 0.85; 95% confidence interval [CI] 0.77–0.95). In patients with systolic pressure below 140 mm Hg, treatment effects were neutral (RR 1.03, 95% CI 0.87–1.20) and not associated with any benefit as primary prevention, although data suggest it may reduce the risk of adverse outcomes in patients with coronary heart disease.
OTHER TRIALS THAT INFLUENCED THE GUIDELINES

SHEP and HYVET (the Systolic Hypertension in the Elderly Program20 and the Hypertension in the Very Elderly Trial)21 supported intensive blood pressure treatment for older patients by reporting a reduction in fatal and nonfatal stroke risks for those with a systolic blood pressure above 160 mm Hg.
FEVER (the Felodipine Event Reduction study)22 found that treatment with a calcium channel blocker in even a low dose can significantly decrease cardiovascular events, cardiovascular disease, and heart failure compared with no treatment.
JATOS and VALISH (the Japanese Trial to Assess Optimal Systolic Blood Pressure in Elderly Hypertensive Patients23 and the Valsartan in Elderly Isolated Systolic Hypertension study)24 found that outcomes were similar with intensive vs standard treatment.
Ettehad et al25 performed a meta-analysis of 123 studies with more than 600,000 participants that provided strong evidence supporting blood pressure treatment goals below 130/90 mm Hg, in line with the SPRINT trial results.
BLOOD PRESSURE ISN’T EVERYTHING
Other trials remind us that although blood pressure is important, it is not the only factor affecting cardiovascular risk.
HOPE (the Heart Outcomes Prevention Evaluation)26 investigated the use of ramipril (an ACE inhibitor) in preventing myocardial infarction, stroke, or cardiovascular death in patients at high risk of cardiovascular events. The study included 9,297 participants over age 55 (mean age 66) with a baseline blood pressure 139/79 mm Hg. Follow-up was 4.5 years.
Ramipril was better than placebo, with significantly fewer patients experiencing adverse end points in the ramipril group compared with the placebo group:
- Myocardial infarction 9.9% vs 12.3%, RR 0.80, P < .001
- Cardiovascular death 6.1% vs 8.1%, RR 0.74, P < .001
- Stroke 3.4% vs 4.9%, RR = .68, P < .001
- The composite end point 14.0% vs 17.8%, RR 0.78, P < .001).
Results were even better in the subset of patients who had diabetes.27 However, the decrease in blood pressure attributable to antihypertensive therapy with ramipril was minimal (3–4 mm Hg systolic and 1–2 mm Hg diastolic). This slight change should not have been enough to produce significant differences in clinical outcomes, a major limitation of this trial. The investigators speculated that the positive results may be due to a class effect of ACE inhibitors.26
HOPE 328–30 explored the effect of blood pressure- and cholesterol-controlling drugs on the same primary end points but in patients at intermediate risk of major cardiovascular events. Investigators randomized the 12,705 patients to 4 treatment groups:
- Blood pressure control with candesartan (an ARB) plus hydrochlorothiazide (a thiazide diuretic)
- Cholesterol control with rosuvastatin (a statin)
- Blood pressure plus cholesterol control
- Placebo.
Therapy was started at a systolic blood pressure above 140 mm Hg.
Compared with placebo, the rate of composite events was significantly reduced in the rosuvastatin group (3.7% vs 4.8%, HR 0.76, P = .002)28 and the candesartan-hydrochlorothiazide-rosuvastatin group (3.6% vs 5.0%, HR 0.71; P = .005)29 but not in the candesartan-hydrochlorothiazide group (4.1% vs 4.4%; HR 0.93; P = .40).30
In addition, a subgroup analysis comparing active treatment vs placebo found a significant reduction in major cardiovascular events for treated patients whose baseline systolic blood pressure was in the upper third (> 143.5 mm Hg, mean 154.1 mm Hg), while treated patients in the lower middle and lower thirds had no significant reduction.30
These results suggest that intensive treatment to achieve a systolic blood pressure below 140 mm Hg in patients at intermediate risk may not be helpful. Nevertheless, there seems to be agreement that intensive treatment generally leads to a reduction in cardiovascular events. The results also show the benefit of lowering cholesterol.
Bundy et al31 performed a meta-analysis that provides support for intensive antihypertensive treatment. Reviewing 42 clinical trials in more than 144,000 patients, they found that treating to reach a target systolic blood pressure of 120 to 124 mm Hg can reduce cardiovascular events and all-cause mortality.
The trade-off is a minimal increase in the risk of adverse events. Also, the risk-benefit ratio of intensive treatment seems to vary in different patient subgroups.
WHAT ABOUT PATIENTS WITH COMORBIDITIES?
The debate over intensive vs standard treatment in blood pressure management extends beyond hypertension and includes important comorbidities such as diabetes, stroke, and renal disease. Patients with a history of stroke or end-stage renal disease have only a minimal mention in the AHA/ACC guidelines.
Diabetes
Emdin et al,32 in a meta-analysis of 40 trials that included more than 100,000 patients with diabetes, concluded that a 10-mm Hg lowering of systolic blood pressure significantly reduces the rates of all-cause mortality, cardiovascular disease, coronary heart disease, stroke, albuminuria, and retinopathy. Stratifying the results according to the systolic blood pressure achieved (≥ 130 or < 130 mm Hg), the relative risks of mortality, coronary heart disease, cardiovascular disease, heart failure, and albuminuria were actually lower in the higher stratum than in the lower.
ACCORD (the Action to Control Cardiovascular Risk in Diabetes)33 study provides contrary results. It examined intensive and standard blood pressure control targets in patients with type 2 diabetes at high risk of cardiovascular events, using primary outcome measures similar to those in SPRINT. It found no significant difference in fatal and nonfatal cardiovascular events between the intensive and standard blood pressure target arms.
Despite those results, the ACC/AHA guidelines still advocate for more intensive treatment (goal < 130/80 mm Hg) in all patients, including those with diabetes.1
The ADA position statement (September 2017) recommended a target below 140/90 mm Hg in patients with diabetes and hypertension.8 However, they also noted that lower systolic and diastolic blood pressure targets, such as below 130/80 mm Hg, may be appropriate for patients at high risk of cardiovascular disease “if they can be achieved without undue treatment burden.”8 Thus, it is not clear which blood pressure targets in patients with diabetes are the best.
Stroke
In patients with stroke, AHA/ACC guidelines1 recommend treatment if the blood pressure is 140/90 mm Hg or higher because antihypertensive therapy has been associated with a decrease in the recurrence of transient ischemic attack and stroke. The ideal target blood pressure is not known, but a goal of less than 130/80 mm Hg may be reasonable.
In the Secondary Prevention of Small Subcortical Strokes (SPS3) trial, a retrospective open-label trial, a target blood pressure below 130/80 mm Hg in patients with a history of lacunar stroke was associated with a lower risk of intracranial hemorrhage, but the difference was not statistically significant.34 For this reason, the ACC/AHA guidelines consider it reasonable to aim for a systolic blood pressure below 130 mm Hg in these patients.1
Renal disease
The ACC/AHA guidelines do not address how to manage hypertension in patients with end-stage renal disease, but for patients with chronic kidney disease they recommend a blood pressure target below 130/80 mm Hg.1 This recommendation is derived from the SPRINT trial,15 in which patients with stage 3 or 4 chronic kidney disease accounted for 28% of the study population. In that subgroup, intensive blood pressure control seemed to provide the same benefits for reduction in cardiovascular death and all-cause mortality.
TREAT PATIENTS, NOT NUMBERS
Blood pressure targets should be applied in the appropriate clinical context and on a patient-by-patient basis. In clinical practice, one size does not always fit all, as special cases exist.
For example, blood pressure can oscillate widely in patients with autonomic nerve disorders, making it difficult to strive for a specific target, especially an intensive one. Thus, it may be necessary to allow higher systolic blood pressure in these patients. Similarly, patients with diabetes or chronic kidney disease may be at higher risk of kidney injury with more intensive blood pressure management.
Treating numbers rather than patients may result in unbalanced patient care. The optimal approach to blood pressure management relies on a comprehensive risk factor assessment and shared decision-making with the patient before setting specific blood pressure targets.
OUR APPROACH
We aim for a blood pressure goal below 130/80 mm Hg for all patients with cardiovascular disease, according to the AHA/ACC guidelines. We aim for that same target in patients without cardiovascular disease but who have an elevated estimated cardiovascular risk (> 10%) over the next 10 years.
We recognize, however, that the benefits of aggressive blood pressure reduction may not be as clear in all patients, such as those with diabetes. We also recognize that some patient subgroups are at high risk of adverse events, including those with low diastolic pressure, chronic kidney disease, a history of falls, and older age. In those patients, we are extremely judicious when titrating antihypertensive medications. We often make smaller titrations, at longer intervals, and with more frequent laboratory testing and in-office follow-up.
Our process of managing hypertension through intensive blood pressure control to achieve lower systolic blood pressure targets requires a concerted effort among healthcare providers at all levels. It especially requires more involvement and investment from primary care providers to individualize treatment in their patients. This process has helped us to reach our treatment goals while limiting adverse effects of lower blood pressure targets.
MOVING FORWARD
Hypertension is a major risk factor for cardiovascular disease, and intensive blood pressure control has the potential to significantly reduce rates of morbidity and death associated with cardiovascular disease. Thus, a general consensus on the definition of hypertension and treatment goals is essential to reduce the risk of cardiovascular events in this large patient population.
Intensive blood pressure treatment has shown efficacy, but it has a small accompanying risk of adverse events, which varies in patient subgroups and affects the benefit-risk ratio of this therapy. For example, the cardiovascular benefit of intensive treatment is less clear in diabetic patients, and the risk of adverse events may be higher in older patients with chronic kidney disease.
Moving forward, more research is needed into the effects of intensive and standard treatment on patients of all ages, those with common comorbid conditions, and those with other important factors such as diastolic hypertension.
Finally, the various medical societies should collaborate on hypertension guideline development. This would require considerable planning and coordination but would ultimately be useful in creating a generalizable approach to hypertension management.
- Whelton PK, Carey RM, Aronow WS, et al. 2017 ACC/AHA/AAPA/ABC/ACPM/AGS/APhA/ASH/ASPC/NMA/PCNA guideline for the prevention, detection, evaluation, and management of high blood pressure in adults: a report of the American College of Cardiology/American Heart Association Task Force on Clinical Practice Guidelines. J Am Coll Cardiol 2018; 71(19):e127–e248. doi:10.1016/j.jacc.2017.11.006
- Chobanian AV, Bakris GL, Black HR, et al. The seventh report of the Joint National Committee on Prevention, Detection, Evaluation, and Treatment of High Blood Pressure: the JNC 7 report. JAMA 2003; 289(19):2560–2572. doi:10.1001/jama.289.19.2560
- Go AS, Bauman MA, King SM, et al. An effective approach to high blood pressure control: a science advisory from the American Heart Association, the American College of Cardiology, and the Centers for Disease Control and Prevention. Hypertension 2014; 63(4):878–885. doi:10.1161/HYP.0000000000000003
- James PA, Oparil S, Carter BL, et al. 2014 evidence-based guideline for the management of high blood pressure in adults: report from the panel members appointed to the Eighth Joint National Committee (JNC 8). JAMA 2014; 311(5):507–520. doi:10.1001/jama.2013.284427
- Wright JT Jr, Fine LJ, Lackland DT, Ogedegbe G, Dennison Himmelfarb CR. Evidence supporting a systolic blood pressure goal of less than 150 mm Hg in patients aged 60 years or older: the minority view. Ann Intern Med 2014; 160(7):499–503. doi:10.7326/M13-2981
- Weber MA, Schiffrin EL, White WB, et al. Notice of duplicate publication [duplicate publication of Weber MA, Schiffrin EL, White WB, et al. Clinical practice guidelines for the management of hypertension in the community: a statement by the American Society of Hypertension and the International Society of Hypertension. J Clin Hypertens 2014; 16(1):14–26. doi:10.1111/jch.12237] J Hypertens 2014; 32(1):3–15. doi:10.1097/HJH.0000000000000065
- Rosendorff C, Lackland DT, Allison M, et al. Treatment of hypertension in patients with coronary artery disease: a scientific statement from the American Heart Association, American College of Cardiology, and American Society of Hypertension. J Am Soc Hypertens 2015; 9(6):453–498. doi:10.1016/j.jash.2015.03.002
- de Boer IH, Bangalore S, Benetos A, et al. Diabetes and hypertension: a position statement by the American Diabetes Association. Diabetes Care 2017; 40(9):1273–1284. doi:10.2337/dci17-0026
- Qaseem A, Wilt TJ, Rich R, Humphrey LL, Frost J, Forciea MA. Pharmacologic treatment of hypertension in adults aged 60 years or older to higher versus lower blood pressure targets: a clinical practice guideline from the American College of Physicians and the American Academy of Family Physicians. Ann Intern Med 2017; 166(6):430–437. doi:10.7326/M16-1785
- The Trials of Hypertension Prevention Collaborative Research Group. Effects of weight loss and sodium reduction intervention on blood pressure and hypertension incidence in over-weight people with high normal blood pressure: the Trials of Hypertension Prevention, phase II. Arch Intern Med 1997; 157(6):657–667. pmid:9080920
- He J, Whelton PK, Appel LJ, Charleston J, Klag MJ. Long-term effects of weight loss and dietary sodium reduction on incidence of hypertension. Hypertension 2000; 35(2):544–549. pmid:10679495
- Sacks FM, Svetkey LP, Vollmer WM, et al. Effects on blood pressure of reduced dietary sodium and the Dietary Approaches to Stop Hypertension (DASH) diet. N Engl J Med 2001; 344(1):3–10. doi:10.1056/NEJM200101043440101
- Blackwell DL, Lucas JW, Clarke TC. Summary health statistics for US adults: National Health Interview Survey, 2012. National Center for Health Statistics. Vital Health Stat 10; 2014(260):1–161. pmid:24819891
- Muntner P, Carey RM, Gidding S, et al. Potential US population impact of the 2017 ACC/AHA high blood pressure guideline. J Am Coll Cardiol 2018; 71(2):109–118. doi:10.1016/j.jacc.2017.10.073
- SPRINT Research Group; Wright JT Jr, Williamson JD, Whelton PK, et al. A randomized trial of intensive versus standard blood-pressure control. N Engl J Med 2015; 373(22):2103–2116. doi:10.1056/NEJMoa1511939
- Bress AP, Kramer H, Khatib R, et al. Potential deaths averted and serious adverse events incurred from adoption of the SPRINT (Systolic Blood Pressure Intervention Trial) intensive blood pressure regimen in the United States: Projections from NHANES (National Health and Nutrition Examination Survey). Circulation 2017; 135(17):1617–1628. doi:10.1161/CIRCULATIONAHA.116.025322
- Williamson JD, Supiano MA, Applegate WB, et al. Intensive vs standard blood pressure control and cardiovascular disease outcomes in adults aged ≥ 75 years: a randomized clinical trial. JAMA 2016; 315(24):2673–2682. doi:10.1001/jama.2016.7050
- Beddhu S, Rocco MV, Toto R, et al. Effects of intensive systolic blood pressure control on kidney and cardiovascular outcomes in persons without kidney disease: a secondary analysis of a randomized trial. Ann Intern Med 2017; 167(6):375–383. doi:10.7326/M16-2966
- Brunström M, Carlberg B. Association of blood pressure lowering with mortality and cardiovascular disease across blood pressure levels: a systematic review and meta-analysis. JAMA Intern Med 2018; 178(1):28–36. doi:10.1001/jamainternmed.2017.6015
- Prevention of stroke by antihypertensive drug treatment in older persons with isolated systolic hypertension. Final results of the Systolic Hypertension in the Elderly Program (SHEP). SHEP Cooperative Research Group. JAMA 1991; 265(24):3255–3264. pmid:2046107
- Bulpitt CJ, Beckett NS, Cooke J, et al. Results of the pilot study for the Hypertension in the Very Elderly Trial. J Hypertens 2003; 21(12):2409–2417. doi:10.1097/01.hjh.0000084782.15238.a2
- Liu L, Zhang Y, Liu G, et al. The Felodipine Event Reduction (FEVER) study: a randomized long-term placebo-controlled trial in Chinese hypertensive patients. J Hypertens 2005; 23(12):2157–2172. pmid:16269957
- JATOS Study Group. Principal results of the Japanese trial to assess optimal systolic blood pressure in elderly hypertensive patients (JATOS). Hypertens Res 2008; 31(12):2115–2127. doi:10.1291/hypres.31.2115
- Ogihara T, Saruta T, Rakugi H, et al. Target blood pressure for treatment of isolated systolic hypertension in the elderly: valsartan in elderly isolated systolic hypertension study. Hypertension 2010; 56(2):196–202. doi:10.1161/HYPERTENSIONAHA.109.146035
- Ettehad D, Emdin CA, Kiran A, et al. Blood pressure lowering for prevention of cardiovascular disease and death: a systematic review and meta-analysis. Lancet 2016; 387(10022):957–967. doi:10.1016/S0140-6736(15)01225-8
- Sleight P. The HOPE study (Heart Outcomes Prevention Evaluation). J Renin Angiotensin Aldosterone Syst 2000; 1(1):18–20. doi:10.3317/jraas.2000.002
- Effects of ramipril on cardiovascular and microvascular outcomes in people with diabetes mellitus: results of the HOPE study and MICRO-HOPE substudy. Heart Outcomes Prevention Evaluation Study Investigators. Lancet 2000; 355(9200):253–259. pmid:10675071
- Yusuf S, Bosch J, Dagenais G, et al. Cholesterol lowering in intermediate-risk persons without cardiovascular disease. N Engl J Med 2016; 374(21):2021–2031. doi:10.1056/NEJMoa1600176
- Yusuf S, Lonn E, Pais P, et al. Blood-pressure and cholesterol lowering in persons without cardiovascular disease. N Engl J Med 2016; 374(21):2032–2043. doi:10.1056/NEJMoa1600177
- Lonn EM, Bosch J, López-Jaramillo P, et al. Blood-pressure lowering in intermediate-risk persons without cardiovascular disease. N Engl J Med 2016; 374(21):2009–2020. doi:10.1056/NEJMoa1600175
- Bundy JD, Li C, Stuchlik P, et al. Systolic blood pressure reduction and risk of cardiovascular disease and mortality: a systematic review and network meta-analysis. JAMA Cardiol 2017; 2(7):775–781. doi:10.1001/jamacardio.2017.1421
- Emdin CA, Rahimi K, Neal B, Callender T, Perkovic V, Patel A. Blood pressure lowering in type 2 diabetes: a systematic review and meta-analysis. JAMA 2015; 313(6):603–615. doi:10.1001/jama.2014.18574
- ACCORD Study Group; Cushman WC, Evans GW, Byington RP, et al. Effects of intensive blood-pressure control in type 2 diabetes mellitus. N Engl J Med 2010; 362(17):1575–1585. doi:10.1056/NEJMoa1001286
- SPS3 Study Group; Benavente OR, Coffey CS, Conwit R, et al. Blood-pressure targets in patients with recent lacunar stroke: the SPS3 randomised trial. Lancet 2013; 382(9891):507–515. doi:10.1016/S0140-6736(13)60852-1
When treating high blood pressure, how low should we try to go? Debate continues about optimal blood pressure goals after publication of guidelines from the American College of Cardiology and American Heart Association (ACC/AHA) in 2017 that set or permitted a treatment goal of less than 130 mm Hg, depending on the population.1
In this article, we summarize the evolution of hypertension guidelines and the evidence behind them.
HOW THE GOALS EVOLVED
JNC 7, 2003: 140/90 or 130/80
The seventh report of the Joint National Committee on Prevention, Detection, Evaluation, and Treatment of High Blood Pressure (JNC 7),2 published in 2003, specified treatment goals of:
- < 140/90 mm Hg for most patients
- < 130/80 mm Hg for those with diabetes or chronic kidney disease.
JNC 7 provided much-needed clarity and uniformity to managing hypertension. Since then, various scientific groups have published their own guidelines (Table 1).1–9
ACC/AHA/CDC 2014: 140/90
In 2014, the ACC, AHA, and US Centers for Disease Control and Prevention (CDC) published an evidence-based algorithm for hypertension management.3 As in JNC 7, they suggested a blood pressure goal of less than 140/90 mm Hg, lifestyle modification, and polytherapy, eg, a thiazide diuretic for stage 1 hypertension (< 160/100 mm Hg) and combination therapy with a thiazide diuretic and an angiotensin-converting enzyme (ACE) inhibitor, angiotensin II receptor blocker (ARB), or calcium channel blocker for stage 2 hypertension (≥ 160/100 mm Hg).
JNC 8 2014: 140/90 or 150/90
Soon after, the much-anticipated report of the panel members appointed to the eighth JNC (JNC 8) was published.4 Previous JNC reports were written and published under the auspices of the National Heart, Lung, and Blood Institute, but while the JNC 8 report was being prepared, this government body announced it would no longer publish guidelines.
In contrast to JNC 7, the JNC 8 panel based its recommendations on a systematic review of randomized clinical trials. However, the process and methodology were controversial, especially as the panel excluded some important clinical trials from the analysis.
JNC 8 relaxed the targets in several subgroups, such as patients over age 60 and those with diabetes and chronic kidney disease, due to a lack of definitive evidence on the impact of blood pressure targets lower than 140/90 mm Hg in these groups. Thus, their goals were:
- < 140/90 mm Hg for patients under age 60
- < 150/90 mm Hg for patients age 60 and older.
Of note, a minority of the JNC 8 panel disagreed with the new targets and provided evidence for keeping the systolic blood pressure target below 140 mm Hg for patients 60 and older.5 Further, the JNC 8 report was not endorsed by several important societies, ie, the AHA, ACC, National Heart, Lung, and Blood Institute, and American Society of Hypertension (ASH). These issues compromised the acceptance and applicability of the guidelines.
ASH/ISH 2014: 140/90 or 150/90
Also in 2014, the ASH and the International Society of Hypertension released their own report.6 Their goals:
- < 140/90 mm Hg for most patients
- < 150/90 mm Hg for patients age 80 and older.
AHA/ACC/ASH 2015: Goals in subgroups
In 2015, the AHA, ACC, and ASH released a joint scientific statement outlining hypertension goals for specific patient populations7:
- < 150/90 mm Hg for those age 80 and older
- < 140/90 mm Hg for those with coronary artery disease
- < 130/80 mm Hg for those with comorbidities such as diabetes and cardiovascular disease.
ADA 2016: Goals for patients with diabetes
In 2016, the American Diabetes Association (ADA) set the following blood pressure goals for patients with diabetes8:
- < 140/90 mm Hg for adults with diabetes
- < 130/80 mm Hg for younger adults with diabetes and adults with a high risk of cardiovascular disease
- 120–160/80–105 mm Hg for pregnant patients with diabetes and preexisting hypertension who are treated with antihypertensive therapy.
ACP/AAFP 2017: Systolic 150 or 130
In 2017, the American College of Physicians (ACP) and the American Academy of Family Physicians (AAFP) recommended a relaxed systolic blood pressure target, ie, below 150 mm Hg, for adults over age 60, but a tighter goal of less than 140 mm Hg for the same age group if they have transient ischemic attack, stroke, or high cardiovascular risk.9
ACC/AHA 2017: 130/80
The 2017 ACC/AHA guidelines recommended a more aggressive goal of below 130/80 for all, including patients age 65 and older.1
This is a class I (strong) recommendation for patients with known cardiovascular disease or a 10-year risk of a cardiovascular event of 10% or higher, with a B-R level of evidence for the systolic goal (ie, moderate-quality, based on systematic review of randomized controlled trials) and a C-EO level of evidence for the diastolic goal (ie, based on expert opinion).
For patients who do not have cardiovascular disease and who are at lower risk of it, this is a class IIb (weak) recommendation, ie, it “may be reasonable,” with a B-NR level of evidence (moderate-quality, based on nonrandomized studies) for the systolic goal and C-EO (expert opinion) for the diastolic goal.
For many patients, this involves drug treatment. For those with known cardiovascular disease or a 10-year risk of an atherosclerotic cardiovascular disease event of 10% or higher, the ACC/AHA guidelines say that drug treatment “is recommended” if their average blood pressure is 130/80 mm Hg or higher (class I recommendation, based on strong evidence for the systolic threshold and expert option for the diastolic). For those without cardiovascular disease and at lower risk, drug treatment is recommended if their average blood pressure is 140/90 mm Hg or higher (also class I, but based on limited data).
EVERYONE AGREES ON LIFESTYLE
Although the guidelines differ in their blood pressure targets, they consistently recommend lifestyle modifications.
Lifestyle modifications, first described in JNC 7, included weight loss, sodium restriction, and the DASH diet, which is rich in fruits, vegetables, low-fat dairy products, whole grains, poultry, and fish, and low in red meat, sweets, cholesterol, and total and saturated fat.2
These recommendations were based on results from 3 large randomized controlled trials in patients with and without hypertension.10–12 In patients with no history of hypertension, interventions to promote weight loss and sodium restriction significantly reduced blood pressure and the incidence of hypertension (the latter by as much as 77%) compared with usual care.10,11
In patients with and without hypertension, lowering sodium intake in conjunction with the DASH diet was associated with substantially larger reductions in systolic blood pressure.12
The recommendation to lower sodium intake has not changed in the guideline revisions. Meanwhile, other modifications have been added, such as incorporating both aerobic and resistance exercise and moderating alcohol intake. These recommendations have a class I level of evidence (ie, strongest level) in the 2017 ACC/AHA guidelines.1
HYPERTENSION BEGINS AT 130/80
The definition of hypertension changed in the 2017 ACC/AHA guidelines1: previously set at 140/90 mm Hg or higher, it is now 130/80 mm Hg or higher for all age groups. Adults with systolic blood pressure of 130 to 139 mm Hg or diastolic blood pressure of 80 to 89 mm Hg are now classified as having stage 1 hypertension.
Under the new definition, the number of US adults who have hypertension expanded to 45.6% of the general population,13 up from 31.9% under the JNC 7 definition. Thus, overall, 103.3 million US adults now have hypertension, compared with 72.2 million under the JNC 7 criteria.
In addition, the new guidelines expanded the population of adults for whom antihypertensive drug treatment is recommended to 36.2% (81.9 million). However, this represents only a 1.9% absolute increase over the JNC 7 recommendations (34.3%) and a 5.1% absolute increase over the JNC 8 recommendations.14
SPRINT: INTENSIVE TREATMENT IS BENEFICIAL
The new ACC/AHA guidelines1 were based on evidence from several trials, including the Systolic Blood Pressure Intervention Trial (SPRINT).15
This multicenter trial investigated the effect of intensive blood pressure treatment on cardiovascular disease risk.16 The primary outcome was a composite of myocardial infarction, acute coronary syndrome, stroke, and heart failure.
The trial enrolled 9,361 participants at least 50 years of age with systolic blood pressure 130 mm Hg or higher and at least 1 additional risk factor for cardiovascular disease. It excluded anyone with a history of diabetes mellitus, stroke, symptomatic heart failure, or end-stage renal disease.
Two interventions were compared:
- Intensive treatment, with a systolic blood pressure goal of less than 120 mm Hg: the protocol called for polytherapy, even for participants who were 75 or older if their blood pressure was 140 mm Hg or higher
- Standard treatment, with a systolic blood pressure goal of less than 140 mm Hg: it used polytherapy for patients whose systolic blood pressure was 160 mm Hg or higher.
The trial was intended to last 5 years but was stopped early at a median of 3.26 years owing to a significantly lower rate of the primary composite outcome in the intensive-treatment group: 1.65% per year vs 2.19%, a 25% relative risk reduction (P < .001) or a 0.54% absolute risk reduction. We calculate the number needed to treat (NNT) for 1 year to prevent 1 event as 185, and over the 3.26 years of the trial, the investigators calculated the NNT as 61. Similarly, the rate of death from any cause was also lower with intensive treatment, 1.03% per year vs 1.40% per year, a 27% relative risk reduction (P = .003) or a 0.37% absolute risk reduction, NNT 270.
Using these findings, Bress et al16 estimated that implementing intensive blood pressure goals could prevent 107,500 deaths annually.
The downside is adverse effects. In SPRINT,15 the intensive-treatment group experienced significantly higher rates of serious adverse effects than the standard-treatment group, ie:
- Hypotension 2.4% vs 1.4%, P = .001
- Syncope 2.3% vs 1.7%, P = .05
- Electrolyte abnormalities 3.1% vs 2.3%, P = .02)
- Acute kidney injury or kidney failure 4.1% vs 2.5%, P < .001
- Any treatment-related adverse event 4.7% vs 2.5%, P = .001.
Thus, Bress et al16 estimated that fully implementing the intensive-treatment goals could cause an additional 56,100 episodes of hypotension per year, 34,400 cases of syncope, 43,400 serious electrolyte disorders, and 88,700 cases of acute kidney injury. All told, about 3 million Americans could suffer a serious adverse effect under the intensive-treatment goals.
SPRINT caveats and limitations
SPRINT15 was stopped early, after 3.26 years instead of the planned 5 years. The true risk-benefit ratio may have been different if the trial had been extended longer.
In addition, SPRINT used automated office blood pressure measurements in which patients were seated alone and a device (Model 907, Omron Healthcare) took 3 blood pressure measurements at 1-minute intervals after 5 minutes of quiet rest. This was designed to reduce elevated blood pressure readings in the presence of a healthcare professional in a medical setting (ie, “white coat” hypertension).
Many physicians are still taking blood pressure manually, which tends to give higher readings. Therefore, if they aim for a lower goal, they may risk overtreating the patient.
About 50% of patients did not achieve the target systolic blood pressure (< 120 mm Hg) despite receiving an average of 2.8 antihypertensive medications in the intensive-treatment group and 1.8 in the standard-treatment group. The use of antihypertensive medications, however, was not a controlled variable in the trial, and practitioners chose the appropriate drugs for their patients.
Diastolic pressure, which can be markedly lower in older hypertensive patients, was largely ignored, although lower diastolic pressure may have contributed to higher syncope rates in response to alpha blockers and calcium blockers.
Moreover, the trial excluded those with significant comorbidities and those younger than 50 (the mean age was 67.9), which limits the generalizability of the results.
JNC 8 VS SPRINT GOALS: WHAT'S THE EFFECT ON OUTCOMES?
JNC 84 recommended a relaxed target of less than 140/90 mm Hg for adults younger than 60, including those with chronic kidney disease or diabetes, and less than 150/90 mm Hg for adults 60 and older. The SPRINT findings upended those recommendations, showing that intensive treatment in adults age 75 or older significantly improved the composite cardiovascular disease outcome (2.59 vs 3.85 events per year; P < .001) and all-cause mortality (1.78 vs 2.63 events per year; P < .05) compared with standard treatment.17 Also, a subset review of SPRINT trial data found no difference in benefit based on chronic kidney disease status.18
A meta-analysis of 74 clinical trials (N = 306,273) offers a compromise between the SPRINT findings and the JNC 8 recommendations.19 It found that the beneficial effect of blood pressure treatment depended on the patient’s baseline systolic blood pressure. In those with a baseline systolic pressure of 160 mm Hg or higher, treatment reduced cardiovascular mortality by about 15% (relative risk [RR] 0.85; 95% confidence interval [CI] 0.77–0.95). In patients with systolic pressure below 140 mm Hg, treatment effects were neutral (RR 1.03, 95% CI 0.87–1.20) and not associated with any benefit as primary prevention, although data suggest it may reduce the risk of adverse outcomes in patients with coronary heart disease.
OTHER TRIALS THAT INFLUENCED THE GUIDELINES
SHEP and HYVET (the Systolic Hypertension in the Elderly Program20 and the Hypertension in the Very Elderly Trial)21 supported intensive blood pressure treatment for older patients by reporting a reduction in fatal and nonfatal stroke risks for those with a systolic blood pressure above 160 mm Hg.
FEVER (the Felodipine Event Reduction study)22 found that treatment with a calcium channel blocker in even a low dose can significantly decrease cardiovascular events, cardiovascular disease, and heart failure compared with no treatment.
JATOS and VALISH (the Japanese Trial to Assess Optimal Systolic Blood Pressure in Elderly Hypertensive Patients23 and the Valsartan in Elderly Isolated Systolic Hypertension study)24 found that outcomes were similar with intensive vs standard treatment.
Ettehad et al25 performed a meta-analysis of 123 studies with more than 600,000 participants that provided strong evidence supporting blood pressure treatment goals below 130/90 mm Hg, in line with the SPRINT trial results.
BLOOD PRESSURE ISN’T EVERYTHING
Other trials remind us that although blood pressure is important, it is not the only factor affecting cardiovascular risk.
HOPE (the Heart Outcomes Prevention Evaluation)26 investigated the use of ramipril (an ACE inhibitor) in preventing myocardial infarction, stroke, or cardiovascular death in patients at high risk of cardiovascular events. The study included 9,297 participants over age 55 (mean age 66) with a baseline blood pressure 139/79 mm Hg. Follow-up was 4.5 years.
Ramipril was better than placebo, with significantly fewer patients experiencing adverse end points in the ramipril group compared with the placebo group:
- Myocardial infarction 9.9% vs 12.3%, RR 0.80, P < .001
- Cardiovascular death 6.1% vs 8.1%, RR 0.74, P < .001
- Stroke 3.4% vs 4.9%, RR = .68, P < .001
- The composite end point 14.0% vs 17.8%, RR 0.78, P < .001).
Results were even better in the subset of patients who had diabetes.27 However, the decrease in blood pressure attributable to antihypertensive therapy with ramipril was minimal (3–4 mm Hg systolic and 1–2 mm Hg diastolic). This slight change should not have been enough to produce significant differences in clinical outcomes, a major limitation of this trial. The investigators speculated that the positive results may be due to a class effect of ACE inhibitors.26
HOPE 328–30 explored the effect of blood pressure- and cholesterol-controlling drugs on the same primary end points but in patients at intermediate risk of major cardiovascular events. Investigators randomized the 12,705 patients to 4 treatment groups:
- Blood pressure control with candesartan (an ARB) plus hydrochlorothiazide (a thiazide diuretic)
- Cholesterol control with rosuvastatin (a statin)
- Blood pressure plus cholesterol control
- Placebo.
Therapy was started at a systolic blood pressure above 140 mm Hg.
Compared with placebo, the rate of composite events was significantly reduced in the rosuvastatin group (3.7% vs 4.8%, HR 0.76, P = .002)28 and the candesartan-hydrochlorothiazide-rosuvastatin group (3.6% vs 5.0%, HR 0.71; P = .005)29 but not in the candesartan-hydrochlorothiazide group (4.1% vs 4.4%; HR 0.93; P = .40).30
In addition, a subgroup analysis comparing active treatment vs placebo found a significant reduction in major cardiovascular events for treated patients whose baseline systolic blood pressure was in the upper third (> 143.5 mm Hg, mean 154.1 mm Hg), while treated patients in the lower middle and lower thirds had no significant reduction.30
These results suggest that intensive treatment to achieve a systolic blood pressure below 140 mm Hg in patients at intermediate risk may not be helpful. Nevertheless, there seems to be agreement that intensive treatment generally leads to a reduction in cardiovascular events. The results also show the benefit of lowering cholesterol.
Bundy et al31 performed a meta-analysis that provides support for intensive antihypertensive treatment. Reviewing 42 clinical trials in more than 144,000 patients, they found that treating to reach a target systolic blood pressure of 120 to 124 mm Hg can reduce cardiovascular events and all-cause mortality.
The trade-off is a minimal increase in the risk of adverse events. Also, the risk-benefit ratio of intensive treatment seems to vary in different patient subgroups.
WHAT ABOUT PATIENTS WITH COMORBIDITIES?
The debate over intensive vs standard treatment in blood pressure management extends beyond hypertension and includes important comorbidities such as diabetes, stroke, and renal disease. Patients with a history of stroke or end-stage renal disease have only a minimal mention in the AHA/ACC guidelines.
Diabetes
Emdin et al,32 in a meta-analysis of 40 trials that included more than 100,000 patients with diabetes, concluded that a 10-mm Hg lowering of systolic blood pressure significantly reduces the rates of all-cause mortality, cardiovascular disease, coronary heart disease, stroke, albuminuria, and retinopathy. Stratifying the results according to the systolic blood pressure achieved (≥ 130 or < 130 mm Hg), the relative risks of mortality, coronary heart disease, cardiovascular disease, heart failure, and albuminuria were actually lower in the higher stratum than in the lower.
ACCORD (the Action to Control Cardiovascular Risk in Diabetes)33 study provides contrary results. It examined intensive and standard blood pressure control targets in patients with type 2 diabetes at high risk of cardiovascular events, using primary outcome measures similar to those in SPRINT. It found no significant difference in fatal and nonfatal cardiovascular events between the intensive and standard blood pressure target arms.
Despite those results, the ACC/AHA guidelines still advocate for more intensive treatment (goal < 130/80 mm Hg) in all patients, including those with diabetes.1
The ADA position statement (September 2017) recommended a target below 140/90 mm Hg in patients with diabetes and hypertension.8 However, they also noted that lower systolic and diastolic blood pressure targets, such as below 130/80 mm Hg, may be appropriate for patients at high risk of cardiovascular disease “if they can be achieved without undue treatment burden.”8 Thus, it is not clear which blood pressure targets in patients with diabetes are the best.
Stroke
In patients with stroke, AHA/ACC guidelines1 recommend treatment if the blood pressure is 140/90 mm Hg or higher because antihypertensive therapy has been associated with a decrease in the recurrence of transient ischemic attack and stroke. The ideal target blood pressure is not known, but a goal of less than 130/80 mm Hg may be reasonable.
In the Secondary Prevention of Small Subcortical Strokes (SPS3) trial, a retrospective open-label trial, a target blood pressure below 130/80 mm Hg in patients with a history of lacunar stroke was associated with a lower risk of intracranial hemorrhage, but the difference was not statistically significant.34 For this reason, the ACC/AHA guidelines consider it reasonable to aim for a systolic blood pressure below 130 mm Hg in these patients.1
Renal disease
The ACC/AHA guidelines do not address how to manage hypertension in patients with end-stage renal disease, but for patients with chronic kidney disease they recommend a blood pressure target below 130/80 mm Hg.1 This recommendation is derived from the SPRINT trial,15 in which patients with stage 3 or 4 chronic kidney disease accounted for 28% of the study population. In that subgroup, intensive blood pressure control seemed to provide the same benefits for reduction in cardiovascular death and all-cause mortality.
TREAT PATIENTS, NOT NUMBERS
Blood pressure targets should be applied in the appropriate clinical context and on a patient-by-patient basis. In clinical practice, one size does not always fit all, as special cases exist.
For example, blood pressure can oscillate widely in patients with autonomic nerve disorders, making it difficult to strive for a specific target, especially an intensive one. Thus, it may be necessary to allow higher systolic blood pressure in these patients. Similarly, patients with diabetes or chronic kidney disease may be at higher risk of kidney injury with more intensive blood pressure management.
Treating numbers rather than patients may result in unbalanced patient care. The optimal approach to blood pressure management relies on a comprehensive risk factor assessment and shared decision-making with the patient before setting specific blood pressure targets.
OUR APPROACH
We aim for a blood pressure goal below 130/80 mm Hg for all patients with cardiovascular disease, according to the AHA/ACC guidelines. We aim for that same target in patients without cardiovascular disease but who have an elevated estimated cardiovascular risk (> 10%) over the next 10 years.
We recognize, however, that the benefits of aggressive blood pressure reduction may not be as clear in all patients, such as those with diabetes. We also recognize that some patient subgroups are at high risk of adverse events, including those with low diastolic pressure, chronic kidney disease, a history of falls, and older age. In those patients, we are extremely judicious when titrating antihypertensive medications. We often make smaller titrations, at longer intervals, and with more frequent laboratory testing and in-office follow-up.
Our process of managing hypertension through intensive blood pressure control to achieve lower systolic blood pressure targets requires a concerted effort among healthcare providers at all levels. It especially requires more involvement and investment from primary care providers to individualize treatment in their patients. This process has helped us to reach our treatment goals while limiting adverse effects of lower blood pressure targets.
MOVING FORWARD
Hypertension is a major risk factor for cardiovascular disease, and intensive blood pressure control has the potential to significantly reduce rates of morbidity and death associated with cardiovascular disease. Thus, a general consensus on the definition of hypertension and treatment goals is essential to reduce the risk of cardiovascular events in this large patient population.
Intensive blood pressure treatment has shown efficacy, but it has a small accompanying risk of adverse events, which varies in patient subgroups and affects the benefit-risk ratio of this therapy. For example, the cardiovascular benefit of intensive treatment is less clear in diabetic patients, and the risk of adverse events may be higher in older patients with chronic kidney disease.
Moving forward, more research is needed into the effects of intensive and standard treatment on patients of all ages, those with common comorbid conditions, and those with other important factors such as diastolic hypertension.
Finally, the various medical societies should collaborate on hypertension guideline development. This would require considerable planning and coordination but would ultimately be useful in creating a generalizable approach to hypertension management.
- Whelton PK, Carey RM, Aronow WS, et al. 2017 ACC/AHA/AAPA/ABC/ACPM/AGS/APhA/ASH/ASPC/NMA/PCNA guideline for the prevention, detection, evaluation, and management of high blood pressure in adults: a report of the American College of Cardiology/American Heart Association Task Force on Clinical Practice Guidelines. J Am Coll Cardiol 2018; 71(19):e127–e248. doi:10.1016/j.jacc.2017.11.006
- Chobanian AV, Bakris GL, Black HR, et al. The seventh report of the Joint National Committee on Prevention, Detection, Evaluation, and Treatment of High Blood Pressure: the JNC 7 report. JAMA 2003; 289(19):2560–2572. doi:10.1001/jama.289.19.2560
- Go AS, Bauman MA, King SM, et al. An effective approach to high blood pressure control: a science advisory from the American Heart Association, the American College of Cardiology, and the Centers for Disease Control and Prevention. Hypertension 2014; 63(4):878–885. doi:10.1161/HYP.0000000000000003
- James PA, Oparil S, Carter BL, et al. 2014 evidence-based guideline for the management of high blood pressure in adults: report from the panel members appointed to the Eighth Joint National Committee (JNC 8). JAMA 2014; 311(5):507–520. doi:10.1001/jama.2013.284427
- Wright JT Jr, Fine LJ, Lackland DT, Ogedegbe G, Dennison Himmelfarb CR. Evidence supporting a systolic blood pressure goal of less than 150 mm Hg in patients aged 60 years or older: the minority view. Ann Intern Med 2014; 160(7):499–503. doi:10.7326/M13-2981
- Weber MA, Schiffrin EL, White WB, et al. Notice of duplicate publication [duplicate publication of Weber MA, Schiffrin EL, White WB, et al. Clinical practice guidelines for the management of hypertension in the community: a statement by the American Society of Hypertension and the International Society of Hypertension. J Clin Hypertens 2014; 16(1):14–26. doi:10.1111/jch.12237] J Hypertens 2014; 32(1):3–15. doi:10.1097/HJH.0000000000000065
- Rosendorff C, Lackland DT, Allison M, et al. Treatment of hypertension in patients with coronary artery disease: a scientific statement from the American Heart Association, American College of Cardiology, and American Society of Hypertension. J Am Soc Hypertens 2015; 9(6):453–498. doi:10.1016/j.jash.2015.03.002
- de Boer IH, Bangalore S, Benetos A, et al. Diabetes and hypertension: a position statement by the American Diabetes Association. Diabetes Care 2017; 40(9):1273–1284. doi:10.2337/dci17-0026
- Qaseem A, Wilt TJ, Rich R, Humphrey LL, Frost J, Forciea MA. Pharmacologic treatment of hypertension in adults aged 60 years or older to higher versus lower blood pressure targets: a clinical practice guideline from the American College of Physicians and the American Academy of Family Physicians. Ann Intern Med 2017; 166(6):430–437. doi:10.7326/M16-1785
- The Trials of Hypertension Prevention Collaborative Research Group. Effects of weight loss and sodium reduction intervention on blood pressure and hypertension incidence in over-weight people with high normal blood pressure: the Trials of Hypertension Prevention, phase II. Arch Intern Med 1997; 157(6):657–667. pmid:9080920
- He J, Whelton PK, Appel LJ, Charleston J, Klag MJ. Long-term effects of weight loss and dietary sodium reduction on incidence of hypertension. Hypertension 2000; 35(2):544–549. pmid:10679495
- Sacks FM, Svetkey LP, Vollmer WM, et al. Effects on blood pressure of reduced dietary sodium and the Dietary Approaches to Stop Hypertension (DASH) diet. N Engl J Med 2001; 344(1):3–10. doi:10.1056/NEJM200101043440101
- Blackwell DL, Lucas JW, Clarke TC. Summary health statistics for US adults: National Health Interview Survey, 2012. National Center for Health Statistics. Vital Health Stat 10; 2014(260):1–161. pmid:24819891
- Muntner P, Carey RM, Gidding S, et al. Potential US population impact of the 2017 ACC/AHA high blood pressure guideline. J Am Coll Cardiol 2018; 71(2):109–118. doi:10.1016/j.jacc.2017.10.073
- SPRINT Research Group; Wright JT Jr, Williamson JD, Whelton PK, et al. A randomized trial of intensive versus standard blood-pressure control. N Engl J Med 2015; 373(22):2103–2116. doi:10.1056/NEJMoa1511939
- Bress AP, Kramer H, Khatib R, et al. Potential deaths averted and serious adverse events incurred from adoption of the SPRINT (Systolic Blood Pressure Intervention Trial) intensive blood pressure regimen in the United States: Projections from NHANES (National Health and Nutrition Examination Survey). Circulation 2017; 135(17):1617–1628. doi:10.1161/CIRCULATIONAHA.116.025322
- Williamson JD, Supiano MA, Applegate WB, et al. Intensive vs standard blood pressure control and cardiovascular disease outcomes in adults aged ≥ 75 years: a randomized clinical trial. JAMA 2016; 315(24):2673–2682. doi:10.1001/jama.2016.7050
- Beddhu S, Rocco MV, Toto R, et al. Effects of intensive systolic blood pressure control on kidney and cardiovascular outcomes in persons without kidney disease: a secondary analysis of a randomized trial. Ann Intern Med 2017; 167(6):375–383. doi:10.7326/M16-2966
- Brunström M, Carlberg B. Association of blood pressure lowering with mortality and cardiovascular disease across blood pressure levels: a systematic review and meta-analysis. JAMA Intern Med 2018; 178(1):28–36. doi:10.1001/jamainternmed.2017.6015
- Prevention of stroke by antihypertensive drug treatment in older persons with isolated systolic hypertension. Final results of the Systolic Hypertension in the Elderly Program (SHEP). SHEP Cooperative Research Group. JAMA 1991; 265(24):3255–3264. pmid:2046107
- Bulpitt CJ, Beckett NS, Cooke J, et al. Results of the pilot study for the Hypertension in the Very Elderly Trial. J Hypertens 2003; 21(12):2409–2417. doi:10.1097/01.hjh.0000084782.15238.a2
- Liu L, Zhang Y, Liu G, et al. The Felodipine Event Reduction (FEVER) study: a randomized long-term placebo-controlled trial in Chinese hypertensive patients. J Hypertens 2005; 23(12):2157–2172. pmid:16269957
- JATOS Study Group. Principal results of the Japanese trial to assess optimal systolic blood pressure in elderly hypertensive patients (JATOS). Hypertens Res 2008; 31(12):2115–2127. doi:10.1291/hypres.31.2115
- Ogihara T, Saruta T, Rakugi H, et al. Target blood pressure for treatment of isolated systolic hypertension in the elderly: valsartan in elderly isolated systolic hypertension study. Hypertension 2010; 56(2):196–202. doi:10.1161/HYPERTENSIONAHA.109.146035
- Ettehad D, Emdin CA, Kiran A, et al. Blood pressure lowering for prevention of cardiovascular disease and death: a systematic review and meta-analysis. Lancet 2016; 387(10022):957–967. doi:10.1016/S0140-6736(15)01225-8
- Sleight P. The HOPE study (Heart Outcomes Prevention Evaluation). J Renin Angiotensin Aldosterone Syst 2000; 1(1):18–20. doi:10.3317/jraas.2000.002
- Effects of ramipril on cardiovascular and microvascular outcomes in people with diabetes mellitus: results of the HOPE study and MICRO-HOPE substudy. Heart Outcomes Prevention Evaluation Study Investigators. Lancet 2000; 355(9200):253–259. pmid:10675071
- Yusuf S, Bosch J, Dagenais G, et al. Cholesterol lowering in intermediate-risk persons without cardiovascular disease. N Engl J Med 2016; 374(21):2021–2031. doi:10.1056/NEJMoa1600176
- Yusuf S, Lonn E, Pais P, et al. Blood-pressure and cholesterol lowering in persons without cardiovascular disease. N Engl J Med 2016; 374(21):2032–2043. doi:10.1056/NEJMoa1600177
- Lonn EM, Bosch J, López-Jaramillo P, et al. Blood-pressure lowering in intermediate-risk persons without cardiovascular disease. N Engl J Med 2016; 374(21):2009–2020. doi:10.1056/NEJMoa1600175
- Bundy JD, Li C, Stuchlik P, et al. Systolic blood pressure reduction and risk of cardiovascular disease and mortality: a systematic review and network meta-analysis. JAMA Cardiol 2017; 2(7):775–781. doi:10.1001/jamacardio.2017.1421
- Emdin CA, Rahimi K, Neal B, Callender T, Perkovic V, Patel A. Blood pressure lowering in type 2 diabetes: a systematic review and meta-analysis. JAMA 2015; 313(6):603–615. doi:10.1001/jama.2014.18574
- ACCORD Study Group; Cushman WC, Evans GW, Byington RP, et al. Effects of intensive blood-pressure control in type 2 diabetes mellitus. N Engl J Med 2010; 362(17):1575–1585. doi:10.1056/NEJMoa1001286
- SPS3 Study Group; Benavente OR, Coffey CS, Conwit R, et al. Blood-pressure targets in patients with recent lacunar stroke: the SPS3 randomised trial. Lancet 2013; 382(9891):507–515. doi:10.1016/S0140-6736(13)60852-1
KEY POINTS
- The 2017 ACC/AHA guidelines lowered the definition of hypertension to 130/80 mm Hg or higher, thereby in-creasing the number of US adults with hypertension from 31.9% to 45.6%.
- For patients with known cardiovascular disease or a 10-year risk of an atherosclerotic cardiovascular disease event of 10% or higher, drug treatment “is recommended” if the average blood pressure is 130/80 mm Hg or higher. For those without cardiovascular disease and at lower risk, drug treatment is recommended if the aver-age blood pressure is 140/90 mm Hg or higher.
- A treatment goal of less than 130/80 mm Hg “is recommended” for patients with hypertension and known car-diovascular disease or a 10-year risk of an atherosclerotic cardiovascular disease event of 10% or higher, and “may be reasonable” for those without additional markers of increased cardiovascular risk.
- Intensive blood pressure control has the potential to significantly reduce rates of morbidity and death associated with cardiovascular disease, at the price of causing more adverse effects.

Common benign breast concerns for the primary care physician
Breast concerns account for approximately 3% of all female visits to a primary care practice.1 The most common symptoms are breast lumps and breast pain.

Because breast cancer is the most common malignancy in women in the United States, affecting nearly 1 in 8 women in their lifetime, women with breast problems often fear the worst. However, only about 3.5% of women reporting a concern have cancer; most problems are benign (Table 1).1
Here, we present an evidence-based review of common breast problems in primary care practice and discuss how to evaluate and manage them.
GENERAL APPROACH
The evaluation of a breast concern requires a systematic approach, beginning with a history that documents the onset, severity, and frequency of symptoms. If the concern is a lump or mass, ask whether it becomes more tender or increases in size at any point during the menstrual cycle.
Focus the physical examination on the cervical, supraclavicular, infraclavicular, and axillary lymph nodes and on the breast itself. Assess breast symmetry, note any skin changes such as dimpling, and check the nipples for discharge and inversion. Palpate the breasts for masses.
PALPABLE BREAST MASS: IMAGING NEEDED
If a mass is present, it is more likely to be malignant if any of the following is true:
- Firm to hard texture or indistinct margins
- Attached to the underlying deep fascia or skin
- Associated nipple inversion or skin dimpling.2
Breast masses are more likely benign if they have discrete, well-defined margins, are mobile with a soft to rubbery consistency, and change with the menstrual cycle. However, clinical features are unreliable indicators of cause, and thus additional investigation with breast imaging is warranted.
Mammography remains the diagnostic test of choice for all women age 30 or older who have a palpable breast mass. It is less effective in younger women because they are more likely to have extremely dense fibroglandular tissue that will limit its sensitivity to imaging.
Order diagnostic mammography, which includes additional views focused on the area of concern, rather than screening mammography, which includes only standard craniocaudal and mediolateral oblique views. A skin marker should be applied over the palpable lump to aid imaging. Because a breast that contains a mass may be denser than the opposite breast or may show asymmetry, both breasts should be imaged. The sensitivity of diagnostic mammography varies from 85% to 90%, so a negative mammogram does not rule out malignancy.2,3
Targeted ultrasonography of the palpable mass helps identify solid masses such as fibroadenomas or malignant tumors, classifies the margins (lobulated, smooth, or irregular), and assesses vascularity. Ultrasonography is particularly useful for characterizing cystic lesions (eg, simple, septated, or clustered cysts) and cysts with internal echoes. It can also identify lipomas or sebaceous cysts.
If the findings on both mammography and ultrasonography are benign, the likelihood of cancer is very low, with an estimated negative predictive value of 97% to 100%.2,3 Additionally, the likelihood of nonmalignant findings on biopsy after benign imaging is approximately 99%.3
Although radiologic imaging can define palpable masses, it is intended as a clinical aid. Suspicious findings on clinical examination should never be ignored even if findings on imaging are reassuring, as studies have documented that about 5% of breast cancers may be detected on clinical breast examination alone.4
Other imaging tests such as magnetic resonance imaging may be considered occasionally if clinical suspicion remains high after negative mammography and ultrasonography, but they cannot confirm a diagnosis of malignancy. In that case, refer the patient to a surgeon for consideration of excisional biopsy.
Patients with an indeterminate lesion can return in 3 to 12 weeks for a follow-up examination and repeat imaging, which helps assess interval clinical stability. The latter option is especially helpful for patients with masses that are of low suspicion or for patients who prefer to avoid invasive tissue biopsy.
Patients with clinical and radiologic findings that suggest a benign cause can return for short-term follow-up in 6 months or in 12 months for their regular mammogram.
BREAST PAIN: RARELY MALIGNANT
More than 50% of women experience breast pain at some point in their life.5 Of these, 35% report that the pain adversely affects their sleep, and 41% note that the pain detrimentally affects their sexual quality of life. Up to 66% of breast pain correlates directly with the patient’s menstrual cycle.5 Breast pain is rarely associated with malignancy.
Regardless of its severity and the low likelihood of malignancy, breast pain can be a significant source of distress for the patient, primarily because of concerns about underlying malignancy. If the patient has a focal area of pain on examination, order mammography in combination with targeted ultrasonography. The sensitivity and negative predictive value of benign findings on combination mammography and ultrasonography in this setting are as high as 100%. The incidence of underlying cancer in patients with focal breast pain and no palpable mass is approximately 1.2%.6
The long-term prognosis in women with diffuse, often bilateral breast pain (in the absence of additional clinical findings) is excellent. In one study, the incidence of a breast cancer diagnosis was 1.8% after a median of 51 months of follow-up.7 Therefore, patients presenting with diffuse pain, no palpable abnormalities, and benign imaging can be safely reassured. Magnetic resonance imaging is rarely indicated in patients with breast pain unless other clinical findings, such as a mass or skin changes, are noted and the results of mammography and ultrasonography are negative.
Treating breast pain
Treating breast pain remains a challenge. The first step is to reassure the patient about her prognosis and help her make appropriate lifestyle modifications.
A well-fitting bra. Suggest getting a professional bra fitting. Wearing a well-fitted bra that offers lift, support, and compression and reduces excess motion can help improve benign breast pain. A bra fitting is especially important for women with large breasts because it can be difficult for these women to get an accurate size. Wearing a lightly fitted bra at night may also provide comfort if there is nighttime pain with breast tissue movement.
Reducing daily caffeine intake is often advised for pain management, but strong evidence of its efficacy is lacking.
Anti-inflammatory drugs can be beneficial if used short-term, especially if costochondritis is suspected.
Danazol improves pain in more than 70% of patients with cyclical symptoms and in up to 48% of those with noncyclical symptoms.
Bromocriptine is effective in up to 54% of those with cyclical symptoms and in up to 33% of those with noncyclical symptoms.8 However, the US Food and Drug Administration (FDA) withdrew approval for this indication because of adverse effects.
Tamoxifen, in contrast, provides relief in 94% of those with cyclical symptoms and in 56% of those with noncyclical symptoms.9
Adverse effects, however, limit the use of danazol, bromocriptine, and tamoxifen, and they should be prescribed only for short-term use (3 to 6 months) and only in women with chronic debilitating pain.
A few small studies have evaluated alternative options.
Toremifene is a triphenylethylene derivative similar to tamoxifen that is also used in the adjuvant treatment of postmenopausal breast cancer (but with fewer adverse effects). It has been documented to have a significant effect on premenstrual breast pain, with a 64% reduction in breast pain scores compared with a 26% reduction with placebo.10 However, the FDA has not approved it for this indication, and it can be cost-prohibitive.
Over-the-counter medications that may provide relief for cyclic breast pain include vitamin E or B6, products containing oil of Vitex agnus castus (chaste tree or chasteberry), and flaxseed.11,12
Acupuncture has been evaluated in patients with noncyclic breast pain and was found to reduce pain by 56% to 67% in one study,13 although it did not affect quality of life.
NIPPLE DISCHARGE
From 5% to 7% of women seek medical attention for nipple discharge.14,15 Breast cancer is found in 5% to 15% of women who undergo surgery for nipple discharge.16,17
Review the patient’s current medications and inquire about health conditions such as thyroid dysfunction or visual field changes that suggest a pituitary mass (which can lead to nipple discharge by causing hormonal dysregulation or hyperprolactinemia).
Palpate the breasts for an underlying mass, look for lesions on the nipple, and assess the color of the fluid. Also note whether there is discharge from one or both breasts, whether it is spontaneous or expressive, and whether it occurs from a single or multiple ducts. Nipple lesions may require further testing with punch biopsy.
Nonlactational nipple discharge is classified as physiologic or pathologic. Physiologic nipple discharge is typically bilateral, involving multiple ducts, and is often clear or straw-colored but may also be green, gray, or brown.
White, opaque fluid is often related to galactorrhea as a result of hyperprolactinemia, hypothyroidism, or medications such as antipsychotic drugs (eg, haloperidol and fluphenazine) and gastrointestinal motility agents such as metoclopramide. Discharge also commonly results from benign underlying ductal abnormalities such as intraductal papilloma, periductal mastitis, and duct ectasia.
Pathologic nipple discharge is often unilateral and persistent, occurring spontaneously from a solitary duct, and may be bloody or serous.
For women with pathologic nipple discharge who are 30 or older, diagnostic imaging with mammography and subareolar ultrasonography is recommended. If the patient is younger than 30, ultrasonography of the subareolar region alone can be used. Targeted ultrasonography of any palpable area is also advised.
Cytologic assessment of the fluid is not recommended because it can often lead to a false-positive finding of atypical cells. Imaging studies such as ductography, duct lavage, ductoscopy, and magnetic resonance imaging are also generally unnecessary; instead, a persistent clinical concern should prompt a surgical referral for consideration of duct excision.
When a patient has pathologic nipple discharge with a negative physical examination and breast imaging, studies have shown that the risk of cancer is 3% or less.18
Patients with spontaneous bloody or serous single-duct discharge with negative results on mammography and ultrasonography should be reassured that they have a low risk of underlying cancer. If the patient prefers, one approachto management is follow-up mammography and ultrasonography at 6 months and clinical examination for up to 2 years or until the discharge resolves on its own.
On the other hand, if the discharge is distressing to the patient, subareolar duct excision can be performed with both a diagnostic and therapeutic purpose.
NIPPLE-AREOLAR RASH: CONSIDER PAGET DISEASE
A rash on the nipple or areolar region warrants careful evaluation because it may be the first sign of Paget disease of the breast.
In the clinical breast examination, assess the extent of the rash and the presence of any underlying breast mass or nipple discharge. Dermatitis often starts on the areola and resolves quickly with topical therapy. However, Paget disease tends to start directly on the nipple itself, is unresponsive or only partially responsive to topical therapy, and progresses gradually, leading to erosions and ultimately effacement of the nipple itself.
If the clinical examination suggests mild dermatitis and the results of breast imaging are negative, treat the patient with a topical medication because benign conditions such as dermatitis and eczema are common. However, continued follow-up is mandatory until the rash completely resolves: Paget disease sometimes initially improves with topical therapy due to its inflammatory nature.
If you suspect Paget disease or the rash does not fully resolve after 2 to 3 weeks of topical therapy, refer the patient to a dermatologist for full-thickness punch biopsy to establish the diagnosis.
Paget disease of the breast may or may not be associated with underlying ductal carcinoma in situ or invasive breast cancer.19 The absence of clinical or imaging abnormalities in a patient with Paget disease does not rule out underlying malignancy.20
DENSE BREASTS


Increased breast density has been shown to be a risk factor for breast cancer and may be prognostically useful when combined with the Tyrer-Cuzick model or the Gail model of breast cancer risk.24
Additionally, increased density can mask cancers on mammography, significantly reducing its sensitivity. In women with heterogeneously or extremely dense breasts, the sensitivity of mammography for detecting cancer is only 25% to 50%.21 Due to this low sensitivity, supplemental imaging is helpful, particularly in women already at risk of breast cancer based on family history.
Supplemental screening
Digital mammography with tomosynthesis was approved by the FDA in 2011 for use in combination with standard digital mammography for breast cancer screening. Compared with traditional 2-dimensional mammography alone, adding 3-D tomosynthesis decreases the recall rate and increases the cancer detection rate.25
Tomosynthesis tends to perform better in women with heterogeneously dense breasts (BI-RADS category C). There is no significant improvement in cancer detection in women with extremely dense breasts (BI-RADS category D).26
Depending on the methodology, radiation exposure can be either higher or lower than with traditional mammography. However, in all forms, the very small amount of radiation is considered safe.
Whole breast ultrasonography. When whole breast ultrasonography is used to supplement mammography, the recall rate is higher than when mammography is used alone (14% vs 7%–11%).22 It also increases the cancer detection rate by 4.4 additional cancers per 1,000 examinations. However, the false-positive rate with whole breast ultrasonography is higher; the positive predictive value of combined mammography and ultrasonography is 11.2% vs 22.6% for mammography alone.22 Therefore, we do not generally recommend whole breast ultrasonography as a supplement to mammography in women with dense breast tissue unless other studies are not an option.
Molecular breast imaging is not widely available because it requires special equipment, injection of a radiopharamceutical (technetium Tc 99m sestamibi), and a radiologist who specializes in breast imaging to interpret the results. When it is available, however, it increases the cancer detection rate by 8.8 in 1,000 examinations; the positive predictive value is similar to that of screening mammography alone.21 It is particularly useful in patients with dense breasts who do not qualify for screening magnetic resonance imaging (lifetime risk of < 20% to 25%).
Technetium sestamibi is associated with a minimal amount of radiation exposure (2.4 mSv vs 1.2 mSV with standard mammography). However, this exposure is much less than background radiation exposure and is considered safe.21
IF THE PATIENT HAS AN ABNORMAL SCREENING MAMMOGRAM

Screening mammography can disclose abnormalities such as calcifications, masses, asymmetry, or architectural distortion.27 Abnormalities are reported using standardized BI-RADS categories designated with the numbers 0 through 6 (Table 3).23
A report of BI-RADS category 0 (incomplete), 4 (suspicious), or 5 (highly suspicious) requires additional workup.
Category 1 (negative) requires no further follow-up, and the patient should resume age-appropriate screening.
For patients with category 2 (benign) findings, routine screening is recommended, whereas patients with category 3 (probably benign) are advised to come back in 6 months for follow-up imaging.
Diagnostic mammography includes additional assessments for focal symptoms or areas of abnormality noted on screening imaging or clinical examination. These may include spot magnification views of areas of asymmetry, mass, architectural distortion, or calcifications. Ultrasonography of focal breast abnormalities can help determine if there is an underlying cyst or solid mass.
MANAGEMENT OF BENIGN FINDINGS ON BREAST BIOPSY

Benign breast disease is diagnosed when a patient with a palpable or radiographic abnormality undergoes breast biopsy with benign findings.28,29 It can be largely grouped into 3 categories: nonproliferative, proliferative without atypia, and proliferative with atypia (Table 4).28,29
If core-needle biopsy study results are benign, the next step is to establish radiologic-pathologic and clinical-pathologic concordance. If the findings on clinical examination or imaging are not consistent with those on pathologic study, excisional biopsy should be performed, as imaging-directed biopsy may not have adequately sampled the lesion.30
Nonproliferative lesions account for about 65% of findings on core-needle biopsy and include simple cysts, fibroadenomas, columnar cell changes, apocrine metaplasia, and mild ductal hyperplasia of the usual type. These lesions do not significantly increase the risk of breast cancer; the relative risk is 1.2 to 1.4.28,29 Additionally, the risk of “upstaging” after excisional biopsy—ie, to a higher-risk lesion or to malignancy—is minimal. Therefore, no additional action is necessary when these findings alone are noted on core-needle biopsy.
Proliferative lesions without atypia account for about 30% of biopsy results and include usual ductal hyperplasia, sclerosing adenosis, columnar hyperplasia, papilloma, and radial scar. Generally, there is a slightly increased risk of subsequent breast cancer, with a relative risk of 1.7 to 2.1.28 Usual ductal hyperplasia and columnar hyperplasia have little risk of upstaging with excision, and therefore, surgical consultation is not recommended.
Previously, surgical excision was recommended for any intraductal papilloma due to risk of upgrade in pathologic diagnosis at the time of excision. However, more recent data suggest that the upgrade rate is about 2.2% for a solitary papilloma that is less than 1 cm in diameter and without associated mass lesion (either clinically or radiographically), is concordant with radiographic findings, and has no associated atypical cells on biopsy.31 In this case, observation and short-interval clinical follow-up are reasonable. If there are multiple papillomas, the patient has symptoms such as persistent bloody nipple discharge, or any of the above criteria are not met, surgical excision is recommended.28
Similarly, radial scars and complex sclerosing lesions are increasingly likely to be associated with malignancy based on size. Upstaging ranges from 0% to 12%. It is again important when evaluating radial scars that there is pathologic concordance and that there were no associated high-risk lesions on pathology. If this is the case, it is reasonable to clinically monitor patients with small radial scars, particularly in those who do not have an elevated risk of developing breast cancer.30
For all patients who have undergone biopsy and whose pathology study results are benign, a thorough risk evaluation should be performed, including calculation of their lifetime risk of breast cancer. This can be done with the National Cancer Institute Breast Cancer Risk Assessment Tool, the International Breast Cancer Intervention Study (IBIS) risk calculator, or other model using family history as a basis for calculations. Patients found to have a lifetime risk of breast cancer of greater than 20% to 25% should be offered annual screening with magnetic resonance imaging in addition to mammography.
ATYPICAL HYPERPLASIA: INCREASED RISK
When biopsy study shows atypical ductal hyperplasia or atypical lobular hyperplasia, there is an increased risk of breast cancer.28,32 The absolute overall risk of developing breast cancer in 25 years is 30%, and that risk is further stratified based on the number of foci of atypia noted in the specimen.29
When core-needle biopsy study reveals atypical ductal hyperplasia in the tissue, there is a 15% to 30% risk of finding breast cancer with surgical excision.28 Surgical excision is therefore recommended for atypical ductal hyperplasia noted on core-needle biopsy.28
In contrast, when atypical lobular hyperplasia alone is noted, the risk of upstagingto malignancy varies widely—from 0% to 67%—although recent studies have noted risks of 1% to 3%.33,34 Thus, the decision for surgical excision is more variable. Generally, if the atypical lobular hyperplasia is noted incidentally, is not associated with a higher grade lesion, and is concordant with imaging, it is reasonable to closely monitor with serial imaging and physical examination. Excision is unnecessary.35
Patients found to have atypical hyperplasia on breast biopsy should receive counseling about risk-reducing medications. Selective estrogen receptor modulators such as tamoxifen and raloxifene have been shown to reduce the risk of breast cancer by as much as 86% in patients with atypical hyperplasia.36 Similarly, aromatase inhibitors such as exemestane and anastrozole reduce breast cancer risk by approximately 65%.37
- Eberl MM, Phillips RL Jr, Lamberts H, Okkes I, Mahoney MC. Characterizing breast symptoms in family practice. Ann Fam Med 2008; 6(6):528–533. doi:10.1370/afm.905
- Harvey JA, Mahoney MC, Newell MS, et al. ACR appropriateness criteria palpable breast masses. J Am Coll Radiol 2013; 10(10):742–749.e3. doi:10.1016/j.jacr.2013.06.013
- Ha R, Kim H, Mango V, Wynn R, Comstock C. Ultrasonographic features and clinical implications of benign palpable breast lesions in young women. Ultrasonography 2015; 34(1):66–70. doi:10.14366/usg.14043
- Provencher L, Hogue JC, Desbiens C, et al. Is clinical breast examination important for breast cancer detection? Curr Oncol 2016; 23(4):e332–e339. doi:10.3747/co.23.2881
- Scurr J, Hedger W, Morris P, Brown N. The prevalence, severity, and impact of breast pain in the general population. Breast J 2014; 20(5):508–513. doi:10.1111/tbj.12305
- Leddy R, Irshad A, Zerwas E, et al. Role of breast ultrasound and mammography in evaluating patients presenting with focal breast pain in the absence of a palpable lump. Breast J 2013; 19(6):582–589. doi:10.1111/tbj.12178
- Noroozian M, Stein LF, Gaetke-Udager K, Helvie MA. Long-term clinical outcomes in women with breast pain in the absence of additional clinical findings: mammography remains indicated. Breast Cancer Res Treat 2015; 149(2):417–424. doi:10.1007/s10549-014-3257-3
- Gateley CA, Miers M, Mansel RE, Hughes LE. Drug treatments for mastalgia: 17 years experience in the Cardiff Mastalgia Clinic. J R Soc Med 1992; 85(1):12–15. pmid:1548647
- Fentiman IS, Caleffi M, Hamed H, Chaudary MA. Dosage and duration of tamoxifen treatment for mastalgia: a controlled trial. Br J Surg 1988; 75(9):845–846. pmid:3052691
- Oksa S, Luukkaala T, Mäenpää J. Toremifene for premenstrual mastalgia: a randomised, placebo-controlled crossover study. BJOG 2006; 113(6):713–718. doi:10.1111/j.1471-0528.2006.00943.x
- Mirghafourvand M, Mohammad-Alizadeh-Charandabi S, Ahmadpour P, Javadzadeh Y. Effects of Vitex agnus and flaxseed on cyclic mastalgia: a randomized controlled trial. Complement Ther Med 2016; 24:90–95. doi:10.1016/j.ctim.2015.12.009
- Shobeiri F, Oshvandi K, Nazari M. Clinical effectiveness of vitamin E and vitamin B6 for improving pain severity in cyclic mastalgia. Iran J Nurs Midwifery Res 2015; 20(6):723–727. doi:10.4103/1735-9066.170003
- Thicke LA, Hazelton JK, Bauer BA, et al. Acupuncture for treatment of noncyclic breast pain: a pilot study. Am J Chin Med 2011; 39(6):1117–1129. doi:10.1142/S0192415X11009445
- Santen RJ, Mansel R. Benign breast disorders. N Engl J Med 2005; 353(3):275–285. doi:10.1056/NEJMra035692
- Gülay H, Bora S, Kìlìçturgay S, Hamaloglu E, Göksel HA. Management of nipple discharge. J Am Coll Surg 1994; 178(5):471–474. pmid:8167884
- Murad TM, Contesso G, Mouriesse H. Nipple discharge from the breast. Ann Surg 1982; 195(3):259–264. pmid:6277258
- Sakorafas GH. Nipple discharge: current diagnostic and therapeutic approaches. Cancer Treat Rev 2001; 27(5):275–282. doi:10.1053/ctrv.2001.0234
- Ashfaq A, Senior D, Pockaj BA, et al. Validation study of a modern treatment algorithm for nipple discharge. Am J Surg 2014; 208(2):222–227. doi:10.1016/j.amjsurg.2013.12.035
- Chen CY, Sun LM, Anderson BO. Paget disease of the breast: changing patterns of incidence, clinical presentation, and treatment in the US. Cancer 2006; 107(7):1448–1458. doi:10.1002/cncr.22137
- Kollmorgen DR, Varanasi JS, Edge SB, Carson WE 3rd. Paget's disease of the breast: a 33-year experience. J Am Coll Surg 1998; 187(2):171–177. pmid:9704964
- Hruska CB. Molecular breast imaging for screening in dense breasts: state of the art and future directions. AJR Am J Roentgenol 2017; 208(2):275–283. doi:10.2214/AJR.16.17131
- Melnikow J, Fenton JJ, Whitlock EP, et al. Supplemental screening for breast cancer in women with dense breasts: a systematic review for the US Preventive Services Task Force. Ann Intern Med 2016; 164(4):268–278. doi:10.7326/M15-1789
- American College of Radiology. Breast imaging reporting and data system (BI-RADS). Reston, VA: American College of Radiology; 2013.
- Brentnall AR, Harkness EF, Astley SM, et al. Mammographic density adds accuracy to both the Tyrer-Cuzick and Gail breast cancer risk models in a prospective UK screening cohort. Breast Cancer Res 2015; 17(1):147. doi:10.1186/s13058-015-0653-5
- Friedewald SM, Rafferty EA, Rose SL, et al. Breast cancer screening using tomosynthesis in combination with digital mammography. JAMA 2014; 311(24):2499–2507. doi:10.1001/jama.2014.6095
- Rafferty EA, Durand MA, Conant EF, et al. Breast cancer screening using tomosynthesis and digital mammography in dense and nondense breasts. JAMA 2016; 315(16):1784–1786. doi:10.1001/jama.2016.1708
- Venkatesan A, Chu P, Kerlikowske K, Sickles EA, Smith-Bindman R. Positive predictive value of specific mammographic findings according to reader and patient variables. Radiology 2009; 250(3):648–657. doi:10.1148/radiol.2503080541
- Hartmann LC, Sellers TA, Frost MH, et al. Benign breast disease and the risk of breast cancer. N Engl J Med 2005; 353(3):229–237. doi:10.1056/NEJMoa044383
- Hartmann LC, Degnim AC, Santen RJ, DuPont WD, Ghosh K. Atypical hyperplasia of the breast—risk assessment and management options. N Engl J Med 2015; 372(1):78–89. doi:10.1056/NEJMsr1407164
- Neal L, Sandhu NP, Hieken TJ, et al. Diagnosis and management of benign, atypical, and indeterminate breast lesions detected on core needle biopsy. Mayo Clin Proc 2014; 89(4):536–547. doi:10.1016/j.mayocp.2014.02.004
- Nakhlis F, Ahmadiyeh N, Lester S, Raza S, Lotfi P, Golshan M. Papilloma on core biopsy: excision vs observation. Ann Surg Oncol 2015; 22(5):1479–1482. doi:10.1245/s10434-014-4091-x
- Degnim AC, Dupont WE, Radisky DC, et al. Extent of atypical hyperplasia stratifies breast cancer risk in 2 independent cohorts of women. Cancer 2016; 122(19):2971-2978. doi:10.1002/cncr.30153
- Sen LQ, Berg WA, Hooley RJ, Carter GJ, Desouki MM, Sumkin JH. Core breast biopsies showing lobular carcinoma in situ should be excised and surveillance is reasonable for atypical lobular hyperplasia. AJR Am J Roentgenol 2016; 207(5):1132–1145. doi:10.2214/AJR.15.15425
- Nakhlis F, Gilmore L, Gelman R, et al. Incidence of adjacent synchronous invasive carcinoma and/or ductal carcinoma in situ in patient with lobular neoplasia on core biopsy: results from a prospective multi-institutional registry (TBCRC 020). Ann Surg Oncol 2016; 23(3):722–728. doi:10.1245/s10434-015-4922-4
- Racz JM, Carter JM, Degnim AC. Lobular neoplasia and atypical ductal hyperplasia on core biopsy: current surgical management recommendations. Ann Surg Oncol 2017; 24(10):2848–2854. doi:10.1245/s10434-017-5978-0
- Fisher B, Costantino JP, Wickerham DL, et al. Tamoxifen for the prevention of breast cancer: report of the National Surgical Adjuvant Breast and Bowel Project P-1 Study. J Natl Cancer Inst 1998; 90:1371–1388. doi:10.1093/jnci/dji372
- Goss PE, Ingle JN, Alés-Martínez JE, et al. Exemestane for breast-cancer prevention in postmenopausal women. N Engl J Med 2011; 364(25):2381–2391. doi:10.1056/NEJMoa1103507
Breast concerns account for approximately 3% of all female visits to a primary care practice.1 The most common symptoms are breast lumps and breast pain.
Because breast cancer is the most common malignancy in women in the United States, affecting nearly 1 in 8 women in their lifetime, women with breast problems often fear the worst. However, only about 3.5% of women reporting a concern have cancer; most problems are benign (Table 1).1
Here, we present an evidence-based review of common breast problems in primary care practice and discuss how to evaluate and manage them.
GENERAL APPROACH
The evaluation of a breast concern requires a systematic approach, beginning with a history that documents the onset, severity, and frequency of symptoms. If the concern is a lump or mass, ask whether it becomes more tender or increases in size at any point during the menstrual cycle.
Focus the physical examination on the cervical, supraclavicular, infraclavicular, and axillary lymph nodes and on the breast itself. Assess breast symmetry, note any skin changes such as dimpling, and check the nipples for discharge and inversion. Palpate the breasts for masses.
PALPABLE BREAST MASS: IMAGING NEEDED
If a mass is present, it is more likely to be malignant if any of the following is true:
- Firm to hard texture or indistinct margins
- Attached to the underlying deep fascia or skin
- Associated nipple inversion or skin dimpling.2
Breast masses are more likely benign if they have discrete, well-defined margins, are mobile with a soft to rubbery consistency, and change with the menstrual cycle. However, clinical features are unreliable indicators of cause, and thus additional investigation with breast imaging is warranted.
Mammography remains the diagnostic test of choice for all women age 30 or older who have a palpable breast mass. It is less effective in younger women because they are more likely to have extremely dense fibroglandular tissue that will limit its sensitivity to imaging.
Order diagnostic mammography, which includes additional views focused on the area of concern, rather than screening mammography, which includes only standard craniocaudal and mediolateral oblique views. A skin marker should be applied over the palpable lump to aid imaging. Because a breast that contains a mass may be denser than the opposite breast or may show asymmetry, both breasts should be imaged. The sensitivity of diagnostic mammography varies from 85% to 90%, so a negative mammogram does not rule out malignancy.2,3
Targeted ultrasonography of the palpable mass helps identify solid masses such as fibroadenomas or malignant tumors, classifies the margins (lobulated, smooth, or irregular), and assesses vascularity. Ultrasonography is particularly useful for characterizing cystic lesions (eg, simple, septated, or clustered cysts) and cysts with internal echoes. It can also identify lipomas or sebaceous cysts.
If the findings on both mammography and ultrasonography are benign, the likelihood of cancer is very low, with an estimated negative predictive value of 97% to 100%.2,3 Additionally, the likelihood of nonmalignant findings on biopsy after benign imaging is approximately 99%.3
Although radiologic imaging can define palpable masses, it is intended as a clinical aid. Suspicious findings on clinical examination should never be ignored even if findings on imaging are reassuring, as studies have documented that about 5% of breast cancers may be detected on clinical breast examination alone.4
Other imaging tests such as magnetic resonance imaging may be considered occasionally if clinical suspicion remains high after negative mammography and ultrasonography, but they cannot confirm a diagnosis of malignancy. In that case, refer the patient to a surgeon for consideration of excisional biopsy.
Patients with an indeterminate lesion can return in 3 to 12 weeks for a follow-up examination and repeat imaging, which helps assess interval clinical stability. The latter option is especially helpful for patients with masses that are of low suspicion or for patients who prefer to avoid invasive tissue biopsy.
Patients with clinical and radiologic findings that suggest a benign cause can return for short-term follow-up in 6 months or in 12 months for their regular mammogram.
BREAST PAIN: RARELY MALIGNANT
More than 50% of women experience breast pain at some point in their life.5 Of these, 35% report that the pain adversely affects their sleep, and 41% note that the pain detrimentally affects their sexual quality of life. Up to 66% of breast pain correlates directly with the patient’s menstrual cycle.5 Breast pain is rarely associated with malignancy.
Regardless of its severity and the low likelihood of malignancy, breast pain can be a significant source of distress for the patient, primarily because of concerns about underlying malignancy. If the patient has a focal area of pain on examination, order mammography in combination with targeted ultrasonography. The sensitivity and negative predictive value of benign findings on combination mammography and ultrasonography in this setting are as high as 100%. The incidence of underlying cancer in patients with focal breast pain and no palpable mass is approximately 1.2%.6
The long-term prognosis in women with diffuse, often bilateral breast pain (in the absence of additional clinical findings) is excellent. In one study, the incidence of a breast cancer diagnosis was 1.8% after a median of 51 months of follow-up.7 Therefore, patients presenting with diffuse pain, no palpable abnormalities, and benign imaging can be safely reassured. Magnetic resonance imaging is rarely indicated in patients with breast pain unless other clinical findings, such as a mass or skin changes, are noted and the results of mammography and ultrasonography are negative.
Treating breast pain
Treating breast pain remains a challenge. The first step is to reassure the patient about her prognosis and help her make appropriate lifestyle modifications.
A well-fitting bra. Suggest getting a professional bra fitting. Wearing a well-fitted bra that offers lift, support, and compression and reduces excess motion can help improve benign breast pain. A bra fitting is especially important for women with large breasts because it can be difficult for these women to get an accurate size. Wearing a lightly fitted bra at night may also provide comfort if there is nighttime pain with breast tissue movement.
Reducing daily caffeine intake is often advised for pain management, but strong evidence of its efficacy is lacking.
Anti-inflammatory drugs can be beneficial if used short-term, especially if costochondritis is suspected.
Danazol improves pain in more than 70% of patients with cyclical symptoms and in up to 48% of those with noncyclical symptoms.
Bromocriptine is effective in up to 54% of those with cyclical symptoms and in up to 33% of those with noncyclical symptoms.8 However, the US Food and Drug Administration (FDA) withdrew approval for this indication because of adverse effects.
Tamoxifen, in contrast, provides relief in 94% of those with cyclical symptoms and in 56% of those with noncyclical symptoms.9
Adverse effects, however, limit the use of danazol, bromocriptine, and tamoxifen, and they should be prescribed only for short-term use (3 to 6 months) and only in women with chronic debilitating pain.
A few small studies have evaluated alternative options.
Toremifene is a triphenylethylene derivative similar to tamoxifen that is also used in the adjuvant treatment of postmenopausal breast cancer (but with fewer adverse effects). It has been documented to have a significant effect on premenstrual breast pain, with a 64% reduction in breast pain scores compared with a 26% reduction with placebo.10 However, the FDA has not approved it for this indication, and it can be cost-prohibitive.
Over-the-counter medications that may provide relief for cyclic breast pain include vitamin E or B6, products containing oil of Vitex agnus castus (chaste tree or chasteberry), and flaxseed.11,12
Acupuncture has been evaluated in patients with noncyclic breast pain and was found to reduce pain by 56% to 67% in one study,13 although it did not affect quality of life.
NIPPLE DISCHARGE
From 5% to 7% of women seek medical attention for nipple discharge.14,15 Breast cancer is found in 5% to 15% of women who undergo surgery for nipple discharge.16,17
Review the patient’s current medications and inquire about health conditions such as thyroid dysfunction or visual field changes that suggest a pituitary mass (which can lead to nipple discharge by causing hormonal dysregulation or hyperprolactinemia).
Palpate the breasts for an underlying mass, look for lesions on the nipple, and assess the color of the fluid. Also note whether there is discharge from one or both breasts, whether it is spontaneous or expressive, and whether it occurs from a single or multiple ducts. Nipple lesions may require further testing with punch biopsy.
Nonlactational nipple discharge is classified as physiologic or pathologic. Physiologic nipple discharge is typically bilateral, involving multiple ducts, and is often clear or straw-colored but may also be green, gray, or brown.
White, opaque fluid is often related to galactorrhea as a result of hyperprolactinemia, hypothyroidism, or medications such as antipsychotic drugs (eg, haloperidol and fluphenazine) and gastrointestinal motility agents such as metoclopramide. Discharge also commonly results from benign underlying ductal abnormalities such as intraductal papilloma, periductal mastitis, and duct ectasia.
Pathologic nipple discharge is often unilateral and persistent, occurring spontaneously from a solitary duct, and may be bloody or serous.
For women with pathologic nipple discharge who are 30 or older, diagnostic imaging with mammography and subareolar ultrasonography is recommended. If the patient is younger than 30, ultrasonography of the subareolar region alone can be used. Targeted ultrasonography of any palpable area is also advised.
Cytologic assessment of the fluid is not recommended because it can often lead to a false-positive finding of atypical cells. Imaging studies such as ductography, duct lavage, ductoscopy, and magnetic resonance imaging are also generally unnecessary; instead, a persistent clinical concern should prompt a surgical referral for consideration of duct excision.
When a patient has pathologic nipple discharge with a negative physical examination and breast imaging, studies have shown that the risk of cancer is 3% or less.18
Patients with spontaneous bloody or serous single-duct discharge with negative results on mammography and ultrasonography should be reassured that they have a low risk of underlying cancer. If the patient prefers, one approachto management is follow-up mammography and ultrasonography at 6 months and clinical examination for up to 2 years or until the discharge resolves on its own.
On the other hand, if the discharge is distressing to the patient, subareolar duct excision can be performed with both a diagnostic and therapeutic purpose.
NIPPLE-AREOLAR RASH: CONSIDER PAGET DISEASE
A rash on the nipple or areolar region warrants careful evaluation because it may be the first sign of Paget disease of the breast.
In the clinical breast examination, assess the extent of the rash and the presence of any underlying breast mass or nipple discharge. Dermatitis often starts on the areola and resolves quickly with topical therapy. However, Paget disease tends to start directly on the nipple itself, is unresponsive or only partially responsive to topical therapy, and progresses gradually, leading to erosions and ultimately effacement of the nipple itself.
If the clinical examination suggests mild dermatitis and the results of breast imaging are negative, treat the patient with a topical medication because benign conditions such as dermatitis and eczema are common. However, continued follow-up is mandatory until the rash completely resolves: Paget disease sometimes initially improves with topical therapy due to its inflammatory nature.
If you suspect Paget disease or the rash does not fully resolve after 2 to 3 weeks of topical therapy, refer the patient to a dermatologist for full-thickness punch biopsy to establish the diagnosis.
Paget disease of the breast may or may not be associated with underlying ductal carcinoma in situ or invasive breast cancer.19 The absence of clinical or imaging abnormalities in a patient with Paget disease does not rule out underlying malignancy.20
DENSE BREASTS
Increased breast density has been shown to be a risk factor for breast cancer and may be prognostically useful when combined with the Tyrer-Cuzick model or the Gail model of breast cancer risk.24
Additionally, increased density can mask cancers on mammography, significantly reducing its sensitivity. In women with heterogeneously or extremely dense breasts, the sensitivity of mammography for detecting cancer is only 25% to 50%.21 Due to this low sensitivity, supplemental imaging is helpful, particularly in women already at risk of breast cancer based on family history.
Supplemental screening
Digital mammography with tomosynthesis was approved by the FDA in 2011 for use in combination with standard digital mammography for breast cancer screening. Compared with traditional 2-dimensional mammography alone, adding 3-D tomosynthesis decreases the recall rate and increases the cancer detection rate.25
Tomosynthesis tends to perform better in women with heterogeneously dense breasts (BI-RADS category C). There is no significant improvement in cancer detection in women with extremely dense breasts (BI-RADS category D).26
Depending on the methodology, radiation exposure can be either higher or lower than with traditional mammography. However, in all forms, the very small amount of radiation is considered safe.
Whole breast ultrasonography. When whole breast ultrasonography is used to supplement mammography, the recall rate is higher than when mammography is used alone (14% vs 7%–11%).22 It also increases the cancer detection rate by 4.4 additional cancers per 1,000 examinations. However, the false-positive rate with whole breast ultrasonography is higher; the positive predictive value of combined mammography and ultrasonography is 11.2% vs 22.6% for mammography alone.22 Therefore, we do not generally recommend whole breast ultrasonography as a supplement to mammography in women with dense breast tissue unless other studies are not an option.
Molecular breast imaging is not widely available because it requires special equipment, injection of a radiopharamceutical (technetium Tc 99m sestamibi), and a radiologist who specializes in breast imaging to interpret the results. When it is available, however, it increases the cancer detection rate by 8.8 in 1,000 examinations; the positive predictive value is similar to that of screening mammography alone.21 It is particularly useful in patients with dense breasts who do not qualify for screening magnetic resonance imaging (lifetime risk of < 20% to 25%).
Technetium sestamibi is associated with a minimal amount of radiation exposure (2.4 mSv vs 1.2 mSV with standard mammography). However, this exposure is much less than background radiation exposure and is considered safe.21
IF THE PATIENT HAS AN ABNORMAL SCREENING MAMMOGRAM
Screening mammography can disclose abnormalities such as calcifications, masses, asymmetry, or architectural distortion.27 Abnormalities are reported using standardized BI-RADS categories designated with the numbers 0 through 6 (Table 3).23
A report of BI-RADS category 0 (incomplete), 4 (suspicious), or 5 (highly suspicious) requires additional workup.
Category 1 (negative) requires no further follow-up, and the patient should resume age-appropriate screening.
For patients with category 2 (benign) findings, routine screening is recommended, whereas patients with category 3 (probably benign) are advised to come back in 6 months for follow-up imaging.
Diagnostic mammography includes additional assessments for focal symptoms or areas of abnormality noted on screening imaging or clinical examination. These may include spot magnification views of areas of asymmetry, mass, architectural distortion, or calcifications. Ultrasonography of focal breast abnormalities can help determine if there is an underlying cyst or solid mass.
MANAGEMENT OF BENIGN FINDINGS ON BREAST BIOPSY
Benign breast disease is diagnosed when a patient with a palpable or radiographic abnormality undergoes breast biopsy with benign findings.28,29 It can be largely grouped into 3 categories: nonproliferative, proliferative without atypia, and proliferative with atypia (Table 4).28,29
If core-needle biopsy study results are benign, the next step is to establish radiologic-pathologic and clinical-pathologic concordance. If the findings on clinical examination or imaging are not consistent with those on pathologic study, excisional biopsy should be performed, as imaging-directed biopsy may not have adequately sampled the lesion.30
Nonproliferative lesions account for about 65% of findings on core-needle biopsy and include simple cysts, fibroadenomas, columnar cell changes, apocrine metaplasia, and mild ductal hyperplasia of the usual type. These lesions do not significantly increase the risk of breast cancer; the relative risk is 1.2 to 1.4.28,29 Additionally, the risk of “upstaging” after excisional biopsy—ie, to a higher-risk lesion or to malignancy—is minimal. Therefore, no additional action is necessary when these findings alone are noted on core-needle biopsy.
Proliferative lesions without atypia account for about 30% of biopsy results and include usual ductal hyperplasia, sclerosing adenosis, columnar hyperplasia, papilloma, and radial scar. Generally, there is a slightly increased risk of subsequent breast cancer, with a relative risk of 1.7 to 2.1.28 Usual ductal hyperplasia and columnar hyperplasia have little risk of upstaging with excision, and therefore, surgical consultation is not recommended.
Previously, surgical excision was recommended for any intraductal papilloma due to risk of upgrade in pathologic diagnosis at the time of excision. However, more recent data suggest that the upgrade rate is about 2.2% for a solitary papilloma that is less than 1 cm in diameter and without associated mass lesion (either clinically or radiographically), is concordant with radiographic findings, and has no associated atypical cells on biopsy.31 In this case, observation and short-interval clinical follow-up are reasonable. If there are multiple papillomas, the patient has symptoms such as persistent bloody nipple discharge, or any of the above criteria are not met, surgical excision is recommended.28
Similarly, radial scars and complex sclerosing lesions are increasingly likely to be associated with malignancy based on size. Upstaging ranges from 0% to 12%. It is again important when evaluating radial scars that there is pathologic concordance and that there were no associated high-risk lesions on pathology. If this is the case, it is reasonable to clinically monitor patients with small radial scars, particularly in those who do not have an elevated risk of developing breast cancer.30
For all patients who have undergone biopsy and whose pathology study results are benign, a thorough risk evaluation should be performed, including calculation of their lifetime risk of breast cancer. This can be done with the National Cancer Institute Breast Cancer Risk Assessment Tool, the International Breast Cancer Intervention Study (IBIS) risk calculator, or other model using family history as a basis for calculations. Patients found to have a lifetime risk of breast cancer of greater than 20% to 25% should be offered annual screening with magnetic resonance imaging in addition to mammography.
ATYPICAL HYPERPLASIA: INCREASED RISK
When biopsy study shows atypical ductal hyperplasia or atypical lobular hyperplasia, there is an increased risk of breast cancer.28,32 The absolute overall risk of developing breast cancer in 25 years is 30%, and that risk is further stratified based on the number of foci of atypia noted in the specimen.29
When core-needle biopsy study reveals atypical ductal hyperplasia in the tissue, there is a 15% to 30% risk of finding breast cancer with surgical excision.28 Surgical excision is therefore recommended for atypical ductal hyperplasia noted on core-needle biopsy.28
In contrast, when atypical lobular hyperplasia alone is noted, the risk of upstagingto malignancy varies widely—from 0% to 67%—although recent studies have noted risks of 1% to 3%.33,34 Thus, the decision for surgical excision is more variable. Generally, if the atypical lobular hyperplasia is noted incidentally, is not associated with a higher grade lesion, and is concordant with imaging, it is reasonable to closely monitor with serial imaging and physical examination. Excision is unnecessary.35
Patients found to have atypical hyperplasia on breast biopsy should receive counseling about risk-reducing medications. Selective estrogen receptor modulators such as tamoxifen and raloxifene have been shown to reduce the risk of breast cancer by as much as 86% in patients with atypical hyperplasia.36 Similarly, aromatase inhibitors such as exemestane and anastrozole reduce breast cancer risk by approximately 65%.37
- Eberl MM, Phillips RL Jr, Lamberts H, Okkes I, Mahoney MC. Characterizing breast symptoms in family practice. Ann Fam Med 2008; 6(6):528–533. doi:10.1370/afm.905
- Harvey JA, Mahoney MC, Newell MS, et al. ACR appropriateness criteria palpable breast masses. J Am Coll Radiol 2013; 10(10):742–749.e3. doi:10.1016/j.jacr.2013.06.013
- Ha R, Kim H, Mango V, Wynn R, Comstock C. Ultrasonographic features and clinical implications of benign palpable breast lesions in young women. Ultrasonography 2015; 34(1):66–70. doi:10.14366/usg.14043
- Provencher L, Hogue JC, Desbiens C, et al. Is clinical breast examination important for breast cancer detection? Curr Oncol 2016; 23(4):e332–e339. doi:10.3747/co.23.2881
- Scurr J, Hedger W, Morris P, Brown N. The prevalence, severity, and impact of breast pain in the general population. Breast J 2014; 20(5):508–513. doi:10.1111/tbj.12305
- Leddy R, Irshad A, Zerwas E, et al. Role of breast ultrasound and mammography in evaluating patients presenting with focal breast pain in the absence of a palpable lump. Breast J 2013; 19(6):582–589. doi:10.1111/tbj.12178
- Noroozian M, Stein LF, Gaetke-Udager K, Helvie MA. Long-term clinical outcomes in women with breast pain in the absence of additional clinical findings: mammography remains indicated. Breast Cancer Res Treat 2015; 149(2):417–424. doi:10.1007/s10549-014-3257-3
- Gateley CA, Miers M, Mansel RE, Hughes LE. Drug treatments for mastalgia: 17 years experience in the Cardiff Mastalgia Clinic. J R Soc Med 1992; 85(1):12–15. pmid:1548647
- Fentiman IS, Caleffi M, Hamed H, Chaudary MA. Dosage and duration of tamoxifen treatment for mastalgia: a controlled trial. Br J Surg 1988; 75(9):845–846. pmid:3052691
- Oksa S, Luukkaala T, Mäenpää J. Toremifene for premenstrual mastalgia: a randomised, placebo-controlled crossover study. BJOG 2006; 113(6):713–718. doi:10.1111/j.1471-0528.2006.00943.x
- Mirghafourvand M, Mohammad-Alizadeh-Charandabi S, Ahmadpour P, Javadzadeh Y. Effects of Vitex agnus and flaxseed on cyclic mastalgia: a randomized controlled trial. Complement Ther Med 2016; 24:90–95. doi:10.1016/j.ctim.2015.12.009
- Shobeiri F, Oshvandi K, Nazari M. Clinical effectiveness of vitamin E and vitamin B6 for improving pain severity in cyclic mastalgia. Iran J Nurs Midwifery Res 2015; 20(6):723–727. doi:10.4103/1735-9066.170003
- Thicke LA, Hazelton JK, Bauer BA, et al. Acupuncture for treatment of noncyclic breast pain: a pilot study. Am J Chin Med 2011; 39(6):1117–1129. doi:10.1142/S0192415X11009445
- Santen RJ, Mansel R. Benign breast disorders. N Engl J Med 2005; 353(3):275–285. doi:10.1056/NEJMra035692
- Gülay H, Bora S, Kìlìçturgay S, Hamaloglu E, Göksel HA. Management of nipple discharge. J Am Coll Surg 1994; 178(5):471–474. pmid:8167884
- Murad TM, Contesso G, Mouriesse H. Nipple discharge from the breast. Ann Surg 1982; 195(3):259–264. pmid:6277258
- Sakorafas GH. Nipple discharge: current diagnostic and therapeutic approaches. Cancer Treat Rev 2001; 27(5):275–282. doi:10.1053/ctrv.2001.0234
- Ashfaq A, Senior D, Pockaj BA, et al. Validation study of a modern treatment algorithm for nipple discharge. Am J Surg 2014; 208(2):222–227. doi:10.1016/j.amjsurg.2013.12.035
- Chen CY, Sun LM, Anderson BO. Paget disease of the breast: changing patterns of incidence, clinical presentation, and treatment in the US. Cancer 2006; 107(7):1448–1458. doi:10.1002/cncr.22137
- Kollmorgen DR, Varanasi JS, Edge SB, Carson WE 3rd. Paget's disease of the breast: a 33-year experience. J Am Coll Surg 1998; 187(2):171–177. pmid:9704964
- Hruska CB. Molecular breast imaging for screening in dense breasts: state of the art and future directions. AJR Am J Roentgenol 2017; 208(2):275–283. doi:10.2214/AJR.16.17131
- Melnikow J, Fenton JJ, Whitlock EP, et al. Supplemental screening for breast cancer in women with dense breasts: a systematic review for the US Preventive Services Task Force. Ann Intern Med 2016; 164(4):268–278. doi:10.7326/M15-1789
- American College of Radiology. Breast imaging reporting and data system (BI-RADS). Reston, VA: American College of Radiology; 2013.
- Brentnall AR, Harkness EF, Astley SM, et al. Mammographic density adds accuracy to both the Tyrer-Cuzick and Gail breast cancer risk models in a prospective UK screening cohort. Breast Cancer Res 2015; 17(1):147. doi:10.1186/s13058-015-0653-5
- Friedewald SM, Rafferty EA, Rose SL, et al. Breast cancer screening using tomosynthesis in combination with digital mammography. JAMA 2014; 311(24):2499–2507. doi:10.1001/jama.2014.6095
- Rafferty EA, Durand MA, Conant EF, et al. Breast cancer screening using tomosynthesis and digital mammography in dense and nondense breasts. JAMA 2016; 315(16):1784–1786. doi:10.1001/jama.2016.1708
- Venkatesan A, Chu P, Kerlikowske K, Sickles EA, Smith-Bindman R. Positive predictive value of specific mammographic findings according to reader and patient variables. Radiology 2009; 250(3):648–657. doi:10.1148/radiol.2503080541
- Hartmann LC, Sellers TA, Frost MH, et al. Benign breast disease and the risk of breast cancer. N Engl J Med 2005; 353(3):229–237. doi:10.1056/NEJMoa044383
- Hartmann LC, Degnim AC, Santen RJ, DuPont WD, Ghosh K. Atypical hyperplasia of the breast—risk assessment and management options. N Engl J Med 2015; 372(1):78–89. doi:10.1056/NEJMsr1407164
- Neal L, Sandhu NP, Hieken TJ, et al. Diagnosis and management of benign, atypical, and indeterminate breast lesions detected on core needle biopsy. Mayo Clin Proc 2014; 89(4):536–547. doi:10.1016/j.mayocp.2014.02.004
- Nakhlis F, Ahmadiyeh N, Lester S, Raza S, Lotfi P, Golshan M. Papilloma on core biopsy: excision vs observation. Ann Surg Oncol 2015; 22(5):1479–1482. doi:10.1245/s10434-014-4091-x
- Degnim AC, Dupont WE, Radisky DC, et al. Extent of atypical hyperplasia stratifies breast cancer risk in 2 independent cohorts of women. Cancer 2016; 122(19):2971-2978. doi:10.1002/cncr.30153
- Sen LQ, Berg WA, Hooley RJ, Carter GJ, Desouki MM, Sumkin JH. Core breast biopsies showing lobular carcinoma in situ should be excised and surveillance is reasonable for atypical lobular hyperplasia. AJR Am J Roentgenol 2016; 207(5):1132–1145. doi:10.2214/AJR.15.15425
- Nakhlis F, Gilmore L, Gelman R, et al. Incidence of adjacent synchronous invasive carcinoma and/or ductal carcinoma in situ in patient with lobular neoplasia on core biopsy: results from a prospective multi-institutional registry (TBCRC 020). Ann Surg Oncol 2016; 23(3):722–728. doi:10.1245/s10434-015-4922-4
- Racz JM, Carter JM, Degnim AC. Lobular neoplasia and atypical ductal hyperplasia on core biopsy: current surgical management recommendations. Ann Surg Oncol 2017; 24(10):2848–2854. doi:10.1245/s10434-017-5978-0
- Fisher B, Costantino JP, Wickerham DL, et al. Tamoxifen for the prevention of breast cancer: report of the National Surgical Adjuvant Breast and Bowel Project P-1 Study. J Natl Cancer Inst 1998; 90:1371–1388. doi:10.1093/jnci/dji372
- Goss PE, Ingle JN, Alés-Martínez JE, et al. Exemestane for breast-cancer prevention in postmenopausal women. N Engl J Med 2011; 364(25):2381–2391. doi:10.1056/NEJMoa1103507
KEY POINTS
- The two most common breast symptoms are lumps and pain.
- Most breast problems are not caused by cancer.
- Evaluation of any breast problem begins with a focused history followed by a breast examination and, when necessary, imaging.
- If the results of the breast examination and imaging suggest a benign cause, no further follow-up is necessary.
- If there is discordance between imaging and breast examination results, or if there is a high clinical suspicion of cancer, then consider serial follow-up examinations at short intervals, referral to a breast surgeon for excision, or both.
Rapidly progressive pleural effusion
A 33-year-old male nonsmoker with no significant medical history presented to the pulmonary clinic with severe left-sided pleuritic chest pain and mild breathlessness for the past 5 days. He denied fever, chills, cough, phlegm, runny nose, or congestion.
Five days before this visit, he had been seen in the emergency department with mild left-sided pleuritic chest pain. His vital signs at that time had been as follows:
- Blood pressure 141/77 mm Hg
- Heart rate 77 beats/minute
- Respiratory rate 17 breaths/minute
- Temperature 36.8°C (98.2°F)
- Oxygen saturation 98% on room air.
 showed a mild left-sided pleural reaction (arrow). Computed tomography (B) showed a mild pleural reaction (arrow) and parenchymal atelectatic and fibrotic changes.")
- White blood cell count 6.89 × 10⁹/L (reference range 3.70–11.00)
- Neutrophils 58% (40%–70%)
- Lymphocytes 29.6% (22%–44%)
- Monocytes 10.7% (0–11%)
- Eosinophils 1% (0–4%)
- Basophils 0.6% (0–1%)
- Troponin T and D-dimer levels normal.
DIFFERENTIAL DIAGNOSIS OF PLEURITIC CHEST PAIN
1. What is the most likely cause of his pleuritic chest pain?
- Pleuritis
- Pneumonia
- Pulmonary embolism
- Malignancy
The differential diagnosis of pleuritic chest pain is broad.
The patient’s symptoms at presentation to the emergency department did not suggest an infectious process. There was no fever, cough, or phlegm, and his white blood cell count was normal. Nonetheless, pneumonia could not be ruled out, as the lung parenchyma was not normal on radiography, and the findings could have been consistent with an early or resolving infectious process.
Pulmonary embolism was a possibility, but his normal D-dimer level argued against it. Further, the patient subsequently underwent CT angiography, which ruled out pulmonary embolism.
Malignancy was unlikely in a young nonsmoker, but follow-up imaging would be needed to ensure resolution and rule this out.
The emergency department physician diagnosed inflammatory pleuritis and discharged him home on a nonsteroidal anti-inflammatory drug.
CLINIC VISIT 5 DAYS LATER
At his pulmonary clinic visit 5 days later, the patient reported persistent but stable left-sided pleuritic chest pain and mild breathlessness on exertion. His blood pressure was 137/81 mm Hg, heart rate 109 beats per minute, temperature 37.1°C (98.8°F), and oxygen saturation 97% on room air.
Auscultation of the lungs revealed rales and slightly decreased breath sounds at the left base. No dullness to percussion could be detected.
Because the patient had developed mild tachycardia and breathlessness along with clinical signs that suggested worsening infiltrates, consolidation, or the development of pleural effusion, he underwent further investigation with chest radiography, a complete blood cell count, and measurement of serum inflammatory markers.

- White blood cell count 13.08 × 10⁹/L
- Neutrophils 81%
- Lymphocytes 7.4%
- Monocytes 7.2%
- Eeosinophils 0.2%
- Basophils 0.2%
- Procalcitonin 0.34 µg/L (reference range < 0.09).
Bedside ultrasonography to assess the effusion’s size and characteristics and the need for thoracentesis indicated that the effusion was too small to tap, and there were no fibrinous strands or loculations to suggest empyema.
FURTHER TREATMENT
2. What was the best management strategy for this patient at this time?
- Admit to the hospital for thoracentesis and intravenous antibiotics
- Give oral antibiotics with close follow-up
- Perform thoracentesis on an outpatient basis and give oral antibiotics
- Repeat chest CT
The patient had worsening pleuritic pain with development of a small left pleural effusion. His symptoms had not improved on a nonsteroidal anti-inflammatory drug. He now had an elevated white blood cell count with a “left shift” (ie, an increase in neutrophils, indicating more immature cells in circulation) and elevated procalcitonin. The most likely diagnosis was pneumonia with a resulting pleural effusion, ie, parapneumonic effusion, requiring appropriate antibiotic therapy. Ideally, the pleural effusion should be sampled by thoracentesis, with management on an outpatient or inpatient basis.

5 DAYS LATER, THE EFFUSION HAD BECOME MASSIVE
On follow-up 5 days later, the patient’s chest pain was better, but he was significantly more short of breath. His blood pressure was 137/90 mm Hg, heart rate 117 beats/minute, respiratory rate 16 breaths/minute, oxygen saturation 97% on room air, and temperature 36.9°C (98.4°F). Chest auscultation revealed decreased breath sounds over the left hemithorax, with dullness to percussion and decreased fremitus.
 and massive pleural effusion causing mediastinal shift to the right on computed tomography (B).")
RAPIDLY PROGRESSIVE PLEURAL EFFUSIONS
A rapidly progressive pleural effusion in a healthy patient suggests parapneumonic effusion. The most likely organism is streptococcal.2
Explosive pleuritis is defined as a pleural effusion that increases in size in less than 24 hours. It was first described by Braman and Donat3 in 1986 as an effusion that develops within hours of admission. In 2001, Sharma and Marrie4 refined the definition as rapid development of pleural effusion involving more than 90% of the hemithorax within 24 hours, causing compression of pulmonary tissue and a mediastinal shift. It is a medical emergency that requires prompt investigation and treatment with drainage and antibiotics. All reported cases of explosive pleuritis have been parapneumonic effusion.
The organisms implicated in explosive pleuritis include gram-positive cocci such as Streptococcus pneumoniae, S pyogenes, other streptococci, staphylococci, and gram-negative cocci such as Neisseria meningitidis and Moraxella catarrhalis. Gram-negative bacilli include Haemophilus influenzae, Klebsiella pneumoniae, Pseudomonas species, Escherichia coli, Proteus species, Enterobacter species, Bacteroides species, and Legionella species.4,5 However, malignancy is the most common cause of massive pleural effusion, accounting for 54% of cases; 17% of cases are idiopathic, 13% are parapneumonic, and 12% are hydrothorax related to liver cirrhosis.6
CASE CONTINUED
Our patient’s massive effusion needed drainage, and he was admitted to the hospital for further management. Samples of blood and sputum were sent for culture. Intravenous piperacillin-tazobactam was started, and an intercostal chest tube was inserted into the pleural cavity under ultrasonographic guidance to drain turbid fluid.


Multiple pleural fluid samples sent for bacterial, fungal, and acid-fast bacilli culture were negative. Blood and sputum cultures also showed no growth. The administration of oral antibiotics for 5 days on an outpatient basis before pleural fluid culture could have led to sterility of all cultures.

Our patient had inadequate pleural fluid output through his chest tube, and radiography showed that the pleural collections failed to clear. In fact, an apical locule did not appear to be connecting with the lower aspect of the pleural collection. In such cases, instillation of intrapleural agents through the chest tube has become common practice in an attempt to lyse adhesions, to connect various locules or pockets of pleural fluid, and to improve drainage.
LOCULATED EMPYEMA: MANAGEMENT
3. What was the best management strategy for this loculated empyema?
- Continue intravenous antibiotics and existing chest tube drainage for 5 to 7 days, then reassess
- Continue intravenous antibiotics and instill intrapleural fibrinolytics (eg, tissue plasminogen activator [tPA]) through the existing chest tube
- Continue intravenous antibiotics and instill intrapleural fibrinolytics with deoxyribonuclease (DNase) into the existing chest tube
- Continue intravenous antibiotics, insert a second chest tube into the apical pocket under imaging guidance, and instill tPA and DNase
- Surgical decortication
Continuing antibiotics with existing chest tube drainage and the two options of using single-agent intrapleural fibrinolytics have been shown to be less effective than combining tPA and DNase when managing a loculated empyema. As such, surgical decortication, attempting intrapleural instillation of fibrinolytics and DNase (with or without further chest tube insertion into noncommunicating locules), or both were the most appropriate options at this stage.
MANAGEMENT OF PARAPNEUMONIC PLEURAL EFFUSION IN ADULTS
There are several options for managing parapneumonic effusion, and clinicians can use the classification system in Table 1 to assess the risk of a poor outcome and to plan the management. Based on radiographic findings and pleural fluid sampling, a pleural effusion can be either observed or drained.
Options for drainage of the pleural space include repeat thoracentesis, surgical insertion of a chest tube, or image-guided insertion of a small-bore catheter. Although no randomized trial has been done to compare tube sizes, a large retrospective series showed that small-bore tubes (< 14 F) perform similarly to standard large-bore tubes.8 However, in another study, Keeling et al9 reported higher failure rates when tubes smaller than 12 F were used. Regular flushing of the chest tube (ideally twice a day) is recommended to keep it patent, particularly with small-bore tubes. Multiloculated empyema may require multiple intercostal chest tubes to drain completely, and therefore small-bore tubes are recommended.
In cases that do not improve radiographically and clinically, one must consider whether the antibiotic choice is adequate, review the position of the chest tube, and assess for loculations. As such, repeating chest CT within 24 to 48 hours of tube insertion and drainage is recommended to confirm adequate tube positioning, assess effective drainage, look for different locules and pockets, and determine the degree of communication between them.
The largest well-powered randomized controlled trials of intrapleural agents in the management of pleural infection, the Multicentre Intrapleural Sepsis Trial (MIST1)10 and MIST2,11 clearly demonstrated that intrapleural fibrinolytics were not beneficial when used alone compared with placebo. However, in MIST2, the combination of tPA and DNase led to clinically significant benefits including radiologic improvement, shorter hospital stay, and less need for surgical decortication.
At our hospital, we follow the MIST2 protocol using a combination of tPA and DNase given intrapleurally twice daily for 3 days. In our patient, we inserted a chest tube into the apical pocket under ultrasonographic guidance, as 2 instillations of intrapleural tPA and DNase did not result in drainage of the apical locule.
Success rates with intrapleural tPA-DNase for complicated pleural effusion and empyema range from 68% to 92%.12–15 Pleural thickening and necrotizing pneumonia and abscess are important predictors of failure of tPA-DNase therapy and of the need for surgery.13,14
Early surgical intervention was another reasonable option in this case. The decision to proceed with surgery is based on need to debride multiloculated empyemas or uniloculated empyemas that fail to resolve with antibiotics and tube thoracostomy drainage. Nonetheless, the decision must be individualized and based on factors such as the patient’s risks vs possible benefit from a surgical procedure under general anesthesia, the patient’s ability to tolerate multiple thoracentesis procedures and chest tubes for a potentially lengthy period, the patient’s pain threshold, the patient’s wishes to avoid a surgical procedure balanced against a longer hospital stay, and cultural norms and beliefs.
Surgical options include video-assisted thoracoscopy, thoracotomy, and open drainage. Decortication can be considered early to control pleural sepsis, or late (after 3 to 6 months) if the lung does not expand. Debate continues on the optimal timing for video-assisted thoracoscopy, with data suggesting that when the procedure is performed later in the course of the disease there is a greater chance of complications and of the need to convert to thoracotomy.
A 2017 Cochrane review16 of surgical vs nonsurgical management of empyema identified 8 randomized trials, 6 in children and 2 in adults, with a total of 391 patients. The authors compared video-assisted thoracoscopy vs tube thoracotomy, with and without intrapleural fibrinolytics. They noted no difference in rates of mortality or procedural complications. However, the mean length of hospital stay was shorter with video-assisted thoracoscopy than with tube thoracotomy (5.9 vs 15.4 days). They could not assess the impact of fibrinolytic therapy on total cost of treatment in the 2 groups.
A randomized trial is planned to compare early video-assisted thoracoscopy vs treatment with chest tube drainage and t-PA-DNase.17
At our institution, we use a multidisciplinary approach, discussing cases at weekly meetings with thoracic surgeons, pulmonologists, infectious disease specialists, and interventional radiologists. We generally try conservative management first, with chest tube drainage and intrapleural agents for 5 to 7 days, before considering surgery if the response is unsatisfactory.
THE PATIENT RECOVERED
In our patient, the multiloculated empyema was successfully cleared after intrapleural instillation of 4 doses of tPA and DNAse over 3 days and insertion of a second intercostal chest tube into the noncommunicating apical locule. He completed 14 days of intravenous piperacillin-tazobactam treatment and, after discharge home, completed another 4 weeks of oral amoxicillin-clavulanate. He made a full recovery and was back at work 2 weeks after discharge. Chest radiography 10 weeks after discharge showed normal results.
- Colice GL, Curtis A, Deslauriers J, et al. Medical and surgical treatment of parapneumonic effusions: an evidence-based guideline. Chest 2000; 118(4):1158–1171. pmid:11035692
- Bryant RE, Salmon CJ. Pleural empyema. Clin Infect Dis 1996; 22(5):747–762. pmid:8722927
- Braman SS, Donat WE. Explosive pleuritis. Manifestation of group A beta-hemolytic streptococcal infection. Am J Med 1986; 81(4):723–726. pmid:3532794
- Sharma JK, Marrie TJ. Explosive pleuritis. Can J Infect Dis 2001; 12(2):104–107. pmid:18159325
- Johnson JL. Pleurisy, fever, and rapidly progressive pleural effusion in a healthy, 29-year-old physician. Chest 2001; 119(4):1266–1269. pmid:11296198
- Jimenez D, Diaz G, Gil D, et al. Etiology and prognostic significance of massive pleural effusions. Respir Med 2005; 99(9):1183–1187. doi:10.1016/j.rmed.2005.02.022
- Light RW, MacGregor MI, Luchsinger PC, Ball WC Jr. Pleural effusions: the diagnostic separation of transudates and exudates. Ann Intern Med 1972; 77:507–513. pmid:4642731
- Rahman NM, Maskell NA, Davies CW, et al. The relationship between chest tube size and clinical outcome in pleural infection. Chest 2010; 137(3):536–543. doi:10.1378/chest.09-1044
- Keeling AN, Leong S, Logan PM, Lee MJ. Empyema and effusion: outcome of image-guided small-bore catheter drainage. Cardiovasc Intervent Radiol 2008; 31(1):135–141. doi:10.1007/s00270-007-9197-0
- Maskell NA, Davies CW, Nunn AJ, et al. UK controlled trial of intrapleural streptokinase for pleural infection. N Engl J Med 2005; 352(9):865–874. doi:10.1056/NEJMoa042473
- Rahman NM, Maskell NA, West A, et al. Intrapleural use of tissue plasminogen activator and DNase in pleural infection. N Engl J Med 2011; 365(6):518–526. doi:10.1056/NEJMoa1012740
- Piccolo F, Pitman N, Bhatnagar R, et al. Intrapleural tissue plasminogen activator and deoxyribonuclease for pleural infection. An effective and safe alternative to surgery. Ann Am Thorac Soc 2014; 11(9):1419–1425. doi:10.1513/AnnalsATS.201407-329OC
- Khemasuwan D, Sorensen J, Griffin DC. Predictive variables for failure in administration of intrapleural tissue plasminogen activator/deoxyribonuclease in patients with complicated parapneumonic effusions/empyema. Chest 2018; 154(3):550–556. doi:10.1016/j.chest.2018.01.037
- Abu-Daff S, Maziak DE, Alshehab D, et al. Intrapleural fibrinolytic therapy (IPFT) in loculated pleural effusions—analysis of predictors for failure of therapy and bleeding: a cohort study. BMJ Open 2013; 3(2):e001887. doi:10.1136/bmjopen-2012-001887
- Bishwakarma R, Shah S, Frank L, Zhang W, Sharma G, Nishi SP. Mixing it up: coadministration of tPA/DNase in complicated parapneumonic pleural effusions and empyema. J Bronchology Interv Pulmonol 2017; 24(1):40–47. doi:10.1097/LBR.0000000000000334
- Redden MD, Chin TY, van Driel ML. Surgical versus non-surgical management for pleural empyema. Cochrane Database Syst Rev 2017; 3:CD010651. doi:10.1002/14651858.CD010651.pub2
- Feller-Kopman D, Light R. Pleural disease. N Engl J Med 2018; 378(8):740–751. doi:10.1056/NEJMra1403503
A 33-year-old male nonsmoker with no significant medical history presented to the pulmonary clinic with severe left-sided pleuritic chest pain and mild breathlessness for the past 5 days. He denied fever, chills, cough, phlegm, runny nose, or congestion.
Five days before this visit, he had been seen in the emergency department with mild left-sided pleuritic chest pain. His vital signs at that time had been as follows:
- Blood pressure 141/77 mm Hg
- Heart rate 77 beats/minute
- Respiratory rate 17 breaths/minute
- Temperature 36.8°C (98.2°F)
- Oxygen saturation 98% on room air.
- White blood cell count 6.89 × 10⁹/L (reference range 3.70–11.00)
- Neutrophils 58% (40%–70%)
- Lymphocytes 29.6% (22%–44%)
- Monocytes 10.7% (0–11%)
- Eosinophils 1% (0–4%)
- Basophils 0.6% (0–1%)
- Troponin T and D-dimer levels normal.
DIFFERENTIAL DIAGNOSIS OF PLEURITIC CHEST PAIN
1. What is the most likely cause of his pleuritic chest pain?
- Pleuritis
- Pneumonia
- Pulmonary embolism
- Malignancy
The differential diagnosis of pleuritic chest pain is broad.
The patient’s symptoms at presentation to the emergency department did not suggest an infectious process. There was no fever, cough, or phlegm, and his white blood cell count was normal. Nonetheless, pneumonia could not be ruled out, as the lung parenchyma was not normal on radiography, and the findings could have been consistent with an early or resolving infectious process.
Pulmonary embolism was a possibility, but his normal D-dimer level argued against it. Further, the patient subsequently underwent CT angiography, which ruled out pulmonary embolism.
Malignancy was unlikely in a young nonsmoker, but follow-up imaging would be needed to ensure resolution and rule this out.
The emergency department physician diagnosed inflammatory pleuritis and discharged him home on a nonsteroidal anti-inflammatory drug.
CLINIC VISIT 5 DAYS LATER
At his pulmonary clinic visit 5 days later, the patient reported persistent but stable left-sided pleuritic chest pain and mild breathlessness on exertion. His blood pressure was 137/81 mm Hg, heart rate 109 beats per minute, temperature 37.1°C (98.8°F), and oxygen saturation 97% on room air.
Auscultation of the lungs revealed rales and slightly decreased breath sounds at the left base. No dullness to percussion could be detected.
Because the patient had developed mild tachycardia and breathlessness along with clinical signs that suggested worsening infiltrates, consolidation, or the development of pleural effusion, he underwent further investigation with chest radiography, a complete blood cell count, and measurement of serum inflammatory markers.
- White blood cell count 13.08 × 10⁹/L
- Neutrophils 81%
- Lymphocytes 7.4%
- Monocytes 7.2%
- Eeosinophils 0.2%
- Basophils 0.2%
- Procalcitonin 0.34 µg/L (reference range < 0.09).
Bedside ultrasonography to assess the effusion’s size and characteristics and the need for thoracentesis indicated that the effusion was too small to tap, and there were no fibrinous strands or loculations to suggest empyema.
FURTHER TREATMENT
2. What was the best management strategy for this patient at this time?
- Admit to the hospital for thoracentesis and intravenous antibiotics
- Give oral antibiotics with close follow-up
- Perform thoracentesis on an outpatient basis and give oral antibiotics
- Repeat chest CT
The patient had worsening pleuritic pain with development of a small left pleural effusion. His symptoms had not improved on a nonsteroidal anti-inflammatory drug. He now had an elevated white blood cell count with a “left shift” (ie, an increase in neutrophils, indicating more immature cells in circulation) and elevated procalcitonin. The most likely diagnosis was pneumonia with a resulting pleural effusion, ie, parapneumonic effusion, requiring appropriate antibiotic therapy. Ideally, the pleural effusion should be sampled by thoracentesis, with management on an outpatient or inpatient basis.
5 DAYS LATER, THE EFFUSION HAD BECOME MASSIVE
On follow-up 5 days later, the patient’s chest pain was better, but he was significantly more short of breath. His blood pressure was 137/90 mm Hg, heart rate 117 beats/minute, respiratory rate 16 breaths/minute, oxygen saturation 97% on room air, and temperature 36.9°C (98.4°F). Chest auscultation revealed decreased breath sounds over the left hemithorax, with dullness to percussion and decreased fremitus.
RAPIDLY PROGRESSIVE PLEURAL EFFUSIONS
A rapidly progressive pleural effusion in a healthy patient suggests parapneumonic effusion. The most likely organism is streptococcal.2
Explosive pleuritis is defined as a pleural effusion that increases in size in less than 24 hours. It was first described by Braman and Donat3 in 1986 as an effusion that develops within hours of admission. In 2001, Sharma and Marrie4 refined the definition as rapid development of pleural effusion involving more than 90% of the hemithorax within 24 hours, causing compression of pulmonary tissue and a mediastinal shift. It is a medical emergency that requires prompt investigation and treatment with drainage and antibiotics. All reported cases of explosive pleuritis have been parapneumonic effusion.
The organisms implicated in explosive pleuritis include gram-positive cocci such as Streptococcus pneumoniae, S pyogenes, other streptococci, staphylococci, and gram-negative cocci such as Neisseria meningitidis and Moraxella catarrhalis. Gram-negative bacilli include Haemophilus influenzae, Klebsiella pneumoniae, Pseudomonas species, Escherichia coli, Proteus species, Enterobacter species, Bacteroides species, and Legionella species.4,5 However, malignancy is the most common cause of massive pleural effusion, accounting for 54% of cases; 17% of cases are idiopathic, 13% are parapneumonic, and 12% are hydrothorax related to liver cirrhosis.6
CASE CONTINUED
Our patient’s massive effusion needed drainage, and he was admitted to the hospital for further management. Samples of blood and sputum were sent for culture. Intravenous piperacillin-tazobactam was started, and an intercostal chest tube was inserted into the pleural cavity under ultrasonographic guidance to drain turbid fluid.
Multiple pleural fluid samples sent for bacterial, fungal, and acid-fast bacilli culture were negative. Blood and sputum cultures also showed no growth. The administration of oral antibiotics for 5 days on an outpatient basis before pleural fluid culture could have led to sterility of all cultures.
Our patient had inadequate pleural fluid output through his chest tube, and radiography showed that the pleural collections failed to clear. In fact, an apical locule did not appear to be connecting with the lower aspect of the pleural collection. In such cases, instillation of intrapleural agents through the chest tube has become common practice in an attempt to lyse adhesions, to connect various locules or pockets of pleural fluid, and to improve drainage.
LOCULATED EMPYEMA: MANAGEMENT
3. What was the best management strategy for this loculated empyema?
- Continue intravenous antibiotics and existing chest tube drainage for 5 to 7 days, then reassess
- Continue intravenous antibiotics and instill intrapleural fibrinolytics (eg, tissue plasminogen activator [tPA]) through the existing chest tube
- Continue intravenous antibiotics and instill intrapleural fibrinolytics with deoxyribonuclease (DNase) into the existing chest tube
- Continue intravenous antibiotics, insert a second chest tube into the apical pocket under imaging guidance, and instill tPA and DNase
- Surgical decortication
Continuing antibiotics with existing chest tube drainage and the two options of using single-agent intrapleural fibrinolytics have been shown to be less effective than combining tPA and DNase when managing a loculated empyema. As such, surgical decortication, attempting intrapleural instillation of fibrinolytics and DNase (with or without further chest tube insertion into noncommunicating locules), or both were the most appropriate options at this stage.
MANAGEMENT OF PARAPNEUMONIC PLEURAL EFFUSION IN ADULTS
There are several options for managing parapneumonic effusion, and clinicians can use the classification system in Table 1 to assess the risk of a poor outcome and to plan the management. Based on radiographic findings and pleural fluid sampling, a pleural effusion can be either observed or drained.
Options for drainage of the pleural space include repeat thoracentesis, surgical insertion of a chest tube, or image-guided insertion of a small-bore catheter. Although no randomized trial has been done to compare tube sizes, a large retrospective series showed that small-bore tubes (< 14 F) perform similarly to standard large-bore tubes.8 However, in another study, Keeling et al9 reported higher failure rates when tubes smaller than 12 F were used. Regular flushing of the chest tube (ideally twice a day) is recommended to keep it patent, particularly with small-bore tubes. Multiloculated empyema may require multiple intercostal chest tubes to drain completely, and therefore small-bore tubes are recommended.
In cases that do not improve radiographically and clinically, one must consider whether the antibiotic choice is adequate, review the position of the chest tube, and assess for loculations. As such, repeating chest CT within 24 to 48 hours of tube insertion and drainage is recommended to confirm adequate tube positioning, assess effective drainage, look for different locules and pockets, and determine the degree of communication between them.
The largest well-powered randomized controlled trials of intrapleural agents in the management of pleural infection, the Multicentre Intrapleural Sepsis Trial (MIST1)10 and MIST2,11 clearly demonstrated that intrapleural fibrinolytics were not beneficial when used alone compared with placebo. However, in MIST2, the combination of tPA and DNase led to clinically significant benefits including radiologic improvement, shorter hospital stay, and less need for surgical decortication.
At our hospital, we follow the MIST2 protocol using a combination of tPA and DNase given intrapleurally twice daily for 3 days. In our patient, we inserted a chest tube into the apical pocket under ultrasonographic guidance, as 2 instillations of intrapleural tPA and DNase did not result in drainage of the apical locule.
Success rates with intrapleural tPA-DNase for complicated pleural effusion and empyema range from 68% to 92%.12–15 Pleural thickening and necrotizing pneumonia and abscess are important predictors of failure of tPA-DNase therapy and of the need for surgery.13,14
Early surgical intervention was another reasonable option in this case. The decision to proceed with surgery is based on need to debride multiloculated empyemas or uniloculated empyemas that fail to resolve with antibiotics and tube thoracostomy drainage. Nonetheless, the decision must be individualized and based on factors such as the patient’s risks vs possible benefit from a surgical procedure under general anesthesia, the patient’s ability to tolerate multiple thoracentesis procedures and chest tubes for a potentially lengthy period, the patient’s pain threshold, the patient’s wishes to avoid a surgical procedure balanced against a longer hospital stay, and cultural norms and beliefs.
Surgical options include video-assisted thoracoscopy, thoracotomy, and open drainage. Decortication can be considered early to control pleural sepsis, or late (after 3 to 6 months) if the lung does not expand. Debate continues on the optimal timing for video-assisted thoracoscopy, with data suggesting that when the procedure is performed later in the course of the disease there is a greater chance of complications and of the need to convert to thoracotomy.
A 2017 Cochrane review16 of surgical vs nonsurgical management of empyema identified 8 randomized trials, 6 in children and 2 in adults, with a total of 391 patients. The authors compared video-assisted thoracoscopy vs tube thoracotomy, with and without intrapleural fibrinolytics. They noted no difference in rates of mortality or procedural complications. However, the mean length of hospital stay was shorter with video-assisted thoracoscopy than with tube thoracotomy (5.9 vs 15.4 days). They could not assess the impact of fibrinolytic therapy on total cost of treatment in the 2 groups.
A randomized trial is planned to compare early video-assisted thoracoscopy vs treatment with chest tube drainage and t-PA-DNase.17
At our institution, we use a multidisciplinary approach, discussing cases at weekly meetings with thoracic surgeons, pulmonologists, infectious disease specialists, and interventional radiologists. We generally try conservative management first, with chest tube drainage and intrapleural agents for 5 to 7 days, before considering surgery if the response is unsatisfactory.
THE PATIENT RECOVERED
In our patient, the multiloculated empyema was successfully cleared after intrapleural instillation of 4 doses of tPA and DNAse over 3 days and insertion of a second intercostal chest tube into the noncommunicating apical locule. He completed 14 days of intravenous piperacillin-tazobactam treatment and, after discharge home, completed another 4 weeks of oral amoxicillin-clavulanate. He made a full recovery and was back at work 2 weeks after discharge. Chest radiography 10 weeks after discharge showed normal results.
- Colice GL, Curtis A, Deslauriers J, et al. Medical and surgical treatment of parapneumonic effusions: an evidence-based guideline. Chest 2000; 118(4):1158–1171. pmid:11035692
- Bryant RE, Salmon CJ. Pleural empyema. Clin Infect Dis 1996; 22(5):747–762. pmid:8722927
- Braman SS, Donat WE. Explosive pleuritis. Manifestation of group A beta-hemolytic streptococcal infection. Am J Med 1986; 81(4):723–726. pmid:3532794
- Sharma JK, Marrie TJ. Explosive pleuritis. Can J Infect Dis 2001; 12(2):104–107. pmid:18159325
- Johnson JL. Pleurisy, fever, and rapidly progressive pleural effusion in a healthy, 29-year-old physician. Chest 2001; 119(4):1266–1269. pmid:11296198
- Jimenez D, Diaz G, Gil D, et al. Etiology and prognostic significance of massive pleural effusions. Respir Med 2005; 99(9):1183–1187. doi:10.1016/j.rmed.2005.02.022
- Light RW, MacGregor MI, Luchsinger PC, Ball WC Jr. Pleural effusions: the diagnostic separation of transudates and exudates. Ann Intern Med 1972; 77:507–513. pmid:4642731
- Rahman NM, Maskell NA, Davies CW, et al. The relationship between chest tube size and clinical outcome in pleural infection. Chest 2010; 137(3):536–543. doi:10.1378/chest.09-1044
- Keeling AN, Leong S, Logan PM, Lee MJ. Empyema and effusion: outcome of image-guided small-bore catheter drainage. Cardiovasc Intervent Radiol 2008; 31(1):135–141. doi:10.1007/s00270-007-9197-0
- Maskell NA, Davies CW, Nunn AJ, et al. UK controlled trial of intrapleural streptokinase for pleural infection. N Engl J Med 2005; 352(9):865–874. doi:10.1056/NEJMoa042473
- Rahman NM, Maskell NA, West A, et al. Intrapleural use of tissue plasminogen activator and DNase in pleural infection. N Engl J Med 2011; 365(6):518–526. doi:10.1056/NEJMoa1012740
- Piccolo F, Pitman N, Bhatnagar R, et al. Intrapleural tissue plasminogen activator and deoxyribonuclease for pleural infection. An effective and safe alternative to surgery. Ann Am Thorac Soc 2014; 11(9):1419–1425. doi:10.1513/AnnalsATS.201407-329OC
- Khemasuwan D, Sorensen J, Griffin DC. Predictive variables for failure in administration of intrapleural tissue plasminogen activator/deoxyribonuclease in patients with complicated parapneumonic effusions/empyema. Chest 2018; 154(3):550–556. doi:10.1016/j.chest.2018.01.037
- Abu-Daff S, Maziak DE, Alshehab D, et al. Intrapleural fibrinolytic therapy (IPFT) in loculated pleural effusions—analysis of predictors for failure of therapy and bleeding: a cohort study. BMJ Open 2013; 3(2):e001887. doi:10.1136/bmjopen-2012-001887
- Bishwakarma R, Shah S, Frank L, Zhang W, Sharma G, Nishi SP. Mixing it up: coadministration of tPA/DNase in complicated parapneumonic pleural effusions and empyema. J Bronchology Interv Pulmonol 2017; 24(1):40–47. doi:10.1097/LBR.0000000000000334
- Redden MD, Chin TY, van Driel ML. Surgical versus non-surgical management for pleural empyema. Cochrane Database Syst Rev 2017; 3:CD010651. doi:10.1002/14651858.CD010651.pub2
- Feller-Kopman D, Light R. Pleural disease. N Engl J Med 2018; 378(8):740–751. doi:10.1056/NEJMra1403503