User login
The American Journal of Orthopedics is an Index Medicus publication that is valued by orthopedic surgeons for its peer-reviewed, practice-oriented clinical information. Most articles are written by specialists at leading teaching institutions and help incorporate the latest technology into everyday practice.
Open vs Percutaneous vs Arthroscopic Surgical Treatment of Lateral Epicondylitis: An Updated Systematic Review
ABSTRACT
This study was performed to compare outcomes of open, arthroscopic, and percutaneous surgical techniques for lateral epicondylitis. We searched PubMed (MEDLINE) for literature published between January 1, 2004 and May 23, 2015 using these key words: lateral epicondylitis AND (surgery OR operative OR surgical OR open OR arthroscopic OR percutaneous). Meta-analyses were performed for outcomes reported in 3 studies using 2-sample and 2-proportion Z-tests. Thirty-five studies including 1640 elbows (1055 open, 401 arthroscopic, 184 percutaneous) met the inclusion criteria. There were no differences between groups regarding duration to return to work, complication rate, or patient satisfaction. A greater proportion of patients were pain free in the open group than in the arthroscopic group (70% vs 60%). Despite the absence of a difference among techniques regarding return to work and subjective function, we recommend open débridement as the technique most likely to achieve a pain-free outcome.
Continue to: Lateral epicondylitis affects...
Lateral epicondylitis affects 1% to 3% of adults each year. Although common, symptoms of lateral epicondylitis resolve spontaneously within a year of symptom onset in 80% of cases, and only 3% of patients who seek medical treatment ultimately require surgical intervention within 2 years of symptom onset.1 Despite a relatively low percentage of patients who require surgery, Sanders and colleagues1 noted a significant increase in the rate of surgical intervention from 1.1% to 3.2% of cases in the last 15 years. Surgical intervention is generally indicated when pain and functional disability persist after 6 to 12 months of nonsurgical treatment. Traditional surgical treatment involves open release/débridement of the extensor carpi radialis (ECRB) origin; however, with the increasing prevalence of surgical intervention, surgeons have demonstrated a rising interest in less invasive techniques like arthroscopic release/débridement and percutaneous tenotomy as alternatives to traditional open débridement. While favorable results have been reported for all 3 techniques, there is no current consensus regarding the optimal surgical technique. In 2007, Lo and Safran2 reported no difference in the results of open, percutaneous, and arthroscopic techniques regarding any outcome measure in a systematic review of 33 papers. We conducted a repeat systematic review of the current literature to update Lo and Safran’s2 review and to ascertain if more recent literature demonstrates superiority of 1 technique regarding pain relief, subjective questionnaire data, subjective satisfaction, restoration of strength, and return to work. We hypothesized that return to work would be accelerated, pain decreased, and function improved in the early postoperative period in the arthroscopic and percutaneous groups, but there would be no difference in ultimate pain, functional outcome, or subjective satisfaction.
METHODS
SEARCH STRATEGY AND STUDY SELECTION
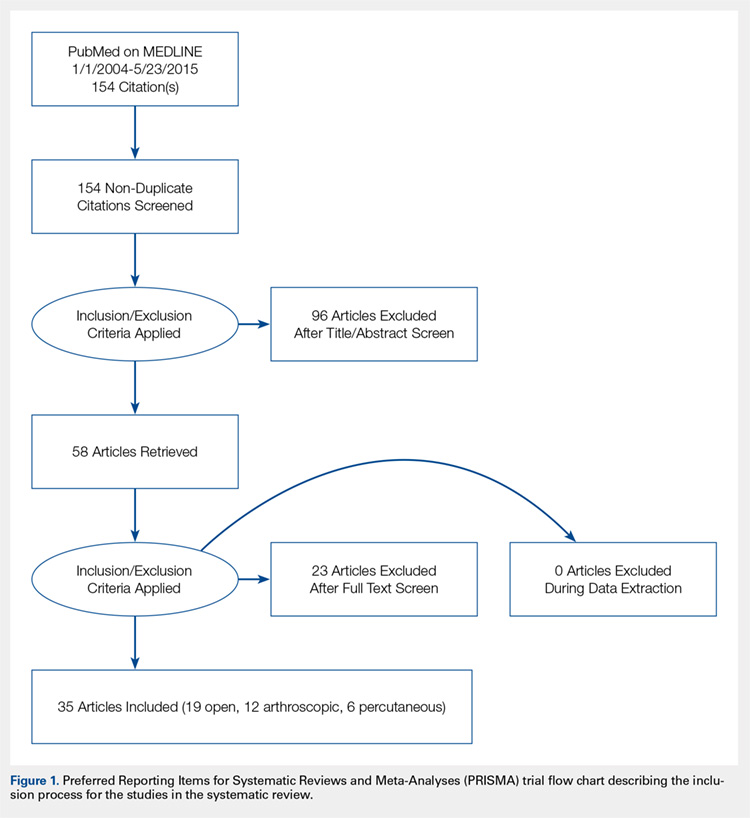
We conducted a systematic review of the literature to update the topic of surgical intervention with lateral epicondylitis since the publication of the most recent review by Lo and Safran2 in 2007, which included all relevant studies published up to 2004. To include all relevant studies published since that time, we searched PubMed (MEDLINE) for all literature published from January 1, 2004 to May 23, 2015 using the following key words: lateral epicondylitis AND (surgery OR operative OR surgical OR open OR arthroscopic OR percutaneous). General search terms were utilized to avoid unintentional exclusion of relevant studies. Two authors reviewed the abstracts of all resultant citations. Table 1 outlines the inclusion and exclusion criteria for the search. References from all included studies were reviewed for applicable articles that were not captured by the initial broad search strategy. A Preferred Reporting Items for Systematic Reviews and Meta-Analyses (PRISMA) trial flow chart shows the study selection algorithm (Figure 1).
Table 1. Inclusion and Exclusion Criteria for the Analyzed Studies
Inclusion Criteria | Exclusion Criteria |
|
|
DATA EXTRACTION AND ANALYSIS
Data were extracted from the included studies by 2 reviewers using data abstraction forms. All study, subject, and surgery parameters were collected. The study and subject demographic parameters analyzed included year of publication, level of evidence, presence of study financial conflict of interest, number of subjects and elbows, gender, age, proportion in whom the dominant extremity was involved, proportion who were laborers, proportion who had a workman’s compensation claim, duration of symptoms prior to surgical intervention, and surgical technique employed (open, arthroscopic, or percutaneous). We recorded the following clinical outcomes: proportion of patients with complete pain relief, proportion who were partially or completely satisfied, proportion who were improved, duration to return to work, grip strength, Disabilities of the Arm, Shoulder, and Hand (DASH) score, visual analog scale (VAS) pain score, and complication rate.
Continue to: Statistical analysis...
STATISTICAL ANALYSIS
Data from all studies were pooled and descriptive statistics were reported as weighted mean ± weighted standard deviation for continuous variables and frequency with percentage for categorical variables. A meta-analysis was performed for all outcome measures that were reported in 3 or more studies within a specific treatment cohort. Data were analyzed using 2-sample and 2-proportion Z-tests. Results were considered statistically significant at P < .05.
RESULTS
LITERATURE RESEARCH
Using the aforementioned search strategy, 154 studies were identified. Following application of the inclusion and exclusion criteria, 35 studies were included in the analysis (Figure 1). One study compared open and percutaneous techniques, and another compared arthroscopic and percutaneous techniques, rendering a total of 19 studies examining open surgical techniques for treatment of lateral epicondylitis,3-21 12 studies examining arthroscopic techniques,14,22-32 and 6 studies reporting percutaneous surgical treatment of lateral epicondylitis29,33-37 (Table 2). There was1 level I study (3%), 6 level III studies (17%), and 28 level IV studies (80%).
Table 2. Study Demographic Data for Open, Arthroscopic, and Percutaneous Lateral Epicondylectomy
| Open | Arthroscopic | Percutaneous | Total |
Number of studies | 19 | 12 | 6 | 35 |
Level of evidence |
|
|
|
|
I | 1 (5%) | 0 | 0 | 1 (3%) |
II | 0 | 0 | 0 | 0 |
III | 3 (16%) | 4 (33%) | 1 (17%) | 6 (17%) |
IV | 15 (79%) | 8 (67%) | 5 (83%) | 28 (80%) |
US: International | 8:12 | 3:9 | 1:5 | 12:24 |
Journals of publication |
|
|
|
|
AJSM | 3 | 1 | 1 | 5 |
JSES | 2 | 2 | 1 | 5 |
Arthroscopy | 2 | 2 | 0 | 3 |
KSSTA | 1 | 2 | 0 | 3 |
CORR | 0 | 2 | 0 | 2 |
JHS | 0 | 1 | 0 | 1 |
JOS | 1 | 1 | 0 | 2 |
AJO | 2 | 0 | 0 | 2 |
Other | 8 | 1 | 4 | 12 |
Abbreviations: AJO, The American Journal of Orthopedics; AJSM, American Journal of Sports Medicine; Arthroscopy, The Journal of Arthroscopy and Related Surgery; CORR, Clinical Orthopaedics & Related Research; JHS, Journal of Hand Surgery; JOS, Journal of Orthopaedic Surgery; JSES, Journal of Shoulder and Elbow Surgery; KSSTA, Knee Surgery, Sports Traumatology, and Arthroscopy.
SUBJECT DEMOGRAPHICS
The 35 included studies comprised 1579 patients and 1640 elbows. Among these, 1055 (64%) elbows underwent open (O), 401 (25%) underwent arthroscopic (A), and 184 (11%) underwent percutaneous (P) treatment. The average age was 45.7 years, 47% of the patients were male, 43% were laborers, 31% had worker’s compensation claims, and the dominant extremity was involved in 62% of patients. The percutaneous cohort was older than the open cohort (P = 46.9, O = 45.4, A = 45.8; P = .036). The duration of symptoms was shorter in the percutaneous cohort than in the other 2 groups and shorter in the arthroscopic cohort than in the open cohort (P = 8 months, O = 23 months, A = 18 months; P < .001). There were no significant differences between groups regarding gender, occupation, worker’s compensation status, or involvement of the dominant extremity (Table 3).
Table 3. Subject Demographics for Open, Arthroscopic, and Percutaneous Groups
| Open | Arthroscopic | Percutaneous |
Subjects (N) | 999 | 397 | 183 |
Elbows (N) | 1055 | 401 | 184 |
Elbows with follow-up (%) | 915 (87%) | 350 (87%) | 181 (98%) |
Males (%) | 427 (47%) | 173 (49%) | 78 (43%) |
Females (%) | 488 (53%) | 177 (51%) | 103 (57%) |
Mean age (years) | 45.4 | 45.8 | 46.9 |
Dominant elbow (%) | 70% | 69% | 53% |
Laborer (%) | 56% | 53% | 48% |
Work comp (%) | 36% | 30% | NR |
Symptoms to operation (months) | 23 | 18 | 8 |
Min. symptoms to operation (months) | 6 | 6 | 3 |
Mean follow-up (months) | 60 | 44 | 11 |
MATA-ANALYSIS CLINICAL OUTCOMES
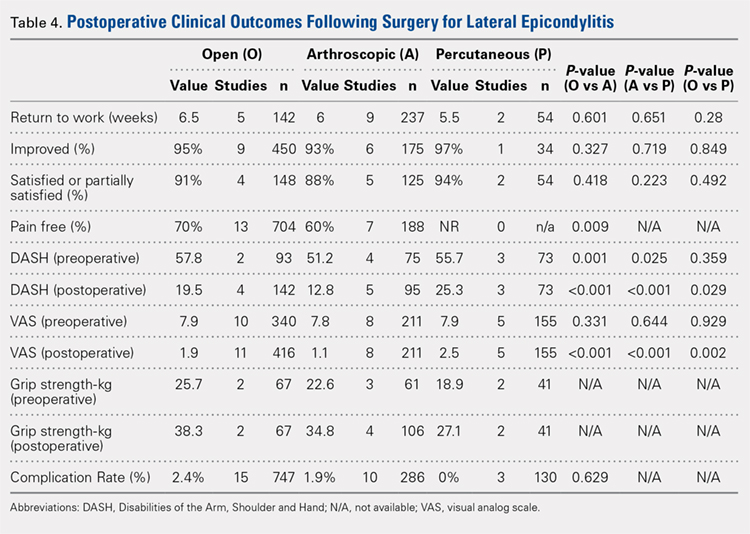
Clinical outcome results were pooled for all studies reporting the same outcome measure for the same technique (open, arthroscopic, or percutaneous). A meta-analysis was performed for all outcome measures that were reported in a minimum of 3 studies utilizing the same surgical technique (Table 4).
PAIN RELIEF
Thirteen open studies,3,5,7,8,11-16,18,19,21 7 arthroscopic studies14,22-24,26,27,31 and 0 percutaneous studies reported the proportion of patients who were pain free at final follow-up. The proportion of patients who were pain free following open débridement was greater than that in the arthroscopic cohort (O = 70%, A = 60%; P = .009) (Table 4).
Continue to: Subjective improvement and satisfaction...
SUBJECTIVE IMPROVEMENT AND SATISFACTION
Nine open studies, 6 arthroscopic studies, and 1 percutaneous study reported the proportion of patients who felt that their condition had been improved as a result of surgery. There was no difference in the proportion of patients who experienced improvement between the open and arthroscopic cohorts. Four open studies,3,11,12 5 arthroscopic studies,22,26,28,29,32 and 2 percutaneous studies29,36 reported the proportion of patients who were satisfied or partially satisfied with the results of the procedure. There was no difference between the open and arthroscopic groups in the proportion of patients who were satisfied or partially satisfied (Table 4).
RETURN TO WORK
The duration to return to work following surgery was reported in 5 open studies,4,5,10,13,14 9 arthroscopic studies,14,23-29,32 and 2 percutaneous studies.29,36 There was no statistically significant difference between the open and arthroscopic groups with regard to duration to return to work (O = 6.5 weeks, A = 6 weeks; P = .601). The percutaneous technique could not be included in the meta-analysis due to the presence of only 2 studies, but the pooled mean duration to return to work in these 2 studies was 5.5 weeks (Table 4).
GRIP STRENGTH
Postoperative grip strength was reported in 2 open studies,10,19 4 arthroscopic studies,28,30,32 and 2 percutaneous studies.35-36 A meta-analysis could not be performed on all the groups due to the presence of only 2 open and 2 percutaneous studies reporting grip strength. The pooled averages were O = 38.3 kg, A = 34.8 kg, and P = 27.1 kg (Table 4).
DASH SCORE
The postoperative DASH score was reported in 4 open studies,4,15,17,19,20 5 arthroscopic studies,28-31 and 3 percutaneous studies.29,33,36 At final follow-up, the mean DASH score was higher in the arthroscopic group than in the open and percutaneous groups (A = 12.8, O = 19.5, P = 25.3; P < .001 for both comparisons), and the mean DASH score was significantly higher in the open group than in the percutaneous group (P = .029). The reporting of DASH scores in the early postoperative period was not sufficiently consistent to allow us to test our hypothesis that there would be early differences in function between groups (Table 4).
VAS PAIN SCORE
Postoperative VAS pain scores were reported in 11 open studies,6,8-10,12,15,19-21 8 arthroscopic studies,24-26,29-32 and 5 percutaneous studies.29,33,35-37 At final follow-up, there was a lower mean VAS score in the arthroscopic group than in the open and percutaneous groups (A = 1.1, O = 1.9, and P = 2.5; P < .001 for both comparisons) and a lower mean VAS score in the open group than in the percutaneous group (P = .002) (Table 4). Reporting of VAS scores in the early postoperative period in the included studies wan not sufficiently consistent to allow us to test our hypothesis that there would be early differences in pain between groups.
COMPLICATIONS
The complication rate was reported in 15 open studies, 10 arthroscopic studies, and 3 percutaneous studies. There was no difference in the complication rate between the open and arthroscopic techniques (O = 2.4%, A = 1.9%; P = .629) (Table 4). Complications noted in the open cohort included superficial wound infection (6), hematoma (5), synovial fistula (2), seroma (2), and posterior interosseous nerve palsy (1). Complications noted in the arthroscopic cohort included superficial infection (3), hematoma (1), and transient paresthesia (1). Of note, there were no complications in the percutaneous group.
Continue to: Discussion...
DISCUSSION
The primary purpose of this review was to determine if definitive evidence suggests that any 1 of open, percutaneous, or arthroscopic surgical treatment is superior to the other 2 for relieving pain, improving functionality, restoring strength, or accelerating return to work. The most striking finding of this study was a significantly higher proportion of patients who were pain free at final follow-up in the open group than in the arthroscopic group (70% vs 60%, P = .009) (Table 4). At final follow-up, there were no significant differences between groups regarding duration to return to work, proportion who were improved, proportion who were satisfied or partially satisfied, and complication rate. Average VAS and DASH scores at final follow-up were lower in the arthroscopic group than in the open and percutaneous groups (Figure 2). However, although the difference between mean DASH scores in the arthroscopic and open groups (6.7 points) was statistically significant, it is likely not clinically significant, as the minimal clinically important difference (MCID) for the DASH score is 10 points, as demonstrated by Sorensen and colleagues.38 Although it has not been specifically defined for lateral epicondylitis, the MCID for VAS pain has been reported in the literature to range from 1.0 to 1.4.39-40 Therefore, as for the DASH score, the difference witnessed between the open and arthroscopic groups (0.8) is likely not clinically significant. Of note, the differences between values for arthroscopic and percutaneous techniques are greater than the MCID.

In light of a recent increase in the prevalence of surgical intervention for lateral epicondylitis, many authors have promoted arthroscopic and percutaneous techniques as alternatives to traditional open débridement with the goal of achieving the same results with decreased morbidity and accelerated return to work. Given the increased proportion of patients who were pain free at final follow-up in the open cohort, it is our contention that open release/débridement of the common extensor/ECRB origin allows the surgeon to fully appreciate the extent of tendinotic tissue that is contributing to the patient’s symptoms and to address the pathology in its entirety. Other authors have also questioned whether the full extent of extra-articular tendinosis can be accurately identified arthroscopically. Cummins41 demonstrated, in a series of 18 patients who underwent arthroscopic ECRB débridement, that 6 patients had residual tendinosis upon open evaluation and 10 had residual tendinosis on histologic assessment. Additionally, in the same series, residual tendinopathy was associated with poorer clinical outcomes.
The improved visualization associated with an open technique comes at minimal expense, as the incision was only 1.5 cm to 5 cm in 13 of 15 papers reporting incision length.3,4,6,8-11,13,15,18-20 This increased exposure may not translate into increased morbidity, as there was no increase in the duration to return to work nor the complication rate. As a result of the extensive instrumentation necessary for arthroscopic techniques, open techniques also appear to be less expensive. Analyses in the literature have suggested increased expenditures associated with arthroscopic treatment ranging from 23%42 to 100%43 greater than those of open treatment.
Although obvious, it should be noted that a percutaneous tenotomy does not permit assessment of the extent of pathologic tendinosis. As a result of an inability to visualize and débride pathologic tissue, percutaneous tenotomy rendered inferior outcomes to open and arthroscopic techniques in terms of both postoperative VAS pain score and DASH score. Nonetheless, it is a relatively rapid and simple technique and resulted in zero complications in 184 elbows. Overall, percutaneous tenotomy appears to be an inferior technique to open and arthroscopic techniques in terms of achieving complete pain relief and optimal functional recovery; however, it may be useful in those who wish to avoid a more invasive intervention.
LIMITATIONS
The most significant limitation of this study was the heterogeneity in the techniques utilized in each group. Among the 19 papers in the open cohort, 11 used techniques aimed at lengthening or release of the extensor origin, 7 performed débridement of tendinotic tissue at the ECRB origin, and 1 compared these approaches. Exposures ranged from 1.5 cm to 8 cm in length, 3 techniques added tendon repair following débridement, and 2 utilized a radiofrequency device.
Among the 12 papers in the arthroscopic cohort, 8 performed arthroscopic (inside-out) débridement of the tendinotic tissue at the ECRB origin, 3 performed arthroscopic release of the ECRB tendon, and 1 performed endoscopic ECRB release in an outside-in fashion. Four techniques added posterior synovial plica excision and 4 added decortication of the lateral epicondyle débridement or release. Some authors advocate for arthroscopic intervention on the grounds that it permits evaluation and correction of other intra-articular pathology. With this in mind, some authors have suggested that a synovial fold (plica) adjacent to the radiocapitellar joint may contribute to lateral elbow pain.27,44 Nevertheless, in the only comparative trial in the literature, Rhyou and Kim30 demonstrated that excision of posterior synovial fold failed to enhance pain relief or function in a retrospective cohort study comparing arthroscopic débridement with and without plica excision.
Continue to: Some authors advocate...
Some authors advocate decorticating the non-articular, lateral epicondyle with a shaver to stimulate bleeding and promote a healing response. However, 1 study in our review compared arthroscopic ECRB release with and without decortication and found that decortication significantly increased pain up to 4 weeks postoperatively, increased duration to return to work, and did not improve the ultimate clinical result.25 Of note, others have used a similar rationale to advocate drilling the lateral epicondyle when utilizing an open technique. However, Dunn and colleagues8 note that they have modified the Nirschl technique to eliminate drilling because they feel it increases postoperative pain and may damage the extensor digitorum communis origin.
Among the 6 papers in the percutaneous tenotomy cohort, 2 performed tenotomy with a hypodermic needle, 2 with a scalpel through a limited incision (0.5 cm-1 cm), 1 using a TX1 tissue removal system (Tenex Health), and 1 with a percutaneous radiofrequency probe. In 3 techniques, ultrasound was used to direct the tenotomy.
The quality of this review is also limited by the studies included for analysis, as with any systematic review. Because 28 of the 35 included studies were classified as evidence level IV, the likelihood of methodological bias is increased. The majority of studies contained ≥1 demonstrable biases, including selection, detection, attrition biases, or a combination. Selection bias is prevalent among predominantly level IV studies, in which the authors have selected their preferred surgical technique. There was heterogeneity in the reporting of preoperative variables and the outcome measures that were utilized. Scoring systems, such as the Nirschl Tennis Elbow Score and the Mayo Elbow Performance Index, would have been valuable in comparing the groups had they been more consistently reported. The heterogeneity in clinical outcome tools and the lack of reported outcome variance or standard deviations prevented a formal meta-analysis of some of these outcome measures. Due to inconsistent reporting, we were also unable to test our hypothesis that there would be less pain and improved function in the arthroscopic and/or percutaneous cohorts in the early postoperative period compared to the open cohort due to the less invasive techniques used. Although the differences in DASH and VAS scores at final follow-up likely did not meet the MCID threshold, these differences may have been greater and more clinically relevant in the early postoperative period.
CONCLUSION
We hypothesized that the arthroscopic and percutaneous groups would experience accelerated return to work and reduced pain in the early postoperative period but no difference in ultimate pain, functional outcome, or subjective satisfaction. There is no difference between open, arthroscopic, and percutaneous surgical treatment for lateral epicondylitis regarding return to work and subjective satisfaction; however, open treatment led to a greater percentage of patients being pain free at final follow-up. While arthroscopic treatment led to better pain and functional scores at final follow-up, the absolute differences were quite small and likely not clinically significant. In light of the available evidence, we recommend open débridement as the best means of minimizing cost and achieving a pain-free outcome in the long term. For future investigators, it would be useful to perform a randomized clinical study directly comparing open, arthroscopic, and percutaneous techniques, including assessment of pain and functional scores in the early postoperative period, and to further evaluate differences in cost among the various techniques.
This paper will be judged for the Resident Writer’s Award.
- Sanders TL Jr, Maradit Kremers H, Bryan AJ, Ransom JE, Smith J, Morrey BF. The epidemiology and health care burden of tennis elbow: a population-based study. Am J Sports Med. 2015;43(5):1066-1071. doi:10.1177/0363546514568087.
- Lo MY, Safran MR. Surgical treatment of lateral epicondylitis: a systematic review. Clin Orthop Relat Res. 2007;463:98-106. doi:10.1097/BLO.0b013e3181483dc4.
- Balk ML, Hagberg WC, Buterbaugh GA, Imbriglia JE. Outcome of surgery for lateral epicondylitis (tennis elbow): effect of worker’s compensation. Am J Orthop. 2005;34(3):122-126; discussion 126.
- Barth J, Mahieu P, Hollevoet N. Extensor tendon and fascia sectioning of extensors at the musculotendinous unit in lateral epicondylitis. Acta Orthop Belg. 2013;79(3):266-270.
- Bigorre N, Raimbeau G, Fouque PA, Cast YS, Rabarin F, Cesari B. Lateral epicondylitis treatment by extensor carpi radialis fasciotomy and radial nerve decompression: is outcome influenced by the occupational disease compensation aspect? Orthop Traumatol Surg Res. 2011;97(2):159-163. doi:10.1016/j.otsr.2010.11.007.
- Cho BK, Kim YM, Kim DS, et al. Mini-open muscle resection procedure under local anesthesia for lateral and medial epicondylitis. Clin Orthop Surg. 2009;1(3):123-127. doi:10.4055/cios.2009.1.3.123.
- Coleman B, Quinlan JF, Matheson JA. Surgical treatment for lateral epicondylitis: a long-term follow-up of results. J Shoulder Elbow Surg. 2010;19(3):363-367. doi:10.1016/j.jse.2009.09.008.
- Dunn JH, Kim JJ, Davis L, Nirschl RP. Ten- to 14-year follow-up of the Nirschl surgical technique for lateral epicondylitis. Am J Sports Med. 2008;36(2):261-266. doi:10.1177/0363546507308932.
- Manon-Matos Y, Oron A, Wolff TW. Combined common extensor and supinator aponeurotomy for the treatment of lateral epicondylitis. Tech Hand Up Extrem Surg. 2013;17(3):179-181. doi:10.1097/BTH.0b013e31829e0eeb.
- Meknas K, Odden-Miland A, Mercer JB, Castillejo M, Johansen O. Radiofrequency microtenotomy: a promising method for treatment of recalcitrant lateral epicondylitis. Am J Sports Med. 2008;36(10):1960-1965. doi:10.1177/0363546508318045.
- Pruzansky ME, Gantsoudes GD, Watters N. Late surgical results of reattachment to bone in repair of chronic lateral epicondylitis. Am J Orthop. 2009;38(6):295-299.
- Rayan F, Rao V Sr, Purushothamdas S, Mukundan C, Shafqat SO. Common extensor origin release in recalcitrant lateral epicondylitis – role justified? J Orthop Surg Res. 2010;5:31. doi:10.1186/1749-799X-5-31.
- Reddy VR, Satheesan KS, Bayliss N. Outcome of Boyd-McLeod procedure for recalcitrant lateral epicondylitis of elbow. Rheumatol Int. 2011;31(8):1081-1084. doi:10.1007/s00296-010-1450-1.
- Rubenthaler F, Wiese M, Senge A, Keller L, Wittenberg RH. Long-term follow-up of open and endoscopic Hohmann procedures for lateral epicondylitis. Arthroscopy. 2005;21(6):684-690. doi:10.1016/j.arthro.2005.03.017.
- Ruch DS, Orr SB, Richard MJ, Leversedge FJ, Mithani SK, Laino DK. A comparison of debridement with and without anconeus muscle flap for treatment of refractory lateral epicondylitis. J Shoulder Elbow Surg. 2015;24(2):236-241. doi:10.1016/j.jse.2014.09.035.
- Siddiqui MA, Koh J, Kua J, Cheung T, Chang P. Functional outcome assessment after open tennis elbow release: what are the predictor parameters? Singapore Med J. 2011;52(2):73-76.
- Solheim E, Hegna J, Øyen J. Extensor tendon release in tennis elbow: results and prognostic factors in 80 elbows. Knee Surg Sports Traumatol Arthrosc. 2011;19(6):1023-1027. doi:10.1007/s00167-011-1477-1.
- Svernlöv B, Adolfsson L. Outcome of release of the lateral extensor muscle origin for epicondylitis. Scand J Plast Reconstr Surg Hand Surg. 2006;40(3):161-165. doi:10.1080/02844310500491492.
- Tasto JP, Cummings J, Medlock V, Hardesty R, Amiel D. Microtenotomy using a radiofrequency probe to treat lateral epicondylitis. Arthroscopy. 2005;21(7):851-860. doi:10.1016/j.arthro.2005.03.019.
- Thornton SJ, Rogers JR, Prickett WD, Dunn WR, Allen AA, Hannafin JA. Treatment of recalcitrant lateral epicondylitis with suture anchor repair. Am J Sports Med. 2005;33(10):1558-1564. doi:10.1177/0363546505276758.
- Wang AW, Erak S. Fractional lengthening of forearm extensors for resistant lateral epicondylitis. ANZ J Surg. 2007;77(11):981-984. doi:10.1111/j.1445-2197.2007.04294.x.
- Baker CL Jr, Baker CL 3rd. Long-term follow-up of arthroscopic treatment of lateral epicondylitis. Am J Sports Med. 2008;36(2):254-260. doi:10.1177/0363546507311599.
- Grewal R, MacDermid JC, Shah P, King GJ. Functional outcome of arthroscopic extensor carpi radialis brevis tendon release in chronic lateral epicondylitis. J Hand Surg Am. 2009;34(5):849-857. doi:10.1016/j.jhsa.2009.02.006.
- Jerosch J, Schunck J. Arthroscopic treatment of lateral epicondylitis: indication, technique and early results. Knee Surg Sports Traumatol Arthrosc. 2006;14(4):379-382. doi:10.1007/s00167-005-0662-5.
- Kim JW, Chun CH, Shim DM, et al. Arthroscopic treatment of lateral epicondylitis: comparison of the outcome of ECRB release with and without decortication. Knee Surg Sports Traumatol Arthrosc. 2011;19(7):1178-1183. doi:10.1007/s00167-011-1507-z.
- Lattermann C, Romeo AA, Anbari A, et al. Arthroscopic debridement of the extensor carpi radialis brevis for recalcitrant lateral epicondylitis. J Shoulder Elbow Surg. 2010;19(5):651-656. doi:10.1016/j.jse.2010.02.008.
- Mullett H, Sprague M, Brown G, Hausman M. Arthroscopic treatment of lateral epicondylitis: clinical and cadaveric studies. Clin Orthop Relat Res. 2005;439:123-128. doi:10.1097/01.blo.0000176143.08886.fe.
- Oki G, Iba K, Sasaki K, Yamashita T, Wada T. Time to functional recovery after arthroscopic surgery for tennis elbow. J Shoulder Elbow Surg. 2014;23(10):1527-1531. doi:10.1016/j.jse.2014.05.010.
- Othman AM. Arthroscopic versus percutaneous release of common extensor origin for treatment of chronic tennis elbow. Arch Orthop Trauma Surg. 2011;131(3):383-388. doi:10.1007/s00402-011-1260-2.
- Rhyou IH, Kim KW. Is posterior synovial plica excision necessary for refractory lateral epicondylitis of the elbow? Clin Orthop Relat Res. 2013;471(1):284-290. doi:10.1007/s11999-012-2585-z.
- Wada T, Moriya T, Iba K, et al. Functional outcomes after arthroscopic treatment of lateral epicondylitis. J Orthop Sci. 2009;14(2):167-174. doi:10.1007/s00776-008-1304-9.
- Yoon JP, Chung SW, Yi JH, et al. Prognostic factors of arthroscopic extensor carpi radialis brevis release for lateral epicondylitis. Arthroscopy. 2015;31(7):1232-1237. doi:10.1016/j.arthro.2015.02.006.
- Barnes DE, Beckley JM, Smith J. Percutaneous ultrasonic tenotomy for chronic elbow tendinosis: a prospective study. J Shoulder Elbow Surg. 2015;24(1):67-73. doi:10.1016/j.jse.2014.07.017.
- Kaleli T, Ozturk C, Temiz A, Tirelioglu O. Surgical treatment of tennis elbow: percutaneous release of the common extensor origin. Acta Orthop Belg. 2004;70(2):131-133.
- Lin MT, Chou LW, Chen HS, Kao MJ. Percutaneous soft tissue release for treating chronic recurrent myofascial pain associated with lateral epicondylitis: 6 case studies. Evid Based Complement Alternat Med. 2012;2012:142941. doi:10.1155/2012/142941.
- Lin CL, Lee JS, Su WR, Kuo LC, Tai TW, Jou IM. Clinical and ultrasonographic results of ultrasonographically guided percutaneous radiofrequency lesioning in the treatment of recalcitrant lateral epicondylitis. Am J Sports Med. 2011;39(11):2429-2435. doi:10.1177/0363546511417096.
- Zhu J, Hu B, Xing C, Li J. Ultrasound-guided, minimally invasive, percutaneous needle puncture treatment for tennis elbow. Adv Ther. 2008;25(10):1031-1036. doi:10.1007/s12325-008-0099-6.
- Sorensen AA, Howard D, Tan WH, Ketchersid J, Calfee RP. Minimal clinically important differences of 3 patient-related outcomes instruments. J Hand Surg Am. 2013;38(4):641-649. doi:10.1016/j.jhsa.2012.12.032.
- Kelly AM. The minimum clinically significant difference in visual analogue scale pain score does not differ with severity of pain. Emerg Med J. 2001;18(3):205-207. doi:10.1136/emj.18.3.205.
- Tashjian RZ, Deloach J, Porucznik CA, Powell AP. Minimal clinically important differences (MCID) and patient acceptable symptomatic state (PASS) for visual analog scales (VAS) measuring pain in patients treated for rotator cuff disease. J Shoulder Elbow Surg. 2009;18(6):927-932. doi:10.1016/j.jse.2009.03.021.
- Cummins CA. Lateral epicondylitis: in vivo assessment of arthroscopic debridement and correlation with patient outcomes. Am J Sports Med. 2006;34(9):1486-1491. doi:10.1177/0363546506288016.
- Stapleton TR, Baker CL. Arthroscopic treatment of lateral epicondylitis: a clinical study. Arthroscopy. 1996;1:365-366.
- Hastings H. Open treatment for lateral tennis elbow good for certain indications. Orthop Today. 2009;2:1-2.
- Duparc F, Putz R, Michot C, Muller JM, Fréger P. The synovial fold of the humeroradial joint: anatomical and histological features, and clinical relevance in lateral epicondylalgia of the elbow. Surg Radiol Anat. 2002;24(5):302-307. doi:10.1007/s00276-002-0055-0.
ABSTRACT
This study was performed to compare outcomes of open, arthroscopic, and percutaneous surgical techniques for lateral epicondylitis. We searched PubMed (MEDLINE) for literature published between January 1, 2004 and May 23, 2015 using these key words: lateral epicondylitis AND (surgery OR operative OR surgical OR open OR arthroscopic OR percutaneous). Meta-analyses were performed for outcomes reported in 3 studies using 2-sample and 2-proportion Z-tests. Thirty-five studies including 1640 elbows (1055 open, 401 arthroscopic, 184 percutaneous) met the inclusion criteria. There were no differences between groups regarding duration to return to work, complication rate, or patient satisfaction. A greater proportion of patients were pain free in the open group than in the arthroscopic group (70% vs 60%). Despite the absence of a difference among techniques regarding return to work and subjective function, we recommend open débridement as the technique most likely to achieve a pain-free outcome.
Continue to: Lateral epicondylitis affects...
Lateral epicondylitis affects 1% to 3% of adults each year. Although common, symptoms of lateral epicondylitis resolve spontaneously within a year of symptom onset in 80% of cases, and only 3% of patients who seek medical treatment ultimately require surgical intervention within 2 years of symptom onset.1 Despite a relatively low percentage of patients who require surgery, Sanders and colleagues1 noted a significant increase in the rate of surgical intervention from 1.1% to 3.2% of cases in the last 15 years. Surgical intervention is generally indicated when pain and functional disability persist after 6 to 12 months of nonsurgical treatment. Traditional surgical treatment involves open release/débridement of the extensor carpi radialis (ECRB) origin; however, with the increasing prevalence of surgical intervention, surgeons have demonstrated a rising interest in less invasive techniques like arthroscopic release/débridement and percutaneous tenotomy as alternatives to traditional open débridement. While favorable results have been reported for all 3 techniques, there is no current consensus regarding the optimal surgical technique. In 2007, Lo and Safran2 reported no difference in the results of open, percutaneous, and arthroscopic techniques regarding any outcome measure in a systematic review of 33 papers. We conducted a repeat systematic review of the current literature to update Lo and Safran’s2 review and to ascertain if more recent literature demonstrates superiority of 1 technique regarding pain relief, subjective questionnaire data, subjective satisfaction, restoration of strength, and return to work. We hypothesized that return to work would be accelerated, pain decreased, and function improved in the early postoperative period in the arthroscopic and percutaneous groups, but there would be no difference in ultimate pain, functional outcome, or subjective satisfaction.
METHODS
SEARCH STRATEGY AND STUDY SELECTION
We conducted a systematic review of the literature to update the topic of surgical intervention with lateral epicondylitis since the publication of the most recent review by Lo and Safran2 in 2007, which included all relevant studies published up to 2004. To include all relevant studies published since that time, we searched PubMed (MEDLINE) for all literature published from January 1, 2004 to May 23, 2015 using the following key words: lateral epicondylitis AND (surgery OR operative OR surgical OR open OR arthroscopic OR percutaneous). General search terms were utilized to avoid unintentional exclusion of relevant studies. Two authors reviewed the abstracts of all resultant citations. Table 1 outlines the inclusion and exclusion criteria for the search. References from all included studies were reviewed for applicable articles that were not captured by the initial broad search strategy. A Preferred Reporting Items for Systematic Reviews and Meta-Analyses (PRISMA) trial flow chart shows the study selection algorithm (Figure 1).
Table 1. Inclusion and Exclusion Criteria for the Analyzed Studies
Inclusion Criteria | Exclusion Criteria |
|
|
DATA EXTRACTION AND ANALYSIS
Data were extracted from the included studies by 2 reviewers using data abstraction forms. All study, subject, and surgery parameters were collected. The study and subject demographic parameters analyzed included year of publication, level of evidence, presence of study financial conflict of interest, number of subjects and elbows, gender, age, proportion in whom the dominant extremity was involved, proportion who were laborers, proportion who had a workman’s compensation claim, duration of symptoms prior to surgical intervention, and surgical technique employed (open, arthroscopic, or percutaneous). We recorded the following clinical outcomes: proportion of patients with complete pain relief, proportion who were partially or completely satisfied, proportion who were improved, duration to return to work, grip strength, Disabilities of the Arm, Shoulder, and Hand (DASH) score, visual analog scale (VAS) pain score, and complication rate.
Continue to: Statistical analysis...
STATISTICAL ANALYSIS
Data from all studies were pooled and descriptive statistics were reported as weighted mean ± weighted standard deviation for continuous variables and frequency with percentage for categorical variables. A meta-analysis was performed for all outcome measures that were reported in 3 or more studies within a specific treatment cohort. Data were analyzed using 2-sample and 2-proportion Z-tests. Results were considered statistically significant at P < .05.
RESULTS
LITERATURE RESEARCH
Using the aforementioned search strategy, 154 studies were identified. Following application of the inclusion and exclusion criteria, 35 studies were included in the analysis (Figure 1). One study compared open and percutaneous techniques, and another compared arthroscopic and percutaneous techniques, rendering a total of 19 studies examining open surgical techniques for treatment of lateral epicondylitis,3-21 12 studies examining arthroscopic techniques,14,22-32 and 6 studies reporting percutaneous surgical treatment of lateral epicondylitis29,33-37 (Table 2). There was1 level I study (3%), 6 level III studies (17%), and 28 level IV studies (80%).
Table 2. Study Demographic Data for Open, Arthroscopic, and Percutaneous Lateral Epicondylectomy
| Open | Arthroscopic | Percutaneous | Total |
Number of studies | 19 | 12 | 6 | 35 |
Level of evidence |
|
|
|
|
I | 1 (5%) | 0 | 0 | 1 (3%) |
II | 0 | 0 | 0 | 0 |
III | 3 (16%) | 4 (33%) | 1 (17%) | 6 (17%) |
IV | 15 (79%) | 8 (67%) | 5 (83%) | 28 (80%) |
US: International | 8:12 | 3:9 | 1:5 | 12:24 |
Journals of publication |
|
|
|
|
AJSM | 3 | 1 | 1 | 5 |
JSES | 2 | 2 | 1 | 5 |
Arthroscopy | 2 | 2 | 0 | 3 |
KSSTA | 1 | 2 | 0 | 3 |
CORR | 0 | 2 | 0 | 2 |
JHS | 0 | 1 | 0 | 1 |
JOS | 1 | 1 | 0 | 2 |
AJO | 2 | 0 | 0 | 2 |
Other | 8 | 1 | 4 | 12 |
Abbreviations: AJO, The American Journal of Orthopedics; AJSM, American Journal of Sports Medicine; Arthroscopy, The Journal of Arthroscopy and Related Surgery; CORR, Clinical Orthopaedics & Related Research; JHS, Journal of Hand Surgery; JOS, Journal of Orthopaedic Surgery; JSES, Journal of Shoulder and Elbow Surgery; KSSTA, Knee Surgery, Sports Traumatology, and Arthroscopy.
SUBJECT DEMOGRAPHICS
The 35 included studies comprised 1579 patients and 1640 elbows. Among these, 1055 (64%) elbows underwent open (O), 401 (25%) underwent arthroscopic (A), and 184 (11%) underwent percutaneous (P) treatment. The average age was 45.7 years, 47% of the patients were male, 43% were laborers, 31% had worker’s compensation claims, and the dominant extremity was involved in 62% of patients. The percutaneous cohort was older than the open cohort (P = 46.9, O = 45.4, A = 45.8; P = .036). The duration of symptoms was shorter in the percutaneous cohort than in the other 2 groups and shorter in the arthroscopic cohort than in the open cohort (P = 8 months, O = 23 months, A = 18 months; P < .001). There were no significant differences between groups regarding gender, occupation, worker’s compensation status, or involvement of the dominant extremity (Table 3).
Table 3. Subject Demographics for Open, Arthroscopic, and Percutaneous Groups
| Open | Arthroscopic | Percutaneous |
Subjects (N) | 999 | 397 | 183 |
Elbows (N) | 1055 | 401 | 184 |
Elbows with follow-up (%) | 915 (87%) | 350 (87%) | 181 (98%) |
Males (%) | 427 (47%) | 173 (49%) | 78 (43%) |
Females (%) | 488 (53%) | 177 (51%) | 103 (57%) |
Mean age (years) | 45.4 | 45.8 | 46.9 |
Dominant elbow (%) | 70% | 69% | 53% |
Laborer (%) | 56% | 53% | 48% |
Work comp (%) | 36% | 30% | NR |
Symptoms to operation (months) | 23 | 18 | 8 |
Min. symptoms to operation (months) | 6 | 6 | 3 |
Mean follow-up (months) | 60 | 44 | 11 |
MATA-ANALYSIS CLINICAL OUTCOMES
Clinical outcome results were pooled for all studies reporting the same outcome measure for the same technique (open, arthroscopic, or percutaneous). A meta-analysis was performed for all outcome measures that were reported in a minimum of 3 studies utilizing the same surgical technique (Table 4).
PAIN RELIEF
Thirteen open studies,3,5,7,8,11-16,18,19,21 7 arthroscopic studies14,22-24,26,27,31 and 0 percutaneous studies reported the proportion of patients who were pain free at final follow-up. The proportion of patients who were pain free following open débridement was greater than that in the arthroscopic cohort (O = 70%, A = 60%; P = .009) (Table 4).
Continue to: Subjective improvement and satisfaction...
SUBJECTIVE IMPROVEMENT AND SATISFACTION
Nine open studies, 6 arthroscopic studies, and 1 percutaneous study reported the proportion of patients who felt that their condition had been improved as a result of surgery. There was no difference in the proportion of patients who experienced improvement between the open and arthroscopic cohorts. Four open studies,3,11,12 5 arthroscopic studies,22,26,28,29,32 and 2 percutaneous studies29,36 reported the proportion of patients who were satisfied or partially satisfied with the results of the procedure. There was no difference between the open and arthroscopic groups in the proportion of patients who were satisfied or partially satisfied (Table 4).
RETURN TO WORK
The duration to return to work following surgery was reported in 5 open studies,4,5,10,13,14 9 arthroscopic studies,14,23-29,32 and 2 percutaneous studies.29,36 There was no statistically significant difference between the open and arthroscopic groups with regard to duration to return to work (O = 6.5 weeks, A = 6 weeks; P = .601). The percutaneous technique could not be included in the meta-analysis due to the presence of only 2 studies, but the pooled mean duration to return to work in these 2 studies was 5.5 weeks (Table 4).
GRIP STRENGTH
Postoperative grip strength was reported in 2 open studies,10,19 4 arthroscopic studies,28,30,32 and 2 percutaneous studies.35-36 A meta-analysis could not be performed on all the groups due to the presence of only 2 open and 2 percutaneous studies reporting grip strength. The pooled averages were O = 38.3 kg, A = 34.8 kg, and P = 27.1 kg (Table 4).
DASH SCORE
The postoperative DASH score was reported in 4 open studies,4,15,17,19,20 5 arthroscopic studies,28-31 and 3 percutaneous studies.29,33,36 At final follow-up, the mean DASH score was higher in the arthroscopic group than in the open and percutaneous groups (A = 12.8, O = 19.5, P = 25.3; P < .001 for both comparisons), and the mean DASH score was significantly higher in the open group than in the percutaneous group (P = .029). The reporting of DASH scores in the early postoperative period was not sufficiently consistent to allow us to test our hypothesis that there would be early differences in function between groups (Table 4).
VAS PAIN SCORE
Postoperative VAS pain scores were reported in 11 open studies,6,8-10,12,15,19-21 8 arthroscopic studies,24-26,29-32 and 5 percutaneous studies.29,33,35-37 At final follow-up, there was a lower mean VAS score in the arthroscopic group than in the open and percutaneous groups (A = 1.1, O = 1.9, and P = 2.5; P < .001 for both comparisons) and a lower mean VAS score in the open group than in the percutaneous group (P = .002) (Table 4). Reporting of VAS scores in the early postoperative period in the included studies wan not sufficiently consistent to allow us to test our hypothesis that there would be early differences in pain between groups.
COMPLICATIONS
The complication rate was reported in 15 open studies, 10 arthroscopic studies, and 3 percutaneous studies. There was no difference in the complication rate between the open and arthroscopic techniques (O = 2.4%, A = 1.9%; P = .629) (Table 4). Complications noted in the open cohort included superficial wound infection (6), hematoma (5), synovial fistula (2), seroma (2), and posterior interosseous nerve palsy (1). Complications noted in the arthroscopic cohort included superficial infection (3), hematoma (1), and transient paresthesia (1). Of note, there were no complications in the percutaneous group.
Continue to: Discussion...
DISCUSSION
The primary purpose of this review was to determine if definitive evidence suggests that any 1 of open, percutaneous, or arthroscopic surgical treatment is superior to the other 2 for relieving pain, improving functionality, restoring strength, or accelerating return to work. The most striking finding of this study was a significantly higher proportion of patients who were pain free at final follow-up in the open group than in the arthroscopic group (70% vs 60%, P = .009) (Table 4). At final follow-up, there were no significant differences between groups regarding duration to return to work, proportion who were improved, proportion who were satisfied or partially satisfied, and complication rate. Average VAS and DASH scores at final follow-up were lower in the arthroscopic group than in the open and percutaneous groups (Figure 2). However, although the difference between mean DASH scores in the arthroscopic and open groups (6.7 points) was statistically significant, it is likely not clinically significant, as the minimal clinically important difference (MCID) for the DASH score is 10 points, as demonstrated by Sorensen and colleagues.38 Although it has not been specifically defined for lateral epicondylitis, the MCID for VAS pain has been reported in the literature to range from 1.0 to 1.4.39-40 Therefore, as for the DASH score, the difference witnessed between the open and arthroscopic groups (0.8) is likely not clinically significant. Of note, the differences between values for arthroscopic and percutaneous techniques are greater than the MCID.
In light of a recent increase in the prevalence of surgical intervention for lateral epicondylitis, many authors have promoted arthroscopic and percutaneous techniques as alternatives to traditional open débridement with the goal of achieving the same results with decreased morbidity and accelerated return to work. Given the increased proportion of patients who were pain free at final follow-up in the open cohort, it is our contention that open release/débridement of the common extensor/ECRB origin allows the surgeon to fully appreciate the extent of tendinotic tissue that is contributing to the patient’s symptoms and to address the pathology in its entirety. Other authors have also questioned whether the full extent of extra-articular tendinosis can be accurately identified arthroscopically. Cummins41 demonstrated, in a series of 18 patients who underwent arthroscopic ECRB débridement, that 6 patients had residual tendinosis upon open evaluation and 10 had residual tendinosis on histologic assessment. Additionally, in the same series, residual tendinopathy was associated with poorer clinical outcomes.
The improved visualization associated with an open technique comes at minimal expense, as the incision was only 1.5 cm to 5 cm in 13 of 15 papers reporting incision length.3,4,6,8-11,13,15,18-20 This increased exposure may not translate into increased morbidity, as there was no increase in the duration to return to work nor the complication rate. As a result of the extensive instrumentation necessary for arthroscopic techniques, open techniques also appear to be less expensive. Analyses in the literature have suggested increased expenditures associated with arthroscopic treatment ranging from 23%42 to 100%43 greater than those of open treatment.
Although obvious, it should be noted that a percutaneous tenotomy does not permit assessment of the extent of pathologic tendinosis. As a result of an inability to visualize and débride pathologic tissue, percutaneous tenotomy rendered inferior outcomes to open and arthroscopic techniques in terms of both postoperative VAS pain score and DASH score. Nonetheless, it is a relatively rapid and simple technique and resulted in zero complications in 184 elbows. Overall, percutaneous tenotomy appears to be an inferior technique to open and arthroscopic techniques in terms of achieving complete pain relief and optimal functional recovery; however, it may be useful in those who wish to avoid a more invasive intervention.
LIMITATIONS
The most significant limitation of this study was the heterogeneity in the techniques utilized in each group. Among the 19 papers in the open cohort, 11 used techniques aimed at lengthening or release of the extensor origin, 7 performed débridement of tendinotic tissue at the ECRB origin, and 1 compared these approaches. Exposures ranged from 1.5 cm to 8 cm in length, 3 techniques added tendon repair following débridement, and 2 utilized a radiofrequency device.
Among the 12 papers in the arthroscopic cohort, 8 performed arthroscopic (inside-out) débridement of the tendinotic tissue at the ECRB origin, 3 performed arthroscopic release of the ECRB tendon, and 1 performed endoscopic ECRB release in an outside-in fashion. Four techniques added posterior synovial plica excision and 4 added decortication of the lateral epicondyle débridement or release. Some authors advocate for arthroscopic intervention on the grounds that it permits evaluation and correction of other intra-articular pathology. With this in mind, some authors have suggested that a synovial fold (plica) adjacent to the radiocapitellar joint may contribute to lateral elbow pain.27,44 Nevertheless, in the only comparative trial in the literature, Rhyou and Kim30 demonstrated that excision of posterior synovial fold failed to enhance pain relief or function in a retrospective cohort study comparing arthroscopic débridement with and without plica excision.
Continue to: Some authors advocate...
Some authors advocate decorticating the non-articular, lateral epicondyle with a shaver to stimulate bleeding and promote a healing response. However, 1 study in our review compared arthroscopic ECRB release with and without decortication and found that decortication significantly increased pain up to 4 weeks postoperatively, increased duration to return to work, and did not improve the ultimate clinical result.25 Of note, others have used a similar rationale to advocate drilling the lateral epicondyle when utilizing an open technique. However, Dunn and colleagues8 note that they have modified the Nirschl technique to eliminate drilling because they feel it increases postoperative pain and may damage the extensor digitorum communis origin.
Among the 6 papers in the percutaneous tenotomy cohort, 2 performed tenotomy with a hypodermic needle, 2 with a scalpel through a limited incision (0.5 cm-1 cm), 1 using a TX1 tissue removal system (Tenex Health), and 1 with a percutaneous radiofrequency probe. In 3 techniques, ultrasound was used to direct the tenotomy.
The quality of this review is also limited by the studies included for analysis, as with any systematic review. Because 28 of the 35 included studies were classified as evidence level IV, the likelihood of methodological bias is increased. The majority of studies contained ≥1 demonstrable biases, including selection, detection, attrition biases, or a combination. Selection bias is prevalent among predominantly level IV studies, in which the authors have selected their preferred surgical technique. There was heterogeneity in the reporting of preoperative variables and the outcome measures that were utilized. Scoring systems, such as the Nirschl Tennis Elbow Score and the Mayo Elbow Performance Index, would have been valuable in comparing the groups had they been more consistently reported. The heterogeneity in clinical outcome tools and the lack of reported outcome variance or standard deviations prevented a formal meta-analysis of some of these outcome measures. Due to inconsistent reporting, we were also unable to test our hypothesis that there would be less pain and improved function in the arthroscopic and/or percutaneous cohorts in the early postoperative period compared to the open cohort due to the less invasive techniques used. Although the differences in DASH and VAS scores at final follow-up likely did not meet the MCID threshold, these differences may have been greater and more clinically relevant in the early postoperative period.
CONCLUSION
We hypothesized that the arthroscopic and percutaneous groups would experience accelerated return to work and reduced pain in the early postoperative period but no difference in ultimate pain, functional outcome, or subjective satisfaction. There is no difference between open, arthroscopic, and percutaneous surgical treatment for lateral epicondylitis regarding return to work and subjective satisfaction; however, open treatment led to a greater percentage of patients being pain free at final follow-up. While arthroscopic treatment led to better pain and functional scores at final follow-up, the absolute differences were quite small and likely not clinically significant. In light of the available evidence, we recommend open débridement as the best means of minimizing cost and achieving a pain-free outcome in the long term. For future investigators, it would be useful to perform a randomized clinical study directly comparing open, arthroscopic, and percutaneous techniques, including assessment of pain and functional scores in the early postoperative period, and to further evaluate differences in cost among the various techniques.
This paper will be judged for the Resident Writer’s Award.
- Sanders TL Jr, Maradit Kremers H, Bryan AJ, Ransom JE, Smith J, Morrey BF. The epidemiology and health care burden of tennis elbow: a population-based study. Am J Sports Med. 2015;43(5):1066-1071. doi:10.1177/0363546514568087.
- Lo MY, Safran MR. Surgical treatment of lateral epicondylitis: a systematic review. Clin Orthop Relat Res. 2007;463:98-106. doi:10.1097/BLO.0b013e3181483dc4.
- Balk ML, Hagberg WC, Buterbaugh GA, Imbriglia JE. Outcome of surgery for lateral epicondylitis (tennis elbow): effect of worker’s compensation. Am J Orthop. 2005;34(3):122-126; discussion 126.
- Barth J, Mahieu P, Hollevoet N. Extensor tendon and fascia sectioning of extensors at the musculotendinous unit in lateral epicondylitis. Acta Orthop Belg. 2013;79(3):266-270.
- Bigorre N, Raimbeau G, Fouque PA, Cast YS, Rabarin F, Cesari B. Lateral epicondylitis treatment by extensor carpi radialis fasciotomy and radial nerve decompression: is outcome influenced by the occupational disease compensation aspect? Orthop Traumatol Surg Res. 2011;97(2):159-163. doi:10.1016/j.otsr.2010.11.007.
- Cho BK, Kim YM, Kim DS, et al. Mini-open muscle resection procedure under local anesthesia for lateral and medial epicondylitis. Clin Orthop Surg. 2009;1(3):123-127. doi:10.4055/cios.2009.1.3.123.
- Coleman B, Quinlan JF, Matheson JA. Surgical treatment for lateral epicondylitis: a long-term follow-up of results. J Shoulder Elbow Surg. 2010;19(3):363-367. doi:10.1016/j.jse.2009.09.008.
- Dunn JH, Kim JJ, Davis L, Nirschl RP. Ten- to 14-year follow-up of the Nirschl surgical technique for lateral epicondylitis. Am J Sports Med. 2008;36(2):261-266. doi:10.1177/0363546507308932.
- Manon-Matos Y, Oron A, Wolff TW. Combined common extensor and supinator aponeurotomy for the treatment of lateral epicondylitis. Tech Hand Up Extrem Surg. 2013;17(3):179-181. doi:10.1097/BTH.0b013e31829e0eeb.
- Meknas K, Odden-Miland A, Mercer JB, Castillejo M, Johansen O. Radiofrequency microtenotomy: a promising method for treatment of recalcitrant lateral epicondylitis. Am J Sports Med. 2008;36(10):1960-1965. doi:10.1177/0363546508318045.
- Pruzansky ME, Gantsoudes GD, Watters N. Late surgical results of reattachment to bone in repair of chronic lateral epicondylitis. Am J Orthop. 2009;38(6):295-299.
- Rayan F, Rao V Sr, Purushothamdas S, Mukundan C, Shafqat SO. Common extensor origin release in recalcitrant lateral epicondylitis – role justified? J Orthop Surg Res. 2010;5:31. doi:10.1186/1749-799X-5-31.
- Reddy VR, Satheesan KS, Bayliss N. Outcome of Boyd-McLeod procedure for recalcitrant lateral epicondylitis of elbow. Rheumatol Int. 2011;31(8):1081-1084. doi:10.1007/s00296-010-1450-1.
- Rubenthaler F, Wiese M, Senge A, Keller L, Wittenberg RH. Long-term follow-up of open and endoscopic Hohmann procedures for lateral epicondylitis. Arthroscopy. 2005;21(6):684-690. doi:10.1016/j.arthro.2005.03.017.
- Ruch DS, Orr SB, Richard MJ, Leversedge FJ, Mithani SK, Laino DK. A comparison of debridement with and without anconeus muscle flap for treatment of refractory lateral epicondylitis. J Shoulder Elbow Surg. 2015;24(2):236-241. doi:10.1016/j.jse.2014.09.035.
- Siddiqui MA, Koh J, Kua J, Cheung T, Chang P. Functional outcome assessment after open tennis elbow release: what are the predictor parameters? Singapore Med J. 2011;52(2):73-76.
- Solheim E, Hegna J, Øyen J. Extensor tendon release in tennis elbow: results and prognostic factors in 80 elbows. Knee Surg Sports Traumatol Arthrosc. 2011;19(6):1023-1027. doi:10.1007/s00167-011-1477-1.
- Svernlöv B, Adolfsson L. Outcome of release of the lateral extensor muscle origin for epicondylitis. Scand J Plast Reconstr Surg Hand Surg. 2006;40(3):161-165. doi:10.1080/02844310500491492.
- Tasto JP, Cummings J, Medlock V, Hardesty R, Amiel D. Microtenotomy using a radiofrequency probe to treat lateral epicondylitis. Arthroscopy. 2005;21(7):851-860. doi:10.1016/j.arthro.2005.03.019.
- Thornton SJ, Rogers JR, Prickett WD, Dunn WR, Allen AA, Hannafin JA. Treatment of recalcitrant lateral epicondylitis with suture anchor repair. Am J Sports Med. 2005;33(10):1558-1564. doi:10.1177/0363546505276758.
- Wang AW, Erak S. Fractional lengthening of forearm extensors for resistant lateral epicondylitis. ANZ J Surg. 2007;77(11):981-984. doi:10.1111/j.1445-2197.2007.04294.x.
- Baker CL Jr, Baker CL 3rd. Long-term follow-up of arthroscopic treatment of lateral epicondylitis. Am J Sports Med. 2008;36(2):254-260. doi:10.1177/0363546507311599.
- Grewal R, MacDermid JC, Shah P, King GJ. Functional outcome of arthroscopic extensor carpi radialis brevis tendon release in chronic lateral epicondylitis. J Hand Surg Am. 2009;34(5):849-857. doi:10.1016/j.jhsa.2009.02.006.
- Jerosch J, Schunck J. Arthroscopic treatment of lateral epicondylitis: indication, technique and early results. Knee Surg Sports Traumatol Arthrosc. 2006;14(4):379-382. doi:10.1007/s00167-005-0662-5.
- Kim JW, Chun CH, Shim DM, et al. Arthroscopic treatment of lateral epicondylitis: comparison of the outcome of ECRB release with and without decortication. Knee Surg Sports Traumatol Arthrosc. 2011;19(7):1178-1183. doi:10.1007/s00167-011-1507-z.
- Lattermann C, Romeo AA, Anbari A, et al. Arthroscopic debridement of the extensor carpi radialis brevis for recalcitrant lateral epicondylitis. J Shoulder Elbow Surg. 2010;19(5):651-656. doi:10.1016/j.jse.2010.02.008.
- Mullett H, Sprague M, Brown G, Hausman M. Arthroscopic treatment of lateral epicondylitis: clinical and cadaveric studies. Clin Orthop Relat Res. 2005;439:123-128. doi:10.1097/01.blo.0000176143.08886.fe.
- Oki G, Iba K, Sasaki K, Yamashita T, Wada T. Time to functional recovery after arthroscopic surgery for tennis elbow. J Shoulder Elbow Surg. 2014;23(10):1527-1531. doi:10.1016/j.jse.2014.05.010.
- Othman AM. Arthroscopic versus percutaneous release of common extensor origin for treatment of chronic tennis elbow. Arch Orthop Trauma Surg. 2011;131(3):383-388. doi:10.1007/s00402-011-1260-2.
- Rhyou IH, Kim KW. Is posterior synovial plica excision necessary for refractory lateral epicondylitis of the elbow? Clin Orthop Relat Res. 2013;471(1):284-290. doi:10.1007/s11999-012-2585-z.
- Wada T, Moriya T, Iba K, et al. Functional outcomes after arthroscopic treatment of lateral epicondylitis. J Orthop Sci. 2009;14(2):167-174. doi:10.1007/s00776-008-1304-9.
- Yoon JP, Chung SW, Yi JH, et al. Prognostic factors of arthroscopic extensor carpi radialis brevis release for lateral epicondylitis. Arthroscopy. 2015;31(7):1232-1237. doi:10.1016/j.arthro.2015.02.006.
- Barnes DE, Beckley JM, Smith J. Percutaneous ultrasonic tenotomy for chronic elbow tendinosis: a prospective study. J Shoulder Elbow Surg. 2015;24(1):67-73. doi:10.1016/j.jse.2014.07.017.
- Kaleli T, Ozturk C, Temiz A, Tirelioglu O. Surgical treatment of tennis elbow: percutaneous release of the common extensor origin. Acta Orthop Belg. 2004;70(2):131-133.
- Lin MT, Chou LW, Chen HS, Kao MJ. Percutaneous soft tissue release for treating chronic recurrent myofascial pain associated with lateral epicondylitis: 6 case studies. Evid Based Complement Alternat Med. 2012;2012:142941. doi:10.1155/2012/142941.
- Lin CL, Lee JS, Su WR, Kuo LC, Tai TW, Jou IM. Clinical and ultrasonographic results of ultrasonographically guided percutaneous radiofrequency lesioning in the treatment of recalcitrant lateral epicondylitis. Am J Sports Med. 2011;39(11):2429-2435. doi:10.1177/0363546511417096.
- Zhu J, Hu B, Xing C, Li J. Ultrasound-guided, minimally invasive, percutaneous needle puncture treatment for tennis elbow. Adv Ther. 2008;25(10):1031-1036. doi:10.1007/s12325-008-0099-6.
- Sorensen AA, Howard D, Tan WH, Ketchersid J, Calfee RP. Minimal clinically important differences of 3 patient-related outcomes instruments. J Hand Surg Am. 2013;38(4):641-649. doi:10.1016/j.jhsa.2012.12.032.
- Kelly AM. The minimum clinically significant difference in visual analogue scale pain score does not differ with severity of pain. Emerg Med J. 2001;18(3):205-207. doi:10.1136/emj.18.3.205.
- Tashjian RZ, Deloach J, Porucznik CA, Powell AP. Minimal clinically important differences (MCID) and patient acceptable symptomatic state (PASS) for visual analog scales (VAS) measuring pain in patients treated for rotator cuff disease. J Shoulder Elbow Surg. 2009;18(6):927-932. doi:10.1016/j.jse.2009.03.021.
- Cummins CA. Lateral epicondylitis: in vivo assessment of arthroscopic debridement and correlation with patient outcomes. Am J Sports Med. 2006;34(9):1486-1491. doi:10.1177/0363546506288016.
- Stapleton TR, Baker CL. Arthroscopic treatment of lateral epicondylitis: a clinical study. Arthroscopy. 1996;1:365-366.
- Hastings H. Open treatment for lateral tennis elbow good for certain indications. Orthop Today. 2009;2:1-2.
- Duparc F, Putz R, Michot C, Muller JM, Fréger P. The synovial fold of the humeroradial joint: anatomical and histological features, and clinical relevance in lateral epicondylalgia of the elbow. Surg Radiol Anat. 2002;24(5):302-307. doi:10.1007/s00276-002-0055-0.
TAKE-HOME POINTS
- While favorable results have been reported for open, arthroscopic, and percutaneous surgical techniques, there is no current consensus regarding the optimal technique for lateral epicondylitis.
- There is no difference between open, arthroscopic, and percutaneous surgical treatment for lateral epicondylitis regarding return to work and subjective satisfaction.
- Open treatment led to a greater percentage of patients being pain free at final follow-up.
- While arthroscopic treatment led to better pain and functional scores at final follow-up, the absolute differences were quite small and likely not clinically significant.
- We recommend open débridement as the best means of minimizing cost and achieving a pain-free outcome in the long-term.
Multi-Modal Pain Control in Ambulatory Hand Surgery
ABSTRACT
We evaluated postoperative pain control and narcotic usage after thumb carpometacarpal (CMC) arthroplasty or open reduction and internal fixation (ORIF) of the distal radius in patients given opiates with or without other non-opiate medication using a specific dosing regimen. A prospective, randomized study of 79 patients undergoing elective CMC arthroplasty or ORIF of the distal radius evaluated postoperative pain in the first 5 postoperative days. Patients were divided into 4 groups: Group 1, oxycodone and acetaminophen PRN; Group 2, oxycodone and acetaminophen with specific dosing; Group 3, oxycodone, acetaminophen, and OxyContin with specific dosing; and Group 4, oxycodone, acetaminophen, and ketorolac with specific dosing. During the first 5 postoperative days, we recorded pain levels according to a numeric pain scale, opioid usage, and complications. Although differences in our data did not reach statistical significance, overall pain scores, opioid usage, and complication rates were less prevalent in the oxycodone, acetaminophen, and ketorolac group. Postoperative pain following ambulatory hand and wrist surgery under regional anesthesia was more effectively controlled with fewer complications using a combination of oxycodone, acetaminophen, and ketorolac with a specific dosing regimen.
Continue to: Regional anesthesia...
Regional anesthesia is a safe and effective modality of perioperative pain control in patients undergoing ambulatory hand procedures.1-10 Often, as the regional block wears off, patients experience a rebound pain effect that can be challenging to manage.
We sought to determine if an organized, multimodal approach in patients undergoing thumb carpometacarpal (CMC) arthroplasty or open reduction and internal fixation (ORIF) of distal radius fractures would provide better postoperative pain control. We hypothesized that this approach would significantly reduce postoperative pain and the need for narcotic pain medication compared with PRN dosing of oxycodone/acetaminophen alone.11-14
MATERIALS AND METHODS
Our study was approved by our Institutional Review Board. Informed consent was obtained from each patient. Patients presenting for elective thumb CMC arthroplasty or ORIF of the distal radius were screened for inclusion in a prospective, randomized study. Inclusion criteria included patients aged 18 to 65 years who could provide informed consent. Patients with chronic pain syndromes, long-term narcotic usage, chronic medical conditions precluding the use of opiates or nonsteroidal anti-inflammatory drugs (NSAIDs), and those who did not have a complete sensory and motor block postoperatively were excluded.
Patients were randomly divided into 1 of 4 study arms. Randomization was performed via sealed envelopes, which were opened in the recovery area when postoperative prescriptions were written. The group distribution was as follows: Group 1, Percocet 5 mg/325 mg alone (control); Group 2, oxycodone 5 mg, acetaminophen 325 mg administered separately; Group 3, oxycodone 5 mg, acetaminophen 325 mg, and oxycodone SR (OxyContin) 10 mg; and Group 4, oxycodone 5 mg, acetaminophen 325 mg, and ketorolac (Toradol) 10 mg (Table 1). Patients in the control group were instructed to take 1 or 2 tablets every 4 to 6 hours as needed for pain. Patients in the 3 experimental groups were given detailed instructions regarding when and how to take their medications. All patients were instructed to take 650 mg of acetaminophen every 6 hours. Patients were provided a sliding scale to assist in dosing their opioid medications according to their numeric pain score (NPS) (Table 2). Group 2 patients were given oxycodone 10 mg in the postanesthesia care unit (PACU) and instructed to take oxycodone 10 mg with acetaminophen 650 mg every 6 hours on a scheduled basis until their block wore off, then dose themselves using the NPS.
Table 1. Patient Groups
Group | Anesthesia | Pain Medications |
1 (standard treatment) | Brachial plexus block | Percocet (oxycodone and acetaminophen) 5-10 mg every 4-6 hours as needed for pain. |
2 | Brachial plexus block | 1. Oxycodone 0-15 mg every 4-6 hours as needed for pain based on pain scale score. 2. Tylenol (Acetaminophen) 650 mg every 6 hours, scheduled. |
3 | Brachial plexus block | 1. Oxycodone 0-15 mg every 4-6 hours as needed for pain based on numeric pain scale. 2. Tylenol (Acetaminophen) 650 mg every 6 hours, scheduled. 3. OxyContin (oxycodone sustained release) 10 mg twice a day, scheduled. |
4 | Brachial plexus block | 1. Oxycodone 0-15 mg every 4-6 hours as needed for pain based on pain scale score. 2. Tylenol (Acetaminophen) 650 mg every 6 hours, scheduled. 3. Toradol (Ketorolac) 10mg every 6 hours, scheduled. |
Table 2. Sliding Scale for Pain Control in the Experimental Groups
Pain Score | Oxycodone Dose |
0-3 | 5 mg (1 tablet) |
4-7 | 10 mg (2 tablets) |
8-10 | 15 mg (3 tablets) |
Group 3 patients were given oxycodone 10 mg in the PACU and instructed to take oxycodone 10 mg with acetaminophen 650 mg every 6 hours and OxyContin 10 mg every 12 hours on a scheduled basis until their block wore off, then dose themselves using NPS. Group 4 patients were given oxycodone 10 mg postoperatively and ketorolac 30 mg intravenously in the PACU and instructed to take oxycodone 10 mg, acetaminophen 650 mg, and ketorolac 10 mg every 6 hours on a scheduled basis until their block wore off, then dose themselves using the NPS.
Patients were provided with a journal and asked to record their medication usage, NPS, and any adverse effects (nausea, vomiting, and uncontrolled pain were specifically mentioned) or complications for 5 days after their procedure. We also attempted to contact patients by telephone on each of the 5 days after their procedure to remind them to complete their logs. They were asked specifically if they were having difficulty with their medications. They were also asked specifically about nausea, vomiting, and over-sedation. If patients requested additional medication to help treat their pain, they were instructed to add an over-the-counter NSAID of their choice based on the label’s suggested dosing.
Continue to: All patients received a supraclavicular...
All patients received a supraclavicular brachial plexus block using 0.75% ropivacaine under the supervision of an attending anesthesiologist experienced in regional anesthesia. Patients underwent thumb CMC arthroplasty utilizing complete resection of the trapezium followed by abductor pollicis longus suspensionplasty under the supervision of 1 of 3 fellowship-trained hand surgeons. ORIF of the distal radius was completed utilizing a volar approach and distal radius locking plate under the supervision of 1 of 3 fellowship-trained hand surgeons.
Primary outcome measures were the total number of oxycodone tablets taken daily and the average daily NPS. Secondary outcomes measured included adverse effects as noted above and the need for a trip to the emergency department for unrelieved pain.
A power analysis was completed prior to the beginning of the study. To detect a difference of at least 1 on the NPS, we determined that 18 patients per group would provide 80% power. This was based on literature utilizing the visual analog scale (VAS), a 100-mm line on which patients can place a mark to describe the intensity of their pain. The standard deviation on the VAS is approximately 15 mm. To account for potential dropout, we elected to recruit 20 patients per group. Non-paired t tests were used to compare groups.
RESULTS
One hundred and eighteen patients enrolled in the study. Of those, 79 patients completed and returned their summary logs (by group: 18 control, 20 oxycodone, 17 OxyContin, and 24 ketorolac). The remaining patients were excluded from the final analysis because they did not return their summary logs. Only 1 patient was excluded from the analysis because he did not have adequate regional anesthesia. Demographic data were analyzed and showed no significant differences between groups at the P < .05 level of significance. Surgical procedures were completed by 3 fellowship-trained hand surgeons. Distal radius fractures were performed using a volar approach. CMC arthroplasty was performed using a procedure that was standardized across surgeons. There were no between-surgeon differences in outcomes.
Average daily NPS (Figure 1) and the total number of oxycodone tablets taken (Figure 2) over the 5-day study period were recorded. Patients in the ketorolac group used fewer oxycodone tablets (19.3) than patients in the other 3 groups (24.4), P =.11, but the difference was not statistically significant. The maximum number of oxycodone tablets used was 71 in the Percocet group, 57 in the oxycodone and ketorolac groups, and 73 in the OxyContin group. The average daily NPS was lower in the ketorolac group during the period of medication use. This value only reached statistical significance on postoperative day 0 when the ketorolac group was compared with the OxyContin group (P = .01) and on postoperative day 1 when the ketorolac group was compared with the oxycodone group (P = .04). Complications (Figure 3) were greater in the non-ketorolac groups. One patient each in the oxycodone and OxyContin groups required a trip to the emergency department for pain control after their block wore off. Nausea and vomiting were present in each of the 4 groups but to a much greater degree in the Percocet and OxyContin groups; however, these results did not reach statistical significance (P = .129). Eleven of the 18 patients in the Percocet group required an additional NSAID (naproxen) and still did not achieve pain control similar to the other groups. This may explain why the average daily pain score in the Percocet group was lower than that in the oxycodone group, in which only 4 of the 20 patients supplemented with naproxen. Patients did, however, require many more oxycodone tablets to achieve pain control in the Percocet group. Over-sedation was reported in 3 patients in the oxycodone group and in 1 patient in the OxyContin group. No patients were found to have bleeding, renal, or other systemic complications.
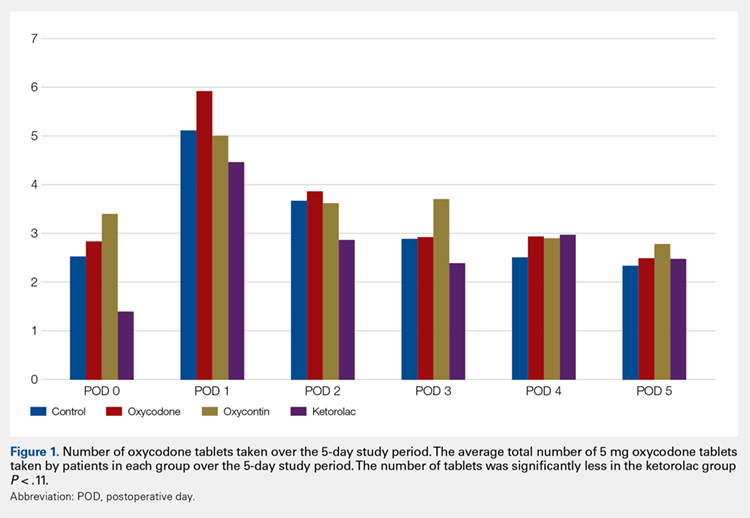
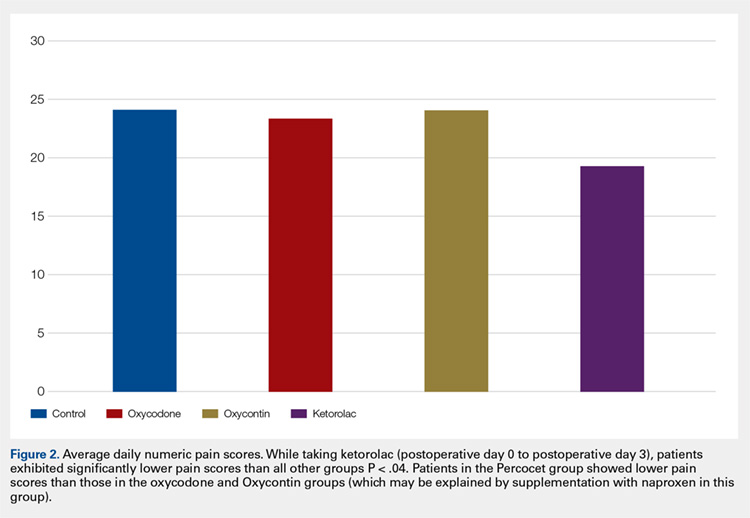
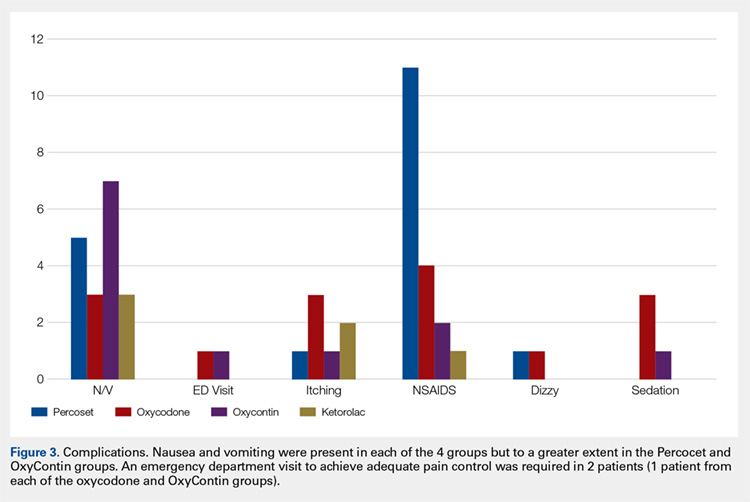
Continue to: Discussion...
DISCUSSION
In this prospective, randomized study, we sought to determine whether a more organized approach to treating postoperative pain using a specific dosing regimen or opiates in conjunction with non-opiate medications would lead to improved pain control and a decreased need for opiates. We found that adding ketorolac to the postoperative pain regimen and outlining a more detailed set of instructions could lower narcotic usage in the first 4 postoperative days. In addition, adding ketorolac decreased other complications commonly seen with narcotic usage and was shown to be safe in our patient population.
Ketorolac has been shown to decrease narcotic pain medication usage in several surgical settings and across different surgical specialties. It is hypothesized that ketorolac potentiates the effects of narcotics.11 Ketorolac given alone has a potent analgesic effect by acting as a strong non-selective cyclooxygenase inhibitor. The major drawback to ketorolac use has been its well-known side-effect profile. Ketorolac is renally excreted, and as such, should not be used in patients with renal insufficiency. In addition, ketorolac has been shown to cause increased gastrointestinal bleeding when used for >5 days.15 Caution should be taken when combining ketorolac with thromboprophylactic medications, especially in older patients.
Many surgeons use NSAIDs along with narcotics as part of a postoperative pain regimen. While this is often adequate for some procedures, when the surgery involves manipulating fractures, internal fixation, or resection arthroplasty, the variation in individual patient pain may call for a more robust protocol. Additionally, as surgeons expand to more complex procedures performed in the outpatient setting, evaluating different combinations of analgesics taken in a more structured manner may provide for improved pain control.
A major component of patient satisfaction is postoperative pain control.3-8,12,16,17 Regional anesthesia is an important tool that allows patients to undergo a surgical procedure with a greatly reduced amount of opioid pain medications. In addition, regional anesthesia can provide significant pain control after the patient has left the ambulatory surgery center, but this relief is short-lived because the medication is designed to lose effectiveness over time. As the effects of regional anesthesia wear off, patients can experience “rebound pain” with severe levels of pain that, on occasion, cannot be controlled with oral analgesics alone. The addition of ketorolac provided improved pain control when compared with the other regimens during this transition period when the regional anesthesia was becoming ineffective. In addition, because patients taking ketorolac used less narcotic medication, they experienced less nausea, vomiting, and over-sedation.
Additionally, patients were instructed to record their medication usage and pain scores on a prospective basis, with the hope of eliminating recall bias. A potential weakness is the inability to show significance for pain relief and reduced narcotic usage with the addition of ketorolac, although there was a trend toward significance. Many of the patients who enrolled in the trial did not return their medication logs. While these patients had to be excluded from data analysis, we continued enrollment until we obtained an adequate number of patients in each group. In addition, in the OxyContin group (Group 3), we could only recruit 17 participants, instead of the 18 needed based on our power study. Although this has a potential to alter the significance of our results, we do not feel this had a substantial impact on our results.
Many patients in the non-ketorolac groups supplemented their medication regimens with NSAIDs, which may have falsely lowered pain scores and narcotic usage. While this confounds our study results, we do not believe that it invalidates the conclusion that ketorolac can be an effective adjunct pain medication for use in patients undergoing ambulatory hand surgery.
The study examined postoperative pain control for only 2 procedures, thumb basal joint arthroplasty and distal radius fracture fixation, both commonly performed in the outpatient setting under regional anesthesia and both typically requiring narcotic pain medication. Perhaps the utilization of these medication regimens with different surgical procedures would have differing results.
We conclude that ketorolac potentially provides patients with improved pain control over the use of narcotic pain medications alone in the setting of ambulatory hand surgery.
This paper will be judged for the Resident Writer’s Award.
- Boezaart AP, Davis G, Le-Wendling L. Recovery after orthopedic surgery: techniques to increase duration of pain control. Curr Opin Anaesthesiol. 2012;25(6):665-672. doi:10.1097/ACO.0b013e328359ab5a.
- Buvanendran A, Kroin JS. Useful adjuvants for postoperative pain management. Best Pract Res Clin Anaesthesiol. 2007;21(1):31-49. doi:10.1016/j.bpa.2006.12.003.
- Coluzzi F, Bragazzi L, Di Bussolo E, Pizza G, Mattia C. Determinants of patient satisfaction in postoperative pain management following hand ambulatory day-surgery. Minerva Med. 2011;102(3):177-186.
- Elvir-Lazo OL, White PF. Postoperative pain management after ambulatory surgery: role of multimodal analgesia. Anesthesiol Clin. 2010;28(2):217-224. doi: 10.1016/j.anclin.2010.02.011.
- Kopp SL, Horlocker TT. Regional anaesthesia in day-stay and short-stay surgery. Anaesthesia. 2010;65(Suppl 1):84-96. doi:10.1111/j.1365-2044.2009.06204.x.
- Rawal N. Postoperative pain treatment for ambulatory surgery. Best Pract Res Clin Anaesthesiol. 2007;21(1):129-148. doi:10.1016/j.bpa.2006.11.005.
- Schug SA, Chong C. Pain management after ambulatory surgery. Curr Opin Anaesthesiol. 2009;22(6):738-743. doi:10.1097/ACO.0b013e32833020f4.
- Sripada R, Bowens C Jr. Regional anesthesia procedures for shoulder and upper arm surgery upper extremity update--2005 to present. Int Anesthesiol Clin. 2012;50(1):26-46. doi:10.1097/AIA.0b013e31821a0284.
- Trompeter A, Camilleri G, Narang K, Hauf W, Venn R. Analgesia requirements after interscalene block for shoulder arthroscopy: the 5 days following surgery. Arch Orthop Trauma Surg. 2010;130(3):417-421. doi:10.1007/s00402-009-0959-9.
- Dufeu N, Marchand-Maillet F, Atchabahian A, et al. Efficacy and safety of ultrasound-guided distal blocks for analgesia without motor blockade after ambulatory hand surgery. J Hand Surg Am. 2014;39(4):737-743. doi:10.1016/j.jhsa.2014.01.011.
- Gutta R, Koehn CR, James LE. Does ketorolac have a preemptive analgesic effect? A randomized, double-blind, control study. J Oral Maxillofac Surg. 2013;71(12):2029-2034. doi:10.1016/j.joms.2013.06.220.
- Nossaman VE, Ramadhyani U, Kadowitz PJ, Nossaman BD. Advances in perioperative pain management: use of medications with dual analgesic mechanisms, tramadol & tapentadol. Anesthesiol Clin. 2010;28(4):647-666. doi:10.1016/j.anclin.2010.08.009.
- Warren-Stomberg M, Brattwall M, Jakobsson JG. Non-opioid analgesics for pain management following ambulatory surgery: a review. Minerva Anestesiol. 2013;79(9):1077-1087.
- Wickerts L, Warrén Stomberg M, Brattwall M, Jakobsson JJ. Coxibs: is there a benefit when compared to traditional non-selective NSAIDs in postoperative pain management? Minerva Anestesiol. 2011;77(11):1084-1098.
- Strom BL, Berlin JA, Kinman JL, et al. Parenteral ketorolac and risk of gastrointestinal and operative site bleeding. A postmarketing surveillance study. JAMA. 1996;275(5):376-382. doi:10.1001/jama.275.5.376.
- Hegarty M, Calder A, Davies K, et al. Does take-home analgesia improve postoperative pain after elective day case surgery? A comparison of hospital vs parent-supplied analgesia. Paediatr Anaesth. 2013;23(5):385-389. doi:10.1111/pan.12077.
- Weber SC, Jain R, Parise C. Pain scores in the management of postoperative pain in shoulder surgery. Arthroscopy. 2007;23(1):65-72. doi:10.1016/j.arthro.2006.11.002.
ABSTRACT
We evaluated postoperative pain control and narcotic usage after thumb carpometacarpal (CMC) arthroplasty or open reduction and internal fixation (ORIF) of the distal radius in patients given opiates with or without other non-opiate medication using a specific dosing regimen. A prospective, randomized study of 79 patients undergoing elective CMC arthroplasty or ORIF of the distal radius evaluated postoperative pain in the first 5 postoperative days. Patients were divided into 4 groups: Group 1, oxycodone and acetaminophen PRN; Group 2, oxycodone and acetaminophen with specific dosing; Group 3, oxycodone, acetaminophen, and OxyContin with specific dosing; and Group 4, oxycodone, acetaminophen, and ketorolac with specific dosing. During the first 5 postoperative days, we recorded pain levels according to a numeric pain scale, opioid usage, and complications. Although differences in our data did not reach statistical significance, overall pain scores, opioid usage, and complication rates were less prevalent in the oxycodone, acetaminophen, and ketorolac group. Postoperative pain following ambulatory hand and wrist surgery under regional anesthesia was more effectively controlled with fewer complications using a combination of oxycodone, acetaminophen, and ketorolac with a specific dosing regimen.
Continue to: Regional anesthesia...
Regional anesthesia is a safe and effective modality of perioperative pain control in patients undergoing ambulatory hand procedures.1-10 Often, as the regional block wears off, patients experience a rebound pain effect that can be challenging to manage.
We sought to determine if an organized, multimodal approach in patients undergoing thumb carpometacarpal (CMC) arthroplasty or open reduction and internal fixation (ORIF) of distal radius fractures would provide better postoperative pain control. We hypothesized that this approach would significantly reduce postoperative pain and the need for narcotic pain medication compared with PRN dosing of oxycodone/acetaminophen alone.11-14
MATERIALS AND METHODS
Our study was approved by our Institutional Review Board. Informed consent was obtained from each patient. Patients presenting for elective thumb CMC arthroplasty or ORIF of the distal radius were screened for inclusion in a prospective, randomized study. Inclusion criteria included patients aged 18 to 65 years who could provide informed consent. Patients with chronic pain syndromes, long-term narcotic usage, chronic medical conditions precluding the use of opiates or nonsteroidal anti-inflammatory drugs (NSAIDs), and those who did not have a complete sensory and motor block postoperatively were excluded.
Patients were randomly divided into 1 of 4 study arms. Randomization was performed via sealed envelopes, which were opened in the recovery area when postoperative prescriptions were written. The group distribution was as follows: Group 1, Percocet 5 mg/325 mg alone (control); Group 2, oxycodone 5 mg, acetaminophen 325 mg administered separately; Group 3, oxycodone 5 mg, acetaminophen 325 mg, and oxycodone SR (OxyContin) 10 mg; and Group 4, oxycodone 5 mg, acetaminophen 325 mg, and ketorolac (Toradol) 10 mg (Table 1). Patients in the control group were instructed to take 1 or 2 tablets every 4 to 6 hours as needed for pain. Patients in the 3 experimental groups were given detailed instructions regarding when and how to take their medications. All patients were instructed to take 650 mg of acetaminophen every 6 hours. Patients were provided a sliding scale to assist in dosing their opioid medications according to their numeric pain score (NPS) (Table 2). Group 2 patients were given oxycodone 10 mg in the postanesthesia care unit (PACU) and instructed to take oxycodone 10 mg with acetaminophen 650 mg every 6 hours on a scheduled basis until their block wore off, then dose themselves using the NPS.
Table 1. Patient Groups
Group | Anesthesia | Pain Medications |
1 (standard treatment) | Brachial plexus block | Percocet (oxycodone and acetaminophen) 5-10 mg every 4-6 hours as needed for pain. |
2 | Brachial plexus block | 1. Oxycodone 0-15 mg every 4-6 hours as needed for pain based on pain scale score. 2. Tylenol (Acetaminophen) 650 mg every 6 hours, scheduled. |
3 | Brachial plexus block | 1. Oxycodone 0-15 mg every 4-6 hours as needed for pain based on numeric pain scale. 2. Tylenol (Acetaminophen) 650 mg every 6 hours, scheduled. 3. OxyContin (oxycodone sustained release) 10 mg twice a day, scheduled. |
4 | Brachial plexus block | 1. Oxycodone 0-15 mg every 4-6 hours as needed for pain based on pain scale score. 2. Tylenol (Acetaminophen) 650 mg every 6 hours, scheduled. 3. Toradol (Ketorolac) 10mg every 6 hours, scheduled. |
Table 2. Sliding Scale for Pain Control in the Experimental Groups
Pain Score | Oxycodone Dose |
0-3 | 5 mg (1 tablet) |
4-7 | 10 mg (2 tablets) |
8-10 | 15 mg (3 tablets) |
Group 3 patients were given oxycodone 10 mg in the PACU and instructed to take oxycodone 10 mg with acetaminophen 650 mg every 6 hours and OxyContin 10 mg every 12 hours on a scheduled basis until their block wore off, then dose themselves using NPS. Group 4 patients were given oxycodone 10 mg postoperatively and ketorolac 30 mg intravenously in the PACU and instructed to take oxycodone 10 mg, acetaminophen 650 mg, and ketorolac 10 mg every 6 hours on a scheduled basis until their block wore off, then dose themselves using the NPS.
Patients were provided with a journal and asked to record their medication usage, NPS, and any adverse effects (nausea, vomiting, and uncontrolled pain were specifically mentioned) or complications for 5 days after their procedure. We also attempted to contact patients by telephone on each of the 5 days after their procedure to remind them to complete their logs. They were asked specifically if they were having difficulty with their medications. They were also asked specifically about nausea, vomiting, and over-sedation. If patients requested additional medication to help treat their pain, they were instructed to add an over-the-counter NSAID of their choice based on the label’s suggested dosing.
Continue to: All patients received a supraclavicular...
All patients received a supraclavicular brachial plexus block using 0.75% ropivacaine under the supervision of an attending anesthesiologist experienced in regional anesthesia. Patients underwent thumb CMC arthroplasty utilizing complete resection of the trapezium followed by abductor pollicis longus suspensionplasty under the supervision of 1 of 3 fellowship-trained hand surgeons. ORIF of the distal radius was completed utilizing a volar approach and distal radius locking plate under the supervision of 1 of 3 fellowship-trained hand surgeons.
Primary outcome measures were the total number of oxycodone tablets taken daily and the average daily NPS. Secondary outcomes measured included adverse effects as noted above and the need for a trip to the emergency department for unrelieved pain.
A power analysis was completed prior to the beginning of the study. To detect a difference of at least 1 on the NPS, we determined that 18 patients per group would provide 80% power. This was based on literature utilizing the visual analog scale (VAS), a 100-mm line on which patients can place a mark to describe the intensity of their pain. The standard deviation on the VAS is approximately 15 mm. To account for potential dropout, we elected to recruit 20 patients per group. Non-paired t tests were used to compare groups.
RESULTS
One hundred and eighteen patients enrolled in the study. Of those, 79 patients completed and returned their summary logs (by group: 18 control, 20 oxycodone, 17 OxyContin, and 24 ketorolac). The remaining patients were excluded from the final analysis because they did not return their summary logs. Only 1 patient was excluded from the analysis because he did not have adequate regional anesthesia. Demographic data were analyzed and showed no significant differences between groups at the P < .05 level of significance. Surgical procedures were completed by 3 fellowship-trained hand surgeons. Distal radius fractures were performed using a volar approach. CMC arthroplasty was performed using a procedure that was standardized across surgeons. There were no between-surgeon differences in outcomes.
Average daily NPS (Figure 1) and the total number of oxycodone tablets taken (Figure 2) over the 5-day study period were recorded. Patients in the ketorolac group used fewer oxycodone tablets (19.3) than patients in the other 3 groups (24.4), P =.11, but the difference was not statistically significant. The maximum number of oxycodone tablets used was 71 in the Percocet group, 57 in the oxycodone and ketorolac groups, and 73 in the OxyContin group. The average daily NPS was lower in the ketorolac group during the period of medication use. This value only reached statistical significance on postoperative day 0 when the ketorolac group was compared with the OxyContin group (P = .01) and on postoperative day 1 when the ketorolac group was compared with the oxycodone group (P = .04). Complications (Figure 3) were greater in the non-ketorolac groups. One patient each in the oxycodone and OxyContin groups required a trip to the emergency department for pain control after their block wore off. Nausea and vomiting were present in each of the 4 groups but to a much greater degree in the Percocet and OxyContin groups; however, these results did not reach statistical significance (P = .129). Eleven of the 18 patients in the Percocet group required an additional NSAID (naproxen) and still did not achieve pain control similar to the other groups. This may explain why the average daily pain score in the Percocet group was lower than that in the oxycodone group, in which only 4 of the 20 patients supplemented with naproxen. Patients did, however, require many more oxycodone tablets to achieve pain control in the Percocet group. Over-sedation was reported in 3 patients in the oxycodone group and in 1 patient in the OxyContin group. No patients were found to have bleeding, renal, or other systemic complications.
Continue to: Discussion...
DISCUSSION
In this prospective, randomized study, we sought to determine whether a more organized approach to treating postoperative pain using a specific dosing regimen or opiates in conjunction with non-opiate medications would lead to improved pain control and a decreased need for opiates. We found that adding ketorolac to the postoperative pain regimen and outlining a more detailed set of instructions could lower narcotic usage in the first 4 postoperative days. In addition, adding ketorolac decreased other complications commonly seen with narcotic usage and was shown to be safe in our patient population.
Ketorolac has been shown to decrease narcotic pain medication usage in several surgical settings and across different surgical specialties. It is hypothesized that ketorolac potentiates the effects of narcotics.11 Ketorolac given alone has a potent analgesic effect by acting as a strong non-selective cyclooxygenase inhibitor. The major drawback to ketorolac use has been its well-known side-effect profile. Ketorolac is renally excreted, and as such, should not be used in patients with renal insufficiency. In addition, ketorolac has been shown to cause increased gastrointestinal bleeding when used for >5 days.15 Caution should be taken when combining ketorolac with thromboprophylactic medications, especially in older patients.
Many surgeons use NSAIDs along with narcotics as part of a postoperative pain regimen. While this is often adequate for some procedures, when the surgery involves manipulating fractures, internal fixation, or resection arthroplasty, the variation in individual patient pain may call for a more robust protocol. Additionally, as surgeons expand to more complex procedures performed in the outpatient setting, evaluating different combinations of analgesics taken in a more structured manner may provide for improved pain control.
A major component of patient satisfaction is postoperative pain control.3-8,12,16,17 Regional anesthesia is an important tool that allows patients to undergo a surgical procedure with a greatly reduced amount of opioid pain medications. In addition, regional anesthesia can provide significant pain control after the patient has left the ambulatory surgery center, but this relief is short-lived because the medication is designed to lose effectiveness over time. As the effects of regional anesthesia wear off, patients can experience “rebound pain” with severe levels of pain that, on occasion, cannot be controlled with oral analgesics alone. The addition of ketorolac provided improved pain control when compared with the other regimens during this transition period when the regional anesthesia was becoming ineffective. In addition, because patients taking ketorolac used less narcotic medication, they experienced less nausea, vomiting, and over-sedation.
Additionally, patients were instructed to record their medication usage and pain scores on a prospective basis, with the hope of eliminating recall bias. A potential weakness is the inability to show significance for pain relief and reduced narcotic usage with the addition of ketorolac, although there was a trend toward significance. Many of the patients who enrolled in the trial did not return their medication logs. While these patients had to be excluded from data analysis, we continued enrollment until we obtained an adequate number of patients in each group. In addition, in the OxyContin group (Group 3), we could only recruit 17 participants, instead of the 18 needed based on our power study. Although this has a potential to alter the significance of our results, we do not feel this had a substantial impact on our results.
Many patients in the non-ketorolac groups supplemented their medication regimens with NSAIDs, which may have falsely lowered pain scores and narcotic usage. While this confounds our study results, we do not believe that it invalidates the conclusion that ketorolac can be an effective adjunct pain medication for use in patients undergoing ambulatory hand surgery.
The study examined postoperative pain control for only 2 procedures, thumb basal joint arthroplasty and distal radius fracture fixation, both commonly performed in the outpatient setting under regional anesthesia and both typically requiring narcotic pain medication. Perhaps the utilization of these medication regimens with different surgical procedures would have differing results.
We conclude that ketorolac potentially provides patients with improved pain control over the use of narcotic pain medications alone in the setting of ambulatory hand surgery.
This paper will be judged for the Resident Writer’s Award.
- Boezaart AP, Davis G, Le-Wendling L. Recovery after orthopedic surgery: techniques to increase duration of pain control. Curr Opin Anaesthesiol. 2012;25(6):665-672. doi:10.1097/ACO.0b013e328359ab5a.
- Buvanendran A, Kroin JS. Useful adjuvants for postoperative pain management. Best Pract Res Clin Anaesthesiol. 2007;21(1):31-49. doi:10.1016/j.bpa.2006.12.003.
- Coluzzi F, Bragazzi L, Di Bussolo E, Pizza G, Mattia C. Determinants of patient satisfaction in postoperative pain management following hand ambulatory day-surgery. Minerva Med. 2011;102(3):177-186.
- Elvir-Lazo OL, White PF. Postoperative pain management after ambulatory surgery: role of multimodal analgesia. Anesthesiol Clin. 2010;28(2):217-224. doi: 10.1016/j.anclin.2010.02.011.
- Kopp SL, Horlocker TT. Regional anaesthesia in day-stay and short-stay surgery. Anaesthesia. 2010;65(Suppl 1):84-96. doi:10.1111/j.1365-2044.2009.06204.x.
- Rawal N. Postoperative pain treatment for ambulatory surgery. Best Pract Res Clin Anaesthesiol. 2007;21(1):129-148. doi:10.1016/j.bpa.2006.11.005.
- Schug SA, Chong C. Pain management after ambulatory surgery. Curr Opin Anaesthesiol. 2009;22(6):738-743. doi:10.1097/ACO.0b013e32833020f4.
- Sripada R, Bowens C Jr. Regional anesthesia procedures for shoulder and upper arm surgery upper extremity update--2005 to present. Int Anesthesiol Clin. 2012;50(1):26-46. doi:10.1097/AIA.0b013e31821a0284.
- Trompeter A, Camilleri G, Narang K, Hauf W, Venn R. Analgesia requirements after interscalene block for shoulder arthroscopy: the 5 days following surgery. Arch Orthop Trauma Surg. 2010;130(3):417-421. doi:10.1007/s00402-009-0959-9.
- Dufeu N, Marchand-Maillet F, Atchabahian A, et al. Efficacy and safety of ultrasound-guided distal blocks for analgesia without motor blockade after ambulatory hand surgery. J Hand Surg Am. 2014;39(4):737-743. doi:10.1016/j.jhsa.2014.01.011.
- Gutta R, Koehn CR, James LE. Does ketorolac have a preemptive analgesic effect? A randomized, double-blind, control study. J Oral Maxillofac Surg. 2013;71(12):2029-2034. doi:10.1016/j.joms.2013.06.220.
- Nossaman VE, Ramadhyani U, Kadowitz PJ, Nossaman BD. Advances in perioperative pain management: use of medications with dual analgesic mechanisms, tramadol & tapentadol. Anesthesiol Clin. 2010;28(4):647-666. doi:10.1016/j.anclin.2010.08.009.
- Warren-Stomberg M, Brattwall M, Jakobsson JG. Non-opioid analgesics for pain management following ambulatory surgery: a review. Minerva Anestesiol. 2013;79(9):1077-1087.
- Wickerts L, Warrén Stomberg M, Brattwall M, Jakobsson JJ. Coxibs: is there a benefit when compared to traditional non-selective NSAIDs in postoperative pain management? Minerva Anestesiol. 2011;77(11):1084-1098.
- Strom BL, Berlin JA, Kinman JL, et al. Parenteral ketorolac and risk of gastrointestinal and operative site bleeding. A postmarketing surveillance study. JAMA. 1996;275(5):376-382. doi:10.1001/jama.275.5.376.
- Hegarty M, Calder A, Davies K, et al. Does take-home analgesia improve postoperative pain after elective day case surgery? A comparison of hospital vs parent-supplied analgesia. Paediatr Anaesth. 2013;23(5):385-389. doi:10.1111/pan.12077.
- Weber SC, Jain R, Parise C. Pain scores in the management of postoperative pain in shoulder surgery. Arthroscopy. 2007;23(1):65-72. doi:10.1016/j.arthro.2006.11.002.
TAKE-HOME POINTS
- While regional anesthesia is safe and effective for patients who undergo ambulatory hand surgery, patients often experience rebound pain as it wears off.
- We tested a multimodal approach for patients who underwent thumb CMC arthroplasty or ORIF of distal radius fracture.
- Patients were provided with a journal and asked to record medication usage, a NPS, and adverse effects. Seventy-nine patients completed the study.
- We found that adding ketorolac to the postoperative pain protocol, with detailed instructions, lowered narcotic usage in the first 4 postoperative days.
- Ketorolac potentially provides patients with improved pain control over the use of narcotic pain medication alone in an ambulatory hand surgery setting.
Impact of Sagittal Rotation on Axial Glenoid Width Measurement in the Setting of Glenoid Bone Loss
ABSTRACT
Standard 2-dimensional (2-D) computed tomography (CT) scans of the shoulder are often aligned to the plane of the body as opposed to the plane of the scapula, which may challenge the ability to accurately measure glenoid width and glenoid bone loss (GBL). The purpose of this study is to determine the effect of sagittal rotation of the glenoid on axial anterior-posterior (AP) glenoid width measurements in the setting of anterior GBL.
Forty-three CT scans from consecutive patients with anterior GBL (minimum 10%) were reformatted utilizing open-source DICOM software (OsiriX MD). Patients were grouped according to extent of GBL: I, 10% to 14.9% (N = 12); II, 15% to 19.9% (N = 16); and III, >20% (N = 15). The uncorrected (UNCORR) and corrected (CORR) images were assessed in the axial plane at 5 standardized cuts and measured for AP glenoid width.
For groups I and III, UNCORR scans underestimated axial AP width (and thus overestimated anterior GBL) in cuts 1 and 2, while in cuts 3 to 5, the axial AP width was overestimated (GBL was underestimated). In Group II, axial AP width was underestimated (GBL was overestimated), while in cuts 2 to 5, the axial AP width was overestimated (GBL was underestimated). Overall, AP glenoid width was consistently underestimated in cut 1, the most caudal cut; while AP glenoid width was consistently overestimated in cuts 3 to 5, the more cephalad cuts.
UNCORR 2-D CT scans inaccurately estimated glenoid width and the degree of anterior GBL. This data suggests that corrected 2D CT scans or a 3-dimensional (3-D) reconstruction can help in accurately defining the anterior GBL in patients with shoulder instability.
The treatment of glenohumeral instability has substantially evolved over the past several decades. The understanding of glenoid bone loss (GBL), in particular, has advanced to such a level that we utilize the quantification of GBL for surgical decision-making. Unrecognized and/or untreated GBL is associated with recurrent instability, pain, and disability. Controversy exists, however, regarding the precise amount of anterior GBL that is significant enough to warrant surgical treatment. While historically, 25%1,2 of anterior GBL was thought to be the critical number required to warrant osseous augmentation, studies that are more recent have highlighted the need to perform osseous glenoid reconstruction with lesser degrees of GBL, particularly in the contact athlete.3-9 As small differences in the amount of GBL can change surgical decision-making from an all-soft tissue repair to an osseous reconstruction, it is paramount that we have accurate, valid, and reproducible methods for calculating GBL.
Continue to: Historically, plain radiographs...
Historically, plain radiographs have been the mainstay for evaluating the glenohumeral joint, including Grashey and axillary views, allowing clinicians to evaluate the congruency of the glenohumeral joint and to assess bone loss on both the glenoid and humeral head.1,10 While large, acute fractures of the glenoid are fairly evident on radiographs, including the Grashey view,11 shoulders with chronic and/or attritional anterior GBL are more difficult to evaluate, and often do not provide the information necessary to guide surgical decision-making.
Computed tomography (CT) of the shoulder has become the most commonly utilized imaging modality in the evaluation of patients with shoulder instability associated with GBL. Standard 2-dimensional (2-D) CT scans of the shoulder are often aligned to the plane of the body as opposed to the plane of the scapula/glenoid, as standard protocols often fail to account for the anterior sagittal rotation of the scapula/glenoid, similar to the disadvantage of standard radiographs. While 3-dimensional (3-D) CT reconstructions eliminate the effect of gantry angles, and thus allow for an en face view of the glenoid, 3-D reconstructions are not always available, and cannot always be measured.12-14 Thus, improved methodology for utilizing standard 2D scans is warranted, as the ability to correctly align the axial CT scan to the axis of the glenoid may allow for more accurate GBL measurements, which will ultimately impact surgical decision-making. Recently, Gross and colleagues15 reported the effect of sagittal rotation of the glenoid on axial measurements of anterior-posterior (AP) glenoid width and glenoid version in normal glenoids, without bone loss, and found that the mean angle of correction needed to align the sagittal plane was 20.1° ± 1.2° of rotation. To the authors’ knowledge, this same methodology has not been applied to patients with clinically meaningful anterior GBL. Given that the average glenoid width in human shoulders is 24.4 mm ± 2.9 mm,16 1 mm of glenoid bone loss (GBL) corresponds to approximately 4% of the glenoid width, and thus even subtle differences in the interpretation of GBL may have substantial clinical implications. Therefore, the purpose of this study is to determine the effect of sagittal rotation of the glenoid on axial AP glenoid width measurements in the setting of clinically significant anterior GBL.
METHODS
This study was approved by Massachusetts General Hospital Institutional Review Board. A retrospective review of consecutive patients with a diagnosis of anterior shoulder instability between 2009 and 2013 was conducted. Inclusion criteria comprised patients with a minimum of 10% anterior GBL, an available CT scan of the affected shoulder, and no history of prior ipsilateral surgeries. Exclusion criteria comprised evidence of degenerative changes to the glenoid and/or humeral head, as well as prior ipsilateral shoulder surgery. Sixty consecutive patients were originally identified as having anterior shoulder instability, and 17 were excluded based on the inclusion/exclusion criteria, leaving 43 patients (43 shoulders) available for inclusion. Shoulder CT scans from all 43 patients were reformatted utilizing open-source DICOM software (OsiriX MD, version 2.5.1 65-bit) multi-planar reconstruction (MPR).
CT PROTOCOL
All patients underwent a standard glenohumeral CT scan using a Siemens Sensation 64 Scanner (Siemens), a 64-detector scanner. Scans were acquired with 0.6 mm of collimation, 140 kV, and 300 mA-seconds. Slice thickness was set to 2 mm. All patient information was de-identified for analysis.
The uncorrected (UNCORR) scans were defined as the default orientation on the scanner. In the UNCORR scans, the axial, coronal, and sagittal views were oriented relative to the scanner gantry table, as opposed to the anatomy of the glenoid. The corrected (CORR) CT scans were aligned in all 3 planes relative to the glenoid face, and thus the cuts were perpendicular to the long axis of the glenoid.15 This resulted in sagittal cuts perpendicular to the 12-o’clock to 6-o’clock axis in the sagittal plane (Figure 1). 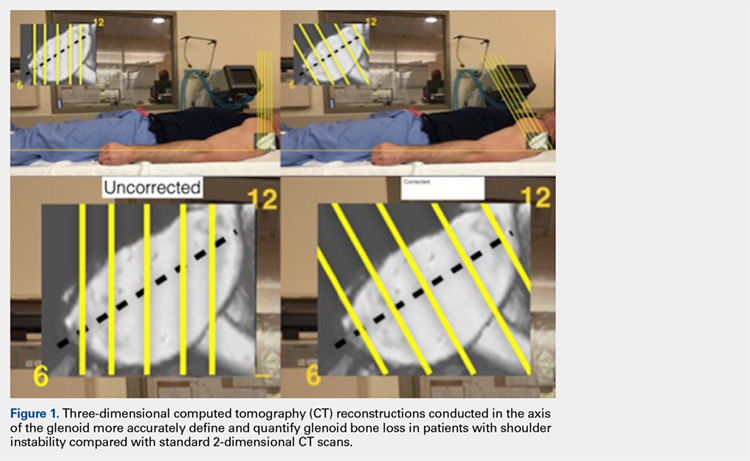
Continue to: In a de-identified fashion...
IMAGE ANALYSIS AND REFORMATTING
In a de-identified fashion, all CT scans were imported and analyzed using open-source Digital Imaging and Communications in Medicine (DICOM) software (OsiriX MD, version 2.5.1 64-bit). By following a previously developed method, CT scans were reformatted using OsiriX MPR. The OsiriX software has an MPR function that allows simultaneous manipulation of 2-D CT scans in 3 orthogonal planes: axial, sagittal, and coronal. In the MPR mode, the alternation of 1 plane directly affects the orientation of the remaining 2 planes. Thus, by using an MPR, one can analyze the impact that a default CT scan performed relative to the gantry of the table, UNCORR, has on the axial images.
First, the en face view was obtained via a 2-step process: alignment of the axial plane to account for the scapular angle, followed by alignment of the coronal plane to adjust for the glenoid inclination.15 These 2 adjustments provided a true en face sagittal glenoid view. The final adjustment step was a sagittal en face rotation of the glenoid such that the superior and inferior glenoid tubercles were placed on the 12-o’clock to 6-o’clock axis (CORR scan). Previous studies have identified a central longitudinal axis that was used in this method to align the supraglenoid tubercle with the 12-o’clock to 6-o’clock axis on the glenoid face.15,17,18 The standard error of mean was 1.21°. This new CORR view resulted in axial cuts through the glenoid that were oriented perpendicular to the 12-o’clock to 6-o’clock axis. The UNCORR and CORR images were assessed in the axial plane at 5 standardized cuts and measured for AP glenoid width by 2 independent observers in a blinded, randomized fashion. When the measured AP width of the UNCORR scan was less than that measured on the CORR scan, the AP width of the glenoid was considered underestimated, and the degree of GBL was considered overestimated (Figure 2). 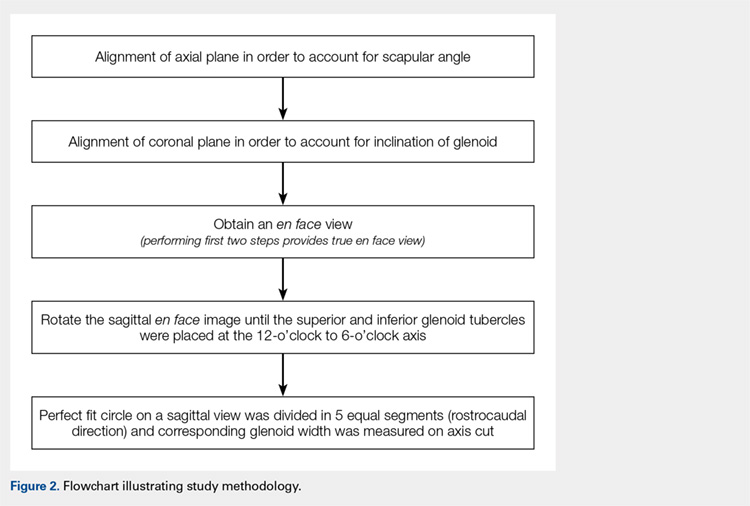
SCAPULAR ANGLE
Scapular angle measurements were performed on the axial view as the angle between a line through the long axis of the body of the scapula, and a line parallel to the CT gantry table.15,19 Subsequently, the axial plane was aligned to the glenoid surface.
CORONAL INCLINATION
Coronal inclination measurements were performed on the sagittal view as the angle between a line tangential to the face of the glenoid and a line perpendicular to the CT gantry table. Positive values represented superior inclination, while negative values represented inferior glenoid inclination.15
SAGITTAL ROTATION
Sagittal rotation measurements were performed using the built-in angle measurement tool in OsiriX in the sagittal plane since the degree of rotation required aligning the long axis of the glenoid to the 12-o’clock to 6-o’clock axis. The amount of rotation was defined as the rotation angle.15
Continue to: Similarly, as described by Gross...
GLENOID WIDTH
Similarly, as described by Gross and colleagues,15 the sagittal en face view was divided via 5 cuts, throughout a superimposed best-fit circle that closely represents the glenoid.9,15,20 For both the UNCORR and CORR, glenoid width (AP distance) was measured on the axial image at the widest point from AP cortex across the glenoid face.
PATIENT GROUPS
Utilizing the en face 3-D CT reconstruction view of the glenoid as the gold standard, patients were placed into 1 of 3 groups according to the degree of anterior GBL measured via the surface method.9,20 The groups were as follows:
I. 10% to 14.9% (N = 12)
II. 15% to 19.9% (N = 16)
III. >20% (N = 15)
STATISTICAL METHODS
Paired t-tests were used to compare all measurements between CORR and UNCORR scans for each of the 5 cuts. A P-value of .05 was used as the threshold for statistical significance in 2-tailed comparisons. Mean and standard errors are presented with standard deviations throughout the study. For interobserver reliability, the measurements between the observers, the intraclass correlation coefficient was calculated. All statistics were performed with SPSS (Version 22).
RESULTS
The study cohort was comprised of 19 left shoulders (44%) and 24 right shoulders (56%), including 36 male patients (84%) and 7 female patients (16%). The average age was 27.8 years (range, 21-40 years). The variability in measured difference, with respect to AP width, was 1.05 mm. The UNCORR CT scans required a mean correction for coronal inclination of 7.0° ± 5.8° (range, -8°-6°). The UNCORR CT scans required a mean correction for scapular angle of 30.2° ± 8.0° (range, 15°-49°). The mean angle of sagittal rotation required to align the glenoid face with the 12-o’clock to 6-o’clock axis was 24.2° ± 5.1 ° (range, 13°-30°). These results are summarized in Table 1.
Table 1. Mean Correction Values Required to Correct the Uncorrected Images to the Corrected Images | |||
Anatomic alignment | Mean (degrees) | Range (degrees) | SD (degrees) |
Scapular angle | 30.2 | 15-49 | 8.0 |
Coronal Inclination | 7.0 | -8-6 | 5.8 |
Sagittal rotation | 24.2 | 13-30 | 5.1 |
For all measurements, the intraclass correlation coefficient for independent observers for all cuts within the 3 groups was r >.900 in all cases.
On an optimized CT scan, over 5 standardized cuts across a best-fit circle of the inferior glenoid, there was a statistically significant absolute mean difference of 12.6% in axial AP glenoid width (2.86 mm ± 2.00 mm, P =.016) when compared with the UNCORR scan. This corresponds to a 3% to 21% error in measurement of the AP width of the glenoid.
Continue to: For the entire cohort...
For the entire cohort of 43 patients, the UNCORR scans underestimated the axial AP width (and thus overestimated GBL) in cut 1 (P =.003), and overestimated the axial AP width (and thus underestimated GBL) in cuts 3 to 5 (P < .001 for all) compared with that of the CORR scans. There was no significant difference between the UNCORR and CORR scans in cut 2 (P = .331).
For groups I (10%-14.9% GBL) and III (>20% GBL), the UNCORR scans underestimated the axial AP width (and thus overestimated anterior GBL) in cuts 1 and 2, while in cuts 3 to 5, the axial AP width was overestimated (GBL was underestimated) (Tables 2, 3). In Group II (15%-19.9% GBL), the axial AP width was underestimated (GBL was overestimated), while in cuts 2 to 5, the axial AP width was overestimated (GBL was underestimated). Overall, AP glenoid width was consistently underestimated in cut 1, the most caudal cut, while AP glenoid width was consistently overestimated in cuts 3 to 5, the more cephalad cuts.
Table 2. Absolute Mean Difference in Axial AP Width (mm) Between Corrected and Uncorrected Images (% difference) | |||||
Cut 1 (Caudal) | Cut 2 | Cut 3 (Center) | Cut 4 | Cut 5 (Cephalad) | |
Group I: 10%-14.9% GBL | 2.4 mm (15.3%) | 1.8 mm (9.0%) | 1.8 mm (7.7%) | 3.0 mm (11.7%) | 4.0 mm (16.8%) |
Group II: 15%-19.9% GBL | 1.8 mm (13.1%) | 1.7 mm (7.9%) | 2.8 mm (10.6%) | 4.1 mm (14.4%) | 4.8 mm (16.9%) |
Group III: >20% | 2.8 mm (16.1%) | 1.9 mm (8.0%) | 2.3 mm (10.3) | 4.4 mm (16.6%) | 5.2 mm (17.0%) |
Abbreviations: AP, anterior-posterior; GBL, glenoid bone loss.
Table 3. Mean AP Glenoid Width Based on CORR and UNCORR Images for the Entire Cohort of 43 Patients | |||||
Axial cut | Mean AP width (mm) | Mean AP width (mm) | Absolute mean AP width difference (mm) | Absolute mean AP width difference (%) | P value |
(Caudal) 1 | 16.6208 | 18.4958 | -1.875 | 14.7768 | .0029565 |
2 | 20.6558 | 21.3166 | -0.661 | 3.6137 | .3310965 |
3 | 24.2583 | 22.3125 | 1.946 | 7.8042 | <.0001 |
4 | 26.1291 | 21.8916 | 4.238 | 15.8449 | <.0001 |
(Rostral) 5 | 26.0875 | 20.4875 | 5.6 | 20.9717 | <.0001 |
Abbreviations: AP, anterior-posterior; CORR, corrected; UNCORR, uncorrected.
DISCUSSION
The principle findings of this study demonstrate that UNCORR conventional 2-D CT scans inaccurately estimate glenoid width as well as inaccurately quantify the degree of anterior GBL. Underestimations of GBL may lead to insufficient treatment of clinically meaningful GBL, thereby increasing the risk of instability recurrence; whereas overestimations of GBL may lead to unnecessary treatment, subjecting patients to increased surgical morbidity. Therefore, the authors recommend correcting the orientation of the scapula in cases wherein clinical decisions are entirely based on 2-D CT, or using alternative methods for quantifying GBL, specifically in the form of 3-D reconstructions.
The use of axial imaging, with CT scans and/or magnetic resonance imaging, is growing in popularity for evaluation of both glenoid anatomy and GBL. Nevertheless, despite our improved ability to critically evaluate the glenoid using these advanced imaging modalities, the images themselves require scrutiny by clinicians to determine if the images accurately depict the true anatomy of the glenoid. As demonstrated by Gross and colleagues,15 conventional 2D CT scan protocols are not optimized to the anatomy of the glenohumeral joint, even in patients without GBL. Due to the alignment of the image relative to the plane of the scapula as opposed to the plane of the glenoid, UNCORR scans result in significantly different measurements of glenoid version (2.0° ± 0.1°) and AP glenoid width (1.2 mm ± 0.42 mm) compared with corrected scans, requiring an average 20.1° ± 1.2° of correction to align the sagittal plane. In the present study involving the patients with GBL, we also found that conventional, UNCORR 2-D CT scan protocols inaccurately estimate glenoid width and the degree of anterior GBL. In particular, AP glenoid width was consistently underestimated in the more caudal cuts, while AP glenoid width was consistently overestimated in the more cephalad cuts. Thus, anterior GBL was overestimated (AP glenoid width was underestimated) in the more caudal cuts, whereas anterior GBL was underestimated in the more cranial cuts (AP glenoid width was overestimated). Given that approximately 1 mm of glenoid bone corresponds to approximately 4% of glenoid width,16 even subtle differences in the interpretation of GBL may lead to gross overestimation/underestimation of bone loss, with significant clinical implications.
In the anterior instability patient population, clinical decision-making is often based on the degree of GBL as determined by advanced imaging modalities. In addition to other patient-specific factors, including age, gender, activity level, type of sport, and number of prior dislocations and/or prior surgeries, the quantity of GBL will often determine which surgical procedure needs to be performed. Typically, patients with >20% to 25% anterior GBL are indicated for a glenoid reconstruction procedure, most commonly via the Latarjet procedure (coracoid transfer).21-27 The Latarjet procedure remains an excellent technique for appropriately indicated patients, with historically good clinical outcomes and low recurrence rates. Complications associated with the Latarjet procedure, however, are not uncommon, including devastating neuropraxia of the axillary and musculocutaneous nerves, and occasionally permanent neurologic deficits.28 Thus, it is critical to avoid overtreating patients with recurrent instability and GBL. As demonstrated by this study, depending on the cranial-to-caudal location on the glenoid, current 2-D CT techniques may underestimate AP glenoid width, resulting in an overestimation of GBL, potentially leading to the decision to proceed with glenoid bone reconstruction when such a procedure is not required. On the contrary, overestimation of AP glenoid width, which occurs in the more cephalad cuts of the glenoid, is perhaps more worrisome, as the resulting underestimation of GBL may lead to inadequate treatment of patients with recurrent instability. Certainly, one of the main risk factors for failed soft tissue shoulder stabilization is a failure to address GBL. If clinical decisions are made based on UNCORR 2-D CT scans, which are often inaccurate with respect to AP glenoid width by an average 2.86 mm ± 2.00 mm (equivalent to 12.6% ± 6.9% GBL) as determined in this study, patients who truly require osseous glenoid reconstructions may be indicated for only soft tissue stabilization, based on the underestimation of GBL.
Continue to: The current gold standard...
The current gold standard for GBL measurement is a perfect-fit circle performed on a 3-D CT scan.22 To that end, it would have been useful to measure the glenoids from this study on 3-D CT scans and compare the data with both UNCORR and CORR measurements. This would have provided a better understanding to what extent the CORR measurements on 2-D scans are relatable with the gold standard. As 3-D CT scans provide a better en face view of the glenoid, more accurate GBL measurements, and ease of 3-D manipulation, they have become more widely used across the country.29,30 Nevertheless, in situations where 3-D imaging is more challenging to obtain because of technology or cost limitations, having a strategy for ensuring proper orientation of 2-D scans would have a substantial impact on clinical decision-making. If such corrections are not made, the inaccuracy of current 2-D scanning protocols justifies the cost 3-D reconstruction protocols. The difference in GBL measurements are critical in cases of increasingly large degrees of GBL, as in these instances, the inferior glenoid becomes more of an inverted-pear shape as opposed to a perfect circle, and differences in CORR and UNCORR images are likely to be more profound.
LIMITATIONS
This study has limitations, such as the relatively small sample size and the selection bias by the reviewers with potential differences in interobserver reliability. Further, minor modifications during the reformatting process may be found with each attempt to manipulate the images and may result in minor, insignificant differences in AP width measurements. Performing 1 or more additional CT scans on the same cohort of patients would have been helpful; however, due to the increased risk of radiation exposure, this was not performed. Performing CT scans on cadaveric specimens with GBL and applying the study methodology would also have been helpful to provide independent verification of our clinical findings; however, specimens were not available for this study. Another limitation of this study is that we did not compare our findings with the findings of glenoid width, and bone loss, as determined using the circle method, which is commonly utilized when 3-D reconstructions are available. In this study, the purpose was to utilize only the 2-D reformatted images, with the assumption that 3-D reconstructions are not always available, and cannot always be measured. To minimize selection bias, the investigators measured the correction effects within groups of patients with similar degrees of GBL (10%-14.9%, 15%-19.9%, and >20%). In addition, not all the selected patients showed degenerative glenoid changes or irregular glenoid shape indicating previous bone augmentation.
CONCLUSIONS
UNCORR 2D CT scans inaccurately estimate glenoid width and the degree of anterior GBL. The clinical implications of these findings are profound and suggest corrected 2D CT scans or 3D reconstruction allow measurements to be taken in the axis of the glenoid to accurately define the anatomy and quantity of anterior GBL in patients with shoulder instability.
1. Cerciello S, Edwards TB, Walch G. Chronic anterior glenohumeral instability in soccer players: results for a series of 28 shoulders treated with the Latarjet procedure. J Orthop Traumatol. 2012;13(4):197-202. doi:10.1007/s10195-012-0201-3.
2. Itoi E, Lee SB, Berglund LJ, Berge LL, An KN. The effect of a glenoid defect on anteroinferior stability of the shoulder after Bankart repair: a cadaveric study. J Bone Joint Surg Am. 2000;82(1):35-46.
3. Bhatia S, Ghodadra NS, Romeo AA, et al. The importance of the recognition and treatment of glenoid bone loss in an athletic population. Sports Health. 2011;3(5):435-440. doi:10.1177/1941738111414126.
4. Lo IK, Parten PM, Burkhart SS. The inverted pear glenoid: an indicator of significant glenoid bone loss. Arthroscopy. 2004;20(2):169-174. doi:10.1016/j.arthro.2003.11.036.
5. Mologne TS, Provencher MT, Menzel KA, Vachon TA, Dewing CB. Arthroscopic stabilization in patients with an inverted pear glenoid: results in patients with bone loss of the anterior glenoid. Am J Sports Med. 2007;35(8):1276-1283. doi:10.1177/0363546507300262.
6. Piasecki DP, Verma NN, Romeo AA, Levine WN, Bach BR Jr, Provencher MT. Glenoid bone deficiency in recurrent anterior shoulder instability: diagnosis and management. J Am Acad Orthop Surg. 2009;17(8):482-493.
7. Provencher MT, Bhatia S, Ghodadra NS, et al. Recurrent shoulder instability: current concepts for evaluation and management of glenoid bone loss. J Bone Joint Surg Am. 2010;92(suppl 2):133-151. doi:10.2106/JBJS.J.00906.
8. Rowe CR, Zarins B, Ciullo JV. Recurrent anterior dislocation of the shoulder after surgical repair. Apparent causes of failure and treatment. J Bone Joint Surg Am. 1984;66(2):159-168.
9. Sugaya H, Moriishi J, Dohi M, Kon Y, Tsuchiya A. Glenoid rim morphology in recurrent anterior glenohumeral instability. J Bone Joint Surg Am. 2003;85-A(5):878-884.
10. Edwards TB, Boulahia A, Walch G. Radiographic analysis of bone defects in chronic anterior shoulder instability. Arthroscopy. 2003;19(7):732-739.
11. Jankauskas L, Rudiger HA, Pfirrmann CW, Jost B, Gerber C. Loss of the sclerotic line of the glenoid on anteroposterior radiographs of the shoulder: a diagnostic sign for an osseous defect of the anterior glenoid rim. J Shoulder Elbow Surg. 2010;19(1):151-156. doi:10.1016/j.jse.2009.04.013.
12. Altan E, Ozbaydar MU, Tonbul M, Yalcin L. Comparison of two different measurement methods to determine glenoid bone defects: area or width? J Shoulder Elbow Surg. 2014;23(8):1215-1222. doi:10.1016/j.jse.2013.11.029.
13. Bishop JY, Jones GL, Rerko MA, Donaldson C, Group MS. 3-D CT is the most reliable imaging modality when quantifying glenoid bone loss. Clin Orthop Relat Res. 2013;471(4):1251-1256. doi:10.1007/s11999-012-2607-x.
14. Chuang TY, Adams CR, Burkhart SS. Use of preoperative three-dimensional computed tomography to quantify glenoid bone loss in shoulder instability. Arthroscopy. 2008; 24(4):376-382. doi:10.1016/j.arthro.2007.10.008.
15. Gross DJ, Golijanin P, Dumont GD, et al. The effect of sagittal rotation of the glenoid on axial glenoid width and glenoid version in computed tomography scan imaging. J Shoulder Elbow Surg. 2016;25(1):61-68. doi:10.1016/j.jse.2015.06.017.
16. Lenart BA, Freedman R, Van Thiel GS, et al. Magnetic resonance imaging evaluation of normal glenoid length and width: an anatomic study. Arthroscopy. 2014;30(8):915-920. doi:10.1016/j.arthro.2014.03.006.
17. Bois AJ, Fening SD, Polster J, Jones MH, Miniaci A. Quantifying glenoid bone loss in anterior shoulder instability: reliability and accuracy of 2-dimensional and 3-dimensional computed tomography measurement techniques. Am J Sports Med. 2012;40(11):2569-2577. doi:10.1177/0363546512458247.
18. Griffith JF, Antonio GE, Tong CW, Ming CK. Anterior shoulder dislocation: quantification of glenoid bone loss with CT. AJR Am J Roentgenol. 2003;180(5):1423-1430. doi:10.2214/ajr.180.5.1801423.
19. Hoenecke HR Jr, Hermida JC, Flores-Hernandez C, D'Lima DD. Accuracy of CT-based measurements of glenoid version for total shoulder arthroplasty. J Shoulder Elbow Surg. 2010;19(2):166-171. doi:10.1016/j.jse.2009.08.009.
20. Huijsmans PE, de Witte PB, de Villiers RV, et al. Recurrent anterior shoulder instability: accuracy of estimations of glenoid bone loss with computed tomography is insufficient for therapeutic decision-making. Skeletal Radiol. 2011;40(10):1329-1334. doi:10.1007/s00256-011-1184-5.
21. Bhatia S, Frank RM, Ghodadra NS, et al. The outcomes and surgical techniques of the latarjet procedure. Arthroscopy. 2014;30(2):227-235. doi:10.1016/j.arthro.2013.10.013.
22. Cunningham G, Benchouk S, Kherad O, Ladermann A. Comparison of arthroscopic and open Latarjet with a learning curve analysis. Knee Surg Sports Traumatol Arthrosc. 2015;24(2):540-545. doi:10.1007/s00167-015-3910-3.
23. Fedorka CJ, Mulcahey MK. Recurrent anterior shoulder instability: a review of the Latarjet procedure and its postoperative rehabilitation. Phys Sportsmed. 2015;43(1):73-79. doi:10.1080/00913847.2015.1005543.
24. Flinkkila T, Sirniö K. Open Latarjet procedure for failed arthroscopic Bankart repair. Orthop Traumatol Surg Res. 2015;101(1):35-38. doi:10.1016/j.otsr.2014.11.005.
25. Hovelius L, Sandström B, Saebö M. One hundred eighteen Bristow-Latarjet repairs for recurrent anterior dislocation of the shoulder prospectively followed for fifteen years: study II-the evolution of dislocation arthropathy. J Shoulder Elbow Surg. 2006;15(3):279-289. doi:10.1016/j.jse.2005.09.014.
26. Hovelius L, Sandström B, Sundgren K, Saebö M. One hundred eighteen Bristow-Latarjet repairs for recurrent anterior dislocation of the shoulder prospectively followed for fifteen years: study I--clinical results. J Shoulder Elbow Surg. 2004;13(5):509-516. doi:10.1016/S1058274604000916.
27. Hovelius L, Vikerfors O, Olofsson A, Svensson O, Rahme H. Bristow-Latarjet and Bankart: a comparative study of shoulder stabilization in 185 shoulders during a seventeen-year follow-up. J Shoulder Elbow Surg. 2011;20(7):1095-1101. doi:10.1016/j.jse.2011.02.005.
28. Gupta A, Delaney R, Petkin K, Lafosse L. Complications of the Latarjet procedure. Curr Rev Musculoskelet Med. 2015;8(1):59-66. doi:10.1007/s12178-015-9258-y.
29. Kwon YW, Powell KA, Yum JK, Brems JJ, Iannotti JP. Use of three-dimensional computed tomography for the analysis of the glenoid anatomy. J Shoulder Elbow Surg. 2005;14(1):85-90. doi:10.1016/j.jse.2004.04.011.
30. Saito H, Itoi E, Sugaya H, Minagawa H, Yamamoto N, Tuoheti Y. Location of the glenoid defect in shoulders with recurrent anterior dislocation. Am J Sports Med. 2005;33(6):889-893. doi:10.1177/0363546504271521.
ABSTRACT
Standard 2-dimensional (2-D) computed tomography (CT) scans of the shoulder are often aligned to the plane of the body as opposed to the plane of the scapula, which may challenge the ability to accurately measure glenoid width and glenoid bone loss (GBL). The purpose of this study is to determine the effect of sagittal rotation of the glenoid on axial anterior-posterior (AP) glenoid width measurements in the setting of anterior GBL.
Forty-three CT scans from consecutive patients with anterior GBL (minimum 10%) were reformatted utilizing open-source DICOM software (OsiriX MD). Patients were grouped according to extent of GBL: I, 10% to 14.9% (N = 12); II, 15% to 19.9% (N = 16); and III, >20% (N = 15). The uncorrected (UNCORR) and corrected (CORR) images were assessed in the axial plane at 5 standardized cuts and measured for AP glenoid width.
For groups I and III, UNCORR scans underestimated axial AP width (and thus overestimated anterior GBL) in cuts 1 and 2, while in cuts 3 to 5, the axial AP width was overestimated (GBL was underestimated). In Group II, axial AP width was underestimated (GBL was overestimated), while in cuts 2 to 5, the axial AP width was overestimated (GBL was underestimated). Overall, AP glenoid width was consistently underestimated in cut 1, the most caudal cut; while AP glenoid width was consistently overestimated in cuts 3 to 5, the more cephalad cuts.
UNCORR 2-D CT scans inaccurately estimated glenoid width and the degree of anterior GBL. This data suggests that corrected 2D CT scans or a 3-dimensional (3-D) reconstruction can help in accurately defining the anterior GBL in patients with shoulder instability.
The treatment of glenohumeral instability has substantially evolved over the past several decades. The understanding of glenoid bone loss (GBL), in particular, has advanced to such a level that we utilize the quantification of GBL for surgical decision-making. Unrecognized and/or untreated GBL is associated with recurrent instability, pain, and disability. Controversy exists, however, regarding the precise amount of anterior GBL that is significant enough to warrant surgical treatment. While historically, 25%1,2 of anterior GBL was thought to be the critical number required to warrant osseous augmentation, studies that are more recent have highlighted the need to perform osseous glenoid reconstruction with lesser degrees of GBL, particularly in the contact athlete.3-9 As small differences in the amount of GBL can change surgical decision-making from an all-soft tissue repair to an osseous reconstruction, it is paramount that we have accurate, valid, and reproducible methods for calculating GBL.
Continue to: Historically, plain radiographs...
Historically, plain radiographs have been the mainstay for evaluating the glenohumeral joint, including Grashey and axillary views, allowing clinicians to evaluate the congruency of the glenohumeral joint and to assess bone loss on both the glenoid and humeral head.1,10 While large, acute fractures of the glenoid are fairly evident on radiographs, including the Grashey view,11 shoulders with chronic and/or attritional anterior GBL are more difficult to evaluate, and often do not provide the information necessary to guide surgical decision-making.
Computed tomography (CT) of the shoulder has become the most commonly utilized imaging modality in the evaluation of patients with shoulder instability associated with GBL. Standard 2-dimensional (2-D) CT scans of the shoulder are often aligned to the plane of the body as opposed to the plane of the scapula/glenoid, as standard protocols often fail to account for the anterior sagittal rotation of the scapula/glenoid, similar to the disadvantage of standard radiographs. While 3-dimensional (3-D) CT reconstructions eliminate the effect of gantry angles, and thus allow for an en face view of the glenoid, 3-D reconstructions are not always available, and cannot always be measured.12-14 Thus, improved methodology for utilizing standard 2D scans is warranted, as the ability to correctly align the axial CT scan to the axis of the glenoid may allow for more accurate GBL measurements, which will ultimately impact surgical decision-making. Recently, Gross and colleagues15 reported the effect of sagittal rotation of the glenoid on axial measurements of anterior-posterior (AP) glenoid width and glenoid version in normal glenoids, without bone loss, and found that the mean angle of correction needed to align the sagittal plane was 20.1° ± 1.2° of rotation. To the authors’ knowledge, this same methodology has not been applied to patients with clinically meaningful anterior GBL. Given that the average glenoid width in human shoulders is 24.4 mm ± 2.9 mm,16 1 mm of glenoid bone loss (GBL) corresponds to approximately 4% of the glenoid width, and thus even subtle differences in the interpretation of GBL may have substantial clinical implications. Therefore, the purpose of this study is to determine the effect of sagittal rotation of the glenoid on axial AP glenoid width measurements in the setting of clinically significant anterior GBL.
METHODS
This study was approved by Massachusetts General Hospital Institutional Review Board. A retrospective review of consecutive patients with a diagnosis of anterior shoulder instability between 2009 and 2013 was conducted. Inclusion criteria comprised patients with a minimum of 10% anterior GBL, an available CT scan of the affected shoulder, and no history of prior ipsilateral surgeries. Exclusion criteria comprised evidence of degenerative changes to the glenoid and/or humeral head, as well as prior ipsilateral shoulder surgery. Sixty consecutive patients were originally identified as having anterior shoulder instability, and 17 were excluded based on the inclusion/exclusion criteria, leaving 43 patients (43 shoulders) available for inclusion. Shoulder CT scans from all 43 patients were reformatted utilizing open-source DICOM software (OsiriX MD, version 2.5.1 65-bit) multi-planar reconstruction (MPR).
CT PROTOCOL
All patients underwent a standard glenohumeral CT scan using a Siemens Sensation 64 Scanner (Siemens), a 64-detector scanner. Scans were acquired with 0.6 mm of collimation, 140 kV, and 300 mA-seconds. Slice thickness was set to 2 mm. All patient information was de-identified for analysis.
The uncorrected (UNCORR) scans were defined as the default orientation on the scanner. In the UNCORR scans, the axial, coronal, and sagittal views were oriented relative to the scanner gantry table, as opposed to the anatomy of the glenoid. The corrected (CORR) CT scans were aligned in all 3 planes relative to the glenoid face, and thus the cuts were perpendicular to the long axis of the glenoid.15 This resulted in sagittal cuts perpendicular to the 12-o’clock to 6-o’clock axis in the sagittal plane (Figure 1).
Continue to: In a de-identified fashion...
IMAGE ANALYSIS AND REFORMATTING
In a de-identified fashion, all CT scans were imported and analyzed using open-source Digital Imaging and Communications in Medicine (DICOM) software (OsiriX MD, version 2.5.1 64-bit). By following a previously developed method, CT scans were reformatted using OsiriX MPR. The OsiriX software has an MPR function that allows simultaneous manipulation of 2-D CT scans in 3 orthogonal planes: axial, sagittal, and coronal. In the MPR mode, the alternation of 1 plane directly affects the orientation of the remaining 2 planes. Thus, by using an MPR, one can analyze the impact that a default CT scan performed relative to the gantry of the table, UNCORR, has on the axial images.
First, the en face view was obtained via a 2-step process: alignment of the axial plane to account for the scapular angle, followed by alignment of the coronal plane to adjust for the glenoid inclination.15 These 2 adjustments provided a true en face sagittal glenoid view. The final adjustment step was a sagittal en face rotation of the glenoid such that the superior and inferior glenoid tubercles were placed on the 12-o’clock to 6-o’clock axis (CORR scan). Previous studies have identified a central longitudinal axis that was used in this method to align the supraglenoid tubercle with the 12-o’clock to 6-o’clock axis on the glenoid face.15,17,18 The standard error of mean was 1.21°. This new CORR view resulted in axial cuts through the glenoid that were oriented perpendicular to the 12-o’clock to 6-o’clock axis. The UNCORR and CORR images were assessed in the axial plane at 5 standardized cuts and measured for AP glenoid width by 2 independent observers in a blinded, randomized fashion. When the measured AP width of the UNCORR scan was less than that measured on the CORR scan, the AP width of the glenoid was considered underestimated, and the degree of GBL was considered overestimated (Figure 2).
SCAPULAR ANGLE
Scapular angle measurements were performed on the axial view as the angle between a line through the long axis of the body of the scapula, and a line parallel to the CT gantry table.15,19 Subsequently, the axial plane was aligned to the glenoid surface.
CORONAL INCLINATION
Coronal inclination measurements were performed on the sagittal view as the angle between a line tangential to the face of the glenoid and a line perpendicular to the CT gantry table. Positive values represented superior inclination, while negative values represented inferior glenoid inclination.15
SAGITTAL ROTATION
Sagittal rotation measurements were performed using the built-in angle measurement tool in OsiriX in the sagittal plane since the degree of rotation required aligning the long axis of the glenoid to the 12-o’clock to 6-o’clock axis. The amount of rotation was defined as the rotation angle.15
Continue to: Similarly, as described by Gross...
GLENOID WIDTH
Similarly, as described by Gross and colleagues,15 the sagittal en face view was divided via 5 cuts, throughout a superimposed best-fit circle that closely represents the glenoid.9,15,20 For both the UNCORR and CORR, glenoid width (AP distance) was measured on the axial image at the widest point from AP cortex across the glenoid face.
PATIENT GROUPS
Utilizing the en face 3-D CT reconstruction view of the glenoid as the gold standard, patients were placed into 1 of 3 groups according to the degree of anterior GBL measured via the surface method.9,20 The groups were as follows:
I. 10% to 14.9% (N = 12)
II. 15% to 19.9% (N = 16)
III. >20% (N = 15)
STATISTICAL METHODS
Paired t-tests were used to compare all measurements between CORR and UNCORR scans for each of the 5 cuts. A P-value of .05 was used as the threshold for statistical significance in 2-tailed comparisons. Mean and standard errors are presented with standard deviations throughout the study. For interobserver reliability, the measurements between the observers, the intraclass correlation coefficient was calculated. All statistics were performed with SPSS (Version 22).
RESULTS
The study cohort was comprised of 19 left shoulders (44%) and 24 right shoulders (56%), including 36 male patients (84%) and 7 female patients (16%). The average age was 27.8 years (range, 21-40 years). The variability in measured difference, with respect to AP width, was 1.05 mm. The UNCORR CT scans required a mean correction for coronal inclination of 7.0° ± 5.8° (range, -8°-6°). The UNCORR CT scans required a mean correction for scapular angle of 30.2° ± 8.0° (range, 15°-49°). The mean angle of sagittal rotation required to align the glenoid face with the 12-o’clock to 6-o’clock axis was 24.2° ± 5.1 ° (range, 13°-30°). These results are summarized in Table 1.
Table 1. Mean Correction Values Required to Correct the Uncorrected Images to the Corrected Images | |||
Anatomic alignment | Mean (degrees) | Range (degrees) | SD (degrees) |
Scapular angle | 30.2 | 15-49 | 8.0 |
Coronal Inclination | 7.0 | -8-6 | 5.8 |
Sagittal rotation | 24.2 | 13-30 | 5.1 |
For all measurements, the intraclass correlation coefficient for independent observers for all cuts within the 3 groups was r >.900 in all cases.
On an optimized CT scan, over 5 standardized cuts across a best-fit circle of the inferior glenoid, there was a statistically significant absolute mean difference of 12.6% in axial AP glenoid width (2.86 mm ± 2.00 mm, P =.016) when compared with the UNCORR scan. This corresponds to a 3% to 21% error in measurement of the AP width of the glenoid.
Continue to: For the entire cohort...
For the entire cohort of 43 patients, the UNCORR scans underestimated the axial AP width (and thus overestimated GBL) in cut 1 (P =.003), and overestimated the axial AP width (and thus underestimated GBL) in cuts 3 to 5 (P < .001 for all) compared with that of the CORR scans. There was no significant difference between the UNCORR and CORR scans in cut 2 (P = .331).
For groups I (10%-14.9% GBL) and III (>20% GBL), the UNCORR scans underestimated the axial AP width (and thus overestimated anterior GBL) in cuts 1 and 2, while in cuts 3 to 5, the axial AP width was overestimated (GBL was underestimated) (Tables 2, 3). In Group II (15%-19.9% GBL), the axial AP width was underestimated (GBL was overestimated), while in cuts 2 to 5, the axial AP width was overestimated (GBL was underestimated). Overall, AP glenoid width was consistently underestimated in cut 1, the most caudal cut, while AP glenoid width was consistently overestimated in cuts 3 to 5, the more cephalad cuts.
Table 2. Absolute Mean Difference in Axial AP Width (mm) Between Corrected and Uncorrected Images (% difference) | |||||
Cut 1 (Caudal) | Cut 2 | Cut 3 (Center) | Cut 4 | Cut 5 (Cephalad) | |
Group I: 10%-14.9% GBL | 2.4 mm (15.3%) | 1.8 mm (9.0%) | 1.8 mm (7.7%) | 3.0 mm (11.7%) | 4.0 mm (16.8%) |
Group II: 15%-19.9% GBL | 1.8 mm (13.1%) | 1.7 mm (7.9%) | 2.8 mm (10.6%) | 4.1 mm (14.4%) | 4.8 mm (16.9%) |
Group III: >20% | 2.8 mm (16.1%) | 1.9 mm (8.0%) | 2.3 mm (10.3) | 4.4 mm (16.6%) | 5.2 mm (17.0%) |
Abbreviations: AP, anterior-posterior; GBL, glenoid bone loss.
Table 3. Mean AP Glenoid Width Based on CORR and UNCORR Images for the Entire Cohort of 43 Patients | |||||
Axial cut | Mean AP width (mm) | Mean AP width (mm) | Absolute mean AP width difference (mm) | Absolute mean AP width difference (%) | P value |
(Caudal) 1 | 16.6208 | 18.4958 | -1.875 | 14.7768 | .0029565 |
2 | 20.6558 | 21.3166 | -0.661 | 3.6137 | .3310965 |
3 | 24.2583 | 22.3125 | 1.946 | 7.8042 | <.0001 |
4 | 26.1291 | 21.8916 | 4.238 | 15.8449 | <.0001 |
(Rostral) 5 | 26.0875 | 20.4875 | 5.6 | 20.9717 | <.0001 |
Abbreviations: AP, anterior-posterior; CORR, corrected; UNCORR, uncorrected.
DISCUSSION
The principle findings of this study demonstrate that UNCORR conventional 2-D CT scans inaccurately estimate glenoid width as well as inaccurately quantify the degree of anterior GBL. Underestimations of GBL may lead to insufficient treatment of clinically meaningful GBL, thereby increasing the risk of instability recurrence; whereas overestimations of GBL may lead to unnecessary treatment, subjecting patients to increased surgical morbidity. Therefore, the authors recommend correcting the orientation of the scapula in cases wherein clinical decisions are entirely based on 2-D CT, or using alternative methods for quantifying GBL, specifically in the form of 3-D reconstructions.
The use of axial imaging, with CT scans and/or magnetic resonance imaging, is growing in popularity for evaluation of both glenoid anatomy and GBL. Nevertheless, despite our improved ability to critically evaluate the glenoid using these advanced imaging modalities, the images themselves require scrutiny by clinicians to determine if the images accurately depict the true anatomy of the glenoid. As demonstrated by Gross and colleagues,15 conventional 2D CT scan protocols are not optimized to the anatomy of the glenohumeral joint, even in patients without GBL. Due to the alignment of the image relative to the plane of the scapula as opposed to the plane of the glenoid, UNCORR scans result in significantly different measurements of glenoid version (2.0° ± 0.1°) and AP glenoid width (1.2 mm ± 0.42 mm) compared with corrected scans, requiring an average 20.1° ± 1.2° of correction to align the sagittal plane. In the present study involving the patients with GBL, we also found that conventional, UNCORR 2-D CT scan protocols inaccurately estimate glenoid width and the degree of anterior GBL. In particular, AP glenoid width was consistently underestimated in the more caudal cuts, while AP glenoid width was consistently overestimated in the more cephalad cuts. Thus, anterior GBL was overestimated (AP glenoid width was underestimated) in the more caudal cuts, whereas anterior GBL was underestimated in the more cranial cuts (AP glenoid width was overestimated). Given that approximately 1 mm of glenoid bone corresponds to approximately 4% of glenoid width,16 even subtle differences in the interpretation of GBL may lead to gross overestimation/underestimation of bone loss, with significant clinical implications.
In the anterior instability patient population, clinical decision-making is often based on the degree of GBL as determined by advanced imaging modalities. In addition to other patient-specific factors, including age, gender, activity level, type of sport, and number of prior dislocations and/or prior surgeries, the quantity of GBL will often determine which surgical procedure needs to be performed. Typically, patients with >20% to 25% anterior GBL are indicated for a glenoid reconstruction procedure, most commonly via the Latarjet procedure (coracoid transfer).21-27 The Latarjet procedure remains an excellent technique for appropriately indicated patients, with historically good clinical outcomes and low recurrence rates. Complications associated with the Latarjet procedure, however, are not uncommon, including devastating neuropraxia of the axillary and musculocutaneous nerves, and occasionally permanent neurologic deficits.28 Thus, it is critical to avoid overtreating patients with recurrent instability and GBL. As demonstrated by this study, depending on the cranial-to-caudal location on the glenoid, current 2-D CT techniques may underestimate AP glenoid width, resulting in an overestimation of GBL, potentially leading to the decision to proceed with glenoid bone reconstruction when such a procedure is not required. On the contrary, overestimation of AP glenoid width, which occurs in the more cephalad cuts of the glenoid, is perhaps more worrisome, as the resulting underestimation of GBL may lead to inadequate treatment of patients with recurrent instability. Certainly, one of the main risk factors for failed soft tissue shoulder stabilization is a failure to address GBL. If clinical decisions are made based on UNCORR 2-D CT scans, which are often inaccurate with respect to AP glenoid width by an average 2.86 mm ± 2.00 mm (equivalent to 12.6% ± 6.9% GBL) as determined in this study, patients who truly require osseous glenoid reconstructions may be indicated for only soft tissue stabilization, based on the underestimation of GBL.
Continue to: The current gold standard...
The current gold standard for GBL measurement is a perfect-fit circle performed on a 3-D CT scan.22 To that end, it would have been useful to measure the glenoids from this study on 3-D CT scans and compare the data with both UNCORR and CORR measurements. This would have provided a better understanding to what extent the CORR measurements on 2-D scans are relatable with the gold standard. As 3-D CT scans provide a better en face view of the glenoid, more accurate GBL measurements, and ease of 3-D manipulation, they have become more widely used across the country.29,30 Nevertheless, in situations where 3-D imaging is more challenging to obtain because of technology or cost limitations, having a strategy for ensuring proper orientation of 2-D scans would have a substantial impact on clinical decision-making. If such corrections are not made, the inaccuracy of current 2-D scanning protocols justifies the cost 3-D reconstruction protocols. The difference in GBL measurements are critical in cases of increasingly large degrees of GBL, as in these instances, the inferior glenoid becomes more of an inverted-pear shape as opposed to a perfect circle, and differences in CORR and UNCORR images are likely to be more profound.
LIMITATIONS
This study has limitations, such as the relatively small sample size and the selection bias by the reviewers with potential differences in interobserver reliability. Further, minor modifications during the reformatting process may be found with each attempt to manipulate the images and may result in minor, insignificant differences in AP width measurements. Performing 1 or more additional CT scans on the same cohort of patients would have been helpful; however, due to the increased risk of radiation exposure, this was not performed. Performing CT scans on cadaveric specimens with GBL and applying the study methodology would also have been helpful to provide independent verification of our clinical findings; however, specimens were not available for this study. Another limitation of this study is that we did not compare our findings with the findings of glenoid width, and bone loss, as determined using the circle method, which is commonly utilized when 3-D reconstructions are available. In this study, the purpose was to utilize only the 2-D reformatted images, with the assumption that 3-D reconstructions are not always available, and cannot always be measured. To minimize selection bias, the investigators measured the correction effects within groups of patients with similar degrees of GBL (10%-14.9%, 15%-19.9%, and >20%). In addition, not all the selected patients showed degenerative glenoid changes or irregular glenoid shape indicating previous bone augmentation.
CONCLUSIONS
UNCORR 2D CT scans inaccurately estimate glenoid width and the degree of anterior GBL. The clinical implications of these findings are profound and suggest corrected 2D CT scans or 3D reconstruction allow measurements to be taken in the axis of the glenoid to accurately define the anatomy and quantity of anterior GBL in patients with shoulder instability.
1. Cerciello S, Edwards TB, Walch G. Chronic anterior glenohumeral instability in soccer players: results for a series of 28 shoulders treated with the Latarjet procedure. J Orthop Traumatol. 2012;13(4):197-202. doi:10.1007/s10195-012-0201-3.
2. Itoi E, Lee SB, Berglund LJ, Berge LL, An KN. The effect of a glenoid defect on anteroinferior stability of the shoulder after Bankart repair: a cadaveric study. J Bone Joint Surg Am. 2000;82(1):35-46.
3. Bhatia S, Ghodadra NS, Romeo AA, et al. The importance of the recognition and treatment of glenoid bone loss in an athletic population. Sports Health. 2011;3(5):435-440. doi:10.1177/1941738111414126.
4. Lo IK, Parten PM, Burkhart SS. The inverted pear glenoid: an indicator of significant glenoid bone loss. Arthroscopy. 2004;20(2):169-174. doi:10.1016/j.arthro.2003.11.036.
5. Mologne TS, Provencher MT, Menzel KA, Vachon TA, Dewing CB. Arthroscopic stabilization in patients with an inverted pear glenoid: results in patients with bone loss of the anterior glenoid. Am J Sports Med. 2007;35(8):1276-1283. doi:10.1177/0363546507300262.
6. Piasecki DP, Verma NN, Romeo AA, Levine WN, Bach BR Jr, Provencher MT. Glenoid bone deficiency in recurrent anterior shoulder instability: diagnosis and management. J Am Acad Orthop Surg. 2009;17(8):482-493.
7. Provencher MT, Bhatia S, Ghodadra NS, et al. Recurrent shoulder instability: current concepts for evaluation and management of glenoid bone loss. J Bone Joint Surg Am. 2010;92(suppl 2):133-151. doi:10.2106/JBJS.J.00906.
8. Rowe CR, Zarins B, Ciullo JV. Recurrent anterior dislocation of the shoulder after surgical repair. Apparent causes of failure and treatment. J Bone Joint Surg Am. 1984;66(2):159-168.
9. Sugaya H, Moriishi J, Dohi M, Kon Y, Tsuchiya A. Glenoid rim morphology in recurrent anterior glenohumeral instability. J Bone Joint Surg Am. 2003;85-A(5):878-884.
10. Edwards TB, Boulahia A, Walch G. Radiographic analysis of bone defects in chronic anterior shoulder instability. Arthroscopy. 2003;19(7):732-739.
11. Jankauskas L, Rudiger HA, Pfirrmann CW, Jost B, Gerber C. Loss of the sclerotic line of the glenoid on anteroposterior radiographs of the shoulder: a diagnostic sign for an osseous defect of the anterior glenoid rim. J Shoulder Elbow Surg. 2010;19(1):151-156. doi:10.1016/j.jse.2009.04.013.
12. Altan E, Ozbaydar MU, Tonbul M, Yalcin L. Comparison of two different measurement methods to determine glenoid bone defects: area or width? J Shoulder Elbow Surg. 2014;23(8):1215-1222. doi:10.1016/j.jse.2013.11.029.
13. Bishop JY, Jones GL, Rerko MA, Donaldson C, Group MS. 3-D CT is the most reliable imaging modality when quantifying glenoid bone loss. Clin Orthop Relat Res. 2013;471(4):1251-1256. doi:10.1007/s11999-012-2607-x.
14. Chuang TY, Adams CR, Burkhart SS. Use of preoperative three-dimensional computed tomography to quantify glenoid bone loss in shoulder instability. Arthroscopy. 2008; 24(4):376-382. doi:10.1016/j.arthro.2007.10.008.
15. Gross DJ, Golijanin P, Dumont GD, et al. The effect of sagittal rotation of the glenoid on axial glenoid width and glenoid version in computed tomography scan imaging. J Shoulder Elbow Surg. 2016;25(1):61-68. doi:10.1016/j.jse.2015.06.017.
16. Lenart BA, Freedman R, Van Thiel GS, et al. Magnetic resonance imaging evaluation of normal glenoid length and width: an anatomic study. Arthroscopy. 2014;30(8):915-920. doi:10.1016/j.arthro.2014.03.006.
17. Bois AJ, Fening SD, Polster J, Jones MH, Miniaci A. Quantifying glenoid bone loss in anterior shoulder instability: reliability and accuracy of 2-dimensional and 3-dimensional computed tomography measurement techniques. Am J Sports Med. 2012;40(11):2569-2577. doi:10.1177/0363546512458247.
18. Griffith JF, Antonio GE, Tong CW, Ming CK. Anterior shoulder dislocation: quantification of glenoid bone loss with CT. AJR Am J Roentgenol. 2003;180(5):1423-1430. doi:10.2214/ajr.180.5.1801423.
19. Hoenecke HR Jr, Hermida JC, Flores-Hernandez C, D'Lima DD. Accuracy of CT-based measurements of glenoid version for total shoulder arthroplasty. J Shoulder Elbow Surg. 2010;19(2):166-171. doi:10.1016/j.jse.2009.08.009.
20. Huijsmans PE, de Witte PB, de Villiers RV, et al. Recurrent anterior shoulder instability: accuracy of estimations of glenoid bone loss with computed tomography is insufficient for therapeutic decision-making. Skeletal Radiol. 2011;40(10):1329-1334. doi:10.1007/s00256-011-1184-5.
21. Bhatia S, Frank RM, Ghodadra NS, et al. The outcomes and surgical techniques of the latarjet procedure. Arthroscopy. 2014;30(2):227-235. doi:10.1016/j.arthro.2013.10.013.
22. Cunningham G, Benchouk S, Kherad O, Ladermann A. Comparison of arthroscopic and open Latarjet with a learning curve analysis. Knee Surg Sports Traumatol Arthrosc. 2015;24(2):540-545. doi:10.1007/s00167-015-3910-3.
23. Fedorka CJ, Mulcahey MK. Recurrent anterior shoulder instability: a review of the Latarjet procedure and its postoperative rehabilitation. Phys Sportsmed. 2015;43(1):73-79. doi:10.1080/00913847.2015.1005543.
24. Flinkkila T, Sirniö K. Open Latarjet procedure for failed arthroscopic Bankart repair. Orthop Traumatol Surg Res. 2015;101(1):35-38. doi:10.1016/j.otsr.2014.11.005.
25. Hovelius L, Sandström B, Saebö M. One hundred eighteen Bristow-Latarjet repairs for recurrent anterior dislocation of the shoulder prospectively followed for fifteen years: study II-the evolution of dislocation arthropathy. J Shoulder Elbow Surg. 2006;15(3):279-289. doi:10.1016/j.jse.2005.09.014.
26. Hovelius L, Sandström B, Sundgren K, Saebö M. One hundred eighteen Bristow-Latarjet repairs for recurrent anterior dislocation of the shoulder prospectively followed for fifteen years: study I--clinical results. J Shoulder Elbow Surg. 2004;13(5):509-516. doi:10.1016/S1058274604000916.
27. Hovelius L, Vikerfors O, Olofsson A, Svensson O, Rahme H. Bristow-Latarjet and Bankart: a comparative study of shoulder stabilization in 185 shoulders during a seventeen-year follow-up. J Shoulder Elbow Surg. 2011;20(7):1095-1101. doi:10.1016/j.jse.2011.02.005.
28. Gupta A, Delaney R, Petkin K, Lafosse L. Complications of the Latarjet procedure. Curr Rev Musculoskelet Med. 2015;8(1):59-66. doi:10.1007/s12178-015-9258-y.
29. Kwon YW, Powell KA, Yum JK, Brems JJ, Iannotti JP. Use of three-dimensional computed tomography for the analysis of the glenoid anatomy. J Shoulder Elbow Surg. 2005;14(1):85-90. doi:10.1016/j.jse.2004.04.011.
30. Saito H, Itoi E, Sugaya H, Minagawa H, Yamamoto N, Tuoheti Y. Location of the glenoid defect in shoulders with recurrent anterior dislocation. Am J Sports Med. 2005;33(6):889-893. doi:10.1177/0363546504271521.
TAKE-HOME POINTS
- Standard 2-D CT scans of the shoulder are often aligned to the plane of the body as opposed to the plane of the scapula, which may challenge the ability to accurately measure glenoid width and GBL.
- Underestimations of GBL may lead to insufficient treatment of clinically meaningful GBL, thereby increasing the risk of instability recurrence; whereas overestimations of GBL may lead to unnecessary treatment, subjecting patients to increased surgical morbidity.
- AP glenoid width was consistently underestimated in uncorrected axial cut 1, the most caudal cut.
- AP glenoid width was consistently overestimated in uncorrected axial cuts 3 to 5, the more cephalad cuts.
- CORR 2-D CT scans or a 3-D reconstruction can help in accurately defining the anterior GBL in patients with shoulder instability.
When Would a Metal-Backed Component Become Cost-Effective Over an All-Polyethylene Tibia in Total Knee Arthroplasty?
ABSTRACT
The importance of cost control in total knee arthroplasty is increasing in the United States secondary to both changing economic realities of healthcare and the increasing prevalence of joint replacement.
Surgeons play a critical role in cost containment and may soon be incentivized to make cost-effective decisions under proposed gainsharing programs. The purpose of this study is to examine the cost-effectiveness of all-polyethylene tibial (APT) components and determine what difference in revision rate would make modular metal-backed tibial (MBT) implants a more cost-effective intervention.
Markov models were constructed using variable implant failure rates and previously published probabilities. Cost data were obtained from both our institution and published United States implant list prices, and modeled with a 3.0% discount rate. The decision tree was continued over a 20-year timeframe.
Using our institutional cost data and model assumptions with a 1.0% annual failure rate for MBT components, an annual failure rate of 1.6% for APT components would be required to achieve equivalency in cost. Over a 20-year period, a failure rate of >27% for the APT component would be necessary to achieve equivalent cost compared with the proposed failure rate of 18% with MBT components. A sensitivity analysis was performed with different assumptions for MBT annual failure rates.
Given our assumptions, the APT component is cost-saving if the excess cumulative revision rate increases by <9% in 20 years compared with that of the MBT implant. Surgeons, payers, and hospitals should consider this approach when evaluating implants. Consideration should also be given to the decreased utility associated with revision surgery.
Continue to: All-polythylene tibial implants...
All-polyethylene tibial (APT) implants have been available for use in total knee arthroplasty (TKA) for decades. Except for one particular implant design, APT implants have shown equivalent functional outcome and survivorship to metal-backed tibial (MBT) components.1 Two recent systematic reviews have demonstrated no difference in durability or functional outcome between APT and MBT components.1,2 Despite this data, APT components continue to be used uncommonly in the United States. Improved technical ease and the theoretical advantages of modularity are likely responsible for the continued popularity of MBT implants despite the fact that APT implants cost considerably less than their MBT counterparts.
The importance of cost control in TKA is increasing secondary to changing economic realities of healthcare and increasing prevalence of joint replacement. Payers are seeking ways to ensure quality care at more affordable reimbursement rates. Surgeons play a critical role in cost containment and may soon be incentivized to make cost-effective decisions under proposed gainsharing programs. Implants account for a substantial portion of hospital costs for knee replacement and have been suggested as an essential part of cost control.3 As such, surgeons in the United States will probably need to factor in value when selecting implants and be required to justify the additional cost of “premium” implants.
Given recent systemic reviews concluding both equivalent effectiveness and survivorship, the APT component would appear to be inherently cost-effective when compared with an MBT design. However, the degree to which this implant is cost-effective has been difficult to quantify. The purpose of this study is to take a novel approach to examine the cost-effectiveness of APT components by determining what theoretical difference in revision rate would make modular MBT implants a more cost-effective intervention using our institutional cost data.
MATERIALS AND METHODS
A Markov decision model was used to evaluate the cost-effectiveness of APT components.4 A Markov decision model is a mathematical framework for modeling decision making in situations where outcomes are partly random and partly under the control of a decision maker. They are powerful tools for determining the best solution from all feasible solutions to a given problem. A decision model was constructed (Figure 1) to depict patients with arthritis of the knee being treated with either APT or MBT implants in a fashion similar to previously published models.5 At each point of a patient’s health status in the 20 years following surgery, they are either considered well after total knee replacement, well after revision surgery, or dead. Patients transition through the decision tree and pass through different states according to the probability of each event occurring, a process that is discussed further below. A utility value, measured in quality-adjusted life years (QALYs), and a cost are assigned to every health state and both primary and revision procedures within the model. The model is designed to determine the maximum failure rate for which the APT is the more cost-effective option.
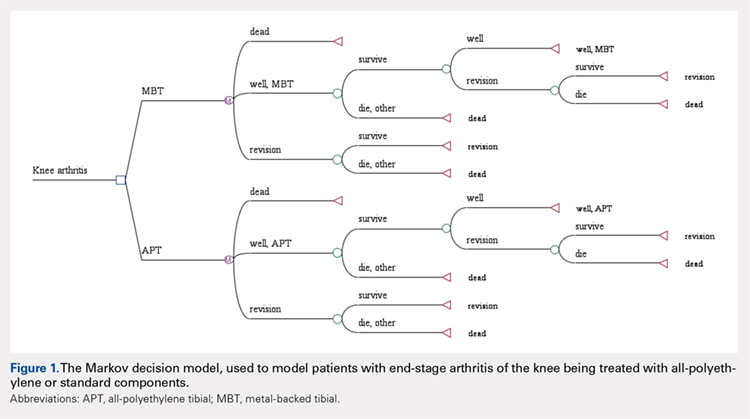
The model probabilities used for survival and mortality following TKA were adapted from those published previously in the literature.5 A utility value was assigned to each health state. The utility after initial surgery was set to 0.83 and utility after revision was set to 0.6.5 These values were obtained from the Swedish Registry and Tufts Cost-Effectiveness Registry, respectively. We also included a disutility of -0.1 for the first year after surgery and -0.2 for the first year after revision, to account for the disutility of undergoing surgery and the post-surgery recovery. Disutilities represent the negative preference patients have for a particular health state or outcome, such as primary or revision knee arthroplasty.5 It is assumed that there is a higher morbidity associated with revision arthroplasty vs primary arthroplasty and, thus, has a higher disutility value assigned to it.
We assumed the age at the initial surgery to be 65 years. Age-specific mortality rates were taken from the 2007 United States Life Tables published by the Centers for Disease Control and Prevention.6 An additional probability of .007 of dying during the surgery or postoperative from the initial surgery and a probability of .011 from the revision was included.
Costs for the surgery were obtained from the University of Virginia’s billing department. We obtained the average cost for the diagnosis-related group in 2012. The cost of primary knee replacement was $17,578.06 with MBT implants. We subtracted institutional cost savings for the APT that could be achieved to obtain a cost of $16,272.10 for the APT. The cost of revision was $21,650.34 and assumed to be the same regardless of the type of initial surgery. A 3% discount rate was used.
The costs, QALYs, and probabilities were then used to compute cost-effectiveness ratios, or the cost per additional QALY, of the 2 options. Unlike previous models published in the orthopedic literature, we assumed a constant probability of revision for the MBT. We initially assumed a 1.0% probability of failure per year for the MBT implant. We then determined what revision rate for the APT would be necessary to be cost equivalent with the MBT. A sensitivity analysis was performed to examine the impact of varying assumptions regarding the rate of revision.
Continue to: Results...
RESULTS
Under our institutional cost data and model assumptions with a 1% annual failure rate for MBT implants, an annual failure rate of 1.6% for APT components would be required to achieve equivalency in cost. Over a 20-year period, a failure rate of >27% for the APT component would be necessary to achieve equivalent cost compared with the proposed failure rate of 18% with MBT components.
A two-way sensitivity analysis for probabilities of failure was performed to compare revision probabilities of the APT with those of MBT components. The preferred strategy graph is included in Figure 2. This graph shows how varying annual revision rates for both the APT and MBT would impact which option would be preferable. For example, on the graph, an annual failure rate of 1.6% for APT implants would be cost equivalent to a 0.1% annual failure rate for MBT implants at 20 years. A 2.0% annual failure rate for the APT would be equivalent to a 1.4% annual failure rate for the MBT, and a 2.5% failure rate for the APT would be equivalent to a 1.8% MBT failure rate. Holding the APT failure rate constant at 2.5%, any MBT failure rate <1.8% would make the MBT the more cost-effective option, whereas a failure rate >1.8% would make the MBT less cost-effective than the APT. For probability combinations that fall in the lower right area of Figure 2, the APT is preferable, and for probability combinations that fall in the upper left area, the MBT is preferable. The line separating the 2 areas is where 1 would be indifferent, such that the cost per additional QALY is the same for both procedures.
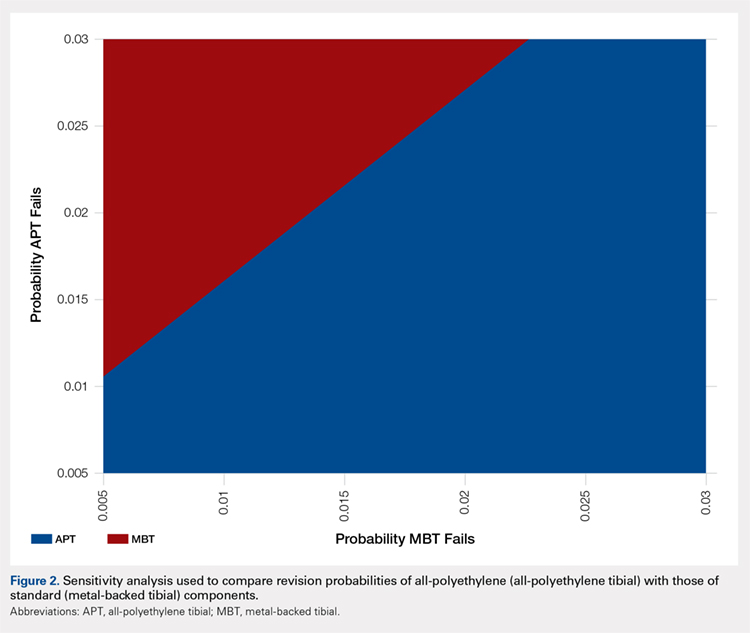
DISCUSSION
In light of the current economic climate and push for cost savings in the United States healthcare system, orthopedic surgeons must increasingly understand the realities of cost and the role it plays in the assessment of new technology. This concept is especially true of TKA as it becomes an increasingly common operative intervention. Utilizing cost savings techniques while ensuring quality outcomes is something that needs to be championed by healthcare providers.
Ideally, the introduction of a new medical technology that is more expensive than preexisting technology should lead to improved outcomes. Multiple randomized radiostereometric and clinical outcome studies looking at failure rates of APT compared with MBT have consistently suggested equivalence or superiority of the APT design when modern round-on-round implant designs are utilized.7-17 Two recent systematic reviews demonstrated that APT components were equivalent to MBT components regarding both revision rates and clinical scores.1,18 Given these results, it seems that the increased use of the APT design could save the healthcare system substantial amounts of money without compromising outcomes. For example, in 2006 Muller and colleagues19. proposed a possible cost savings of approximately 39 million dollars per year across England and Wales, if just 50% of the 70,000 TKAs performed annually used APTs. Our study, which helps quantify the potential cost-effectiveness of the APT design in terms of revision rates, should help further support this debate and provide a framework for the evaluation of new technology.
It should be noted that the results of this current study are based on both assumptions and generalizations. Institutional cost data is known to vary widely among institutions and our conclusions regarding comparable revision rates would change with different cost inputs. We are also unable to take into account individual patients, surgeons, or specific implant factors. It is very difficult to place a price on quality-adjusted life years and negative repercussions with revision surgery. Furthermore, speaking specifically about surgical technique, each surgeon has his/her own preference when performing TKA. There is a lack of intraoperative flexibility when using monoblock tibial components that many surgeons may find undesirable. A surgeon is unable to adjust the thickness of the polyethylene insert after cementation of metal implants. Finally, we are aware that cost-effectiveness analyses cannot take the place of rational clinical decision making when evaluating an individual patient for TKA. Patient age, body mass index, and deformity are all factors that may dictate the use of MBTs in an attempt to improve outcomes.
The results of this analysis help quantify the cost-effectiveness of the APT. Given the additional cost, the MBT design would have to lower revision rates substantially when compared with the APT design to be considered cost-effective. Multiple clinical studies have not shown this to be the case. Further studies are required to help guide clinical decision making and define the role of APT components in TKA.
- Voigt J, Mosier M. Cemented all-polyethylene and metal-backed polyethylene tibial components used for primary total knee arthroplasty: a systematic review of the literature and meta-analysis of randomized controlled trials involving 1798 primary total knee implants. J Bone Joint Surg Am. 2011;93(19):1790-1798. doi:10.2106/JBJS.J.01303.
- Klaas AN, Wiebe CV, Bart GP, Jan WS, Rob GHHN. All-polyethylene tibial components are equal to metal-backed components: systematic review and meta-regression. Clin Orthop Relat Res. 2012;470(12):3549-3559. doi:10.1007/s11999-012-2582-2.
- Healy WL, Iorio R. Implant selection and cost for total joint arthroplasty: conflict between surgeons and hospitals. Clin Orthop Relat Res. 2007;457:57-63. doi:10.1097/BLO.0b013e31803372e0.
- Hunink MGM, Glasziou PP, Siegel JE, et al. Decision Making in Health and Medicine. Cambridge, UK: Cambridge University Press; 2001.
- Slover JD. Cost effectiveness analysis of custom TK cutting blocks. J Arthroplasty. 2012;27(2):180-185. doi:10.1016/j.arth.2011.04.023.
- Revised United States life tables, 2001-2011. Centers for Disease Control and Prevention Web site. https://www.cdc.gov/nchs/nvss/mortality/lewk3.htm. Accessed January 22, 2013.
- Adalberth G, Nilsson KG, Byström S, Kolstad K, Milbrink J. Low-conforming all-polyethylene tibial component not inferior to metal-backed component in cemented total knee arthroplasty: Prospective, randomized radiostereometric analysis study of the AGC total knee prosthesis. J Arthroplasty. 2000;15(6):783-792.
- Adalberth G, Nilsson KG, Byström S, Kolstad K, Milbrink J. All-polyethylene versus metal-backed and stemmed tibial components in cemented total knee arthroplasty: A prospective, randomized RSA study. J Bone Joint Surg Br. 2001;83(6):825-831. doi:10.1302/0301-620X.83B6.0830825
- Gioe TJ, Bowman KR. A randomized comparison of all-polyethylene and metal-backed tibial components. Clin Orthop Relat Res. 2000;380:108-115.
- Hyldahl H, Regnér L, Carlsson L, Kärrholm J, Weidenhielm L. All-polyethylene vs. metal-backed tibial component in total knee arthroplasty: a randomized RSA study comparing early fixation of horizontally and completely cemented tibial components. Part 2: completely cemented components. MB not superior to AP components. Acta Orthop. 2005;76(6):778-784. doi:10.1080/17453670510045363
- Hyldahl H, Regnér L, Carlsson L, Kärrholm J, Weidenhielm L. All polyethylene vs. metal-backed tibial component in total knee arthroplasty: a randomized RSA study comparing early fixation of horizontally and completely cemented tibial components. Part 1: horizontally cemented components. AP better fixated than MB. Acta Orthop. 2005;76(6):769-777.
- Norgren B, Dalén T, Nilsson KG. All poly tibial component better than metal backed: a randomized RSA study. Knee. 2004;11(3):189-196. doi:10.1016/S0968-0160(03)00071-1
- Rodriguez JA, Baez N, Rasquinha V, Ranawat CS. Metal-backed and all-polyethylene tibial components in total knee replacement. Clin Orthop Relat Res. 2001;392:174-183. doi:10.1097/00003086-200111000-00021.
- Gioe TJ, Sinner P, Mehle S, Ma W, Killeen KK. Excellent survival of all polyethylene tibial components in a community joint registry. Clin Orthop Relat Res. 2007;464:88-92. doi:10.1097/BLO.0b013e31812f7879.
- Gioe TJ, Stroemer ES, Santos ER. All-polyethylene and metal-backed tibias have similar outcomes at 10 years: A randomized level I [corrected] evidence study. Clin Orthop Relat Res. 2007;455:212-218. doi:10.1097/01.blo.0000238863.69486.97.
- Gioe TJ, Glynn J, Sembrano J, Suthers K, Santos ER, Singh J. Mobile and fixed bearing (all-polyethylene tibial component) total knee arthroplasty designs: a prospective randomized trial. J Bone Joint Surg Am. 2009;91(9):2104-2112. doi:10.2106/JBJS.H.01442.
- Bettinson KA, Pinder IM, Moran CG, Weir DJ, Lingard EA. All-polyethylene compared with metal-backed tibial components in total knee arthroplasty at ten years: A prospective, randomized controlled trial. J Bone Joint Surg Am. 2009;91(7):1587-1594. doi:10.2106/JBJS.G.01427.
- Nouta KA, Verra WC, Pijls BG, Schoones JW, Nelissen RG. All-polyethylene tibial components are equal to metal-backed components: systematic review and meta-regression. Clin Orthop Relat Res. 2012;470(12):3549-3559. doi:10.1007/s11999-012-2582-2.
- Muller SD, Deehan DJ, Holland JP, et al. Should we reconsider all-polyethylene tibial implants in total knee replacement? J Bone Joint Surg Br. 2006;88(12):1596-1602. doi:10.1302/0301-620X.88B12.17695.
ABSTRACT
The importance of cost control in total knee arthroplasty is increasing in the United States secondary to both changing economic realities of healthcare and the increasing prevalence of joint replacement.
Surgeons play a critical role in cost containment and may soon be incentivized to make cost-effective decisions under proposed gainsharing programs. The purpose of this study is to examine the cost-effectiveness of all-polyethylene tibial (APT) components and determine what difference in revision rate would make modular metal-backed tibial (MBT) implants a more cost-effective intervention.
Markov models were constructed using variable implant failure rates and previously published probabilities. Cost data were obtained from both our institution and published United States implant list prices, and modeled with a 3.0% discount rate. The decision tree was continued over a 20-year timeframe.
Using our institutional cost data and model assumptions with a 1.0% annual failure rate for MBT components, an annual failure rate of 1.6% for APT components would be required to achieve equivalency in cost. Over a 20-year period, a failure rate of >27% for the APT component would be necessary to achieve equivalent cost compared with the proposed failure rate of 18% with MBT components. A sensitivity analysis was performed with different assumptions for MBT annual failure rates.
Given our assumptions, the APT component is cost-saving if the excess cumulative revision rate increases by <9% in 20 years compared with that of the MBT implant. Surgeons, payers, and hospitals should consider this approach when evaluating implants. Consideration should also be given to the decreased utility associated with revision surgery.
Continue to: All-polythylene tibial implants...
All-polyethylene tibial (APT) implants have been available for use in total knee arthroplasty (TKA) for decades. Except for one particular implant design, APT implants have shown equivalent functional outcome and survivorship to metal-backed tibial (MBT) components.1 Two recent systematic reviews have demonstrated no difference in durability or functional outcome between APT and MBT components.1,2 Despite this data, APT components continue to be used uncommonly in the United States. Improved technical ease and the theoretical advantages of modularity are likely responsible for the continued popularity of MBT implants despite the fact that APT implants cost considerably less than their MBT counterparts.
The importance of cost control in TKA is increasing secondary to changing economic realities of healthcare and increasing prevalence of joint replacement. Payers are seeking ways to ensure quality care at more affordable reimbursement rates. Surgeons play a critical role in cost containment and may soon be incentivized to make cost-effective decisions under proposed gainsharing programs. Implants account for a substantial portion of hospital costs for knee replacement and have been suggested as an essential part of cost control.3 As such, surgeons in the United States will probably need to factor in value when selecting implants and be required to justify the additional cost of “premium” implants.
Given recent systemic reviews concluding both equivalent effectiveness and survivorship, the APT component would appear to be inherently cost-effective when compared with an MBT design. However, the degree to which this implant is cost-effective has been difficult to quantify. The purpose of this study is to take a novel approach to examine the cost-effectiveness of APT components by determining what theoretical difference in revision rate would make modular MBT implants a more cost-effective intervention using our institutional cost data.
MATERIALS AND METHODS
A Markov decision model was used to evaluate the cost-effectiveness of APT components.4 A Markov decision model is a mathematical framework for modeling decision making in situations where outcomes are partly random and partly under the control of a decision maker. They are powerful tools for determining the best solution from all feasible solutions to a given problem. A decision model was constructed (Figure 1) to depict patients with arthritis of the knee being treated with either APT or MBT implants in a fashion similar to previously published models.5 At each point of a patient’s health status in the 20 years following surgery, they are either considered well after total knee replacement, well after revision surgery, or dead. Patients transition through the decision tree and pass through different states according to the probability of each event occurring, a process that is discussed further below. A utility value, measured in quality-adjusted life years (QALYs), and a cost are assigned to every health state and both primary and revision procedures within the model. The model is designed to determine the maximum failure rate for which the APT is the more cost-effective option.
The model probabilities used for survival and mortality following TKA were adapted from those published previously in the literature.5 A utility value was assigned to each health state. The utility after initial surgery was set to 0.83 and utility after revision was set to 0.6.5 These values were obtained from the Swedish Registry and Tufts Cost-Effectiveness Registry, respectively. We also included a disutility of -0.1 for the first year after surgery and -0.2 for the first year after revision, to account for the disutility of undergoing surgery and the post-surgery recovery. Disutilities represent the negative preference patients have for a particular health state or outcome, such as primary or revision knee arthroplasty.5 It is assumed that there is a higher morbidity associated with revision arthroplasty vs primary arthroplasty and, thus, has a higher disutility value assigned to it.
We assumed the age at the initial surgery to be 65 years. Age-specific mortality rates were taken from the 2007 United States Life Tables published by the Centers for Disease Control and Prevention.6 An additional probability of .007 of dying during the surgery or postoperative from the initial surgery and a probability of .011 from the revision was included.
Costs for the surgery were obtained from the University of Virginia’s billing department. We obtained the average cost for the diagnosis-related group in 2012. The cost of primary knee replacement was $17,578.06 with MBT implants. We subtracted institutional cost savings for the APT that could be achieved to obtain a cost of $16,272.10 for the APT. The cost of revision was $21,650.34 and assumed to be the same regardless of the type of initial surgery. A 3% discount rate was used.
The costs, QALYs, and probabilities were then used to compute cost-effectiveness ratios, or the cost per additional QALY, of the 2 options. Unlike previous models published in the orthopedic literature, we assumed a constant probability of revision for the MBT. We initially assumed a 1.0% probability of failure per year for the MBT implant. We then determined what revision rate for the APT would be necessary to be cost equivalent with the MBT. A sensitivity analysis was performed to examine the impact of varying assumptions regarding the rate of revision.
Continue to: Results...
RESULTS
Under our institutional cost data and model assumptions with a 1% annual failure rate for MBT implants, an annual failure rate of 1.6% for APT components would be required to achieve equivalency in cost. Over a 20-year period, a failure rate of >27% for the APT component would be necessary to achieve equivalent cost compared with the proposed failure rate of 18% with MBT components.
A two-way sensitivity analysis for probabilities of failure was performed to compare revision probabilities of the APT with those of MBT components. The preferred strategy graph is included in Figure 2. This graph shows how varying annual revision rates for both the APT and MBT would impact which option would be preferable. For example, on the graph, an annual failure rate of 1.6% for APT implants would be cost equivalent to a 0.1% annual failure rate for MBT implants at 20 years. A 2.0% annual failure rate for the APT would be equivalent to a 1.4% annual failure rate for the MBT, and a 2.5% failure rate for the APT would be equivalent to a 1.8% MBT failure rate. Holding the APT failure rate constant at 2.5%, any MBT failure rate <1.8% would make the MBT the more cost-effective option, whereas a failure rate >1.8% would make the MBT less cost-effective than the APT. For probability combinations that fall in the lower right area of Figure 2, the APT is preferable, and for probability combinations that fall in the upper left area, the MBT is preferable. The line separating the 2 areas is where 1 would be indifferent, such that the cost per additional QALY is the same for both procedures.
DISCUSSION
In light of the current economic climate and push for cost savings in the United States healthcare system, orthopedic surgeons must increasingly understand the realities of cost and the role it plays in the assessment of new technology. This concept is especially true of TKA as it becomes an increasingly common operative intervention. Utilizing cost savings techniques while ensuring quality outcomes is something that needs to be championed by healthcare providers.
Ideally, the introduction of a new medical technology that is more expensive than preexisting technology should lead to improved outcomes. Multiple randomized radiostereometric and clinical outcome studies looking at failure rates of APT compared with MBT have consistently suggested equivalence or superiority of the APT design when modern round-on-round implant designs are utilized.7-17 Two recent systematic reviews demonstrated that APT components were equivalent to MBT components regarding both revision rates and clinical scores.1,18 Given these results, it seems that the increased use of the APT design could save the healthcare system substantial amounts of money without compromising outcomes. For example, in 2006 Muller and colleagues19. proposed a possible cost savings of approximately 39 million dollars per year across England and Wales, if just 50% of the 70,000 TKAs performed annually used APTs. Our study, which helps quantify the potential cost-effectiveness of the APT design in terms of revision rates, should help further support this debate and provide a framework for the evaluation of new technology.
It should be noted that the results of this current study are based on both assumptions and generalizations. Institutional cost data is known to vary widely among institutions and our conclusions regarding comparable revision rates would change with different cost inputs. We are also unable to take into account individual patients, surgeons, or specific implant factors. It is very difficult to place a price on quality-adjusted life years and negative repercussions with revision surgery. Furthermore, speaking specifically about surgical technique, each surgeon has his/her own preference when performing TKA. There is a lack of intraoperative flexibility when using monoblock tibial components that many surgeons may find undesirable. A surgeon is unable to adjust the thickness of the polyethylene insert after cementation of metal implants. Finally, we are aware that cost-effectiveness analyses cannot take the place of rational clinical decision making when evaluating an individual patient for TKA. Patient age, body mass index, and deformity are all factors that may dictate the use of MBTs in an attempt to improve outcomes.
The results of this analysis help quantify the cost-effectiveness of the APT. Given the additional cost, the MBT design would have to lower revision rates substantially when compared with the APT design to be considered cost-effective. Multiple clinical studies have not shown this to be the case. Further studies are required to help guide clinical decision making and define the role of APT components in TKA.
- Voigt J, Mosier M. Cemented all-polyethylene and metal-backed polyethylene tibial components used for primary total knee arthroplasty: a systematic review of the literature and meta-analysis of randomized controlled trials involving 1798 primary total knee implants. J Bone Joint Surg Am. 2011;93(19):1790-1798. doi:10.2106/JBJS.J.01303.
- Klaas AN, Wiebe CV, Bart GP, Jan WS, Rob GHHN. All-polyethylene tibial components are equal to metal-backed components: systematic review and meta-regression. Clin Orthop Relat Res. 2012;470(12):3549-3559. doi:10.1007/s11999-012-2582-2.
- Healy WL, Iorio R. Implant selection and cost for total joint arthroplasty: conflict between surgeons and hospitals. Clin Orthop Relat Res. 2007;457:57-63. doi:10.1097/BLO.0b013e31803372e0.
- Hunink MGM, Glasziou PP, Siegel JE, et al. Decision Making in Health and Medicine. Cambridge, UK: Cambridge University Press; 2001.
- Slover JD. Cost effectiveness analysis of custom TK cutting blocks. J Arthroplasty. 2012;27(2):180-185. doi:10.1016/j.arth.2011.04.023.
- Revised United States life tables, 2001-2011. Centers for Disease Control and Prevention Web site. https://www.cdc.gov/nchs/nvss/mortality/lewk3.htm. Accessed January 22, 2013.
- Adalberth G, Nilsson KG, Byström S, Kolstad K, Milbrink J. Low-conforming all-polyethylene tibial component not inferior to metal-backed component in cemented total knee arthroplasty: Prospective, randomized radiostereometric analysis study of the AGC total knee prosthesis. J Arthroplasty. 2000;15(6):783-792.
- Adalberth G, Nilsson KG, Byström S, Kolstad K, Milbrink J. All-polyethylene versus metal-backed and stemmed tibial components in cemented total knee arthroplasty: A prospective, randomized RSA study. J Bone Joint Surg Br. 2001;83(6):825-831. doi:10.1302/0301-620X.83B6.0830825
- Gioe TJ, Bowman KR. A randomized comparison of all-polyethylene and metal-backed tibial components. Clin Orthop Relat Res. 2000;380:108-115.
- Hyldahl H, Regnér L, Carlsson L, Kärrholm J, Weidenhielm L. All-polyethylene vs. metal-backed tibial component in total knee arthroplasty: a randomized RSA study comparing early fixation of horizontally and completely cemented tibial components. Part 2: completely cemented components. MB not superior to AP components. Acta Orthop. 2005;76(6):778-784. doi:10.1080/17453670510045363
- Hyldahl H, Regnér L, Carlsson L, Kärrholm J, Weidenhielm L. All polyethylene vs. metal-backed tibial component in total knee arthroplasty: a randomized RSA study comparing early fixation of horizontally and completely cemented tibial components. Part 1: horizontally cemented components. AP better fixated than MB. Acta Orthop. 2005;76(6):769-777.
- Norgren B, Dalén T, Nilsson KG. All poly tibial component better than metal backed: a randomized RSA study. Knee. 2004;11(3):189-196. doi:10.1016/S0968-0160(03)00071-1
- Rodriguez JA, Baez N, Rasquinha V, Ranawat CS. Metal-backed and all-polyethylene tibial components in total knee replacement. Clin Orthop Relat Res. 2001;392:174-183. doi:10.1097/00003086-200111000-00021.
- Gioe TJ, Sinner P, Mehle S, Ma W, Killeen KK. Excellent survival of all polyethylene tibial components in a community joint registry. Clin Orthop Relat Res. 2007;464:88-92. doi:10.1097/BLO.0b013e31812f7879.
- Gioe TJ, Stroemer ES, Santos ER. All-polyethylene and metal-backed tibias have similar outcomes at 10 years: A randomized level I [corrected] evidence study. Clin Orthop Relat Res. 2007;455:212-218. doi:10.1097/01.blo.0000238863.69486.97.
- Gioe TJ, Glynn J, Sembrano J, Suthers K, Santos ER, Singh J. Mobile and fixed bearing (all-polyethylene tibial component) total knee arthroplasty designs: a prospective randomized trial. J Bone Joint Surg Am. 2009;91(9):2104-2112. doi:10.2106/JBJS.H.01442.
- Bettinson KA, Pinder IM, Moran CG, Weir DJ, Lingard EA. All-polyethylene compared with metal-backed tibial components in total knee arthroplasty at ten years: A prospective, randomized controlled trial. J Bone Joint Surg Am. 2009;91(7):1587-1594. doi:10.2106/JBJS.G.01427.
- Nouta KA, Verra WC, Pijls BG, Schoones JW, Nelissen RG. All-polyethylene tibial components are equal to metal-backed components: systematic review and meta-regression. Clin Orthop Relat Res. 2012;470(12):3549-3559. doi:10.1007/s11999-012-2582-2.
- Muller SD, Deehan DJ, Holland JP, et al. Should we reconsider all-polyethylene tibial implants in total knee replacement? J Bone Joint Surg Br. 2006;88(12):1596-1602. doi:10.1302/0301-620X.88B12.17695.
TAKE-HOME POINTS
- APT components have been shown to be cost-effective when compared to MBT designs in TKA.
- Revision rates would have to be substantially lower in MBT to afford a cost advantage over APT components.
- Given that only a small percentage of surgeons routinely use APT components, factors other than cost-effectiveness must influence the choice of implant.
- Surgeons may find that APT components are more technically demanding to use and they do not allow for modular stems or augmentations.
- Institutional cost data is known to vary widely among institutions, and our conclusions regarding comparable revision rates would change with different cost inputs.

Reoperation Rates After Cartilage Restoration Procedures in the Knee: Analysis of a Large US Commercial Database
ABSTRACT
The purpose of this study is to describe the rate of return to the operating room (OR) following microfracture (MFX), autologous chondrocyte implantation (ACI), osteochondral autograft transplantation (OATS), and osteochondral allograft (OCA) procedures at 90 days, 1 year, and 2 years. Current Procedural Terminology codes for all patients undergoing MFX, ACI, OATS, and OCA were used to search a prospectively collected, commercially available private payer insurance company database from 2007 to 2011. Within 90 days, 1 year, and 2 years after surgery, the database was searched for the occurrence of these same patients undergoing knee diagnostic arthroscopy with biopsy, lysis of adhesions, synovectomy, arthroscopy for infection or lavage, arthroscopy for removal of loose bodies, chondroplasty, MFX, ACI, OATS, OCA, and/or knee arthroplasty. Descriptive statistical analysis and contingency table analysis were performed. A total of 47,207 cartilage procedures were performed from 2007 to 2011, including 43,576 MFX, 640 ACI, 386 open OATS, 997 arthroscopic OATS, 714 open OCA, and 894 arthroscopic OCA procedures. The weighted average reoperation rates for all procedures were 5.87% at 90 days, 11.94% at 1 year, and 14.90% at 2 years following the index cartilage surgery. At 2 years, patients who underwent MFX, ACI, OATS, OCA had reoperation rates of 14.65%, 29.69%, 8.82%, and 12.22%, respectively. There was a statistically significantly increased risk for ACI return to OR within all intervals (P < .0001); however, MFX had a greater risk factor (P < .0001) for conversion to arthroplasty. There was no difference in failure/revision rates between the restorative treatment options. With a large US commercial insurance database from 2007 to 2011, reparative procedures were favored for chondral injuries, but yielded an increased risk for conversion to arthroplasty. There was no difference in failure/revision rates between the restorative approaches, yet cell-based approaches yielded a significantly increased risk for a return to the OR.
Continue to: Symptomatic, full-thickness articular cartilage
Symptomatic, full-thickness articular cartilage defects in the knee are difficult to manage, particularly in the young, athletic patient population. Fortunately, a variety of cartilage repair (direct repair of the cartilage or those procedures which attempt to generate fibrocartilage) and restoration (those aimed at restoring hyaline cartilage) procedures are available, with encouraging short- and long-term clinical outcomes. After failure of nonoperative management, several surgical options are available for treating symptomatic focal chondral defects, including microfracture (MFX), autologous chondrocyte implantation (ACI), osteochondral autograft transplantation (OATS), and open and arthroscopic osteochondral allograft (OCA) transplantation procedures.1,2 When appropriately indicated, each of these techniques has demonstrated good to excellent clinical outcomes with respect to reducing pain and improving function.3-5
While major complications following cartilage surgery are uncommon, the need for reoperation following an index articular cartilage operation is poorly understood. Recently, McCormick and colleagues6 found that reoperation within the first 2 years following meniscus allograft transplantation (MAT) is associated with an increased likelihood of revision MAT or future arthroplasty. Given the association between early reoperation following meniscus restoration surgery and subsequent failure, an improved understanding of the epidemiology and implications of reoperations following cartilage restoration surgery is warranted. Further, in deciding which treatment option is best suited to a particular patient, the rate of return to the operating room (OR) should be taken into consideration, as this could potentially influence surgical decision-making as to which procedure to perform, especially in value-based care decision-making environments.
The purpose of this study is to describe the rate of return to the OR for knee procedures following cartilage restoration at intervals of 90 days, 1 year, and 2 years across a large-scale US patient database. The authors hypothesize that the rate of return to the OR following knee cartilage repair or restoration procedures will be under 20% during the first post-operative year, with increasing reoperation rates over time. A secondary hypothesis is that there will be no difference in reoperation rates according to sex, but that younger patients (those younger than 40 years) will have higher reoperation rates than older patients.
METHODS
We performed a retrospective analysis of a prospectively collected, large-scale, and commercially available private payer insurance company database (PearlDiver) from 2007 to 2011. The PearlDiver database is a Health Insurance Portability and Accountability Act (HIPAA) compliant, publicly available national database consisting of a collection of private payer records, with United Health Group representing the contributing health plan. The database has more than 30 million patient records and contains Current Procedural Terminology (CPT) and International Classification of Diseases, Ninth Revision (ICD-9) codes related to orthopedic procedures. From 2007 to 2011, the private payer database captured between 5.9 million and 6.2 million patients per year.
Our search was based on the CPT codes for MFX (29879), ACI (27412), OATS (29866, 29867), and OCA (27415, 27416). Return to the OR for revision surgery for the above-mentioned procedures was classified as patients with a diagnosis of diagnostic arthroscopy with biopsy (CPT 29870), lysis of adhesions (CPT 29884), synovectomy (29875, 29876), arthroscopy for infection or lavage (CPT 29871), arthroscopy for removal of loose bodies (29874), chondroplasty (29877), unicompartmental knee arthroplasty (27446), total knee arthroplasty (27447), and/or patellar arthroplasty (27438). Patient records were followed for reoperations occurring within 90 days, 1 year, and 2 years after the index cartilage procedure. All data were compared based on patient age and sex.
Table 1. Breakdown of MFX, ACI, OATS, and OCA Procedures by Sex | ||||||
MFX | ACI | Open OATS | Arthroscopic OATS | Open OCA | Arthroscopic OCA | |
Females | 20,589 | 276 | 167 | 401 | 275 | 350 |
Males | 22,987 | 364 | 219 | 596 | 439 | 544 |
Total | 43,576 | 640 | 386 | 997 | 714 | 894 |
Abbreviations: ACI, autologous chondrocyte implantation; MFX, microfracture; OCA, osteochondral allograft; OATS, osteochondral autograft transplantation.
Continue to: Statistical analysis...
STATISTICAL ANALYSIS
Statistical analysis of this study was primarily descriptive to demonstrate the incidence for each code at each time interval. One-way analysis of variance, Chi-square analysis, and contingency tables were used to compare the incidence of each type of procedure throughout the various time intervals. A P-value of < 0.05 was considered statistically significant. Statistical analysis was performed using SPSS v.20 (International Business Machines).
RESULTS
A total of 47,207 cartilage procedures were performed from 2007 to 2011, including 43,576 MFX (92.3%) 640 ACI (1.4%), 386 open OATS (0.82%), 997 arthroscopic OATS (2.11%), 714 open OCA (1.51%), and 894 arthroscopic OCA (1.89%) procedures. A summary of the procedures performed, broken down by age and sex, is provided in Tables 1 and 2. A total of 25,149 male patients (53.3%) underwent surgical procedures compared to 22,058 female patients (46.7%). For each category of procedure (MFX, ACI, OATS, OCA), there was a significantly higher proportion of males than females undergoing surgery (P < .0001 for all). Surgical treatment with MFX was consistently the most frequently performed surgery across all age groups (92.31%), while cell-based therapy with ACI was the least frequently performed procedure across all age ranges (1.36%). Restorative OATS and OCA techniques were performed with the greatest frequency in the 15-year-old to 19-year-old age group, but were not utilized in patients over 64 years of age (Table 2).
Table 2. Breakdown of MFX, ACI, OATS, and OCA Procedures by Age | ||||
Age (y) | MFX | ACI | OATS | OCA |
10 to 14 | 572 | 22 | 74 | 47 |
15 to 19 | 1984 | 83 | 254 | 235 |
20 to 24 | 1468 | 54 | 140 | 144 |
25 to 29 | 1787 | 74 | 152 | 176 |
30 to 34 | 2824 | 114 | 152 | 204 |
35 to 39 | 4237 | 96 | 153 | 210 |
40 to 44 | 5441 | 103 | 166 | 217 |
45 to 49 | 7126 | 57 | 149 | 180 |
50 to 54 | 7004 | 25 | 83 | 140 |
55 to 59 | 6410 | 12 | 40 | 40 |
60 to 64 | 4409 | 0 | 20 | 15 |
65 to 69 | 269 | 0 | 0 | 0 |
70 to 74 | 45 | 0 | 0 | 0 |
Total | 43,576 | 640 | 1383 | 1608 |
Abbreviations: ACI, autologous chondrocyte implantation; MFX, microfracture; OCA, osteochondral allograft; OATS, osteochondral autograft transplantation.
A summary of all reoperation data is provided in Tables 3 to 7 and Figures 1 and 2. The weighted average reoperation rates for all procedures were 5.87% at 90 days, 11.94% at 1 year, and 14.90% at 2 years following the index cartilage surgery. Patients who underwent MFX had reoperation rates of 6.05% at 90 days, 11.80% at 1 year, and 14.65% at 2 years. Patients who underwent ACI had reoperation rates of 4.53% at 90 days, 23.28% at 1 year, and 29.69% at 2 years. Patients who had open and arthroscopic OATS had reoperation rates of 3.122% and 5.12% at 90 days, 6.74% and 8.53% at 1 year, and 7.51% and 10.13% at 2 years, respectively. Patients who underwent open and arthroscopic OCA had reoperation rates of 2.52% and 3.91% at 90 days, 7.14% and 6.60% at 1 year, and 13.59% and 10.85% at 2 years (Table 3). There was a statistically significantly increased risk for reoperation following ACI within all intervals compared to all other surgical techniques (P < .0001); however, MFX had a greater risk factor (P < .0001) for conversion to arthroplasty at 6.70%. There was no significant difference between failure rates (revision OATS/OCA or conversion to arthroplasty) between the restorative treatment options, with 14 failures for OATS (9.52% of reoperations at 2 years) compared to 22 failures for OCA (12.7% of reoperations at 2 years, P = .358). Among the entire cohort of cartilage surgery patients, arthroscopic chondroplasty was the most frequent procedure performed at the time of reoperation at all time points assessed, notably accounting for 33.08% of reoperations 2 years following microfracture, 51.58% of reoperations at 2 years following ACI, 53.06% of reoperations at 2 years following OATS, and 54.07% of reoperations at 2 years following OCA (Figure 3, Tables 4–7).
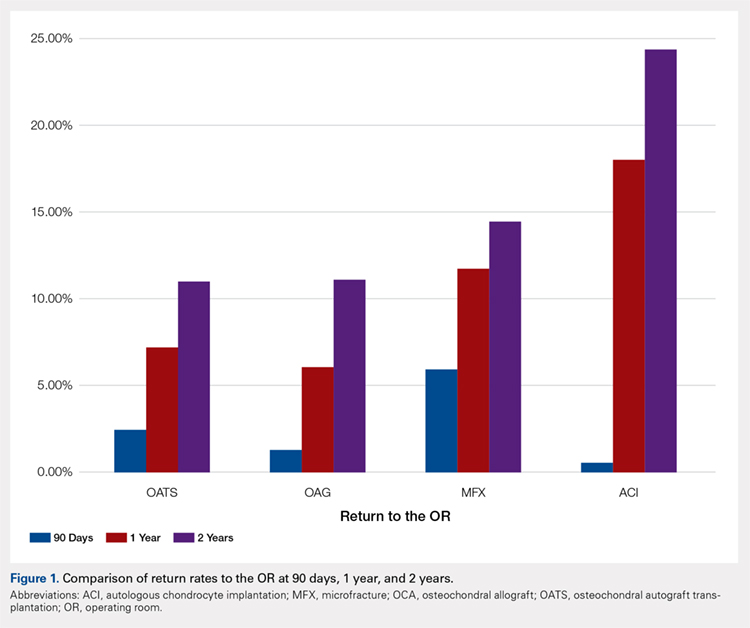
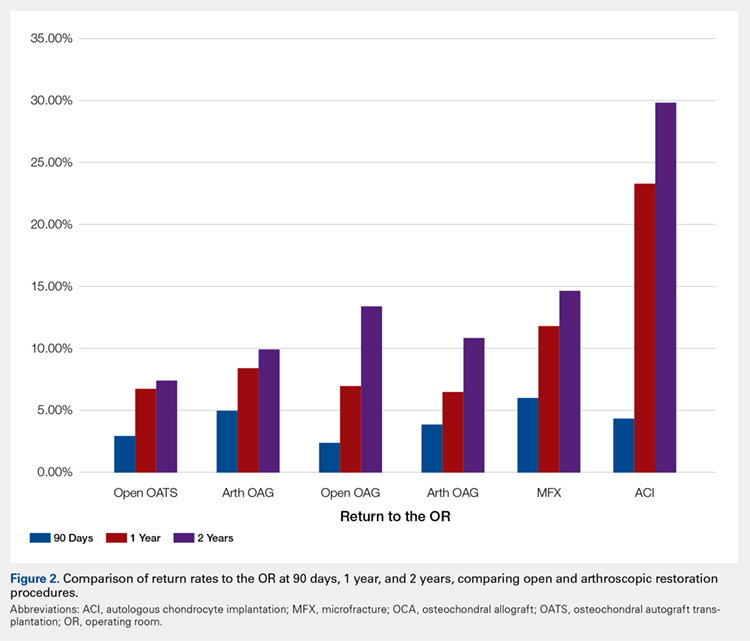
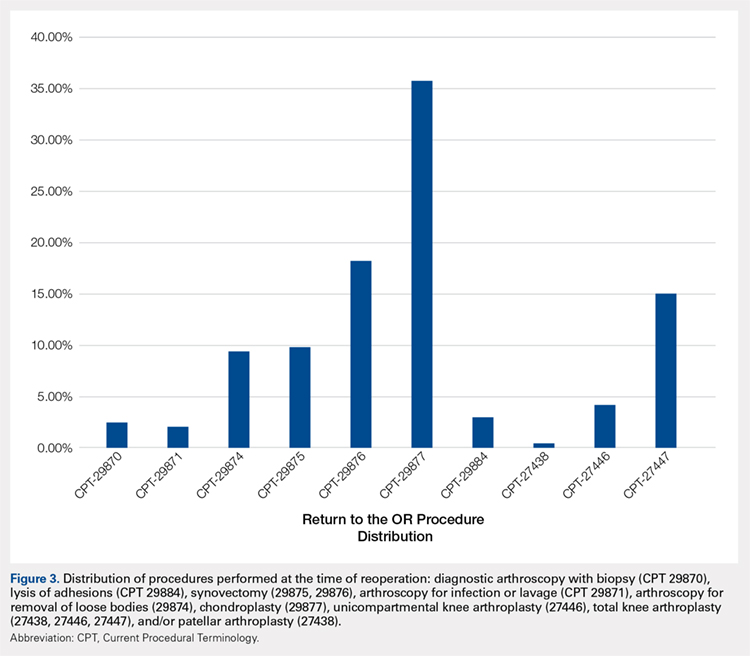
Table 3. Comparison of Return to OR Following MFX, ACI, OCA, and OATS | |||||||
Procedure | Total No. of Cases in Study Period | No. of Reoperations at 90 Days | Return to OR Rate at 90 Days | No. of Reoperations at 1 Year | Return to OR Rate at 1 Year | No. of Reoperations at 2 Years | Return to OR Rate at 2 Years |
MFX | 43,576 | 2636 | 6.05% | 5142 | 11.80% | 6385 | 14.65% |
ACI | 640 | 29 | 4.53% | 149 | 23.28% | 190 | 29.69% |
Open OATS | 386 | 12 | 3.12% | 26 | 6.74% | 29 | 7.51% |
Arthroscopic OATS | 997 | 51 | 5.12% | 85 | 8.53% | 101 | 10.13% |
Open OCA | 714 | 18 | 2.52% | 51 | 7.14% | 97 | 13.59% |
Arthroscopic OCA | 894 | 161 | 3.91% | 59 | 6.60% | 97 | 10.85% |
Weighted average for all procedures |
| 5.87% |
| 11.94% |
| 14.90% | |
Abbreviations: ACI, autologous chondrocyte implantation; MFX, microfracture; OCA, osteochondral allograft; OATS, osteochondral autograft transplantation; OR, operating room.
Table 4. Rate of Return to OR Following MFX (n = 43,574) | ||||
Procedure | CPT Code | 90 Days | 1 Year | 2 Years |
Knee arthroscopy | 29870 | 54 | 122 | 162 |
Knee arthroscopic drainage and lavage | 29871 | 84 | 102 | 104 |
Arthroscopic adhesions débridement | 29874 | 300 | 468 | 549 |
Arthroscopic synovectomy | 29875 | 324 | 528 | 611 |
Major arthroscopic synovectomy | 29876 | 557 | 926 | 1087 |
Knee arthroscopic chondroplasty | 29877 | 1063 | 1722 | 2112 |
Arthroscopic lysis of adhesions | 29884 | 61 | 129 | 171 |
Patellar arthroplasty | 27438 | 0 | 38 | 49 |
Medial or lateral knee arthroplasty | 27446 | 51 | 242 | 328 |
Medial and lateral knee arthroplasty | 27447 | 142 | 865 | 1212 |
Total | 2636 | 5142 | 6385 | |
Return to OR | 6.05% | 11.80% | 14.65% | |
Abbreviations: CPT, Current Procedural Terminology; MFX, microfracture; OR, operating room.
Table 5. Rate of Return to OR Following ACI (n = 640) | ||||
Procedure | CPT Code | 90 Daysa | 1 Yeara | 2 Yearsa |
Revision ACI | 27412 | 29 | 33 | 35 |
Knee arthroscopy | 29870 | -1 | -1 | -1 |
Knee arthroscopic drainage and lavage | 29871 | -1 | -1 | -1 |
Arthroscopic adhesions débridement | 29874 | 0 | -1 | -1 |
Arthroscopic synovectomy | 29875 | -1 | -1 | -1 |
Major arthroscopic synovectomy | 29876 | -1 | 12 | 20 |
Knee arthroscopic chondroplasty | 29877 | -1 | 71 | 98 |
Arthroscopic lysis of adhesions | 29884 | -1 | 33 | 37 |
Patellar arthroplasty | 27438 | 0 | 0 | 0 |
Medial or lateral knee arthroplasty | 27446 | 0 | -1 | -1 |
Medial and lateral knee arthroplasty | 27447 | 0 | -1 | -1 |
Total | 29 | 149 | 190 | |
Return to OR | 4.53% | 23.28% | 29.69% | |
aA -1 denotes No. <11 within the PearlDiver database, and exact numbers are not reported due to patient privacy considerations.
Abbreviations: ACI, autologous chondrocyte implantation; CPT, Current Procedural Terminology; OR, operating room.
Table 6. Rate of Return to OR Following OATS (n = 1320) | ||||
Procedure | CPT Code | 90 Days | 1 Year | 2 Years |
Knee arthroscopy | 29870 | 0 | 0 | 0 |
Knee arthroscopic drainage and lavage | 29871 | 0 | 0 | 0 |
Arthroscopic adhesions débridement | 29874 | 0 | 12 | 13 |
Arthroscopic synovectomy | 29875 | 0 | 0 | 14 |
Major arthroscopic synovectomy | 29876 | 16 | 25 | 28 |
Knee arthroscopic chondroplasty | 29877 | 17 | 58 | 78 |
Arthroscopic lysis of adhesions | 29884 | 0 | 0 | 0 |
Patellar arthroplasty | 27438 | 0 | 0 | 0 |
Medial or lateral knee arthroplasty | 27446 | 0 | 0 | 0 |
Medial and lateral knee arthroplasty | 27447 | 0 | 0 | 14 |
Total | 33 | 95 | 147 | |
Return to OR | 2.50% | 7.20% | 11.14% | |
Abbreviations: CPT, Current Procedural Terminology; OATS, osteochondral autograft transplantation; OR, operating room.
Table 7. Rate of Return to OR Following OCA Transplantation (n = 1531) | ||||
Procedure | CPT Code | 90 Days | 1 Year | 2 Year |
Knee arthroscopy | 29870 | 0 | 0 | 0 |
Knee arthroscopic drainage and lavage | 29871 | 0 | 0 | 0 |
Arthroscopic adhesions débridement | 29874 | 0 | 15 | 19 |
Arthroscopic synovectomy | 29875 | 0 | 0 | 0 |
Major arthroscopic synovectomy | 29876 | 0 | 20 | 38 |
Knee arthroscopic chondroplasty | 29877 | 22 | 59 | 93 |
Arthroscopic lysis of adhesions | 29884 | 0 | 0 | 0 |
Patellar arthroplasty | 27438 | 0 | 0 | 0 |
Medial or lateral knee arthroplasty | 27446 | 0 | 0 | 0 |
Medial and lateral knee arthroplasty | 27447 | 0 | 0 | 22 |
Total | 22 | 94 | 172 | |
Return to OR | 1.44% | 6.14% | 11.23% | |
Abbreviations: CPT, Current Procedural Terminology; OCA, osteochondral allograft; OR, operating room.
Continue to: Discussion...
DISCUSSION
The principle findings of this study demonstrate that there is an overall reoperation rate of 14.90% at 2 years following cartilage repair/restoration surgery, with the highest reoperation rates following MFX at 90 days, and ACI at both 1 year and 2 years following the index procedure. Also, patients undergoing index MFX as the index procedure have the highest risk for conversion to arthroplasty, reoperation rates for all cartilage surgeries increase over time, and arthroscopic chondroplasty is the most frequent procedure performed at the time of reoperation.
The management of symptomatic articular cartilage knee pathology is extremely challenging. With improvements in surgical technique, instrumentation, and clinical decision-making, indications are constantly evolving. Techniques that may work for “small” defects, though there is some debate as to what constitutes a “small” defect, are not necessarily going to be successful for larger defects, and this certainly varies depending on where the defect is located within the knee joint (distal femur vs patella vs trochlea, etc.). Recently, in a 2015 analysis of 3 level I or II studies, Miller and colleagues7 demonstrated both MFX and OATS to be viable, cost-effective, first-line treatment options for articular cartilage injuries, with similar clinical outcomes at 8.7 years. The authors noted cumulative reoperation rates of 29% among patients undergoing MFX compared to 13% among patients undergoing OATS. While ACI and OCA procedures were not included in their study, the reported reoperation rates of 29% following MFX and 13% following OATS at nearly 10 years suggest a possible increased need for reoperation following MFX over time (approximately 15% at 2 years in our study) and a stable rate of reoperation following OATS (approximately 11% at 2 years in our study). This finding is significant, as one of the goals with these procedures is to deliver effective, long-lasting pain relief and restoration of function. Interestingly, in this study, restorative OATS and OCA techniques were performed with the greatest frequency in the 15-year-old to 19-year-old age group, but were not performed in patients older than 64 years. This may be explained by the higher prevalence of acute traumatic injuries and osteochondritis dissecans diagnoses in younger patients compared with older patients, as these diagnoses are more often indicated to undergo restorative procedures as opposed to marrow stimulation.
In a 2016 systematic review of 20 studies incorporating 1117 patients, Campbell and colleagues8 assessed return-to-play rates following MFX, ACI, OATS, and OCA. The authors noted that return to sport (RTS) rates were greatest following OATS (89%), followed by OCA (88%), ACI (84%), and MFX (75%). Positive prognostic factors for RTS included younger age, shorter duration of preoperative symptoms, no history of prior ipsilateral knee surgery, and smaller chondral defects. Reoperation rates between the 4 techniques were not statistically compared in their study. Interestingly, in 2013, Chalmers and colleagues9 conducted a separate systematic review of 20 studies comprising 1375 patients undergoing MFX, ACI, or OATS. In their study, the authors found significant advantages following ACI and OATS compared to MFX with respect to patient-reported outcome scores but noted significantly faster RTS rates with MFX. Reoperation rates were noted to be similar between the 3 procedures (25% for ACI, 21% for MFX, and 28% for OATS) at an average 3.7 years following the index procedure. When considering these 2 systematic reviews together, despite a faster RTS rate following MFX, a greater proportion of patients seem to be able to RTS over time following other procedures such as OATS, OCA, and ACI. Unfortunately, these reviews do not provide insight as to the role, if any, of reoperation on return to play rates nor on overall clinical outcome scores on patients undergoing articular cartilage surgery. However, this information is valuable when counseling athletes who are in season and would like to RTS as soon as possible as opposed to those who do not have tight time constraints for when they need to RTS.
Regardless of the cartilage technique chosen, the goals of surgery remain similar—to reduce pain and improve function. For athletes, the ultimate goal is to return to the same level of play that the athlete was able to achieve prior to injury. Certainly, the need for reoperation following a cartilage surgery has implications on pain, function, and ability to RTS. Our review of nearly 50,000 cartilage surgeries demonstrates that reoperations following cartilage repair surgery are not uncommon, with a rate of 14.90% at 2 years, and that while reoperation rates are the highest following ACI, the rate of conversion to knee arthroplasty is highest following MFX. Due to the limitations of the PearlDiver database, it is not possible to determine the clinical outcomes of patients undergoing reoperation following cartilage surgery, but certainly, given these data, reoperation is clearly not necessarily indicative of clinical failure. This is highlighted by the fact that the most common procedure performed at the time of reoperation is arthroscopic chondroplasty, which, despite being an additional surgical procedure, may be acceptable for patients who wish to RTS, particularly in the setting of an index ACI in which there may be graft hypertrophy. Ideally, additional studies incorporating a cost-effectiveness analysis of each of the procedures, incorporating reoperation rates as well as patient-reported clinical outcomes, would be helpful to truly determine the patient and societal implications of reoperation following cartilage repair/restoration.
Many of the advantages and disadvantages of the described cartilage repair/restoration procedures have been well described.10-17 Microfracture is the most commonly utilized first-line repair/restoration option for small articular cartilage lesions, mainly due to its low cost, low morbidity, and relatively low level of difficulty.18 Despite these advantages, MFX is not without limitations, and the need for revision cartilage restoration and/or conversion to arthroplasty is concerning. In 2013, Salzmann and colleagues19 evaluated a cohort of 454 patients undergoing MFX for a symptomatic knee defect and noted a reoperation rate of 26.9% (n = 123) within 2 years of the index surgery, with risk factors for reoperation noted to include an increased number of pre-MFX ipsilateral knee surgeries, patellofemoral lesions, smoking, and lower preoperative numeric analog scale scores. The definition of reoperation in their study is unfortunately not described, and thus the extent of reoperation (arthroscopy to arthroplasty) is unclear. In a 2009 systematic review of 3122 patients (28 studies) undergoing MFX conducted by Mithoefer and colleagues,20 revision rates were noted to range from 2% to 31% depending on the study analyzed, with increasing revision rates after 2 years. Unfortunately, the heterogeneity of the included studies makes it difficult to determine which patients tend to fail over time.
Continue to: OATS...
OATS is a promising cartilage restoration technique indicated for treatment of patients with large, uncontained chondral lesions, and/or lesions with both bone and cartilage loss.1 OCA is similar to OATS but uses allograft tissue instead of autograft tissue and is typically considered a viable treatment option in larger lesions (>2 cm2).21 Cell-based ACI therapy has evolved substantially over the past decade and is now available as a third-generation model utilizing biodegradable 3-dimensional scaffolds seeded with chondrocytes. Reoperation rates following ACI can often be higher than those following other cartilage treatments, particularly given the known complication of graft hypertrophy and/or delamination. Harris and colleagues22 conducted a systematic review of 5276 subjects undergoing ACI (all generations), noting an overall reoperation rate of 33%, but a failure rate of 5.8% at an average of 22 months following ACI. Risk factors for reoperation included periosteal-based ACI as well as open (vs arthroscopic) ACI. In this study, we found a modestly lower return to OR rate of 29.69% at 2 years.
When the outcomes of patients undergoing OATS or OCA are compared to those of patients undergoing MFX or ACI, it can be difficult to interpret the results, as the indications for performing these procedures tend to be very different. Further, the reasons for reoperation, as well as the procedures performed at the time of reoperation, are often poorly described, making it difficult to truly quantify the risk of reoperation and the implications of reoperation for patients undergoing any of these index cartilage procedures.
Overall, in this database, the return to the OR rate approaches 15% at 2 years following cartilage surgery, with cell-based therapy demonstrating higher reoperation rates at 2 years, without the risk of conversion to arthroplasty. Reoperation rates appear to stabilize at 1 year following surgery and consist mostly of minor arthroscopic procedures. These findings can help surgeons counsel patients as to the rate and type of reoperations that can be expected following cartilage surgery. Additional research incorporating patient-reported outcomes and patient-specific risk factors are needed to complement these data as to the impact of reoperations on overall clinical outcomes. Further, studies incorporating 90-day, 1-year, and 2-year costs associated with cartilage surgery will help to determine which index procedure is the most cost effective over the short- and long-term.
LIMITATIONS
This study is not without limitations. The PearlDiver database is reliant upon accurate CPT and ICD-9 coding, which creates a potential for a reporting bias. The overall reliability of the analyses is dependent on the quality of the available data, which, as noted in previous PearlDiver studies,18,23-28 may include inaccurate billing codes, miscoding, and/or non-coding by physicians as potential sources of error. At the time of this study, the PearlDiver database did not provide consistent data points on laterality, and thus it is possible that the reported rates of reoperation overestimate the true reoperation rate following a given procedure. Fortunately, the reoperation rates for each procedure analyzed in this database study are consistent with those previously presented in the literature. In addition, it is not uncommon for patients receiving one of these procedures to have previously been treated with one of the others. Due to the inherent limitations of the PearlDiver database, this study did not investigate concomitant procedures performed along with the index procedure, nor did it investigate confounding factors such as comorbidities. The PearlDiver database does not provide data on defect size, location within the knee, concomitant pathologies (eg, meniscus tear), prior surgeries, or patient comorbidities, and while important, these factors cannot be accounted for in our analysis. The inability to account for these important factors, particularly concomitant diagnoses, procedures, and lesion size/location, represents an important limitation of this study, as this is a source of selection bias and may influence the need for reoperation in a given patient. Despite these limitations, the results of this study are supported by previous and current literature. In addition, the PearlDiver database, as a HIPAA-compliant database, does not report exact numbers when the value of the outcome of interest is between 0 and 10, which prohibits analysis of any cartilage procedure performed in a cohort of patients greater than 1 and less than 11. Finally, while not necessarily a limitation, it should be noted that CPT 29879 is not specific for microfracture, as the code also includes abrasion arthroplasty and drilling. Due to the limitations of the methodology of searching the database for this code, it is unclear as to how many patients underwent actual microfracture vs abrasion arthroplasty.
CONCLUSION
Within a large US commercial insurance database from 2007 to 2011, reparative procedures were favored for chondral injuries, but yielded an increased risk for conversion to arthroplasty. There was no difference between failure/revision rates among the restorative approaches, yet cell-based approaches yielded a significantly increased risk for a return to the OR.
- Farr J, Cole B, Dhawan A, Kercher J, Sherman S. Clinical cartilage restoration: evolution and overview. Clin Orthop Relat Res. 2011;469(10):2696-2705. doi:10.1007/s11999-010-1764-z.
- Alford JW, Cole BJ. Cartilage restoration, part 1: basic science, historical perspective, patient evaluation, and treatment options. Am J Sports Med. 2005;33(2):295-306. doi:10.1177/03635465004273510.
- Alford JW, Cole BJ. Cartilage restoration, part 2: techniques, outcomes, and future directions. Am J Sports Med. 2005;33(3):443-460. doi:10.1177/0363546505274578.
- Gudas R, Gudaitė A, Pocius A, et al. Ten-year follow-up of a prospective, randomized clinical study of mosaic osteochondral autologous transplantation versus microfracture for the treatment of osteochondral defects in the knee joint of athletes. Am J Sports Med. 2012;40(11):2499-2508. doi:10.1177/0363546512458763.
- Saris DBF, Vanlauwe J, Victor J, et al. Treatment of symptomatic cartilage defects of the knee: characterized chondrocyte implantation results in better clinical outcome at 36 months in a randomized trial compared to microfracture. Am J Sports Med. 2009;37(suppl 1):10-19. doi:10.1177/0363546509350694.
- McCormick F, Harris JD, Abrams GD, et al. Survival and reoperation rates after meniscal allograft transplantation: analysis of failures for 172 consecutive transplants at a minimum 2-year follow-up. Am J Sports Med. 2014;42(4):892-897. doi:10.1177/0363546513520115.
- Miller DJ, Smith MV, Matava MJ, Wright RW, Brophy RH. Microfracture and osteochondral autograft transplantation are cost-effective treatments for articular cartilage lesions of the distal femur. Am J Sports Med. 2015;43(9):2175-2181. doi:10.1177/0363546515591261.
- Campbell AB, Pineda M, Harris JD, Flanigan DC. Return to sport after articular cartilage repair in athletes' knees: a systematic review. Arthroscopy. 2016;32(4):651-668.
- Chalmers PN, Vigneswaran H, Harris JD, Cole BJ. Activity-related outcomes of articular cartilage surgery: a systematic review. Cartilage. 2013;4(3):193-203.
- Bentley G, Biant LC, Vijayan S, Macmull S, Skinner JA, Carrington RW. Minimum ten-year results of a prospective randomised study of autologous chondrocyte implantation versus mosaicplasty for symptomatic articular cartilage lesions of the knee. JBone Joint Surg Br. 2012;94(4):504-509. doi:10.1177/1947603513481603.
- Beris AE, Lykissas MG, Kostas-Agnantis I, Manoudis GN. Treatment of full-thickness chondral defects of the knee with autologous chondrocyte implantation: a functional evaluation with long-term follow-up. Am J Sports Med. 2012;40(3):562-567.
- Chahal J, Gross AE, Gross C, et al. Outcomes of osteochondral allograft transplantation in the knee. Arthroscopy. 2013;29(3):575-588. doi:10.1177/0363546511428778.
- Emmerson BC, Görtz S, Jamali AA, Chung C, Amiel D, Bugbee WD. Fresh osteochondral allografting in the treatment of osteochondritis dissecans of the femoral condyle. Am J Sports Med. 2007;35(6):907-914. doi:10.1177/0363546507299932.
- Gudas R, Stankevičius E, Monastyreckienė E, Pranys D, Kalesinskas R. Osteochondral autologous transplantation versus microfracture for the treatment of articular cartilage defects in the knee joint in athletes. Knee Surg Sports Traumatol Arthrosc. 2006;14(9):834-842. doi:10.1007/s00167-006-0067-0.
- Lynch TS, Patel RM, Benedick A, Amin NH, Jones MH, Miniaci A. Systematic review of autogenous osteochondral transplant outcomes. Arthroscopy. 2015;31(4):746-754. doi:10.1016/j.arthro.2014.11.018.
- Niemeyer P, Porichis S, Steinwachs M, et al. Long-term outcomes after first-generation autologous chondrocyte implantation for cartilage defects of the knee. Am J Sports Med. 2014;42(1):150-157. doi:10.1177/0363546513506593.
- Ulstein S, Årøen A, Røtterud J, Løken S, Engebretsen L, Heir S. Microfracture technique versus osteochondral autologous transplantation mosaicplasty in patients with articular chondral lesions of the knee: a prospective randomized trial with long-term follow-up. Knee Surg Sports Traumatol Arthrosc. 2014;22(6):1207-1215. doi:10.1007/s00167-014-2843-6.
- Montgomery S, Foster B, Ngo S, et al. Trends in the surgical treatment of articular cartilage defects of the knee in the United States. Knee Surg Sports Traumatol Arthrosc. 2014;22(9):2070-2075. doi:10.1007/s00167-013-2614-9.
- Salzmann GM, Sah B, Südkamp NP, Niemeyer P. Reoperative characteristics after microfracture of knee cartilage lesions in 454 patients. Knee Surg Sports Traumatol Arthrosc. 2013;21(2):365-371. doi:10.1007/s00167-012-1973-y.
- Mithoefer K, McAdams T, Williams RJ, Kreuz PC, Mandelbaum BR. Clinical efficacy of the microfracture technique for articular cartilage repair in the knee: an evidence-based systematic analysis. Am J Sports Med. 2009;37(10):2053-2063. doi:10.1177/0363546508328414.
- Wajsfisz A, Makridis KG, Djian P. Arthroscopic retrograde osteochondral autograft transplantation for cartilage lesions of the tibial plateau: a prospective study. Am J Sports Med. 2013;41(2):411-415. doi:10.1177/0363546512469091.
- Harris JD, Siston RA, Brophy RH, Lattermann C, Carey JL, Flanigan DC. Failures, re-operations, and complications after autologous chondrocyte implantation–a systematic review. Osteoarthritis Cartilage. 2011;19(7):779-791. doi:10.1016/j.joca.2011.02.010.
- Abrams GD, Frank RM, Gupta AK, Harris JD, McCormick FM, Cole BJ. Trends in meniscus repair and meniscectomy in the United States, 2005-2011. Am J Sports Med. 2013;41(10):2333-2339. doi:10.1177/0363546513495641.
- Montgomery SR, Ngo SS, Hobson T, et al. Trends and demographics in hip arthroscopy in the United States. Arthroscopy. 2013;29(4):661-665. doi:10.1016/j.arthro.2012.11.005.
- Yeranosian MG, Arshi A, Terrell RD, Wang JC, McAllister DR, Petrigliano FA. Incidence of acute postoperative infections requiring reoperation after arthroscopic shoulder surgery. Am J Sports Med. 2014;42(2):437-441. doi:10.1177/0363546513510686.
- Zhang AL, Montgomery SR, Ngo SS, Hame SL, Wang JC, Gamradt SC. Arthroscopic versus open shoulder stabilization: current practice patterns in the United States. Arthroscopy. 2014;30(4):436-443. doi:10.1016/j.arthro.2013.12.013.
- Werner BC, Carr JB, Wiggins JC, Gwathmey FW, Browne JA. Manipulation under anesthesia after total knee arthroplasty is associated with an increased incidence of subsequent revision surgery. J Arthroplasty. 2015;30(suppl 9):72-75. doi:10.1016/j.arth.2015.01.061.
- Carr JB 2nd, Werner BC, Browne JA. Trends and outcomes in the treatment of failed septic total knee arthroplasty: comparing arthrodesis and above-knee amputation. J Arthroplasty. 2016;31(7):1574-1577. doi:10.1016/j.arth.2016.01.010.
ABSTRACT
The purpose of this study is to describe the rate of return to the operating room (OR) following microfracture (MFX), autologous chondrocyte implantation (ACI), osteochondral autograft transplantation (OATS), and osteochondral allograft (OCA) procedures at 90 days, 1 year, and 2 years. Current Procedural Terminology codes for all patients undergoing MFX, ACI, OATS, and OCA were used to search a prospectively collected, commercially available private payer insurance company database from 2007 to 2011. Within 90 days, 1 year, and 2 years after surgery, the database was searched for the occurrence of these same patients undergoing knee diagnostic arthroscopy with biopsy, lysis of adhesions, synovectomy, arthroscopy for infection or lavage, arthroscopy for removal of loose bodies, chondroplasty, MFX, ACI, OATS, OCA, and/or knee arthroplasty. Descriptive statistical analysis and contingency table analysis were performed. A total of 47,207 cartilage procedures were performed from 2007 to 2011, including 43,576 MFX, 640 ACI, 386 open OATS, 997 arthroscopic OATS, 714 open OCA, and 894 arthroscopic OCA procedures. The weighted average reoperation rates for all procedures were 5.87% at 90 days, 11.94% at 1 year, and 14.90% at 2 years following the index cartilage surgery. At 2 years, patients who underwent MFX, ACI, OATS, OCA had reoperation rates of 14.65%, 29.69%, 8.82%, and 12.22%, respectively. There was a statistically significantly increased risk for ACI return to OR within all intervals (P < .0001); however, MFX had a greater risk factor (P < .0001) for conversion to arthroplasty. There was no difference in failure/revision rates between the restorative treatment options. With a large US commercial insurance database from 2007 to 2011, reparative procedures were favored for chondral injuries, but yielded an increased risk for conversion to arthroplasty. There was no difference in failure/revision rates between the restorative approaches, yet cell-based approaches yielded a significantly increased risk for a return to the OR.
Continue to: Symptomatic, full-thickness articular cartilage
Symptomatic, full-thickness articular cartilage defects in the knee are difficult to manage, particularly in the young, athletic patient population. Fortunately, a variety of cartilage repair (direct repair of the cartilage or those procedures which attempt to generate fibrocartilage) and restoration (those aimed at restoring hyaline cartilage) procedures are available, with encouraging short- and long-term clinical outcomes. After failure of nonoperative management, several surgical options are available for treating symptomatic focal chondral defects, including microfracture (MFX), autologous chondrocyte implantation (ACI), osteochondral autograft transplantation (OATS), and open and arthroscopic osteochondral allograft (OCA) transplantation procedures.1,2 When appropriately indicated, each of these techniques has demonstrated good to excellent clinical outcomes with respect to reducing pain and improving function.3-5
While major complications following cartilage surgery are uncommon, the need for reoperation following an index articular cartilage operation is poorly understood. Recently, McCormick and colleagues6 found that reoperation within the first 2 years following meniscus allograft transplantation (MAT) is associated with an increased likelihood of revision MAT or future arthroplasty. Given the association between early reoperation following meniscus restoration surgery and subsequent failure, an improved understanding of the epidemiology and implications of reoperations following cartilage restoration surgery is warranted. Further, in deciding which treatment option is best suited to a particular patient, the rate of return to the operating room (OR) should be taken into consideration, as this could potentially influence surgical decision-making as to which procedure to perform, especially in value-based care decision-making environments.
The purpose of this study is to describe the rate of return to the OR for knee procedures following cartilage restoration at intervals of 90 days, 1 year, and 2 years across a large-scale US patient database. The authors hypothesize that the rate of return to the OR following knee cartilage repair or restoration procedures will be under 20% during the first post-operative year, with increasing reoperation rates over time. A secondary hypothesis is that there will be no difference in reoperation rates according to sex, but that younger patients (those younger than 40 years) will have higher reoperation rates than older patients.
METHODS
We performed a retrospective analysis of a prospectively collected, large-scale, and commercially available private payer insurance company database (PearlDiver) from 2007 to 2011. The PearlDiver database is a Health Insurance Portability and Accountability Act (HIPAA) compliant, publicly available national database consisting of a collection of private payer records, with United Health Group representing the contributing health plan. The database has more than 30 million patient records and contains Current Procedural Terminology (CPT) and International Classification of Diseases, Ninth Revision (ICD-9) codes related to orthopedic procedures. From 2007 to 2011, the private payer database captured between 5.9 million and 6.2 million patients per year.
Our search was based on the CPT codes for MFX (29879), ACI (27412), OATS (29866, 29867), and OCA (27415, 27416). Return to the OR for revision surgery for the above-mentioned procedures was classified as patients with a diagnosis of diagnostic arthroscopy with biopsy (CPT 29870), lysis of adhesions (CPT 29884), synovectomy (29875, 29876), arthroscopy for infection or lavage (CPT 29871), arthroscopy for removal of loose bodies (29874), chondroplasty (29877), unicompartmental knee arthroplasty (27446), total knee arthroplasty (27447), and/or patellar arthroplasty (27438). Patient records were followed for reoperations occurring within 90 days, 1 year, and 2 years after the index cartilage procedure. All data were compared based on patient age and sex.
Table 1. Breakdown of MFX, ACI, OATS, and OCA Procedures by Sex | ||||||
MFX | ACI | Open OATS | Arthroscopic OATS | Open OCA | Arthroscopic OCA | |
Females | 20,589 | 276 | 167 | 401 | 275 | 350 |
Males | 22,987 | 364 | 219 | 596 | 439 | 544 |
Total | 43,576 | 640 | 386 | 997 | 714 | 894 |
Abbreviations: ACI, autologous chondrocyte implantation; MFX, microfracture; OCA, osteochondral allograft; OATS, osteochondral autograft transplantation.
Continue to: Statistical analysis...
STATISTICAL ANALYSIS
Statistical analysis of this study was primarily descriptive to demonstrate the incidence for each code at each time interval. One-way analysis of variance, Chi-square analysis, and contingency tables were used to compare the incidence of each type of procedure throughout the various time intervals. A P-value of < 0.05 was considered statistically significant. Statistical analysis was performed using SPSS v.20 (International Business Machines).
RESULTS
A total of 47,207 cartilage procedures were performed from 2007 to 2011, including 43,576 MFX (92.3%) 640 ACI (1.4%), 386 open OATS (0.82%), 997 arthroscopic OATS (2.11%), 714 open OCA (1.51%), and 894 arthroscopic OCA (1.89%) procedures. A summary of the procedures performed, broken down by age and sex, is provided in Tables 1 and 2. A total of 25,149 male patients (53.3%) underwent surgical procedures compared to 22,058 female patients (46.7%). For each category of procedure (MFX, ACI, OATS, OCA), there was a significantly higher proportion of males than females undergoing surgery (P < .0001 for all). Surgical treatment with MFX was consistently the most frequently performed surgery across all age groups (92.31%), while cell-based therapy with ACI was the least frequently performed procedure across all age ranges (1.36%). Restorative OATS and OCA techniques were performed with the greatest frequency in the 15-year-old to 19-year-old age group, but were not utilized in patients over 64 years of age (Table 2).
Table 2. Breakdown of MFX, ACI, OATS, and OCA Procedures by Age | ||||
Age (y) | MFX | ACI | OATS | OCA |
10 to 14 | 572 | 22 | 74 | 47 |
15 to 19 | 1984 | 83 | 254 | 235 |
20 to 24 | 1468 | 54 | 140 | 144 |
25 to 29 | 1787 | 74 | 152 | 176 |
30 to 34 | 2824 | 114 | 152 | 204 |
35 to 39 | 4237 | 96 | 153 | 210 |
40 to 44 | 5441 | 103 | 166 | 217 |
45 to 49 | 7126 | 57 | 149 | 180 |
50 to 54 | 7004 | 25 | 83 | 140 |
55 to 59 | 6410 | 12 | 40 | 40 |
60 to 64 | 4409 | 0 | 20 | 15 |
65 to 69 | 269 | 0 | 0 | 0 |
70 to 74 | 45 | 0 | 0 | 0 |
Total | 43,576 | 640 | 1383 | 1608 |
Abbreviations: ACI, autologous chondrocyte implantation; MFX, microfracture; OCA, osteochondral allograft; OATS, osteochondral autograft transplantation.
A summary of all reoperation data is provided in Tables 3 to 7 and Figures 1 and 2. The weighted average reoperation rates for all procedures were 5.87% at 90 days, 11.94% at 1 year, and 14.90% at 2 years following the index cartilage surgery. Patients who underwent MFX had reoperation rates of 6.05% at 90 days, 11.80% at 1 year, and 14.65% at 2 years. Patients who underwent ACI had reoperation rates of 4.53% at 90 days, 23.28% at 1 year, and 29.69% at 2 years. Patients who had open and arthroscopic OATS had reoperation rates of 3.122% and 5.12% at 90 days, 6.74% and 8.53% at 1 year, and 7.51% and 10.13% at 2 years, respectively. Patients who underwent open and arthroscopic OCA had reoperation rates of 2.52% and 3.91% at 90 days, 7.14% and 6.60% at 1 year, and 13.59% and 10.85% at 2 years (Table 3). There was a statistically significantly increased risk for reoperation following ACI within all intervals compared to all other surgical techniques (P < .0001); however, MFX had a greater risk factor (P < .0001) for conversion to arthroplasty at 6.70%. There was no significant difference between failure rates (revision OATS/OCA or conversion to arthroplasty) between the restorative treatment options, with 14 failures for OATS (9.52% of reoperations at 2 years) compared to 22 failures for OCA (12.7% of reoperations at 2 years, P = .358). Among the entire cohort of cartilage surgery patients, arthroscopic chondroplasty was the most frequent procedure performed at the time of reoperation at all time points assessed, notably accounting for 33.08% of reoperations 2 years following microfracture, 51.58% of reoperations at 2 years following ACI, 53.06% of reoperations at 2 years following OATS, and 54.07% of reoperations at 2 years following OCA (Figure 3, Tables 4–7).
Table 3. Comparison of Return to OR Following MFX, ACI, OCA, and OATS | |||||||
Procedure | Total No. of Cases in Study Period | No. of Reoperations at 90 Days | Return to OR Rate at 90 Days | No. of Reoperations at 1 Year | Return to OR Rate at 1 Year | No. of Reoperations at 2 Years | Return to OR Rate at 2 Years |
MFX | 43,576 | 2636 | 6.05% | 5142 | 11.80% | 6385 | 14.65% |
ACI | 640 | 29 | 4.53% | 149 | 23.28% | 190 | 29.69% |
Open OATS | 386 | 12 | 3.12% | 26 | 6.74% | 29 | 7.51% |
Arthroscopic OATS | 997 | 51 | 5.12% | 85 | 8.53% | 101 | 10.13% |
Open OCA | 714 | 18 | 2.52% | 51 | 7.14% | 97 | 13.59% |
Arthroscopic OCA | 894 | 161 | 3.91% | 59 | 6.60% | 97 | 10.85% |
Weighted average for all procedures |
| 5.87% |
| 11.94% |
| 14.90% | |
Abbreviations: ACI, autologous chondrocyte implantation; MFX, microfracture; OCA, osteochondral allograft; OATS, osteochondral autograft transplantation; OR, operating room.
Table 4. Rate of Return to OR Following MFX (n = 43,574) | ||||
Procedure | CPT Code | 90 Days | 1 Year | 2 Years |
Knee arthroscopy | 29870 | 54 | 122 | 162 |
Knee arthroscopic drainage and lavage | 29871 | 84 | 102 | 104 |
Arthroscopic adhesions débridement | 29874 | 300 | 468 | 549 |
Arthroscopic synovectomy | 29875 | 324 | 528 | 611 |
Major arthroscopic synovectomy | 29876 | 557 | 926 | 1087 |
Knee arthroscopic chondroplasty | 29877 | 1063 | 1722 | 2112 |
Arthroscopic lysis of adhesions | 29884 | 61 | 129 | 171 |
Patellar arthroplasty | 27438 | 0 | 38 | 49 |
Medial or lateral knee arthroplasty | 27446 | 51 | 242 | 328 |
Medial and lateral knee arthroplasty | 27447 | 142 | 865 | 1212 |
Total | 2636 | 5142 | 6385 | |
Return to OR | 6.05% | 11.80% | 14.65% | |
Abbreviations: CPT, Current Procedural Terminology; MFX, microfracture; OR, operating room.
Table 5. Rate of Return to OR Following ACI (n = 640) | ||||
Procedure | CPT Code | 90 Daysa | 1 Yeara | 2 Yearsa |
Revision ACI | 27412 | 29 | 33 | 35 |
Knee arthroscopy | 29870 | -1 | -1 | -1 |
Knee arthroscopic drainage and lavage | 29871 | -1 | -1 | -1 |
Arthroscopic adhesions débridement | 29874 | 0 | -1 | -1 |
Arthroscopic synovectomy | 29875 | -1 | -1 | -1 |
Major arthroscopic synovectomy | 29876 | -1 | 12 | 20 |
Knee arthroscopic chondroplasty | 29877 | -1 | 71 | 98 |
Arthroscopic lysis of adhesions | 29884 | -1 | 33 | 37 |
Patellar arthroplasty | 27438 | 0 | 0 | 0 |
Medial or lateral knee arthroplasty | 27446 | 0 | -1 | -1 |
Medial and lateral knee arthroplasty | 27447 | 0 | -1 | -1 |
Total | 29 | 149 | 190 | |
Return to OR | 4.53% | 23.28% | 29.69% | |
aA -1 denotes No. <11 within the PearlDiver database, and exact numbers are not reported due to patient privacy considerations.
Abbreviations: ACI, autologous chondrocyte implantation; CPT, Current Procedural Terminology; OR, operating room.
Table 6. Rate of Return to OR Following OATS (n = 1320) | ||||
Procedure | CPT Code | 90 Days | 1 Year | 2 Years |
Knee arthroscopy | 29870 | 0 | 0 | 0 |
Knee arthroscopic drainage and lavage | 29871 | 0 | 0 | 0 |
Arthroscopic adhesions débridement | 29874 | 0 | 12 | 13 |
Arthroscopic synovectomy | 29875 | 0 | 0 | 14 |
Major arthroscopic synovectomy | 29876 | 16 | 25 | 28 |
Knee arthroscopic chondroplasty | 29877 | 17 | 58 | 78 |
Arthroscopic lysis of adhesions | 29884 | 0 | 0 | 0 |
Patellar arthroplasty | 27438 | 0 | 0 | 0 |
Medial or lateral knee arthroplasty | 27446 | 0 | 0 | 0 |
Medial and lateral knee arthroplasty | 27447 | 0 | 0 | 14 |
Total | 33 | 95 | 147 | |
Return to OR | 2.50% | 7.20% | 11.14% | |
Abbreviations: CPT, Current Procedural Terminology; OATS, osteochondral autograft transplantation; OR, operating room.
Table 7. Rate of Return to OR Following OCA Transplantation (n = 1531) | ||||
Procedure | CPT Code | 90 Days | 1 Year | 2 Year |
Knee arthroscopy | 29870 | 0 | 0 | 0 |
Knee arthroscopic drainage and lavage | 29871 | 0 | 0 | 0 |
Arthroscopic adhesions débridement | 29874 | 0 | 15 | 19 |
Arthroscopic synovectomy | 29875 | 0 | 0 | 0 |
Major arthroscopic synovectomy | 29876 | 0 | 20 | 38 |
Knee arthroscopic chondroplasty | 29877 | 22 | 59 | 93 |
Arthroscopic lysis of adhesions | 29884 | 0 | 0 | 0 |
Patellar arthroplasty | 27438 | 0 | 0 | 0 |
Medial or lateral knee arthroplasty | 27446 | 0 | 0 | 0 |
Medial and lateral knee arthroplasty | 27447 | 0 | 0 | 22 |
Total | 22 | 94 | 172 | |
Return to OR | 1.44% | 6.14% | 11.23% | |
Abbreviations: CPT, Current Procedural Terminology; OCA, osteochondral allograft; OR, operating room.
Continue to: Discussion...
DISCUSSION
The principle findings of this study demonstrate that there is an overall reoperation rate of 14.90% at 2 years following cartilage repair/restoration surgery, with the highest reoperation rates following MFX at 90 days, and ACI at both 1 year and 2 years following the index procedure. Also, patients undergoing index MFX as the index procedure have the highest risk for conversion to arthroplasty, reoperation rates for all cartilage surgeries increase over time, and arthroscopic chondroplasty is the most frequent procedure performed at the time of reoperation.
The management of symptomatic articular cartilage knee pathology is extremely challenging. With improvements in surgical technique, instrumentation, and clinical decision-making, indications are constantly evolving. Techniques that may work for “small” defects, though there is some debate as to what constitutes a “small” defect, are not necessarily going to be successful for larger defects, and this certainly varies depending on where the defect is located within the knee joint (distal femur vs patella vs trochlea, etc.). Recently, in a 2015 analysis of 3 level I or II studies, Miller and colleagues7 demonstrated both MFX and OATS to be viable, cost-effective, first-line treatment options for articular cartilage injuries, with similar clinical outcomes at 8.7 years. The authors noted cumulative reoperation rates of 29% among patients undergoing MFX compared to 13% among patients undergoing OATS. While ACI and OCA procedures were not included in their study, the reported reoperation rates of 29% following MFX and 13% following OATS at nearly 10 years suggest a possible increased need for reoperation following MFX over time (approximately 15% at 2 years in our study) and a stable rate of reoperation following OATS (approximately 11% at 2 years in our study). This finding is significant, as one of the goals with these procedures is to deliver effective, long-lasting pain relief and restoration of function. Interestingly, in this study, restorative OATS and OCA techniques were performed with the greatest frequency in the 15-year-old to 19-year-old age group, but were not performed in patients older than 64 years. This may be explained by the higher prevalence of acute traumatic injuries and osteochondritis dissecans diagnoses in younger patients compared with older patients, as these diagnoses are more often indicated to undergo restorative procedures as opposed to marrow stimulation.
In a 2016 systematic review of 20 studies incorporating 1117 patients, Campbell and colleagues8 assessed return-to-play rates following MFX, ACI, OATS, and OCA. The authors noted that return to sport (RTS) rates were greatest following OATS (89%), followed by OCA (88%), ACI (84%), and MFX (75%). Positive prognostic factors for RTS included younger age, shorter duration of preoperative symptoms, no history of prior ipsilateral knee surgery, and smaller chondral defects. Reoperation rates between the 4 techniques were not statistically compared in their study. Interestingly, in 2013, Chalmers and colleagues9 conducted a separate systematic review of 20 studies comprising 1375 patients undergoing MFX, ACI, or OATS. In their study, the authors found significant advantages following ACI and OATS compared to MFX with respect to patient-reported outcome scores but noted significantly faster RTS rates with MFX. Reoperation rates were noted to be similar between the 3 procedures (25% for ACI, 21% for MFX, and 28% for OATS) at an average 3.7 years following the index procedure. When considering these 2 systematic reviews together, despite a faster RTS rate following MFX, a greater proportion of patients seem to be able to RTS over time following other procedures such as OATS, OCA, and ACI. Unfortunately, these reviews do not provide insight as to the role, if any, of reoperation on return to play rates nor on overall clinical outcome scores on patients undergoing articular cartilage surgery. However, this information is valuable when counseling athletes who are in season and would like to RTS as soon as possible as opposed to those who do not have tight time constraints for when they need to RTS.
Regardless of the cartilage technique chosen, the goals of surgery remain similar—to reduce pain and improve function. For athletes, the ultimate goal is to return to the same level of play that the athlete was able to achieve prior to injury. Certainly, the need for reoperation following a cartilage surgery has implications on pain, function, and ability to RTS. Our review of nearly 50,000 cartilage surgeries demonstrates that reoperations following cartilage repair surgery are not uncommon, with a rate of 14.90% at 2 years, and that while reoperation rates are the highest following ACI, the rate of conversion to knee arthroplasty is highest following MFX. Due to the limitations of the PearlDiver database, it is not possible to determine the clinical outcomes of patients undergoing reoperation following cartilage surgery, but certainly, given these data, reoperation is clearly not necessarily indicative of clinical failure. This is highlighted by the fact that the most common procedure performed at the time of reoperation is arthroscopic chondroplasty, which, despite being an additional surgical procedure, may be acceptable for patients who wish to RTS, particularly in the setting of an index ACI in which there may be graft hypertrophy. Ideally, additional studies incorporating a cost-effectiveness analysis of each of the procedures, incorporating reoperation rates as well as patient-reported clinical outcomes, would be helpful to truly determine the patient and societal implications of reoperation following cartilage repair/restoration.
Many of the advantages and disadvantages of the described cartilage repair/restoration procedures have been well described.10-17 Microfracture is the most commonly utilized first-line repair/restoration option for small articular cartilage lesions, mainly due to its low cost, low morbidity, and relatively low level of difficulty.18 Despite these advantages, MFX is not without limitations, and the need for revision cartilage restoration and/or conversion to arthroplasty is concerning. In 2013, Salzmann and colleagues19 evaluated a cohort of 454 patients undergoing MFX for a symptomatic knee defect and noted a reoperation rate of 26.9% (n = 123) within 2 years of the index surgery, with risk factors for reoperation noted to include an increased number of pre-MFX ipsilateral knee surgeries, patellofemoral lesions, smoking, and lower preoperative numeric analog scale scores. The definition of reoperation in their study is unfortunately not described, and thus the extent of reoperation (arthroscopy to arthroplasty) is unclear. In a 2009 systematic review of 3122 patients (28 studies) undergoing MFX conducted by Mithoefer and colleagues,20 revision rates were noted to range from 2% to 31% depending on the study analyzed, with increasing revision rates after 2 years. Unfortunately, the heterogeneity of the included studies makes it difficult to determine which patients tend to fail over time.
Continue to: OATS...
OATS is a promising cartilage restoration technique indicated for treatment of patients with large, uncontained chondral lesions, and/or lesions with both bone and cartilage loss.1 OCA is similar to OATS but uses allograft tissue instead of autograft tissue and is typically considered a viable treatment option in larger lesions (>2 cm2).21 Cell-based ACI therapy has evolved substantially over the past decade and is now available as a third-generation model utilizing biodegradable 3-dimensional scaffolds seeded with chondrocytes. Reoperation rates following ACI can often be higher than those following other cartilage treatments, particularly given the known complication of graft hypertrophy and/or delamination. Harris and colleagues22 conducted a systematic review of 5276 subjects undergoing ACI (all generations), noting an overall reoperation rate of 33%, but a failure rate of 5.8% at an average of 22 months following ACI. Risk factors for reoperation included periosteal-based ACI as well as open (vs arthroscopic) ACI. In this study, we found a modestly lower return to OR rate of 29.69% at 2 years.
When the outcomes of patients undergoing OATS or OCA are compared to those of patients undergoing MFX or ACI, it can be difficult to interpret the results, as the indications for performing these procedures tend to be very different. Further, the reasons for reoperation, as well as the procedures performed at the time of reoperation, are often poorly described, making it difficult to truly quantify the risk of reoperation and the implications of reoperation for patients undergoing any of these index cartilage procedures.
Overall, in this database, the return to the OR rate approaches 15% at 2 years following cartilage surgery, with cell-based therapy demonstrating higher reoperation rates at 2 years, without the risk of conversion to arthroplasty. Reoperation rates appear to stabilize at 1 year following surgery and consist mostly of minor arthroscopic procedures. These findings can help surgeons counsel patients as to the rate and type of reoperations that can be expected following cartilage surgery. Additional research incorporating patient-reported outcomes and patient-specific risk factors are needed to complement these data as to the impact of reoperations on overall clinical outcomes. Further, studies incorporating 90-day, 1-year, and 2-year costs associated with cartilage surgery will help to determine which index procedure is the most cost effective over the short- and long-term.
LIMITATIONS
This study is not without limitations. The PearlDiver database is reliant upon accurate CPT and ICD-9 coding, which creates a potential for a reporting bias. The overall reliability of the analyses is dependent on the quality of the available data, which, as noted in previous PearlDiver studies,18,23-28 may include inaccurate billing codes, miscoding, and/or non-coding by physicians as potential sources of error. At the time of this study, the PearlDiver database did not provide consistent data points on laterality, and thus it is possible that the reported rates of reoperation overestimate the true reoperation rate following a given procedure. Fortunately, the reoperation rates for each procedure analyzed in this database study are consistent with those previously presented in the literature. In addition, it is not uncommon for patients receiving one of these procedures to have previously been treated with one of the others. Due to the inherent limitations of the PearlDiver database, this study did not investigate concomitant procedures performed along with the index procedure, nor did it investigate confounding factors such as comorbidities. The PearlDiver database does not provide data on defect size, location within the knee, concomitant pathologies (eg, meniscus tear), prior surgeries, or patient comorbidities, and while important, these factors cannot be accounted for in our analysis. The inability to account for these important factors, particularly concomitant diagnoses, procedures, and lesion size/location, represents an important limitation of this study, as this is a source of selection bias and may influence the need for reoperation in a given patient. Despite these limitations, the results of this study are supported by previous and current literature. In addition, the PearlDiver database, as a HIPAA-compliant database, does not report exact numbers when the value of the outcome of interest is between 0 and 10, which prohibits analysis of any cartilage procedure performed in a cohort of patients greater than 1 and less than 11. Finally, while not necessarily a limitation, it should be noted that CPT 29879 is not specific for microfracture, as the code also includes abrasion arthroplasty and drilling. Due to the limitations of the methodology of searching the database for this code, it is unclear as to how many patients underwent actual microfracture vs abrasion arthroplasty.
CONCLUSION
Within a large US commercial insurance database from 2007 to 2011, reparative procedures were favored for chondral injuries, but yielded an increased risk for conversion to arthroplasty. There was no difference between failure/revision rates among the restorative approaches, yet cell-based approaches yielded a significantly increased risk for a return to the OR.
- Farr J, Cole B, Dhawan A, Kercher J, Sherman S. Clinical cartilage restoration: evolution and overview. Clin Orthop Relat Res. 2011;469(10):2696-2705. doi:10.1007/s11999-010-1764-z.
- Alford JW, Cole BJ. Cartilage restoration, part 1: basic science, historical perspective, patient evaluation, and treatment options. Am J Sports Med. 2005;33(2):295-306. doi:10.1177/03635465004273510.
- Alford JW, Cole BJ. Cartilage restoration, part 2: techniques, outcomes, and future directions. Am J Sports Med. 2005;33(3):443-460. doi:10.1177/0363546505274578.
- Gudas R, Gudaitė A, Pocius A, et al. Ten-year follow-up of a prospective, randomized clinical study of mosaic osteochondral autologous transplantation versus microfracture for the treatment of osteochondral defects in the knee joint of athletes. Am J Sports Med. 2012;40(11):2499-2508. doi:10.1177/0363546512458763.
- Saris DBF, Vanlauwe J, Victor J, et al. Treatment of symptomatic cartilage defects of the knee: characterized chondrocyte implantation results in better clinical outcome at 36 months in a randomized trial compared to microfracture. Am J Sports Med. 2009;37(suppl 1):10-19. doi:10.1177/0363546509350694.
- McCormick F, Harris JD, Abrams GD, et al. Survival and reoperation rates after meniscal allograft transplantation: analysis of failures for 172 consecutive transplants at a minimum 2-year follow-up. Am J Sports Med. 2014;42(4):892-897. doi:10.1177/0363546513520115.
- Miller DJ, Smith MV, Matava MJ, Wright RW, Brophy RH. Microfracture and osteochondral autograft transplantation are cost-effective treatments for articular cartilage lesions of the distal femur. Am J Sports Med. 2015;43(9):2175-2181. doi:10.1177/0363546515591261.
- Campbell AB, Pineda M, Harris JD, Flanigan DC. Return to sport after articular cartilage repair in athletes' knees: a systematic review. Arthroscopy. 2016;32(4):651-668.
- Chalmers PN, Vigneswaran H, Harris JD, Cole BJ. Activity-related outcomes of articular cartilage surgery: a systematic review. Cartilage. 2013;4(3):193-203.
- Bentley G, Biant LC, Vijayan S, Macmull S, Skinner JA, Carrington RW. Minimum ten-year results of a prospective randomised study of autologous chondrocyte implantation versus mosaicplasty for symptomatic articular cartilage lesions of the knee. JBone Joint Surg Br. 2012;94(4):504-509. doi:10.1177/1947603513481603.
- Beris AE, Lykissas MG, Kostas-Agnantis I, Manoudis GN. Treatment of full-thickness chondral defects of the knee with autologous chondrocyte implantation: a functional evaluation with long-term follow-up. Am J Sports Med. 2012;40(3):562-567.
- Chahal J, Gross AE, Gross C, et al. Outcomes of osteochondral allograft transplantation in the knee. Arthroscopy. 2013;29(3):575-588. doi:10.1177/0363546511428778.
- Emmerson BC, Görtz S, Jamali AA, Chung C, Amiel D, Bugbee WD. Fresh osteochondral allografting in the treatment of osteochondritis dissecans of the femoral condyle. Am J Sports Med. 2007;35(6):907-914. doi:10.1177/0363546507299932.
- Gudas R, Stankevičius E, Monastyreckienė E, Pranys D, Kalesinskas R. Osteochondral autologous transplantation versus microfracture for the treatment of articular cartilage defects in the knee joint in athletes. Knee Surg Sports Traumatol Arthrosc. 2006;14(9):834-842. doi:10.1007/s00167-006-0067-0.
- Lynch TS, Patel RM, Benedick A, Amin NH, Jones MH, Miniaci A. Systematic review of autogenous osteochondral transplant outcomes. Arthroscopy. 2015;31(4):746-754. doi:10.1016/j.arthro.2014.11.018.
- Niemeyer P, Porichis S, Steinwachs M, et al. Long-term outcomes after first-generation autologous chondrocyte implantation for cartilage defects of the knee. Am J Sports Med. 2014;42(1):150-157. doi:10.1177/0363546513506593.
- Ulstein S, Årøen A, Røtterud J, Løken S, Engebretsen L, Heir S. Microfracture technique versus osteochondral autologous transplantation mosaicplasty in patients with articular chondral lesions of the knee: a prospective randomized trial with long-term follow-up. Knee Surg Sports Traumatol Arthrosc. 2014;22(6):1207-1215. doi:10.1007/s00167-014-2843-6.
- Montgomery S, Foster B, Ngo S, et al. Trends in the surgical treatment of articular cartilage defects of the knee in the United States. Knee Surg Sports Traumatol Arthrosc. 2014;22(9):2070-2075. doi:10.1007/s00167-013-2614-9.
- Salzmann GM, Sah B, Südkamp NP, Niemeyer P. Reoperative characteristics after microfracture of knee cartilage lesions in 454 patients. Knee Surg Sports Traumatol Arthrosc. 2013;21(2):365-371. doi:10.1007/s00167-012-1973-y.
- Mithoefer K, McAdams T, Williams RJ, Kreuz PC, Mandelbaum BR. Clinical efficacy of the microfracture technique for articular cartilage repair in the knee: an evidence-based systematic analysis. Am J Sports Med. 2009;37(10):2053-2063. doi:10.1177/0363546508328414.
- Wajsfisz A, Makridis KG, Djian P. Arthroscopic retrograde osteochondral autograft transplantation for cartilage lesions of the tibial plateau: a prospective study. Am J Sports Med. 2013;41(2):411-415. doi:10.1177/0363546512469091.
- Harris JD, Siston RA, Brophy RH, Lattermann C, Carey JL, Flanigan DC. Failures, re-operations, and complications after autologous chondrocyte implantation–a systematic review. Osteoarthritis Cartilage. 2011;19(7):779-791. doi:10.1016/j.joca.2011.02.010.
- Abrams GD, Frank RM, Gupta AK, Harris JD, McCormick FM, Cole BJ. Trends in meniscus repair and meniscectomy in the United States, 2005-2011. Am J Sports Med. 2013;41(10):2333-2339. doi:10.1177/0363546513495641.
- Montgomery SR, Ngo SS, Hobson T, et al. Trends and demographics in hip arthroscopy in the United States. Arthroscopy. 2013;29(4):661-665. doi:10.1016/j.arthro.2012.11.005.
- Yeranosian MG, Arshi A, Terrell RD, Wang JC, McAllister DR, Petrigliano FA. Incidence of acute postoperative infections requiring reoperation after arthroscopic shoulder surgery. Am J Sports Med. 2014;42(2):437-441. doi:10.1177/0363546513510686.
- Zhang AL, Montgomery SR, Ngo SS, Hame SL, Wang JC, Gamradt SC. Arthroscopic versus open shoulder stabilization: current practice patterns in the United States. Arthroscopy. 2014;30(4):436-443. doi:10.1016/j.arthro.2013.12.013.
- Werner BC, Carr JB, Wiggins JC, Gwathmey FW, Browne JA. Manipulation under anesthesia after total knee arthroplasty is associated with an increased incidence of subsequent revision surgery. J Arthroplasty. 2015;30(suppl 9):72-75. doi:10.1016/j.arth.2015.01.061.
- Carr JB 2nd, Werner BC, Browne JA. Trends and outcomes in the treatment of failed septic total knee arthroplasty: comparing arthrodesis and above-knee amputation. J Arthroplasty. 2016;31(7):1574-1577. doi:10.1016/j.arth.2016.01.010.
TAKE-HOME POINTS
- With a large US commercial insurance database analyzing techniques for cartilage restoration, reparative procedures were favored for chondral injuries compared to restorative approaches.
- Among patients undergoing microfracture, autologous chondrocyte implantation, osteochondral autograft transfer, and osteochondral allograft transplantation, the average 90-day reoperation rate is 6%.
- Among patients undergoing microfracture, autologous chondrocyte implantation, osteochondral autograft transfer, and osteochondral allograft transplantation, the average 2-year reoperation rate is 15%.
- Patients undergoing autologous chondrocyte implantation are more likely to experience reoperation at 90 days, 1 year, and 2 years compared to other cartilage restoration techniques including microfracture, osteochondral autograft transfer, and osteochondral allograft transplantation.
- Patients undergoing microfracture are more likely to experience an ultimate conversion to arthroplasty compared to other cartilage restoration techniques including autologous chondrocyte implantation, osteochondral autograft transfer, and osteochondral allograft transplantation.
An MRI Analysis of the Pelvis to Determine the Ideal Method for Ultrasound-Guided Bone Marrow Aspiration from the Iliac Crest
ABSTRACT
Use of mesenchymal stem cells from bone marrow has gained significant popularity. The iliac crest has been determined to be an effective site for harvesting mesenchymal stem cells. Review of the literature reveals that multiple techniques are used to harvest bone marrow aspirate from the iliac crest, but the descriptions are based on the experience of various authors as opposed to studied anatomy. A safe, reliable, and reproducible method for aspiration has yet to be studied and described. We hypothesized that there would be an ideal angle and distance for aspiration that would be the safest, most consistent, and most reliable. Using magnetic resonance imaging (MRI), we reviewed 26 total lumbar spine MRI scans (13 males, 13 females) and found that an angle of 24° should be used when entering the most medial aspect of the posterior superior iliac spine (PSIS) and that this angle did not differ between the sexes. The distance that the trocar can advance after entry before hitting the anterior ilium wall varied significantly between males and females, being 7.53 cm in males and 6.74 cm in females. In addition, the size of the PSIS table was significantly different between males and females (1.20 cm and 0.96 cm, respectively). No other significant differences in the measurements gathered were found. Using the data gleaned from this study, we developed an aspiration technique. This method uses ultrasound to determine the location of the PSIS and the entry point on the PSIS. This contrasts with most techniques that use landmark palpation, which is known to be unreliable and inaccurate. The described technique for aspiration from the PSIS is safe, reliable, reproducible, and substantiated by data.
The iliac crest is an effective site for harvesting bone marrow stem cells. It allows for easy access and is superficial in most individuals, allowing for a relatively quick and simple procedure. Use of mesenchymal stem cells (MSCs) for treatment of orthopedic injuries has grown recently. Whereas overall use has increased, review of the literature reveals very few techniques for iliac crest aspiration,1 but these are not based on anatomic relationships or studies. Hernigou and colleagues2,3 attempted to quantitatively evaluate potential “sectors” allowing for safe aspiration using cadaver and computed tomographic reconstruction imaging. We used magnetic resonance imaging (MRI) to analyze aspiration parameters. Owing to the ilium’s anatomy, improper positioning or aspiration technique during aspiration can result in serious injury.2,4-6 We hypothesized that there is an ideal angle and positioning for bone marrow aspiration from the posterior superior iliac spine (PSIS) that is safe, consistent, and reproducible. Although most aspiration techniques use landmark palpation, this is unreliable and inaccurate, especially when compared with ultrasound-guided injections7-16 and procedures.9,12,17-19 We describe our technique using ultrasound to visualize patient anatomy and accurately determine anatomic entry with the trocar.
METHODS
MRI scans of 26 patients (13 males, 13 females) were reviewed to determine average angles and distances. Axial T2-weighted views of the lumbar spine were used in all analyses. The sacroiliac (SI) joint angle was defined as the angle formed between the vector through the midline of the pelvis and the vector that is parallel to the SI joint. The approach angle was defined as the angle formed between the vector of the most medial aspect of the PSIS through the ilium to the anterior wall and the vector through the midline of the pelvis (Figure 1). 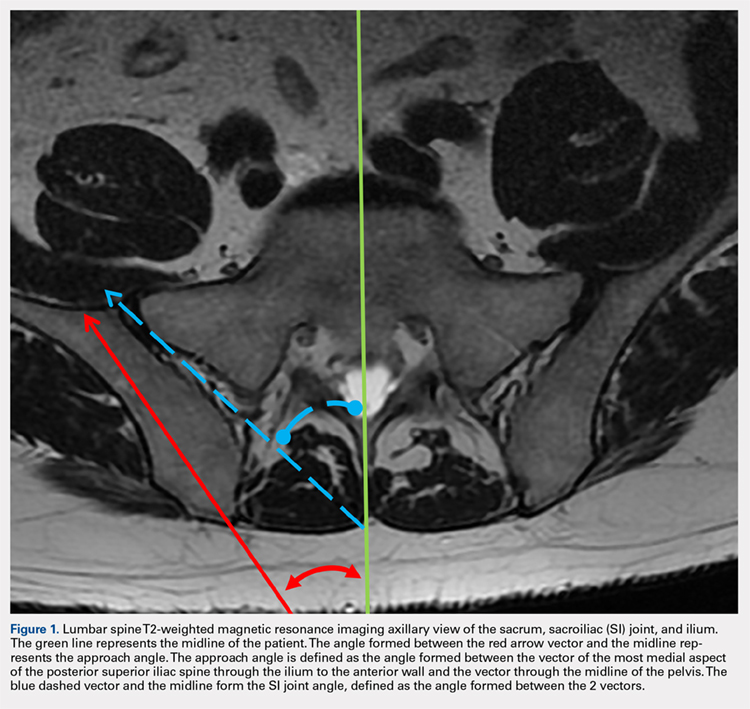
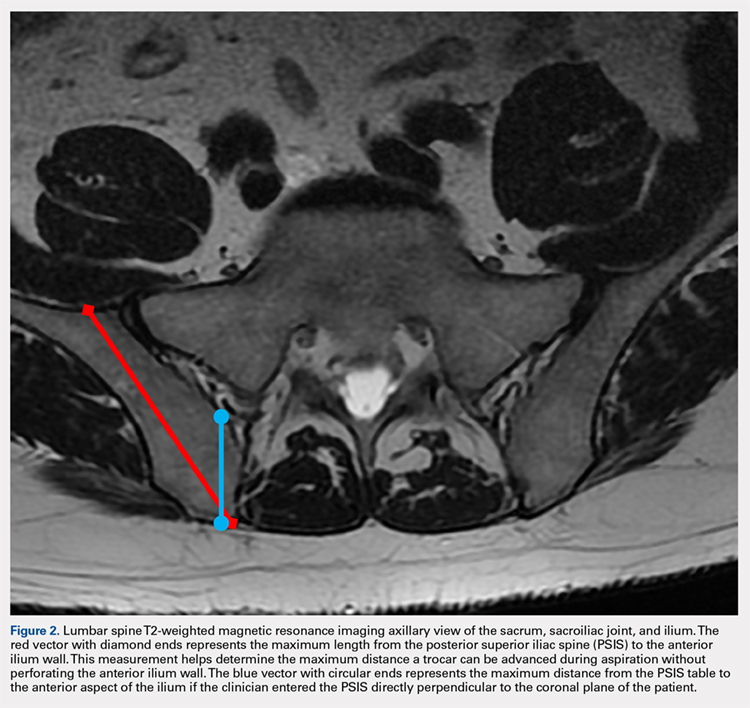
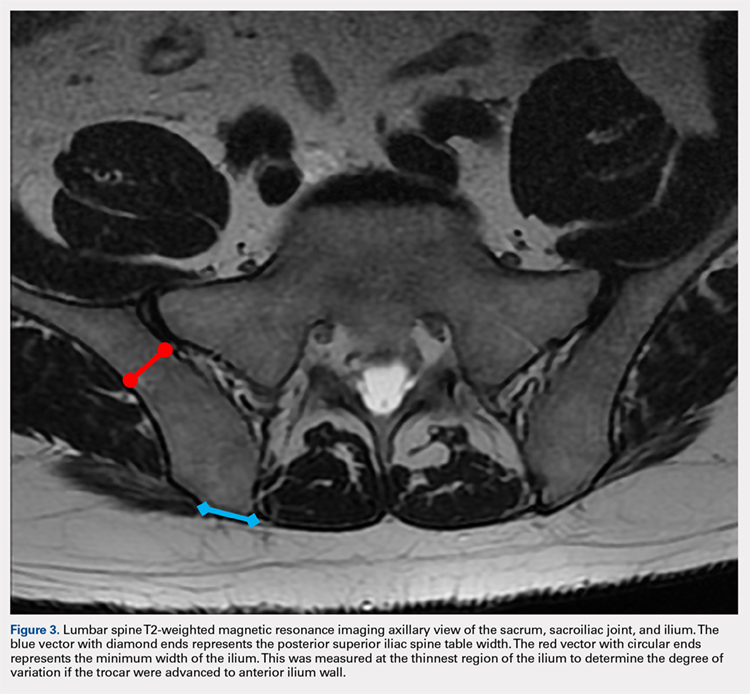
Continue to: For the 13 males, the mean SI joint...
RESULTS
The results are reported in the Table.
Table. Measurements of Patients Taken on Axial T2-Weighted Views of Lumbosacral MRI Scansa
Patient | SI Joint Angle (°) | Approach Angle (°) | PSIS Table Width (cm) | PSIS to Anterior Ilium Wall (cm) | Perpendicular Distance PSIS to Anterior Joint (cm) | Post Ilium Wall to SI Joint Width (cm) |
Males | ||||||
1 | 28.80 | 19.50 | 1.24 | 8.80 | 4.16 | 1.52 |
2 | 31.80 | 27.60 | 1.70 | 7.89 | 3.49 | 1.02 |
3 | 33.70 | 27.70 | 1.12 | 8.14 | 3.15 | 1.28 |
4 | 23.70 | 26.40 | 0.95 | 6.66 | 3.22 | 0.65 |
5 | 35.90 | 28.40 | 0.84 | 7.60 | 2.57 | 0.95 |
6 | 33.80 | 29.30 | 1.20 | 7.73 | 2.34 | 0.90 |
7 | 30.30 | 21.20 | 1.36 | 8.44 | 3.95 | 1.18 |
8 | 34.50 | 20.40 | 1.53 | 7.08 | 3.98 | 1.56 |
9 | 28.70 | 24.00 | 1.34 | 8.19 | 3.51 | 1.31 |
10 | 22.40 | 20.10 | 1.37 | 7.30 | 3.87 | 1.28 |
11 | 33.60 | 20.80 | 0.88 | 6.43 | 3.26 | 0.94 |
12 | 48.50 | 31.00 | 1.15 | 6.69 | 2.97 | 1.38 |
13 | 20.20 | 20.90 | 0.94 | 6.95 | 3.79 | 1.05 |
Averages | 31.22 | 24.41 | 1.20 | 7.53 | 3.40 | 1.16 |
Standard Deviation | 7.18 | 4.11 | 0.26 | 0.75 | 0.56 | 0.26 |
Females | ||||||
14 | 22.80 | 23.20 | 1.54 | 7.21 | 3.45 | 1.39 |
15 | 33.30 | 21.40 | 1.09 | 7.26 | 3.57 | 0.98 |
16 | 19.70 | 15.60 | 0.78 | 8.32 | 3.76 | 0.86 |
17 | 17.50 | 15.60 | 0.61 | 7.57 | 3.37 | 1.03 |
18 | 48.20 | 26.60 | 0.94 | 6.62 | 3.16 | 0.71 |
19 | 38.20 | 28.30 | 0.90 | 6.32 | 2.23 | 0.91 |
20 | 44.50 | 31.70 | 0.99 | 6.19 | 3.06 | 0.76 |
21 | 24.10 | 18.00 | 0.92 | 6.99 | 3.23 | 0.71 |
22 | 17.20 | 14.80 | 0.81 | 6.00 | 2.81 | 1.13 |
23 | 42.00 | 38.50 | 1.00 | 5.33 | 2.47 | 1.42 |
24 | 32.00 | 25.50 | 0.98 | 6.01 | 2.79 | 1.21 |
25 | 24.70 | 24.80 | 0.87 | 6.09 | 2.79 | 1.02 |
26 | 19.80 | 22.30 | 1.04 | 7.71 | 2.37 | 1.36 |
Averages | 29.54 | 23.56 | 0.96 | 6.74 | 3.00 | 1.04 |
Standard Deviation | 10.84 | 6.88 | 0.21 | 0.85 | 0.48 | 0.25 |
All patients Averages | 30.38 | 23.98 | 1.08 | 7.14 | 3.20 | 1.10 |
Standard Deviation | 9.05 | 5.57 | 0.26 | 0.88 | 0.55 | 0.26 |
aStatistical significance is denoted as P < .02.
Abbreviations: MRI, magnetic resonance imaging; PSIS, posterior iliac spine; SI, sacroiliac.
For the 13 males, the mean SI joint angle was 31.22° ± 7.18° (range, 20.20° to 48.50°). The mean approach angle was 24.41° ± 4.11° (range, 19.50° to 31.00°). The mean PSIS table width was 1.20 cm ± 0.26 cm (range, 0.84 cm to 1.70 cm). The mean distance from the PSIS to the anterior ilium wall was 7.53 cm ± 0.75 cm (range, 6.43 cm to 8.80 cm). The mean perpendicular distance from the PSIS table to the anterior ilium was 3.40 cm ± 0.56 cm (range, 2.34 cm to 4.16 cm). The mean minimum width of the ilium to the SI joint was 1.16 cm ± 0.26 cm (range, 0.65 cm to 1.56 cm).
For the 13 females, the mean SI joint angle was 29.54° ± 10.84° (range, 17.20° to 48.20°). The mean approach angle was 23.56° ± 6.88° (range, 14.80° to 38.50°). The mean PSIS table width was 0.96 cm ± 0.21 cm (range, 0.61 cm to 1.54 cm). The mean distance from the PSIS to the anterior ilium wall was 6.74 cm ± 0.85 cm (range, 5.33 cm to 8.32 cm). The mean perpendicular distance from the PSIS table to the anterior ilium was 3.00 cm ± 0.48 cm (range, 2.23 cm to 3.76 cm). The mean minimum width of the ilium to the SI joint was 1.04 cm ± 0.25 cm (range, 0.71 cm to 1.42 cm).
For the 26 total patients, the mean SI joint angle was 30.38° ± 9.05° (range, 17.20° to 48.50°). The mean approach angle was 23.98° ± 5.57° (range, 14.80° to 38.50°). The mean PSIS table width was 1.08 cm ± 0.26 cm (range, 0.61 cm to 1.70 cm). The mean distance from the PSIS to the anterior ilium wall was 7.14 cm ± 0.88 cm (range, 5.33 cm to 8.80 cm). The mean perpendicular distance from the PSIS table to the anterior ilium was 3.20 cm ± 0.55 cm (range, 2.23 cm to 4.16 cm). The mean minimum width of the ilium to the SI joint was 1.10 cm ± 0.26 cm (range, 0.65 cm to 1.56 cm).
There was a statistically significant difference between the male and female groups for the maximum distance the trocar can be advanced from the PSIS to the anterior ilium wall (P < .02), and a statistically significant difference for the PSIS table width (P < .02). There were no significant differences between the male and female groups for the approach angle, the SI joint angle, the perpendicular distance from the PSIS to the anterior ilium, and the minimum width of the ilium to the SI joint.
Continue to: The patient is brought to the procedure...
TECHNIQUE: ILIAC CREST (PSIS) BONE MARROW ASPIRATION
The patient is brought to the procedure room and placed in a prone position. The donor site is prepared and draped in the usual sterile manner. Ultrasound is used to identify the median sacral crest in a short-axis view. The probe is then moved laterally to identify the PSIS (Figures 4A, 4B). 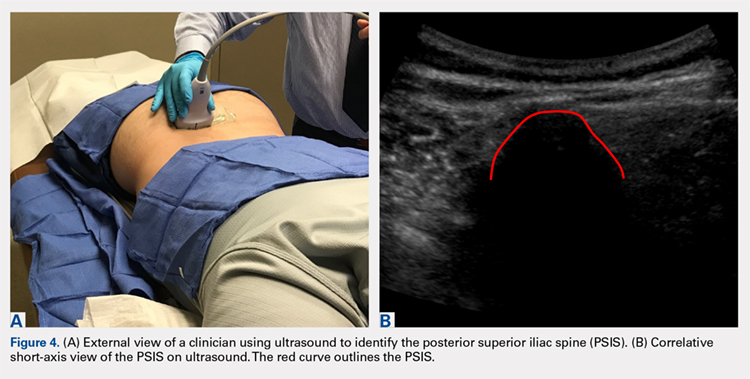
The crosshairs on the ultrasound probe are used to mark the center lines of each plane. The central point marks the location of the PSIS. Alternatively, an in-plane technique can be used to place a spinal needle on the exact entry point on the PSIS. Once the PSIS and entry point are identified, the site is blocked with 10 mL of 0.5% ropivacaine.
Prior to introduction of the trocar, all instrumentation is primed with heparin and syringes are prepped with anticoagulant citrate dextrose solution, solution A. A stab incision is made at the site. The trocar is placed at the entry point, which should be centered in a superior-inferior plane and at the most medial point of the PSIS. Starting with the trocar vertical, the trocar is angled laterally 24° by dropping the hand medially toward the midline. No angulation cephalad or caudad is necessary, but cephalad must be avoided so as not to skive superiorly. This angle, which is recommended for both males and females, allows for the greatest distance the trocar can travel in bone before hitting the anterior ilium wall. A standard deviation of 5.57° is present, which should be considered. Steady pressure should be applied with a slight twisting motion on the PSIS. If advancement of the trocar is too difficult, a mallet or drill can be used to assist in penetration.
With the trocar advanced into the bone 1 cm, the trocar needle is removed while the cannula remains in place. The syringe is attached to the top of the cannula. The syringe plunger is pulled back to aspirate 20 mL of bone marrow. The cannula and syringe assembly are advanced 2 cm farther into the bone to allow for aspiration of a new location within the bone marrow cavity, and 20 mL of bone marrow are again aspirated. This is done a final time, advancing the trocar another 2 cm and aspirating a final 20 mL of bone marrow. The entire process should yield roughly 60 mL of bone marrow from one side. If desired, the same process can be repeated for the contralateral PSIS to yield a total of 120 mL of bone marrow from the 2 sites.
Based on our data, the average distance to the anterior ilium wall was 7 cm, but the shortest distance noted in this study was 5 cm. On the basis of the data presented, this technique allows for safe advancement based on even the shortest measured distance, without fear of puncturing the anterior ilium wall. Perforation could damage the femoral nerve and the internal or external iliac artery or vein that lie anterior to the ilium.
Continue to: We hypothesized that there...
DISCUSSION
We hypothesized that there would be an optimal angle of entry and maximal safe distance the trocar could advance through the ilium when aspirating. Because male and female pelvic anatomy differs, we also hypothesized that there would be differences in distance and size measurements for males and females. Our results supported our hypothesis that there is an ideal approach angle. The results also showed that the maximum distance the trocar can advance and the width of the PSIS table differ significantly between males and females.
Although pelvic anatomy differs between males and females, there should be an ideal entry angle that would allow maximum advancement into the ilium without perforating the anterior wall, which we defined as the approach angle. In our comparison of 26 MRI scans, we found that the approach angle did not differ significantly between the 2 groups (13 males, 13 females). This allows clinicians to enter the PSIS at roughly 24° medial to the parasagittal line, maximizing the space before puncturing into the anterior pelvis in either males or females.
If clinicians were to enter perpendicular to the patient’s PSIS, they would, on average, be able to advance only 3.20 cm before encountering the SI joint. When entering at 24° as we recommend, the average distance increases to 7.14 cm. Although the angle did not differ significantly, there was a significant difference between males and females in the length from the PSIS to the anterior wall, with males having 7.53 cm distance and females 6.74 cm. This is an important measurement because if the anterior ilium wall is punctured, the femoral nerve and the common, internal and external iliac arteries and veins could be damaged, resulting in retroperitoneal hemorrhage.
A fatality in 2001 in the United Kingdom led to a national audit of bone marrow aspiration and biopsies.4-6 Although these procedures were done primarily for patients with cancer, hemorrhagic events were the most frequent and serious events. This audit led to the identification of many risk factors. Bain4-6 conducted reviews of bone marrow aspirations and biopsies in the United Kingdom from 2002 to 2004. Of a total of 53,088 procedures conducted during that time frame, 48 (0.09%) adverse events occurred, with 29 (0.05%) being hemorrhagic events. Although infrequent, hemorrhagic adverse events represent significant morbidity. Reviews such as those conducted by Bain4-6 highlight the importance of a study that helps determine the optimal parameters for aspiration to ensure safety and reliability.
Hernigou and colleagues2,3 conducted studies analyzing different “sectors” in an attempt to develop a safe aspiration technique. They found that obese patients were at higher risk, and some sites of aspiration (sectors 1, 4, 5) had increased risk for perforation and damage to surrounding structures. Their sector 6, which incorporated the entirety of the PSIS table, was considered the safest, most reliable site for trocar introduction.2,3 Hernigou and colleagues,2 in comparing the bone mass of the sectors, also noted that sector 6 has the greatest bone thickness close to the entry point, making it the most favorable site. The PSIS is not just a point; it is more a “table.” The PSIS can be palpated posteriorly, but this is inaccurate and unreliable, particularly in larger individuals. The PSIS table can be identified on ultrasound before introducing the trocar, which is a more reliable method of landmark identification than palpation guidance, just as in ultrasound-guided injections7-16 and procedures.9,12,17-19
Continue to: If the PSIS is not accurately...
If the PSIS is not accurately identified, penetration laterally will result in entering the ilium wing, where it is quite narrow. We found the distance between the posterior ilium wall and the SI joint to be only 1.10 cm wide (Figure 3); we defined this area as the narrow corridor. Superior and lateral entry could damage the superior cluneal nerves coming over the iliac crest, which are located 6 cm lateral to the SI joint. Inferior and lateral entry 6 cm below the PSIS could reach the greater sciatic foramen, damaging the sacral plexus and superior gluteal artery and vein. If the entry slips above the PSIS over the pelvis, the trocar could enter the retroperitoneal space and damage the femoral nerve and common iliac artery and vein, leading to a retroperitoneal hemorrhage.4-6,20
MSCs are found as perivascular cells and lie in the cortices of bones.21 Following the approach angle and directed line from the PSIS to the anterior ilium wall described in this study (Figures 1 and 2), the trocar would pass through the narrow corridor as it advances farther into the ilium. The minimum width of this corridor was measured in this study and, on average, was 1.10 cm wide from cortex to cortex (Figure 3). As the bone marrow is aspirated from this narrow corridor, the clinician is gathering MSCs from both the lateral and medial cortices of the ilium. By aspirating from a greater surface area of the cortices, it is believed that this will increase the total collection of MSCs.
CONCLUSION
Although there are reports in the literature that describe techniques for bone marrow aspiration from the iliac crest, the techniques are very general and vague regarding the ideal angles and methods. Studies have attempted to quantify the safest entry sites for aspiration but have not detailed ideal parameters for collection. Blind aspiration from the iliac crest can have serious implications if adverse events occur, and thus there is a need for a safe and reliable method of aspiration from the iliac crest. Ultrasound guidance to identify anatomy, as opposed to palpation guidance, ensures anatomic placement of the trocar while minimizing the risk of aspiration. Based on the measurements gathered in this study, an optimal angle of entry and safe distance of penetration have been identified. Using our data and relevant literature, we developed a technique for a safe, consistent, and reliable method of bone marrow aspiration out of the iliac crest.
1. Chahla J, Mannava S, Cinque ME, Geeslin AG, Codina D, LaPrade RF. Bone marrow aspirate concentrate harvesting and processing technique. Arthrosc Tech. 2017;6(2):e441-e445. doi:10.1016/j.eats.2016.10.024.
2. Hernigou J, Alves A, Homma Y, Guissou I, Hernigou P. Anatomy of the ilium for bone marrow aspiration: map of sectors and implication for safe trocar placement. Int Orthop. 2014;38(12):2585-2590. doi:10.1007/s00264-014-2353-7.
3. Hernigou J, Picard L, Alves A, Silvera J, Homma Y, Hernigou P. Understanding bone safety zones during bone marrow aspiration from the iliac crest: the sector rule. Int Orthop. 2014;38(11):2377-2384. doi:10.1007/s00264-014-2343-9.
4. Bain BJ. Bone marrow biopsy morbidity: review of 2003. J Clin Pathol. 2005;58(4):406-408. doi:10.1136/jcp.2004.022178.
5. Bain BJ. Bone marrow biopsy morbidity and mortality: 2002 data. Clin Lab Haematol. 2004;26(5):315-318. doi:10.1111/j.1365-2257.2004.00630.x.
6. Bain BJ. Morbidity associated with bone marrow aspiration and trephine biopsy - a review of UK data for 2004. Haematologica. 2006;91(9):1293-1294.
7. Berkoff DJ, Miller LE, Block JE. Clinical utility of ultrasound guidance for intra-articular knee injections: a review. Clin Interv Aging. 2012;7:89-95. doi:10.2147/CIA.S29265.
8. Henkus HE, Cobben LP, Coerkamp EG, Nelissen RG, van Arkel ER. The accuracy of subacromial injections: a prospective randomized magnetic resonance imaging study. Arthroscopy. 2006;22(3):277-282. doi:10.1016/j.arthro.2005.12.019.
9. Hirahara AM, Panero AJ. A guide to ultrasound of the shoulder, part 3: interventional and procedural uses. Am J Orthop. 2016;45(7):440-445.
10. Jackson DW, Evans NA, Thomas BM. Accuracy of needle placement into the intra-articular space of the knee. J Bone Joint Surg Am. 2002;84-A(9):1522-1527.
11. Naredo E, Cabero F, Beneyto P, et al. A randomized comparative study of short term response to blind versus sonographic-guided injection of local corticosteroids in patients with painful shoulder. J Rheumatol. 2004;31(2):308-314.
12. Panero AJ, Hirahara AM. A guide to ultrasound of the shoulder, part 2: the diagnostic evaluation. Am J Orthop. 2016;45(4):233-238.
13. Sethi PM, El Attrache N. Accuracy of intra-articular injection of the glenohumeral joint: a cadaveric study. Orthopedics. 2006;29(2):149-152.
14. Sibbit WL Jr, Peisajovich A, Michael AA, et al. Does sonographic needle guidance affect the clinical outcome of intraarticular injections? J Rheumatol. 2009;36(9):1892-1902. doi:10.3899/jrheum.090013.
15. Smith J, Brault JS, Rizzo M, Sayeed YA, Finnoff JT. Accuracy of sonographically guided and palpation guided scaphotrapeziotrapezoid joint injections. J Ultrasound Med. 2011;30(11):1509-1515. doi:10.7863/jum.2011.30.11.1509.
16. Yamakado K. The targeting accuracy of subacromial injection to the shoulder: an arthrographic evaluation. Arthroscopy. 2002;18(8):887-891.
17. Hirahara AM, Andersen WJ. Ultrasound-guided percutaneous reconstruction of the anterolateral ligament: surgical technique and case report. Am J Orthop. 2016;45(7):418-422, 460.
18. Hirahara AM, Andersen WJ. Ultrasound-guided percutaneous repair of medial patellofemoral ligament: surgical technique and outcomes. Am J Orthop. 2017;46(3):152-157.
19. Hirahara AM, Mackay G, Andersen WJ. Ultrasound-guided InternalBrace of the medial collateral ligament. Arthrosc Tech. Submitted.
20. Jamaludin WFW, Mukari SAM, Wahid SFA. Retroperitoneal hemorrhage associated with bone marrow trephine biopsy. Am J Case Rep. 2013;14:489-493. doi:10.12659/AJCR.889274.
21. Bianco P, Cao X, Frenette PS, et al. The meaning, the sense and the significance: translating the science of mesenchymal stem cells into medicine. Nat Med. 2013;19(1):35-42. doi:10.1038/nm.3028.
ABSTRACT
Use of mesenchymal stem cells from bone marrow has gained significant popularity. The iliac crest has been determined to be an effective site for harvesting mesenchymal stem cells. Review of the literature reveals that multiple techniques are used to harvest bone marrow aspirate from the iliac crest, but the descriptions are based on the experience of various authors as opposed to studied anatomy. A safe, reliable, and reproducible method for aspiration has yet to be studied and described. We hypothesized that there would be an ideal angle and distance for aspiration that would be the safest, most consistent, and most reliable. Using magnetic resonance imaging (MRI), we reviewed 26 total lumbar spine MRI scans (13 males, 13 females) and found that an angle of 24° should be used when entering the most medial aspect of the posterior superior iliac spine (PSIS) and that this angle did not differ between the sexes. The distance that the trocar can advance after entry before hitting the anterior ilium wall varied significantly between males and females, being 7.53 cm in males and 6.74 cm in females. In addition, the size of the PSIS table was significantly different between males and females (1.20 cm and 0.96 cm, respectively). No other significant differences in the measurements gathered were found. Using the data gleaned from this study, we developed an aspiration technique. This method uses ultrasound to determine the location of the PSIS and the entry point on the PSIS. This contrasts with most techniques that use landmark palpation, which is known to be unreliable and inaccurate. The described technique for aspiration from the PSIS is safe, reliable, reproducible, and substantiated by data.
The iliac crest is an effective site for harvesting bone marrow stem cells. It allows for easy access and is superficial in most individuals, allowing for a relatively quick and simple procedure. Use of mesenchymal stem cells (MSCs) for treatment of orthopedic injuries has grown recently. Whereas overall use has increased, review of the literature reveals very few techniques for iliac crest aspiration,1 but these are not based on anatomic relationships or studies. Hernigou and colleagues2,3 attempted to quantitatively evaluate potential “sectors” allowing for safe aspiration using cadaver and computed tomographic reconstruction imaging. We used magnetic resonance imaging (MRI) to analyze aspiration parameters. Owing to the ilium’s anatomy, improper positioning or aspiration technique during aspiration can result in serious injury.2,4-6 We hypothesized that there is an ideal angle and positioning for bone marrow aspiration from the posterior superior iliac spine (PSIS) that is safe, consistent, and reproducible. Although most aspiration techniques use landmark palpation, this is unreliable and inaccurate, especially when compared with ultrasound-guided injections7-16 and procedures.9,12,17-19 We describe our technique using ultrasound to visualize patient anatomy and accurately determine anatomic entry with the trocar.
METHODS
MRI scans of 26 patients (13 males, 13 females) were reviewed to determine average angles and distances. Axial T2-weighted views of the lumbar spine were used in all analyses. The sacroiliac (SI) joint angle was defined as the angle formed between the vector through the midline of the pelvis and the vector that is parallel to the SI joint. The approach angle was defined as the angle formed between the vector of the most medial aspect of the PSIS through the ilium to the anterior wall and the vector through the midline of the pelvis (Figure 1).
Continue to: For the 13 males, the mean SI joint...
RESULTS
The results are reported in the Table.
Table. Measurements of Patients Taken on Axial T2-Weighted Views of Lumbosacral MRI Scansa
Patient | SI Joint Angle (°) | Approach Angle (°) | PSIS Table Width (cm) | PSIS to Anterior Ilium Wall (cm) | Perpendicular Distance PSIS to Anterior Joint (cm) | Post Ilium Wall to SI Joint Width (cm) |
Males | ||||||
1 | 28.80 | 19.50 | 1.24 | 8.80 | 4.16 | 1.52 |
2 | 31.80 | 27.60 | 1.70 | 7.89 | 3.49 | 1.02 |
3 | 33.70 | 27.70 | 1.12 | 8.14 | 3.15 | 1.28 |
4 | 23.70 | 26.40 | 0.95 | 6.66 | 3.22 | 0.65 |
5 | 35.90 | 28.40 | 0.84 | 7.60 | 2.57 | 0.95 |
6 | 33.80 | 29.30 | 1.20 | 7.73 | 2.34 | 0.90 |
7 | 30.30 | 21.20 | 1.36 | 8.44 | 3.95 | 1.18 |
8 | 34.50 | 20.40 | 1.53 | 7.08 | 3.98 | 1.56 |
9 | 28.70 | 24.00 | 1.34 | 8.19 | 3.51 | 1.31 |
10 | 22.40 | 20.10 | 1.37 | 7.30 | 3.87 | 1.28 |
11 | 33.60 | 20.80 | 0.88 | 6.43 | 3.26 | 0.94 |
12 | 48.50 | 31.00 | 1.15 | 6.69 | 2.97 | 1.38 |
13 | 20.20 | 20.90 | 0.94 | 6.95 | 3.79 | 1.05 |
Averages | 31.22 | 24.41 | 1.20 | 7.53 | 3.40 | 1.16 |
Standard Deviation | 7.18 | 4.11 | 0.26 | 0.75 | 0.56 | 0.26 |
Females | ||||||
14 | 22.80 | 23.20 | 1.54 | 7.21 | 3.45 | 1.39 |
15 | 33.30 | 21.40 | 1.09 | 7.26 | 3.57 | 0.98 |
16 | 19.70 | 15.60 | 0.78 | 8.32 | 3.76 | 0.86 |
17 | 17.50 | 15.60 | 0.61 | 7.57 | 3.37 | 1.03 |
18 | 48.20 | 26.60 | 0.94 | 6.62 | 3.16 | 0.71 |
19 | 38.20 | 28.30 | 0.90 | 6.32 | 2.23 | 0.91 |
20 | 44.50 | 31.70 | 0.99 | 6.19 | 3.06 | 0.76 |
21 | 24.10 | 18.00 | 0.92 | 6.99 | 3.23 | 0.71 |
22 | 17.20 | 14.80 | 0.81 | 6.00 | 2.81 | 1.13 |
23 | 42.00 | 38.50 | 1.00 | 5.33 | 2.47 | 1.42 |
24 | 32.00 | 25.50 | 0.98 | 6.01 | 2.79 | 1.21 |
25 | 24.70 | 24.80 | 0.87 | 6.09 | 2.79 | 1.02 |
26 | 19.80 | 22.30 | 1.04 | 7.71 | 2.37 | 1.36 |
Averages | 29.54 | 23.56 | 0.96 | 6.74 | 3.00 | 1.04 |
Standard Deviation | 10.84 | 6.88 | 0.21 | 0.85 | 0.48 | 0.25 |
All patients Averages | 30.38 | 23.98 | 1.08 | 7.14 | 3.20 | 1.10 |
Standard Deviation | 9.05 | 5.57 | 0.26 | 0.88 | 0.55 | 0.26 |
aStatistical significance is denoted as P < .02.
Abbreviations: MRI, magnetic resonance imaging; PSIS, posterior iliac spine; SI, sacroiliac.
For the 13 males, the mean SI joint angle was 31.22° ± 7.18° (range, 20.20° to 48.50°). The mean approach angle was 24.41° ± 4.11° (range, 19.50° to 31.00°). The mean PSIS table width was 1.20 cm ± 0.26 cm (range, 0.84 cm to 1.70 cm). The mean distance from the PSIS to the anterior ilium wall was 7.53 cm ± 0.75 cm (range, 6.43 cm to 8.80 cm). The mean perpendicular distance from the PSIS table to the anterior ilium was 3.40 cm ± 0.56 cm (range, 2.34 cm to 4.16 cm). The mean minimum width of the ilium to the SI joint was 1.16 cm ± 0.26 cm (range, 0.65 cm to 1.56 cm).
For the 13 females, the mean SI joint angle was 29.54° ± 10.84° (range, 17.20° to 48.20°). The mean approach angle was 23.56° ± 6.88° (range, 14.80° to 38.50°). The mean PSIS table width was 0.96 cm ± 0.21 cm (range, 0.61 cm to 1.54 cm). The mean distance from the PSIS to the anterior ilium wall was 6.74 cm ± 0.85 cm (range, 5.33 cm to 8.32 cm). The mean perpendicular distance from the PSIS table to the anterior ilium was 3.00 cm ± 0.48 cm (range, 2.23 cm to 3.76 cm). The mean minimum width of the ilium to the SI joint was 1.04 cm ± 0.25 cm (range, 0.71 cm to 1.42 cm).
For the 26 total patients, the mean SI joint angle was 30.38° ± 9.05° (range, 17.20° to 48.50°). The mean approach angle was 23.98° ± 5.57° (range, 14.80° to 38.50°). The mean PSIS table width was 1.08 cm ± 0.26 cm (range, 0.61 cm to 1.70 cm). The mean distance from the PSIS to the anterior ilium wall was 7.14 cm ± 0.88 cm (range, 5.33 cm to 8.80 cm). The mean perpendicular distance from the PSIS table to the anterior ilium was 3.20 cm ± 0.55 cm (range, 2.23 cm to 4.16 cm). The mean minimum width of the ilium to the SI joint was 1.10 cm ± 0.26 cm (range, 0.65 cm to 1.56 cm).
There was a statistically significant difference between the male and female groups for the maximum distance the trocar can be advanced from the PSIS to the anterior ilium wall (P < .02), and a statistically significant difference for the PSIS table width (P < .02). There were no significant differences between the male and female groups for the approach angle, the SI joint angle, the perpendicular distance from the PSIS to the anterior ilium, and the minimum width of the ilium to the SI joint.
Continue to: The patient is brought to the procedure...
TECHNIQUE: ILIAC CREST (PSIS) BONE MARROW ASPIRATION
The patient is brought to the procedure room and placed in a prone position. The donor site is prepared and draped in the usual sterile manner. Ultrasound is used to identify the median sacral crest in a short-axis view. The probe is then moved laterally to identify the PSIS (Figures 4A, 4B).
The crosshairs on the ultrasound probe are used to mark the center lines of each plane. The central point marks the location of the PSIS. Alternatively, an in-plane technique can be used to place a spinal needle on the exact entry point on the PSIS. Once the PSIS and entry point are identified, the site is blocked with 10 mL of 0.5% ropivacaine.
Prior to introduction of the trocar, all instrumentation is primed with heparin and syringes are prepped with anticoagulant citrate dextrose solution, solution A. A stab incision is made at the site. The trocar is placed at the entry point, which should be centered in a superior-inferior plane and at the most medial point of the PSIS. Starting with the trocar vertical, the trocar is angled laterally 24° by dropping the hand medially toward the midline. No angulation cephalad or caudad is necessary, but cephalad must be avoided so as not to skive superiorly. This angle, which is recommended for both males and females, allows for the greatest distance the trocar can travel in bone before hitting the anterior ilium wall. A standard deviation of 5.57° is present, which should be considered. Steady pressure should be applied with a slight twisting motion on the PSIS. If advancement of the trocar is too difficult, a mallet or drill can be used to assist in penetration.
With the trocar advanced into the bone 1 cm, the trocar needle is removed while the cannula remains in place. The syringe is attached to the top of the cannula. The syringe plunger is pulled back to aspirate 20 mL of bone marrow. The cannula and syringe assembly are advanced 2 cm farther into the bone to allow for aspiration of a new location within the bone marrow cavity, and 20 mL of bone marrow are again aspirated. This is done a final time, advancing the trocar another 2 cm and aspirating a final 20 mL of bone marrow. The entire process should yield roughly 60 mL of bone marrow from one side. If desired, the same process can be repeated for the contralateral PSIS to yield a total of 120 mL of bone marrow from the 2 sites.
Based on our data, the average distance to the anterior ilium wall was 7 cm, but the shortest distance noted in this study was 5 cm. On the basis of the data presented, this technique allows for safe advancement based on even the shortest measured distance, without fear of puncturing the anterior ilium wall. Perforation could damage the femoral nerve and the internal or external iliac artery or vein that lie anterior to the ilium.
Continue to: We hypothesized that there...
DISCUSSION
We hypothesized that there would be an optimal angle of entry and maximal safe distance the trocar could advance through the ilium when aspirating. Because male and female pelvic anatomy differs, we also hypothesized that there would be differences in distance and size measurements for males and females. Our results supported our hypothesis that there is an ideal approach angle. The results also showed that the maximum distance the trocar can advance and the width of the PSIS table differ significantly between males and females.
Although pelvic anatomy differs between males and females, there should be an ideal entry angle that would allow maximum advancement into the ilium without perforating the anterior wall, which we defined as the approach angle. In our comparison of 26 MRI scans, we found that the approach angle did not differ significantly between the 2 groups (13 males, 13 females). This allows clinicians to enter the PSIS at roughly 24° medial to the parasagittal line, maximizing the space before puncturing into the anterior pelvis in either males or females.
If clinicians were to enter perpendicular to the patient’s PSIS, they would, on average, be able to advance only 3.20 cm before encountering the SI joint. When entering at 24° as we recommend, the average distance increases to 7.14 cm. Although the angle did not differ significantly, there was a significant difference between males and females in the length from the PSIS to the anterior wall, with males having 7.53 cm distance and females 6.74 cm. This is an important measurement because if the anterior ilium wall is punctured, the femoral nerve and the common, internal and external iliac arteries and veins could be damaged, resulting in retroperitoneal hemorrhage.
A fatality in 2001 in the United Kingdom led to a national audit of bone marrow aspiration and biopsies.4-6 Although these procedures were done primarily for patients with cancer, hemorrhagic events were the most frequent and serious events. This audit led to the identification of many risk factors. Bain4-6 conducted reviews of bone marrow aspirations and biopsies in the United Kingdom from 2002 to 2004. Of a total of 53,088 procedures conducted during that time frame, 48 (0.09%) adverse events occurred, with 29 (0.05%) being hemorrhagic events. Although infrequent, hemorrhagic adverse events represent significant morbidity. Reviews such as those conducted by Bain4-6 highlight the importance of a study that helps determine the optimal parameters for aspiration to ensure safety and reliability.
Hernigou and colleagues2,3 conducted studies analyzing different “sectors” in an attempt to develop a safe aspiration technique. They found that obese patients were at higher risk, and some sites of aspiration (sectors 1, 4, 5) had increased risk for perforation and damage to surrounding structures. Their sector 6, which incorporated the entirety of the PSIS table, was considered the safest, most reliable site for trocar introduction.2,3 Hernigou and colleagues,2 in comparing the bone mass of the sectors, also noted that sector 6 has the greatest bone thickness close to the entry point, making it the most favorable site. The PSIS is not just a point; it is more a “table.” The PSIS can be palpated posteriorly, but this is inaccurate and unreliable, particularly in larger individuals. The PSIS table can be identified on ultrasound before introducing the trocar, which is a more reliable method of landmark identification than palpation guidance, just as in ultrasound-guided injections7-16 and procedures.9,12,17-19
Continue to: If the PSIS is not accurately...
If the PSIS is not accurately identified, penetration laterally will result in entering the ilium wing, where it is quite narrow. We found the distance between the posterior ilium wall and the SI joint to be only 1.10 cm wide (Figure 3); we defined this area as the narrow corridor. Superior and lateral entry could damage the superior cluneal nerves coming over the iliac crest, which are located 6 cm lateral to the SI joint. Inferior and lateral entry 6 cm below the PSIS could reach the greater sciatic foramen, damaging the sacral plexus and superior gluteal artery and vein. If the entry slips above the PSIS over the pelvis, the trocar could enter the retroperitoneal space and damage the femoral nerve and common iliac artery and vein, leading to a retroperitoneal hemorrhage.4-6,20
MSCs are found as perivascular cells and lie in the cortices of bones.21 Following the approach angle and directed line from the PSIS to the anterior ilium wall described in this study (Figures 1 and 2), the trocar would pass through the narrow corridor as it advances farther into the ilium. The minimum width of this corridor was measured in this study and, on average, was 1.10 cm wide from cortex to cortex (Figure 3). As the bone marrow is aspirated from this narrow corridor, the clinician is gathering MSCs from both the lateral and medial cortices of the ilium. By aspirating from a greater surface area of the cortices, it is believed that this will increase the total collection of MSCs.
CONCLUSION
Although there are reports in the literature that describe techniques for bone marrow aspiration from the iliac crest, the techniques are very general and vague regarding the ideal angles and methods. Studies have attempted to quantify the safest entry sites for aspiration but have not detailed ideal parameters for collection. Blind aspiration from the iliac crest can have serious implications if adverse events occur, and thus there is a need for a safe and reliable method of aspiration from the iliac crest. Ultrasound guidance to identify anatomy, as opposed to palpation guidance, ensures anatomic placement of the trocar while minimizing the risk of aspiration. Based on the measurements gathered in this study, an optimal angle of entry and safe distance of penetration have been identified. Using our data and relevant literature, we developed a technique for a safe, consistent, and reliable method of bone marrow aspiration out of the iliac crest.
1. Chahla J, Mannava S, Cinque ME, Geeslin AG, Codina D, LaPrade RF. Bone marrow aspirate concentrate harvesting and processing technique. Arthrosc Tech. 2017;6(2):e441-e445. doi:10.1016/j.eats.2016.10.024.
2. Hernigou J, Alves A, Homma Y, Guissou I, Hernigou P. Anatomy of the ilium for bone marrow aspiration: map of sectors and implication for safe trocar placement. Int Orthop. 2014;38(12):2585-2590. doi:10.1007/s00264-014-2353-7.
3. Hernigou J, Picard L, Alves A, Silvera J, Homma Y, Hernigou P. Understanding bone safety zones during bone marrow aspiration from the iliac crest: the sector rule. Int Orthop. 2014;38(11):2377-2384. doi:10.1007/s00264-014-2343-9.
4. Bain BJ. Bone marrow biopsy morbidity: review of 2003. J Clin Pathol. 2005;58(4):406-408. doi:10.1136/jcp.2004.022178.
5. Bain BJ. Bone marrow biopsy morbidity and mortality: 2002 data. Clin Lab Haematol. 2004;26(5):315-318. doi:10.1111/j.1365-2257.2004.00630.x.
6. Bain BJ. Morbidity associated with bone marrow aspiration and trephine biopsy - a review of UK data for 2004. Haematologica. 2006;91(9):1293-1294.
7. Berkoff DJ, Miller LE, Block JE. Clinical utility of ultrasound guidance for intra-articular knee injections: a review. Clin Interv Aging. 2012;7:89-95. doi:10.2147/CIA.S29265.
8. Henkus HE, Cobben LP, Coerkamp EG, Nelissen RG, van Arkel ER. The accuracy of subacromial injections: a prospective randomized magnetic resonance imaging study. Arthroscopy. 2006;22(3):277-282. doi:10.1016/j.arthro.2005.12.019.
9. Hirahara AM, Panero AJ. A guide to ultrasound of the shoulder, part 3: interventional and procedural uses. Am J Orthop. 2016;45(7):440-445.
10. Jackson DW, Evans NA, Thomas BM. Accuracy of needle placement into the intra-articular space of the knee. J Bone Joint Surg Am. 2002;84-A(9):1522-1527.
11. Naredo E, Cabero F, Beneyto P, et al. A randomized comparative study of short term response to blind versus sonographic-guided injection of local corticosteroids in patients with painful shoulder. J Rheumatol. 2004;31(2):308-314.
12. Panero AJ, Hirahara AM. A guide to ultrasound of the shoulder, part 2: the diagnostic evaluation. Am J Orthop. 2016;45(4):233-238.
13. Sethi PM, El Attrache N. Accuracy of intra-articular injection of the glenohumeral joint: a cadaveric study. Orthopedics. 2006;29(2):149-152.
14. Sibbit WL Jr, Peisajovich A, Michael AA, et al. Does sonographic needle guidance affect the clinical outcome of intraarticular injections? J Rheumatol. 2009;36(9):1892-1902. doi:10.3899/jrheum.090013.
15. Smith J, Brault JS, Rizzo M, Sayeed YA, Finnoff JT. Accuracy of sonographically guided and palpation guided scaphotrapeziotrapezoid joint injections. J Ultrasound Med. 2011;30(11):1509-1515. doi:10.7863/jum.2011.30.11.1509.
16. Yamakado K. The targeting accuracy of subacromial injection to the shoulder: an arthrographic evaluation. Arthroscopy. 2002;18(8):887-891.
17. Hirahara AM, Andersen WJ. Ultrasound-guided percutaneous reconstruction of the anterolateral ligament: surgical technique and case report. Am J Orthop. 2016;45(7):418-422, 460.
18. Hirahara AM, Andersen WJ. Ultrasound-guided percutaneous repair of medial patellofemoral ligament: surgical technique and outcomes. Am J Orthop. 2017;46(3):152-157.
19. Hirahara AM, Mackay G, Andersen WJ. Ultrasound-guided InternalBrace of the medial collateral ligament. Arthrosc Tech. Submitted.
20. Jamaludin WFW, Mukari SAM, Wahid SFA. Retroperitoneal hemorrhage associated with bone marrow trephine biopsy. Am J Case Rep. 2013;14:489-493. doi:10.12659/AJCR.889274.
21. Bianco P, Cao X, Frenette PS, et al. The meaning, the sense and the significance: translating the science of mesenchymal stem cells into medicine. Nat Med. 2013;19(1):35-42. doi:10.1038/nm.3028.
TAKE-HOME POINTS
- There is an ideal angle and distance for optimization of a bone marrow harvest from the iliac crest.
- Ultrasound is a reliable technology that allows clinicians to accurately and consistently identify the PSIS and avoid neurovascular structures.
- This safe, reliable bone marrow aspiration technique can lower the risk of serious potential complications.
- The ideal angle does not differ significantly between sexes, but the safe distance a clinician can advance does.
- The PSIS should be considered a “table” as opposed to a protuberance.
Participation in Work and Sport Following Reverse and Total Shoulder Arthroplasty
ABSTRACT
Both anatomical total shoulder arthroplasty (TSA) and reverse shoulder arthroplasty (RSA) are routinely performed for patients who desire to continuously work or participate in sports. This study analyzes and compares the ability of patients to work and partake in sports following shoulder arthroplasty based on responses to clinical outcome surveys.
A retrospective review of the shoulder surgery repository was performed for all patients treated with TSA and RSA and who completed questions 9 and 10 on the activity patient self-evaluation portion of the American Shoulder and Elbow Surgeons (ASES) Assessment Form. Patients with a minimum of 1-year follow-up were included if a sport or work was identified. The analysis included 162 patients with TSA and 114 patients with RSA. Comparisons were made between TSA and RSA in terms of the specific ASES scores (rated 0-3) reported for ability to work and participate in sports and total ASES scores, and scores based on specific sports or line of work reported. Comparisons were also made between sports predominantly using shoulder function and those that do not.
TSA patients had a 27% higher ability to participate in sports (average specific ASES score: 2.5 vs 1.9, P < .001) than RSA patients and presented significantly higher scores for swimming and golf. Compared with RSA patients, TSA patients demonstrated more ability to participate in sports requiring shoulder function without difficulty, as 63% reported maximal scores (P = .003). Total shoulder arthroplasty patients also demonstrated a 21% higher ability to work than RSA patients (average specific ASES scores: 2.6 vs 2.1, P < .001), yielding significantly higher scores for housework and gardening.
Both TSA and RSA allow for participation in work and sports, with TSA patients reporting better overall ability to participate. For sports involving shoulder function, TSA patients more commonly report maximal ability to participate than RSA patients.
End-stage shoulder arthritis has been successfully treated with anatomical total shoulder arthroplasty (TSA) with high rates of functional recovery.1 With the introduction of reverse shoulder arthroplasty (RSA), indications for TSA have expanded.2-6 With continuing expansion of surgical indications, a more diverse and potentially active patient population is now being treated. As patients exhibit increased awareness of health and wellness, they demonstrate significant interest in understanding their ability to work or participate in sports after surgery.7 Patients no longer focus on pain relief as the only goal of surgery. A recent study of patients aged 65 years and undergoing shoulder arthroplasty revealed that 64% of the patients listed the ability to return to sports as the main reason for undergoing surgery,8 highlighting the significance of sports play in a patient’s life. Prior to surgery, shoulder pathologies lead to impairment in function, range of motion, and pain,9 hindering a patient to participate in both work and sports. With the intervention yielding improvement to these areas6,9-13 with increased patient satisfaction,10,13 accurately tailoring patient expectations for participation in sports and work postoperatively becomes increasingly important.
Continue to: Although several studies...
Although several studies have demonstrated the ability of patients to return to sports following TSA,8,14-18 a limited number of studies discuss the return to sports following RSA.19-21 Despite known postoperative improvements, no clear consensus is reached as to which specific sports patients can return to and at what level of participation is to be expected. Surveyed members of the American Shoulder and Elbow Surgeons (ASES) universally favored full return to sports, except for contact sports for TSA patients, whereas other surgeons are more conservative to allow RSA patients to return to activities.22 To our knowledge, no other study has investigated the ability to work following RSA. Furthermore, no other study has used patient-reported outcomes to compare the quality of participation in sports or work between TSA and RSA patients following surgery. This study reports the ability of patients treated with TSA and RSA to work and participate in sports based on clinical outcome surveys. We hypothesize that TSA patients will be allowed to work and participate in sports with less difficulty than RSA patients.
MATERIALS AND METHODS
Following Institutional Review Board approval, a retrospective review was performed on all patients treated with TSA or RSA and who completed questions 9 and/or 10 (by score and named usual sport and/or work) on the activity patient self-evaluation portion of the ASES23 Assessment Form between 2007 to 2014; queries were made via the Shoulder Outcomes Repository. A minimum of 12-month follow-up was required, as functional recovery has been shown to plateau or nearly plateau by 12 months.11 Patients were excluded if <12 months of follow-up was available, if they failed to provide a written answer for questions 9 or 10 on the activity patient self-evaluation portion of the ASES Assessment Form, or if they required a revision shoulder arthroplasty. A single fellowship-trained shoulder and elbow surgeon performed all procedures via the same deltopectoral approach and prescribed identical postoperative rehabilitation for both TSA and RSA patients. The database query yielded 162 TSA and 114 RSA patients, for a total of 276 patients eligible for the study.
For all patients, the most recent follow-up ASES score was used. Comparisons were made between TSA and RSA for total ASES scores and response groups for usual sport (ASES question 9) and usual work (ASES question 10). The ASES questionnaire provides patients with 4 choices for each question based on the ability to perform each activity: 0, unable to do; 1, very difficult; 2, somewhat difficult; and 3, not difficult. The questionnaire also allows the patients to identify their usual work and sports. If patients noted >1 sport or work activity, they were included within multiple subgroups. Patients were further compared by age and gender.
Work was subdivided to include retired, housework, desk jobs, prolonged standing, gardening/yard work, jobs requiring lifting, carpenter/construction, cook/food preparation, and creative jobs (Table 1). 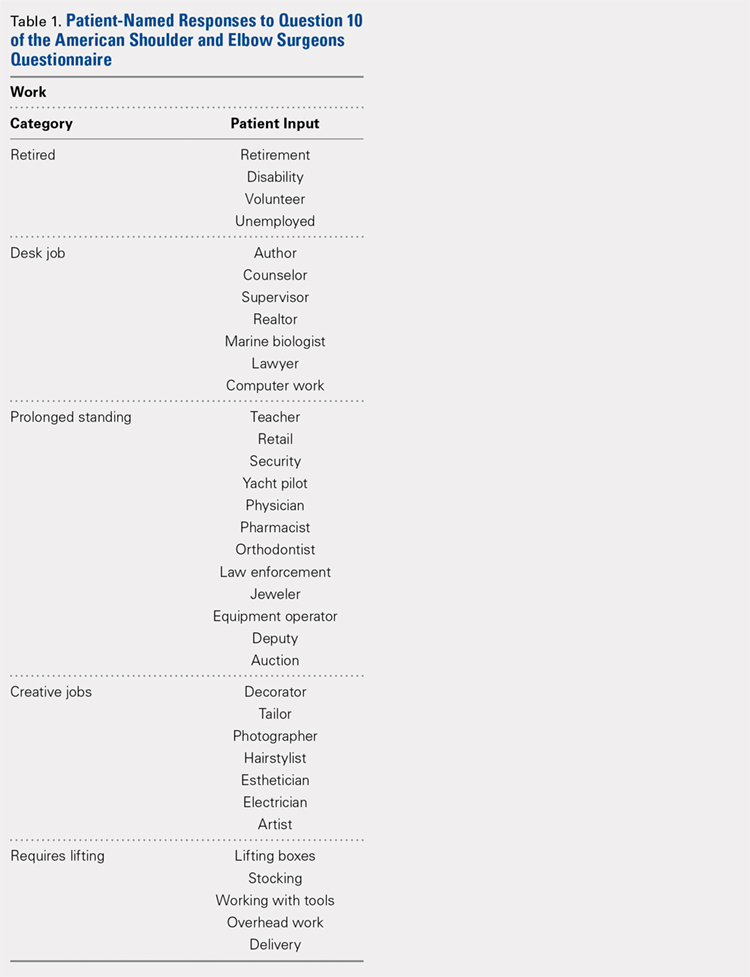
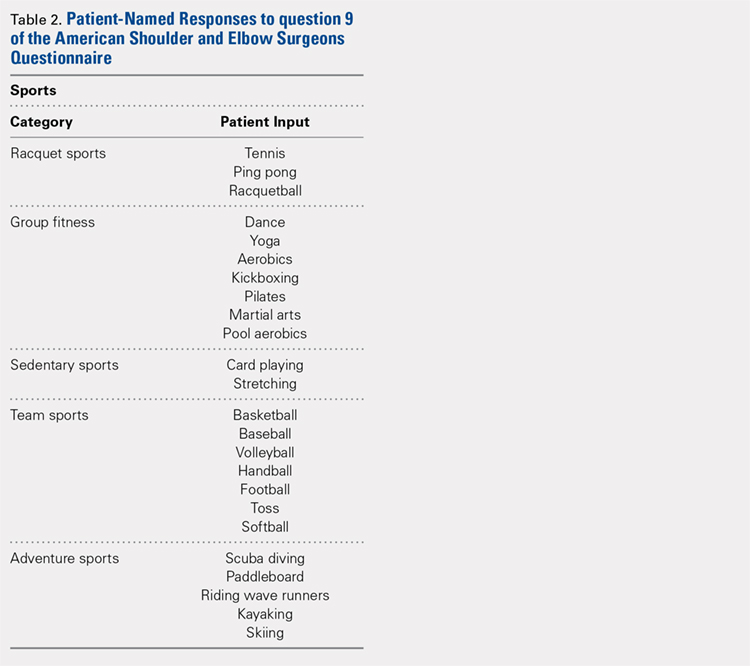
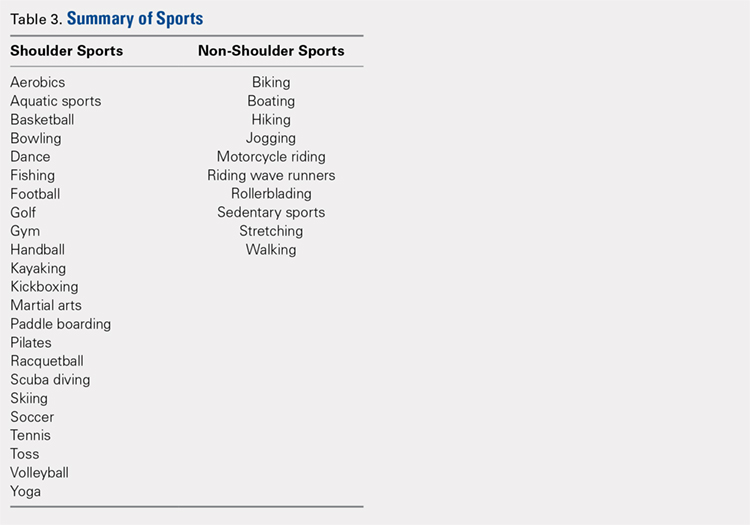
Statistical analysis was performed with SPSS Version 21 (IBM). Unpaired t tests were used to determine differences between groups. A P-value of <.05 was deemed significant.
Continue to: A total of 276 patients...
RESULTS
A total of 276 patients that met the inclusion criteria were eligible for the study, with 162 having undergone TSA and 114 with RSA. Overall average follow-up totaled 29 months (range, 12-91 months). RSA patients (average age, 75 years old; range, 46-88 years) were significantly older than TSA patients (average age, 69 years old; range, 32-89 years; P = .001). Significantly more women were treated with TSA (52% TSA; 48% RSA; P = .012), whereas significantly more men were treated with TSA (67% TSA; 33% RSA, P = .012). Total ASES scores were significantly higher for TSA patients than RSA patients in work (P = .012) (Table 4) but not in sports (P = .063) (Table 5) categories. 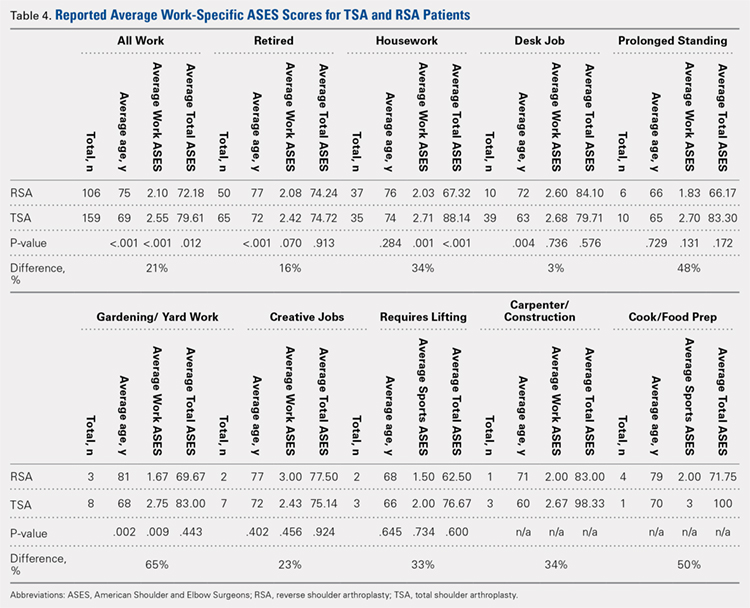
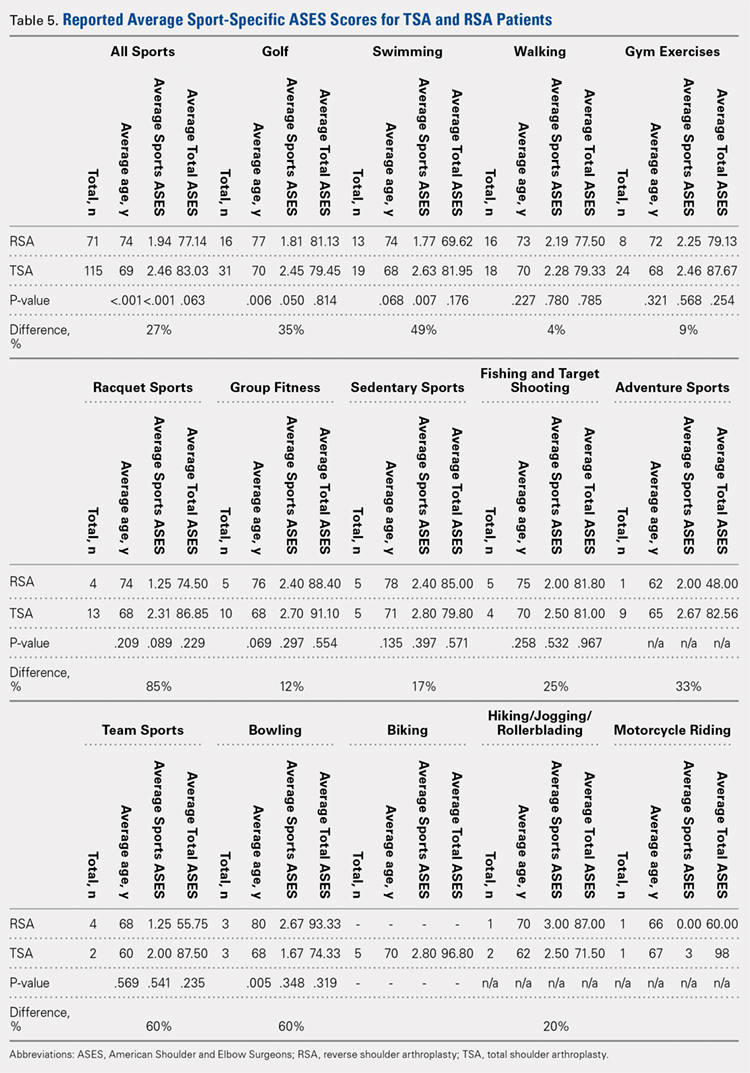
SPORTS
A total of 186 patients, comprising of 71 RSA and 115 TSA individuals, responded to question 9 of the ASES questionnaire (Table 5). Among usually reported sports, golf (25%), swimming (17%), and walking (18%) were the most commonly cited. RSA patients indicating a sport were significantly older than TSA patients (74 years vs 69 years, P < .001). TSA patients reported a 27% higher difference in overall ability to participate in sports, with an average ASES sport-specific score of 2.5 compared with the 1.9 for RSA patients (P < .001).
Among specific sports, TSA patients reported significantly higher scores for swimming (2.6 vs 1.8, P = .007) and golf (2.5 vs 1.8, P = .050). However, no significant differences were observed for walking, gym exercises, and racquet sports (Table 5). Among sport subsets, RSA patients were significantly older for golf (77 years vs 70 years, P = .006) and bowling (80 years vs 68 years, P = .005). Five TSA patients reported biking as their sport, whereas no RSA patient reported such activity. Within each subset of sports, no significant differences were noted in average ASES total scores.
TSA patients demonstrated a more significant ability to perform usual sports that involve shoulder function without difficulty (score of 3). In shoulder dominant sports, a total of 63% of TSA patients reported a score of 3 compared with the 39% of RSA patients (P = .003). RSA patients more often reported an inability to perform shoulder specific sports, as proven by 20% of RSA patients reporting a score of 0 compared with 4% of TSA patients (P < .001) (Table 6). 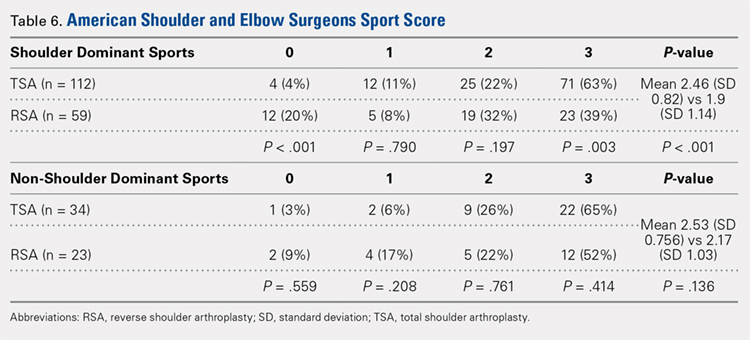
WORK
A total of 265 patients, including 106 RSA and 159 TSA patients, responded to question 10 of the ASES questionnaire. Among usually reported work, retirement (43%), housework (27%), and desk jobs (18%) were the most commonly cited. RSA patients denoting a work were significantly older than TSA patients (75 years vs 69 years, P < .001). Patients with TSA presented a 21% higher difference in the overall ability to work, featuring an average ASES work-specific score of 2.6 compared with the 2.1 for RSA patients (P < .001) (Table 4).
Continue to: Among specific work activities...
Among specific work activities, TSA patients reported significantly higher scores for housework (2.7 vs 2; 34% difference; P = .001) and gardening (2.8 vs 1.7; 65% difference; P = .009) in comparison with RSA patients. However, no significant differences were observed for other work activities, including retirement, desk job, prolonged standing, creative jobs, lifting jobs, or construction (Table 4). Among the work subgroups, RSA patients were older than TSA patients for the retired group (77 years vs 72 years; P < .001) and gardening (81 years vs 68 years; P = .002).
DISCUSSION
The ability to participate in sports and work is a common goal for shoulder arthroplasty patients. However, the ability at which participation occurs has not been examined. This study illustrates not only the ability to engage in usual work or sport, but provides some insights into patient-reported quality of participation. Overall, TSA patients featured 27% higher sport-specific ASES scores and 21% higher work-specific ASES scores than RSA patients, confirming our hypothesis that TSA patients can participate in work or sports with less difficulty in general. This study is the first to stratify the difficulty of participating in sports in general and in specific sports identified by patients. Although statistical analysis was performed for individual sports and work reported, the use of small cohorts possibly affected the ability to detect significant differences. The data presented in this study can thus be used as descriptive evidence of what a patient may expect to be able to do following surgery, helping to define patient expectations prior to electing to undergo shoulder arthroplasty.
Among specific sports identified by patients, a few significant differences were observed between RSA and TSA patients. However, ASES-specific scores almost universally favored TSA. Of the sport subgroups, swimming and golf showed significant differences. For swimming, this difference was fairly significant, as TSA patients demonstrated a 49% higher score than their RSA counterparts, but without differences in age or total ASES score (Table 5). Alteration in shoulder mechanics after RSA may be used to explain the difficulty in returning to swimming, as additional time may be needed to adapt to new mechanics.24 McCarty and colleagues8 demonstrated that 90% of patients following TSA fully resumed participation in swimming within 6 months of surgery, and further stated that repetitive motions of swimming caused no effects on short-term outcomes. No similar analysis of swimming has been reported for RSA patients. Based upon our findings, the average RSA patient can experience some difficulties when returning to swimming after surgery (average specific ASES score, 1.8).
Jensen and Rockwood16 were among the first to demonstrate successful return to golf of 24 patients who had undergone either TSA or hemiarthroplasty (HA), showing a 5-stroke improvement in their game. A recent study investigating patient-reported activity in patients aged 75 years and undergoing RSA showed that 23% of patients returned to high-level activity sports, such as golf, motorcycle riding, or free weights.19 All patients who participated in golf before surgery resumed playing following surgery; however, golf was listed among the top activities that patients wanted to participate in but could not for any reason.19 Our data suggest that golfers with TSA will face less difficulty returning to sports compared with their RSA counterparts (average specific ASES score, 2.5 vs 1.8, who might find golf somewhat difficult.
Although no study has provided a clear consensus as to which activities are safe to perform following shoulder arthroplasty, experts have suggested that activities that impart high loads on the glenohumeral joint should be avoided.15 Among TSA patients, McCarty and colleagues8 reported high rates of return for swimmers, golfers, and tennis players; however, relatively low rates were reported for weight lifting, bowling, and softball (20%). Within our study group, golf, swimming, and walking were listed among the most popular sports performed. Although weight lifting, bowling, and softball were less commonly identified as usual sports within our study, patients treated with TSA demonstrated more ease to participate than RSA patients. This result was observed with ASES-specific scores noted for weight lifting and gym exercises (TSA, 2.5; RSA, 2.3) and team sports, such as softball (TSA, 2; RSA, 1.3). However, for bowling, RSA patients showed a trend toward more ability (RSA, 2.7; TSA, 1.7).
Continue to: Among specific work activities...
Successful return to sports that involve shoulder function, such as golf and swimming, has been demonstrated for TSA.8,14,16,17 However, studies have reported that return to these sports can be difficult for RSA patients.20 Fink and colleagues19 reported that following RSA, 48.7% of patients returned to moderate-intensity sports, such as swimming and golf. Consistent with these findings, in our study, TSA patients demonstrated a significantly higher ability to participate in their usual sports without difficulty (ASES-specific score of 3). This observation may relate to lower ultimate achievements in range of motion and strength in patients treated with RSA, when compared with TSA patients,24,25 and the generalized practice of utilizing RSA for lower-demand patients (RSA patients in this study were older).
Overall, participation in work was 21% easier for TSA patients than RSA patients. Although the majority of our patients cited retirement as their primary work, which is consistent with what one would expect with the mean age of this study’s cohorts (RSA, 75 years; TSA, 69 years), housework and gardening were the only specifically identified forms of work that demonstrated significant differences between RSA and TSA patients. A few reports in the literature documented the ability to return to work after shoulder arthroplasty. In a recent report on 13 workers’ compensation patients treated with TSA, only 1 patient returned to the same job, and 54% did not return to work.26 In a study comparing 14 workers’ compensation to a matched group of controls with all members treated with RSA, the workers’ compensation group yielded a lower return-to-work rate (14.2%) than the controls (41.7%).27 In a large study of 154 TSA patients, 14% returned to work, but specific jobs were not described in this analysis.14
The results of this study suggest that more TSA patients successfully participate in low-demand activities, such as gardening or housework. Zarkadas and colleagues18 reported that 65% of TSA and 47% of HA patients successfully returned to gardening compared with 42% of RSA patients observed in a continuation study.20 This study showed that TSA patients yielded a 65% difference in ability to work in gardening and 34% difference in ability to perform housework compared with RSA patients. Based on these findings, TSA patients can expect to experience no difficulty in performing housework or gardening, whereas RSA patients may find these tasks difficult to a certain degree.
The main limitation of this study is the reporting bias that results from survey-based studies. Possibly, more people engage in specific sports or work than what were reported. This type of study also features an inherent selection bias, as patients with highly and physically demanding jobs or usual sports were less likely to have been offered either TSA or RSA. An additional important limitation is the relatively small cohorts within sport and work subgroups; the small cohorts probably underpowered the statistical results of this study and made these findings valuable mostly as descriptive observations. Larger studies focusing on each subgroup will further clarify the ability of shoulder arthroplasty to perform individual sports or work. Further studies evaluating preoperative to postoperative sports- and work-specific ASES scores would provide notable insights into the functional improvements observed within each sport or work following surgery. The relatively large study population of 276 patients strengthened the findings, which relate to the overall ability to participate in sports and work for TSA and RSA patients. Finally, the evaluated TSA and RSA patients possibly represent different groups (significant difference in age and gender) with different underlying pathologies and potentially different demands and expectations. However, comparisons among these groups of patients bear importance in defining patient expectations related to surgery. Still, the ability to participate in sport or work possibly relates more to the limitations of the implant used than patient pathology. This possibility warrants further investigation.
CONCLUSION
Both TSA and RSA allow for participation in work and sports, with TSA patients reporting easier overall ability to participate. For sports involving shoulder function, TSA patients more commonly report maximal ability to participate than RSA patients.
1. Fehringer EV, Kopjar B, Boorman RS, Churchill RS, Smith KL, Matsen FA 3rd. Characterizing the functional improvement after total shoulder arthroplasty for osteoarthritis. J Bone Joint Surg Am. 2002;84-A(8):1349-1353.
2. Cuff DJ, Pupello DR. Comparison of hemiarthroplasty and reverse shoulder arthroplasty for the treatment of proximal humeral fractures in elderly patients. J Bone Joint Surg Am. 2013;95(22):2050-2055. doi:10.2106/JBJS.L.01637.
3. Guery J, Favard L, Sirveaux F, Oudet D, Mole D, Walch G. Reverse total shoulder arthroplasty. Survivorship analysis of eighty replacements followed for five to ten years. J Bone Joint Surg Am. 2006;88(8):1742-1747.
4. Levy JC, Virani N, Pupello D, Frankle M. Use of the reverse shoulder prosthesis for the treatment of failed hemiarthroplasty in patients with glenohumeral arthritis and rotator cuff deficiency. J Bone Joint Surg Br. 2007;89(2):189-195.
5. Patel DN, Young B, Onyekwelu I, Zuckerman JD, Kwon YW. Reverse total shoulder arthroplasty for failed shoulder arthroplasty. J Shoulder Elbow Surg. 2012;21(11):1478-1483. doi:10.1016/j.jse.2011.11.004.
6. Sebastia-Forcada E, Cebrian-Gomez R, Lizaur-Utrilla A, Gil-Guillen V. Reverse shoulder arthroplasty versus hemiarthroplasty for acute proximal humeral fractures. A blinded, randomized, controlled, prospective study. J Shoulder Elbow Surg. 2014;23(10):1419-1426. doi:10.1016/j.jse.2014.06.035.
7. Henn RF 3rd, Ghomrawi H, Rutledge JR, Mazumdar M, Mancuso CA, Marx RG. Preoperative patient expectations of total shoulder arthroplasty. J Bone Joint Surg Am. 2011;93(22):2110-2115. doi:10.2106/JBJS.J.01114.
8. McCarty EC, Marx RG, Maerz D, Altchek D, Warren RF. Sports participation after shoulder replacement surgery. Am J Sports Med. 2008;36(8):1577-1581. doi:10.1177/0363546508317126.
9. Puskas B, Harreld K, Clark R, Downes K, Virani NA, Frankle M. Isometric strength, range of motion, and impairment before and after total and reverse shoulder arthroplasty. J Shoulder Elbow Surg. 2013;22(7):869-876. doi:10.1016/j.jse.2012.09.004.
10. Deshmukh AV, Koris M, Zurakowski D, Thornhill TS. Total shoulder arthroplasty: long-term survivorship, functional outcome, and quality of life. J Shoulder Elbow Surg. 2005;14(5):471-479.
11. Levy JC, Everding NG, Gil CC Jr., Stephens S, Giveans MR. Speed of recovery after shoulder arthroplasty: a comparison of reverse and anatomic total shoulder arthroplasty. J Shoulder Elbow Surg. 2014;23(12):1872-1881. doi:10.1016/j.jse.2014.04.014.
12. Nolan BM, Ankerson E, Wiater JM. Reverse total shoulder arthroplasty improves function in cuff tear arthropathy. Clin Orthop Relat Res. 2011;469(9):2476-2482. doi:10.1007/s11999-010-1683-z.
13. Norris TR, Iannotti JP. Functional outcome after shoulder arthroplasty for primary osteoarthritis: a multicenter study. J Shoulder Elbow Surg. 2002;11(2):130-135.
14. Bulhoff M, Sattler P, Bruckner T, Loew M, Zeifang F, Raiss P. Do patients return to sports and work after total shoulder replacement surgery? Am J Sports Med. 2015;43(2):423-427. doi:10.1177/0363546514557940.
15. Healy WL, Iorio R, Lemos MJ. Athletic activity after joint replacement. Am J Sports Med. 2001;29(3):377-388.
16. Jensen KL, Rockwood CA Jr. Shoulder arthroplasty in recreational golfers. J Shoulder Elbow Surg. 1998;7(4):362-367.
17. Schumann K, Flury MP, Schwyzer HK, Simmen BR, Drerup S, Goldhahn J. Sports activity after anatomical total shoulder arthroplasty. Am J Sports Med. 2010;38(10):2097-2105. doi:10.1177/0363546510371368.
18. Zarkadas PC, Throckmorton TQ, Dahm DL, Sperling J, Schleck CD, Cofield R. Patient reported activities after shoulder replacement: total and hemiarthroplasty. J Shoulder Elbow Surg. 2011;20(2):273-280. doi:10.1016/j.jse.2010.06.007.
19. Fink Barnes LA, Grantham WJ, Meadows MC, Bigliani LU, Levine WN, Ahmad CS. Sports activity after reverse total shoulder arthroplasty with minimum 2-year follow-up. Am J Orthop. 2015;44(2):68-72.
20. Lawrence TM, Ahmadi S, Sanchez-Sotelo J, Sperling JW, Cofield RH. Patient reported activities after reverse shoulder arthroplasty: part II. J Shoulder Elbow Surg. 2012;21(11):1464-1469. doi:10.1016/j.jse.2011.11.012.
21. Simovitch RW, Gerard BK, Brees JA, Fullick R, Kearse JC. Outcomes of reverse total shoulder arthroplasty in a senior athletic population. J Shoulder Elbow Surg. 2015;24(9):1481-1485. doi:10.1016/j.jse.2015.03.011.
22. Golant A, Christoforou D, Zuckerman JD, Kwon YW. Return to sports after shoulder arthroplasty: a survey of surgeons' preferences. J Shoulder Elbow Surg. 2012;21(4):554-560. doi:10.1016/j.jse.2010.11.021.
23. Michener LA, McClure PW, Sennett BJ. American Shoulder and Elbow Surgeons Standardized Shoulder Assessment Form, patient self-report section: reliability, validity, and responsiveness. J Shoulder Elbow Surg. 2002;11(6):587-594.
24. Alta TD, de Toledo JM, Veeger HE, Janssen TW, Willems WJ. The active and passive kinematic difference between primary reverse and total shoulder prostheses. J Shoulder Elbow Surg. 2014;23(9):1395-1402. doi:10.1016/j.jse.2014.01.040.
25. Alta TD, Veeger DH, de Toledo JM, Janssen TW, Willems WJ. Isokinetic strength differences between patients with primary reverse and total shoulder prostheses: muscle strength quantified with a dynamometer. Clin Biomech (Bristol, Avon). 2014;29(9):965-970. doi:10.1016/j.clinbiomech.2014.08.018.
26. Jawa A, Dasti UR, Fasulo SM, Vaickus MH, Curtis AS, Miller SL. Anatomic total shoulder arthroplasty for patients receiving workers' compensation. J Shoulder Elbow Surg. 2015;24(11):1694-1697. doi:10.1016/j.jse.2015.04.017.
27. Morris BJ, Haigler RE, Laughlin MS, Elkousy HA, Gartsman GM, Edwards TB. Workers' compensation claims and outcomes after reverse shoulder arthroplasty. J Shoulder Elbow Surg. 2015;24(3):453-459. doi:10.1016/j.jse.2014.07.009.
ABSTRACT
Both anatomical total shoulder arthroplasty (TSA) and reverse shoulder arthroplasty (RSA) are routinely performed for patients who desire to continuously work or participate in sports. This study analyzes and compares the ability of patients to work and partake in sports following shoulder arthroplasty based on responses to clinical outcome surveys.
A retrospective review of the shoulder surgery repository was performed for all patients treated with TSA and RSA and who completed questions 9 and 10 on the activity patient self-evaluation portion of the American Shoulder and Elbow Surgeons (ASES) Assessment Form. Patients with a minimum of 1-year follow-up were included if a sport or work was identified. The analysis included 162 patients with TSA and 114 patients with RSA. Comparisons were made between TSA and RSA in terms of the specific ASES scores (rated 0-3) reported for ability to work and participate in sports and total ASES scores, and scores based on specific sports or line of work reported. Comparisons were also made between sports predominantly using shoulder function and those that do not.
TSA patients had a 27% higher ability to participate in sports (average specific ASES score: 2.5 vs 1.9, P < .001) than RSA patients and presented significantly higher scores for swimming and golf. Compared with RSA patients, TSA patients demonstrated more ability to participate in sports requiring shoulder function without difficulty, as 63% reported maximal scores (P = .003). Total shoulder arthroplasty patients also demonstrated a 21% higher ability to work than RSA patients (average specific ASES scores: 2.6 vs 2.1, P < .001), yielding significantly higher scores for housework and gardening.
Both TSA and RSA allow for participation in work and sports, with TSA patients reporting better overall ability to participate. For sports involving shoulder function, TSA patients more commonly report maximal ability to participate than RSA patients.
End-stage shoulder arthritis has been successfully treated with anatomical total shoulder arthroplasty (TSA) with high rates of functional recovery.1 With the introduction of reverse shoulder arthroplasty (RSA), indications for TSA have expanded.2-6 With continuing expansion of surgical indications, a more diverse and potentially active patient population is now being treated. As patients exhibit increased awareness of health and wellness, they demonstrate significant interest in understanding their ability to work or participate in sports after surgery.7 Patients no longer focus on pain relief as the only goal of surgery. A recent study of patients aged 65 years and undergoing shoulder arthroplasty revealed that 64% of the patients listed the ability to return to sports as the main reason for undergoing surgery,8 highlighting the significance of sports play in a patient’s life. Prior to surgery, shoulder pathologies lead to impairment in function, range of motion, and pain,9 hindering a patient to participate in both work and sports. With the intervention yielding improvement to these areas6,9-13 with increased patient satisfaction,10,13 accurately tailoring patient expectations for participation in sports and work postoperatively becomes increasingly important.
Continue to: Although several studies...
Although several studies have demonstrated the ability of patients to return to sports following TSA,8,14-18 a limited number of studies discuss the return to sports following RSA.19-21 Despite known postoperative improvements, no clear consensus is reached as to which specific sports patients can return to and at what level of participation is to be expected. Surveyed members of the American Shoulder and Elbow Surgeons (ASES) universally favored full return to sports, except for contact sports for TSA patients, whereas other surgeons are more conservative to allow RSA patients to return to activities.22 To our knowledge, no other study has investigated the ability to work following RSA. Furthermore, no other study has used patient-reported outcomes to compare the quality of participation in sports or work between TSA and RSA patients following surgery. This study reports the ability of patients treated with TSA and RSA to work and participate in sports based on clinical outcome surveys. We hypothesize that TSA patients will be allowed to work and participate in sports with less difficulty than RSA patients.
MATERIALS AND METHODS
Following Institutional Review Board approval, a retrospective review was performed on all patients treated with TSA or RSA and who completed questions 9 and/or 10 (by score and named usual sport and/or work) on the activity patient self-evaluation portion of the ASES23 Assessment Form between 2007 to 2014; queries were made via the Shoulder Outcomes Repository. A minimum of 12-month follow-up was required, as functional recovery has been shown to plateau or nearly plateau by 12 months.11 Patients were excluded if <12 months of follow-up was available, if they failed to provide a written answer for questions 9 or 10 on the activity patient self-evaluation portion of the ASES Assessment Form, or if they required a revision shoulder arthroplasty. A single fellowship-trained shoulder and elbow surgeon performed all procedures via the same deltopectoral approach and prescribed identical postoperative rehabilitation for both TSA and RSA patients. The database query yielded 162 TSA and 114 RSA patients, for a total of 276 patients eligible for the study.
For all patients, the most recent follow-up ASES score was used. Comparisons were made between TSA and RSA for total ASES scores and response groups for usual sport (ASES question 9) and usual work (ASES question 10). The ASES questionnaire provides patients with 4 choices for each question based on the ability to perform each activity: 0, unable to do; 1, very difficult; 2, somewhat difficult; and 3, not difficult. The questionnaire also allows the patients to identify their usual work and sports. If patients noted >1 sport or work activity, they were included within multiple subgroups. Patients were further compared by age and gender.
Work was subdivided to include retired, housework, desk jobs, prolonged standing, gardening/yard work, jobs requiring lifting, carpenter/construction, cook/food preparation, and creative jobs (Table 1).
Statistical analysis was performed with SPSS Version 21 (IBM). Unpaired t tests were used to determine differences between groups. A P-value of <.05 was deemed significant.
Continue to: A total of 276 patients...
RESULTS
A total of 276 patients that met the inclusion criteria were eligible for the study, with 162 having undergone TSA and 114 with RSA. Overall average follow-up totaled 29 months (range, 12-91 months). RSA patients (average age, 75 years old; range, 46-88 years) were significantly older than TSA patients (average age, 69 years old; range, 32-89 years; P = .001). Significantly more women were treated with TSA (52% TSA; 48% RSA; P = .012), whereas significantly more men were treated with TSA (67% TSA; 33% RSA, P = .012). Total ASES scores were significantly higher for TSA patients than RSA patients in work (P = .012) (Table 4) but not in sports (P = .063) (Table 5) categories.
SPORTS
A total of 186 patients, comprising of 71 RSA and 115 TSA individuals, responded to question 9 of the ASES questionnaire (Table 5). Among usually reported sports, golf (25%), swimming (17%), and walking (18%) were the most commonly cited. RSA patients indicating a sport were significantly older than TSA patients (74 years vs 69 years, P < .001). TSA patients reported a 27% higher difference in overall ability to participate in sports, with an average ASES sport-specific score of 2.5 compared with the 1.9 for RSA patients (P < .001).
Among specific sports, TSA patients reported significantly higher scores for swimming (2.6 vs 1.8, P = .007) and golf (2.5 vs 1.8, P = .050). However, no significant differences were observed for walking, gym exercises, and racquet sports (Table 5). Among sport subsets, RSA patients were significantly older for golf (77 years vs 70 years, P = .006) and bowling (80 years vs 68 years, P = .005). Five TSA patients reported biking as their sport, whereas no RSA patient reported such activity. Within each subset of sports, no significant differences were noted in average ASES total scores.
TSA patients demonstrated a more significant ability to perform usual sports that involve shoulder function without difficulty (score of 3). In shoulder dominant sports, a total of 63% of TSA patients reported a score of 3 compared with the 39% of RSA patients (P = .003). RSA patients more often reported an inability to perform shoulder specific sports, as proven by 20% of RSA patients reporting a score of 0 compared with 4% of TSA patients (P < .001) (Table 6).
WORK
A total of 265 patients, including 106 RSA and 159 TSA patients, responded to question 10 of the ASES questionnaire. Among usually reported work, retirement (43%), housework (27%), and desk jobs (18%) were the most commonly cited. RSA patients denoting a work were significantly older than TSA patients (75 years vs 69 years, P < .001). Patients with TSA presented a 21% higher difference in the overall ability to work, featuring an average ASES work-specific score of 2.6 compared with the 2.1 for RSA patients (P < .001) (Table 4).
Continue to: Among specific work activities...
Among specific work activities, TSA patients reported significantly higher scores for housework (2.7 vs 2; 34% difference; P = .001) and gardening (2.8 vs 1.7; 65% difference; P = .009) in comparison with RSA patients. However, no significant differences were observed for other work activities, including retirement, desk job, prolonged standing, creative jobs, lifting jobs, or construction (Table 4). Among the work subgroups, RSA patients were older than TSA patients for the retired group (77 years vs 72 years; P < .001) and gardening (81 years vs 68 years; P = .002).
DISCUSSION
The ability to participate in sports and work is a common goal for shoulder arthroplasty patients. However, the ability at which participation occurs has not been examined. This study illustrates not only the ability to engage in usual work or sport, but provides some insights into patient-reported quality of participation. Overall, TSA patients featured 27% higher sport-specific ASES scores and 21% higher work-specific ASES scores than RSA patients, confirming our hypothesis that TSA patients can participate in work or sports with less difficulty in general. This study is the first to stratify the difficulty of participating in sports in general and in specific sports identified by patients. Although statistical analysis was performed for individual sports and work reported, the use of small cohorts possibly affected the ability to detect significant differences. The data presented in this study can thus be used as descriptive evidence of what a patient may expect to be able to do following surgery, helping to define patient expectations prior to electing to undergo shoulder arthroplasty.
Among specific sports identified by patients, a few significant differences were observed between RSA and TSA patients. However, ASES-specific scores almost universally favored TSA. Of the sport subgroups, swimming and golf showed significant differences. For swimming, this difference was fairly significant, as TSA patients demonstrated a 49% higher score than their RSA counterparts, but without differences in age or total ASES score (Table 5). Alteration in shoulder mechanics after RSA may be used to explain the difficulty in returning to swimming, as additional time may be needed to adapt to new mechanics.24 McCarty and colleagues8 demonstrated that 90% of patients following TSA fully resumed participation in swimming within 6 months of surgery, and further stated that repetitive motions of swimming caused no effects on short-term outcomes. No similar analysis of swimming has been reported for RSA patients. Based upon our findings, the average RSA patient can experience some difficulties when returning to swimming after surgery (average specific ASES score, 1.8).
Jensen and Rockwood16 were among the first to demonstrate successful return to golf of 24 patients who had undergone either TSA or hemiarthroplasty (HA), showing a 5-stroke improvement in their game. A recent study investigating patient-reported activity in patients aged 75 years and undergoing RSA showed that 23% of patients returned to high-level activity sports, such as golf, motorcycle riding, or free weights.19 All patients who participated in golf before surgery resumed playing following surgery; however, golf was listed among the top activities that patients wanted to participate in but could not for any reason.19 Our data suggest that golfers with TSA will face less difficulty returning to sports compared with their RSA counterparts (average specific ASES score, 2.5 vs 1.8, who might find golf somewhat difficult.
Although no study has provided a clear consensus as to which activities are safe to perform following shoulder arthroplasty, experts have suggested that activities that impart high loads on the glenohumeral joint should be avoided.15 Among TSA patients, McCarty and colleagues8 reported high rates of return for swimmers, golfers, and tennis players; however, relatively low rates were reported for weight lifting, bowling, and softball (20%). Within our study group, golf, swimming, and walking were listed among the most popular sports performed. Although weight lifting, bowling, and softball were less commonly identified as usual sports within our study, patients treated with TSA demonstrated more ease to participate than RSA patients. This result was observed with ASES-specific scores noted for weight lifting and gym exercises (TSA, 2.5; RSA, 2.3) and team sports, such as softball (TSA, 2; RSA, 1.3). However, for bowling, RSA patients showed a trend toward more ability (RSA, 2.7; TSA, 1.7).
Continue to: Among specific work activities...
Successful return to sports that involve shoulder function, such as golf and swimming, has been demonstrated for TSA.8,14,16,17 However, studies have reported that return to these sports can be difficult for RSA patients.20 Fink and colleagues19 reported that following RSA, 48.7% of patients returned to moderate-intensity sports, such as swimming and golf. Consistent with these findings, in our study, TSA patients demonstrated a significantly higher ability to participate in their usual sports without difficulty (ASES-specific score of 3). This observation may relate to lower ultimate achievements in range of motion and strength in patients treated with RSA, when compared with TSA patients,24,25 and the generalized practice of utilizing RSA for lower-demand patients (RSA patients in this study were older).
Overall, participation in work was 21% easier for TSA patients than RSA patients. Although the majority of our patients cited retirement as their primary work, which is consistent with what one would expect with the mean age of this study’s cohorts (RSA, 75 years; TSA, 69 years), housework and gardening were the only specifically identified forms of work that demonstrated significant differences between RSA and TSA patients. A few reports in the literature documented the ability to return to work after shoulder arthroplasty. In a recent report on 13 workers’ compensation patients treated with TSA, only 1 patient returned to the same job, and 54% did not return to work.26 In a study comparing 14 workers’ compensation to a matched group of controls with all members treated with RSA, the workers’ compensation group yielded a lower return-to-work rate (14.2%) than the controls (41.7%).27 In a large study of 154 TSA patients, 14% returned to work, but specific jobs were not described in this analysis.14
The results of this study suggest that more TSA patients successfully participate in low-demand activities, such as gardening or housework. Zarkadas and colleagues18 reported that 65% of TSA and 47% of HA patients successfully returned to gardening compared with 42% of RSA patients observed in a continuation study.20 This study showed that TSA patients yielded a 65% difference in ability to work in gardening and 34% difference in ability to perform housework compared with RSA patients. Based on these findings, TSA patients can expect to experience no difficulty in performing housework or gardening, whereas RSA patients may find these tasks difficult to a certain degree.
The main limitation of this study is the reporting bias that results from survey-based studies. Possibly, more people engage in specific sports or work than what were reported. This type of study also features an inherent selection bias, as patients with highly and physically demanding jobs or usual sports were less likely to have been offered either TSA or RSA. An additional important limitation is the relatively small cohorts within sport and work subgroups; the small cohorts probably underpowered the statistical results of this study and made these findings valuable mostly as descriptive observations. Larger studies focusing on each subgroup will further clarify the ability of shoulder arthroplasty to perform individual sports or work. Further studies evaluating preoperative to postoperative sports- and work-specific ASES scores would provide notable insights into the functional improvements observed within each sport or work following surgery. The relatively large study population of 276 patients strengthened the findings, which relate to the overall ability to participate in sports and work for TSA and RSA patients. Finally, the evaluated TSA and RSA patients possibly represent different groups (significant difference in age and gender) with different underlying pathologies and potentially different demands and expectations. However, comparisons among these groups of patients bear importance in defining patient expectations related to surgery. Still, the ability to participate in sport or work possibly relates more to the limitations of the implant used than patient pathology. This possibility warrants further investigation.
CONCLUSION
Both TSA and RSA allow for participation in work and sports, with TSA patients reporting easier overall ability to participate. For sports involving shoulder function, TSA patients more commonly report maximal ability to participate than RSA patients.
1. Fehringer EV, Kopjar B, Boorman RS, Churchill RS, Smith KL, Matsen FA 3rd. Characterizing the functional improvement after total shoulder arthroplasty for osteoarthritis. J Bone Joint Surg Am. 2002;84-A(8):1349-1353.
2. Cuff DJ, Pupello DR. Comparison of hemiarthroplasty and reverse shoulder arthroplasty for the treatment of proximal humeral fractures in elderly patients. J Bone Joint Surg Am. 2013;95(22):2050-2055. doi:10.2106/JBJS.L.01637.
3. Guery J, Favard L, Sirveaux F, Oudet D, Mole D, Walch G. Reverse total shoulder arthroplasty. Survivorship analysis of eighty replacements followed for five to ten years. J Bone Joint Surg Am. 2006;88(8):1742-1747.
4. Levy JC, Virani N, Pupello D, Frankle M. Use of the reverse shoulder prosthesis for the treatment of failed hemiarthroplasty in patients with glenohumeral arthritis and rotator cuff deficiency. J Bone Joint Surg Br. 2007;89(2):189-195.
5. Patel DN, Young B, Onyekwelu I, Zuckerman JD, Kwon YW. Reverse total shoulder arthroplasty for failed shoulder arthroplasty. J Shoulder Elbow Surg. 2012;21(11):1478-1483. doi:10.1016/j.jse.2011.11.004.
6. Sebastia-Forcada E, Cebrian-Gomez R, Lizaur-Utrilla A, Gil-Guillen V. Reverse shoulder arthroplasty versus hemiarthroplasty for acute proximal humeral fractures. A blinded, randomized, controlled, prospective study. J Shoulder Elbow Surg. 2014;23(10):1419-1426. doi:10.1016/j.jse.2014.06.035.
7. Henn RF 3rd, Ghomrawi H, Rutledge JR, Mazumdar M, Mancuso CA, Marx RG. Preoperative patient expectations of total shoulder arthroplasty. J Bone Joint Surg Am. 2011;93(22):2110-2115. doi:10.2106/JBJS.J.01114.
8. McCarty EC, Marx RG, Maerz D, Altchek D, Warren RF. Sports participation after shoulder replacement surgery. Am J Sports Med. 2008;36(8):1577-1581. doi:10.1177/0363546508317126.
9. Puskas B, Harreld K, Clark R, Downes K, Virani NA, Frankle M. Isometric strength, range of motion, and impairment before and after total and reverse shoulder arthroplasty. J Shoulder Elbow Surg. 2013;22(7):869-876. doi:10.1016/j.jse.2012.09.004.
10. Deshmukh AV, Koris M, Zurakowski D, Thornhill TS. Total shoulder arthroplasty: long-term survivorship, functional outcome, and quality of life. J Shoulder Elbow Surg. 2005;14(5):471-479.
11. Levy JC, Everding NG, Gil CC Jr., Stephens S, Giveans MR. Speed of recovery after shoulder arthroplasty: a comparison of reverse and anatomic total shoulder arthroplasty. J Shoulder Elbow Surg. 2014;23(12):1872-1881. doi:10.1016/j.jse.2014.04.014.
12. Nolan BM, Ankerson E, Wiater JM. Reverse total shoulder arthroplasty improves function in cuff tear arthropathy. Clin Orthop Relat Res. 2011;469(9):2476-2482. doi:10.1007/s11999-010-1683-z.
13. Norris TR, Iannotti JP. Functional outcome after shoulder arthroplasty for primary osteoarthritis: a multicenter study. J Shoulder Elbow Surg. 2002;11(2):130-135.
14. Bulhoff M, Sattler P, Bruckner T, Loew M, Zeifang F, Raiss P. Do patients return to sports and work after total shoulder replacement surgery? Am J Sports Med. 2015;43(2):423-427. doi:10.1177/0363546514557940.
15. Healy WL, Iorio R, Lemos MJ. Athletic activity after joint replacement. Am J Sports Med. 2001;29(3):377-388.
16. Jensen KL, Rockwood CA Jr. Shoulder arthroplasty in recreational golfers. J Shoulder Elbow Surg. 1998;7(4):362-367.
17. Schumann K, Flury MP, Schwyzer HK, Simmen BR, Drerup S, Goldhahn J. Sports activity after anatomical total shoulder arthroplasty. Am J Sports Med. 2010;38(10):2097-2105. doi:10.1177/0363546510371368.
18. Zarkadas PC, Throckmorton TQ, Dahm DL, Sperling J, Schleck CD, Cofield R. Patient reported activities after shoulder replacement: total and hemiarthroplasty. J Shoulder Elbow Surg. 2011;20(2):273-280. doi:10.1016/j.jse.2010.06.007.
19. Fink Barnes LA, Grantham WJ, Meadows MC, Bigliani LU, Levine WN, Ahmad CS. Sports activity after reverse total shoulder arthroplasty with minimum 2-year follow-up. Am J Orthop. 2015;44(2):68-72.
20. Lawrence TM, Ahmadi S, Sanchez-Sotelo J, Sperling JW, Cofield RH. Patient reported activities after reverse shoulder arthroplasty: part II. J Shoulder Elbow Surg. 2012;21(11):1464-1469. doi:10.1016/j.jse.2011.11.012.
21. Simovitch RW, Gerard BK, Brees JA, Fullick R, Kearse JC. Outcomes of reverse total shoulder arthroplasty in a senior athletic population. J Shoulder Elbow Surg. 2015;24(9):1481-1485. doi:10.1016/j.jse.2015.03.011.
22. Golant A, Christoforou D, Zuckerman JD, Kwon YW. Return to sports after shoulder arthroplasty: a survey of surgeons' preferences. J Shoulder Elbow Surg. 2012;21(4):554-560. doi:10.1016/j.jse.2010.11.021.
23. Michener LA, McClure PW, Sennett BJ. American Shoulder and Elbow Surgeons Standardized Shoulder Assessment Form, patient self-report section: reliability, validity, and responsiveness. J Shoulder Elbow Surg. 2002;11(6):587-594.
24. Alta TD, de Toledo JM, Veeger HE, Janssen TW, Willems WJ. The active and passive kinematic difference between primary reverse and total shoulder prostheses. J Shoulder Elbow Surg. 2014;23(9):1395-1402. doi:10.1016/j.jse.2014.01.040.
25. Alta TD, Veeger DH, de Toledo JM, Janssen TW, Willems WJ. Isokinetic strength differences between patients with primary reverse and total shoulder prostheses: muscle strength quantified with a dynamometer. Clin Biomech (Bristol, Avon). 2014;29(9):965-970. doi:10.1016/j.clinbiomech.2014.08.018.
26. Jawa A, Dasti UR, Fasulo SM, Vaickus MH, Curtis AS, Miller SL. Anatomic total shoulder arthroplasty for patients receiving workers' compensation. J Shoulder Elbow Surg. 2015;24(11):1694-1697. doi:10.1016/j.jse.2015.04.017.
27. Morris BJ, Haigler RE, Laughlin MS, Elkousy HA, Gartsman GM, Edwards TB. Workers' compensation claims and outcomes after reverse shoulder arthroplasty. J Shoulder Elbow Surg. 2015;24(3):453-459. doi:10.1016/j.jse.2014.07.009.
TAKE-HOME POINTS
- Both anatomic (TSA) and reverse shoulder arthroplasty (RSA) allow for the participation in work and sports.
- TSA patients report easier overall ability to participate in sports, specifically golf and swimming.
- For sports involving shoulder function, TSA patients more commonly report maximal ability to participate than RSA patients.
- TSA patients report easier overall ability to return to work-related activities, specifically housework and gardening.
- TSA patients featured 27% higher sport-specific ASES scores and 21% higher work-specific ASES scores than RSA patients.

Magnetic Resonance Imaging Evaluation of the Distal Biceps Tendon
ABSTRACT
Injuries to the distal biceps occur at the tendinous insertion at the radial tuberosity. Distal biceps injuries range from tendinosis to partial tears to non-retracted and retracted complete tears. Acute and chronic complete tears result from a tendinous avulsion at the radial tuberosity. Acute tears result from a strong force exerted on an eccentric biceps contraction, leading to tendon injury.
Distal biceps tendon injuries are uncommon (1.2 per 100,000 patients in one study).1 An underlying degenerative component is involved in all distal biceps tendon tears and tendinosis.2 Partial tears can be caused by the same mechanism or by no particular inciting event.3 Magnetic resonance imaging (MRI) is the optimal imaging modality for distal tendon tears because of its excellent specificity and sensitivity in the detection of complete tears.4,5 Imaging also accurately diagnoses and characterizes partial tears and tendinosis.5 On MRI, fast spin-echo intermediate-weighted and T2-weighted or short tau inversion recovery (STIR) sequences are normally obtained to assess tendon integrity. Along with standard axial and sagittal views, the FABS (flexed elbow, abducted shoulder, supinated forearm) view is an important tool in the diagnosis of distal biceps tendon tears.6 The FABS view is obtained with the patient prone with the shoulder abducted 180° (above the head), with the elbow flexed to 90°, and the forearm supinated. This position allows a longitudinal view of along the entire length of the distal tendon.
Complete distal biceps tears can usually be diagnosed by history and physical examinations. However, imaging can be helpful when intact brachialis function can compensate for a completely torn tendon. MRI is also useful in the setting of a complete tear to locate the torn tendon stump, and assess the degree of retraction for tendon retrieval7,8 and quality of the tendon stump for repair. For associated rupture of the lacertus, the degree of proximal tendon retraction can be significant (Figures 1A, 1B). 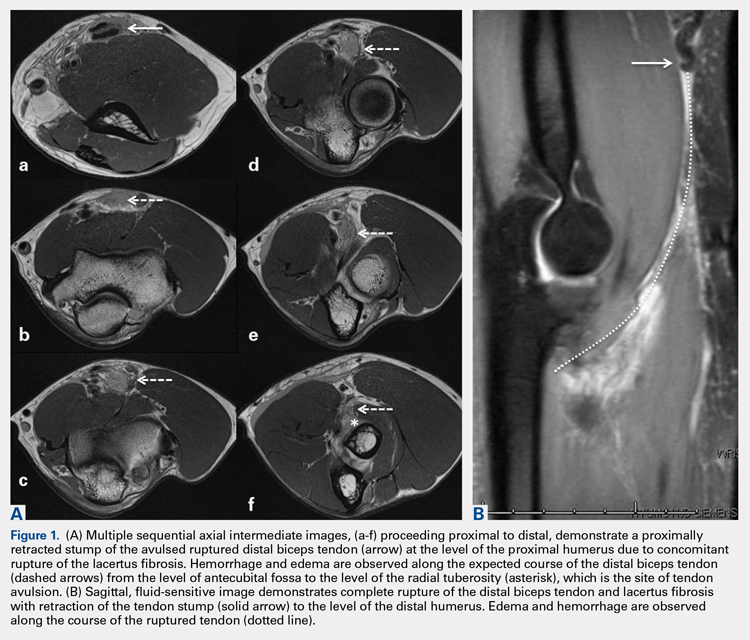
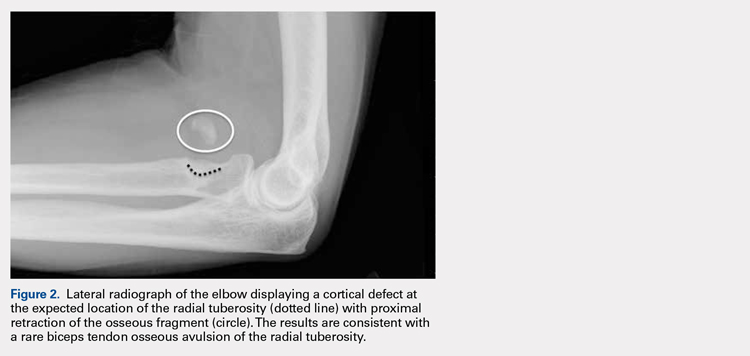
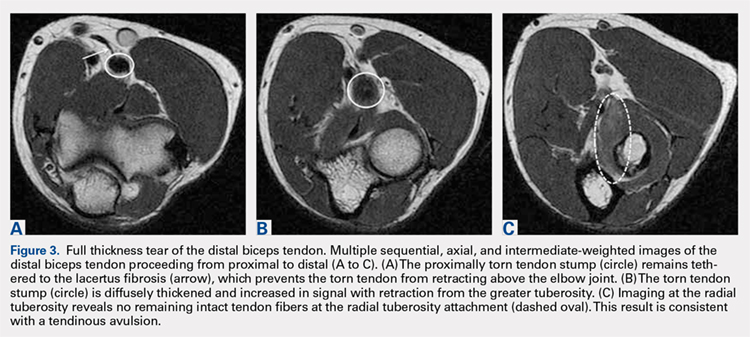
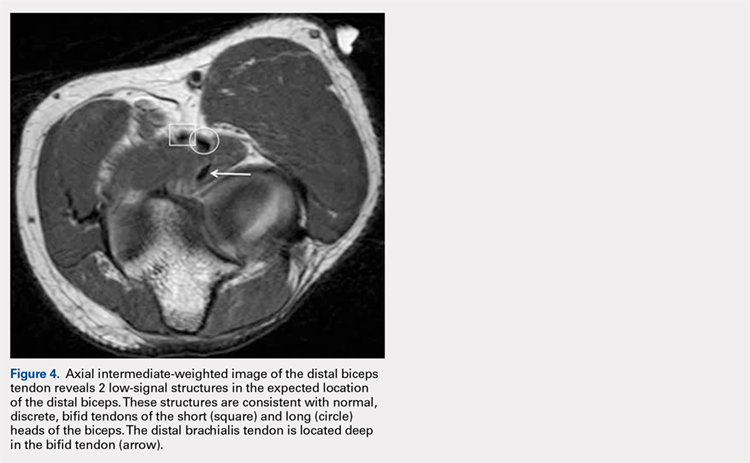
Continue to: Partial distal bicep tears...
Partial distal bicep tears are characterized on MRI by focal or partial detachment of the tendon at the radial tuberosity with fluid filling the site of the tear. The degree of partial tearing can be assessed on MRI (Figures 5A, 5B).
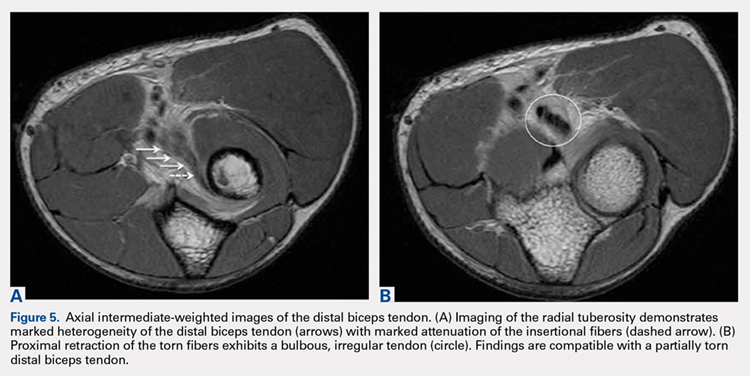
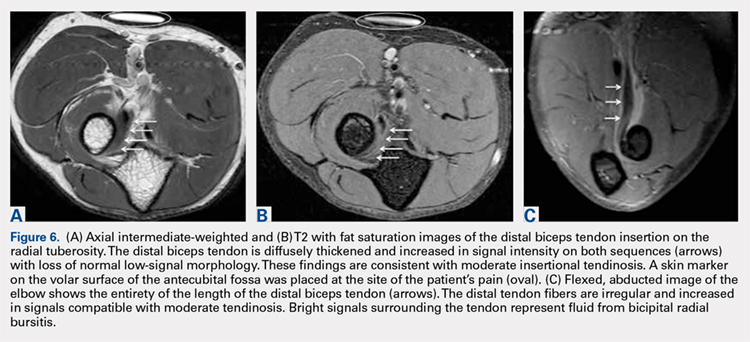
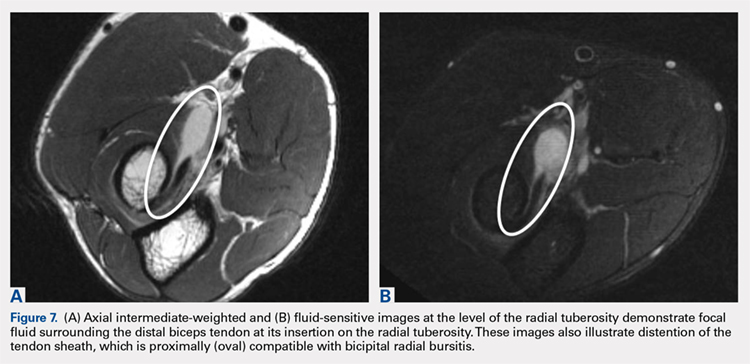
MRI is useful in assessing the distal biceps tendon in the postoperative setting to evaluate the integrity of a repaired tendon. Cortical fixation button technique for repair creates minimal susceptibility artifacts on MRI. Postoperative MRI typically demonstrates a transverse hole drilled through the proximal radius at the site of the tuberosity with a cortical fixation button flush against the posterior radial cortex (Figures 8A-8D). 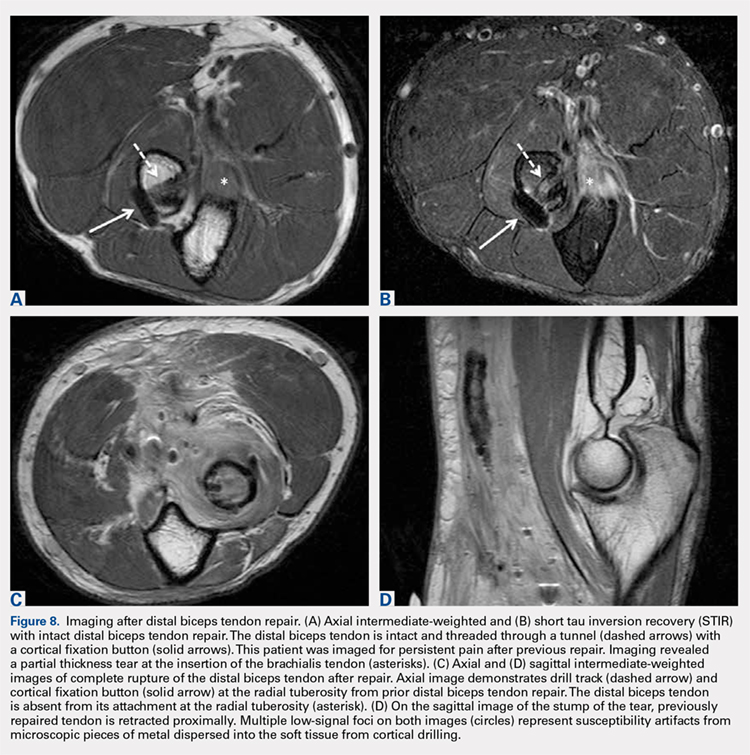
1. Safran M, Graham S. Distal biceps tendon ruptures. Clin Orthop Relat Res. 2002;404:275-283.
2. Kannus P, Józsa L. Histopathological changes preceding spontaneous rupture of a tendon. A controlled study of 891 patients. J Bone Joint Surg Am. 1991;73(10):1507-1525. doi:10.2106/00004623-199173100-00009.
3. Frazier M, Boardman M, Westland M, Imbriglia J. Surgical treatment of partial distal biceps tendon ruptures. J Hand Surg Am. 2010;35(7):1111-1114. doi:10.1016/j.jhsa.2010.04.024.
4. Festa A, Mulieri P, Newman J, Spitz D, Leslie B. Effectiveness of magnetic resonance imaging in detecting partial and complete distal biceps tendon rupture. J Hand Surg Am. 2010;35(1):77-83. doi:10.1016/j.jhsa.2009.08.016.
5. O'Driscoll S, Goncalves L, Dietz P. The hook test for distal biceps tendon avulsion. Am J Sports Med. 2007;35(11):1865-1869. doi:10.1177/0363546507305016.
6. Giuffrè B, Moss M. Optimal positioning for MRI of the distal biceps brachii tendon: flexed abducted supinated view. Am J Roentgenol. 2004;182(4):944-946. doi:10.2214/ajr.182.4.1820944.
7. Falchook F, Zlatkin M, Erbacher G, Moulton J, Bisset G. Murphy B. Rupture of the distal biceps tendon: evaluation with MR imaging. Radiology. 1994;190(3):659-663. doi:10.1148/radiology.190.3.8115606.
8. Fitzgerald S, Curry D, Erickson S, Quinn S, Friedman H. Distal biceps tendon injury: MR imaging diagnosis. Radiology. 1994;191(1):203-206. doi:10.1148/radiology.191.1.8134571.
9. Lehuec J, Zipoli B, Liquois F, Moinard M, Chauveaux D, Le Rebeller A. Distal rupture of the biceps tendon MRI evaluation and surgical repair. J Shoulder Elbow Surg. 1996;5(2):S49.
10. Dirim B, Brouha S, Pretterklieber M, et al. Terminal bifurcation of the biceps brachii muscle and tendon: anatomic considerations and clinical implications. Am J Roentgenol. 2008;191(6):W248-W255. doi:10.2214/AJR.08.1048.
11. Quach T, Jazayeri R, Sherman O, Rosen J. Distal biceps tendon injuries--current treatment options. Bull NYU Hosp Jt Dis. 2010;68(2):103-111.
ABSTRACT
Injuries to the distal biceps occur at the tendinous insertion at the radial tuberosity. Distal biceps injuries range from tendinosis to partial tears to non-retracted and retracted complete tears. Acute and chronic complete tears result from a tendinous avulsion at the radial tuberosity. Acute tears result from a strong force exerted on an eccentric biceps contraction, leading to tendon injury.
Distal biceps tendon injuries are uncommon (1.2 per 100,000 patients in one study).1 An underlying degenerative component is involved in all distal biceps tendon tears and tendinosis.2 Partial tears can be caused by the same mechanism or by no particular inciting event.3 Magnetic resonance imaging (MRI) is the optimal imaging modality for distal tendon tears because of its excellent specificity and sensitivity in the detection of complete tears.4,5 Imaging also accurately diagnoses and characterizes partial tears and tendinosis.5 On MRI, fast spin-echo intermediate-weighted and T2-weighted or short tau inversion recovery (STIR) sequences are normally obtained to assess tendon integrity. Along with standard axial and sagittal views, the FABS (flexed elbow, abducted shoulder, supinated forearm) view is an important tool in the diagnosis of distal biceps tendon tears.6 The FABS view is obtained with the patient prone with the shoulder abducted 180° (above the head), with the elbow flexed to 90°, and the forearm supinated. This position allows a longitudinal view of along the entire length of the distal tendon.
Complete distal biceps tears can usually be diagnosed by history and physical examinations. However, imaging can be helpful when intact brachialis function can compensate for a completely torn tendon. MRI is also useful in the setting of a complete tear to locate the torn tendon stump, and assess the degree of retraction for tendon retrieval7,8 and quality of the tendon stump for repair. For associated rupture of the lacertus, the degree of proximal tendon retraction can be significant (Figures 1A, 1B).
Continue to: Partial distal bicep tears...
Partial distal bicep tears are characterized on MRI by focal or partial detachment of the tendon at the radial tuberosity with fluid filling the site of the tear. The degree of partial tearing can be assessed on MRI (Figures 5A, 5B).
MRI is useful in assessing the distal biceps tendon in the postoperative setting to evaluate the integrity of a repaired tendon. Cortical fixation button technique for repair creates minimal susceptibility artifacts on MRI. Postoperative MRI typically demonstrates a transverse hole drilled through the proximal radius at the site of the tuberosity with a cortical fixation button flush against the posterior radial cortex (Figures 8A-8D).
1. Safran M, Graham S. Distal biceps tendon ruptures. Clin Orthop Relat Res. 2002;404:275-283.
2. Kannus P, Józsa L. Histopathological changes preceding spontaneous rupture of a tendon. A controlled study of 891 patients. J Bone Joint Surg Am. 1991;73(10):1507-1525. doi:10.2106/00004623-199173100-00009.
3. Frazier M, Boardman M, Westland M, Imbriglia J. Surgical treatment of partial distal biceps tendon ruptures. J Hand Surg Am. 2010;35(7):1111-1114. doi:10.1016/j.jhsa.2010.04.024.
4. Festa A, Mulieri P, Newman J, Spitz D, Leslie B. Effectiveness of magnetic resonance imaging in detecting partial and complete distal biceps tendon rupture. J Hand Surg Am. 2010;35(1):77-83. doi:10.1016/j.jhsa.2009.08.016.
5. O'Driscoll S, Goncalves L, Dietz P. The hook test for distal biceps tendon avulsion. Am J Sports Med. 2007;35(11):1865-1869. doi:10.1177/0363546507305016.
6. Giuffrè B, Moss M. Optimal positioning for MRI of the distal biceps brachii tendon: flexed abducted supinated view. Am J Roentgenol. 2004;182(4):944-946. doi:10.2214/ajr.182.4.1820944.
7. Falchook F, Zlatkin M, Erbacher G, Moulton J, Bisset G. Murphy B. Rupture of the distal biceps tendon: evaluation with MR imaging. Radiology. 1994;190(3):659-663. doi:10.1148/radiology.190.3.8115606.
8. Fitzgerald S, Curry D, Erickson S, Quinn S, Friedman H. Distal biceps tendon injury: MR imaging diagnosis. Radiology. 1994;191(1):203-206. doi:10.1148/radiology.191.1.8134571.
9. Lehuec J, Zipoli B, Liquois F, Moinard M, Chauveaux D, Le Rebeller A. Distal rupture of the biceps tendon MRI evaluation and surgical repair. J Shoulder Elbow Surg. 1996;5(2):S49.
10. Dirim B, Brouha S, Pretterklieber M, et al. Terminal bifurcation of the biceps brachii muscle and tendon: anatomic considerations and clinical implications. Am J Roentgenol. 2008;191(6):W248-W255. doi:10.2214/AJR.08.1048.
11. Quach T, Jazayeri R, Sherman O, Rosen J. Distal biceps tendon injuries--current treatment options. Bull NYU Hosp Jt Dis. 2010;68(2):103-111.
TAKE-HOME POINTS
- There are a variety of injuries to the distal biceps tendon.
- Injuries vary from tendinosis to full thickness, retracted tears.
- The degree of retraction of full thickness tears depends on the integrity of the lacertus fibrosis.
- The FABS view allows for MRI of the entire length of the distal biceps tendon.
- MRI is the most useful imaging modality to determine the integrity of the postoperative biceps tendon.
Radiographic Study of Humeral Stem in Shoulder Arthroplasty After Lesser Tuberosity Osteotomy or Subscapularis Tenotomy
ABSTRACT
Lesser tuberosity osteotomy (LTO) and subscapularis tenotomy (ST) are used for takedown of the subscapularis during shoulder arthroplasty. LTO offers the theoretical but unproven benefit of improved healing and function of the subscapularis. However, humeral stem subsidence and loosening may be greater when osteotomy is performed, which may compromise functional outcomes. Our hypothesis is that no difference in proximal collar press-fit humeral stem subsidence or loosening exists, with no impairment of functional outcomes using the LTO technique.
During the surgical approach for total shoulder arthroplasty (TSA), the subscapularis is taken down for adequate exposure to the glenohumeral joint. Various methods are available for taking down the subscapularis, including lesser tuberosity osteotomy (LTO) and a subscapularis tenotomy (ST). LTO offers the theoretical but unproven benefit of improved healing and function of the subscapularis secondary to bone-to-bone healing. One concern, however, is that humeral stem subsidence may be greater when an osteotomy is performed owing to compromise of metaphyseal cortical bone, which may compromise functional outcomes. The humeral stem design may also influence subsidence when metaphyseal bone proximally is compromised. This is a concern in both metaphyseal and diaphyseal fitting stems. Metaphyseal collars on diaphyseal fitting stems rely on adequate bone stock in the metaphysis to provide the additional support needed. Also, posterior subluxation remains a challenge in shoulder arthroplasty. The integrity of the subscapularis is important in prevention of posterior subluxation.1 To our knowledge, no study to date has directly compared differences in humeral stem subsidence, loosening, or posterior subluxation between LTO and ST techniques with any humeral stem design. Our hypothesis is that no difference in proximal collar press-fit humeral stem subsidence or loosening exists, with no impairment of functional outcomes using the LTO technique. We also hypothesize that no difference in posterior subluxation exists between LTO and ST techniques.
MATERIALS AND METHODS
INCLUSION CRITERIA
Consecutive patients with a minimum of 12 months of radiographic follow-up were selected from 2007 to 2010 after TSA was performed by 1 of the senior authors (Dr. Miller and Dr. Voloshin). Study patients underwent primary TSA for primary osteoarthritis or rheumatoid arthritis.
EXCLUSION CRITERIA
Patients were excluded if they underwent TSA for posttraumatic glenohumeral arthritis, hemiarthroplasty, or osteonecrosis. Patients were also excluded if a rotator cuff tear was discovered intraoperatively or if they had a history of a rotator cuff repair. Additional exclusion criteria included postoperative trauma to the operative shoulder, postoperative infection, extensive documentation of chronic pain, and underlying neurologic disorder (eg, Parkinson disease, dystonia). Patients with a history of diabetes mellitus were not excluded.
SURGICAL TECHNIQUE
All patients underwent TSA via a deltopectoral approach in a modified beach chair position. Biceps tendons were tenodesed at the level of the pectoralis major. All patients received the same proximal collar press-fit implant (Bigliani-Flatow; Zimmer Biomet). These stems provide rotational stability in the metaphyseal segment via fins, vertical stability with the proximal collar, and distal fixation via an interference fit. All parts of the procedure were performed in similar fashion with the exception of ST vs LTO (Figures 1A-1D). 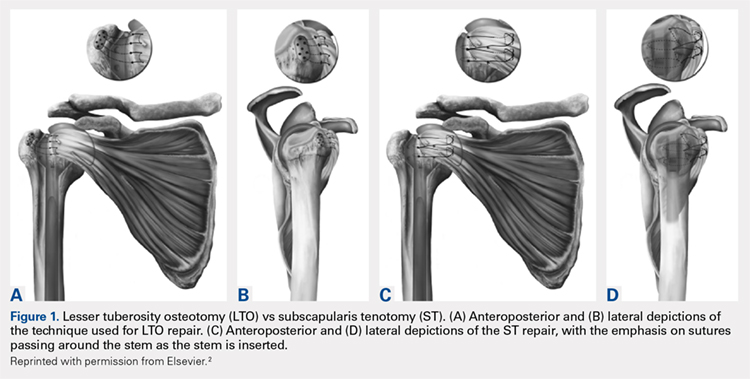
Continue to: LTO was performed as the primary...
LESSER TUBEROSITY OSTEOTOMY
LTO was performed as the primary or preferred technique of 1 surgeon. After completion of the biceps tenodesis, the lesser tuberosity is reflected off with the subscapularis intact using an osteotome. After placement of the press-fit humeral stem, the LTO is repaired using No. 5 Ethibond Excel sutures (Ethicon) passed through previously created bone tunnels in the greater tuberosity. These sutures are tied over metal buttons over the lateral cortex of the greater tuberosity. Last, the lateral corner of the rotator interval is repaired using a single No. 2 FiberWire (Arthrex).2
SUBSCAPULARIS TENOTOMY
ST is the preferred surgical technique of the second surgeon. After a biceps tenodesis, the subscapularis tendon is released from the lesser tuberosity at the margin of the bicipital groove. Through careful dissection, a single flap including the underlying capsule is created and reflected medially to the level of the coracoid. After placement of the press-fit humeral stem and humeral head, the subscapularis is repaired back in place through previous bone tunnels and with a No. 5 Ethibond Excel suture under the appropriate tension. Then, the lateral corner of the rotator interval is closed using a single No. 2 Ethibond Excel suture in a figure-of-eight fashion.2
RADIOGRAPHIC ANALYSIS
The primary variables analyzed were subsidence and loosening. Additional variables, including humeral-acromial distance (HAD) and subluxation index, were also analyzed to assess for any additional impact caused by subsidence or loosening.3 All radiographic measurements were taken from the Grashey (true anteroposterior) view, except subluxation index, which was calculated using the axillary view. All radiographic measurements were completed by 3 independent reviewers. All radiographs were completed in a consistent manner according to postoperative protocols.
HAD was measured preoperatively, immediately postoperatively, and at final follow-up at a minimum of 1 year. The HAD was measured from the lowest point on the acromion to the humerus using a perpendicular line (Figure 2). 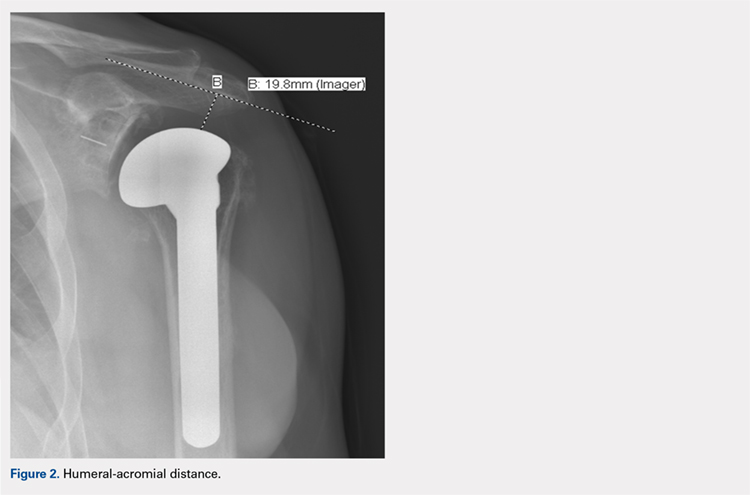
Subsidence of the prosthesis was calculated by determining the difference between immediate postoperative heights of the prosthesis in comparison to the value of the final follow-up films. To calculate the height, 2 lines were drawn, 1 line was drawn perpendicular to the top of the prosthetic head and 1 perpendicular to the top of the greater tuberosity (Figure 3). 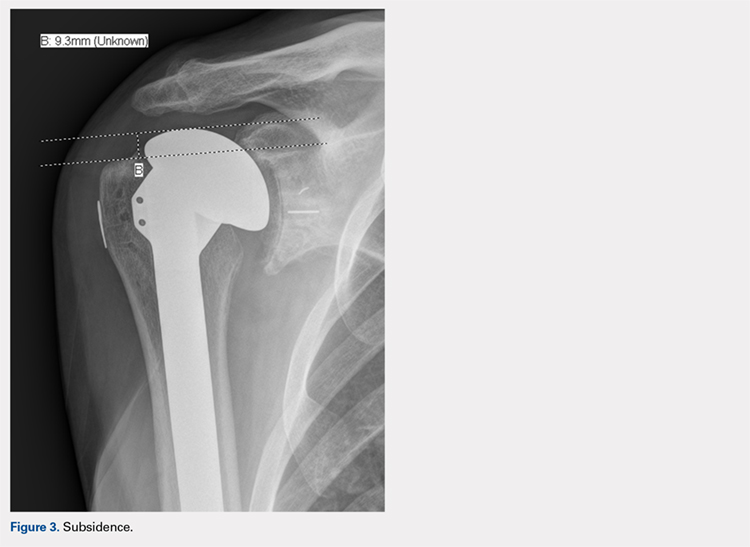
Continue to: Posterior subluxation is indicated...
Posterior subluxation is indicated by a value >65%, a centered head is between 35% and 65%, and anterior subluxation is indicated by a value <35% (Figure 4).3
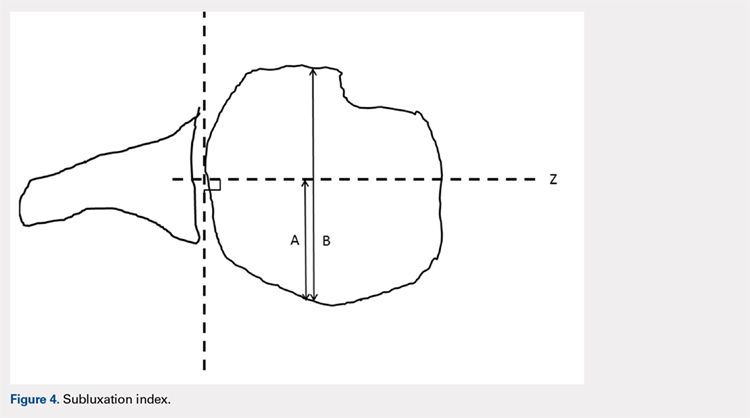
The humeral stems were evaluated for loosening by assessing for lucency on final radiographic follow-up films. These were evaluated in a zonal fashion as demonstrated by Sanchez-Sotelo and colleagues4 and in Figure 5. 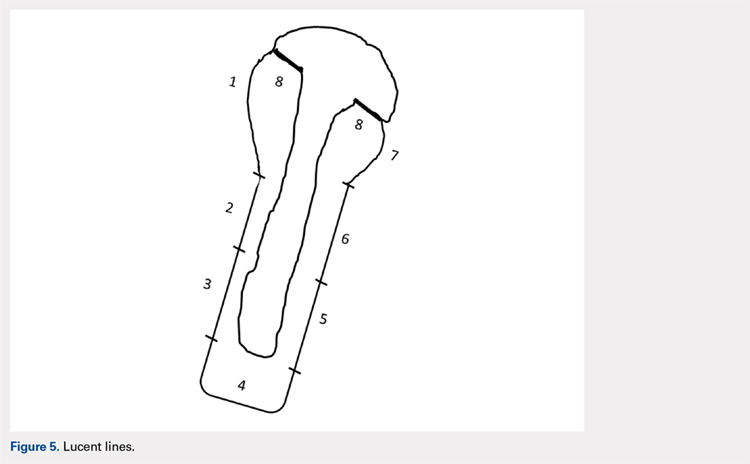
FUNCTIONAL OUTCOME EVALUATION
Before clinical evaluation, each study patient completed the Western Ontario Osteoarthritis of the Shoulder (WOOS) index; the Disabilities of the Hand, Arm and Shoulder (DASH) questionnaire, and the pain and function sections of the Constant score. The functional outcomes scores were captured postoperatively from October to November 2011. The WOOS is a validated outcome measure specific to osteoarthritis of the shoulder and has been used in prior studies evaluating outcomes of TSA.5-7 Previous studies have determined that the minimal clinically important difference for the WOOS score is 15 on a normalized 0 to 100 scale (100 being the best). The DASH score is a validated outcome measure for disorders of the upper extremity but is not specific to osteoarthritis of the shoulder.8 The Constant score is a validated outcome measure for a number of shoulder disorders, including TSA.9,10
STATISTICAL ANALYSIS
Statistical analyses were completed by a trained biostatistician. A power analysis was calculated using the noninferiority test to determine if adequate data had been obtained for this study. This was calculated by using previously accepted data demonstrating a statistically significant difference for subsidence and HAD. The data from these studies were used to make assumptions regarding accepted standard deviations and noninferiority margins, as calculated from the mean values of the 2 groups analyzed in each respective study.4,11 This analysis demonstrated power of 0.97 and 0.85 for the subsidence and HAD, respectively, given the current sample sizes. Intraclass coefficients were calculated to evaluate the measurements obtained during the radiographic analysis to determine the interrater agreement. Two samples’ t tests were calculated for the variables analyzed, along with P values and means.
RESULTS
DEMOGRAPHICS
A total of 51 consecutive patients were retrospectively selected for analysis. Of these, 16 patients were excluded from the study because they had <9 months of radiographic follow-up and were unavailable for further follow-up evaluation. Of the remaining 35 patients available for analysis, 4 patients had bilateral TSA, providing 39 shoulders for evaluation. Demographic characteristics of the study cohort are reported in Table 1.
| Table 1. Demographic Characteristics | |||
| Tenotomy (n = 24) | Osteotomy (n = 15) | P-value | |
| Age | 68.2 [7.4] | 70.2 [7.1] | 0.46 |
| Follow-up | 20.6 [11.5] | 18.5 [6.25] | 0.94 |
| Females | 7 (29%) | 6 (40%) | 0.58 |
| Dominant shoulder | 14 (58%) | 8 (53%) | 0.81 |
| Primary Diagnosis | |||
| Osteoarthritis | 22 (92%) | 15 (100%) | |
| Rheumatoid arthritis | 2 (8%) | 0 (0%) |
Fifteen patients underwent LTO, and 24 underwent ST. One patient underwent a tenotomy of the right shoulder and LTO of the left shoulder. Three LTOs were performed by the surgeon who primarily performed ST, owing to potential benefits of LTO. He eventually returned to his preferred technique of ST because of surgeon preference. Three ST procedures were completed by the surgeon who typically performed LTO at the start of the series prior to establishing LTO as his preferred technique. There was no significant difference between the study populations in terms of age, follow-up, male-to-female ratio, hand dominance, and primary diagnosis of osteoarthritis vs rheumatoid arthritis.
Continue to: There was no significant difference...
RADIOGRAPHIC DATA
There was no significant difference in preoperative HAD between the LTO and ST groups (9.5 ± 2.4 mm vs 10.9 ± 2.7 mm, P = .11). The immediate postoperative HAD was statistically significant between the LTO and ST groups (11.9 ± 3.7 mm vs 15.9 ± 4.5 mm, P = .005). There was as statistically significant difference noted in the final follow-up films between the LTO and ST groups (11.8 ± 3.2 mm vs 14.5 ± 3.9 mm, P = .025) (Table 2).
Table 2. Radiographic Data | |||||
Humeral Acromial Distance | |||||
| LTO | ST | P-Value | ||
Preoperative, mm | 9.5 | [2.4] | 10.9 | [2.7] | 0.11 |
Postoperative, mm | 11.9 | [3.7] | 15.9 | [4.5] | 0.005 |
Final follow-up, mm | 11.8 | [3.2] | 14.5 | [3.9] | 0.025 |
Subsidence | |||||
| LTO | ST | P-Value | ||
Subsidence, mm | 2.8 | [3.1] | 2.5 | [3.1] | 0.72 |
Subluxation Index | |||||
| LTO | ST | P-Value | ||
Preoperative, % | 0.55 | [0.06] | 0.54 | [0.07] | 0.45 |
Postoperative, % | 0.55 | [0.09] | 0.48 | [0.05] | 0.015 |
Lucent Lines | |||||
| LTO | ST | P-Value | ||
Lines >2 mm, % | 0.00 | 0.08 | 0.51 | ||
Abbreviations: LTO, lesser tuberosity osteotomy; ST, subscapularis tenotomy.
There were no statistically significant differences found in subsidence between LTO and ST groups at final follow-up (2.8 mm ± 3.1 mm vs 2.5 mm ± 3.1 mm, P = .72) (Table 2). No statistically significant difference was noted in the subluxation index between the LTO and ST groups (0.55% ± .06% vs 0.54% ± 0.07%, P = .45), but there was a statistically significant difference noted postoperatively between the LTO and ST groups (0.55% ± 0.09% vs .48% ± 0.05%, P = .015) (Table 2).
Two stems were noted to have lucent lines >2 mm, both within the ST cohort. Each had 1 stem zone >2 mm, 1 in zone 7, and 1 in zone 4. No statistically significant difference was identified between the LTO and ST groups (0/15 vs 2/24, P = .51) (Table 2).
FUNCTIONAL OUTCOMES
Study patients were evaluated using functional outcome scores, including the Constant, WOOS, and DASH scores (Table 3).
| Table 3. Functional Data | |||||
| LTO | ST | P-Value | |||
| WOOS index | 93.3 | [5.3] | 81.5 | [20.8] | 0.013 |
| DASH score | 8.4 | [6.6] | 13.8 | [4.9] | 0.13 |
| Constant score | 83.3 | [9.1] | 81.8 | [10.1] | 0.64 |
Abbreviations: DASH, disabilities of the arm, shoulder and hand; WOOS, Western Ontario Osteoarthritis of the Shoulder.
No statistically significant differences were noted in the DASH scores (8.4 ± 6.6 vs 13.8 ± 4.9, P = .13) or Constant scores (83.3 ± 9.1 vs 81.8 ± 10.1, P = .64) between the LTO and ST cohorts. There was a statistically significant difference between the WOOS scores (93.3 ± 5.3 vs 81.5 ± 20.8, P = .013). Because separate radiographic reviews were done by 3 independent personnel at 3 different times, it was important to ensure agreement among the reviewers. This was compared using the intraclass correlation coefficients. In the statistical analysis completed, the intraclass coefficients showed the 3 reviewers agreed with each other throughout the radiographic analysis (Table 4).
| Table 4. Testing Agreement: ICC | ||||
| ICC | CI, 2.5% | CI, 97.5% | ||
| HAD | Preoperative | 0.4451 | 0.2202 | 0.6443 |
| Postoperative | 0.6997 | 0.4836 | 0.834 | |
| Final follow-up | 0.5575 | 0.3592 | 0.7218 | |
| Subsidence | 0.6863 | 0.5349 | 0.807 | |
| SI | Preoperative | 0.3087 | 0.1061 | 0.5213 |
| Final follow-up | 0.5364 | 0.299 | 0.7186 |
Abbreviations: CI, confidence interval; HAD, humeral acromial distance; ICC, intraclass correlation coefficient; SI, subluxation index.
DISCUSSION
At final follow-up, we identified no statistically significant difference between the LTO and ST patients in subsidence, lucent lines >2 mm, or functional outcomes (Constant and DASH scores) in patients who underwent TSA with the same proximal collar press-fit humeral stem. In regard to the functional outcome scores, although the WOOS score was statistically significant (P = .013) between the LTO and ST cohorts, we do not feel that this is clinically relevant because it does not reach the minimal clinically important difference threshold of 15 points.8
A statistically significant difference was noted in postoperative subluxation index but was not clinically relevant, because the values between the LTO and ST groups (0.55 vs 0.48) still showed a centered humeral head. Gerber and colleagues3 discussed using a value of 0.65 as a measure of posterior humeral head subluxation, whereas Walch and colleagues12 defined posterior humeral head subluxation as a value >0.55. On the basis of these numbers, the values obtained in this study demonstrated that the postoperative values were still centered on the glenoid, and therefore were not clinically significant.3,12
Continue to: In regard to HAD, there...
In regard to HAD, there was a statistically significant difference noted postoperatively (P = .005) and at final follow-up (P = .025) between the LTO and ST cohorts. Saupe and colleagues13 demonstrated that a HAD <7 mm was considered abnormal and reflected subacromial space narrowing. The values noted in the LTO and ST patients on postoperative and final follow-up radiographs were statistically significant (Table 2), but not clinically relevant because both were >7 mm. A potential source for the variation in HAD may be due to X-ray position and angle.
Studies have shown a concern regarding the integrity of the subscapularis after tenotomy or peel used in TSA with abnormal subscapularis function.14,15 Miller and colleagues15 reported 41 patients, nearly two-thirds, of whom described subscapularis dysfunction. Those authors’ response to the poor clinical outcomes was to remove a fleck of bone with the tendon to achieve “bone-to-bone” healing.14 Gerber and colleagues16 reported on a series of patients using LTO and repair in TSA with 75% and 89% intact subscapularis function on clinical testing.16 Studies by Qureshi and colleagues17 and Scalise and colleagues18 showed similar results after LTO. Biomechanical studies have shown mixed results. Ponce and colleagues19 showed biomechanically superior results for LTO in comparison to the various repair techniques for ST. In another study, Giuseffi and colleagues20 showed no difference in LTO vs ST during biomechanical testing. In response to the increased concern regarding subscapularis integrity, Caplan and colleagues21 reported on 45 arthroplasties in 43 patients with improved postoperative testing with intact subscapularis testing in 90% to 100% of patients. A level 1 randomized control trial conducted by Lapner and colleagues22 did not demonstrate any clear clinical advantage of LTO vs ST. Controversy still exists regarding which is the preferred technique for TSA.
Sanchez-Sotelo and colleagues4 evaluated uncemented humeral components in 72 patients who underwent TSA. They found a humeral component was at risk for loosening if a radiolucent line ≥2 mm was present in at least 3 radiographic zones. They also evaluated tilt or subsidence by measurement and whether the components were observed to have changed. Their measured values correlated with their observed values. That study provided a benchmark for evaluation of loosening and subsidence used during this study.4 Although radiographic follow-up is limited in this study, we feel that any potential subsidence secondary to use of the LTO technique would be radiographically apparent at 1 year. There were 16 patients without adequate radiographic follow-up included in the study. However, we feel that this was not a large concern, because the study was adequately powered with the patients available to determine a difference based on subsidence.
CONCLUSION
We found no difference in subsidence, lucent lines >2 mm, posterior subluxation, and the Constant and DASH functional outcome scores when we compared TSA performed by a LTO with an ST technique with proximal collar press-fit humeral stem. These data cannot be extrapolated to metaphyseal fit stems, which may exhibit different settling characteristics in the setting of the LTO technique.
This paper will be judged for the Resident Writer’s Award.
1. Blasier R, Soslowsky L, Malicky D, Palmer M. Posterior glenohumeral subluxation: Active and passive stabilization in a biomechanical model. J Bone Joint Surg Am. 1997;79-A(3):433-440.
2. Buckley T, Miller R, Nicandri G, Lewis R, Voloshin I. Analysis of subscapularis integrity and function after lesser tuberosity osteotomy versus subscapularis tenotomy in total shoulder arthroplasty using ultrasound and validated clinical outcome measures. J Shoulder Elbow Surg. 2014;23(9):1309-1317. doi:10.1016/j.jse.2013.12.009.
3. Gerber C, Costouros JG, Sukthankar A, Fucentese SF. Static posterior humeral head subluxation and total shoulder arthroplasty. J Shoulder Elbow Surg. 2009;18(4):505-510. doi:10.1016/j.jse.2009.03.003.
4. Sanchez-Sotelo J, Wright TW, O'Driscoll SW, Cofield RH, Rowland CM. Radiographic assessment of uncemented humeral components in total shoulder arthroplasty. J Arthroplasty. 2001;16(2):180-187.
5. Litchfield RB, McKee MD, Balyk R, et al. Cemented versus uncemented fixation of humeral components in total shoulder arthroplasty for osteoarthrtitis of the shoulder: A prospective, randomized, double-blind clinical trial-A JOINTs Canada Project. J Shoulder Elbow Surg. 2013;20(4):529-536. doi:10.1016/j.jse.2011.01.041.
6. Lo IK, Griffin S, Kirkley A. The development of a disease specific quality of life measurement tool for osteoarthritis of the shoulder: The Western Ontario Osteoarthritis of the Shoulder (WOOS) index. Osteoarthritis Cartilage. 2001;9(8):771-778. doi:10.1053/joca.2001.0474
7. Lo IK, Litchfield RB, Griffin S, Faber K, Patterson SD, Kirkley A. Quality of life outcome following hemiarthroplasty or total shoulder arthroplasty in patients with osteoarthritis. A prospective, randomized trial. J Bone Joint Surg Am. 2005;87(10):2178-2185. doi:10.2106/JBJS.D.02198
8. Hudak PL, Amadio PC, Bombardier C. Development of an upper extremity outcome measure: the DASH (disabilities of the arm, shoulder and hand) [corrected]. The Upper Extremity Collaborative Group (UECG). Am J Ind Med. 1996;29(6):602-608. doi:10.1002/(SICI)1097-0274(199606)29:6<602::AID-AJIM4>3.0.CO;2-L.
9. Constant CR, Gerber C, Emery RJ, Sojbjerg JO, Gohlke F, Boileau P. A review of the constant score: Modifications and guidelines for its use. J Shoulder Elbow Surg. 2008;17(2):355-361. doi:10.1016/j.jse.2007.06.022.
10. Constant CR, Murley AH. A clinical method of functional assessment of the shoulder. Clin Orthop Relat Res. 1987;(214):160-164.
11. Mayerhoefer ME, Breitenseher MJ, Wurnig C, Roposch A. Shoulder impingement: Relationship of clinical symptoms and imaging criteria. Clin J Sport Med. 2009;19(2):83-89. doi:10.1097/JSM.0b013e318198e2e3.
12. Walch G, Badet R, Boulahia A, Khoury A. Morphologic study of the glenoid in primary glenohumeral osteoarthritis. J Arthroplasy. 1999;14(6):756-760.
13. Saupe N, Pfirmann CW, Schmid MR, et al. Association between rotator cuff abnormalities and reduced acromiohumeral distance. AJR Am J Roentgenol. 2006;187(2):376-382. doi:10.2214/AJR.05.0435.
14. Jackson J, Cil A, Smith J, Steinmann SP. Integrity and function of the subscapularis after total shoulder arthroplasty. J Shoulder Elbow Surg. 2010;19(7):1085-1090. doi:10.1016/j.jse.2010.04.001.
15. Miller SL, Hazrati Y, Klepps S, Chiang A, Flatow EL. Loss of subscapularis function after total shoulder replacement: a seldom recognized problem. J Shoulder Elbow Surg. 2003;12(1):29-34. doi:10.1067/mse.2003.128195.
16. Gerber C, Yian EH, Pfirrmann AW, Zumstein MA, Werner CM. Subscapularis muscle function and structure after total shoulder replacement with lesser tuberosity osteotomy and repair. J Bone Joint Surg Am. 2005;87(8):1739-1745. doi:10.2106/JBJS.D.02788.
17. Qureshi S, Hsiao A, Klug RA, Lee E, Braman J, Flatow EL. Subscapularis function after total shoulder replacement: results with lesser tuberosity osteotomy. J Shoulder Elbow Surg. 2008;17(1): 68-72. doi:10.1016/j.jse.2007.04.018.
18. Scalise JJ, Ciccone J, Iannotti JP. Clinical, radiographic and ultrasonographic comparison of subscapularis tenotomy and lesser tuberosity osteotomy for total shoulder arthroplasty. J Bone Joint Surg Am. 2010;92(7):1627-1634. doi:10.2106/JBJS.G.01461.
19. Ponce BA, Ahluwalia RS, Mazzocca AD, Gobezie RG, Warner JJ, Millett PJ. Biomechanical and clinical evaluation of a novel lesser tuberosity in total shoulder arthroplasty. J Bone Joint Surg Am. 2005;87 Suppl 2:1-8.
20. Giuseffi SA, Wongtriratanachai P, Omae H, et al. Biomechanical comparison of lesser tuberosity osteotomy versus subscapularis tenotomy in total shoulder arthroplasty. J Shoulder Elbow Surg. 2012;21(8):1087-1095. doi:10.1016/j.jse.2011.07.008.
21. Caplan JL, Whitfield W, Nevasier RJ. Subscapularis function after primary tendon to tendon repair in patients after replacement arthroplasty of the shoulder. J Shoulder Elbow Surg. 2009;18(2):193-196. doi:10.1016/j.jse.2008.10.019.
22. Lapner PLC, Sabri E, Rakhra K, Bell K, Athwal GS. Comparison of LTO to subscapularis peel in shoulder arthroplasty. J Bone Joint Surg Am. 2012;94(24):2239-2246. doi:10.2106/JBJS.K.01365.
ABSTRACT
Lesser tuberosity osteotomy (LTO) and subscapularis tenotomy (ST) are used for takedown of the subscapularis during shoulder arthroplasty. LTO offers the theoretical but unproven benefit of improved healing and function of the subscapularis. However, humeral stem subsidence and loosening may be greater when osteotomy is performed, which may compromise functional outcomes. Our hypothesis is that no difference in proximal collar press-fit humeral stem subsidence or loosening exists, with no impairment of functional outcomes using the LTO technique.
During the surgical approach for total shoulder arthroplasty (TSA), the subscapularis is taken down for adequate exposure to the glenohumeral joint. Various methods are available for taking down the subscapularis, including lesser tuberosity osteotomy (LTO) and a subscapularis tenotomy (ST). LTO offers the theoretical but unproven benefit of improved healing and function of the subscapularis secondary to bone-to-bone healing. One concern, however, is that humeral stem subsidence may be greater when an osteotomy is performed owing to compromise of metaphyseal cortical bone, which may compromise functional outcomes. The humeral stem design may also influence subsidence when metaphyseal bone proximally is compromised. This is a concern in both metaphyseal and diaphyseal fitting stems. Metaphyseal collars on diaphyseal fitting stems rely on adequate bone stock in the metaphysis to provide the additional support needed. Also, posterior subluxation remains a challenge in shoulder arthroplasty. The integrity of the subscapularis is important in prevention of posterior subluxation.1 To our knowledge, no study to date has directly compared differences in humeral stem subsidence, loosening, or posterior subluxation between LTO and ST techniques with any humeral stem design. Our hypothesis is that no difference in proximal collar press-fit humeral stem subsidence or loosening exists, with no impairment of functional outcomes using the LTO technique. We also hypothesize that no difference in posterior subluxation exists between LTO and ST techniques.
MATERIALS AND METHODS
INCLUSION CRITERIA
Consecutive patients with a minimum of 12 months of radiographic follow-up were selected from 2007 to 2010 after TSA was performed by 1 of the senior authors (Dr. Miller and Dr. Voloshin). Study patients underwent primary TSA for primary osteoarthritis or rheumatoid arthritis.
EXCLUSION CRITERIA
Patients were excluded if they underwent TSA for posttraumatic glenohumeral arthritis, hemiarthroplasty, or osteonecrosis. Patients were also excluded if a rotator cuff tear was discovered intraoperatively or if they had a history of a rotator cuff repair. Additional exclusion criteria included postoperative trauma to the operative shoulder, postoperative infection, extensive documentation of chronic pain, and underlying neurologic disorder (eg, Parkinson disease, dystonia). Patients with a history of diabetes mellitus were not excluded.
SURGICAL TECHNIQUE
All patients underwent TSA via a deltopectoral approach in a modified beach chair position. Biceps tendons were tenodesed at the level of the pectoralis major. All patients received the same proximal collar press-fit implant (Bigliani-Flatow; Zimmer Biomet). These stems provide rotational stability in the metaphyseal segment via fins, vertical stability with the proximal collar, and distal fixation via an interference fit. All parts of the procedure were performed in similar fashion with the exception of ST vs LTO (Figures 1A-1D).
Continue to: LTO was performed as the primary...
LESSER TUBEROSITY OSTEOTOMY
LTO was performed as the primary or preferred technique of 1 surgeon. After completion of the biceps tenodesis, the lesser tuberosity is reflected off with the subscapularis intact using an osteotome. After placement of the press-fit humeral stem, the LTO is repaired using No. 5 Ethibond Excel sutures (Ethicon) passed through previously created bone tunnels in the greater tuberosity. These sutures are tied over metal buttons over the lateral cortex of the greater tuberosity. Last, the lateral corner of the rotator interval is repaired using a single No. 2 FiberWire (Arthrex).2
SUBSCAPULARIS TENOTOMY
ST is the preferred surgical technique of the second surgeon. After a biceps tenodesis, the subscapularis tendon is released from the lesser tuberosity at the margin of the bicipital groove. Through careful dissection, a single flap including the underlying capsule is created and reflected medially to the level of the coracoid. After placement of the press-fit humeral stem and humeral head, the subscapularis is repaired back in place through previous bone tunnels and with a No. 5 Ethibond Excel suture under the appropriate tension. Then, the lateral corner of the rotator interval is closed using a single No. 2 Ethibond Excel suture in a figure-of-eight fashion.2
RADIOGRAPHIC ANALYSIS
The primary variables analyzed were subsidence and loosening. Additional variables, including humeral-acromial distance (HAD) and subluxation index, were also analyzed to assess for any additional impact caused by subsidence or loosening.3 All radiographic measurements were taken from the Grashey (true anteroposterior) view, except subluxation index, which was calculated using the axillary view. All radiographic measurements were completed by 3 independent reviewers. All radiographs were completed in a consistent manner according to postoperative protocols.
HAD was measured preoperatively, immediately postoperatively, and at final follow-up at a minimum of 1 year. The HAD was measured from the lowest point on the acromion to the humerus using a perpendicular line (Figure 2).
Subsidence of the prosthesis was calculated by determining the difference between immediate postoperative heights of the prosthesis in comparison to the value of the final follow-up films. To calculate the height, 2 lines were drawn, 1 line was drawn perpendicular to the top of the prosthetic head and 1 perpendicular to the top of the greater tuberosity (Figure 3).
Continue to: Posterior subluxation is indicated...
Posterior subluxation is indicated by a value >65%, a centered head is between 35% and 65%, and anterior subluxation is indicated by a value <35% (Figure 4).3
The humeral stems were evaluated for loosening by assessing for lucency on final radiographic follow-up films. These were evaluated in a zonal fashion as demonstrated by Sanchez-Sotelo and colleagues4 and in Figure 5.
FUNCTIONAL OUTCOME EVALUATION
Before clinical evaluation, each study patient completed the Western Ontario Osteoarthritis of the Shoulder (WOOS) index; the Disabilities of the Hand, Arm and Shoulder (DASH) questionnaire, and the pain and function sections of the Constant score. The functional outcomes scores were captured postoperatively from October to November 2011. The WOOS is a validated outcome measure specific to osteoarthritis of the shoulder and has been used in prior studies evaluating outcomes of TSA.5-7 Previous studies have determined that the minimal clinically important difference for the WOOS score is 15 on a normalized 0 to 100 scale (100 being the best). The DASH score is a validated outcome measure for disorders of the upper extremity but is not specific to osteoarthritis of the shoulder.8 The Constant score is a validated outcome measure for a number of shoulder disorders, including TSA.9,10
STATISTICAL ANALYSIS
Statistical analyses were completed by a trained biostatistician. A power analysis was calculated using the noninferiority test to determine if adequate data had been obtained for this study. This was calculated by using previously accepted data demonstrating a statistically significant difference for subsidence and HAD. The data from these studies were used to make assumptions regarding accepted standard deviations and noninferiority margins, as calculated from the mean values of the 2 groups analyzed in each respective study.4,11 This analysis demonstrated power of 0.97 and 0.85 for the subsidence and HAD, respectively, given the current sample sizes. Intraclass coefficients were calculated to evaluate the measurements obtained during the radiographic analysis to determine the interrater agreement. Two samples’ t tests were calculated for the variables analyzed, along with P values and means.
RESULTS
DEMOGRAPHICS
A total of 51 consecutive patients were retrospectively selected for analysis. Of these, 16 patients were excluded from the study because they had <9 months of radiographic follow-up and were unavailable for further follow-up evaluation. Of the remaining 35 patients available for analysis, 4 patients had bilateral TSA, providing 39 shoulders for evaluation. Demographic characteristics of the study cohort are reported in Table 1.
| Table 1. Demographic Characteristics | |||
| Tenotomy (n = 24) | Osteotomy (n = 15) | P-value | |
| Age | 68.2 [7.4] | 70.2 [7.1] | 0.46 |
| Follow-up | 20.6 [11.5] | 18.5 [6.25] | 0.94 |
| Females | 7 (29%) | 6 (40%) | 0.58 |
| Dominant shoulder | 14 (58%) | 8 (53%) | 0.81 |
| Primary Diagnosis | |||
| Osteoarthritis | 22 (92%) | 15 (100%) | |
| Rheumatoid arthritis | 2 (8%) | 0 (0%) |
Fifteen patients underwent LTO, and 24 underwent ST. One patient underwent a tenotomy of the right shoulder and LTO of the left shoulder. Three LTOs were performed by the surgeon who primarily performed ST, owing to potential benefits of LTO. He eventually returned to his preferred technique of ST because of surgeon preference. Three ST procedures were completed by the surgeon who typically performed LTO at the start of the series prior to establishing LTO as his preferred technique. There was no significant difference between the study populations in terms of age, follow-up, male-to-female ratio, hand dominance, and primary diagnosis of osteoarthritis vs rheumatoid arthritis.
Continue to: There was no significant difference...
RADIOGRAPHIC DATA
There was no significant difference in preoperative HAD between the LTO and ST groups (9.5 ± 2.4 mm vs 10.9 ± 2.7 mm, P = .11). The immediate postoperative HAD was statistically significant between the LTO and ST groups (11.9 ± 3.7 mm vs 15.9 ± 4.5 mm, P = .005). There was as statistically significant difference noted in the final follow-up films between the LTO and ST groups (11.8 ± 3.2 mm vs 14.5 ± 3.9 mm, P = .025) (Table 2).
Table 2. Radiographic Data | |||||
Humeral Acromial Distance | |||||
| LTO | ST | P-Value | ||
Preoperative, mm | 9.5 | [2.4] | 10.9 | [2.7] | 0.11 |
Postoperative, mm | 11.9 | [3.7] | 15.9 | [4.5] | 0.005 |
Final follow-up, mm | 11.8 | [3.2] | 14.5 | [3.9] | 0.025 |
Subsidence | |||||
| LTO | ST | P-Value | ||
Subsidence, mm | 2.8 | [3.1] | 2.5 | [3.1] | 0.72 |
Subluxation Index | |||||
| LTO | ST | P-Value | ||
Preoperative, % | 0.55 | [0.06] | 0.54 | [0.07] | 0.45 |
Postoperative, % | 0.55 | [0.09] | 0.48 | [0.05] | 0.015 |
Lucent Lines | |||||
| LTO | ST | P-Value | ||
Lines >2 mm, % | 0.00 | 0.08 | 0.51 | ||
Abbreviations: LTO, lesser tuberosity osteotomy; ST, subscapularis tenotomy.
There were no statistically significant differences found in subsidence between LTO and ST groups at final follow-up (2.8 mm ± 3.1 mm vs 2.5 mm ± 3.1 mm, P = .72) (Table 2). No statistically significant difference was noted in the subluxation index between the LTO and ST groups (0.55% ± .06% vs 0.54% ± 0.07%, P = .45), but there was a statistically significant difference noted postoperatively between the LTO and ST groups (0.55% ± 0.09% vs .48% ± 0.05%, P = .015) (Table 2).
Two stems were noted to have lucent lines >2 mm, both within the ST cohort. Each had 1 stem zone >2 mm, 1 in zone 7, and 1 in zone 4. No statistically significant difference was identified between the LTO and ST groups (0/15 vs 2/24, P = .51) (Table 2).
FUNCTIONAL OUTCOMES
Study patients were evaluated using functional outcome scores, including the Constant, WOOS, and DASH scores (Table 3).
| Table 3. Functional Data | |||||
| LTO | ST | P-Value | |||
| WOOS index | 93.3 | [5.3] | 81.5 | [20.8] | 0.013 |
| DASH score | 8.4 | [6.6] | 13.8 | [4.9] | 0.13 |
| Constant score | 83.3 | [9.1] | 81.8 | [10.1] | 0.64 |
Abbreviations: DASH, disabilities of the arm, shoulder and hand; WOOS, Western Ontario Osteoarthritis of the Shoulder.
No statistically significant differences were noted in the DASH scores (8.4 ± 6.6 vs 13.8 ± 4.9, P = .13) or Constant scores (83.3 ± 9.1 vs 81.8 ± 10.1, P = .64) between the LTO and ST cohorts. There was a statistically significant difference between the WOOS scores (93.3 ± 5.3 vs 81.5 ± 20.8, P = .013). Because separate radiographic reviews were done by 3 independent personnel at 3 different times, it was important to ensure agreement among the reviewers. This was compared using the intraclass correlation coefficients. In the statistical analysis completed, the intraclass coefficients showed the 3 reviewers agreed with each other throughout the radiographic analysis (Table 4).
| Table 4. Testing Agreement: ICC | ||||
| ICC | CI, 2.5% | CI, 97.5% | ||
| HAD | Preoperative | 0.4451 | 0.2202 | 0.6443 |
| Postoperative | 0.6997 | 0.4836 | 0.834 | |
| Final follow-up | 0.5575 | 0.3592 | 0.7218 | |
| Subsidence | 0.6863 | 0.5349 | 0.807 | |
| SI | Preoperative | 0.3087 | 0.1061 | 0.5213 |
| Final follow-up | 0.5364 | 0.299 | 0.7186 |
Abbreviations: CI, confidence interval; HAD, humeral acromial distance; ICC, intraclass correlation coefficient; SI, subluxation index.
DISCUSSION
At final follow-up, we identified no statistically significant difference between the LTO and ST patients in subsidence, lucent lines >2 mm, or functional outcomes (Constant and DASH scores) in patients who underwent TSA with the same proximal collar press-fit humeral stem. In regard to the functional outcome scores, although the WOOS score was statistically significant (P = .013) between the LTO and ST cohorts, we do not feel that this is clinically relevant because it does not reach the minimal clinically important difference threshold of 15 points.8
A statistically significant difference was noted in postoperative subluxation index but was not clinically relevant, because the values between the LTO and ST groups (0.55 vs 0.48) still showed a centered humeral head. Gerber and colleagues3 discussed using a value of 0.65 as a measure of posterior humeral head subluxation, whereas Walch and colleagues12 defined posterior humeral head subluxation as a value >0.55. On the basis of these numbers, the values obtained in this study demonstrated that the postoperative values were still centered on the glenoid, and therefore were not clinically significant.3,12
Continue to: In regard to HAD, there...
In regard to HAD, there was a statistically significant difference noted postoperatively (P = .005) and at final follow-up (P = .025) between the LTO and ST cohorts. Saupe and colleagues13 demonstrated that a HAD <7 mm was considered abnormal and reflected subacromial space narrowing. The values noted in the LTO and ST patients on postoperative and final follow-up radiographs were statistically significant (Table 2), but not clinically relevant because both were >7 mm. A potential source for the variation in HAD may be due to X-ray position and angle.
Studies have shown a concern regarding the integrity of the subscapularis after tenotomy or peel used in TSA with abnormal subscapularis function.14,15 Miller and colleagues15 reported 41 patients, nearly two-thirds, of whom described subscapularis dysfunction. Those authors’ response to the poor clinical outcomes was to remove a fleck of bone with the tendon to achieve “bone-to-bone” healing.14 Gerber and colleagues16 reported on a series of patients using LTO and repair in TSA with 75% and 89% intact subscapularis function on clinical testing.16 Studies by Qureshi and colleagues17 and Scalise and colleagues18 showed similar results after LTO. Biomechanical studies have shown mixed results. Ponce and colleagues19 showed biomechanically superior results for LTO in comparison to the various repair techniques for ST. In another study, Giuseffi and colleagues20 showed no difference in LTO vs ST during biomechanical testing. In response to the increased concern regarding subscapularis integrity, Caplan and colleagues21 reported on 45 arthroplasties in 43 patients with improved postoperative testing with intact subscapularis testing in 90% to 100% of patients. A level 1 randomized control trial conducted by Lapner and colleagues22 did not demonstrate any clear clinical advantage of LTO vs ST. Controversy still exists regarding which is the preferred technique for TSA.
Sanchez-Sotelo and colleagues4 evaluated uncemented humeral components in 72 patients who underwent TSA. They found a humeral component was at risk for loosening if a radiolucent line ≥2 mm was present in at least 3 radiographic zones. They also evaluated tilt or subsidence by measurement and whether the components were observed to have changed. Their measured values correlated with their observed values. That study provided a benchmark for evaluation of loosening and subsidence used during this study.4 Although radiographic follow-up is limited in this study, we feel that any potential subsidence secondary to use of the LTO technique would be radiographically apparent at 1 year. There were 16 patients without adequate radiographic follow-up included in the study. However, we feel that this was not a large concern, because the study was adequately powered with the patients available to determine a difference based on subsidence.
CONCLUSION
We found no difference in subsidence, lucent lines >2 mm, posterior subluxation, and the Constant and DASH functional outcome scores when we compared TSA performed by a LTO with an ST technique with proximal collar press-fit humeral stem. These data cannot be extrapolated to metaphyseal fit stems, which may exhibit different settling characteristics in the setting of the LTO technique.
This paper will be judged for the Resident Writer’s Award.
1. Blasier R, Soslowsky L, Malicky D, Palmer M. Posterior glenohumeral subluxation: Active and passive stabilization in a biomechanical model. J Bone Joint Surg Am. 1997;79-A(3):433-440.
2. Buckley T, Miller R, Nicandri G, Lewis R, Voloshin I. Analysis of subscapularis integrity and function after lesser tuberosity osteotomy versus subscapularis tenotomy in total shoulder arthroplasty using ultrasound and validated clinical outcome measures. J Shoulder Elbow Surg. 2014;23(9):1309-1317. doi:10.1016/j.jse.2013.12.009.
3. Gerber C, Costouros JG, Sukthankar A, Fucentese SF. Static posterior humeral head subluxation and total shoulder arthroplasty. J Shoulder Elbow Surg. 2009;18(4):505-510. doi:10.1016/j.jse.2009.03.003.
4. Sanchez-Sotelo J, Wright TW, O'Driscoll SW, Cofield RH, Rowland CM. Radiographic assessment of uncemented humeral components in total shoulder arthroplasty. J Arthroplasty. 2001;16(2):180-187.
5. Litchfield RB, McKee MD, Balyk R, et al. Cemented versus uncemented fixation of humeral components in total shoulder arthroplasty for osteoarthrtitis of the shoulder: A prospective, randomized, double-blind clinical trial-A JOINTs Canada Project. J Shoulder Elbow Surg. 2013;20(4):529-536. doi:10.1016/j.jse.2011.01.041.
6. Lo IK, Griffin S, Kirkley A. The development of a disease specific quality of life measurement tool for osteoarthritis of the shoulder: The Western Ontario Osteoarthritis of the Shoulder (WOOS) index. Osteoarthritis Cartilage. 2001;9(8):771-778. doi:10.1053/joca.2001.0474
7. Lo IK, Litchfield RB, Griffin S, Faber K, Patterson SD, Kirkley A. Quality of life outcome following hemiarthroplasty or total shoulder arthroplasty in patients with osteoarthritis. A prospective, randomized trial. J Bone Joint Surg Am. 2005;87(10):2178-2185. doi:10.2106/JBJS.D.02198
8. Hudak PL, Amadio PC, Bombardier C. Development of an upper extremity outcome measure: the DASH (disabilities of the arm, shoulder and hand) [corrected]. The Upper Extremity Collaborative Group (UECG). Am J Ind Med. 1996;29(6):602-608. doi:10.1002/(SICI)1097-0274(199606)29:6<602::AID-AJIM4>3.0.CO;2-L.
9. Constant CR, Gerber C, Emery RJ, Sojbjerg JO, Gohlke F, Boileau P. A review of the constant score: Modifications and guidelines for its use. J Shoulder Elbow Surg. 2008;17(2):355-361. doi:10.1016/j.jse.2007.06.022.
10. Constant CR, Murley AH. A clinical method of functional assessment of the shoulder. Clin Orthop Relat Res. 1987;(214):160-164.
11. Mayerhoefer ME, Breitenseher MJ, Wurnig C, Roposch A. Shoulder impingement: Relationship of clinical symptoms and imaging criteria. Clin J Sport Med. 2009;19(2):83-89. doi:10.1097/JSM.0b013e318198e2e3.
12. Walch G, Badet R, Boulahia A, Khoury A. Morphologic study of the glenoid in primary glenohumeral osteoarthritis. J Arthroplasy. 1999;14(6):756-760.
13. Saupe N, Pfirmann CW, Schmid MR, et al. Association between rotator cuff abnormalities and reduced acromiohumeral distance. AJR Am J Roentgenol. 2006;187(2):376-382. doi:10.2214/AJR.05.0435.
14. Jackson J, Cil A, Smith J, Steinmann SP. Integrity and function of the subscapularis after total shoulder arthroplasty. J Shoulder Elbow Surg. 2010;19(7):1085-1090. doi:10.1016/j.jse.2010.04.001.
15. Miller SL, Hazrati Y, Klepps S, Chiang A, Flatow EL. Loss of subscapularis function after total shoulder replacement: a seldom recognized problem. J Shoulder Elbow Surg. 2003;12(1):29-34. doi:10.1067/mse.2003.128195.
16. Gerber C, Yian EH, Pfirrmann AW, Zumstein MA, Werner CM. Subscapularis muscle function and structure after total shoulder replacement with lesser tuberosity osteotomy and repair. J Bone Joint Surg Am. 2005;87(8):1739-1745. doi:10.2106/JBJS.D.02788.
17. Qureshi S, Hsiao A, Klug RA, Lee E, Braman J, Flatow EL. Subscapularis function after total shoulder replacement: results with lesser tuberosity osteotomy. J Shoulder Elbow Surg. 2008;17(1): 68-72. doi:10.1016/j.jse.2007.04.018.
18. Scalise JJ, Ciccone J, Iannotti JP. Clinical, radiographic and ultrasonographic comparison of subscapularis tenotomy and lesser tuberosity osteotomy for total shoulder arthroplasty. J Bone Joint Surg Am. 2010;92(7):1627-1634. doi:10.2106/JBJS.G.01461.
19. Ponce BA, Ahluwalia RS, Mazzocca AD, Gobezie RG, Warner JJ, Millett PJ. Biomechanical and clinical evaluation of a novel lesser tuberosity in total shoulder arthroplasty. J Bone Joint Surg Am. 2005;87 Suppl 2:1-8.
20. Giuseffi SA, Wongtriratanachai P, Omae H, et al. Biomechanical comparison of lesser tuberosity osteotomy versus subscapularis tenotomy in total shoulder arthroplasty. J Shoulder Elbow Surg. 2012;21(8):1087-1095. doi:10.1016/j.jse.2011.07.008.
21. Caplan JL, Whitfield W, Nevasier RJ. Subscapularis function after primary tendon to tendon repair in patients after replacement arthroplasty of the shoulder. J Shoulder Elbow Surg. 2009;18(2):193-196. doi:10.1016/j.jse.2008.10.019.
22. Lapner PLC, Sabri E, Rakhra K, Bell K, Athwal GS. Comparison of LTO to subscapularis peel in shoulder arthroplasty. J Bone Joint Surg Am. 2012;94(24):2239-2246. doi:10.2106/JBJS.K.01365.
TAKE-HOME POINTS
- LTO and ST remain viable options for takedown of the subscapularis.
- No difference exists in subsidence, lucent lines, and posterior subluxation on radiographic evaluation between LTO and ST.
- No clinically significant difference exists between outcome scores of patients with either technique.
- HAD was statistically significant but not clinically relevant between the 2 techniques.
- Results from the study do not apply to metaphyseal fitting stems, only diaphyseal fitting stems.
Soft Tissue Reconstruction of the Proximal Tibiofibular Joint by Using Split Biceps Femoris Graft with 5-Year Clinical Follow-up
ABSTRACT
Instability of the proximal tibiofibular joint (PTFJ) is a rare clinical condition that presents unique challenges to treatment. We present the case of an active 26-year-old woman with a 4-year history of recurrent PTFJ subluxations, treated surgically at our institution using a split biceps femoris tendon graft for PTFJ reconstruction. She underwent several attempts at nonoperative management until we decided to proceed with surgical intervention. A split biceps femoris graft was used to restore stability of the PTFJ. Approximately 5 years postoperatively, she achieved full range of motion as well as functional and clinical Knee Society Scores of 94 and 90 points, respectively. To the best of our knowledge, this is the first case report of PTFJ instability treated surgically with long-term follow-up. Future studies should focus on the long-term satisfactory outcomes of soft tissue stabilization of a chronically unstable PTFJ.
The instability of the proximal tibiofibular joint (PTFJ) is a rare clinical condition that commonly occurs secondary to an initial pivoting or twisting event of a flexed knee. Although acute PTFJ dislocations respond well to closed reduction and casting, the treatment of chronic PTFJ instability presents a unique challenge.1 Surgical fixation methods include tibiofibular joint recreation using either a split semitendinosus or biceps femoris graft, as well as a Tightrope device.2-6 Older surgical options for chronic PTFJ instability include fibular head resection or PTFJ arthrodesis.7 However, these older techniques have fallen out of favor, and the optimal surgical technique for the treatment of this injury remains a point of contention.
We present the case of an active 26-year-old woman with a 4-year history of recurrent PTFJ subluxations. The patient was surgically treated at our institution by using a split biceps femoris tendon graft for PTFJ reconstruction. This article specifically details the surgical technique used, provides data obtained at the 5-year clinical follow-up, and reviews prior publications on this injury. The patient provided written informed consent for print and electronic publication of this case report.
CASE
A 26-year-old woman presented with a 4-year history of lateral right knee pain with any physical activity. She stated that her pain began immediately following a fall, which was initially treated with casting and immobilization for approximately 6 weeks. After treatment, she began to develop symptoms of “popping on the outside of the knee.” In the 8 months prior to her presentation to our practice, these symptoms had intensified in pain severity and frequency. She reported that the popping events occurred most often with deep squatting.
No gross deformity was observed upon physical examination, and both knees were visibly symmetric. Evidence of effusion was absent. The patient felt no pain with the passive motion of her knee, and she presented the full range of motion (ROM) from 0° to 120°. Anterior drawer, McMurray, Lachman, and pivot shift tests were all negative. Upon the application of manual pressure, the fibular head could be dislocated anteriorly (Video 1). This dislocation recreated the patient’s symptoms. The fibular head could not be subluxed or dislocated posteriorly. Flexing the knee to 90° facilitated reproducing manual anterior dislocation. The contralateral knee was examined and demonstrated no appreciable PTFJ instability. The patient exhibited no other signs of generalized ligamentous laxity. Her sensation in the lower leg was intact, and she reported no tingling or numbness in the peroneal nerve distribution. Tinel’s test of the peroneal nerve was negative.
Continue to: X-ray imaging revealed...
X-ray imaging revealed symmetrically aligned knees with the fibular head in place within the PTFJ. Magnetic resonance imaging (MRI) and computed tomography demonstrated no evidence of soft tissue posterolateral corner injury, meniscal damage, bony fracture, or PTFJ arthrosis.
When the patient presented to our office, she reported having undergone several failed efforts of nonoperative treatment, including bracing and activity modification. On the basis of the chronicity of the reported symptoms, level of pain, and the desire of the patient to return to full activity, we recommended the surgical reconstruction of the PTFJ by using a split biceps femoris tendon graft.
OPERATIVE TECHNIQUE
The patient was positioned supine on a Jackson table. General anesthesia was utilized. Biplanar fluoroscopic imaging of the fibula was obtained with the fibular head manually dislocated and reduced. A bump was placed beneath the right thigh to create resting knee flexion. The patient was prepped and draped in sterile fashion, and a tourniquet was applied.
A 10-cm curvilinear surgical incision was made centered over the fibular neck and extending proximally within the interval between the iliotibial band and the biceps femoris tendon. Dissection was performed. The peroneal nerve was identified, carefully dissected out, and then isolated with a vessel loop. The biceps femoris tendon insertion on the fibular head was dissected while ensuring that the nerve was isolated, and the anterior half of the tendon was marked approximately 14 cm proximally using a surgical marker. A 15-blade was then used to split the tendon proximally along the marked path while taking care to preserve the tendinous insertion on the fibular head. The split portion of the tendon was freed from all underlying tissue, and the most distal 2 cm was tubularized using a running baseball stitch and No. 2 Ethibond.
The anterior and posterior aspects of the fibular head were then débrided of tissue, and a guidewire was placed anteriorly-to-posterior. After the position of the guidewire was confirmed with fluoroscopy, a 5-0 cannulated reamer was used to drill through the fibular head. Next, the interval between the biceps femoris and iliotibial band was found, and the lateral head of the gastrocnemius was retracted posteriorly within this interval. A portion of the soleus muscle was also elevated off of the posterior capsule and posterior tibia. The iliotibial band insertion at Gerdy’s tubercle was then identified, and a guidewire was placed from anterior-to-posterior within the tibia, with the starting point just posterior to Gerdy’s tubercle. The wire was advanced under direct visualization with an ACL tibial guide and confirmed fluoroscopically. A 5-mm cannulated reamer was then used to drill over the guidewire through the anterior and posterior cortex of the tibia. A suture passer was passed anterior-to-posterior through this tunnel to retrieve the tubularized portion of the biceps femoris graft, which was then shuttled through the tibial tunnel. This same tubularized graft segment was then shuttled anteriorly-to-posteriorly through the fibular tunnel. At this point, approximately 3 cm of the graft protruded from the posterior aspect of the fibular tunnel.
Continue to: The remaining graft was held...
The remaining graft was held taut, and the knee was cycled through flexion and extension. The knee was then placed in approximately 30° of flexion, and the fibular head was noted to be well reduced within the tibiofibular joint. This was confirmed visually and fluoroscopically. A 4.75-mm biotenodesis interference screw was then placed from anterior-to-posterior in the fibular tunnel. The remaining tendon exiting posteriorly from the tunnel was then over-sewn onto the remaining native biceps femoris tendon attached to the fibular head. The knee was stable through flexion and extension, and gentle pressure on the fibular head demonstrated no subluxation motion (Video 2). The wound was copiously irrigated with normal saline. The tourniquet was then taken down, and following the reapproximation of the deep fascia, the wound was closed in standard subcutaneous fashion.
POSTOPERATIVE COURSE
The patient was initially kept in a knee immobilizer following surgery and instructed to use touch-down weight-bearing for 3 weeks. She was switched to a hinged brace at 1 week postoperatively. Physical therapy began with range of motion exercises, and an active flexion was withheld until 6 weeks postoperatively. After 6 weeks, the patient was allowed to progress to an active ROM and increase to weight-bearing as tolerated. Strengthening was started at 12 weeks.
MRI was performed at 4 months postoperatively because the patient reported pain with running. The MRI demonstrated no evidence of stress reaction or fracture in the area of reconstruction. She was advised to continue with physical therapy and stop running. At 5-month post-reconstruction, the patient reported that her pain had resolved and that she had no complaints of any peroneal nerve neuropraxia. At 6 months she had returned to normal activity without complaints. At this point, she was instructed to follow-up as needed.
The patient was seen in office 5.5 years after the initial surgery for an unrelated orthopedic issue. At this time, follow-up data were obtained for her PTFJ reconstruction. She stated that she was very satisfied with the results of her surgery. She claimed to be pain free and had been performing normal activities without any difficulty. Upon physical examination, she achieved full range of motion. She had no extension lag or flexion contracture. She achieved functional and clinical Knee Society Scores of 94 and 90 points, respectively.
DISCUSSION
This article details a soft tissue PTFJ reconstruction using a split biceps femoris graft with over 5 years of clinical follow-up. Chronic PTFJ instability is a rare clinical entity, and unless gross instability is evident upon physical examination, its diagnosis may be confused with the diagnosis of more common complaints, such as meniscal tears or iliotibial band syndrome.
Continue to: Ogden first described...
Ogden8 first described the classification system for PTFJ dislocations. The classification system is based on dislocation direction and whether the joint is partially subluxed or dislocated. The classification system is as follows: type 1, atraumatic subluxation; type 2, anterolateral dislocation; type 3, posteromedial dislocation; and type 4, superior dislocation. Anterolateral PTFJ dislocation is the most commonly reported PTFJ dislocation in published literature. This case was classified as a type 2 dislocation given that the patient’s fibular head can be dislocated with manual pressure following an initial traumatic event.
Past instances of PTFJ instability have been managed with closed reduction and protected weight-bearing, as well as with various open reduction techniques.2-7 Surgical reconstruction is commonly considered in chronic cases or if nonoperative modalities have failed. Although PTFJ arthrodesis or fibular head resection has been used as a prior treatment option, the postoperative complications associated with each of these techniques have since caused them to fall out of favor.
The split biceps femoris graft has been successfully used in the soft tissue reconstruction of PTFJ.3,5-7 The soft tissue reconstruction of the PTFJ provides advantages over arthrodesis or fibular head resection because it preserves normal anatomy and avoids secondary stresses to the ankle encountered in the latter procedure. Fibular head resection also presents secondary complications, such as the loss of the biceps femoris and posterolateral corner ligament insertion points.9 Similar to this study, prior works have reported returns to functionality. However, this study represents the longest clinical postoperative follow-up of PTFJ ligament reconstruction. By using a split biceps graft, the insertion point of the biceps on the fibular head is preserved, thus maintaining normal function while still allowing for an easily tubularized graft for anatomic PTFJ ligament reconstruction.
CONSLUSION
We present data for over 5 years of follow-up for our surgical approach to this rare pathology. To the best of our knowledge, this is the first case report of PTFJ instability that was treated surgically and with a long-term follow-up. The patient did not demonstrate loss of knee motion, pain, or peroneal nerve symptoms. Moreover, she was very satisfied with the procedure at the most recent follow-up and had returned to unrestricted activity. The soft tissue stabilization of a chronically unstable PTFJ is a viable treatment modality that provides good results, and future studies should confirm these satisfactory outcomes in the long-term.
This paper will be judged for the Resident Writer’s Award.
1. Nieuwe Weme RA, Somford MP, Schepers T. Proximal tibiofibular dislocation: a case report and review of literature. Strategies Trauma Limb Reconstr. 2014;9(3):185-189. doi:10.1007/s11751-014-0209-8.
2. Tafazal SI, Flowers MJ. Proximal tibiofibular joint instability in a child: stabilization with Tightrope. J Pediatr Orthop B. 2013;22(4):363-366. doi:10.1097/BPB.0b013e32836026b1.
3. Kobbe P, Flohe S, Wellmann M, Russe K. Stabilization of chronic proximal tibiofibular joint instability with a semitendinosus graft. Acta Orthop Belg. 2010;76(6):830-833.
4. Miettinen H, Kettunen J, Vaatainen U. Dislocation of the proximal tibiofibular joint.A new method for fixation. Arch Orthop Trauma Surg. 1999;119(5-6):358-359.
5. Mena H, Brautigan B, Johnson DL. Split biceps femoris tendon reconstruction for proximal tibiofibular joint instability. Arthroscopy. 2001;17(6):668-671.
6. Weinert CR Jr, Raczka R. Recurrent dislocation of the superior tibiofibular joint. Surgical stabilization by ligament reconstruction. J Bone Joint Surg Am. 1986;68(1):126-128.
7. Giachino AA. Recurrent dislocations of the proximal tibiofibular joint. Report of two cases. J Bone Joint Surg Am. 1986;68(7):1104-1106.
8. Ogden JA. Subluxation and dislocation of the proximal tibiofibular joint. J Bone Joint Surg Am. 1974;56(1):145-154.
9. Shapiro GS, Fanton GS, Dillingham MF. Reconstruction for recurrent dislocation of the proximal tibiofibular joint. A new technique. Orthop Rev. 1993;22(11):1229-1232.
ABSTRACT
Instability of the proximal tibiofibular joint (PTFJ) is a rare clinical condition that presents unique challenges to treatment. We present the case of an active 26-year-old woman with a 4-year history of recurrent PTFJ subluxations, treated surgically at our institution using a split biceps femoris tendon graft for PTFJ reconstruction. She underwent several attempts at nonoperative management until we decided to proceed with surgical intervention. A split biceps femoris graft was used to restore stability of the PTFJ. Approximately 5 years postoperatively, she achieved full range of motion as well as functional and clinical Knee Society Scores of 94 and 90 points, respectively. To the best of our knowledge, this is the first case report of PTFJ instability treated surgically with long-term follow-up. Future studies should focus on the long-term satisfactory outcomes of soft tissue stabilization of a chronically unstable PTFJ.
The instability of the proximal tibiofibular joint (PTFJ) is a rare clinical condition that commonly occurs secondary to an initial pivoting or twisting event of a flexed knee. Although acute PTFJ dislocations respond well to closed reduction and casting, the treatment of chronic PTFJ instability presents a unique challenge.1 Surgical fixation methods include tibiofibular joint recreation using either a split semitendinosus or biceps femoris graft, as well as a Tightrope device.2-6 Older surgical options for chronic PTFJ instability include fibular head resection or PTFJ arthrodesis.7 However, these older techniques have fallen out of favor, and the optimal surgical technique for the treatment of this injury remains a point of contention.
We present the case of an active 26-year-old woman with a 4-year history of recurrent PTFJ subluxations. The patient was surgically treated at our institution by using a split biceps femoris tendon graft for PTFJ reconstruction. This article specifically details the surgical technique used, provides data obtained at the 5-year clinical follow-up, and reviews prior publications on this injury. The patient provided written informed consent for print and electronic publication of this case report.
CASE
A 26-year-old woman presented with a 4-year history of lateral right knee pain with any physical activity. She stated that her pain began immediately following a fall, which was initially treated with casting and immobilization for approximately 6 weeks. After treatment, she began to develop symptoms of “popping on the outside of the knee.” In the 8 months prior to her presentation to our practice, these symptoms had intensified in pain severity and frequency. She reported that the popping events occurred most often with deep squatting.
No gross deformity was observed upon physical examination, and both knees were visibly symmetric. Evidence of effusion was absent. The patient felt no pain with the passive motion of her knee, and she presented the full range of motion (ROM) from 0° to 120°. Anterior drawer, McMurray, Lachman, and pivot shift tests were all negative. Upon the application of manual pressure, the fibular head could be dislocated anteriorly (Video 1). This dislocation recreated the patient’s symptoms. The fibular head could not be subluxed or dislocated posteriorly. Flexing the knee to 90° facilitated reproducing manual anterior dislocation. The contralateral knee was examined and demonstrated no appreciable PTFJ instability. The patient exhibited no other signs of generalized ligamentous laxity. Her sensation in the lower leg was intact, and she reported no tingling or numbness in the peroneal nerve distribution. Tinel’s test of the peroneal nerve was negative.
Continue to: X-ray imaging revealed...
X-ray imaging revealed symmetrically aligned knees with the fibular head in place within the PTFJ. Magnetic resonance imaging (MRI) and computed tomography demonstrated no evidence of soft tissue posterolateral corner injury, meniscal damage, bony fracture, or PTFJ arthrosis.
When the patient presented to our office, she reported having undergone several failed efforts of nonoperative treatment, including bracing and activity modification. On the basis of the chronicity of the reported symptoms, level of pain, and the desire of the patient to return to full activity, we recommended the surgical reconstruction of the PTFJ by using a split biceps femoris tendon graft.
OPERATIVE TECHNIQUE
The patient was positioned supine on a Jackson table. General anesthesia was utilized. Biplanar fluoroscopic imaging of the fibula was obtained with the fibular head manually dislocated and reduced. A bump was placed beneath the right thigh to create resting knee flexion. The patient was prepped and draped in sterile fashion, and a tourniquet was applied.
A 10-cm curvilinear surgical incision was made centered over the fibular neck and extending proximally within the interval between the iliotibial band and the biceps femoris tendon. Dissection was performed. The peroneal nerve was identified, carefully dissected out, and then isolated with a vessel loop. The biceps femoris tendon insertion on the fibular head was dissected while ensuring that the nerve was isolated, and the anterior half of the tendon was marked approximately 14 cm proximally using a surgical marker. A 15-blade was then used to split the tendon proximally along the marked path while taking care to preserve the tendinous insertion on the fibular head. The split portion of the tendon was freed from all underlying tissue, and the most distal 2 cm was tubularized using a running baseball stitch and No. 2 Ethibond.
The anterior and posterior aspects of the fibular head were then débrided of tissue, and a guidewire was placed anteriorly-to-posterior. After the position of the guidewire was confirmed with fluoroscopy, a 5-0 cannulated reamer was used to drill through the fibular head. Next, the interval between the biceps femoris and iliotibial band was found, and the lateral head of the gastrocnemius was retracted posteriorly within this interval. A portion of the soleus muscle was also elevated off of the posterior capsule and posterior tibia. The iliotibial band insertion at Gerdy’s tubercle was then identified, and a guidewire was placed from anterior-to-posterior within the tibia, with the starting point just posterior to Gerdy’s tubercle. The wire was advanced under direct visualization with an ACL tibial guide and confirmed fluoroscopically. A 5-mm cannulated reamer was then used to drill over the guidewire through the anterior and posterior cortex of the tibia. A suture passer was passed anterior-to-posterior through this tunnel to retrieve the tubularized portion of the biceps femoris graft, which was then shuttled through the tibial tunnel. This same tubularized graft segment was then shuttled anteriorly-to-posteriorly through the fibular tunnel. At this point, approximately 3 cm of the graft protruded from the posterior aspect of the fibular tunnel.
Continue to: The remaining graft was held...
The remaining graft was held taut, and the knee was cycled through flexion and extension. The knee was then placed in approximately 30° of flexion, and the fibular head was noted to be well reduced within the tibiofibular joint. This was confirmed visually and fluoroscopically. A 4.75-mm biotenodesis interference screw was then placed from anterior-to-posterior in the fibular tunnel. The remaining tendon exiting posteriorly from the tunnel was then over-sewn onto the remaining native biceps femoris tendon attached to the fibular head. The knee was stable through flexion and extension, and gentle pressure on the fibular head demonstrated no subluxation motion (Video 2). The wound was copiously irrigated with normal saline. The tourniquet was then taken down, and following the reapproximation of the deep fascia, the wound was closed in standard subcutaneous fashion.
POSTOPERATIVE COURSE
The patient was initially kept in a knee immobilizer following surgery and instructed to use touch-down weight-bearing for 3 weeks. She was switched to a hinged brace at 1 week postoperatively. Physical therapy began with range of motion exercises, and an active flexion was withheld until 6 weeks postoperatively. After 6 weeks, the patient was allowed to progress to an active ROM and increase to weight-bearing as tolerated. Strengthening was started at 12 weeks.
MRI was performed at 4 months postoperatively because the patient reported pain with running. The MRI demonstrated no evidence of stress reaction or fracture in the area of reconstruction. She was advised to continue with physical therapy and stop running. At 5-month post-reconstruction, the patient reported that her pain had resolved and that she had no complaints of any peroneal nerve neuropraxia. At 6 months she had returned to normal activity without complaints. At this point, she was instructed to follow-up as needed.
The patient was seen in office 5.5 years after the initial surgery for an unrelated orthopedic issue. At this time, follow-up data were obtained for her PTFJ reconstruction. She stated that she was very satisfied with the results of her surgery. She claimed to be pain free and had been performing normal activities without any difficulty. Upon physical examination, she achieved full range of motion. She had no extension lag or flexion contracture. She achieved functional and clinical Knee Society Scores of 94 and 90 points, respectively.
DISCUSSION
This article details a soft tissue PTFJ reconstruction using a split biceps femoris graft with over 5 years of clinical follow-up. Chronic PTFJ instability is a rare clinical entity, and unless gross instability is evident upon physical examination, its diagnosis may be confused with the diagnosis of more common complaints, such as meniscal tears or iliotibial band syndrome.
Continue to: Ogden first described...
Ogden8 first described the classification system for PTFJ dislocations. The classification system is based on dislocation direction and whether the joint is partially subluxed or dislocated. The classification system is as follows: type 1, atraumatic subluxation; type 2, anterolateral dislocation; type 3, posteromedial dislocation; and type 4, superior dislocation. Anterolateral PTFJ dislocation is the most commonly reported PTFJ dislocation in published literature. This case was classified as a type 2 dislocation given that the patient’s fibular head can be dislocated with manual pressure following an initial traumatic event.
Past instances of PTFJ instability have been managed with closed reduction and protected weight-bearing, as well as with various open reduction techniques.2-7 Surgical reconstruction is commonly considered in chronic cases or if nonoperative modalities have failed. Although PTFJ arthrodesis or fibular head resection has been used as a prior treatment option, the postoperative complications associated with each of these techniques have since caused them to fall out of favor.
The split biceps femoris graft has been successfully used in the soft tissue reconstruction of PTFJ.3,5-7 The soft tissue reconstruction of the PTFJ provides advantages over arthrodesis or fibular head resection because it preserves normal anatomy and avoids secondary stresses to the ankle encountered in the latter procedure. Fibular head resection also presents secondary complications, such as the loss of the biceps femoris and posterolateral corner ligament insertion points.9 Similar to this study, prior works have reported returns to functionality. However, this study represents the longest clinical postoperative follow-up of PTFJ ligament reconstruction. By using a split biceps graft, the insertion point of the biceps on the fibular head is preserved, thus maintaining normal function while still allowing for an easily tubularized graft for anatomic PTFJ ligament reconstruction.
CONSLUSION
We present data for over 5 years of follow-up for our surgical approach to this rare pathology. To the best of our knowledge, this is the first case report of PTFJ instability that was treated surgically and with a long-term follow-up. The patient did not demonstrate loss of knee motion, pain, or peroneal nerve symptoms. Moreover, she was very satisfied with the procedure at the most recent follow-up and had returned to unrestricted activity. The soft tissue stabilization of a chronically unstable PTFJ is a viable treatment modality that provides good results, and future studies should confirm these satisfactory outcomes in the long-term.
This paper will be judged for the Resident Writer’s Award.
1. Nieuwe Weme RA, Somford MP, Schepers T. Proximal tibiofibular dislocation: a case report and review of literature. Strategies Trauma Limb Reconstr. 2014;9(3):185-189. doi:10.1007/s11751-014-0209-8.
2. Tafazal SI, Flowers MJ. Proximal tibiofibular joint instability in a child: stabilization with Tightrope. J Pediatr Orthop B. 2013;22(4):363-366. doi:10.1097/BPB.0b013e32836026b1.
3. Kobbe P, Flohe S, Wellmann M, Russe K. Stabilization of chronic proximal tibiofibular joint instability with a semitendinosus graft. Acta Orthop Belg. 2010;76(6):830-833.
4. Miettinen H, Kettunen J, Vaatainen U. Dislocation of the proximal tibiofibular joint.A new method for fixation. Arch Orthop Trauma Surg. 1999;119(5-6):358-359.
5. Mena H, Brautigan B, Johnson DL. Split biceps femoris tendon reconstruction for proximal tibiofibular joint instability. Arthroscopy. 2001;17(6):668-671.
6. Weinert CR Jr, Raczka R. Recurrent dislocation of the superior tibiofibular joint. Surgical stabilization by ligament reconstruction. J Bone Joint Surg Am. 1986;68(1):126-128.
7. Giachino AA. Recurrent dislocations of the proximal tibiofibular joint. Report of two cases. J Bone Joint Surg Am. 1986;68(7):1104-1106.
8. Ogden JA. Subluxation and dislocation of the proximal tibiofibular joint. J Bone Joint Surg Am. 1974;56(1):145-154.
9. Shapiro GS, Fanton GS, Dillingham MF. Reconstruction for recurrent dislocation of the proximal tibiofibular joint. A new technique. Orthop Rev. 1993;22(11):1229-1232.
TAKE-HOME POINTS
- We present the case of an active 26-year-old woman with a 4-year history of recurrent PTFJ subluxations.
- We chose to treat this patient surgically using split biceps femoris tendon graft for PTFJ reconstruction after failed nonoperative management.
- Surgical correction should be considered for those who fail several courses of nonoperative management.
- In our practice, we prefer reconstruction over arthrodesis as it preserves normal anatomy and avoids secondary stresses to the ankle.
- The soft tissue stabilization of a chronically unstable PTFJ is a viable treatment modality that provides good results