User login
Ultrasound and Pleural Effusions
Hospitalists commonly encounter pleural effusions, and their detection and characterization by point‐of‐care ultrasound can guide management. Approximately 44% to 57% of hospitalized patients with bacterial pneumonia,[1, 2] and up to 62% of intensive care unit (ICU) patients[3] have a pleural effusion. For patients with a parapneumonic effusion, hospitalists can use ultrasound to quantify and characterize pleural fluid to determine whether diagnostic or therapeutic drainage is indicated, as well as guide performance of thoracentesis. For patients with lung cancer, detection of a malignant pleural effusion changes staging to stage IV, regardless of tumor size or lymph node involvement, and hospitalists may discuss more appropriate treatment options with patients and consultants.
Routine use of pleural ultrasonography may help hospitalists provide high‐value care by reducing ancillary testing, including computerized tomography (CT) scans that expose patients to ionizing radiation, and reducing complications of thoracentesis. However, many hospitalists may not be familiar with the use of point‐of‐care ultrasound. A national survey in 2012 revealed only 25% of internal medicine residencies have formal curricula to teach point‐of‐care ultrasonography.[4] The purpose of this review is to provide an overview of how point‐of‐care ultrasound can be utilized by hospitalists in the care of patients with pleural effusions. We review the literature on the diagnosis and evaluation of pleural effusions with ultrasound, as well as techniques to examine and drain the pleural space.
DIAGNOSIS OF PLEURAL EFFUSION
History and Physical Exam
Pleural effusions are most commonly associated with heart failure, pneumonia, cancer, pulmonary embolism, viral disease, coronary artery bypass surgery, and cirrhosis with ascites. The most common symptoms related to pleural effusion are nonspecific and often indistinguishable from those of the underlying disease process, including cough, dyspnea, and pleuritic chest pain.[5]
Diagnostic accuracy of a physical examination to detect pleural fluid is highly dependent on the size of the effusion and is unlikely to detect effusions <300 mL. A systematic review found the most accurate physical exam findings to rule in a pleural effusion were dullness to percussion (positive likelihood ratio [LR]: 8.7; 95% CI: 2.2‐33.8) and asymmetric chest expansion (positive LR: 8.1; 95% CI: 5.2‐12.7). Normal tactile vocal fremitus was the most accurate physical exam finding to rule out a pleural effusion (negative LR: 0.21; 95% CI: 0.12‐0.37).[6] A major limitation of all these studies is that physical exam was compared to chest radiography as the reference standard, and posterior‐anterior chest radiographs are not sensitive for detection of pleural effusions until 200 mL of fluid has accumulated.[7] Further, chest percussion penetrates to a maximum depth of 6 cm, and its utility is limited in obese patients.[8] Characteristics of pleural fluid that can change management, such as loculations, cannot be detected by physical exam.
Chest Radiography
Chest radiography has traditionally been used to diagnose pleural effusions. Free‐flowing pleural fluid collects in the most dependent portions of the thorax, initially in the subpulmonic space followed by the costophrenic recesses. Pleural fluid is detectable in the costophrenic recesses on lateral upright chest radiograph after 50 mL has accumulated. On standard posterior‐anterior chest radiograph, blunting of the costophrenic recesses and obliteration of the hemidiaphragm are seen when >200 mL and >500 mL of pleural fluid have accumulated, respectively.[7] However, upright chest radiographs can miss a considerable number of effusions, including as many as 10% of parapneumonic effusions large enough to indicate need for drainage.[9] Supine anterior‐posterior chest radiographs can miss a significant proportion of large effusions seen on chest CT,[10] ultrasound,[11] and lateral decubitus radiographs.[12] Pleural effusions are frequently mistaken for parenchymal opacities on portable anterior‐posterior chest radiographs.[10]
Computerized Tomography
Chest CT serves as the reference standard in most modern diagnostic accuracy studies. Limitations of chest CT include difficulty distinguishing small effusions from pleural thickening, dependent atelectasis, or tumor; lower sensitivity for detecting pleural fluid septations compared to ultrasound[13]; exposure of patients to approximately 7 mSv of ionizing radiation (the equivalent radiation dose of 350 chest radiographs)[14]; high cost; and need to transport patients to radiology departments where CT scanners are located.
Pleural Ultrasonography
Ultrasound can rapidly differentiate conditions that demonstrate a nonspecific, radiopaque appearance of lower lung fields on chest radiographs, including pleural effusions, pneumonia, atelectasis, elevated hemidiaphragm, and lung or pleural masses. Advantages of point‐of‐care ultrasound include the ability of hospitalists to acquire and interpret images at the bedside and integrate findings into clinical decision making immediately. Multiple studies have demonstrated superior diagnostic accuracy of ultrasound compared to chest radiography for detection of pleural effusions. Pleural ultrasound can detect physiologic amounts of pleural fluid (5 mL),[15] but a minimal volume of 20 mL is more reliably detected,[16] and ultrasound is 100% sensitive for effusions >100 mL.[17] In a prospective study of critically ill patients with acute respiratory distress syndrome, the diagnostic accuracy of ultrasound for pleural effusions was superior (93%) compared to auscultation (61%) and anterior‐posterior chest radiograph (47%), using chest CT as the reference standard.[18] A meta‐analysis of 4 studies calculated a pooled sensitivity and specificity of ultrasound for detection of pleural effusions as 93% (95% CI: 89%‐96%) and 96% (95% CI: 95%‐98%), respectively.[18, 19, 20, 21, 22] Ultrasound has the additional benefit of characterizing underlying lung parenchyma, which is well described in the literature but beyond the scope of this review.[23]
Sensitivity and specificity of chest radiography and ultrasonography to detect a pleural effusion are displayed in Table 1.[9, 10, 11, 12, 18, 20, 21, 22, 24, 25, 26]
| Exam | Reference Standard | Sensitivity | Specificity | Study | |
|---|---|---|---|---|---|
| |||||
| Chest radiograph | Supine AP | Upright PA/lateral | 92% | Woodring[24] | |
| Lateral decubitus XR | 67% | 70% | Ruskin[12] | ||
| Ultrasound | 82% | 82% | Emamian[11] | ||
| Ultrasound or thoracentesis | 33% | Kocijancic[25] | |||
| CT | 39% | 85% | Lichtenstein[18] | ||
| CT | 66% | 89% | Kitazano[10] | ||
| CT | 65% | 81% | Xirouchaki[26] | ||
| CT | 78% | 76% | Brixey[9] | ||
| Lateral decubitus | Ultrasound or thoracentesis | 94% | 100% | Kocijancic[25] | |
| Upright PA | CT | 82% | 81% | Brixey[9] | |
| Lateral upright | CT | 86% | 88% | Brixey[9] | |
| Ultrasound | Cardiology | CT | 93% | 88% | Kataoka[20] |
| Point of care | CT or tube thoracostomy | 96% | 100% | Ma[21] | |
| CT | 92% | 93% | Lichtenstein[18] | ||
| CT | 94% | 99% | Rocco[22] | ||
| CT | 100% | 100% | Xirouchaki[26] | ||
PLEURAL ULTRASOUND EXAMINATION
A pleural ultrasound exam may be performed as part of a complete lung ultrasound exam, such as the BLUE (Bedside Lung Ultrasound in Emergency) protocol,[27] or a focused exam to evaluate a suspected or known pleural effusion seen on chest radiograph or CT scan.[27] Free‐flowing pleural effusions accumulate in the most dependent portions of the thorax, most commonly, the posterolateral costophrenic recesses in semirecumbent or seated patients, but anteriorly in mechanically ventilated patients in a prone position.
A low‐frequency (25 MHz) phased‐array transducer is generally preferred for imaging in between the ribs. High‐frequency linear transducers do not provide adequate penetration to visualize deep structures, but do provide superior visualization of the pleural line to assess pleural thickness, measure pleural depth, and evaluate for pneumothorax.
Pleural effusions are best evaluated starting at the level of the diaphragm. Place the transducer in a longitudinal plane on the posterior axillary line at the level of the diaphragm with the transducer orientation marker (notch) pointed cephalad (Figure 1). Five structures must be definitively identified to diagnose a pleural effusion: liver/spleen, diaphragm, pleural fluid, lung, and chest wall (Figure 2A). Large pleural effusions compress the adjacent lung causing atelectasis, which gives the lung a tissue‐like echogenicity similar to the liver (Figure 2B). Static air bronchograms are commonly seen in atelectatic lung bases with pleural effusions.[28]

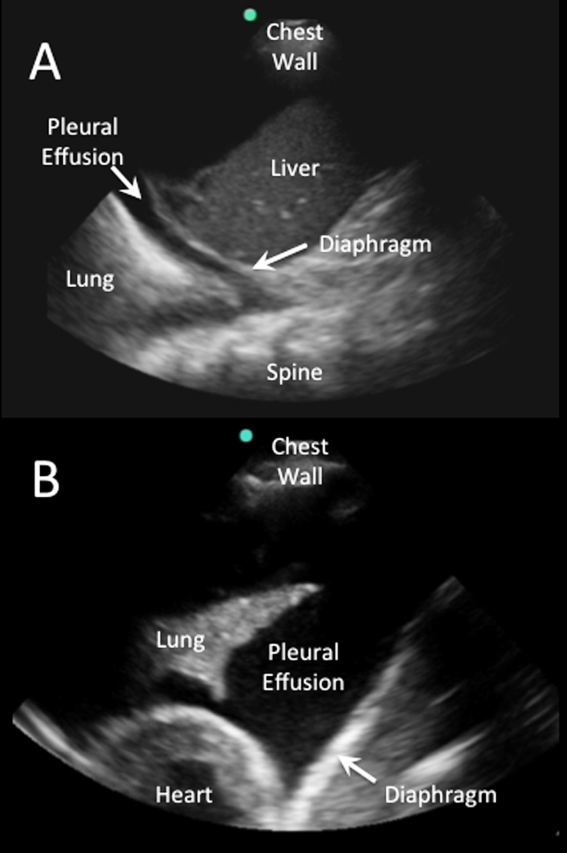
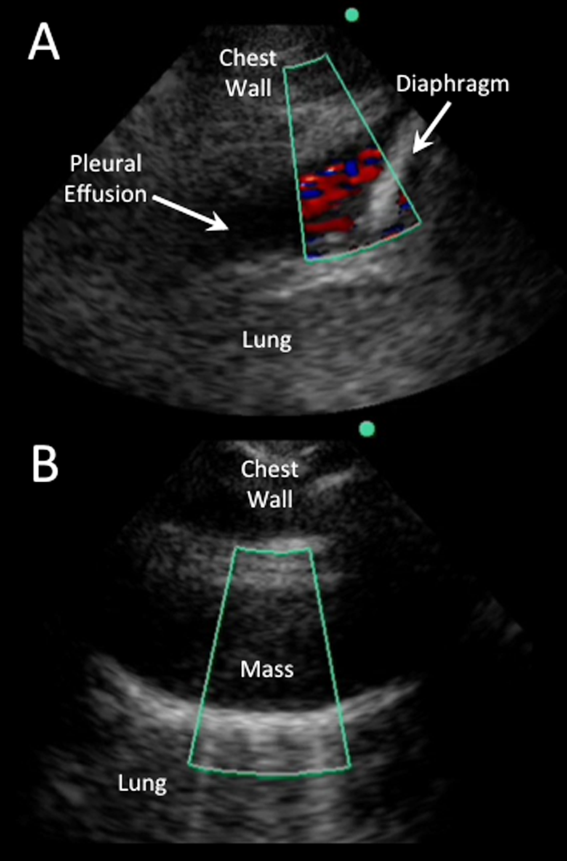
Color flow Doppler and M‐mode ultrasound may be utilized as adjuncts to routine 2‐dimensional ultrasonography. Free‐flowing pleural effusions will demonstrate flow by color Doppler (Figure 3A). Using M‐mode ultrasound, the lung can been seen moving within a pleural effusion to and from the chest wall (sinusoid sign).[29] Absence of flow or movement is seen with dense pleural loculations, pleural thickening, and peripheral lung or pleural masses (Figure 3B).
CHARACTERIZATION OF PLEURAL EFFUSION
Pleural Fluid Volume
Quantification of pleural fluid volume has been proposed using formulas with sonographic measurements.[30, 31, 32] These formulas are most accurate for moderate‐sized effusions but have not been validated beyond individual study cohorts. The largest study (n = 150) found a strong correlation between calculated and actual volumes drained by thoracentesis (r2 = 0.79; P < 0.001) using the formula (Volume [mL] = 16 parietal to visceral pleura distance (mm) at the mid‐diaphragm).[31] Although an accurate quantitative pleural fluid volume assessment may be possible, these formulas are not commonly used in clinical practice. A qualitative assessment is adequate for most clinical decision making using categories of minimal, small, moderate, or large volume.
Simple Versus Complex Effusions
Based on its sonographic appearance, pleural effusions are categorized as simple or complex. Simple pleural effusions are anechoic and usually transudative. Complex pleural effusions are subcategorized as homogeneously or heterogeneously echogenic, with or without septations, and are more often exudative.[33]
Effusions with heterogeneous echogenicity with swirling echoes suggest high cellular content that is often associated with malignancy.[34] Fibrinous stranding, septations, and loculations also suggest an exudative effusion (Figure 4A), and are more readily identified and characterized on lung ultrasound than CT scan.[35]
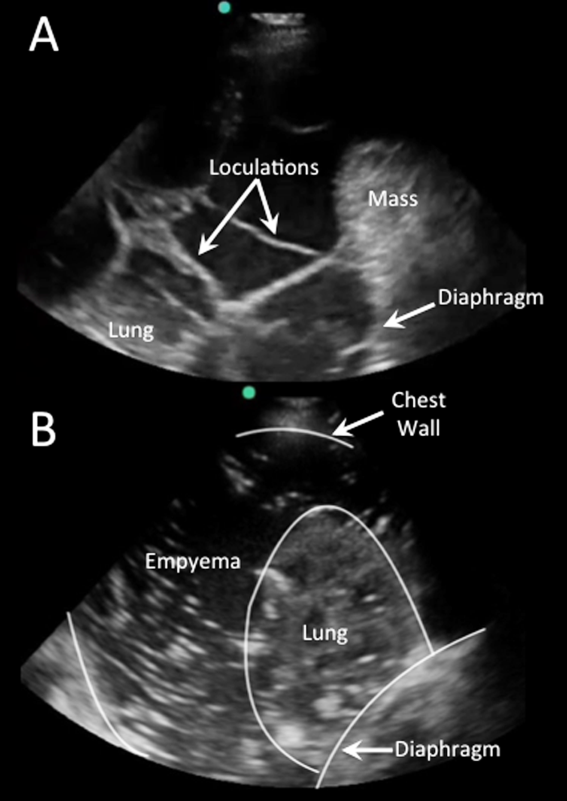
Homogenously echogenic effusions are most often due to hemothorax or empyema.[36] The high cell count of a hemothorax creates a layering effect in costophrenic recesses (hematocrit sign). Empyemas develop from complex effusions that organize into collections of pus and usually have a homogeneously echogenic, speckled appearance (Figure 4B). Sonographic evidence of septations in the presence of empyema predicts the need for intrapleural fibrinolytic therapy, longer duration of drainage, and possible surgical intervention.[37]
Isolated dense loculations may be challenging to differentiate from peripheral lung or pleural lesions, such as abscess or tumor.
Pleural Thickness
Normal visceral and parietal pleura are apposed and 0.2 to 0.3 mm thick.[38] Pleural effusions with parietal pleural thickness >10 mm, pleural nodularity, and diaphragmatic thickness >7 mm predicted underlying malignancy with high specificity and positive predictive value in 1 study.[39] As many as 20% of anechoic lesions of the pleura are solid rather than fluid. Color flow Doppler ultrasound can differentiate small pleural effusions from solid pleural abnormalities with sensitivity and specificity of 89% and 100%, respectively.[40]
PLEURAL FLUID DRAINAGE
Since its first description in 1967, use of ultrasound guidance for thoracentesis has evolved to become the standard of care in many hospitals in the United States.[41] The British Thoracic Society guidelines recommend that all thoracenteses be performed with ultrasound guidance.[42] The American College of Graduate Medical Education now requires proficiency in the use of ultrasound for thoracentesis and pleural catheter insertion by pulmonary and critical care fellows.[43]
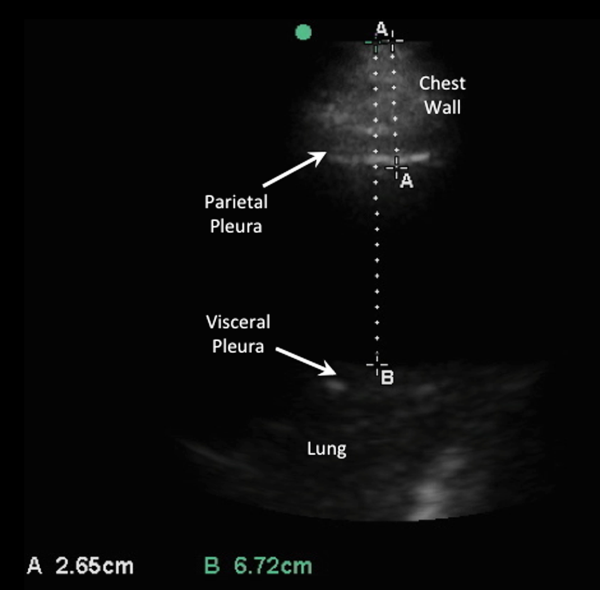
The impetus for these recommendations stems from increased procedural success and decreased complications associated with ultrasound‐guided drainage of pleural effusions. A study evaluating thoracentesis site selection based on physical exam and chest radiographs demonstrated inaccurate site selection in 15% of patients, and use of ultrasound for site selection prevented possible accidental organ puncture in 10% of all cases.[44] The success rate of thoracentesis for small pleural effusions has been shown to increase from 66% to 90% with ultrasound guidance.[42] Using ultrasound, the distance from the skin to parietal and visceral pleura can be measured to determine whether thoracentesis can be safely performed, and to guide selection of an adequate length needle (Figure 5). A minimum pleural effusion depth of 1.5 cm between the visceral and parietal pleura has been recommended to perform diagnostic thoracentesis.[28] Diagnostic thoracentesis of complex septated pleural effusions or empyemas may be performed with a straight needle, but therapeutic drainage often requires temporary insertion of a catheter. Traditionally, large‐bore chest tubes (>24 F) had been advocated to drain viscid pus, but recent evidence suggests that small‐bore catheters (1014 F) with instillation of thrombolytics may be as effective and performed with less discomfort.[45] Video‐assisted thoracoscopy to lyse septations and evacuate infected materials is indicated when chest tube drainage has failed.
The most common complication of pleural drainage is pneumothorax. A meta‐analysis demonstrated a reduction in post‐thoracentesis pneumothorax rates from 9% to 4% with use of ultrasound.[46] Transporting patients to radiology for ultrasound marking has not been shown to decrease pneumothorax rates compared to thoracentesis without ultrasound guidance, likely due to changes in patient position and prolonged delays between marking and drainage.[47] Postprocedure pneumothorax can be ruled out if lung sliding is visualized. A meta‐analysis demonstrated superior sensitivity and similar specificity of pleural ultrasonography versus chest radiography to detect pneumothorax (sensitivity 91% vs 50% and specificity 98% vs 99%, respectively).[48] Real‐time ultrasound guidance for thoracentesis, or use of ultrasound to track the needle tip, has not been well studied but may be performed by experienced proceduralists to drain small effusions.
FUTURE RESEARCH
Future research should focus on the clinical effectiveness of point‐of‐care pleural ultrasonography when integrated with other diagnostic tools, and application of new ultrasound technologies to evaluate pleural diseases. Routine use of point‐of‐care ultrasound as the primary imaging modality in a medical ICU demonstrated a highly statistically significant reduction in chest x‐rays (3.75 vs 0.82, P < 0.0001) and chest CT scans (0.10 vs 0.04, P = 0.0007).[49] Similar studies have yet to be performed with the use of ultrasound specifically in the management of pleural diseases. Thus, clinical effectiveness studies are needed to assess the impact of routine use of pleural ultrasound on the initiation of appropriate therapies, length of stay, and costs in the management of pleural disease.
Point‐of‐care pleural ultrasound findings need to be evaluated in the context of other clinical findings and diagnostic tests. Certain ultrasound findings have been associated with exudative pleural effusions, but whether exudative and transudative effusions can be differentiated noninvasively using ultrasound findings alone, or in combination with other clinical data, warrants investigation. Similar to severity of illness scores, models that incorporate clinical, laboratory, and ultrasound findings need to be developed to guide treatment decisions, such as type of drainage procedure, as well as prognostication.
Finally, new technologies may advance the utility of point‐of‐care pleural ultrasonography. Even though 3‐dimensional ultrasonography has been available for over 2 decades, comparative studies of conventional 2‐dimensional versus 3‐dimensional ultrasonography to characterize pleural effusions have yet to be performed. Furthermore, computer‐aided detection has been shown to facilitate interpretation of ultrasound images, but this technology has yet to be applied to pleural ultrasonography.
CONCLUSIONS
Point‐of‐care pleural ultrasound is a powerful bedside tool in the hospitalist's armamentarium that is superior to physical examination and chest radiographs in the detection and characterization of pleural effusions. Furthermore, ultrasound performs similarly when compared to CT scans but offers the advantages of decreased cost, avoidance of ionizing radiation, and availability at the bedside. Ultrasound guidance reduces complications and increases the success rate of pleural drainage procedures, leading to improved patient safety. As clinical effectiveness studies emerge revealing its true value, point‐of‐care pleural ultrasonography is likely to become the standard diagnostic tool to evaluate and manage patients with pleural effusions.
Disclosures: Dr. Restrepo is partially supported by award number K23HL096054 from the National Heart, Lung, and Blood Institute. The content is solely the responsibility of the authors and does not necessarily represent the official views of the National Heart, Lung, and Blood Institute or the National Institutes of Health. The authors report no conflicts of interest.
- , , , . Parapneumonic effusions. Am J Med. 1980;69(4):507–512.
- , , . The incidence and clinical correlates of parapneumonic effusions in pneumococcal pneumonia. Chest. 1978;74(2):170–173.
- , , , , . Pleural effusions in the medical ICU: prevalence, causes, and clinical implications. Chest. 1997;111(4):1018–1023.
- , , , . Point‐of‐care ultrasound in internal medicine: a national survey of educational leadership. J Grad Med Educ. 2013;5(3):498–502.
- . Pleural Diseases. Philadelphia, PA: Lippincott Williams 2007.
- , , . Does this patient have a pleural effusion? JAMA. 2009;301(3):309–317.
- , , , . Pleural fluid volume estimation: a chest radiograph prediction rule. Acad Radiol. 1996;3(2):103–109.
- , . Accuracy of the physical examination in evaluating pleural effusion. Cleve Clin J Med. 2008;75(4):297–303.
- , , , , . The efficacy of chest radiographs in detecting parapneumonic effusions. Respirology. 2011;16(6):1000–1004.
- , , , , . Differentiation of pleural effusions from parenchymal opacities: accuracy of bedside chest radiography. AJR Am J Roentgenol. 2010;194(2):407–412.
- , , , . Accuracy of the diagnosis of pleural effusion on supine chest X‐ray. Eur Radiol. 1997;7(1):57–60.
- , , , . Detection of pleural effusions on supine chest radiographs. AJR Am J Roentgenol. 1987;148(4):681–683.
- , , , , . Multiloculated pleural effusion detected by ultrasound only in a critically‐ill patient. Am J Case Rep. 2013;14:63–66.
- , , , et al. Exposure to low‐dose ionizing radiation from medical imaging procedures. N Engl J Med. 2009;361(9):849–857.
- , , . The diagnosis of pleural effusion by ultrasonic and radiologic techniques. Chest. 1976;70(1):33–37.
- , , , , , . Ultrasound in blunt abdominal and thoracic trauma. J Trauma. 1993;34(4):488–495.
- , , , et al. Application of color Doppler ultrasound in the study of small pleural effusion. Med Ultrason. 2010;12(1):12–16.
- , , , , , . Comparative diagnostic performances of auscultation, chest radiography, and lung ultrasonography in acute respiratory distress syndrome. Anesthesiology. 2004;100(1):9–15.
- , , , , . Diagnostic accuracy of sonography for pleural effusion: systematic review. Sao Paulo Med J. 2010;128(2):90–95.
- , . The role of thoracic ultrasonography for evaluation of patients with decompensated chronic heart failure. J Am Coll Cardiol. 2000;35(6):1638–1646.
- , . Trauma ultrasound examination versus chest radiography in the detection of hemothorax. Ann Emerg Med. 1997;29(3):312–315; discussion 315–316.
- , , , et al. Diagnostic accuracy of bedside ultrasonography in the ICU: feasibility of detecting pulmonary effusion and lung contusion in patients on respiratory support after severe blunt thoracic trauma. Acta Anaesthesiol Scand. 2008;52(6):776–784.
- . Lung ultrasound in the critically ill. Ann Intensive Care. 2014;4(1):1.
- . Recognition of pleural effusion on supine radiographs: how much fluid is required? AJR. Am J Roentgenol. 1984;142(1):59–64.
- , , . Chest sonography versus lateral decubitus radiography in the diagnosis of small pleural effusions. J Clin Ultrasound. 2003;31(2):69–74.
- , , , , . Impact of lung ultrasound on clinical decision making in critically ill patients. Intensive Care Med. 2014;40(1):57–65.
- . Lung ultrasound in acute respiratory failure an introduction to the BLUE‐protocol. Minerva Anestesiol. 2009;75(5):313–317.
- , , . Point‐of‐Care Ultrasound. 1st ed. Philadelphia, PA: Saunders; 2014.
- , , , et al. International evidence‐based recommendations for point‐of‐care lung ultrasound. Intensive Care Med. 2012;38(4):577–591.
- , , , et al. Ultrasound estimation of volume of pleural fluid in mechanically ventilated patients. Intensive Care Med. 2006;32(2):318–321.
- , , . Ultrasound estimation of volume of postoperative pleural effusion in cardiac surgery patients. Interact Cardiovasc Thorac Surg. 2010;10(2):204–207.
- , , , et al. Multiplane ultrasound approach to quantify pleural effusion at the bedside. Intensive Care Med. 2010;36(4):656–664.
- , , , , , . Value of sonography in determining the nature of pleural effusion: analysis of 320 cases. AJR Am J Roentgenol. 1992;159(1):29–33.
- , , , , , . Echogenic swirling pattern as a predictor of malignant pleural effusions in patients with malignancies. Chest. 2004;126(1):129–134.
- , . Imaging the pleura: sonography, CT, and MR imaging. AJR Am J Roentgenol. 1991;156(6):1145–1153.
- , , , et al. Pleural effusions in febrile medical ICU patients: chest ultrasound study. Chest. 2004;126(4):1274–1280.
- , , , , . Sonographic septation: a useful prognostic indicator of acute thoracic empyema. J Ultrasound Med. 2000;19(12):837–843.
- . Sonography of the pleura [in German]. Ultraschall Med. 2010;31(1):8–22, quiz 23–25.
- , , . Thoracic ultrasound in the diagnosis of malignant pleural effusion. Thorax. 2009;64(2):139–143.
- , , , . “Fluid color” sign: a useful indicator for discrimination between pleural thickening and pleural effusion. J Ultrasound Med. 1995;14(10):767–769.
- , , . Reflected ultrasound in the detection and localization of pleural effusion. JAMA. 1967;200(5):399–402.
- , , , . Pleural procedures and thoracic ultrasound: British Thoracic Society Pleural Disease Guideline 2010. Thorax. 2010;65(suppl 2):ii61–ii76.
- Accreditation Council for Graduate Medical Education. http://www.acgme.org/acgmeweb. Accessed January 15, 2015.
- , , . Accuracy of pleural puncture sites: a prospective comparison of clinical examination with ultrasound. Chest. 2003;123(2):436–441.
- , , , , , . A double blind randomized cross over trial comparing rate of decortication and efficacy of intrapleural instillation of alteplase vs placebo in patients with empyemas and complicated parapneumonic effusions. Respir Med. 2012;106(5):716–723.
- , , , . Pneumothorax following thoracentesis: a systematic review and meta‐analysis. Arch Intern Med. 2010;170(4):332–339.
- , , , , , . Factors affecting the development of pneumothorax associated with thoracentesis. AJR Am J Roentgenol. 1991;156(5):917–920.
- , , . Test characteristics of ultrasonography for the detection of pneumothorax: a systematic review and meta‐analysis. Chest. 2012;141(3):703–708.
- , , , et al. The effect of point‐of‐care ultrasonography on imaging studies in the medical ICU: a comparative study. Chest. 2014;146(6):1574–1577.
Hospitalists commonly encounter pleural effusions, and their detection and characterization by point‐of‐care ultrasound can guide management. Approximately 44% to 57% of hospitalized patients with bacterial pneumonia,[1, 2] and up to 62% of intensive care unit (ICU) patients[3] have a pleural effusion. For patients with a parapneumonic effusion, hospitalists can use ultrasound to quantify and characterize pleural fluid to determine whether diagnostic or therapeutic drainage is indicated, as well as guide performance of thoracentesis. For patients with lung cancer, detection of a malignant pleural effusion changes staging to stage IV, regardless of tumor size or lymph node involvement, and hospitalists may discuss more appropriate treatment options with patients and consultants.
Routine use of pleural ultrasonography may help hospitalists provide high‐value care by reducing ancillary testing, including computerized tomography (CT) scans that expose patients to ionizing radiation, and reducing complications of thoracentesis. However, many hospitalists may not be familiar with the use of point‐of‐care ultrasound. A national survey in 2012 revealed only 25% of internal medicine residencies have formal curricula to teach point‐of‐care ultrasonography.[4] The purpose of this review is to provide an overview of how point‐of‐care ultrasound can be utilized by hospitalists in the care of patients with pleural effusions. We review the literature on the diagnosis and evaluation of pleural effusions with ultrasound, as well as techniques to examine and drain the pleural space.
DIAGNOSIS OF PLEURAL EFFUSION
History and Physical Exam
Pleural effusions are most commonly associated with heart failure, pneumonia, cancer, pulmonary embolism, viral disease, coronary artery bypass surgery, and cirrhosis with ascites. The most common symptoms related to pleural effusion are nonspecific and often indistinguishable from those of the underlying disease process, including cough, dyspnea, and pleuritic chest pain.[5]
Diagnostic accuracy of a physical examination to detect pleural fluid is highly dependent on the size of the effusion and is unlikely to detect effusions <300 mL. A systematic review found the most accurate physical exam findings to rule in a pleural effusion were dullness to percussion (positive likelihood ratio [LR]: 8.7; 95% CI: 2.2‐33.8) and asymmetric chest expansion (positive LR: 8.1; 95% CI: 5.2‐12.7). Normal tactile vocal fremitus was the most accurate physical exam finding to rule out a pleural effusion (negative LR: 0.21; 95% CI: 0.12‐0.37).[6] A major limitation of all these studies is that physical exam was compared to chest radiography as the reference standard, and posterior‐anterior chest radiographs are not sensitive for detection of pleural effusions until 200 mL of fluid has accumulated.[7] Further, chest percussion penetrates to a maximum depth of 6 cm, and its utility is limited in obese patients.[8] Characteristics of pleural fluid that can change management, such as loculations, cannot be detected by physical exam.
Chest Radiography
Chest radiography has traditionally been used to diagnose pleural effusions. Free‐flowing pleural fluid collects in the most dependent portions of the thorax, initially in the subpulmonic space followed by the costophrenic recesses. Pleural fluid is detectable in the costophrenic recesses on lateral upright chest radiograph after 50 mL has accumulated. On standard posterior‐anterior chest radiograph, blunting of the costophrenic recesses and obliteration of the hemidiaphragm are seen when >200 mL and >500 mL of pleural fluid have accumulated, respectively.[7] However, upright chest radiographs can miss a considerable number of effusions, including as many as 10% of parapneumonic effusions large enough to indicate need for drainage.[9] Supine anterior‐posterior chest radiographs can miss a significant proportion of large effusions seen on chest CT,[10] ultrasound,[11] and lateral decubitus radiographs.[12] Pleural effusions are frequently mistaken for parenchymal opacities on portable anterior‐posterior chest radiographs.[10]
Computerized Tomography
Chest CT serves as the reference standard in most modern diagnostic accuracy studies. Limitations of chest CT include difficulty distinguishing small effusions from pleural thickening, dependent atelectasis, or tumor; lower sensitivity for detecting pleural fluid septations compared to ultrasound[13]; exposure of patients to approximately 7 mSv of ionizing radiation (the equivalent radiation dose of 350 chest radiographs)[14]; high cost; and need to transport patients to radiology departments where CT scanners are located.
Pleural Ultrasonography
Ultrasound can rapidly differentiate conditions that demonstrate a nonspecific, radiopaque appearance of lower lung fields on chest radiographs, including pleural effusions, pneumonia, atelectasis, elevated hemidiaphragm, and lung or pleural masses. Advantages of point‐of‐care ultrasound include the ability of hospitalists to acquire and interpret images at the bedside and integrate findings into clinical decision making immediately. Multiple studies have demonstrated superior diagnostic accuracy of ultrasound compared to chest radiography for detection of pleural effusions. Pleural ultrasound can detect physiologic amounts of pleural fluid (5 mL),[15] but a minimal volume of 20 mL is more reliably detected,[16] and ultrasound is 100% sensitive for effusions >100 mL.[17] In a prospective study of critically ill patients with acute respiratory distress syndrome, the diagnostic accuracy of ultrasound for pleural effusions was superior (93%) compared to auscultation (61%) and anterior‐posterior chest radiograph (47%), using chest CT as the reference standard.[18] A meta‐analysis of 4 studies calculated a pooled sensitivity and specificity of ultrasound for detection of pleural effusions as 93% (95% CI: 89%‐96%) and 96% (95% CI: 95%‐98%), respectively.[18, 19, 20, 21, 22] Ultrasound has the additional benefit of characterizing underlying lung parenchyma, which is well described in the literature but beyond the scope of this review.[23]
Sensitivity and specificity of chest radiography and ultrasonography to detect a pleural effusion are displayed in Table 1.[9, 10, 11, 12, 18, 20, 21, 22, 24, 25, 26]
| Exam | Reference Standard | Sensitivity | Specificity | Study | |
|---|---|---|---|---|---|
| |||||
| Chest radiograph | Supine AP | Upright PA/lateral | 92% | Woodring[24] | |
| Lateral decubitus XR | 67% | 70% | Ruskin[12] | ||
| Ultrasound | 82% | 82% | Emamian[11] | ||
| Ultrasound or thoracentesis | 33% | Kocijancic[25] | |||
| CT | 39% | 85% | Lichtenstein[18] | ||
| CT | 66% | 89% | Kitazano[10] | ||
| CT | 65% | 81% | Xirouchaki[26] | ||
| CT | 78% | 76% | Brixey[9] | ||
| Lateral decubitus | Ultrasound or thoracentesis | 94% | 100% | Kocijancic[25] | |
| Upright PA | CT | 82% | 81% | Brixey[9] | |
| Lateral upright | CT | 86% | 88% | Brixey[9] | |
| Ultrasound | Cardiology | CT | 93% | 88% | Kataoka[20] |
| Point of care | CT or tube thoracostomy | 96% | 100% | Ma[21] | |
| CT | 92% | 93% | Lichtenstein[18] | ||
| CT | 94% | 99% | Rocco[22] | ||
| CT | 100% | 100% | Xirouchaki[26] | ||
PLEURAL ULTRASOUND EXAMINATION
A pleural ultrasound exam may be performed as part of a complete lung ultrasound exam, such as the BLUE (Bedside Lung Ultrasound in Emergency) protocol,[27] or a focused exam to evaluate a suspected or known pleural effusion seen on chest radiograph or CT scan.[27] Free‐flowing pleural effusions accumulate in the most dependent portions of the thorax, most commonly, the posterolateral costophrenic recesses in semirecumbent or seated patients, but anteriorly in mechanically ventilated patients in a prone position.
A low‐frequency (25 MHz) phased‐array transducer is generally preferred for imaging in between the ribs. High‐frequency linear transducers do not provide adequate penetration to visualize deep structures, but do provide superior visualization of the pleural line to assess pleural thickness, measure pleural depth, and evaluate for pneumothorax.
Pleural effusions are best evaluated starting at the level of the diaphragm. Place the transducer in a longitudinal plane on the posterior axillary line at the level of the diaphragm with the transducer orientation marker (notch) pointed cephalad (Figure 1). Five structures must be definitively identified to diagnose a pleural effusion: liver/spleen, diaphragm, pleural fluid, lung, and chest wall (Figure 2A). Large pleural effusions compress the adjacent lung causing atelectasis, which gives the lung a tissue‐like echogenicity similar to the liver (Figure 2B). Static air bronchograms are commonly seen in atelectatic lung bases with pleural effusions.[28]
Color flow Doppler and M‐mode ultrasound may be utilized as adjuncts to routine 2‐dimensional ultrasonography. Free‐flowing pleural effusions will demonstrate flow by color Doppler (Figure 3A). Using M‐mode ultrasound, the lung can been seen moving within a pleural effusion to and from the chest wall (sinusoid sign).[29] Absence of flow or movement is seen with dense pleural loculations, pleural thickening, and peripheral lung or pleural masses (Figure 3B).
CHARACTERIZATION OF PLEURAL EFFUSION
Pleural Fluid Volume
Quantification of pleural fluid volume has been proposed using formulas with sonographic measurements.[30, 31, 32] These formulas are most accurate for moderate‐sized effusions but have not been validated beyond individual study cohorts. The largest study (n = 150) found a strong correlation between calculated and actual volumes drained by thoracentesis (r2 = 0.79; P < 0.001) using the formula (Volume [mL] = 16 parietal to visceral pleura distance (mm) at the mid‐diaphragm).[31] Although an accurate quantitative pleural fluid volume assessment may be possible, these formulas are not commonly used in clinical practice. A qualitative assessment is adequate for most clinical decision making using categories of minimal, small, moderate, or large volume.
Simple Versus Complex Effusions
Based on its sonographic appearance, pleural effusions are categorized as simple or complex. Simple pleural effusions are anechoic and usually transudative. Complex pleural effusions are subcategorized as homogeneously or heterogeneously echogenic, with or without septations, and are more often exudative.[33]
Effusions with heterogeneous echogenicity with swirling echoes suggest high cellular content that is often associated with malignancy.[34] Fibrinous stranding, septations, and loculations also suggest an exudative effusion (Figure 4A), and are more readily identified and characterized on lung ultrasound than CT scan.[35]
Homogenously echogenic effusions are most often due to hemothorax or empyema.[36] The high cell count of a hemothorax creates a layering effect in costophrenic recesses (hematocrit sign). Empyemas develop from complex effusions that organize into collections of pus and usually have a homogeneously echogenic, speckled appearance (Figure 4B). Sonographic evidence of septations in the presence of empyema predicts the need for intrapleural fibrinolytic therapy, longer duration of drainage, and possible surgical intervention.[37]
Isolated dense loculations may be challenging to differentiate from peripheral lung or pleural lesions, such as abscess or tumor.
Pleural Thickness
Normal visceral and parietal pleura are apposed and 0.2 to 0.3 mm thick.[38] Pleural effusions with parietal pleural thickness >10 mm, pleural nodularity, and diaphragmatic thickness >7 mm predicted underlying malignancy with high specificity and positive predictive value in 1 study.[39] As many as 20% of anechoic lesions of the pleura are solid rather than fluid. Color flow Doppler ultrasound can differentiate small pleural effusions from solid pleural abnormalities with sensitivity and specificity of 89% and 100%, respectively.[40]
PLEURAL FLUID DRAINAGE
Since its first description in 1967, use of ultrasound guidance for thoracentesis has evolved to become the standard of care in many hospitals in the United States.[41] The British Thoracic Society guidelines recommend that all thoracenteses be performed with ultrasound guidance.[42] The American College of Graduate Medical Education now requires proficiency in the use of ultrasound for thoracentesis and pleural catheter insertion by pulmonary and critical care fellows.[43]
The impetus for these recommendations stems from increased procedural success and decreased complications associated with ultrasound‐guided drainage of pleural effusions. A study evaluating thoracentesis site selection based on physical exam and chest radiographs demonstrated inaccurate site selection in 15% of patients, and use of ultrasound for site selection prevented possible accidental organ puncture in 10% of all cases.[44] The success rate of thoracentesis for small pleural effusions has been shown to increase from 66% to 90% with ultrasound guidance.[42] Using ultrasound, the distance from the skin to parietal and visceral pleura can be measured to determine whether thoracentesis can be safely performed, and to guide selection of an adequate length needle (Figure 5). A minimum pleural effusion depth of 1.5 cm between the visceral and parietal pleura has been recommended to perform diagnostic thoracentesis.[28] Diagnostic thoracentesis of complex septated pleural effusions or empyemas may be performed with a straight needle, but therapeutic drainage often requires temporary insertion of a catheter. Traditionally, large‐bore chest tubes (>24 F) had been advocated to drain viscid pus, but recent evidence suggests that small‐bore catheters (1014 F) with instillation of thrombolytics may be as effective and performed with less discomfort.[45] Video‐assisted thoracoscopy to lyse septations and evacuate infected materials is indicated when chest tube drainage has failed.
The most common complication of pleural drainage is pneumothorax. A meta‐analysis demonstrated a reduction in post‐thoracentesis pneumothorax rates from 9% to 4% with use of ultrasound.[46] Transporting patients to radiology for ultrasound marking has not been shown to decrease pneumothorax rates compared to thoracentesis without ultrasound guidance, likely due to changes in patient position and prolonged delays between marking and drainage.[47] Postprocedure pneumothorax can be ruled out if lung sliding is visualized. A meta‐analysis demonstrated superior sensitivity and similar specificity of pleural ultrasonography versus chest radiography to detect pneumothorax (sensitivity 91% vs 50% and specificity 98% vs 99%, respectively).[48] Real‐time ultrasound guidance for thoracentesis, or use of ultrasound to track the needle tip, has not been well studied but may be performed by experienced proceduralists to drain small effusions.
FUTURE RESEARCH
Future research should focus on the clinical effectiveness of point‐of‐care pleural ultrasonography when integrated with other diagnostic tools, and application of new ultrasound technologies to evaluate pleural diseases. Routine use of point‐of‐care ultrasound as the primary imaging modality in a medical ICU demonstrated a highly statistically significant reduction in chest x‐rays (3.75 vs 0.82, P < 0.0001) and chest CT scans (0.10 vs 0.04, P = 0.0007).[49] Similar studies have yet to be performed with the use of ultrasound specifically in the management of pleural diseases. Thus, clinical effectiveness studies are needed to assess the impact of routine use of pleural ultrasound on the initiation of appropriate therapies, length of stay, and costs in the management of pleural disease.
Point‐of‐care pleural ultrasound findings need to be evaluated in the context of other clinical findings and diagnostic tests. Certain ultrasound findings have been associated with exudative pleural effusions, but whether exudative and transudative effusions can be differentiated noninvasively using ultrasound findings alone, or in combination with other clinical data, warrants investigation. Similar to severity of illness scores, models that incorporate clinical, laboratory, and ultrasound findings need to be developed to guide treatment decisions, such as type of drainage procedure, as well as prognostication.
Finally, new technologies may advance the utility of point‐of‐care pleural ultrasonography. Even though 3‐dimensional ultrasonography has been available for over 2 decades, comparative studies of conventional 2‐dimensional versus 3‐dimensional ultrasonography to characterize pleural effusions have yet to be performed. Furthermore, computer‐aided detection has been shown to facilitate interpretation of ultrasound images, but this technology has yet to be applied to pleural ultrasonography.
CONCLUSIONS
Point‐of‐care pleural ultrasound is a powerful bedside tool in the hospitalist's armamentarium that is superior to physical examination and chest radiographs in the detection and characterization of pleural effusions. Furthermore, ultrasound performs similarly when compared to CT scans but offers the advantages of decreased cost, avoidance of ionizing radiation, and availability at the bedside. Ultrasound guidance reduces complications and increases the success rate of pleural drainage procedures, leading to improved patient safety. As clinical effectiveness studies emerge revealing its true value, point‐of‐care pleural ultrasonography is likely to become the standard diagnostic tool to evaluate and manage patients with pleural effusions.
Disclosures: Dr. Restrepo is partially supported by award number K23HL096054 from the National Heart, Lung, and Blood Institute. The content is solely the responsibility of the authors and does not necessarily represent the official views of the National Heart, Lung, and Blood Institute or the National Institutes of Health. The authors report no conflicts of interest.
- , , , . Parapneumonic effusions. Am J Med. 1980;69(4):507–512.
- , , . The incidence and clinical correlates of parapneumonic effusions in pneumococcal pneumonia. Chest. 1978;74(2):170–173.
- , , , , . Pleural effusions in the medical ICU: prevalence, causes, and clinical implications. Chest. 1997;111(4):1018–1023.
- , , , . Point‐of‐care ultrasound in internal medicine: a national survey of educational leadership. J Grad Med Educ. 2013;5(3):498–502.
- . Pleural Diseases. Philadelphia, PA: Lippincott Williams 2007.
- , , . Does this patient have a pleural effusion? JAMA. 2009;301(3):309–317.
- , , , . Pleural fluid volume estimation: a chest radiograph prediction rule. Acad Radiol. 1996;3(2):103–109.
- , . Accuracy of the physical examination in evaluating pleural effusion. Cleve Clin J Med. 2008;75(4):297–303.
- , , , , . The efficacy of chest radiographs in detecting parapneumonic effusions. Respirology. 2011;16(6):1000–1004.
- , , , , . Differentiation of pleural effusions from parenchymal opacities: accuracy of bedside chest radiography. AJR Am J Roentgenol. 2010;194(2):407–412.
- , , , . Accuracy of the diagnosis of pleural effusion on supine chest X‐ray. Eur Radiol. 1997;7(1):57–60.
- , , , . Detection of pleural effusions on supine chest radiographs. AJR Am J Roentgenol. 1987;148(4):681–683.
- , , , , . Multiloculated pleural effusion detected by ultrasound only in a critically‐ill patient. Am J Case Rep. 2013;14:63–66.
- , , , et al. Exposure to low‐dose ionizing radiation from medical imaging procedures. N Engl J Med. 2009;361(9):849–857.
- , , . The diagnosis of pleural effusion by ultrasonic and radiologic techniques. Chest. 1976;70(1):33–37.
- , , , , , . Ultrasound in blunt abdominal and thoracic trauma. J Trauma. 1993;34(4):488–495.
- , , , et al. Application of color Doppler ultrasound in the study of small pleural effusion. Med Ultrason. 2010;12(1):12–16.
- , , , , , . Comparative diagnostic performances of auscultation, chest radiography, and lung ultrasonography in acute respiratory distress syndrome. Anesthesiology. 2004;100(1):9–15.
- , , , , . Diagnostic accuracy of sonography for pleural effusion: systematic review. Sao Paulo Med J. 2010;128(2):90–95.
- , . The role of thoracic ultrasonography for evaluation of patients with decompensated chronic heart failure. J Am Coll Cardiol. 2000;35(6):1638–1646.
- , . Trauma ultrasound examination versus chest radiography in the detection of hemothorax. Ann Emerg Med. 1997;29(3):312–315; discussion 315–316.
- , , , et al. Diagnostic accuracy of bedside ultrasonography in the ICU: feasibility of detecting pulmonary effusion and lung contusion in patients on respiratory support after severe blunt thoracic trauma. Acta Anaesthesiol Scand. 2008;52(6):776–784.
- . Lung ultrasound in the critically ill. Ann Intensive Care. 2014;4(1):1.
- . Recognition of pleural effusion on supine radiographs: how much fluid is required? AJR. Am J Roentgenol. 1984;142(1):59–64.
- , , . Chest sonography versus lateral decubitus radiography in the diagnosis of small pleural effusions. J Clin Ultrasound. 2003;31(2):69–74.
- , , , , . Impact of lung ultrasound on clinical decision making in critically ill patients. Intensive Care Med. 2014;40(1):57–65.
- . Lung ultrasound in acute respiratory failure an introduction to the BLUE‐protocol. Minerva Anestesiol. 2009;75(5):313–317.
- , , . Point‐of‐Care Ultrasound. 1st ed. Philadelphia, PA: Saunders; 2014.
- , , , et al. International evidence‐based recommendations for point‐of‐care lung ultrasound. Intensive Care Med. 2012;38(4):577–591.
- , , , et al. Ultrasound estimation of volume of pleural fluid in mechanically ventilated patients. Intensive Care Med. 2006;32(2):318–321.
- , , . Ultrasound estimation of volume of postoperative pleural effusion in cardiac surgery patients. Interact Cardiovasc Thorac Surg. 2010;10(2):204–207.
- , , , et al. Multiplane ultrasound approach to quantify pleural effusion at the bedside. Intensive Care Med. 2010;36(4):656–664.
- , , , , , . Value of sonography in determining the nature of pleural effusion: analysis of 320 cases. AJR Am J Roentgenol. 1992;159(1):29–33.
- , , , , , . Echogenic swirling pattern as a predictor of malignant pleural effusions in patients with malignancies. Chest. 2004;126(1):129–134.
- , . Imaging the pleura: sonography, CT, and MR imaging. AJR Am J Roentgenol. 1991;156(6):1145–1153.
- , , , et al. Pleural effusions in febrile medical ICU patients: chest ultrasound study. Chest. 2004;126(4):1274–1280.
- , , , , . Sonographic septation: a useful prognostic indicator of acute thoracic empyema. J Ultrasound Med. 2000;19(12):837–843.
- . Sonography of the pleura [in German]. Ultraschall Med. 2010;31(1):8–22, quiz 23–25.
- , , . Thoracic ultrasound in the diagnosis of malignant pleural effusion. Thorax. 2009;64(2):139–143.
- , , , . “Fluid color” sign: a useful indicator for discrimination between pleural thickening and pleural effusion. J Ultrasound Med. 1995;14(10):767–769.
- , , . Reflected ultrasound in the detection and localization of pleural effusion. JAMA. 1967;200(5):399–402.
- , , , . Pleural procedures and thoracic ultrasound: British Thoracic Society Pleural Disease Guideline 2010. Thorax. 2010;65(suppl 2):ii61–ii76.
- Accreditation Council for Graduate Medical Education. http://www.acgme.org/acgmeweb. Accessed January 15, 2015.
- , , . Accuracy of pleural puncture sites: a prospective comparison of clinical examination with ultrasound. Chest. 2003;123(2):436–441.
- , , , , , . A double blind randomized cross over trial comparing rate of decortication and efficacy of intrapleural instillation of alteplase vs placebo in patients with empyemas and complicated parapneumonic effusions. Respir Med. 2012;106(5):716–723.
- , , , . Pneumothorax following thoracentesis: a systematic review and meta‐analysis. Arch Intern Med. 2010;170(4):332–339.
- , , , , , . Factors affecting the development of pneumothorax associated with thoracentesis. AJR Am J Roentgenol. 1991;156(5):917–920.
- , , . Test characteristics of ultrasonography for the detection of pneumothorax: a systematic review and meta‐analysis. Chest. 2012;141(3):703–708.
- , , , et al. The effect of point‐of‐care ultrasonography on imaging studies in the medical ICU: a comparative study. Chest. 2014;146(6):1574–1577.

PoCUS for Hospitalists
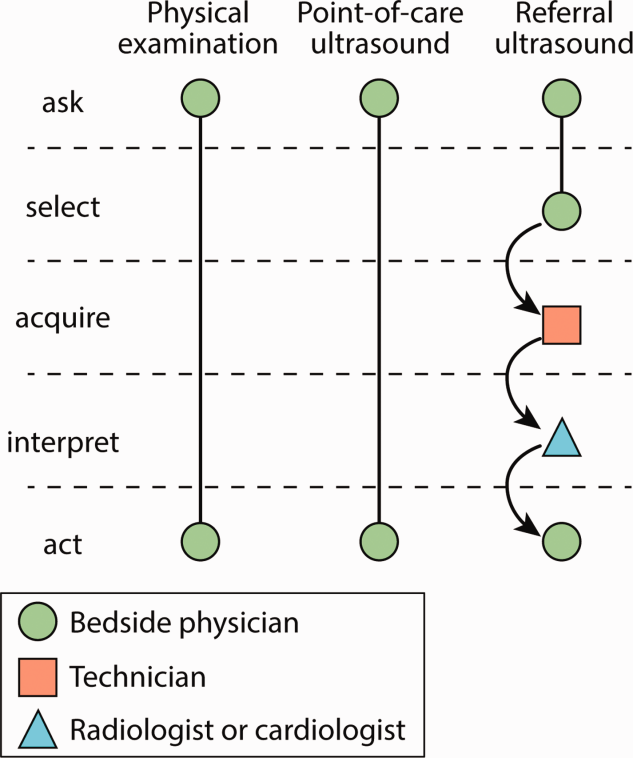
Similar to the physical exam, diagnostic point‐of‐care ultrasound exams are performed at the bedside in real time by hospitalists who are seeking a diagnosis. In contrast, referral ultrasound exams involve multiple providers and several steps. Typically, an ultrasound technologist acquires images, a radiologist or cardiologist interprets the images, a report is prepared, and results are sent to the referring hospitalist (Figure 1). Another important difference is that although referral ultrasound exams are usually comprehensive evaluations of entire organs or anatomic spaces, often without specific diagnoses in mind, point‐of‐care ultrasound exams are aimed at making specific diagnoses for well‐defined clinical scenarios.[1]
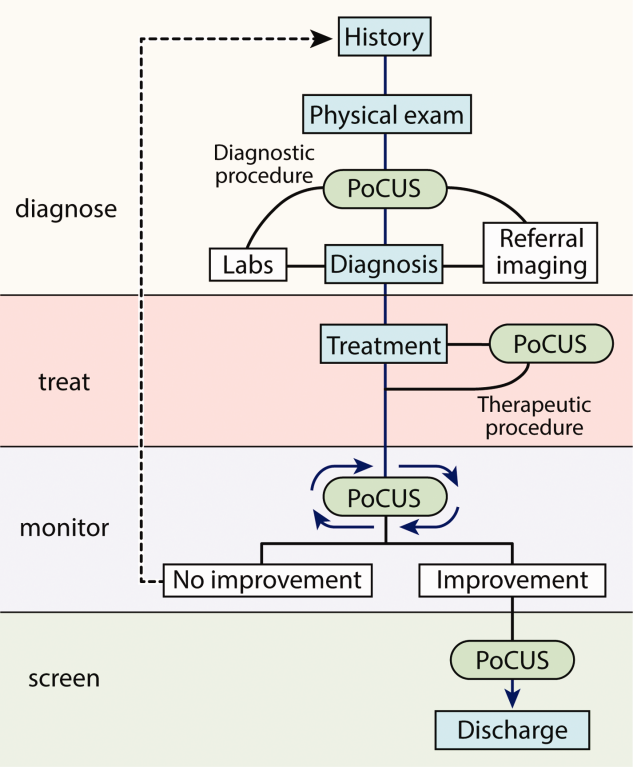
The American Medical Association has reassured providers that ultrasound imaging is within the scope of practice of appropriately trained physicians.[2] A growing body of literature demonstrates that point‐of‐care ultrasound is increasingly used by hospitalists for more than just bedside procedures. Incited by ongoing miniaturization of ultrasound devices, hospitalists are beginning to use point‐of‐care ultrasound for diagnosis, treatment, monitoring, and screening of patients (Figure 2). Our aim was to review the current literature for point‐of‐care ultrasound applications most relevant to hospitalists and highlight gaps in the current literature.
ABDOMEN
Ascites
Ultrasound is the gold standard for diagnosing ascites and can detect as little as 100 mL of ascitic fluid.[3] When ascites is not immediately evident, hospitalists can apply the principles of the FAST (Focused Assessment with Sonography in Trauma) examination to detect small amounts of ascites by evaluating the most dependent areas of the abdominopelvic cavity, the hepatorenal, left subdiaphragmatic, and rectovesicular or rectouterine spaces.[1] When ascites is identified and paracentesis is indicated, ultrasound guidance for site selection reduces bleeding complications.[4]
Aortic Aneurysm
Novice providers with limited ultrasound training can accurately screen patients for abdominal aortic aneurysm (AAA). Multiple studies from emergency departments have shown that point‐of‐care ultrasound can be used to accurately detect AAA, and a recent meta‐analysis of 7 high‐quality studies demonstrated a sensitivity of 99% (95% confidence interval [CI]: 96%‐100%) and a specificity of 98% (95% CI: 97%‐99%).[5] Hospitalists could use ultrasound to rapidly detect AAA in patients with acute abdominal pain, monitor the size in patients with known AAA, and possibly screen high‐risk patients.[6]
Hydronephrosis
Once detected, relief of postrenal obstruction usually results in rapid reversal of acute kidney injury. Although diagnostic accuracy studies of detection of hydronephrosis have yet to be conducted with hospitalists, studies of other frontline providers with limited training in renal ultrasonography have revealed sensitivities of 72% to 87% and specificities of 73% to 82% in patients with renal colic.[7, 8]
HEART
Studies of point‐of‐care cardiac ultrasound have focused most on detection of left ventricular systolic dysfunction. Yet studies among hospitalists have yielded high diagnostic accuracy for an array of abnormalities.[9, 10, 11] Lucas et al. evaluated the diagnostic accuracy of 9 hospitalists for 5 cardiac abnormalities including left ventricular systolic dysfunction after a 27‐hour, structured training program. Positive and negative likelihood ratios for point‐of‐care cardiac ultrasound increased and decreased, respectively, the prior odds by 5‐fold or more for left ventricular systolic dysfunction, severe mitral regurgitation, and moderate or large pericardial effusion. Likelihood ratios changed the prior odds by 2‐fold or more for moderate or severe left atrial enlargement, and moderate or severe left ventricle hypertrophy.[9] Martin et al. found that after a brief training program, hospitalists' image acquisition and interpretation skills were respectively below echocardiography technicians' and senior cardiology fellows' skills.[10] Yet in a follow‐up study, they found that bedside diagnosis of left ventricle systolic dysfunction, cardiomegaly, and pericardial effusion improved when point‐of‐care cardiac ultrasound supplemented hospitalists' physical examination.[11]
In 1 of the few experimental studies of the impact of point‐of‐care ultrasound on clinical care, Lucas et al. randomized general medicine patients who were referred by hospitalists for standard echocardiography to care guided by point‐of‐care cardiac ultrasound versus care guided by the referral echocardiography (usual care). Point‐of‐care cardiac ultrasound changed hospitalists' management for 37% of patients, and a post hoc subgroup analysis of heart failure patients demonstrated a statistically significant 15% reduction in length of stay.[12]
LUNGS
Pneumonia
Normally aerated lung parenchyma generates A‐lines, horizontal hyperechoic lines that are artifacts due to repeated reflections, or reverberations, between the highly reflective pleura and transducer.[1] These normal A‐lines disappear with pneumonia due to accumulation of interstitial fluid and cellular exudate in consolidated alveoli. A meta‐analysis of 9 studies of lung ultrasound to diagnose pneumonia reported pooled sensitivity of 97% (95% CI: 93%‐99%) with specificity of 94% (95% CI: 85%‐98%).[13]
Pleural Effusion
Half of patients with community‐acquired pneumonia have a pleural effusion, yet chest x‐ray often cannot differentiate pneumonia from pleural effusion, especially along the lower lung fields. Ultrasound can accurately differentiate consolidated lung from pleural effusion and is more sensitive than a chest x‐ray for detecting small pleural fluid volumes (100% vs 71%).[14] Serial monitoring of size and character of a pleural effusion can distinguish free flowing from loculated pleural effusions. Drainage of pleural effusions with ultrasound guidance is associated with a lower rate of postprocedure pneumothorax and lower total hospital costs.[15]
Pneumothorax
Lung ultrasound can accurately and rapidly detect pneumothorax after lung and pleural procedures, including thoracentesis, bronchoscopy, and transthoracic biopsy.[2] Multiple studies have demonstrated that lung ultrasound is superior to chest x‐ray. Three recent meta‐analyses reported near‐perfect specificity for both ultrasound and x‐ray. But the sensitivity of ultrasound (79%95%) was far better than that of x‐ray (40%52%) to detect pneumothorax.[16, 17]
The hallmark ultrasound findings of pneumothorax include absence of lung sliding, absence of B‐lines, and a stratified pattern using M‐mode ultrasonography (stratosphere sign). Both lung sliding and B‐lines rule out pneumothorax with a negative predictive value of 100%.[18] Absence of either finding, however, does not rule in pneumothorax with similar strength. Absent lung sliding is seen in other conditions, such as pleurodesis, mainstem intubation, and massive atelectasis; absent B‐lines are most suggestive of the normal lung (see below).[1]
Pulmonary Edema
The classic ultrasound finding of acute pulmonary edema is bilateral anterior B‐lines. In contrast to horizontal A‐lines, B‐lines are vertical, laser‐like reverberations that originate from the pleura and are due to interlobular septal edema. A linear correlation has been shown between the quantity of B‐lines and radiographic lung water score (r=0.78; P<0.01).[19] Yet B‐lines are not specific for high pulmonary capillary wedge pressure because interstitial edema can be caused by a variety of etiologies. Nonetheless, visualization of multiple B‐lines in a single intercostal space corresponds with a sensitivity of 86% to 100% and specificity of 92% to 98% for either high‐ or low‐pressure pulmonary edema.[20, 21]
VEINS
Central Venous Volume
The physiologic relationship between central venous volume and central venous pressure (CVP) is complex. Initially, there is upward stepwise progression to the stressed volume threshold, and then the relationship becomes curvilinear with the steepness of the slope dependent on the stiffness or tone of the central veins.[22]
The complexity of this relationship may explain the variable diagnostic accuracy of inferior vena cava (IVC) measurements to determine CVP, with measurements best reflecting CVP at extreme values. An IVC maximal diameter >2.0 cm predicted CVP >10 mm Hg (sensitivity 82% and specificity 84%) and pulmonary capillary wedge pressure >16 mm Hg (sensitivity 75% and specificity 83%) in 1 study.[23] Adding measurement of the collapsibility of the IVC with respiration may improve diagnostic accuracy, particularly with intermediate ranges of CVP and is recommended by current echocardiography guidelines.[24]
Nonetheless, in patients with acute dyspnea, a dilated, noncollapsing IVC may differentiate acute decompensated heart failure (ADHF) from primary pulmonary disease.[25, 26] IVC measurements may guide fluid removal in hemodialysis and heart failure patients.[27, 28] In 2 studies of patients hospitalized with ADHF, lack of improvement of IVC collapsibility index at the time of discharge was associated with higher rates of readmission.[29, 30] A follow‐up study comparing diuresis guided by IVC collapsibility to usual care in patients hospitalized with ADHF showed a reduction in hospital readmission rates (4% vs 30%, P=0.03) without an increase in hospital length of stay or renal dysfunction.[31] Patients with small, collapsed IVCs can be administered intravenous fluids safely, particularly in the setting of hypovolemic or septic shock, and the response to this fluid resuscitation can be assessed by serially measuring the change in IVC diameter.[32]
Thromboembolism
Multiple studies have shown that point‐of‐care ultrasound can accurately diagnose deep venous thrombosis (DVT) with a pooled sensitivity of 96% and specificity of 96% based on a recent meta‐analysis of 19 studies.[33] In symptomatic patients with a lung ultrasound pattern showing A‐lines, positive and negative predictive values of DVT in predicting pulmonary embolism (PE) were 94% and 98%, respectively.[34] A diagnostic accuracy study to diagnose PE using lung ultrasound to detect pleural‐ or subpleural‐based lesions yielded a sensitivity of 90%, specificity of 60%, positive predictive value of 80%, and negative predictive value of 78%.[35] In a study of 96 patients with suspected PE who underwent computed tomography pulmonary angiogram (CTPA), a focused ultrasound exam of the heart, lungs, and lower extremity veins was able to detect DVT (2.1%) or an alternative diagnosis (56.2%) in the majority of these patients, potentially obviating the need for CTPA in 58.4% of patients.[36] In addition, point‐of‐care cardiac ultrasound may reveal direct findings, such as free‐floating thrombus in the pulmonary artery, or indirect findings, such as right ventricular dilation and systolic dysfunction, septal bowing, McConnell's sign, or IVC dilation.[1] Cardiac abnormalities are more specific (88%94%) than sensitive (31%77%), and absence of cardiac abnormalities rules out massive PE, justifying withholding thrombolytic medications in most patients.[37]
RESEARCH GAPS
Most point‐of‐care ultrasound research has focused on diagnostic accuracy. Yet the training required for hospitalists to attain diagnostic competency remains controversial.[38] Evidence from cardiac point‐of‐care ultrasound training suggests that the number of supervised studies is a key determinate in competency.[39] For example, training programs based on 30 supervised studies[11, 15, 40] outperformed those based on only 5 supervised studies.[11] Nevertheless, the real value of point‐of‐care ultrasound will be in leading hospitalists to more appropriate treatment decisions that result in better outcomes for patients.[41] We believe that there are 4 important clinical areas where future research ought to focus.
First, can point‐of‐care ultrasound guide hospitalists' decision making during cardiac arrest? Current advanced cardiac life support (ACLS) guidelines recommend ruling out potentially reversible causes of cardiac arrest, including tension pneumothorax, cardiac tamponade, and massive pulmonary embolism, but traditional physical examination techniques are impractical to perform during cardiopulmonary resuscitation. Point‐of‐care ultrasound may be able to detect these conditions and facilitate emergent interventions, such as pericardiocentesis or needle decompression.[1] Identifying the absence of cardiac contractility is importantly associated with a significantly low likelihood of return of spontaneous circulation.[1, 42] Whether or not point‐of‐care ultrasound should be added to either crash carts or ACLS guideline recommendations will depend on further evidence demonstrating its value.
Second, should hospitalists seize the opportunity to screen inpatients for abdominal aortic aneurysm and asymptomatic left ventricular systolic dysfunction? Although such screening has been successfully carried out,[6, 43] widespread screening applications have been slow to develop. Ultrasound waves, themselves, impart no harm, but further research is needed to weigh the benefits of early detection against the harms of false‐positive findings.
Third, how can hospitalists best utilize bedside ultrasound to perform serial examinations of patients? Unlike referral ultrasound examinations that take single snapshots of patients at 1 point in time, point‐of‐care ultrasound allows hospitalists to iteratively monitor patients. Promising and needed applications include serial examinations of the IVC as a surrogate for central venous volume[44] during both fluid resuscitation and removal, left ventricular contraction in response to inotrope initiation, and resolution or worsening of a pneumothorax or pneumonia.
Fourth, how should hospitalists integrate point‐of‐care ultrasound into their workflow for common conditions? Recognized protocols most relevant to hospital medicine include RUSH (Rapid Ultrasound for Shock and Hypotension),[45] FALLS (Fluid Administration Limited by Lung Sonography),[46] BLUE (Bedside Lung Ultrasound in Emergency),[34] CLUE (Cardiovascular Limited Ultrasound Exam),[47] and intensive care unit‐sound.[48] Several small single‐institution studies have demonstrated that bedside ultrasound may benefit clinical decision making by differentiating cardiac versus pulmonary causes of acute dyspnea.[49, 50] However, large, validating, multicenter trials are needed. In addition, outcomes that better reflect both the patients' and payers' perspectives ought to be considered. For example, how are doctor‐patient relationships affected? Is shared decision making and patient (or physician) satisfaction improved? How are resources utilized and healthcare costs affected?
CONCLUSIONS
Hospitalists are striving to provide high‐quality, cost‐effective healthcare, and point‐of‐care ultrasound may contribute to achieving these goals by expediting diagnoses and decreasing costly ancillary testing that utilizes ionizing radiation. Hospitalists are uniquely poised to advance the field by studying how point‐of‐care ultrasound is best incorporated into patient care algorithms.
Disclosure: Nothing to report.
1. Soni NJ, Arntfield R, Kory P. Point-of-Care Ultrasound. 1st ed. Philadelphia,
PA: Saunders; 2014.
2. American Medical Association. House of Delegates. H-230.960 Privileging
for ultrasound imaging. Policy finder website. Available at:
https://ssl3.ama-assn.org/apps/ecomm/PolicyFinderForm.pl?site5www.
ama-assn.org&uri5%2fresources%2fhtml%2fPolicyFinder%2fpolicy
files%2fHnE%2fH-230.960.HTM. Accessed October 2, 2014.
3. Goldberg BB, Goodman GA, Clearfield HR. Evaluation of ascites by
ultrasound. Radiology. 1970;96(1):15–22.
4. Mercaldi CJ, Lanes SF. Ultrasound guidance decreases complications
and improves the cost of care among patients undergoing thoracentesis
and paracentesis. Chest. 2013;143(2):532–538.
5. Rubano E, Mehta N, Caputo W, Paladino L, Sinert R. Systematic
review: emergency department bedside ultrasonography for diagnosing
suspected abdominal aortic aneurysm. Acad Emerg Med. 2013;
20(2):128–138.
6. Dijos M, Pucheux Y, Lafitte M, et al. Fast track echo of abdominal
aortic aneurysm using a real pocket-ultrasound device at bedside.
Echocardiography. 2012;29(3):285–290.
7. Rosen CL, Brown DF, Sagarin MJ, Chang Y, McCabe CJ, Wolfe RE.
Ultrasonography by emergency physicians in patients with suspected
ureteral colic. J Emerg Med. 1998;16(6):865–870.
8. Gaspari RJ, Horst K. Emergency ultrasound and urinalysis in the evaluation
of flank pain. Acad Emerg Med. 2005;12(12):1180–1184.
9. Lucas BP, Candotti C, Margeta B, et al. Diagnostic accuracy of
hospitalist-performed hand-carried ultrasound echocardiography after
a brief training program. J Hosp Med. 2009;4(6):340–349.
10. Martin LD, Howell EE, Ziegelstein RC, Martire C, Shapiro EP,
Hellmann DB. Hospitalist performance of cardiac hand-carried ultrasound
after focused training. Am J Med. 2007;120(11):1000–1004.
11. Martin LD, Howell EE, Ziegelstein RC, et al. Hand-carried ultrasound
performed by hospitalists: does it improve the cardiac physical
examination? Am J Med. 2009;122(1):35–41.
PoCUS for Hospitalists | Soni and Lucas
An Official Publication of the Society of Hospital Medicine Journal of Hospital Medicine Vol 10 | No 2 | February 2015 123
12. Lucas BP, Candotti C, Margeta B, et al. Hand-carried echocardiography
by hospitalists: a randomized trial. Am J Med. 2011;124(8):766–
774.
13. Hu QJ, Shen YC, Jia LQ, et al. Diagnostic performance of lung ultrasound
in the diagnosis of pneumonia: a bivariate meta-analysis. Int J
Clin Exp Med. 2014;7(1):115–121.
14. Reissig A, Gramegna A, Aliberti S. The role of lung ultrasound in the
diagnosis and follow-up of community-acquired pneumonia. Eur J
Intern Med. 2012;23(5):391–397.
15. Patel PA, Ernst FR, Gunnarsson CL. Ultrasonography guidance
reduces complications and costs associated with thoracentesis procedures.
J Clin Ultrasound. 2012;40(3):135–141.
16. Ding W, Shen Y, Yang J, He X, Zhang M. Diagnosis of pneumothorax
by radiography and ultrasonography: a meta-analysis. Chest.
2011;140(4):859–866.
17. Alrajab S, Youssef AM, Akkus NI, Caldito G. Pleural ultrasonography
versus chest radiography for the diagnosis of pneumothorax: review
of the literature and meta-analysis. Crit Care. 2013;17(5):R208.
18. Lichtenstein D, Meziere G, Biderman P, Gepner A. The comet-tail
artifact: an ultrasound sign ruling out pneumothorax. Intensive Care
Med. 1999;25(4):383–388.
19. Picano E, Frassi F, Agricola E, Gligorova S, Gargani L, Mottola G.
Ultrasound lung comets: a clinically useful sign of extravascular lung
water. J Am Soc Echocardiogr. 2006;19(3):356–363.
20. Lichtenstein D, Meziere G. A lung ultrasound sign allowing bedside
distinction between pulmonary edema and COPD: the comet-tail artifact.
Intensive Care Med. 1998;24(12):1331–1334.
21. Volpicelli G, Mussa A, Garofalo G, et al. Bedside lung ultrasound in
the assessment of alveolar-interstitial syndrome. Am J Emerg Med.
2006;24(6):689–696.
22. Rothe CF. Reflex control of veins and vascular capacitance. Physiol
Rev. 1983;63(4):1281–1342.
23. Blair JE, Brennan JM, Goonewardena SN, Shah D, Vasaiwala S,
Spencer KT. Usefulness of hand-carried ultrasound to predict elevated
left ventricular filling pressure. Am J Cardiol. 2009;103(2):246–247.
24. Beigel R, Cercek B, Luo H, Siegel RJ. Noninvasive evaluation of right
atrial pressure. J Am Soc Echocardiogr. 2013;26(9):1033–1042.
25. Miller JB, Sen A, Strote SR, et al. Inferior vena cava assessment in the
bedside diagnosis of acute heart failure. Am J Emerg Med. 2012;
30(5):778–783.
26. Blehar DJ, Dickman E, Gaspari R. Identification of congestive heart
failure via respiratory variation of inferior vena cava diameter. Am J
Emerg Med. 2009;27(1):71–75.
27. Goonewardena SN, Spencer KT. Handcarried echocardiography to
assess hemodynamics in acute decompensated heart failure. Curr
Heart Fail Rep. 2010;7(4):219–227.
28. Guiotto G, Masarone M, Paladino F, et al. Inferior vena cava collapsibility
to guide fluid removal in slow continuous ultrafiltration: a pilot
study. Intensive Care Med. 2010;36(4):692–696.
29. Carbone F, Bovio M, Rosa GM, et al. Inferior vena cava parameters
predict readmission in ischemic heart failure. Eur J Clin Invest. 2014;
44(4):341–349.
30. Goonewardena SN, Gemignani A, Ronan A, et al. Comparison of
hand-carried ultrasound assessment of the inferior vena cava and Nterminal
pro-brain natriuretic peptide for predicting readmission after
hospitalization for acute decompensated heart failure. JACC Cardiovasc
Imaging. 2008;1(5):595–601.
31. Laffin L, Patel AR, Saha N, et al. Inferior vena cava measurement by
focused cardiac ultrasound in acute decompensated heart failure prevents
hospital readmissions. J Am Coll Cardiol. 2014;63(12 suppl):
A542.
32. Zhang Z, Xu X, Ye S, Xu L. Ultrasonographic measurement of the
respiratory variation in the inferior vena cava diameter is predictive of
fluid responsiveness in critically ill patients: systematic review and
meta-analysis. Ultrasound Med Biol. 2014;40(5):845–853.
33. Pomero F, Dentali F, Borretta V, et al. Accuracy of emergency
physician-performed ultrasonography in the diagnosis of deep-vein
thrombosis: a systematic review and meta-analysis. Thromb Haemost.
2013;109(1):137–145.
34. Lichtenstein DA, Meziere GA. Relevance of lung ultrasound in the
diagnosis of acute respiratory failure: the BLUE protocol. Chest.
2008;134(1):117–125.
35. Comert SS, Caglayan B, Akturk U, et al. The role of thoracic ultrasonography
in the diagnosis of pulmonary embolism. Ann Thorac Med.
2013;8(2):99–104.
36. Koenig S, Chandra S, Alaverdian A, Dibello C, Mayo PH,
Narasimhan M. Ultrasound assessment of pulmonary embolism in
patients receiving computerized tomography pulmonary angiography.
Chest. 2014;145(4):818–823.
37. Mookadam F, Jiamsripong P, Goel R, Warsame TA, Emani UR,
Khandheria BK. Critical appraisal on the utility of echocardiography
in the management of acute pulmonary embolism. Cardiol Rev. 2010;
18(1):29–37.
38. Gesensway D. Making the case for portable ultrasound. Todays Hospitalist.
2012;10:32–36.
39. Spencer KT, Kimura BJ, Korcarz CE, Pellikka PA, Rahko PS, Siegel
RJ. Focused cardiac ultrasound: recommendations from the American
Society of Echocardiography. J Am Soc Echocardiogr. 2013;26(6):
567–581.
40. Hellmann DB, Whiting-O’Keefe Q, Shapiro EP, Martin LD, Martire
C, Ziegelstein RC. The rate at which residents learn to use hand-held
echocardiography at the bedside. Am J Med. 2005;118(9):1010–
1018.
41. Redberg RF, Walsch J. Pay now, benefits may follow—the case of cardiac
computed tomographic angiography. N Engl J Med. 2008;359:
2309–2311.
42. Blyth L, Atkinson P, Gadd K, Lang E. Bedside focused echocardiography
as predictor of survival in cardiac arrest patients: a systematic
review. Acad Emerg Med. 2012;19(10):1119–1126.
43. Martin LD, Mathews S, Ziegelstein RC, et al. Prevalence of asymptomatic
left ventricular systolic dysfunction in at-risk medical inpatients.
Am J Med. 2013;126(1):68–73.
44. Low D, Vlasschaert M, Novak K, Chee A, Ma IWY. An argument for
using additional bedside tools, such as bedside ultrasound, for volume
status assessment in hospitalized medical patients: a needs assessment
survey. J Hosp Med. 2014;9:727–730.
45. Perera P, Mailhot T, Riley D, Mandavia D. The RUSH exam: Rapid
Ultrasound in SHock in the evaluation of the critically lll. Emerg Med
Clin North Am. 2010;28(1):29–56, vii.
46. Lichtenstein D. FALLS-protocol: lung ultrasound in hemodynamic
assessment of shock. Heart Lung Vessel. 2013;5(3):142–147.
47. Kimura BJ, Yogo N, O’Connell CW, Phan JN, Showalter BK,
Wolfson T. Cardiopulmonary limited ultrasound examination for
“quick-look” bedside application. Am J Cardiol. 2011;108(4):586–
590.
48. Manno E, Navarra M, Faccio L, et al. Deep impact of ultrasound in
the intensive care unit: the “ICU-sound” protocol. Anesthesiology.
2012;117(4):801–809.
49. Cibinel GA, Casoli G, Elia F, et al. Diagnostic accuracy and reproducibility
of pleural and lung ultrasound in discriminating cardiogenic
causes of acute dyspnea in the emergency department. Intern Emerg
Med. 2012;7(1):65–70.
50. Anderson KL, Jenq KY, Fields JM, Panebianco NL, Dean AJ. Diagnosing
heart failure among acutely dyspneic patients with cardiac,
inferior vena cava, and lung ultrasonography. Am J Emerg Med.
2013;31(8):1208–1214.
Similar to the physical exam, diagnostic point‐of‐care ultrasound exams are performed at the bedside in real time by hospitalists who are seeking a diagnosis. In contrast, referral ultrasound exams involve multiple providers and several steps. Typically, an ultrasound technologist acquires images, a radiologist or cardiologist interprets the images, a report is prepared, and results are sent to the referring hospitalist (Figure 1). Another important difference is that although referral ultrasound exams are usually comprehensive evaluations of entire organs or anatomic spaces, often without specific diagnoses in mind, point‐of‐care ultrasound exams are aimed at making specific diagnoses for well‐defined clinical scenarios.[1]
The American Medical Association has reassured providers that ultrasound imaging is within the scope of practice of appropriately trained physicians.[2] A growing body of literature demonstrates that point‐of‐care ultrasound is increasingly used by hospitalists for more than just bedside procedures. Incited by ongoing miniaturization of ultrasound devices, hospitalists are beginning to use point‐of‐care ultrasound for diagnosis, treatment, monitoring, and screening of patients (Figure 2). Our aim was to review the current literature for point‐of‐care ultrasound applications most relevant to hospitalists and highlight gaps in the current literature.
ABDOMEN
Ascites
Ultrasound is the gold standard for diagnosing ascites and can detect as little as 100 mL of ascitic fluid.[3] When ascites is not immediately evident, hospitalists can apply the principles of the FAST (Focused Assessment with Sonography in Trauma) examination to detect small amounts of ascites by evaluating the most dependent areas of the abdominopelvic cavity, the hepatorenal, left subdiaphragmatic, and rectovesicular or rectouterine spaces.[1] When ascites is identified and paracentesis is indicated, ultrasound guidance for site selection reduces bleeding complications.[4]
Aortic Aneurysm
Novice providers with limited ultrasound training can accurately screen patients for abdominal aortic aneurysm (AAA). Multiple studies from emergency departments have shown that point‐of‐care ultrasound can be used to accurately detect AAA, and a recent meta‐analysis of 7 high‐quality studies demonstrated a sensitivity of 99% (95% confidence interval [CI]: 96%‐100%) and a specificity of 98% (95% CI: 97%‐99%).[5] Hospitalists could use ultrasound to rapidly detect AAA in patients with acute abdominal pain, monitor the size in patients with known AAA, and possibly screen high‐risk patients.[6]
Hydronephrosis
Once detected, relief of postrenal obstruction usually results in rapid reversal of acute kidney injury. Although diagnostic accuracy studies of detection of hydronephrosis have yet to be conducted with hospitalists, studies of other frontline providers with limited training in renal ultrasonography have revealed sensitivities of 72% to 87% and specificities of 73% to 82% in patients with renal colic.[7, 8]
HEART
Studies of point‐of‐care cardiac ultrasound have focused most on detection of left ventricular systolic dysfunction. Yet studies among hospitalists have yielded high diagnostic accuracy for an array of abnormalities.[9, 10, 11] Lucas et al. evaluated the diagnostic accuracy of 9 hospitalists for 5 cardiac abnormalities including left ventricular systolic dysfunction after a 27‐hour, structured training program. Positive and negative likelihood ratios for point‐of‐care cardiac ultrasound increased and decreased, respectively, the prior odds by 5‐fold or more for left ventricular systolic dysfunction, severe mitral regurgitation, and moderate or large pericardial effusion. Likelihood ratios changed the prior odds by 2‐fold or more for moderate or severe left atrial enlargement, and moderate or severe left ventricle hypertrophy.[9] Martin et al. found that after a brief training program, hospitalists' image acquisition and interpretation skills were respectively below echocardiography technicians' and senior cardiology fellows' skills.[10] Yet in a follow‐up study, they found that bedside diagnosis of left ventricle systolic dysfunction, cardiomegaly, and pericardial effusion improved when point‐of‐care cardiac ultrasound supplemented hospitalists' physical examination.[11]
In 1 of the few experimental studies of the impact of point‐of‐care ultrasound on clinical care, Lucas et al. randomized general medicine patients who were referred by hospitalists for standard echocardiography to care guided by point‐of‐care cardiac ultrasound versus care guided by the referral echocardiography (usual care). Point‐of‐care cardiac ultrasound changed hospitalists' management for 37% of patients, and a post hoc subgroup analysis of heart failure patients demonstrated a statistically significant 15% reduction in length of stay.[12]
LUNGS
Pneumonia
Normally aerated lung parenchyma generates A‐lines, horizontal hyperechoic lines that are artifacts due to repeated reflections, or reverberations, between the highly reflective pleura and transducer.[1] These normal A‐lines disappear with pneumonia due to accumulation of interstitial fluid and cellular exudate in consolidated alveoli. A meta‐analysis of 9 studies of lung ultrasound to diagnose pneumonia reported pooled sensitivity of 97% (95% CI: 93%‐99%) with specificity of 94% (95% CI: 85%‐98%).[13]
Pleural Effusion
Half of patients with community‐acquired pneumonia have a pleural effusion, yet chest x‐ray often cannot differentiate pneumonia from pleural effusion, especially along the lower lung fields. Ultrasound can accurately differentiate consolidated lung from pleural effusion and is more sensitive than a chest x‐ray for detecting small pleural fluid volumes (100% vs 71%).[14] Serial monitoring of size and character of a pleural effusion can distinguish free flowing from loculated pleural effusions. Drainage of pleural effusions with ultrasound guidance is associated with a lower rate of postprocedure pneumothorax and lower total hospital costs.[15]
Pneumothorax
Lung ultrasound can accurately and rapidly detect pneumothorax after lung and pleural procedures, including thoracentesis, bronchoscopy, and transthoracic biopsy.[2] Multiple studies have demonstrated that lung ultrasound is superior to chest x‐ray. Three recent meta‐analyses reported near‐perfect specificity for both ultrasound and x‐ray. But the sensitivity of ultrasound (79%95%) was far better than that of x‐ray (40%52%) to detect pneumothorax.[16, 17]
The hallmark ultrasound findings of pneumothorax include absence of lung sliding, absence of B‐lines, and a stratified pattern using M‐mode ultrasonography (stratosphere sign). Both lung sliding and B‐lines rule out pneumothorax with a negative predictive value of 100%.[18] Absence of either finding, however, does not rule in pneumothorax with similar strength. Absent lung sliding is seen in other conditions, such as pleurodesis, mainstem intubation, and massive atelectasis; absent B‐lines are most suggestive of the normal lung (see below).[1]
Pulmonary Edema
The classic ultrasound finding of acute pulmonary edema is bilateral anterior B‐lines. In contrast to horizontal A‐lines, B‐lines are vertical, laser‐like reverberations that originate from the pleura and are due to interlobular septal edema. A linear correlation has been shown between the quantity of B‐lines and radiographic lung water score (r=0.78; P<0.01).[19] Yet B‐lines are not specific for high pulmonary capillary wedge pressure because interstitial edema can be caused by a variety of etiologies. Nonetheless, visualization of multiple B‐lines in a single intercostal space corresponds with a sensitivity of 86% to 100% and specificity of 92% to 98% for either high‐ or low‐pressure pulmonary edema.[20, 21]
VEINS
Central Venous Volume
The physiologic relationship between central venous volume and central venous pressure (CVP) is complex. Initially, there is upward stepwise progression to the stressed volume threshold, and then the relationship becomes curvilinear with the steepness of the slope dependent on the stiffness or tone of the central veins.[22]
The complexity of this relationship may explain the variable diagnostic accuracy of inferior vena cava (IVC) measurements to determine CVP, with measurements best reflecting CVP at extreme values. An IVC maximal diameter >2.0 cm predicted CVP >10 mm Hg (sensitivity 82% and specificity 84%) and pulmonary capillary wedge pressure >16 mm Hg (sensitivity 75% and specificity 83%) in 1 study.[23] Adding measurement of the collapsibility of the IVC with respiration may improve diagnostic accuracy, particularly with intermediate ranges of CVP and is recommended by current echocardiography guidelines.[24]
Nonetheless, in patients with acute dyspnea, a dilated, noncollapsing IVC may differentiate acute decompensated heart failure (ADHF) from primary pulmonary disease.[25, 26] IVC measurements may guide fluid removal in hemodialysis and heart failure patients.[27, 28] In 2 studies of patients hospitalized with ADHF, lack of improvement of IVC collapsibility index at the time of discharge was associated with higher rates of readmission.[29, 30] A follow‐up study comparing diuresis guided by IVC collapsibility to usual care in patients hospitalized with ADHF showed a reduction in hospital readmission rates (4% vs 30%, P=0.03) without an increase in hospital length of stay or renal dysfunction.[31] Patients with small, collapsed IVCs can be administered intravenous fluids safely, particularly in the setting of hypovolemic or septic shock, and the response to this fluid resuscitation can be assessed by serially measuring the change in IVC diameter.[32]
Thromboembolism
Multiple studies have shown that point‐of‐care ultrasound can accurately diagnose deep venous thrombosis (DVT) with a pooled sensitivity of 96% and specificity of 96% based on a recent meta‐analysis of 19 studies.[33] In symptomatic patients with a lung ultrasound pattern showing A‐lines, positive and negative predictive values of DVT in predicting pulmonary embolism (PE) were 94% and 98%, respectively.[34] A diagnostic accuracy study to diagnose PE using lung ultrasound to detect pleural‐ or subpleural‐based lesions yielded a sensitivity of 90%, specificity of 60%, positive predictive value of 80%, and negative predictive value of 78%.[35] In a study of 96 patients with suspected PE who underwent computed tomography pulmonary angiogram (CTPA), a focused ultrasound exam of the heart, lungs, and lower extremity veins was able to detect DVT (2.1%) or an alternative diagnosis (56.2%) in the majority of these patients, potentially obviating the need for CTPA in 58.4% of patients.[36] In addition, point‐of‐care cardiac ultrasound may reveal direct findings, such as free‐floating thrombus in the pulmonary artery, or indirect findings, such as right ventricular dilation and systolic dysfunction, septal bowing, McConnell's sign, or IVC dilation.[1] Cardiac abnormalities are more specific (88%94%) than sensitive (31%77%), and absence of cardiac abnormalities rules out massive PE, justifying withholding thrombolytic medications in most patients.[37]
RESEARCH GAPS
Most point‐of‐care ultrasound research has focused on diagnostic accuracy. Yet the training required for hospitalists to attain diagnostic competency remains controversial.[38] Evidence from cardiac point‐of‐care ultrasound training suggests that the number of supervised studies is a key determinate in competency.[39] For example, training programs based on 30 supervised studies[11, 15, 40] outperformed those based on only 5 supervised studies.[11] Nevertheless, the real value of point‐of‐care ultrasound will be in leading hospitalists to more appropriate treatment decisions that result in better outcomes for patients.[41] We believe that there are 4 important clinical areas where future research ought to focus.
First, can point‐of‐care ultrasound guide hospitalists' decision making during cardiac arrest? Current advanced cardiac life support (ACLS) guidelines recommend ruling out potentially reversible causes of cardiac arrest, including tension pneumothorax, cardiac tamponade, and massive pulmonary embolism, but traditional physical examination techniques are impractical to perform during cardiopulmonary resuscitation. Point‐of‐care ultrasound may be able to detect these conditions and facilitate emergent interventions, such as pericardiocentesis or needle decompression.[1] Identifying the absence of cardiac contractility is importantly associated with a significantly low likelihood of return of spontaneous circulation.[1, 42] Whether or not point‐of‐care ultrasound should be added to either crash carts or ACLS guideline recommendations will depend on further evidence demonstrating its value.
Second, should hospitalists seize the opportunity to screen inpatients for abdominal aortic aneurysm and asymptomatic left ventricular systolic dysfunction? Although such screening has been successfully carried out,[6, 43] widespread screening applications have been slow to develop. Ultrasound waves, themselves, impart no harm, but further research is needed to weigh the benefits of early detection against the harms of false‐positive findings.
Third, how can hospitalists best utilize bedside ultrasound to perform serial examinations of patients? Unlike referral ultrasound examinations that take single snapshots of patients at 1 point in time, point‐of‐care ultrasound allows hospitalists to iteratively monitor patients. Promising and needed applications include serial examinations of the IVC as a surrogate for central venous volume[44] during both fluid resuscitation and removal, left ventricular contraction in response to inotrope initiation, and resolution or worsening of a pneumothorax or pneumonia.
Fourth, how should hospitalists integrate point‐of‐care ultrasound into their workflow for common conditions? Recognized protocols most relevant to hospital medicine include RUSH (Rapid Ultrasound for Shock and Hypotension),[45] FALLS (Fluid Administration Limited by Lung Sonography),[46] BLUE (Bedside Lung Ultrasound in Emergency),[34] CLUE (Cardiovascular Limited Ultrasound Exam),[47] and intensive care unit‐sound.[48] Several small single‐institution studies have demonstrated that bedside ultrasound may benefit clinical decision making by differentiating cardiac versus pulmonary causes of acute dyspnea.[49, 50] However, large, validating, multicenter trials are needed. In addition, outcomes that better reflect both the patients' and payers' perspectives ought to be considered. For example, how are doctor‐patient relationships affected? Is shared decision making and patient (or physician) satisfaction improved? How are resources utilized and healthcare costs affected?
CONCLUSIONS
Hospitalists are striving to provide high‐quality, cost‐effective healthcare, and point‐of‐care ultrasound may contribute to achieving these goals by expediting diagnoses and decreasing costly ancillary testing that utilizes ionizing radiation. Hospitalists are uniquely poised to advance the field by studying how point‐of‐care ultrasound is best incorporated into patient care algorithms.
Disclosure: Nothing to report.
1. Soni NJ, Arntfield R, Kory P. Point-of-Care Ultrasound. 1st ed. Philadelphia,
PA: Saunders; 2014.
2. American Medical Association. House of Delegates. H-230.960 Privileging
for ultrasound imaging. Policy finder website. Available at:
https://ssl3.ama-assn.org/apps/ecomm/PolicyFinderForm.pl?site5www.
ama-assn.org&uri5%2fresources%2fhtml%2fPolicyFinder%2fpolicy
files%2fHnE%2fH-230.960.HTM. Accessed October 2, 2014.
3. Goldberg BB, Goodman GA, Clearfield HR. Evaluation of ascites by
ultrasound. Radiology. 1970;96(1):15–22.
4. Mercaldi CJ, Lanes SF. Ultrasound guidance decreases complications
and improves the cost of care among patients undergoing thoracentesis
and paracentesis. Chest. 2013;143(2):532–538.
5. Rubano E, Mehta N, Caputo W, Paladino L, Sinert R. Systematic
review: emergency department bedside ultrasonography for diagnosing
suspected abdominal aortic aneurysm. Acad Emerg Med. 2013;
20(2):128–138.
6. Dijos M, Pucheux Y, Lafitte M, et al. Fast track echo of abdominal
aortic aneurysm using a real pocket-ultrasound device at bedside.
Echocardiography. 2012;29(3):285–290.
7. Rosen CL, Brown DF, Sagarin MJ, Chang Y, McCabe CJ, Wolfe RE.
Ultrasonography by emergency physicians in patients with suspected
ureteral colic. J Emerg Med. 1998;16(6):865–870.
8. Gaspari RJ, Horst K. Emergency ultrasound and urinalysis in the evaluation
of flank pain. Acad Emerg Med. 2005;12(12):1180–1184.
9. Lucas BP, Candotti C, Margeta B, et al. Diagnostic accuracy of
hospitalist-performed hand-carried ultrasound echocardiography after
a brief training program. J Hosp Med. 2009;4(6):340–349.
10. Martin LD, Howell EE, Ziegelstein RC, Martire C, Shapiro EP,
Hellmann DB. Hospitalist performance of cardiac hand-carried ultrasound
after focused training. Am J Med. 2007;120(11):1000–1004.
11. Martin LD, Howell EE, Ziegelstein RC, et al. Hand-carried ultrasound
performed by hospitalists: does it improve the cardiac physical
examination? Am J Med. 2009;122(1):35–41.
PoCUS for Hospitalists | Soni and Lucas
An Official Publication of the Society of Hospital Medicine Journal of Hospital Medicine Vol 10 | No 2 | February 2015 123
12. Lucas BP, Candotti C, Margeta B, et al. Hand-carried echocardiography
by hospitalists: a randomized trial. Am J Med. 2011;124(8):766–
774.
13. Hu QJ, Shen YC, Jia LQ, et al. Diagnostic performance of lung ultrasound
in the diagnosis of pneumonia: a bivariate meta-analysis. Int J
Clin Exp Med. 2014;7(1):115–121.
14. Reissig A, Gramegna A, Aliberti S. The role of lung ultrasound in the
diagnosis and follow-up of community-acquired pneumonia. Eur J
Intern Med. 2012;23(5):391–397.
15. Patel PA, Ernst FR, Gunnarsson CL. Ultrasonography guidance
reduces complications and costs associated with thoracentesis procedures.
J Clin Ultrasound. 2012;40(3):135–141.
16. Ding W, Shen Y, Yang J, He X, Zhang M. Diagnosis of pneumothorax
by radiography and ultrasonography: a meta-analysis. Chest.
2011;140(4):859–866.
17. Alrajab S, Youssef AM, Akkus NI, Caldito G. Pleural ultrasonography
versus chest radiography for the diagnosis of pneumothorax: review
of the literature and meta-analysis. Crit Care. 2013;17(5):R208.
18. Lichtenstein D, Meziere G, Biderman P, Gepner A. The comet-tail
artifact: an ultrasound sign ruling out pneumothorax. Intensive Care
Med. 1999;25(4):383–388.
19. Picano E, Frassi F, Agricola E, Gligorova S, Gargani L, Mottola G.
Ultrasound lung comets: a clinically useful sign of extravascular lung
water. J Am Soc Echocardiogr. 2006;19(3):356–363.
20. Lichtenstein D, Meziere G. A lung ultrasound sign allowing bedside
distinction between pulmonary edema and COPD: the comet-tail artifact.
Intensive Care Med. 1998;24(12):1331–1334.
21. Volpicelli G, Mussa A, Garofalo G, et al. Bedside lung ultrasound in
the assessment of alveolar-interstitial syndrome. Am J Emerg Med.
2006;24(6):689–696.
22. Rothe CF. Reflex control of veins and vascular capacitance. Physiol
Rev. 1983;63(4):1281–1342.
23. Blair JE, Brennan JM, Goonewardena SN, Shah D, Vasaiwala S,
Spencer KT. Usefulness of hand-carried ultrasound to predict elevated
left ventricular filling pressure. Am J Cardiol. 2009;103(2):246–247.
24. Beigel R, Cercek B, Luo H, Siegel RJ. Noninvasive evaluation of right
atrial pressure. J Am Soc Echocardiogr. 2013;26(9):1033–1042.
25. Miller JB, Sen A, Strote SR, et al. Inferior vena cava assessment in the
bedside diagnosis of acute heart failure. Am J Emerg Med. 2012;
30(5):778–783.
26. Blehar DJ, Dickman E, Gaspari R. Identification of congestive heart
failure via respiratory variation of inferior vena cava diameter. Am J
Emerg Med. 2009;27(1):71–75.
27. Goonewardena SN, Spencer KT. Handcarried echocardiography to
assess hemodynamics in acute decompensated heart failure. Curr
Heart Fail Rep. 2010;7(4):219–227.
28. Guiotto G, Masarone M, Paladino F, et al. Inferior vena cava collapsibility
to guide fluid removal in slow continuous ultrafiltration: a pilot
study. Intensive Care Med. 2010;36(4):692–696.
29. Carbone F, Bovio M, Rosa GM, et al. Inferior vena cava parameters
predict readmission in ischemic heart failure. Eur J Clin Invest. 2014;
44(4):341–349.
30. Goonewardena SN, Gemignani A, Ronan A, et al. Comparison of
hand-carried ultrasound assessment of the inferior vena cava and Nterminal
pro-brain natriuretic peptide for predicting readmission after
hospitalization for acute decompensated heart failure. JACC Cardiovasc
Imaging. 2008;1(5):595–601.
31. Laffin L, Patel AR, Saha N, et al. Inferior vena cava measurement by
focused cardiac ultrasound in acute decompensated heart failure prevents
hospital readmissions. J Am Coll Cardiol. 2014;63(12 suppl):
A542.
32. Zhang Z, Xu X, Ye S, Xu L. Ultrasonographic measurement of the
respiratory variation in the inferior vena cava diameter is predictive of
fluid responsiveness in critically ill patients: systematic review and
meta-analysis. Ultrasound Med Biol. 2014;40(5):845–853.
33. Pomero F, Dentali F, Borretta V, et al. Accuracy of emergency
physician-performed ultrasonography in the diagnosis of deep-vein
thrombosis: a systematic review and meta-analysis. Thromb Haemost.
2013;109(1):137–145.
34. Lichtenstein DA, Meziere GA. Relevance of lung ultrasound in the
diagnosis of acute respiratory failure: the BLUE protocol. Chest.
2008;134(1):117–125.
35. Comert SS, Caglayan B, Akturk U, et al. The role of thoracic ultrasonography
in the diagnosis of pulmonary embolism. Ann Thorac Med.
2013;8(2):99–104.
36. Koenig S, Chandra S, Alaverdian A, Dibello C, Mayo PH,
Narasimhan M. Ultrasound assessment of pulmonary embolism in
patients receiving computerized tomography pulmonary angiography.
Chest. 2014;145(4):818–823.
37. Mookadam F, Jiamsripong P, Goel R, Warsame TA, Emani UR,
Khandheria BK. Critical appraisal on the utility of echocardiography
in the management of acute pulmonary embolism. Cardiol Rev. 2010;
18(1):29–37.
38. Gesensway D. Making the case for portable ultrasound. Todays Hospitalist.
2012;10:32–36.
39. Spencer KT, Kimura BJ, Korcarz CE, Pellikka PA, Rahko PS, Siegel
RJ. Focused cardiac ultrasound: recommendations from the American
Society of Echocardiography. J Am Soc Echocardiogr. 2013;26(6):
567–581.
40. Hellmann DB, Whiting-O’Keefe Q, Shapiro EP, Martin LD, Martire
C, Ziegelstein RC. The rate at which residents learn to use hand-held
echocardiography at the bedside. Am J Med. 2005;118(9):1010–
1018.
41. Redberg RF, Walsch J. Pay now, benefits may follow—the case of cardiac
computed tomographic angiography. N Engl J Med. 2008;359:
2309–2311.
42. Blyth L, Atkinson P, Gadd K, Lang E. Bedside focused echocardiography
as predictor of survival in cardiac arrest patients: a systematic
review. Acad Emerg Med. 2012;19(10):1119–1126.
43. Martin LD, Mathews S, Ziegelstein RC, et al. Prevalence of asymptomatic
left ventricular systolic dysfunction in at-risk medical inpatients.
Am J Med. 2013;126(1):68–73.
44. Low D, Vlasschaert M, Novak K, Chee A, Ma IWY. An argument for
using additional bedside tools, such as bedside ultrasound, for volume
status assessment in hospitalized medical patients: a needs assessment
survey. J Hosp Med. 2014;9:727–730.
45. Perera P, Mailhot T, Riley D, Mandavia D. The RUSH exam: Rapid
Ultrasound in SHock in the evaluation of the critically lll. Emerg Med
Clin North Am. 2010;28(1):29–56, vii.
46. Lichtenstein D. FALLS-protocol: lung ultrasound in hemodynamic
assessment of shock. Heart Lung Vessel. 2013;5(3):142–147.
47. Kimura BJ, Yogo N, O’Connell CW, Phan JN, Showalter BK,
Wolfson T. Cardiopulmonary limited ultrasound examination for
“quick-look” bedside application. Am J Cardiol. 2011;108(4):586–
590.
48. Manno E, Navarra M, Faccio L, et al. Deep impact of ultrasound in
the intensive care unit: the “ICU-sound” protocol. Anesthesiology.
2012;117(4):801–809.
49. Cibinel GA, Casoli G, Elia F, et al. Diagnostic accuracy and reproducibility
of pleural and lung ultrasound in discriminating cardiogenic
causes of acute dyspnea in the emergency department. Intern Emerg
Med. 2012;7(1):65–70.
50. Anderson KL, Jenq KY, Fields JM, Panebianco NL, Dean AJ. Diagnosing
heart failure among acutely dyspneic patients with cardiac,
inferior vena cava, and lung ultrasonography. Am J Emerg Med.
2013;31(8):1208–1214.
© 2014 Society of Hospital Medicine

Procalcitonin‐Guided Antibiotic Therapy
Many serum biomarkers have been identified in recent years with a wide range of potential applications, including diagnosis of local and systemic infections, differentiation of bacterial and fungal infections from viral syndromes or noninfectious conditions, prognostic stratification of patients, and enhanced management of antibiotic therapy. Currently, there are at least 178 serum biomarkers that have potential roles to guide antibiotic therapy, and among these, procalcitonin has been the most extensively studied biomarker.[1, 2]
Procalcitonin is the prohormone precursor of calcitonin that is expressed primarily in C cells of the thyroid gland. Conversion of procalcitonin to calcitonin is inhibited by various cytokines and bacterial endotoxins. Procalcitonin's primary diagnostic utility is thought to be in establishing the presence of bacterial infections, because serum procalcitonin levels rise and fall rapidly in bacterial infections.[3, 4, 5] In healthy individuals, procalcitonin levels are very low. In systemic infections, including sepsis, procalcitonin levels are generally greater than 0.5 to 2 ng/mL, but often reach levels 10 ng/mL, which correlates with severity of illness and a poor prognosis. In patients with respiratory tract infections, procalcitonin levels are less elevated, and a cutoff of 0.25 ng/mL seems to be most predictive of a bacterial respiratory tract infection requiring antibiotic therapy.[6, 7, 8] Procalcitonin levels decrease to <0.25 ng/mL as infection resolves, and a decline in procalcitonin level may guide decisions about discontinuation of antibiotic therapy.[5]
The purpose of this systematic review was to synthesize comparative studies examining the use of procalcitonin to guide antibiotic therapy in patients with suspected local or systemic infections in different patient populations. We are aware of 6 previously published systematic reviews evaluating the utility of procalcitonin guidance in the management of infections.[9, 10, 11, 12, 13, 14] Our systematic review included more studies and pooled patients into the most clinically similar groups compared to other systematic reviews.
METHODS
This review is based on a comparative effectiveness review prepared for the Agency for Healthcare Research and Quality's Effective Health Care Program.[15] A standard protocol consistent with the Methods Guide for Effectiveness and Comparative Effectiveness Reviews[16] was followed. A detailed description of the methods is available online (
Study Question
In selected populations of patients with suspected local or systemic infection, what are the effects of using procalcitonin measurement plus clinical criteria for infection to guide initiation, intensification, and/or discontinuation of antibiotic therapy when compared to clinical criteria for infection alone?
Search Strategy
MEDLINE and EMBASE were searched from January 1, 1990 through December 16, 2011, and the Cochrane Controlled Trials register was searched with no date restriction for randomized and nonrandomized comparative studies using the following search terms: procalcitonin AND chronic obstructive pulmonary disease; COPD; critical illness; critically ill; febrile neutropenia; ICU; intensive care; intensive care unit; postoperative complication(s); postoperative infection(s); postsurgical infection(s); sepsis; septic; surgical wound infection; systemic inflammatory response syndrome OR postoperative infection. In addition, a search for systematic reviews was conducted in MEDLINE, the Cochrane Database of Systematic Reviews, and Web sites of the National Institute for Clinical Excellence, the National Guideline Clearinghouse, and the Health Technology Assessment Programme. Gray literature, including databases with regulatory information, clinical trial registries, abstracts and conference papers, grants and federally funded research, and manufacturing information was searched from January 1, 2006 to June 28, 2011.
Study Selection
A single reviewer screened abstracts and selected studies looking at procalcitonin‐guided antibiotic therapy. Second and third reviewers were consulted to screen articles when needed. Studies were included if they fulfilled all of the following criteria: (1) randomized, controlled trial or nonrandomized comparative study; (2) adult and/or pediatric patients with known or suspected local or systemic infection, including critically ill patients with sepsis syndrome or ventilator‐associated pneumonia, adults with respiratory tract infections, neonates with sepsis, children with fever of unknown source, and postoperative patients at risk of infection; (3) interventions included initiation, intensification, and/or discontinuation of antibiotic therapy guided by procalcitonin plus clinical criteria; (4) primary outcomes included antibiotic usage (antibiotic prescription rate, total antibiotic exposure, duration of antibiotic therapy, and days without antibiotic therapy); and (5) secondary outcomes included morbidity (antibiotic adverse events, hospital and/or intensive care unit length of stay), mortality, and quality of life.
Studies with any of the following criteria were excluded: published in non‐English language, not reporting primary data from original research, not a randomized, controlled trial or nonrandomized comparative study, not reporting relevant outcomes.
Data Extraction and Quality Assessment
A single reviewer abstracted data and a second reviewer confirmed accuracy. Disagreements between reviewers were resolved by group discussion among the research team and final quality rating was assigned by consensus adjudication. Data elements were abstracted into the following categories: quality assessment, applicability and clinical diversity assessment, and outcome assessment. Quality of included studies was assessed using the US Preventive Services Task Force framework[17] by at least 2 independent reviewers. Three quality categories were used: good, fair, and poor.
Data Synthesis and Analysis
The decision to incorporate formal data synthesis in this review was made after completing the formal literature search, and the decision to pool studies was based on the specific number of studies with similar questions and outcomes. If a meta‐analysis could be performed, subgroup and sensitivity analyses were based on clinical similarity of available studies and reporting of mean and standard deviation. The pooling method involved inverse variance weighting and a random effects model.
The strength of evidence was graded using the Methods Guide,[16] a system based on the Grading of Recommendations Assessment, Development and Evaluation Working Group.[18] The following domains were addressed: risk of bias, consistency, directness, and precision. The overall strength of evidence was graded as high, moderate, low, or insufficient. The final strength of evidence grading was made by consensus adjudication among the authors.
RESULTS
Of the 2000 studies identified through the literature search, 1986 were excluded and 14 studies[19, 20, 21, 22, 23, 24, 25, 26, 27, 28, 29, 30, 31, 32] were included. Search of gray literature yielded 4 published studies.[33, 34, 35, 36] A total of 18 randomized, controlled trials comparing procalcitonin guidance to use of clinical criteria alone to manage antibiotic therapy in patients with infections were included. The PRISMA diagram (Figure 1) depicts the flow of search screening and study selection. We sought, but did not find, nonrandomized comparative studies of populations, comparisons, interventions, and outcomes that were not adequately studied in randomized, controlled trials.

Data were pooled into clinically similar groups that were reviewed separately: (1) adult intensive care unit (ICU) patients, including patients with ventilator‐associated pneumonia; (2) adult patients with respiratory tract infections; (3) neonates with suspected sepsis; (4) children between 1 to 36 months of age with fever of unknown source; and (5) postoperative patients at risk of infection. Tables summarizing study quality and outcome measures with strength of evidence are available online (
| Outcome | Author, Year | N | PCT‐Guided Therapya | Controla | Difference PCT‐CTRL (95% CI) | P Value |
|---|---|---|---|---|---|---|
| ||||||
| Critically ill adult patients: procalcitonin‐guided antibiotic discontinuation | ||||||
| ABT Duration, d | Hochreiter, 2009[22] | 110 | 5.9 | 7.9 | 2.0 (2.5 to 1.5) | <0.001 |
| Nobre, 2008[19] | 79 | 66 | 9.5 (ITT), 10 (PP) | 2.6 (5.5 to 0.3), 3.2 (1.1 to5.4) | 0.15, 0.003 | |
| Schroeder, 2009[20] | 27 | 6.6 | 8.3 | 1.7 (2.4 to 1.0) | <0.001 | |
| Stolz, 2009[21] | 101 | 10 (616)b | 15 (1023)b | 5 | 0.049 | |
| Bouadma, 2010[23] | 621 | 10.3 | 13.3 | 3.0 (4.20 to 1.80) | <0.0001 | |
| Days without ABTs, day 28 | Nobre, 2008[19] | 79 | 15.3, 17.4 | 13, 13.6 | 2.3 (5.9 to 1.8), 3.8 (0.1 to 7.5)c | 0.28, 0.04 |
| Stolz, 2009[21] | 101 | 13 (221)b | 9.5 (1.517)b | 3.5 | 0.049 | |
| Bouadma, 2010[23] | 621 | 14.3 | 11.6 | 2.7 (1.4 to 4.1) | <0.001 | |
| Total ABT exposured | Nobre, 2008[19] | 79 | 541 | 644 | 1.1e (0.9 to 1.3), 1.3e (1.1 to 1,5)c | 0.07, 0.0002 |
| 504 | 655 | |||||
| Stolz, 2009[21] | 101 | 1077 | 1341 | |||
| Bouadma, 2010[23]d | 621 | 653 | 812 | 159 (185 to 131) | <0.001 | |
| Critically ill adult patients: procalcitonin‐guided antibiotic intensification | ||||||
| ABT duration, days | Jensen, 2011[33] | 1200 | 6 (311)b | 4 (310)b | NR | NR |
| Days spent in ICU on 3 ABTs | Jensen, 2011[33] | 1200 | 3570/5447 (65.5%) | 2721/4717 (57.7%) | 7.9% (6.0 to 9.7) | 0.002 |
| Adult patients with respiratory tract infections | ||||||
| ABT duration, da | Schuetz, 2009[2][5] | 1359 | 5.7 | 8.7 | 3.0 | |
| Christ‐Crain, 2004[30] | 243 | 10.9 | 12.8 | 1.9 (3.1 to 0.7) | 0.002 | |
| Kristoffersen, 2009[26] | 210 | 5.1 | 6.8 | 1.7 | ||
| Briel, 2008[27] | 458 | 6.2 | 7.1 | 1.0 (1.7 to 0.4) | <0.05 | |
| Long, 20113[5] | 162 | 5 (36)f | 7 (59)f | 2.0 | <0.001 | |
| Burkhardt, 2010[34] | 550 | 7.8 | 7.7 | 0.1 (0.7 to 0.9) | 0.8 | |
| Christ‐Crain, 2006[29] | 302 | 5.8 | 12.9 | 7.1(8.4 to 5.8) | <0.0001 | |
| Antibiotic prescription rate, % | Schuetz, 2009[2][5] | 1359 | 506/671 (75.4%) | 603/688 (87.6%) | 12.2% (16.3 to 8.1) | <0.05 |
| Christ‐Crain, 2004[30] | 243 | 55/124 (44.4%) | 99/119 (83.2%) | 38.8% (49.9 to 27.8) | <0.0001 | |
| Kristoffersen, 2009[26] | 210 | 88/103 (85.4%) | 85/107 (79.4%) | 6.0% (4.3 to 16.2) | 0.25 | |
| Briel, 2008[27] | 458 | 58/232 (25.0%) | 219/226 (96.9%) | 72% (78 to 66) | <0.05 | |
| Long, 20113[5] | 162 | NR (84.4%) | NR (97.5%) | 13.1% | 0.004 | |
| Stolz, 2007[28] | 208 | 41/102 (40.2%) | 76/106 (71.7%) | 31.5% (44.3 to 18.7) | <0.0001 | |
| Christ‐Crain, 2006[29] | 302 | 128/151 (84.8%) | 149/151 (98.79%) | 13.9% (19.9 to 7.9) | <0.0001 | |
| Burkhardt, 2010[34] | 550 | 84/275 (30.5%) | 89/275 (32.4%) | 1.8% (9.6 to 5.9) | 0.701 | |
| Total ABT exposure | Stolz, 2007[28] | 208 | NR | NR | 31.5% (18.7 to 44.3) | <0.0001 |
| Long, 20113[5] | 162 | NR | NR | NR | ||
| Christ‐Crain, 2006[29] | 302 | 136g | 323g | |||
| Christ‐Crain, 2004[30] | 243 | 332g | 661g | |||
| Neonates with sepsis | ||||||
| ABTs 72 hours, % | Stocker, 2010[31] | All neonates (N=121) | 33/60 (55%) | 50/61 (82%) | 27.0 (42.8 to 11.1) | 0.002 |
| Infection proven/probably (N=21) | 9/9 (100%) | 12/12 (100%) | 0% (0 to 0) | NA | ||
| Infection possible (N=40) | 13/21 (61.9%) | 19/19 (100%) | 38.1 (58.9 to 17.3) | 0.003 | ||
| Infection unlikely (N=60) | 11/30 (36.7%) | 19/30 (63.3%) | 26.6 (51.1 to 2.3) | 0.038 | ||
| ABT duration, h | Stocker, 2010[31] | All neonates (N=121) | 79.1 | 101.5 | 22.4 | 0.012 |
| Infection proven/probably (N=21) | 177.8 | 170.8 | 7 | NSS | ||
| Infection possible (N=40) | 83.4 | 111.5 | 28.1 | <0.001 | ||
| Infection unlikely (N=60) | 46.5 | 67.4 | 20.9 | 0.001 | ||
| Children ages 136 months with fever of unknown source | ||||||
| Antibiotic prescription rate, % | Manzano, 2010[36] | All children (N=384) | 48/192 (25%) | 54/192 (28.0%) | 3.1 (12.0 to 5.7) | 0.49 |
| No SBI or neutropenia (N=312) | 14/158 (9%) | 16/154 (10%) | 1.5 (8.1 to 5.0) | 0.65 | ||
| Adult postoperative patients at risk of infection | ||||||
| ABT duration, d | Chromik, 2006[32] | All patients (N=20) | 5.5 | 9 | 3.5 | 0.27 |
| Outcome | Author, Year | N | PCTa | Controla | Difference, PCT‐CTRL (95% CI) | P Value |
|---|---|---|---|---|---|---|
| ||||||
| Critically ill adult patients: procalcitonin‐guided antibiotic discontinuation | ||||||
| ICU LOS, days | Hochreiter, 2009[22] | 110 | 15.5 | 17.7 | 2.2 | 0.046 |
| Nobre, 2008[19] | 79 | 4 | 7 | 4.6 (8.2 to 1.0) | 0.02 | |
| Schroeder, 2009[20] | 27 | 16.4 | 16.7 | 0.3 (5.6 to 5.0) | NSS | |
| Bouadma, 2010[23] | 621 | 15.9 | 14.4 | 1.5 (0.9 to 3.1) | 0.23 | |
| Hospital LOS, days | Nobre, 2008[19] | 79 | 17 | 23.5 | 2.5 (6.5 to 1.5) | 0.85 |
| Stolz, 2009[21] | 101 | 26 (721)b | 26 (16.822.3)b | 0 | 0.15 | |
| Bouadma, 2010[23] | 621 | 26.1 | 26.4 | 0.3 (3.2 to 2.7) | 0.87 | |
| ICU‐free days alive, 128 | Stolz, 2009[21] | 101 | 10 (018)b | 8.5 (018)c | 1.5 | 0.53 |
| SOFA day 28 | Bouadma, 2010[23] | 621 | 1.5 | 0.9 | 0.6 (0.0, 1.1) | 0.037 |
| SOFA score max | Schroeder, 2009[20] | 27 | 7.3 | 8.3 | 8.1 (4.1 to 1.7) | NSS |
| SAPS II score | Hochreiter, 2009[22] | 110 | 40.1 | 40.5 | 0.4 (6.4 to 5.6) | >0.05 |
| Days without MV | Stolz, 2009[21] | 101 | 21 (224)b | 19 (8.522.5)b | 2.0 | 0.46 |
| Bouadma, 2010[23] | 621 | 16.2 | 16.9 | 0.7 (2.4 to 1.1) | 0.47 | |
| Critically ill adult patients: procalcitonin‐guided antibiotic intensification | ||||||
| ICU LOS, da | Svoboda, 2007[24] | 72 | 16.1 | 19.4 | 3.3 (7.0 to 0.4) | 0.09 |
| Jensen, 2011[33] | 1200 | 6 (312)b | 5 (311)b | 1 | 0.004 | |
| SOFA scorea | Svoboda, 2007[24] | 72 | 7.9 | 9.3 | 1.4 (2.8 to 0.0) | 0.06 |
| Days on MVa | Svoboda, 2007[24] | 72 | 10.3 | 13.9 | 3.6 (7.6 to 0.4) | 0.08 |
| Jensen, 2011[33] | 1200 | 3569 (65.5%) | 2861 (60.7%) | 4.9% (3 to 6.7) | <0.0001 | |
| Percent days in ICU with GFR <60 | Jensen, 2011[33] | 1200 | 2796 (51.3%) | 2187 (46.4%) | 5.0 % (3.0 to 6.9) | <0.0001 |
| Adult patients with respiratory tract infections | ||||||
| Hospital LOS, da | Schuetz, 2009[2][5] | 1359 | 9.4 | 9.2 | 0.2 | |
| Christ‐Crain, 2004[30] | 224 | 10.78.9 | 11.210.6 | 0.5 (3.0 to 2.0) | 0.69 | |
| Kristoffersen, 2009[26] | 210 | 5.9 | 6.7 | 0.8 | 0.22 | |
| Stolz, 2007[28] | 208 | 9 (115)b | 10 (115)b | 1 | 0.96 | |
| Christ‐Crain, 2006[29] | 302 | 12.09.1 | 13.09.0 | 1 (3.0 to 1.0) | 0.34 | |
| ICU admission, % | Schuetz, 2009[2][5] | 1359 | 43/671 (6.4%) | 60/688 (8.7%) | 2.3% (5.2 to 0.4) | 0.12 |
| Christ‐Crain, 2004[30] | 224 | 5/124 (4.0%) | 6/119 (5.0%) | 1.0% (6.2 to 4.2) | 0.71 | |
| Kristoffersen, 2009[26] | 210 | 7/103 (6.8%) | 5/107 (4.7%) | 2.1% (4.2 to 8.4) | 0.51 | |
| Stolz, 2007[28] | 208 | 8/102 (7.8%) | 11/106 (10.4%) | 2.5% (10.3 to 5.3) | 0.53 | |
| Christ‐Crain, 2006[29] | 302 | 20/151 (13.2%) | 21/151 (13.94%) | 0.7% (8.4 to 7.1) | 0.87 | |
| Antibiotic adverse events | Schuetz, 2009[2][5]c | 1359 | 133/671 (19.8%) | 193/688 (28.1%) | 8.2% (12.7 to 3.7) | |
| Briel, 2008[27]d | 458 | 2.34.6 days | 3.66.1 days | 1.1 days (2.1 to 0.1) | <0.05 | |
| Burkhardt, 2010[34]e | 550 | 11 /59 (18.6%) | 16/101 (15.8%) | 2.8% (9.4 to 15.0) | 0.65 | |
| Restricted activity, df | Briel, 2008[27] | 458 | 8.73.9 | 8.63.9 | 0.2 (0.4 to 0.9) | >0.05 |
| Burkhardt, 2010[34] | 550 | 9.1 | 8.8 | 0.25 (0.52 to 1.03) | >0.05 | |
| Neonates with sepsis | ||||||
| Recurrence of infection | Stocker, 2010[31] | 121 | 32% | 39% | 7 | 0.45 |
| Children ages 136 months with fever of unknown source | ||||||
| Hospitalization rate | Manzano, 2010[36] | All children (N=384) | 50/192 (26%) | 48/192 (25%) | 1 (8 to 10) | 0.81 |
| No SBI or neutropenia (N=312) | 16/158 (10%) | 11/154 (7%) | 3 (3 to 10) | 0.34 | ||
| Adult postoperative patients at risk of infection | ||||||
| Hospital LOS, days | Chromik, 2006[32] | 20 | 18 | 30 | 12 | 0.057 |
| Local wound infection, % | Chromik, 2006[32] | 20 | 1/10 | 2/10 | 10 (41.0 to 21.0) | 0.53 |
| Systemic infection, % | Chromik, 2006[32] | 20 | 3/10 | 7/10 | 40.0 (80.2 to 0.2) | 0.07 |
| Sepsis/SIRS, % | Chromik, 2006[32] | 20 | 2/10 | 8/10 | 60.0 (95.1 to 24.9) | 0.007 |
| Mortality | Mortality | Difference | ||||
|---|---|---|---|---|---|---|
| Outcome | Author, Year | N | PCT‐Guided Therapy | Control | PCT‐CTRL (95% CI) | P Value |
| ||||||
| Critically ill adult patients: procalcitonin‐guided antibiotic discontinuation | ||||||
| 28‐day mortality | Nobre, 2008[19] | 79 | 8/39 (20.5%) | 8/40 (20.0%) | 0.5 (17.2 to 18.2), | 0.95 |
| 5/31 (16.1%) | 6/37 (16.2%) | 0.1 (17.7 to 17.5)a | 0.99 | |||
| Stolz, 2009[21] | 101 | 8/51 (15.7%) | 12/50 (24.0%) | 8.3 (23.8 to 7.2) | 0.29 | |
| Bouadma, 2010[23] | 621 | 65/307 (21.2%) | 64/314 (20.4%) | 0.8 (5.6 to 7.2) | 0.81 | |
| 60‐day mortality | Bouadma, 2010[23] | 621 | 92/307 (30.0%) | 82/314 (26.1%) | 3.9 (3.2 to 10.9) | 0.29 |
| In‐hospital mortality | Nobre, 2008[19] | 79 | 9/39 (23.1%) | 9/40 (22.5%) | 0.6 (17.9 to 19.1) | 0.95 |
| 6/31 (19.4%) | 7/37 (18.9%) | 0.4+ (18.3 to 19.2) | 0.96 | |||
| Stolz, 2009[21] | 101 | 10/51 (19.6%) | 14/50 (28.0%) | 8.4, (24.9 to 8.1) | 0.32 | |
| Hochreiter, 2009[22] | 110 | 15/57 (26.3%) | 14/53 (26.4%) | 0.1, (16.6 to 16.4) | 0.99 | |
| Schroeder, 2009[20] | 27 | 3/14 (21.4%) | 3/13 (23.1%) | 1.7, (33.1 to 29.8) | 0.92 | |
| Critically ill adult patients: procalcitonin‐guided antibiotic intensification | ||||||
| 28‐day mortality | Svoboda, 2007[24] | 72 | 10/38 (26.3%) | 13/34 (38.2%) | 11.9 (33.4 to 9.6) | 0.28 |
| 28‐day mortality | Jensen, 2011[33] | 1200 | 190/604 (31.5%) | 191/596 (32.0%) | 0.6 (4.7 to 5.9) | 0.83 |
| Adult patients with respiratory tract infections | ||||||
| 6‐month mortality | Stolz, 2007[28] | 208 | 5/102 (4.9%) | 9/106 (8.5%) | 3.6% (10.3 to 3.2%) | 0.30 |
| 6‐week mortality | Christ‐Crain, 2006[29] | 302 | 18/151 (11.9%) | 20/151 (13.2%) | 1.3% (8.8 to 6.2) | 0.73 |
| 28‐day mortality | Christ‐Crain, 2004[30] | 243 | 4/124(3.2%) | 4/119 (3.4%) | 0.1% (4.6 to 4.4) | 0.95 |
| Schuetz, 2009 (30‐day)[25] | 1359 | 34/671(5.1%) | 33/688(4.8%) | 0.3% (2.1 to 2.5) | 0.82 | |
| Briel, 2008[27] | 458 | 0/231(0%) | 1/224 (0.4%) | 0.4% (1.3 to 0.4) | 0.31 | |
| Burkhardt, 2010[34] | 550 | 0/275(0%) | 0/275 (0%) | 0 | ||
| Kristoffersen, 2009[26] | 210 | 2/103(1.9%) | 1/107 (0.9%) | 1.0% (2.2 to 4.2) | 0.54 | |
| Long, 20113[5] | 162 | 0/81 (0%) | 0/81 (0%) | 0 | ||
| Neonates with sepsis | ||||||
| Mortality (in‐hospital) | Stocker, 2010[31] | 121 | 0% | 0% | 0 (0 to 0) | NA |
| Children ages 136 months with fever of unknown source | ||||||
| Mortality | Manzano, 2010[36] | 384 | All children | 0% | 0% | 0 (0 to 0) |
| Adult postoperative patients at risk of infection | ||||||
| Mortality | Chromik, 2006[32] | 20 | 1/10 (10%) | 3/10 (30%) | 20 (54.0 to 14.0) | 0.07 |
Adult ICU Patients: Procalcitonin‐Guided Antibiotic Discontinuation
Five studies[19, 20, 21, 22, 23] (N=938) addressed procalcitonin‐guided discontinuation of antibiotic therapy in adult ICU patients. Four studies conducted superiority analyses for mortality with procalcitonin‐guided therapy, whereas 1 study conducted a noninferiority analysis. Absolute procalcitonin values for discontinuation of antibiotics ranged from 0.25 to 1 ng/mL. Physicians in control groups administered antibiotics according to their standard practice.
Antibiotic Usage
The absolute reduction in duration of antibiotic usage with procalcitonin guidance in these studies ranged from 1.7 to 5 days, and the relative reduction ranged from 21% to 38%. Meta‐analysis of antibiotic duration in adult ICU patients was performed (Figure 2A).
Morbidity
Procalcitonin‐guided antibiotic discontinuation did not increase morbidity, including ICU length of stay (LOS). Meta‐analysis of ICU LOS is displayed in Figure 2B. Limited data on adverse antibiotic events were reported (Table 2).
Mortality
There was no increase in mortality as a result of shorter duration of antibiotic therapy. Meta‐analysis of short‐term mortality (28‐day or in‐hospital mortality) showed a mortality difference of 0.43% favoring procalcitonin‐guided therapy, and a 95% confidence interval (CI) of 6% to 5% (Figure 2C).
Adult ICU Patients: Procalcitonin‐Guided Antibiotic Intensification
Two studies[24, 33] (N=1272) addressed procalcitonin‐guided intensification of antibiotic therapy in adult ICU patients. The Jensen et al. study[33] was a large (N=1200), high‐quality study that used a detailed algorithm for broadening antibiotic therapy in patients with elevated procalcitonin. The Jensen et al. study also educated physicians about empiric therapy and intensification of antibiotic therapy. A second study[24] was too small (N=72) and lacked sufficient details to be informative.
Antibiotic Usage
The Jensen et al. study found a 2‐day increase, or 50% relative increase, in the duration of antibiotic therapy and a 7.9% absolute increase (P=0.002) in the number of days on 3 antibiotics with procalcitonin‐guided intensification.
Morbidity
The Jensen et al. study showed a significant 1‐day increase in ICU LOS (P=0.004) and a significant increase in organ dysfunction. Specifically, patients had a highly statistically significant 5% increase in days on mechanical ventilation (P<0.0001) and 5% increase in days with abnormal renal function (P<0.0001).
Mortality
The Jensen et al. study was a superiority trial powered to test a 7.5% decrease in 28‐day mortality, but no significant difference in mortality was observed with procalcitonin‐guided intensification (31.5% vs 32.0, P=0.83).
Adult Patients With Respiratory Tract Infections
Eight studies[25, 26, 27, 28, 29, 30, 34, 35] (N=3492) addressed initiation and/or discontinuation of antibiotics in adult patients with acute upper and lower respiratory tract infections, including community‐acquired pneumonia, acute exacerbation of chronic obstructive pulmonary disease, and acute bronchitis. Settings included primary care clinics, emergency departments, and hospital wards. Physicians in control groups administered antibiotics according to their own standard practices and/or evidence‐based guidelines. All studies encouraged initiation of antibiotics with procalcitonin levels >0.25 ng/mL, and 4 studies strongly encouraged antibiotics with procalcitonin levels >0.5 ng/mL.
Antibiotic Usage
Procalcitonin guidance reduced antibiotic duration, antibiotic prescription rate, and total antibiotic exposure. Absolute reduction in antibiotic duration ranged from 1 to 7 days, and relative reductions ranged from 13% to 55%. Four of the 8 studies reported sufficient details to be pooled into a meta‐analysis (Figure 3A) with a statistically significant pooled mean difference of 2.35 days favoring procalcitonin (95% CI: 4.38 to 0.33). Procalcitonin guidance also reduced antibiotic prescription rate with absolute reductions ranging from 2% to 7% and relative reductions ranging from 1.8% to 72%. Meta‐analysis of prescription rates from 8 studies (Figure 3B) yielded a statistically significant pooled risk difference of 22% (95% CI: 41% to 4%). Total antibiotic exposure was consistently reduced in the 4 studies reporting this outcome.
Morbidity
Procalcitonin guidance did not increase hospital LOS or ICU admission rates. Meta‐analysis of ICU admission rates from 5 studies (Figure 3C) produced a risk difference of 1%, with a narrow 95% CI (4% to 1%). There was insufficient evidence to judge the effect on days of restricted activity or antibiotic adverse events.
Mortality
Procalcitonin guidance did not increase mortality, and meta‐analysis of 4 studies (Figure 3D) produced a risk difference of 0.3% with a narrow 95% CI (1% to 2%), with no statistical heterogeneity (I2=0%).
Neonates With Sepsis
One study[31] (N=121) evaluated procalcitonin‐guided antibiotic therapy for suspected neonatal sepsis. Neonatal sepsis was suspected on the basis of risk factors and clinical signs and symptoms. Antibiotic initiation or discontinuation was based on a procalcitonin nomogram. Antibiotic therapy in the control group was based on the physician's assessment. The quality of this study was rated good, and strength of evidence was rated moderate for antibiotic usage and insufficient for morbidity and mortality outcomes.
Antibiotic Usage
Duration of antibiotic therapy was decreased by 22.4 hours (P=0.012), a 24% relative reduction, and the proportion of neonates on antibiotics 72 hours was reduced by 27% (P=0.002). The largest reduction in antibiotic duration was seen in the 80% to 85% of neonates who were categorized as having possible or infection or unlikely to have infection.
Morbidity
A statistically insignificant 7% reduction in rate of recurrence of infection was seen with procalcitonin‐guided antibiotic therapy (P=0.45).
Mortality
No in‐hospital deaths occurred in either the procalcitonin or control group.
Children Ages 1 to 36 Months With Fever of Unknown Source
One study[36] (N=384) evaluated procalcitonin‐guided antibiotic therapy for fever of unknown source in children 1 to 36 months of age, but the overall strength of evidence was judged insufficient to draw conclusions.
Antibiotic Usage
A statistically insignificant reduction of 3.1% in antibiotic prescription rate was seen with procalcitonin‐guided antibiotic therapy (P=0.49).
Morbidity
Rate of hospitalization was relatively low, and no significant difference was seen between procalcitonin and control groups.
Mortality
In‐hospital mortality was reported as 0% in both arms.
Adult Postoperative Patients at Risk of Infection
One study[32] (N =250) monitored procalcitonin in consecutive patients after colorectal surgery to identify patients at risk of infection who might benefit from prophylactic antibiotic therapy. Two hundred thirty patients had normal procalcitonin levels. Twenty patients with elevated procalcitonin levels (>1.5 ng/mL) were randomized to receive prophylactic antibiotic therapy with ceftriaxone or no antibiotics. The strength of evidence was judged insufficient to draw conclusions from this study.
Antibiotic Usage
Duration of antibiotic therapy was reduced by 3.5% but was not statistically insignificant (P=0.27).
Morbidity
Procalcitonin guidance reduced the incidence of sepsis/systemic inflammatory response syndrome by 60% (p=0.007). The incidences of local and systemic infection were reduced with procalcitonin guidance but were not statistically significant (10%, P=0.53; and 40%, P=0.07, respectively).
Mortality
Mortality was 20% higher in the control arm but was not statistically significant (P=0.07).
DISCUSSION
Summary of the Main Findings
Diagnosis of sepsis or other serious infections in critically ill patients is challenging because clinical criteria for diagnosis overlap with noninfectious causes of the systemic inflammatory response syndrome. Initiation of antibiotic therapy for presumed sepsis is necessary while diagnostic evaluation is ongoing, because delaying antibiotic therapy is associated with increased mortality.[37, 38, 39] Our review found that procalcitonin guidance significantly reduced antibiotic usage in adult ICU patients by reducing the duration of antibiotic therapy, rather than decreasing the initiation of antibiotics, without increasing morbidity or mortality.
In contrast, the use of procalcitonin as an indicator of need for intensification of antibiotic therapy in adult ICU patients should be discouraged because this approach was associated with increased morbidity. The large, well‐designed study by Jensen[33] showed that antibiotic intensification in response to elevated procalcitonin measurement was associated with increased morbidity: a longer ICU LOS, an increase in days on mechanical ventilation, and an increase in days with abnormal renal function. The authors concluded that the increased morbidity could only be explained by clinical harms of increased exposure to broad‐spectrum antibiotics.
Clinical and microbiological evaluations are neither sensitive nor specific for differentiating bacterial from viral respiratory tract infections. Procalcitonin can guide initiation of antibiotic therapy in adults with suspected bacterial respiratory tract infection. Our review showed that procalcitonin guidance significantly reduced antibiotic usage with respect to antibiotic prescription rate, duration of antibiotic therapy, and total exposure to antibiotic therapy in adult patients with respiratory tract infections.
The role of procalcitonin‐guided therapy in other populations is less clear. One study in postoperative colorectal surgery patients reported that elevated procalcitonin levels may identify patients at risk for infection who benefit from prophylactic antibiotic therapy.[32] Patients with elevated procalcitonin levels who received prophylactic antibiotic therapy had a significant decrease in the incidence and severity of systemic infections, whereas patients with normal procalcitonin levels did not require any additional surgical or medical therapy. Although these findings are promising, more data in postoperative patients are needed.
The utility of procalcitonin in pediatric settings is a significant gap in the present literature. One study[31] in neonates with suspected sepsis showed a significant decrease in the proportion of neonates started on empiric antibiotic therapy and a decrease in the duration of antibiotic therapy with procalcitonin guidance. However, there was insufficient evidence that procalcitonin guidance does not increase morbidity or mortality.
Comparison to Other Systematic Reviews
Six systematic reviews of procalcitonin guidance in the management of patients with infections were published prior to our review.[9, 10, 11, 12, 13, 14] Our systematic review differs from past reviews in the number of studies included and the pooling of studies according to patient population, type and severity of infection, and different uses of procalcitonin measurements, either for initiation, discontinuation, or intensification of antibiotic therapy. Previous systematic reviews included 7 to 14 studies, whereas ours included 18 randomized, controlled trials. One previous review[13] included and pooled the Jensen et al. study[33] with other studies of adult ICU patients. We evaluated the Jensen et al. study separately because it uniquely looked at procalcitonin‐guided antibiotic intensification in adult ICU patients, in contrast to other studies that looked at procalcitonin‐guided antibiotic discontinuation. We addressed pediatric populations separately from adult patients, and recognizing that there are distinct groups within the pediatric population, we separately grouped neonates and children ages 1 to 36 months. Despite these differences, our review and other systematic reviews, we came to similar conclusions: procalcitonin‐guided antibiotic decision making compared to clinical criteria‐guided antibiotic decision making reduces antibiotic usage without increasing morbidity or mortality.
Limitations
An important limitation of this review was the uncertainty about the noninferiority margin for morbidity and mortality in adult ICU patients. Only the Bouadma et al. study[23] did a power analysis and predefined a margin for noninferiority for 28‐ and 60‐day mortality. Meta‐analysis of all 5 ICU studies showed a pooled point estimate of 0.43% in mortality and a 95% CI of 6% to 5% for difference in mortality between procalcitonin‐guided therapy versus standard care. A 10% noninferiority margin for mortality has been recommended by the Infectious Diseases Society of America and American College of Chest Physicians, but there is concern that a 10% margin for mortality may be too high. Presently, 2 large trials are in progress that may yield more precise estimates of mortality in the future.
Differences in reporting of total antibiotic exposure and morbidity outcomes limited our ability to pool data. Total antibiotic exposure is conventionally reported as mean days per 1000 days of follow‐up, but some studies only reported relative or absolute differences. Likewise, morbidity was reported with different severity of illness scales, including Sepsis‐Related Organ Failure Assessment, Simplified Acute Physiology (SAP) II, SAP III, and Acute Physiology and Chronic Health Evaluation II, which limited comparisons across studies.
Research Gaps
We identified gaps in the available literature and opportunities for future research. First, the safety and efficacy of procalcitonin‐guided antibiotic therapy needs to be studied in patient populations excluded from current randomized controlled studies, such as immunocompromised patients and pregnant women. Patients who are immunocompromised or have chronic conditions, such as cystic fibrosis, account for a significant percentage of community‐acquired respiratory tract infections and are often treated empirically.[29, 30] Second, standardized reporting of antibiotic adverse events and emergence of antibiotic resistance is needed. Strategies to reduce antibiotic usage have been associated with reductions in antibiotic adverse events, such as Clostridium difficile colitis and superinfection with multi‐drug resistant Gram‐negative bacteria.[37, 40, 41] Few studies in our review reported allergic reactions or adverse events of antibiotic therapy, [25, 27, 34] and only 1 reported antibiotic resistance.[19] Third, procalcitonin guidance should be compared to other strategies to reduce antibiotic usage, such as structured implementation of practice guidelines and antibiotic stewardship programs.[42] One single‐arm study describes how procalcitonin can be used in antibiotic stewardship programs to decrease the duration of antibiotic therapy,[43] but additional studies are needed. Finally, generalizing results from those studies that were conducted primarily in Europe would depend on similar use of and adherence to study‐based algorithms. Newer observational studies have demonstrated reduced antibiotic usage with implementation of procalcitonin algorithms in real‐life settings in Europe, but algorithm adherence was significantly less in the United States.[44, 45]
In summary, our systematic review found that procalcitonin‐guided antibiotic therapy can significantly reduce antibiotic usage in adult ICU patients without affecting morbidity or mortality. Procalcitonin should not be used to guide intensification of antibiotic therapy in adult ICU patients because this approach may increase morbidity. In adults with respiratory infections, procalcitonin guidance can significantly reduce antibiotic usage without adversely affecting morbidity or mortality. There is insufficient evidence to recommend procalcitonin‐guided antibiotic therapy in neonates with sepsis, children with fever of unknown source, or postoperative patients at risk for infection.
Acknowledgments
Disclosures: This project was funded under contract HHSA 2902007‐10058 from the Agency for Healthcare Research and Quality (AHRQ), US Department of Health and Human Services. The authors of this article are responsible for its content, including any clinical treatment recommendations. No statement in this article should be construed as an official position of AHRQ or of the US Department of Health and Human Services. There are no conflicts of interest reported by any of the authors.
- , . Sepsis biomarkers: a review. Crit Care. 2010;14(1):R15.
- , . Biomarkers of sepsis. Crit Care Med. 2009;37(7):2290–2298.
- , , . Kinetics of procalcitonin in iatrogenic sepsis. Intensive Care Med. 1998;24(8):888–889.
- , , , et al. Procalcitonin increase after endotoxin injection in normal subjects. J Clin Endocrinol Metab. 1994;79(6):1605–1608.
- , , , et al. Procalcitonin kinetics as a prognostic marker of ventilator‐associated pneumonia. Am J Respir Crit Care Med. 2005;171(1):48–53.
- , , , , . Serum procalcitonin and C‐reactive protein levels as markers of bacterial infection: a systematic review and meta‐analysis. Clin Infect Dis. 2004;39(2):206–217.
- , . Biomarkers in respiratory tract infections: diagnostic guides to antibiotic prescription, prognostic markers and mediators. Eur Respir J. 2007;30(3):556–573.
- , , , et al. Reliability of procalcitonin concentrations for the diagnosis of sepsis in critically ill neonates. Clin Infect Dis. 1998;26(3):664–672.
- , , , , . Effect of procalcitonin‐guided treatment in patients with infections: a systematic review and meta‐analysis. Infection. 2009;37(6):497–507.
- , . Procalcitonin to guide duration of antimicrobial therapy in intensive care units: a systematic review. Clin Infect Dis. 2011;53(4):379–387.
- , , , , . Procalcitonin‐guided algorithms of antibiotic therapy in the intensive care unit: a systematic review and meta‐analysis of randomized controlled trials. Crit Care Med. 2010;38(11):2229–2241.
- , , , . Procalcitonin algorithms for antibiotic therapy decisions: a systematic review of randomized controlled trials and recommendations for clinical algorithms. Arch Intern Med. 2011;171(15):1322–1331.
- , , , , , . An ESCIM systematic review and meta‐analysis of procalcitonin‐guided antibiotic therapy algorithms in adult critically ill patients. Intensive Care Med. 2012;38:940–949.
- , , , et al. Procalcitonin to initiate or discontinue antibiotics in acute respiratory tract infections. Cochrane Database Syst Rev 2012;(9):CD007498.
- , , , , , . Prepared by the Blue Cross and Blue Shield Association Technology Evaluation Center Evidence‐based Practice Center under contract no. 290–2007‐10058‐I. Procalcitonin‐guided antibiotic therapy. Comparative effectiveness review No. 78. AHRQ publication no. 12(13)‐EHC124‐EF. Rockville, MD: Agency for Healthcare Research and Quality. Available at: www.effectivehealthcare.ahrq.gov/reports/final.cfm. Published Accessed October 2012.
- Methods Guide for Effectiveness and Comparative Effectiveness Reviews. AHRQ publication no. 10(11)‐EHC063‐EF. Rockville, MD: Agency for Healthcare Research and Quality; 2011.
- , , , et al. Current methods of the US Preventive Services Task Force: a review of the process. Am J Prev Med. 2001;20(3 suppl):21–35.
- , , , et al. AHRQ series paper 5: grading the strength of a body of evidence when comparing medical interventions—agency for healthcare research and quality and the effective health‐care program. J Clin Epidemiol. 2010;63(5):513–523.
- , , , , . Use of procalcitonin to shorten antibiotic treatment duration in septic patients: a randomized trial. Am J Respir Crit Care Med. 2008;177(5):498–505.
- , , , et al. Procalcitonin (PCT)‐guided algorithm reduces length of antibiotic treatment in surgical intensive care patients with severe sepsis: results of a prospective randomized study. Langenbecks Arch Surg. 2009;394(2):221–226.
- , , , et al. Procalcitonin for reduced antibiotic exposure in ventilator‐associated pneumonia: a randomised study. Eur Respir J. 2009;34(6):1364–1375.
- , , , et al. Procalcitonin to guide duration of antibiotic therapy in intensive care patients: a randomized prospective controlled trial. Crit Care. 2009;13(3):R83.
- , , , et al. Use of procalcitonin to reduce patients' exposure to antibiotics in intensive care units (PRORATA trial): a multicentre randomised controlled trial. Lancet. 2010;375(9713):463–474.
- , , , , . Can procalcitonin help us in timing of re‐intervention in septic patients after multiple trauma or major surgery? Hepatogastroenterology. 2007;54(74):359–363.
- , , , et al. Effect of procalcitonin‐based guidelines vs. standard guidelines on antibiotic use in lower respiratory tract infections: the ProHOSP randomized controlled trial. JAMA. 2009;302(10):1059–1066.
- , , , et al. Antibiotic treatment interruption of suspected lower respiratory tract infections based on a single procalcitonin measurement at hospital admission—a randomized trial. Clin Microbiol Infect. 2009;15(5):481–487.
- , , , et al. Procalcitonin‐guided antibiotic use vs a standard approach for acute respiratory tract infections in primary care. Arch Intern Med. 2008;168(18):2000–2007; discussion 2007–2008.
- , , , et al. Antibiotic treatment of exacerbations of COPD: a randomized, controlled trial comparing procalcitonin‐guidance with standard therapy. Chest. 2007;131(1):9–19.
- , , , et al. Procalcitonin guidance of antibiotic therapy in community‐acquired pneumonia: a randomized trial. Am J Respir Crit Care Med. 2006;174(1):84–93.
- , , , et al. Effect of procalcitonin‐guided treatment on antibiotic use and outcome in lower respiratory tract infections: cluster‐randomised, single‐blinded intervention trial. Lancet. 2004;363(9409):600–607.
- , , , , . Use of procalcitonin‐guided decision‐making to shorten antibiotic therapy in suspected neonatal early‐onset sepsis: prospective randomized intervention trial. Neonatology. 2010;97(2):165–174.
- , , , , , . Pre‐emptive antibiotic treatment vs “standard” treatment in patients with elevated serum procalcitonin levels after elective colorectal surgery: a prospective randomised pilot study. Langenbecks Arch Surg. 2006;391(3):187–194.
- , , , et al. Procalcitonin‐guided interventions against infections to increase early appropriate antibiotics and improve survival in the intensive care unit: a randomized trial. Crit Care Med. 2011;39(9):2048–2058.
- , , , et al. Procalcitonin guidance and reduction of antibiotic use in acute respiratory tract infection. Eur Respir J. 2010;36(3):601–607.
- , , , , , . Procalcitonin guidance for reduction of antibiotic use in low‐risk outpatients with community‐acquired pneumonia. Respirology. 2011;16(5):819–824.
- , , , , , . Impact of procalcitonin on the management of children aged 1 to 36 months presenting with fever without source: a randomized controlled trial. Am J Emerg Med. 2010;28(6):647–653.
- , , , , , . Experience with a clinical guideline for the treatment of ventilator‐associated pneumonia. Crit Care Med. 2001;29(6):1109–1115.
- , , , et al. Diagnostic value of procalcitonin, interleukin‐6, and interleukin‐8 in critically ill patients admitted with suspected sepsis. Am J Respir Crit Care Med. 2001;164(3):396–402.
- , , , . Inadequate antimicrobial treatment of infections: a risk factor for hospital mortality among critically ill patients. Chest. 1999;115(2):462–474.
- , , , , . Favorable impact of a multidisciplinary antibiotic management program conducted during 7 years. Infect Control Hosp Epidemiol. 2003;24(9):699–706.
- , , , et al. Comparison of 8 vs 15 days of antibiotic therapy for ventilator‐associated pneumonia in adults: a randomized trial. JAMA. 2003;290(19):2588–2598.
- , , , et al. Infectious Diseases Society of America and the Society for Healthcare Epidemiology of America guidelines for developing an institutional program to enhance antimicrobial stewardship. Clin Infect Dis. 2007;44(2):159–177.
- , , , , . Use of procalcitonin (PCT) to guide discontinuation of antibiotic use in an unspecified sepsis is an antimicrobial stewardship program (ASP). Eur J Clin Microbiol Infect Dis. 2011;30(7):853–855.
- , , , et al. Effectiveness and safety of procalcitonin‐guided antibiotic therapy in lower respiratory tract infections in “real life.” Arch Intern Med. 2012;172(9):715–722.
- , , , et al. Effectiveness of a procalcitonin algorithm to guide antibiotic therapy in respiratory tract infections outside of study conditions: a post‐study survey. Eur J Clin Microbiol Infect Dis. 2012;29(3):269–277.
Many serum biomarkers have been identified in recent years with a wide range of potential applications, including diagnosis of local and systemic infections, differentiation of bacterial and fungal infections from viral syndromes or noninfectious conditions, prognostic stratification of patients, and enhanced management of antibiotic therapy. Currently, there are at least 178 serum biomarkers that have potential roles to guide antibiotic therapy, and among these, procalcitonin has been the most extensively studied biomarker.[1, 2]
Procalcitonin is the prohormone precursor of calcitonin that is expressed primarily in C cells of the thyroid gland. Conversion of procalcitonin to calcitonin is inhibited by various cytokines and bacterial endotoxins. Procalcitonin's primary diagnostic utility is thought to be in establishing the presence of bacterial infections, because serum procalcitonin levels rise and fall rapidly in bacterial infections.[3, 4, 5] In healthy individuals, procalcitonin levels are very low. In systemic infections, including sepsis, procalcitonin levels are generally greater than 0.5 to 2 ng/mL, but often reach levels 10 ng/mL, which correlates with severity of illness and a poor prognosis. In patients with respiratory tract infections, procalcitonin levels are less elevated, and a cutoff of 0.25 ng/mL seems to be most predictive of a bacterial respiratory tract infection requiring antibiotic therapy.[6, 7, 8] Procalcitonin levels decrease to <0.25 ng/mL as infection resolves, and a decline in procalcitonin level may guide decisions about discontinuation of antibiotic therapy.[5]
The purpose of this systematic review was to synthesize comparative studies examining the use of procalcitonin to guide antibiotic therapy in patients with suspected local or systemic infections in different patient populations. We are aware of 6 previously published systematic reviews evaluating the utility of procalcitonin guidance in the management of infections.[9, 10, 11, 12, 13, 14] Our systematic review included more studies and pooled patients into the most clinically similar groups compared to other systematic reviews.
METHODS
This review is based on a comparative effectiveness review prepared for the Agency for Healthcare Research and Quality's Effective Health Care Program.[15] A standard protocol consistent with the Methods Guide for Effectiveness and Comparative Effectiveness Reviews[16] was followed. A detailed description of the methods is available online (
Study Question
In selected populations of patients with suspected local or systemic infection, what are the effects of using procalcitonin measurement plus clinical criteria for infection to guide initiation, intensification, and/or discontinuation of antibiotic therapy when compared to clinical criteria for infection alone?
Search Strategy
MEDLINE and EMBASE were searched from January 1, 1990 through December 16, 2011, and the Cochrane Controlled Trials register was searched with no date restriction for randomized and nonrandomized comparative studies using the following search terms: procalcitonin AND chronic obstructive pulmonary disease; COPD; critical illness; critically ill; febrile neutropenia; ICU; intensive care; intensive care unit; postoperative complication(s); postoperative infection(s); postsurgical infection(s); sepsis; septic; surgical wound infection; systemic inflammatory response syndrome OR postoperative infection. In addition, a search for systematic reviews was conducted in MEDLINE, the Cochrane Database of Systematic Reviews, and Web sites of the National Institute for Clinical Excellence, the National Guideline Clearinghouse, and the Health Technology Assessment Programme. Gray literature, including databases with regulatory information, clinical trial registries, abstracts and conference papers, grants and federally funded research, and manufacturing information was searched from January 1, 2006 to June 28, 2011.
Study Selection
A single reviewer screened abstracts and selected studies looking at procalcitonin‐guided antibiotic therapy. Second and third reviewers were consulted to screen articles when needed. Studies were included if they fulfilled all of the following criteria: (1) randomized, controlled trial or nonrandomized comparative study; (2) adult and/or pediatric patients with known or suspected local or systemic infection, including critically ill patients with sepsis syndrome or ventilator‐associated pneumonia, adults with respiratory tract infections, neonates with sepsis, children with fever of unknown source, and postoperative patients at risk of infection; (3) interventions included initiation, intensification, and/or discontinuation of antibiotic therapy guided by procalcitonin plus clinical criteria; (4) primary outcomes included antibiotic usage (antibiotic prescription rate, total antibiotic exposure, duration of antibiotic therapy, and days without antibiotic therapy); and (5) secondary outcomes included morbidity (antibiotic adverse events, hospital and/or intensive care unit length of stay), mortality, and quality of life.
Studies with any of the following criteria were excluded: published in non‐English language, not reporting primary data from original research, not a randomized, controlled trial or nonrandomized comparative study, not reporting relevant outcomes.
Data Extraction and Quality Assessment
A single reviewer abstracted data and a second reviewer confirmed accuracy. Disagreements between reviewers were resolved by group discussion among the research team and final quality rating was assigned by consensus adjudication. Data elements were abstracted into the following categories: quality assessment, applicability and clinical diversity assessment, and outcome assessment. Quality of included studies was assessed using the US Preventive Services Task Force framework[17] by at least 2 independent reviewers. Three quality categories were used: good, fair, and poor.
Data Synthesis and Analysis
The decision to incorporate formal data synthesis in this review was made after completing the formal literature search, and the decision to pool studies was based on the specific number of studies with similar questions and outcomes. If a meta‐analysis could be performed, subgroup and sensitivity analyses were based on clinical similarity of available studies and reporting of mean and standard deviation. The pooling method involved inverse variance weighting and a random effects model.
The strength of evidence was graded using the Methods Guide,[16] a system based on the Grading of Recommendations Assessment, Development and Evaluation Working Group.[18] The following domains were addressed: risk of bias, consistency, directness, and precision. The overall strength of evidence was graded as high, moderate, low, or insufficient. The final strength of evidence grading was made by consensus adjudication among the authors.
RESULTS
Of the 2000 studies identified through the literature search, 1986 were excluded and 14 studies[19, 20, 21, 22, 23, 24, 25, 26, 27, 28, 29, 30, 31, 32] were included. Search of gray literature yielded 4 published studies.[33, 34, 35, 36] A total of 18 randomized, controlled trials comparing procalcitonin guidance to use of clinical criteria alone to manage antibiotic therapy in patients with infections were included. The PRISMA diagram (Figure 1) depicts the flow of search screening and study selection. We sought, but did not find, nonrandomized comparative studies of populations, comparisons, interventions, and outcomes that were not adequately studied in randomized, controlled trials.
Data were pooled into clinically similar groups that were reviewed separately: (1) adult intensive care unit (ICU) patients, including patients with ventilator‐associated pneumonia; (2) adult patients with respiratory tract infections; (3) neonates with suspected sepsis; (4) children between 1 to 36 months of age with fever of unknown source; and (5) postoperative patients at risk of infection. Tables summarizing study quality and outcome measures with strength of evidence are available online (
| Outcome | Author, Year | N | PCT‐Guided Therapya | Controla | Difference PCT‐CTRL (95% CI) | P Value |
|---|---|---|---|---|---|---|
| ||||||
| Critically ill adult patients: procalcitonin‐guided antibiotic discontinuation | ||||||
| ABT Duration, d | Hochreiter, 2009[22] | 110 | 5.9 | 7.9 | 2.0 (2.5 to 1.5) | <0.001 |
| Nobre, 2008[19] | 79 | 66 | 9.5 (ITT), 10 (PP) | 2.6 (5.5 to 0.3), 3.2 (1.1 to5.4) | 0.15, 0.003 | |
| Schroeder, 2009[20] | 27 | 6.6 | 8.3 | 1.7 (2.4 to 1.0) | <0.001 | |
| Stolz, 2009[21] | 101 | 10 (616)b | 15 (1023)b | 5 | 0.049 | |
| Bouadma, 2010[23] | 621 | 10.3 | 13.3 | 3.0 (4.20 to 1.80) | <0.0001 | |
| Days without ABTs, day 28 | Nobre, 2008[19] | 79 | 15.3, 17.4 | 13, 13.6 | 2.3 (5.9 to 1.8), 3.8 (0.1 to 7.5)c | 0.28, 0.04 |
| Stolz, 2009[21] | 101 | 13 (221)b | 9.5 (1.517)b | 3.5 | 0.049 | |
| Bouadma, 2010[23] | 621 | 14.3 | 11.6 | 2.7 (1.4 to 4.1) | <0.001 | |
| Total ABT exposured | Nobre, 2008[19] | 79 | 541 | 644 | 1.1e (0.9 to 1.3), 1.3e (1.1 to 1,5)c | 0.07, 0.0002 |
| 504 | 655 | |||||
| Stolz, 2009[21] | 101 | 1077 | 1341 | |||
| Bouadma, 2010[23]d | 621 | 653 | 812 | 159 (185 to 131) | <0.001 | |
| Critically ill adult patients: procalcitonin‐guided antibiotic intensification | ||||||
| ABT duration, days | Jensen, 2011[33] | 1200 | 6 (311)b | 4 (310)b | NR | NR |
| Days spent in ICU on 3 ABTs | Jensen, 2011[33] | 1200 | 3570/5447 (65.5%) | 2721/4717 (57.7%) | 7.9% (6.0 to 9.7) | 0.002 |
| Adult patients with respiratory tract infections | ||||||
| ABT duration, da | Schuetz, 2009[2][5] | 1359 | 5.7 | 8.7 | 3.0 | |
| Christ‐Crain, 2004[30] | 243 | 10.9 | 12.8 | 1.9 (3.1 to 0.7) | 0.002 | |
| Kristoffersen, 2009[26] | 210 | 5.1 | 6.8 | 1.7 | ||
| Briel, 2008[27] | 458 | 6.2 | 7.1 | 1.0 (1.7 to 0.4) | <0.05 | |
| Long, 20113[5] | 162 | 5 (36)f | 7 (59)f | 2.0 | <0.001 | |
| Burkhardt, 2010[34] | 550 | 7.8 | 7.7 | 0.1 (0.7 to 0.9) | 0.8 | |
| Christ‐Crain, 2006[29] | 302 | 5.8 | 12.9 | 7.1(8.4 to 5.8) | <0.0001 | |
| Antibiotic prescription rate, % | Schuetz, 2009[2][5] | 1359 | 506/671 (75.4%) | 603/688 (87.6%) | 12.2% (16.3 to 8.1) | <0.05 |
| Christ‐Crain, 2004[30] | 243 | 55/124 (44.4%) | 99/119 (83.2%) | 38.8% (49.9 to 27.8) | <0.0001 | |
| Kristoffersen, 2009[26] | 210 | 88/103 (85.4%) | 85/107 (79.4%) | 6.0% (4.3 to 16.2) | 0.25 | |
| Briel, 2008[27] | 458 | 58/232 (25.0%) | 219/226 (96.9%) | 72% (78 to 66) | <0.05 | |
| Long, 20113[5] | 162 | NR (84.4%) | NR (97.5%) | 13.1% | 0.004 | |
| Stolz, 2007[28] | 208 | 41/102 (40.2%) | 76/106 (71.7%) | 31.5% (44.3 to 18.7) | <0.0001 | |
| Christ‐Crain, 2006[29] | 302 | 128/151 (84.8%) | 149/151 (98.79%) | 13.9% (19.9 to 7.9) | <0.0001 | |
| Burkhardt, 2010[34] | 550 | 84/275 (30.5%) | 89/275 (32.4%) | 1.8% (9.6 to 5.9) | 0.701 | |
| Total ABT exposure | Stolz, 2007[28] | 208 | NR | NR | 31.5% (18.7 to 44.3) | <0.0001 |
| Long, 20113[5] | 162 | NR | NR | NR | ||
| Christ‐Crain, 2006[29] | 302 | 136g | 323g | |||
| Christ‐Crain, 2004[30] | 243 | 332g | 661g | |||
| Neonates with sepsis | ||||||
| ABTs 72 hours, % | Stocker, 2010[31] | All neonates (N=121) | 33/60 (55%) | 50/61 (82%) | 27.0 (42.8 to 11.1) | 0.002 |
| Infection proven/probably (N=21) | 9/9 (100%) | 12/12 (100%) | 0% (0 to 0) | NA | ||
| Infection possible (N=40) | 13/21 (61.9%) | 19/19 (100%) | 38.1 (58.9 to 17.3) | 0.003 | ||
| Infection unlikely (N=60) | 11/30 (36.7%) | 19/30 (63.3%) | 26.6 (51.1 to 2.3) | 0.038 | ||
| ABT duration, h | Stocker, 2010[31] | All neonates (N=121) | 79.1 | 101.5 | 22.4 | 0.012 |
| Infection proven/probably (N=21) | 177.8 | 170.8 | 7 | NSS | ||
| Infection possible (N=40) | 83.4 | 111.5 | 28.1 | <0.001 | ||
| Infection unlikely (N=60) | 46.5 | 67.4 | 20.9 | 0.001 | ||
| Children ages 136 months with fever of unknown source | ||||||
| Antibiotic prescription rate, % | Manzano, 2010[36] | All children (N=384) | 48/192 (25%) | 54/192 (28.0%) | 3.1 (12.0 to 5.7) | 0.49 |
| No SBI or neutropenia (N=312) | 14/158 (9%) | 16/154 (10%) | 1.5 (8.1 to 5.0) | 0.65 | ||
| Adult postoperative patients at risk of infection | ||||||
| ABT duration, d | Chromik, 2006[32] | All patients (N=20) | 5.5 | 9 | 3.5 | 0.27 |
| Outcome | Author, Year | N | PCTa | Controla | Difference, PCT‐CTRL (95% CI) | P Value |
|---|---|---|---|---|---|---|
| ||||||
| Critically ill adult patients: procalcitonin‐guided antibiotic discontinuation | ||||||
| ICU LOS, days | Hochreiter, 2009[22] | 110 | 15.5 | 17.7 | 2.2 | 0.046 |
| Nobre, 2008[19] | 79 | 4 | 7 | 4.6 (8.2 to 1.0) | 0.02 | |
| Schroeder, 2009[20] | 27 | 16.4 | 16.7 | 0.3 (5.6 to 5.0) | NSS | |
| Bouadma, 2010[23] | 621 | 15.9 | 14.4 | 1.5 (0.9 to 3.1) | 0.23 | |
| Hospital LOS, days | Nobre, 2008[19] | 79 | 17 | 23.5 | 2.5 (6.5 to 1.5) | 0.85 |
| Stolz, 2009[21] | 101 | 26 (721)b | 26 (16.822.3)b | 0 | 0.15 | |
| Bouadma, 2010[23] | 621 | 26.1 | 26.4 | 0.3 (3.2 to 2.7) | 0.87 | |
| ICU‐free days alive, 128 | Stolz, 2009[21] | 101 | 10 (018)b | 8.5 (018)c | 1.5 | 0.53 |
| SOFA day 28 | Bouadma, 2010[23] | 621 | 1.5 | 0.9 | 0.6 (0.0, 1.1) | 0.037 |
| SOFA score max | Schroeder, 2009[20] | 27 | 7.3 | 8.3 | 8.1 (4.1 to 1.7) | NSS |
| SAPS II score | Hochreiter, 2009[22] | 110 | 40.1 | 40.5 | 0.4 (6.4 to 5.6) | >0.05 |
| Days without MV | Stolz, 2009[21] | 101 | 21 (224)b | 19 (8.522.5)b | 2.0 | 0.46 |
| Bouadma, 2010[23] | 621 | 16.2 | 16.9 | 0.7 (2.4 to 1.1) | 0.47 | |
| Critically ill adult patients: procalcitonin‐guided antibiotic intensification | ||||||
| ICU LOS, da | Svoboda, 2007[24] | 72 | 16.1 | 19.4 | 3.3 (7.0 to 0.4) | 0.09 |
| Jensen, 2011[33] | 1200 | 6 (312)b | 5 (311)b | 1 | 0.004 | |
| SOFA scorea | Svoboda, 2007[24] | 72 | 7.9 | 9.3 | 1.4 (2.8 to 0.0) | 0.06 |
| Days on MVa | Svoboda, 2007[24] | 72 | 10.3 | 13.9 | 3.6 (7.6 to 0.4) | 0.08 |
| Jensen, 2011[33] | 1200 | 3569 (65.5%) | 2861 (60.7%) | 4.9% (3 to 6.7) | <0.0001 | |
| Percent days in ICU with GFR <60 | Jensen, 2011[33] | 1200 | 2796 (51.3%) | 2187 (46.4%) | 5.0 % (3.0 to 6.9) | <0.0001 |
| Adult patients with respiratory tract infections | ||||||
| Hospital LOS, da | Schuetz, 2009[2][5] | 1359 | 9.4 | 9.2 | 0.2 | |
| Christ‐Crain, 2004[30] | 224 | 10.78.9 | 11.210.6 | 0.5 (3.0 to 2.0) | 0.69 | |
| Kristoffersen, 2009[26] | 210 | 5.9 | 6.7 | 0.8 | 0.22 | |
| Stolz, 2007[28] | 208 | 9 (115)b | 10 (115)b | 1 | 0.96 | |
| Christ‐Crain, 2006[29] | 302 | 12.09.1 | 13.09.0 | 1 (3.0 to 1.0) | 0.34 | |
| ICU admission, % | Schuetz, 2009[2][5] | 1359 | 43/671 (6.4%) | 60/688 (8.7%) | 2.3% (5.2 to 0.4) | 0.12 |
| Christ‐Crain, 2004[30] | 224 | 5/124 (4.0%) | 6/119 (5.0%) | 1.0% (6.2 to 4.2) | 0.71 | |
| Kristoffersen, 2009[26] | 210 | 7/103 (6.8%) | 5/107 (4.7%) | 2.1% (4.2 to 8.4) | 0.51 | |
| Stolz, 2007[28] | 208 | 8/102 (7.8%) | 11/106 (10.4%) | 2.5% (10.3 to 5.3) | 0.53 | |
| Christ‐Crain, 2006[29] | 302 | 20/151 (13.2%) | 21/151 (13.94%) | 0.7% (8.4 to 7.1) | 0.87 | |
| Antibiotic adverse events | Schuetz, 2009[2][5]c | 1359 | 133/671 (19.8%) | 193/688 (28.1%) | 8.2% (12.7 to 3.7) | |
| Briel, 2008[27]d | 458 | 2.34.6 days | 3.66.1 days | 1.1 days (2.1 to 0.1) | <0.05 | |
| Burkhardt, 2010[34]e | 550 | 11 /59 (18.6%) | 16/101 (15.8%) | 2.8% (9.4 to 15.0) | 0.65 | |
| Restricted activity, df | Briel, 2008[27] | 458 | 8.73.9 | 8.63.9 | 0.2 (0.4 to 0.9) | >0.05 |
| Burkhardt, 2010[34] | 550 | 9.1 | 8.8 | 0.25 (0.52 to 1.03) | >0.05 | |
| Neonates with sepsis | ||||||
| Recurrence of infection | Stocker, 2010[31] | 121 | 32% | 39% | 7 | 0.45 |
| Children ages 136 months with fever of unknown source | ||||||
| Hospitalization rate | Manzano, 2010[36] | All children (N=384) | 50/192 (26%) | 48/192 (25%) | 1 (8 to 10) | 0.81 |
| No SBI or neutropenia (N=312) | 16/158 (10%) | 11/154 (7%) | 3 (3 to 10) | 0.34 | ||
| Adult postoperative patients at risk of infection | ||||||
| Hospital LOS, days | Chromik, 2006[32] | 20 | 18 | 30 | 12 | 0.057 |
| Local wound infection, % | Chromik, 2006[32] | 20 | 1/10 | 2/10 | 10 (41.0 to 21.0) | 0.53 |
| Systemic infection, % | Chromik, 2006[32] | 20 | 3/10 | 7/10 | 40.0 (80.2 to 0.2) | 0.07 |
| Sepsis/SIRS, % | Chromik, 2006[32] | 20 | 2/10 | 8/10 | 60.0 (95.1 to 24.9) | 0.007 |
| Mortality | Mortality | Difference | ||||
|---|---|---|---|---|---|---|
| Outcome | Author, Year | N | PCT‐Guided Therapy | Control | PCT‐CTRL (95% CI) | P Value |
| ||||||
| Critically ill adult patients: procalcitonin‐guided antibiotic discontinuation | ||||||
| 28‐day mortality | Nobre, 2008[19] | 79 | 8/39 (20.5%) | 8/40 (20.0%) | 0.5 (17.2 to 18.2), | 0.95 |
| 5/31 (16.1%) | 6/37 (16.2%) | 0.1 (17.7 to 17.5)a | 0.99 | |||
| Stolz, 2009[21] | 101 | 8/51 (15.7%) | 12/50 (24.0%) | 8.3 (23.8 to 7.2) | 0.29 | |
| Bouadma, 2010[23] | 621 | 65/307 (21.2%) | 64/314 (20.4%) | 0.8 (5.6 to 7.2) | 0.81 | |
| 60‐day mortality | Bouadma, 2010[23] | 621 | 92/307 (30.0%) | 82/314 (26.1%) | 3.9 (3.2 to 10.9) | 0.29 |
| In‐hospital mortality | Nobre, 2008[19] | 79 | 9/39 (23.1%) | 9/40 (22.5%) | 0.6 (17.9 to 19.1) | 0.95 |
| 6/31 (19.4%) | 7/37 (18.9%) | 0.4+ (18.3 to 19.2) | 0.96 | |||
| Stolz, 2009[21] | 101 | 10/51 (19.6%) | 14/50 (28.0%) | 8.4, (24.9 to 8.1) | 0.32 | |
| Hochreiter, 2009[22] | 110 | 15/57 (26.3%) | 14/53 (26.4%) | 0.1, (16.6 to 16.4) | 0.99 | |
| Schroeder, 2009[20] | 27 | 3/14 (21.4%) | 3/13 (23.1%) | 1.7, (33.1 to 29.8) | 0.92 | |
| Critically ill adult patients: procalcitonin‐guided antibiotic intensification | ||||||
| 28‐day mortality | Svoboda, 2007[24] | 72 | 10/38 (26.3%) | 13/34 (38.2%) | 11.9 (33.4 to 9.6) | 0.28 |
| 28‐day mortality | Jensen, 2011[33] | 1200 | 190/604 (31.5%) | 191/596 (32.0%) | 0.6 (4.7 to 5.9) | 0.83 |
| Adult patients with respiratory tract infections | ||||||
| 6‐month mortality | Stolz, 2007[28] | 208 | 5/102 (4.9%) | 9/106 (8.5%) | 3.6% (10.3 to 3.2%) | 0.30 |
| 6‐week mortality | Christ‐Crain, 2006[29] | 302 | 18/151 (11.9%) | 20/151 (13.2%) | 1.3% (8.8 to 6.2) | 0.73 |
| 28‐day mortality | Christ‐Crain, 2004[30] | 243 | 4/124(3.2%) | 4/119 (3.4%) | 0.1% (4.6 to 4.4) | 0.95 |
| Schuetz, 2009 (30‐day)[25] | 1359 | 34/671(5.1%) | 33/688(4.8%) | 0.3% (2.1 to 2.5) | 0.82 | |
| Briel, 2008[27] | 458 | 0/231(0%) | 1/224 (0.4%) | 0.4% (1.3 to 0.4) | 0.31 | |
| Burkhardt, 2010[34] | 550 | 0/275(0%) | 0/275 (0%) | 0 | ||
| Kristoffersen, 2009[26] | 210 | 2/103(1.9%) | 1/107 (0.9%) | 1.0% (2.2 to 4.2) | 0.54 | |
| Long, 20113[5] | 162 | 0/81 (0%) | 0/81 (0%) | 0 | ||
| Neonates with sepsis | ||||||
| Mortality (in‐hospital) | Stocker, 2010[31] | 121 | 0% | 0% | 0 (0 to 0) | NA |
| Children ages 136 months with fever of unknown source | ||||||
| Mortality | Manzano, 2010[36] | 384 | All children | 0% | 0% | 0 (0 to 0) |
| Adult postoperative patients at risk of infection | ||||||
| Mortality | Chromik, 2006[32] | 20 | 1/10 (10%) | 3/10 (30%) | 20 (54.0 to 14.0) | 0.07 |
Adult ICU Patients: Procalcitonin‐Guided Antibiotic Discontinuation
Five studies[19, 20, 21, 22, 23] (N=938) addressed procalcitonin‐guided discontinuation of antibiotic therapy in adult ICU patients. Four studies conducted superiority analyses for mortality with procalcitonin‐guided therapy, whereas 1 study conducted a noninferiority analysis. Absolute procalcitonin values for discontinuation of antibiotics ranged from 0.25 to 1 ng/mL. Physicians in control groups administered antibiotics according to their standard practice.
Antibiotic Usage
The absolute reduction in duration of antibiotic usage with procalcitonin guidance in these studies ranged from 1.7 to 5 days, and the relative reduction ranged from 21% to 38%. Meta‐analysis of antibiotic duration in adult ICU patients was performed (Figure 2A).
Morbidity
Procalcitonin‐guided antibiotic discontinuation did not increase morbidity, including ICU length of stay (LOS). Meta‐analysis of ICU LOS is displayed in Figure 2B. Limited data on adverse antibiotic events were reported (Table 2).
Mortality
There was no increase in mortality as a result of shorter duration of antibiotic therapy. Meta‐analysis of short‐term mortality (28‐day or in‐hospital mortality) showed a mortality difference of 0.43% favoring procalcitonin‐guided therapy, and a 95% confidence interval (CI) of 6% to 5% (Figure 2C).
Adult ICU Patients: Procalcitonin‐Guided Antibiotic Intensification
Two studies[24, 33] (N=1272) addressed procalcitonin‐guided intensification of antibiotic therapy in adult ICU patients. The Jensen et al. study[33] was a large (N=1200), high‐quality study that used a detailed algorithm for broadening antibiotic therapy in patients with elevated procalcitonin. The Jensen et al. study also educated physicians about empiric therapy and intensification of antibiotic therapy. A second study[24] was too small (N=72) and lacked sufficient details to be informative.
Antibiotic Usage
The Jensen et al. study found a 2‐day increase, or 50% relative increase, in the duration of antibiotic therapy and a 7.9% absolute increase (P=0.002) in the number of days on 3 antibiotics with procalcitonin‐guided intensification.
Morbidity
The Jensen et al. study showed a significant 1‐day increase in ICU LOS (P=0.004) and a significant increase in organ dysfunction. Specifically, patients had a highly statistically significant 5% increase in days on mechanical ventilation (P<0.0001) and 5% increase in days with abnormal renal function (P<0.0001).
Mortality
The Jensen et al. study was a superiority trial powered to test a 7.5% decrease in 28‐day mortality, but no significant difference in mortality was observed with procalcitonin‐guided intensification (31.5% vs 32.0, P=0.83).
Adult Patients With Respiratory Tract Infections
Eight studies[25, 26, 27, 28, 29, 30, 34, 35] (N=3492) addressed initiation and/or discontinuation of antibiotics in adult patients with acute upper and lower respiratory tract infections, including community‐acquired pneumonia, acute exacerbation of chronic obstructive pulmonary disease, and acute bronchitis. Settings included primary care clinics, emergency departments, and hospital wards. Physicians in control groups administered antibiotics according to their own standard practices and/or evidence‐based guidelines. All studies encouraged initiation of antibiotics with procalcitonin levels >0.25 ng/mL, and 4 studies strongly encouraged antibiotics with procalcitonin levels >0.5 ng/mL.
Antibiotic Usage
Procalcitonin guidance reduced antibiotic duration, antibiotic prescription rate, and total antibiotic exposure. Absolute reduction in antibiotic duration ranged from 1 to 7 days, and relative reductions ranged from 13% to 55%. Four of the 8 studies reported sufficient details to be pooled into a meta‐analysis (Figure 3A) with a statistically significant pooled mean difference of 2.35 days favoring procalcitonin (95% CI: 4.38 to 0.33). Procalcitonin guidance also reduced antibiotic prescription rate with absolute reductions ranging from 2% to 7% and relative reductions ranging from 1.8% to 72%. Meta‐analysis of prescription rates from 8 studies (Figure 3B) yielded a statistically significant pooled risk difference of 22% (95% CI: 41% to 4%). Total antibiotic exposure was consistently reduced in the 4 studies reporting this outcome.
Morbidity
Procalcitonin guidance did not increase hospital LOS or ICU admission rates. Meta‐analysis of ICU admission rates from 5 studies (Figure 3C) produced a risk difference of 1%, with a narrow 95% CI (4% to 1%). There was insufficient evidence to judge the effect on days of restricted activity or antibiotic adverse events.
Mortality
Procalcitonin guidance did not increase mortality, and meta‐analysis of 4 studies (Figure 3D) produced a risk difference of 0.3% with a narrow 95% CI (1% to 2%), with no statistical heterogeneity (I2=0%).
Neonates With Sepsis
One study[31] (N=121) evaluated procalcitonin‐guided antibiotic therapy for suspected neonatal sepsis. Neonatal sepsis was suspected on the basis of risk factors and clinical signs and symptoms. Antibiotic initiation or discontinuation was based on a procalcitonin nomogram. Antibiotic therapy in the control group was based on the physician's assessment. The quality of this study was rated good, and strength of evidence was rated moderate for antibiotic usage and insufficient for morbidity and mortality outcomes.
Antibiotic Usage
Duration of antibiotic therapy was decreased by 22.4 hours (P=0.012), a 24% relative reduction, and the proportion of neonates on antibiotics 72 hours was reduced by 27% (P=0.002). The largest reduction in antibiotic duration was seen in the 80% to 85% of neonates who were categorized as having possible or infection or unlikely to have infection.
Morbidity
A statistically insignificant 7% reduction in rate of recurrence of infection was seen with procalcitonin‐guided antibiotic therapy (P=0.45).
Mortality
No in‐hospital deaths occurred in either the procalcitonin or control group.
Children Ages 1 to 36 Months With Fever of Unknown Source
One study[36] (N=384) evaluated procalcitonin‐guided antibiotic therapy for fever of unknown source in children 1 to 36 months of age, but the overall strength of evidence was judged insufficient to draw conclusions.
Antibiotic Usage
A statistically insignificant reduction of 3.1% in antibiotic prescription rate was seen with procalcitonin‐guided antibiotic therapy (P=0.49).
Morbidity
Rate of hospitalization was relatively low, and no significant difference was seen between procalcitonin and control groups.
Mortality
In‐hospital mortality was reported as 0% in both arms.
Adult Postoperative Patients at Risk of Infection
One study[32] (N =250) monitored procalcitonin in consecutive patients after colorectal surgery to identify patients at risk of infection who might benefit from prophylactic antibiotic therapy. Two hundred thirty patients had normal procalcitonin levels. Twenty patients with elevated procalcitonin levels (>1.5 ng/mL) were randomized to receive prophylactic antibiotic therapy with ceftriaxone or no antibiotics. The strength of evidence was judged insufficient to draw conclusions from this study.
Antibiotic Usage
Duration of antibiotic therapy was reduced by 3.5% but was not statistically insignificant (P=0.27).
Morbidity
Procalcitonin guidance reduced the incidence of sepsis/systemic inflammatory response syndrome by 60% (p=0.007). The incidences of local and systemic infection were reduced with procalcitonin guidance but were not statistically significant (10%, P=0.53; and 40%, P=0.07, respectively).
Mortality
Mortality was 20% higher in the control arm but was not statistically significant (P=0.07).
DISCUSSION
Summary of the Main Findings
Diagnosis of sepsis or other serious infections in critically ill patients is challenging because clinical criteria for diagnosis overlap with noninfectious causes of the systemic inflammatory response syndrome. Initiation of antibiotic therapy for presumed sepsis is necessary while diagnostic evaluation is ongoing, because delaying antibiotic therapy is associated with increased mortality.[37, 38, 39] Our review found that procalcitonin guidance significantly reduced antibiotic usage in adult ICU patients by reducing the duration of antibiotic therapy, rather than decreasing the initiation of antibiotics, without increasing morbidity or mortality.
In contrast, the use of procalcitonin as an indicator of need for intensification of antibiotic therapy in adult ICU patients should be discouraged because this approach was associated with increased morbidity. The large, well‐designed study by Jensen[33] showed that antibiotic intensification in response to elevated procalcitonin measurement was associated with increased morbidity: a longer ICU LOS, an increase in days on mechanical ventilation, and an increase in days with abnormal renal function. The authors concluded that the increased morbidity could only be explained by clinical harms of increased exposure to broad‐spectrum antibiotics.
Clinical and microbiological evaluations are neither sensitive nor specific for differentiating bacterial from viral respiratory tract infections. Procalcitonin can guide initiation of antibiotic therapy in adults with suspected bacterial respiratory tract infection. Our review showed that procalcitonin guidance significantly reduced antibiotic usage with respect to antibiotic prescription rate, duration of antibiotic therapy, and total exposure to antibiotic therapy in adult patients with respiratory tract infections.
The role of procalcitonin‐guided therapy in other populations is less clear. One study in postoperative colorectal surgery patients reported that elevated procalcitonin levels may identify patients at risk for infection who benefit from prophylactic antibiotic therapy.[32] Patients with elevated procalcitonin levels who received prophylactic antibiotic therapy had a significant decrease in the incidence and severity of systemic infections, whereas patients with normal procalcitonin levels did not require any additional surgical or medical therapy. Although these findings are promising, more data in postoperative patients are needed.
The utility of procalcitonin in pediatric settings is a significant gap in the present literature. One study[31] in neonates with suspected sepsis showed a significant decrease in the proportion of neonates started on empiric antibiotic therapy and a decrease in the duration of antibiotic therapy with procalcitonin guidance. However, there was insufficient evidence that procalcitonin guidance does not increase morbidity or mortality.
Comparison to Other Systematic Reviews
Six systematic reviews of procalcitonin guidance in the management of patients with infections were published prior to our review.[9, 10, 11, 12, 13, 14] Our systematic review differs from past reviews in the number of studies included and the pooling of studies according to patient population, type and severity of infection, and different uses of procalcitonin measurements, either for initiation, discontinuation, or intensification of antibiotic therapy. Previous systematic reviews included 7 to 14 studies, whereas ours included 18 randomized, controlled trials. One previous review[13] included and pooled the Jensen et al. study[33] with other studies of adult ICU patients. We evaluated the Jensen et al. study separately because it uniquely looked at procalcitonin‐guided antibiotic intensification in adult ICU patients, in contrast to other studies that looked at procalcitonin‐guided antibiotic discontinuation. We addressed pediatric populations separately from adult patients, and recognizing that there are distinct groups within the pediatric population, we separately grouped neonates and children ages 1 to 36 months. Despite these differences, our review and other systematic reviews, we came to similar conclusions: procalcitonin‐guided antibiotic decision making compared to clinical criteria‐guided antibiotic decision making reduces antibiotic usage without increasing morbidity or mortality.
Limitations
An important limitation of this review was the uncertainty about the noninferiority margin for morbidity and mortality in adult ICU patients. Only the Bouadma et al. study[23] did a power analysis and predefined a margin for noninferiority for 28‐ and 60‐day mortality. Meta‐analysis of all 5 ICU studies showed a pooled point estimate of 0.43% in mortality and a 95% CI of 6% to 5% for difference in mortality between procalcitonin‐guided therapy versus standard care. A 10% noninferiority margin for mortality has been recommended by the Infectious Diseases Society of America and American College of Chest Physicians, but there is concern that a 10% margin for mortality may be too high. Presently, 2 large trials are in progress that may yield more precise estimates of mortality in the future.
Differences in reporting of total antibiotic exposure and morbidity outcomes limited our ability to pool data. Total antibiotic exposure is conventionally reported as mean days per 1000 days of follow‐up, but some studies only reported relative or absolute differences. Likewise, morbidity was reported with different severity of illness scales, including Sepsis‐Related Organ Failure Assessment, Simplified Acute Physiology (SAP) II, SAP III, and Acute Physiology and Chronic Health Evaluation II, which limited comparisons across studies.
Research Gaps
We identified gaps in the available literature and opportunities for future research. First, the safety and efficacy of procalcitonin‐guided antibiotic therapy needs to be studied in patient populations excluded from current randomized controlled studies, such as immunocompromised patients and pregnant women. Patients who are immunocompromised or have chronic conditions, such as cystic fibrosis, account for a significant percentage of community‐acquired respiratory tract infections and are often treated empirically.[29, 30] Second, standardized reporting of antibiotic adverse events and emergence of antibiotic resistance is needed. Strategies to reduce antibiotic usage have been associated with reductions in antibiotic adverse events, such as Clostridium difficile colitis and superinfection with multi‐drug resistant Gram‐negative bacteria.[37, 40, 41] Few studies in our review reported allergic reactions or adverse events of antibiotic therapy, [25, 27, 34] and only 1 reported antibiotic resistance.[19] Third, procalcitonin guidance should be compared to other strategies to reduce antibiotic usage, such as structured implementation of practice guidelines and antibiotic stewardship programs.[42] One single‐arm study describes how procalcitonin can be used in antibiotic stewardship programs to decrease the duration of antibiotic therapy,[43] but additional studies are needed. Finally, generalizing results from those studies that were conducted primarily in Europe would depend on similar use of and adherence to study‐based algorithms. Newer observational studies have demonstrated reduced antibiotic usage with implementation of procalcitonin algorithms in real‐life settings in Europe, but algorithm adherence was significantly less in the United States.[44, 45]
In summary, our systematic review found that procalcitonin‐guided antibiotic therapy can significantly reduce antibiotic usage in adult ICU patients without affecting morbidity or mortality. Procalcitonin should not be used to guide intensification of antibiotic therapy in adult ICU patients because this approach may increase morbidity. In adults with respiratory infections, procalcitonin guidance can significantly reduce antibiotic usage without adversely affecting morbidity or mortality. There is insufficient evidence to recommend procalcitonin‐guided antibiotic therapy in neonates with sepsis, children with fever of unknown source, or postoperative patients at risk for infection.
Acknowledgments
Disclosures: This project was funded under contract HHSA 2902007‐10058 from the Agency for Healthcare Research and Quality (AHRQ), US Department of Health and Human Services. The authors of this article are responsible for its content, including any clinical treatment recommendations. No statement in this article should be construed as an official position of AHRQ or of the US Department of Health and Human Services. There are no conflicts of interest reported by any of the authors.
- , . Sepsis biomarkers: a review. Crit Care. 2010;14(1):R15.
- , . Biomarkers of sepsis. Crit Care Med. 2009;37(7):2290–2298.
- , , . Kinetics of procalcitonin in iatrogenic sepsis. Intensive Care Med. 1998;24(8):888–889.
- , , , et al. Procalcitonin increase after endotoxin injection in normal subjects. J Clin Endocrinol Metab. 1994;79(6):1605–1608.
- , , , et al. Procalcitonin kinetics as a prognostic marker of ventilator‐associated pneumonia. Am J Respir Crit Care Med. 2005;171(1):48–53.
- , , , , . Serum procalcitonin and C‐reactive protein levels as markers of bacterial infection: a systematic review and meta‐analysis. Clin Infect Dis. 2004;39(2):206–217.
- , . Biomarkers in respiratory tract infections: diagnostic guides to antibiotic prescription, prognostic markers and mediators. Eur Respir J. 2007;30(3):556–573.
- , , , et al. Reliability of procalcitonin concentrations for the diagnosis of sepsis in critically ill neonates. Clin Infect Dis. 1998;26(3):664–672.
- , , , , . Effect of procalcitonin‐guided treatment in patients with infections: a systematic review and meta‐analysis. Infection. 2009;37(6):497–507.
- , . Procalcitonin to guide duration of antimicrobial therapy in intensive care units: a systematic review. Clin Infect Dis. 2011;53(4):379–387.
- , , , , . Procalcitonin‐guided algorithms of antibiotic therapy in the intensive care unit: a systematic review and meta‐analysis of randomized controlled trials. Crit Care Med. 2010;38(11):2229–2241.
- , , , . Procalcitonin algorithms for antibiotic therapy decisions: a systematic review of randomized controlled trials and recommendations for clinical algorithms. Arch Intern Med. 2011;171(15):1322–1331.
- , , , , , . An ESCIM systematic review and meta‐analysis of procalcitonin‐guided antibiotic therapy algorithms in adult critically ill patients. Intensive Care Med. 2012;38:940–949.
- , , , et al. Procalcitonin to initiate or discontinue antibiotics in acute respiratory tract infections. Cochrane Database Syst Rev 2012;(9):CD007498.
- , , , , , . Prepared by the Blue Cross and Blue Shield Association Technology Evaluation Center Evidence‐based Practice Center under contract no. 290–2007‐10058‐I. Procalcitonin‐guided antibiotic therapy. Comparative effectiveness review No. 78. AHRQ publication no. 12(13)‐EHC124‐EF. Rockville, MD: Agency for Healthcare Research and Quality. Available at: www.effectivehealthcare.ahrq.gov/reports/final.cfm. Published Accessed October 2012.
- Methods Guide for Effectiveness and Comparative Effectiveness Reviews. AHRQ publication no. 10(11)‐EHC063‐EF. Rockville, MD: Agency for Healthcare Research and Quality; 2011.
- , , , et al. Current methods of the US Preventive Services Task Force: a review of the process. Am J Prev Med. 2001;20(3 suppl):21–35.
- , , , et al. AHRQ series paper 5: grading the strength of a body of evidence when comparing medical interventions—agency for healthcare research and quality and the effective health‐care program. J Clin Epidemiol. 2010;63(5):513–523.
- , , , , . Use of procalcitonin to shorten antibiotic treatment duration in septic patients: a randomized trial. Am J Respir Crit Care Med. 2008;177(5):498–505.
- , , , et al. Procalcitonin (PCT)‐guided algorithm reduces length of antibiotic treatment in surgical intensive care patients with severe sepsis: results of a prospective randomized study. Langenbecks Arch Surg. 2009;394(2):221–226.
- , , , et al. Procalcitonin for reduced antibiotic exposure in ventilator‐associated pneumonia: a randomised study. Eur Respir J. 2009;34(6):1364–1375.
- , , , et al. Procalcitonin to guide duration of antibiotic therapy in intensive care patients: a randomized prospective controlled trial. Crit Care. 2009;13(3):R83.
- , , , et al. Use of procalcitonin to reduce patients' exposure to antibiotics in intensive care units (PRORATA trial): a multicentre randomised controlled trial. Lancet. 2010;375(9713):463–474.
- , , , , . Can procalcitonin help us in timing of re‐intervention in septic patients after multiple trauma or major surgery? Hepatogastroenterology. 2007;54(74):359–363.
- , , , et al. Effect of procalcitonin‐based guidelines vs. standard guidelines on antibiotic use in lower respiratory tract infections: the ProHOSP randomized controlled trial. JAMA. 2009;302(10):1059–1066.
- , , , et al. Antibiotic treatment interruption of suspected lower respiratory tract infections based on a single procalcitonin measurement at hospital admission—a randomized trial. Clin Microbiol Infect. 2009;15(5):481–487.
- , , , et al. Procalcitonin‐guided antibiotic use vs a standard approach for acute respiratory tract infections in primary care. Arch Intern Med. 2008;168(18):2000–2007; discussion 2007–2008.
- , , , et al. Antibiotic treatment of exacerbations of COPD: a randomized, controlled trial comparing procalcitonin‐guidance with standard therapy. Chest. 2007;131(1):9–19.
- , , , et al. Procalcitonin guidance of antibiotic therapy in community‐acquired pneumonia: a randomized trial. Am J Respir Crit Care Med. 2006;174(1):84–93.
- , , , et al. Effect of procalcitonin‐guided treatment on antibiotic use and outcome in lower respiratory tract infections: cluster‐randomised, single‐blinded intervention trial. Lancet. 2004;363(9409):600–607.
- , , , , . Use of procalcitonin‐guided decision‐making to shorten antibiotic therapy in suspected neonatal early‐onset sepsis: prospective randomized intervention trial. Neonatology. 2010;97(2):165–174.
- , , , , , . Pre‐emptive antibiotic treatment vs “standard” treatment in patients with elevated serum procalcitonin levels after elective colorectal surgery: a prospective randomised pilot study. Langenbecks Arch Surg. 2006;391(3):187–194.
- , , , et al. Procalcitonin‐guided interventions against infections to increase early appropriate antibiotics and improve survival in the intensive care unit: a randomized trial. Crit Care Med. 2011;39(9):2048–2058.
- , , , et al. Procalcitonin guidance and reduction of antibiotic use in acute respiratory tract infection. Eur Respir J. 2010;36(3):601–607.
- , , , , , . Procalcitonin guidance for reduction of antibiotic use in low‐risk outpatients with community‐acquired pneumonia. Respirology. 2011;16(5):819–824.
- , , , , , . Impact of procalcitonin on the management of children aged 1 to 36 months presenting with fever without source: a randomized controlled trial. Am J Emerg Med. 2010;28(6):647–653.
- , , , , , . Experience with a clinical guideline for the treatment of ventilator‐associated pneumonia. Crit Care Med. 2001;29(6):1109–1115.
- , , , et al. Diagnostic value of procalcitonin, interleukin‐6, and interleukin‐8 in critically ill patients admitted with suspected sepsis. Am J Respir Crit Care Med. 2001;164(3):396–402.
- , , , . Inadequate antimicrobial treatment of infections: a risk factor for hospital mortality among critically ill patients. Chest. 1999;115(2):462–474.
- , , , , . Favorable impact of a multidisciplinary antibiotic management program conducted during 7 years. Infect Control Hosp Epidemiol. 2003;24(9):699–706.
- , , , et al. Comparison of 8 vs 15 days of antibiotic therapy for ventilator‐associated pneumonia in adults: a randomized trial. JAMA. 2003;290(19):2588–2598.
- , , , et al. Infectious Diseases Society of America and the Society for Healthcare Epidemiology of America guidelines for developing an institutional program to enhance antimicrobial stewardship. Clin Infect Dis. 2007;44(2):159–177.
- , , , , . Use of procalcitonin (PCT) to guide discontinuation of antibiotic use in an unspecified sepsis is an antimicrobial stewardship program (ASP). Eur J Clin Microbiol Infect Dis. 2011;30(7):853–855.
- , , , et al. Effectiveness and safety of procalcitonin‐guided antibiotic therapy in lower respiratory tract infections in “real life.” Arch Intern Med. 2012;172(9):715–722.
- , , , et al. Effectiveness of a procalcitonin algorithm to guide antibiotic therapy in respiratory tract infections outside of study conditions: a post‐study survey. Eur J Clin Microbiol Infect Dis. 2012;29(3):269–277.
South American Hospitalist Conference Draws Record Attendance


A record number of hospitalists attended the combined biannual conference of the Chilean Society of Hospitalists and the Pan American Society of Hospitalists (PASHA) July 19-20 in Santiago, Chile. The meeting sold out with more than 250 attendees, and the energy of the South American hospitalist movement could be felt inside as hospitalists from across the Americas packed into the conference center.
It was the third such combined meeting, and hospitalists from Argentina, Colombia, the United States, and all parts of Chile were present. The first national meeting of hospitalists in Chile was held in 2008, and meetings have occurred every other year since 2008. PASHA was established in 2010 to unite hospitalists in South America and build collaborations with hospitalists in North America. PASHA’s past meetings were held in Brazil and Argentina, and organizers plan to continue it annually.
Hospitalists and subspecialists gathered to update their clinical knowledge and share ideas on patient safety, quality improvement (QI), and transitions of care.
“All of our countries have different challenges, but hospitalists everywhere are trying to do the same thing—provide quality healthcare as efficiently as possible. This central goal of hospitalists allows us to share ideas and learn from each other,” said Andres Aizman, MD, director of the division of hospital medicine at Pontificia Universidad Católica de Chile in Santiago.
Lectures were translated into multiple languages, including English, to engage not only local physicians, but also those from abroad.
“This has been an incredible experience,” said Dr. Eddie Greene, a nephrologist from the Mayo Clinic in Rochester, Minn., who presented a lecture on hypertensive crises. “Getting so many talented people from different backgrounds in the same place exchanging ideas on diverse topics has been an amazing experience. This is something special, and I hope to see it continue to grow.”
Two internists at Pontificia Universidad Católica de Chile founded its first HM division in 2004. The division has grown to include nine physicians, and there is a second, five-physician group of hospitalists at Universidad de Chile, a neighboring teaching hospital. The actual number of practicing hospitalists in Chile is hard to estimate because there are many hospital-based internists that have yet to be recognized as hospitalists; however, the most active academic hospitalists in the Chilean Society of Hospitalists are at the two universities.

One of the highlights of this year’s conference was a workshop on bedside applications of portable ultrasound for hospitalists. Lectures on procedural and diagnostic applications of portable ultrasound were presented to the general assembly, and a hands-on workshop with limited seating was sold out.
The workshop included brief lectures, simulation-based training, and scanning of live models.
“This meeting has enlightened me on so many topics and tools that I can easily use in my hospital,” said Ofelia Leiva, MD, a hospitalist from Curico, a city of 250,000 in southern Chile. “There are so many ways we can use ultrasound in the hospital. I’m grateful that I was able to attend.”
Nilam Soni, MD, of the University of Texas Health Science Center at San Antonio, spearheaded the ultrasound workshop in collaboration with Dr. Ricardo Franco from John H. Stroger Hospital in Chicago and Dr. Carolina Candotti from Penn State Hershey Medical Center.
Faculty from the Mayo Clinic, including Drs. Jamie Newman, Fernando Rivera, John Park, and Eddie Greene, attended the meeting for a second consecutive time. Their contributions made the event even more attractive to local hospitalists.
—Ofelia Leiva, hospitalist, Curico, Chile
Although HM continues to grow in South America, barriers still exist. Each country has a different healthcare system, and the economic and political forces that drive these systems affect hospitalists and their patients. Certain metrics that are often used to gauge hospitalists’ impact in North America, such as length of stay, are less meaningful in Chile and other countries. Additionally, hospitalists’ ability to participate in conferences and exchange ideas is limited by distance and circumstance; the average hospitalist in Chile earns the equivalent of about $70,000 a year. Lastly, many hospitalists in South America aspire to develop research programs, but obtaining research training is challenging. Such opportunities are limited in South America, and physicians often encounter cost and immigration issues when they seek training abroad.
Despite the challenges, the enthusiasm to advance HM in South America and build international collaborations continues to grow. Hospitalists from different institutions in the U.S. have returned every year to participate in the conference. The opportunity to meet hospitalists from different countries, exchange ideas, and be part of the hospitalist movement abroad draws people back. The energy of the hospitalist movement is still alive.
Dr. Abbott and Dr. Rodriguez are adjunct professors and Dr. Aizman is an assistant professor in the department of internal medicine at Pontificia Universidad Católica de Chile School of Medicine in Santiago; Dr. Newman is an assistant professor in the division of hospital medicine at Mayo Clinic in Rochester, Minn.; and Dr. Soni is an assistant professor of medicine in the division of hospital medicine at the University of Texas Health Science Center at San Antonio.
A record number of hospitalists attended the combined biannual conference of the Chilean Society of Hospitalists and the Pan American Society of Hospitalists (PASHA) July 19-20 in Santiago, Chile. The meeting sold out with more than 250 attendees, and the energy of the South American hospitalist movement could be felt inside as hospitalists from across the Americas packed into the conference center.
It was the third such combined meeting, and hospitalists from Argentina, Colombia, the United States, and all parts of Chile were present. The first national meeting of hospitalists in Chile was held in 2008, and meetings have occurred every other year since 2008. PASHA was established in 2010 to unite hospitalists in South America and build collaborations with hospitalists in North America. PASHA’s past meetings were held in Brazil and Argentina, and organizers plan to continue it annually.
Hospitalists and subspecialists gathered to update their clinical knowledge and share ideas on patient safety, quality improvement (QI), and transitions of care.
“All of our countries have different challenges, but hospitalists everywhere are trying to do the same thing—provide quality healthcare as efficiently as possible. This central goal of hospitalists allows us to share ideas and learn from each other,” said Andres Aizman, MD, director of the division of hospital medicine at Pontificia Universidad Católica de Chile in Santiago.
Lectures were translated into multiple languages, including English, to engage not only local physicians, but also those from abroad.
“This has been an incredible experience,” said Dr. Eddie Greene, a nephrologist from the Mayo Clinic in Rochester, Minn., who presented a lecture on hypertensive crises. “Getting so many talented people from different backgrounds in the same place exchanging ideas on diverse topics has been an amazing experience. This is something special, and I hope to see it continue to grow.”
Two internists at Pontificia Universidad Católica de Chile founded its first HM division in 2004. The division has grown to include nine physicians, and there is a second, five-physician group of hospitalists at Universidad de Chile, a neighboring teaching hospital. The actual number of practicing hospitalists in Chile is hard to estimate because there are many hospital-based internists that have yet to be recognized as hospitalists; however, the most active academic hospitalists in the Chilean Society of Hospitalists are at the two universities.
One of the highlights of this year’s conference was a workshop on bedside applications of portable ultrasound for hospitalists. Lectures on procedural and diagnostic applications of portable ultrasound were presented to the general assembly, and a hands-on workshop with limited seating was sold out.
The workshop included brief lectures, simulation-based training, and scanning of live models.
“This meeting has enlightened me on so many topics and tools that I can easily use in my hospital,” said Ofelia Leiva, MD, a hospitalist from Curico, a city of 250,000 in southern Chile. “There are so many ways we can use ultrasound in the hospital. I’m grateful that I was able to attend.”
Nilam Soni, MD, of the University of Texas Health Science Center at San Antonio, spearheaded the ultrasound workshop in collaboration with Dr. Ricardo Franco from John H. Stroger Hospital in Chicago and Dr. Carolina Candotti from Penn State Hershey Medical Center.
Faculty from the Mayo Clinic, including Drs. Jamie Newman, Fernando Rivera, John Park, and Eddie Greene, attended the meeting for a second consecutive time. Their contributions made the event even more attractive to local hospitalists.
—Ofelia Leiva, hospitalist, Curico, Chile
Although HM continues to grow in South America, barriers still exist. Each country has a different healthcare system, and the economic and political forces that drive these systems affect hospitalists and their patients. Certain metrics that are often used to gauge hospitalists’ impact in North America, such as length of stay, are less meaningful in Chile and other countries. Additionally, hospitalists’ ability to participate in conferences and exchange ideas is limited by distance and circumstance; the average hospitalist in Chile earns the equivalent of about $70,000 a year. Lastly, many hospitalists in South America aspire to develop research programs, but obtaining research training is challenging. Such opportunities are limited in South America, and physicians often encounter cost and immigration issues when they seek training abroad.
Despite the challenges, the enthusiasm to advance HM in South America and build international collaborations continues to grow. Hospitalists from different institutions in the U.S. have returned every year to participate in the conference. The opportunity to meet hospitalists from different countries, exchange ideas, and be part of the hospitalist movement abroad draws people back. The energy of the hospitalist movement is still alive.
Dr. Abbott and Dr. Rodriguez are adjunct professors and Dr. Aizman is an assistant professor in the department of internal medicine at Pontificia Universidad Católica de Chile School of Medicine in Santiago; Dr. Newman is an assistant professor in the division of hospital medicine at Mayo Clinic in Rochester, Minn.; and Dr. Soni is an assistant professor of medicine in the division of hospital medicine at the University of Texas Health Science Center at San Antonio.
ITL: Physician Reviews of HM-Relevant Research
In This Edition
Literature At A Glance
A guide to this month’s studies
- Initial trophic feedings effective for patients with acute lung injury
- IM vs. IV benzodiazepines in status epilepticus
- CDI risk following antibiotic cessation
- Acid suppression associated with increased complications in CDI patients
- Perioperative statins and cardiac events in surgical patients
- Enoxaparin vs. unfractionated heparin during PCI
- Optimal serum potassium levels for AMI patients
- PPIs superior to H2-blockers for lowering UGI bleeding following ACS and STEMI
Initial Lower-Volume Enteral Feeding Better Tolerated, but Has No Mortality Benefit
Clinical question: In mechanically ventilated patients with acute lung injury, do initial lower-volume enteral feedings (trophic feedings) improve clinical outcomes when compared with full enteral feedings?
Background: Malnutrition in critically ill patients is associated with poor outcomes, but conflicting data exist regarding the best timing, amount, and formulation of enteral nutrition to initiate. Initiation of lower-volume enteral feeding with periodic assessment of gastric residual volume is common practice, but the effects of this practice are unknown.
Study design: Multicenter randomized controlled open-label study.
Setting: Forty-four hospitals in the National Heart, Lung, and Blood Institute (NHLBI) Acute Respiratory Distress Syndrome (ARDS) Clinical Trials Network.
Synopsis: One thousand patients with acute lung injury receiving mechanical ventilation for longer than 72 hours were randomized using a Web-based system to receive either trophic or full enteric feedings for the first six days of mechanical ventilation. After the sixth day, a full enteric feeding protocol was used in all patients. All analyses were by intention-to-treat.
There was no significant difference between the trophic and full enteral feeding groups with regard to the primary outcome of ventilator-free days through Day 28 (14.9% vs. 15.0%, P=0.89). There were also no significant differences between groups in secondary outcomes, which included 60-day mortality, ICU-free days, organ-failure-free days, or the incidence of new infections. However, gastrointestinal intolerances occurred less often in the trophic feeding group, and these patients received fewer anti-diarrheal and prokinetic agents. The full feeding group gained 2.1 liters of fluid by Day 7, but this fluid gain did not cause significant differences in measures of circulatory or pulmonary physiology.
Limitations include open-label study design and inclusion of only critically ill adult medical patients with acute lung injury.
Bottom line: Initial lower-volume tube feedings in mechanically ventilated patients with acute lung injury did not improve clinical outcomes compared with full enteral feedings, but they were associated with fewer instances of gastrointestinal intolerance.
Citation: National Heart, Lung, and Blood Institute Acute Respiratory Distress Syndrome (ARDS) Clinical Trials Network. Initial trophic vs full enteral feeding in patients with acute lung injury: the EDEN randomized trial. JAMA. 2012;307:795-803.
Intramuscular Benzodiazepines as Good as IV Benzodiazepines in Status Epilepticus
Clinical question: Is intramuscular (IM) midazolam noninferior to intravenous lorazepam in patients in status epilepticus?
Background: Studies have shown that IV benzodiazepines, particularly lorazepam, are effective for patients in status epilepticus. Studies have not evaluated IM benzodiazepines. However, many emergency medical service (EMS) agencies use IM midazolam because IM administration is easier than IV administration, and midazolam has a longer nonrefrigerated shelf life than lorazepam does.
Study design: Randomized, double-blinded clinical trial.
Setting: Thirty-three EMS agencies across the United States.
Synopsis: Based on the 893 adults and children in status epilepticus included in this double-blind study, the researchers found IM midazolam to be noninferior to, and in fact superior to, IV lorazepam for treating seizures prior to arrival at EDs. Specifically, they found 10% more (95% CI 4.0% to 16.1%; P<0.001 for noninferiority and P<0.001 for superiority) seizure-free patients arriving at EDs when IM midazolam was administered. Seizures ceased in patients given IM midazolam in less time on average than it took for paramedics to administer IV lorazepam.
Hospitalists might be less inclined than EMS personnel to use IM midazolam because their patients have established IV access and refrigerated drugs are readily available. However, since IM midazolam was superior to IV lorazepam in this prehospital study, a similar trial in hospitalized patients is warranted. In subsequent trials, it would be useful to administer both midazolam and lorazepam via IM and IV routes, and IM injections by an autoinjector could be compared with the conventional manner.
Bottom line: In the prehospital setting, IM midazolam is at least as good as IV lorazepam in treating status epilepticus in children and adults.
Citation: Silbergleit R, Durkalski V, Lowenstein D, et al. Intramuscular versus intravenous therapy for prehospital status epilepticus. N Engl J Med. 2012;366:591-600.
Clostridium Difficile Infection Risk Remains High at Least Three Months after Antibiotics Are Stopped
Clinical question: How long are patients at higher risk for Clostridium difficile infection (CDI) after completing antibiotics?
Background: Studies have shown that patients given antibiotics are at higher risk for CDI than those who are not, particularly if they take multiple antibiotics at high doses for a prolonged period of time. However, it is not known how long a patient remains at high risk for CDI after completing antibiotic therapy.
Study design: Case-control study.
Setting: Nine hospitals in Netherlands.
Synopsis: The study compared 337 hospitalized patients who had CDI with 337 nondiarrheal controls and 227 non-CDI diarrheal controls. The study showed a seven- to tenfold increased risk for CDI during antibiotic treatment and in the 30 days following cessation of antibiotics. A 2.7-fold increased risk of CDI was seen in the one- to three-month period after antibiotic treatment was stopped.
Because researchers only obtained information about antibiotic use in the three months preceding the onset of diarrhea, it is unknown if CDI risk remains elevated longer than three months after antibiotics are stopped. Also of note, the enzyme immunoassays used in this study to diagnose C. diff had sensitivities of between 60% and 85%.
As hospitalists, this information can be used to advise patients about their continued risk for CDI after cessation of antibiotics. Further studies are needed to determine the risk after three months.
Bottom line: Patients are at highest risk for CDI up to one month after stopping antibiotics but continue to be at higher risk for at least two additional months.
Citation: Hensgens MPN, Goorhuis A, Dekkers OM, Kuijper EJ. Time interval of increased risk for Clostridium difficile infection after exposure to antibiotics. J Antimicrob Chemother. 2012;67:742-748.
Acid Suppression and Poor Outcomes in C. Diff Patients
Clinical question: What are potential modifiable risk factors associated with increased complications and mortality in patients hospitalized with C. diff infection (CDI)?
Background: CDI is a growing cause of morbidity and mortality in hospitalized patients. Evidence is growing for the association of acid suppression, among other modifiable risk factors, with complications and mortality in patients with CDI.
Study design: Retrospective case review.
Setting: Naval medical center.
Synopsis: A laboratory, medical record, and pharmacy database query found 485 patients with CDI. Complications of CDI were defined as ICU admission, surgery, and megacolon. Factors significantly associated with CDI complications and mortality were admission for CDI, corticosteroid use >5 mg per day, age ≥80 years, and prescription acid suppression (including H2-blockers and proton-pump inhibitors).
The latter two risk factors were associated with mortality alone. In multivariable regression, the odds of mortality among patients on acid suppression was more than four times the odds of those not on acid suppression (OR 4.74, 95% CI, 1.57 to 14.36).
Although this is a retrospective cohort study and cannot prove a causal relationship, the data add to a growing body of evidence supporting the risk of CDI complications and mortality for those on acid suppression.
Bottom line: In hospitalized patients with CDI, acid suppression is associated with increased complications and mortality and should be discontinued in this population when possible.
Citation: Morrison RH, Hall NS, Said M, et al. Risk factors associated with complications and mortality in patients with Clostridium difficile infection. Clin Infect Dis. 2011;53:1173-1178.
Perioperative Statins Reduce Cardiac Events for Surgical Patients
Clinical question: Does perioperative statin use improve cardiac outcomes (death, myocardial infarction, atrial fibrillation, and ICU and hospital lengths of stay) in statin-naive patients undergoing cardiac or non-cardiac surgery?
Background: Statins have been hypothesized to reduce perioperative cardiac complications because they reduce vascular and systemic inflammation caused by surgery, and several meta-analyses have demonstrated their efficacy. To date, no meta-analyses have specifically evaluated the benefits of perioperative statins in non-cardiac surgery from randomized controlled trials.
Study design: Systematic review of the literature and meta-analysis.
Setting: Fifteen randomized controlled trials of hospitalized surgical patients.
Synopsis: A systematic review examined the effects of statins on a variety of perioperative cardiac outcomes (death, myocardial infarction, atrial fibrillation, and ICU and hospital lengths of stay); 11 of the 15 patients were undergoing cardiac surgery.
Perioperative statins decreased the risk of atrial fibrillation in patients undergoing cardiac surgery (RR 0.56; 95% CI 0.45-0.69; number needed to treat [NNT], 6). In both cardiac and non-cardiac surgical patients, statins reduced the risk of myocardial infarction (RR 0.53; 95% CI 0.38 to 0.74; NNT 23). Statin treatment also reduced the mean length of hospital stay (in days, mean difference -0.32; 95% CI, -0.53 to -0.11) but did not reduce the length of ICU stay (mean difference -0.08; 95% CI, -0.25 to 0.10). Risk of death was not reduced with statin treatment (RR 0.62; 95% CI, 0.34 to 1.14).
Bottom line: Perioperative statins reduce the risk of postoperative atrial fibrillation in cardiac surgical patients, the risk of postoperative MI in cardiac and non-cardiac surgical patients, and the mean length of hospital stay.
Citation: Chopra V, Wesorick DH, Sussman JB, et al. Effect of perioperative statins on death, myocardial infarction, atrial fibrillation, and length of stay: a systematic review and meta-analysis. Arch Surg. 2012;147:181-188.
Enoxaparin Safe and Effective during Percutaneous Coronary Intervention
Clinical question: Is enoxaparin safe and efficacious compared with unfractionated heparin during percutaneous coronary intervention (PCI)?
Background: Despite problems with the use of unfractionated heparin during PCI, current guidelines give it a Class 1 recommendation for PCI in ST-elevation myocardial infarction (MI). There is growing evidence that enoxaparin can provide predictable, effective anticoagulation during PCI. Although several trials have examined this issue, none have been sufficiently powered to evaluate mortality.
Study design: Systematic review and meta-analysis.
Setting: Twenty-three trials or registries of patients undergoing PCI.
Synopsis: A systematic review found 23 trials representing 30,966 patients that examined the effects of enoxaparin versus unfractionated heparin on risk of mortality, MI, complications of MI, and major bleeding. Of these, 10,243 (33.1%) patients underwent primary PCI for ST elevation MI, 8,750 (28.2%) underwent PCI after fibrinolysis, and 11,973 (38.7%) patients had either scheduled PCI or PCI for non-ST elevation acute coronary syndrome.
Of all the patients, 13,943 (45%) received enoxaparin and 17,023 (55%) received unfractionated heparin. Enoxaparin was associated with significant reductions in all-cause mortality (RR 0.66; 95% CI, 0.57 to 0.76), composite of death or MI (RR 0.68; 95% CI, 0.57 to 0.81), and complications of MI (RR 0.75; 95% CI, 0.6 to 0.85). For patients who received primary PCI for ST elevation MI, enoxaparin reduced the risk of complications of MI by 44% (RR 0.56; 95% CI, 0.42 to 0.76). Enoxaparin also reduced the risk of major bleeding (RR 0.80, 95% CI, 0.68 to 0.95) with even more striking results for the 14 studies that compared intravenous enoxaparin to unfractionated heparin (RR 0.66; 95% CI, 0.52 to 0.83).
Bottom line: Enoxaparin is safe and efficacious when used during PCI. Patients who receive enoxaparin during PCI have reduced risk for death, MI, complications of MI, and major bleeding when compared with patients who receive unfractionated heparin.
Citation: Silvain J, Beygui F, Barthelmy O, et al. Efficacy and safety of enoxaparin versus unfractionated heparin during percutaneous coronary intervention: systematic review and meta-analysis. BMJ. 2012;344:e553.
Serum Potassium Levels and Mortality in Acute Myocardial Infarction
Clinical question: What is the relationship between serum potassium levels and mortality in acute myocardial infarction (AMI) patients?
Background: Several smaller studies in the pre-beta-blocker and pre-reperfusion era recommended maintaining serum potassium levels between 4.0 mEq/L and 5.0 mEq/L in AMI patients. However, current studies examining the relationship between potassium levels and mortality in AMI patients are lacking.
Study design: Retrospective cohort study.
Setting: Multicenter study involving 67 hospitals in the U.S.
Synopsis: Using the Cerner Health Facts database, which included 38,689 patients with biomarker-confirmed AMI, this study showed there was a U-shaped relationship between mean post-admission serum potassium level and in-hospital mortality.
Compared with the reference group of 3.5 mEq/L to less than 4.0 mEq/L (mortality rate 4.8%; 95% CI, 4.4% to 5.2%), mortality was comparable for those with mean post-admission potassium of 4.0 mEq/L to less than 4.5 mEq/L (5.0%; 95% CI, 4.7% to 5.3%). Mortality was twice as great for potassium of 4.5 mEq/L to less than 5.0 mEq/L (10.0%; 95% CI, 9.1% to 10.9%), and even greater for higher potassium strata. Similarly, mortality rates were higher for potassium levels of less than 3.5 mEq/L. Rates of ventricular fibrillation or cardiac arrest were higher among patients with potassium levels of less than 3.0 mEq/L or more than 5.0 mEq/L.
Bottom line: For inpatients with AMI, serum potassium levels of 3.5 mEq/L to 4.5 mEq/L should be maintained for the best outcomes. Repletion of serum potassium to levels greater than 4.5 mEq/L is associated with increased mortality and should be avoided.
Citation: Goyal A, Spertus JA, Gosch K, et al. Serum potassium levels and mortality in acute myocardial infarction. JAMA. 2012;307:157-164.
Proton-Pump Inhibitors Better than H2-Blockers in ACS and STEMI
Clinical question: Are proton-pump inhibitors (PPIs) better than H2-blockers at preventing UGI bleeding in patients after acute coronary syndrome (ACS) or ST-elevation myocardial infarction (STEMI)?
Background: It is not definitively known if PPIs are the same or better than H2-blockers in preventing UGI bleeding in patients on high-risk medications (aspirin, clopidogrel, and anticoagulants) after ACS or STEMI.
Study design: Randomized double-blinded controlled trial.
Setting: Single hospital.
Synopsis: Patients with ACS or STEMI were treated with aspirin, clopidogrel, and enoxaparin or thrombolytics. They were then randomized to either esomeprazole 20 mg or famotidine 40 mg, both administered nightly. They were followed throughout their hospital stay and were then followed between four and 52 weeks after discharge (mean duration: 19 weeks for esomeprazole, 18 weeks for famotidine). The primary end point was time to a composite outcome, consisting of UGI bleeding, obstruction, or perforation. Overall, 313 patients were randomized (164 to esomeprazole and 149 to famotidine).
The treatment groups were equivalent in baseline characteristics, and compliance in both groups was excellent (>98%). The primary endpoint occurred in three patients in the esomeprazole group and in 12 patients in the famotidine group (hazard ratio 0.21; 95% CI, 0.06 to 0.75; P=0.008).
Bottom line: PPIs are superior to H2-blockers in reducing UGI bleeding in patients on high-risk medications (aspirin, clopidogrel, and enoxaparin or thrombolytics) after ACS and STEMI. This confirms the recommendations of the 2010 ACCF/ACG/AHA Expert Consensus that PPIs should be used in those on dual antiplatelet therapy on anticoagulants.
Citation: Ng FH, Tunggal P, Chu WM, et al. Esomeprazole compared with famotidine in the prevention of upper gastrointestinal bleeding in patients with acute coronary syndrome or myocardial infarction. Am J Gastroenterol. 2012;107:389-396.
In the Literature: HM-Related Research You Need to Know
Literature at a Glance
A guide to this month’s studies
- Risks of preoperative tobacco use
- Timing of perioperative beta-blocker use and outcomes
- Continuous vs. bolus dose diuretics in CHF
- Outcomes of carotid endearterectomy and carotid artery stenting
- Protocol for low-risk chest pain
- Effect of esomeprazole on recurrent ulcer rates in clopidogrel users
- Effect of ICU QI project on hospital mortality
- Acute kidney injury risks after coronary angiography
Smokers Have Worse Perioperative Outcomes
Clinical question: Do current smokers have worse 30-day postoperative outcomes than nonsmokers after noncardiac surgery?
Background: Approximately 20% of adults in the U.S. smoke cigarettes, and a significant fraction of surgical patients are current smokers. Despite concerns that smoking is associated with worse postoperative outcomes, these increased risks have not been quantified across multiple outcomes.
Study design: Retrospective cohort study.
Setting: Surgical patients in 200 centers throughout the United States.
Synopsis: Data from the American College of Surgeons National Surgical Quality Improvement Program from 2005 to 2008 were acquired, and 391,006 patient records were reviewed. Postoperative morbidity and mortality were significantly greater in smokers. Current smokers had a 40% increased odds of death at 30 days compared to people who had never smoked (OR 1.38, 95% CI, 1.11-1.72). Current smokers also had significantly greater odds of pulmonary complications, including pneumonia (OR 2.09, 95% CI, 1.80-2.43), unplanned intubation (OR 1.87, 95% CI, 1.58-2.21), and mechanical ventilation (OR 1.53, 95% CI, 1.31-1.79).
Furthermore, current smokers had significantly greater odds of postoperative cardiac arrest (OR 1.57, 95% CI, 1.10-2.25), myocardial infarction (OR 1.80, 95% CI, 1.11-2.25), and stroke (OR 1.73, 95% CI, 1.18-2.53). Odds of infectious complications were increased in current smokers, including deep incisional infections (OR 1.42, 95% CI, 1.21-1.68), sepsis (OR 1.30, 95% CI, 1.20-1.60), and septic shock (OR 1.55, 95% CI, 1.29-1.87).
Limitations of this study include self-reporting of smoking habits and absence of detailed smoking history just before and after surgery.
Bottom line: Current smokers have significantly increased postoperative morbidity and mortality after noncardiac surgery.
Citation: Turan A, Mascha EJ, Roberman D, et al. Smoking and perioperative outcomes. Anesthesiology. 2011;114(4):837-846.
Chronic Beta-Blockade Reduces Postoperative Myocardial Ischemia
Clinical question: Does the timing of beta-blocker exposure affect cardiovascular outcomes in patients undergoing elective, noncardiac surgery?
Background: Several studies have demonstrated that beta-blockers are associated with decreased perioperative cardiovascular morbidity and mortality. Study designs have varied greatly, and differences in dosing and timing of beta-blocker administration have caused conflicting results. The question of when to initiate beta-blockers prior to surgery remains controversial.
Study design: Prospective cohort study.
Setting: Three academic medical centers in Canada.
Synopsis: Data from 1,398 patients who had elective, noncardiac surgery with either acute (n=436) or chronic (n=962) beta-blocker exposure were analyzed. Acute exposure was defined as receiving a beta-blocker for the first time within 48 hours after surgery, whereas chronic beta-blocker exposure was defined as receiving a beta-blocker seven to 10 days prior to surgery.
Patients with chronic beta-blocker exposure were more likely to have a history of coronary disease, heart failure, or hypertension and were more likely to be receiving statins, antiplatelet agents, and angiotensin-converting enzyme inhibitors. The primary outcome was a composite of major cardiac events, including myocardial infarction, nonfatal cardiac arrest, and 30-day mortality.
Major cardiac events occurred more often in patients with acute versus chronic beta-blocker exposure in both the entire cohort (8.3% vs. 4.7%) and in the propensity-matched cohort (8.0% vs. 3.0%). Myocardial infarction accounted for the majority of cardiac events.
There are several limitations of this study: The sample size was small, the beta-blocker and dosage used varied, and the indication and exact duration of chronic beta-blocker therapy was unknown.
Bottom line: Chronic beta-blocker therapy reduces major cardiac events compared with acute beta-blocker therapy in patients undergoing elective, noncardiac surgery.
Citation: Ellenberger C, Tait G, Beattie WS. Chronic beta-blockade is associated with a better outcome after elective noncardiac surgery than acute beta-blockade: a single-center propensity-matched cohort study. Anesthesiology. 2011;114(4):817-823.
Continuous and Bolus Dosing of Furosemide Provides Similar Outcomes in Heart Failure
Clinical question: Does continuous infusion compared to bolus dosing of furosemide improve clinical outcomes in patients with acute decompensated heart failure?
Background: Diuresis with furosemide is commonly used to manage acute decompensated heart failure, but it is uncertain which dosing strategy is optimal. Continuous infusion of furosemide has been proposed as a more effective method of diuresis compared with bolus dosing, especially when higher doses are required, but data comparing the two strategies are limited.
Study design: Randomized, double-blind, controlled trial.
Setting: Twenty-six clinical sites in the U.S. and Canada.
Synopsis: Researchers randomized 308 patients with acute decompensated heart failure to either continuous or bolus intravenous dosing, which was calculated as either the equivalent of their daily oral dose (low-dose strategy) or 2.5 times their daily dose (high-dose strategy). Mean ejection fraction was 35%. Primary endpoints were patients’ assessment of symptoms based on a visual-analogue scale quantified as area under the curve, as well as change in serum creatinine level at 72 hours.
No significant differences between the continuous and bolus dosing groups were evidenced in primary endpoints at 72 hours. Patients in the bolus group had more dose increases at 48 hours (21% vs. 11%, P=0.01). Patients in the high-dose group were more likely to change from intravenous to oral doses at 48 hours (31% vs. 17%, P<0.001) and had greater net fluid loss (4.9L vs. 3.6L, P=0.01). More patients in the high-dose versus low-dose group had an increase in creatinine ≥0.3 mg/dL (23% vs. 14%, P=0.04). Hospital length of stay, readmission, and mortality rates were similar between the groups.
Bottom line: Diuretic therapy administered by continuous infusion or bolus dosing in patients with acute decompensated heart failure have equivocal effects on patients’ symptoms and kidney function.
Citation: Felker GM, Lee KL, Bull DA, et al. Diuretic strategies in patients with acute decompensated heart failure. N Engl J Med. 2011;364(9):797-805.
Carotid Endarterectomy Is Better than Carotid Artery Stenting
Clinical question: How do the clinical outcomes of carotid artery stenting compare with those of carotid endarterectomy?
Background: Whether carotid artery stenting or carotid endarterectomy is the preferred therapy for patients with carotid artery stenosis has been highly controversial. This study was a meta-analysis of all available data from randomized trials comparing carotid endarterectomy to carotid artery stenting.
Study design: Meta-analysis.
Setting: Teaching and nonteaching hospitals.
Synopsis: Thirteen randomized trials were identified with 3,723 patients who had undergone endarterectomy and 3,754 patients who had undergone carotid artery stenting. Outcomes included stroke, myocardial infarction, cranial nerve injury, and death or stroke, and these outcomes were divided as either short-term (<30 days) or long-term (>1 year) outcomes.
Patients who had undergone carotid artery stenting had less risk of short-term myocardial infarction (OR 0.48, 95% CI, 0.29–9.78, P=0.003) and less risk of cranial nerve injury (OR 0.09, 95% CI, 0.05–0.16, P<0.001). However, carotid artery stenting had a significantly higher risk of short-term stroke and combined death or stroke, and also significantly higher long-term risk of stroke and combined death or stroke. The association between carotid artery stenting and stroke was stronger in the subgroup of patients >68 years but not in patients <68 years. There was no significant heterogeneity, and no significant modifying associations were revealed by meta-regression analysis.
Limitations include potentially unpublished small studies favoring carotid endarterectomy and a significant publication bias regarding short-term death.
Bottom line: Although carotid artery stenting has less short-term risk of myocardial infarction and cranial nerve injury, carotid endarterectomy has less short-term and long-term risks of stroke and death.
Citation: Economopoulus KP, Sergentanis TN, Tsivgoulis G, Mariolis AD, Stefanadis C. Carotid artery stenting versus carotid endarterectomy: a comprehensive meta-analysis of short-term and long-term outcomes. Stroke. 2011;42:687-692.
Chest Pain Protocol Can Identify Low-Risk Chest Pain in Emergency Departments
Clinical question: Can a two-hour accelerated diagnostic protocol (ADP) based on electrocardiogram, point-of-care biomarkers, and Thrombolysis in Myocardial Infarction (TIMI) score safely identify patients with chest pain at very low short-term risk of major cardiac events?
Background: Evaluation of patients presenting to EDs with chest pain utilize significant amounts of hospital resources. A safe, reproducible, and expeditious process to identify patients at low risk for short-term cardiac events is desired.
Study design: Prospective cohort study.
Setting: Fourteen urban EDs in nine countries across the Asia-Pacific region.
Synopsis: The study included 3,582 patients presenting to an ED with at least five minutes of chest pain suggestive of an acute coronary syndrome and for whom further evaluation with serial cardiac biomarkers was planned. A negative ADP was defined as TIMI score of 0, no new ischemic changes on initial electrocardiogram, and normal cardiac biomarkers at zero and two hours after arrival.
All components of the ADP were negative for 352 patients (9.8%). Only three low-risk patients (0.9%) by ADP had a major cardiac event during the 30-day follow-up period, yielding a negative predictive value of 99.1% (95% CI, 97.3-99.8%). Mean hospital stay for the low-risk group with a negative ADP was 43 hours with a median of 26 hours. The authors suggest that a 10% reduction in prolonged workups of patients with chest pain could be seen with implementation of this protocol.
Potential limitations include applicability only to a select cohort of patients with chest pain and the low specificity of the protocol.
Bottom line: A two-hour diagnostic protocol can help expedite discharge of patients with very-low-risk chest pain.
Citation: Than T, Cullen L, Reid CM, et al. A 2-h diagnostic protocol to assess patients with chest pain symptoms in the Asia-Pacific region (ASPECT): a prospective observational validation study. Lancet. 2011;337:1077-1084.
Esomeprazole Reduces Peptic Ulcer Recurrence in Patients on Clopidogrel
Clinical question: Does esomeprazole prevent recurrent peptic ulcers in patients with atherosclerosis on clopidogrel?
Background: Although clopidogrel is sometimes used as an alternative antiplatelet agent to aspirin, a significant rate of recurrent ulcer bleeding on clopidogrel has been described. No previous prospective trial has studied whether a proton-pump inhibitor (PPI) can reduce the risk of peptic ulcer recurrence or bleeding in atherosclerotic patients on clopidogrel.
Study design: Randomized controlled trial.
Setting: A single veterans hospital in Taiwan.
Synopsis: One hundred sixty-five patients were enrolled with a past history of peptic ulcer disease, no signs of ulcer recurrence by endoscopy, and current use of clopidogrel 37.5 mg to 75 mg per day. All patients had atherosclerosis and had been on clopidogrel for at least two weeks, without aspirin, corticosteroids, anticoagulants, or recent treatment with a PPI. Patients were randomized to clopidogrel 75 mg at night (n=82) or clopidogrel 75 mg at night plus esomeprazole 20 mg before breakfast. Follow-up endoscopy was performed at six months or as needed for symptoms.
Recurrence of ulcer was found in 1.2% of patients on clopidogrel plus esomeprazole versus 11.0% in patients on clopidogrel alone (95% CI, 2.6-17.0%; P=0.009). The pharmacodynamic study revealed no significant differences in platelet aggregation within or between treatment groups on day 1 or day 28. No significant differences were seen on the incidence of ischemic events in this setting, but the trial was underpowered to draw conclusions on this outcome.
An important limitation is that the findings of this study are applicable only to patients on clopidogrel monotherapy and not dual antiplatelet therapy.
Bottom line: A significant reduction in recurrent peptic ulcers is seen with the combination of esomeprazole plus clopidogrel, versus clopidogrel alone, in patients with atherosclerosis and a history of peptic ulcer disease.
Citation: Hsu PI, Lai KH, Liu CP. Esomeprazole with clopidogrel reduces peptic ulcer recurrence, compared with clopidogrel alone, in patients with atherosclerosis. Gastroenterology. 2011;140:791-798.
ICU Quality-Improvement Project Reduces Hospital Mortality
Clinical question: Does a quality-improvement (QI) project in the ICU reduce in-hospital mortality and length of stay among elderly adults?
Background: Previous studies have shown that ICU-acquired infections are associated with increased morbidity and mortality, and QI initiatives reduce hospital-acquired infections. However, it has not been demonstrated that QI projects in the ICU reduce in-hospital mortality or length of stay.
Study design: Retrospective cohort study.
Setting: Four hundred fifty-nine Midwestern hospitals.
Synopsis: This study included 238,937 adults age >65 who were hospitalized in an ICU from 2001 to 2006 at one of 95 hospitals invited to implement the Keystone ICU Project. The control group included 1,091,547 elderly adults at one of 364 hospitals not invited to participate in the project. The Keystone ICU Project implements evidence-based practices to reduce rates of catheter-related bloodstream infections and ventilator-associated pneumonia.
Hospital mortality was not significantly reduced during initiation or implementation of the project; however, a significant reduction in hospital mortality occurred in the study group during one to 12 months post-implementation (OR=0.83 vs. 0.88, P=0.041) and 13 to 22 months post-implementation (OR=0.76 vs. 0.84, P=0.007). In contrast, length of stay did not differ significantly between the two groups, but the study was underpowered for this outcome.
The study is limited by the complexity of the Keystone ICU Project, as well as the exclusion of smaller hospitals and nonelderly adults. The study is promising because implementing a QI project in the ICU is associated with no known harms and might confer a mortality benefit at a relatively low cost.
Bottom line: Elderly adults had lower in-hospital mortality after implementation of the Keystone QI project in ICUs.
Citation: Lipitz-Snyderman A, Steinwachs D, Needham DM, Colantuoni E, Morlock LL, Pronovost PJ. Impact of a statewide intensive care unit quality improvement initiative on hospital mortality and length of stay: retrospective comparative analysis. BMJ. 2011;342:d219.
Serious Long-Term Risks with Acute Kidney Injury after Coronary Angiography
Clinical question: Does postcoronary angiography acute kidney injury (AKI) increase the risk of poor long-term clinical outcomes?
Background: Previous studies have shown that AKI following coronary angiography increases the risk of poor short-term clinical outcomes, such as in-hospital myocardial infarction, prolonged hospital stay, and early mortality. Little is known about the long-term cardiovascular and renal outcomes following post-coronary angiography AKI.
Study design: Retrospective cohort study.
Setting: All coronary angiography centers in Alberta, Canada.
Synopsis: The study included 14,782 adults who were ≥18 years of age, underwent coronary angiography, had a baseline creatinine measurement, did not have end-stage renal disease (ESRD), and had a creatinine measurement within seven days after coronary angiography.
During a median follow-up period of 19.7 months, 1,099 (7.4%) patients developed stage 1 AKI and 321 (2.2%) developed stage 2 or 3 AKI. Mortality increased twofold with stage 1 AKI and >3-fold with stage 2 or 3 AKI. Risk of ESRD increased substantially by >11-fold in patients with stage 2 or 3 AKI. Risk of hospitalization for subsequent AKI, myocardial infarction, and heart failure also increased significantly following post-coronary angiography AKI.
Patients who experienced AKI were older, had more severe CAD, were more likely to have such comorbidities as DM, HTN, and heart failure, and had lower baseline GFRs. However, the underlying comorbidities do not completely explain the increased risk of poor long-term outcomes in the adjusted analysis.
Limitations include missing or underestimating mild cases of AKI, residual confounding from unmeasured variables, and inability of retrospective comparative studies to establish causality.
Bottom line: Adults with post-coronary angiography AKI are at increased risk of poor long-term cardiovascular and renal outcomes.
Citation: James MT, Ghali WA, Knudtson ML, et al. Associations between acute kidney injury and cardiovascular and renal outcomes after coronary angiography. Circulation. 2011;123(4):409-416. TH
Pediatric HM Literature
Proton-Pump Inhibitors Ineffective for Gastroesophageal Reflux Disease in Children

Clinical question: What is the efficacy of proton-pump inhibitors (PPIs) in children with gastroesophageal reflux disease (GERD)?
Background: Gastroesophageal reflux is both a common and normal phenomenon in infants. GERD refers to the presence of abnormal symptoms ascribed to the reflux and frequently is treated in children in a manner similar to adults with reflux esophagitis. PPIs often are prescribed as front-line treatment, and their use has increased dramatically in recent years, though their effectiveness in children remains unclear.
Study design: Systematic review of the literature.
Setting: Hawaii’s largest health insurer.
Synopsis: Medline, Embase, and the Cochrane Database of Systematic Reviews were searched for randomized controlled trials (RCTs) and crossover studies performed to evaluate the efficacy of PPIs in children 0-17 years with GERD and no complicating diseases. Ten RCTs and two crossover studies were analyzed and rated independently by two reviewers.
Due to significant heterogeneity between the studies, a meta-analysis was not possible; studies were discussed separately. PPIs offered no advantage when compared with controls (alginates, ranitidine, different dosages of PPIs), and similar rates of adverse events were reported between treatment groups.
This study is hampered by notable heterogeneity of patient type, symptoms, and study design in many of the trials. However, the results are in line with discussions at a recent FDA Gastrointestinal Drugs Advisory Committee meeting, which reviewed the lack of efficacy of PPIs in infants in four recent Phase 3 clinical trials.
Bottom line: Little evidence supports the widespread use of PPIs in children.
Citation: Van der Pol RJ, Smits MJ, van Wijk MP, Omari TI, Tabbers MM, Benninga MA. Efficacy of proton-pump inhibitors in children with gastroesophageal reflux disease: a systematic review. Pediatrics. 2011;127:925-935.
Literature at a Glance
A guide to this month’s studies
- Risks of preoperative tobacco use
- Timing of perioperative beta-blocker use and outcomes
- Continuous vs. bolus dose diuretics in CHF
- Outcomes of carotid endearterectomy and carotid artery stenting
- Protocol for low-risk chest pain
- Effect of esomeprazole on recurrent ulcer rates in clopidogrel users
- Effect of ICU QI project on hospital mortality
- Acute kidney injury risks after coronary angiography
Smokers Have Worse Perioperative Outcomes
Clinical question: Do current smokers have worse 30-day postoperative outcomes than nonsmokers after noncardiac surgery?
Background: Approximately 20% of adults in the U.S. smoke cigarettes, and a significant fraction of surgical patients are current smokers. Despite concerns that smoking is associated with worse postoperative outcomes, these increased risks have not been quantified across multiple outcomes.
Study design: Retrospective cohort study.
Setting: Surgical patients in 200 centers throughout the United States.
Synopsis: Data from the American College of Surgeons National Surgical Quality Improvement Program from 2005 to 2008 were acquired, and 391,006 patient records were reviewed. Postoperative morbidity and mortality were significantly greater in smokers. Current smokers had a 40% increased odds of death at 30 days compared to people who had never smoked (OR 1.38, 95% CI, 1.11-1.72). Current smokers also had significantly greater odds of pulmonary complications, including pneumonia (OR 2.09, 95% CI, 1.80-2.43), unplanned intubation (OR 1.87, 95% CI, 1.58-2.21), and mechanical ventilation (OR 1.53, 95% CI, 1.31-1.79).
Furthermore, current smokers had significantly greater odds of postoperative cardiac arrest (OR 1.57, 95% CI, 1.10-2.25), myocardial infarction (OR 1.80, 95% CI, 1.11-2.25), and stroke (OR 1.73, 95% CI, 1.18-2.53). Odds of infectious complications were increased in current smokers, including deep incisional infections (OR 1.42, 95% CI, 1.21-1.68), sepsis (OR 1.30, 95% CI, 1.20-1.60), and septic shock (OR 1.55, 95% CI, 1.29-1.87).
Limitations of this study include self-reporting of smoking habits and absence of detailed smoking history just before and after surgery.
Bottom line: Current smokers have significantly increased postoperative morbidity and mortality after noncardiac surgery.
Citation: Turan A, Mascha EJ, Roberman D, et al. Smoking and perioperative outcomes. Anesthesiology. 2011;114(4):837-846.
Chronic Beta-Blockade Reduces Postoperative Myocardial Ischemia
Clinical question: Does the timing of beta-blocker exposure affect cardiovascular outcomes in patients undergoing elective, noncardiac surgery?
Background: Several studies have demonstrated that beta-blockers are associated with decreased perioperative cardiovascular morbidity and mortality. Study designs have varied greatly, and differences in dosing and timing of beta-blocker administration have caused conflicting results. The question of when to initiate beta-blockers prior to surgery remains controversial.
Study design: Prospective cohort study.
Setting: Three academic medical centers in Canada.
Synopsis: Data from 1,398 patients who had elective, noncardiac surgery with either acute (n=436) or chronic (n=962) beta-blocker exposure were analyzed. Acute exposure was defined as receiving a beta-blocker for the first time within 48 hours after surgery, whereas chronic beta-blocker exposure was defined as receiving a beta-blocker seven to 10 days prior to surgery.
Patients with chronic beta-blocker exposure were more likely to have a history of coronary disease, heart failure, or hypertension and were more likely to be receiving statins, antiplatelet agents, and angiotensin-converting enzyme inhibitors. The primary outcome was a composite of major cardiac events, including myocardial infarction, nonfatal cardiac arrest, and 30-day mortality.
Major cardiac events occurred more often in patients with acute versus chronic beta-blocker exposure in both the entire cohort (8.3% vs. 4.7%) and in the propensity-matched cohort (8.0% vs. 3.0%). Myocardial infarction accounted for the majority of cardiac events.
There are several limitations of this study: The sample size was small, the beta-blocker and dosage used varied, and the indication and exact duration of chronic beta-blocker therapy was unknown.
Bottom line: Chronic beta-blocker therapy reduces major cardiac events compared with acute beta-blocker therapy in patients undergoing elective, noncardiac surgery.
Citation: Ellenberger C, Tait G, Beattie WS. Chronic beta-blockade is associated with a better outcome after elective noncardiac surgery than acute beta-blockade: a single-center propensity-matched cohort study. Anesthesiology. 2011;114(4):817-823.
Continuous and Bolus Dosing of Furosemide Provides Similar Outcomes in Heart Failure
Clinical question: Does continuous infusion compared to bolus dosing of furosemide improve clinical outcomes in patients with acute decompensated heart failure?
Background: Diuresis with furosemide is commonly used to manage acute decompensated heart failure, but it is uncertain which dosing strategy is optimal. Continuous infusion of furosemide has been proposed as a more effective method of diuresis compared with bolus dosing, especially when higher doses are required, but data comparing the two strategies are limited.
Study design: Randomized, double-blind, controlled trial.
Setting: Twenty-six clinical sites in the U.S. and Canada.
Synopsis: Researchers randomized 308 patients with acute decompensated heart failure to either continuous or bolus intravenous dosing, which was calculated as either the equivalent of their daily oral dose (low-dose strategy) or 2.5 times their daily dose (high-dose strategy). Mean ejection fraction was 35%. Primary endpoints were patients’ assessment of symptoms based on a visual-analogue scale quantified as area under the curve, as well as change in serum creatinine level at 72 hours.
No significant differences between the continuous and bolus dosing groups were evidenced in primary endpoints at 72 hours. Patients in the bolus group had more dose increases at 48 hours (21% vs. 11%, P=0.01). Patients in the high-dose group were more likely to change from intravenous to oral doses at 48 hours (31% vs. 17%, P<0.001) and had greater net fluid loss (4.9L vs. 3.6L, P=0.01). More patients in the high-dose versus low-dose group had an increase in creatinine ≥0.3 mg/dL (23% vs. 14%, P=0.04). Hospital length of stay, readmission, and mortality rates were similar between the groups.
Bottom line: Diuretic therapy administered by continuous infusion or bolus dosing in patients with acute decompensated heart failure have equivocal effects on patients’ symptoms and kidney function.
Citation: Felker GM, Lee KL, Bull DA, et al. Diuretic strategies in patients with acute decompensated heart failure. N Engl J Med. 2011;364(9):797-805.
Carotid Endarterectomy Is Better than Carotid Artery Stenting
Clinical question: How do the clinical outcomes of carotid artery stenting compare with those of carotid endarterectomy?
Background: Whether carotid artery stenting or carotid endarterectomy is the preferred therapy for patients with carotid artery stenosis has been highly controversial. This study was a meta-analysis of all available data from randomized trials comparing carotid endarterectomy to carotid artery stenting.
Study design: Meta-analysis.
Setting: Teaching and nonteaching hospitals.
Synopsis: Thirteen randomized trials were identified with 3,723 patients who had undergone endarterectomy and 3,754 patients who had undergone carotid artery stenting. Outcomes included stroke, myocardial infarction, cranial nerve injury, and death or stroke, and these outcomes were divided as either short-term (<30 days) or long-term (>1 year) outcomes.
Patients who had undergone carotid artery stenting had less risk of short-term myocardial infarction (OR 0.48, 95% CI, 0.29–9.78, P=0.003) and less risk of cranial nerve injury (OR 0.09, 95% CI, 0.05–0.16, P<0.001). However, carotid artery stenting had a significantly higher risk of short-term stroke and combined death or stroke, and also significantly higher long-term risk of stroke and combined death or stroke. The association between carotid artery stenting and stroke was stronger in the subgroup of patients >68 years but not in patients <68 years. There was no significant heterogeneity, and no significant modifying associations were revealed by meta-regression analysis.
Limitations include potentially unpublished small studies favoring carotid endarterectomy and a significant publication bias regarding short-term death.
Bottom line: Although carotid artery stenting has less short-term risk of myocardial infarction and cranial nerve injury, carotid endarterectomy has less short-term and long-term risks of stroke and death.
Citation: Economopoulus KP, Sergentanis TN, Tsivgoulis G, Mariolis AD, Stefanadis C. Carotid artery stenting versus carotid endarterectomy: a comprehensive meta-analysis of short-term and long-term outcomes. Stroke. 2011;42:687-692.
Chest Pain Protocol Can Identify Low-Risk Chest Pain in Emergency Departments
Clinical question: Can a two-hour accelerated diagnostic protocol (ADP) based on electrocardiogram, point-of-care biomarkers, and Thrombolysis in Myocardial Infarction (TIMI) score safely identify patients with chest pain at very low short-term risk of major cardiac events?
Background: Evaluation of patients presenting to EDs with chest pain utilize significant amounts of hospital resources. A safe, reproducible, and expeditious process to identify patients at low risk for short-term cardiac events is desired.
Study design: Prospective cohort study.
Setting: Fourteen urban EDs in nine countries across the Asia-Pacific region.
Synopsis: The study included 3,582 patients presenting to an ED with at least five minutes of chest pain suggestive of an acute coronary syndrome and for whom further evaluation with serial cardiac biomarkers was planned. A negative ADP was defined as TIMI score of 0, no new ischemic changes on initial electrocardiogram, and normal cardiac biomarkers at zero and two hours after arrival.
All components of the ADP were negative for 352 patients (9.8%). Only three low-risk patients (0.9%) by ADP had a major cardiac event during the 30-day follow-up period, yielding a negative predictive value of 99.1% (95% CI, 97.3-99.8%). Mean hospital stay for the low-risk group with a negative ADP was 43 hours with a median of 26 hours. The authors suggest that a 10% reduction in prolonged workups of patients with chest pain could be seen with implementation of this protocol.
Potential limitations include applicability only to a select cohort of patients with chest pain and the low specificity of the protocol.
Bottom line: A two-hour diagnostic protocol can help expedite discharge of patients with very-low-risk chest pain.
Citation: Than T, Cullen L, Reid CM, et al. A 2-h diagnostic protocol to assess patients with chest pain symptoms in the Asia-Pacific region (ASPECT): a prospective observational validation study. Lancet. 2011;337:1077-1084.
Esomeprazole Reduces Peptic Ulcer Recurrence in Patients on Clopidogrel
Clinical question: Does esomeprazole prevent recurrent peptic ulcers in patients with atherosclerosis on clopidogrel?
Background: Although clopidogrel is sometimes used as an alternative antiplatelet agent to aspirin, a significant rate of recurrent ulcer bleeding on clopidogrel has been described. No previous prospective trial has studied whether a proton-pump inhibitor (PPI) can reduce the risk of peptic ulcer recurrence or bleeding in atherosclerotic patients on clopidogrel.
Study design: Randomized controlled trial.
Setting: A single veterans hospital in Taiwan.
Synopsis: One hundred sixty-five patients were enrolled with a past history of peptic ulcer disease, no signs of ulcer recurrence by endoscopy, and current use of clopidogrel 37.5 mg to 75 mg per day. All patients had atherosclerosis and had been on clopidogrel for at least two weeks, without aspirin, corticosteroids, anticoagulants, or recent treatment with a PPI. Patients were randomized to clopidogrel 75 mg at night (n=82) or clopidogrel 75 mg at night plus esomeprazole 20 mg before breakfast. Follow-up endoscopy was performed at six months or as needed for symptoms.
Recurrence of ulcer was found in 1.2% of patients on clopidogrel plus esomeprazole versus 11.0% in patients on clopidogrel alone (95% CI, 2.6-17.0%; P=0.009). The pharmacodynamic study revealed no significant differences in platelet aggregation within or between treatment groups on day 1 or day 28. No significant differences were seen on the incidence of ischemic events in this setting, but the trial was underpowered to draw conclusions on this outcome.
An important limitation is that the findings of this study are applicable only to patients on clopidogrel monotherapy and not dual antiplatelet therapy.
Bottom line: A significant reduction in recurrent peptic ulcers is seen with the combination of esomeprazole plus clopidogrel, versus clopidogrel alone, in patients with atherosclerosis and a history of peptic ulcer disease.
Citation: Hsu PI, Lai KH, Liu CP. Esomeprazole with clopidogrel reduces peptic ulcer recurrence, compared with clopidogrel alone, in patients with atherosclerosis. Gastroenterology. 2011;140:791-798.
ICU Quality-Improvement Project Reduces Hospital Mortality
Clinical question: Does a quality-improvement (QI) project in the ICU reduce in-hospital mortality and length of stay among elderly adults?
Background: Previous studies have shown that ICU-acquired infections are associated with increased morbidity and mortality, and QI initiatives reduce hospital-acquired infections. However, it has not been demonstrated that QI projects in the ICU reduce in-hospital mortality or length of stay.
Study design: Retrospective cohort study.
Setting: Four hundred fifty-nine Midwestern hospitals.
Synopsis: This study included 238,937 adults age >65 who were hospitalized in an ICU from 2001 to 2006 at one of 95 hospitals invited to implement the Keystone ICU Project. The control group included 1,091,547 elderly adults at one of 364 hospitals not invited to participate in the project. The Keystone ICU Project implements evidence-based practices to reduce rates of catheter-related bloodstream infections and ventilator-associated pneumonia.
Hospital mortality was not significantly reduced during initiation or implementation of the project; however, a significant reduction in hospital mortality occurred in the study group during one to 12 months post-implementation (OR=0.83 vs. 0.88, P=0.041) and 13 to 22 months post-implementation (OR=0.76 vs. 0.84, P=0.007). In contrast, length of stay did not differ significantly between the two groups, but the study was underpowered for this outcome.
The study is limited by the complexity of the Keystone ICU Project, as well as the exclusion of smaller hospitals and nonelderly adults. The study is promising because implementing a QI project in the ICU is associated with no known harms and might confer a mortality benefit at a relatively low cost.
Bottom line: Elderly adults had lower in-hospital mortality after implementation of the Keystone QI project in ICUs.
Citation: Lipitz-Snyderman A, Steinwachs D, Needham DM, Colantuoni E, Morlock LL, Pronovost PJ. Impact of a statewide intensive care unit quality improvement initiative on hospital mortality and length of stay: retrospective comparative analysis. BMJ. 2011;342:d219.
Serious Long-Term Risks with Acute Kidney Injury after Coronary Angiography
Clinical question: Does postcoronary angiography acute kidney injury (AKI) increase the risk of poor long-term clinical outcomes?
Background: Previous studies have shown that AKI following coronary angiography increases the risk of poor short-term clinical outcomes, such as in-hospital myocardial infarction, prolonged hospital stay, and early mortality. Little is known about the long-term cardiovascular and renal outcomes following post-coronary angiography AKI.
Study design: Retrospective cohort study.
Setting: All coronary angiography centers in Alberta, Canada.
Synopsis: The study included 14,782 adults who were ≥18 years of age, underwent coronary angiography, had a baseline creatinine measurement, did not have end-stage renal disease (ESRD), and had a creatinine measurement within seven days after coronary angiography.
During a median follow-up period of 19.7 months, 1,099 (7.4%) patients developed stage 1 AKI and 321 (2.2%) developed stage 2 or 3 AKI. Mortality increased twofold with stage 1 AKI and >3-fold with stage 2 or 3 AKI. Risk of ESRD increased substantially by >11-fold in patients with stage 2 or 3 AKI. Risk of hospitalization for subsequent AKI, myocardial infarction, and heart failure also increased significantly following post-coronary angiography AKI.
Patients who experienced AKI were older, had more severe CAD, were more likely to have such comorbidities as DM, HTN, and heart failure, and had lower baseline GFRs. However, the underlying comorbidities do not completely explain the increased risk of poor long-term outcomes in the adjusted analysis.
Limitations include missing or underestimating mild cases of AKI, residual confounding from unmeasured variables, and inability of retrospective comparative studies to establish causality.
Bottom line: Adults with post-coronary angiography AKI are at increased risk of poor long-term cardiovascular and renal outcomes.
Citation: James MT, Ghali WA, Knudtson ML, et al. Associations between acute kidney injury and cardiovascular and renal outcomes after coronary angiography. Circulation. 2011;123(4):409-416. TH
Pediatric HM Literature
Proton-Pump Inhibitors Ineffective for Gastroesophageal Reflux Disease in Children
Clinical question: What is the efficacy of proton-pump inhibitors (PPIs) in children with gastroesophageal reflux disease (GERD)?
Background: Gastroesophageal reflux is both a common and normal phenomenon in infants. GERD refers to the presence of abnormal symptoms ascribed to the reflux and frequently is treated in children in a manner similar to adults with reflux esophagitis. PPIs often are prescribed as front-line treatment, and their use has increased dramatically in recent years, though their effectiveness in children remains unclear.
Study design: Systematic review of the literature.
Setting: Hawaii’s largest health insurer.
Synopsis: Medline, Embase, and the Cochrane Database of Systematic Reviews were searched for randomized controlled trials (RCTs) and crossover studies performed to evaluate the efficacy of PPIs in children 0-17 years with GERD and no complicating diseases. Ten RCTs and two crossover studies were analyzed and rated independently by two reviewers.
Due to significant heterogeneity between the studies, a meta-analysis was not possible; studies were discussed separately. PPIs offered no advantage when compared with controls (alginates, ranitidine, different dosages of PPIs), and similar rates of adverse events were reported between treatment groups.
This study is hampered by notable heterogeneity of patient type, symptoms, and study design in many of the trials. However, the results are in line with discussions at a recent FDA Gastrointestinal Drugs Advisory Committee meeting, which reviewed the lack of efficacy of PPIs in infants in four recent Phase 3 clinical trials.
Bottom line: Little evidence supports the widespread use of PPIs in children.
Citation: Van der Pol RJ, Smits MJ, van Wijk MP, Omari TI, Tabbers MM, Benninga MA. Efficacy of proton-pump inhibitors in children with gastroesophageal reflux disease: a systematic review. Pediatrics. 2011;127:925-935.
In the Literature: Research You Need to Know
Clinical question: Does the mortality rate differ between patients treated perioperatively with atenolol versus metoprolol?
Background: Perioperative beta-blockers have been shown to reduce mortality in patients with significant cardiac risk factors. Different beta-blockers have been used in the studies demonstrating benefit, and it is uncertain which beta-blocker is the preferred agent. The purpose of this study was to compare the perioperative benefits of metoprolol versus atenolol.
Study design: Retrospective cohort study.
Setting: San Francisco Veterans Affairs Medical Center.
Synopsis: Computerized records of patients who underwent surgery from 1996 to 2008 were extracted into a database, and patients who received inpatient beta-blockers after surgery were included. Of these patients, 3,787 received beta-blockade exclusively with either atenolol (n=1,011) or metoprolol (n=2,776) during hospitalization. Perioperative risk reduction was better with atenolol versus metoprolol. Mortality rates were 1% versus 3% at 30 days (P=0.0008), and 7% versus 13% at one year (P=<0.0001) with atenolol and metoprolol, respectively. Similar results were found in the analysis of 1,871 patients who were on their respective beta-blocker as an outpatient before surgery.
Because the metoprolol group had higher prevalence of risk factors, such as coronary artery disease, peripheral vascular disease, and congestive heart failure, a propensity-matched analysis was performed to remove differences in risk factors between the groups. After propensity matching, the metoprolol group still had statistically significant higher mortality at 30 days and one year, even though causality cannot be established in this retrospective study.
Bottom line: Atenolol was associated with fewer cases of perioperative mortality compared with metoprolol in patients with cardiac risk factors or established cardiovascular disease.
Citation: Wallace AW, Au S, Cason BA. Perioperative ß-blockade: atenolol is associated with reduced mortality when compared to metoprolol. Anesthesiology. 2011;114:824-836.
For more physician reviews of HM-related research, visit our website.