User login
Pediatric Observation Status Stays
In recent decades, hospital lengths of stay have decreased and there has been a shift toward outpatient management for many pediatric conditions. In 2003, one‐third of all children admitted to US hospitals experienced 1‐day inpatient stays, an increase from 19% in 1993.1 Some hospitals have developed dedicated observation units for the care of children, with select diagnoses, who are expected to respond to less than 24 hours of treatment.26 Expansion of observation services has been suggested as an approach to lessen emergency department (ED) crowding7 and alleviate high‐capacity conditions within hospital inpatient units.8
In contrast to care delivered in a dedicated observation unit, observation status is an administrative label applied to patients who do not meet inpatient criteria as defined by third parties such as InterQual. While the decision to admit a patient is ultimately at the discretion of the ordering physician, many hospitals use predetermined criteria to assign observation status to patients admitted to observation and inpatient units.9 Treatment provided under observation status is designated by hospitals and payers as outpatient care, even when delivered in an inpatient bed.10 As outpatient‐designated care, observation cases do not enter publicly available administrative datasets of hospital discharges that have traditionally been used to understand hospital resource utilization, including the National Hospital Discharge Survey and the Kid's Inpatient Database.11, 12
We hypothesize that there has been an increase in observation status care delivered to children in recent years, and that the majority of children under observation were discharged home without converting to inpatient status. To determine trends in pediatric observation status care, we conducted the first longitudinal, multicenter evaluation of observation status code utilization following ED treatment in a sample of US freestanding children's hospitals. In addition, we focused on the most recent year of data among top ranking diagnoses to assess the current state of observation status stay outcomes (including conversion to inpatient status and return visits).
METHODS
Data Source
Data for this multicenter retrospective cohort study were obtained from the Pediatric Health Information System (PHIS). Freestanding children's hospital's participating in PHIS account for approximately 20% of all US tertiary care children's hospitals. The PHIS hospitals provide resource utilization data including patient demographics, International Classification of Diseases, Ninth Revision (ICD‐9) diagnosis and procedure codes, and charges applied to each stay, including room and nursing charges. Data were de‐identified prior to inclusion in the database, however encrypted identification numbers allowed for tracking individual patients across admissions. Data quality and reliability were assured through a joint effort between the Child Health Corporation of America (CHCA; Shawnee Mission, KS) and participating hospitals as described previously.13, 14 In accordance with the Common Rule (45 CFR 46.102(f)) and the policies of The Children's Hospital of Philadelphia Institutional Review Board, this research, using a de‐identified dataset, was considered exempt from review.
Hospital Selection
Each year from 2004 to 2009, there were 18 hospitals participating in PHIS that reported data from both inpatient discharges and outpatient visits (including observation status discharges). To assess data quality for observation status stays, we evaluated observation status discharges for the presence of associated observation billing codes applied to charge records reported to PHIS including: 1) observation per hour, 2) ED observation time, or 3) other codes mentioning observation in the hospital charge master description document. The 16 hospitals with observation charges assigned to at least 90% of observation status discharges in each study year were selected for analysis.
Visit Identification
Within the 16 study hospitals, we identified all visits between January 1, 2004 and December 31, 2009 with ED facility charges. From these ED visits, we included any stays designated by the hospital as observation or inpatient status, excluding transfers and ED discharges.
Variable Definitions
Hospitals submitting records to PHIS assigned a single patient type to the episode of care. The Observation patient type was assigned to patients discharged from observation status. Although the duration of observation is often less than 24 hours, hospitals may allow a patient to remain under observation for longer durations.15, 16 Duration of stay is not defined precisely enough within PHIS to determine hours of inpatient care. Therefore, length of stay (LOS) was not used to determine observation status stays.
The Inpatient patient type was assigned to patients who were discharged from inpatient status, including those patients admitted to inpatient care from the ED and also those who converted to inpatient status from observation. Patients who converted from observation status to inpatient status during the episode of care could be identified through the presence of observation charge codes as described above.
Given the potential for differences in the application of observation status, we also identified 1‐Day Stays where discharge occurred on the day of, or the day following, an inpatient status admission. These 1‐Day Stays represent hospitalizations that may, by their duration, be suitable for care in an observation unit. We considered discharges in the Observation and 1‐Day Stay categories to be Short‐Stays.
DATA ANALYSIS
For each of the 6 years of study, we calculated the following proportions to determine trends over time: 1) the number of Observation Status admissions from the ED as a proportion of the total number of ED visits resulting in Observation or Inpatient admission, and 2) the number of 1‐Day Stays admitted from the ED as a proportion of the total number of ED visits resulting in Observation or Inpatient admissions. Trends were analyzed using linear regression. Trends were also calculated for the total volume of admissions from the ED and the case‐mix index (CMI). CMI was assessed to evaluate for changes in the severity of illness for children admitted from the ED over the study period. Each hospital's CMI was calculated as an average of their Observation and Inpatient Status discharges' charge weights during the study period. Charge weights were calculated at the All Patient Refined Diagnosis Related Groups (APR‐DRG)/severity of illness level (3M Health Information Systems, St Paul, MN) and were normalized national average charges derived by Thomson‐Reuters from their Pediatric Projected National Database. Weights were then assigned to each discharge based on the discharge's APR‐DRG and severity level assignment.
To assess the current outcomes for observation, we analyzed stays with associated observation billing codes from the most recent year of available data (2009). Stays with Observation patient type were considered to have been discharged from observation, while those with an Inpatient Status patient type were considered to have converted to an inpatient admission during the observation period.
Using the 2009 data, we calculated descriptive statistics for patient characteristics (eg, age, gender, payer) comparing Observation Stays, 1‐Day Stays, and longer‐duration Inpatient admissions using chi‐square statistics. Age was categorized using the American Academy of Pediatrics groupings: <30 days, 30 days1 year, 12 years, 34 years, 512 years, 1317 years, >18 years. Designated payer was categorized into government, private, and other, including self‐pay and uninsured groups.
We used the Severity Classification Systems (SCS) developed for pediatric emergency care to estimate severity of illness for the visit.17 In this 5‐level system, each ICD‐9 diagnosis code is associated with a score related to the intensity of ED resources needed to care for a child with that diagnosis. In our analyses, each case was assigned the maximal SCS category based on the highest severity ICD‐9 code associated with the stay. Within the SCS, a score of 1 indicates minor illness (eg, diaper dermatitis) and 5 indicates major illness (eg, septic shock). The proportions of visits within categorical SCS scores were compared for Observation Stays, 1‐Day Stays, and longer‐duration Inpatient admissions using chi‐square statistics.
We determined the top 10 ranking diagnoses for which children were admitted from the ED in 2009 using the Diagnosis Grouping System (DGS).18 The DGS was designed specifically to categorize pediatric ED visits into clinically meaningful groups. The ICD‐9 code for the principal discharge diagnosis was used to assign records to 1 of the 77 DGS subgroups. Within each of the top ranking DGS subgroups, we determined the proportion of Observation Stays, 1‐Day Stays, and longer‐duration Inpatient admissions.
To provide clinically relevant outcomes of Observation Stays for common conditions, we selected stays with observation charges from within the top 10 ranking observation stay DGS subgroups in 2009. Outcomes for observation included: 1) immediate outcome of the observation stay (ie, discharge or conversion to inpatient status), 2) return visits to the ED in the 3 days following observation, and 3) readmissions to the hospital in the 3 and 30 days following observation. Bivariate comparisons of return visits and readmissions for Observation versus 1‐Day Stays within DGS subgroups were analyzed using chi‐square tests. Multivariate analyses of return visits and readmissions were conducted using Generalized Estimating Equations adjusting for severity of illness by SCS score and clustering by hospital. To account for local practice patterns, we also adjusted for a grouped treatment variable that included the site level proportion of children admitted to Observation Status, 1‐Day‐Stays, and longer Inpatient admissions. All statistical analyses were performed using SAS (version 9.2, SAS Institute, Inc, Cary, NC); P values <0.05 were considered statistically significant.
RESULTS
Trends in Short‐Stays
An increase in proportion of Observation Stays was mirrored by a decrease in proportion of 1‐Day Stays over the study period (Figure 1). In 2009, there were 1.4 times more Observation Stays than 1‐Day Stays (25,653 vs 18,425) compared with 14,242 and 20,747, respectively, in 2004. This shift toward more Observation Stays occurred as hospitals faced a 16% increase in the total number of admissions from the ED (91,318 to 108,217) and change in CMI from 1.48 to 1.51. Over the study period, roughly 40% of all admissions from the ED were Short‐Stays (Observation and 1‐Day Stays). Median LOS for Observation Status stays was 1 day (interquartile range [IQR]: 11).

Patient Characteristics in 2009
Table 1 presents comparisons between Observation, 1‐Day Stays, and longer‐duration Inpatient admissions. Of potential clinical significance, children under Observation Status were slightly younger (median, 4.0 years; IQR: 1.310.0) when compared with children admitted for 1‐Day Stays (median, 5.0 years; IQR: 1.411.4; P < 0.001) and longer‐duration Inpatient stays (median, 4.7 years; IQR: 0.912.2; P < 0.001). Nearly two‐thirds of Observation Status stays had SCS scores of 3 or lower compared with less than half of 1‐Day Stays and longer‐duration Inpatient admissions.
| Short‐Stays | LOS >1 Day | |||||
|---|---|---|---|---|---|---|
| Observation | 1‐Day Stay | Longer Admission | ||||
| N = 25,653* (24%) | N = 18,425* (17%) | P Value Comparing Observation to 1‐Day Stay | N = 64,139* (59%) | P Value Comparing Short‐Stays to LOS >1 Day | ||
| ||||||
| Sex | Male | 14,586 (57) | 10,474 (57) | P = 0.663 | 34,696 (54) | P < 0.001 |
| Female | 11,000 (43) | 7,940 (43) | 29,403 (46) | |||
| Payer | Government | 13,247 (58) | 8,944 (55) | P < 0.001 | 35,475 (61) | P < 0.001 |
| Private | 7,123 (31) | 5,105 (32) | 16,507 (28) | |||
| Other | 2,443 (11) | 2,087 (13) | 6,157 (11) | |||
| Age | <30 days | 793 (3) | 687 (4) | P < 0.001 | 3,932 (6) | P < 0.001 |
| 30 days1 yr | 4,499 (17) | 2,930 (16) | 13,139 (21) | |||
| 12 yr | 5,793 (23) | 3,566 (19) | 10,229 (16) | |||
| 34 yr | 3,040 (12) | 2,056 (11) | 5,551 (9) | |||
| 512 yr | 7,427 (29) | 5,570 (30) | 17,057 (27) | |||
| 1317 yr | 3,560 (14) | 3,136 (17) | 11,860 (18) | |||
| >17 yr | 541 (2) | 480 (3) | 2,371 (4) | |||
| Race | White | 17,249 (70) | 12,123 (70) | P < 0.001 | 40,779 (67) | P <0.001 |
| Black | 6,298 (25) | 4,216 (25) | 16,855 (28) | |||
| Asian | 277 (1) | 295 (2) | 995 (2) | |||
| Other | 885 (4) | 589 (3) | 2,011 (3) | |||
| SCS | 1 Minor illness | 64 (<1) | 37 (<1) | P < 0.001 | 84 (<1) | P < 0.001 |
| 2 | 1,190 (5) | 658 (4) | 1,461 (2) | |||
| 3 | 14,553 (57) | 7,617 (42) | 20,760 (33) | |||
| 4 | 8,994 (36) | 9,317 (51) | 35,632 (56) | |||
| 5 Major illness | 490 (2) | 579 (3) | 5,689 (9) | |||
In 2009, the top 10 DGS subgroups accounted for half of all admissions from the ED. The majority of admissions for extremity fractures, head trauma, dehydration, and asthma were Short‐Stays, as were roughly 50% of admissions for seizures, appendicitis, and gastroenteritis (Table 2). Respiratory infections and asthma were the top 1 and 2 ranking DGS subgroups for Observation Stays, 1‐Day Stays, and longer‐duration Inpatient admissions. While rank order differed, 9 of the 10 top ranking Observation Stay DGS subgroups were also top ranking DGS subgroups for 1‐Day Stays. Gastroenteritis ranked 10th among Observation Stays and 11th among 1‐Day Stays. Diabetes mellitus ranked 26th among Observation Stays compared with 8th among 1‐Day Stays.
| Short‐Stays | LOS >1 Day | ||
|---|---|---|---|
| % Observation | % 1‐Day Stay | % Longer Admission | |
| |||
| All admissions from the ED | 23.7 | 17.0 | 59.3 |
| n = 108,217 | |||
| Respiratory infections | 22.3 | 15.3 | 62.4 |
| n = 14,455 (13%) | |||
| Asthma | 32.0 | 23.8 | 44.2 |
| n = 8,853 (8%) | |||
| Other GI diseases | 24.1 | 16.2 | 59.7 |
| n = 6,519 (6%) | |||
| Appendicitis | 21.0 | 29.5 | 49.5 |
| n = 4,480 (4%) | |||
| Skin infections | 20.7 | 14.3 | 65.0 |
| n = 4,743 (4%) | |||
| Seizures | 29.5 | 22 | 48.5 |
| n = 4,088 (4%) | |||
| Extremity fractures | 49.4 | 20.5 | 30.1 |
| n = 3,681 (3%) | |||
| Dehydration | 37.8 | 19.0 | 43.2 |
| n = 2,773 (3%) | |||
| Gastroenteritis | 30.3 | 18.7 | 50.9 |
| n = 2,603 (2%) | |||
| Head trauma | 44.1 | 43.9 | 32.0 |
| n = 2,153 (2%) | |||
Average maximum SCS scores were clinically comparable for Observation and 1‐Day Stays and generally lower than for longer‐duration Inpatient admissions within the top 10 most common DGS subgroups. Average maximum SCS scores were statistically lower for Observation Stays compared with 1‐Day Stays for respiratory infections (3.2 vs 3.4), asthma (3.4 vs 3.6), diabetes (3.5 vs 3.8), gastroenteritis (3.0 vs 3.1), other gastrointestinal diseases (3.2 vs 3.4), head trauma (3.3 vs 3.5), and extremity fractures (3.2 vs 3.4) (P < 0.01). There were no differences in SCS scores for skin infections (SCS = 3.0) and appendicitis (SCS = 4.0) when comparing Observation and 1‐Day Stays.
Outcomes for Observation Stays in 2009
Within 6 of the top 10 DGS subgroups for Observation Stays, >75% of patients were discharged home from Observation Status (Table 3). Mean LOS for stays that converted from Observation to Inpatient Status ranged from 2.85 days for extremity fractures to 4.66 days for appendicitis.
| Return to ED in 3 Days n = 421 (1.6%) | Hospital Readmissions in 3 Days n = 247 (1.0%) | Hospital Readmissions in 30 Days n = 819 (3.2%) | ||
|---|---|---|---|---|
| DGS subgroup | % Discharged From Observation | Adjusted* Odds Ratio (95% CI) | Adjusted* Odds Ratio (95% CI) | Adjusted* Odds Ratio (95% CI) |
| ||||
| Respiratory infections | 72 | 1.1 (0.71.8) | 0.8 (0.51.3) | 0.9 (0.71.3) |
| Asthma | 80 | 1.3 (0.63.0) | 1.0 (0.61.8) | 0.5 (0.31.0) |
| Other GI diseases | 74 | 0.8 (0.51.3) | 2.2 (1.33.8) | 1.0 (0.71.5) |
| Appendicitis | 82 | NE | NE | NE |
| Skin infections | 68 | 1.8 (0.84.4) | 1.4 (0.45.3) | 0.9 (0.61.6) |
| Seizures | 79 | 0.8 (0.41.6) | 0.8 (0.31.8) | 0.7 (0.51.0) |
| Extremity fractures | 92 | 0.9 (0.42.1) | 0.2 (01.3) | 1.2 (0.53.2) |
| Dehydration | 81 | 0.9 (0.61.4) | 0.8 (0.31.9) | 0.7 (0.41.1) |
| Gastroenteritis | 74 | 0.9 (0.42.0) | 0.6 (0.41.2) | 0.6 (0.41) |
| Head trauma | 92 | 0.6 (0.21.7) | 0.3 (02.1) | 1.0 (0.42.8) |
Among children with Observation Stays for 1 of the top 10 DGS subgroups, adjusted return ED visit rates were <3% and readmission rates were <1.6% within 3 days following the index stay. Thirty‐day readmission rates were highest following observation for other GI illnesses and seizures. In unadjusted analysis, Observation Stays for asthma, respiratory infections, and skin infections were associated with greater proportions of return ED visits when compared with 1‐Day Stays. Differences were no longer statistically significant after adjusting for SCS score, clustering by hospital, and the grouped treatment variable. Adjusted odds of readmission were significantly higher at 3 days following observation for other GI illnesses and lower at 30 days following observation for seizures when compared with 1‐Day Stays (Table 3).
DISCUSSION
In this first, multicenter longitudinal study of pediatric observation following an ED visit, we found that Observation Status code utilization has increased steadily over the past 6 years and, in 2007, the proportion of children admitted to observation status surpassed the proportion of children experiencing a 1‐day inpatient admission. Taken together, Short‐Stays made up more than 40% of the hospital‐based care delivered to children admitted from an ED. Stable trends in CMI over time suggest that observation status may be replacing inpatient status designated care for pediatric Short‐Stays in these hospitals. Our findings suggest the lines between outpatient observation and short‐stay inpatient care are becoming increasingly blurred. These trends have occurred in the setting of changing policies for hospital reimbursement, requirements for patients to meet criteria to qualify for inpatient admissions, and efforts to avoid stays deemed unnecessary or inappropriate by their brief duration.19 Therefore there is a growing need to understand the impact of children under observation on the structure, delivery, and financing of acute hospital care for children.
Our results also have implications for pediatric health services research that relies on hospital administrative databases that do not contain observation stays. Currently, observation stays are systematically excluded from many inpatient administrative datasets.11, 12 Analyses of datasets that do not account for observation stays likely result in underestimation of hospitalization rates and hospital resource utilization for children. This may be particularly important for high‐volume conditions, such as asthma and acute infections, for which children commonly require brief periods of hospital‐based care beyond an ED encounter. Data from pediatric observation status admissions should be consistently included in hospital administrative datasets to allow for more comprehensive analyses of hospital resource utilization among children.
Prior research has shown that the diagnoses commonly treated in pediatric observation units overlap with the diagnoses for which children experience 1‐Day Stays.1, 20 We found a similar pattern of conditions for which children were under Observation Status and 1‐Day Stays with comparable severity of illness between the groups in terms of SCS scores. Our findings imply a need to determine how and why hospitals differentiate Observation Status from 1‐Day‐Stay groups in order to improve the assignment of observation status. Assuming continued pressures from payers to provide more care in outpatient or observation settings, there is potential for expansion of dedicated observation services for children in the US. Without designated observation units or processes to group patients with lower severity conditions, there may be limited opportunities to realize more efficient hospital care simply through the application of the label of observation status.
For more than 30 years, observation services have been provided to children who require a period of monitoring to determine their response to therapy and the need for acute inpatient admission from the ED.21While we were not able to determine the location of care for observation status patients in this study, we know that few children's hospitals have dedicated observation units and, even when an observation unit is present, not all observation status patients are cared for in dedicated observation units.9 This, in essence, means that most children under observation status are cared for in virtual observation by inpatient teams using inpatient beds. If observation patients are treated in inpatient beds and consume the same resources as inpatients, then cost‐savings based on reimbursement contracts with payers may not reflect an actual reduction in services. Pediatric institutions will need to closely monitor the financial implications of observation status given the historical differences in payment for observation and inpatient care.
With more than 70% of children being discharged home following observation, our results are comparable to the published literature2, 5, 6, 22, 23 and guidelines for observation unit operations.24 Similar to prior studies,4, 15, 2530 our results also indicate that return visits and readmissions following observation are uncommon events. Our findings can serve as initial benchmarks for condition‐specific outcomes for pediatric observation care. Studies are needed both to identify the clinical characteristics predictive of successful discharge home from observation and to explore the hospital‐to‐hospital variability in outcomes for observation. Such studies are necessary to identify the most successful healthcare delivery models for pediatric observation stays.
LIMITATIONS
The primary limitation to our results is that data from a subset of freestanding children's hospitals may not reflect observation stays at other children's hospitals or the community hospitals that care for children across the US. Only 18 of 42 current PHIS member hospitals have provided both outpatient visit and inpatient stay data for each year of the study period and were considered eligible. In an effort to ensure the quality of observation stay data, we included the 16 hospitals that assigned observation charges to at least 90% of their observation status stays in the PHIS database. The exclusion of the 2 hospitals where <90% of observation status patients were assigned observation charges likely resulted in an underestimation of the utilization of observation status.
Second, there is potential for misclassification of patient type given institutional variations in the assignment of patient status. The PHIS database does not contain information about the factors that were considered in the assignment of observation status. At the time of admission from the ED, observation or inpatient status is assigned. While this decision is clearly reserved for the admitting physician, the process is not standardized across hospitals.9 Some institutions have Utilization Managers on site to help guide decision‐making, while others allow the assignment to be made by physicians without specific guidance. As a result, some patients may be assigned to observation status at admission and reassigned to inpatient status following Utilization Review, which may bias our results toward overestimation of the number of observation stays that converted to inpatient status.
The third limitation to our results relates to return visits. An accurate assessment of return visits is subject to the patient returning to the same hospital. If children do not return to the same hospital, our results would underestimate return visits and readmissions. In addition, we did not assess the reason for return visit as there was no way to verify if the return visit was truly related to the index visit without detailed chart review. Assuming children return to the same hospital for different reasons, our results would overestimate return visits associated with observation stays. We suspect that many 3‐day return visits result from the progression of acute illness or failure to respond to initial treatment, and 30‐day readmissions reflect recurrent hospital care needs related to chronic illnesses.
Lastly, severity classification is difficult when analyzing administrative datasets without physiologic patient data, and the SCS may not provide enough detail to reveal clinically important differences between patient groups.
CONCLUSIONS
Short‐stay hospitalizations following ED visits are common among children, and the majority of pediatric short‐stays are under observation status. Analyses of inpatient administrative databases that exclude observation stays likely result in an underestimation of hospital resource utilization for children. Efforts are needed to ensure that patients under observation status are accounted for in hospital administrative datasets used for pediatric health services research, and healthcare resource allocation, as it relates to hospital‐based care. While the clinical outcomes for observation patients appear favorable in terms of conversion to inpatient admissions and return visits, the financial implications of observation status care within children's hospitals are currently unknown.
- ,,,,,.Trends in high‐turnover stays among children hospitalized in the United States, 1993–2003.Pediatrics.2009;123(3):996–1002.
- ,,,,.Utilization and unexpected hospitalization rates of a pediatric emergency department 23‐hour observation unit.Pediatr Emerg Care.2008;24(9):589–594.
- ,,.When the patient requires observation not hospitalization.J Nurs Admin.1988;18(10):20–23.
- ,,,.Pediatric observation status beds on an inpatient unit: an integrated care model.Pediatr Emerg Care.2004;20(1):17–21.
- ,,.Use of an observation unit by a pediatric emergency department for common pediatric illnesses.Pediatr Emerg Care.2001;17(5):321–323.
- ,,.The pediatric hybrid observation unit: an analysis of 6477 consecutive patient encounters.Pediatrics.2005;115(5):e535–e542.
- ACEP. Emergency Department Crowding: High‐Impact Solutions. Task Force Report on Boarding.2008. Available at: http://www.acep.org/WorkArea/downloadasset.aspx?id=37960. Accessed July 21, 2010.
- ,,, et al.Children's hospitals do not acutely respond to high occupancy.Pediatrics.2010;125(5):974–981.
- ,,, et al.Differences in observation care practices in US freestanding children's hospitals: are they virtual or real?J Hosp Med.2011. Available at: http://www.cms.gov/transmittals/downloads/R770HO.pdf. Accessed January 10, 2011.
- CMS.Medicare Hospital Manual, Section 455.Department of Health and Human Services, Centers for Medicare and Medicaid Services;2001. Available at: http://www.hcup‐us.ahrq.gov/reports/methods/FinalReportonObservationStatus_v2Final.pdf. Accessed on May 3, 2007.
- HCUP.Methods Series Report #2002–3. Observation Status Related to U.S. Hospital Records. Healthcare Cost and Utilization Project.Rockville, MD:Agency for Healthcare Research and Quality;2002.
- ,.Design and operation of the National Hospital Discharge Survey: 1988 redesign.Vital Health Stat.2000;1(39):1–43.
- ,,,.Corticosteroids and mortality in children with bacterial meningitis.JAMA.2008;299(17):2048–2055.
- ,,,,.Intravenous immunoglobulin in children with streptococcal toxic shock syndrome.Clin Infect Dis.2009;49(9):1369–1376.
- ,,,.Impact of a short stay unit on asthma patients admitted to a tertiary pediatric hospital.Qual Manag Health Care.1997;6(1):14–22.
- ,,.An observation unit in a pediatric emergency department: one children's hospital's experience.J Emerg Nurs.2002;28(5):407–413.
- ,,,.Developing a diagnosis‐based severity classification system for use in emergency medical systems for children. Pediatric Academic Societies' Annual Meeting, Platform Presentation; Toronto, Canada;2007.
- ,,,,.A new diagnosis grouping system for child emergency department visits.Acad Emerg Med.2010;17(2):204–213.
- .Observation medicine: the healthcare system's tincture of time. In: Graff LG, ed.Principles of Observation Medicine.American College of Emergency Physicians;2010. Available at: http://www. acep.org/content.aspx?id=46142. Accessed February 18, 2011.
- ,,,,.High turnover stays for pediatric asthma in the United States: analysis of the 2006 Kids' Inpatient Database.Med Care.2010;48(9):827–833.
- ,,,,.Pediatric observation units in the United States: a systematic review.J Hosp Med.2010;5(3):172–182.
- ,.Observation unit in childrens hospital—adjunct to delivery and teaching of ambulatory pediatric care.N Y State J Med.1980;80(11):1684–1686.
- ,,.Short stay in an outpatient department. An alternative to hospitalization.Am J Dis Child.1972;123(2):128–132.
- ACEP.Practice Management Committee, American College of Emergency Physicians. Management of Observation Units.Irving, TX:American College of Emergency Physicians;1994.
- ,,,,.Return visits to a pediatric emergency department.Pediatr Emerg Care.2004;20(3):166–171.
- ,.Postreduction management of intussusception in a children's hospital emergency department.Pediatrics.2003;112(6 pt 1):1302–1307.
- ,,,,.Pediatric closed head injuries treated in an observation unit.Pediatr Emerg Care.2005;21(10):639–644.
- ,,,.Use of pediatric observation unit for treatment of children with dehydration caused by gastroenteritis.Pediatr Emerg Care.2006;22(1):1–6.
- ,,,.Children with asthma admitted to a pediatric observation unit.Pediatr Emerg Care.2005;21(10):645–649.
- ,,, et al.How well can hospital readmission be predicted in a cohort of hospitalized children? A retrospective, multicenter study.Pediatrics.2009;123(1):286–293.
In recent decades, hospital lengths of stay have decreased and there has been a shift toward outpatient management for many pediatric conditions. In 2003, one‐third of all children admitted to US hospitals experienced 1‐day inpatient stays, an increase from 19% in 1993.1 Some hospitals have developed dedicated observation units for the care of children, with select diagnoses, who are expected to respond to less than 24 hours of treatment.26 Expansion of observation services has been suggested as an approach to lessen emergency department (ED) crowding7 and alleviate high‐capacity conditions within hospital inpatient units.8
In contrast to care delivered in a dedicated observation unit, observation status is an administrative label applied to patients who do not meet inpatient criteria as defined by third parties such as InterQual. While the decision to admit a patient is ultimately at the discretion of the ordering physician, many hospitals use predetermined criteria to assign observation status to patients admitted to observation and inpatient units.9 Treatment provided under observation status is designated by hospitals and payers as outpatient care, even when delivered in an inpatient bed.10 As outpatient‐designated care, observation cases do not enter publicly available administrative datasets of hospital discharges that have traditionally been used to understand hospital resource utilization, including the National Hospital Discharge Survey and the Kid's Inpatient Database.11, 12
We hypothesize that there has been an increase in observation status care delivered to children in recent years, and that the majority of children under observation were discharged home without converting to inpatient status. To determine trends in pediatric observation status care, we conducted the first longitudinal, multicenter evaluation of observation status code utilization following ED treatment in a sample of US freestanding children's hospitals. In addition, we focused on the most recent year of data among top ranking diagnoses to assess the current state of observation status stay outcomes (including conversion to inpatient status and return visits).
METHODS
Data Source
Data for this multicenter retrospective cohort study were obtained from the Pediatric Health Information System (PHIS). Freestanding children's hospital's participating in PHIS account for approximately 20% of all US tertiary care children's hospitals. The PHIS hospitals provide resource utilization data including patient demographics, International Classification of Diseases, Ninth Revision (ICD‐9) diagnosis and procedure codes, and charges applied to each stay, including room and nursing charges. Data were de‐identified prior to inclusion in the database, however encrypted identification numbers allowed for tracking individual patients across admissions. Data quality and reliability were assured through a joint effort between the Child Health Corporation of America (CHCA; Shawnee Mission, KS) and participating hospitals as described previously.13, 14 In accordance with the Common Rule (45 CFR 46.102(f)) and the policies of The Children's Hospital of Philadelphia Institutional Review Board, this research, using a de‐identified dataset, was considered exempt from review.
Hospital Selection
Each year from 2004 to 2009, there were 18 hospitals participating in PHIS that reported data from both inpatient discharges and outpatient visits (including observation status discharges). To assess data quality for observation status stays, we evaluated observation status discharges for the presence of associated observation billing codes applied to charge records reported to PHIS including: 1) observation per hour, 2) ED observation time, or 3) other codes mentioning observation in the hospital charge master description document. The 16 hospitals with observation charges assigned to at least 90% of observation status discharges in each study year were selected for analysis.
Visit Identification
Within the 16 study hospitals, we identified all visits between January 1, 2004 and December 31, 2009 with ED facility charges. From these ED visits, we included any stays designated by the hospital as observation or inpatient status, excluding transfers and ED discharges.
Variable Definitions
Hospitals submitting records to PHIS assigned a single patient type to the episode of care. The Observation patient type was assigned to patients discharged from observation status. Although the duration of observation is often less than 24 hours, hospitals may allow a patient to remain under observation for longer durations.15, 16 Duration of stay is not defined precisely enough within PHIS to determine hours of inpatient care. Therefore, length of stay (LOS) was not used to determine observation status stays.
The Inpatient patient type was assigned to patients who were discharged from inpatient status, including those patients admitted to inpatient care from the ED and also those who converted to inpatient status from observation. Patients who converted from observation status to inpatient status during the episode of care could be identified through the presence of observation charge codes as described above.
Given the potential for differences in the application of observation status, we also identified 1‐Day Stays where discharge occurred on the day of, or the day following, an inpatient status admission. These 1‐Day Stays represent hospitalizations that may, by their duration, be suitable for care in an observation unit. We considered discharges in the Observation and 1‐Day Stay categories to be Short‐Stays.
DATA ANALYSIS
For each of the 6 years of study, we calculated the following proportions to determine trends over time: 1) the number of Observation Status admissions from the ED as a proportion of the total number of ED visits resulting in Observation or Inpatient admission, and 2) the number of 1‐Day Stays admitted from the ED as a proportion of the total number of ED visits resulting in Observation or Inpatient admissions. Trends were analyzed using linear regression. Trends were also calculated for the total volume of admissions from the ED and the case‐mix index (CMI). CMI was assessed to evaluate for changes in the severity of illness for children admitted from the ED over the study period. Each hospital's CMI was calculated as an average of their Observation and Inpatient Status discharges' charge weights during the study period. Charge weights were calculated at the All Patient Refined Diagnosis Related Groups (APR‐DRG)/severity of illness level (3M Health Information Systems, St Paul, MN) and were normalized national average charges derived by Thomson‐Reuters from their Pediatric Projected National Database. Weights were then assigned to each discharge based on the discharge's APR‐DRG and severity level assignment.
To assess the current outcomes for observation, we analyzed stays with associated observation billing codes from the most recent year of available data (2009). Stays with Observation patient type were considered to have been discharged from observation, while those with an Inpatient Status patient type were considered to have converted to an inpatient admission during the observation period.
Using the 2009 data, we calculated descriptive statistics for patient characteristics (eg, age, gender, payer) comparing Observation Stays, 1‐Day Stays, and longer‐duration Inpatient admissions using chi‐square statistics. Age was categorized using the American Academy of Pediatrics groupings: <30 days, 30 days1 year, 12 years, 34 years, 512 years, 1317 years, >18 years. Designated payer was categorized into government, private, and other, including self‐pay and uninsured groups.
We used the Severity Classification Systems (SCS) developed for pediatric emergency care to estimate severity of illness for the visit.17 In this 5‐level system, each ICD‐9 diagnosis code is associated with a score related to the intensity of ED resources needed to care for a child with that diagnosis. In our analyses, each case was assigned the maximal SCS category based on the highest severity ICD‐9 code associated with the stay. Within the SCS, a score of 1 indicates minor illness (eg, diaper dermatitis) and 5 indicates major illness (eg, septic shock). The proportions of visits within categorical SCS scores were compared for Observation Stays, 1‐Day Stays, and longer‐duration Inpatient admissions using chi‐square statistics.
We determined the top 10 ranking diagnoses for which children were admitted from the ED in 2009 using the Diagnosis Grouping System (DGS).18 The DGS was designed specifically to categorize pediatric ED visits into clinically meaningful groups. The ICD‐9 code for the principal discharge diagnosis was used to assign records to 1 of the 77 DGS subgroups. Within each of the top ranking DGS subgroups, we determined the proportion of Observation Stays, 1‐Day Stays, and longer‐duration Inpatient admissions.
To provide clinically relevant outcomes of Observation Stays for common conditions, we selected stays with observation charges from within the top 10 ranking observation stay DGS subgroups in 2009. Outcomes for observation included: 1) immediate outcome of the observation stay (ie, discharge or conversion to inpatient status), 2) return visits to the ED in the 3 days following observation, and 3) readmissions to the hospital in the 3 and 30 days following observation. Bivariate comparisons of return visits and readmissions for Observation versus 1‐Day Stays within DGS subgroups were analyzed using chi‐square tests. Multivariate analyses of return visits and readmissions were conducted using Generalized Estimating Equations adjusting for severity of illness by SCS score and clustering by hospital. To account for local practice patterns, we also adjusted for a grouped treatment variable that included the site level proportion of children admitted to Observation Status, 1‐Day‐Stays, and longer Inpatient admissions. All statistical analyses were performed using SAS (version 9.2, SAS Institute, Inc, Cary, NC); P values <0.05 were considered statistically significant.
RESULTS
Trends in Short‐Stays
An increase in proportion of Observation Stays was mirrored by a decrease in proportion of 1‐Day Stays over the study period (Figure 1). In 2009, there were 1.4 times more Observation Stays than 1‐Day Stays (25,653 vs 18,425) compared with 14,242 and 20,747, respectively, in 2004. This shift toward more Observation Stays occurred as hospitals faced a 16% increase in the total number of admissions from the ED (91,318 to 108,217) and change in CMI from 1.48 to 1.51. Over the study period, roughly 40% of all admissions from the ED were Short‐Stays (Observation and 1‐Day Stays). Median LOS for Observation Status stays was 1 day (interquartile range [IQR]: 11).
Patient Characteristics in 2009
Table 1 presents comparisons between Observation, 1‐Day Stays, and longer‐duration Inpatient admissions. Of potential clinical significance, children under Observation Status were slightly younger (median, 4.0 years; IQR: 1.310.0) when compared with children admitted for 1‐Day Stays (median, 5.0 years; IQR: 1.411.4; P < 0.001) and longer‐duration Inpatient stays (median, 4.7 years; IQR: 0.912.2; P < 0.001). Nearly two‐thirds of Observation Status stays had SCS scores of 3 or lower compared with less than half of 1‐Day Stays and longer‐duration Inpatient admissions.
| Short‐Stays | LOS >1 Day | |||||
|---|---|---|---|---|---|---|
| Observation | 1‐Day Stay | Longer Admission | ||||
| N = 25,653* (24%) | N = 18,425* (17%) | P Value Comparing Observation to 1‐Day Stay | N = 64,139* (59%) | P Value Comparing Short‐Stays to LOS >1 Day | ||
| ||||||
| Sex | Male | 14,586 (57) | 10,474 (57) | P = 0.663 | 34,696 (54) | P < 0.001 |
| Female | 11,000 (43) | 7,940 (43) | 29,403 (46) | |||
| Payer | Government | 13,247 (58) | 8,944 (55) | P < 0.001 | 35,475 (61) | P < 0.001 |
| Private | 7,123 (31) | 5,105 (32) | 16,507 (28) | |||
| Other | 2,443 (11) | 2,087 (13) | 6,157 (11) | |||
| Age | <30 days | 793 (3) | 687 (4) | P < 0.001 | 3,932 (6) | P < 0.001 |
| 30 days1 yr | 4,499 (17) | 2,930 (16) | 13,139 (21) | |||
| 12 yr | 5,793 (23) | 3,566 (19) | 10,229 (16) | |||
| 34 yr | 3,040 (12) | 2,056 (11) | 5,551 (9) | |||
| 512 yr | 7,427 (29) | 5,570 (30) | 17,057 (27) | |||
| 1317 yr | 3,560 (14) | 3,136 (17) | 11,860 (18) | |||
| >17 yr | 541 (2) | 480 (3) | 2,371 (4) | |||
| Race | White | 17,249 (70) | 12,123 (70) | P < 0.001 | 40,779 (67) | P <0.001 |
| Black | 6,298 (25) | 4,216 (25) | 16,855 (28) | |||
| Asian | 277 (1) | 295 (2) | 995 (2) | |||
| Other | 885 (4) | 589 (3) | 2,011 (3) | |||
| SCS | 1 Minor illness | 64 (<1) | 37 (<1) | P < 0.001 | 84 (<1) | P < 0.001 |
| 2 | 1,190 (5) | 658 (4) | 1,461 (2) | |||
| 3 | 14,553 (57) | 7,617 (42) | 20,760 (33) | |||
| 4 | 8,994 (36) | 9,317 (51) | 35,632 (56) | |||
| 5 Major illness | 490 (2) | 579 (3) | 5,689 (9) | |||
In 2009, the top 10 DGS subgroups accounted for half of all admissions from the ED. The majority of admissions for extremity fractures, head trauma, dehydration, and asthma were Short‐Stays, as were roughly 50% of admissions for seizures, appendicitis, and gastroenteritis (Table 2). Respiratory infections and asthma were the top 1 and 2 ranking DGS subgroups for Observation Stays, 1‐Day Stays, and longer‐duration Inpatient admissions. While rank order differed, 9 of the 10 top ranking Observation Stay DGS subgroups were also top ranking DGS subgroups for 1‐Day Stays. Gastroenteritis ranked 10th among Observation Stays and 11th among 1‐Day Stays. Diabetes mellitus ranked 26th among Observation Stays compared with 8th among 1‐Day Stays.
| Short‐Stays | LOS >1 Day | ||
|---|---|---|---|
| % Observation | % 1‐Day Stay | % Longer Admission | |
| |||
| All admissions from the ED | 23.7 | 17.0 | 59.3 |
| n = 108,217 | |||
| Respiratory infections | 22.3 | 15.3 | 62.4 |
| n = 14,455 (13%) | |||
| Asthma | 32.0 | 23.8 | 44.2 |
| n = 8,853 (8%) | |||
| Other GI diseases | 24.1 | 16.2 | 59.7 |
| n = 6,519 (6%) | |||
| Appendicitis | 21.0 | 29.5 | 49.5 |
| n = 4,480 (4%) | |||
| Skin infections | 20.7 | 14.3 | 65.0 |
| n = 4,743 (4%) | |||
| Seizures | 29.5 | 22 | 48.5 |
| n = 4,088 (4%) | |||
| Extremity fractures | 49.4 | 20.5 | 30.1 |
| n = 3,681 (3%) | |||
| Dehydration | 37.8 | 19.0 | 43.2 |
| n = 2,773 (3%) | |||
| Gastroenteritis | 30.3 | 18.7 | 50.9 |
| n = 2,603 (2%) | |||
| Head trauma | 44.1 | 43.9 | 32.0 |
| n = 2,153 (2%) | |||
Average maximum SCS scores were clinically comparable for Observation and 1‐Day Stays and generally lower than for longer‐duration Inpatient admissions within the top 10 most common DGS subgroups. Average maximum SCS scores were statistically lower for Observation Stays compared with 1‐Day Stays for respiratory infections (3.2 vs 3.4), asthma (3.4 vs 3.6), diabetes (3.5 vs 3.8), gastroenteritis (3.0 vs 3.1), other gastrointestinal diseases (3.2 vs 3.4), head trauma (3.3 vs 3.5), and extremity fractures (3.2 vs 3.4) (P < 0.01). There were no differences in SCS scores for skin infections (SCS = 3.0) and appendicitis (SCS = 4.0) when comparing Observation and 1‐Day Stays.
Outcomes for Observation Stays in 2009
Within 6 of the top 10 DGS subgroups for Observation Stays, >75% of patients were discharged home from Observation Status (Table 3). Mean LOS for stays that converted from Observation to Inpatient Status ranged from 2.85 days for extremity fractures to 4.66 days for appendicitis.
| Return to ED in 3 Days n = 421 (1.6%) | Hospital Readmissions in 3 Days n = 247 (1.0%) | Hospital Readmissions in 30 Days n = 819 (3.2%) | ||
|---|---|---|---|---|
| DGS subgroup | % Discharged From Observation | Adjusted* Odds Ratio (95% CI) | Adjusted* Odds Ratio (95% CI) | Adjusted* Odds Ratio (95% CI) |
| ||||
| Respiratory infections | 72 | 1.1 (0.71.8) | 0.8 (0.51.3) | 0.9 (0.71.3) |
| Asthma | 80 | 1.3 (0.63.0) | 1.0 (0.61.8) | 0.5 (0.31.0) |
| Other GI diseases | 74 | 0.8 (0.51.3) | 2.2 (1.33.8) | 1.0 (0.71.5) |
| Appendicitis | 82 | NE | NE | NE |
| Skin infections | 68 | 1.8 (0.84.4) | 1.4 (0.45.3) | 0.9 (0.61.6) |
| Seizures | 79 | 0.8 (0.41.6) | 0.8 (0.31.8) | 0.7 (0.51.0) |
| Extremity fractures | 92 | 0.9 (0.42.1) | 0.2 (01.3) | 1.2 (0.53.2) |
| Dehydration | 81 | 0.9 (0.61.4) | 0.8 (0.31.9) | 0.7 (0.41.1) |
| Gastroenteritis | 74 | 0.9 (0.42.0) | 0.6 (0.41.2) | 0.6 (0.41) |
| Head trauma | 92 | 0.6 (0.21.7) | 0.3 (02.1) | 1.0 (0.42.8) |
Among children with Observation Stays for 1 of the top 10 DGS subgroups, adjusted return ED visit rates were <3% and readmission rates were <1.6% within 3 days following the index stay. Thirty‐day readmission rates were highest following observation for other GI illnesses and seizures. In unadjusted analysis, Observation Stays for asthma, respiratory infections, and skin infections were associated with greater proportions of return ED visits when compared with 1‐Day Stays. Differences were no longer statistically significant after adjusting for SCS score, clustering by hospital, and the grouped treatment variable. Adjusted odds of readmission were significantly higher at 3 days following observation for other GI illnesses and lower at 30 days following observation for seizures when compared with 1‐Day Stays (Table 3).
DISCUSSION
In this first, multicenter longitudinal study of pediatric observation following an ED visit, we found that Observation Status code utilization has increased steadily over the past 6 years and, in 2007, the proportion of children admitted to observation status surpassed the proportion of children experiencing a 1‐day inpatient admission. Taken together, Short‐Stays made up more than 40% of the hospital‐based care delivered to children admitted from an ED. Stable trends in CMI over time suggest that observation status may be replacing inpatient status designated care for pediatric Short‐Stays in these hospitals. Our findings suggest the lines between outpatient observation and short‐stay inpatient care are becoming increasingly blurred. These trends have occurred in the setting of changing policies for hospital reimbursement, requirements for patients to meet criteria to qualify for inpatient admissions, and efforts to avoid stays deemed unnecessary or inappropriate by their brief duration.19 Therefore there is a growing need to understand the impact of children under observation on the structure, delivery, and financing of acute hospital care for children.
Our results also have implications for pediatric health services research that relies on hospital administrative databases that do not contain observation stays. Currently, observation stays are systematically excluded from many inpatient administrative datasets.11, 12 Analyses of datasets that do not account for observation stays likely result in underestimation of hospitalization rates and hospital resource utilization for children. This may be particularly important for high‐volume conditions, such as asthma and acute infections, for which children commonly require brief periods of hospital‐based care beyond an ED encounter. Data from pediatric observation status admissions should be consistently included in hospital administrative datasets to allow for more comprehensive analyses of hospital resource utilization among children.
Prior research has shown that the diagnoses commonly treated in pediatric observation units overlap with the diagnoses for which children experience 1‐Day Stays.1, 20 We found a similar pattern of conditions for which children were under Observation Status and 1‐Day Stays with comparable severity of illness between the groups in terms of SCS scores. Our findings imply a need to determine how and why hospitals differentiate Observation Status from 1‐Day‐Stay groups in order to improve the assignment of observation status. Assuming continued pressures from payers to provide more care in outpatient or observation settings, there is potential for expansion of dedicated observation services for children in the US. Without designated observation units or processes to group patients with lower severity conditions, there may be limited opportunities to realize more efficient hospital care simply through the application of the label of observation status.
For more than 30 years, observation services have been provided to children who require a period of monitoring to determine their response to therapy and the need for acute inpatient admission from the ED.21While we were not able to determine the location of care for observation status patients in this study, we know that few children's hospitals have dedicated observation units and, even when an observation unit is present, not all observation status patients are cared for in dedicated observation units.9 This, in essence, means that most children under observation status are cared for in virtual observation by inpatient teams using inpatient beds. If observation patients are treated in inpatient beds and consume the same resources as inpatients, then cost‐savings based on reimbursement contracts with payers may not reflect an actual reduction in services. Pediatric institutions will need to closely monitor the financial implications of observation status given the historical differences in payment for observation and inpatient care.
With more than 70% of children being discharged home following observation, our results are comparable to the published literature2, 5, 6, 22, 23 and guidelines for observation unit operations.24 Similar to prior studies,4, 15, 2530 our results also indicate that return visits and readmissions following observation are uncommon events. Our findings can serve as initial benchmarks for condition‐specific outcomes for pediatric observation care. Studies are needed both to identify the clinical characteristics predictive of successful discharge home from observation and to explore the hospital‐to‐hospital variability in outcomes for observation. Such studies are necessary to identify the most successful healthcare delivery models for pediatric observation stays.
LIMITATIONS
The primary limitation to our results is that data from a subset of freestanding children's hospitals may not reflect observation stays at other children's hospitals or the community hospitals that care for children across the US. Only 18 of 42 current PHIS member hospitals have provided both outpatient visit and inpatient stay data for each year of the study period and were considered eligible. In an effort to ensure the quality of observation stay data, we included the 16 hospitals that assigned observation charges to at least 90% of their observation status stays in the PHIS database. The exclusion of the 2 hospitals where <90% of observation status patients were assigned observation charges likely resulted in an underestimation of the utilization of observation status.
Second, there is potential for misclassification of patient type given institutional variations in the assignment of patient status. The PHIS database does not contain information about the factors that were considered in the assignment of observation status. At the time of admission from the ED, observation or inpatient status is assigned. While this decision is clearly reserved for the admitting physician, the process is not standardized across hospitals.9 Some institutions have Utilization Managers on site to help guide decision‐making, while others allow the assignment to be made by physicians without specific guidance. As a result, some patients may be assigned to observation status at admission and reassigned to inpatient status following Utilization Review, which may bias our results toward overestimation of the number of observation stays that converted to inpatient status.
The third limitation to our results relates to return visits. An accurate assessment of return visits is subject to the patient returning to the same hospital. If children do not return to the same hospital, our results would underestimate return visits and readmissions. In addition, we did not assess the reason for return visit as there was no way to verify if the return visit was truly related to the index visit without detailed chart review. Assuming children return to the same hospital for different reasons, our results would overestimate return visits associated with observation stays. We suspect that many 3‐day return visits result from the progression of acute illness or failure to respond to initial treatment, and 30‐day readmissions reflect recurrent hospital care needs related to chronic illnesses.
Lastly, severity classification is difficult when analyzing administrative datasets without physiologic patient data, and the SCS may not provide enough detail to reveal clinically important differences between patient groups.
CONCLUSIONS
Short‐stay hospitalizations following ED visits are common among children, and the majority of pediatric short‐stays are under observation status. Analyses of inpatient administrative databases that exclude observation stays likely result in an underestimation of hospital resource utilization for children. Efforts are needed to ensure that patients under observation status are accounted for in hospital administrative datasets used for pediatric health services research, and healthcare resource allocation, as it relates to hospital‐based care. While the clinical outcomes for observation patients appear favorable in terms of conversion to inpatient admissions and return visits, the financial implications of observation status care within children's hospitals are currently unknown.
- ,,,,,.Trends in high‐turnover stays among children hospitalized in the United States, 1993–2003.Pediatrics.2009;123(3):996–1002.
- ,,,,.Utilization and unexpected hospitalization rates of a pediatric emergency department 23‐hour observation unit.Pediatr Emerg Care.2008;24(9):589–594.
- ,,.When the patient requires observation not hospitalization.J Nurs Admin.1988;18(10):20–23.
- ,,,.Pediatric observation status beds on an inpatient unit: an integrated care model.Pediatr Emerg Care.2004;20(1):17–21.
- ,,.Use of an observation unit by a pediatric emergency department for common pediatric illnesses.Pediatr Emerg Care.2001;17(5):321–323.
- ,,.The pediatric hybrid observation unit: an analysis of 6477 consecutive patient encounters.Pediatrics.2005;115(5):e535–e542.
- ACEP. Emergency Department Crowding: High‐Impact Solutions. Task Force Report on Boarding.2008. Available at: http://www.acep.org/WorkArea/downloadasset.aspx?id=37960. Accessed July 21, 2010.
- ,,, et al.Children's hospitals do not acutely respond to high occupancy.Pediatrics.2010;125(5):974–981.
- ,,, et al.Differences in observation care practices in US freestanding children's hospitals: are they virtual or real?J Hosp Med.2011. Available at: http://www.cms.gov/transmittals/downloads/R770HO.pdf. Accessed January 10, 2011.
- CMS.Medicare Hospital Manual, Section 455.Department of Health and Human Services, Centers for Medicare and Medicaid Services;2001. Available at: http://www.hcup‐us.ahrq.gov/reports/methods/FinalReportonObservationStatus_v2Final.pdf. Accessed on May 3, 2007.
- HCUP.Methods Series Report #2002–3. Observation Status Related to U.S. Hospital Records. Healthcare Cost and Utilization Project.Rockville, MD:Agency for Healthcare Research and Quality;2002.
- ,.Design and operation of the National Hospital Discharge Survey: 1988 redesign.Vital Health Stat.2000;1(39):1–43.
- ,,,.Corticosteroids and mortality in children with bacterial meningitis.JAMA.2008;299(17):2048–2055.
- ,,,,.Intravenous immunoglobulin in children with streptococcal toxic shock syndrome.Clin Infect Dis.2009;49(9):1369–1376.
- ,,,.Impact of a short stay unit on asthma patients admitted to a tertiary pediatric hospital.Qual Manag Health Care.1997;6(1):14–22.
- ,,.An observation unit in a pediatric emergency department: one children's hospital's experience.J Emerg Nurs.2002;28(5):407–413.
- ,,,.Developing a diagnosis‐based severity classification system for use in emergency medical systems for children. Pediatric Academic Societies' Annual Meeting, Platform Presentation; Toronto, Canada;2007.
- ,,,,.A new diagnosis grouping system for child emergency department visits.Acad Emerg Med.2010;17(2):204–213.
- .Observation medicine: the healthcare system's tincture of time. In: Graff LG, ed.Principles of Observation Medicine.American College of Emergency Physicians;2010. Available at: http://www. acep.org/content.aspx?id=46142. Accessed February 18, 2011.
- ,,,,.High turnover stays for pediatric asthma in the United States: analysis of the 2006 Kids' Inpatient Database.Med Care.2010;48(9):827–833.
- ,,,,.Pediatric observation units in the United States: a systematic review.J Hosp Med.2010;5(3):172–182.
- ,.Observation unit in childrens hospital—adjunct to delivery and teaching of ambulatory pediatric care.N Y State J Med.1980;80(11):1684–1686.
- ,,.Short stay in an outpatient department. An alternative to hospitalization.Am J Dis Child.1972;123(2):128–132.
- ACEP.Practice Management Committee, American College of Emergency Physicians. Management of Observation Units.Irving, TX:American College of Emergency Physicians;1994.
- ,,,,.Return visits to a pediatric emergency department.Pediatr Emerg Care.2004;20(3):166–171.
- ,.Postreduction management of intussusception in a children's hospital emergency department.Pediatrics.2003;112(6 pt 1):1302–1307.
- ,,,,.Pediatric closed head injuries treated in an observation unit.Pediatr Emerg Care.2005;21(10):639–644.
- ,,,.Use of pediatric observation unit for treatment of children with dehydration caused by gastroenteritis.Pediatr Emerg Care.2006;22(1):1–6.
- ,,,.Children with asthma admitted to a pediatric observation unit.Pediatr Emerg Care.2005;21(10):645–649.
- ,,, et al.How well can hospital readmission be predicted in a cohort of hospitalized children? A retrospective, multicenter study.Pediatrics.2009;123(1):286–293.
Copyright © 2012 Society of Hospital Medicine
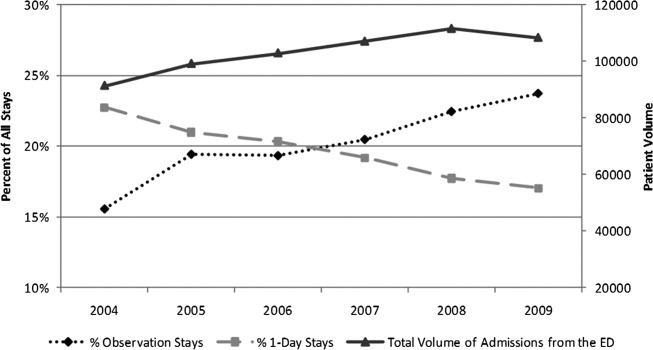
Correction of CSF Protein
Traumatic lumbar puncture (LP) occurs when peripheral blood is introduced into the cerebrospinal fluid (CSF) as a result of needle trauma, which causes bleeding into the subarachnoid space. Traumatic LPs occur in up to 30% of LPs performed in children.1, 2 In addition to affecting the CSF white blood cell count, the presence of CSF red blood cells (RBCs) is associated with higher CSF protein concentrations due to the higher protein concentration in plasma compared with CSF and to the release of protein from lysed red blood cells. CSF protein concentration has been used in clinical decision rules for the prediction of bacterial meningitis in children.3 Elevated protein levels are difficult to interpret in cases of traumatic LP, and a diagnosis of bacterial meningitis may be more difficult to exclude on the basis of CSF test results.4
The interpretation of CSF protein levels is further complicated in the youngest infants due to both the changing composition of the CSF as well as the higher rates of traumatic LPs.5 Therefore, studies establishing a correction factor, adjusting observed CSF protein levels for the presence of CSF RBCs, that included predominantly older children may not be generalizable to neonates and young infants.6 We sought to determine the relationship between CSF RBC count and CSF protein in infants 56 days of age who underwent LP in the emergency department (ED).
METHODS
Study Design, Setting, and Participants
This cross‐sectional study was performed at The Children's Hospital of Philadelphia (Philadelphia, PA), an urban, tertiary care children's hospital. The Committees for the Protection of Human Subjects approved this study with a waiver of informed consent.
Infants 56 days of age and younger were eligible for inclusion if they had an LP performed as part of their ED evaluation between January 1, 2005 and July 31, 2009. At The Children's Hospital of Philadelphia, infants 56 days and younger routinely receive LPs for evaluation of fever.79 Patients undergoing LP in the ED were identified using computerized order entry records as previously described.5, 10
We excluded patients with conditions known to elevate CSF protein, including: serious bacterial infection (bacterial meningitis, urinary tract infection, bacteremia, pneumonia, septic arthritis, and bacterial gastroenteritis),11 presence of a ventricular shunt, aseptic meningitis (positive CSF enteroviral polymerase chain reaction or CSF herpes simplex virus polymerase chain reaction), congenital infections (eg, syphilis), seizure prior to presentation, and elevated bilirubin (if serum bilirubin was obtained). Due to the fact that grossly bloody CSF samples are difficult to interpret, we excluded those with a CSF RBC count >150,000 cells/mm3, a cutoff representing the 99th percentile of CSF RBC values in the cohort after applying other exclusion criteria.
Study Definitions
Bacterial meningitis was defined as either the isolation of a known bacterial pathogen from the CSF or, in patients who received antibiotics prior to evaluation, the combination of CSF pleocytosis and bacteria reported on CSF Gram stain. Bacteremia was defined as the isolation of a known bacterial pathogen from blood cultures excluding commensal skin flora. Urinary tract infection was defined as growth of a single known pathogen meeting 1 of 3 criteria: (1) 1000 colony‐forming units per mL for urine cultures obtained by suprapubic aspiration, (2) 50,000 colony‐forming units per mL from a catheterized specimen, or (3) 10,000 colony‐forming units per mL from a catheterized specimen in association with a positive urinalysis.1214
Statistical Analysis
Data analysis was performed using STATA version 12 (Stata Corp, College Station, TX). Linear regression was used to determine the association between CSF RBC and CSF protein. We analyzed the following groups of children: 1) all eligible patients; 2) children 28 days versus children >28 days; 3) vaginal versus cesarean delivery; and 4) patients without CSF pleocytosis. In the primary subanalysis, CSF pleocytosis was defined as CSF white blood cells (WBCs) >19 cells/mm3 for infants 28 days of age and CSF WBCs >9 cells/mm3 for infants 29 days of age, using reference values established by Kestenbaum et al.10 Alternate definitions of CSF pleocytosis were also examined using reference values proposed by Byington et al15 (age 28 days, >18 cells/mm3; age >29 days, >8.5 cells/mm3) and Chadwick et al16(age 0‐7 days, >26 cells/mm3; age 8‐28 days, >9 cells/mm3; age 29‐49 days, >8 cells/mm3; and age 50‐56 days, >7 cells/mm3). We did not correct CSF WBCs for the RBC count because prior studies suggest that such correction factors do not provide any advantage over uncorrected values.17 Finally, linear regression analysis was repeated while including subjects with >150,000 RBC/mm3 to determine the effect of including those patients on the association of CSF RBC count and protein concentrations. Subjects with grossly bloody CSF specimens, defined a priori as a CSF RBC >1,000,000/mm3, were excluded from this subanalysis.
RESULTS
There were 1986 infants, 56 days of age or younger, who underwent LP in the ED during the study period. Patients were excluded for the following reasons: missing medical record number (n = 16); missing CSF WBC, CSF RBC, or CSF protein values (n = 290); conditions known to elevate CSF protein concentrations (n = 426, as follows: presence of a ventricular shunt device [n = 48], serious bacterial infection [n = 149], congenital infection [n = 2], positive CSF polymerase chain reaction [PCR] test for either enterovirus or herpes simplex virus [n = 97], seizure prior to presentation [n = 98], or elevated serum bilirubin [n = 32]). An additional 13 patients with a CSF RBC count >150,000 cells/mm3 were also excluded.
For the remaining 1241 study infants, the median age was 34 days (interquartile range: 19 days‐46 days) and 554 patients (45%) were male. The median CSF RBC count was 40 cells/mm3 (interquartile range: 2‐1080 cells/mm3); 11.8% of patients had a CSF RBC count >10,000 cells/mm3.
CSF protein increased linearly with increasing CSF RBCs (Figure 1). The increase in the CSF protein concentration of 1.9 mg/dL per 1000 CSF RBCs for all patients was similar between different age groups and delivery types (Table 1). Restricting analysis to those patients without pleocytosis also yielded comparable results; applying 2 other definitions of pleocytosis did not change the magnitude of the association (Table 1).
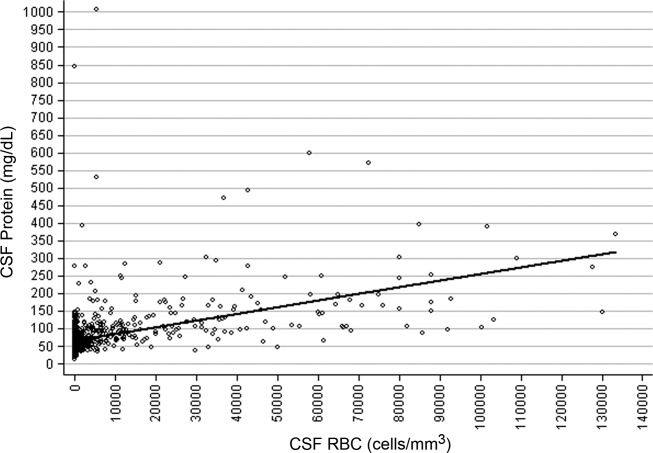
| Patient Group | No. of Patients | Change in CSF protein (mg/dL) per 1000 RBCs (95% CI) |
|---|---|---|
| ||
| All eligible | 1241 | 1.9 (1.7‐2.1) |
| No CSF pleocytosis* | 1085 | 2.0 (1.7‐2.4) |
| Age | ||
| Age 28 days | 481 | 1.9 (1.5‐2.3) |
| Age >28 days | 760 | 1.9 (1.7‐2.1) |
| Mode of delivery | ||
| Vaginal | 741 | 1.9 (1.7‐2.2) |
| Cesarean | 366 | 1.7 (1.4‐2.0) |
In a subanalysis, we then included subjects with a CSF RBC count >150,000/mm3; one extreme outlier with a CSF RBC equal to 3,160,000/mm3 remained excluded. Inclusion of more traumatic samples lessened the overall correction factor. The CSF protein increased by 1.22 mg/dL (95% confidence interval: 1.14‐1.29 mg/dL) per 1000 RBC/mm3 increase in the CSF. In the subset without CSF pleocytosis, the CSF protein increased by 1.44 mg/dL (95% confidence interval: 1.33‐1.57 mg/dL) per 1000 RBC/mm3.
Three children had high CSF protein values (>500 mg/dL) despite the relative paucity of CSF RBCs. Two of these infants had respiratory syncytial virus bronchiolitis; neither infant had signs or symptoms of neurological illness. While details of the labor and delivery were not available, the CSF sample for one of these infants was reported to have xanthochromia, and the other infant was reported to have had a traumatic LP with a CSF sample that subsequently cleared. The third infant had fever without a specific source identified, but had a birth history of vaginal delivery and prolonged labor. The CSF sample from LP for this patient was reported as grossly bloody by the performing clinicians and by the Clinical Microbiology Laboratory, despite a CSF red blood cell count of only 5500 cells/mm3.
DISCUSSION
In a large cohort of infants 56 days of age, CSF protein increased by approximately 2 mg/dL for every 1000 cell/mm3 increase in CSF RBCs. This correction factor is higher than previously reported correction factors from studies including older infants and children.6, 18 Some of this difference may be explained by the presence of old blood related to the trauma of labor and delivery. Previous work has demonstrated that the presence of xanthochromia, another RBC breakdown product, in the CSF of young infants was associated with maternal labor and elevated CSF protein.19 Consistent with this hypothesis, the correction factor was nominally higher in those infants born by vaginal delivery compared with those born by cesarean section.
Several infants in our study had high CSF protein levels despite a paucity of CSF RBCs. By convention at our institution, the protein and glucose values are determined from the second tube, and the WBCs and RBCs are determined from the third tube. However, we could not determine the order in which the specimens for protein and RBCs were collected for individual specimens. Additionally, it is possible that delayed clearance of blood from a traumatic LP would cause the CSF protein level to be high, as measured in the second tube, but lead to few RBCs in the third tube. These circumstances could explain the discrepancy between CSF protein and CSF RBCs counts for some patients.
The CSF protein adjustment factor for infants 56 days of age in our study was almost twice the correction of 1.1 mg/dL for every 1000 RBC increase reported by Nigrovic et al among infants 90 days of age.6 There are differences in the design of the 2 studies. We excluded subjects with exceedingly large numbers of CSF RBCs and restricted inclusion to those 56 days of age or younger. When subjects with >150,000 RBCs/mm3 were included, the correction decreased to a value comparable to that reported by Nigrovic et al.6 Therefore, it is possible that inclusion of subjects with grossly bloody specimens in prior studies skewed the association between CSF protein and CSF RBCs. The number of subjects in our cohort with >150,000 CSF RBCs was too small to calculate a relevant correction factor for infants with exceedingly high CSF RBC counts.
The results of this study should be considered in the context of several limitations. Details regarding labor and delivery were not available. We suspect that old blood related to the trauma of birth provides partial explanation for the higher correction factor in neonates and young infants compared with older children. However, differences in CSF blood‐brain barrier permeability may also contribute to these differences, independent of the CSF RBC count. Additionally, though the study population included a large number of neonates and young infants, a relatively small proportion of subjects had high CSF RBC counts. Therefore, our results may not be generalizable to those with exceedingly high CSF RBCs. Finally, available clinical prediction rules to identify patients with CSF pleocytosis, who are at very low risk for bacterial meningitis, include CSF protein as a predictor.3, 20, 21 Although CSF protein in children with traumatic LPs may need adjustment prior to application of the clinical prediction rule, further study is needed before implementing this approach.
In conclusion, we found that CSF protein concentrations increased by approximately 2 mg/dL for every 1000 CSF RBCs. Correction of CSF protein for those with extremely high CSF RBCs may not be appropriate, as conventional linear models do not apply. These data may assist clinicians in interpreting CSF protein concentrations in infants 56 days of age and younger in the context of traumatic LPs.
- ,,,,,.Local anesthetic and stylet styles: factors associated with resident lumbar puncture success.Pediatrics.2006;117:876–881.
- ,,.Risk factors for traumatic or unsuccessful lumbar punctures in children.Ann Emerg Med.2007;49:762–771.
- ,,, et al.Clinical prediction rule for identifying children with cerebrospinal fluid pleocytosis at very low risk of bacterial meningitis.JAMA.2007;297:52–60.
- ,,.Interpretation of traumatic lumbar punctures: who can go home?Pediatrics.2003;111:525–528.
- ,,,,.Age‐specific reference values for cerebrospinal fluid protein concentration in neonates and young infants.J Hosp Med.2011;6:22–27.
- ,,.Correction of cerebrospinal fluid protein for the presence of red blood cells in children with a traumatic lumbar puncture.J Pediatr.2011;159:158–159.
- ,,.Failure of infant observation scales in detecting serious illness in febrile, 4‐ to 8‐week‐old infants.Pediatrics.1990;85:1040–1043.
- ,.Unpredictability of serious bacterial illness in febrile infants from birth to 1 month of age.Arch Pediatr Adolesc Med.1999;153:508–511.
- ,,.Outpatient management without antibiotics of fever in selected infants.N Engl J Med.1993;329:1437–1441.
- ,,,,.Defining cerebrospinal fluid white blood cell count reference values in neonates and young infants.Pediatrics.2010;125:257–264.
- ,,,,.Sterile cerebrospinal fluid pleocytosis in young infants with urinary tract infections.J Pediatr.2008;153:290–292.
- ,,, et al.Clinical and demographic factors associated with urinary tract infection in young febrile infants.Pediatrics.2005;116:644–648.
- ,,,,.Prevalence of urinary tract infection in febrile young children in the emergency department.Pediatrics.1998;102:e16.
- ,,,,,.Prevalence of urinary tract infection in febrile infants.J Pediatr.1993;123:17–23.
- ,,.Normative cerebrospinal fluid profiles in febrile infants.J Pediatr.2011;158:130–134.
- ,,,.Cerebrospinal fluid characteristics of infants who present to the emergency department with fever: establishing normal values by week of age.Pediatr Infect Dis J.2011;30:e63–e67.
- ,.Corrections for leukocytes and percent of neutrophils do not match observations in blood‐contaminated cerebrospinal fluid and have no value over uncorrected cells for diagnosis.Pediatr Infect Dis J.2006;25:8–11.
- ,,,,.Distinguishing cerebrospinal fluid abnormalities in children with bacterial meningitis and traumatic lumbar puncture.J Infect Dis.1990;162:251–254.
- ,,,.Cerebrospinal fluid xanthochromia in newborns is related to maternal labor before delivery.Pediatrics.2007;120:e1212–e1216.
- ,.Accuracy and test characteristics of ancillary tests of cerebrospinal fluid for predicting acute bacterial meningitis in children with low white blood cell counts in cerebrospinal fluid.Acad Emerg Med.2005;12:303–309.
- ,,,.A decision rule for predicting bacterial meningitis in children with cerebrospinal fluid pleocytosis when gram stain is negative or unavailable.Acad Emerg Med.2008;15:437–444.
Traumatic lumbar puncture (LP) occurs when peripheral blood is introduced into the cerebrospinal fluid (CSF) as a result of needle trauma, which causes bleeding into the subarachnoid space. Traumatic LPs occur in up to 30% of LPs performed in children.1, 2 In addition to affecting the CSF white blood cell count, the presence of CSF red blood cells (RBCs) is associated with higher CSF protein concentrations due to the higher protein concentration in plasma compared with CSF and to the release of protein from lysed red blood cells. CSF protein concentration has been used in clinical decision rules for the prediction of bacterial meningitis in children.3 Elevated protein levels are difficult to interpret in cases of traumatic LP, and a diagnosis of bacterial meningitis may be more difficult to exclude on the basis of CSF test results.4
The interpretation of CSF protein levels is further complicated in the youngest infants due to both the changing composition of the CSF as well as the higher rates of traumatic LPs.5 Therefore, studies establishing a correction factor, adjusting observed CSF protein levels for the presence of CSF RBCs, that included predominantly older children may not be generalizable to neonates and young infants.6 We sought to determine the relationship between CSF RBC count and CSF protein in infants 56 days of age who underwent LP in the emergency department (ED).
METHODS
Study Design, Setting, and Participants
This cross‐sectional study was performed at The Children's Hospital of Philadelphia (Philadelphia, PA), an urban, tertiary care children's hospital. The Committees for the Protection of Human Subjects approved this study with a waiver of informed consent.
Infants 56 days of age and younger were eligible for inclusion if they had an LP performed as part of their ED evaluation between January 1, 2005 and July 31, 2009. At The Children's Hospital of Philadelphia, infants 56 days and younger routinely receive LPs for evaluation of fever.79 Patients undergoing LP in the ED were identified using computerized order entry records as previously described.5, 10
We excluded patients with conditions known to elevate CSF protein, including: serious bacterial infection (bacterial meningitis, urinary tract infection, bacteremia, pneumonia, septic arthritis, and bacterial gastroenteritis),11 presence of a ventricular shunt, aseptic meningitis (positive CSF enteroviral polymerase chain reaction or CSF herpes simplex virus polymerase chain reaction), congenital infections (eg, syphilis), seizure prior to presentation, and elevated bilirubin (if serum bilirubin was obtained). Due to the fact that grossly bloody CSF samples are difficult to interpret, we excluded those with a CSF RBC count >150,000 cells/mm3, a cutoff representing the 99th percentile of CSF RBC values in the cohort after applying other exclusion criteria.
Study Definitions
Bacterial meningitis was defined as either the isolation of a known bacterial pathogen from the CSF or, in patients who received antibiotics prior to evaluation, the combination of CSF pleocytosis and bacteria reported on CSF Gram stain. Bacteremia was defined as the isolation of a known bacterial pathogen from blood cultures excluding commensal skin flora. Urinary tract infection was defined as growth of a single known pathogen meeting 1 of 3 criteria: (1) 1000 colony‐forming units per mL for urine cultures obtained by suprapubic aspiration, (2) 50,000 colony‐forming units per mL from a catheterized specimen, or (3) 10,000 colony‐forming units per mL from a catheterized specimen in association with a positive urinalysis.1214
Statistical Analysis
Data analysis was performed using STATA version 12 (Stata Corp, College Station, TX). Linear regression was used to determine the association between CSF RBC and CSF protein. We analyzed the following groups of children: 1) all eligible patients; 2) children 28 days versus children >28 days; 3) vaginal versus cesarean delivery; and 4) patients without CSF pleocytosis. In the primary subanalysis, CSF pleocytosis was defined as CSF white blood cells (WBCs) >19 cells/mm3 for infants 28 days of age and CSF WBCs >9 cells/mm3 for infants 29 days of age, using reference values established by Kestenbaum et al.10 Alternate definitions of CSF pleocytosis were also examined using reference values proposed by Byington et al15 (age 28 days, >18 cells/mm3; age >29 days, >8.5 cells/mm3) and Chadwick et al16(age 0‐7 days, >26 cells/mm3; age 8‐28 days, >9 cells/mm3; age 29‐49 days, >8 cells/mm3; and age 50‐56 days, >7 cells/mm3). We did not correct CSF WBCs for the RBC count because prior studies suggest that such correction factors do not provide any advantage over uncorrected values.17 Finally, linear regression analysis was repeated while including subjects with >150,000 RBC/mm3 to determine the effect of including those patients on the association of CSF RBC count and protein concentrations. Subjects with grossly bloody CSF specimens, defined a priori as a CSF RBC >1,000,000/mm3, were excluded from this subanalysis.
RESULTS
There were 1986 infants, 56 days of age or younger, who underwent LP in the ED during the study period. Patients were excluded for the following reasons: missing medical record number (n = 16); missing CSF WBC, CSF RBC, or CSF protein values (n = 290); conditions known to elevate CSF protein concentrations (n = 426, as follows: presence of a ventricular shunt device [n = 48], serious bacterial infection [n = 149], congenital infection [n = 2], positive CSF polymerase chain reaction [PCR] test for either enterovirus or herpes simplex virus [n = 97], seizure prior to presentation [n = 98], or elevated serum bilirubin [n = 32]). An additional 13 patients with a CSF RBC count >150,000 cells/mm3 were also excluded.
For the remaining 1241 study infants, the median age was 34 days (interquartile range: 19 days‐46 days) and 554 patients (45%) were male. The median CSF RBC count was 40 cells/mm3 (interquartile range: 2‐1080 cells/mm3); 11.8% of patients had a CSF RBC count >10,000 cells/mm3.
CSF protein increased linearly with increasing CSF RBCs (Figure 1). The increase in the CSF protein concentration of 1.9 mg/dL per 1000 CSF RBCs for all patients was similar between different age groups and delivery types (Table 1). Restricting analysis to those patients without pleocytosis also yielded comparable results; applying 2 other definitions of pleocytosis did not change the magnitude of the association (Table 1).
| Patient Group | No. of Patients | Change in CSF protein (mg/dL) per 1000 RBCs (95% CI) |
|---|---|---|
| ||
| All eligible | 1241 | 1.9 (1.7‐2.1) |
| No CSF pleocytosis* | 1085 | 2.0 (1.7‐2.4) |
| Age | ||
| Age 28 days | 481 | 1.9 (1.5‐2.3) |
| Age >28 days | 760 | 1.9 (1.7‐2.1) |
| Mode of delivery | ||
| Vaginal | 741 | 1.9 (1.7‐2.2) |
| Cesarean | 366 | 1.7 (1.4‐2.0) |
In a subanalysis, we then included subjects with a CSF RBC count >150,000/mm3; one extreme outlier with a CSF RBC equal to 3,160,000/mm3 remained excluded. Inclusion of more traumatic samples lessened the overall correction factor. The CSF protein increased by 1.22 mg/dL (95% confidence interval: 1.14‐1.29 mg/dL) per 1000 RBC/mm3 increase in the CSF. In the subset without CSF pleocytosis, the CSF protein increased by 1.44 mg/dL (95% confidence interval: 1.33‐1.57 mg/dL) per 1000 RBC/mm3.
Three children had high CSF protein values (>500 mg/dL) despite the relative paucity of CSF RBCs. Two of these infants had respiratory syncytial virus bronchiolitis; neither infant had signs or symptoms of neurological illness. While details of the labor and delivery were not available, the CSF sample for one of these infants was reported to have xanthochromia, and the other infant was reported to have had a traumatic LP with a CSF sample that subsequently cleared. The third infant had fever without a specific source identified, but had a birth history of vaginal delivery and prolonged labor. The CSF sample from LP for this patient was reported as grossly bloody by the performing clinicians and by the Clinical Microbiology Laboratory, despite a CSF red blood cell count of only 5500 cells/mm3.
DISCUSSION
In a large cohort of infants 56 days of age, CSF protein increased by approximately 2 mg/dL for every 1000 cell/mm3 increase in CSF RBCs. This correction factor is higher than previously reported correction factors from studies including older infants and children.6, 18 Some of this difference may be explained by the presence of old blood related to the trauma of labor and delivery. Previous work has demonstrated that the presence of xanthochromia, another RBC breakdown product, in the CSF of young infants was associated with maternal labor and elevated CSF protein.19 Consistent with this hypothesis, the correction factor was nominally higher in those infants born by vaginal delivery compared with those born by cesarean section.
Several infants in our study had high CSF protein levels despite a paucity of CSF RBCs. By convention at our institution, the protein and glucose values are determined from the second tube, and the WBCs and RBCs are determined from the third tube. However, we could not determine the order in which the specimens for protein and RBCs were collected for individual specimens. Additionally, it is possible that delayed clearance of blood from a traumatic LP would cause the CSF protein level to be high, as measured in the second tube, but lead to few RBCs in the third tube. These circumstances could explain the discrepancy between CSF protein and CSF RBCs counts for some patients.
The CSF protein adjustment factor for infants 56 days of age in our study was almost twice the correction of 1.1 mg/dL for every 1000 RBC increase reported by Nigrovic et al among infants 90 days of age.6 There are differences in the design of the 2 studies. We excluded subjects with exceedingly large numbers of CSF RBCs and restricted inclusion to those 56 days of age or younger. When subjects with >150,000 RBCs/mm3 were included, the correction decreased to a value comparable to that reported by Nigrovic et al.6 Therefore, it is possible that inclusion of subjects with grossly bloody specimens in prior studies skewed the association between CSF protein and CSF RBCs. The number of subjects in our cohort with >150,000 CSF RBCs was too small to calculate a relevant correction factor for infants with exceedingly high CSF RBC counts.
The results of this study should be considered in the context of several limitations. Details regarding labor and delivery were not available. We suspect that old blood related to the trauma of birth provides partial explanation for the higher correction factor in neonates and young infants compared with older children. However, differences in CSF blood‐brain barrier permeability may also contribute to these differences, independent of the CSF RBC count. Additionally, though the study population included a large number of neonates and young infants, a relatively small proportion of subjects had high CSF RBC counts. Therefore, our results may not be generalizable to those with exceedingly high CSF RBCs. Finally, available clinical prediction rules to identify patients with CSF pleocytosis, who are at very low risk for bacterial meningitis, include CSF protein as a predictor.3, 20, 21 Although CSF protein in children with traumatic LPs may need adjustment prior to application of the clinical prediction rule, further study is needed before implementing this approach.
In conclusion, we found that CSF protein concentrations increased by approximately 2 mg/dL for every 1000 CSF RBCs. Correction of CSF protein for those with extremely high CSF RBCs may not be appropriate, as conventional linear models do not apply. These data may assist clinicians in interpreting CSF protein concentrations in infants 56 days of age and younger in the context of traumatic LPs.
- ,,,,,.Local anesthetic and stylet styles: factors associated with resident lumbar puncture success.Pediatrics.2006;117:876–881.
- ,,.Risk factors for traumatic or unsuccessful lumbar punctures in children.Ann Emerg Med.2007;49:762–771.
- ,,, et al.Clinical prediction rule for identifying children with cerebrospinal fluid pleocytosis at very low risk of bacterial meningitis.JAMA.2007;297:52–60.
- ,,.Interpretation of traumatic lumbar punctures: who can go home?Pediatrics.2003;111:525–528.
- ,,,,.Age‐specific reference values for cerebrospinal fluid protein concentration in neonates and young infants.J Hosp Med.2011;6:22–27.
- ,,.Correction of cerebrospinal fluid protein for the presence of red blood cells in children with a traumatic lumbar puncture.J Pediatr.2011;159:158–159.
- ,,.Failure of infant observation scales in detecting serious illness in febrile, 4‐ to 8‐week‐old infants.Pediatrics.1990;85:1040–1043.
- ,.Unpredictability of serious bacterial illness in febrile infants from birth to 1 month of age.Arch Pediatr Adolesc Med.1999;153:508–511.
- ,,.Outpatient management without antibiotics of fever in selected infants.N Engl J Med.1993;329:1437–1441.
- ,,,,.Defining cerebrospinal fluid white blood cell count reference values in neonates and young infants.Pediatrics.2010;125:257–264.
- ,,,,.Sterile cerebrospinal fluid pleocytosis in young infants with urinary tract infections.J Pediatr.2008;153:290–292.
- ,,, et al.Clinical and demographic factors associated with urinary tract infection in young febrile infants.Pediatrics.2005;116:644–648.
- ,,,,.Prevalence of urinary tract infection in febrile young children in the emergency department.Pediatrics.1998;102:e16.
- ,,,,,.Prevalence of urinary tract infection in febrile infants.J Pediatr.1993;123:17–23.
- ,,.Normative cerebrospinal fluid profiles in febrile infants.J Pediatr.2011;158:130–134.
- ,,,.Cerebrospinal fluid characteristics of infants who present to the emergency department with fever: establishing normal values by week of age.Pediatr Infect Dis J.2011;30:e63–e67.
- ,.Corrections for leukocytes and percent of neutrophils do not match observations in blood‐contaminated cerebrospinal fluid and have no value over uncorrected cells for diagnosis.Pediatr Infect Dis J.2006;25:8–11.
- ,,,,.Distinguishing cerebrospinal fluid abnormalities in children with bacterial meningitis and traumatic lumbar puncture.J Infect Dis.1990;162:251–254.
- ,,,.Cerebrospinal fluid xanthochromia in newborns is related to maternal labor before delivery.Pediatrics.2007;120:e1212–e1216.
- ,.Accuracy and test characteristics of ancillary tests of cerebrospinal fluid for predicting acute bacterial meningitis in children with low white blood cell counts in cerebrospinal fluid.Acad Emerg Med.2005;12:303–309.
- ,,,.A decision rule for predicting bacterial meningitis in children with cerebrospinal fluid pleocytosis when gram stain is negative or unavailable.Acad Emerg Med.2008;15:437–444.
Copyright © 2012 Society of Hospital Medicine

Macrolides for Mycoplasmal Pneumonia
Mycoplasma pneumoniae is a common cause of community‐acquired pneumonia (CAP), among school‐age children and adolescents.14 Though pneumonia caused by M. pneumoniae is typically self‐limited, severe illness may occur.5 M. pneumoniae has also been implicated in airway inflammation, which may lead to the onset and development of chronic pulmonary disease.610 Few studies have directly addressed appropriate treatment strategies for M. pneumoniae pneumonia,11 and, despite its high prevalence and potential for causing severe complications, treatment recommendations remain inconsistent.
The efficacy of macrolide therapy in particular for M. pneumoniae remains unclear. In vitro susceptibility studies have shown bacteriostatic activity of erythromycin, clarithromycin, and azithromycin against M. pneumoniae.1218 Additionally, several small retrospective studies have shown that among children with atypical CAP (including M. pneumoniae pneumonia), those treated with macrolides were less likely to have persistence or progression of signs and symptoms after 3 days of therapy.19, 20 Lu et al21 found a shorter duration of fever among macrolide recipients compared with non‐recipients. In adults, Shames et al22 found a shorter duration of fever and hospitalization among erythromycin recipients compared with controls. Other randomized controlled trials have also addressed the use of macrolides in treatment of M. pneumoniae, but the ability to draw meaningful conclusions is limited by small samples sizes and by lack of details about the number of patients with M. pneumoniae.11
In addition to their antimicrobial effect, macrolides also have anti‐inflammatory properties.2327 The importance of these anti‐inflammatory properties is supported by studies showing clinical cure in patients treated with macrolides despite persistence of M. pneumoniae organisms,2831 clinical improvement despite the administration of doses that provide tissue levels below the minimum inhibitory concentration of the organism,3234 and clinical cure in patients with macrolide‐resistant M. pneumoniae.18, 35
The objectives of the current study were to examine the impact of macrolide therapy on the length of stay (LOS) and short‐ and longer‐term readmissions, including longer‐term asthma‐related readmissions, in children hospitalized with M. pneumoniae pneumonia.
METHODS
Data Source
Data for this retrospective cohort study were obtained from the Pediatric Health Information System (PHIS), which contains administrative data from 38 freestanding children's hospitals. Data quality and reliability are assured through a joint effort by the Child Health Corporation of America (Shawnee Mission, KS) and PHIS‐participating hospitals as described previously.36, 37 Encrypted medical record numbers allow for tracking of individual patients across hospitalizations. This study was reviewed and approved by the Committees for the Protection of Human Subjects at The Children's Hospital of Philadelphia (Philadelphia, PA).
Patients
Children 6‐18 years of age with CAP were eligible if they were discharged from a participating hospital between January 1, 2006 and December 31, 2008. Subjects were included if they received antibiotic therapy on the first day of hospitalization and if they satisfied one of the following International Classification of Diseases, 9th revision (ICD‐9) discharge diagnosis code criteria: 1) Principal diagnosis of M. pneumoniae pneumonia (483.0); 2) Principal diagnosis of a pneumonia‐related symptom (eg, fever, cough) (780.6 or 786.00‐786.52 [except 786.1]) and a secondary diagnosis of M. pneumoniae pneumonia; or 3) Principal diagnosis of pneumonia (481‐483.8 [except 483.0], 485‐486) and a secondary diagnosis of Mycoplasma (041.81).
Children younger than 6 years of age were excluded due to the low prevalence of M. pneumoniae infection.2, 38 Patients with comorbid conditions predisposing to severe or recurrent pneumonia (eg, cystic fibrosis, malignancy) were excluded using a previously reported classification scheme.39 In addition, we excluded patient data from 2 hospitals due to incomplete reporting of discharge information; thus data from 36 hospitals were included in this study.
Validation of Discharge Diagnosis Codes for Mycoplasma pneumoniae
To assess for misclassification of the diagnosis of M. pneumoniae, we reviewed records of a randomly selected subset of subjects from The Children's Hospital of Philadelphia; 14 of 15 patients had signs of lower respiratory tract infection in conjunction with a positive M. pneumoniae polymerase chain reaction test from nasopharyngeal washings to confirm the diagnosis of M. pneumoniae pneumonia. Hence, the positive predictive value of our algorithm for diagnosing M. pneumoniae pneumonia was 93.3%.
Study Definitions
We identified children with asthma in 2 ways. Asthma‐related hospitalizations were identified by an ICD‐9 code for asthma (493.0‐493.92) in any discharge diagnosis field during any hospitalization in the 24 months prior to the current hospitalization. Baseline controller medications were identified by receipt of inhaled corticosteroids (eg, fluticasone) or leukotriene receptor antagonists on the first day of hospitalization.
Systemic corticosteroids (either oral or intravenous) included dexamethasone, hydrocortisone, methylprednisolone, prednisolone, and prednisone. Measures of disease severity included admission to the intensive care unit within 48 hours of hospitalization, and administration of vancomycin or clindamycin, vasoactive infusions (epinephrine, norepinephrine, dopamine, and dobutamine), and invasive (endotracheal intubation) and noninvasive (continuous positive airway pressure) mechanical ventilation within 24 hours of hospitalization, as previously described.40, 41 Viral respiratory season was defined as October through March.
Measured Outcomes
The primary outcomes of interest were hospital LOS and all‐cause readmission within 28 days and 15 months after index discharge. We examined readmissions for asthma 15 months after index discharge as a secondary outcome measure because of the potential role for M. pneumoniae infection in long‐term lung dysfunction, including asthma.42 The 15‐month time frame was selected based on longitudinal data available in PHIS for the entire study cohort.
Measured Exposures
The main exposure was early initiation of macrolide therapy, defined as receipt of erythromycin, clarithromycin, or azithromycin on the first day of hospitalization.
Data Analysis
Continuous variables were described using median and interquartile range (IQR) or range values, and compared using the Wilcoxon rank‐sum test. Categorical variables were described using counts and frequencies, and compared using the chi‐square test. Multivariable linear (for LOS) and logistic (for readmission) regression analyses were performed to assess the independent association of macrolide therapy with the primary outcomes. Because the LOS data had a skewed distribution, our analyses were performed using logarithmically transformed LOS values as the dependent variable. The resulting beta‐coefficients were transformed to reflect the percent difference in LOS between subjects receiving and not receiving macrolide therapy.
Building of the multivariable models began with the inclusion of macrolide therapy. Variables associated with primary outcomes on univariate analysis (P < 0.20) were also considered for inclusion as potential confounders.43 These variables were included in the final multivariable model if they remained significant after adjusting for other factors, or if their inclusion in the model resulted in a 15% or greater change in the effect size of the primary association of interest (ie, macrolide therapy).44 Because corticosteroids also have anti‐inflammatory properties, we assessed for interactions with macrolide therapy. There was no interaction between macrolide and systemic corticosteroid therapy (P = 0.26, Likelihood ratio test), therefore our primary model adjusted for systemic corticosteroids.
Despite adjusting for systemic corticosteroid therapy in our primary analysis, residual confounding by indication for corticosteroid therapy might exist. We therefore repeated the analysis after stratifying by receipt or non‐receipt of systemic corticosteroid therapy. Because the benefit of macrolides in preventing long‐term dysfunction may be limited to those without a prior diagnosis of asthma, we repeated the analysis of readmissions within 15 months of index discharge (any readmission and asthma‐related readmissions) while limiting the cohort to those without evidence of asthma (ie, no prior asthma‐related hospitalizations and no chronic asthma medications). Because children with underlying conditions or circumstances that would predispose to prolonged hospitalizations may have been included, despite our restriction of the cohort to those without an identified chronic complex condition, we also repeated the analysis while limiting the cohort to those with a LOS 7 days. Finally, all analyses were clustered on hospital using the robust standard errors of Huber and White to account for the correlation of exposures and outcomes among children within centers.
Data were analyzed using Stata version 11 (Stata Corporation, College Station, TX). Statistical significance was determined a priori as a two‐tailed P value <0.05.
RESULTS
Patient Characteristics
During the study, 690 children ages 6 to 18 years met inclusion criteria. Characteristics of these patients are shown in Table 1. The median age was 10 years (IQR, 7‐13 years). Ten patients (1.4%) also had a concomitant discharge diagnosis of pneumococcal pneumonia, while 19 patients (2.7%) had a concomitant discharge diagnosis of viral pneumonia; 1 of these patients had discharge diagnoses of both viral and pneumococcal pneumonia.
| Empiric Macrolide Therapy | ||||
|---|---|---|---|---|
| Variable | All Subjects | Yes | No | P |
| ||||
| Demographics | ||||
| Male sex | 356 (51.6) | 200 (49.4) | 156 (54.7) | 0.166 |
| Race | ||||
| Black | 135 (19.6) | 81 (20.0) | 54 (19.0) | 0.506 |
| White | 484 (70.1) | 287 (70.9) | 197 (69.1) | |
| Other | 62 (9.0) | 31 (7.7) | 31 (10.9) | |
| Missing | 9 (1.3) | 6 (1.5) | 3 (1.1) | |
| Presentation during viral respiratory season | 420 (60.9) | 242 (59.8) | 178 (62.5) | |
| Prior asthma hospitalization | 41 (5.9) | 31 (7.7) | 10 (3.5) | 0.023 |
| Intensive care unit admission | 127 (18.4) | 74 (18.3) | 53 (18.6) | 0.914 |
| Laboratory tests and procedures | ||||
| Additional radiologic imaging* | 24 (3.5) | 13 (3.2) | 11 (3.9) | 0.646 |
| Arterial blood gas | 116 (17.3) | 72 (18.5) | 44 (15.6) | 0.316 |
| Complete blood count | 433 (64.4) | 249 (64.0) | 184 (65.0) | 0.788 |
| Blood culture | 280 (41.7) | 167 (42.9) | 113 (39.9) | 0.436 |
| Mechanical ventilation | 16 (2.3) | 5 (1.2) | 11 (3.86) | 0.024 |
| Medications | ||||
| Chronic asthma medication | 116 (16.8) | 72 (17.8) | 44 (15.4) | 0.419 |
| Beta‐agonist therapy | 328 (47.5) | 215 (53.1) | 113 (39.7) | 0.001 |
| Vasoactive infusions | 22 (3.2) | 13 (3.2) | 9 (3.2) | 0.969 |
| Systemic corticosteroids | 252 (36.5) | 191 (47.2) | 61 (21.4) | <0.001 |
| Clindamycin or vancomycin | 86 (12.5) | 24 (5.9) | 62 (21.8) | <0.001 |
Macrolide therapy was administered to 405 (58.7%) patients. Systemic corticosteroid therapy was administered to 252 (36.5%) patients. Overall, 191 (27.7%) of the 690 patients received both macrolides and systemic corticosteroids empirically, while 224 (32.5%) received neither; 61 (8.8%) received corticosteroids but not macrolides, while 214 (31.0%) received macrolides but not corticosteroids. Asthma hospitalization within the 24 months prior to admission was more common among those receiving macrolides (N = 60/405, 14.8%) than among those not receiving macrolides (N = 30/285, 10.5%) (P = 0.023). Macrolide recipients also more commonly received concomitant systemic corticosteroids (N = 191/405, 47.2%) than macrolide non‐recipients (N = 61/285, 21.4%) (P < 0.001) and more commonly received beta‐agonist therapy (N = 215/405, 53.1%) than macrolide non‐recipients (N = 113/285, 39.7%) (P = 0.001).
Length of Stay
The overall median LOS was 3 days (IQR, 2‐6 days); the median LOS was 3 days (IQR, 2‐5 days) for empiric macrolide recipients and 4 days (IQR, 2‐9 days) for non‐recipients (P < 0.001). Overall, 22.9% (N = 158) of children had an LOS 7 days and 8.8% (N = 61) of children had an LOS 14 days. The LOS was 7 days for 15.3% (N = 62) of macrolide recipients and 33.7% (N = 96) of non‐recipients. LOS was 7 days for 17.5% (N = 44) of systemic steroid recipients and 26% (N = 114) of non‐recipients. In unadjusted analysis, macrolide therapy (beta‐coefficient, 0.49; 95% confidence interval [CI]: 0.72 to 0.25; P < 0.001) and systemic corticosteroid administration (beta‐coefficient, 0.26; CI: 0.37 to 0.14; P < 0.001) were associated with shorter hospital LOS (Appendix 1).
In multivariable analysis, macrolide therapy remained associated with a shorter LOS (Table 2; Appendix 2). Systemic corticosteroid administration was associated with a 23% shorter LOS (adjusted beta‐coefficient, 0.26; 95% CI: 0.39 to 0.14; P < 0.001). In contrast, previous hospitalization for asthma was associated with a 31% longer LOS (adjusted beta‐coefficient, 0.27; 95% CI: 0.09‐0.045; P = 0.004). Receipt of beta‐agonist therapy or chronic asthma medications were not associated with significant differences in LOS. In analysis stratified by receipt or non‐receipt of concomitant systemic corticosteroid therapy, empiric macrolide therapy remained associated with a significantly shorter LOS in both systemic corticosteroid recipients and non‐recipient (Table 4). When the cohort was restricted to subjects with a LOS 7 days, macrolide therapy remained significantly associated with a shorter LOS (adjusted percent change, 20%; 95% CI: 32% to 5%; P = 0.015).
| Association of Empiric Macrolide Therapy With Outcomes* | |
|---|---|
| |
| Length of stay (days) | |
| Adjusted beta‐coefficient (95 % CI) | 0.38 (0.59 to 0.17) |
| Adjusted percent change (95% CI) | 32% (45% to 15%) |
| P value | 0.001 |
| Any readmission within 28 days | |
| Adjusted odds ratio (95% CI) | 1.12 (0.22 to 5.78) |
| P value | 0.890 |
| Any readmission within 15 mo | |
| Adjusted odds ratio (95% CI) | 1.00 (0.59 to 1.70) |
| P value | 0.991 |
| Asthma hospitalization within 15 mo | |
| Adjusted odds ratio (95% CI) | 1.09 (0.54 to 2.17) |
| P value | 0.820 |
Readmission
Overall, 8 children (1.2%) were readmitted for pneumonia‐associated conditions within 28 days of index discharge. Readmission occurred in 1.2% of macrolide recipients and 1.1% of non‐recipients (P = 0.83) (Table 4). In unadjusted analysis, neither macrolide therapy (odds ratio [OR], 1.18; 95% CI: 0.25‐5.45; P = 0.84) nor systemic corticosteroid administration (OR, 1.04; 95% CI: 0.27‐4.10; P = 0.95) was associated with 28‐day readmission (Appendix 3). In multivariable analysis, empiric macrolide therapy was not associated with 28‐day readmission in the overall cohort (Table 2; Appendix 4)), or when the analysis was stratified by receipt or non‐receipt of concomitant systemic corticosteroid therapy (Table 3).
| Concomitant Systemic Corticosteroid Therapy* | ||
|---|---|---|
| Yes | No | |
| ||
| Length of stay | ||
| Adjusted beta‐coefficient (95% CI) | 0.40 (0.74 to 0.07) | 0.37 (0.58 to 0.16) |
| Adjusted percent change (95% CI) | 33% (52% to 7%) | 31% (44% to 15%) |
| P value | 0.020 | 0.001 |
| Readmission within 28 days | ||
| Adjusted odds ratio (95% CI) | 1.09 (0.05 to 26.7) | 1.50 (0.21 to 10.8) |
| P value | 0.960 | 0.687 |
| Readmission within 15 mo | ||
| Adjusted odds ratio (95% CI) | 1.57 (0.65 to 3.82) | 0.81 (0.45 to 1.46) |
| P value | 0.32 | 0.49 |
| Asthma hospitalization within 15 mo | ||
| Adjusted odds ratio (95% CI) | 1.51 (0.58 to 3.93) | 0.85 (0.36 to 1.97) |
| P value | 0.395 | 0.700 |
| Empiric Macrolide Therapy | ||
|---|---|---|
| N/Total (%) | ||
| Readmission | Yes | No |
| Any readmission within 28 days | ||
| Overall | 5/405 (1.2) | 3/285 (1.1) |
| Systemic corticosteroid therapy | 2/186 (1.1) | 1/66 (1.5) |
| No systemic corticosteroid therapy | 3/177 (1.7) | 2/261 (0.8) |
| Any readmission within 15 mo | ||
| Overall | 96/405 (23.7) | 64/285 (22.5) |
| Systemic corticosteroid therapy | 52/186 (28.0) | 17/66 (25.8) |
| No systemic corticosteroid therapy | 32/177 (18.1) | 59/261 (22.6) |
| Asthma hospitalization within 15 mo | ||
| Overall | 61/405 (15.1) | 34/285 (11.9) |
| Systemic corticosteroid therapy | 39/186 (21.0) | 13/66 (19.7) |
| No systemic corticosteroid therapy | 14/177 (7.9) | 29/261 (11.1) |
Overall, 160 children (23.2%) were readmitted within 15 months of index discharge; 95 were readmitted for asthma during this time (Table 3). Overall readmission occurred in 23.7% of macrolide recipients and 22.5% of macrolide non‐recipients (P = 0.702). Asthma readmission occurred in 15.1% of macrolide recipients and 11.9% of macrolide non‐recipients (P = 0.240). In unadjusted analysis, empiric macrolide therapy was not significantly associated with any readmission within 15 months (OR, 1.07; 95% CI: 0.69‐1.68; P = 0.759) or with asthma‐related readmission within 15 months (OR, 1.31; 95% CI: 0.73‐ 2.36; P = 0.369). In multivariable analysis, neither any readmission nor asthma readmission within 15 months was associated with empiric macrolide therapy overall (Table 2) or when stratified by receipt or non‐receipt of concomitant systemic corticosteroid therapy (Table 3).
The analyses for readmissions within 15 months of index discharge were repeated while limiting the cohort to those without prior asthma hospitalizations or chronic asthma medications. In this subset of patients, readmissions for any reason occurred in 55 (18.6%) of 295 macrolide recipients and 50 (22.0%) of 227 non‐recipients. The difference was not statistically significant in multivariable analysis (adjusted odds ratio, 0.79; 95% CI: 0.41‐1.51; P = 0.47). Readmissions for asthma occurred in 30 (10.2%) of 295 macrolide recipients and 26 (11.5%) of 227 non‐recipients; this difference was also not significant in multivariable analysis (adjusted odds ratio, 0.83; 95% CI: 0.36‐1.93; P = 0.83). The magnitude of the estimate of effect for 28‐day and 15‐month readmissions, and 15‐month asthma hospitalizations, was similar to the primary analysis when the cohort was restricted to subjects with a LOS 7 days.
DISCUSSION
This multicenter study examined the role of macrolide therapy in children hospitalized with M. pneumoniae pneumonia. Empiric macrolide therapy was associated with an approximately 30% shorter hospital LOS and, in stratified analysis, remained associated with a significantly shorter hospital LOS in both systemic corticosteroid recipients and non‐recipients. Empiric macrolide therapy was not associated with short‐ or longer‐term hospital readmission.
Previous small randomized trials have been inconclusive regarding the potential benefit of macrolide therapy in M. pneumoniae pneumonia.11 Our study, which demonstrated a shorter LOS among macrolides recipients compared with non‐recipients, has several advantages over prior studies including a substantively larger sample size and multicenter design. Animal models support our observations regarding the potential beneficial antimicrobial role of macrolides. M. pneumoniae concentrations in bronchoalveolar lavage specimens were significantly lower among experimentally infected mice treated with clarithromycin, a macolide‐class antibiotic, compared with either placebo or dexamethasone.45 Combination therapy with clarithromycin and dexamethasone reduced histopathologic inflammation to a greater degree than dexamethasone alone.45
While the relative importance of the antimicrobial and anti‐inflammatory properties of macrolides is not known, observational studies of children infected with macrolide‐resistant M. pneumoniae suggest that the antimicrobial properties of macrolides may provide disproportionate clinical benefit. The duration of fever in macrolide recipients with macrolide‐resistant M. pneumoniae (median duration, 9 days) reported by Suzuki et al46 was significantly longer than those with macrolide‐susceptible infections (median duration, 5 days), and similar to the duration of fever in patients with M. pneumoniae infection treated with placebo (median duration, 8 days) reported by Kingston et al.47 Additionally, macrolide therapy was associated with significant improvements in lung function in patients with asthma and concomitant M. pneumoniae infection, but not in patients with asthma without documented M. pneumoniae infection.9 As corticosteroids also have anti‐inflammatory properties, we expect that any anti‐inflammatory benefit of macrolide therapy would be mitigated by the concomitant administration of corticosteroids. The shorter LOS associated with empiric macrolide therapy in our study was comparable among corticosteroid recipients and non‐recipients.
Atypical bacterial pathogens, including M. pneumoniae, are associated with diffuse lower airway inflammation6, 48 and airway hyperresponsiveness,6 and have been implicated as a cause of acute asthma exacerbations.7, 4954 Among patients with previously diagnosed asthma, acute M. pneumoniae infection was identified in up to 20% of those having acute exacerbations.7, 54 Macrolide therapy has a beneficial effect on lung function and airway hyperresponsiveness in adults with asthma.9, 55 Among mice infected with M. pneumoniae, 3 days of macrolide therapy resulted in a significant reduction in airway hyperresponsiveness compared with placebo or dexamethasone; however, after 6 days of therapy, there was no significant difference in airway hyperresponsiveness between those receiving macrolides, dexamethasone, or placebo, suggesting that the benefit of macrolides on airway hyperresponsiveness may be brief. Our findings of a shorter LOS but no difference in readmissions at 28 days or longer, for macrolide recipients compared with non‐recipients, support the limited benefit of macrolide therapy beyond the initial reduction in bacterial load seen in the first few days of therapy.
M. pneumoniae infection has also been implicated as a cause of chronic pulmonary disease, including asthma.610 In the mouse model, peribronchial and perivascular mononuclear infiltrates, increased airway methacholine reactivity, and increased airway obstruction were observed 530 days after M. pneumoniae inoculation.6 M. pneumoniae has been identified in 26 (50%) of 51 children experiencing their first asthma attack,7 and 23 (42%) of 55 adults with chronic, stable asthma.9 Nevertheless, results of other studies addressing the issue are inconsistent, and the role of M. pneumoniae in the development of asthma remains unclear.56 In order to investigate the impact of macrolide therapy on the development of chronic pulmonary disease requiring hospitalization, we examined the readmission rates in the 15 months following index discharge. The proportion of children hospitalized with asthma following the hospitalization for M. pneumoniae pneumonia was higher for both macrolide recipients and non‐recipients compared with the 24‐months prior to infection. These results support a possible role for M. pneumoniae in chronic pulmonary disease. However, macrolide therapy was not associated with long‐term overall hospital readmission or long‐term asthma readmission, either in the entire cohort or in the subset of patients without prior asthma hospitalizations or medications.
This study had several limitations. First, because the identification of children with M. pneumoniae pneumonia relied on ICD‐9 discharge diagnosis codes, it is possible that there was misclassification of disease. We minimized the inclusion of children without M. pneumoniae by including only children who received antibiotic therapy on the first day of hospitalization and by excluding patients younger than 6 years of age, a group at relatively low‐risk for M. pneumoniae infection. Further, our algorithm for identification of M. pneumoniae pneumonia was validated through review of the medical records at 1 institution and was found to have a high positive predictive value. However, the positive predictive value of these ICD‐9 codes may vary across institutions. Additionally, the sensitivity of ICD‐9 codes for identifying children with M. pneumoniae pneumonia is not known. Also, not all children with pneumonia undergo testing for M. pneumoniae, and different tests have varying sensitivity and specificity.57, 58 Thus, some children with M. pneumoniae pneumonia were not diagnosed and so were not included in our study. It is not known how inclusion of these children would affect our results.
Second, the antibiotic information used in this study was limited to empiric antibiotic therapy. It is possible that some patients received macrolide therapy before admission. It is also likely that identification of M. pneumoniae during the hospitalization prompted the addition or substitution of macrolide therapy for some patients. If this therapy was initiated beyond the first day of hospitalization, these children would be classified as macrolide non‐recipients. Since macrolide administration was associated with a shorter hospital LOS, such misclassification would bias our results towards finding no difference in LOS between macrolide recipients and non‐recipients. It is therefore possible that the benefit of macrolide therapy is even greater than found in our study.
Third, there may be unmeasured confounding or residual confounding by indication for adjunct corticosteroid therapy related to clinical presentation. We expect that corticosteroid recipients would be sicker than non‐recipients. We included variables associated with a greater severity of illness (such as intensive care unit admission) in the multivariable analysis. Additionally, the shorter LOS among macrolide recipients remained when the analysis was stratified by receipt or non‐receipt of systemic corticosteroid therapy.
Fourth, we were only able to record readmissions occurring at the same hospital as the index admission; any readmission presenting to a different hospital following their index admission did not appear in our records, and was therefore not counted. It is thus possible that the true number of readmissions is higher than that represented here. Finally, despite the large number of patients included in this study, the number of short‐term readmissions was relatively small. Thus, we may have been underpowered to detect small but significant differences in short‐term readmission rates.
In conclusion, macrolide therapy was associated with shorter hospital LOS, but not with short‐term or longer‐term readmission in children presenting with M. pneumoniae pneumonia.
Appendix
| Variable | Beta Coefficient | Confidence Interval | P Value |
|---|---|---|---|
| Demographics | |||
| Sex | 0.12 | (0.22, 0.02) | 0.022 |
| Race | |||
| Blackreference category | |||
| White | 0.01 | (0.21, 0.23) | 0.933 |
| Other | 0.13 | (0.39, 0.13) | 0.323 |
| Missing | 0.46 | (0.81, 0.11) | 0.012 |
| Presentation during viral respiratory season | 0.05 | (0.19, 0.09) | 0.462 |
| Prior asthma hospitalization | 0.36 | (0.64, 0.08) | 0.015 |
| Intensive care unit admission | 1.05 | (0.87, 1.23) | <0.001 |
| Labs and procedures performed | |||
| Additional radiologic imaging | 0.23 | (0.20, 0.67) | 0.287 |
| Arterial blood gas | 0.69 | (0.50, 0.87) | <0.001 |
| Complete blood count | 0.34 | (0.24, 0.45) | <0.001 |
| Blood culture | 0.17 | (0.98, 0.44) | 0.204 |
| Mechanical ventilation | 1.15 | (0.68, 1.63) | <0.001 |
| Therapies received | |||
| Empiric macrolide therapy | 0.49 | (0.72, 0.25) | <0.001 |
| Systemic steroids | 0.26 | (0.38, 0.14) | <0.001 |
| Chronic asthma medications | 0.20 | (0.38, 0.013) | 0.037 |
| Beta‐agonist therapy | 0.07 | (0.21, 0.08) | 0.357 |
| Vasoactive infusion | 1.08 | (0.727, 1.45) | <0.001 |
| Clindamycin or vancomycin | 0.55 | (0.34, 0.75) | <0.001 |
| Variable | Odds Ratio* | Confidence Interval | P Value |
|---|---|---|---|
| |||
| Demographics | |||
| Sex | 0.56 | (0.23, 1.33) | 0.190 |
| Race | |||
| Blackreference category | |||
| White | 0.46 | (0.19, 1.14) | 0.093 |
| Other | |||
| Missing | |||
| Presentation during viral respiratory season | 0.64 | (0.09, 4.75) | 0.662 |
| Prior asthma hospitalization | |||
| Intensive care unit admission | 4.54 | (1.21, 17.03) | 0.025 |
| Laboratory tests and procedures | |||
| Additional radiologic imaging | 10.00 | (2.25, 44.47) | 0.002 |
| Arterial blood gas | |||
| Complete blood count | 0.92 | (0.24, 3.48) | 0.901 |
| Blood culture | 0.85 | (0.30, 2.36) | 0.738 |
| Mechanical ventilation | |||
| Medications | |||
| Macrolide therapy | 1.18 | (0.25, 5.45) | 0.837 |
| Systemic corticosteroids | 1.04 | (0.276, 4.09) | 0.951 |
| Chronic asthma medication | 1.66 | (0.71, 3.88) | 0.242 |
| Beta‐agonist therapy | 0.66 | (0.16, 2.65) | 0.557 |
| Vasoactive infusions | |||
| Clindamycin or vancomycin | 1.00 | (0.10, 9.90) | 0.998 |
| Variable | Coefficient | Confidence Interval | P Value | % Change | Confidence Interval for % Change |
|---|---|---|---|---|---|
| Demographics | |||||
| Age | 0.287 | (0.012, 0.045) | 0.001 | 2.9 | (1.2, 4.6) |
| Prior asthma hospitalization | 0.272 | (0.094, 0.45) | 0.004 | 31.3 | (9.9, 56.8) |
| Intensive care unit admission | 1.015 | (0.802, 1.23) | <0.001 | 175.9 | (123.0, 241.3) |
| Therapies received | |||||
| Macrolide therapy | 0.379 | (0.59, 0.166) | 0.001 | 31.6 | (44.6, 15.3) |
| Systemic corticosteroids | 0.264 | (0.391, 0.138) | <0.001 | 23.2 | (32.3, 12.9) |
| Chronic asthma medications | 0.056 | (0.255, 0.142) | 0.568 | 5.5 | (22.5, 15.2) |
| Albuterol | 0.07 | (0.059, 0.199) | 0.281 | 7.2 | (5.8, 22.0) |
| Clindamycin or vancomycin | 0.311 | (0.063, 0.559) | 0.015 | 36.5 | (6.5, 74.9) |
| Variable | Adjusted Odds Ratio | Confidence Interval | P Value |
|---|---|---|---|
| Demographics | |||
| Age | 0.91 | 0.72, 1.15 | 0.423 |
| Prior asthma hospitalization | 1.94 | 0.42, 8.90 | 0.394 |
| Intensive care unit admission | 5.73 | 2.03, 16.20 | 0.001 |
| Therapies received | |||
| Macrolide therapy | 1.12 | 0.22, 5.78 | 0.890 |
| Systemic corticosteroids | 0.696 | 0.10, 4.70 | 0.710 |
| Chronic asthma medications | 1.98 | 0.32, 12.20 | 0.460 |
| Albuterol | 0.519 | 0.081, 3.31 | 0.488 |
| Clindamycin or vancomycin | 0.904 | 0.07, 11.13 | 0.937 |
- ,,, et al.Prospective surveillance for atypical pathogens in children with community‐acquired pneumonia in Japan.J Infect Chemother.2006;12:36–41.
- ,,.Incidence of community‐acquired pneumonia in children caused by Mycoplasma pneumoniae: serological results of a prospective, population‐based study in primary health care.Respirology.2004;9:109–114.
- ,,.Mycoplasma pneumoniae infections in University of Wisconsin students.Am Rev Respir Dis.1967;96:237–244.
- .Infections caused by Mycoplasma pneumoniae and possible carrier state in different populations of patients.Clin Infect Dis.1993;17(suppl 1):S37–S46.
- .Mycoplasma pneumoniae. In: Long SS, Pickering LK, Prober CG, eds.Principles and Practice of Pediatric Infectious Diseases.3rd ed.Philadelphia, PA:Churchill Livingstone;2008:979–985.
- ,,, et al.Mycoplasma pneumoniae induces chronic respiratory infection, airway hyperreactivity, and pulmonary inflammation: a murine model of infection‐associated chronic reactive airway disease.Infect Immun.2002;70:649–654.
- ,,, et al.Mycoplasma pneumoniae and asthma in children.Clin Infect Dis.2004;38:1341–1346.
- ,,,.Isolation of Mycoplasma pneumoniae from asthmatic patients.Ann Allergy.1993;70:23–25.
- ,,,.Mycoplasma pneumoniae and Chlamydia pneumoniae in asthma: effect of clarithromycin.Chest.2002;121:1782–1788.
- ,,,,.A link between chronic asthma and chronic infection.J Allergy Clin Immunol.2001;107:595–601.
- ,,.Antibiotics for community‐acquired lower respiratory tract infections secondary to Mycoplasma pneumoniae in children.Cochrane Database Syst Rev.2010;7:CD004875.
- ,,,.In vitro susceptibilities of mycoplasmas and ureaplasmas to new macrolides and aryl‐fluoroquinolones.Antimicrob Agents Chemother.1988;32:1500–1502.
- ,,.Inhibitory and bactericidal activities of gemifloxacin and other antimicrobials against Mycoplasma pneumoniae.Int J Antimicrob Agents.2003;21:574–577.
- ,,,,.The in vitro activity of some 14‐, 15‐ and 16‐ membered macrolides against Staphylococcus spp., Legionella spp., Mycoplasma spp. and Ureaplasma urealyticum.Drugs Exp Clin Res.1991;17:91–99.
- ,,, et al.In vitro and in vivo activities of macrolides against Mycoplasma pneumoniae.Antimicrob Agents Chemother.1994;38:790–798.
- ,.Comparative in vitro activity of azithromycin, clarithromycin, erythromycin and lomefloxacin against Mycoplasma pneumoniae, Mycoplasma hominis and Ureaplasma urealyticum.Eur J Clin Microbiol Infect Dis.1990;9:838–841.
- ,,, et al.Characteristics of macrolide‐resistant Mycoplasma pneumoniae strains isolated from patients and induced with erythromycin in vitro.Microbiol Immunol.2001;45:617–620.
- ,,, et al.Characterization and molecular analysis of macrolide‐resistant Mycoplasma pneumoniae clinical isolates obtained in Japan.Antimicrob Agents Chemother.2004;48:4624–4630.
- ,,,.Role of Mycoplasma pneumoniae and Chlamydia pneumoniae in children with community‐acquired lower respiratory tract infections.Clin Infect Dis.2001;32:1281–1289.
- ,,, et al.Characteristics of Streptococcus pneumoniae and atypical bacterial infections in children 2–5 years of age with community‐acquired pneumonia.Clin Infect Dis.2002;35:1345–1352.
- ,,,,.Macrolide use shortens fever duration in Mycoplasma pneumoniae infection in children: a 2‐year experience.J Microbiol Immunol Infect.2008;41:307–310.
- ,,,,.Comparison of antibiotics in the treatment of mycoplasmal pneumonia.Arch Intern Med.1970;125:680–684.
- ,,, et al.Antimicrobial and immunologic activities of clarithromycin in a murine model of Mycoplasma pneumoniae‐induced pneumonia.Antimicrob Agents Chemother.2003;47:1614–1620.
- ,.Antibiotics in asthma.Curr Allergy Asthma Rep.2004;4:132–138.
- ,.Immunomodulatory activity and effectiveness of macrolides in chronic airway disease.Chest.2004;125:70S–78S.
- ,,, et al.Interleukin‐8 gene repression by clarithromycin is mediated by the activator protein‐1 binding site in human bronchial epithelial cells.Am J Respir Cell Mol Biol.2000;22:51–60.
- ,,, et al.Clarithromycin inhibits NF‐kappaB activation in human peripheral blood mononuclear cells and pulmonary epithelial cells.Antimicrob Agents Chemother.2001;45:44–47.
- ,,,,.Epidemiology of Mycoplasma pneumoniae infection in families.JAMA.1966;197:859–866.
- ,,.Shedding of Mycoplasma pneumoniae after tetracycline and erythromycin therapy.N Engl J Med.1967;276:1172–1175.
- ,,.Mycoplasma pneumoniae disease: clinical spectrum, pathophysiology, epidemiology, and control.J Infect Dis.1971;123:74–92.
- .Is there a role for antibiotics in the treatment of asthma? Involvement of atypical organisms.BioDrugs.2000;14:349–354.
- ,.Diffuse panbronchiolitis: role of macrolides in therapy.Am J Respir Med.2002;1:119–131.
- ,,,,,.Long‐term low‐dose administration of erythromycin to patients with diffuse panbronchiolitis.Respiration.1991;58:145–149.
- ,,,,,.[Long‐term therapeutic effects of erythromycin and newquinolone antibacterial agents on diffuse panbronchiolitis].Nihon Kyobu Shikkan Gakkai Zasshi.1990;28:1305–1313.
- ,,, et al.A comparative clinical study of macrolide‐sensitive and macrolide‐resistant Mycoplasma pneumoniae infections in pediatric patients.J Infect Chemother.2009;15:380–383.
- ,,,.Corticosteroids and mortality in children with bacterial meningitis.JAMA.2008;299:2048–2055.
- ,,,,.Intravenous immunoglobulin in children with streptococcal toxic shock syndrome.Clin Infect Dis.2009;49:1369–1376.
- ,,, et al.Etiology of childhood pneumonia: serologic results of a prospective, population‐based study.Pediatr Infect Dis J.1998;17:986–991.
- ,,,,,.Deaths attributed to pediatric complex chronic conditions: national trends and implications for supportive care services.Pediatrics.2001;107:E99.
- ,,,,,.Adjunct corticosteroids in children hospitalized with community‐acquired pneumonia.Pediatrics.2011;127:e255–e263.
- ,,, et al.Comparative effectiveness of pleural drainage procedures for the treatment of complicated pneumonia in childhood.J Hosp Med.2011;6:256–263.
- ,,, et al.Detection of Mycoplasma pneumoniae in the airways of adults with chronic asthma.Am J Respir Crit Care Med.1998;158:998–1001.
- ,.The impact of confounder selection criteria on effect estimation.Am J Epidemiol.1989;129:125–137.
- ,,.The risk of determining risk with multivariable models.Ann Intern Med.1993;118:201–210.
- ,,, et al.The impact of steroids given with macrolide therapy on experimental Mycoplasma pneumoniae respiratory infection.J Infect Dis.2008;198:1180–1188.
- ,,, et al.Clinical evaluation of macrolide‐resistant Mycoplasma pneumoniae.Antimicrob Agents Chemother.2006;50:709–712.
- ,,, et al.Eaton agent pneumonia.JAMA.1961;176:118–123.
- .The role of viral and atypical bacterial pathogens in asthma pathogenesis.Pediatr Pulmonol Suppl.1999;18:141–143.
- ,,.The association of viral and mycoplasma infections with recurrence of wheezing in the asthmatic child.Ann Allergy.1970;28:43–49.
- ,,,.Association of viral and mycoplasma infections with exacerbations of asthma.Ann Allergy.1974;33:145–149.
- ,,, et al.Acute Chlamydia pneumoniae and Mycoplasma pneumoniae infections in community‐acquired pneumonia and exacerbations of COPD or asthma: therapeutic considerations.J Chemother.2004;16:70–76.
- ,,, et al.Mycoplasma pneumoniae is a frequent cause of exacerbation of bronchial asthma in adults.Ann Allergy.1986;57:263–265.
- ,,, et al.Acute exacerbations of asthma in adults: role of Chlamydia pneumoniae infection.Eur Respir J.1994;7:2165–2168.
- ,,, et al.Atypical pathogen infection in adults with acute exacerbation of bronchial asthma.Am J Respir Crit Care Med.2003;167:406–410.
- ,,,,,.Erythromycin reduces the severity of bronchial hyperresponsiveness in asthma.Chest.1991;99:670–673.
- ,,,,.Atypical bacteria and macrolides in asthma.Allergy Asthma Clin Immunol.2008;4:111–116.
- ,,.Acute respiratory infection due to Mycoplasma pneumoniae: current status of diagnostic methods.Eur J Clin Microbiol Infect Dis.2010;29:1055–1069.
- ,,,,,.A multicenter pilot external quality assessment programme to assess the quality of molecular detection of Chlamydophila pneumoniae and Mycoplasma pneumoniae.J Microbiol Methods.2010;82:131–135.
Mycoplasma pneumoniae is a common cause of community‐acquired pneumonia (CAP), among school‐age children and adolescents.14 Though pneumonia caused by M. pneumoniae is typically self‐limited, severe illness may occur.5 M. pneumoniae has also been implicated in airway inflammation, which may lead to the onset and development of chronic pulmonary disease.610 Few studies have directly addressed appropriate treatment strategies for M. pneumoniae pneumonia,11 and, despite its high prevalence and potential for causing severe complications, treatment recommendations remain inconsistent.
The efficacy of macrolide therapy in particular for M. pneumoniae remains unclear. In vitro susceptibility studies have shown bacteriostatic activity of erythromycin, clarithromycin, and azithromycin against M. pneumoniae.1218 Additionally, several small retrospective studies have shown that among children with atypical CAP (including M. pneumoniae pneumonia), those treated with macrolides were less likely to have persistence or progression of signs and symptoms after 3 days of therapy.19, 20 Lu et al21 found a shorter duration of fever among macrolide recipients compared with non‐recipients. In adults, Shames et al22 found a shorter duration of fever and hospitalization among erythromycin recipients compared with controls. Other randomized controlled trials have also addressed the use of macrolides in treatment of M. pneumoniae, but the ability to draw meaningful conclusions is limited by small samples sizes and by lack of details about the number of patients with M. pneumoniae.11
In addition to their antimicrobial effect, macrolides also have anti‐inflammatory properties.2327 The importance of these anti‐inflammatory properties is supported by studies showing clinical cure in patients treated with macrolides despite persistence of M. pneumoniae organisms,2831 clinical improvement despite the administration of doses that provide tissue levels below the minimum inhibitory concentration of the organism,3234 and clinical cure in patients with macrolide‐resistant M. pneumoniae.18, 35
The objectives of the current study were to examine the impact of macrolide therapy on the length of stay (LOS) and short‐ and longer‐term readmissions, including longer‐term asthma‐related readmissions, in children hospitalized with M. pneumoniae pneumonia.
METHODS
Data Source
Data for this retrospective cohort study were obtained from the Pediatric Health Information System (PHIS), which contains administrative data from 38 freestanding children's hospitals. Data quality and reliability are assured through a joint effort by the Child Health Corporation of America (Shawnee Mission, KS) and PHIS‐participating hospitals as described previously.36, 37 Encrypted medical record numbers allow for tracking of individual patients across hospitalizations. This study was reviewed and approved by the Committees for the Protection of Human Subjects at The Children's Hospital of Philadelphia (Philadelphia, PA).
Patients
Children 6‐18 years of age with CAP were eligible if they were discharged from a participating hospital between January 1, 2006 and December 31, 2008. Subjects were included if they received antibiotic therapy on the first day of hospitalization and if they satisfied one of the following International Classification of Diseases, 9th revision (ICD‐9) discharge diagnosis code criteria: 1) Principal diagnosis of M. pneumoniae pneumonia (483.0); 2) Principal diagnosis of a pneumonia‐related symptom (eg, fever, cough) (780.6 or 786.00‐786.52 [except 786.1]) and a secondary diagnosis of M. pneumoniae pneumonia; or 3) Principal diagnosis of pneumonia (481‐483.8 [except 483.0], 485‐486) and a secondary diagnosis of Mycoplasma (041.81).
Children younger than 6 years of age were excluded due to the low prevalence of M. pneumoniae infection.2, 38 Patients with comorbid conditions predisposing to severe or recurrent pneumonia (eg, cystic fibrosis, malignancy) were excluded using a previously reported classification scheme.39 In addition, we excluded patient data from 2 hospitals due to incomplete reporting of discharge information; thus data from 36 hospitals were included in this study.
Validation of Discharge Diagnosis Codes for Mycoplasma pneumoniae
To assess for misclassification of the diagnosis of M. pneumoniae, we reviewed records of a randomly selected subset of subjects from The Children's Hospital of Philadelphia; 14 of 15 patients had signs of lower respiratory tract infection in conjunction with a positive M. pneumoniae polymerase chain reaction test from nasopharyngeal washings to confirm the diagnosis of M. pneumoniae pneumonia. Hence, the positive predictive value of our algorithm for diagnosing M. pneumoniae pneumonia was 93.3%.
Study Definitions
We identified children with asthma in 2 ways. Asthma‐related hospitalizations were identified by an ICD‐9 code for asthma (493.0‐493.92) in any discharge diagnosis field during any hospitalization in the 24 months prior to the current hospitalization. Baseline controller medications were identified by receipt of inhaled corticosteroids (eg, fluticasone) or leukotriene receptor antagonists on the first day of hospitalization.
Systemic corticosteroids (either oral or intravenous) included dexamethasone, hydrocortisone, methylprednisolone, prednisolone, and prednisone. Measures of disease severity included admission to the intensive care unit within 48 hours of hospitalization, and administration of vancomycin or clindamycin, vasoactive infusions (epinephrine, norepinephrine, dopamine, and dobutamine), and invasive (endotracheal intubation) and noninvasive (continuous positive airway pressure) mechanical ventilation within 24 hours of hospitalization, as previously described.40, 41 Viral respiratory season was defined as October through March.
Measured Outcomes
The primary outcomes of interest were hospital LOS and all‐cause readmission within 28 days and 15 months after index discharge. We examined readmissions for asthma 15 months after index discharge as a secondary outcome measure because of the potential role for M. pneumoniae infection in long‐term lung dysfunction, including asthma.42 The 15‐month time frame was selected based on longitudinal data available in PHIS for the entire study cohort.
Measured Exposures
The main exposure was early initiation of macrolide therapy, defined as receipt of erythromycin, clarithromycin, or azithromycin on the first day of hospitalization.
Data Analysis
Continuous variables were described using median and interquartile range (IQR) or range values, and compared using the Wilcoxon rank‐sum test. Categorical variables were described using counts and frequencies, and compared using the chi‐square test. Multivariable linear (for LOS) and logistic (for readmission) regression analyses were performed to assess the independent association of macrolide therapy with the primary outcomes. Because the LOS data had a skewed distribution, our analyses were performed using logarithmically transformed LOS values as the dependent variable. The resulting beta‐coefficients were transformed to reflect the percent difference in LOS between subjects receiving and not receiving macrolide therapy.
Building of the multivariable models began with the inclusion of macrolide therapy. Variables associated with primary outcomes on univariate analysis (P < 0.20) were also considered for inclusion as potential confounders.43 These variables were included in the final multivariable model if they remained significant after adjusting for other factors, or if their inclusion in the model resulted in a 15% or greater change in the effect size of the primary association of interest (ie, macrolide therapy).44 Because corticosteroids also have anti‐inflammatory properties, we assessed for interactions with macrolide therapy. There was no interaction between macrolide and systemic corticosteroid therapy (P = 0.26, Likelihood ratio test), therefore our primary model adjusted for systemic corticosteroids.
Despite adjusting for systemic corticosteroid therapy in our primary analysis, residual confounding by indication for corticosteroid therapy might exist. We therefore repeated the analysis after stratifying by receipt or non‐receipt of systemic corticosteroid therapy. Because the benefit of macrolides in preventing long‐term dysfunction may be limited to those without a prior diagnosis of asthma, we repeated the analysis of readmissions within 15 months of index discharge (any readmission and asthma‐related readmissions) while limiting the cohort to those without evidence of asthma (ie, no prior asthma‐related hospitalizations and no chronic asthma medications). Because children with underlying conditions or circumstances that would predispose to prolonged hospitalizations may have been included, despite our restriction of the cohort to those without an identified chronic complex condition, we also repeated the analysis while limiting the cohort to those with a LOS 7 days. Finally, all analyses were clustered on hospital using the robust standard errors of Huber and White to account for the correlation of exposures and outcomes among children within centers.
Data were analyzed using Stata version 11 (Stata Corporation, College Station, TX). Statistical significance was determined a priori as a two‐tailed P value <0.05.
RESULTS
Patient Characteristics
During the study, 690 children ages 6 to 18 years met inclusion criteria. Characteristics of these patients are shown in Table 1. The median age was 10 years (IQR, 7‐13 years). Ten patients (1.4%) also had a concomitant discharge diagnosis of pneumococcal pneumonia, while 19 patients (2.7%) had a concomitant discharge diagnosis of viral pneumonia; 1 of these patients had discharge diagnoses of both viral and pneumococcal pneumonia.
| Empiric Macrolide Therapy | ||||
|---|---|---|---|---|
| Variable | All Subjects | Yes | No | P |
| ||||
| Demographics | ||||
| Male sex | 356 (51.6) | 200 (49.4) | 156 (54.7) | 0.166 |
| Race | ||||
| Black | 135 (19.6) | 81 (20.0) | 54 (19.0) | 0.506 |
| White | 484 (70.1) | 287 (70.9) | 197 (69.1) | |
| Other | 62 (9.0) | 31 (7.7) | 31 (10.9) | |
| Missing | 9 (1.3) | 6 (1.5) | 3 (1.1) | |
| Presentation during viral respiratory season | 420 (60.9) | 242 (59.8) | 178 (62.5) | |
| Prior asthma hospitalization | 41 (5.9) | 31 (7.7) | 10 (3.5) | 0.023 |
| Intensive care unit admission | 127 (18.4) | 74 (18.3) | 53 (18.6) | 0.914 |
| Laboratory tests and procedures | ||||
| Additional radiologic imaging* | 24 (3.5) | 13 (3.2) | 11 (3.9) | 0.646 |
| Arterial blood gas | 116 (17.3) | 72 (18.5) | 44 (15.6) | 0.316 |
| Complete blood count | 433 (64.4) | 249 (64.0) | 184 (65.0) | 0.788 |
| Blood culture | 280 (41.7) | 167 (42.9) | 113 (39.9) | 0.436 |
| Mechanical ventilation | 16 (2.3) | 5 (1.2) | 11 (3.86) | 0.024 |
| Medications | ||||
| Chronic asthma medication | 116 (16.8) | 72 (17.8) | 44 (15.4) | 0.419 |
| Beta‐agonist therapy | 328 (47.5) | 215 (53.1) | 113 (39.7) | 0.001 |
| Vasoactive infusions | 22 (3.2) | 13 (3.2) | 9 (3.2) | 0.969 |
| Systemic corticosteroids | 252 (36.5) | 191 (47.2) | 61 (21.4) | <0.001 |
| Clindamycin or vancomycin | 86 (12.5) | 24 (5.9) | 62 (21.8) | <0.001 |
Macrolide therapy was administered to 405 (58.7%) patients. Systemic corticosteroid therapy was administered to 252 (36.5%) patients. Overall, 191 (27.7%) of the 690 patients received both macrolides and systemic corticosteroids empirically, while 224 (32.5%) received neither; 61 (8.8%) received corticosteroids but not macrolides, while 214 (31.0%) received macrolides but not corticosteroids. Asthma hospitalization within the 24 months prior to admission was more common among those receiving macrolides (N = 60/405, 14.8%) than among those not receiving macrolides (N = 30/285, 10.5%) (P = 0.023). Macrolide recipients also more commonly received concomitant systemic corticosteroids (N = 191/405, 47.2%) than macrolide non‐recipients (N = 61/285, 21.4%) (P < 0.001) and more commonly received beta‐agonist therapy (N = 215/405, 53.1%) than macrolide non‐recipients (N = 113/285, 39.7%) (P = 0.001).
Length of Stay
The overall median LOS was 3 days (IQR, 2‐6 days); the median LOS was 3 days (IQR, 2‐5 days) for empiric macrolide recipients and 4 days (IQR, 2‐9 days) for non‐recipients (P < 0.001). Overall, 22.9% (N = 158) of children had an LOS 7 days and 8.8% (N = 61) of children had an LOS 14 days. The LOS was 7 days for 15.3% (N = 62) of macrolide recipients and 33.7% (N = 96) of non‐recipients. LOS was 7 days for 17.5% (N = 44) of systemic steroid recipients and 26% (N = 114) of non‐recipients. In unadjusted analysis, macrolide therapy (beta‐coefficient, 0.49; 95% confidence interval [CI]: 0.72 to 0.25; P < 0.001) and systemic corticosteroid administration (beta‐coefficient, 0.26; CI: 0.37 to 0.14; P < 0.001) were associated with shorter hospital LOS (Appendix 1).
In multivariable analysis, macrolide therapy remained associated with a shorter LOS (Table 2; Appendix 2). Systemic corticosteroid administration was associated with a 23% shorter LOS (adjusted beta‐coefficient, 0.26; 95% CI: 0.39 to 0.14; P < 0.001). In contrast, previous hospitalization for asthma was associated with a 31% longer LOS (adjusted beta‐coefficient, 0.27; 95% CI: 0.09‐0.045; P = 0.004). Receipt of beta‐agonist therapy or chronic asthma medications were not associated with significant differences in LOS. In analysis stratified by receipt or non‐receipt of concomitant systemic corticosteroid therapy, empiric macrolide therapy remained associated with a significantly shorter LOS in both systemic corticosteroid recipients and non‐recipient (Table 4). When the cohort was restricted to subjects with a LOS 7 days, macrolide therapy remained significantly associated with a shorter LOS (adjusted percent change, 20%; 95% CI: 32% to 5%; P = 0.015).
| Association of Empiric Macrolide Therapy With Outcomes* | |
|---|---|
| |
| Length of stay (days) | |
| Adjusted beta‐coefficient (95 % CI) | 0.38 (0.59 to 0.17) |
| Adjusted percent change (95% CI) | 32% (45% to 15%) |
| P value | 0.001 |
| Any readmission within 28 days | |
| Adjusted odds ratio (95% CI) | 1.12 (0.22 to 5.78) |
| P value | 0.890 |
| Any readmission within 15 mo | |
| Adjusted odds ratio (95% CI) | 1.00 (0.59 to 1.70) |
| P value | 0.991 |
| Asthma hospitalization within 15 mo | |
| Adjusted odds ratio (95% CI) | 1.09 (0.54 to 2.17) |
| P value | 0.820 |
Readmission
Overall, 8 children (1.2%) were readmitted for pneumonia‐associated conditions within 28 days of index discharge. Readmission occurred in 1.2% of macrolide recipients and 1.1% of non‐recipients (P = 0.83) (Table 4). In unadjusted analysis, neither macrolide therapy (odds ratio [OR], 1.18; 95% CI: 0.25‐5.45; P = 0.84) nor systemic corticosteroid administration (OR, 1.04; 95% CI: 0.27‐4.10; P = 0.95) was associated with 28‐day readmission (Appendix 3). In multivariable analysis, empiric macrolide therapy was not associated with 28‐day readmission in the overall cohort (Table 2; Appendix 4)), or when the analysis was stratified by receipt or non‐receipt of concomitant systemic corticosteroid therapy (Table 3).
| Concomitant Systemic Corticosteroid Therapy* | ||
|---|---|---|
| Yes | No | |
| ||
| Length of stay | ||
| Adjusted beta‐coefficient (95% CI) | 0.40 (0.74 to 0.07) | 0.37 (0.58 to 0.16) |
| Adjusted percent change (95% CI) | 33% (52% to 7%) | 31% (44% to 15%) |
| P value | 0.020 | 0.001 |
| Readmission within 28 days | ||
| Adjusted odds ratio (95% CI) | 1.09 (0.05 to 26.7) | 1.50 (0.21 to 10.8) |
| P value | 0.960 | 0.687 |
| Readmission within 15 mo | ||
| Adjusted odds ratio (95% CI) | 1.57 (0.65 to 3.82) | 0.81 (0.45 to 1.46) |
| P value | 0.32 | 0.49 |
| Asthma hospitalization within 15 mo | ||
| Adjusted odds ratio (95% CI) | 1.51 (0.58 to 3.93) | 0.85 (0.36 to 1.97) |
| P value | 0.395 | 0.700 |
| Empiric Macrolide Therapy | ||
|---|---|---|
| N/Total (%) | ||
| Readmission | Yes | No |
| Any readmission within 28 days | ||
| Overall | 5/405 (1.2) | 3/285 (1.1) |
| Systemic corticosteroid therapy | 2/186 (1.1) | 1/66 (1.5) |
| No systemic corticosteroid therapy | 3/177 (1.7) | 2/261 (0.8) |
| Any readmission within 15 mo | ||
| Overall | 96/405 (23.7) | 64/285 (22.5) |
| Systemic corticosteroid therapy | 52/186 (28.0) | 17/66 (25.8) |
| No systemic corticosteroid therapy | 32/177 (18.1) | 59/261 (22.6) |
| Asthma hospitalization within 15 mo | ||
| Overall | 61/405 (15.1) | 34/285 (11.9) |
| Systemic corticosteroid therapy | 39/186 (21.0) | 13/66 (19.7) |
| No systemic corticosteroid therapy | 14/177 (7.9) | 29/261 (11.1) |
Overall, 160 children (23.2%) were readmitted within 15 months of index discharge; 95 were readmitted for asthma during this time (Table 3). Overall readmission occurred in 23.7% of macrolide recipients and 22.5% of macrolide non‐recipients (P = 0.702). Asthma readmission occurred in 15.1% of macrolide recipients and 11.9% of macrolide non‐recipients (P = 0.240). In unadjusted analysis, empiric macrolide therapy was not significantly associated with any readmission within 15 months (OR, 1.07; 95% CI: 0.69‐1.68; P = 0.759) or with asthma‐related readmission within 15 months (OR, 1.31; 95% CI: 0.73‐ 2.36; P = 0.369). In multivariable analysis, neither any readmission nor asthma readmission within 15 months was associated with empiric macrolide therapy overall (Table 2) or when stratified by receipt or non‐receipt of concomitant systemic corticosteroid therapy (Table 3).
The analyses for readmissions within 15 months of index discharge were repeated while limiting the cohort to those without prior asthma hospitalizations or chronic asthma medications. In this subset of patients, readmissions for any reason occurred in 55 (18.6%) of 295 macrolide recipients and 50 (22.0%) of 227 non‐recipients. The difference was not statistically significant in multivariable analysis (adjusted odds ratio, 0.79; 95% CI: 0.41‐1.51; P = 0.47). Readmissions for asthma occurred in 30 (10.2%) of 295 macrolide recipients and 26 (11.5%) of 227 non‐recipients; this difference was also not significant in multivariable analysis (adjusted odds ratio, 0.83; 95% CI: 0.36‐1.93; P = 0.83). The magnitude of the estimate of effect for 28‐day and 15‐month readmissions, and 15‐month asthma hospitalizations, was similar to the primary analysis when the cohort was restricted to subjects with a LOS 7 days.
DISCUSSION
This multicenter study examined the role of macrolide therapy in children hospitalized with M. pneumoniae pneumonia. Empiric macrolide therapy was associated with an approximately 30% shorter hospital LOS and, in stratified analysis, remained associated with a significantly shorter hospital LOS in both systemic corticosteroid recipients and non‐recipients. Empiric macrolide therapy was not associated with short‐ or longer‐term hospital readmission.
Previous small randomized trials have been inconclusive regarding the potential benefit of macrolide therapy in M. pneumoniae pneumonia.11 Our study, which demonstrated a shorter LOS among macrolides recipients compared with non‐recipients, has several advantages over prior studies including a substantively larger sample size and multicenter design. Animal models support our observations regarding the potential beneficial antimicrobial role of macrolides. M. pneumoniae concentrations in bronchoalveolar lavage specimens were significantly lower among experimentally infected mice treated with clarithromycin, a macolide‐class antibiotic, compared with either placebo or dexamethasone.45 Combination therapy with clarithromycin and dexamethasone reduced histopathologic inflammation to a greater degree than dexamethasone alone.45
While the relative importance of the antimicrobial and anti‐inflammatory properties of macrolides is not known, observational studies of children infected with macrolide‐resistant M. pneumoniae suggest that the antimicrobial properties of macrolides may provide disproportionate clinical benefit. The duration of fever in macrolide recipients with macrolide‐resistant M. pneumoniae (median duration, 9 days) reported by Suzuki et al46 was significantly longer than those with macrolide‐susceptible infections (median duration, 5 days), and similar to the duration of fever in patients with M. pneumoniae infection treated with placebo (median duration, 8 days) reported by Kingston et al.47 Additionally, macrolide therapy was associated with significant improvements in lung function in patients with asthma and concomitant M. pneumoniae infection, but not in patients with asthma without documented M. pneumoniae infection.9 As corticosteroids also have anti‐inflammatory properties, we expect that any anti‐inflammatory benefit of macrolide therapy would be mitigated by the concomitant administration of corticosteroids. The shorter LOS associated with empiric macrolide therapy in our study was comparable among corticosteroid recipients and non‐recipients.
Atypical bacterial pathogens, including M. pneumoniae, are associated with diffuse lower airway inflammation6, 48 and airway hyperresponsiveness,6 and have been implicated as a cause of acute asthma exacerbations.7, 4954 Among patients with previously diagnosed asthma, acute M. pneumoniae infection was identified in up to 20% of those having acute exacerbations.7, 54 Macrolide therapy has a beneficial effect on lung function and airway hyperresponsiveness in adults with asthma.9, 55 Among mice infected with M. pneumoniae, 3 days of macrolide therapy resulted in a significant reduction in airway hyperresponsiveness compared with placebo or dexamethasone; however, after 6 days of therapy, there was no significant difference in airway hyperresponsiveness between those receiving macrolides, dexamethasone, or placebo, suggesting that the benefit of macrolides on airway hyperresponsiveness may be brief. Our findings of a shorter LOS but no difference in readmissions at 28 days or longer, for macrolide recipients compared with non‐recipients, support the limited benefit of macrolide therapy beyond the initial reduction in bacterial load seen in the first few days of therapy.
M. pneumoniae infection has also been implicated as a cause of chronic pulmonary disease, including asthma.610 In the mouse model, peribronchial and perivascular mononuclear infiltrates, increased airway methacholine reactivity, and increased airway obstruction were observed 530 days after M. pneumoniae inoculation.6 M. pneumoniae has been identified in 26 (50%) of 51 children experiencing their first asthma attack,7 and 23 (42%) of 55 adults with chronic, stable asthma.9 Nevertheless, results of other studies addressing the issue are inconsistent, and the role of M. pneumoniae in the development of asthma remains unclear.56 In order to investigate the impact of macrolide therapy on the development of chronic pulmonary disease requiring hospitalization, we examined the readmission rates in the 15 months following index discharge. The proportion of children hospitalized with asthma following the hospitalization for M. pneumoniae pneumonia was higher for both macrolide recipients and non‐recipients compared with the 24‐months prior to infection. These results support a possible role for M. pneumoniae in chronic pulmonary disease. However, macrolide therapy was not associated with long‐term overall hospital readmission or long‐term asthma readmission, either in the entire cohort or in the subset of patients without prior asthma hospitalizations or medications.
This study had several limitations. First, because the identification of children with M. pneumoniae pneumonia relied on ICD‐9 discharge diagnosis codes, it is possible that there was misclassification of disease. We minimized the inclusion of children without M. pneumoniae by including only children who received antibiotic therapy on the first day of hospitalization and by excluding patients younger than 6 years of age, a group at relatively low‐risk for M. pneumoniae infection. Further, our algorithm for identification of M. pneumoniae pneumonia was validated through review of the medical records at 1 institution and was found to have a high positive predictive value. However, the positive predictive value of these ICD‐9 codes may vary across institutions. Additionally, the sensitivity of ICD‐9 codes for identifying children with M. pneumoniae pneumonia is not known. Also, not all children with pneumonia undergo testing for M. pneumoniae, and different tests have varying sensitivity and specificity.57, 58 Thus, some children with M. pneumoniae pneumonia were not diagnosed and so were not included in our study. It is not known how inclusion of these children would affect our results.
Second, the antibiotic information used in this study was limited to empiric antibiotic therapy. It is possible that some patients received macrolide therapy before admission. It is also likely that identification of M. pneumoniae during the hospitalization prompted the addition or substitution of macrolide therapy for some patients. If this therapy was initiated beyond the first day of hospitalization, these children would be classified as macrolide non‐recipients. Since macrolide administration was associated with a shorter hospital LOS, such misclassification would bias our results towards finding no difference in LOS between macrolide recipients and non‐recipients. It is therefore possible that the benefit of macrolide therapy is even greater than found in our study.
Third, there may be unmeasured confounding or residual confounding by indication for adjunct corticosteroid therapy related to clinical presentation. We expect that corticosteroid recipients would be sicker than non‐recipients. We included variables associated with a greater severity of illness (such as intensive care unit admission) in the multivariable analysis. Additionally, the shorter LOS among macrolide recipients remained when the analysis was stratified by receipt or non‐receipt of systemic corticosteroid therapy.
Fourth, we were only able to record readmissions occurring at the same hospital as the index admission; any readmission presenting to a different hospital following their index admission did not appear in our records, and was therefore not counted. It is thus possible that the true number of readmissions is higher than that represented here. Finally, despite the large number of patients included in this study, the number of short‐term readmissions was relatively small. Thus, we may have been underpowered to detect small but significant differences in short‐term readmission rates.
In conclusion, macrolide therapy was associated with shorter hospital LOS, but not with short‐term or longer‐term readmission in children presenting with M. pneumoniae pneumonia.
Appendix
| Variable | Beta Coefficient | Confidence Interval | P Value |
|---|---|---|---|
| Demographics | |||
| Sex | 0.12 | (0.22, 0.02) | 0.022 |
| Race | |||
| Blackreference category | |||
| White | 0.01 | (0.21, 0.23) | 0.933 |
| Other | 0.13 | (0.39, 0.13) | 0.323 |
| Missing | 0.46 | (0.81, 0.11) | 0.012 |
| Presentation during viral respiratory season | 0.05 | (0.19, 0.09) | 0.462 |
| Prior asthma hospitalization | 0.36 | (0.64, 0.08) | 0.015 |
| Intensive care unit admission | 1.05 | (0.87, 1.23) | <0.001 |
| Labs and procedures performed | |||
| Additional radiologic imaging | 0.23 | (0.20, 0.67) | 0.287 |
| Arterial blood gas | 0.69 | (0.50, 0.87) | <0.001 |
| Complete blood count | 0.34 | (0.24, 0.45) | <0.001 |
| Blood culture | 0.17 | (0.98, 0.44) | 0.204 |
| Mechanical ventilation | 1.15 | (0.68, 1.63) | <0.001 |
| Therapies received | |||
| Empiric macrolide therapy | 0.49 | (0.72, 0.25) | <0.001 |
| Systemic steroids | 0.26 | (0.38, 0.14) | <0.001 |
| Chronic asthma medications | 0.20 | (0.38, 0.013) | 0.037 |
| Beta‐agonist therapy | 0.07 | (0.21, 0.08) | 0.357 |
| Vasoactive infusion | 1.08 | (0.727, 1.45) | <0.001 |
| Clindamycin or vancomycin | 0.55 | (0.34, 0.75) | <0.001 |
| Variable | Odds Ratio* | Confidence Interval | P Value |
|---|---|---|---|
| |||
| Demographics | |||
| Sex | 0.56 | (0.23, 1.33) | 0.190 |
| Race | |||
| Blackreference category | |||
| White | 0.46 | (0.19, 1.14) | 0.093 |
| Other | |||
| Missing | |||
| Presentation during viral respiratory season | 0.64 | (0.09, 4.75) | 0.662 |
| Prior asthma hospitalization | |||
| Intensive care unit admission | 4.54 | (1.21, 17.03) | 0.025 |
| Laboratory tests and procedures | |||
| Additional radiologic imaging | 10.00 | (2.25, 44.47) | 0.002 |
| Arterial blood gas | |||
| Complete blood count | 0.92 | (0.24, 3.48) | 0.901 |
| Blood culture | 0.85 | (0.30, 2.36) | 0.738 |
| Mechanical ventilation | |||
| Medications | |||
| Macrolide therapy | 1.18 | (0.25, 5.45) | 0.837 |
| Systemic corticosteroids | 1.04 | (0.276, 4.09) | 0.951 |
| Chronic asthma medication | 1.66 | (0.71, 3.88) | 0.242 |
| Beta‐agonist therapy | 0.66 | (0.16, 2.65) | 0.557 |
| Vasoactive infusions | |||
| Clindamycin or vancomycin | 1.00 | (0.10, 9.90) | 0.998 |
| Variable | Coefficient | Confidence Interval | P Value | % Change | Confidence Interval for % Change |
|---|---|---|---|---|---|
| Demographics | |||||
| Age | 0.287 | (0.012, 0.045) | 0.001 | 2.9 | (1.2, 4.6) |
| Prior asthma hospitalization | 0.272 | (0.094, 0.45) | 0.004 | 31.3 | (9.9, 56.8) |
| Intensive care unit admission | 1.015 | (0.802, 1.23) | <0.001 | 175.9 | (123.0, 241.3) |
| Therapies received | |||||
| Macrolide therapy | 0.379 | (0.59, 0.166) | 0.001 | 31.6 | (44.6, 15.3) |
| Systemic corticosteroids | 0.264 | (0.391, 0.138) | <0.001 | 23.2 | (32.3, 12.9) |
| Chronic asthma medications | 0.056 | (0.255, 0.142) | 0.568 | 5.5 | (22.5, 15.2) |
| Albuterol | 0.07 | (0.059, 0.199) | 0.281 | 7.2 | (5.8, 22.0) |
| Clindamycin or vancomycin | 0.311 | (0.063, 0.559) | 0.015 | 36.5 | (6.5, 74.9) |
| Variable | Adjusted Odds Ratio | Confidence Interval | P Value |
|---|---|---|---|
| Demographics | |||
| Age | 0.91 | 0.72, 1.15 | 0.423 |
| Prior asthma hospitalization | 1.94 | 0.42, 8.90 | 0.394 |
| Intensive care unit admission | 5.73 | 2.03, 16.20 | 0.001 |
| Therapies received | |||
| Macrolide therapy | 1.12 | 0.22, 5.78 | 0.890 |
| Systemic corticosteroids | 0.696 | 0.10, 4.70 | 0.710 |
| Chronic asthma medications | 1.98 | 0.32, 12.20 | 0.460 |
| Albuterol | 0.519 | 0.081, 3.31 | 0.488 |
| Clindamycin or vancomycin | 0.904 | 0.07, 11.13 | 0.937 |
- ,,, et al.Prospective surveillance for atypical pathogens in children with community‐acquired pneumonia in Japan.J Infect Chemother.2006;12:36–41.
- ,,.Incidence of community‐acquired pneumonia in children caused by Mycoplasma pneumoniae: serological results of a prospective, population‐based study in primary health care.Respirology.2004;9:109–114.
- ,,.Mycoplasma pneumoniae infections in University of Wisconsin students.Am Rev Respir Dis.1967;96:237–244.
- .Infections caused by Mycoplasma pneumoniae and possible carrier state in different populations of patients.Clin Infect Dis.1993;17(suppl 1):S37–S46.
- .Mycoplasma pneumoniae. In: Long SS, Pickering LK, Prober CG, eds.Principles and Practice of Pediatric Infectious Diseases.3rd ed.Philadelphia, PA:Churchill Livingstone;2008:979–985.
- ,,, et al.Mycoplasma pneumoniae induces chronic respiratory infection, airway hyperreactivity, and pulmonary inflammation: a murine model of infection‐associated chronic reactive airway disease.Infect Immun.2002;70:649–654.
- ,,, et al.Mycoplasma pneumoniae and asthma in children.Clin Infect Dis.2004;38:1341–1346.
- ,,,.Isolation of Mycoplasma pneumoniae from asthmatic patients.Ann Allergy.1993;70:23–25.
- ,,,.Mycoplasma pneumoniae and Chlamydia pneumoniae in asthma: effect of clarithromycin.Chest.2002;121:1782–1788.
- ,,,,.A link between chronic asthma and chronic infection.J Allergy Clin Immunol.2001;107:595–601.
- ,,.Antibiotics for community‐acquired lower respiratory tract infections secondary to Mycoplasma pneumoniae in children.Cochrane Database Syst Rev.2010;7:CD004875.
- ,,,.In vitro susceptibilities of mycoplasmas and ureaplasmas to new macrolides and aryl‐fluoroquinolones.Antimicrob Agents Chemother.1988;32:1500–1502.
- ,,.Inhibitory and bactericidal activities of gemifloxacin and other antimicrobials against Mycoplasma pneumoniae.Int J Antimicrob Agents.2003;21:574–577.
- ,,,,.The in vitro activity of some 14‐, 15‐ and 16‐ membered macrolides against Staphylococcus spp., Legionella spp., Mycoplasma spp. and Ureaplasma urealyticum.Drugs Exp Clin Res.1991;17:91–99.
- ,,, et al.In vitro and in vivo activities of macrolides against Mycoplasma pneumoniae.Antimicrob Agents Chemother.1994;38:790–798.
- ,.Comparative in vitro activity of azithromycin, clarithromycin, erythromycin and lomefloxacin against Mycoplasma pneumoniae, Mycoplasma hominis and Ureaplasma urealyticum.Eur J Clin Microbiol Infect Dis.1990;9:838–841.
- ,,, et al.Characteristics of macrolide‐resistant Mycoplasma pneumoniae strains isolated from patients and induced with erythromycin in vitro.Microbiol Immunol.2001;45:617–620.
- ,,, et al.Characterization and molecular analysis of macrolide‐resistant Mycoplasma pneumoniae clinical isolates obtained in Japan.Antimicrob Agents Chemother.2004;48:4624–4630.
- ,,,.Role of Mycoplasma pneumoniae and Chlamydia pneumoniae in children with community‐acquired lower respiratory tract infections.Clin Infect Dis.2001;32:1281–1289.
- ,,, et al.Characteristics of Streptococcus pneumoniae and atypical bacterial infections in children 2–5 years of age with community‐acquired pneumonia.Clin Infect Dis.2002;35:1345–1352.
- ,,,,.Macrolide use shortens fever duration in Mycoplasma pneumoniae infection in children: a 2‐year experience.J Microbiol Immunol Infect.2008;41:307–310.
- ,,,,.Comparison of antibiotics in the treatment of mycoplasmal pneumonia.Arch Intern Med.1970;125:680–684.
- ,,, et al.Antimicrobial and immunologic activities of clarithromycin in a murine model of Mycoplasma pneumoniae‐induced pneumonia.Antimicrob Agents Chemother.2003;47:1614–1620.
- ,.Antibiotics in asthma.Curr Allergy Asthma Rep.2004;4:132–138.
- ,.Immunomodulatory activity and effectiveness of macrolides in chronic airway disease.Chest.2004;125:70S–78S.
- ,,, et al.Interleukin‐8 gene repression by clarithromycin is mediated by the activator protein‐1 binding site in human bronchial epithelial cells.Am J Respir Cell Mol Biol.2000;22:51–60.
- ,,, et al.Clarithromycin inhibits NF‐kappaB activation in human peripheral blood mononuclear cells and pulmonary epithelial cells.Antimicrob Agents Chemother.2001;45:44–47.
- ,,,,.Epidemiology of Mycoplasma pneumoniae infection in families.JAMA.1966;197:859–866.
- ,,.Shedding of Mycoplasma pneumoniae after tetracycline and erythromycin therapy.N Engl J Med.1967;276:1172–1175.
- ,,.Mycoplasma pneumoniae disease: clinical spectrum, pathophysiology, epidemiology, and control.J Infect Dis.1971;123:74–92.
- .Is there a role for antibiotics in the treatment of asthma? Involvement of atypical organisms.BioDrugs.2000;14:349–354.
- ,.Diffuse panbronchiolitis: role of macrolides in therapy.Am J Respir Med.2002;1:119–131.
- ,,,,,.Long‐term low‐dose administration of erythromycin to patients with diffuse panbronchiolitis.Respiration.1991;58:145–149.
- ,,,,,.[Long‐term therapeutic effects of erythromycin and newquinolone antibacterial agents on diffuse panbronchiolitis].Nihon Kyobu Shikkan Gakkai Zasshi.1990;28:1305–1313.
- ,,, et al.A comparative clinical study of macrolide‐sensitive and macrolide‐resistant Mycoplasma pneumoniae infections in pediatric patients.J Infect Chemother.2009;15:380–383.
- ,,,.Corticosteroids and mortality in children with bacterial meningitis.JAMA.2008;299:2048–2055.
- ,,,,.Intravenous immunoglobulin in children with streptococcal toxic shock syndrome.Clin Infect Dis.2009;49:1369–1376.
- ,,, et al.Etiology of childhood pneumonia: serologic results of a prospective, population‐based study.Pediatr Infect Dis J.1998;17:986–991.
- ,,,,,.Deaths attributed to pediatric complex chronic conditions: national trends and implications for supportive care services.Pediatrics.2001;107:E99.
- ,,,,,.Adjunct corticosteroids in children hospitalized with community‐acquired pneumonia.Pediatrics.2011;127:e255–e263.
- ,,, et al.Comparative effectiveness of pleural drainage procedures for the treatment of complicated pneumonia in childhood.J Hosp Med.2011;6:256–263.
- ,,, et al.Detection of Mycoplasma pneumoniae in the airways of adults with chronic asthma.Am J Respir Crit Care Med.1998;158:998–1001.
- ,.The impact of confounder selection criteria on effect estimation.Am J Epidemiol.1989;129:125–137.
- ,,.The risk of determining risk with multivariable models.Ann Intern Med.1993;118:201–210.
- ,,, et al.The impact of steroids given with macrolide therapy on experimental Mycoplasma pneumoniae respiratory infection.J Infect Dis.2008;198:1180–1188.
- ,,, et al.Clinical evaluation of macrolide‐resistant Mycoplasma pneumoniae.Antimicrob Agents Chemother.2006;50:709–712.
- ,,, et al.Eaton agent pneumonia.JAMA.1961;176:118–123.
- .The role of viral and atypical bacterial pathogens in asthma pathogenesis.Pediatr Pulmonol Suppl.1999;18:141–143.
- ,,.The association of viral and mycoplasma infections with recurrence of wheezing in the asthmatic child.Ann Allergy.1970;28:43–49.
- ,,,.Association of viral and mycoplasma infections with exacerbations of asthma.Ann Allergy.1974;33:145–149.
- ,,, et al.Acute Chlamydia pneumoniae and Mycoplasma pneumoniae infections in community‐acquired pneumonia and exacerbations of COPD or asthma: therapeutic considerations.J Chemother.2004;16:70–76.
- ,,, et al.Mycoplasma pneumoniae is a frequent cause of exacerbation of bronchial asthma in adults.Ann Allergy.1986;57:263–265.
- ,,, et al.Acute exacerbations of asthma in adults: role of Chlamydia pneumoniae infection.Eur Respir J.1994;7:2165–2168.
- ,,, et al.Atypical pathogen infection in adults with acute exacerbation of bronchial asthma.Am J Respir Crit Care Med.2003;167:406–410.
- ,,,,,.Erythromycin reduces the severity of bronchial hyperresponsiveness in asthma.Chest.1991;99:670–673.
- ,,,,.Atypical bacteria and macrolides in asthma.Allergy Asthma Clin Immunol.2008;4:111–116.
- ,,.Acute respiratory infection due to Mycoplasma pneumoniae: current status of diagnostic methods.Eur J Clin Microbiol Infect Dis.2010;29:1055–1069.
- ,,,,,.A multicenter pilot external quality assessment programme to assess the quality of molecular detection of Chlamydophila pneumoniae and Mycoplasma pneumoniae.J Microbiol Methods.2010;82:131–135.
Copyright © 2012 Society of Hospital Medicine
Observation Care in Children's Hospitals
Observation medicine has grown in recent decades out of changes in policies for hospital reimbursement, requirements for patients to meet admission criteria to qualify for inpatient admission, and efforts to avoid unnecessary or inappropriate admissions.1 Emergency physicians are frequently faced with patients who are too sick to be discharged home, but do not clearly meet criteria for an inpatient status admission. These patients often receive extended outpatient services (typically extending 24 to 48 hours) under the designation of observation status, in order to determine their response to treatment and need for hospitalization.
Observation care delivered to adult patients has increased substantially in recent years, and the confusion around the designation of observation versus inpatient care has received increasing attention in the lay press.27 According to the Centers for Medicare and Medicaid Services (CMS)8:
Observation care is a well‐defined set of specific, clinically appropriate services, which include ongoing short term treatment, assessment, and reassessment before a decision can be made regarding whether patients will require further treatment as hospital inpatients. Observation services are commonly ordered for patients who present to the emergency department and who then require a significant period of treatment or monitoring in order to make a decision concerning their admission or discharge.
Observation status is an administrative label that is applied to patients who do not meet inpatient level of care criteria, as defined by third parties such as InterQual. These criteria usually include a combination of the patient's clinical diagnoses, severity of illness, and expected needs for monitoring and interventions, in order to determine the admission status to which the patient may be assigned (eg, observation, inpatient, or intensive care). Observation services can be provided, in a variety of settings, to those patients who do not meet inpatient level of care but require a period of observation. Some hospitals provide observation care in discrete units in the emergency department (ED) or specific inpatient unit, and others have no designated unit but scatter observation patients throughout the institution, termed virtual observation units.9
For more than 30 years, observation unit (OU) admission has offered an alternative to traditional inpatient hospitalization for children with a variety of acute conditions.10, 11 Historically, the published literature on observation care for children in the United States has been largely based in dedicated emergency department OUs.12 Yet, in a 2001 survey of 21 pediatric EDs, just 6 reported the presence of a 23‐hour unit.13 There are single‐site examples of observation care delivered in other settings.14, 15 In 2 national surveys of US General Hospitals, 25% provided observation services in beds adjacent to the ED, and the remainder provided observation services in hospital inpatient units.16, 17 However, we are not aware of any previous multi‐institution studies exploring hospital‐wide practices related to observation care for children.
Recognizing that observation status can be designated using various standards, and that observation care can be delivered in locations outside of dedicated OUs,9 we developed 2 web‐based surveys to examine the current models of pediatric observation medicine in US children's hospitals. We hypothesized that observation care is most commonly applied as a billing designation and does not necessarily represent care delivered in a structurally or functionally distinct OU, nor does it represent a difference in care provided to those patients with inpatient designation.
METHODS
Study Design
Two web‐based surveys were distributed, in April 2010, to the 42 freestanding, tertiary care children's hospitals affiliated with the Child Health Corporation of America (CHCA; Shawnee Mission, KS) which contribute data to the Pediatric Health Information System (PHIS) database. The PHIS is a national administrative database that contains resource utilization data from participating hospitals located in noncompeting markets of 27 states plus the District of Columbia. These hospitals account for 20% of all tertiary care children's hospitals in the United States.
Survey Content
Survey 1
A survey of hospital observation status practices has been developed by CHCA as a part of the PHIS data quality initiative (see Supporting Appendix: Survey 1 in the online version of this article). Hospitals that did not provide observation patient data to PHIS were excluded after an initial screening question. This survey obtained information regarding the designation of observation status within each hospital. Hospitals provided free‐text responses to questions related to the criteria used to define observation, and to admit patients into observation status. Fixed‐choice response questions were used to determine specific observation status utilization criteria and clinical guidelines (eg, InterQual and Milliman) used by hospitals for the designation of observation status to patients.
Survey 2
We developed a detailed follow‐up survey in order to characterize the structures and processes of care associated with observation status (see Supporting Appendix: Survey 2 in the online version of this article). Within the follow‐up survey, an initial screening question was used to determine all types of patients to which observation status is assigned within the responding hospitals. All other questions in Survey 2 were focused specifically on those patients who required additional care following ED evaluation and treatment. Fixed‐choice response questions were used to explore differences in care for patients under observation and those admitted as inpatients. We also inquired of hospital practices related to boarding of patients in the ED while awaiting admission to an inpatient bed.
Survey Distribution
Two web‐based surveys were distributed to all 42 CHCA hospitals that contribute data to PHIS. During the month of April 2010, each hospital's designated PHIS operational contact received e‐mail correspondence requesting their participation in each survey. Within hospitals participating in PHIS, Operational Contacts have been assigned to serve as the day‐to‐day PHIS contact person based upon their experience working with the PHIS data. The Operational Contacts are CHCA's primary contact for issues related to the hospital's data quality and reporting to PHIS. Non‐responders were contacted by e‐mail for additional requests to complete the surveys. Each e‐mail provided an introduction to the topic of the survey and a link to complete the survey. The e‐mail requesting participation in Survey 1 was distributed the first week of April 2010, and the survey was open for responses during the first 3 weeks of the month. The e‐mail requesting participation in Survey 2 was sent the third week of April 2010, and the survey was open for responses during the subsequent 2 weeks.
DATA ANALYSIS
Survey responses were collected and are presented as a descriptive summary of results. Hospital characteristics were summarized with medians and interquartile ranges for continuous variables, and with percents for categorical variables. Characteristics were compared between hospitals that responded and those that did not respond to Survey 2 using Wilcoxon rank‐sum tests and chi‐square tests as appropriate. All analyses were performed using SAS v.9.2 (SAS Institute, Cary, NC), and a P value <0.05 was considered statistically significant. The study was reviewed by the University of Michigan Institutional Review Board and considered exempt.
RESULTS
Responses to Survey 1 were available from 37 of 42 (88%) of PHIS hospitals (Figure 1). For Survey 2, we received responses from 20 of 42 (48%) of PHIS hospitals. Based on information available from Survey 1, we know that 20 of the 31 (65%) PHIS hospitals that report observation status patient data to PHIS responded to Survey 2. Characteristics of the hospitals responding and not responding to Survey 2 are presented in Table 1. Respondents provided hospital identifying information which allowed for the linkage of data, from Survey 1, to 17 of the 20 hospitals responding to Survey 2. We did not have information available to link responses from 3 hospitals.
| Respondent N = 20 | Non‐Respondent N = 22 | P Value | |
|---|---|---|---|
| |||
| No. of inpatient beds Median [IQR] (excluding Obstetrics) | 245 [219283] | 282 [250381] | 0.076 |
| Annual admissions Median [IQR] (excluding births) | 11,658 [8,64213,213] | 13,522 [9,83018,705] | 0.106 |
| ED volume Median [IQR] | 60,528 [47,85082,955] | 64,486 [47,38684,450] | 0.640 |
| Percent government payer Median [IQR] | 53% [4662] | 49% [4158] | 0.528 |
| Region | |||
| Northeast | 37% | 0% | 0.021 |
| Midwest | 21% | 33% | |
| South | 21% | 50% | |
| West | 21% | 17% | |
| Reports observation status patients to PHIS | 85% | 90% | 0.555 |
Based on responses to the surveys and our knowledge of data reported to PHIS, our current understanding of patient flow from ED through observation to discharge home, and the application of observation status to the encounter, is presented in Figure 2. According to free‐text responses to Survey 1, various methods were applied to designate observation status (gray shaded boxes in Figure 2). Fixed‐choice responses to Survey 2 revealed that observation status patients were cared for in a variety of locations within hospitals, including ED beds, designated observation units, and inpatient beds (dashed boxes in Figure 2). Not every facility utilized all of the listed locations for observation care. Space constraints could dictate the location of care, regardless of patient status (eg, observation vs inpatient), in hospitals with more than one location of care available to observation patients. While patient status could change during a visit, only the final patient status at discharge enters the administrative record submitted to PHIS (black boxes in Figure 2). Facility charges for observation remained a part of the visit record and were reported to PHIS. Hospitals may or may not bill for all assigned charges depending on patient status, length of stay, or other specific criteria determined by contracts with individual payers.
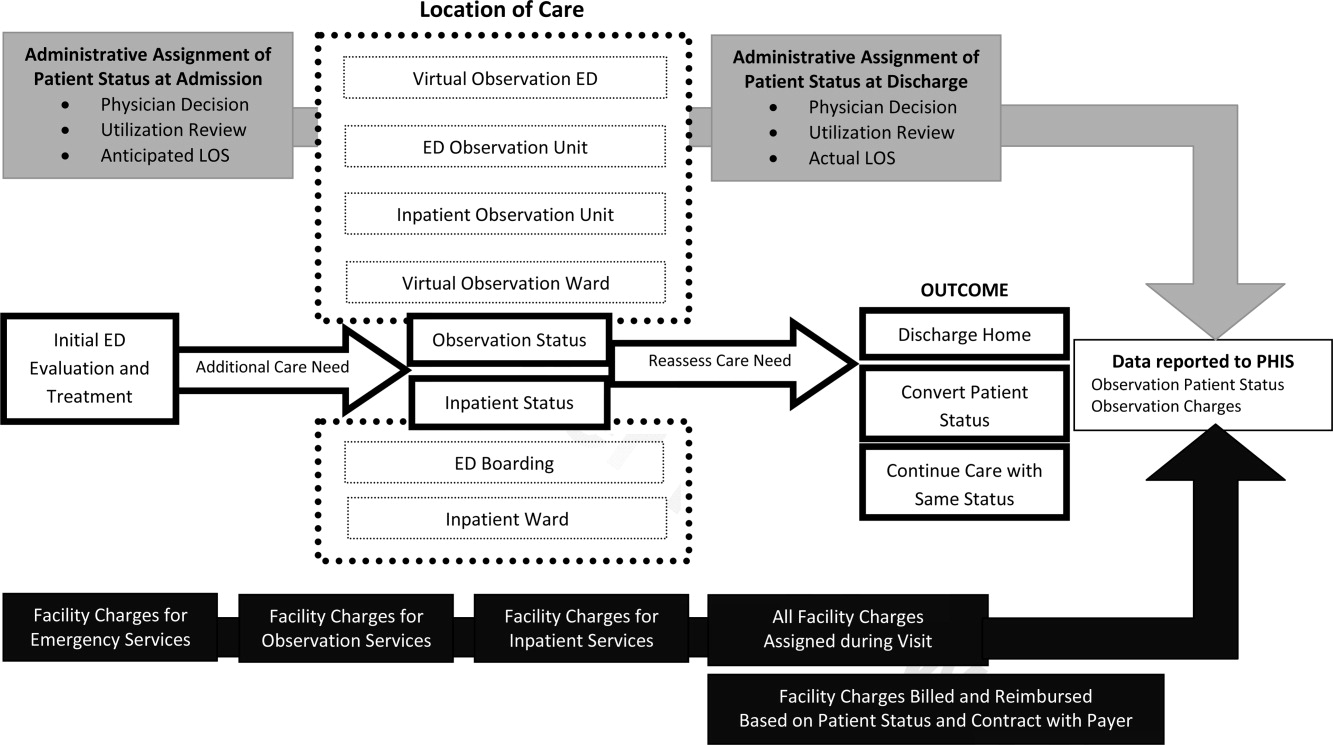
Survey 1: Classification of Observation Patients and Presence of Observation Units in PHIS Hospitals
According to responses to Survey 1, designated OUs were not widespread, present in only 12 of the 31 hospitals. No hospital reported treating all observation status patients exclusively in a designated OU. Observation status was defined by both duration of treatment and either level of care criteria or clinical care guidelines in 21 of the 31 hospitals responding to Survey 1. Of the remaining 10 hospitals, 1 reported that treatment duration alone defines observation status, and the others relied on prespecified observation criteria. When considering duration of treatment, hospitals variably indicated that anticipated or actual lengths of stay were used to determine observation status. Regarding the maximum hours a patient can be observed, 12 hospitals limited observation to 24 hours or fewer, 12 hospitals observed patients for no more than 36 to 48 hours, and the remaining 7 hospitals allowed observation periods of 72 hours or longer.
When admitting patients to observation status, 30 of 31 hospitals specified the criteria that were used to determine observation admissions. InterQual criteria, the most common response, were used by 23 of the 30 hospitals reporting specified criteria; the remaining 7 hospitals had developed hospital‐specific criteria or modified existing criteria, such as InterQual or Milliman, to determine observation status admissions. In addition to these criteria, 11 hospitals required a physician order for admission to observation status. Twenty‐four hospitals indicated that policies were in place to change patient status from observation to inpatient, or inpatient to observation, typically through processes of utilization review and application of criteria listed above.
Most hospitals indicated that they faced substantial variation in the standards used from one payer to another when considering reimbursement for care delivered under observation status. Hospitals noted that duration‐of‐carebased reimbursement practices included hourly rates, per diem, and reimbursement for only the first 24 or 48 hours of observation care. Hospitals identified that payers variably determined reimbursement for observation based on InterQual level of care criteria and Milliman care guidelines. One hospital reported that it was not their practice to bill for the observation bed.
Survey 2: Understanding Observation Patient Type Administrative Data Following ED Care Within PHIS Hospitals
Of the 20 hospitals responding to Survey 2, there were 2 hospitals that did not apply observation status to patients after ED care and 2 hospitals that did not provide complete responses. The remaining 16 hospitals provided information regarding observation status as applied to patients after receiving treatment in the ED. The settings available for observation care and patient groups treated within each area are presented in Table 2. In addition to the patient groups listed in Table 2, there were 4 hospitals where patients could be admitted to observation status directly from an outpatient clinic. All responding hospitals provided virtual observation care (ie, observation status is assigned but the patient is cared for in the existing ED or inpatient ward). Nine hospitals also provided observation care within a dedicated ED or ward‐based OU (ie, a separate clinical area in which observation patients are treated).
| Hospital No. | Available Observation Settings | Patient Groups Under Observation in Each Setting | UR to Assign Obs Status | When Obs Status Is Assigned | ||
|---|---|---|---|---|---|---|
| ED | Post‐Op | Test/Treat | ||||
| ||||||
| 1 | Virtual inpatient | X | X | X | Yes | Discharge |
| Ward‐based OU | X | X | No | |||
| 2 | Virtual inpatient | X | X | Yes | Admission | |
| Ward‐based OU | X | X | X | No | ||
| 3 | Virtual inpatient | X | X | X | Yes | Discharge |
| Ward‐based OU | X | X | X | Yes | ||
| ED OU | X | Yes | ||||
| Virtual ED | X | Yes | ||||
| 4 | Virtual inpatient | X | X | X | Yes | Discharge |
| ED OU | X | No | ||||
| Virtual ED | X | No | ||||
| 5 | Virtual inpatient | X | X | X | N/A | Discharge |
| 6 | Virtual inpatient | X | X | X | Yes | Discharge |
| 7 | Virtual inpatient | X | X | Yes | No response | |
| Ward‐based OU | X | Yes | ||||
| Virtual ED | X | Yes | ||||
| 8 | Virtual inpatient | X | X | X | Yes | Admission |
| 9 | Virtual inpatient | X | X | Yes | Discharge | |
| ED OU | X | Yes | ||||
| Virtual ED | X | Yes | ||||
| 10 | Virtual inpatient | X | X | X | Yes | Admission |
| ED OU | X | Yes | ||||
| 11 | Virtual inpatient | X | X | Yes | Discharge | |
| Ward‐based OU | X | X | Yes | |||
| ED OU | X | Yes | ||||
| Virtual ED | X | Yes | ||||
| 12 | Virtual inpatient | X | X | X | Yes | Admission |
| 13 | Virtual inpatient | X | X | N/A | Discharge | |
| Virtual ED | X | N/A | ||||
| 14 | Virtual inpatient | X | X | X | Yes | Both |
| 15 | Virtual inpatient | X | X | Yes | Admission | |
| Ward‐based OU | X | X | Yes | |||
| 16 | Virtual inpatient | X | Yes | Admission | ||
When asked to identify differences between clinical care delivered to patients admitted under virtual observation and those admitted under inpatient status, 14 of 16 hospitals selected the option There are no differences in the care delivery of these patients. The differences identified by 2 hospitals included patient care orders, treatment protocols, and physician documentation. Within the hospitals that reported utilization of virtual ED observation, 2 reported differences in care compared with other ED patients, including patient care orders, physician rounds, documentation, and discharge process. When admitted patients were boarded in the ED while awaiting an inpatient bed, 11 of 16 hospitals allowed for observation or inpatient level of care to be provided in the ED. Fourteen hospitals allow an admitted patient to be discharged home from boarding in the ED without ever receiving care in an inpatient bed. The discharge decision was made by ED providers in 7 hospitals, and inpatient providers in the other 7 hospitals.
Responses to questions providing detailed information on the process of utilization review were provided by 12 hospitals. Among this subset of hospitals, utilization review was consistently used to assign virtual inpatient observation status and was applied at admission (n = 6) or discharge (n = 8), depending on the hospital. One hospital applied observation status at both admission and discharge; 1 hospital did not provide a response. Responses to questions regarding utilization review are presented in Table 3.
| Survey Question | Yes N (%) | No N (%) |
|---|---|---|
| Preadmission utilization review is conducted at my hospital. | 3 (25) | 9 (75) |
| Utilization review occurs daily at my hospital. | 10 (83) | 2 (17) |
| A nonclinician can initiate an order for observation status. | 4 (33) | 8 (67) |
| Status can be changed after the patient has been discharged. | 10 (83) | 2 (17) |
| Inpatient status would always be assigned to a patient who receives less than 24 hours of care and meets inpatient criteria. | 9 (75) | 3 (25) |
| The same status would be assigned to different patients who received the same treatment of the same duration but have different payers. | 6 (50) | 6 (50) |
DISCUSSION
This is the largest descriptive study of pediatric observation status practices in US freestanding children's hospitals and, to our knowledge, the first to include information about both the ED and inpatient treatment environments. There are two important findings of this study. First, designated OUs were uncommon among the group of freestanding children's hospitals that reported observation patient data to PHIS in 2010. Second, despite the fact that hospitals reported observation care was delivered in a variety of settings, virtual inpatient observation status was nearly ubiquitous. Among the subset of hospitals that provided information about the clinical care delivered to patients admitted under virtual inpatient observation, hospitals frequently reported there were no differences in the care delivered to observation patients when compared with other inpatients.
The results of our survey indicate that designated OUs are not a commonly available model of observation care in the study hospitals. In fact, the vast majority of the hospitals used virtual inpatient observation care, which did not differ from the care delivered to a child admitted as an inpatient. ED‐based OUs, which often provide operationally and physically distinct care to observation patients, have been touted as cost‐effective alternatives to inpatient care,1820 resulting in fewer admissions and reductions in length of stay19, 20 without a resultant increase in return ED‐visits or readmissions.2123 Research is needed to determine the patient‐level outcomes for short‐stay patients in the variety of available treatment settings (eg, physically or operationally distinct OUs and virtual observation), and to evaluate these outcomes in comparison to results published from designated OUs. The operationally and physically distinct features of a designated OU may be required to realize the benefits of observation attributed to individual patients.
While observation care has been historically provided by emergency physicians, there is increasing interest in the role of inpatient providers in observation care.9 According to our survey, children were admitted to observation status directly from clinics, following surgical procedures, scheduled tests and treatment, or after evaluation and treatment in the ED. As many of these children undergo virtual observation in inpatient areas, the role of inpatient providers, such as pediatric hospitalists, in observation care may be an important area for future study, education, and professional development. Novel models of care, with hospitalists collaborating with emergency physicians, may be of benefit to the children who require observation following initial stabilization and treatment in the ED.24, 25
We identified variation between hospitals in the methods used to assign observation status to an episode of care, including a wide range of length of stay criteria and different approaches to utilization review. In addition, the criteria payers use to reimburse for observation varied between payers, even within individual hospitals. The results of our survey may be driven by issues of reimbursement and not based on a model of optimizing patient care outcomes using designated OUs. Variations in reimbursement may limit hospital efforts to refine models of observation care for children. Designated OUs have been suggested as a method for improving ED patient flow,26 increasing inpatient capacity,27 and reducing costs of care.28 Standardization of observation status criteria and consistent reimbursement for observation services may be necessary for hospitals to develop operationally and physically distinct OUs, which may be essential to achieving the proposed benefits of observation medicine on costs of care, patient flow, and hospital capacity.
LIMITATIONS
Our study results should be interpreted with the following limitations in mind. First, the surveys were distributed only to freestanding children's hospitals who participate in PHIS. As a result, our findings may not be generalizable to the experiences of other children's hospitals or general hospitals caring for children. Questions in Survey 2 were focused on understanding observation care, delivered to patients following ED care, which may differ from observation practices related to a direct admission or following scheduled procedures, tests, or treatments. It is important to note that, hospitals that do not report observation status patient data to PHIS are still providing care to children with acute conditions that respond to brief periods of hospital treatment, even though it is not labeled observation. However, it was beyond the scope of this study to characterize the care delivered to all patients who experience a short stay.
The second main limitation of our study is the lower response rate to Survey 2. In addition, several surveys contained incomplete responses which further limits our sample size for some questions, specifically those related to utilization review. The lower response to Survey 2 could be related to the timing of the distribution of the 2 surveys, or to the information contained in the introductory e‐mail describing Survey 2. Hospitals with designated observation units, or where observation status care has been receiving attention, may have been more likely to respond to our survey, which may bias our results to reflect the experiences of hospitals experiencing particular successes or challenges with observation status care. A comparison of known hospital characteristics revealed no differences between hospitals that did and did not provide responses to Survey 2, but other unmeasured differences may exist.
CONCLUSION
Observation status is assigned using duration of treatment, clinical care guidelines, and level of care criteria, and is defined differently by individual hospitals and payers. Currently, the most widely available setting for pediatric observation status is within a virtual inpatient unit. Our results suggest that the care delivered to observation patients in virtual inpatient units is consistent with care provided to other inpatients. As such, observation status is largely an administrative/billing designation, which does not appear to reflect differences in clinical care. A consistent approach to the assignment of patients to observation status, and treatment of patients under observation among hospitals and payers, may be necessary to compare quality outcomes. Studies of the clinical care delivery and processes of care for short‐stay patients are needed to optimize models of pediatric observation care.
- .Observation medicine: the healthcare system's tincture of time. In: Graff LG, ed.Principles of Observation Medicine.Dallas, TX:American College of Emergency Physicians;2010. Available at: http://www.acep.org/content.aspx?id=46142. Accessed February 18,year="2011"2011.
- .Hospital ‘observation’ status a matter of billing.The Columbus Dispatch. February 14,2011.
- .Hospital payments downgraded.Philadelphia Business Journal. February 18,2011.
- .Medicare rules give full hospital benefits only to those with ‘inpatient’ status.The Washington Post. September 7,2010.
- .Hospitals caught between a rock and a hard place over observation.Health Leaders Media. September 15,2010.
- .AHA: observation status fears on the rise.Health Leaders Media. October 29,2010.
- .Put your hospital bill under a microscope.The New York Times. September 13,2010.
- Medicare Hospital Manual Section 455.Washington, DC:Department of Health and Human Services, Centers for Medicare and Medicaid Services;2001.
- ,,,,.The Observation Unit: An Operational Overview for the Hospitalist. Society of Hospital Medicine White Paper. May 21, 2009. Available at: http://www.hospitalmedicine.org/Content/NavigationMenu/Publications/White Papers/White_Papers.htm. Accessed May 21,2009.
- ,,,,.Utilization and unexpected hospitalization rates of a pediatric emergency department 23‐hour observation unit.Pediatr Emerg Care.2008;24(9):589–594.
- ,,.The pediatric hybrid observation unit: an analysis of 6477 consecutive patient encounters.Pediatrics.2005;115(5):e535–e542.
- ,,,,.Pediatric observation units in the United States: a systematic review.J Hosp Med.2010;5(3):172–182.
- ,,.Pediatric emergency department directors' benchmarking survey: fiscal year 2001.Pediatr Emerg Care.2003;19(3):143–147.
- ,,,.Pediatric observation status beds on an inpatient unit: an integrated care model.Pediatr Emerg Care.2004;20(1):17–21.
- ,,,.Impact of a short stay unit on asthma patients admitted to a tertiary pediatric hospital.Qual Manag Health Care.1997;6(1):14–22.
- ,,,.A national survey of observation units in the United States.Am J Emerg Med.2003;21(7):529–533.
- ,,,.A survey of observation units in the United States.Am J Emerg Med.1989;7(6):576–580.
- ,,.When the patient requires observation not hospitalization.J Nurs Admin.1988;18(10):20–23.
- ,,.A reduction in hospitalization, length of stay, and hospital charges for croup with the institution of a pediatric observation unit.Am J Emerg Med.2006;24(7):818–821.
- ,,.Outpatient oral rehydration in the United States.Am J Dis Child.1986;140(3):211–215.
- ,,,,.Pediatric closed head injuries treated in an observation unit.Pediatr Emerg Care.2005;21(10):639–644.
- ,,,.Use of pediatric observation unit for treatment of children with dehydration caused by gastroenteritis.Pediatr Emerg Care.2006;22(1):1–6.
- ,,,.Children with asthma admitted to a pediatric observation unit.Pediatr Emerg Care.2005;21(10):645–649.
- ,,,.Redefining the community pediatric hospitalist: the combined pediatric ED/inpatient unit.Pediatr Emerg Care.2007;23(1):33–37.
- ,,,.Program description: a hospitalist‐run, medical short‐stay unit in a teaching hospital.Can Med Assoc J.2000;163(11):1477–1480.
- ,.Impact of an observation unit and an emergency department‐admitted patient transfer mandate in decreasing overcrowding in a pediatric emergency department: a discrete event simulation exercise.Pediatr Emerg Care.2009;25(3):160–163.
- ,,, et al.Children's hospitals do not acutely respond to high occupancy.Pediatrics.125(5):974–981.
- ,,,,,.Trends in high‐turnover stays among children hospitalized in the United States, 1993‐2003.Pediatrics.2009;123(3):996–1002.
Observation medicine has grown in recent decades out of changes in policies for hospital reimbursement, requirements for patients to meet admission criteria to qualify for inpatient admission, and efforts to avoid unnecessary or inappropriate admissions.1 Emergency physicians are frequently faced with patients who are too sick to be discharged home, but do not clearly meet criteria for an inpatient status admission. These patients often receive extended outpatient services (typically extending 24 to 48 hours) under the designation of observation status, in order to determine their response to treatment and need for hospitalization.
Observation care delivered to adult patients has increased substantially in recent years, and the confusion around the designation of observation versus inpatient care has received increasing attention in the lay press.27 According to the Centers for Medicare and Medicaid Services (CMS)8:
Observation care is a well‐defined set of specific, clinically appropriate services, which include ongoing short term treatment, assessment, and reassessment before a decision can be made regarding whether patients will require further treatment as hospital inpatients. Observation services are commonly ordered for patients who present to the emergency department and who then require a significant period of treatment or monitoring in order to make a decision concerning their admission or discharge.
Observation status is an administrative label that is applied to patients who do not meet inpatient level of care criteria, as defined by third parties such as InterQual. These criteria usually include a combination of the patient's clinical diagnoses, severity of illness, and expected needs for monitoring and interventions, in order to determine the admission status to which the patient may be assigned (eg, observation, inpatient, or intensive care). Observation services can be provided, in a variety of settings, to those patients who do not meet inpatient level of care but require a period of observation. Some hospitals provide observation care in discrete units in the emergency department (ED) or specific inpatient unit, and others have no designated unit but scatter observation patients throughout the institution, termed virtual observation units.9
For more than 30 years, observation unit (OU) admission has offered an alternative to traditional inpatient hospitalization for children with a variety of acute conditions.10, 11 Historically, the published literature on observation care for children in the United States has been largely based in dedicated emergency department OUs.12 Yet, in a 2001 survey of 21 pediatric EDs, just 6 reported the presence of a 23‐hour unit.13 There are single‐site examples of observation care delivered in other settings.14, 15 In 2 national surveys of US General Hospitals, 25% provided observation services in beds adjacent to the ED, and the remainder provided observation services in hospital inpatient units.16, 17 However, we are not aware of any previous multi‐institution studies exploring hospital‐wide practices related to observation care for children.
Recognizing that observation status can be designated using various standards, and that observation care can be delivered in locations outside of dedicated OUs,9 we developed 2 web‐based surveys to examine the current models of pediatric observation medicine in US children's hospitals. We hypothesized that observation care is most commonly applied as a billing designation and does not necessarily represent care delivered in a structurally or functionally distinct OU, nor does it represent a difference in care provided to those patients with inpatient designation.
METHODS
Study Design
Two web‐based surveys were distributed, in April 2010, to the 42 freestanding, tertiary care children's hospitals affiliated with the Child Health Corporation of America (CHCA; Shawnee Mission, KS) which contribute data to the Pediatric Health Information System (PHIS) database. The PHIS is a national administrative database that contains resource utilization data from participating hospitals located in noncompeting markets of 27 states plus the District of Columbia. These hospitals account for 20% of all tertiary care children's hospitals in the United States.
Survey Content
Survey 1
A survey of hospital observation status practices has been developed by CHCA as a part of the PHIS data quality initiative (see Supporting Appendix: Survey 1 in the online version of this article). Hospitals that did not provide observation patient data to PHIS were excluded after an initial screening question. This survey obtained information regarding the designation of observation status within each hospital. Hospitals provided free‐text responses to questions related to the criteria used to define observation, and to admit patients into observation status. Fixed‐choice response questions were used to determine specific observation status utilization criteria and clinical guidelines (eg, InterQual and Milliman) used by hospitals for the designation of observation status to patients.
Survey 2
We developed a detailed follow‐up survey in order to characterize the structures and processes of care associated with observation status (see Supporting Appendix: Survey 2 in the online version of this article). Within the follow‐up survey, an initial screening question was used to determine all types of patients to which observation status is assigned within the responding hospitals. All other questions in Survey 2 were focused specifically on those patients who required additional care following ED evaluation and treatment. Fixed‐choice response questions were used to explore differences in care for patients under observation and those admitted as inpatients. We also inquired of hospital practices related to boarding of patients in the ED while awaiting admission to an inpatient bed.
Survey Distribution
Two web‐based surveys were distributed to all 42 CHCA hospitals that contribute data to PHIS. During the month of April 2010, each hospital's designated PHIS operational contact received e‐mail correspondence requesting their participation in each survey. Within hospitals participating in PHIS, Operational Contacts have been assigned to serve as the day‐to‐day PHIS contact person based upon their experience working with the PHIS data. The Operational Contacts are CHCA's primary contact for issues related to the hospital's data quality and reporting to PHIS. Non‐responders were contacted by e‐mail for additional requests to complete the surveys. Each e‐mail provided an introduction to the topic of the survey and a link to complete the survey. The e‐mail requesting participation in Survey 1 was distributed the first week of April 2010, and the survey was open for responses during the first 3 weeks of the month. The e‐mail requesting participation in Survey 2 was sent the third week of April 2010, and the survey was open for responses during the subsequent 2 weeks.
DATA ANALYSIS
Survey responses were collected and are presented as a descriptive summary of results. Hospital characteristics were summarized with medians and interquartile ranges for continuous variables, and with percents for categorical variables. Characteristics were compared between hospitals that responded and those that did not respond to Survey 2 using Wilcoxon rank‐sum tests and chi‐square tests as appropriate. All analyses were performed using SAS v.9.2 (SAS Institute, Cary, NC), and a P value <0.05 was considered statistically significant. The study was reviewed by the University of Michigan Institutional Review Board and considered exempt.
RESULTS
Responses to Survey 1 were available from 37 of 42 (88%) of PHIS hospitals (Figure 1). For Survey 2, we received responses from 20 of 42 (48%) of PHIS hospitals. Based on information available from Survey 1, we know that 20 of the 31 (65%) PHIS hospitals that report observation status patient data to PHIS responded to Survey 2. Characteristics of the hospitals responding and not responding to Survey 2 are presented in Table 1. Respondents provided hospital identifying information which allowed for the linkage of data, from Survey 1, to 17 of the 20 hospitals responding to Survey 2. We did not have information available to link responses from 3 hospitals.
| Respondent N = 20 | Non‐Respondent N = 22 | P Value | |
|---|---|---|---|
| |||
| No. of inpatient beds Median [IQR] (excluding Obstetrics) | 245 [219283] | 282 [250381] | 0.076 |
| Annual admissions Median [IQR] (excluding births) | 11,658 [8,64213,213] | 13,522 [9,83018,705] | 0.106 |
| ED volume Median [IQR] | 60,528 [47,85082,955] | 64,486 [47,38684,450] | 0.640 |
| Percent government payer Median [IQR] | 53% [4662] | 49% [4158] | 0.528 |
| Region | |||
| Northeast | 37% | 0% | 0.021 |
| Midwest | 21% | 33% | |
| South | 21% | 50% | |
| West | 21% | 17% | |
| Reports observation status patients to PHIS | 85% | 90% | 0.555 |
Based on responses to the surveys and our knowledge of data reported to PHIS, our current understanding of patient flow from ED through observation to discharge home, and the application of observation status to the encounter, is presented in Figure 2. According to free‐text responses to Survey 1, various methods were applied to designate observation status (gray shaded boxes in Figure 2). Fixed‐choice responses to Survey 2 revealed that observation status patients were cared for in a variety of locations within hospitals, including ED beds, designated observation units, and inpatient beds (dashed boxes in Figure 2). Not every facility utilized all of the listed locations for observation care. Space constraints could dictate the location of care, regardless of patient status (eg, observation vs inpatient), in hospitals with more than one location of care available to observation patients. While patient status could change during a visit, only the final patient status at discharge enters the administrative record submitted to PHIS (black boxes in Figure 2). Facility charges for observation remained a part of the visit record and were reported to PHIS. Hospitals may or may not bill for all assigned charges depending on patient status, length of stay, or other specific criteria determined by contracts with individual payers.
Survey 1: Classification of Observation Patients and Presence of Observation Units in PHIS Hospitals
According to responses to Survey 1, designated OUs were not widespread, present in only 12 of the 31 hospitals. No hospital reported treating all observation status patients exclusively in a designated OU. Observation status was defined by both duration of treatment and either level of care criteria or clinical care guidelines in 21 of the 31 hospitals responding to Survey 1. Of the remaining 10 hospitals, 1 reported that treatment duration alone defines observation status, and the others relied on prespecified observation criteria. When considering duration of treatment, hospitals variably indicated that anticipated or actual lengths of stay were used to determine observation status. Regarding the maximum hours a patient can be observed, 12 hospitals limited observation to 24 hours or fewer, 12 hospitals observed patients for no more than 36 to 48 hours, and the remaining 7 hospitals allowed observation periods of 72 hours or longer.
When admitting patients to observation status, 30 of 31 hospitals specified the criteria that were used to determine observation admissions. InterQual criteria, the most common response, were used by 23 of the 30 hospitals reporting specified criteria; the remaining 7 hospitals had developed hospital‐specific criteria or modified existing criteria, such as InterQual or Milliman, to determine observation status admissions. In addition to these criteria, 11 hospitals required a physician order for admission to observation status. Twenty‐four hospitals indicated that policies were in place to change patient status from observation to inpatient, or inpatient to observation, typically through processes of utilization review and application of criteria listed above.
Most hospitals indicated that they faced substantial variation in the standards used from one payer to another when considering reimbursement for care delivered under observation status. Hospitals noted that duration‐of‐carebased reimbursement practices included hourly rates, per diem, and reimbursement for only the first 24 or 48 hours of observation care. Hospitals identified that payers variably determined reimbursement for observation based on InterQual level of care criteria and Milliman care guidelines. One hospital reported that it was not their practice to bill for the observation bed.
Survey 2: Understanding Observation Patient Type Administrative Data Following ED Care Within PHIS Hospitals
Of the 20 hospitals responding to Survey 2, there were 2 hospitals that did not apply observation status to patients after ED care and 2 hospitals that did not provide complete responses. The remaining 16 hospitals provided information regarding observation status as applied to patients after receiving treatment in the ED. The settings available for observation care and patient groups treated within each area are presented in Table 2. In addition to the patient groups listed in Table 2, there were 4 hospitals where patients could be admitted to observation status directly from an outpatient clinic. All responding hospitals provided virtual observation care (ie, observation status is assigned but the patient is cared for in the existing ED or inpatient ward). Nine hospitals also provided observation care within a dedicated ED or ward‐based OU (ie, a separate clinical area in which observation patients are treated).
| Hospital No. | Available Observation Settings | Patient Groups Under Observation in Each Setting | UR to Assign Obs Status | When Obs Status Is Assigned | ||
|---|---|---|---|---|---|---|
| ED | Post‐Op | Test/Treat | ||||
| ||||||
| 1 | Virtual inpatient | X | X | X | Yes | Discharge |
| Ward‐based OU | X | X | No | |||
| 2 | Virtual inpatient | X | X | Yes | Admission | |
| Ward‐based OU | X | X | X | No | ||
| 3 | Virtual inpatient | X | X | X | Yes | Discharge |
| Ward‐based OU | X | X | X | Yes | ||
| ED OU | X | Yes | ||||
| Virtual ED | X | Yes | ||||
| 4 | Virtual inpatient | X | X | X | Yes | Discharge |
| ED OU | X | No | ||||
| Virtual ED | X | No | ||||
| 5 | Virtual inpatient | X | X | X | N/A | Discharge |
| 6 | Virtual inpatient | X | X | X | Yes | Discharge |
| 7 | Virtual inpatient | X | X | Yes | No response | |
| Ward‐based OU | X | Yes | ||||
| Virtual ED | X | Yes | ||||
| 8 | Virtual inpatient | X | X | X | Yes | Admission |
| 9 | Virtual inpatient | X | X | Yes | Discharge | |
| ED OU | X | Yes | ||||
| Virtual ED | X | Yes | ||||
| 10 | Virtual inpatient | X | X | X | Yes | Admission |
| ED OU | X | Yes | ||||
| 11 | Virtual inpatient | X | X | Yes | Discharge | |
| Ward‐based OU | X | X | Yes | |||
| ED OU | X | Yes | ||||
| Virtual ED | X | Yes | ||||
| 12 | Virtual inpatient | X | X | X | Yes | Admission |
| 13 | Virtual inpatient | X | X | N/A | Discharge | |
| Virtual ED | X | N/A | ||||
| 14 | Virtual inpatient | X | X | X | Yes | Both |
| 15 | Virtual inpatient | X | X | Yes | Admission | |
| Ward‐based OU | X | X | Yes | |||
| 16 | Virtual inpatient | X | Yes | Admission | ||
When asked to identify differences between clinical care delivered to patients admitted under virtual observation and those admitted under inpatient status, 14 of 16 hospitals selected the option There are no differences in the care delivery of these patients. The differences identified by 2 hospitals included patient care orders, treatment protocols, and physician documentation. Within the hospitals that reported utilization of virtual ED observation, 2 reported differences in care compared with other ED patients, including patient care orders, physician rounds, documentation, and discharge process. When admitted patients were boarded in the ED while awaiting an inpatient bed, 11 of 16 hospitals allowed for observation or inpatient level of care to be provided in the ED. Fourteen hospitals allow an admitted patient to be discharged home from boarding in the ED without ever receiving care in an inpatient bed. The discharge decision was made by ED providers in 7 hospitals, and inpatient providers in the other 7 hospitals.
Responses to questions providing detailed information on the process of utilization review were provided by 12 hospitals. Among this subset of hospitals, utilization review was consistently used to assign virtual inpatient observation status and was applied at admission (n = 6) or discharge (n = 8), depending on the hospital. One hospital applied observation status at both admission and discharge; 1 hospital did not provide a response. Responses to questions regarding utilization review are presented in Table 3.
| Survey Question | Yes N (%) | No N (%) |
|---|---|---|
| Preadmission utilization review is conducted at my hospital. | 3 (25) | 9 (75) |
| Utilization review occurs daily at my hospital. | 10 (83) | 2 (17) |
| A nonclinician can initiate an order for observation status. | 4 (33) | 8 (67) |
| Status can be changed after the patient has been discharged. | 10 (83) | 2 (17) |
| Inpatient status would always be assigned to a patient who receives less than 24 hours of care and meets inpatient criteria. | 9 (75) | 3 (25) |
| The same status would be assigned to different patients who received the same treatment of the same duration but have different payers. | 6 (50) | 6 (50) |
DISCUSSION
This is the largest descriptive study of pediatric observation status practices in US freestanding children's hospitals and, to our knowledge, the first to include information about both the ED and inpatient treatment environments. There are two important findings of this study. First, designated OUs were uncommon among the group of freestanding children's hospitals that reported observation patient data to PHIS in 2010. Second, despite the fact that hospitals reported observation care was delivered in a variety of settings, virtual inpatient observation status was nearly ubiquitous. Among the subset of hospitals that provided information about the clinical care delivered to patients admitted under virtual inpatient observation, hospitals frequently reported there were no differences in the care delivered to observation patients when compared with other inpatients.
The results of our survey indicate that designated OUs are not a commonly available model of observation care in the study hospitals. In fact, the vast majority of the hospitals used virtual inpatient observation care, which did not differ from the care delivered to a child admitted as an inpatient. ED‐based OUs, which often provide operationally and physically distinct care to observation patients, have been touted as cost‐effective alternatives to inpatient care,1820 resulting in fewer admissions and reductions in length of stay19, 20 without a resultant increase in return ED‐visits or readmissions.2123 Research is needed to determine the patient‐level outcomes for short‐stay patients in the variety of available treatment settings (eg, physically or operationally distinct OUs and virtual observation), and to evaluate these outcomes in comparison to results published from designated OUs. The operationally and physically distinct features of a designated OU may be required to realize the benefits of observation attributed to individual patients.
While observation care has been historically provided by emergency physicians, there is increasing interest in the role of inpatient providers in observation care.9 According to our survey, children were admitted to observation status directly from clinics, following surgical procedures, scheduled tests and treatment, or after evaluation and treatment in the ED. As many of these children undergo virtual observation in inpatient areas, the role of inpatient providers, such as pediatric hospitalists, in observation care may be an important area for future study, education, and professional development. Novel models of care, with hospitalists collaborating with emergency physicians, may be of benefit to the children who require observation following initial stabilization and treatment in the ED.24, 25
We identified variation between hospitals in the methods used to assign observation status to an episode of care, including a wide range of length of stay criteria and different approaches to utilization review. In addition, the criteria payers use to reimburse for observation varied between payers, even within individual hospitals. The results of our survey may be driven by issues of reimbursement and not based on a model of optimizing patient care outcomes using designated OUs. Variations in reimbursement may limit hospital efforts to refine models of observation care for children. Designated OUs have been suggested as a method for improving ED patient flow,26 increasing inpatient capacity,27 and reducing costs of care.28 Standardization of observation status criteria and consistent reimbursement for observation services may be necessary for hospitals to develop operationally and physically distinct OUs, which may be essential to achieving the proposed benefits of observation medicine on costs of care, patient flow, and hospital capacity.
LIMITATIONS
Our study results should be interpreted with the following limitations in mind. First, the surveys were distributed only to freestanding children's hospitals who participate in PHIS. As a result, our findings may not be generalizable to the experiences of other children's hospitals or general hospitals caring for children. Questions in Survey 2 were focused on understanding observation care, delivered to patients following ED care, which may differ from observation practices related to a direct admission or following scheduled procedures, tests, or treatments. It is important to note that, hospitals that do not report observation status patient data to PHIS are still providing care to children with acute conditions that respond to brief periods of hospital treatment, even though it is not labeled observation. However, it was beyond the scope of this study to characterize the care delivered to all patients who experience a short stay.
The second main limitation of our study is the lower response rate to Survey 2. In addition, several surveys contained incomplete responses which further limits our sample size for some questions, specifically those related to utilization review. The lower response to Survey 2 could be related to the timing of the distribution of the 2 surveys, or to the information contained in the introductory e‐mail describing Survey 2. Hospitals with designated observation units, or where observation status care has been receiving attention, may have been more likely to respond to our survey, which may bias our results to reflect the experiences of hospitals experiencing particular successes or challenges with observation status care. A comparison of known hospital characteristics revealed no differences between hospitals that did and did not provide responses to Survey 2, but other unmeasured differences may exist.
CONCLUSION
Observation status is assigned using duration of treatment, clinical care guidelines, and level of care criteria, and is defined differently by individual hospitals and payers. Currently, the most widely available setting for pediatric observation status is within a virtual inpatient unit. Our results suggest that the care delivered to observation patients in virtual inpatient units is consistent with care provided to other inpatients. As such, observation status is largely an administrative/billing designation, which does not appear to reflect differences in clinical care. A consistent approach to the assignment of patients to observation status, and treatment of patients under observation among hospitals and payers, may be necessary to compare quality outcomes. Studies of the clinical care delivery and processes of care for short‐stay patients are needed to optimize models of pediatric observation care.
- .Observation medicine: the healthcare system's tincture of time. In: Graff LG, ed.Principles of Observation Medicine.Dallas, TX:American College of Emergency Physicians;2010. Available at: http://www.acep.org/content.aspx?id=46142. Accessed February 18,year="2011"2011.
- .Hospital ‘observation’ status a matter of billing.The Columbus Dispatch. February 14,2011.
- .Hospital payments downgraded.Philadelphia Business Journal. February 18,2011.
- .Medicare rules give full hospital benefits only to those with ‘inpatient’ status.The Washington Post. September 7,2010.
- .Hospitals caught between a rock and a hard place over observation.Health Leaders Media. September 15,2010.
- .AHA: observation status fears on the rise.Health Leaders Media. October 29,2010.
- .Put your hospital bill under a microscope.The New York Times. September 13,2010.
- Medicare Hospital Manual Section 455.Washington, DC:Department of Health and Human Services, Centers for Medicare and Medicaid Services;2001.
- ,,,,.The Observation Unit: An Operational Overview for the Hospitalist. Society of Hospital Medicine White Paper. May 21, 2009. Available at: http://www.hospitalmedicine.org/Content/NavigationMenu/Publications/White Papers/White_Papers.htm. Accessed May 21,2009.
- ,,,,.Utilization and unexpected hospitalization rates of a pediatric emergency department 23‐hour observation unit.Pediatr Emerg Care.2008;24(9):589–594.
- ,,.The pediatric hybrid observation unit: an analysis of 6477 consecutive patient encounters.Pediatrics.2005;115(5):e535–e542.
- ,,,,.Pediatric observation units in the United States: a systematic review.J Hosp Med.2010;5(3):172–182.
- ,,.Pediatric emergency department directors' benchmarking survey: fiscal year 2001.Pediatr Emerg Care.2003;19(3):143–147.
- ,,,.Pediatric observation status beds on an inpatient unit: an integrated care model.Pediatr Emerg Care.2004;20(1):17–21.
- ,,,.Impact of a short stay unit on asthma patients admitted to a tertiary pediatric hospital.Qual Manag Health Care.1997;6(1):14–22.
- ,,,.A national survey of observation units in the United States.Am J Emerg Med.2003;21(7):529–533.
- ,,,.A survey of observation units in the United States.Am J Emerg Med.1989;7(6):576–580.
- ,,.When the patient requires observation not hospitalization.J Nurs Admin.1988;18(10):20–23.
- ,,.A reduction in hospitalization, length of stay, and hospital charges for croup with the institution of a pediatric observation unit.Am J Emerg Med.2006;24(7):818–821.
- ,,.Outpatient oral rehydration in the United States.Am J Dis Child.1986;140(3):211–215.
- ,,,,.Pediatric closed head injuries treated in an observation unit.Pediatr Emerg Care.2005;21(10):639–644.
- ,,,.Use of pediatric observation unit for treatment of children with dehydration caused by gastroenteritis.Pediatr Emerg Care.2006;22(1):1–6.
- ,,,.Children with asthma admitted to a pediatric observation unit.Pediatr Emerg Care.2005;21(10):645–649.
- ,,,.Redefining the community pediatric hospitalist: the combined pediatric ED/inpatient unit.Pediatr Emerg Care.2007;23(1):33–37.
- ,,,.Program description: a hospitalist‐run, medical short‐stay unit in a teaching hospital.Can Med Assoc J.2000;163(11):1477–1480.
- ,.Impact of an observation unit and an emergency department‐admitted patient transfer mandate in decreasing overcrowding in a pediatric emergency department: a discrete event simulation exercise.Pediatr Emerg Care.2009;25(3):160–163.
- ,,, et al.Children's hospitals do not acutely respond to high occupancy.Pediatrics.125(5):974–981.
- ,,,,,.Trends in high‐turnover stays among children hospitalized in the United States, 1993‐2003.Pediatrics.2009;123(3):996–1002.
Copyright © 2011 Society of Hospital Medicine

Reliability of CXR for Pneumonia
The chest radiograph (CXR) is the most commonly used diagnostic imaging modality in children, and is considered to be the gold standard for the diagnosis of pneumonia. As such, physicians in developed countries rely on chest radiography to establish the diagnosis of pneumonia.13 However, there are limited data investigating the reliability of this test for the diagnosis of pneumonia in children.2, 46
Prior investigations have noted poor overall agreement by emergency medicine, infectious diseases, and pulmonary medicine physicians, and even radiologists, in their interpretation of chest radiographs for the diagnosis of pneumonia.2, 5, 710 The World Health Organization (WHO) developed criteria to standardize CXR interpretation for the diagnosis of pneumonia in children for use in epidemiologic studies.11 These standardized definitions of pneumonia have been formally evaluated by the WHO6 and utilized in epidemiologic studies of vaccine efficacy,12 but the overall reliability of these radiographic criteria have not been studied outside of these forums.
We conducted this prospective case‐based study to evaluate the reliability of the radiographic diagnosis of pneumonia among children presenting to a pediatric emergency department with clinical suspicion of pneumonia. We were primarily interested in assessing the overall reliability in CXR interpretation for the diagnosis of pneumonia, and identifying which radiographic features of pneumonia were consistently identified by radiologists.
MATERIALS AND METHODS
Study Subjects
We evaluated the reliability of CXR interpretation with respect to the diagnosis of pneumonia among radiologists. Six board‐certified radiologists at 2 academic children's hospitals (Children's Hospital of Philadelphia, Philadelphia, PA [n = 3] and Children's Hospital, Boston, Boston, MA [n = 3]) interpreted the same 110 chest radiographs in a blinded fashion. The radiologists varied with respect to the number of years practicing pediatric radiology (median 8 years, range 3‐36 years). Clinical information such as age, gender, clinical indication for obtaining the radiograph, history, and physical examination findings were not provided. Aside from the study form which stated the WHO classification scheme for radiographic pneumonia, no other information or training was provided to the radiologists as part of this study.
Radiographs were selected among a population of children presenting to the emergency department at Children's Hospital, Boston, who had a radiograph obtained for concern of pneumonia. From this cohort, we selected children who had radiographs which encompassed the spectrum of respiratory disease processes encountered in a pediatric population. The radiographs selected for review included 50 radiographs with a final reading in the medical record without suspicion for pneumonia, and 50 radiographs in which the diagnosis of pneumonia could not be excluded. In the latter group, 25 radiographs had a final reading suggestive of an alveolar infiltrate, and 25 radiographs had a final reading suggestive of an interstitial infiltrate. Ten duplicate radiographs were included to permit assessment of intra‐rater reliability.
Radiograph Interpretation
Radiologists at both sites interpreted the identical 110 radiographs (both anteroposterior [AP] and lateral views for each subject). Digital Imaging and Communications in Medicine (DICOM) images were downloaded from a registry at Children's Hospital, Boston, and were copied to DVDs which were provided to each radiologist. Standardized radiographic imaging software (eFilm Lite [Mississauga, Canada]) was used by each radiologist to view and interpret the radiographs.
Each radiologist completed a study questionnaire for each radiograph interpreted (see Supporting Appendix A in the online version of this article). The questionnaire utilized radiographic descriptors of primary end‐point pneumonia described by the WHO which were procured to standardize the radiographic diagnosis of pneumonia.11, 12 The main outcome of interest was the presence or absence of an infiltrate. Among radiographs in which an infiltrate was identified, radiologists selected whether there was an alveolar infiltrate, interstitial infiltrate, or both. An alveolar infiltrate was defined as a dense or fluffy opacity that occupies a portion or whole of a lobe, or of the entire lung, that may or may not contain air bronchograms.11, 12 An interstitial infiltrate was defined by a lacy pattern involving both lungs, featuring peribronchial thickening and multiple areas of atelectasis.11, 12 It also included minor patchy infiltrates that were not of sufficient magnitude to constitute consolidation, and small areas of atelectasis that in children may be difficult to distinguish from consolidation. Among interstitial infiltrates, radiologists were asked to distinguish infiltrate from atelectasis. A radiograph classified as having either an alveolar infiltrate or interstitial infiltrate (not atelectasis) was considered to have any infiltrate. Additional findings including air bronchograms, hilar adenopathy, pleural effusion, and location of abnormalities were also recorded.
Statistical Analysis
Inter‐rater reliability was assessed using the kappa statistic to determine the overall agreement between the 6 radiologists for each binary outcome (ie, presence or absence of alveolar infiltrate). To calculate 95% confidence intervals (CI) for kappa statistics with more than 2 raters, we employed a bootstrapping method with 1000 replications of samples equal in size to the study sample, using the kapci program as implemented by STATA software (version 10.1, STATA Corp, College Station, TX). Also, intra‐rater reliability was evaluated by examining the agreement within each radiologist upon review of 10 duplicate radiographs that had been randomly inserted into the case‐mix. We used the benchmarks proposed by Landis and Koch to classify the strength of agreement measured by the kappa statistic, as follows: poor (<0.0); slight (0‐0.20); fair (0.21‐0.40); moderate (0.41‐0.60); substantial (0.61‐0.80); almost perfect (0.81‐1.0).13
The study was approved by the institutional review boards at Children's Hospital, Boston and Children's Hospital of Philadelphia.
RESULTS
Patient Sample
The sample of 110 radiographs was obtained from 100 children presenting to the emergency department at Children's Hospital, Boston, with concern of pneumonia. These patients ranged in age from 1 week to 19 years (median, 3.5 years; interquartile range [IQR], 1.6‐6.0 years). Fifty (50%) of these patients were male. As stated above, the sample comprised 50 radiographs with a final reading in the medical record without suspicion for pneumonia, and 50 radiographs in which the diagnosis of pneumonia could not be excluded. The 10 duplicate radiographs encompassed a similar spectrum of findings.
Inter‐Rater Reliability
The kappa coefficients of inter‐rater reliability between the radiologists across the 6 clinical measures of interest are displayed in Table 1. As shown, the most reliable measure was that of alveolar infiltrate (Figure 1), which attained a substantial degree of agreement between the radiologists. Two other measures, any infiltrate and pleural effusion, attained moderate reliability, while bronchograms and hilar adenopathy were each classified as having fair reliability. However, interstitial infiltrate (Figure 2) was found to have the lowest kappa estimate, with a slight degree of reliability. When examining inter‐rater reliability among the radiologists separately from each institution, the pattern of results was similar.
| All Radiologists (n = 6) | Kappa | 95% Confidence Interval |
|---|---|---|
| ||
| Any infiltrate | 0.47 | 0.39, 0.56 |
| Alveolar infiltrate | 0.69 | 0.60, 0.78 |
| Interstitial infiltrate | 0.14 | 0.05, 0.23 |
| Air bronchograms | 0.32 | 0.24, 0.42 |
| Hilar adenopathy | 0.21 | 0.08, 0.39 |
| Pleural effusion | 0.45 | 0.29, 0.61 |
At least 4 of the 6 radiologists agreed on the presence or absence of an alveolar infiltrate for 95 of the 100 unique CXRs; all 6 radiologists agreed regarding the presence or absence of an alveolar infiltrate in 72 of the 100 unique CXRs. At least 4 of the 6 radiologists agreed on the presence or absence of any infiltrate and interstitial infiltrate 96% and 90% of the time, respectively. All 6 of the radiologists agreed on the presence or absence of any infiltrate and interstitial infiltrate 35% and 27% of the time, respectively.
Intra‐Rater Reliability
Estimates of intra‐rater reliability on the primary clinical outcomes (alveolar infiltrate, interstitial infiltrate, and any infiltrate) are found in Table 2. Across the 6 raters, the kappa estimates for alveolar infiltrate were all classified as substantial or almost perfect. The kappa estimates for interstitial infiltrate varied widely, ranging from fair to almost perfect, while for any infiltrate, reliability ranged from moderate to almost perfect.
| Kappa | 95% Confidence Interval | |
|---|---|---|
| ||
| Any infiltrate | ||
| Rater 1 | 1.00 | 1.00, 1.00 |
| Rater 2 | 0.60 | 0.10, 1.00 |
| Rater 3 | 0.80 | 0.44, 1.00 |
| Rater 4 | 1.00 | 1.00, 1.00 |
| Rater 5 | n/a* | |
| Rater 6 | 1.00 | 1.00, 1.00 |
| Alveolar infiltrate | ||
| Rater 1 | 1.00 | 1.00, 1.00 |
| Rater 2 | 1.00 | 1.00, 1.00 |
| Rater 3 | 1.00 | 1.00, 1.00 |
| Rater 4 | 1.00 | 1.00, 1.00 |
| Rater 5 | 0.78 | 0.39, 1.00 |
| Rater 6 | 0.74 | 0.27, 1.00 |
| Interstitial infiltrate | ||
| Rater 1 | 1.00 | 1.00, 1.00 |
| Rater 2 | 0.21 | 0.43, 0.85 |
| Rater 3 | 0.74 | 0.27, 1.00 |
| Rater 4 | n/a | |
| Rater 5 | 0.58 | 0.07, 1.00 |
| Rater 6 | 0.62 | 0.5, 1.00 |
DISCUSSION
The chest radiograph serves as an integral component of the reference standard for the diagnosis of childhood pneumonia. Few prior studies have assessed the reliability of chest radiograph findings in children.3, 5, 12, 14, 15 We found a high degree of agreement among radiologists for radiologic findings consistent with bacterial pneumonia when standardized interpretation criteria were applied. In this study, we identified radiographic features of pneumonia, such as alveolar infiltrate and pleural effusion, that were consistently identified by different radiologists reviewing the same radiograph and by the same radiologist reviewing the same radiograph. These data support the notion that radiographic features most suggestive of bacterial pneumonia are consistently identified by radiologists.16, 17 There was less consistency in the identification of other radiographic findings, such as interstitial infiltrates, air bronchograms, and hilar lymphadenopathy.
Prior studies have found high levels of disagreement among radiologists in the interpretation of chest radiographs.2, 3, 15, 18 Many of these prior studies emphasized variation in detection of radiographic findings that would not typically alter clinical management. We observed high intra‐rater, and inter‐rater reliability among radiologists for the findings of alveolar infiltrate and pleural effusion. These are the radiographic findings most consistent with a bacterial etiologic agent for pneumonia.19 Other studies have also found that the presence of an alveolar infiltrate is a reliable radiographic finding in children18 and adults.7, 9, 10 These findings support the use of the WHO definition of primary endpoint pneumonia for use in epidemiologic studies.4, 6, 11
This study also confirms a previous report by Cherian et al. that findings of many children with asthma, reactive airways disease, bronchiolitis, and viral infections interstitial infiltrates are less reliable.6 This is not surprising considering the fact that these patients often have radiographic findings due to small airway disease and atelectasis.19, 20 The differentiation between atelectasis and interstitial infiltrate is difficult, particularly in young children. A prior study conducted among neonates observed wide variability in the interpretation of chest radiographs, and that the differentiation of pneumonia from atelectasis was difficult for this patient population.5 The decisions around antimicrobial treatment of children with radiographic findings of interstitial infiltrates should be made in the context of the clinical history and physical examination findings, and clinicians should realize that these radiographic features demonstrate poor reliability for the diagnosis of pneumonia.
Overall reliability for the presence of any infiltrate, and its converse, no infiltrate was considered moderate. This is driven by the low reliability and variability around the radiographic diagnosis of interstitial infiltrates. Our findings are similar to those observed in adults with lower respiratory tract infections.9 The low reliability in identification of interstitial infiltrates may explain why prior studies have demonstrated that the CXR results rarely change management in children who have radiographs performed for suspicion of pneumonia.1, 21 Our study highlights the importance of quantifying CXR findings to include specific comments regarding the presence or absence of alveolar infiltrates, rather than the presence or absence of any infiltrate.
The WHO has procured definitions the radiographic diagnosis of pneumonia, and this definition has been utilized to help standardize the interpretation of chest radiographs for the conduct of epidemiological studies.6, 11 Specifically, the definitions utilized not only define the presence or absence of pneumonia, but also attempt to differentiate a primarily bacterial infection (consolidation or pleural effusion), from a viral or atypical presentation (interstitial pattern). Even under the best of circumstances, the differentiation of viral versus bacterial pneumonia is not always possible, and again, is often made by the treating physician by incorporating the clinical setting within which the radiograph was obtained.
This study had several limitations. Firstly, the included radiographs did not reflect the frequency with which certain radiographic findings would be identified in children evaluated for pneumonia in a pediatric emergency department setting. Radiographs were purposefully selected to encompass a broad spectrum of radiologic findings, including less common findings such as hilar lymphadenopathy and pleural effusions. Thus, the prevalence of pneumonia and other abnormal findings in this study was artificially higher than typically observed among a cohort of children for whom pneumonia is considered, a factor that may limit the generalizability of our results. Secondly, the clinical history was not provided to the radiologists to avoid bias by indication. For this study, we notified the radiologists that all radiographs were performed for clinical suspicion of pneumonia without providing details about the subjects' signs and symptoms. The absence of clinical history, however, does not mirror the real world scenario in which the interpretation of the chest radiograph is frequently made in the context of the clinical history. The relevance of this latter issue is unclear, as Tudor et al. found a nonstatistically significant improvement in the overall accuracy in chest radiograph interpretation when radiologists were provided clinical details.10 The radiologists recruited for this study all practice in an academic children's hospital setting, and thus, the generalizability of our findings may be limited to this type of practice setting. Finally, reproducibility does not imply accuracy, and reliability in identifying specific findings does not necessarily lead to improved or different management. Thus, while the reliability of radiographic findings of alveolar infiltrate and pleural effusion is reassuringly high, the validity of these radiographic features for bacterial pneumonia is not known. Ascertainment of validity can only be assessed through the use of invasive testing such as lung biopsy, as the yield from bacterial testing such as blood cultures is low, and the results of other studies such as viral testing of nasopharyngeal washings do not prove an etiologic cause of pneumonia.
CONCLUSIONS
Radiographic findings of alveolar infiltrates and pleural effusions are highly reliable among radiologists. Radiographic interpretation of interstitial infiltrates appears to be less reliable.
- ,,, et al.Usefulness of chest radiographs in children with acute lower respiratory tract disease.J Pediatr.1987;111:187–193.
- ,,, et al.Disagreement in the interpretation of chest radiographs among specialists and clinical outcomes of patients hospitalized with suspected pneumonia.Eur J Intern Med.2006;17:43–47.
- ,,.Problems in the clinical and roentgenographic diagnosis of pneumonia in young children.Clin Pediatr (Phila).1984;23:398–399.
- WHO guidelines on detecting pneumonia in children.Lancet.1991;338:1453–1454.
- ,,, et al.Inter‐ and intra‐observer variability in the assessment of atelectasis and consolidation in neonatal chest radiographs.Pediatr Radiol.1999;29:459–462.
- ,,, et al.Standardized interpretation of paediatric chest radiographs for the diagnosis of pneumonia in epidemiological studies.Bull World Health Organ.2005;83:353–359.
- ,,, et al.Interobserver reliability of the chest radiograph in community‐acquired pneumonia. PORT Investigators.Chest.1996;110:343–350.
- ,,, et al.Chest radiographs in the emergency department: is the radiologist really necessary?Postgrad Med J.2003;79:214–217.
- ,,, et al.Inter‐observer variation in the interpretation of chest radiographs for pneumonia in community‐acquired lower respiratory tract infections.Clin Radiol.2004;59:743–752.
- ,,.An assessment of inter‐observer agreement and accuracy when reporting plain radiographs.Clin Radiol.1997;52:235–238.
- Standardization of interpretation of chest radiographs for the diagnosis of pneumonia in children. In:World Health Organization: Pneumonia Vaccine Trial Investigators' Group.Geneva:Department of Vaccine and Biologics;2001.
- ,,, et al.Effectiveness of heptavalent pneumococcal conjugate vaccine in children younger than 5 years of age for prevention of pneumonia: updated analysis using World Health Organization standardized interpretation of chest radiographs.Pediatr Infect Dis J.2006;25:779–781.
- ,.The measurement of observer agreement for categorical data.Biometrics.1977;33:159–174.
- ,.Clinical, laboratory, and radiological information in the diagnosis of pneumonia in children.Ann Emerg Med.1988;17:43–46.
- ,.Intraobserver and interobserver agreement of the interpretation of pediatric chest radiographs.Emerg Radiol.17:285–290.
- ,,, et al.Practice guidelines for the management of community‐acquired pneumonia in adults. Infectious Diseases Society of America.Clin Infect Dis.2000;31:347–382.
- ,,, et al.Guidelines for the management of adults with community‐acquired pneumonia. Diagnosis, assessment of severity, antimicrobial therapy, and prevention.Am J Respir Crit Care Med.2001;163:1730–1754.
- ,,, et al.Comparison of radiological findings and microbial aetiology of childhood pneumonia.Acta Paediatr.1993;82:360–363.
- Kuhn JP, Slovis TL, Haller JO, eds.Caffey's Pediatric Diagnostic Imaging.10th ed.Philadelphia, PA:Mosby;2004.
- ,,, et al.Clinical predictors of pneumonia among children with wheezing.Pediatrics.2009;124:e29–e36.
- ,,, et al.The clinical impact of the radiology report in wheezing and nonwheezing febrile children: a survey of clinicians.Pediatr Radiol.2009;39:348–353.
The chest radiograph (CXR) is the most commonly used diagnostic imaging modality in children, and is considered to be the gold standard for the diagnosis of pneumonia. As such, physicians in developed countries rely on chest radiography to establish the diagnosis of pneumonia.13 However, there are limited data investigating the reliability of this test for the diagnosis of pneumonia in children.2, 46
Prior investigations have noted poor overall agreement by emergency medicine, infectious diseases, and pulmonary medicine physicians, and even radiologists, in their interpretation of chest radiographs for the diagnosis of pneumonia.2, 5, 710 The World Health Organization (WHO) developed criteria to standardize CXR interpretation for the diagnosis of pneumonia in children for use in epidemiologic studies.11 These standardized definitions of pneumonia have been formally evaluated by the WHO6 and utilized in epidemiologic studies of vaccine efficacy,12 but the overall reliability of these radiographic criteria have not been studied outside of these forums.
We conducted this prospective case‐based study to evaluate the reliability of the radiographic diagnosis of pneumonia among children presenting to a pediatric emergency department with clinical suspicion of pneumonia. We were primarily interested in assessing the overall reliability in CXR interpretation for the diagnosis of pneumonia, and identifying which radiographic features of pneumonia were consistently identified by radiologists.
MATERIALS AND METHODS
Study Subjects
We evaluated the reliability of CXR interpretation with respect to the diagnosis of pneumonia among radiologists. Six board‐certified radiologists at 2 academic children's hospitals (Children's Hospital of Philadelphia, Philadelphia, PA [n = 3] and Children's Hospital, Boston, Boston, MA [n = 3]) interpreted the same 110 chest radiographs in a blinded fashion. The radiologists varied with respect to the number of years practicing pediatric radiology (median 8 years, range 3‐36 years). Clinical information such as age, gender, clinical indication for obtaining the radiograph, history, and physical examination findings were not provided. Aside from the study form which stated the WHO classification scheme for radiographic pneumonia, no other information or training was provided to the radiologists as part of this study.
Radiographs were selected among a population of children presenting to the emergency department at Children's Hospital, Boston, who had a radiograph obtained for concern of pneumonia. From this cohort, we selected children who had radiographs which encompassed the spectrum of respiratory disease processes encountered in a pediatric population. The radiographs selected for review included 50 radiographs with a final reading in the medical record without suspicion for pneumonia, and 50 radiographs in which the diagnosis of pneumonia could not be excluded. In the latter group, 25 radiographs had a final reading suggestive of an alveolar infiltrate, and 25 radiographs had a final reading suggestive of an interstitial infiltrate. Ten duplicate radiographs were included to permit assessment of intra‐rater reliability.
Radiograph Interpretation
Radiologists at both sites interpreted the identical 110 radiographs (both anteroposterior [AP] and lateral views for each subject). Digital Imaging and Communications in Medicine (DICOM) images were downloaded from a registry at Children's Hospital, Boston, and were copied to DVDs which were provided to each radiologist. Standardized radiographic imaging software (eFilm Lite [Mississauga, Canada]) was used by each radiologist to view and interpret the radiographs.
Each radiologist completed a study questionnaire for each radiograph interpreted (see Supporting Appendix A in the online version of this article). The questionnaire utilized radiographic descriptors of primary end‐point pneumonia described by the WHO which were procured to standardize the radiographic diagnosis of pneumonia.11, 12 The main outcome of interest was the presence or absence of an infiltrate. Among radiographs in which an infiltrate was identified, radiologists selected whether there was an alveolar infiltrate, interstitial infiltrate, or both. An alveolar infiltrate was defined as a dense or fluffy opacity that occupies a portion or whole of a lobe, or of the entire lung, that may or may not contain air bronchograms.11, 12 An interstitial infiltrate was defined by a lacy pattern involving both lungs, featuring peribronchial thickening and multiple areas of atelectasis.11, 12 It also included minor patchy infiltrates that were not of sufficient magnitude to constitute consolidation, and small areas of atelectasis that in children may be difficult to distinguish from consolidation. Among interstitial infiltrates, radiologists were asked to distinguish infiltrate from atelectasis. A radiograph classified as having either an alveolar infiltrate or interstitial infiltrate (not atelectasis) was considered to have any infiltrate. Additional findings including air bronchograms, hilar adenopathy, pleural effusion, and location of abnormalities were also recorded.
Statistical Analysis
Inter‐rater reliability was assessed using the kappa statistic to determine the overall agreement between the 6 radiologists for each binary outcome (ie, presence or absence of alveolar infiltrate). To calculate 95% confidence intervals (CI) for kappa statistics with more than 2 raters, we employed a bootstrapping method with 1000 replications of samples equal in size to the study sample, using the kapci program as implemented by STATA software (version 10.1, STATA Corp, College Station, TX). Also, intra‐rater reliability was evaluated by examining the agreement within each radiologist upon review of 10 duplicate radiographs that had been randomly inserted into the case‐mix. We used the benchmarks proposed by Landis and Koch to classify the strength of agreement measured by the kappa statistic, as follows: poor (<0.0); slight (0‐0.20); fair (0.21‐0.40); moderate (0.41‐0.60); substantial (0.61‐0.80); almost perfect (0.81‐1.0).13
The study was approved by the institutional review boards at Children's Hospital, Boston and Children's Hospital of Philadelphia.
RESULTS
Patient Sample
The sample of 110 radiographs was obtained from 100 children presenting to the emergency department at Children's Hospital, Boston, with concern of pneumonia. These patients ranged in age from 1 week to 19 years (median, 3.5 years; interquartile range [IQR], 1.6‐6.0 years). Fifty (50%) of these patients were male. As stated above, the sample comprised 50 radiographs with a final reading in the medical record without suspicion for pneumonia, and 50 radiographs in which the diagnosis of pneumonia could not be excluded. The 10 duplicate radiographs encompassed a similar spectrum of findings.
Inter‐Rater Reliability
The kappa coefficients of inter‐rater reliability between the radiologists across the 6 clinical measures of interest are displayed in Table 1. As shown, the most reliable measure was that of alveolar infiltrate (Figure 1), which attained a substantial degree of agreement between the radiologists. Two other measures, any infiltrate and pleural effusion, attained moderate reliability, while bronchograms and hilar adenopathy were each classified as having fair reliability. However, interstitial infiltrate (Figure 2) was found to have the lowest kappa estimate, with a slight degree of reliability. When examining inter‐rater reliability among the radiologists separately from each institution, the pattern of results was similar.
| All Radiologists (n = 6) | Kappa | 95% Confidence Interval |
|---|---|---|
| ||
| Any infiltrate | 0.47 | 0.39, 0.56 |
| Alveolar infiltrate | 0.69 | 0.60, 0.78 |
| Interstitial infiltrate | 0.14 | 0.05, 0.23 |
| Air bronchograms | 0.32 | 0.24, 0.42 |
| Hilar adenopathy | 0.21 | 0.08, 0.39 |
| Pleural effusion | 0.45 | 0.29, 0.61 |
At least 4 of the 6 radiologists agreed on the presence or absence of an alveolar infiltrate for 95 of the 100 unique CXRs; all 6 radiologists agreed regarding the presence or absence of an alveolar infiltrate in 72 of the 100 unique CXRs. At least 4 of the 6 radiologists agreed on the presence or absence of any infiltrate and interstitial infiltrate 96% and 90% of the time, respectively. All 6 of the radiologists agreed on the presence or absence of any infiltrate and interstitial infiltrate 35% and 27% of the time, respectively.
Intra‐Rater Reliability
Estimates of intra‐rater reliability on the primary clinical outcomes (alveolar infiltrate, interstitial infiltrate, and any infiltrate) are found in Table 2. Across the 6 raters, the kappa estimates for alveolar infiltrate were all classified as substantial or almost perfect. The kappa estimates for interstitial infiltrate varied widely, ranging from fair to almost perfect, while for any infiltrate, reliability ranged from moderate to almost perfect.
| Kappa | 95% Confidence Interval | |
|---|---|---|
| ||
| Any infiltrate | ||
| Rater 1 | 1.00 | 1.00, 1.00 |
| Rater 2 | 0.60 | 0.10, 1.00 |
| Rater 3 | 0.80 | 0.44, 1.00 |
| Rater 4 | 1.00 | 1.00, 1.00 |
| Rater 5 | n/a* | |
| Rater 6 | 1.00 | 1.00, 1.00 |
| Alveolar infiltrate | ||
| Rater 1 | 1.00 | 1.00, 1.00 |
| Rater 2 | 1.00 | 1.00, 1.00 |
| Rater 3 | 1.00 | 1.00, 1.00 |
| Rater 4 | 1.00 | 1.00, 1.00 |
| Rater 5 | 0.78 | 0.39, 1.00 |
| Rater 6 | 0.74 | 0.27, 1.00 |
| Interstitial infiltrate | ||
| Rater 1 | 1.00 | 1.00, 1.00 |
| Rater 2 | 0.21 | 0.43, 0.85 |
| Rater 3 | 0.74 | 0.27, 1.00 |
| Rater 4 | n/a | |
| Rater 5 | 0.58 | 0.07, 1.00 |
| Rater 6 | 0.62 | 0.5, 1.00 |
DISCUSSION
The chest radiograph serves as an integral component of the reference standard for the diagnosis of childhood pneumonia. Few prior studies have assessed the reliability of chest radiograph findings in children.3, 5, 12, 14, 15 We found a high degree of agreement among radiologists for radiologic findings consistent with bacterial pneumonia when standardized interpretation criteria were applied. In this study, we identified radiographic features of pneumonia, such as alveolar infiltrate and pleural effusion, that were consistently identified by different radiologists reviewing the same radiograph and by the same radiologist reviewing the same radiograph. These data support the notion that radiographic features most suggestive of bacterial pneumonia are consistently identified by radiologists.16, 17 There was less consistency in the identification of other radiographic findings, such as interstitial infiltrates, air bronchograms, and hilar lymphadenopathy.
Prior studies have found high levels of disagreement among radiologists in the interpretation of chest radiographs.2, 3, 15, 18 Many of these prior studies emphasized variation in detection of radiographic findings that would not typically alter clinical management. We observed high intra‐rater, and inter‐rater reliability among radiologists for the findings of alveolar infiltrate and pleural effusion. These are the radiographic findings most consistent with a bacterial etiologic agent for pneumonia.19 Other studies have also found that the presence of an alveolar infiltrate is a reliable radiographic finding in children18 and adults.7, 9, 10 These findings support the use of the WHO definition of primary endpoint pneumonia for use in epidemiologic studies.4, 6, 11
This study also confirms a previous report by Cherian et al. that findings of many children with asthma, reactive airways disease, bronchiolitis, and viral infections interstitial infiltrates are less reliable.6 This is not surprising considering the fact that these patients often have radiographic findings due to small airway disease and atelectasis.19, 20 The differentiation between atelectasis and interstitial infiltrate is difficult, particularly in young children. A prior study conducted among neonates observed wide variability in the interpretation of chest radiographs, and that the differentiation of pneumonia from atelectasis was difficult for this patient population.5 The decisions around antimicrobial treatment of children with radiographic findings of interstitial infiltrates should be made in the context of the clinical history and physical examination findings, and clinicians should realize that these radiographic features demonstrate poor reliability for the diagnosis of pneumonia.
Overall reliability for the presence of any infiltrate, and its converse, no infiltrate was considered moderate. This is driven by the low reliability and variability around the radiographic diagnosis of interstitial infiltrates. Our findings are similar to those observed in adults with lower respiratory tract infections.9 The low reliability in identification of interstitial infiltrates may explain why prior studies have demonstrated that the CXR results rarely change management in children who have radiographs performed for suspicion of pneumonia.1, 21 Our study highlights the importance of quantifying CXR findings to include specific comments regarding the presence or absence of alveolar infiltrates, rather than the presence or absence of any infiltrate.
The WHO has procured definitions the radiographic diagnosis of pneumonia, and this definition has been utilized to help standardize the interpretation of chest radiographs for the conduct of epidemiological studies.6, 11 Specifically, the definitions utilized not only define the presence or absence of pneumonia, but also attempt to differentiate a primarily bacterial infection (consolidation or pleural effusion), from a viral or atypical presentation (interstitial pattern). Even under the best of circumstances, the differentiation of viral versus bacterial pneumonia is not always possible, and again, is often made by the treating physician by incorporating the clinical setting within which the radiograph was obtained.
This study had several limitations. Firstly, the included radiographs did not reflect the frequency with which certain radiographic findings would be identified in children evaluated for pneumonia in a pediatric emergency department setting. Radiographs were purposefully selected to encompass a broad spectrum of radiologic findings, including less common findings such as hilar lymphadenopathy and pleural effusions. Thus, the prevalence of pneumonia and other abnormal findings in this study was artificially higher than typically observed among a cohort of children for whom pneumonia is considered, a factor that may limit the generalizability of our results. Secondly, the clinical history was not provided to the radiologists to avoid bias by indication. For this study, we notified the radiologists that all radiographs were performed for clinical suspicion of pneumonia without providing details about the subjects' signs and symptoms. The absence of clinical history, however, does not mirror the real world scenario in which the interpretation of the chest radiograph is frequently made in the context of the clinical history. The relevance of this latter issue is unclear, as Tudor et al. found a nonstatistically significant improvement in the overall accuracy in chest radiograph interpretation when radiologists were provided clinical details.10 The radiologists recruited for this study all practice in an academic children's hospital setting, and thus, the generalizability of our findings may be limited to this type of practice setting. Finally, reproducibility does not imply accuracy, and reliability in identifying specific findings does not necessarily lead to improved or different management. Thus, while the reliability of radiographic findings of alveolar infiltrate and pleural effusion is reassuringly high, the validity of these radiographic features for bacterial pneumonia is not known. Ascertainment of validity can only be assessed through the use of invasive testing such as lung biopsy, as the yield from bacterial testing such as blood cultures is low, and the results of other studies such as viral testing of nasopharyngeal washings do not prove an etiologic cause of pneumonia.
CONCLUSIONS
Radiographic findings of alveolar infiltrates and pleural effusions are highly reliable among radiologists. Radiographic interpretation of interstitial infiltrates appears to be less reliable.
- ,,, et al.Usefulness of chest radiographs in children with acute lower respiratory tract disease.J Pediatr.1987;111:187–193.
- ,,, et al.Disagreement in the interpretation of chest radiographs among specialists and clinical outcomes of patients hospitalized with suspected pneumonia.Eur J Intern Med.2006;17:43–47.
- ,,.Problems in the clinical and roentgenographic diagnosis of pneumonia in young children.Clin Pediatr (Phila).1984;23:398–399.
- WHO guidelines on detecting pneumonia in children.Lancet.1991;338:1453–1454.
- ,,, et al.Inter‐ and intra‐observer variability in the assessment of atelectasis and consolidation in neonatal chest radiographs.Pediatr Radiol.1999;29:459–462.
- ,,, et al.Standardized interpretation of paediatric chest radiographs for the diagnosis of pneumonia in epidemiological studies.Bull World Health Organ.2005;83:353–359.
- ,,, et al.Interobserver reliability of the chest radiograph in community‐acquired pneumonia. PORT Investigators.Chest.1996;110:343–350.
- ,,, et al.Chest radiographs in the emergency department: is the radiologist really necessary?Postgrad Med J.2003;79:214–217.
- ,,, et al.Inter‐observer variation in the interpretation of chest radiographs for pneumonia in community‐acquired lower respiratory tract infections.Clin Radiol.2004;59:743–752.
- ,,.An assessment of inter‐observer agreement and accuracy when reporting plain radiographs.Clin Radiol.1997;52:235–238.
- Standardization of interpretation of chest radiographs for the diagnosis of pneumonia in children. In:World Health Organization: Pneumonia Vaccine Trial Investigators' Group.Geneva:Department of Vaccine and Biologics;2001.
- ,,, et al.Effectiveness of heptavalent pneumococcal conjugate vaccine in children younger than 5 years of age for prevention of pneumonia: updated analysis using World Health Organization standardized interpretation of chest radiographs.Pediatr Infect Dis J.2006;25:779–781.
- ,.The measurement of observer agreement for categorical data.Biometrics.1977;33:159–174.
- ,.Clinical, laboratory, and radiological information in the diagnosis of pneumonia in children.Ann Emerg Med.1988;17:43–46.
- ,.Intraobserver and interobserver agreement of the interpretation of pediatric chest radiographs.Emerg Radiol.17:285–290.
- ,,, et al.Practice guidelines for the management of community‐acquired pneumonia in adults. Infectious Diseases Society of America.Clin Infect Dis.2000;31:347–382.
- ,,, et al.Guidelines for the management of adults with community‐acquired pneumonia. Diagnosis, assessment of severity, antimicrobial therapy, and prevention.Am J Respir Crit Care Med.2001;163:1730–1754.
- ,,, et al.Comparison of radiological findings and microbial aetiology of childhood pneumonia.Acta Paediatr.1993;82:360–363.
- Kuhn JP, Slovis TL, Haller JO, eds.Caffey's Pediatric Diagnostic Imaging.10th ed.Philadelphia, PA:Mosby;2004.
- ,,, et al.Clinical predictors of pneumonia among children with wheezing.Pediatrics.2009;124:e29–e36.
- ,,, et al.The clinical impact of the radiology report in wheezing and nonwheezing febrile children: a survey of clinicians.Pediatr Radiol.2009;39:348–353.
Copyright © 2011 Society of Hospital Medicine

Diagnosis of Complicated Pneumonia
Community‐acquired pneumonia (CAP), the most common serious bacterial infection in childhood, may be complicated by parapneumonic effusion (ie, complicated pneumonia).1, 2 The clinical outcome of children with complicated pneumonia is directly influenced by the causative organism, and precise identification of the infectious agent has the potential to improve clinical management.35 The incidence of complicated pneumonia has recently increased, highlighting the need to better understand the reasons for this changing epidemiology.68 However, using conventional bacterial culture, bacteria are isolated from clinical samples obtained from children with complicated pneumonia in only 17%42% of cases.1, 9, 10 The low rate of positive culture results may be related to stringent bacterial growth requirements or to administration of broad‐spectrum antibiotics before obtaining blood or pleural fluid samples for culture.
Unlike bacterial culture, polymerase chain reaction (PCR) relies on the detection of bacterial DNA rather than on the recovery of viable bacteria and is therefore less affected by the prior administration of antibiotics. Broad‐range or universal primer 16S rRNA PCR detects a conserved region of the 16S ribosomal RNA (rRNA) gene and can detect a wide range of bacterial species with a single assay.11 However, few studies have evaluated the role of 16S rRNA PCR in detecting bacteria in the pleural fluid of children with complicated pneumonia.12, 13 The purpose of this study was to determine the frequency of positive blood and pleural fluid cultures in children with complicated pneumonia, and to determine whether broad‐range 16S rRNA PCR can increase the proportion of children with an identifiable microbiologic cause of complicated pneumonia.
Methods
Study Design, Setting, and Participants
This prospective cohort study was conducted at The Children's Hospital of Philadelphia (CHOP), an urban tertiary care children's hospital. The proposal was approved by the CHOP Committees for the Protection of Human Subjects. Patients were eligible for participation if they were 18 years of age, admitted to the hospital between October 1, 2007 and March 31, 2010, and diagnosed with complicated pneumonia. Parental informed consent was obtained for all patients, and verbal assent was obtained for all children over seven years of age. Patients with chronic medical conditions predisposing them to severe or recurrent pneumonia, such as human immunodeficiency virus, malignancy, and sickle cell disease, were excluded. The study team had no role in the clinical management of study patients. As this test is still considered experimental, pleural fluid 16S rRNA PCR was not performed until the patient was discharged from the hospital; these test results were not shared with the treating physicians.
Study Definition
Complicated pneumonia was defined by a temperature >38.0C, and the presence of lung parenchymal infiltrates and pleural effusions of any size or character on chest radiography or computed tomography.
Microbiologic MethodsConventional Culture
Pleural fluid or blood (4 mL) was inoculated onto a single pediatric BacT/Alert FAN bottle (BioMrieux, Durham, NC) which was immediately transported to the laboratory at room temperature. Additional pleural fluid was also submitted to the laboratory for a cytospin Gram stain. Once received in the laboratory, the bottles were immediately loaded into the BacT/Alert instrument. Bottles were automatically checked by the instrument for production of CO2 every ten minutes, and remained in the instrument for a total of five days. Bottles flagged as positive by the BacT/Alert system were removed from the instrument, subcultured to agar plates, and Gram stained. Bacterial isolates were identified and the antibiotic susceptibility tested by conventional methods following Clinical and Laboratory Standards Institute guidelines.
Microbiological Methods16S rRNA PCR
The 16S rRNA primers and probe used in this study have been validated previously and have been used extensively for the identification of organisms from the Domain Bacteria.14 Escherichia coli (ATCC 25922) and Staphylococcus aureus (ATCC 29213) were used as Gram‐negative and Gram‐positive controls, respectively. DNA extraction was performed on a 300 l aliquot of pleural fluid using the MagMAX Total Nucleic Acid Isolation Kit (Applied Biosystems, Foster City, CA). Samples were disrupted using a Vortex adapter for 15 minutes at the highest setting. Tubes were then centrifuged at 16,000 relative centrifugal force (RCF) for three minutes, and DNA extraction was performed using the KingFisher Flex Automated Purification System (Thermo Scientific, Waltham, MA). All DNA extracts were frozen at 20C prior to use. Details of the 16S rRNA PCR assay optimization and validation appear in the Appendix.
DNA was amplified on an Applied Biosystems 7500 thermal cycler (ABI, Foster City, CA) using the primers, 16S F: 5‐GCT GTC ATC TCT TGT GGG CTG T‐3, 16S R: 5‐AAA CTC ATG GGA GCT GCT GGT T‐3, and the fluorescent labeled TaqMan probe, 16s Probe: 5‐Cy5/CCT GTC ATG CCC ACA CAA ATC TCT CC/BHQ‐2‐3. Human DNA (0.5 nanograms) was added to each assay as a standardized internal amplification control. The primers, AlbICF: 5‐GCT GTC ATC TCT TGT GGG CTG T‐3, AlbICR: 5‐AAA CTC ATG GGA GCT GCT GGT T‐3, and the TaqMan probe, AlbICP: 5‐Cy5/CCT GTC ATG CCC ACA CAA ATC TCT CC/BHQ‐2‐3 detect a region of the human albumin gene. Amplification was performed as follows: initial denaturation of 94C for 20 seconds, followed by 35 cycles of 94C for 10 seconds, 61C for 31 seconds, and 72C for 5 seconds. Each run included positive (E. coli ATCC 25922 DNA) and negative (nuclease free water) controls. A cycle threshold value of 30 or less indicated a positive sample. All positive samples were confirmed using the MicroSeq 500 16S rDNA Bacterial Identification kit (Applied Biosystems).
DNA Sequencing
DNA sequencing was performed directly on PCR products using an ABI 3730 with the BigDye Taq FS Terminator V3.1. Sequencing was completed at the University of Pennsylvania DNA Sequencing Facility, and sequence identification was performed by BLAST at the National Center for Biotechnology Information web site (
Statistical Analysis
Data were analyzed using STATA 10.0 (Stata Corp., College Station, TX). Categorical variables were described using frequencies and percentages, and were compared using the chi‐square test. Continuous variables were described using mean, median, intraquartile range (IQR), and range values. Binomial exact 95% confidence intervals (CIs) were calculated for the proportion of positive blood and pleural fluid cultures and pleural fluid 16S rRNA PCR tests.
Results
During the study period, 124 patients with complicated pneumonia were identified; the median age was 4.9 years (IQR, 2.78.8 years) and the ratio of female to male patients was 1:1. The racial distribution was as follows: non‐Hispanic white, 62 (50%); non‐Hispanic black, 43 (34%); and Hispanic, 7 (6%). The median length of stay was 11 days (range, 240 days; IQR, 811 days). Forty‐one (33.1%) patients were admitted to the intensive care unit, and nine (7.3%) patients required mechanical ventilation. Overall, 5 of the 71 blood cultures performed (7.0%; 95% CI: 2.3%15.7%) were positive.
Pleural fluid drainage was performed in 64 (51.6%) patients. The median duration of antibiotic treatment before pleural fluid drainage was two days (IQR, 04 days). Differences in duration of antibiotic pretreatment between those with and without pleural fluid drainage were not significant. Patients received beta‐lactam agents (76.6%), clindamycin (51.6%), and vancomycin (23.4%) before pleural drainage. Blood cultures were performed in 27 (45.0%) of 60 patients not undergoing pleural fluid drainage; 2 of these 27 (7.4%; 95% CI: 0.9%24.3%) blood cultures were positive, and Streptococcus pneumoniae was isolated in both cases.
Using a combination of pleural fluid culture, blood culture, and broad‐range PCR, a microbiologic cause of infection was identified in 11 of 64 (17.2%; 95% CI: 8.9%28.7%) patients undergoing pleural fluid drainage (Figure 1). Patients with an identified bacterial cause were younger than those without an identified bacterial cause (Table 1). However, there were no statistically significant differences between the groups with and without identified bacteria with respect to sex, race, clinical examination findings and laboratory results at admission, duration of antibiotic therapy before pleural fluid drainage, or length of stay (Table 1). The median pleural fluid white blood cell count was 6880 per mm3 (IQR, 154227,918 per mm3).
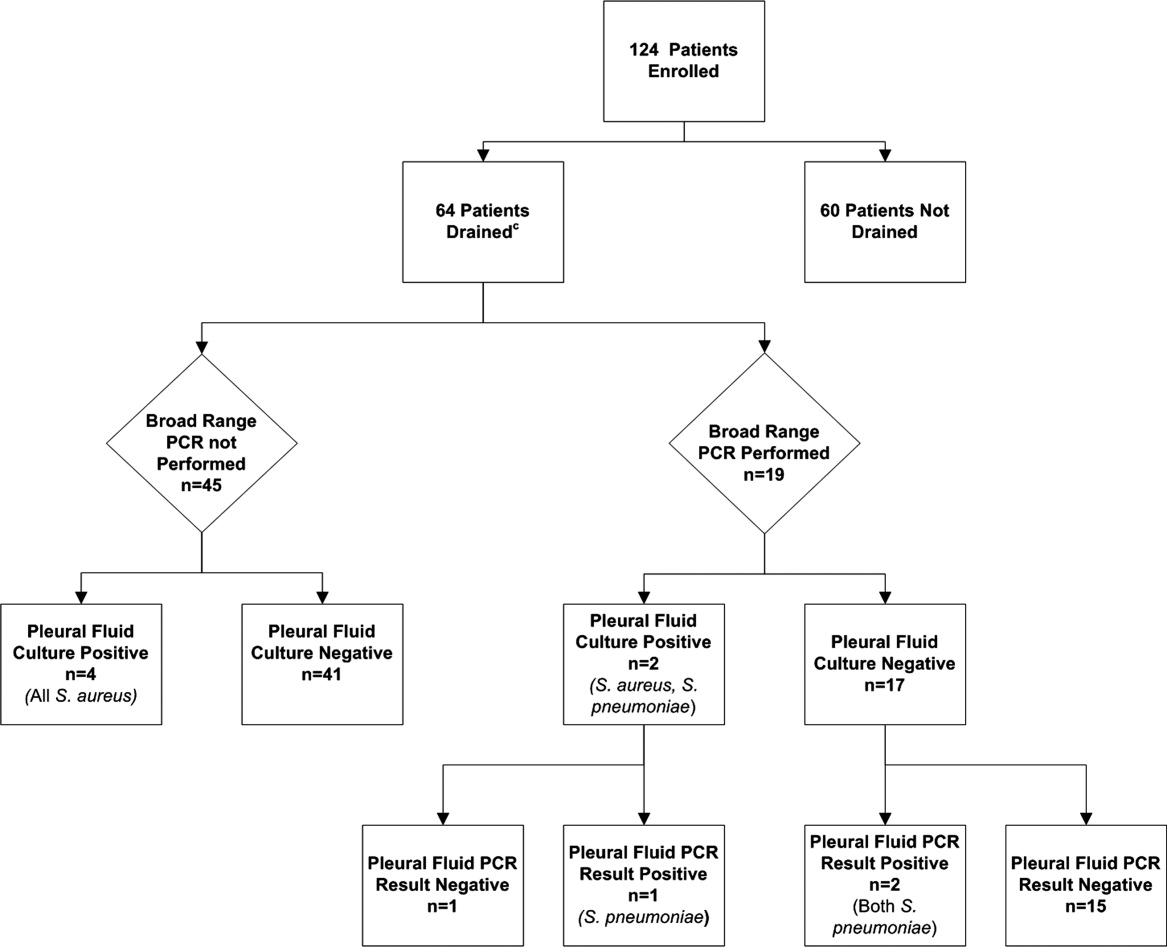
| Causative Bacteria Identified | |||
|---|---|---|---|
| Demographics | Yes (n = 11) | No (n = 53) | P Value |
| |||
| Female sex | 3 (27.3%) | 29 (54.7%) | 0.10 |
| Age (years) | 2 (1.34.50) | 4.3 (3.1 8.1) | 0.03 |
| Race | 0.09 | ||
| Non‐Hispanic white | 3 (27.3%) | 29 (54.7%) | |
| Non‐Hispanic black | 7 (63.6%) | 13 (24.5%) | |
| Hispanic | 0 (0.0%) | 3 (5.6%) | |
| Other | 1 (9.1%) | 8 (15.1%) | |
| History of asthma | 2 (18.2%%) | 12 (22.6%) | 0.75 |
| Duration of antibiotics before drainage (days) | 0.5 (03) | 2 (04) | 0.43 |
| Intensive care unit admission | 7 (63.6%) | 25 (47.2%) | 0.32 |
| Initial temperature (C) | 37.8 (37.239.5) | 38.1 (37.639.3) | 0.76 |
| Initial oxygen saturation (%) | 94 (9397) | 95 (9396) | 0.97 |
| Peripheral white blood cell count (per mm3) | 21.4 (14.028.4) | 16.3 (10.922.6) | 0.12 |
| Platelet count (per mm3) | 434 (298546) | 402 (312575) | 0.95 |
Blood was obtained for culture from 44 (68.8%) of 64 patients that underwent pleural fluid drainage. Blood cultures were positive in three (6.8%; 95% CI: 1.4%18.7%) of these patients; causative bacteria were S. pneumoniae (n = 1), Haemophilus influenzae (n = 1), and Staphylococcus aureus (n = 1). Pleural fluid cultures were positive from 6 of 64 patients (9.3%; 95% CI: 3.5%19.3%) that underwent pleural fluid drainage; causative bacteria were Staphylococcus aureus (n = 5) and Streptococcus pneumoniae (n = 1). Three of the 19 pleural fluid samples (15.8%, CI 3.4%39.6%) tested by 16S rRNA PCR yielded positive results; S. pneumoniae was identified by DNA sequencing in all three of these samples (Figure 1). Of these three specimens, two had both negative Gram stains and negative pleural fluid cultures, while one specimen had Gram‐positive cocci in pairs identified on Gram stain along with a pleural fluid culture‐positive for S. pneumoniae. Of the 16 patients with negative PCR results, one was found to have a pleural fluid culture‐positive for S. aureus; no bacteria were detected on the pleural fluid Gram stain (Figure 1). Differences in the demographic characteristics between patients in whom broad‐range PCR was performed and not performed were not statistically significant (Table 2). Differences in the median length of hospital stay between patients who had PCR performed (9 days; IQR, 712 days) and those who did not (11 days; IQR, 914 days) were not statistically significant (P = 0.19). Antibiotic therapy was simplified from treatment with multiple antibiotics to a single antibiotic in each instance of a positive culture, though the number of positive cultures was too small to lead to meaningful reductions in antibiotic use or spectrum.
| PCR Performed | |||
|---|---|---|---|
| Demographics | Yes (N = 19) | No (N = 45) | P Value |
| |||
| Female sex | 9 (47.4) | 23 (51.1) | 0.78 |
| Age (years) | 4.9 (2.78.8) | 4.0 (2.88.1) | 0.76 |
| Race | 0.42 | ||
| Non‐Hispanic white | 10 (52.6%) | 22 (48.9%) | |
| Non‐Hispanic black | 5 (26.3%) | 15 (33.3%) | |
| Hispanic | 0 (0.0%) | 3 (6.7%) | |
| Other | 4 (21.1%) | 5 (11.1%) | |
| History of asthma | 5 (26.32%) | 9 (20.0%) | 0.58 |
| Duration of antibiotics before drainage (days) | 2 (03) | 1.5 (04) | 0.65 |
| Intensive care unit admission | 8 (42.1%) | 24 (53.3%) | 0.41 |
| Initial temperature (C) | 38.1 (37.339.4) | 38.0 (37.639.4) | 0.86 |
| Initial pulse oximetry (%) | 96 (9497) | 94 (9296) | 0.34 |
| Initial white blood cell count (1000 per mm3) | 16.1 (9.527.4) | 17.8 (12.622.8) | 0.93 |
| Platelet count (1000 per mm3) | 397 (312575) | 431 (303597) | 0.73 |
Discussion
Identification of the causative organism can improve the treatment of children with complicated pneumonia by enabling clinicians to target the infection with effective, narrow‐spectrum antibiotics. However, broad‐spectrum antibiotics are typically given before blood or pleural fluid samples are obtained, lowering the yield of conventional bacterial cultures. In our study, pleural fluid and blood cultures were infrequently positive. However, the use of 16S rRNA broad‐range PCR and DNA sequencing as ancillary tests only modestly improved our diagnostic yield.
Two prior studies have shown that broad‐range PCR analysis of pleural fluid can detect pathogenic organisms from pleural fluid even after the administration of antibiotics. Saglani et al.12 used bacterial culture and broad‐range PCR to analyze pleural fluid from 32 children with complicated pneumonia. Although the cohort had received a median of eight days of antibiotic therapy prior to fluid aspiration, a combination of broad‐range PCR and DNA sequencing identified organisms, predominantly S. pneumoniae, in 17 of 26 (65.4%) pleural fluid samples with negative culture. Five of the six culture‐positive samples also had positive PCR results, suggesting that a low proportion of the PCR results were false‐negatives. Le Monnier et al.13 cultured the pleural fluid from 78 children with complicated pneumonia; 15 samples were excluded from PCR testing because they grew bacteria other than S. pneumoniae. Broad‐range 16S rRNA PCR detected bacteria in 22 of 40 (55.0%) samples that were culture‐negative; subsequent DNA sequencing identified S. pneumoniae (n = 17), S. pyogenes (n = 3), S. aureus (n = 1), and H. influenzae (n = 1). S. pneumoniae was identified by 16S rRNA PCR followed by DNA sequencing in 20 of the 23 (87.0%) pleural fluid samples that grew S. pneumoniae on culture.
PCR with organism‐specific primers has also been shown to detect pathogenic bacteria in 35%70% of pleural fluid samples from patients with complicated pneumonia.15, 16 These rates of detection are comparable to the results of prior studies that used broad‐range PCR, and suggest that 16S rRNA and organism‐specific PCR are similarly sensitive tests.
Our study found that the proportion of positive results with broad‐range PCR was greater than the proportion observed with conventional pleural fluid culture. We were also able to identify S. pneumoniae by broad‐range PCR in two culture‐negative pleural fluid samples. The detection of S. pneumoniae by PCR in the setting of negative pleural fluid culture is not surprising, as most patients received empiric antibiotic therapy against S. pneumoniae before undergoing pleural fluid drainage. This prior antibiotic therapy would be expected to decrease the yield of pleural fluid culture but have a less significant impact on PCR. The reason for the failure to detect S. aureus by PCR from our clinical samples is not known. We explored whether this issue could be attributable to test characteristics during validation of our assay (as described in the technical Appendix), and S. aureus was consistently identified in pleural fluid samples spiked with S. aureus. While our diagnostic yield was low compared with prior studies that used broad‐range PCR, the distribution of causative bacteria was similar to prior studies of complicated pneumonia.9, 10 There were too few positive cultures among the specimens available for broad‐range PCR testing for us to reliably assess 16S rRNA PCR sensitivity and specificity. Thus, it was not possible to reliably assess the value of 16S rRNA PCR as an ancillary test in culture‐negative complicated pneumonia.
Several factors may have contributed to the low yield of broad‐range PCR in our study. First, all patients in our study received broad‐spectrum antibiotics prior to pleural fluid drainage; most patients received treatment with a beta‐lactam agent in combination with either clindamycin or vancomycin. Although PCR is less affected than culture by the prior administration of antibiotics, it is still possible that exposure to antibiotics accelerated degradation of the bacterial genome, thus decreasing the sensitivity of broad‐range PCR. The median duration of antibiotic therapy prior to drainage was shorter for patients in whom a bacterial pathogen was identified, compared with those in whom a pathogen was not identified. Though this difference was not statistically significant, this difference emphasizes that early pleural fluid collection may improve bacterial detection. The median duration of prior antibiotic therapy was eight days, in the study by Saglani et al.,12 however details regarding anti‐staphylococcal therapy were not reported. Second, several studies using 16S rRNA PCR in blood or cerebrospinal fluid (CSF) specimens for children with sepsis or meningitis, respectively, have noted decreased sensitivity for detection of Gram‐positive bacteria.1720 The cell wall composition makes Gram‐positive bacteria particularly difficult to lyse for DNA extraction. Prior studies used a different approach to DNA extraction compared with our study. Saglani et al.12 used the QIAmp minikit for DNA extraction (Qiagen Ltd, West Sussex, UK) and Le Monnier et al.13 used the MagnaPure System (Roche Diagnostics, Indianapolis, IN) for DNA extraction; additionally Saglani et al.12 included an additional 15 minutes of incubation at 95C following Proteinase K digestion to ensure complete lysis of the bacterial cells. We used the MagMAX Total Nucleic Acid Isolation Kit with a bead beating step to degrade the samples prior to lysis. It is unlikely that any of these differences contributed to differences in our study results. Third, human DNA may cause a nonspecific background signal, which could decrease PCR sensitivity. This issue may be particularly important in complicated pneumonia where the pleural fluid white blood cell counts are substantially elevated. Human DNA from white blood cells might be present at much higher concentrations than bacterial DNA, which would create a competitive advantage for binding of human, rather than bacterial, DNA on to the bead matrix.21 Saglani et al.12 did not report pleural fluid white blood cell counts for comparison. However, Le Monnier et al.13 reported pleural fluid white blood cell counts slightly higher than those observed in our patients. Thus, differences in pleural fluid white blood cell counts do not necessarily explain the differences in yield across studies. Fourth, while the universal primers used in our study have been validated, including for detection of S. aureus, in previous studies,14 Saglani et al.12 and Le Monnier et al.13 each used a different set of primers. It is unclear whether or not the choice of different primers affected the microbiologic yield.
An important limitation of this study is the relatively small number of patients with pleural fluid available for PCR testing combined with the low PCR yield. This limitation may have caused us to underestimate the true benefit of 16S rRNA PCR as an ancillary diagnostic test, as suggested by the wide confidence intervals around the estimates of PCR yield. Additionally, not all patients underwent pleural drainage, and not all patients undergoing pleural drainage had pleural fluid available for PCR testing. The latter issue would likely have only minimal impact on our study results, as there were no differences in demographics or clinical or laboratory features among those with and without pleural fluid available for PCR testing. However, differences among physicians, and across institutions, may play an important role in the decision to perform pleural drainage. We do not know whether patients undergoing pleural drainage at our institution were more or less likely to have bacteria detected by PCR than patients not undergoing drainage. If they were more likely to have bacteria detected, then our study would underestimate the benefit of PCR as an adjunct diagnostic test. However, there was no difference in the duration of antibiotic pretreatment between these two groups, and the yield from blood culture was similar.
In conclusion, blood and pleural fluid cultures infrequently identify the causative bacteria in children with complicated pneumonia. The use of broad‐range PCR increased the microbiologic yield only modestly. Further refinements to improve the diagnostic accuracy of broad‐range PCR testing are needed before this technique can be recommended for widespread use in clinical practice.
Appendix
Optimization and Validation of The 16S Assay
The assay was optimized for use with pleural fluid samples as follows. E. coli (ATCC 25922) and S. aureus (ATCC 29213) were grown overnight in 100 ml Brain Heart Infusion (BHI) broth. A suspension equivalent to a 0.5 MacFarland standard was prepared and was taken to represent approximately 1 108 colony‐forming units/mL. To prepare standard PCR curves, 1 in 10 dilutions were prepared in PBS (pH, 7.4) and DNA was extracted, in triplicate, using two different DNA extraction methods: the MagMAX Total Nucleic Acid Isolation Kit and the PrepMan Ultra Sample Preparation reagent system (Applied Biosystems, Foster City, CA), as described by the manufacturer. For the MagMax extraction, a 300 microliter sample was added to 200 microliters of lysis/binding solution in a bead tube. Samples were disrupted using a vortex adapter for 15 minutes at the highest setting. Tubes were then centrifuged at 16,000 relative centrifugal force (RCF) for three minutes. DNA extraction was performed using the KingFisher Flex Automated Purification System (Thermo Scientific). For the PrepMan Ultra extraction, a 300‐l sample was centrifuged for three minutes at 16,000 RCF. The supernatant fluid was discarded and the pellet was resuspended in 100 microliters of PrepMan Ultra Lysis Buffer and incubated at 100C for ten minutes. The sample was centrifuged for three minutes at 16,000 RCF, and a 10‐microliter aliquot of supernatant fluid was added to 90 microliters of nuclease free water. All DNA extracts were frozen at 20C prior to use. Plate counts, performed from the bacterial suspensions in triplicate, revealed approximately 1.3 108 colony‐forming units/mL in the original suspensions.
Pleural fluid samples were spiked with known concentrations (1, 3, 10, 30, 100, 300, and 1000 colony‐forming units/mL) of E. coli and S. aureus, and each sample was extracted five times with both DNA extraction systems. Each DNA extract was amplified on an Applied Biosystems 7500 thermal cycler (ABI) and a SmartCycler (Cepheid, Sunnyvale, CA). Analysis of the results obtained from the preliminary experiments indicated that the following combination of DNA extraction and PCR was optimal, and these conditions were used for all patient samples.
DNA was extracted from a 300‐microliter aliquot of pleural fluid using the MagMAX Total Nucleic Acid Isolation Kit (Ambion, Applied Biosystems) as described by the manufacturer. PCR was performed on an Applied Biosystems 7500 thermal cycler (ABI) using the primers, 16S F: 5‐GCT GTC ATC TCT TGT GGG CTG T‐3, 16S R: 5‐AAA CTC ATG GGA GCT GCT GGT T‐3, and the fluorescent labeled TaqMan probe, 16s Probe: 5‐Cy5/CCT GTC ATG CCC ACA CAA ATC TCT CC/BHQ‐2‐3. Human DNA (0.5 nanograms) was added to each assay to ensure that an adequate amount of human DNA was available to act as an internal amplification control. The primers, AlbICF: 5‐GCT GTC ATC TCT TGT GGG CTG T‐3, AlbICR: 5‐AAA CTC ATG GGA GCT GCT GGT T‐3, and the TaqMan probe, AlbICP: 5‐Cy5/CCT GTC ATG CCC ACA CAA ATC TCT CC/BHQ‐2‐3 detect a region of the human albumin gene. Amplification was performed as follows: initial denaturation of 94C for 20 seconds, followed by 35 cycles of 94C for 10 seconds, 61C for 31 seconds, and 72C for 5 seconds. Each run included positive (E. coli ATCC 25922 DNA) and negative (nuclease free water) controls. A cycle threshold value of 30 or less indicated a positive sample. All positive samples were confirmed using the MicroSeq 500 16S rDNA Bacterial Identification kit (Applied Biosystems).
- ,,, et al.An epidemiological investigation of a sustained high rate of pediatric parapneumonic empyema: risk factors and microbiological associations.Clin Infect Dis.2002;34:434–440.
- ,,,,.Primary early thoracoscopy and reduction in length of hospital stay and additional procedures among children with complicated pneumonia: results of a multicenter retrospective cohort study.Arch Pediatr Adolesc Med.2008;162:675–681.
- ,,, et al.Pulmonary manifestations in children with invasive community‐acquired Staphylococcus aureus infection.Clin Infect Dis.2005;41:583–590.
- ,,, et al.Association between Staphylococcus aureus strains carrying gene for Panton‐Valentine leukocidin and highly lethal necrotising pneumonia in young immunocompetent patients.Lancet.2002;359:753–759.
- ,,, et al.Severe community‐onset pneumonia in healthy adults caused by methicillin‐resistant Staphylococcus aureus carrying the Panton‐Valentine leukocidin genes.Clin Infect Dis.2005;40:100–107.
- ,.Empyema hospitalizations increased in US children despite pneumococcal conjugate vaccine.Pediatrics.2010;125:26–33.
- ,,,.Increasing incidence of empyema complicating childhood community‐acquired pneumonia in the United States.Clin Infect Dis.2010;50:805–813.
- ,,,,.National hospitalization trends for pediatric pneumonia and associated complications.Pediatrics.2010;126:204–213.
- ,,, et al.Thoracoscopic decortication vs tube thoracostomy with fibrinolysis for empyema in children: a prospective, randomized trial.J Pediatr Surg.2009;44:106–111.
- ,,, et al.Comparison of urokinase and video‐assisted thoracoscopic surgery for treatment of childhood empyema.Am J Respir Crit Care Med.2006;174:221–227.
- ,.Development of broad‐range 16S rDNA PCR for use in the routine diagnostic clinical microbiology service.J Med Microbiol.2003;52:685–691.
- ,,,.Empyema: the use of broad range 16S rDNA PCR for pathogen detection.Arch Dis Child.2005;90:70–73.
- ,,, et al.Microbiological diagnosis of empyema in children: comparative evaluations by culture, polymerase chain reaction, and pneumococcal antigen detection in pleural fluids.Clin Infect Dis.2006;42:1135–1140.
- ,,,.Determination of bacterial load by real‐time PCR using a broad‐range (universal) probe and primers set.Microbiology.2002;148:257–266.
- ,,,,,.Pneumolysin polymerase chain reaction for diagnosis of pneumococcal pneumonia and empyema in children.Eur J Clin Microbiol Infect Dis.2006;25:783–789.
- ,,, et al.Pleural fluid PCR method for detection of Staphylococcus aureus, Streptococcus pneumoniae and Haemophilus influenzae in pediatric parapneumonic effusions.Respiration.2008;75:437–442.
- ,.16S rRNA gene sequencing for bacterial identification in the diagnostic laboratory: pluses, perils, and pitfalls.J Clin Microbiol.2007;45:2761–2764.
- ,,,,.Evaluating the near‐term infant for early onset sepsis: progress and challenges to consider with 16S rDNA polymerase chain reaction testing.J Mol Diagn.2006;8:357–363.
- ,,,,.Preanalytic removal of human DNA eliminates false signals in general 16S rDNA PCR monitoring of bacterial pathogens in blood.Comp Immunol Microbiol Infect Dis.2009;32:207–219.
- ,,,,.Use of broad range16S rDNA PCR in clinical microbiology.J Microbiol Methods.2009;76:217–225.
- ,.Real‐time polymerase chain reaction for detecting bacterial DNA directly from blood of neonates being evaluated for sepsis.J Mol Diagn.2005;7:575–581.
Community‐acquired pneumonia (CAP), the most common serious bacterial infection in childhood, may be complicated by parapneumonic effusion (ie, complicated pneumonia).1, 2 The clinical outcome of children with complicated pneumonia is directly influenced by the causative organism, and precise identification of the infectious agent has the potential to improve clinical management.35 The incidence of complicated pneumonia has recently increased, highlighting the need to better understand the reasons for this changing epidemiology.68 However, using conventional bacterial culture, bacteria are isolated from clinical samples obtained from children with complicated pneumonia in only 17%42% of cases.1, 9, 10 The low rate of positive culture results may be related to stringent bacterial growth requirements or to administration of broad‐spectrum antibiotics before obtaining blood or pleural fluid samples for culture.
Unlike bacterial culture, polymerase chain reaction (PCR) relies on the detection of bacterial DNA rather than on the recovery of viable bacteria and is therefore less affected by the prior administration of antibiotics. Broad‐range or universal primer 16S rRNA PCR detects a conserved region of the 16S ribosomal RNA (rRNA) gene and can detect a wide range of bacterial species with a single assay.11 However, few studies have evaluated the role of 16S rRNA PCR in detecting bacteria in the pleural fluid of children with complicated pneumonia.12, 13 The purpose of this study was to determine the frequency of positive blood and pleural fluid cultures in children with complicated pneumonia, and to determine whether broad‐range 16S rRNA PCR can increase the proportion of children with an identifiable microbiologic cause of complicated pneumonia.
Methods
Study Design, Setting, and Participants
This prospective cohort study was conducted at The Children's Hospital of Philadelphia (CHOP), an urban tertiary care children's hospital. The proposal was approved by the CHOP Committees for the Protection of Human Subjects. Patients were eligible for participation if they were 18 years of age, admitted to the hospital between October 1, 2007 and March 31, 2010, and diagnosed with complicated pneumonia. Parental informed consent was obtained for all patients, and verbal assent was obtained for all children over seven years of age. Patients with chronic medical conditions predisposing them to severe or recurrent pneumonia, such as human immunodeficiency virus, malignancy, and sickle cell disease, were excluded. The study team had no role in the clinical management of study patients. As this test is still considered experimental, pleural fluid 16S rRNA PCR was not performed until the patient was discharged from the hospital; these test results were not shared with the treating physicians.
Study Definition
Complicated pneumonia was defined by a temperature >38.0C, and the presence of lung parenchymal infiltrates and pleural effusions of any size or character on chest radiography or computed tomography.
Microbiologic MethodsConventional Culture
Pleural fluid or blood (4 mL) was inoculated onto a single pediatric BacT/Alert FAN bottle (BioMrieux, Durham, NC) which was immediately transported to the laboratory at room temperature. Additional pleural fluid was also submitted to the laboratory for a cytospin Gram stain. Once received in the laboratory, the bottles were immediately loaded into the BacT/Alert instrument. Bottles were automatically checked by the instrument for production of CO2 every ten minutes, and remained in the instrument for a total of five days. Bottles flagged as positive by the BacT/Alert system were removed from the instrument, subcultured to agar plates, and Gram stained. Bacterial isolates were identified and the antibiotic susceptibility tested by conventional methods following Clinical and Laboratory Standards Institute guidelines.
Microbiological Methods16S rRNA PCR
The 16S rRNA primers and probe used in this study have been validated previously and have been used extensively for the identification of organisms from the Domain Bacteria.14 Escherichia coli (ATCC 25922) and Staphylococcus aureus (ATCC 29213) were used as Gram‐negative and Gram‐positive controls, respectively. DNA extraction was performed on a 300 l aliquot of pleural fluid using the MagMAX Total Nucleic Acid Isolation Kit (Applied Biosystems, Foster City, CA). Samples were disrupted using a Vortex adapter for 15 minutes at the highest setting. Tubes were then centrifuged at 16,000 relative centrifugal force (RCF) for three minutes, and DNA extraction was performed using the KingFisher Flex Automated Purification System (Thermo Scientific, Waltham, MA). All DNA extracts were frozen at 20C prior to use. Details of the 16S rRNA PCR assay optimization and validation appear in the Appendix.
DNA was amplified on an Applied Biosystems 7500 thermal cycler (ABI, Foster City, CA) using the primers, 16S F: 5‐GCT GTC ATC TCT TGT GGG CTG T‐3, 16S R: 5‐AAA CTC ATG GGA GCT GCT GGT T‐3, and the fluorescent labeled TaqMan probe, 16s Probe: 5‐Cy5/CCT GTC ATG CCC ACA CAA ATC TCT CC/BHQ‐2‐3. Human DNA (0.5 nanograms) was added to each assay as a standardized internal amplification control. The primers, AlbICF: 5‐GCT GTC ATC TCT TGT GGG CTG T‐3, AlbICR: 5‐AAA CTC ATG GGA GCT GCT GGT T‐3, and the TaqMan probe, AlbICP: 5‐Cy5/CCT GTC ATG CCC ACA CAA ATC TCT CC/BHQ‐2‐3 detect a region of the human albumin gene. Amplification was performed as follows: initial denaturation of 94C for 20 seconds, followed by 35 cycles of 94C for 10 seconds, 61C for 31 seconds, and 72C for 5 seconds. Each run included positive (E. coli ATCC 25922 DNA) and negative (nuclease free water) controls. A cycle threshold value of 30 or less indicated a positive sample. All positive samples were confirmed using the MicroSeq 500 16S rDNA Bacterial Identification kit (Applied Biosystems).
DNA Sequencing
DNA sequencing was performed directly on PCR products using an ABI 3730 with the BigDye Taq FS Terminator V3.1. Sequencing was completed at the University of Pennsylvania DNA Sequencing Facility, and sequence identification was performed by BLAST at the National Center for Biotechnology Information web site (
Statistical Analysis
Data were analyzed using STATA 10.0 (Stata Corp., College Station, TX). Categorical variables were described using frequencies and percentages, and were compared using the chi‐square test. Continuous variables were described using mean, median, intraquartile range (IQR), and range values. Binomial exact 95% confidence intervals (CIs) were calculated for the proportion of positive blood and pleural fluid cultures and pleural fluid 16S rRNA PCR tests.
Results
During the study period, 124 patients with complicated pneumonia were identified; the median age was 4.9 years (IQR, 2.78.8 years) and the ratio of female to male patients was 1:1. The racial distribution was as follows: non‐Hispanic white, 62 (50%); non‐Hispanic black, 43 (34%); and Hispanic, 7 (6%). The median length of stay was 11 days (range, 240 days; IQR, 811 days). Forty‐one (33.1%) patients were admitted to the intensive care unit, and nine (7.3%) patients required mechanical ventilation. Overall, 5 of the 71 blood cultures performed (7.0%; 95% CI: 2.3%15.7%) were positive.
Pleural fluid drainage was performed in 64 (51.6%) patients. The median duration of antibiotic treatment before pleural fluid drainage was two days (IQR, 04 days). Differences in duration of antibiotic pretreatment between those with and without pleural fluid drainage were not significant. Patients received beta‐lactam agents (76.6%), clindamycin (51.6%), and vancomycin (23.4%) before pleural drainage. Blood cultures were performed in 27 (45.0%) of 60 patients not undergoing pleural fluid drainage; 2 of these 27 (7.4%; 95% CI: 0.9%24.3%) blood cultures were positive, and Streptococcus pneumoniae was isolated in both cases.
Using a combination of pleural fluid culture, blood culture, and broad‐range PCR, a microbiologic cause of infection was identified in 11 of 64 (17.2%; 95% CI: 8.9%28.7%) patients undergoing pleural fluid drainage (Figure 1). Patients with an identified bacterial cause were younger than those without an identified bacterial cause (Table 1). However, there were no statistically significant differences between the groups with and without identified bacteria with respect to sex, race, clinical examination findings and laboratory results at admission, duration of antibiotic therapy before pleural fluid drainage, or length of stay (Table 1). The median pleural fluid white blood cell count was 6880 per mm3 (IQR, 154227,918 per mm3).
| Causative Bacteria Identified | |||
|---|---|---|---|
| Demographics | Yes (n = 11) | No (n = 53) | P Value |
| |||
| Female sex | 3 (27.3%) | 29 (54.7%) | 0.10 |
| Age (years) | 2 (1.34.50) | 4.3 (3.1 8.1) | 0.03 |
| Race | 0.09 | ||
| Non‐Hispanic white | 3 (27.3%) | 29 (54.7%) | |
| Non‐Hispanic black | 7 (63.6%) | 13 (24.5%) | |
| Hispanic | 0 (0.0%) | 3 (5.6%) | |
| Other | 1 (9.1%) | 8 (15.1%) | |
| History of asthma | 2 (18.2%%) | 12 (22.6%) | 0.75 |
| Duration of antibiotics before drainage (days) | 0.5 (03) | 2 (04) | 0.43 |
| Intensive care unit admission | 7 (63.6%) | 25 (47.2%) | 0.32 |
| Initial temperature (C) | 37.8 (37.239.5) | 38.1 (37.639.3) | 0.76 |
| Initial oxygen saturation (%) | 94 (9397) | 95 (9396) | 0.97 |
| Peripheral white blood cell count (per mm3) | 21.4 (14.028.4) | 16.3 (10.922.6) | 0.12 |
| Platelet count (per mm3) | 434 (298546) | 402 (312575) | 0.95 |
Blood was obtained for culture from 44 (68.8%) of 64 patients that underwent pleural fluid drainage. Blood cultures were positive in three (6.8%; 95% CI: 1.4%18.7%) of these patients; causative bacteria were S. pneumoniae (n = 1), Haemophilus influenzae (n = 1), and Staphylococcus aureus (n = 1). Pleural fluid cultures were positive from 6 of 64 patients (9.3%; 95% CI: 3.5%19.3%) that underwent pleural fluid drainage; causative bacteria were Staphylococcus aureus (n = 5) and Streptococcus pneumoniae (n = 1). Three of the 19 pleural fluid samples (15.8%, CI 3.4%39.6%) tested by 16S rRNA PCR yielded positive results; S. pneumoniae was identified by DNA sequencing in all three of these samples (Figure 1). Of these three specimens, two had both negative Gram stains and negative pleural fluid cultures, while one specimen had Gram‐positive cocci in pairs identified on Gram stain along with a pleural fluid culture‐positive for S. pneumoniae. Of the 16 patients with negative PCR results, one was found to have a pleural fluid culture‐positive for S. aureus; no bacteria were detected on the pleural fluid Gram stain (Figure 1). Differences in the demographic characteristics between patients in whom broad‐range PCR was performed and not performed were not statistically significant (Table 2). Differences in the median length of hospital stay between patients who had PCR performed (9 days; IQR, 712 days) and those who did not (11 days; IQR, 914 days) were not statistically significant (P = 0.19). Antibiotic therapy was simplified from treatment with multiple antibiotics to a single antibiotic in each instance of a positive culture, though the number of positive cultures was too small to lead to meaningful reductions in antibiotic use or spectrum.
| PCR Performed | |||
|---|---|---|---|
| Demographics | Yes (N = 19) | No (N = 45) | P Value |
| |||
| Female sex | 9 (47.4) | 23 (51.1) | 0.78 |
| Age (years) | 4.9 (2.78.8) | 4.0 (2.88.1) | 0.76 |
| Race | 0.42 | ||
| Non‐Hispanic white | 10 (52.6%) | 22 (48.9%) | |
| Non‐Hispanic black | 5 (26.3%) | 15 (33.3%) | |
| Hispanic | 0 (0.0%) | 3 (6.7%) | |
| Other | 4 (21.1%) | 5 (11.1%) | |
| History of asthma | 5 (26.32%) | 9 (20.0%) | 0.58 |
| Duration of antibiotics before drainage (days) | 2 (03) | 1.5 (04) | 0.65 |
| Intensive care unit admission | 8 (42.1%) | 24 (53.3%) | 0.41 |
| Initial temperature (C) | 38.1 (37.339.4) | 38.0 (37.639.4) | 0.86 |
| Initial pulse oximetry (%) | 96 (9497) | 94 (9296) | 0.34 |
| Initial white blood cell count (1000 per mm3) | 16.1 (9.527.4) | 17.8 (12.622.8) | 0.93 |
| Platelet count (1000 per mm3) | 397 (312575) | 431 (303597) | 0.73 |
Discussion
Identification of the causative organism can improve the treatment of children with complicated pneumonia by enabling clinicians to target the infection with effective, narrow‐spectrum antibiotics. However, broad‐spectrum antibiotics are typically given before blood or pleural fluid samples are obtained, lowering the yield of conventional bacterial cultures. In our study, pleural fluid and blood cultures were infrequently positive. However, the use of 16S rRNA broad‐range PCR and DNA sequencing as ancillary tests only modestly improved our diagnostic yield.
Two prior studies have shown that broad‐range PCR analysis of pleural fluid can detect pathogenic organisms from pleural fluid even after the administration of antibiotics. Saglani et al.12 used bacterial culture and broad‐range PCR to analyze pleural fluid from 32 children with complicated pneumonia. Although the cohort had received a median of eight days of antibiotic therapy prior to fluid aspiration, a combination of broad‐range PCR and DNA sequencing identified organisms, predominantly S. pneumoniae, in 17 of 26 (65.4%) pleural fluid samples with negative culture. Five of the six culture‐positive samples also had positive PCR results, suggesting that a low proportion of the PCR results were false‐negatives. Le Monnier et al.13 cultured the pleural fluid from 78 children with complicated pneumonia; 15 samples were excluded from PCR testing because they grew bacteria other than S. pneumoniae. Broad‐range 16S rRNA PCR detected bacteria in 22 of 40 (55.0%) samples that were culture‐negative; subsequent DNA sequencing identified S. pneumoniae (n = 17), S. pyogenes (n = 3), S. aureus (n = 1), and H. influenzae (n = 1). S. pneumoniae was identified by 16S rRNA PCR followed by DNA sequencing in 20 of the 23 (87.0%) pleural fluid samples that grew S. pneumoniae on culture.
PCR with organism‐specific primers has also been shown to detect pathogenic bacteria in 35%70% of pleural fluid samples from patients with complicated pneumonia.15, 16 These rates of detection are comparable to the results of prior studies that used broad‐range PCR, and suggest that 16S rRNA and organism‐specific PCR are similarly sensitive tests.
Our study found that the proportion of positive results with broad‐range PCR was greater than the proportion observed with conventional pleural fluid culture. We were also able to identify S. pneumoniae by broad‐range PCR in two culture‐negative pleural fluid samples. The detection of S. pneumoniae by PCR in the setting of negative pleural fluid culture is not surprising, as most patients received empiric antibiotic therapy against S. pneumoniae before undergoing pleural fluid drainage. This prior antibiotic therapy would be expected to decrease the yield of pleural fluid culture but have a less significant impact on PCR. The reason for the failure to detect S. aureus by PCR from our clinical samples is not known. We explored whether this issue could be attributable to test characteristics during validation of our assay (as described in the technical Appendix), and S. aureus was consistently identified in pleural fluid samples spiked with S. aureus. While our diagnostic yield was low compared with prior studies that used broad‐range PCR, the distribution of causative bacteria was similar to prior studies of complicated pneumonia.9, 10 There were too few positive cultures among the specimens available for broad‐range PCR testing for us to reliably assess 16S rRNA PCR sensitivity and specificity. Thus, it was not possible to reliably assess the value of 16S rRNA PCR as an ancillary test in culture‐negative complicated pneumonia.
Several factors may have contributed to the low yield of broad‐range PCR in our study. First, all patients in our study received broad‐spectrum antibiotics prior to pleural fluid drainage; most patients received treatment with a beta‐lactam agent in combination with either clindamycin or vancomycin. Although PCR is less affected than culture by the prior administration of antibiotics, it is still possible that exposure to antibiotics accelerated degradation of the bacterial genome, thus decreasing the sensitivity of broad‐range PCR. The median duration of antibiotic therapy prior to drainage was shorter for patients in whom a bacterial pathogen was identified, compared with those in whom a pathogen was not identified. Though this difference was not statistically significant, this difference emphasizes that early pleural fluid collection may improve bacterial detection. The median duration of prior antibiotic therapy was eight days, in the study by Saglani et al.,12 however details regarding anti‐staphylococcal therapy were not reported. Second, several studies using 16S rRNA PCR in blood or cerebrospinal fluid (CSF) specimens for children with sepsis or meningitis, respectively, have noted decreased sensitivity for detection of Gram‐positive bacteria.1720 The cell wall composition makes Gram‐positive bacteria particularly difficult to lyse for DNA extraction. Prior studies used a different approach to DNA extraction compared with our study. Saglani et al.12 used the QIAmp minikit for DNA extraction (Qiagen Ltd, West Sussex, UK) and Le Monnier et al.13 used the MagnaPure System (Roche Diagnostics, Indianapolis, IN) for DNA extraction; additionally Saglani et al.12 included an additional 15 minutes of incubation at 95C following Proteinase K digestion to ensure complete lysis of the bacterial cells. We used the MagMAX Total Nucleic Acid Isolation Kit with a bead beating step to degrade the samples prior to lysis. It is unlikely that any of these differences contributed to differences in our study results. Third, human DNA may cause a nonspecific background signal, which could decrease PCR sensitivity. This issue may be particularly important in complicated pneumonia where the pleural fluid white blood cell counts are substantially elevated. Human DNA from white blood cells might be present at much higher concentrations than bacterial DNA, which would create a competitive advantage for binding of human, rather than bacterial, DNA on to the bead matrix.21 Saglani et al.12 did not report pleural fluid white blood cell counts for comparison. However, Le Monnier et al.13 reported pleural fluid white blood cell counts slightly higher than those observed in our patients. Thus, differences in pleural fluid white blood cell counts do not necessarily explain the differences in yield across studies. Fourth, while the universal primers used in our study have been validated, including for detection of S. aureus, in previous studies,14 Saglani et al.12 and Le Monnier et al.13 each used a different set of primers. It is unclear whether or not the choice of different primers affected the microbiologic yield.
An important limitation of this study is the relatively small number of patients with pleural fluid available for PCR testing combined with the low PCR yield. This limitation may have caused us to underestimate the true benefit of 16S rRNA PCR as an ancillary diagnostic test, as suggested by the wide confidence intervals around the estimates of PCR yield. Additionally, not all patients underwent pleural drainage, and not all patients undergoing pleural drainage had pleural fluid available for PCR testing. The latter issue would likely have only minimal impact on our study results, as there were no differences in demographics or clinical or laboratory features among those with and without pleural fluid available for PCR testing. However, differences among physicians, and across institutions, may play an important role in the decision to perform pleural drainage. We do not know whether patients undergoing pleural drainage at our institution were more or less likely to have bacteria detected by PCR than patients not undergoing drainage. If they were more likely to have bacteria detected, then our study would underestimate the benefit of PCR as an adjunct diagnostic test. However, there was no difference in the duration of antibiotic pretreatment between these two groups, and the yield from blood culture was similar.
In conclusion, blood and pleural fluid cultures infrequently identify the causative bacteria in children with complicated pneumonia. The use of broad‐range PCR increased the microbiologic yield only modestly. Further refinements to improve the diagnostic accuracy of broad‐range PCR testing are needed before this technique can be recommended for widespread use in clinical practice.
Appendix
Optimization and Validation of The 16S Assay
The assay was optimized for use with pleural fluid samples as follows. E. coli (ATCC 25922) and S. aureus (ATCC 29213) were grown overnight in 100 ml Brain Heart Infusion (BHI) broth. A suspension equivalent to a 0.5 MacFarland standard was prepared and was taken to represent approximately 1 108 colony‐forming units/mL. To prepare standard PCR curves, 1 in 10 dilutions were prepared in PBS (pH, 7.4) and DNA was extracted, in triplicate, using two different DNA extraction methods: the MagMAX Total Nucleic Acid Isolation Kit and the PrepMan Ultra Sample Preparation reagent system (Applied Biosystems, Foster City, CA), as described by the manufacturer. For the MagMax extraction, a 300 microliter sample was added to 200 microliters of lysis/binding solution in a bead tube. Samples were disrupted using a vortex adapter for 15 minutes at the highest setting. Tubes were then centrifuged at 16,000 relative centrifugal force (RCF) for three minutes. DNA extraction was performed using the KingFisher Flex Automated Purification System (Thermo Scientific). For the PrepMan Ultra extraction, a 300‐l sample was centrifuged for three minutes at 16,000 RCF. The supernatant fluid was discarded and the pellet was resuspended in 100 microliters of PrepMan Ultra Lysis Buffer and incubated at 100C for ten minutes. The sample was centrifuged for three minutes at 16,000 RCF, and a 10‐microliter aliquot of supernatant fluid was added to 90 microliters of nuclease free water. All DNA extracts were frozen at 20C prior to use. Plate counts, performed from the bacterial suspensions in triplicate, revealed approximately 1.3 108 colony‐forming units/mL in the original suspensions.
Pleural fluid samples were spiked with known concentrations (1, 3, 10, 30, 100, 300, and 1000 colony‐forming units/mL) of E. coli and S. aureus, and each sample was extracted five times with both DNA extraction systems. Each DNA extract was amplified on an Applied Biosystems 7500 thermal cycler (ABI) and a SmartCycler (Cepheid, Sunnyvale, CA). Analysis of the results obtained from the preliminary experiments indicated that the following combination of DNA extraction and PCR was optimal, and these conditions were used for all patient samples.
DNA was extracted from a 300‐microliter aliquot of pleural fluid using the MagMAX Total Nucleic Acid Isolation Kit (Ambion, Applied Biosystems) as described by the manufacturer. PCR was performed on an Applied Biosystems 7500 thermal cycler (ABI) using the primers, 16S F: 5‐GCT GTC ATC TCT TGT GGG CTG T‐3, 16S R: 5‐AAA CTC ATG GGA GCT GCT GGT T‐3, and the fluorescent labeled TaqMan probe, 16s Probe: 5‐Cy5/CCT GTC ATG CCC ACA CAA ATC TCT CC/BHQ‐2‐3. Human DNA (0.5 nanograms) was added to each assay to ensure that an adequate amount of human DNA was available to act as an internal amplification control. The primers, AlbICF: 5‐GCT GTC ATC TCT TGT GGG CTG T‐3, AlbICR: 5‐AAA CTC ATG GGA GCT GCT GGT T‐3, and the TaqMan probe, AlbICP: 5‐Cy5/CCT GTC ATG CCC ACA CAA ATC TCT CC/BHQ‐2‐3 detect a region of the human albumin gene. Amplification was performed as follows: initial denaturation of 94C for 20 seconds, followed by 35 cycles of 94C for 10 seconds, 61C for 31 seconds, and 72C for 5 seconds. Each run included positive (E. coli ATCC 25922 DNA) and negative (nuclease free water) controls. A cycle threshold value of 30 or less indicated a positive sample. All positive samples were confirmed using the MicroSeq 500 16S rDNA Bacterial Identification kit (Applied Biosystems).
- ,,, et al.An epidemiological investigation of a sustained high rate of pediatric parapneumonic empyema: risk factors and microbiological associations.Clin Infect Dis.2002;34:434–440.
- ,,,,.Primary early thoracoscopy and reduction in length of hospital stay and additional procedures among children with complicated pneumonia: results of a multicenter retrospective cohort study.Arch Pediatr Adolesc Med.2008;162:675–681.
- ,,, et al.Pulmonary manifestations in children with invasive community‐acquired Staphylococcus aureus infection.Clin Infect Dis.2005;41:583–590.
- ,,, et al.Association between Staphylococcus aureus strains carrying gene for Panton‐Valentine leukocidin and highly lethal necrotising pneumonia in young immunocompetent patients.Lancet.2002;359:753–759.
- ,,, et al.Severe community‐onset pneumonia in healthy adults caused by methicillin‐resistant Staphylococcus aureus carrying the Panton‐Valentine leukocidin genes.Clin Infect Dis.2005;40:100–107.
- ,.Empyema hospitalizations increased in US children despite pneumococcal conjugate vaccine.Pediatrics.2010;125:26–33.
- ,,,.Increasing incidence of empyema complicating childhood community‐acquired pneumonia in the United States.Clin Infect Dis.2010;50:805–813.
- ,,,,.National hospitalization trends for pediatric pneumonia and associated complications.Pediatrics.2010;126:204–213.
- ,,, et al.Thoracoscopic decortication vs tube thoracostomy with fibrinolysis for empyema in children: a prospective, randomized trial.J Pediatr Surg.2009;44:106–111.
- ,,, et al.Comparison of urokinase and video‐assisted thoracoscopic surgery for treatment of childhood empyema.Am J Respir Crit Care Med.2006;174:221–227.
- ,.Development of broad‐range 16S rDNA PCR for use in the routine diagnostic clinical microbiology service.J Med Microbiol.2003;52:685–691.
- ,,,.Empyema: the use of broad range 16S rDNA PCR for pathogen detection.Arch Dis Child.2005;90:70–73.
- ,,, et al.Microbiological diagnosis of empyema in children: comparative evaluations by culture, polymerase chain reaction, and pneumococcal antigen detection in pleural fluids.Clin Infect Dis.2006;42:1135–1140.
- ,,,.Determination of bacterial load by real‐time PCR using a broad‐range (universal) probe and primers set.Microbiology.2002;148:257–266.
- ,,,,,.Pneumolysin polymerase chain reaction for diagnosis of pneumococcal pneumonia and empyema in children.Eur J Clin Microbiol Infect Dis.2006;25:783–789.
- ,,, et al.Pleural fluid PCR method for detection of Staphylococcus aureus, Streptococcus pneumoniae and Haemophilus influenzae in pediatric parapneumonic effusions.Respiration.2008;75:437–442.
- ,.16S rRNA gene sequencing for bacterial identification in the diagnostic laboratory: pluses, perils, and pitfalls.J Clin Microbiol.2007;45:2761–2764.
- ,,,,.Evaluating the near‐term infant for early onset sepsis: progress and challenges to consider with 16S rDNA polymerase chain reaction testing.J Mol Diagn.2006;8:357–363.
- ,,,,.Preanalytic removal of human DNA eliminates false signals in general 16S rDNA PCR monitoring of bacterial pathogens in blood.Comp Immunol Microbiol Infect Dis.2009;32:207–219.
- ,,,,.Use of broad range16S rDNA PCR in clinical microbiology.J Microbiol Methods.2009;76:217–225.
- ,.Real‐time polymerase chain reaction for detecting bacterial DNA directly from blood of neonates being evaluated for sepsis.J Mol Diagn.2005;7:575–581.
Copyright © 2011 Society of Hospital Medicine

Insurance and LOS for Children With CAP
Disparities in patterns of care and outcomes for ambulatory‐care sensitive conditions remain a persistent problem for children.19 Many studies have focused on disparities in hospitalization rates and length of stay (LOS) related to asthma, however, few studies have focused on community‐acquired pneumonia (CAP) despite the fact that pneumonia is the most common, preventable, and potentially serious infection in childhood.10 Providers, payers, and families have a common interest in minimizing hospital LOS for different reasons (eg, minimizing costs, lost wages, exposure to antibiotic‐resistant bacteria), however, this interest is balanced against the potentially greater risk of readmission and adverse outcomes if LOS is inappropriately short. To date, the relationship between insurance status and LOS for CAP remains unexplored.
As in other conditions, substantial variation exists with respect to patterns of care and outcomes for children hospitalized with CAP.11 For example, children hospitalized in rural settings have a shorter LOS for pneumonia than those hospitalized in large urban settings.12 Children from racial/ethnic minorities tend to have higher rates of CAP‐associated complications, including death.11 Decades of prior studies have documented that uninsured children are less likely than insured children to make preventive care visits and obtain prescription medications, but differences in LOS or hospitalization rates between insured and uninsured children with CAP have not been studied.6, 8, 13, 14 Though imperfect, insurance status is 1 proxy for healthcare access, and current healthcare reform efforts aim to improve healthcare access and decrease socioeconomic gradients in health by increasing the number of insured American children. Nonetheless, quantifying the relationship between insurance status on LOS for children hospitalized with CAP is a first step towards understanding the influence of ambulatory care access on hospitalization for ambulatory‐care sensitive conditions.
The purpose of this study was to investigate the influence of insurance status and type on LOS for children hospitalized with CAP. In addition, we sought to determine if there were consistent trends over time in the association between insurance status and type with LOS for children hospitalized with CAP.
METHODS
Study Design and Data Source
This retrospective cross‐sectional study used data from the 1997, 2000, 2003, and 2006 Kids' Inpatient Database (KID). The KID is part of the Healthcare Cost and Utilization Project sponsored by the Agency for Healthcare Research and Quality (AHRQ). It is the only dataset on hospital use and outcomes specifically designed to study children's use of hospital services in the United States. The KID samples pediatric discharges from all community non‐rehabilitation hospitals in states participating in the Healthcare Cost and Utilization Project, using a complex stratification system, across pediatric discharge type and hospital characteristics. Community hospitals in the KID are defined as all non‐federal, short‐term, general and other specialty hospitals, including academic medical centers, obstetrics‐gynecology, otolaryngology, orthopedic, and children's hospitals. Federal hospitals, long‐term hospitals, psychiatric hospitals, alcohol/chemical dependency treatment facilities and hospitals units within institutions are excluded. Discharge‐level weights assigned to discharges within the stratum permit calculation of national estimates. Datasets, which each contain approximately 3 million discharges (unweighted), are released every 3 years beginning with 1997. The 2006 KID is the most recently available dataset and contains hospital administrative data from 38 states, representing 88.8% of the estimated US population.15 This study was considered exempt from review by the Committees for the Protection of Human Subjects at The Children's Hospital of Philadelphia.
Study Participants
Patients 18 years of age and younger were eligible for inclusion if they required hospitalization for CAP in 1997, 2000, 2003, or 2006. Using a previously validated algorithm, patients were considered as having CAP if they met 1 of 2 criteria: 1) International Classification of Diseases, 9th Revision, Clinical Modification (ICD‐9 CM) primary diagnosis code indicating pneumonia (480‐483, 485‐486), empyema (510), or pleurisy (511.0‐1, 511.9); or 2) primary diagnosis of pneumonia‐related symptom (eg, cough, fever, tachypnea) and secondary diagnosis of pneumonia, empyema or pleurisy. Pneumonia‐related symptoms included fever, respiratory abnormality unspecified, shortness of breath, tachypnea, wheezing, cough, hemoptysis, abnormal sputum, chest pain, and abnormal chest sounds.16 Because there is no specific ICD‐9 code for nosocomial pneumonia, this previously validated approach minimized such misclassification16 (eg, a child hospitalized following traumatic injury who then develops ventilator‐associated pneumonia is likely to have trauma, rather than pneumonia or a pneumonia‐related symptom, listed as the primary diagnosis). Patients with the following comorbid conditions (identified by KID data elements and ICD‐9 CM codes) were excluded as these comorbidities are characterized by risk factors not reflective of the general pediatric population: acquired and congenital immunologic disorders, malignancy, collagen vascular disease, sickle cell disease, cystic fibrosis, organ transplant, congenital heart defects, and heart failure. Patients identified as in‐hospital births were excluded to minimize the inclusion of perinatally acquired and nosocomial infections occurring in neonates. Patients with a secondary diagnosis code indicating trauma were also excluded, as a diagnosis of pneumonia in this population likely reflects nosocomial etiology. CAP‐related complications (eg, effusion, abscess; for complete list, see Supporting Appendix A in the online version of this article) were identified using ICD‐9 CM diagnosis and procedure codes. Asthma‐related hospitalizations were identified using ICD‐9 CM diagnosis code 493 in any secondary diagnosis field.
Primary Exposure
The primary exposure was insurance type, categorized as private, public, uninsured, or other (eg, Civilian Health and Medical Program Uniform Service (CHAMPUS), worker's compensation, union‐based insurance, but definition varies by state precluding categorization as purely public or private).
Primary Outcome
The primary outcome was the hospital LOS calculated in days.
Statistical Analysis
Consistent with prior work,12 subjects were characterized by age, race, sex, the presence or absence of a pneumonia‐associated complication, discharge status (discharge from hospital vs in‐hospital death), hospital type (rural, urban non‐teaching, urban teaching non‐children's, urban teaching children's), and hospital region (Northeast, Midwest, South, West). Age groups for analysis were defined as <1 year (infant), 1 to 5 years (preschool age), 6 to 11 years (school‐age), and 12 to 18 years old (adolescent). Race was recorded as a single variable (white, black, other, and missing). Patient information for race was missing from 32% of discharges in 1997, 18% in 2000, 29% in 2003, and 26% in 2006. Patients with missing race data were included to preserve the integrity of our estimates. Categorical variables were summarized by frequencies and percents. Continuous variables were summarized by mean and standard deviation values.
All analyses accounted for the complex sampling design with the survey commands included in STATA, version 10 (College Station, TX) to produce weighted estimates. To determine the adjusted impact of patient and hospital‐level characteristics in our cohort, we constructed multivariable negative binomial regression models using all available covariates for LOS because of its rightward‐skewed distribution. The negative binomial model produced an incident rate ratio (IRR) for LOS (IRR >1 indicates that the risk factor is associated with a longer length of stay). As recommended in the AHRQ technical documentation, variance estimates for each model accounted for the clustering of data at the hospital level. To address the impact of missing race data on outcome, we constructed additional multivariable negative binomial regression models while varying the underlying assumptions about race classification. In these secondary analyses, children with race coded as missing were sequentially excluded, assumed to be white, and assumed to be black. These analyses were repeated after excluding insurance from the multivariable model.
RESULTS
The more than 10.5 million children sampled (unweighted) in KID during these 4 time periods (1997, 2000, 2003, and 2006) are representative of the more than 28.9 million children hospitalized in the United States. In each of these sample years, there were approximately 150,000 children hospitalized with pneumonia across the United States (Table 1). Of those hospitalized, 23% to 28% had a concomitant diagnosis of asthma; 6% to 8% had a pneumonia‐associated complication; and mortality was <0.01% in each sample year for patients hospitalized with pneumonia. In all years, among those with racial/ethnic data, the sample population was predominantly white boys less than 6 years old. The greatest proportion of children were hospitalized in urban non‐teaching settings, and also those children living in the southern regions of the United States.
| 1997 | 2000 | 2003 | 2006 | |
|---|---|---|---|---|
| N = 148,702 | N = 157,847 | N = 157,743 | N = 156,810 | |
| ||||
| Race | ||||
| White | 56,348 (38) | 68,643 (44) | 54,903 (35) | 56,108 (36) |
| Black | 22,864 (15) | 22,580 (14) | 17,960 (11) | 18,800 (12) |
| Other | 22,203 (15) | 38,448 (24) | 39,138 (25) | 40,803 (26) |
| Missing | 47,287 (32) | 28,175 (18) | 45,588 (29) | 41,099 (26) |
| Age category | ||||
| <1 year | 43,851 (29) | 44,470 (28) | 37,798 (24) | 37,705 (24) |
| 1 through 5 years | 75,033 (50) | 76,385 (48) | 77,530 (49) | 79,519 (51) |
| 6 through 11 years | 19,372 (13) | 21,403 (14) | 23,126 (15) | 23,494 (15) |
| >12 years | 10,446 (7) | 15,589 (9) | 19,289 (12) | 16,092 (10) |
| Hospital type | ||||
| Urban non‐teaching | 52,756 (35) | 50,718 (32) | 52,552 (34) | 50,718 (32) |
| Rural | 47,910 (32) | 41,715 (27) | 39,605 (26) | 31,947 (21) |
| Urban teaching non‐children's | 20,378 (14) | 30,981 (20) | 28,432 (18) | 30,194 (20) |
| Urban teaching children's | 27,658 (19) | 34,021 (22) | 34,454 (22) | 41,035 (27) |
| Male sex | 83,291 (56) | 8,783 (56) | 86,034 (55) | 85,508 (55) |
| Region* | ||||
| Northeast | 19,750 (13) | 26,092 (17) | 23,867 (15) | 23,832 (15) |
| Midwest | 33,053 (22) | 30,706 (19) | 35,714 (23) | 35,900 (23) |
| South | 68,958 (46) | 68,663 (44) | 65,994 (42) | 65,460 (42) |
| West | 26,741 (18) | 32,385 (21) | 32,169 (20) | 31,618 (20) |
| Asthma | 26,971 (24) | 31,746 (28) | 27,729 (24) | 26,822 (23) |
| Pneumonia‐associated complication | 8,831 (6) | 11,084 (7) | 12,005 (8) | 11,724 (7) |
| Died | 334 (0.002) | 394 (0.002) | 270 (0.002) | 193 (0.001) |
| Insurance | ||||
| Private | 65,428 (44) | 73,528 (47) | 68,720 (44) | 63,997 (41) |
| Public | 68,024 (46) | 71,698 (45) | 76,779 (49) | 80,226 (51) |
| Uninsured | 9,922 (7) | 8,336 (5) | 6,381 (4) | 6,912 (4) |
| Other | 4,964 (3) | 4,285 (3) | 5,391 (3) | 5,283 (3) |
There was little variation in the insurance status of children hospitalized with CAP between 1997 and 2006. In each of the sampled years, at least 40% of sampled children were privately insured, at least 40% were publicly insured, and approximately 5% were uninsured (Table 1). In all years, there were significant racial/ethnic disparities in insurance coverage such that whites were 4 to 6 times more likely to have private insurance than blacks, however, the large amount of missing race/ethnicity data warrant caution in interpreting this finding (Table 2; also see Supporting Information Appendix B in the online version of this article). We also found that children less than 1 year old were the most likely to be publicly insured in all years (see Supporting Appendix C in the online version of this article). There were also regional differences related to insurance coverage such that a greater proportion of children hospitalized in facilities located in the southern part of the United States were publicly insured. Notably, there were no significant differences in CAP‐associated mortality or asthma related to insurance coverage (Table 2). In 2006, CAP‐associated complications occurred in 8.5% of children with private insurance, 6.5% of children with public insurance, and 7.7% of uninsured children; the relative distribution of complications by insurance type were similar in previous years of the KID survey.
| Private | Public | Uninsured | Other Insurance | P | |
|---|---|---|---|---|---|
| |||||
| No. of children (%) | 63,997 (41) | 80,226 (51) | 6,912 (4) | 5,283 (3) | |
| Male sex | 34,639 (41) | 44,140 (52) | 3,727 (4) | 2,808 (3) | 0.092 |
| Race | |||||
| White | 30,707 (55) | 21,282 (38) | 2,241 (4) | 1,774 (3) | <0.001 |
| Black* | 5,112 (27) | 12,239 (65) | 988 (5) | 426 (3) | |
| Other | 11,033 (27) | 26,489 (65) | 2,112 (5) | 1,076 (3) | |
| Missing | 17,145 (42) | 20,216 (49) | 1,572 (4) | 2,007 (4) | |
| Age category | |||||
| <1 year | 10,788 (29) | 24,762 (65) | 1,164 (3) | 880 (3) | <0.001 |
| 1 through 5 years | 33,664 (42) | 39,531 (50) | 3,442 (4) | 2,673 (3) | |
| 6 through 11 years | 11,660 (50) | 9,684 (41) | 1,085 (5) | 1,015 (4) | |
| >12 years | 7,885 (49) | 6,249 (39) | 1,221 (8) | 714 (4) | |
| Hospital type | |||||
| Urban non‐teaching | 22,429 (44) | 24,241 (49) | 2,440 (5) | 1,555 (2) | <0.001 |
| Rural | 10,880 (34) | 18,396 (58) | 1,290 (4) | 1,109 (3) | |
| Urban teaching non‐children's | 13,130 (44) | 14,542 (48) | 1,721 (6) | 750 (2) | |
| Urban teaching children's | 16,591 (40) | 21,544 (53) | 1,417 (3) | 1,465 (4) | |
| Region | |||||
| Northeast | 12,364 (52) | 9,620 (40) | 1,466 (6) | 377 (2) | <0.001 |
| Midwest∥ | 17,891 (50) | 15,573 (43) | 1,160 (3) | 1,215 (3) | |
| South∥ | 21,479 (33) | 38,112 (58) | 3,108 (5) | 2,495 (4) | |
| West∥ | 12,263 (39) | 16,921 (44) | 1,178 (5) | 1,195 (5) | |
| Asthma | 10,829 (41) | 13,923 (52) | 1,119 (4) | 866 (3) | 0.193 |
| Pneumonia‐associated complication | 5,416 (46) | 5,206 (45) | 532 (4) | 556 (5) | <0.001 |
| Died | 66 (34) | 115 (60) | 3 (1) | 8 (5) | 0.131 |
After examining the general and demographic characteristics, we then examined mean LOS for all children with CAP in each sample year (Table 3). The mean LOS for children with CAP was 3.44 days in 1997, with marginal decreases in subsequent years to a mean LOS of 3.18 days in 2006. The distribution of LOS for children with CAP revealed that nearly 70% of children were hospitalized for fewer than 3 days, another 22% to 28% were hospitalized for less than 1 week, and only 3% were hospitalized for more than 1 week. This distribution did not change substantially between 1997 and 2006. Next, we compared mean LOS by insurance type and race/ethnicity in unadjusted analyses. In each sample year, publicly insured children hospitalized with CAP had significantly longer LOS than privately insured children (P < 0.001). Similarly, in all years excepting 1997, uninsured children hospitalized with CAP had significantly shorter LOS than privately insured children. There were also significant racial differences in LOS for children with CAP, such that black children had longer LOS than white children with CAP. However, the large amount of missing data for race/ethnicity limited the robustness of this finding, and subsequent sensitivity analyses demonstrated that there were no consistent racial/ethnic disparities in LOS (see Supporting Appendix B in the online version of this article). These sensitivity analyses for missing race data did not alter our primary finding of shorter LOS for uninsured versus publicly or privately insured children.
| 1997 | P | 2000 | P | 2003 | P | 2006 | P | |
|---|---|---|---|---|---|---|---|---|
| ||||||||
| Overall | 3.44 (0.04) | 3.35 (0.05) | 3.27 (0.05) | 3.18 (0.04) | ||||
| Insurance type | ||||||||
| Private | 3.21 (0.04) | 3.19 (0.04) | 3.09 (0.04) | 3.00 (0.03) | ||||
| Public | 3.71 (0.06) | <0.001 | 3.57 (0.06) | <0.001 | 3.44 (0.06) | <0.001 | 3.34 (0.05) | <0.001 |
| Uninsured | 3.18 (0.14) | 0.792 | 2.92 (0.07) | <0.001 | 2.80 (0.05) | <0.001 | 2.82 (0.05) | <0.001 |
| Other | 3.32 (0.11) | 0.319 | 3.55 (0.14) | 0.0134 | 3.54 (0.21) | 0.037 | 3.42 (0.13) | 0.001 |
| Race | ||||||||
| White | 3.31 (0.05) | 3.18 (0.04) | 3.19 (0.05) | 3.10 (0.04) | ||||
| Black | 3.61 (0.08) | <0.001 | 3.32 (0.07) | <0.001 | 3.36 (0.08) | <0.001 | 3.31 (0.07) | <0.001 |
| Other | 3.96 (0.11) | <0.001 | 3.81 (0.09) | <0.001 | 3.67 (0.10) | <0.001 | 3.56 (0.08) | <0.001 |
| Missing | 3.27 (0.08) | 0.645 | 3.18 (0.08) | 0.926 | 2.99 (0.06) | 0.0134 | 2.86 (0.04) | <0.001 |
After controlling for child age, race/ethnicity, gender, hospital type, transfer status, and presence of asthma or pneumonia‐associated complications, our multivariable analyses examining the relationship between insurance coverage and hospital LOS yielded the following results (Table 4). First, publicly insured children had significantly longer hospital stays than privately insured children, and uninsured children had significantly shorter hospital stays than privately insured children in all years except 1997. Second, children admitted with CAP at urban teaching children's hospitals had significantly longer LOS than those admitted to urban non‐teaching hospitals, and, in 2003, children admitted with CAP to rural hospitals had significantly shorter LOS than those admitted to urban non‐teaching hospitals. Third, children older than 1 year consistently had shorter hospital stays than infants less than 1 year old. Finally, though concomitant diagnosis of asthma did not consistently influence LOS, children who developed any complications had significantly longer LOS than those who did not. The cumulative impact of seemingly small differences in LOS is great. For example, in 2006, our model suggests that, for every 1000 children hospitalized with CAP in a given year, after adjusting for differences in sex, age, race, hospital‐type, region, transfer status, and diagnosis of asthma or complications, publicly insured children spend 90 to 130 more days in the hospital than privately insured children, whereas uninsured children spend between 40 to 90 fewer days in the hospital than privately insured children.
| 1997 | 2000 | 2003 | 2006 | |
|---|---|---|---|---|
| Variable | IRR (95% CI) | IRR (95% CI) | IRR (95% CI) | IRR (95% CI) |
| ||||
| Age category | ||||
| <1 year | ||||
| 15 years | 0.82 (0.81, 0.84) | 0.83 (0.88, 0.95) | 0.86 (0.85, 0.88) | 0.87 (0.86, 0.89) |
| 611 years | 0.91 (0.87, 0.95) | 0.91 (0.88, 0.94) | 0.93 (0.91, 0.95) | 0.93 (0.90, 0.95) |
| >12 years | 1.03 (0.99, 1.07) | 1.17 (1.11, 1.22) | 1.09 (1.06, 1.13) | 1.13 (1.09, 1.16) |
| Race | ||||
| White | ||||
| Black | 1.04 (0.99, 1.08) | 1.00 (0.95, 1.03) | 1.00 (0.98, 1.03) | 1.02 (0.98, 1.06) |
| Other | 1.09 (1.05, 1.13) | 1.11 (1.08, 1.15) | 1.09 (1.06, 1.12) | 1.08 (1.05, 1.11) |
| Missing | 1.00 (0.94, 1.06) | 1.01 (0.96, 1.06) | 0.95 (0.92, 0.99)* | 0.96 (0.93, 0.99) |
| Sex | ||||
| Female | 1.02 (0.94, 1.06) | 1.01 (0.99, 1.02) | 1.01(0.93, 100) | 1.01 (1.00, 1.02) |
| Insurance type | ||||
| Private | ||||
| Public | 1.13 (1.11, 1.16) | 1.11 (1.09, 1.14) | 1.11 (1.09, 1.13) | 1.11 (1.09, 1.13) |
| Uninsured | 1.01 (0.91, 1.11) | 0.93 (0.89, 0.96) | 0.92 (0.90, 0.96) | 0.94 (0.91, 0.96) |
| Other | 1.01 (0.96, 1.06) | 1.10 (1.03, 1.18) | 1.10 (1.02, 1.19)* | 1.07 (1.02, 1.13) |
| Hospital type | ||||
| Urban non‐teaching | ||||
| Rural | 0.98 (0.92, 1.04) | 0.96 (0.92, 1.00) | 0.97 (0.94, 1.00) | 0.97 (0.93, 1.00) |
| Urban teaching (non‐children's) | 0.99 (0.95, 1.04) | 1.06 (1.02, 1.10) | 1.06 (1.02, 1.10) | 1.03 (0.99, 1.07) |
| Urban teaching children's | 1.2 (1.14, 1.26) | 1.23 (1.16, 1.30) | 1.28 (1.21, 1.37) | 1.25 (1.19, 1.31) |
| Region | ||||
| Northeast | ||||
| Midwest | 0.93 (0.88, 0.98)* | 0.96 (0.92, 1.00) | 0.95 (0.91, 0.99)* | 0.95 (0.91, 0.99)* |
| South | 0.98 (0.94, 1.02) | 1.06 (1.02, 1.10)* | 1.04 (1.00, 1.09) | 1.03 (0.98, 1.08) |
| West | 0.97 (0.92, 1.01) | 1.22 (1.16, 1.30)* | 1.02 (0.97, 1.08) | 1.06 (1.00, 1.12)* |
| Transfer status | ||||
| Transfer | 1.35 (1.25, 1.46) | 1.39 (1.27, 1.52) | 1.31 (1.23, 1.37 ) | 1.16 (1.10, 1.23) |
| Asthma | 0.99 (0.96, 1.03) | 0.97 (0.95, 0.99) | 0.98 (0.96, 1.00) | 0.98 (0.97, 1.00)* |
| Pneumonia Complications | 0.99 (0.96, 1.03) | 0.97 (0.95, 0.99)* | 0.98 (0.96, 1.0) | 0.98 (0.97, 1.00)* |
| Any complication | 2.20 (2.07, 2.34) | 2.23 (2.07, 2.40) | 2.22 (2.22, 2.44) | 2.37 (2.27, 2.47) |
DISCUSSION
In this nationally representative sample selected over the past 10 years, we found that publicly insured children hospitalized with CAP have significantly longer LOS than those who are privately insured, and that, since 2000, uninsured children hospitalized with CAP have significantly shorter LOS than those who are privately insured. Though these observed differences are small, they are consistent across all 4 sampled years and, because CAP is one of the most common pediatric inpatient diagnoses, the cumulative impact of the observed differences on hospital LOS is great. Insurance status is often considered a proxy for access to preventive and ambulatory healthcare services or socioeconomic status. However, the underlying mechanisms relating insurance status to healthcare access, utilization, and ultimately, health outcomes are highly complex and difficult to elucidate.17 The observed variation in this study raises questions about the potential influence of insurance status on hospital discharge practices. Additional research is necessary to understand whether there are differences in processes of care (eg, performance of blood cultures or chest radiographs), quality of care, or other outcomes, such as readmissions, related to CAP inpatient management for children with different insurance coverage.
Apart from differences in hospital discharge practices, another possible explanation for uninsured children with CAP having shorter LOS is that these children have less severe disease than privately insured. This may occur if uninsured children with CAP are evaluated in the emergency department rather than the office setting, because emergency department providers may be more likely to admit children with CAP who lack a consistent access to ambulatory primary care services. Countering this alternative, prior studies have shown that uninsured groups are more likely to have greater disease severity than privately insured groups at the time of hospital admission.18, 19 In this study, we attempted to identify children with greater severity of disease using ICD‐9 codes for CAP‐associated complications. Though this is a relatively crude method that might lead to an underestimate of the total number of children with complications, we found that there were no significant differences in the prevalence of CAP‐associated complications between uninsured and insured groups in all sampled years.
On the other hand, uninsured patients may be released earlier by providers in order to reduce the amount of uncompensated care provided, or possibly because parents may urge providers to discharge their children, given their inability to pay forthcoming hospital bills and/or avoid further lost wages due to work absence.20, 21 In California, Bindman et al. demonstrated that decreasing the frequency of Medicaid recertification, and consequently increasing the likelihood of continuous insurance coverage, was associated with a decreased risk of hospitalization for ambulatory‐care sensitive conditions.5
We also found that children admitted to urban teaching children's hospitals with CAP had significantly longer LOS than those admitted to urban non‐teaching hospitals, whereas children in rural hospitals had significantly shorter LOS than those in urban non‐teaching hospitals in 2003. These findings are consistent with prior data from 1996 to1998 demonstrating that children admitted to rural hospitals in New York and Pennsylvania had significantly shorter LOS than large urban hospitals for 19 medical and 9 surgical conditions, including pneumonia.12 These findings may reflect underlying differences in between rural and urban hospital transfer practices, whereby rural hospitals may be more likely than urban hospitals to transfer children with relatively more severe illness to urban referral centers and retain children with less severe illness, leading to shorter LOS.12 Though our empiric understanding of differences in LOS between teaching and non‐teaching hospitals is currently limited, clinical experience supports the notion that there may be decreases in efficiency that occur in teaching hospitals, and are a result of the supervision required for care provided by trainees. It is also possible that, despite our exclusion of comorbid conditions, some children with complex or chronic medical conditions were included in this study. These children are often cared for at teaching hospitals, regardless of the primary cause for admission, and are more likely to have public insurance than other children, thus confounding the relationship between hospital type, insurance type and status, and LOS for children with CAP. The limitations of this dataset preclude further examination of this issue.
There are some limitations to this study. First, the KID data are cross‐sectional and causal inferences are limited. However, our results demonstrating that uninsured children hospitalized with CAP had shorter LOS than privately insured children were quite consistent in each sample year, suggesting that our results are a true association. Additionally, insurance status in KID is typically collected at admission, however, it is not possible to determine whether specific changes to insurance status that occurred during the hospitalization were applied to the data. The impact of this limitation would depend on the type of insurance obtained by the patient. If uninsured patients obtained public insurance, our study would underestimate the increased LOS for publicly insured patients, compared with privately insured patients, but have no effect on the difference in LOS between uninsured and privately insured patients. In the unlikely event that uninsured patients obtained private insurance, then our study would underestimate the difference for uninsured patients, compared with privately insured patients, biasing our current study results towards the null. Second, a substantial proportion of sampled children had missing data for race/ethnicity. To assess the impact of the missing race/ethnicity data on our results, we conducted sensitivity analyses and found that, though difficult to make any definitive conclusions about the relationship between race/ethnicity and LOS for children with CAP, there were no changes to our primary findings regarding differences in LOS between children with different insurance status and type. Third, KID does not include data about other unmeasured confounders (eg, parent income, parent education, regular source of care) that might be related to LOS, as well as a broad spectrum of pediatric outcomes. Serious consideration of expanding KID to include these variables is warranted. Fourth, the other category of insurance is not uniformly coded across states in the KID database. While some states use this category to classify public insurance options other than Medicare and Medicaid, other states include private insurance options in this group. Thus, it is possible that some patients with public insurance are misclassified as having other insurance. We would expect such misclassification to bias our findings towards the null hypothesis. Finally, we focused on the relationship between child health insurance status and CAP, only 1 ambulatory care‐sensitive condition. Additional research examining the relationship between insurance type and other ambulatory care‐sensitive conditions is warranted.
In summary, we found that, after multivariable adjustment, uninsured children hospitalized with community‐acquired pneumonia had significantly shorter LOS than privately insured children, and publicly insured children had a significantly longer hospital stay than privately insured children in these 4 nationally representative samples from 1997 to 2006. Current federal and state efforts to increase enrollment of children into insurance programs are a first step in reducing healthcare disparities. However, insurance coverage alone does not guarantee access to healthcare, thus, these efforts in isolation will likely be insufficient to achieve optimal health for the children of our country. As healthcare reform legislation is implemented, these findings provide hospitals and policy makers additional impetus to develop ways to achieve the ideal length of stay for every child; this ideal state will be achieved when clinical status and course, rather than nonclinical factors such as insurance type or provider's unease with ambulatory follow‐up, determine the duration of hospitalization for every child.
- ,,,,,.Recurrent urinary tract infections in children: risk factors and association with prophylactic antimicrobials.JAMA.2007;298:179–186.
- ,.Factors associated with variability in outcomes for children hospitalized with urinary tract infection.J Pediatr.2009;154:789–796.
- ,,,,.Intravenous immunoglobulin in children with streptococcal toxic shock syndrome.Clin Infect Dis.2009;49:1369–1376.
- ,,.Pediatric hospital adherence to the standard of care for acute gastroenteritis.Pediatrics.2009;124:e1081–e1087.
- ,,.Medicaid re‐enrollment policies and children's risk of hospitalizations for ambulatory care sensitive conditions.Med Care.2008;46:1049–1054.
- ,.Differences associated with age, transfer status, and insurance coverage in end‐of‐life hospital care for children.J Hosp Med.2008;3:376–383.
- ,,,,,.Health care for children and youth in the United States: annual report on patterns of coverage, utilization, quality, and expenditures by a county level of urban influence.Ambul Pediatr.2006;6:241–264.
- ,,.Lengths of stay and costs associated with children's hospitals.Pediatrics.2005;115:839–844.
- ,.Variation in hospital discharges for ambulatory care‐sensitive conditions among children.Pediatrics.2000;106:942–948.
- ,,,,,.Ambulatory visit rates and antibiotic prescribing for children with pneumonia, 1994–2007.Pediatrics.2011;127:411–418.
- ,,,,.Patterns of hospital‐based pediatric care across diverse ethnicities: the case of pneumonia.J Health Care Poor Underserved.2004;15:462–473.
- ,,,,.Equivalent lengths of stay of pediatric patients hospitalized in rural and nonrural hospitals.Pediatrics.2004;114:e400–e408.
- ,.Effect of Child Health Insurance Plan enrollment on the utilization of health care services by children using a public safety net system.Pediatrics.2002;110:940–945.
- ,,,,,.Relationships between welfare status, health insurance status, and health and medical care among children with asthma.Am J Public Health.2002;92:1446–1452.
- HCUP Kids' Inpatient Database (KID). Healthcare Cost and Utilization Project (HCUP), 1997, 2000, 2003, 2006. Agency for Healthcare Research and Quality. Available at: http://www.hcup‐us.ahrq.gov/kidoverview.jsp. Accessed May 17,2010.
- ,,, et al.Community‐acquired pneumonia: can it be defined with claims data?Am J Med Qual.1997;12:187–193.
- .Sicker and poorer—the consequences of being uninsured: a review of the research on the relationship between health insurance, medical care use, health, work, and income.Med Care Res Rev.2003;60:3S–75S; discussion76S–112S.
- ,,,,,.Socioeconomic variation in asthma hospitalization: excess utilization or greater need?Pediatrics.1999;103:e75.
- ,,, et al.Analysis of 23 million US hospitalizations: uninsured children have higher all‐cause in‐hospital mortality.J Public Health (Oxf).2010;32(2)236–244.
- ,.The impact of welfare reform on parents' ability to care for their children's health.Am J Public Health.1999;89:502–505.
- ,,.Knowledge of welfare reform program provisions among families of children with chronic conditions.Am J Public Health.2002;92:228–230.
Disparities in patterns of care and outcomes for ambulatory‐care sensitive conditions remain a persistent problem for children.19 Many studies have focused on disparities in hospitalization rates and length of stay (LOS) related to asthma, however, few studies have focused on community‐acquired pneumonia (CAP) despite the fact that pneumonia is the most common, preventable, and potentially serious infection in childhood.10 Providers, payers, and families have a common interest in minimizing hospital LOS for different reasons (eg, minimizing costs, lost wages, exposure to antibiotic‐resistant bacteria), however, this interest is balanced against the potentially greater risk of readmission and adverse outcomes if LOS is inappropriately short. To date, the relationship between insurance status and LOS for CAP remains unexplored.
As in other conditions, substantial variation exists with respect to patterns of care and outcomes for children hospitalized with CAP.11 For example, children hospitalized in rural settings have a shorter LOS for pneumonia than those hospitalized in large urban settings.12 Children from racial/ethnic minorities tend to have higher rates of CAP‐associated complications, including death.11 Decades of prior studies have documented that uninsured children are less likely than insured children to make preventive care visits and obtain prescription medications, but differences in LOS or hospitalization rates between insured and uninsured children with CAP have not been studied.6, 8, 13, 14 Though imperfect, insurance status is 1 proxy for healthcare access, and current healthcare reform efforts aim to improve healthcare access and decrease socioeconomic gradients in health by increasing the number of insured American children. Nonetheless, quantifying the relationship between insurance status on LOS for children hospitalized with CAP is a first step towards understanding the influence of ambulatory care access on hospitalization for ambulatory‐care sensitive conditions.
The purpose of this study was to investigate the influence of insurance status and type on LOS for children hospitalized with CAP. In addition, we sought to determine if there were consistent trends over time in the association between insurance status and type with LOS for children hospitalized with CAP.
METHODS
Study Design and Data Source
This retrospective cross‐sectional study used data from the 1997, 2000, 2003, and 2006 Kids' Inpatient Database (KID). The KID is part of the Healthcare Cost and Utilization Project sponsored by the Agency for Healthcare Research and Quality (AHRQ). It is the only dataset on hospital use and outcomes specifically designed to study children's use of hospital services in the United States. The KID samples pediatric discharges from all community non‐rehabilitation hospitals in states participating in the Healthcare Cost and Utilization Project, using a complex stratification system, across pediatric discharge type and hospital characteristics. Community hospitals in the KID are defined as all non‐federal, short‐term, general and other specialty hospitals, including academic medical centers, obstetrics‐gynecology, otolaryngology, orthopedic, and children's hospitals. Federal hospitals, long‐term hospitals, psychiatric hospitals, alcohol/chemical dependency treatment facilities and hospitals units within institutions are excluded. Discharge‐level weights assigned to discharges within the stratum permit calculation of national estimates. Datasets, which each contain approximately 3 million discharges (unweighted), are released every 3 years beginning with 1997. The 2006 KID is the most recently available dataset and contains hospital administrative data from 38 states, representing 88.8% of the estimated US population.15 This study was considered exempt from review by the Committees for the Protection of Human Subjects at The Children's Hospital of Philadelphia.
Study Participants
Patients 18 years of age and younger were eligible for inclusion if they required hospitalization for CAP in 1997, 2000, 2003, or 2006. Using a previously validated algorithm, patients were considered as having CAP if they met 1 of 2 criteria: 1) International Classification of Diseases, 9th Revision, Clinical Modification (ICD‐9 CM) primary diagnosis code indicating pneumonia (480‐483, 485‐486), empyema (510), or pleurisy (511.0‐1, 511.9); or 2) primary diagnosis of pneumonia‐related symptom (eg, cough, fever, tachypnea) and secondary diagnosis of pneumonia, empyema or pleurisy. Pneumonia‐related symptoms included fever, respiratory abnormality unspecified, shortness of breath, tachypnea, wheezing, cough, hemoptysis, abnormal sputum, chest pain, and abnormal chest sounds.16 Because there is no specific ICD‐9 code for nosocomial pneumonia, this previously validated approach minimized such misclassification16 (eg, a child hospitalized following traumatic injury who then develops ventilator‐associated pneumonia is likely to have trauma, rather than pneumonia or a pneumonia‐related symptom, listed as the primary diagnosis). Patients with the following comorbid conditions (identified by KID data elements and ICD‐9 CM codes) were excluded as these comorbidities are characterized by risk factors not reflective of the general pediatric population: acquired and congenital immunologic disorders, malignancy, collagen vascular disease, sickle cell disease, cystic fibrosis, organ transplant, congenital heart defects, and heart failure. Patients identified as in‐hospital births were excluded to minimize the inclusion of perinatally acquired and nosocomial infections occurring in neonates. Patients with a secondary diagnosis code indicating trauma were also excluded, as a diagnosis of pneumonia in this population likely reflects nosocomial etiology. CAP‐related complications (eg, effusion, abscess; for complete list, see Supporting Appendix A in the online version of this article) were identified using ICD‐9 CM diagnosis and procedure codes. Asthma‐related hospitalizations were identified using ICD‐9 CM diagnosis code 493 in any secondary diagnosis field.
Primary Exposure
The primary exposure was insurance type, categorized as private, public, uninsured, or other (eg, Civilian Health and Medical Program Uniform Service (CHAMPUS), worker's compensation, union‐based insurance, but definition varies by state precluding categorization as purely public or private).
Primary Outcome
The primary outcome was the hospital LOS calculated in days.
Statistical Analysis
Consistent with prior work,12 subjects were characterized by age, race, sex, the presence or absence of a pneumonia‐associated complication, discharge status (discharge from hospital vs in‐hospital death), hospital type (rural, urban non‐teaching, urban teaching non‐children's, urban teaching children's), and hospital region (Northeast, Midwest, South, West). Age groups for analysis were defined as <1 year (infant), 1 to 5 years (preschool age), 6 to 11 years (school‐age), and 12 to 18 years old (adolescent). Race was recorded as a single variable (white, black, other, and missing). Patient information for race was missing from 32% of discharges in 1997, 18% in 2000, 29% in 2003, and 26% in 2006. Patients with missing race data were included to preserve the integrity of our estimates. Categorical variables were summarized by frequencies and percents. Continuous variables were summarized by mean and standard deviation values.
All analyses accounted for the complex sampling design with the survey commands included in STATA, version 10 (College Station, TX) to produce weighted estimates. To determine the adjusted impact of patient and hospital‐level characteristics in our cohort, we constructed multivariable negative binomial regression models using all available covariates for LOS because of its rightward‐skewed distribution. The negative binomial model produced an incident rate ratio (IRR) for LOS (IRR >1 indicates that the risk factor is associated with a longer length of stay). As recommended in the AHRQ technical documentation, variance estimates for each model accounted for the clustering of data at the hospital level. To address the impact of missing race data on outcome, we constructed additional multivariable negative binomial regression models while varying the underlying assumptions about race classification. In these secondary analyses, children with race coded as missing were sequentially excluded, assumed to be white, and assumed to be black. These analyses were repeated after excluding insurance from the multivariable model.
RESULTS
The more than 10.5 million children sampled (unweighted) in KID during these 4 time periods (1997, 2000, 2003, and 2006) are representative of the more than 28.9 million children hospitalized in the United States. In each of these sample years, there were approximately 150,000 children hospitalized with pneumonia across the United States (Table 1). Of those hospitalized, 23% to 28% had a concomitant diagnosis of asthma; 6% to 8% had a pneumonia‐associated complication; and mortality was <0.01% in each sample year for patients hospitalized with pneumonia. In all years, among those with racial/ethnic data, the sample population was predominantly white boys less than 6 years old. The greatest proportion of children were hospitalized in urban non‐teaching settings, and also those children living in the southern regions of the United States.
| 1997 | 2000 | 2003 | 2006 | |
|---|---|---|---|---|
| N = 148,702 | N = 157,847 | N = 157,743 | N = 156,810 | |
| ||||
| Race | ||||
| White | 56,348 (38) | 68,643 (44) | 54,903 (35) | 56,108 (36) |
| Black | 22,864 (15) | 22,580 (14) | 17,960 (11) | 18,800 (12) |
| Other | 22,203 (15) | 38,448 (24) | 39,138 (25) | 40,803 (26) |
| Missing | 47,287 (32) | 28,175 (18) | 45,588 (29) | 41,099 (26) |
| Age category | ||||
| <1 year | 43,851 (29) | 44,470 (28) | 37,798 (24) | 37,705 (24) |
| 1 through 5 years | 75,033 (50) | 76,385 (48) | 77,530 (49) | 79,519 (51) |
| 6 through 11 years | 19,372 (13) | 21,403 (14) | 23,126 (15) | 23,494 (15) |
| >12 years | 10,446 (7) | 15,589 (9) | 19,289 (12) | 16,092 (10) |
| Hospital type | ||||
| Urban non‐teaching | 52,756 (35) | 50,718 (32) | 52,552 (34) | 50,718 (32) |
| Rural | 47,910 (32) | 41,715 (27) | 39,605 (26) | 31,947 (21) |
| Urban teaching non‐children's | 20,378 (14) | 30,981 (20) | 28,432 (18) | 30,194 (20) |
| Urban teaching children's | 27,658 (19) | 34,021 (22) | 34,454 (22) | 41,035 (27) |
| Male sex | 83,291 (56) | 8,783 (56) | 86,034 (55) | 85,508 (55) |
| Region* | ||||
| Northeast | 19,750 (13) | 26,092 (17) | 23,867 (15) | 23,832 (15) |
| Midwest | 33,053 (22) | 30,706 (19) | 35,714 (23) | 35,900 (23) |
| South | 68,958 (46) | 68,663 (44) | 65,994 (42) | 65,460 (42) |
| West | 26,741 (18) | 32,385 (21) | 32,169 (20) | 31,618 (20) |
| Asthma | 26,971 (24) | 31,746 (28) | 27,729 (24) | 26,822 (23) |
| Pneumonia‐associated complication | 8,831 (6) | 11,084 (7) | 12,005 (8) | 11,724 (7) |
| Died | 334 (0.002) | 394 (0.002) | 270 (0.002) | 193 (0.001) |
| Insurance | ||||
| Private | 65,428 (44) | 73,528 (47) | 68,720 (44) | 63,997 (41) |
| Public | 68,024 (46) | 71,698 (45) | 76,779 (49) | 80,226 (51) |
| Uninsured | 9,922 (7) | 8,336 (5) | 6,381 (4) | 6,912 (4) |
| Other | 4,964 (3) | 4,285 (3) | 5,391 (3) | 5,283 (3) |
There was little variation in the insurance status of children hospitalized with CAP between 1997 and 2006. In each of the sampled years, at least 40% of sampled children were privately insured, at least 40% were publicly insured, and approximately 5% were uninsured (Table 1). In all years, there were significant racial/ethnic disparities in insurance coverage such that whites were 4 to 6 times more likely to have private insurance than blacks, however, the large amount of missing race/ethnicity data warrant caution in interpreting this finding (Table 2; also see Supporting Information Appendix B in the online version of this article). We also found that children less than 1 year old were the most likely to be publicly insured in all years (see Supporting Appendix C in the online version of this article). There were also regional differences related to insurance coverage such that a greater proportion of children hospitalized in facilities located in the southern part of the United States were publicly insured. Notably, there were no significant differences in CAP‐associated mortality or asthma related to insurance coverage (Table 2). In 2006, CAP‐associated complications occurred in 8.5% of children with private insurance, 6.5% of children with public insurance, and 7.7% of uninsured children; the relative distribution of complications by insurance type were similar in previous years of the KID survey.
| Private | Public | Uninsured | Other Insurance | P | |
|---|---|---|---|---|---|
| |||||
| No. of children (%) | 63,997 (41) | 80,226 (51) | 6,912 (4) | 5,283 (3) | |
| Male sex | 34,639 (41) | 44,140 (52) | 3,727 (4) | 2,808 (3) | 0.092 |
| Race | |||||
| White | 30,707 (55) | 21,282 (38) | 2,241 (4) | 1,774 (3) | <0.001 |
| Black* | 5,112 (27) | 12,239 (65) | 988 (5) | 426 (3) | |
| Other | 11,033 (27) | 26,489 (65) | 2,112 (5) | 1,076 (3) | |
| Missing | 17,145 (42) | 20,216 (49) | 1,572 (4) | 2,007 (4) | |
| Age category | |||||
| <1 year | 10,788 (29) | 24,762 (65) | 1,164 (3) | 880 (3) | <0.001 |
| 1 through 5 years | 33,664 (42) | 39,531 (50) | 3,442 (4) | 2,673 (3) | |
| 6 through 11 years | 11,660 (50) | 9,684 (41) | 1,085 (5) | 1,015 (4) | |
| >12 years | 7,885 (49) | 6,249 (39) | 1,221 (8) | 714 (4) | |
| Hospital type | |||||
| Urban non‐teaching | 22,429 (44) | 24,241 (49) | 2,440 (5) | 1,555 (2) | <0.001 |
| Rural | 10,880 (34) | 18,396 (58) | 1,290 (4) | 1,109 (3) | |
| Urban teaching non‐children's | 13,130 (44) | 14,542 (48) | 1,721 (6) | 750 (2) | |
| Urban teaching children's | 16,591 (40) | 21,544 (53) | 1,417 (3) | 1,465 (4) | |
| Region | |||||
| Northeast | 12,364 (52) | 9,620 (40) | 1,466 (6) | 377 (2) | <0.001 |
| Midwest∥ | 17,891 (50) | 15,573 (43) | 1,160 (3) | 1,215 (3) | |
| South∥ | 21,479 (33) | 38,112 (58) | 3,108 (5) | 2,495 (4) | |
| West∥ | 12,263 (39) | 16,921 (44) | 1,178 (5) | 1,195 (5) | |
| Asthma | 10,829 (41) | 13,923 (52) | 1,119 (4) | 866 (3) | 0.193 |
| Pneumonia‐associated complication | 5,416 (46) | 5,206 (45) | 532 (4) | 556 (5) | <0.001 |
| Died | 66 (34) | 115 (60) | 3 (1) | 8 (5) | 0.131 |
After examining the general and demographic characteristics, we then examined mean LOS for all children with CAP in each sample year (Table 3). The mean LOS for children with CAP was 3.44 days in 1997, with marginal decreases in subsequent years to a mean LOS of 3.18 days in 2006. The distribution of LOS for children with CAP revealed that nearly 70% of children were hospitalized for fewer than 3 days, another 22% to 28% were hospitalized for less than 1 week, and only 3% were hospitalized for more than 1 week. This distribution did not change substantially between 1997 and 2006. Next, we compared mean LOS by insurance type and race/ethnicity in unadjusted analyses. In each sample year, publicly insured children hospitalized with CAP had significantly longer LOS than privately insured children (P < 0.001). Similarly, in all years excepting 1997, uninsured children hospitalized with CAP had significantly shorter LOS than privately insured children. There were also significant racial differences in LOS for children with CAP, such that black children had longer LOS than white children with CAP. However, the large amount of missing data for race/ethnicity limited the robustness of this finding, and subsequent sensitivity analyses demonstrated that there were no consistent racial/ethnic disparities in LOS (see Supporting Appendix B in the online version of this article). These sensitivity analyses for missing race data did not alter our primary finding of shorter LOS for uninsured versus publicly or privately insured children.
| 1997 | P | 2000 | P | 2003 | P | 2006 | P | |
|---|---|---|---|---|---|---|---|---|
| ||||||||
| Overall | 3.44 (0.04) | 3.35 (0.05) | 3.27 (0.05) | 3.18 (0.04) | ||||
| Insurance type | ||||||||
| Private | 3.21 (0.04) | 3.19 (0.04) | 3.09 (0.04) | 3.00 (0.03) | ||||
| Public | 3.71 (0.06) | <0.001 | 3.57 (0.06) | <0.001 | 3.44 (0.06) | <0.001 | 3.34 (0.05) | <0.001 |
| Uninsured | 3.18 (0.14) | 0.792 | 2.92 (0.07) | <0.001 | 2.80 (0.05) | <0.001 | 2.82 (0.05) | <0.001 |
| Other | 3.32 (0.11) | 0.319 | 3.55 (0.14) | 0.0134 | 3.54 (0.21) | 0.037 | 3.42 (0.13) | 0.001 |
| Race | ||||||||
| White | 3.31 (0.05) | 3.18 (0.04) | 3.19 (0.05) | 3.10 (0.04) | ||||
| Black | 3.61 (0.08) | <0.001 | 3.32 (0.07) | <0.001 | 3.36 (0.08) | <0.001 | 3.31 (0.07) | <0.001 |
| Other | 3.96 (0.11) | <0.001 | 3.81 (0.09) | <0.001 | 3.67 (0.10) | <0.001 | 3.56 (0.08) | <0.001 |
| Missing | 3.27 (0.08) | 0.645 | 3.18 (0.08) | 0.926 | 2.99 (0.06) | 0.0134 | 2.86 (0.04) | <0.001 |
After controlling for child age, race/ethnicity, gender, hospital type, transfer status, and presence of asthma or pneumonia‐associated complications, our multivariable analyses examining the relationship between insurance coverage and hospital LOS yielded the following results (Table 4). First, publicly insured children had significantly longer hospital stays than privately insured children, and uninsured children had significantly shorter hospital stays than privately insured children in all years except 1997. Second, children admitted with CAP at urban teaching children's hospitals had significantly longer LOS than those admitted to urban non‐teaching hospitals, and, in 2003, children admitted with CAP to rural hospitals had significantly shorter LOS than those admitted to urban non‐teaching hospitals. Third, children older than 1 year consistently had shorter hospital stays than infants less than 1 year old. Finally, though concomitant diagnosis of asthma did not consistently influence LOS, children who developed any complications had significantly longer LOS than those who did not. The cumulative impact of seemingly small differences in LOS is great. For example, in 2006, our model suggests that, for every 1000 children hospitalized with CAP in a given year, after adjusting for differences in sex, age, race, hospital‐type, region, transfer status, and diagnosis of asthma or complications, publicly insured children spend 90 to 130 more days in the hospital than privately insured children, whereas uninsured children spend between 40 to 90 fewer days in the hospital than privately insured children.
| 1997 | 2000 | 2003 | 2006 | |
|---|---|---|---|---|
| Variable | IRR (95% CI) | IRR (95% CI) | IRR (95% CI) | IRR (95% CI) |
| ||||
| Age category | ||||
| <1 year | ||||
| 15 years | 0.82 (0.81, 0.84) | 0.83 (0.88, 0.95) | 0.86 (0.85, 0.88) | 0.87 (0.86, 0.89) |
| 611 years | 0.91 (0.87, 0.95) | 0.91 (0.88, 0.94) | 0.93 (0.91, 0.95) | 0.93 (0.90, 0.95) |
| >12 years | 1.03 (0.99, 1.07) | 1.17 (1.11, 1.22) | 1.09 (1.06, 1.13) | 1.13 (1.09, 1.16) |
| Race | ||||
| White | ||||
| Black | 1.04 (0.99, 1.08) | 1.00 (0.95, 1.03) | 1.00 (0.98, 1.03) | 1.02 (0.98, 1.06) |
| Other | 1.09 (1.05, 1.13) | 1.11 (1.08, 1.15) | 1.09 (1.06, 1.12) | 1.08 (1.05, 1.11) |
| Missing | 1.00 (0.94, 1.06) | 1.01 (0.96, 1.06) | 0.95 (0.92, 0.99)* | 0.96 (0.93, 0.99) |
| Sex | ||||
| Female | 1.02 (0.94, 1.06) | 1.01 (0.99, 1.02) | 1.01(0.93, 100) | 1.01 (1.00, 1.02) |
| Insurance type | ||||
| Private | ||||
| Public | 1.13 (1.11, 1.16) | 1.11 (1.09, 1.14) | 1.11 (1.09, 1.13) | 1.11 (1.09, 1.13) |
| Uninsured | 1.01 (0.91, 1.11) | 0.93 (0.89, 0.96) | 0.92 (0.90, 0.96) | 0.94 (0.91, 0.96) |
| Other | 1.01 (0.96, 1.06) | 1.10 (1.03, 1.18) | 1.10 (1.02, 1.19)* | 1.07 (1.02, 1.13) |
| Hospital type | ||||
| Urban non‐teaching | ||||
| Rural | 0.98 (0.92, 1.04) | 0.96 (0.92, 1.00) | 0.97 (0.94, 1.00) | 0.97 (0.93, 1.00) |
| Urban teaching (non‐children's) | 0.99 (0.95, 1.04) | 1.06 (1.02, 1.10) | 1.06 (1.02, 1.10) | 1.03 (0.99, 1.07) |
| Urban teaching children's | 1.2 (1.14, 1.26) | 1.23 (1.16, 1.30) | 1.28 (1.21, 1.37) | 1.25 (1.19, 1.31) |
| Region | ||||
| Northeast | ||||
| Midwest | 0.93 (0.88, 0.98)* | 0.96 (0.92, 1.00) | 0.95 (0.91, 0.99)* | 0.95 (0.91, 0.99)* |
| South | 0.98 (0.94, 1.02) | 1.06 (1.02, 1.10)* | 1.04 (1.00, 1.09) | 1.03 (0.98, 1.08) |
| West | 0.97 (0.92, 1.01) | 1.22 (1.16, 1.30)* | 1.02 (0.97, 1.08) | 1.06 (1.00, 1.12)* |
| Transfer status | ||||
| Transfer | 1.35 (1.25, 1.46) | 1.39 (1.27, 1.52) | 1.31 (1.23, 1.37 ) | 1.16 (1.10, 1.23) |
| Asthma | 0.99 (0.96, 1.03) | 0.97 (0.95, 0.99) | 0.98 (0.96, 1.00) | 0.98 (0.97, 1.00)* |
| Pneumonia Complications | 0.99 (0.96, 1.03) | 0.97 (0.95, 0.99)* | 0.98 (0.96, 1.0) | 0.98 (0.97, 1.00)* |
| Any complication | 2.20 (2.07, 2.34) | 2.23 (2.07, 2.40) | 2.22 (2.22, 2.44) | 2.37 (2.27, 2.47) |
DISCUSSION
In this nationally representative sample selected over the past 10 years, we found that publicly insured children hospitalized with CAP have significantly longer LOS than those who are privately insured, and that, since 2000, uninsured children hospitalized with CAP have significantly shorter LOS than those who are privately insured. Though these observed differences are small, they are consistent across all 4 sampled years and, because CAP is one of the most common pediatric inpatient diagnoses, the cumulative impact of the observed differences on hospital LOS is great. Insurance status is often considered a proxy for access to preventive and ambulatory healthcare services or socioeconomic status. However, the underlying mechanisms relating insurance status to healthcare access, utilization, and ultimately, health outcomes are highly complex and difficult to elucidate.17 The observed variation in this study raises questions about the potential influence of insurance status on hospital discharge practices. Additional research is necessary to understand whether there are differences in processes of care (eg, performance of blood cultures or chest radiographs), quality of care, or other outcomes, such as readmissions, related to CAP inpatient management for children with different insurance coverage.
Apart from differences in hospital discharge practices, another possible explanation for uninsured children with CAP having shorter LOS is that these children have less severe disease than privately insured. This may occur if uninsured children with CAP are evaluated in the emergency department rather than the office setting, because emergency department providers may be more likely to admit children with CAP who lack a consistent access to ambulatory primary care services. Countering this alternative, prior studies have shown that uninsured groups are more likely to have greater disease severity than privately insured groups at the time of hospital admission.18, 19 In this study, we attempted to identify children with greater severity of disease using ICD‐9 codes for CAP‐associated complications. Though this is a relatively crude method that might lead to an underestimate of the total number of children with complications, we found that there were no significant differences in the prevalence of CAP‐associated complications between uninsured and insured groups in all sampled years.
On the other hand, uninsured patients may be released earlier by providers in order to reduce the amount of uncompensated care provided, or possibly because parents may urge providers to discharge their children, given their inability to pay forthcoming hospital bills and/or avoid further lost wages due to work absence.20, 21 In California, Bindman et al. demonstrated that decreasing the frequency of Medicaid recertification, and consequently increasing the likelihood of continuous insurance coverage, was associated with a decreased risk of hospitalization for ambulatory‐care sensitive conditions.5
We also found that children admitted to urban teaching children's hospitals with CAP had significantly longer LOS than those admitted to urban non‐teaching hospitals, whereas children in rural hospitals had significantly shorter LOS than those in urban non‐teaching hospitals in 2003. These findings are consistent with prior data from 1996 to1998 demonstrating that children admitted to rural hospitals in New York and Pennsylvania had significantly shorter LOS than large urban hospitals for 19 medical and 9 surgical conditions, including pneumonia.12 These findings may reflect underlying differences in between rural and urban hospital transfer practices, whereby rural hospitals may be more likely than urban hospitals to transfer children with relatively more severe illness to urban referral centers and retain children with less severe illness, leading to shorter LOS.12 Though our empiric understanding of differences in LOS between teaching and non‐teaching hospitals is currently limited, clinical experience supports the notion that there may be decreases in efficiency that occur in teaching hospitals, and are a result of the supervision required for care provided by trainees. It is also possible that, despite our exclusion of comorbid conditions, some children with complex or chronic medical conditions were included in this study. These children are often cared for at teaching hospitals, regardless of the primary cause for admission, and are more likely to have public insurance than other children, thus confounding the relationship between hospital type, insurance type and status, and LOS for children with CAP. The limitations of this dataset preclude further examination of this issue.
There are some limitations to this study. First, the KID data are cross‐sectional and causal inferences are limited. However, our results demonstrating that uninsured children hospitalized with CAP had shorter LOS than privately insured children were quite consistent in each sample year, suggesting that our results are a true association. Additionally, insurance status in KID is typically collected at admission, however, it is not possible to determine whether specific changes to insurance status that occurred during the hospitalization were applied to the data. The impact of this limitation would depend on the type of insurance obtained by the patient. If uninsured patients obtained public insurance, our study would underestimate the increased LOS for publicly insured patients, compared with privately insured patients, but have no effect on the difference in LOS between uninsured and privately insured patients. In the unlikely event that uninsured patients obtained private insurance, then our study would underestimate the difference for uninsured patients, compared with privately insured patients, biasing our current study results towards the null. Second, a substantial proportion of sampled children had missing data for race/ethnicity. To assess the impact of the missing race/ethnicity data on our results, we conducted sensitivity analyses and found that, though difficult to make any definitive conclusions about the relationship between race/ethnicity and LOS for children with CAP, there were no changes to our primary findings regarding differences in LOS between children with different insurance status and type. Third, KID does not include data about other unmeasured confounders (eg, parent income, parent education, regular source of care) that might be related to LOS, as well as a broad spectrum of pediatric outcomes. Serious consideration of expanding KID to include these variables is warranted. Fourth, the other category of insurance is not uniformly coded across states in the KID database. While some states use this category to classify public insurance options other than Medicare and Medicaid, other states include private insurance options in this group. Thus, it is possible that some patients with public insurance are misclassified as having other insurance. We would expect such misclassification to bias our findings towards the null hypothesis. Finally, we focused on the relationship between child health insurance status and CAP, only 1 ambulatory care‐sensitive condition. Additional research examining the relationship between insurance type and other ambulatory care‐sensitive conditions is warranted.
In summary, we found that, after multivariable adjustment, uninsured children hospitalized with community‐acquired pneumonia had significantly shorter LOS than privately insured children, and publicly insured children had a significantly longer hospital stay than privately insured children in these 4 nationally representative samples from 1997 to 2006. Current federal and state efforts to increase enrollment of children into insurance programs are a first step in reducing healthcare disparities. However, insurance coverage alone does not guarantee access to healthcare, thus, these efforts in isolation will likely be insufficient to achieve optimal health for the children of our country. As healthcare reform legislation is implemented, these findings provide hospitals and policy makers additional impetus to develop ways to achieve the ideal length of stay for every child; this ideal state will be achieved when clinical status and course, rather than nonclinical factors such as insurance type or provider's unease with ambulatory follow‐up, determine the duration of hospitalization for every child.
- ,,,,,.Recurrent urinary tract infections in children: risk factors and association with prophylactic antimicrobials.JAMA.2007;298:179–186.
- ,.Factors associated with variability in outcomes for children hospitalized with urinary tract infection.J Pediatr.2009;154:789–796.
- ,,,,.Intravenous immunoglobulin in children with streptococcal toxic shock syndrome.Clin Infect Dis.2009;49:1369–1376.
- ,,.Pediatric hospital adherence to the standard of care for acute gastroenteritis.Pediatrics.2009;124:e1081–e1087.
- ,,.Medicaid re‐enrollment policies and children's risk of hospitalizations for ambulatory care sensitive conditions.Med Care.2008;46:1049–1054.
- ,.Differences associated with age, transfer status, and insurance coverage in end‐of‐life hospital care for children.J Hosp Med.2008;3:376–383.
- ,,,,,.Health care for children and youth in the United States: annual report on patterns of coverage, utilization, quality, and expenditures by a county level of urban influence.Ambul Pediatr.2006;6:241–264.
- ,,.Lengths of stay and costs associated with children's hospitals.Pediatrics.2005;115:839–844.
- ,.Variation in hospital discharges for ambulatory care‐sensitive conditions among children.Pediatrics.2000;106:942–948.
- ,,,,,.Ambulatory visit rates and antibiotic prescribing for children with pneumonia, 1994–2007.Pediatrics.2011;127:411–418.
- ,,,,.Patterns of hospital‐based pediatric care across diverse ethnicities: the case of pneumonia.J Health Care Poor Underserved.2004;15:462–473.
- ,,,,.Equivalent lengths of stay of pediatric patients hospitalized in rural and nonrural hospitals.Pediatrics.2004;114:e400–e408.
- ,.Effect of Child Health Insurance Plan enrollment on the utilization of health care services by children using a public safety net system.Pediatrics.2002;110:940–945.
- ,,,,,.Relationships between welfare status, health insurance status, and health and medical care among children with asthma.Am J Public Health.2002;92:1446–1452.
- HCUP Kids' Inpatient Database (KID). Healthcare Cost and Utilization Project (HCUP), 1997, 2000, 2003, 2006. Agency for Healthcare Research and Quality. Available at: http://www.hcup‐us.ahrq.gov/kidoverview.jsp. Accessed May 17,2010.
- ,,, et al.Community‐acquired pneumonia: can it be defined with claims data?Am J Med Qual.1997;12:187–193.
- .Sicker and poorer—the consequences of being uninsured: a review of the research on the relationship between health insurance, medical care use, health, work, and income.Med Care Res Rev.2003;60:3S–75S; discussion76S–112S.
- ,,,,,.Socioeconomic variation in asthma hospitalization: excess utilization or greater need?Pediatrics.1999;103:e75.
- ,,, et al.Analysis of 23 million US hospitalizations: uninsured children have higher all‐cause in‐hospital mortality.J Public Health (Oxf).2010;32(2)236–244.
- ,.The impact of welfare reform on parents' ability to care for their children's health.Am J Public Health.1999;89:502–505.
- ,,.Knowledge of welfare reform program provisions among families of children with chronic conditions.Am J Public Health.2002;92:228–230.
Copyright © 2011 Society of Hospital Medicine
Addressing Inpatient Crowding
High levels of hospital occupancy are associated with compromises to quality of care and access (often referred to as crowding), 18 while low occupancy may be inefficient and also impact quality. 9, 10 Despite this, hospitals typically have uneven occupancy. Although some demand for services is driven by factors beyond the control of a hospital (eg, seasonal variation in viral illness), approximately 15%30% of admissions to children's hospitals are scheduled from days to months in advance, with usual arrivals on weekdays. 1114 For example, of the 3.4 million elective admissions in the 2006 Healthcare Cost and Utilization Project Kids Inpatient Database (HCUP KID), only 13% were admitted on weekends. 14 Combined with short length of stay (LOS) for such patients, this leads to higher midweek and lower weekend occupancy. 12
Hospitals respond to crowding in a number of ways, but often focus on reducing LOS to make room for new patients. 11, 15, 16 For hospitals that are relatively efficient in terms of LOS, efforts to reduce it may not increase functional capacity adequately. In children's hospitals, median lengths of stay are 2 to 3 days, and one‐third of hospitalizations are 1 day or less. 17 Thus, even 10%20% reductions in LOS trims hours, not days, from typical stays. Practical barriers (eg, reluctance to discharge in the middle of the night, or family preferences and work schedules) and undesired outcomes (eg, increased hospital re‐visits) are additional pitfalls encountered by relying on throughput enhancement alone.
Managing scheduled admissions through smoothing is an alternative strategy to reduce variability and high occupancy. 6, 12, 1820 The concept is to proactively control the entry of patients, when possible, to achieve more even levels of occupancy, instead of the peaks and troughs commonly encountered. Nonetheless, it is not a widely used approach. 18, 20, 21 We hypothesized that children's hospitals had substantial unused capacity that could be used to smooth occupancy, which would reduce weekday crowding. While it is obvious that smoothing will reduce peaks to average levels (and also raise troughs), we sought to quantify just how large this difference wasand thereby quantify the potential of smoothing to reduce inpatient crowding (or, conversely, expose more patients to high levels of occupancy). Is there enough variation to justify smoothing, and, if a hospital does smooth, what is the expected result? If the number of patients removed from exposure to high occupancy is not substantial, other means to address inpatient crowding might be of more value. Our aims were to quantify the difference in weekday versus weekend occupancy, report on mathematical feasibility of such an approach, and determine the difference in number of patients exposed to various levels of high occupancy.
Methods
Data Source
This retrospective study was conducted with resource‐utilization data from 39 freestanding, tertiary‐care children's hospitals in the Pediatric Health Information System (PHIS). Participating hospitals are located in noncompeting markets of 23 states, plus the District of Columbia, and affiliated with the Child Health Corporation of America (CHCA, Shawnee Mission, KS). They account for 80% of freestanding, and 20% of all general, tertiary‐care children's hospitals. Data quality and reliability are assured through joint ongoing, systematic monitoring. The Children's Hospital of Philadelphia Committees for the Protection of Human Subjects approved the protocol with a waiver of informed consent.
Patients
Patients admitted January 1December 31, 2007 were eligible for inclusion. Due to variation in the presence of birthing, neonatal intensive care, and behavioral health units across hospitals, these beds and associated patients were excluded. Inpatients enter hospitals either as scheduled (often referred to as elective) or unscheduled (emergent or urgent) admissions. Because PHIS does not include these data, KID was used to standardize the PHIS data for proportion of scheduled admissions. 22 (KID is a healthcare database of 23 million pediatric inpatient discharges developed through federalstateindustry partnership, and sponsored by the Agency for Healthcare Research and Quality [AHRQ].) Each encounter in KID includes a principal International Classification of Diseases, 9th revision (ICD‐9) discharge diagnosis code, and is designated by the hospital as elective (ranging from chemotherapy to tonsillectomy) or not elective. Because admissions, rather than diagnoses, are scheduled, a proportion of patients with each primary diagnosis in KID are scheduled (eg, 28% of patients with a primary diagnosis of esophageal reflux). Proportions in KID were matched to principal diagnoses in PHIS.
Definitions
The census was the number of patients registered as inpatients (including those physically in the emergency department [ED] from time of ED arrival)whether observation or inpatient statusat midnight, the conclusion of the day. Hospital capacity was set using CHCA data (and confirmed by each hospital's administrative personnel) as the number of licensed in‐service beds available for patients in 2007; we assumed beds were staffed and capacity fixed for the year. Occupancy was calculated by dividing census by capacity. Maximum occupancy in a week referred to the highest occupancy level achieved in a seven‐day period (MondaySunday). We analyzed a set of thresholds for high‐occupancy (85%, 90%, 95%, and 100%), because there is no consistent definition for when hospitals are at high occupancy or when crowding occurs, though crowding has been described as starting at 85% occupancy. 2325
Analysis
The hospital was the unit of analysis. We report hospital characteristics, including capacity, number of discharges, and census region, and annual standardized length of stay ratio (SLOSR) as observed‐to‐expected LOS.
Smoothing Technique
A retrospective smoothing algorithm set each hospital's daily occupancy during a week to that hospital's mean occupancy for the week; effectively spreading the week's volume of patients evenly across the days of the week. While inter‐week and inter‐month smoothing were considered, intra‐week smoothing was deemed more practical for the largest number of patients, as it would not mean delaying care by more than one week. In the case of a planned treatment course (eg, chemotherapy), only intra‐week smoothing would maintain the necessary scheduled intervals of treatment.
Mathematical Feasibility
To approximate the number of patient admissions that would require different scheduling during a particular week to achieve smoothed weekly occupancy, we determined the total number of patient‐days in the week that required different scheduling and divided by the average LOS for the week. We then divided the number of admissions‐to‐move by total weekly admissions to compute the percentage at each hospital across 52 weeks of the year.
Measuring the Impact of Smoothing
We focused on the frequency and severity of high occupancy and the number of patients exposed to it. This framework led to 4 measures that assess the opportunity and effect of smoothing:
Difference in hospital weekdayweekend occupancy: Equal to 12‐month median of difference between mean weekday occupancy and mean weekend occupancy for each hospital‐week.
Difference in hospital maximummean occupancy: Equal to median of difference between maximum one‐day occupancy and weekly mean (smoothed) occupancy for each hospital‐week. A regression line was derived from the data for the 39 hospitals to report expected reduction in peak occupancy based on the magnitude of the difference between weekday and weekend occupancy.
Difference in number of hospitals exposed to above‐threshold occupancy: Equal to difference, pre‐ and post‐smoothing, in number of hospitals facing high‐occupancy conditions on an average of at least one weekday midnight per week during the year at different occupancy thresholds.
Difference in number of patients exposed to above‐threshold occupancy: Equal to difference, pre‐ and post‐smoothing, in number of patients exposed to hospital midnight occupancy at the thresholds. We utilized patient‐days for the calculation to avoid double‐counting, and divided this by average LOS, in order to determine the number of patients who would no longer be exposed to over‐threshold occupancy after smoothing, while also adjusting for patients newly exposed to over‐threshold occupancy levels.
All analyses were performed separately for each hospital for the entire year and then for winter (DecemberMarch), the period during which most crowding occurred. Analyses were performed using SAS (version 9.2, SAS Institute, Inc, Cary, NC); P values <0.05 were considered statistically significant.
Results
The characteristics of the 39 hospitals are provided in Table 1. Based on standardization with KID, 23.6% of PHIS admissions were scheduled (range: 18.1%35.8%) or a median of 81.5 scheduled admissions per week per hospital; 26.6% of weekday admissions were scheduled versus 16.1% for weekends. Overall, 12.4% of scheduled admissions entered on weekends. For all patients, median LOS was three days (interquartile range [IQR]: twofive days), but median LOS for scheduled admissions was two days (IQR: onefour days). The median LOS and IQR were the same by day of admission for all days of the week. Most hospitals had an overall SLOSR close to one (median: 0.9, IQR: 0.91.1). Overall, hospital mean midnight occupancy ranged from 70.9% to 108.1% on weekdays and 65.7% to 94.9% on weekends. Uniformly, weekday occupancy exceeded weekend occupancy, with a median difference of 8.2% points (IQR: 7.2%9.5% points). There was a wide range of median hospital weekdayweekend occupancy differences across hospitals (Figure 1). The overall difference was less in winter (median difference: 7.7% points; IQR: 6.3%8.8% points) than in summer (median difference: 8.6% points; IQR: 7.4%9.8% points (Wilcoxon Sign Rank test, P < 0.001). Thirty‐five hospitals (89.7%) exceeded the 85% occupancy threshold and 29 (74.4%) exceeded the 95% occupancy threshold on at least 20% of weekdays (Table 2). Across all the hospitals, the median difference in weekly maximum and weekly mean occupancy was 6.6% points (IQR: 6.2%7.4% points) (Figure 2).
| Characteristics | No. (%) |
|---|---|
| |
| Licensed in‐service beds | n = 39 hospitals |
| <200 beds | 6 (15.4) |
| 200249 beds | 10 (25.6) |
| 250300 beds | 14 (35.9) |
| >300 beds | 9 (23.1) |
| No. of discharges | |
| <10,000 | 5 (12.8) |
| 10,00013,999 | 14 (35.9) |
| 14,00017,999 | 11 (28.2) |
| >18,000 | 9 (23.1) |
| Census region | |
| West | 9 (23.1) |
| Midwest | 11 (28.2) |
| Northeast | 6 (15.4) |
| South | 13 (33.3) |
| Admissions | n = 590,352 admissions |
| Medical scheduled admissions* | 79,683 |
| Surgical scheduled admissions* | 59,640 |
| Total scheduled admissions* (% of all admissions) | 139,323 (23.6) |
| Weekend medical scheduled admissions* (% of all medical scheduled admissions) | 13,546 (17.0) |
| Weekend surgical scheduled admissions* (% of all surgical scheduled admissions) | 3,757 (6.3) |
| Weekend total scheduled admissions* (% of total scheduled admissions) | 17,276 (12.4) |

| Entire Year | >85% | Occupancy Threshold | >95% | >100% |
|---|---|---|---|---|
| >90% | ||||
| ||||
| No. of hospitals (n = 39) with mean weekday occupancy above threshold | ||||
| Before smoothing (current state) | 33 | 25 | 14 | 6 |
| After smoothing | 32 | 22 | 10 | 1 |
| No. of hospitals (n = 39) above threshold 20% of weekdays | ||||
| Before smoothing (current state) | 35 | 34 | 29 | 14 |
| After smoothing | 35 | 32 | 21 | 9 |
| Median (IQR) no. of patient‐days per hospital not exposed to occupancy above threshold by smoothing | 3,071 | 281 | 3236 | 3281 |
| (5,552, 919) | (5,288, 3,103) | (0, 7,083) | (962, 8,517) | |
| Median (IQR) no. of patients per hospital not exposed to occupancy above threshold by smoothing | 596 | 50 | 630 | 804 |
| (1,190, 226) | (916, 752) | (0, 1,492) | (231, 2,195) | |
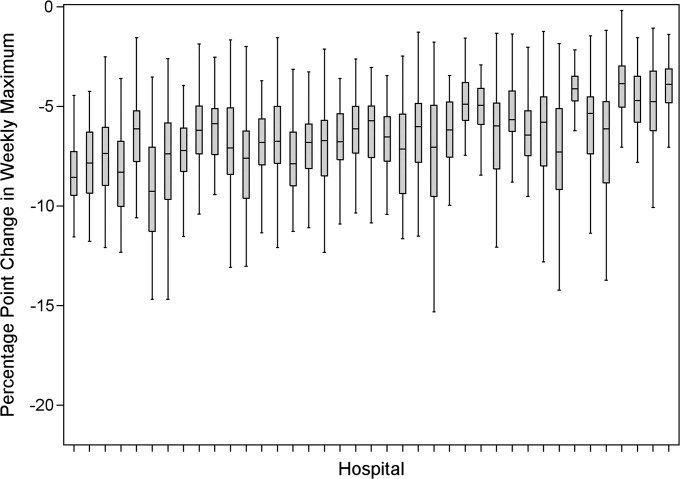
Smoothing reduced the number of hospitals at each occupancy threshold, except 85% (Table 2). As a linear relationship, the reduction in weekday peak occupancy (y) based on a hospital's median difference in weekly maximum and weekly mean occupancy (x) was y = 2.69 + 0.48x. Thus, a hospital with a 10% point difference between weekday and weekend occupancy could reduce weekday peak by 7.5% points.
Smoothing increased the number of patients exposed to the lower thresholds (85% and 90%), but decreased the number of patients exposed to >95% occupancy (Table 2). For example, smoothing at the 95% threshold resulted in 630 fewer patients per hospital exposed to that threshold. If all 39 hospitals had within‐week smoothing, a net of 39,607 patients would have been protected from exposure to >95% occupancy and a net of 50,079 patients from 100% occupancy.
To demonstrate the varied effects of smoothing, Table 3 and Figure 3 present representative categories of response to smoothing depending on pre‐smoothing patterns. While not all hospitals decreased occupancy to below thresholds after smoothing (Types B and D), the overall occupancy was reduced and fewer patients were exposed to extreme levels of high occupancy (eg, >100%).
| Category | Before Smoothing Hospital Description | After Smoothing Hospital Description | No. of Hospitals at 85% Threshold (n = 39) | No. of Hospitals at 95% Threshold (n = 39) |
|---|---|---|---|---|
| ||||
| Type A | Weekdays above threshold | All days below threshold, resulting in net decrease in patients exposed to occupancies above threshold | 3 | 1 |
| Weekends below threshold | ||||
| Type B | Weekdays above threshold | All days above threshold, resulting in net increase in patients exposed to occupancies above threshold | 12 | 18 |
| Weekends below threshold | ||||
| Type C | All days of week below threshold | All days of week below threshold | 6 | 19 |
| Type D | All days of week above threshold | All days of week above threshold, resulting in net decrease in patients exposed to extreme high occupancy | 18 | 1 |
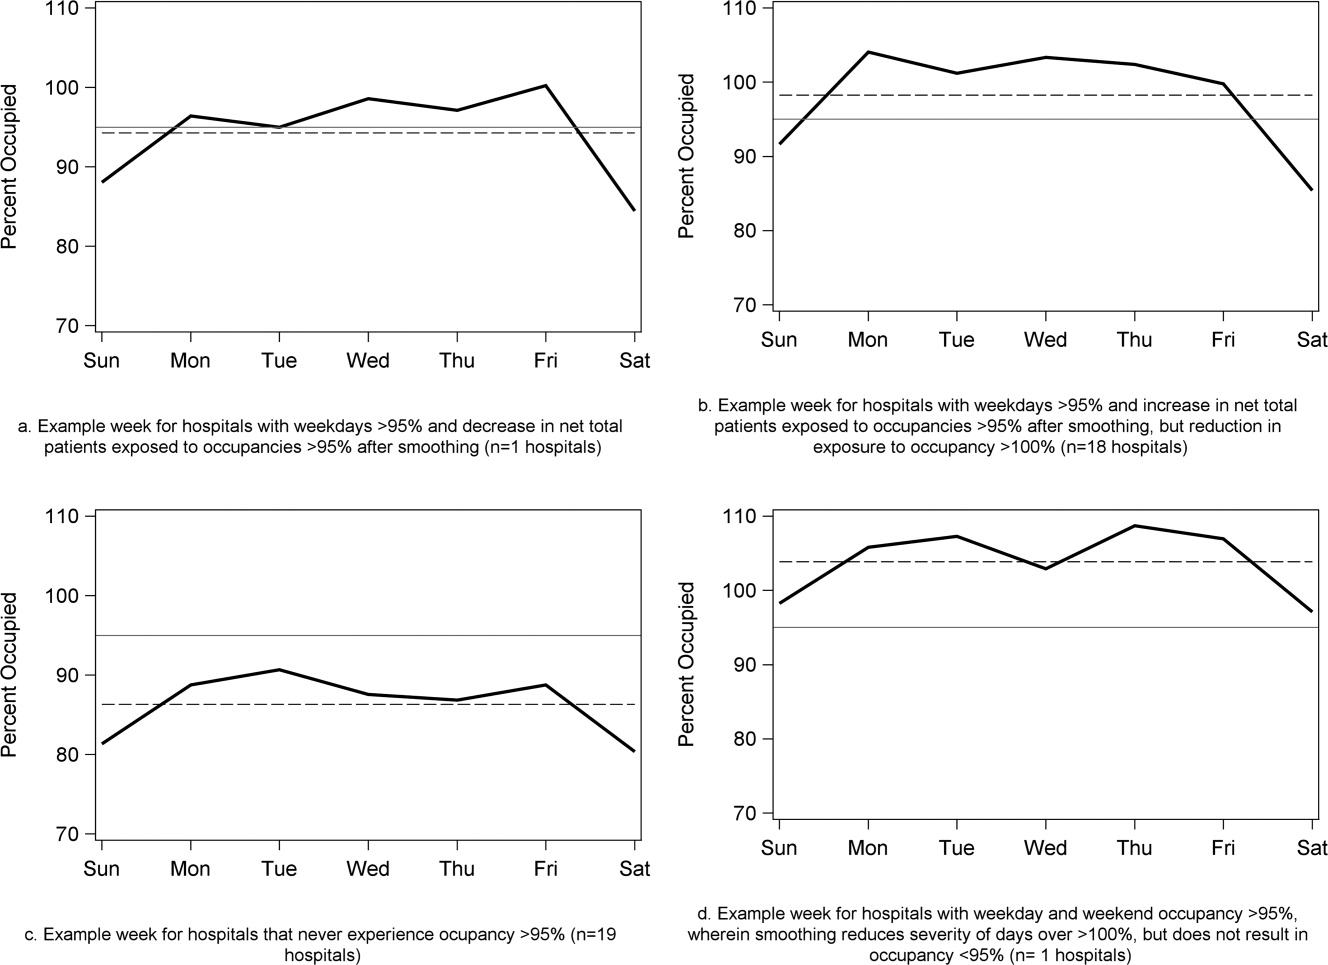
To achieve within‐week smoothing, a median of 7.4 patient‐admissions per week (range: 2.314.4) would have to be scheduled on a different day of the week. This equates to a median of 2.6% (IQR: 2.25%, 2.99%; range: 0.02%9.2%) of all admissionsor 9% of a typical hospital‐week's scheduled admissions.
Discussion
This analysis of 39 children's hospitals found high levels of occupancy and weekend occupancy lower than weekday occupancy (median difference: 8.2% points). Only 12.4% of scheduled admissions entered on weekends. Thus, weekend capacity is available to offset high weekday occupancy. Hospitals at the higher end of the occupancy thresholds (95%, 100%) would reduce the number of days operating at very high occupancy and the number of patients exposed to such levels by smoothing. This change is mathematically feasible, as a median of 7.4 patients would have to be proactively scheduled differently each week, just under one‐tenth of scheduled admissions. Since LOS by day of admission was the same (median: two days), the opportunity to affect occupancy by shifting patients should be relatively similar for all days of the week. In addition, these admissions were short, conferring greater flexibility. Implementing smoothing over the course of the week does not necessarily require admitting patients on weekends. For example, Monday admissions with an anticipated three‐day LOS could enter on Friday with anticipated discharge on Monday to alleviate midweek crowding and take advantage of unoccupied weekend beds. 26
At the highest levels of occupancy, smoothing reduces the frequency of reaching these maximum levels, but can have the effect of actually exposing more patient‐days to a higher occupancy. For example, for nine hospitals in our analysis with >20% of days over 100%, smoothing decreased days over 100%, but exposed weekend patients to higher levels of occupancy (Figure 3). Since most admissions are short and most scheduled admissions currently occur on weekdays, the number of individual patients (not patient‐days) newly exposed to such high occupancy may not increase much after smoothing at these facilities. Regardless, hospitals with such a pattern may not be able to rely solely on smoothing to avoid weekday crowding, and, if they are operating efficiently in terms of SLOSR, might be justified in building more capacity.
Consistent with our findings, the Institute for Healthcare Improvement, the Institute for Healthcare Optimization, and the American Hospital Association Quality Center stress that addressing artificial variability of scheduled admissions is a critical first step to improving patient flow and quality of care while reducing costs. 18, 21, 27 Our study suggests that small numbers of patients need to be proactively scheduled differently to decrease midweek peak occupancy, so only a small proportion of families would need to find this desirable to make it attractive for hospitals and patients. This type of proactive smoothing decreases peak occupancy on weekdays, reducing the safety risks associated with high occupancy, improving acute access for emergent patients, shortening wait‐times and loss of scheduled patients to another facility, and increasing procedure volume (3%74% in one study). 28 Smoothing may also increase quality and safety on weekends, as emergent patients admitted on weekends experience more delays in necessary treatment and have worse outcomes. 2932 In addition, increasing scheduled admissions to span weekends may appeal to some families wishing to avoid absence from work to be with their hospitalized child, to parents concerned about school performanceand may also appeal to staff members seeking flexible schedules. Increasing weekend hospital capacity is safe, feasible, and economical, even when considering the increased wages for weekend work. 33, 34 Finally, smoothing over the whole week allows fixed costs (eg, surgical suites, imaging equipment) to be allocated over 7 days rather than 5, and allows for better matching of revenue to the fixed expenses.
Rather than a prescriptive approach, our work suggests hospitals need to identify only a small number of patients to proactively shift, providing them opportunities to adapt the approach to local circumstances. The particular patients to move around may also depend on the costs and benefits of services (eg, radiologic, laboratory, operative) and the hospital's existing patterns of staffing. A number of hospitals that have engaged in similar work have achieved sustainable results, such as Seattle Children's Hospital, Boston Medical Center, St. John's Regional Health Center, and New York University Langone Medical Center. 19, 26, 3537 In these cases, proactive smoothing took advantage of unused capacity and decreased crowding on days that had been traditionally very full. Hospitals that rarely or never have high‐occupancy days, and that do not expect growth in volume, may not need to employ smoothing, whereas others that have crowding issues primarily in the winter may wish to implement smoothing techniques seasonally.
Aside from attempting to reduce high‐occupancy through modification of admission patterns, other proactive approaches include optimizing staffing and processes around care, improving efficiency of care, and building additional beds. 16, 25, 38, 39 However, the expense of construction and the scarcity of capital often preclude this last option. Among children's hospitals, with SLOSR close to one, implementing strategies to reduce the LOS during periods of high occupancy may not result in meaningful reductions in LOS, as such approaches would only decrease the typical child's hospitalization by hours, not days. In addition to proactive strategies, hospitals also rely on reactive approaches, such as ED boarding, placing patients in hallways on units, diverting ambulances or transfers, or canceling scheduled admissions at the last moment, to decrease crowding. 16, 39, 40
This study has several limitations. First, use of administrative data precluded modeling all responses. For example, some hospitals may be better able to accommodate fluctuations in census or high occupancy without compromising quality or access. Second, we only considered intra‐week smoothing, but hospitals may benefit from smoothing over longer periods of time, especially since children's hospitals are busier in winter months, but incoming scheduled volume is often not reduced. 11 Hospitals with large occupancy variations across months may want to consider broadening the time horizon for smoothing, and weigh the costs and benefits over that period of time, including parental and clinician concerns and preferences for not delaying treatment. At the individual hospital level, discrete‐event simulation would likely be useful to consider the trade‐offs of smoothing to different levels and over different periods of time. Third, we assumed a fixed number of beds for the year, an approach that may not accurately reflect actual available beds on specific days. This limitation was minimized by counting all beds for each hospital as available for all the days of the year, so that hospitals with a high census when all available beds are included would have an even higher percent occupancy if some of those beds were not actually open. In a related way, then, we also do not consider how staffing may need to be altered or augmented to care for additional patients on certain days. Fourth, midnight census, the only universally available measure, was used to determine occupancy rather than peak census. Midnight census provides a standard snapshot, but is lower than mid‐day peak census. 41 In order to account for these limitations, we considered several different thresholds of high occupancy. Fifth, we smoothed at the hospital level, but differential effects may exist at the unit level. Sixth, to determine proportion of scheduled admissions, we used HCUP KID proportions on PHIS admissions. Overall, this approach likely overestimated scheduled medical admissions on weekends, thus biasing our result towards the null hypothesis. Finally, only freestanding children's hospitals were included in this study. While this may limit generalizability, the general concept of smoothing occupancy should apply in any setting with substantial and consistent variation.
In summary, our study revealed that children's hospitals often face high midweek occupancy, but also have substantial unused weekend capacity. Hospitals facing challenges with high weekday occupancy could proactively use a smoothing approach to decrease the frequency and severity of high occupancy. Further qualitative evaluation is also warranted around child, family, and staff preferences concerning scheduled admissions, school, and work.
- , , , . A comparison of in‐hospital mortality risk conferred by high hospital occupancy, differences in nurse staffing levels, weekend admission, and seasonal influenza. Medical Care. 2010;48(3):224–232.
- , , , et al. Hospital workload and adverse events. Med Care. 2007;45(5):448–455.
- , , , , . Impact of admission‐day crowding on the length of stay of pediatric hospitalizations. Pediatrics. 2008;121(4):e718–e730.
- , , , . The effect of hospital bed occupancy on throughput in the pediatric emergency department. Ann Emerg Med. 2009;53(6):767–776.
- . The tipping point: the relationship between volume and patient harm. Am J Med Qual. 2008;23(5):336–341.
- , , , , , . Managing unnecessary variability in patient demand to reduce nursing stress and improve patient safety. Jt Comm J Qual Patient Saf. 2005;31(6):330–338.
- Hospital‐Based Emergency Care: At the Breaking Point. Washington, DC: Institute of Medicine Committee on the Future of Emergency Care in the United States Health System; 2006.
- , , , , . The effect of hospital occupancy on emergency department length of stay and patient disposition. Acad Emerg Med. 2003;10(2):127–133.
- . Interpreting the Volume‐Outcome Relationship in the Context of Health Care Quality: Workshop Summary. Washington, DC: National Academies Press; 2000.
- , , , , . Has recognition of the relationship between mortality rates and hospital volume for major cancer surgery in California made a difference? A follow‐up analysis of another decade. Ann Surg. 2009;250(3):472–483.
- , , , et al. Children's hospitals do not acutely respond to high occupancy. Pediatrics. 2010;125:974–981.
- , , , , , . Scheduled admissions and high occupancy at a children's hospital. J Hosp Med. 2011;6(2):81–87.
- , , . Characteristics of weekday and weekend hospital admissions. HCUP Statistical Brief. 2010;87.
- Agency for Healthcare Research and Quality. HCUP databases, Healthcare Cost and Utilization Project (HCUP); 2008. Available at: http://www.hcup‐us.ahrq.gov/kidoverview.jsp. Accessed July 15, 2009.
- , et al. Managing capacity to reduce emergency department overcrowding and ambulance diversions. J Qual Patient Saf. 2006;32(5):239–245.
- Institute for Healthcare Improvement. Flow initiatives; 2008. Available at: http://www.ihi.org/IHI/Topics/Flow. Accessed February 20, 2008.
- , , , , , . Trends in high‐turnover stays among children hospitalized in the United States, 1993–2003. Pediatrics. 2009;123(3):996–1002.
- Institute for Healthcare Improvement. Smoothing elective surgical admissions. Available at: http://www.ihi.org/IHI/Topics/Flow/PatientFlow/EmergingContent/SmoothingElectiveSurgicalAdmissions.htm. Accessed October 24, 2008.
- Boston hospital sees big impact from smoothing elective schedule. OR Manager. 2004;20:12.
- . Managing Variability in Patient Flow Is the Key to Improving Access to Care, Nursing Staffing, Quality of Care, and Reducing Its Cost. Paper presented at Institute of Medicine, Washington, DC; June 24, 2004.
- American Hospital Association Quality Center. Available at: http://www.ahaqualitycenter.org/ahaqualitycenter/. Accessed October 14, 2008.
- Healthcare Cost and Utilization Project (HCUP). Kids' Inpatient Database (KID); July 2008. Available at: http://www.hcup‐us.ahrq.gov/kidoverview.jsp. Accessed September 10, 2008.
- , , . Using a queuing model to help plan bed allocation in a department of geriatric medicine. Health Care Manag Sci. 2002;5(4):307–313.
- . How many hospital beds? Inquiry. 2002;39(4):400–412.
- . Institute for Healthcare Improvement. Patient flow comments. Available at: http://www.ihi.org/IHI/Topics/Flow. Accessed September 10, 2008.
- . Factory efficiency comes to the hospital. New York Times. July 9, 2010.
- Institute for Healthcare Improvement. Re‐engineering the operating room. Available at: http://www.ihi.org/IHI/Programs/ConferencesAndSeminars/ReengineeringtheOperatingRoomSept08.htm. Accessed November 8, 2008.
- , . Enhanced weekend service: an affordable means to increased hospital procedure volume. CMAJ. 2005;172(4):503–504.
- , . Mortality among patients admitted to hospitals on weekends as compared with weekdays. N Engl J Med. 2001;345:663–668.
- , , , , , . Weekend versus weekday admission and mortality from myocardial infarction. N Engl J Med. 2007;356:1099–1109.
- , . Waiting for urgent procedures on the weekend among emergently hospitalized patients. Am J Med. 2004;117:175–181.
- . Do hospitals provide lower quality care on weekends? Health Serv Res. 2007;42:1589–1612.
- . Hospital saves by working weekends. Mod Healthc. 1996;26:82–99.
- , , , , . Weekend and holiday exercise testing in patients with chest pain. J Gen Intern Med. 1999;14:10–14.
- . Boston Medical Center Case Study: Institute of Healthcare Optimization; 2006. Available at: http://www.ihoptimize.org/8f16e142‐eeaa‐4898–9e62–660218f19ffb/download.htm. Accessed October 3, 2010.
- , , , . The impact of IMPACT on St John's Regional Health Center. Mo Med. 2003;100:590–592.
- NYU Langone Medical Center Extends Access to Non‐Emergent Care as Part of Commitment to Patient‐Centered Care (June 23, 2010). Available at: http://communications.med.nyu.edu/news/2010/nyu‐langone‐medical‐center‐extends‐access‐non‐emergent‐care‐part‐commitment‐patient‐center. Accessed October 3, 2010.
- Carondelet St. Mary's Hospital. A pragmatic approach to improving patient efficiency throughput. Improvement Report 2005. Available at: http://www.ihi.org/IHI/Topics/Flow/PatientFlow/ImprovementStories/APragmaticApproachtoImprovingPatientEfficiencyThroughput.htm. Accessed October 3, 2010.
- AHA Solutions. Patient Flow Challenges Assessment 2009. Chicago, IL; 2009.
- , , , , , . A conceptual model of emergency department crowding. Ann Emerg Med. 2003;42(2):173–180.
- . Annual bed statistics give a misleading picture of hospital surge capacity. Ann Emerg Med. 2006;48(4):384–388.
High levels of hospital occupancy are associated with compromises to quality of care and access (often referred to as crowding), 18 while low occupancy may be inefficient and also impact quality. 9, 10 Despite this, hospitals typically have uneven occupancy. Although some demand for services is driven by factors beyond the control of a hospital (eg, seasonal variation in viral illness), approximately 15%30% of admissions to children's hospitals are scheduled from days to months in advance, with usual arrivals on weekdays. 1114 For example, of the 3.4 million elective admissions in the 2006 Healthcare Cost and Utilization Project Kids Inpatient Database (HCUP KID), only 13% were admitted on weekends. 14 Combined with short length of stay (LOS) for such patients, this leads to higher midweek and lower weekend occupancy. 12
Hospitals respond to crowding in a number of ways, but often focus on reducing LOS to make room for new patients. 11, 15, 16 For hospitals that are relatively efficient in terms of LOS, efforts to reduce it may not increase functional capacity adequately. In children's hospitals, median lengths of stay are 2 to 3 days, and one‐third of hospitalizations are 1 day or less. 17 Thus, even 10%20% reductions in LOS trims hours, not days, from typical stays. Practical barriers (eg, reluctance to discharge in the middle of the night, or family preferences and work schedules) and undesired outcomes (eg, increased hospital re‐visits) are additional pitfalls encountered by relying on throughput enhancement alone.
Managing scheduled admissions through smoothing is an alternative strategy to reduce variability and high occupancy. 6, 12, 1820 The concept is to proactively control the entry of patients, when possible, to achieve more even levels of occupancy, instead of the peaks and troughs commonly encountered. Nonetheless, it is not a widely used approach. 18, 20, 21 We hypothesized that children's hospitals had substantial unused capacity that could be used to smooth occupancy, which would reduce weekday crowding. While it is obvious that smoothing will reduce peaks to average levels (and also raise troughs), we sought to quantify just how large this difference wasand thereby quantify the potential of smoothing to reduce inpatient crowding (or, conversely, expose more patients to high levels of occupancy). Is there enough variation to justify smoothing, and, if a hospital does smooth, what is the expected result? If the number of patients removed from exposure to high occupancy is not substantial, other means to address inpatient crowding might be of more value. Our aims were to quantify the difference in weekday versus weekend occupancy, report on mathematical feasibility of such an approach, and determine the difference in number of patients exposed to various levels of high occupancy.
Methods
Data Source
This retrospective study was conducted with resource‐utilization data from 39 freestanding, tertiary‐care children's hospitals in the Pediatric Health Information System (PHIS). Participating hospitals are located in noncompeting markets of 23 states, plus the District of Columbia, and affiliated with the Child Health Corporation of America (CHCA, Shawnee Mission, KS). They account for 80% of freestanding, and 20% of all general, tertiary‐care children's hospitals. Data quality and reliability are assured through joint ongoing, systematic monitoring. The Children's Hospital of Philadelphia Committees for the Protection of Human Subjects approved the protocol with a waiver of informed consent.
Patients
Patients admitted January 1December 31, 2007 were eligible for inclusion. Due to variation in the presence of birthing, neonatal intensive care, and behavioral health units across hospitals, these beds and associated patients were excluded. Inpatients enter hospitals either as scheduled (often referred to as elective) or unscheduled (emergent or urgent) admissions. Because PHIS does not include these data, KID was used to standardize the PHIS data for proportion of scheduled admissions. 22 (KID is a healthcare database of 23 million pediatric inpatient discharges developed through federalstateindustry partnership, and sponsored by the Agency for Healthcare Research and Quality [AHRQ].) Each encounter in KID includes a principal International Classification of Diseases, 9th revision (ICD‐9) discharge diagnosis code, and is designated by the hospital as elective (ranging from chemotherapy to tonsillectomy) or not elective. Because admissions, rather than diagnoses, are scheduled, a proportion of patients with each primary diagnosis in KID are scheduled (eg, 28% of patients with a primary diagnosis of esophageal reflux). Proportions in KID were matched to principal diagnoses in PHIS.
Definitions
The census was the number of patients registered as inpatients (including those physically in the emergency department [ED] from time of ED arrival)whether observation or inpatient statusat midnight, the conclusion of the day. Hospital capacity was set using CHCA data (and confirmed by each hospital's administrative personnel) as the number of licensed in‐service beds available for patients in 2007; we assumed beds were staffed and capacity fixed for the year. Occupancy was calculated by dividing census by capacity. Maximum occupancy in a week referred to the highest occupancy level achieved in a seven‐day period (MondaySunday). We analyzed a set of thresholds for high‐occupancy (85%, 90%, 95%, and 100%), because there is no consistent definition for when hospitals are at high occupancy or when crowding occurs, though crowding has been described as starting at 85% occupancy. 2325
Analysis
The hospital was the unit of analysis. We report hospital characteristics, including capacity, number of discharges, and census region, and annual standardized length of stay ratio (SLOSR) as observed‐to‐expected LOS.
Smoothing Technique
A retrospective smoothing algorithm set each hospital's daily occupancy during a week to that hospital's mean occupancy for the week; effectively spreading the week's volume of patients evenly across the days of the week. While inter‐week and inter‐month smoothing were considered, intra‐week smoothing was deemed more practical for the largest number of patients, as it would not mean delaying care by more than one week. In the case of a planned treatment course (eg, chemotherapy), only intra‐week smoothing would maintain the necessary scheduled intervals of treatment.
Mathematical Feasibility
To approximate the number of patient admissions that would require different scheduling during a particular week to achieve smoothed weekly occupancy, we determined the total number of patient‐days in the week that required different scheduling and divided by the average LOS for the week. We then divided the number of admissions‐to‐move by total weekly admissions to compute the percentage at each hospital across 52 weeks of the year.
Measuring the Impact of Smoothing
We focused on the frequency and severity of high occupancy and the number of patients exposed to it. This framework led to 4 measures that assess the opportunity and effect of smoothing:
Difference in hospital weekdayweekend occupancy: Equal to 12‐month median of difference between mean weekday occupancy and mean weekend occupancy for each hospital‐week.
Difference in hospital maximummean occupancy: Equal to median of difference between maximum one‐day occupancy and weekly mean (smoothed) occupancy for each hospital‐week. A regression line was derived from the data for the 39 hospitals to report expected reduction in peak occupancy based on the magnitude of the difference between weekday and weekend occupancy.
Difference in number of hospitals exposed to above‐threshold occupancy: Equal to difference, pre‐ and post‐smoothing, in number of hospitals facing high‐occupancy conditions on an average of at least one weekday midnight per week during the year at different occupancy thresholds.
Difference in number of patients exposed to above‐threshold occupancy: Equal to difference, pre‐ and post‐smoothing, in number of patients exposed to hospital midnight occupancy at the thresholds. We utilized patient‐days for the calculation to avoid double‐counting, and divided this by average LOS, in order to determine the number of patients who would no longer be exposed to over‐threshold occupancy after smoothing, while also adjusting for patients newly exposed to over‐threshold occupancy levels.
All analyses were performed separately for each hospital for the entire year and then for winter (DecemberMarch), the period during which most crowding occurred. Analyses were performed using SAS (version 9.2, SAS Institute, Inc, Cary, NC); P values <0.05 were considered statistically significant.
Results
The characteristics of the 39 hospitals are provided in Table 1. Based on standardization with KID, 23.6% of PHIS admissions were scheduled (range: 18.1%35.8%) or a median of 81.5 scheduled admissions per week per hospital; 26.6% of weekday admissions were scheduled versus 16.1% for weekends. Overall, 12.4% of scheduled admissions entered on weekends. For all patients, median LOS was three days (interquartile range [IQR]: twofive days), but median LOS for scheduled admissions was two days (IQR: onefour days). The median LOS and IQR were the same by day of admission for all days of the week. Most hospitals had an overall SLOSR close to one (median: 0.9, IQR: 0.91.1). Overall, hospital mean midnight occupancy ranged from 70.9% to 108.1% on weekdays and 65.7% to 94.9% on weekends. Uniformly, weekday occupancy exceeded weekend occupancy, with a median difference of 8.2% points (IQR: 7.2%9.5% points). There was a wide range of median hospital weekdayweekend occupancy differences across hospitals (Figure 1). The overall difference was less in winter (median difference: 7.7% points; IQR: 6.3%8.8% points) than in summer (median difference: 8.6% points; IQR: 7.4%9.8% points (Wilcoxon Sign Rank test, P < 0.001). Thirty‐five hospitals (89.7%) exceeded the 85% occupancy threshold and 29 (74.4%) exceeded the 95% occupancy threshold on at least 20% of weekdays (Table 2). Across all the hospitals, the median difference in weekly maximum and weekly mean occupancy was 6.6% points (IQR: 6.2%7.4% points) (Figure 2).
| Characteristics | No. (%) |
|---|---|
| |
| Licensed in‐service beds | n = 39 hospitals |
| <200 beds | 6 (15.4) |
| 200249 beds | 10 (25.6) |
| 250300 beds | 14 (35.9) |
| >300 beds | 9 (23.1) |
| No. of discharges | |
| <10,000 | 5 (12.8) |
| 10,00013,999 | 14 (35.9) |
| 14,00017,999 | 11 (28.2) |
| >18,000 | 9 (23.1) |
| Census region | |
| West | 9 (23.1) |
| Midwest | 11 (28.2) |
| Northeast | 6 (15.4) |
| South | 13 (33.3) |
| Admissions | n = 590,352 admissions |
| Medical scheduled admissions* | 79,683 |
| Surgical scheduled admissions* | 59,640 |
| Total scheduled admissions* (% of all admissions) | 139,323 (23.6) |
| Weekend medical scheduled admissions* (% of all medical scheduled admissions) | 13,546 (17.0) |
| Weekend surgical scheduled admissions* (% of all surgical scheduled admissions) | 3,757 (6.3) |
| Weekend total scheduled admissions* (% of total scheduled admissions) | 17,276 (12.4) |
| Entire Year | >85% | Occupancy Threshold | >95% | >100% |
|---|---|---|---|---|
| >90% | ||||
| ||||
| No. of hospitals (n = 39) with mean weekday occupancy above threshold | ||||
| Before smoothing (current state) | 33 | 25 | 14 | 6 |
| After smoothing | 32 | 22 | 10 | 1 |
| No. of hospitals (n = 39) above threshold 20% of weekdays | ||||
| Before smoothing (current state) | 35 | 34 | 29 | 14 |
| After smoothing | 35 | 32 | 21 | 9 |
| Median (IQR) no. of patient‐days per hospital not exposed to occupancy above threshold by smoothing | 3,071 | 281 | 3236 | 3281 |
| (5,552, 919) | (5,288, 3,103) | (0, 7,083) | (962, 8,517) | |
| Median (IQR) no. of patients per hospital not exposed to occupancy above threshold by smoothing | 596 | 50 | 630 | 804 |
| (1,190, 226) | (916, 752) | (0, 1,492) | (231, 2,195) | |
Smoothing reduced the number of hospitals at each occupancy threshold, except 85% (Table 2). As a linear relationship, the reduction in weekday peak occupancy (y) based on a hospital's median difference in weekly maximum and weekly mean occupancy (x) was y = 2.69 + 0.48x. Thus, a hospital with a 10% point difference between weekday and weekend occupancy could reduce weekday peak by 7.5% points.
Smoothing increased the number of patients exposed to the lower thresholds (85% and 90%), but decreased the number of patients exposed to >95% occupancy (Table 2). For example, smoothing at the 95% threshold resulted in 630 fewer patients per hospital exposed to that threshold. If all 39 hospitals had within‐week smoothing, a net of 39,607 patients would have been protected from exposure to >95% occupancy and a net of 50,079 patients from 100% occupancy.
To demonstrate the varied effects of smoothing, Table 3 and Figure 3 present representative categories of response to smoothing depending on pre‐smoothing patterns. While not all hospitals decreased occupancy to below thresholds after smoothing (Types B and D), the overall occupancy was reduced and fewer patients were exposed to extreme levels of high occupancy (eg, >100%).
| Category | Before Smoothing Hospital Description | After Smoothing Hospital Description | No. of Hospitals at 85% Threshold (n = 39) | No. of Hospitals at 95% Threshold (n = 39) |
|---|---|---|---|---|
| ||||
| Type A | Weekdays above threshold | All days below threshold, resulting in net decrease in patients exposed to occupancies above threshold | 3 | 1 |
| Weekends below threshold | ||||
| Type B | Weekdays above threshold | All days above threshold, resulting in net increase in patients exposed to occupancies above threshold | 12 | 18 |
| Weekends below threshold | ||||
| Type C | All days of week below threshold | All days of week below threshold | 6 | 19 |
| Type D | All days of week above threshold | All days of week above threshold, resulting in net decrease in patients exposed to extreme high occupancy | 18 | 1 |
To achieve within‐week smoothing, a median of 7.4 patient‐admissions per week (range: 2.314.4) would have to be scheduled on a different day of the week. This equates to a median of 2.6% (IQR: 2.25%, 2.99%; range: 0.02%9.2%) of all admissionsor 9% of a typical hospital‐week's scheduled admissions.
Discussion
This analysis of 39 children's hospitals found high levels of occupancy and weekend occupancy lower than weekday occupancy (median difference: 8.2% points). Only 12.4% of scheduled admissions entered on weekends. Thus, weekend capacity is available to offset high weekday occupancy. Hospitals at the higher end of the occupancy thresholds (95%, 100%) would reduce the number of days operating at very high occupancy and the number of patients exposed to such levels by smoothing. This change is mathematically feasible, as a median of 7.4 patients would have to be proactively scheduled differently each week, just under one‐tenth of scheduled admissions. Since LOS by day of admission was the same (median: two days), the opportunity to affect occupancy by shifting patients should be relatively similar for all days of the week. In addition, these admissions were short, conferring greater flexibility. Implementing smoothing over the course of the week does not necessarily require admitting patients on weekends. For example, Monday admissions with an anticipated three‐day LOS could enter on Friday with anticipated discharge on Monday to alleviate midweek crowding and take advantage of unoccupied weekend beds. 26
At the highest levels of occupancy, smoothing reduces the frequency of reaching these maximum levels, but can have the effect of actually exposing more patient‐days to a higher occupancy. For example, for nine hospitals in our analysis with >20% of days over 100%, smoothing decreased days over 100%, but exposed weekend patients to higher levels of occupancy (Figure 3). Since most admissions are short and most scheduled admissions currently occur on weekdays, the number of individual patients (not patient‐days) newly exposed to such high occupancy may not increase much after smoothing at these facilities. Regardless, hospitals with such a pattern may not be able to rely solely on smoothing to avoid weekday crowding, and, if they are operating efficiently in terms of SLOSR, might be justified in building more capacity.
Consistent with our findings, the Institute for Healthcare Improvement, the Institute for Healthcare Optimization, and the American Hospital Association Quality Center stress that addressing artificial variability of scheduled admissions is a critical first step to improving patient flow and quality of care while reducing costs. 18, 21, 27 Our study suggests that small numbers of patients need to be proactively scheduled differently to decrease midweek peak occupancy, so only a small proportion of families would need to find this desirable to make it attractive for hospitals and patients. This type of proactive smoothing decreases peak occupancy on weekdays, reducing the safety risks associated with high occupancy, improving acute access for emergent patients, shortening wait‐times and loss of scheduled patients to another facility, and increasing procedure volume (3%74% in one study). 28 Smoothing may also increase quality and safety on weekends, as emergent patients admitted on weekends experience more delays in necessary treatment and have worse outcomes. 2932 In addition, increasing scheduled admissions to span weekends may appeal to some families wishing to avoid absence from work to be with their hospitalized child, to parents concerned about school performanceand may also appeal to staff members seeking flexible schedules. Increasing weekend hospital capacity is safe, feasible, and economical, even when considering the increased wages for weekend work. 33, 34 Finally, smoothing over the whole week allows fixed costs (eg, surgical suites, imaging equipment) to be allocated over 7 days rather than 5, and allows for better matching of revenue to the fixed expenses.
Rather than a prescriptive approach, our work suggests hospitals need to identify only a small number of patients to proactively shift, providing them opportunities to adapt the approach to local circumstances. The particular patients to move around may also depend on the costs and benefits of services (eg, radiologic, laboratory, operative) and the hospital's existing patterns of staffing. A number of hospitals that have engaged in similar work have achieved sustainable results, such as Seattle Children's Hospital, Boston Medical Center, St. John's Regional Health Center, and New York University Langone Medical Center. 19, 26, 3537 In these cases, proactive smoothing took advantage of unused capacity and decreased crowding on days that had been traditionally very full. Hospitals that rarely or never have high‐occupancy days, and that do not expect growth in volume, may not need to employ smoothing, whereas others that have crowding issues primarily in the winter may wish to implement smoothing techniques seasonally.
Aside from attempting to reduce high‐occupancy through modification of admission patterns, other proactive approaches include optimizing staffing and processes around care, improving efficiency of care, and building additional beds. 16, 25, 38, 39 However, the expense of construction and the scarcity of capital often preclude this last option. Among children's hospitals, with SLOSR close to one, implementing strategies to reduce the LOS during periods of high occupancy may not result in meaningful reductions in LOS, as such approaches would only decrease the typical child's hospitalization by hours, not days. In addition to proactive strategies, hospitals also rely on reactive approaches, such as ED boarding, placing patients in hallways on units, diverting ambulances or transfers, or canceling scheduled admissions at the last moment, to decrease crowding. 16, 39, 40
This study has several limitations. First, use of administrative data precluded modeling all responses. For example, some hospitals may be better able to accommodate fluctuations in census or high occupancy without compromising quality or access. Second, we only considered intra‐week smoothing, but hospitals may benefit from smoothing over longer periods of time, especially since children's hospitals are busier in winter months, but incoming scheduled volume is often not reduced. 11 Hospitals with large occupancy variations across months may want to consider broadening the time horizon for smoothing, and weigh the costs and benefits over that period of time, including parental and clinician concerns and preferences for not delaying treatment. At the individual hospital level, discrete‐event simulation would likely be useful to consider the trade‐offs of smoothing to different levels and over different periods of time. Third, we assumed a fixed number of beds for the year, an approach that may not accurately reflect actual available beds on specific days. This limitation was minimized by counting all beds for each hospital as available for all the days of the year, so that hospitals with a high census when all available beds are included would have an even higher percent occupancy if some of those beds were not actually open. In a related way, then, we also do not consider how staffing may need to be altered or augmented to care for additional patients on certain days. Fourth, midnight census, the only universally available measure, was used to determine occupancy rather than peak census. Midnight census provides a standard snapshot, but is lower than mid‐day peak census. 41 In order to account for these limitations, we considered several different thresholds of high occupancy. Fifth, we smoothed at the hospital level, but differential effects may exist at the unit level. Sixth, to determine proportion of scheduled admissions, we used HCUP KID proportions on PHIS admissions. Overall, this approach likely overestimated scheduled medical admissions on weekends, thus biasing our result towards the null hypothesis. Finally, only freestanding children's hospitals were included in this study. While this may limit generalizability, the general concept of smoothing occupancy should apply in any setting with substantial and consistent variation.
In summary, our study revealed that children's hospitals often face high midweek occupancy, but also have substantial unused weekend capacity. Hospitals facing challenges with high weekday occupancy could proactively use a smoothing approach to decrease the frequency and severity of high occupancy. Further qualitative evaluation is also warranted around child, family, and staff preferences concerning scheduled admissions, school, and work.
- , , , . A comparison of in‐hospital mortality risk conferred by high hospital occupancy, differences in nurse staffing levels, weekend admission, and seasonal influenza. Medical Care. 2010;48(3):224–232.
- , , , et al. Hospital workload and adverse events. Med Care. 2007;45(5):448–455.
- , , , , . Impact of admission‐day crowding on the length of stay of pediatric hospitalizations. Pediatrics. 2008;121(4):e718–e730.
- , , , . The effect of hospital bed occupancy on throughput in the pediatric emergency department. Ann Emerg Med. 2009;53(6):767–776.
- . The tipping point: the relationship between volume and patient harm. Am J Med Qual. 2008;23(5):336–341.
- , , , , , . Managing unnecessary variability in patient demand to reduce nursing stress and improve patient safety. Jt Comm J Qual Patient Saf. 2005;31(6):330–338.
- Hospital‐Based Emergency Care: At the Breaking Point. Washington, DC: Institute of Medicine Committee on the Future of Emergency Care in the United States Health System; 2006.
- , , , , . The effect of hospital occupancy on emergency department length of stay and patient disposition. Acad Emerg Med. 2003;10(2):127–133.
- . Interpreting the Volume‐Outcome Relationship in the Context of Health Care Quality: Workshop Summary. Washington, DC: National Academies Press; 2000.
- , , , , . Has recognition of the relationship between mortality rates and hospital volume for major cancer surgery in California made a difference? A follow‐up analysis of another decade. Ann Surg. 2009;250(3):472–483.
- , , , et al. Children's hospitals do not acutely respond to high occupancy. Pediatrics. 2010;125:974–981.
- , , , , , . Scheduled admissions and high occupancy at a children's hospital. J Hosp Med. 2011;6(2):81–87.
- , , . Characteristics of weekday and weekend hospital admissions. HCUP Statistical Brief. 2010;87.
- Agency for Healthcare Research and Quality. HCUP databases, Healthcare Cost and Utilization Project (HCUP); 2008. Available at: http://www.hcup‐us.ahrq.gov/kidoverview.jsp. Accessed July 15, 2009.
- , et al. Managing capacity to reduce emergency department overcrowding and ambulance diversions. J Qual Patient Saf. 2006;32(5):239–245.
- Institute for Healthcare Improvement. Flow initiatives; 2008. Available at: http://www.ihi.org/IHI/Topics/Flow. Accessed February 20, 2008.
- , , , , , . Trends in high‐turnover stays among children hospitalized in the United States, 1993–2003. Pediatrics. 2009;123(3):996–1002.
- Institute for Healthcare Improvement. Smoothing elective surgical admissions. Available at: http://www.ihi.org/IHI/Topics/Flow/PatientFlow/EmergingContent/SmoothingElectiveSurgicalAdmissions.htm. Accessed October 24, 2008.
- Boston hospital sees big impact from smoothing elective schedule. OR Manager. 2004;20:12.
- . Managing Variability in Patient Flow Is the Key to Improving Access to Care, Nursing Staffing, Quality of Care, and Reducing Its Cost. Paper presented at Institute of Medicine, Washington, DC; June 24, 2004.
- American Hospital Association Quality Center. Available at: http://www.ahaqualitycenter.org/ahaqualitycenter/. Accessed October 14, 2008.
- Healthcare Cost and Utilization Project (HCUP). Kids' Inpatient Database (KID); July 2008. Available at: http://www.hcup‐us.ahrq.gov/kidoverview.jsp. Accessed September 10, 2008.
- , , . Using a queuing model to help plan bed allocation in a department of geriatric medicine. Health Care Manag Sci. 2002;5(4):307–313.
- . How many hospital beds? Inquiry. 2002;39(4):400–412.
- . Institute for Healthcare Improvement. Patient flow comments. Available at: http://www.ihi.org/IHI/Topics/Flow. Accessed September 10, 2008.
- . Factory efficiency comes to the hospital. New York Times. July 9, 2010.
- Institute for Healthcare Improvement. Re‐engineering the operating room. Available at: http://www.ihi.org/IHI/Programs/ConferencesAndSeminars/ReengineeringtheOperatingRoomSept08.htm. Accessed November 8, 2008.
- , . Enhanced weekend service: an affordable means to increased hospital procedure volume. CMAJ. 2005;172(4):503–504.
- , . Mortality among patients admitted to hospitals on weekends as compared with weekdays. N Engl J Med. 2001;345:663–668.
- , , , , , . Weekend versus weekday admission and mortality from myocardial infarction. N Engl J Med. 2007;356:1099–1109.
- , . Waiting for urgent procedures on the weekend among emergently hospitalized patients. Am J Med. 2004;117:175–181.
- . Do hospitals provide lower quality care on weekends? Health Serv Res. 2007;42:1589–1612.
- . Hospital saves by working weekends. Mod Healthc. 1996;26:82–99.
- , , , , . Weekend and holiday exercise testing in patients with chest pain. J Gen Intern Med. 1999;14:10–14.
- . Boston Medical Center Case Study: Institute of Healthcare Optimization; 2006. Available at: http://www.ihoptimize.org/8f16e142‐eeaa‐4898–9e62–660218f19ffb/download.htm. Accessed October 3, 2010.
- , , , . The impact of IMPACT on St John's Regional Health Center. Mo Med. 2003;100:590–592.
- NYU Langone Medical Center Extends Access to Non‐Emergent Care as Part of Commitment to Patient‐Centered Care (June 23, 2010). Available at: http://communications.med.nyu.edu/news/2010/nyu‐langone‐medical‐center‐extends‐access‐non‐emergent‐care‐part‐commitment‐patient‐center. Accessed October 3, 2010.
- Carondelet St. Mary's Hospital. A pragmatic approach to improving patient efficiency throughput. Improvement Report 2005. Available at: http://www.ihi.org/IHI/Topics/Flow/PatientFlow/ImprovementStories/APragmaticApproachtoImprovingPatientEfficiencyThroughput.htm. Accessed October 3, 2010.
- AHA Solutions. Patient Flow Challenges Assessment 2009. Chicago, IL; 2009.
- , , , , , . A conceptual model of emergency department crowding. Ann Emerg Med. 2003;42(2):173–180.
- . Annual bed statistics give a misleading picture of hospital surge capacity. Ann Emerg Med. 2006;48(4):384–388.
Copyright © 2011 Society of Hospital Medicine
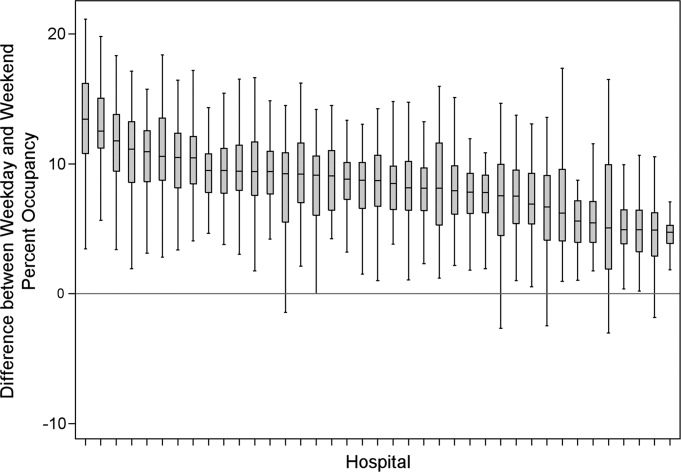
Treatment of Complicated Pneumonia
Community‐acquired pneumonia, the most common serious bacterial infection in childhood, may be complicated by parapneumonic effusion (ie, complicated pneumonia).1 Children with complicated pneumonia require prolonged hospitalization and frequently undergo multiple pleural fluid drainage procedures.2 Additionally, the incidence of complicated pneumonia has increased,37 making the need to define appropriate therapy even more pressing. Defining appropriate therapy is challenging for the individual physician as a result of inconsistent and insufficient evidence, and wide variation in treatment practices.2, 8
Historically, thoracotomy was performed only if initial chest tube placement did not lead to clinical improvement.9, 10 Several authors, noting the rapid resolution of symptoms in children undergoing earlier thoracotomy, advocated for the use of thoracotomy as initial therapy rather than as a procedure of last resort.114 The advent of less invasive techniques such as video‐assisted thoracoscopic surgery (VATS) has served as an additional impetus to consider surgical drainage as the initial treatment strategy.1518 Few well‐designed studies have examined the relative efficacy of these interventions.2, 1922 Published randomized trials were single center, enrolled few patients, and arrived at different conclusions.19, 21, 22 In addition, these trials did not examine other important outcomes such as requirement for additional pleural fluid drainage procedures and hospital readmission. Two large retrospective multicenter studies found modest reductions in length of stay (LOS) and substantial decreases in the requirement for additional pleural fluid drainage procedures in children undergoing initial VATS compared with initial chest tube placement.2, 20 However, Shah et al2 included relatively few patients undergoing VATS. Li et al20 combined patients undergoing initial thoracentesis, initial chest tube placement, late pleural fluid drainage (by any method), and no pleural fluid drainage into a single non‐operative management category, precluding conclusions about the relative benefits of chest tube placement compared with VATS. Neither study2, 20 examined the role of chemical fibrinolysis, a therapy which has been associated with outcomes comparable to VATS in two small randomized trials.21, 22
The objectives of this multicenter study were to describe the variation in the initial management strategy along with associated outcomes of complicated pneumonia in childhood and to determine the comparative effectiveness of different pleural fluid drainage procedures.
Methods
Data Source
The Pediatric Health Information System (PHIS), which contains resource utilization data from 40 freestanding children's hospitals, provided data for this multicenter retrospective cohort study. Participating hospitals are located in noncompeting markets of 27 states plus the District of Columbia. The PHIS database includes patient demographics, diagnoses, and procedures as well as data for all drugs, radiologic studies, laboratory tests, and supplies charged to each patient. Data are de‐identified, however encrypted medical record numbers allow for tracking individual patients across admissions. The Child Health Corporation of America (Shawnee Mission, KS) and participating hospitals jointly assure data quality and reliability as described previously.23, 24 The Children's Hospital of Philadelphia Institutional Review Board reviewed and approved this study.
Patients
Children 18 years of age receiving a pleural drainage procedure for complicated pneumonia were eligible if they were discharged from participating hospitals between January 1, 2004 and June 30, 2009. Study participants met the following criteria: 1) discharge diagnosis of pneumonia (International Classification of Diseases, 9th revision [ICD‐9] discharge diagnosis codes 480.x‐483.x, 485.x‐487.x), 2) discharge diagnosis of pleural effusion (ICD‐9 codes 510.0, 510.9, 511.0, 511.1, or 511.9), and 3) billing charge for antibiotics on the first day of hospitalization. Additionally, the primary discharge diagnosis had to be either pneumonia or pleural effusion. Patients were excluded if they did not undergo pleural fluid drainage or if their initial pleural fluid drainage procedure was thoracentesis.
Study Definitions
Pleural drainage procedures were identified using ICD‐9 procedure codes for thoracentesis (34.91), chest tube placement (34.04), VATS (34.21), and thoracotomy (34.02 or 34.09). Fibrinolysis was defined as receipt of urokinase, streptokinase, or alteplase within two days of initial chest tube placement.
Acute conditions or complications included influenza (487, 487.0, 487.1, 487.8, 488, or V04.81) and hemolytic‐uremic syndrome (283.11). Chronic comorbid conditions (CCCs) (eg, malignancy) were identified using a previously reported classification scheme.25 Billing data were used to classify receipt of mechanical ventilation and medications on the first day of hospitalization.
Measured Outcomes
The primary outcomes were hospital LOS (both overall and post‐initial procedure), requirement for additional pleural drainage procedures, total cost for index hospitalization, all‐cause readmission within 14 days after index hospital discharge, and total cost of the episode (accounting for the cost of readmissions).
Measured Exposures
The primary exposure of interest was the initial pleural fluid drainage procedure, classified as chest tube placement without fibrinolysis, chest tube placement with fibrinolysis, VATS, or thoracotomy.
Statistical Analysis
Variables were summarized using frequencies and percentages for categorical variables, and median, interquartile range (IQR), and range for continuous variables. Outcomes by initial pleural drainage procedure were compared using chi‐squared tests for categorical variables and Kruskal‐Wallis tests for continuous variables.
Multivariable analysis was performed to account for potential confounding by observed baseline variables. For dichotomous outcome variables, modeling consisted of logistic regression using generalized estimating equations to account for hospital clustering. For continuous variables, a mixed model approach was used, treating hospital as a random effect. Log transformation was applied to the right‐skewed outcome variables (LOS and cost). Cost outcomes remained skewed following log transformation, thus gamma mixed models were applied.2629 Odds ratios and 95% confidence intervals (CIs) were reported for comparison of dichotomous outcomes and the adjusted means and 95% CIs were reported for continuous outcomes after appropriate back transformation.
Additional analyses addressed the potential impact of confounding by indication inherent in any observational study. First, patients with an underlying CCC were excluded to ensure that our results would be generalizable to otherwise healthy children with community‐acquired pneumonia. Second, patients undergoing pleural drainage >2 days after hospitalization were excluded to minimize the effect of residual confounding related to differences in timing of the initial drainage procedure. Third, the analysis was repeated using a generalized propensity score as an additional method to account for confounding by indication for the initial drainage procedure.30 Propensity scores, constructed using a multivariable generalized logit model, included all variables listed in Table 1. The inverse of the propensity score was included as a weight in each multivariable model described previously. Only the primary multivariable analyses are presented as the results of the propensity score analysis were nearly identical to the primary analyses.
| Overall | Chest Tube Without Fibrinolysis | Chest Tube With Fibrinolysis | Thoracotomy | VATS | P Value | |
|---|---|---|---|---|---|---|
| ||||||
| N | 3500 | 1672 (47.8) | 623 (17.8) | 797 (22.8) | 408 (11.7) | |
| Age | ||||||
| <1 year | 335 (9.6) | 176 (10.5) | 56 (9.0) | 78 (9.8) | 25 (6.1) | |
| 1 year | 475 (13.6) | 238 (14.2) | 98 (15.7) | 92 (11.5) | 47 (11.5) | 0.003 |
| 24 years | 1230 (35.1) | 548 (32.8) | 203 (32.6) | 310 (38.9) | 169 (41.4) | |
| 59 years | 897 (25.6) | 412 (24.6) | 170 (27.3) | 199 (25.0) | 116 (28.4) | |
| 1014 years | 324 (9.3) | 167 (10.0) | 61 (9.8) | 65 (8.2) | 31 (7.6) | |
| 1518 years | 193 (5.5) | 106 (6.3) | 29 (4.6) | 40 (5.0) | 18 (4.4) | |
| >18 years | 46 (1.3) | 25 (1.5) | 6 (0.96) | 13 (1.6) | 2 (0.5) | |
| Comorbid Conditions | ||||||
| Cardiac | 69 (2.0) | 43 (2.6) | 14 (2.3) | 12 (1.5) | 0 (0.0) | 0.006 |
| Malignancy | 81 (2.3) | 31 (1.9) | 18 (2.9) | 21 (2.6) | 11 (2.7) | 0.375 |
| Neurological | 138 (3.9) | 73 (4.4) | 20 (3.2) | 34 (4.3) | 11 (2.7) | 0.313 |
| Any Other Condition | 202 (5.8) | 96 (5.7) | 40 (6.4) | 47 (5.9) | 19 (4.7) | 0.696 |
| Payer | ||||||
| Government | 1240 (35.6) | 630 (37.8) | 224 (36.0) | 259 (32.7) | 127 (31.3) | <0.001 |
| Private | 1383 (39.7) | 607 (36.4) | 283 (45.4) | 310 (39.2) | 183 (45.07) | |
| Other | 864 (24.8) | 430 (25.8) | 116 (18.6) | 222 (28.1) | 96 (23.65) | |
| Race | ||||||
| Non‐Hispanic White | 1746 (51.9) | 838 (51.6) | 358 (59.7) | 361 (47.8) | 189 (48.7) | <0.001 |
| Non‐Hispanic Black | 601 (17.9) | 318 (19.6) | 90 (15.0) | 128 (17.0) | 65 (16.8) | |
| Hispanic | 588 (17.5) | 280 (17.3) | 73 (12.2) | 155 (20.5) | 80 (20.6) | |
| Asian | 117 (3.5) | 47 (2.9) | 20 (3.3) | 37 (4.9) | 13 (3.4) | |
| Other | 314 (9.3) | 140 (8.6) | 59 (9.8) | 74 (9.8) | 41 (10.6) | |
| Male Sex | 1912 (54.6) | 923 (55.2) | 336 (53.9) | 439 (55.1) | 214 (52.5) | 0.755 |
| Radiology | ||||||
| CT, no US | 1200 (34.3) | 600 (35.9) | 184 (29.5) | 280 (35.1) | 136 (33.3) | <0.001 |
| CT and US | 221 (6.3) | 84 (5.0) | 53 (8.5) | 61 (7.7) | 23 (5.6) | |
| US, no CT | 799 (22.8) | 324 (19.4) | 178 (28.6) | 200 (25.1) | 97 (23.8) | |
| No US, no CT | 1280 (36.6) | 664 (39.7) | 208 (33.4) | 256 (32.1) | 152 (37.3) | |
| Empiric Antibiotic Regimen | ||||||
| Cephalosporins alone | 448 (12.8) | 181 (10.83) | 126 (20.2) | 73 (9.2) | 68 (16.7) | <0.001 |
| Cephalosporin and clindamycin | 797 (22.8) | 359 (21.5) | 145 (23.3) | 184 (23.1) | 109 (26.7) | |
| Other antibiotic combination | 167 (4.8) | 82 (4.9) | 30 (4.8) | 38 (4.8) | 17 (4.2) | |
| Cephalosporin and vancomycin | 2088 (59.7) | 1050 (62.8) | 322 (51.7) | 502 (63.0) | 214 (52.5) | |
| Mechanical ventilation | 494 (14.1) | 251 (15.0) | 75 (12.0) | 114 (14.3) | 54 (13.2) | 0.307 |
| Corticosteroids | 520 (14.9) | 291 (17.4) | 72 (11.6) | 114 (14.3) | 43 (10.5) | <0.001 |
| Blood product transfusionsb | 761 (21.7) | 387 (23.2) | 145 (23.3) | 161 (20.2) | 68 (16.7) | 0.018 |
| Vasoactive infusionsc | 381 (10.9) | 223 (13.3) | 63 (10.1) | 72 (9.0) | 23 (5.6) | <0.001 |
| Admission to intensive care | 1397 (39.9) | 731 (43.7) | 234 (37.6) | 296 (37.1) | 136 (33.3) | <0.001 |
| Extracorporeal membranous oxygenation | 18 (0.5) | 13 (0.8) | 2 (0.3) | 3 (0.4) | 0 (0.0) | 0.163 |
| Hemolytic‐uremic syndrome | 31 (0.9) | 15 (0.9) | 6 (1.0) | 7 (0.9) | 3 (0.7) | 0.985 |
| Influenza | 108 (3.1) | 53 (3.2) | 27 (4.3) | 23 (2.9) | 5 (1.2) | 0.044 |
| Arterial blood gas measurements | 0 (0,1) | 0 (0, 2) | 0 (0,1) | 0 (0, 1) | 0 (0, 1) | <0.001 |
| Days to first procedure | 1 (0, 3) | 1 (0, 2) | 1 (1, 3) | 1 (1, 3) | 1 (1, 3) | <0.001 |
Medical records of a randomly selected subset of subjects from 6 hospitals were reviewed to determine the accuracy of our algorithm in identifying patients with complicated pneumonia; these subjects represented 1% of the study population. For the purposes of medical record review, complicated pneumonia was defined by the following: 1) radiologically‐confirmed lung infiltrate; 2) moderate or large pleural effusion; and 3) signs and symptoms of lower respiratory tract infection. Complicated pneumonia was identified in 118 of 120 reviewed subjects for a positive predictive value of 98.3%.
All analyses were clustered by hospital. Analyses were performed using SAS version 9.2 (SAS Institute, Cary, NC). A two‐tailed P < 0.05 was considered statistically significant.
Results
Patient Characteristics
During the study period, 9,680 subjects had complicated pneumonia. Subjects were excluded if they did not have a pleural drainage procedure (n = 5798), or if thoracentesis was the first pleural fluid drainage procedure performed (n = 382). The remaining 3500 patients were included. Demographic characteristics are summarized in Table 1. The median patient age was 4.1 years (IQR: 2.17.2 years). An underlying CCC was present in 424 (12.1%) patients. There was no association between type of drainage procedure and mechanical ventilation. However, factors associated with more severe systemic illness, such as blood product transfusion, were more common among those undergoing initial chest tube placement with or without fibrinolysis (Table 1).
Initial Pleural Fluid Drainage Procedures
The primary procedures included chest tube without fibrinolysis (47.8%); chest tube with fibrinolysis (17.8%); thoracotomy (22.8%); and VATS (11.7%) (Table 1). The proportion of patients undergoing primary chest tube placement with fibrinolysis increased over time from 14.2% in 2004 to 30.0% in 2009 (P < 0.001; chi‐squared test for trend). The initial procedure varied by hospital with the greatest proportion of patients undergoing primary chest tube placement without fibrinolysis at 28 (70.0%) hospitals, chest tube placement with fibrinolysis at 5 (12.5%) hospitals, thoracotomy at 5 (12.5%) hospitals, and VATS at 2 (5.0%) hospitals (Figure 1). The median proportion of patients undergoing primary VATS across all hospitals was 11.5% (IQR: 3.9%‐26.5%) (Figure 1). The median time to first procedure was 1 day (IQR: 03 days).
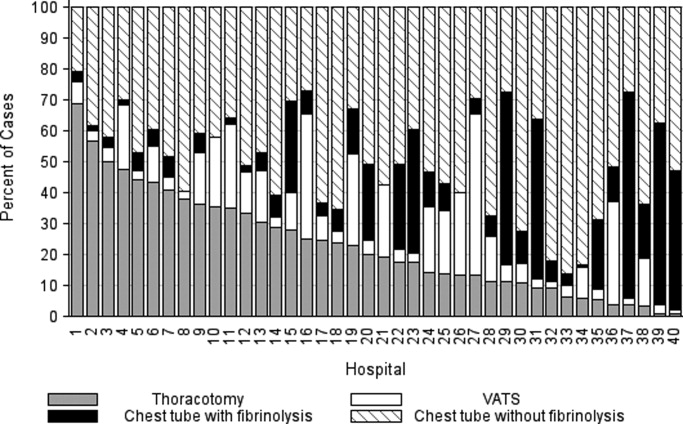
Outcome Measures
Variation in outcomes occurred across hospitals. Additional pleural drainage procedures were performed in a median of 20.9% of patients with a range of 6.8% to 44.8% (IQR: 14.5%‐25.3%) of patients across all hospitals. Median LOS was 10 days with a range of 714 days (IQR: 8.511 days) and the median LOS following the initial pleural fluid drainage procedure was 8 days with a range of 6 to 13 days (IQR: 78 days). Variation in timing of the initial pleural fluid drainage procedure explained 9.6% of the variability in LOS (Spearman rho, 0.31; P < 0.001).
Overall, 118 (3.4%) patients were readmitted within 14 days of index discharge; the median readmission rate was 3.8% with a range of 0.8% to 33.3% (IQR: 2.1%‐5.8%) across hospitals. The median total cost of the index hospitalization was $19,574 (IQR: $13,791‐$31,063). The total cost for the index hospitalization exceeded $54,215 for 10% of patients and the total cost of the episode exceeded $55,208 for 10% of patients. Unadjusted outcomes, stratified by primary pleural fluid drainage procedure, are summarized in Table 2.
| Overall | Chest Tube Without Fibrinolysis | Chest Tube With Fibrinolysis | Thoracotomy | VATS | P Valueb | |
|---|---|---|---|---|---|---|
| ||||||
| Additional Procedure | 716 (20.5) | 331 (19.8) | 144 (23.1) | 197 (24.7) | 44 (10.8) | <0.001 |
| Readmission within 14 days | 118 (3.4) | 54 (3.3) | 13 (2.1) | 32 (4.0) | 19 (4.7) | 0.096 |
| Total LOS (days) | 10 (7, 14) | 10 (7, 14) | 9 (7, 13) | 10 (7, 14) | 9 (7, 12) | <.001 |
| Post‐initial Procedure LOS (days) | 8 (5, 12) | 8 (6, 12) | 7 (5, 10) | 8 (5, 12) | 7 (5, 10) | <0.001 |
| Total Cost, Index Hospitalization ($)e | 19319 (13358, 30955) | 19951 (13576, 32018)c | 19565 (13209, 32778)d | 20352 (14351, 31343) | 17918 (13531, 25166) | 0.016 |
| Total Cost, Episode of Illness ($)e | 19831 (13927, 31749) | 20151 (13764, 32653) | 19593 (13210, 32861) | 20573 (14419, 31753) | 18344 (13835, 25462) | 0.029 |
In multivariable analysis, differences in total LOS and post‐procedure LOS were not significant (Table 3). The odds of additional drainage procedures were higher for all drainage procedures compared with initial VATS (Table 3). Patients undergoing initial chest tube placement with fibrinolysis were less likely to require readmission compared with patients undergoing initial VATS (Table 3). The total cost for the episode of illness (including the cost of readmission) was significantly less for those undergoing primary chest tube placement without fibrinolysis compared with primary VATS. The results of subanalyses excluding patients with an underlying CCC (Supporting Appendix online, Table 4) and restricting the cohort to patients undergoing pleural drainage within two days of admission (Supporting Appendix online, Table 5) were similar to the results of our primary analysis with one exception; in the latter subanalysis, children undergoing initial chest tube placement without fibrinolysis were also less likely to require readmission compared with patients undergoing initial VATS.
| Adjusted OR (95% CI)a | P Value | |
|---|---|---|
| ||
| Additional pleural drainage procedure | ||
| Chest tube without fibrinolysis | 1.82 (1.103.00) | .019 |
| Chest tube with fibrinolysis | 2.31 (1.443.72) | <0.001 |
| Thoracotomy | 2.59 (1.624.14) | <0.001 |
| VATS | Reference | |
| Readmission within 14 days | ||
| Chest tube without fibrinolysis | 0.61 (0.361.05) | .077 |
| Chest tube with fibrinolysis | 0.45 (0.230.86) | .015 |
| Thoracotomy | 0.85 (0.521.39) | .521 |
| VATS | Reference | |
| Adjusted Mean (95% CI)a | P Value | |
| Total LOS (days) | ||
| Chest tube without fibrinolysis | 8.0 (7.88.2) | .339 |
| Chest tube with fibrinolysis | 8.1 (7.98.3) | .812 |
| Thoracotomy | 8.1 (7.98.3) | .632 |
| VATS | 8.1 (7.98.3) | Ref |
| Post‐initial procedure LOS (days) | ||
| Chest tube without fibrinolysis | 7.3 (7.07.5) | .512 |
| Chest tube with fibrinolysis | 7.5 (7.27.8) | .239 |
| Thoracotomy | 7.3 (7.07.6) | .841 |
| VATS | 7.3 (7.17.6) | Reference |
| Total cost, index hospitalization ($) | ||
| Chest tube without fibrinolysis | 22928 (2200023895 | .012 |
| Chest tube with fibrinolysis | 23621 (2263124655) | .657 |
| Thoracotomy | 23386 (2241924395 | .262 |
| VATS | 23820 (2280824878) | Reference |
| Total cost, episode of illness ($) | ||
| Chest tube without fibrinolysis | 23218 (2227824199) | .004 |
| Chest tube with fibrinolysis | 23749 (2275224790) | .253 |
| Thoracotomy | 23673 (2269324696) | .131 |
| VATS | 24280 (2324425362) | Reference |
Discussion
This multicenter study is the largest to evaluate the management of children hospitalized with complicated pneumonia. We found considerable variation in initial management and outcomes across hospitals. Differences in timing of the initial drainage procedure explained only a small amount of the variability in outcomes. Children undergoing initial VATS less commonly required additional drainage procedures while children undergoing initial chest tube placement with fibrinolysis less commonly required readmission. Differences in total and post‐procedure LOS were not statistically significant. Differences in cost, while statistically significant, were of marginal relevance.
Previous studies have also shown significant variation in treatment and outcomes of children with complicated pneumonia across hospitals.2, 8 Our study provides data from additional hospitals, includes a substantially larger number of patients undergoing initial VATS, distinguishes between fibrinolysis recipients and nonrecipients, and is the first to compare outcomes between four different initial drainage strategies. The creation of national consensus guidelines might reduce variability in initial management strategies, although the variability in outcomes across hospitals in the current study could not be explained simply by differences in the type or timing of the initial drainage procedure. Thus, future studies examining hospital‐level factors may play an important role in improving quality of care for children with complicated pneumonia.
Patients with initial thoracotomy or chest tube placement with or without fibrinolysis more commonly received additional drainage procedures than patients with initial VATS. This difference remained when patients with CCCs were excluded from the analysis and when the analysis was limited to patients undergoing pleural fluid drainage within 2 days of hospitalization. Several small, randomized trials demonstrated conflicting results when comparing initial chest tube placement with fibrinolysis and VATS. St. Peter et al22 reported that 3 (17%) of 18 patients undergoing initial chest tube placement with fibrinolysis and none of the 18 patients undergoing initial VATS received additional pleural drainage procedures. Sonnappa et al21 found no differences between the two groups. Kurt et al19 did not state the proportion of patients receiving additional procedures. However, the mean number of drainage procedures was 2.25 among the 8 patients undergoing initial chest tube placement while none of the 10 patients with VATS received additional drainage.19
Thoracotomy is often perceived as a definitive procedure for treatment of complicated pneumonia. However, several possibilities exist to explain why additional procedures were performed less frequently in patients undergoing initial VATS compared with initial thoracotomy. The limited visual field in thoracotomy may lead to greater residual disease post‐operatively in those receiving thoracotomy compared with VATS.31 Additionally, thoracotomy substantially disrupts the integrity of the chest wall and is consequently associated with complications such as bleeding and air leak into the pleural cavity more often than VATS.31, 32 It is thus possible that some of the additional procedures in patients receiving initial thoracotomy were necessary for management of thoracotomy‐associated complications rather than for failure of the initial drainage procedure.
Similar to the randomized trials by Sonnappa et al21 and St. Peter et al,22 differences in the overall and post‐procedure LOS were not significant among patients undergoing initial VATS compared with initial chest tube placement with fibrinolysis. However, chest tube placement without fibrinolysis did not result in significant differences in LOS compared with initial VATS. In the only pediatric randomized trial, the 29 intrapleural urokinase recipients had a 2 day shorter LOS compared with the 29 intrapleural saline recipients.33 Several small, randomized controlled trials of adults with complicated pneumonia reported improved pleural fluid drainage among intrapleural fibrinolysis recipients compared with non‐recipients.3436 However, a large multicenter randomized trial in adults found no differences in mortality, requirement for surgical drainage, or LOS between intrapleural streptokinase and placebo recipients.37 Subsequent meta‐analyses of randomized trials in adults also demonstrated no benefit to fibrinolysis.38, 39 In the context of the increasing use of intrapleural fibrinolysis in children with complicated pneumonia, our results highlight the need for a large, multicenter randomized controlled trial to determine whether chest tube with fibrinolysis is superior to chest tube alone.
Two small randomized trials21, 22 and a decision analysis40 identified chest tube with fibrinolysis as the most economical approach to children with complicated pneumonia. However, the costs did not differ significantly between patients undergoing initial VATS or initial chest tube placement with fibrinolysis in our study. The least costly approach was initial chest tube placement without fibrinolysis. Unlike the randomized controlled trials, we considered costs associated with readmissions in determining the total costs. Shah et al41 found no difference in total charges for patients undergoing initial VATS compared with initial chest tube placement; however, patients undergoing initial VATS were concentrated in a few centers, making it difficult to determine the relative importance of procedural and hospital factors.
This multicenter observational study has several limitations. First, discharge diagnosis coding may be unreliable for specific diseases. However, our rigorous definition of complicated pneumonia, supported by the high positive predictive value as verified by medical record review, minimizes the likelihood of misclassification.
Second, unmeasured confounding or residual confounding by indication for the method of pleural drainage may occur, potentially influencing our results in two disparate ways. If patients with more severe systemic illness were too unstable for operative interventions, then our results would be biased towards worse outcomes for children undergoing initial chest tube placement. We adjusted for several variables associated with a greater systemic severity of illness, including intensive care unit admission, making this possibility less likely. We also could not account for some factors associated with more severe local disease such as the size and character of the effusion. We suspect that patients with more extensive local disease (ie, loculated effusions) would have worse outcomes than other patients, regardless of initial procedure, and that these patients would also be more likely to undergo primary surgical drainage. Thus, this study may have underestimated the benefit of initial surgical drainage (eg, VATS) compared with nonsurgical drainage (ie, chest tube placement).
Third, misclassification of the method of initial pleural drainage may have occurred. Patients transferred from another institution following chest tube placement could either be classified as not receiving pleural drainage and thus excluded from the study or classified as having initial VATS or thoracotomy if the reason for transfer was chest tube treatment failure. Additionally, we could not distinguish routine use of fibrinolysis from fibrinolysis to maintain chest tube patency. Whether such misclassification would falsely minimize or maximize differences in outcomes between the various groups remains uncertain. Fourth, because this study only included tertiary care children's hospitals, these data are not generalizable to community settings. VATS requires specialized surgical training that may be unavailable in some areas. Finally, this study demonstrates the relative efficacy of various pleural fluid drainage procedures on short‐term clinical outcomes and resource utilization. However, long‐term functional outcomes should be measured in future prospective studies.
Conclusions
In conclusion, emphasis on evidence driven treatment to optimize care has led to an increasing examination of unwarranted practice variation.42 The lack of evidence for best practice makes it difficult to define unwarranted variation in the treatment of complicated pneumonia. Our study demonstrates the large variability in practice and raises additional questions regarding the optimal drainage strategies. Published randomized trials have focused on comparisons between chest tube placement with fibrinolysis and VATS. However, our data suggest that future randomized trials should include chest tube placement without fibrinolysis as a treatment strategy. In determining the current best treatment for patients with complicated pneumonia, a clinician must weigh the impact of needing an additional procedure in approximately one‐quarter of patients undergoing initial chest tube placement (with or without fibrinolysis) with the risks of general anesthesia and readmission in patients undergoing initial VATS.
Acknowledgements
Dr. Hall had full access to all the data in the study and takes responsibility for the integrity of the data and accuracy of the analysis.
- ,.Parapneumonic pleural effusion and empyema in children. Review of a 19‐year experience, 1962–1980.Clin Pediatr (Phila).1983;22:414–419.
- ,,,,.Primary early thoracoscopy and reduction in length of hospital stay and additional procedures among children with complicated pneumonia: Results of a multicenter retrospective cohort study.Arch Pediatr Adolesc Med.2008;162:675–681.
- ,.Empyema hospitalizations increased in US children despite pneumococcal conjugate vaccine.Pediatrics.2010;125:26–33.
- ,,, et al.Impact of the pneumococcal conjugate vaccine on pneumococcal parapneumonic empyema.Pediatr Infect Dis J.2006;25:250–254.
- ,,,,.Five‐fold increase in pediatric parapneumonic empyema since introduction of pneumococcal conjugate vaccine.Pediatric Infect Dis J.2008;27:1030–1032.
- ,,,.Increasing incidence of empyema complicating childhood community‐acquired pneumonia in the United States.Clin Infect Dis.2010;50:805–813.
- ,,,,.National hospitalization trends for pediatric pneumonia and associated complications.Pediatrics.2010;126:204–213.
- ,,, et al.Empyema associated with community‐acquired pneumonia: A Pediatric Investigator's Collaborative Network on Infections in Canada (PICNIC) study.BMC Infect Dis.2008;8:129.
- ,,,,.Pleural empyema in children.Ann Thorac Surg.1970;10:37–44.
- ,,.Management of streptococcal empyema.Ann Thorac Surg.1966;2:658–664.
- ,.Thoracoscopy in the management of empyema in children.J Pediatr Surg.1993;28:1128–1132.
- ,,,.Surgical treatment of parapneumonic empyema.Pediatr Pulmonol.1996;22:348–356.
- ,.The controversial role of decortication in the management of pediatric empyema.J Thorac Cardiovasc Surg.1988;96:166–170.
- ,,,,,.Postpneumonic empyema in children treated by early decortication.Eur J Pediatr Surg.1997;7:135–137.
- ,.Video‐assisted thoracoscopic surgery in the management of pediatric empyema.JSLS.1997;1:251–3.
- ,,,.Early video‐assisted thoracic surgery in the management of empyema.Pediatrics.1999;103:e63.
- ,,,,.Early definitive intervention by thoracoscopy in pediatric empyema.J Pediatr Surg.1999;34:178–180; discussion80–81.
- ,,,,.Thoracoscopy in the management of pediatric empyema.J Pediatr Surg.1995;30:1211–1215.
- ,,,,.Therapy of parapneumonic effusions in children: Video‐assisted thoracoscopic surgery versus conventional thoracostomy drainage.Pediatrics.2006;118:e547–e553.
- ,.Primary operative management for pediatric empyema: Decreases in hospital length of stay and charges in a national sample.Arch Pediatr Adolesc Med.2008;162:44–48.
- ,,, et al.Comparison of urokinase and video‐assisted thoracoscopic surgery for treatment of childhood empyema.Am J Respir Crit Care Med.2006;174:221–227.
- ,,, et al.Thoracoscopic decortication vs tube thoracostomy with fibrinolysis for empyema in children: A prospective, randomized trial.J Pediatr Surg.2009;44:106–111; discussion11.
- ,,,.Corticosteroids and mortality in children with bacterial meningitis.JAMA.2008;299:2048–2055.
- ,,,,.Intravenous immunoglobulin in children with streptococcal toxic shock syndrome.Clin Infect Dis.2009;49:1369–1376.
- ,,, et al.Deaths attributed to pediatric complex chronic conditions: National trends and implications for supportive care services.Pediatrics.2001;107:e99.
- ,.Multiple regression of cost data: Use of generalised linear models.J Health Serv Res Policy.2004;9:197–204.
- ,,,.A robustified modeling approach to analyze pediatric length of stay.Ann Epidemiol.2005;15:673–677.
- ,,.Correlates of length of stay, cost of care, and mortality among patients hospitalized for necrotizing fasciitis.Epidemiol Infect.2007;135:868–876.
- ,,,,,.Health care costs of adults treated for attention‐deficit/hyperactivity disorder who received alternative drug therapies.J Manag Care Pharm.2007;13:561–569.
- .The role of the propensity score in estimating dose‐response functions.Biometrika.2000;87:706–710.
- ,,,,.Experience with video‐assisted thoracoscopic surgery in the management of complicated pneumonia in children.J Pediatr Surg.2001;36:316–319.
- ,,, et al.VATS debridement versus thoracotomy in the treatment of loculated postpneumonia empyema.Ann Thorac Surg.1996;61:1626–1630.
- ,,,,.Randomised trial of intrapleural urokinase in the treatment of childhood empyema.Thorax.2002;57:343–347.
- ,,,,,.Intrapleural urokinase versus normal saline in the treatment of complicated parapneumonic effusions and empyema. A randomized, double‐blind study.Am J Respir Crit Care Med.1999;159:37–42.
- ,,.Randomised controlled trial of intrapleural streptokinase in community acquired pleural infection.Thorax.1997;52:416–421.
- ,,,,.Intrapleural streptokinase for empyema and complicated parapneumonic effusions.Am J Respir Crit Care Med.2004;170:49–53.
- ,,, et al.U.K. Controlled trial of intrapleural streptokinase for pleural infection.N Engl J Med.2005;352:865–874.
- ,.Intra‐pleural fibrinolytic therapy versus conservative management in the treatment of adult parapneumonic effusions and empyema.Cochrane Database Syst Rev.2008:CD002312.
- ,,,.Intrapleural fibrinolytic agents for empyema and complicated parapneumonic effusions: A meta‐analysis.Chest.2006;129:783–790.
- ,,.Cost‐effectiveness of competing strategies for the treatment of pediatric empyema.Pediatrics.2008;121:e1250–e1257.
- ,,.Costs of treating children with complicated pneumonia: A comparison of primary video‐assisted thoracoscopic surgery and chest tube placement.Pediatr Pulmonol.2010;45:71–77.
- .Unwarranted variation in pediatric medical care.Pediatr Clin North Am.2009;56:745–755.
Community‐acquired pneumonia, the most common serious bacterial infection in childhood, may be complicated by parapneumonic effusion (ie, complicated pneumonia).1 Children with complicated pneumonia require prolonged hospitalization and frequently undergo multiple pleural fluid drainage procedures.2 Additionally, the incidence of complicated pneumonia has increased,37 making the need to define appropriate therapy even more pressing. Defining appropriate therapy is challenging for the individual physician as a result of inconsistent and insufficient evidence, and wide variation in treatment practices.2, 8
Historically, thoracotomy was performed only if initial chest tube placement did not lead to clinical improvement.9, 10 Several authors, noting the rapid resolution of symptoms in children undergoing earlier thoracotomy, advocated for the use of thoracotomy as initial therapy rather than as a procedure of last resort.114 The advent of less invasive techniques such as video‐assisted thoracoscopic surgery (VATS) has served as an additional impetus to consider surgical drainage as the initial treatment strategy.1518 Few well‐designed studies have examined the relative efficacy of these interventions.2, 1922 Published randomized trials were single center, enrolled few patients, and arrived at different conclusions.19, 21, 22 In addition, these trials did not examine other important outcomes such as requirement for additional pleural fluid drainage procedures and hospital readmission. Two large retrospective multicenter studies found modest reductions in length of stay (LOS) and substantial decreases in the requirement for additional pleural fluid drainage procedures in children undergoing initial VATS compared with initial chest tube placement.2, 20 However, Shah et al2 included relatively few patients undergoing VATS. Li et al20 combined patients undergoing initial thoracentesis, initial chest tube placement, late pleural fluid drainage (by any method), and no pleural fluid drainage into a single non‐operative management category, precluding conclusions about the relative benefits of chest tube placement compared with VATS. Neither study2, 20 examined the role of chemical fibrinolysis, a therapy which has been associated with outcomes comparable to VATS in two small randomized trials.21, 22
The objectives of this multicenter study were to describe the variation in the initial management strategy along with associated outcomes of complicated pneumonia in childhood and to determine the comparative effectiveness of different pleural fluid drainage procedures.
Methods
Data Source
The Pediatric Health Information System (PHIS), which contains resource utilization data from 40 freestanding children's hospitals, provided data for this multicenter retrospective cohort study. Participating hospitals are located in noncompeting markets of 27 states plus the District of Columbia. The PHIS database includes patient demographics, diagnoses, and procedures as well as data for all drugs, radiologic studies, laboratory tests, and supplies charged to each patient. Data are de‐identified, however encrypted medical record numbers allow for tracking individual patients across admissions. The Child Health Corporation of America (Shawnee Mission, KS) and participating hospitals jointly assure data quality and reliability as described previously.23, 24 The Children's Hospital of Philadelphia Institutional Review Board reviewed and approved this study.
Patients
Children 18 years of age receiving a pleural drainage procedure for complicated pneumonia were eligible if they were discharged from participating hospitals between January 1, 2004 and June 30, 2009. Study participants met the following criteria: 1) discharge diagnosis of pneumonia (International Classification of Diseases, 9th revision [ICD‐9] discharge diagnosis codes 480.x‐483.x, 485.x‐487.x), 2) discharge diagnosis of pleural effusion (ICD‐9 codes 510.0, 510.9, 511.0, 511.1, or 511.9), and 3) billing charge for antibiotics on the first day of hospitalization. Additionally, the primary discharge diagnosis had to be either pneumonia or pleural effusion. Patients were excluded if they did not undergo pleural fluid drainage or if their initial pleural fluid drainage procedure was thoracentesis.
Study Definitions
Pleural drainage procedures were identified using ICD‐9 procedure codes for thoracentesis (34.91), chest tube placement (34.04), VATS (34.21), and thoracotomy (34.02 or 34.09). Fibrinolysis was defined as receipt of urokinase, streptokinase, or alteplase within two days of initial chest tube placement.
Acute conditions or complications included influenza (487, 487.0, 487.1, 487.8, 488, or V04.81) and hemolytic‐uremic syndrome (283.11). Chronic comorbid conditions (CCCs) (eg, malignancy) were identified using a previously reported classification scheme.25 Billing data were used to classify receipt of mechanical ventilation and medications on the first day of hospitalization.
Measured Outcomes
The primary outcomes were hospital LOS (both overall and post‐initial procedure), requirement for additional pleural drainage procedures, total cost for index hospitalization, all‐cause readmission within 14 days after index hospital discharge, and total cost of the episode (accounting for the cost of readmissions).
Measured Exposures
The primary exposure of interest was the initial pleural fluid drainage procedure, classified as chest tube placement without fibrinolysis, chest tube placement with fibrinolysis, VATS, or thoracotomy.
Statistical Analysis
Variables were summarized using frequencies and percentages for categorical variables, and median, interquartile range (IQR), and range for continuous variables. Outcomes by initial pleural drainage procedure were compared using chi‐squared tests for categorical variables and Kruskal‐Wallis tests for continuous variables.
Multivariable analysis was performed to account for potential confounding by observed baseline variables. For dichotomous outcome variables, modeling consisted of logistic regression using generalized estimating equations to account for hospital clustering. For continuous variables, a mixed model approach was used, treating hospital as a random effect. Log transformation was applied to the right‐skewed outcome variables (LOS and cost). Cost outcomes remained skewed following log transformation, thus gamma mixed models were applied.2629 Odds ratios and 95% confidence intervals (CIs) were reported for comparison of dichotomous outcomes and the adjusted means and 95% CIs were reported for continuous outcomes after appropriate back transformation.
Additional analyses addressed the potential impact of confounding by indication inherent in any observational study. First, patients with an underlying CCC were excluded to ensure that our results would be generalizable to otherwise healthy children with community‐acquired pneumonia. Second, patients undergoing pleural drainage >2 days after hospitalization were excluded to minimize the effect of residual confounding related to differences in timing of the initial drainage procedure. Third, the analysis was repeated using a generalized propensity score as an additional method to account for confounding by indication for the initial drainage procedure.30 Propensity scores, constructed using a multivariable generalized logit model, included all variables listed in Table 1. The inverse of the propensity score was included as a weight in each multivariable model described previously. Only the primary multivariable analyses are presented as the results of the propensity score analysis were nearly identical to the primary analyses.
| Overall | Chest Tube Without Fibrinolysis | Chest Tube With Fibrinolysis | Thoracotomy | VATS | P Value | |
|---|---|---|---|---|---|---|
| ||||||
| N | 3500 | 1672 (47.8) | 623 (17.8) | 797 (22.8) | 408 (11.7) | |
| Age | ||||||
| <1 year | 335 (9.6) | 176 (10.5) | 56 (9.0) | 78 (9.8) | 25 (6.1) | |
| 1 year | 475 (13.6) | 238 (14.2) | 98 (15.7) | 92 (11.5) | 47 (11.5) | 0.003 |
| 24 years | 1230 (35.1) | 548 (32.8) | 203 (32.6) | 310 (38.9) | 169 (41.4) | |
| 59 years | 897 (25.6) | 412 (24.6) | 170 (27.3) | 199 (25.0) | 116 (28.4) | |
| 1014 years | 324 (9.3) | 167 (10.0) | 61 (9.8) | 65 (8.2) | 31 (7.6) | |
| 1518 years | 193 (5.5) | 106 (6.3) | 29 (4.6) | 40 (5.0) | 18 (4.4) | |
| >18 years | 46 (1.3) | 25 (1.5) | 6 (0.96) | 13 (1.6) | 2 (0.5) | |
| Comorbid Conditions | ||||||
| Cardiac | 69 (2.0) | 43 (2.6) | 14 (2.3) | 12 (1.5) | 0 (0.0) | 0.006 |
| Malignancy | 81 (2.3) | 31 (1.9) | 18 (2.9) | 21 (2.6) | 11 (2.7) | 0.375 |
| Neurological | 138 (3.9) | 73 (4.4) | 20 (3.2) | 34 (4.3) | 11 (2.7) | 0.313 |
| Any Other Condition | 202 (5.8) | 96 (5.7) | 40 (6.4) | 47 (5.9) | 19 (4.7) | 0.696 |
| Payer | ||||||
| Government | 1240 (35.6) | 630 (37.8) | 224 (36.0) | 259 (32.7) | 127 (31.3) | <0.001 |
| Private | 1383 (39.7) | 607 (36.4) | 283 (45.4) | 310 (39.2) | 183 (45.07) | |
| Other | 864 (24.8) | 430 (25.8) | 116 (18.6) | 222 (28.1) | 96 (23.65) | |
| Race | ||||||
| Non‐Hispanic White | 1746 (51.9) | 838 (51.6) | 358 (59.7) | 361 (47.8) | 189 (48.7) | <0.001 |
| Non‐Hispanic Black | 601 (17.9) | 318 (19.6) | 90 (15.0) | 128 (17.0) | 65 (16.8) | |
| Hispanic | 588 (17.5) | 280 (17.3) | 73 (12.2) | 155 (20.5) | 80 (20.6) | |
| Asian | 117 (3.5) | 47 (2.9) | 20 (3.3) | 37 (4.9) | 13 (3.4) | |
| Other | 314 (9.3) | 140 (8.6) | 59 (9.8) | 74 (9.8) | 41 (10.6) | |
| Male Sex | 1912 (54.6) | 923 (55.2) | 336 (53.9) | 439 (55.1) | 214 (52.5) | 0.755 |
| Radiology | ||||||
| CT, no US | 1200 (34.3) | 600 (35.9) | 184 (29.5) | 280 (35.1) | 136 (33.3) | <0.001 |
| CT and US | 221 (6.3) | 84 (5.0) | 53 (8.5) | 61 (7.7) | 23 (5.6) | |
| US, no CT | 799 (22.8) | 324 (19.4) | 178 (28.6) | 200 (25.1) | 97 (23.8) | |
| No US, no CT | 1280 (36.6) | 664 (39.7) | 208 (33.4) | 256 (32.1) | 152 (37.3) | |
| Empiric Antibiotic Regimen | ||||||
| Cephalosporins alone | 448 (12.8) | 181 (10.83) | 126 (20.2) | 73 (9.2) | 68 (16.7) | <0.001 |
| Cephalosporin and clindamycin | 797 (22.8) | 359 (21.5) | 145 (23.3) | 184 (23.1) | 109 (26.7) | |
| Other antibiotic combination | 167 (4.8) | 82 (4.9) | 30 (4.8) | 38 (4.8) | 17 (4.2) | |
| Cephalosporin and vancomycin | 2088 (59.7) | 1050 (62.8) | 322 (51.7) | 502 (63.0) | 214 (52.5) | |
| Mechanical ventilation | 494 (14.1) | 251 (15.0) | 75 (12.0) | 114 (14.3) | 54 (13.2) | 0.307 |
| Corticosteroids | 520 (14.9) | 291 (17.4) | 72 (11.6) | 114 (14.3) | 43 (10.5) | <0.001 |
| Blood product transfusionsb | 761 (21.7) | 387 (23.2) | 145 (23.3) | 161 (20.2) | 68 (16.7) | 0.018 |
| Vasoactive infusionsc | 381 (10.9) | 223 (13.3) | 63 (10.1) | 72 (9.0) | 23 (5.6) | <0.001 |
| Admission to intensive care | 1397 (39.9) | 731 (43.7) | 234 (37.6) | 296 (37.1) | 136 (33.3) | <0.001 |
| Extracorporeal membranous oxygenation | 18 (0.5) | 13 (0.8) | 2 (0.3) | 3 (0.4) | 0 (0.0) | 0.163 |
| Hemolytic‐uremic syndrome | 31 (0.9) | 15 (0.9) | 6 (1.0) | 7 (0.9) | 3 (0.7) | 0.985 |
| Influenza | 108 (3.1) | 53 (3.2) | 27 (4.3) | 23 (2.9) | 5 (1.2) | 0.044 |
| Arterial blood gas measurements | 0 (0,1) | 0 (0, 2) | 0 (0,1) | 0 (0, 1) | 0 (0, 1) | <0.001 |
| Days to first procedure | 1 (0, 3) | 1 (0, 2) | 1 (1, 3) | 1 (1, 3) | 1 (1, 3) | <0.001 |
Medical records of a randomly selected subset of subjects from 6 hospitals were reviewed to determine the accuracy of our algorithm in identifying patients with complicated pneumonia; these subjects represented 1% of the study population. For the purposes of medical record review, complicated pneumonia was defined by the following: 1) radiologically‐confirmed lung infiltrate; 2) moderate or large pleural effusion; and 3) signs and symptoms of lower respiratory tract infection. Complicated pneumonia was identified in 118 of 120 reviewed subjects for a positive predictive value of 98.3%.
All analyses were clustered by hospital. Analyses were performed using SAS version 9.2 (SAS Institute, Cary, NC). A two‐tailed P < 0.05 was considered statistically significant.
Results
Patient Characteristics
During the study period, 9,680 subjects had complicated pneumonia. Subjects were excluded if they did not have a pleural drainage procedure (n = 5798), or if thoracentesis was the first pleural fluid drainage procedure performed (n = 382). The remaining 3500 patients were included. Demographic characteristics are summarized in Table 1. The median patient age was 4.1 years (IQR: 2.17.2 years). An underlying CCC was present in 424 (12.1%) patients. There was no association between type of drainage procedure and mechanical ventilation. However, factors associated with more severe systemic illness, such as blood product transfusion, were more common among those undergoing initial chest tube placement with or without fibrinolysis (Table 1).
Initial Pleural Fluid Drainage Procedures
The primary procedures included chest tube without fibrinolysis (47.8%); chest tube with fibrinolysis (17.8%); thoracotomy (22.8%); and VATS (11.7%) (Table 1). The proportion of patients undergoing primary chest tube placement with fibrinolysis increased over time from 14.2% in 2004 to 30.0% in 2009 (P < 0.001; chi‐squared test for trend). The initial procedure varied by hospital with the greatest proportion of patients undergoing primary chest tube placement without fibrinolysis at 28 (70.0%) hospitals, chest tube placement with fibrinolysis at 5 (12.5%) hospitals, thoracotomy at 5 (12.5%) hospitals, and VATS at 2 (5.0%) hospitals (Figure 1). The median proportion of patients undergoing primary VATS across all hospitals was 11.5% (IQR: 3.9%‐26.5%) (Figure 1). The median time to first procedure was 1 day (IQR: 03 days).
Outcome Measures
Variation in outcomes occurred across hospitals. Additional pleural drainage procedures were performed in a median of 20.9% of patients with a range of 6.8% to 44.8% (IQR: 14.5%‐25.3%) of patients across all hospitals. Median LOS was 10 days with a range of 714 days (IQR: 8.511 days) and the median LOS following the initial pleural fluid drainage procedure was 8 days with a range of 6 to 13 days (IQR: 78 days). Variation in timing of the initial pleural fluid drainage procedure explained 9.6% of the variability in LOS (Spearman rho, 0.31; P < 0.001).
Overall, 118 (3.4%) patients were readmitted within 14 days of index discharge; the median readmission rate was 3.8% with a range of 0.8% to 33.3% (IQR: 2.1%‐5.8%) across hospitals. The median total cost of the index hospitalization was $19,574 (IQR: $13,791‐$31,063). The total cost for the index hospitalization exceeded $54,215 for 10% of patients and the total cost of the episode exceeded $55,208 for 10% of patients. Unadjusted outcomes, stratified by primary pleural fluid drainage procedure, are summarized in Table 2.
| Overall | Chest Tube Without Fibrinolysis | Chest Tube With Fibrinolysis | Thoracotomy | VATS | P Valueb | |
|---|---|---|---|---|---|---|
| ||||||
| Additional Procedure | 716 (20.5) | 331 (19.8) | 144 (23.1) | 197 (24.7) | 44 (10.8) | <0.001 |
| Readmission within 14 days | 118 (3.4) | 54 (3.3) | 13 (2.1) | 32 (4.0) | 19 (4.7) | 0.096 |
| Total LOS (days) | 10 (7, 14) | 10 (7, 14) | 9 (7, 13) | 10 (7, 14) | 9 (7, 12) | <.001 |
| Post‐initial Procedure LOS (days) | 8 (5, 12) | 8 (6, 12) | 7 (5, 10) | 8 (5, 12) | 7 (5, 10) | <0.001 |
| Total Cost, Index Hospitalization ($)e | 19319 (13358, 30955) | 19951 (13576, 32018)c | 19565 (13209, 32778)d | 20352 (14351, 31343) | 17918 (13531, 25166) | 0.016 |
| Total Cost, Episode of Illness ($)e | 19831 (13927, 31749) | 20151 (13764, 32653) | 19593 (13210, 32861) | 20573 (14419, 31753) | 18344 (13835, 25462) | 0.029 |
In multivariable analysis, differences in total LOS and post‐procedure LOS were not significant (Table 3). The odds of additional drainage procedures were higher for all drainage procedures compared with initial VATS (Table 3). Patients undergoing initial chest tube placement with fibrinolysis were less likely to require readmission compared with patients undergoing initial VATS (Table 3). The total cost for the episode of illness (including the cost of readmission) was significantly less for those undergoing primary chest tube placement without fibrinolysis compared with primary VATS. The results of subanalyses excluding patients with an underlying CCC (Supporting Appendix online, Table 4) and restricting the cohort to patients undergoing pleural drainage within two days of admission (Supporting Appendix online, Table 5) were similar to the results of our primary analysis with one exception; in the latter subanalysis, children undergoing initial chest tube placement without fibrinolysis were also less likely to require readmission compared with patients undergoing initial VATS.
| Adjusted OR (95% CI)a | P Value | |
|---|---|---|
| ||
| Additional pleural drainage procedure | ||
| Chest tube without fibrinolysis | 1.82 (1.103.00) | .019 |
| Chest tube with fibrinolysis | 2.31 (1.443.72) | <0.001 |
| Thoracotomy | 2.59 (1.624.14) | <0.001 |
| VATS | Reference | |
| Readmission within 14 days | ||
| Chest tube without fibrinolysis | 0.61 (0.361.05) | .077 |
| Chest tube with fibrinolysis | 0.45 (0.230.86) | .015 |
| Thoracotomy | 0.85 (0.521.39) | .521 |
| VATS | Reference | |
| Adjusted Mean (95% CI)a | P Value | |
| Total LOS (days) | ||
| Chest tube without fibrinolysis | 8.0 (7.88.2) | .339 |
| Chest tube with fibrinolysis | 8.1 (7.98.3) | .812 |
| Thoracotomy | 8.1 (7.98.3) | .632 |
| VATS | 8.1 (7.98.3) | Ref |
| Post‐initial procedure LOS (days) | ||
| Chest tube without fibrinolysis | 7.3 (7.07.5) | .512 |
| Chest tube with fibrinolysis | 7.5 (7.27.8) | .239 |
| Thoracotomy | 7.3 (7.07.6) | .841 |
| VATS | 7.3 (7.17.6) | Reference |
| Total cost, index hospitalization ($) | ||
| Chest tube without fibrinolysis | 22928 (2200023895 | .012 |
| Chest tube with fibrinolysis | 23621 (2263124655) | .657 |
| Thoracotomy | 23386 (2241924395 | .262 |
| VATS | 23820 (2280824878) | Reference |
| Total cost, episode of illness ($) | ||
| Chest tube without fibrinolysis | 23218 (2227824199) | .004 |
| Chest tube with fibrinolysis | 23749 (2275224790) | .253 |
| Thoracotomy | 23673 (2269324696) | .131 |
| VATS | 24280 (2324425362) | Reference |
Discussion
This multicenter study is the largest to evaluate the management of children hospitalized with complicated pneumonia. We found considerable variation in initial management and outcomes across hospitals. Differences in timing of the initial drainage procedure explained only a small amount of the variability in outcomes. Children undergoing initial VATS less commonly required additional drainage procedures while children undergoing initial chest tube placement with fibrinolysis less commonly required readmission. Differences in total and post‐procedure LOS were not statistically significant. Differences in cost, while statistically significant, were of marginal relevance.
Previous studies have also shown significant variation in treatment and outcomes of children with complicated pneumonia across hospitals.2, 8 Our study provides data from additional hospitals, includes a substantially larger number of patients undergoing initial VATS, distinguishes between fibrinolysis recipients and nonrecipients, and is the first to compare outcomes between four different initial drainage strategies. The creation of national consensus guidelines might reduce variability in initial management strategies, although the variability in outcomes across hospitals in the current study could not be explained simply by differences in the type or timing of the initial drainage procedure. Thus, future studies examining hospital‐level factors may play an important role in improving quality of care for children with complicated pneumonia.
Patients with initial thoracotomy or chest tube placement with or without fibrinolysis more commonly received additional drainage procedures than patients with initial VATS. This difference remained when patients with CCCs were excluded from the analysis and when the analysis was limited to patients undergoing pleural fluid drainage within 2 days of hospitalization. Several small, randomized trials demonstrated conflicting results when comparing initial chest tube placement with fibrinolysis and VATS. St. Peter et al22 reported that 3 (17%) of 18 patients undergoing initial chest tube placement with fibrinolysis and none of the 18 patients undergoing initial VATS received additional pleural drainage procedures. Sonnappa et al21 found no differences between the two groups. Kurt et al19 did not state the proportion of patients receiving additional procedures. However, the mean number of drainage procedures was 2.25 among the 8 patients undergoing initial chest tube placement while none of the 10 patients with VATS received additional drainage.19
Thoracotomy is often perceived as a definitive procedure for treatment of complicated pneumonia. However, several possibilities exist to explain why additional procedures were performed less frequently in patients undergoing initial VATS compared with initial thoracotomy. The limited visual field in thoracotomy may lead to greater residual disease post‐operatively in those receiving thoracotomy compared with VATS.31 Additionally, thoracotomy substantially disrupts the integrity of the chest wall and is consequently associated with complications such as bleeding and air leak into the pleural cavity more often than VATS.31, 32 It is thus possible that some of the additional procedures in patients receiving initial thoracotomy were necessary for management of thoracotomy‐associated complications rather than for failure of the initial drainage procedure.
Similar to the randomized trials by Sonnappa et al21 and St. Peter et al,22 differences in the overall and post‐procedure LOS were not significant among patients undergoing initial VATS compared with initial chest tube placement with fibrinolysis. However, chest tube placement without fibrinolysis did not result in significant differences in LOS compared with initial VATS. In the only pediatric randomized trial, the 29 intrapleural urokinase recipients had a 2 day shorter LOS compared with the 29 intrapleural saline recipients.33 Several small, randomized controlled trials of adults with complicated pneumonia reported improved pleural fluid drainage among intrapleural fibrinolysis recipients compared with non‐recipients.3436 However, a large multicenter randomized trial in adults found no differences in mortality, requirement for surgical drainage, or LOS between intrapleural streptokinase and placebo recipients.37 Subsequent meta‐analyses of randomized trials in adults also demonstrated no benefit to fibrinolysis.38, 39 In the context of the increasing use of intrapleural fibrinolysis in children with complicated pneumonia, our results highlight the need for a large, multicenter randomized controlled trial to determine whether chest tube with fibrinolysis is superior to chest tube alone.
Two small randomized trials21, 22 and a decision analysis40 identified chest tube with fibrinolysis as the most economical approach to children with complicated pneumonia. However, the costs did not differ significantly between patients undergoing initial VATS or initial chest tube placement with fibrinolysis in our study. The least costly approach was initial chest tube placement without fibrinolysis. Unlike the randomized controlled trials, we considered costs associated with readmissions in determining the total costs. Shah et al41 found no difference in total charges for patients undergoing initial VATS compared with initial chest tube placement; however, patients undergoing initial VATS were concentrated in a few centers, making it difficult to determine the relative importance of procedural and hospital factors.
This multicenter observational study has several limitations. First, discharge diagnosis coding may be unreliable for specific diseases. However, our rigorous definition of complicated pneumonia, supported by the high positive predictive value as verified by medical record review, minimizes the likelihood of misclassification.
Second, unmeasured confounding or residual confounding by indication for the method of pleural drainage may occur, potentially influencing our results in two disparate ways. If patients with more severe systemic illness were too unstable for operative interventions, then our results would be biased towards worse outcomes for children undergoing initial chest tube placement. We adjusted for several variables associated with a greater systemic severity of illness, including intensive care unit admission, making this possibility less likely. We also could not account for some factors associated with more severe local disease such as the size and character of the effusion. We suspect that patients with more extensive local disease (ie, loculated effusions) would have worse outcomes than other patients, regardless of initial procedure, and that these patients would also be more likely to undergo primary surgical drainage. Thus, this study may have underestimated the benefit of initial surgical drainage (eg, VATS) compared with nonsurgical drainage (ie, chest tube placement).
Third, misclassification of the method of initial pleural drainage may have occurred. Patients transferred from another institution following chest tube placement could either be classified as not receiving pleural drainage and thus excluded from the study or classified as having initial VATS or thoracotomy if the reason for transfer was chest tube treatment failure. Additionally, we could not distinguish routine use of fibrinolysis from fibrinolysis to maintain chest tube patency. Whether such misclassification would falsely minimize or maximize differences in outcomes between the various groups remains uncertain. Fourth, because this study only included tertiary care children's hospitals, these data are not generalizable to community settings. VATS requires specialized surgical training that may be unavailable in some areas. Finally, this study demonstrates the relative efficacy of various pleural fluid drainage procedures on short‐term clinical outcomes and resource utilization. However, long‐term functional outcomes should be measured in future prospective studies.
Conclusions
In conclusion, emphasis on evidence driven treatment to optimize care has led to an increasing examination of unwarranted practice variation.42 The lack of evidence for best practice makes it difficult to define unwarranted variation in the treatment of complicated pneumonia. Our study demonstrates the large variability in practice and raises additional questions regarding the optimal drainage strategies. Published randomized trials have focused on comparisons between chest tube placement with fibrinolysis and VATS. However, our data suggest that future randomized trials should include chest tube placement without fibrinolysis as a treatment strategy. In determining the current best treatment for patients with complicated pneumonia, a clinician must weigh the impact of needing an additional procedure in approximately one‐quarter of patients undergoing initial chest tube placement (with or without fibrinolysis) with the risks of general anesthesia and readmission in patients undergoing initial VATS.
Acknowledgements
Dr. Hall had full access to all the data in the study and takes responsibility for the integrity of the data and accuracy of the analysis.
- ,.Parapneumonic pleural effusion and empyema in children. Review of a 19‐year experience, 1962–1980.Clin Pediatr (Phila).1983;22:414–419.
- ,,,,.Primary early thoracoscopy and reduction in length of hospital stay and additional procedures among children with complicated pneumonia: Results of a multicenter retrospective cohort study.Arch Pediatr Adolesc Med.2008;162:675–681.
- ,.Empyema hospitalizations increased in US children despite pneumococcal conjugate vaccine.Pediatrics.2010;125:26–33.
- ,,, et al.Impact of the pneumococcal conjugate vaccine on pneumococcal parapneumonic empyema.Pediatr Infect Dis J.2006;25:250–254.
- ,,,,.Five‐fold increase in pediatric parapneumonic empyema since introduction of pneumococcal conjugate vaccine.Pediatric Infect Dis J.2008;27:1030–1032.
- ,,,.Increasing incidence of empyema complicating childhood community‐acquired pneumonia in the United States.Clin Infect Dis.2010;50:805–813.
- ,,,,.National hospitalization trends for pediatric pneumonia and associated complications.Pediatrics.2010;126:204–213.
- ,,, et al.Empyema associated with community‐acquired pneumonia: A Pediatric Investigator's Collaborative Network on Infections in Canada (PICNIC) study.BMC Infect Dis.2008;8:129.
- ,,,,.Pleural empyema in children.Ann Thorac Surg.1970;10:37–44.
- ,,.Management of streptococcal empyema.Ann Thorac Surg.1966;2:658–664.
- ,.Thoracoscopy in the management of empyema in children.J Pediatr Surg.1993;28:1128–1132.
- ,,,.Surgical treatment of parapneumonic empyema.Pediatr Pulmonol.1996;22:348–356.
- ,.The controversial role of decortication in the management of pediatric empyema.J Thorac Cardiovasc Surg.1988;96:166–170.
- ,,,,,.Postpneumonic empyema in children treated by early decortication.Eur J Pediatr Surg.1997;7:135–137.
- ,.Video‐assisted thoracoscopic surgery in the management of pediatric empyema.JSLS.1997;1:251–3.
- ,,,.Early video‐assisted thoracic surgery in the management of empyema.Pediatrics.1999;103:e63.
- ,,,,.Early definitive intervention by thoracoscopy in pediatric empyema.J Pediatr Surg.1999;34:178–180; discussion80–81.
- ,,,,.Thoracoscopy in the management of pediatric empyema.J Pediatr Surg.1995;30:1211–1215.
- ,,,,.Therapy of parapneumonic effusions in children: Video‐assisted thoracoscopic surgery versus conventional thoracostomy drainage.Pediatrics.2006;118:e547–e553.
- ,.Primary operative management for pediatric empyema: Decreases in hospital length of stay and charges in a national sample.Arch Pediatr Adolesc Med.2008;162:44–48.
- ,,, et al.Comparison of urokinase and video‐assisted thoracoscopic surgery for treatment of childhood empyema.Am J Respir Crit Care Med.2006;174:221–227.
- ,,, et al.Thoracoscopic decortication vs tube thoracostomy with fibrinolysis for empyema in children: A prospective, randomized trial.J Pediatr Surg.2009;44:106–111; discussion11.
- ,,,.Corticosteroids and mortality in children with bacterial meningitis.JAMA.2008;299:2048–2055.
- ,,,,.Intravenous immunoglobulin in children with streptococcal toxic shock syndrome.Clin Infect Dis.2009;49:1369–1376.
- ,,, et al.Deaths attributed to pediatric complex chronic conditions: National trends and implications for supportive care services.Pediatrics.2001;107:e99.
- ,.Multiple regression of cost data: Use of generalised linear models.J Health Serv Res Policy.2004;9:197–204.
- ,,,.A robustified modeling approach to analyze pediatric length of stay.Ann Epidemiol.2005;15:673–677.
- ,,.Correlates of length of stay, cost of care, and mortality among patients hospitalized for necrotizing fasciitis.Epidemiol Infect.2007;135:868–876.
- ,,,,,.Health care costs of adults treated for attention‐deficit/hyperactivity disorder who received alternative drug therapies.J Manag Care Pharm.2007;13:561–569.
- .The role of the propensity score in estimating dose‐response functions.Biometrika.2000;87:706–710.
- ,,,,.Experience with video‐assisted thoracoscopic surgery in the management of complicated pneumonia in children.J Pediatr Surg.2001;36:316–319.
- ,,, et al.VATS debridement versus thoracotomy in the treatment of loculated postpneumonia empyema.Ann Thorac Surg.1996;61:1626–1630.
- ,,,,.Randomised trial of intrapleural urokinase in the treatment of childhood empyema.Thorax.2002;57:343–347.
- ,,,,,.Intrapleural urokinase versus normal saline in the treatment of complicated parapneumonic effusions and empyema. A randomized, double‐blind study.Am J Respir Crit Care Med.1999;159:37–42.
- ,,.Randomised controlled trial of intrapleural streptokinase in community acquired pleural infection.Thorax.1997;52:416–421.
- ,,,,.Intrapleural streptokinase for empyema and complicated parapneumonic effusions.Am J Respir Crit Care Med.2004;170:49–53.
- ,,, et al.U.K. Controlled trial of intrapleural streptokinase for pleural infection.N Engl J Med.2005;352:865–874.
- ,.Intra‐pleural fibrinolytic therapy versus conservative management in the treatment of adult parapneumonic effusions and empyema.Cochrane Database Syst Rev.2008:CD002312.
- ,,,.Intrapleural fibrinolytic agents for empyema and complicated parapneumonic effusions: A meta‐analysis.Chest.2006;129:783–790.
- ,,.Cost‐effectiveness of competing strategies for the treatment of pediatric empyema.Pediatrics.2008;121:e1250–e1257.
- ,,.Costs of treating children with complicated pneumonia: A comparison of primary video‐assisted thoracoscopic surgery and chest tube placement.Pediatr Pulmonol.2010;45:71–77.
- .Unwarranted variation in pediatric medical care.Pediatr Clin North Am.2009;56:745–755.
Copyright © 2011 Society of Hospital Medicine

Resource Utilization in Bacterial Meningitis
Bacterial meningitis can be a devastating disease in children. Overall mortality in children in the United States is 4%1 while long‐term morbidity is present in up to 25%2 of surviving children. The introduction of Haemophilus influenzae type B vaccine, heptavalent pneumococcal conjugate vaccine, and the quadrivalent meningococcal conjugate vaccine has altered the epidemiology of bacterial meningitis.24 Currently, little is known about the epidemiology of systemic complications and associated focal infections that occur during episodes of bacterial meningitis in children and how the presence of such complications affects in‐hospital healthcare resource utilization.
In a randomized controlled trial, the administration of adjuvant corticosteroids was associated with lower mortality rates in adults with bacterial meningitis due to all causes, with the greatest reduction in those with pneumococcal meningitis.5 In a post hoc analysis of data from this trial, reductions in systemic complications, such as septic shock, pneumonia, and acute respiratory distress syndrome, rather than neurologic complications were thought to be the underlying reason for the decrease in mortality associated with pneumococcal meningitis among corticosteroid recipients.6 However, children with bacterial meningitis have an overall 4‐fold lower mortality rate than adults with bacterial meningitis. An even greater difference in mortality rates exists between children and adults with pneumococcal meningitis.1, 5 Children do not benefit from adjuvant corticosteroids as adults do.1, 5, 7 Therefore, the pathogenesis of bacterial meningitis may differ in children from adults and account for the difference in response to adjuvant corticosteroids. Understanding the epidemiology of systemic complications and associated focal infections can aid in the understanding of the pathogenesis of the disease in varying age groups of children.
Previous studies in children have documented the frequency of certain bacterial meningitis‐associated conditions such as respiratory failure, pneumonia, endocarditis, and mastoiditis. Researchers have used the presence of such conditions to predict either mortality or neurologic sequelae in children.810 These studies were small and only included a few types of complications associated with bacterial meningitis. In‐hospital healthcare resource utilization, which may be an important indicator of in‐hospital morbidity, was also not considered as an outcome. In‐hospital morbidity may represent aspects of disease burden not captured by mortality rates or markers for long‐term morbidity alone. In future vaccine efficacy trails or novel therapeutics evaluations, consideration of these associated conditions is important.
The quantification of the use of in‐hospital healthcare utilization is also important for hospital planning and resource allocation in children with bacterial meningitis. A child presenting with bacterial meningitis and a systemic complication or an associated focal infection may require additional resource planning initially to expedite care to enhance recovery and decrease hospital length of stay (LOS).
Our goal was to document the frequency of bacterial meningitis‐associated conditions (systemic complications and associated focal infections) in a large cohort of children with bacterial meningitis treated at tertiary care children's hospitals in the United States, and determine how the presence of such conditions impacted in‐hospital healthcare resource utilization.
Patients and Methods
Data Source
Data for this retrospective cohort study was obtained from the Pediatric Health Information System (PHIS), a national administrative database containing data from 36 freestanding, tertiary care children's hospitals. These hospitals are affiliated with the Child Health Corporation of America (Shawnee Mission, KS), a business alliance of children's hospitals. Data quality and reliability are assured through a joint effort between the Child Health Corporation of America and participating hospitals. For the purposes of external benchmarking, participating hospitals provide discharge data including patient demographics, diagnoses, and procedures. Procedures to assure data validity were described previously.1 Total hospital charges are reported in the PHIS database and adjusted for hospital location using the Centers for Medicare and Medicaid price/wage index. A total of 27 participating hospitals also provide resource utilization data for each hospital discharge (ie, pharmaceutical dispensing, imaging, and laboratory studies); patients from these 27 hospitals were eligible for inclusion in this study. The protocol for the conduct of this study was reviewed and approved by The Children's Hospital of Philadelphia Committees for the Protection of Human Subjects.
Patients
Children less than 18 years of age with bacterial meningitis were eligible for this study if they were discharged from any of the 27 hospitals disclosing resource utilization data between January 1, 2001 and December 31, 2006. Study participants discharged with bacterial meningitis as their primary diagnosis were identified in the PHIS database using International Classification of Diseases, 9th revision, (ICD‐9) discharge diagnosis codes. The study population was limited to children without conditions predisposing to meningitis. Therefore, patients with ventricular shunts prior to the episode of bacterial meningitis were excluded using the following ICD‐9 procedure codes: ventricular shunt replacement (02.42); incision of peritoneum (54.95); removal of ventricular shunts (02.43); and the ICD‐9 discharge diagnosis code for mechanical complication of nervous system device, implant, and graft (996.2). Also, children with comorbid conditions that could predispose to meningitis or increase the likelihood of associated complications such as cancer (hematologic and nonhematologic), primary or secondary immunodeficiencies, prematurity, post‐operative infection, congenital cardiac disease, and sickle cell disease, were excluded from the analysis. Race and ethnicity were self‐reported by patients at time of admission.
Study Definitions
Study participants were identified from the PHIS database using ICD‐9 codes for the primary diagnosis of bacterial meningitis (codes 036.0‐036.1; 320.0‐320.3; 320.7; 320.81‐320.82; 320.89; 320.9). The sensitivity and specificity of ICD‐9 codes in identifying children with bacterial meningitis is unknown, however these codes have been used by previous investigators.1113 Bacterial meningitis associated‐conditions were classified as systemic complications (sepsis, systemic inflammatory response syndrome (SIRS), and respiratory failure) and associated focal infections (septic arthritis, mastoiditis, osteomyelitis, pneumonia and endocarditis). These associated conditions were identified by ICD‐9 discharge and procedural codes as listed in the Appendix (Supporting Information). Bone and joint infections were defined by the presence of either osteomyelitis or septic arthritis.
Primary Outcomes
The primary outcomes of interest were total in‐hospital charges and hospital LOS.
Measured Exposures
The primary exposures of interest were the occurrences of systemic complications, focal infections, or both conditions in children with bacterial meningitis.
Statistical Analysis
The data were initially described using frequencies and percentages for categorical variables and mean, median, interquartile ranges (IQRs) and range values for continuous variables. Analyses of bivariate associations between the outcomes (total in‐hospital charges and length of hospital stay) and potential covariates entailed either chi‐square tests or, for rare events with an expected frequency <5, Fishers Exact Test.
Following bivariate analysis, multivariable models were constructed to assess the adjusted impact of systemic complications and focal infection on total in‐hospital charges and hospital LOS. In evaluating total in‐hospital charges, the charge data were logarithmically transformed to account for the skewed distribution of charges. Multivariable linear regression was then performed to analyze the log transformed charges. The resulting beta‐coefficients were transformed to reflect the percent difference in total hospital charges between children with and without specific complications. In evaluating hospital LOS, negative binomial regression models were employed to estimate incidence rate ratios (IRRs) rather than log‐linear models, as to account for overdispersion in the outcome data. The negative binomial model produced a ratio of lengths of stay or IRR, where a ratio >1 indicates that the risk factor was associated with a longer LOS. The results were presented as percentage change to facilitate interpretation of the results.
The multivariable models were adjusted for the following confounders as determined a priori: age category, race, sex, vancomycin receipt, and adjuvant corticosteroid receipt within the first 24 hours of admission. Tests for interaction between systemic complications or focal infections and age were performed for each of these models. To address the possibility of referral bias which would lead us to overestimate the cost of caring for children with bacterial meningitis with an associated condition, the analyses were repeated restricting the sample to those children who had a lumber puncture performed at a PHIS‐participating hospital. The frequency of systemic complications and focal infections in those who were transferred was no different than in children who were not transferred; therefore the entire cohort was used in the final analyses. Sub‐group analyses were also performed for children identified with pneumococcal and meningococcal meningitis.
The standard errors for all estimates of covariate effects including metastatic effects under the above models were adjusted for the hospital to account for the increased variability due to clustering of individuals within hospitals. Two‐tailed P values <0.05 were considered statistically significant. Actual P values and 95% confidence intervals are reported. Data were analyzed using STATA, Version 10 (Stata Corporation, College Station, TX).
Results
Demographics
There were 2780 children admitted with bacterial meningitis during the study period; 461 (17%) children were excluded because of comorbid illness including malignancy (n = 37), congential heart disease (n = 231), prematurity (n = 104), human immunodeficiency virus infection (n = 4), sickle cell disease (n = 17), and post‐operative infection (n = 68). The remaining 2319 children with bacterial meningitis were included in the analyses. The mean age was 3.6 years (median, 1 year; IQR, 0‐6 years). Approximately half of the children were less than 1 year of age, 23% were 1 to 5 years, and 27% were >5 years. A total of 54% of children were white, 19% were black, 22% were Hispanic, and 5% were of other racial groups. Males accounted for 58% of the children. In this cohort of children, 9% received adjuvant corticosteroids within 24 hours of hospitalization.
Bacterial Meningitis‐Associated Conditions
Overall, 574 (25%) of children with bacterial meningitis suffered a systemic complication or an associated focal infection. Figure 1 shows the types of associated condition stratified by age category. Older children had a higher frequency of associated focal infections while younger children had a higher frequency of systemic complications (P = 0.002, chi‐square test for trend). Figure 2 shows the distribution of specific conditions among children in each age category. The frequency of sepsis decreased with age (P < 0.001, chi‐square test) while the frequency of mastoiditis (P < 0.001, Fisher's exact test) and osteomyelitis (P = 0.005, Fisher's exact test) increased with age. There did not appear to be substantial variability in the proportion of patients with SIRS or sepsis across hospitals, suggesting that hospital‐level variability in coding for these conditions was likely minimal. The median proportion of patients with SIRS by hospital was 2.4% (IQR, 1.2‐4.8%) while the median proportion of patients with sepsis by hospital was 13.4% (IQR, 10.0‐16.9%).

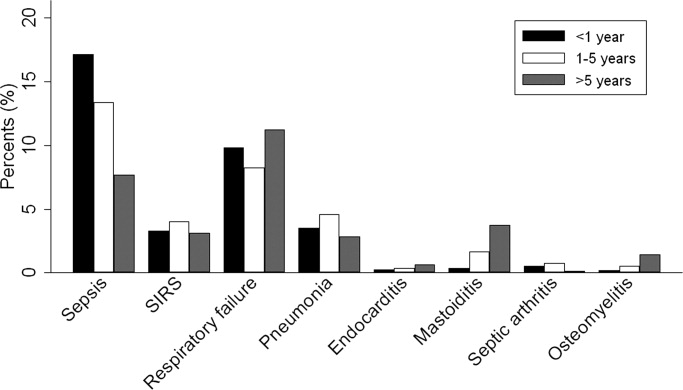
Of the 151 children with an associated focal infection, only 3 (2%) of children had more than 1 infection (1 child had mastoiditis and endocarditis, 1 child had pneumonia and osteomyelitis, and 1 child had pneumonia and endocarditis). However, of the 479 children with systemic complications, 116 (24%) had more than 1 systemic disease (Table 1).
| Types of Systemic Complications | Systemic Complications in All Bacterial Meningitis, n (%) | Systemic Complications in Meningococcal Meningitis, n (%) | Systemic Complications in Pneumococcal Meningitis, n (%) |
|---|---|---|---|
| |||
| Sepsis only | 209 (44) | 16 (21) | 69 (54) |
| Respiratory failure only | 139 (29) | 38 (49) | 30 (24) |
| SIRS only | 15 (3) | 9 (12) | 1 (1) |
| Sepsis and respiratory failure | 52 (11) | 4 (5) | 18 (14) |
| SIRS and sepsis | 27 (6) | 2 (3) | 4 (3) |
| SIRS and respiratory failure | 9 (2) | 5 (6) | 0 (0) |
| SIRS and respiratory failure and sepsis | 28 (6) | 3 (4) | 5 (4) |
| Total systemic complications | 479 | 77 | 127 |
In sub‐group analyses, 269 children had meningococcal meningitis and 470 children had pneumococcal meningitis. Of the children with meningococcal meningitis, 31.2% had a meningitis‐associated condition: 26.4% had a systemic complication, 2.6% had a focal infection, and 2.2% had both conditions. The most common associated conditions in children with meningococcal meningitis were respiratory failure (18.6%; n = 50), sepsis (9.3%; n = 25), and SIRS (7.1%; n = 19). In children with pneumococcal meningitis, 32.3% had a meningitis‐associated complication: 24.7% had a systemic complication, 5.3% had a focal infection, and 2.3% had both conditions. The most common associated conditions in children with pneumococcal meningitis were sepsis (20.4%; n = 96), respiratory failure (11.3%; n = 53), and pneumonia (4.7%; n = 22); mastoiditis was present in 2.3% (n = 11) of children with pneumococcal meningitis. Respiratory failure was more common in meningococcal meningitis (18.6%) than in pneumococcal meningitis (11.3%; P = 0.006). In contrast, sepsis was less common in meningococcal meningitis (9.3%) than in pneumococcal meningitis (20.4%; P < 0.001).
Hospital Charges
Overall, the median charges per hospital ranged from $20,158 to $53,823. In‐hospital charges for children with bacterial meningitis with and without any identified associated conditions are presented in Table 2. In multivariate analyses, the presence of systemic conditions, associated focal infections, or both conditions was independently associated with significantly higher total in‐hospital charges (Table 2). When conditions were considered individually, bone and joint infections (213% increase; 95% CI, 113‐260%), endocarditis (108% increase; 95% CI, 23‐258%), and pneumonia (107% increase; 95% CI, 58‐171%) were associated with the highest increases in total hospital charges (Figure 3). In contrast, SIRS and mastoiditis were not associated with higher hospital charges (Figure 3).
| Charges | LOS | |||
|---|---|---|---|---|
| Median, $ (IQR) | Adjusted Increase,* % (95% CI) | Median, days (IQR) | Adjusted Increase,* % (95% CI) | |
| ||||
| None (n = 1,745) | $27,110 (15,823‐48,307) | Reference** | 9 (6‐14) | Reference |
| Systemic (n = 423) | $66,690 (39,546136,756) | 136 (108269) | 14 (923) | 72 (5196) |
| Focal Infection (n = 95) | $58,016 (29,056125,813) | 118 (77168) | 13 (928) | 78 (40126) |
| Both (n = 56) | $130,744 (62,397299,288) | 351 (237503) | 21.5 (1245) | 211 (142303) |
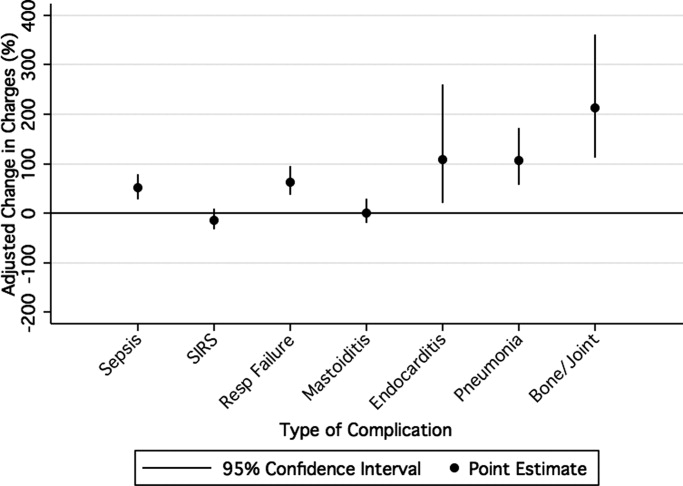
LOS
The median LOS was 9 days (IQR, 6‐15 days); 5% of children had a LOS >42 days. Table 2 summarizes difference in LOS by the presence and absence of systemic conditions and focal infections. In multivariate analyses, the presence of systemic conditions, associated focal infections, or both conditions was independently associated with a significantly longer LOS (Table 2). When conditions were considered individually, endocarditis (152% increase; 95% CI, 60‐300%) and pneumonia (136% increase; 95% CI, 85‐201%) were associated with the greatest adjusted increases in LOS (Figure 4); only mastoiditis was not associated with an increased LOS compared with those without complications.

Discussion
To our knowledge, this is the first study to examine bacterial meningitis‐associated conditions in children and their impact on in‐hospital resource utilization. We found that 25% of the cohort of children with bacterial meningitis suffered from at least one focal infection or systemic complication. This represents a significant invasive disease burden among children with bacterial meningitis who do not have underlying comorbid conditions. Younger children were more likely to have systemic complications when compared with older children, specifically due to a higher frequency of sepsis in children <1 year. Older children were more likely to have an associated focal infection, specifically due to an increase in mastoiditis and osteomyelitis in children >1 year. Only 2% of children had more than 1 focal infection, while 24% of children had more than 1 systemic complication.
Importantly, the presence of a systemic complication in a child with bacterial meningitis increased their in‐hospital adjusted charges by 136%. The presence of a focal infection increased in‐hospital adjusted charges by 118%. A child with both a systemic complication and a focal infection and had a 351% increase in in‐hospital adjusted charges.
The presence of systemic complications or associated focal infections was significantly associated with higher in‐hospital charges and longer hospital LOS. Most individual meningitis‐associated conditions included in this study were associated with higher in‐hospital charges with the exception of SIRS and mastoiditis. All individual meningitis‐associated conditions were associated with a longer LOS except mastoiditis. This finding is not surprising as the LOS for children with mastoiditis is typically shorter than for children with bacterial meningitis. Glikich et al.14 reported a mean LOS of approximately 8 days for children with mastoiditis. As meningitis in the context of mastoiditis is likely caused by direct extension of infection, patients with meningitis and mastoiditis likely required extended hospitalization to treat meningitis rather than mastoiditis. In contrast, patients with meningitis occurring in the context of metastatic dissemination of infection (eg, endocarditis, pneumonia) often have hemodynamic instability requiring prolonged intensive care support.
A study of children with sepsis found that increasing severity of illness was associated with greater hospital resource utilization.15 Our study shows that this may also be true in children with bacterial meningitis. We found that in children with bacterial meningitis, having systemic complications or an associated focal infection was associated with greater in‐hospital resource utilization. This finding may therefore indicate greater in‐hospital morbidity among children with a bacterial meningitis‐associated condition. Since mortality rates for bacterial meningitis are low in children, in‐hospital morbidity may be a better indicator of disease burden.
Our data show that, in contrast to adults, bacterial meningitis in children is not typically associated with other focal infections. Some focal complications such as mastoiditis and osteomyelitis disproportionately affect older children. These complications are typically accompanied by overt clinical manifestations. Therefore, we believe that the evaluation for the presence of concomitant focal infections can be guided by clinical examination findings and that routine radiologic evaluation for focal complications may not be necessary. Additionally, focal infections tend to occur in the absence of concomitant systemic complications. Of the 151 children with at least 1 associated focal infection, only 37% had a systemic complication. Bacterial meningitis may lie on a continuum of invasive disease depending on the virulence factors of the invading pathogen as well as specific host factors. Understanding the epidemiology of these associated conditions can enhance our understanding of the pathogenesis of bacterial meningitis in children. Understanding why some children suffer from septicemia rather than bacteremia may help in developing novel therapeutics.
There are several limitations to our study. First, since we identified focal infections and systemic complications using billing charges and ICD‐9 discharge diagnosis codes, it was impossible to determine when these conditions represented true complications of bacterial meningitis and when they represented the primary source of infection. Therefore, some of our primary outcomes may represent the cause of meningitis rather than a direct complication. We attempted to minimize such misclassification by limiting the cohort to those with a primary discharge diagnosis of bacterial meningitis though such misclassification is still possible.
Second, the use of ICD‐9 codes to accurately identify systemic complications and associated focal infections is a potential limitation. For example, respiratory failure, defined as the requirement of endotracheal intubation in our study, may not capture children receiving non‐invasive mechanical ventilation (eg, bilevel positive airway pressure). If use of noninvasive ventilation strategies did not depend exclusively on illness severity, our study would underestimate the frequency of respiratory failure. Furthermore, there may be inconsistencies among pediatric physicians in coding conditions such as SIRS and sepsis. Even in the clinical setting, a uniform definition of SIRS and sepsis is problematic due to physiologic differences between adults and children of varying age groups.16 An international panel of pediatricians proposed age‐specific definitions for sepsis and SIRS, while acknowledging the paucity of evidence to support some of their recommendations.16 None of the proposed definitions could be applied using administrative data. Limitations in the use of ICD‐9 discharge diagnosis codes to identify children with bacterial meningitis were discussed previously.1
Third, only free‐standing children's hospitals were included in the analysis. It is likely that many children with uncomplicated bacterial meningitis are treated at community hospitals or smaller academic centers. Our study may overestimate the rate of bacterial meningitis‐associated focal infections and systemic complications since participating hospitals serve as regional referral centers. To address the potential for such referral bias, we repeated the analysis while restricting the cohort to those children who had a lumbar puncture performed at the treating facility. No difference in frequency of associated conditions or in‐hospital resource utilization was found between children transferred and children not transferred. Finally, the PHIS database reports billed charge data rather than cost data. Billed data may overestimate the actual economic impact of bacterial meningitis‐associated complications since payers often reimburse at lesser rates. Resource utilization may also vary widely between hospitals and geographic locations as previously shown.15
In conclusion, bacterial meningitis remains an important cause of morbidity in children. Systemic complications such as sepsis and respiratory failure are common. Respiratory failure occurred more commonly among patients with meningococcal meningitis while sepsis occurred more commonly among patients with pneumococcal meningitis. While focal complications are uncommon, children >5 years of age are more likely than younger children to have concomitant mastoiditis or osteomyelitis. The presence of both systemic and focal complications is associated with substantially greater resource utilization than either complication alone.
Dr. Shah had full access to all of the data in the study and takes responsibility for the integrity of the data and the accuracy of the analysis. Study concept and design: Shah, Mongelluzzo; acquisition of data: Shah, Mohamad; analysis and interpretation of data: Mongelluzzo, Mohamad, Ten Have, Shah; drafting of the manuscript: Mongelluzzo; critical revision of the manuscript for important intellectual content: Mongelluzzo, Mohamad, Ten Have, Shah; statistical analysis: Shah, Mongelluzzo, Ten Have; obtained funding: Shah, Mongelluzzo; administrative, technical, or material support: Shah; study supervision: Shah.
Appendix
Diagnosis Codes:
Endocarditis: 421.0, 421.1, 421.9
Mastoiditis: 383.0, 383.1, 383.2, 383.8, 383.9
Osteomyelitis: 730.0, 730.1, 730.2, 730.3, 730.7, 730.8, 730.9
Septic arthritis: 711.0, 711.1, 711.2, 711.3, 711.4, 711.5, 711.6, 711.7, 711.8, 711.9
Sepsis: 038.0, 038.1, 038.2, 038.3, 038.4, 038.8, 038.9
Systemic Inflammatory Response Syndrome: 995.92
Pneumonia: 480.0, 480.1, 480.2, 480.3, 480.8, 480.9, 481, 482.0, 482.1, 482.2, 482.3, 482.4, 482.8, 482.9, 483.0, 483.1, 483.8, 484.1, 484.3, 484.5, 484.6, 484.7, 484.8, 485, 486
Procedure Codes:
Endotracheal Intubation: 96.04
- , , , .Corticosteroids and mortality in children with bacterial meningitis.JAMA.2008;299:2048–2055.
- , , , et al.Bacterial meningitis in the United States in 1995. Active surveillance team.N Engl J Med.1997;337:970–976.
- Progress toward elimination of Haemophilus influenzae type b disease among infants and children–United States, 1987–1995.MMWR Morb Mortal Wkly Rep.1996;45:901–906.
- , .Bacterial meningitis in children.Lancet.2003;361:2139–2148.
- , .Dexamethasone in adults with bacterial meningitis.N Engl J Med.2002;347:1549–1556.
- , .Dexamethasone and pneumococcal meningitis.Ann Intern Med.2004;141:327.
- , , , et al.Dexamethasone in Vietnamese adolescents and adults with bacterial meningitis.N Engl J Med.2007;357:2431–2440.
- , , , , .Bacterial meningitis in an urban area: etiologic study and prognostic factors.Infection.2007;35:406–413.
- , , .Clinical features and prognostic factors in childhood pneumococcal meningitis.J Microbiol Immunol Infect.2008;41:48–53.
- , , .Clinical presentation and prognostic factors of Streptococcus pneumoniae meningitis according to the focus of infection.BMC Infect Dis.2005;5:93.
- , .Trends in invasive pneumococcal disease‐associated hospitalizations.Clin Infect Dis.2006;42:e1–e5.
- , , .Managing meningococcal disease in the United States: Hospital case characteristics and costs by age.Value Health.2006;9:236–243.
- , , , , , .Population‐based analysis of meningococcal disease mortality in the United States: 1990–2002.Pediatr Infect Dis J.2006;25:191–194.
- , , , .A contemporary analysis of acute mastoiditis.Arch Otolaryngol Head Neck Surg.1996;122:135–139.
- , , .Patient and hospital correlates of clinical outcomes and resource utilization in severe pediatric sepsis.Pediatrics.2007;119:487–494.
- , , .International pediatric sepsis consensus conference: definitions for sepsis and organ dysfunction in pediatrics.Pediatr Crit Care Med.2005;6:2–8.
Bacterial meningitis can be a devastating disease in children. Overall mortality in children in the United States is 4%1 while long‐term morbidity is present in up to 25%2 of surviving children. The introduction of Haemophilus influenzae type B vaccine, heptavalent pneumococcal conjugate vaccine, and the quadrivalent meningococcal conjugate vaccine has altered the epidemiology of bacterial meningitis.24 Currently, little is known about the epidemiology of systemic complications and associated focal infections that occur during episodes of bacterial meningitis in children and how the presence of such complications affects in‐hospital healthcare resource utilization.
In a randomized controlled trial, the administration of adjuvant corticosteroids was associated with lower mortality rates in adults with bacterial meningitis due to all causes, with the greatest reduction in those with pneumococcal meningitis.5 In a post hoc analysis of data from this trial, reductions in systemic complications, such as septic shock, pneumonia, and acute respiratory distress syndrome, rather than neurologic complications were thought to be the underlying reason for the decrease in mortality associated with pneumococcal meningitis among corticosteroid recipients.6 However, children with bacterial meningitis have an overall 4‐fold lower mortality rate than adults with bacterial meningitis. An even greater difference in mortality rates exists between children and adults with pneumococcal meningitis.1, 5 Children do not benefit from adjuvant corticosteroids as adults do.1, 5, 7 Therefore, the pathogenesis of bacterial meningitis may differ in children from adults and account for the difference in response to adjuvant corticosteroids. Understanding the epidemiology of systemic complications and associated focal infections can aid in the understanding of the pathogenesis of the disease in varying age groups of children.
Previous studies in children have documented the frequency of certain bacterial meningitis‐associated conditions such as respiratory failure, pneumonia, endocarditis, and mastoiditis. Researchers have used the presence of such conditions to predict either mortality or neurologic sequelae in children.810 These studies were small and only included a few types of complications associated with bacterial meningitis. In‐hospital healthcare resource utilization, which may be an important indicator of in‐hospital morbidity, was also not considered as an outcome. In‐hospital morbidity may represent aspects of disease burden not captured by mortality rates or markers for long‐term morbidity alone. In future vaccine efficacy trails or novel therapeutics evaluations, consideration of these associated conditions is important.
The quantification of the use of in‐hospital healthcare utilization is also important for hospital planning and resource allocation in children with bacterial meningitis. A child presenting with bacterial meningitis and a systemic complication or an associated focal infection may require additional resource planning initially to expedite care to enhance recovery and decrease hospital length of stay (LOS).
Our goal was to document the frequency of bacterial meningitis‐associated conditions (systemic complications and associated focal infections) in a large cohort of children with bacterial meningitis treated at tertiary care children's hospitals in the United States, and determine how the presence of such conditions impacted in‐hospital healthcare resource utilization.
Patients and Methods
Data Source
Data for this retrospective cohort study was obtained from the Pediatric Health Information System (PHIS), a national administrative database containing data from 36 freestanding, tertiary care children's hospitals. These hospitals are affiliated with the Child Health Corporation of America (Shawnee Mission, KS), a business alliance of children's hospitals. Data quality and reliability are assured through a joint effort between the Child Health Corporation of America and participating hospitals. For the purposes of external benchmarking, participating hospitals provide discharge data including patient demographics, diagnoses, and procedures. Procedures to assure data validity were described previously.1 Total hospital charges are reported in the PHIS database and adjusted for hospital location using the Centers for Medicare and Medicaid price/wage index. A total of 27 participating hospitals also provide resource utilization data for each hospital discharge (ie, pharmaceutical dispensing, imaging, and laboratory studies); patients from these 27 hospitals were eligible for inclusion in this study. The protocol for the conduct of this study was reviewed and approved by The Children's Hospital of Philadelphia Committees for the Protection of Human Subjects.
Patients
Children less than 18 years of age with bacterial meningitis were eligible for this study if they were discharged from any of the 27 hospitals disclosing resource utilization data between January 1, 2001 and December 31, 2006. Study participants discharged with bacterial meningitis as their primary diagnosis were identified in the PHIS database using International Classification of Diseases, 9th revision, (ICD‐9) discharge diagnosis codes. The study population was limited to children without conditions predisposing to meningitis. Therefore, patients with ventricular shunts prior to the episode of bacterial meningitis were excluded using the following ICD‐9 procedure codes: ventricular shunt replacement (02.42); incision of peritoneum (54.95); removal of ventricular shunts (02.43); and the ICD‐9 discharge diagnosis code for mechanical complication of nervous system device, implant, and graft (996.2). Also, children with comorbid conditions that could predispose to meningitis or increase the likelihood of associated complications such as cancer (hematologic and nonhematologic), primary or secondary immunodeficiencies, prematurity, post‐operative infection, congenital cardiac disease, and sickle cell disease, were excluded from the analysis. Race and ethnicity were self‐reported by patients at time of admission.
Study Definitions
Study participants were identified from the PHIS database using ICD‐9 codes for the primary diagnosis of bacterial meningitis (codes 036.0‐036.1; 320.0‐320.3; 320.7; 320.81‐320.82; 320.89; 320.9). The sensitivity and specificity of ICD‐9 codes in identifying children with bacterial meningitis is unknown, however these codes have been used by previous investigators.1113 Bacterial meningitis associated‐conditions were classified as systemic complications (sepsis, systemic inflammatory response syndrome (SIRS), and respiratory failure) and associated focal infections (septic arthritis, mastoiditis, osteomyelitis, pneumonia and endocarditis). These associated conditions were identified by ICD‐9 discharge and procedural codes as listed in the Appendix (Supporting Information). Bone and joint infections were defined by the presence of either osteomyelitis or septic arthritis.
Primary Outcomes
The primary outcomes of interest were total in‐hospital charges and hospital LOS.
Measured Exposures
The primary exposures of interest were the occurrences of systemic complications, focal infections, or both conditions in children with bacterial meningitis.
Statistical Analysis
The data were initially described using frequencies and percentages for categorical variables and mean, median, interquartile ranges (IQRs) and range values for continuous variables. Analyses of bivariate associations between the outcomes (total in‐hospital charges and length of hospital stay) and potential covariates entailed either chi‐square tests or, for rare events with an expected frequency <5, Fishers Exact Test.
Following bivariate analysis, multivariable models were constructed to assess the adjusted impact of systemic complications and focal infection on total in‐hospital charges and hospital LOS. In evaluating total in‐hospital charges, the charge data were logarithmically transformed to account for the skewed distribution of charges. Multivariable linear regression was then performed to analyze the log transformed charges. The resulting beta‐coefficients were transformed to reflect the percent difference in total hospital charges between children with and without specific complications. In evaluating hospital LOS, negative binomial regression models were employed to estimate incidence rate ratios (IRRs) rather than log‐linear models, as to account for overdispersion in the outcome data. The negative binomial model produced a ratio of lengths of stay or IRR, where a ratio >1 indicates that the risk factor was associated with a longer LOS. The results were presented as percentage change to facilitate interpretation of the results.
The multivariable models were adjusted for the following confounders as determined a priori: age category, race, sex, vancomycin receipt, and adjuvant corticosteroid receipt within the first 24 hours of admission. Tests for interaction between systemic complications or focal infections and age were performed for each of these models. To address the possibility of referral bias which would lead us to overestimate the cost of caring for children with bacterial meningitis with an associated condition, the analyses were repeated restricting the sample to those children who had a lumber puncture performed at a PHIS‐participating hospital. The frequency of systemic complications and focal infections in those who were transferred was no different than in children who were not transferred; therefore the entire cohort was used in the final analyses. Sub‐group analyses were also performed for children identified with pneumococcal and meningococcal meningitis.
The standard errors for all estimates of covariate effects including metastatic effects under the above models were adjusted for the hospital to account for the increased variability due to clustering of individuals within hospitals. Two‐tailed P values <0.05 were considered statistically significant. Actual P values and 95% confidence intervals are reported. Data were analyzed using STATA, Version 10 (Stata Corporation, College Station, TX).
Results
Demographics
There were 2780 children admitted with bacterial meningitis during the study period; 461 (17%) children were excluded because of comorbid illness including malignancy (n = 37), congential heart disease (n = 231), prematurity (n = 104), human immunodeficiency virus infection (n = 4), sickle cell disease (n = 17), and post‐operative infection (n = 68). The remaining 2319 children with bacterial meningitis were included in the analyses. The mean age was 3.6 years (median, 1 year; IQR, 0‐6 years). Approximately half of the children were less than 1 year of age, 23% were 1 to 5 years, and 27% were >5 years. A total of 54% of children were white, 19% were black, 22% were Hispanic, and 5% were of other racial groups. Males accounted for 58% of the children. In this cohort of children, 9% received adjuvant corticosteroids within 24 hours of hospitalization.
Bacterial Meningitis‐Associated Conditions
Overall, 574 (25%) of children with bacterial meningitis suffered a systemic complication or an associated focal infection. Figure 1 shows the types of associated condition stratified by age category. Older children had a higher frequency of associated focal infections while younger children had a higher frequency of systemic complications (P = 0.002, chi‐square test for trend). Figure 2 shows the distribution of specific conditions among children in each age category. The frequency of sepsis decreased with age (P < 0.001, chi‐square test) while the frequency of mastoiditis (P < 0.001, Fisher's exact test) and osteomyelitis (P = 0.005, Fisher's exact test) increased with age. There did not appear to be substantial variability in the proportion of patients with SIRS or sepsis across hospitals, suggesting that hospital‐level variability in coding for these conditions was likely minimal. The median proportion of patients with SIRS by hospital was 2.4% (IQR, 1.2‐4.8%) while the median proportion of patients with sepsis by hospital was 13.4% (IQR, 10.0‐16.9%).
Of the 151 children with an associated focal infection, only 3 (2%) of children had more than 1 infection (1 child had mastoiditis and endocarditis, 1 child had pneumonia and osteomyelitis, and 1 child had pneumonia and endocarditis). However, of the 479 children with systemic complications, 116 (24%) had more than 1 systemic disease (Table 1).
| Types of Systemic Complications | Systemic Complications in All Bacterial Meningitis, n (%) | Systemic Complications in Meningococcal Meningitis, n (%) | Systemic Complications in Pneumococcal Meningitis, n (%) |
|---|---|---|---|
| |||
| Sepsis only | 209 (44) | 16 (21) | 69 (54) |
| Respiratory failure only | 139 (29) | 38 (49) | 30 (24) |
| SIRS only | 15 (3) | 9 (12) | 1 (1) |
| Sepsis and respiratory failure | 52 (11) | 4 (5) | 18 (14) |
| SIRS and sepsis | 27 (6) | 2 (3) | 4 (3) |
| SIRS and respiratory failure | 9 (2) | 5 (6) | 0 (0) |
| SIRS and respiratory failure and sepsis | 28 (6) | 3 (4) | 5 (4) |
| Total systemic complications | 479 | 77 | 127 |
In sub‐group analyses, 269 children had meningococcal meningitis and 470 children had pneumococcal meningitis. Of the children with meningococcal meningitis, 31.2% had a meningitis‐associated condition: 26.4% had a systemic complication, 2.6% had a focal infection, and 2.2% had both conditions. The most common associated conditions in children with meningococcal meningitis were respiratory failure (18.6%; n = 50), sepsis (9.3%; n = 25), and SIRS (7.1%; n = 19). In children with pneumococcal meningitis, 32.3% had a meningitis‐associated complication: 24.7% had a systemic complication, 5.3% had a focal infection, and 2.3% had both conditions. The most common associated conditions in children with pneumococcal meningitis were sepsis (20.4%; n = 96), respiratory failure (11.3%; n = 53), and pneumonia (4.7%; n = 22); mastoiditis was present in 2.3% (n = 11) of children with pneumococcal meningitis. Respiratory failure was more common in meningococcal meningitis (18.6%) than in pneumococcal meningitis (11.3%; P = 0.006). In contrast, sepsis was less common in meningococcal meningitis (9.3%) than in pneumococcal meningitis (20.4%; P < 0.001).
Hospital Charges
Overall, the median charges per hospital ranged from $20,158 to $53,823. In‐hospital charges for children with bacterial meningitis with and without any identified associated conditions are presented in Table 2. In multivariate analyses, the presence of systemic conditions, associated focal infections, or both conditions was independently associated with significantly higher total in‐hospital charges (Table 2). When conditions were considered individually, bone and joint infections (213% increase; 95% CI, 113‐260%), endocarditis (108% increase; 95% CI, 23‐258%), and pneumonia (107% increase; 95% CI, 58‐171%) were associated with the highest increases in total hospital charges (Figure 3). In contrast, SIRS and mastoiditis were not associated with higher hospital charges (Figure 3).
| Charges | LOS | |||
|---|---|---|---|---|
| Median, $ (IQR) | Adjusted Increase,* % (95% CI) | Median, days (IQR) | Adjusted Increase,* % (95% CI) | |
| ||||
| None (n = 1,745) | $27,110 (15,823‐48,307) | Reference** | 9 (6‐14) | Reference |
| Systemic (n = 423) | $66,690 (39,546136,756) | 136 (108269) | 14 (923) | 72 (5196) |
| Focal Infection (n = 95) | $58,016 (29,056125,813) | 118 (77168) | 13 (928) | 78 (40126) |
| Both (n = 56) | $130,744 (62,397299,288) | 351 (237503) | 21.5 (1245) | 211 (142303) |
LOS
The median LOS was 9 days (IQR, 6‐15 days); 5% of children had a LOS >42 days. Table 2 summarizes difference in LOS by the presence and absence of systemic conditions and focal infections. In multivariate analyses, the presence of systemic conditions, associated focal infections, or both conditions was independently associated with a significantly longer LOS (Table 2). When conditions were considered individually, endocarditis (152% increase; 95% CI, 60‐300%) and pneumonia (136% increase; 95% CI, 85‐201%) were associated with the greatest adjusted increases in LOS (Figure 4); only mastoiditis was not associated with an increased LOS compared with those without complications.
Discussion
To our knowledge, this is the first study to examine bacterial meningitis‐associated conditions in children and their impact on in‐hospital resource utilization. We found that 25% of the cohort of children with bacterial meningitis suffered from at least one focal infection or systemic complication. This represents a significant invasive disease burden among children with bacterial meningitis who do not have underlying comorbid conditions. Younger children were more likely to have systemic complications when compared with older children, specifically due to a higher frequency of sepsis in children <1 year. Older children were more likely to have an associated focal infection, specifically due to an increase in mastoiditis and osteomyelitis in children >1 year. Only 2% of children had more than 1 focal infection, while 24% of children had more than 1 systemic complication.
Importantly, the presence of a systemic complication in a child with bacterial meningitis increased their in‐hospital adjusted charges by 136%. The presence of a focal infection increased in‐hospital adjusted charges by 118%. A child with both a systemic complication and a focal infection and had a 351% increase in in‐hospital adjusted charges.
The presence of systemic complications or associated focal infections was significantly associated with higher in‐hospital charges and longer hospital LOS. Most individual meningitis‐associated conditions included in this study were associated with higher in‐hospital charges with the exception of SIRS and mastoiditis. All individual meningitis‐associated conditions were associated with a longer LOS except mastoiditis. This finding is not surprising as the LOS for children with mastoiditis is typically shorter than for children with bacterial meningitis. Glikich et al.14 reported a mean LOS of approximately 8 days for children with mastoiditis. As meningitis in the context of mastoiditis is likely caused by direct extension of infection, patients with meningitis and mastoiditis likely required extended hospitalization to treat meningitis rather than mastoiditis. In contrast, patients with meningitis occurring in the context of metastatic dissemination of infection (eg, endocarditis, pneumonia) often have hemodynamic instability requiring prolonged intensive care support.
A study of children with sepsis found that increasing severity of illness was associated with greater hospital resource utilization.15 Our study shows that this may also be true in children with bacterial meningitis. We found that in children with bacterial meningitis, having systemic complications or an associated focal infection was associated with greater in‐hospital resource utilization. This finding may therefore indicate greater in‐hospital morbidity among children with a bacterial meningitis‐associated condition. Since mortality rates for bacterial meningitis are low in children, in‐hospital morbidity may be a better indicator of disease burden.
Our data show that, in contrast to adults, bacterial meningitis in children is not typically associated with other focal infections. Some focal complications such as mastoiditis and osteomyelitis disproportionately affect older children. These complications are typically accompanied by overt clinical manifestations. Therefore, we believe that the evaluation for the presence of concomitant focal infections can be guided by clinical examination findings and that routine radiologic evaluation for focal complications may not be necessary. Additionally, focal infections tend to occur in the absence of concomitant systemic complications. Of the 151 children with at least 1 associated focal infection, only 37% had a systemic complication. Bacterial meningitis may lie on a continuum of invasive disease depending on the virulence factors of the invading pathogen as well as specific host factors. Understanding the epidemiology of these associated conditions can enhance our understanding of the pathogenesis of bacterial meningitis in children. Understanding why some children suffer from septicemia rather than bacteremia may help in developing novel therapeutics.
There are several limitations to our study. First, since we identified focal infections and systemic complications using billing charges and ICD‐9 discharge diagnosis codes, it was impossible to determine when these conditions represented true complications of bacterial meningitis and when they represented the primary source of infection. Therefore, some of our primary outcomes may represent the cause of meningitis rather than a direct complication. We attempted to minimize such misclassification by limiting the cohort to those with a primary discharge diagnosis of bacterial meningitis though such misclassification is still possible.
Second, the use of ICD‐9 codes to accurately identify systemic complications and associated focal infections is a potential limitation. For example, respiratory failure, defined as the requirement of endotracheal intubation in our study, may not capture children receiving non‐invasive mechanical ventilation (eg, bilevel positive airway pressure). If use of noninvasive ventilation strategies did not depend exclusively on illness severity, our study would underestimate the frequency of respiratory failure. Furthermore, there may be inconsistencies among pediatric physicians in coding conditions such as SIRS and sepsis. Even in the clinical setting, a uniform definition of SIRS and sepsis is problematic due to physiologic differences between adults and children of varying age groups.16 An international panel of pediatricians proposed age‐specific definitions for sepsis and SIRS, while acknowledging the paucity of evidence to support some of their recommendations.16 None of the proposed definitions could be applied using administrative data. Limitations in the use of ICD‐9 discharge diagnosis codes to identify children with bacterial meningitis were discussed previously.1
Third, only free‐standing children's hospitals were included in the analysis. It is likely that many children with uncomplicated bacterial meningitis are treated at community hospitals or smaller academic centers. Our study may overestimate the rate of bacterial meningitis‐associated focal infections and systemic complications since participating hospitals serve as regional referral centers. To address the potential for such referral bias, we repeated the analysis while restricting the cohort to those children who had a lumbar puncture performed at the treating facility. No difference in frequency of associated conditions or in‐hospital resource utilization was found between children transferred and children not transferred. Finally, the PHIS database reports billed charge data rather than cost data. Billed data may overestimate the actual economic impact of bacterial meningitis‐associated complications since payers often reimburse at lesser rates. Resource utilization may also vary widely between hospitals and geographic locations as previously shown.15
In conclusion, bacterial meningitis remains an important cause of morbidity in children. Systemic complications such as sepsis and respiratory failure are common. Respiratory failure occurred more commonly among patients with meningococcal meningitis while sepsis occurred more commonly among patients with pneumococcal meningitis. While focal complications are uncommon, children >5 years of age are more likely than younger children to have concomitant mastoiditis or osteomyelitis. The presence of both systemic and focal complications is associated with substantially greater resource utilization than either complication alone.
Dr. Shah had full access to all of the data in the study and takes responsibility for the integrity of the data and the accuracy of the analysis. Study concept and design: Shah, Mongelluzzo; acquisition of data: Shah, Mohamad; analysis and interpretation of data: Mongelluzzo, Mohamad, Ten Have, Shah; drafting of the manuscript: Mongelluzzo; critical revision of the manuscript for important intellectual content: Mongelluzzo, Mohamad, Ten Have, Shah; statistical analysis: Shah, Mongelluzzo, Ten Have; obtained funding: Shah, Mongelluzzo; administrative, technical, or material support: Shah; study supervision: Shah.
Appendix
Diagnosis Codes:
Endocarditis: 421.0, 421.1, 421.9
Mastoiditis: 383.0, 383.1, 383.2, 383.8, 383.9
Osteomyelitis: 730.0, 730.1, 730.2, 730.3, 730.7, 730.8, 730.9
Septic arthritis: 711.0, 711.1, 711.2, 711.3, 711.4, 711.5, 711.6, 711.7, 711.8, 711.9
Sepsis: 038.0, 038.1, 038.2, 038.3, 038.4, 038.8, 038.9
Systemic Inflammatory Response Syndrome: 995.92
Pneumonia: 480.0, 480.1, 480.2, 480.3, 480.8, 480.9, 481, 482.0, 482.1, 482.2, 482.3, 482.4, 482.8, 482.9, 483.0, 483.1, 483.8, 484.1, 484.3, 484.5, 484.6, 484.7, 484.8, 485, 486
Procedure Codes:
Endotracheal Intubation: 96.04
- , , , .Corticosteroids and mortality in children with bacterial meningitis.JAMA.2008;299:2048–2055.
- , , , et al.Bacterial meningitis in the United States in 1995. Active surveillance team.N Engl J Med.1997;337:970–976.
- Progress toward elimination of Haemophilus influenzae type b disease among infants and children–United States, 1987–1995.MMWR Morb Mortal Wkly Rep.1996;45:901–906.
- , .Bacterial meningitis in children.Lancet.2003;361:2139–2148.
- , .Dexamethasone in adults with bacterial meningitis.N Engl J Med.2002;347:1549–1556.
- , .Dexamethasone and pneumococcal meningitis.Ann Intern Med.2004;141:327.
- , , , et al.Dexamethasone in Vietnamese adolescents and adults with bacterial meningitis.N Engl J Med.2007;357:2431–2440.
- , , , , .Bacterial meningitis in an urban area: etiologic study and prognostic factors.Infection.2007;35:406–413.
- , , .Clinical features and prognostic factors in childhood pneumococcal meningitis.J Microbiol Immunol Infect.2008;41:48–53.
- , , .Clinical presentation and prognostic factors of Streptococcus pneumoniae meningitis according to the focus of infection.BMC Infect Dis.2005;5:93.
- , .Trends in invasive pneumococcal disease‐associated hospitalizations.Clin Infect Dis.2006;42:e1–e5.
- , , .Managing meningococcal disease in the United States: Hospital case characteristics and costs by age.Value Health.2006;9:236–243.
- , , , , , .Population‐based analysis of meningococcal disease mortality in the United States: 1990–2002.Pediatr Infect Dis J.2006;25:191–194.
- , , , .A contemporary analysis of acute mastoiditis.Arch Otolaryngol Head Neck Surg.1996;122:135–139.
- , , .Patient and hospital correlates of clinical outcomes and resource utilization in severe pediatric sepsis.Pediatrics.2007;119:487–494.
- , , .International pediatric sepsis consensus conference: definitions for sepsis and organ dysfunction in pediatrics.Pediatr Crit Care Med.2005;6:2–8.
Copyright © 2010 Society of Hospital Medicine