User login
Feds call for EHR interoperability. Again.
WASHINGTON – In what feels like a tradition, the need to solve interoperability issues was front and center once again as the key goal presented by Health and Human Services officials at the annual meeting of the Office of the National Coordinator.

“It is actually impossible to move to a future health system, the one that we need ... without a truly interoperable system,” HHS Deputy Secretary Eric Hargan said Nov. 29 during a keynote address.
“Patients need to be able to access their own records. Period,” he added.
Mr. Hargan emphasized that the HHS will define what it wants to see regarding interoperability, but leave it up to vendors and developers to come up with solutions on how this will be accomplished.
One example that he mentioned is Blue Button 2.0, a part of the MyHealthEData initiative, which allows Medicare patients to connect their claims data to apps to help them make informed decisions about their care.
“The use of apps here reflects to potential, we believe, for patient-centered technology to improve health,” Mr. Hargan said.
He also noted that the agency is looking at how existing law and regulation – such as the antikickback statute, the Stark law, HIPAA, and federal privacy regulations – might be hindering the transition to value-based care.
This analysis is “specifically focused on understanding as quickly as we can ... how current interpretations of these laws may be impeding value-based transformation and coordinated care,” Mr. Hargan said.
ONC is also taking a look at reducing provider burden, issuing a draft strategy for comment that specifically targets provider burden related to the use of EHRs and offer up a series of recommendations to help address it.
WASHINGTON – In what feels like a tradition, the need to solve interoperability issues was front and center once again as the key goal presented by Health and Human Services officials at the annual meeting of the Office of the National Coordinator.
“It is actually impossible to move to a future health system, the one that we need ... without a truly interoperable system,” HHS Deputy Secretary Eric Hargan said Nov. 29 during a keynote address.
“Patients need to be able to access their own records. Period,” he added.
Mr. Hargan emphasized that the HHS will define what it wants to see regarding interoperability, but leave it up to vendors and developers to come up with solutions on how this will be accomplished.
One example that he mentioned is Blue Button 2.0, a part of the MyHealthEData initiative, which allows Medicare patients to connect their claims data to apps to help them make informed decisions about their care.
“The use of apps here reflects to potential, we believe, for patient-centered technology to improve health,” Mr. Hargan said.
He also noted that the agency is looking at how existing law and regulation – such as the antikickback statute, the Stark law, HIPAA, and federal privacy regulations – might be hindering the transition to value-based care.
This analysis is “specifically focused on understanding as quickly as we can ... how current interpretations of these laws may be impeding value-based transformation and coordinated care,” Mr. Hargan said.
ONC is also taking a look at reducing provider burden, issuing a draft strategy for comment that specifically targets provider burden related to the use of EHRs and offer up a series of recommendations to help address it.
REPORTING FROM ONC 2018
Death row executions raise questions about competence
AUSTIN, TEX. – More than one-quarter of inmates executed during a recent 7-year period had a history confirming or suggesting they had a mental illness that might have called their competence for execution into question, according to new research.
Capital punishment remains legal in 31 U.S. states. In Ford v. Wainwright, the U.S. Supreme Court ruled in 1986 that executing a person lacking competence violates the Eighth Amendment, yet many people with a history of mental illness have been executed, said Paulina Riess, MD, of the BronxCare Health System in New York, and her colleagues.
The question of appropriately determining whether someone is competent enough to be executed also is controversial, Dr. Riess and her colleagues noted in their research abstract at the annual meeting of the American Academy of Psychiatry and the Law. “The decision of whether one is competent ultimately falls into the hands of a forensic evaluator whose opinion should represent a clear and detailed explanation of a prison’s understanding, awareness, and comprehension of the pending execution.”
They also collected data on inmates’ age, race, instant offense, method of execution, and years spent on death row.
When the authors searched the literature for an evidence-based tool to provide “information regarding any history of mental illness pertaining to executed prisoners,” they found none and therefore relied on media coverage for their data on history of mental illness or disability or psychotropic medication treatment.
They found that 26% had a history of psychiatric illness, mental disability, or treatment with psychiatric medications.
Among 273 people executed from 2010-2017, all but 5 were men. Texas had the most executions at 80, followed by Florida (27), Georgia (23), Ohio (22), Oklahoma (21), and Alabama (17). Other states in the analysis included Arizona, Arkansas, Idaho, Louisiana, Mississippi, South Carolina, South Dakota, Utah, and Virginia.
Five of the inmates were aged older than 70 years, and seven were under 30 years old. Most were aged 31-40 years (73 inmates) or 40-50 years (108 inmates). The racial breakdown was 147 whites, 90 blacks, 35 Hispanics, and 1 Native American.
Lethal injection was the method of execution for all – except one who died by firing squad and two who died by electrocution. Seven inmates had been convicted for mass murder or serial killing (one of whom also had a robbery conviction). The others all had homicide convictions, 61 of whom had at least one other conviction in addition to homicide – predominantly robbery or rape.
Of those with information available, 117 inmates spent 11-20 years on death row, 64 spent 21-30 years, and 15 spent 31-40 years. Only five inmates spent fewer than 5 years on death row, and 49 inmates spent 5-10 years.
The need to rely on media reports for data collection is a limitation of the study. “While gathering demographic information, team members unanimously reported a history of trauma in a large portion of those executed during the 7-year span examined,” the authors reported. “This is another limitation as trauma history could have been included as a separate variable.”
No disclosures were reported.
REPORTING FROM THE AAPL ANNUAL MEETING
AHA jewels, readmissions not best at ‘Best Hospitals,’ and more
and study findings challenge cholesterol guidelines for patients with type 1 diabetes. Also, we take a closer look at how smoke-free policies affect blood pressure, and how magazine-ranked “Best Hospitals” actually perform.
Subscribe to Cardiocast wherever you get your podcasts.
Amazon Alexa
Apple Podcasts

Heart disease remains the leading cause of death in U.S.
The 10 leading causes of death in the United States remained unchanged over the past year, according to a new report from the Centers for Disease Control (CDC). Though life expectancy at birth decreased to 78.6 years in 2017, down from 78.7 years in 2016, that change was driven primarily by suicide and drug overdose.
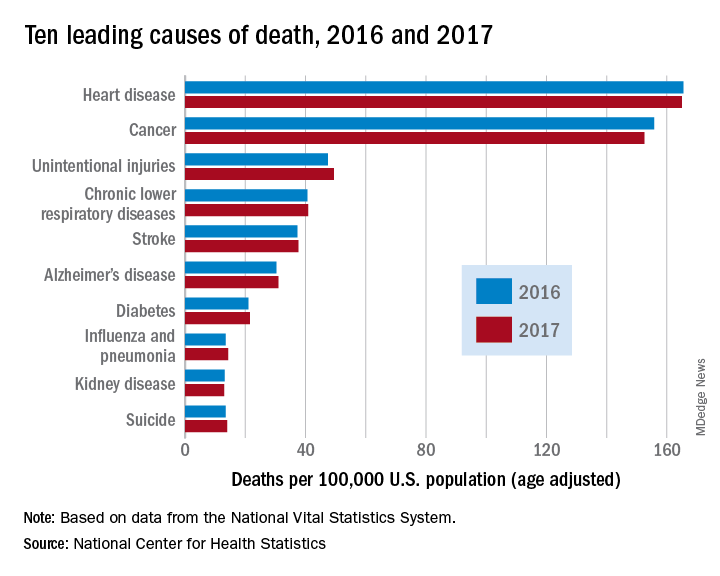
However, heart disease remains the leading cause of death in the United States, at 165 deaths per 100,000 individuals in 2017. This represents a slight, statistically nonsignificant, decrease from the 165.5 deaths per 100,000 caused by heart disease in the previous year.
Other diseases related to cardiometabolic health saw increases. Stroke and diabetes each caused a small but significant increase in deaths in 2017, which saw a 1-year increase to 37.6 from 37.3 stroke deaths per 100,000 people. Diabetes deaths increased to 21.5 from 21 per 100,000 the previous year. Stroke was the fifth and diabetes the seventh most common cause of death, according to the data brief published by the CDC’s National Center for Health Statistics (NCHS).
Alzheimer’s disease deaths also increased significantly, from 30.3 per 100,000 in 2016 to 31 per 100,000 in 2017. Although Alzheimer’s exact etiology remains under study, cardiovascular disease factors and Alzheimer’s disease share many risk factors and are often comorbid .
“With a slight decrease in deaths from heart disease in 2017 and a slight increase in deaths from stroke, this lack of any major movement in these areas has been a trend we’ve seen the last couple of years,” said Ivor Benjamin, MD, president of the American Heart Association, in a press release. “It is discouraging after experiencing decades when heart disease and stroke death rates both dropped more dramatically.”
Infant deaths from congenital malformations decreased from 2016 to 2017, from 122.1 to 118.8 deaths per 100,000 live births. “While the report doesn’t specify death rates for specific types of congenital malformations, this is heartening news as it could reflect fewer deaths from congenital heart defects,” said the AHA in its release.
According to the CDC, the 10 leading causes of death together account for about three quarters of United States deaths. Cancer caused nearly as many deaths as heart disease – 152.5 per 100,000. This represented a significant decrease from the 155.8 cancer deaths per 100,000 seen in 2016. The remaining top 10 causes of death, in decreasing order, were unintentional injuries, chronic lower respiratory diseases, influenza and pneumonia, kidney disease, and suicide.
The 10 leading causes of death in the United States remained unchanged over the past year, according to a new report from the Centers for Disease Control (CDC). Though life expectancy at birth decreased to 78.6 years in 2017, down from 78.7 years in 2016, that change was driven primarily by suicide and drug overdose.
However, heart disease remains the leading cause of death in the United States, at 165 deaths per 100,000 individuals in 2017. This represents a slight, statistically nonsignificant, decrease from the 165.5 deaths per 100,000 caused by heart disease in the previous year.
Other diseases related to cardiometabolic health saw increases. Stroke and diabetes each caused a small but significant increase in deaths in 2017, which saw a 1-year increase to 37.6 from 37.3 stroke deaths per 100,000 people. Diabetes deaths increased to 21.5 from 21 per 100,000 the previous year. Stroke was the fifth and diabetes the seventh most common cause of death, according to the data brief published by the CDC’s National Center for Health Statistics (NCHS).
Alzheimer’s disease deaths also increased significantly, from 30.3 per 100,000 in 2016 to 31 per 100,000 in 2017. Although Alzheimer’s exact etiology remains under study, cardiovascular disease factors and Alzheimer’s disease share many risk factors and are often comorbid .
“With a slight decrease in deaths from heart disease in 2017 and a slight increase in deaths from stroke, this lack of any major movement in these areas has been a trend we’ve seen the last couple of years,” said Ivor Benjamin, MD, president of the American Heart Association, in a press release. “It is discouraging after experiencing decades when heart disease and stroke death rates both dropped more dramatically.”
Infant deaths from congenital malformations decreased from 2016 to 2017, from 122.1 to 118.8 deaths per 100,000 live births. “While the report doesn’t specify death rates for specific types of congenital malformations, this is heartening news as it could reflect fewer deaths from congenital heart defects,” said the AHA in its release.
According to the CDC, the 10 leading causes of death together account for about three quarters of United States deaths. Cancer caused nearly as many deaths as heart disease – 152.5 per 100,000. This represented a significant decrease from the 155.8 cancer deaths per 100,000 seen in 2016. The remaining top 10 causes of death, in decreasing order, were unintentional injuries, chronic lower respiratory diseases, influenza and pneumonia, kidney disease, and suicide.
FROM A CDC DATA BRIEF
Missed HIV screening opportunities found among subsequently infected youth
In the year prior to HIV diagnosis, there were high rates of missed opportunities for HIV testing and sexual history documentation, according to a retrospective study of youth with HIV aged 14-26 years who were treated at an HIV clinic. These results demonstrate a failed need for routine HIV screening and counseling in adolescents, according to Nellie Riendeau Lazar, MPH, of Children’s Hospital of Philadelphia, and her colleagues.

The researchers retrospectively identified 301 subjects between January 2009 and April 2015 who met their study criteria. A total of 58 of these (19%) had at least one visit in the care network in the year prior to diagnosis and their entry into the adolescent HIV clinic, and they were analyzed for missed diagnosis. The adolescent HIV clinic is part of a large care network in the Philadelphia area that includes a pediatric emergency department and a tertiary care hospital. At the time of the study, there were 31 primary care sites, according to the authors.
The mean age of the subjects in the study was 17. The majority (80%) were young men, African-American (93%), and men who have sex with men (81%). There were no significant differences seen in demographics between those with and without prior visits in the health system (J Adolesc Health. 2018;63:799-802).
The 58 subjects were seen in 179 health care visits in the year prior to their diagnosis: 56% outpatient, 40% emergency department, and 4% inpatient visits. Only 59% of these visits had any documentation of sexual history and “the overwhelming majority of those noting sexual activity included no other information,” such as number of partners, sex of partners, or condom use, according to the researchers.
Among the total cohort, 183 of 301 had never had an HIV test prior to their first positive test, even though 26% had been seen in the care network in the 3 years prior to their diagnosis. Among the 58 in the missed opportunity analysis, only 48% had HIV testing, even though 88% (51) had documented symptoms in their visits that could have been consistent with acute infection.
“Our findings support the most recent guidelines from the Centers for Disease Control and Prevention, American Academy of Pediatrics (AAP), and United States Preventive Services Task Force (USPSTF), recommending routine HIV screening for all adolescents, regardless of risk,” the researchers stated. “Adolescents may not always disclose sexual activity during routine assessment, and provider level barriers limit the reach of risk-based testing algorithms,” they added.
The authors reported that they had no conflicts of interest.
SOURCE: Lazar NR et al. J Adolesc Health. 2018;63:799-802.
In the year prior to HIV diagnosis, there were high rates of missed opportunities for HIV testing and sexual history documentation, according to a retrospective study of youth with HIV aged 14-26 years who were treated at an HIV clinic. These results demonstrate a failed need for routine HIV screening and counseling in adolescents, according to Nellie Riendeau Lazar, MPH, of Children’s Hospital of Philadelphia, and her colleagues.
The researchers retrospectively identified 301 subjects between January 2009 and April 2015 who met their study criteria. A total of 58 of these (19%) had at least one visit in the care network in the year prior to diagnosis and their entry into the adolescent HIV clinic, and they were analyzed for missed diagnosis. The adolescent HIV clinic is part of a large care network in the Philadelphia area that includes a pediatric emergency department and a tertiary care hospital. At the time of the study, there were 31 primary care sites, according to the authors.
The mean age of the subjects in the study was 17. The majority (80%) were young men, African-American (93%), and men who have sex with men (81%). There were no significant differences seen in demographics between those with and without prior visits in the health system (J Adolesc Health. 2018;63:799-802).
The 58 subjects were seen in 179 health care visits in the year prior to their diagnosis: 56% outpatient, 40% emergency department, and 4% inpatient visits. Only 59% of these visits had any documentation of sexual history and “the overwhelming majority of those noting sexual activity included no other information,” such as number of partners, sex of partners, or condom use, according to the researchers.
Among the total cohort, 183 of 301 had never had an HIV test prior to their first positive test, even though 26% had been seen in the care network in the 3 years prior to their diagnosis. Among the 58 in the missed opportunity analysis, only 48% had HIV testing, even though 88% (51) had documented symptoms in their visits that could have been consistent with acute infection.
“Our findings support the most recent guidelines from the Centers for Disease Control and Prevention, American Academy of Pediatrics (AAP), and United States Preventive Services Task Force (USPSTF), recommending routine HIV screening for all adolescents, regardless of risk,” the researchers stated. “Adolescents may not always disclose sexual activity during routine assessment, and provider level barriers limit the reach of risk-based testing algorithms,” they added.
The authors reported that they had no conflicts of interest.
SOURCE: Lazar NR et al. J Adolesc Health. 2018;63:799-802.
FROM THE JOURNAL OF ADOLESCENT HEALTH
Key clinical point: Only 51% of youth with symptoms suggesting acute retroviral syndrome were tested.
Major finding: HIV testing was performed in only 48% of the subjects seen in the year prior to their diagnosis.
Study details: Retrospective review of subjects with HIV aged 14-26 years, comparing those with and without HIV screening within the year prior to diagnosis.
Disclosures: The authors reported that they had no conflicts of interest.
Source: Lazar NR et al. J Adolesc Health. 2018;63:799-802.
Open enrollment: Weekly volume down again
Plan selections at HealthCare.gov fell for the second week in a row as overall volume for open enrollment 2019 continues to lag behind last year, according to the Centers for Medicare & Medicaid Services.
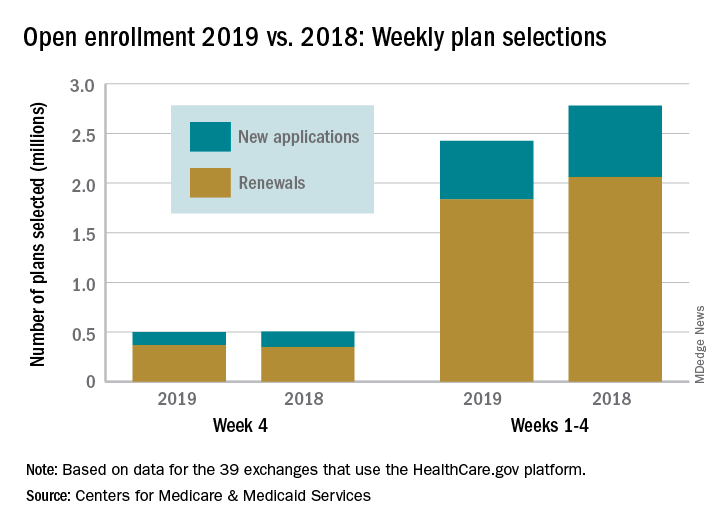
Just over 500,000 plans – 369,000 renewals and 131,000 new applications – were selected during week 4 (Nov. 18-24) for the 2019 coverage year in the 39 states that use the HealthCare.gov platform, which is down from 748,000 for week 3 and 805,000 for week 2. A similar pattern of decreases in weeks 3 and 4 was seen during last year’s open-enrollment period.
For the entire open enrollment so far this year, a little over 2.42 million plans have been selected, which is down by 12.8% from last year’s 4-week total of 2.78 million selections, the CMS data show.
Plan selections at HealthCare.gov fell for the second week in a row as overall volume for open enrollment 2019 continues to lag behind last year, according to the Centers for Medicare & Medicaid Services.
Just over 500,000 plans – 369,000 renewals and 131,000 new applications – were selected during week 4 (Nov. 18-24) for the 2019 coverage year in the 39 states that use the HealthCare.gov platform, which is down from 748,000 for week 3 and 805,000 for week 2. A similar pattern of decreases in weeks 3 and 4 was seen during last year’s open-enrollment period.
For the entire open enrollment so far this year, a little over 2.42 million plans have been selected, which is down by 12.8% from last year’s 4-week total of 2.78 million selections, the CMS data show.
Weight loss cuts risk of psoriatic arthritis
CHICAGO – Overweight and obese psoriasis patients have it within their power to reduce their risk of developing psoriatic arthritis through weight loss, according to a large British longitudinal study.

Of the three modifiable lifestyle factors evaluated in the study as potential risk factors for the development of psoriatic arthritis in psoriasis patients – body mass index, smoking, and alcohol intake – reduction in BMI over time was clearly the winning strategy, Neil McHugh, MD, said at the annual meeting of the American College of Rheumatology.
The message from this study of 90,189 incident cases of psoriasis identified in the U.K. Clinical Practice Research Datalink was unequivocal: “If you’re overweight and have psoriasis and you lose weight, you reduce your chance of developing a nasty form of arthritis,” said Dr. McHugh, professor of pharmacoepidemiology and a rheumatologist at the University of Bath, England.
“As psoriatic arthritis affects around 20% of people with psoriasis, weight reduction amongst those who are obese may have the potential to greatly reduce their risk of psoriatic arthritis in addition to providing additional health benefits,” he added.
Among the more than 90,000 patients diagnosed with psoriasis, 1,409 subsequently developed psoriatic arthritis, with an overall incidence rate of 2.72 cases per 1,000 person-years. Baseline BMI was strongly associated in stepwise fashion with subsequent psoriatic arthritis. Psoriasis patients with a baseline BMI of 25-29.9 kg/m2 were at an adjusted 1.76-fold increased risk of later developing psoriatic arthritis, compared with psoriasis patients having a BMI of less than 25. For those with a BMI of 30-34.9 kg/m2, the risk of subsequent psoriatic arthritis was increased 2.04-fold. And for those with a baseline BMI of 35 kg/m2 or more, the risk was increased 2.42-fold in analyses adjusted for age, sex, psoriasis duration and severity, history of trauma, and diabetes.
In contrast, the risk of developing psoriatic arthritis wasn’t significantly different between psoriasis patients who were nonsmokers, ex-smokers, or current smokers. And while there was a significantly increased risk of developing psoriatic arthritis in psoriasis patients who were current drinkers, compared with nondrinkers, the risk in ex-drinkers and heavy drinkers was similar to that in nondrinkers, a counterintuitive finding Dr. McHugh suspects was a distortion due to small numbers.
While the observed relationship between baseline BMI and subsequent risk of psoriatic arthritis was informative, it only tells part of the story, since body weight so often changes over time. Dr. McHugh and his coinvestigators had data on change in BMI over the course of 10 years of follow-up in 15,627 psoriasis patients free of psoriatic arthritis at the time their psoriasis was diagnosed. The researchers developed a BMI risk calculator that expressed the effect of change in BMI over time on the cumulative risk of developing psoriatic arthritis.
“We were able to show that if, for instance, you started with a BMI of 25 at baseline and ended up with a BMI of 30, your risk of psoriatic arthritis goes up by 13%, whereas if you start at 30 and come down to 25, your risk decreases by 13%. And the more weight you lose, the greater you reduce your risk of developing psoriatic arthritis,” the rheumatologist explained in an interview.
Indeed, with more extreme changes in BMI over the course of a decade following diagnosis of psoriasis – for example, dropping from a baseline BMI of 36 kg/m2 to 23 kg/m2 – the risk of developing psoriatic arthritis fell by close to 30%.
Dr. McHugh reported having no financial conflicts regarding this study, funded by the U.K. National Institute for Health Research.
SOURCE: Green A et al. Arthritis Rheumatol. 2018;70(Suppl 10): Abstract 2134.
CHICAGO – Overweight and obese psoriasis patients have it within their power to reduce their risk of developing psoriatic arthritis through weight loss, according to a large British longitudinal study.
Of the three modifiable lifestyle factors evaluated in the study as potential risk factors for the development of psoriatic arthritis in psoriasis patients – body mass index, smoking, and alcohol intake – reduction in BMI over time was clearly the winning strategy, Neil McHugh, MD, said at the annual meeting of the American College of Rheumatology.
The message from this study of 90,189 incident cases of psoriasis identified in the U.K. Clinical Practice Research Datalink was unequivocal: “If you’re overweight and have psoriasis and you lose weight, you reduce your chance of developing a nasty form of arthritis,” said Dr. McHugh, professor of pharmacoepidemiology and a rheumatologist at the University of Bath, England.
“As psoriatic arthritis affects around 20% of people with psoriasis, weight reduction amongst those who are obese may have the potential to greatly reduce their risk of psoriatic arthritis in addition to providing additional health benefits,” he added.
Among the more than 90,000 patients diagnosed with psoriasis, 1,409 subsequently developed psoriatic arthritis, with an overall incidence rate of 2.72 cases per 1,000 person-years. Baseline BMI was strongly associated in stepwise fashion with subsequent psoriatic arthritis. Psoriasis patients with a baseline BMI of 25-29.9 kg/m2 were at an adjusted 1.76-fold increased risk of later developing psoriatic arthritis, compared with psoriasis patients having a BMI of less than 25. For those with a BMI of 30-34.9 kg/m2, the risk of subsequent psoriatic arthritis was increased 2.04-fold. And for those with a baseline BMI of 35 kg/m2 or more, the risk was increased 2.42-fold in analyses adjusted for age, sex, psoriasis duration and severity, history of trauma, and diabetes.
In contrast, the risk of developing psoriatic arthritis wasn’t significantly different between psoriasis patients who were nonsmokers, ex-smokers, or current smokers. And while there was a significantly increased risk of developing psoriatic arthritis in psoriasis patients who were current drinkers, compared with nondrinkers, the risk in ex-drinkers and heavy drinkers was similar to that in nondrinkers, a counterintuitive finding Dr. McHugh suspects was a distortion due to small numbers.
While the observed relationship between baseline BMI and subsequent risk of psoriatic arthritis was informative, it only tells part of the story, since body weight so often changes over time. Dr. McHugh and his coinvestigators had data on change in BMI over the course of 10 years of follow-up in 15,627 psoriasis patients free of psoriatic arthritis at the time their psoriasis was diagnosed. The researchers developed a BMI risk calculator that expressed the effect of change in BMI over time on the cumulative risk of developing psoriatic arthritis.
“We were able to show that if, for instance, you started with a BMI of 25 at baseline and ended up with a BMI of 30, your risk of psoriatic arthritis goes up by 13%, whereas if you start at 30 and come down to 25, your risk decreases by 13%. And the more weight you lose, the greater you reduce your risk of developing psoriatic arthritis,” the rheumatologist explained in an interview.
Indeed, with more extreme changes in BMI over the course of a decade following diagnosis of psoriasis – for example, dropping from a baseline BMI of 36 kg/m2 to 23 kg/m2 – the risk of developing psoriatic arthritis fell by close to 30%.
Dr. McHugh reported having no financial conflicts regarding this study, funded by the U.K. National Institute for Health Research.
SOURCE: Green A et al. Arthritis Rheumatol. 2018;70(Suppl 10): Abstract 2134.
REPORTING FROM THE ACR ANNUAL MEETING
Key clinical point:
Major finding: A psoriasis patient’s risk of developing psoriatic arthritis increases stepwise with greater body mass index, and the converse is true as well.
Study details: This study included more than 90,000 patients with a diagnosis of psoriasis in the U.K. Clinical Practice Research Datalink.
Disclosures: The presenter reported having no financial conflicts regarding this study, funded by the U.K. National Institute for Health Research.
Source: Green A et al. Arthritis Rheumatol. 2018;70(Suppl 10): Abstract 2134.
New data further support curability of myeloma
finds a retrospective cohort study of the International Myeloma Working Group. That figure may be even higher today because more than 90% of patients in the study – the largest yet to look at outcome predictors in this population – were treated in the era before novel therapies became available.
Investigators led by Saad Z. Usmani, MD, director/chief of plasma cell disorders and director of clinical research (hematologic malignancies) at the Levine Cancer Institute/Atrium Health in Charlotte, N.C., studied 7,291 patients with newly diagnosed multiple myeloma who were up to 75 years old and eligible for high-dose melphalan and autologous stem cell transplant. The patients were treated in clinical trials in 10 countries.
Compared with counterparts who did not achieve complete response 1 year after diagnosis, patients who did had better median progression-free survival (3.3 vs. 2.6 years; P less than .0001) and median overall survival (8.5 vs. 6.3 years; P less than .0001), according to study results report in Blood Cancer Journal.
The investigators next performed multivariate analyses to assess clinical variables at diagnosis associated with 10-year survival as compared with 2-year death.
Results here indicated that patients were less likely to be alive at 10 years if they were older than 65 years (odds ratio for death, 1.87; P = .002); had an immunoglobulin A isotype (OR, 1.53; P = .004); had a low albumin level, defined as less than 3.5 g/dL (OR, 1.36; P = .023); had an elevated beta2-microglobulin level, defined as at least 3.5 mg/dL (OR, 1.86; P less than .001); had a higher serum creatinine level, defined as at least 2 mg/dL (OR, 1.77; P = .005); had a lower hemoglobin level, defined as less than 10 g/dL (OR, 1.55; P = .003); or had a lower platelet count, defined as less than 150,000/μL (OR, 2.26; P less than .001).
Cytogenetic abnormalities did not independently predict long-term survival, but these abnormalities were obtained only by conventional band karyotyping and were not available for some patients.
Overall, the cohort had a relative survival of about 0.9 when compared with the matched general population. With follow-up out to about 20 years, the cure fraction (proportion achieving or exceeding expected survival when compared with the matched general population) was 14.3%.
Identification of early complete response as a predictor of long-term survival “underscores the importance of depth of response as we explore novel regimens for newly diagnosed [multiple myeloma] along with [minimal residual disease] endpoints,” Dr. Usmani and his colleagues wrote while acknowledging that the patients studied were a selected group eligible for transplant and treated on trials.
Recent therapeutic advances “have reignited the debate on possible functional curability of a subset MM patients,” they noted. “[T]here are perhaps more effective drugs and drug classes in the clinician’s armamentarium than [were] available for MM patients being treated in the 1990s or even early 2000s. This may mean that the depth of response after induction therapy may continue to improve over time, potentially further improving the PFS/OS of [the] biologic subset who previously achieved [partial response] yet had good long-term survival.”
Dr. Usmani disclosed that he is a consultant for AbbVie, Amgen, BMS, Celgene, Janssen, Takeda, Sanofi, and SkylineDx; receives speaker’s fees for Amgen, Celgene, Janssen, and Takeda; and receives research funding from Amgen, Array Biopharma, BMS, Celgene, Janssen, Pharmacyclics, Sanofi, and Takeda.
SOURCE: Usmani SZ et al. Blood Cancer J. 2018 Nov 23;8(12):123..
FROM BLOOD CANCER JOURNAL
Key clinical point: Some patients with newly diagnosed multiple myeloma eligible for transplant are likely now being cured.
Major finding: The cure fraction (proportion of patients achieving or exceeding expected survival compared with the matched general population) was 14.3%.
Study details: An international retrospective cohort study of 7,291 patients with newly diagnosed multiple myeloma eligible for high-dose melphalan and autologous stem cell transplant who were treated in clinical trials.
Disclosures: Dr. Usmani disclosed that he is a consultant for AbbVie, Amgen, BMS, Celgene, Janssen, Takeda, Sanofi, and SkylineDx; receives speaker’s fees for Amgen, Celgene, Janssen, and Takeda; and receives research funding from Amgen, Array Biopharma, BMS, Celgene, Janssen, Pharmacyclics, Sanofi, and Takeda.
Source: Usmani SZ et al. Blood Cancer J. 2018 Nov 23;8(12):123.
Should toe amputation be delayed in diabetic patients with osteomyelitis?
Amputation: Resistance is not futile!
What’s in a toe you may ask? Why worry about saving it? Just amputate and move on ...

Not so! I implore you to resist the desire. We vascular surgeons are accustomed to cutting off toes, even feet and legs. But when it comes to diabetic feet please reconsider. Just because there is osteomyelitis, I argue that does not necessitate amputation.
We all agree that ischemic gangrene and black mummified digits are beyond salvage. That’s not what my concern is. My focus is nonhealing ulcers with underlying osteomyelitis. Whether ischemic in etiology or neuropathic (or both), give salvage a try.
Why is this so important? My opponent will try to convince you that it’s not. He’ll try to sell you on how well people walk after amputation and that functional outcomes are great. But think beyond that for a second.
Amputation changes the foot architecture and weight distribution. In a person with neuropathy, this only predisposes them to more ulcers. More ulcers will mean more infection, which will lead to more amputations. This finally culminates in a major amputation.
In one reported study,1 researchers followed more than 200,000 diabetics from 2010 until 2013. While the risk of amputation overall was relatively small (0.36% for major and 0.56% for minor amputations), prior minor amputation increased the risk of major amputation 10-fold and increased the risk of another minor (below-ankle) amputation 20-fold. Of those who had a major amputation, 57% died over the 3 years. This is not insignificant.
This does not also consider the morbidity and impact on lifestyle and quality of life for these patients. Many may not walk. Some will be relegated to nursing homes. Some will suffer from phantom limb pain. Many may never return to work. Even more will have difficulty with their daily lives, not to mention the psychological recovery also required.
The foot seems to be the only place where amputation as first-line therapy for osteomyelitis is accepted. We don’t do a hip disarticulation for ischial pressure sores with osteomyelitis. Calvarial osteomyelitis is also treated with antibiotics. I implore you: Don’t treat toes like vestigial organs.
Granted, there are subsets of patients who would benefit from amputations. A patient with painful Charcot foot may elect to have a below-knee amputation and move on with life. Another who has lost jobs or significant time due to recurrence of osteomyelitis may progress. A patient with severe sepsis and infection into a joint may need amputation.
But what other treatment options are there? I’m glad you inquired.
I primarily treat diabetic feet by treating the soft tissue envelope. Even if a patient presents with midfoot infection or necrotizing soft tissue infection, I treat it like a good old-fashioned abscess or necrotizing fasciitis:
1) Drain pus
2) Resect the dead stuff
3) Supportive care (antibiotics, fluids, aggressive wound care, etc.)
I try to leave the bones intact. When bone is exposed I take biopsies for culture and pathology. Any bone destroyed by the infection is focally debrided. I also take a specimen of the “bone margin” that I’m leaving behind and I send this to pathology looking for residual acute osteomyelitis. These steps are important as they dictate duration and choice of antibiotic therapy. This is in keeping with the consensus recommendations published in 2016.2
Even chronic wounds get a similar approach. If there is granulation, let it granulate and see if it will fill the wound. “Just because osteomyelitis is there, it doesn’t mean that for the toe we won’t care!”
There are exceptions of course. If the soft tissue is severely affected so the phalynx protrudes like something from the movie “Coco,” probably that should be amputated. Repeat offenders also may progress to amputation. But otherwise, hold off and give it a chance.
For the inpatient, aggressive irrigation of the wounds using the Veraflo system promotes granulation, even for short hospital stays of 1 week or less. Any ischemic component is worked up and addressed with percutaneous or open revascularization. We treat with prolonged antibiotics, and in questionable cases err on the side of giving long-term courses. These wounds need to be offloaded for tasks of daily living (going to the bathroom, making a sandwich, etc.) but otherwise we instruct patients to be effectively non–weight-bearing on that limb.
We also refer patients for hyperbaric therapy frequently. Now if you’re done groaning, I assure you this is not phony medicine. There is growing evidence to support not only improved rates of healing, but also significant cost savings and improved quality of life.3
In young patients or those with large defects, we also involve plastic and reconstructive surgery for secondary closure approaches (free flaps, adjacent tissue transfers, local autogenous or prosthetic grafting [Integra, Stravix, Dermacell, etc.] or other advanced techniques). This is particularly important in plantar wounds that will need to bear weight in the future, or in young patients for improved functional and cosmetic outcomes. For smaller wounds, we often use dermal/subdermal graft substitutes ourselves.
Even still, in nonambulatory or chronically debilitated and medically high-risk patients, maybe a different option is palliative wound care with or without antibiotics. A nonoperative approach to allow individuals to live the rest of their remaining days without undergoing a morbid and disfiguring amputation is not unreasonable. Many families are thankful for this option when given it. In the absence of refractory pain or overwhelming sepsis, we just let the wound do what it will do, understanding that someday the plan may change. This allows patients to continue to treat the wound without escalation to surgery or resorting to amputation.
In the end, just like we vascular surgeons tailor our “holistic” approach to the needs and desires of a single particular patient, we should approach wounds with a similar attitude. The presence of osteomyelitis in and of itself should not prompt one to bypass an entire algorithm, go straight to amputation, do not pass “Go” or “collect $200” (although the professional fee for a toe amputation is probably around $200). With a multidisciplinary and multimodal approach, and vested patients, salvage is possible in the majority of cases.
References
1. Diabetologia. 2018 Mar;61(3):626-35.
2. Diabet Foot Ankle. 2016 Jul 12. doi: 10.3402/dfa.v7.30079.
3. Int J Technol Assess Health Care. 2008 Spring;24(2):178-83.
Dr. Issam Koleilat is assistant professor and associate program director, Vascular Surgery Residency and Fellowship, Division of Vascular Surgery, Albert Einstein College of Medicine/Montefiore Medical Center, New York. He had no relevant disclosures.
Amputation: Often the best option
For many years there has been debate about the best management strategy for diabetic foot infection including osteomyelitis. The principles of appropriate antibiotics, surgical debridement, good wound care, and proper offloading will always remain. There are no randomized controlled trials of medical vs. surgical management of diabetic foot ulceration with osteomyelitis.

We now have a number of widely accepted ways to define wounds including Wagner and the SVS-adopted WIFI score. Historical papers are somewhat plagued by heterogeneity in the wounds included. This is even more apparent with any attempted meta-analyses. I think everyone would agree that the superficial toe wound with minimal cellulitis is best managed medically. The issue at hand is the profoundly neuropathic diabetic often with underlying anatomic abnormality and osteomyelitis. My esteemed colleague would suggest that we are too quick to pull a trigger and amputate a toe with underlying osteomyelitis.
I think the initial item for debate is the technique of diagnosis of osteomyelitis. We have multiple ways this is reported. Plain x-ray, bone scan, MRI, and “clinical osteomyelitis” are among the alternative ways osteomyelitis is diagnosed. The reliability of the last is the most variable because clinical osteomyelitis ranges from “probes close to bone” to exposed bone visible protruding from the wound bed. Given the variability of diagnostic techniques, the literature is an amalgam of clinical scenarios and difficult to navigate in a way to affect treatment decisions.
In addition, the medical treatment for osteomyelitis is highly variable. This commonly involves tunneled catheter insertion and 6 weeks to 3 months of IV antibiotics. In some institutions antibiotics are tailored to “wound culture.” Several of our infectious disease specialists prefer bone culture and pathology of bone demonstrating an acute destructive process. Obviously, this often requires surgical debridement to obtain a specimen. Antibiotic duration recommendations may vary from 1 week (if all infected bone is resected) to 90 days if a standalone antibiotic management is selected. Chronic osteomyelitis has a reinfection rate of up to 30%.1
Medical management is not without risk. These risks include recurring infection with resistant organisms, wound deterioration, gastrointestinal complications (Clostridium difficile), catheter-related complications, and acute kidney injury. A recent paper found over 30% of patients treated medically for osteomyelitis developed acute kidney injury. These patients had more frequent hospitalization, recurring ulceration, and infection.2 We have all experienced the patient with multiple hospitalizations and episodic AKI that culminates in ESRD requiring hemodialysis.
If the argument is with good follow-up these patients will ultimately experience preservation of the toe, I would take the stance that in our patient population of diabetics presenting with foot ulcer and osteomyelitis the average hemoglobin A1c is over 9. Although this is not only related to patient compliance, in many instances this is a large piece of the puzzle. It is hard to infer that suddenly with biopsy-proven osteomyelitis the patient will become compliant with medical management of the disease process. Certainly, in some circumstances, this is the case. There are a number of studies with a wide range of findings on HbA1c as it relates to predictive value of wound healing.
There are various studies comparing surgical to medical management for osteomyelitis. Limb salvage is contingent upon location (forefoot, midfoot, hindfoot), the extent of infection, and patient comorbidities. The conclusion of the majority of these studies is that a standalone antibiotic treatment algorithm results in greater limb loss. Patients with peripheral occlusive disease and preadmission antibiotic use have been shown to have decreased wound healing. Minor amputation has been shown to be protective from mortality, risk of major amputation, and unfavorable discharge in patients admitted with a diagnosis of osteomyelitis.3 The major limb amputation rate for antibiotics alone is 20%-30% according to two trials with duration of antibiotics of 3 months.4,5 The available randomized trials tend to exclude patients with severe infection (poorly defined), those with PAD, or those with severe comorbid conditions.
Cost of treatment is even more poorly delineated. Obviously, surgical treatment is not without cost to the health care system. Toe amputation especially when including the metatarsal head shifts pressure points and in the neuropathic patient may lead to recurrent ulceration. The average outpatient cost per patient per ulcer is often over $30,000. The goal of surgical treatment can be defined as trying to maintain the greatest degree of function with the least risk. Removing infected bone (i.e., minor amputation) limits exposure to prolonged antibiotic treatment and hopefully lessens recurring ulceration and hospitalization. This is only one piece of the puzzle, however. A multidisciplinary approach with endocrinology, infectious disease, and orthotics for offloading are keys to decrease future ulceration.
Although I do not advocate for widespread toe carnage as suggested by Dr. Koleilat, I do think liberal application of minor amputation to limit hospital stay, limit antibiotic duration and its inherent risk, and possibly affect readmission is often in the best interest of the patient and the system as a whole. Obviously, based on the variable reports in the literature there cannot be a single approach to these patients and the treatment must be individualized based on extent of infection, compliance of the patient, access to multidisciplinary care, and comorbid conditions.
References
1. World J Diabetes. 2017 Apr 15;8(4):135-42.
2. Diabetes Res Clin Pract. 2018 Jan;135:58-64.
3. Ann Surg. 2005;241(6):885-94.
4. Am J Med. 1987 Oct;83(4):653-60.
5. Am J Med.1989 Jun;86(6 Pt 2):801-8.
Dr. Mark P. Androes is division chief, vascular surgery, Greenville (S.C.) Health System. He had no relevant disclosures.
Amputation: Resistance is not futile!
What’s in a toe you may ask? Why worry about saving it? Just amputate and move on ...
Not so! I implore you to resist the desire. We vascular surgeons are accustomed to cutting off toes, even feet and legs. But when it comes to diabetic feet please reconsider. Just because there is osteomyelitis, I argue that does not necessitate amputation.
We all agree that ischemic gangrene and black mummified digits are beyond salvage. That’s not what my concern is. My focus is nonhealing ulcers with underlying osteomyelitis. Whether ischemic in etiology or neuropathic (or both), give salvage a try.
Why is this so important? My opponent will try to convince you that it’s not. He’ll try to sell you on how well people walk after amputation and that functional outcomes are great. But think beyond that for a second.
Amputation changes the foot architecture and weight distribution. In a person with neuropathy, this only predisposes them to more ulcers. More ulcers will mean more infection, which will lead to more amputations. This finally culminates in a major amputation.
In one reported study,1 researchers followed more than 200,000 diabetics from 2010 until 2013. While the risk of amputation overall was relatively small (0.36% for major and 0.56% for minor amputations), prior minor amputation increased the risk of major amputation 10-fold and increased the risk of another minor (below-ankle) amputation 20-fold. Of those who had a major amputation, 57% died over the 3 years. This is not insignificant.
This does not also consider the morbidity and impact on lifestyle and quality of life for these patients. Many may not walk. Some will be relegated to nursing homes. Some will suffer from phantom limb pain. Many may never return to work. Even more will have difficulty with their daily lives, not to mention the psychological recovery also required.
The foot seems to be the only place where amputation as first-line therapy for osteomyelitis is accepted. We don’t do a hip disarticulation for ischial pressure sores with osteomyelitis. Calvarial osteomyelitis is also treated with antibiotics. I implore you: Don’t treat toes like vestigial organs.
Granted, there are subsets of patients who would benefit from amputations. A patient with painful Charcot foot may elect to have a below-knee amputation and move on with life. Another who has lost jobs or significant time due to recurrence of osteomyelitis may progress. A patient with severe sepsis and infection into a joint may need amputation.
But what other treatment options are there? I’m glad you inquired.
I primarily treat diabetic feet by treating the soft tissue envelope. Even if a patient presents with midfoot infection or necrotizing soft tissue infection, I treat it like a good old-fashioned abscess or necrotizing fasciitis:
1) Drain pus
2) Resect the dead stuff
3) Supportive care (antibiotics, fluids, aggressive wound care, etc.)
I try to leave the bones intact. When bone is exposed I take biopsies for culture and pathology. Any bone destroyed by the infection is focally debrided. I also take a specimen of the “bone margin” that I’m leaving behind and I send this to pathology looking for residual acute osteomyelitis. These steps are important as they dictate duration and choice of antibiotic therapy. This is in keeping with the consensus recommendations published in 2016.2
Even chronic wounds get a similar approach. If there is granulation, let it granulate and see if it will fill the wound. “Just because osteomyelitis is there, it doesn’t mean that for the toe we won’t care!”
There are exceptions of course. If the soft tissue is severely affected so the phalynx protrudes like something from the movie “Coco,” probably that should be amputated. Repeat offenders also may progress to amputation. But otherwise, hold off and give it a chance.
For the inpatient, aggressive irrigation of the wounds using the Veraflo system promotes granulation, even for short hospital stays of 1 week or less. Any ischemic component is worked up and addressed with percutaneous or open revascularization. We treat with prolonged antibiotics, and in questionable cases err on the side of giving long-term courses. These wounds need to be offloaded for tasks of daily living (going to the bathroom, making a sandwich, etc.) but otherwise we instruct patients to be effectively non–weight-bearing on that limb.
We also refer patients for hyperbaric therapy frequently. Now if you’re done groaning, I assure you this is not phony medicine. There is growing evidence to support not only improved rates of healing, but also significant cost savings and improved quality of life.3
In young patients or those with large defects, we also involve plastic and reconstructive surgery for secondary closure approaches (free flaps, adjacent tissue transfers, local autogenous or prosthetic grafting [Integra, Stravix, Dermacell, etc.] or other advanced techniques). This is particularly important in plantar wounds that will need to bear weight in the future, or in young patients for improved functional and cosmetic outcomes. For smaller wounds, we often use dermal/subdermal graft substitutes ourselves.
Even still, in nonambulatory or chronically debilitated and medically high-risk patients, maybe a different option is palliative wound care with or without antibiotics. A nonoperative approach to allow individuals to live the rest of their remaining days without undergoing a morbid and disfiguring amputation is not unreasonable. Many families are thankful for this option when given it. In the absence of refractory pain or overwhelming sepsis, we just let the wound do what it will do, understanding that someday the plan may change. This allows patients to continue to treat the wound without escalation to surgery or resorting to amputation.
In the end, just like we vascular surgeons tailor our “holistic” approach to the needs and desires of a single particular patient, we should approach wounds with a similar attitude. The presence of osteomyelitis in and of itself should not prompt one to bypass an entire algorithm, go straight to amputation, do not pass “Go” or “collect $200” (although the professional fee for a toe amputation is probably around $200). With a multidisciplinary and multimodal approach, and vested patients, salvage is possible in the majority of cases.
References
1. Diabetologia. 2018 Mar;61(3):626-35.
2. Diabet Foot Ankle. 2016 Jul 12. doi: 10.3402/dfa.v7.30079.
3. Int J Technol Assess Health Care. 2008 Spring;24(2):178-83.
Dr. Issam Koleilat is assistant professor and associate program director, Vascular Surgery Residency and Fellowship, Division of Vascular Surgery, Albert Einstein College of Medicine/Montefiore Medical Center, New York. He had no relevant disclosures.
Amputation: Often the best option
For many years there has been debate about the best management strategy for diabetic foot infection including osteomyelitis. The principles of appropriate antibiotics, surgical debridement, good wound care, and proper offloading will always remain. There are no randomized controlled trials of medical vs. surgical management of diabetic foot ulceration with osteomyelitis.
We now have a number of widely accepted ways to define wounds including Wagner and the SVS-adopted WIFI score. Historical papers are somewhat plagued by heterogeneity in the wounds included. This is even more apparent with any attempted meta-analyses. I think everyone would agree that the superficial toe wound with minimal cellulitis is best managed medically. The issue at hand is the profoundly neuropathic diabetic often with underlying anatomic abnormality and osteomyelitis. My esteemed colleague would suggest that we are too quick to pull a trigger and amputate a toe with underlying osteomyelitis.
I think the initial item for debate is the technique of diagnosis of osteomyelitis. We have multiple ways this is reported. Plain x-ray, bone scan, MRI, and “clinical osteomyelitis” are among the alternative ways osteomyelitis is diagnosed. The reliability of the last is the most variable because clinical osteomyelitis ranges from “probes close to bone” to exposed bone visible protruding from the wound bed. Given the variability of diagnostic techniques, the literature is an amalgam of clinical scenarios and difficult to navigate in a way to affect treatment decisions.
In addition, the medical treatment for osteomyelitis is highly variable. This commonly involves tunneled catheter insertion and 6 weeks to 3 months of IV antibiotics. In some institutions antibiotics are tailored to “wound culture.” Several of our infectious disease specialists prefer bone culture and pathology of bone demonstrating an acute destructive process. Obviously, this often requires surgical debridement to obtain a specimen. Antibiotic duration recommendations may vary from 1 week (if all infected bone is resected) to 90 days if a standalone antibiotic management is selected. Chronic osteomyelitis has a reinfection rate of up to 30%.1
Medical management is not without risk. These risks include recurring infection with resistant organisms, wound deterioration, gastrointestinal complications (Clostridium difficile), catheter-related complications, and acute kidney injury. A recent paper found over 30% of patients treated medically for osteomyelitis developed acute kidney injury. These patients had more frequent hospitalization, recurring ulceration, and infection.2 We have all experienced the patient with multiple hospitalizations and episodic AKI that culminates in ESRD requiring hemodialysis.
If the argument is with good follow-up these patients will ultimately experience preservation of the toe, I would take the stance that in our patient population of diabetics presenting with foot ulcer and osteomyelitis the average hemoglobin A1c is over 9. Although this is not only related to patient compliance, in many instances this is a large piece of the puzzle. It is hard to infer that suddenly with biopsy-proven osteomyelitis the patient will become compliant with medical management of the disease process. Certainly, in some circumstances, this is the case. There are a number of studies with a wide range of findings on HbA1c as it relates to predictive value of wound healing.
There are various studies comparing surgical to medical management for osteomyelitis. Limb salvage is contingent upon location (forefoot, midfoot, hindfoot), the extent of infection, and patient comorbidities. The conclusion of the majority of these studies is that a standalone antibiotic treatment algorithm results in greater limb loss. Patients with peripheral occlusive disease and preadmission antibiotic use have been shown to have decreased wound healing. Minor amputation has been shown to be protective from mortality, risk of major amputation, and unfavorable discharge in patients admitted with a diagnosis of osteomyelitis.3 The major limb amputation rate for antibiotics alone is 20%-30% according to two trials with duration of antibiotics of 3 months.4,5 The available randomized trials tend to exclude patients with severe infection (poorly defined), those with PAD, or those with severe comorbid conditions.
Cost of treatment is even more poorly delineated. Obviously, surgical treatment is not without cost to the health care system. Toe amputation especially when including the metatarsal head shifts pressure points and in the neuropathic patient may lead to recurrent ulceration. The average outpatient cost per patient per ulcer is often over $30,000. The goal of surgical treatment can be defined as trying to maintain the greatest degree of function with the least risk. Removing infected bone (i.e., minor amputation) limits exposure to prolonged antibiotic treatment and hopefully lessens recurring ulceration and hospitalization. This is only one piece of the puzzle, however. A multidisciplinary approach with endocrinology, infectious disease, and orthotics for offloading are keys to decrease future ulceration.
Although I do not advocate for widespread toe carnage as suggested by Dr. Koleilat, I do think liberal application of minor amputation to limit hospital stay, limit antibiotic duration and its inherent risk, and possibly affect readmission is often in the best interest of the patient and the system as a whole. Obviously, based on the variable reports in the literature there cannot be a single approach to these patients and the treatment must be individualized based on extent of infection, compliance of the patient, access to multidisciplinary care, and comorbid conditions.
References
1. World J Diabetes. 2017 Apr 15;8(4):135-42.
2. Diabetes Res Clin Pract. 2018 Jan;135:58-64.
3. Ann Surg. 2005;241(6):885-94.
4. Am J Med. 1987 Oct;83(4):653-60.
5. Am J Med.1989 Jun;86(6 Pt 2):801-8.
Dr. Mark P. Androes is division chief, vascular surgery, Greenville (S.C.) Health System. He had no relevant disclosures.

Under Trump, number of uninsured kids rose for first time this decade
After years of steady decline, the number of U.S. children without health insurance rose by 276,000 in 2017, according to a Georgetown University report released Nov. 22.
While not a big jump statistically – the share of uninsured kids rose to 5% in 2017 from 4.7% a year earlier – it is still striking. The uninsured rate typically remains stable or drops during times of economic growth. In September, the U.S. unemployment rate hit its lowest level since 1969.
“The nation is going backwards on insuring kids and it is likely to get worse,” said Joan Alker, coauthor of the study and executive director of Georgetown’s Center for Children and Families in Washington.
Ms. Alker and other child health advocates place the blame for this change on the Trump administration and the Republican-controlled Congress, saying their policies and actions cast a pall on enrollment.
The number of children without coverage rose to 3.9 million in 2017 from about 3.6 million a year earlier, according to Census data analyzed by Georgetown. The overall uninsured rate for people of all ages – which plummeted from 2013 to 2016 following the health law’s implementation – remained unchanged at 8.8% last year.
The share of children with employer-sponsored coverage rose modestly in 2017, but not by enough to make up for the drop in children enrolling in Medicaid or getting coverage from Obamacare insurance exchanges, Ms. Alker said.
While no states made any significant gains in lowering children’s uninsured rate, nine states experienced significant increases. The biggest occurred in South Dakota (up from 4.7% to 6.2%), Utah (up from 6% to 7.3%), and Texas (from 9.8% to 10.7%).
More than one in five uninsured children nationwide live in Texas – about 835,000 kids – by far the highest number of any state.
Florida had 325,000 uninsured children last year, as its uninsured rate for that age group rose 0.7 percentage points to 7.3%. California had 301,000 children without insurance, though its number remained virtually unchanged, relative to the previous year.
Other states with significant increases were Georgia, Massachusetts, Ohio, Tennessee, and South Carolina.
The uninsured rates for children increased at nearly triple the rates in states that did not expand Medicaid under the Affordable Care Act, according to the report. Studies have shown that children whose parents are insured are more likely to have coverage.
The uninsured rate among Hispanic children was 7.8%, compared with 4.9% among whites and 4.6% among blacks overall. (Hispanics can be of any race.)
Georgetown has been tracking these figures since 2008 when 7.6 million children – or about 10% of kids – lacked health coverage.
Because nearly all low-income children are eligible for Medicaid or the federal Children’s Health Insurance Program, known as CHIP, the challenge is making sure parents are aware of the programs, getting them enrolled, and keeping them signed up as long as they are eligible, Ms. Alker said.
Congress let the CHIP program funding lapse for several months in 2017, putting states in a position of having to warn consumers that they would soon have to freeze enrollment. Congress restored federal funding in early in 2018.
In addition, low-income families were bombarded by news reports last year of Congress threatening to repeal the health law that expanded coverage to millions. In the past 2 years, the Trump administration has slashed funding to Obamacare navigators to help people sign up for coverage.
Ms. Alker also pointed to the Trump administration’s September proposal, known as the “public charge” rule, which could make it harder for legal immigrants to get green cards if they have received certain kinds of public assistance – including Medicaid, food stamps, and housing subsidies. Green cards allow them to live and work permanently in the United States.
OLE Health, a large health provider based in Napa Valley, Calif., that serves many immigrants, said it has seen patients disenroll from Medicaid in the past year. CEO Alicia Hardy said many have dropped coverage over fears the help could jeopardize their immigration status. “They are afraid of being deported.”
All those events could have deterred families from getting their kids covered. “The welcome mat has been pulled back and as a result we see more uninsured children,” Ms. Alker said.
She said the easiest way to change the trend would be for more states to expand Medicaid under the health law. A total of 14 states have yet to do so. Though the expansion largely affects adults, as parents enroll, their children are likely to follow.
KHN’s coverage of children’s health care issues is supported in part by the Heising-Simons Foundation. Kaiser Health News is a nonprofit national health policy news service. It is an editorially independent program of the Henry J. Kaiser Family Foundation that is not affiliated with Kaiser Permanente.