User login
The Colonial Formulary
Pharmacies have plotted a dynamic course through history, arriving late to North America in relation to other nations. Before the origin of the first true hospital pharmacy, medicinal therapies were often distributed by public officials, heads of households, and religious leaders or sold in drug stores and other free-standing apothecaries. Colonists followed books on self-treatment and methods of cultivating herbs. With the introduction of hospitals came the hospital pharmacy.
Great Britain had long been a glowing example of how pharmacists could prepare, compound, and administer prescriptions ordered by physicians in an organized manner. In contrast, the role of physicians, surgeons, and apothecaries in the British colonies were blurred, each with overlapping responsibilities of caring for patients and treating ailments.
It was not until 1751 after Benjamin Franklin and Dr. Thomas Bond founded the first hospital in the British Colonies—Pennsylvania Hospital in Philadelphia—that the idea for a hospital pharmacy was cultivated in North America. Because the first hospital’s mission was to provide charity for the poor, there initially was resistance to Dr. Bond’s idea of creating an apothecary in the same institution. Colonists feared that it would become costly to those in Philadelphia being served by the hospital. However, with Franklin’s persuading, enough funds were eventually solicited to purchase more than 112 pounds worth of drugs from London. In 1752, these drugs filled shelves in the hospital president’s office in the Pine Building of Pennsylvania Hospital instituting the first “Apothecary’s Shop in the Hospital” in the British colonies.
The first salaried hospital pharmacist, making 15 pounds per year, was Jonathon Roberts who worked until 1755 fulfilling the role of preparing medications requested by physicians. Medical and surgical students were often hired for short tenures in the apothecary to obtain experience in pharmacy or to simply cover their room and board expenses. John Morgan replaced Roberts in May 1755, and he worked for only one year before using that experience as a springboard for stirring up great influence in the future direction of American pharmacy. Morgan went on to become a physician and a vocal advocate for a more distinct separation of professions among physicians, surgeons, and pharmacists in America.
Most of the drugs available in the first American hospital pharmacy could be found in the London Pharmacopoeia of 1650, whereas very few drugs were of North American origin. Contributions from the colonies came primarily from the American Indian traditions that involved the extraction of botanical drugs such as cascara, bloodroot, and jalap. Nearly 170 of these particular preparations used by Indians north of the Rio Grande or their derivatives are still used today.
Other drugs used at the time of the first hospital pharmacy included emetic ipecac, an expectorant made of benzoin known as “Jesuit’s Drops,” antimony in “Plummer’s Pills,” and tincture of lavender (originally referred to as “Palsy Drops” and used to treat muscle spasms and headaches).
The advent of the American Revolution made importing drugs nearly impossible, requiring an increase in the number of patented drugs from North America. The first colonial hospital pharmacy, thanks to the ingenuity and persistence of Benjamin Franklin and Dr. Bond, set the stage for the development and transformation of pharmacies as we know them to today. TH
Nordman is a senior medical student at Penn State University.
Resources
- Bender GA. The First Hospital Pharmacy in Colonial America. In: Great Moments in Pharmacy. Detroit: Northwood Institute Press; 1966:84-87.
- Franklin B. Some Account of the Pennsylvania Hospital. Baltimore: The Johns Hopkins Press; 1954.
- Harris MR, Paracandola J. Images of Hospital Pharmacy in America. Am J Hosp Pharm. Reprint. June 1992.
- Lawall CH. Four Thousand Years of Pharmacy: An Outline History of Pharmacy and the Allied Sciences. Philadelphia: Lippincott; 1927.
- Massengill SE. American Pharmacy. In: A Sketch of Medicine and Pharmacy. Bristol, Tenn.: The S.E. Massengill Company. Chapter XV.
- Osborne GE. Pharmacy in British Colonial America. In: Bender GA, Parascandolam J, eds. American Pharmacy in the Colonial and Revolutionary Periods: A Bicentential Symposium held April 5, 1976. Madison, Wis.: American Institute of Pharmacy; 1977.
- Williams WH. Pharmacists at America’s First Hospital, 1752–1841 [abstract]. Am J Health Sys Pharm. 1976;33:804-804.
The Case of the Perfect Performer

Junior Moleray rubbed his large hand against the jet-black stubble on his square jaw. His feet were on his desk, and a dead pint of Old Croup Whisky was in the dumpster. It was quiet in the Moleray detective agency. Too quiet.
Moleray specialized in medical insurance fraud. It had been a week since he had solved the last case. A cagey bird had been collecting disability payments on five different accounts. Moleray caught up with him on a double black diamond run at Jackson Hole. Case solved. It had been too easy.
Junior thought about how he’d gotten into the detective racket. It was an improbably sad story. He’d been a detective on the Philadelphia police force and quit to become a medical student—the second doctor in the family.
His older brother, Maurie, had just finished an internal medicine residency and had signed with a clinic in Punxatawney—an outpatient internal medicine and pain clinic. Things were great for Maurie those the first two weeks. He was still getting his feet wet when his boss, Dr. Rock, went on vacation and disappeared while climbing in Malta. Shortly thereafter Rock’s widow showed up at the clinic with legal papers in hand. She offered to sell the entire practice for $10,000 cash just to be done with it. It was a beautiful office and a busy practice. Dr. Rock’s misfortune was Maurie’s stroke of luck. The deal was closed in 24 hours.
A week later, moving men came for the furniture (it was all rented and payment was overdue). Then the building manager evicted Maurie because the rent was also unpaid. Within two weeks he was accused of Medicare and Medicaid fraud and prescription peddling and named as a codefendant on six separate malpractice cases. The malpractice premiums hadn’t been paid in months.
Mrs. Rock was nowhere to be found. Maurie had been framed. His license was suspended. His debt was magnificent. His career in tatters.
Junior got to his brother’s house just in time. He found Maurie knotting ties together into a noose.
Junior quit medical school to track down the wife. After months, he found Mrs. Rock living in a shotgun shack in St. Bernard Parish, La. It didn’t look like the home of a rich widow. When he saw Mrs. Rock, his draw dropped. She was a tall drink of water, and he wanted to be the straw. Later he couldn’t remember what her face looked like. She invited him in.
“Come on in, honey” was the last thing he heard as he stepped into the room. He woke up hours later in an empty room with an occipital goose egg. There was nothing left except some half filled out forms in a precise handwriting. It was a cold trail that he swore he’d pick up again one day.
The ringing of the phone was a welcome relief.
“Moleray, it’s your dime,” Junior barked into the receiver.
“Hey Mole,” came an annoyingly familiar voice on the phone, “I got a hot one for you.”
It was Benny “the Weasel” Rabinowitz from the Mutual International Reinsurance Corporation.
“We’ve got a hospital that just submitted some numbers that are hard to believe, perfect numbers,” said Rabinowitz. “Unless we figure out their scam, we are going to have to fork over a cool million in pay-for-performance bonus fees. I smell a rat.”
“What’s the matter, Weasel, don’t your handlers at the Mutt want to pay the piper?” Junior retorted. He never trusted these big companies, even if the clients were defrauding them. The companies were none too innocent themselves. He took the case. It beat boredom.
The hospital was a rickety old building on South Main. It didn’t seem like the type of facility that would have perfect utilization numbers, but looks can be deceiving.
The medical records office was in the basement. A grumpy woman directed him to a pile of charts and disappeared. Junior spent the next six hours sitting in the cramped cubicle, sipping lukewarm, weak coffee and marveling at the perfect records. They were all written by the same physician with the perfect handwriting. There was something familiar about the writing, but Junior couldn’t make the connection.
The records were meticulous. Every patient with an MI had been given an ace inhibitor, a beta-blocker, aspirin, and a statin. But every patient was identical; the EKGs identical; the lab values identical—even the vitals were the same. Something was very wrong with these charts. By day’s end Junior was ready to go back to his cheesy motel room and make some phone calls. He had lifted some phone numbers from the charts. (Junior didn’t let a little thing like confidentiality stand in his way.) He tried to call several patients, but every single one of them had a disconnected phone.
The next morning Junior returned to the record room and knocked on the door. There was a different clerk today. A lilting voice said, “Come on in, honey.”
Junior started to get chills up and down his spine. He knew that voice … from somewhere. He felt her brush against his back. The smell of jasmine filled the air as she place a cup of coffee on the desk before him. As he finished off the foul morning brew it came to him. He knew her voice and her handwriting.
He stood quickly and turned toward her, but his head began to swim. Suddenly she was joined by a man whose photo he had seen before. It was Dr. Rock and his “wife.” Junior took a step toward them and then hit the ground, drugged into oblivion.
Fluorescent lights. Movement though a hallway. Junior found himself strapped on a gurney. He heard the orderly talking, maybe to a nurse.
“Is this Mr. Johnson?” asked the nurse. She checked his arm band; the ID was correct.
“He doesn’t say much does he?” the orderly commented.
“He’s going for resection of a huge brain mass,” the nurse replied.
Junior wondered who they were talking about as his stretcher was wheeled into the operating room. He felt the IV go into his hand. They checked his arm band again: “This is Hugo Johnson, birth date Oct. 5, 1957? OK.” They started to put the mask over his face, and Junior summoned all his strength and whispered, “Not me.”
The anesthesiologist shook his head, ”Sorry I know you’re scared but these things happen to everyone. You’ll be fine, Hugo.”
Junior tried again: “Not Hugo.”
The anesthesiologist nodded again, “I know we all feel immortal, but anyone—even you—can get sick.”
The mask came toward Junior again. He knew this was his last chance before his skull was cut open and his brain dissected in a hunt for a tumor that was not there.
Summoning his last reserve of energy, he yelled, “Sentinel event.” Everyone in the room stopped cold.
Junior sat in his office, his feet on his desk, and a newly deceased pint of Old Croup in the dumpster. He looked at his check from the Mutual for $25,000. He was ready for his next case. TH
Jamie Newman, MD, FACP, is the physician editor of The Hospitalist, senior associate consultant, Hospital Internal Medicine, and assistant professor of internal medicine and medical history, Mayo Clinic College of Medicine at the Mayo Clinic College of Medicine, Rochester, Minn.
Medication Compliance, the New C. Diff
The Tricky Nature of Medication Compliance
Review by Osterberg L, Blaschke T. Adherence to Medication. N Engl J Med. 2005;353:487-497.
Adherence to (or compliance with) a medication regimen is generally defined as the extent to which patients take medications as prescribed by their healthcare providers. Adherence rates are typically higher among patients with acute conditions, as compared with those with chronic conditions; persistence among patients with chronic conditions is disappointingly low, dropping most drastically after the first six months of therapy. Of all medication-related hospital admissions in the United States, 33% to 69% are because of poor medication adherence, with a resultant cost of approximately $100 billion a year.
Electronic medication-monitoring devices have provided very detailed information about the patterns of medication-taking behavior. Studies using these monitors have shown six general patterns of taking medication among patients treated for chronic illnesses who continue to take their medications. Approximately one-sixth come close to perfect adherence to a regimen; one-sixth take nearly all doses, but with some timing irregularity; one-sixth miss an occasional single day’s dose and have some timing inconsistency; one-sixth take drug holidays three to four times a year, with occasional omissions of doses; one-sixth have a drug holiday monthly or more often, with frequent omissions of doses; and one-sixth take few or no doses while giving the impression of good adherence.
Poor adherence to medication regimens is common, contributing to substantial worsening of disease, death, and increased healthcare costs. Practitioners should always look for poor adherence and can enhance adherence by emphasizing the value of a patient’s regimen, making the regimen simple, and customizing the regimen to the patient’s lifestyle. Asking patients nonjudgmentally about medication-taking behavior is a practical strategy for identifying poor adherence. A collaborative approach to care augments adherence. Patients who have difficulty maintaining adequate adherence need more intensive strategies than do patients who have less difficulty with adherence, a more forgiving medication regimen, or both. Innovative methods of managing chronic diseases have had some success in improving adherence when a regimen has been difficult to follow.
The New Clostridium Difficile—What Does It Mean?
McDonald LC, Killgore GE, Thompson A, et al. An epidemic, toxic gene-variant of Clostridium difficile. N Eng J Med. 2005;353;2433-2441.
Clostridium difficile is the only anaerobe that causes nosocomial infections. It colonizes the colon in 3% of the healthy population and about 20% to 40% of hospitalized patients.
This study was done in response to reports of increasing rate and severity of this infection. This study looked at healthcare facilities in Pennsylvania, Maine, Georgia, Oregon, Illinois, and New Jersey and did indeed find a new strain of Clostridium difficile isolate which showed 100% resistance to gatifloxacin and moxifloxacin, compared with no resistance in the historic strain.
Resistance to clindamycin was similar in both the groups, which was measured at 79%. This particular strain secretes 16 to 23 times more toxins A and B in vitro than other strains. And in this study the new strain accounted for 51% of the infections compared with 17% in the historic control isolates. Fluoroquinolones were implicated alone or in combination with other antibiotics in 52% of the cases. Those infected with the new strain were more likely to have higher rates of toxic megacolon, need for colectomy, leukemoid reaction, shock, and death. Like any disease, the interaction between host and pathogen is key to severity, thereby making patients who are chronically ill and elderly more susceptible.
For hospitalists the implications for this study are certainly important. We need to be aware of whether this strain is prevalent in our work environment. Close collaboration with our colleagues from infectious disease services along with monitoring clinical outcomes of patients with Clostridium difficile infection is the need of the hour. Also recommended is investigation of any increases in caseload of this infection. Simple measures such as judicious use of antibiotics, early diagnosis, and appropriate treatment of Clostridium difficile infection and strict isolation of the patients infected or colonized with Clostridium difficile would go a long way in controlling the spread of the new more virulent strain. It must be pointed out that alcohol-based waterless hand-sanitizing agents do not kill the Clostridium difficile spores; washing hands with soap and water is a prudent option after coming in contact with a patient with Clostridium difficile. TH
Nasal MRSA Carriage: A Study of Current Prevalence with Commentary
Creech CB, Kernodle DS, Alsectzer M, et al. Increasing rates of nasal carriage of methicillin-resistant Staphylococcus aureus in healthy children. Pediatr Infect Dis J. 2005;24:617-621.
Review by Laura Ortman, MD
The incidence of methicillin-resistant Staphylococcus aureus (MRSA) infections seen in outpatient clinics and emergency rooms appears to be on the rise. In 2001 a study done at Vanderbilt University Medical Center found the prevalence of MRSA in its pediatric community to be 0.8%1. Creech, et al., devised a study to describe the current prevalence of MRSA colonization in the same population.
The study population was children between the ages of two weeks and 21 years of age presenting for a health maintenance visit at two outpatient clinics. Nasal swabs were obtained and cultures preformed on plates with and without oxacillin containing media. Possible MRSA isolates were confirmed with PCR for the mecA gene, which codes for the protein responsible for beta-lactam resistance.
Of the 500 children enrolled 182 (36.4%) were found to be colonized with S. aureus. 46 (9.2%) isolates were positive for the mecA gene and considered MRSA. The only risk factor found to increase risk for MRSA colonization was having a family member who works in a hospital (odds ratio, 2.0; 95% confidence interval, 1.03-4.1). Fifty-four percent of MRSA isolates were resistant to erythromycin, and 32% of these had inducible clindamycin resistance.
Commentary: This study shows a greater than tenfold increase in MRSA colonization in a three-year time period in a healthy outpatient population. This finding is consistent with other studies that have shown increasing rates of colonization.2-3 This increase has led some institutions to attempt decolonization of MRSA, most often using nasal mupirocin. To determine if current evidence supports attempts to eradicate MRSA nasal colonization, the following literature search was performed: Cochrane DSR, ACP Journal Club, PubMed, and PubMed Clinical Queries were searched using the search terms “MRSA,” “colonization,” and “staphylococcus.”
One Cochrane review summarizes the evidence for use of antimicrobial agents on MRSA colonized patients4. Of six randomized controlled trials, only one compares rates of infection during follow-up between the study and control groups. The difference in infections was not statistically significant. Five other studies of inconsistent quality followed eradication rates of MRSA and varied widely in their results. The Cochrane review concluded that there was insufficient evidence to recommend nasal decolonization of MRSA.
One article reviewed the evidence for intranasal mupirocin for S. aureus.5 This review did not differentiate between MRSA and MSSA. The authors appraised clinical trials that evaluated the effect of mupirocin on MRSA colonization and infection. In a trial of patients undergoing dialysis there was no overall difference in the rate of infection between groups. In trials using mupirocin for preoperative prophylaxis there was no difference in number of surgical site infections. The authors concluded that mupirocin did not result in long-term clearance of S. aureus and that the available evidence does not support its use for prevention of infection. With the current evidence routine decolonization of patients colonized with MRSA cannot be recommended.
References
- Nakamura MM, Rohling KL, Shashaty M, et al. Prevalence of methicillin-resistant Staphylococcus aureus nasal carriage in the community pediatric population. Pediatr Infect Dis J. 2002;21:917-922.
- Herold BC, Immergluck LC, Maranan MC, et al. Community-acquired methicillin-resistant Staphylococcus aureus in children with no identified predisposing risk. JAMA. 1998;279:593-598.
- Fergie JE, Purcell K. Community-acquired methicillin-resistant Staphylococcus aureus infections in south Texas children. Pediatr Infect Dis J. 2001;20:860-863.
- Loeb M, Main C, Walker-Dilks C. Antimicrobial drugs for treating methicillin-resistant Staphylococcus aureus colonization. Cochrane Database Syst Rev. 2003;(4):CD003340.
- Laupland KB, Conly JM. Treatment of Staphylococcus aureus colonization and prophylaxis for infection with topical intranasal mupirocin: an evidence-based review. Clin Infect Dis. 2003;37:933-938.
Is Ultrasound Sufficient for Diagnosing Urolithiasis in the Pediatric Patient?
Palmer JS, Donaher ER, O’Riordan MA, et al. Diagnosis of Pediatric Urolithiasis: Role of ultrasound and computerized tomography. J Urol. 2005;174:1413-1416.
Review by Ann Mattison, RN, CPNP
Pediatric urolithiasis is uncommon and may present without the classic symptoms of renal colic, making diagnosis of pediatric urolithiasis problematic. Previously published data has revealed that unenhanced spiral CT is the gold standard in diagnosing urinary tract calculi in adults. However, CT carries the risk of exposure to ionizing radiation, which can be a significant issue in children.
Due to the low prevalence of urolithiasis in addition to concerns about radiation exposure, many primary care providers choose ultrasound as the initial radiographic study for children with symptoms that can be associated with urolithiasis, such as flank pain, abdominal pain, and gross hematuria. But the accuracy of ultrasound in detecting pediatric urolithiasis has not been well studied.
A retrospective chart review was performed in all patients 0-18 evaluated as outpatients and inpatients at the study institution. Subjects were identified by ICD-9 codes and billing records. The study showed the accuracy of ultrasounds performed was variable and dependent on the location of the calculi. In contrast, CT was highly accurate regardless of calculi location.
The study concluded that ultrasound may still be the appropriate initial study for the majority of children presenting with symptoms suggestive of urolithiasis; however, a negative ultrasound should not be considered sufficient to rule out the diagnosis of urolithiasis in pediatric patients. The authors recommended the patient with persistent symptoms and negative ultrasound undergo unenhanced CT. The retrospective design of this study limits application of these results; however, the study does highlight the need for a heightened index of suspicion for the diagnosis as well as the need for further prospective studies describing the most safe and efficient method for confirming the diagnosis. TH
A Return Visit to Mercy's Pay-For-Performance Program
Within a year of the implementation of a performance-based incentive program for its hospitalists, Mercy Hospital in Springfield, Mass., found itself leading the state in key composite compliance measures. Mercy was No. 2 on the list for two quarters in a row when MassPRO (the federally designated Quality Improvement Organization for Massachusetts) rated all 63 hospitals in the state on performance on quality indicators for heart failure, pneumonia, and MI.
Mercy Hospital ranked second in the state for both the fourth quarter of 2004 and the first quarter of 2005, whereas a different hospital ranked first for each quarter—and Massachusetts is the second-ranked state in the United States in these indicators.
How did Mercy rise so quickly to the top? Win Whitcomb, MD, who heads the hospitalist program at Mercy Hospital, credits the quality-based incentive program he helped initiate. “We had rapid improvement because we had a dedicated group of hospitalists and they were incentivized,” says Dr. Whitcomb.
Pay-for-Performance Program
A full 75% of the inpatients at Mercy Hospital are under the care of 10 hospitalists employed by the Mercy Inpatient Medicine Service (MIMS). As outlined in an article Dr. Whitcomb wrote for the July/August 2005 issue of The Hospitalist (“Physician Pay-for-Performance Comes to the Hospital”), MIMS implemented a unique incentive program for their hospitalists in January 2004.
The pay-for-performance, quality-based incentive program promised that each physician would receive a cash bonus every six months of more than 7.5% of his or her salary—but only if Mercy Medical Center reached the following targets for all hospital patients by the end of 2004:
- A 45% rate of pneumococcal vaccine screening and administration for all pneumonia patients;
- An 85% rate of documentation of ejection fraction for all heart failure patients; and
- Less than 40% rate of ejection fraction for heart failure patients and prescription of an ACE-inhibitor upon discharge (or documentation of a contraindication).
Dr. Whitcomb’s article shows how the MIMS group exceeded each of these quality improvement goals by the end of 2004. The MassPRO ranking shows how well they did in comparison with other hospitals in their state.
“The MassPRO recommendation for our performance is for the whole hospital—not just hospitalists,” says Dr. Whitcomb. “This is a good example of how hospitalists can carry the hospital. We also have traditional PCPs [primary care physicians] who are eager to measure up to our hospitalists; I feed back information to them, too.”
Update on the Incentive Program
MIMS is not resting on its laurels; they have continued to expand and update the incentive program. According to Bipinchandra Mistry, MD, MRCP, the current leader of the incentive program, 2005 has seen the addition of quality markers for reduction of decubitus ulcer rates, reduction of postoperative urinary tract infections, and discharge instructions for CHF. The annual bonus for physicians will be increased accordingly if these new markers are met.
“Of course, we must also maintain the previous quality markers at the same time,” explains Dr. Mistry.
Dr. Mistry attributes the success of the incentive program to its tie-in with a quality department. “The key is to have a person in your quality department involved to keep an eye on [markers in an incentive program] and see what barriers are coming up,” he says. “Otherwise, it’s harder for a group to forge ahead.”
Of the pay bonus that is tied to the markers, 30% relies on reaching the quality markers. “I think 30% to 40% is a reasonable target,” says Dr. Mistry.
Because these particular measures are difficult for the MIMS hospitalists to monitor alone, a quality improvement group headed by Dr. Whitcomb worked to include both a separate hospitalist group as well as PCPs. All were held accountable for quality through the addition of a “night-time coverage fee” that would be forgiven when the new quality goals were met.
Time will tell if the MIMS pay-for-performance program continues to pay off in increased quality of care for patients. TH
Contributing Writer Jane Jerrard is based in Chicago.
VTE Victory
What is your hospital doing to mark DVT Awareness Month this year? Consider that last year a Virginia hospital used this occasion to educate their staff on VTE, which encompasses both DVT and PE. This training was the first step in the implementation of a multidisciplinary, hospital-wide process that resulted in the vast majority of patients receiving proper preventive treatment of this common killer.
According to the Society of Critical Care Medicine, VTE is the No. 1 preventable cause of hospital-associated death for medical inpatients. Most hospitals are struggling to decrease the number of DVTs and PEs in their patient population by teaching or reminding staff to check for risk factors in each patient and, if necessary, provide VTE prophylaxis. While this seems like a simple solution, anyone who’s currently struggling to turn the numbers around this way can assure you that it is an uphill battle. The good news is that Carilion Medical Center in Roanoke, Va., may have found a key to winning that battle.
First Steps toward Improvement
Carilion Medical Center is 625-bed tertiary care facility that typically operates at peak census. With a level-one trauma center and a separate building housing the women’s and children’s hospital, Carilion offers every kind of care except burn treatment and full organ transplants.
“We recognized that VTE prophylaxis is a very important area and that we had not addressed it,” says James Franko, MD, FACP, medical director, General Medicine and Hospitalist Services.
Carilion’s first attempt to tackle the problem was not effective, but it laid the groundwork for later success.
“In April of 2004 we began working with a committee, conducting an investigation to see how frequently patients were receiving VTE prophylaxis,” recalls Dr. Franko. “We found that it was about 30%, based on patient population where more than 80% met the criteria for receiving this prophylaxis.”
The committee then broke down the data to examine who was ordering the VTE prophylaxis and found that there were three groups of physicians.
“There were those who almost always ordered the treatment, including our trauma surgeons,” says Dr. Franko. “Then there were those who did it sometimes and another group of those who never ordered it. We saw that this was obviously a good opportunity for education.”
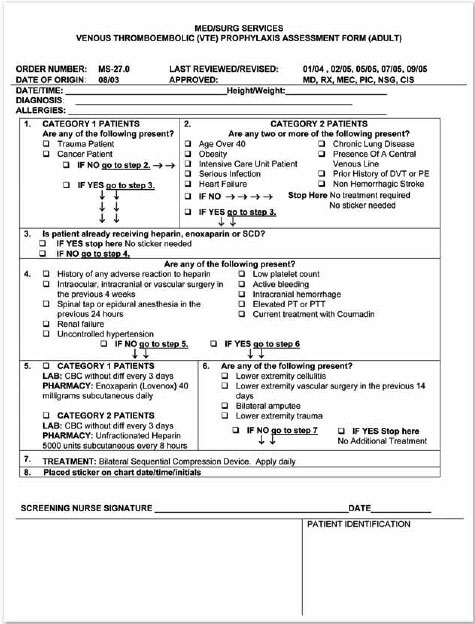
Initial Research and Planning
In summer 2004, the group implemented a pilot program for screening every single patient on one floor of the hospital—a floor where physicians were predominantly hospitalists. The pilot involved including an information sheet on each medical chart with a list of VTE risk and exclusion criteria. The results: “We saw only a modest increase in prophylaxis,” says Dr. Franko.
So he pushed to find a better way to focus attention on VTE prophylaxis, this time using the channel that Carilion Medical Center has in place to address quality improvement issues.
“Someone can pitch an idea to our Quality Council and ask for a charter team,” explains Kris Peters, RN, human resources education consultant for Carilion Medical Center. “That team is given a time frame and asked to perform research and make recommendations. We have a charter team for pneumonia, for heart failure, for MCI, … that’s worked well for us.”
In fall 2004, Carilion’s Quality Council commissioned a new charter team and gave them the mission of increasing the percentage of patients receiving VTE prophylaxis. The team consisted of Dr. Franko and other physicians, nursing staff, a pharmacist, researchers, a staff member from the medical records department, secretaries, and—as a late addition—Peters.
“There was strong emotional buy-in from everyone on the team,” recalls Dr. Franko, “because almost everyone has a family member or friend who have had an experience with a blood clot.”
Dr. Franko and other members of the team proceeded to gather information on the rates of use and made projections for prophylaxis. They also reviewed the first attempt to increase use.
“We realized that it was necessary to make this a mandatory approach, or there would be no improvement whatsoever,” says Dr. Franko.
One possibility the team explored and then rejected was incorporating VTE prophylaxis with a patient’s admission. “When patients are admitted, we fill out a very thorough nursing assessment form,” explains Dr. Franko. “This is a good point to gather the information, but we decided it was just too cumbersome.”
The team decided on the inclusion of a form with each patient’s medical chart that would lead the nursing staff through simple questions to determine whether the person should receive VTE prophylaxis. (See “VTE Prophylaxis Assessment Form [Adult],” at right.) The default is prophylaxis. “This was a bold step,” says Dr. Franko. With the form, “your patients are going to get VTE prophylaxis unless you tell us not to give it to them.”
Creating the VTE Prophylaxis Assessment Form
The multidisciplinary team needed to build the form using basic, easy-to-understand information. They began by breaking down the hospital’s patient population to determine who most needed the VTE prophylaxis. They found four groups:
- All trauma patients;
- All patients in ICU;
- Anyone with a diagnosis of cancer; and
- Anyone with a history of cancer. (See step 1 on the “VTE Prophylaxis Assessment Form,” at right.)
They also agreed that patients over age 40 with one other risk factor, such as smoking or drinking, would be considered at risk for DVT. (See step 2 on the “VTE Prophylaxis Assessment Form,” at right.)
“That is a significant percentage of our patients,” Dr. Franko points out. Because the women’s and children’s hospital is separate, a full 87% of Carilion’s patients are over 40.
The team then worked on exclusion factors that would eliminate patients in these groups from receiving prophylaxis. They agreed that patients with any of these exclusion criteria would automatically not receive prophylaxis. (See step 4 on the “VTE Prophylaxis Assessment Form,” at right.)
“We really struggled with how to administer the VTE prophylaxis,” admits Dr. Franko. “It was projected at one point that if we put all at-risk patients on low-molecular-weight heparins, we would increase our pharmacy’s budget by $3 million.”
With a great deal of reliance on the American College of Chest Physicians (ACCP) guidelines for VTE prophylaxis, the charter team decided on three treatment categories: low-molecular-weight heparins (enoxaparin, specifically), unfractionated heparins, and sequential compression devices (SCDs). (See step 5 on the “VTE Prophylaxis Assessment Form,” at right.)
“We use a lot of SCDs on our trauma patients,” says Dr. Franko, “but we still had to order more.” After talking to the hospital’s vascular surgeons and other staff, the charter team decided on patients to exclude from medications, including amputees and those who’d had recent vascular surgery. (See step 6 on the “VTE Prophylaxis Assessment Form,” at right.)
If the form indicates that prophylaxis is necessary, then the last step in completing the form is to have a physician add a bright pink sticker with his or her initials and the date and time.
“The pharmacy will prescribe with only that sticker on the chart,” says Dr. Franko. “Patients can get treatment earlier rather than later.”
Implementing the Form
The charter team still had to decide how the form would be presented to physicians and nursing staff. “We learned that there are no such things as standing orders,” says Dr. Franko. “But we can make the form a permanent part of each patient record, so that it cannot be discarded.”
The next hurdle was educating the staff, particularly nurses, on the new quality-improvement program. The team timed the implementation of the new process so that it began in March 2005, DVT Awareness Month. “We used the posters and giveaways provided by the Coalition to Prevent DVT to boost awareness in the staff,” says Peters. In April and May, the form went live.
“We used it for three months, then got information back from the nursing staff,” recalls Peters. “We went back to the committee with some suggested changes.” One of those changes was the inclusion of step 3: information on whether the patient was already receiving VTE prophylaxis.
The second wave of staff education began in late November, and the nursing staff continues to address the form in their bimonthly meetings. “Nurses fear the form, because they think it’s an order,” says Peters. “The top [of the form] will be done, but the bottom will be completely blank.”
She is working to educate nurses so that they are more comfortable with the form, and she has created an e-learning module with detailed information to supplement the form.
“This was a wonderful multidisciplinary effort,” says Dr. Franko. “I feel that the nursing service in particular has done a superb job. They get all the credit for this.”
Carolyn Webster, RN, vice president, Carilion Medical Center Nursing Operations, adds, “I’m happy that patients are being treated.”
First Findings: Dramatic Improvement
In May 2005, within two months after implementing the form, the charter team pulled 70 random patient charts to check their progress.
“We found that we had increased the percent of prophylaxis by SCD, low-molecular-weight heparins and unfractionated heparin [from 30%] to 60%,” says Dr. Franko. “And in June and July of 2005, we pulled 70 charts again. Eighty-seven percent of the patients had received prophylaxis. We were pleased with that increase.”
An Ongoing Process
When this period of education is over and any changes are made to the form and the process, the charter team will continue to meet once or twice a year to track progress and watch for problems.
“I’m not convinced that we’re going to sustain those numbers,” says Dr. Franko of the 87% success rate. “I hope we can keep the score up, but it’s going to take constant re-education.”
One positive factor was that the hospital’s staff is now well educated about VTE prophylaxis, so awareness continues to remain high.
The project will continue—and it will continue to be a work in progress. “We’re always relying on staff feedback to make [the form] more user-friendly,” says Dr. Franko. “And the prophylaxis may change over time, too.” TH
Contributing Writer Jane Jerrard is based in Chicago.
What is your hospital doing to mark DVT Awareness Month this year? Consider that last year a Virginia hospital used this occasion to educate their staff on VTE, which encompasses both DVT and PE. This training was the first step in the implementation of a multidisciplinary, hospital-wide process that resulted in the vast majority of patients receiving proper preventive treatment of this common killer.
According to the Society of Critical Care Medicine, VTE is the No. 1 preventable cause of hospital-associated death for medical inpatients. Most hospitals are struggling to decrease the number of DVTs and PEs in their patient population by teaching or reminding staff to check for risk factors in each patient and, if necessary, provide VTE prophylaxis. While this seems like a simple solution, anyone who’s currently struggling to turn the numbers around this way can assure you that it is an uphill battle. The good news is that Carilion Medical Center in Roanoke, Va., may have found a key to winning that battle.
First Steps toward Improvement
Carilion Medical Center is 625-bed tertiary care facility that typically operates at peak census. With a level-one trauma center and a separate building housing the women’s and children’s hospital, Carilion offers every kind of care except burn treatment and full organ transplants.
“We recognized that VTE prophylaxis is a very important area and that we had not addressed it,” says James Franko, MD, FACP, medical director, General Medicine and Hospitalist Services.
Carilion’s first attempt to tackle the problem was not effective, but it laid the groundwork for later success.
“In April of 2004 we began working with a committee, conducting an investigation to see how frequently patients were receiving VTE prophylaxis,” recalls Dr. Franko. “We found that it was about 30%, based on patient population where more than 80% met the criteria for receiving this prophylaxis.”
The committee then broke down the data to examine who was ordering the VTE prophylaxis and found that there were three groups of physicians.
“There were those who almost always ordered the treatment, including our trauma surgeons,” says Dr. Franko. “Then there were those who did it sometimes and another group of those who never ordered it. We saw that this was obviously a good opportunity for education.”
Initial Research and Planning
In summer 2004, the group implemented a pilot program for screening every single patient on one floor of the hospital—a floor where physicians were predominantly hospitalists. The pilot involved including an information sheet on each medical chart with a list of VTE risk and exclusion criteria. The results: “We saw only a modest increase in prophylaxis,” says Dr. Franko.
So he pushed to find a better way to focus attention on VTE prophylaxis, this time using the channel that Carilion Medical Center has in place to address quality improvement issues.
“Someone can pitch an idea to our Quality Council and ask for a charter team,” explains Kris Peters, RN, human resources education consultant for Carilion Medical Center. “That team is given a time frame and asked to perform research and make recommendations. We have a charter team for pneumonia, for heart failure, for MCI, … that’s worked well for us.”
In fall 2004, Carilion’s Quality Council commissioned a new charter team and gave them the mission of increasing the percentage of patients receiving VTE prophylaxis. The team consisted of Dr. Franko and other physicians, nursing staff, a pharmacist, researchers, a staff member from the medical records department, secretaries, and—as a late addition—Peters.
“There was strong emotional buy-in from everyone on the team,” recalls Dr. Franko, “because almost everyone has a family member or friend who have had an experience with a blood clot.”
Dr. Franko and other members of the team proceeded to gather information on the rates of use and made projections for prophylaxis. They also reviewed the first attempt to increase use.
“We realized that it was necessary to make this a mandatory approach, or there would be no improvement whatsoever,” says Dr. Franko.
One possibility the team explored and then rejected was incorporating VTE prophylaxis with a patient’s admission. “When patients are admitted, we fill out a very thorough nursing assessment form,” explains Dr. Franko. “This is a good point to gather the information, but we decided it was just too cumbersome.”
The team decided on the inclusion of a form with each patient’s medical chart that would lead the nursing staff through simple questions to determine whether the person should receive VTE prophylaxis. (See “VTE Prophylaxis Assessment Form [Adult],” at right.) The default is prophylaxis. “This was a bold step,” says Dr. Franko. With the form, “your patients are going to get VTE prophylaxis unless you tell us not to give it to them.”
Creating the VTE Prophylaxis Assessment Form
The multidisciplinary team needed to build the form using basic, easy-to-understand information. They began by breaking down the hospital’s patient population to determine who most needed the VTE prophylaxis. They found four groups:
- All trauma patients;
- All patients in ICU;
- Anyone with a diagnosis of cancer; and
- Anyone with a history of cancer. (See step 1 on the “VTE Prophylaxis Assessment Form,” at right.)
They also agreed that patients over age 40 with one other risk factor, such as smoking or drinking, would be considered at risk for DVT. (See step 2 on the “VTE Prophylaxis Assessment Form,” at right.)
“That is a significant percentage of our patients,” Dr. Franko points out. Because the women’s and children’s hospital is separate, a full 87% of Carilion’s patients are over 40.
The team then worked on exclusion factors that would eliminate patients in these groups from receiving prophylaxis. They agreed that patients with any of these exclusion criteria would automatically not receive prophylaxis. (See step 4 on the “VTE Prophylaxis Assessment Form,” at right.)
“We really struggled with how to administer the VTE prophylaxis,” admits Dr. Franko. “It was projected at one point that if we put all at-risk patients on low-molecular-weight heparins, we would increase our pharmacy’s budget by $3 million.”
With a great deal of reliance on the American College of Chest Physicians (ACCP) guidelines for VTE prophylaxis, the charter team decided on three treatment categories: low-molecular-weight heparins (enoxaparin, specifically), unfractionated heparins, and sequential compression devices (SCDs). (See step 5 on the “VTE Prophylaxis Assessment Form,” at right.)
“We use a lot of SCDs on our trauma patients,” says Dr. Franko, “but we still had to order more.” After talking to the hospital’s vascular surgeons and other staff, the charter team decided on patients to exclude from medications, including amputees and those who’d had recent vascular surgery. (See step 6 on the “VTE Prophylaxis Assessment Form,” at right.)
If the form indicates that prophylaxis is necessary, then the last step in completing the form is to have a physician add a bright pink sticker with his or her initials and the date and time.
“The pharmacy will prescribe with only that sticker on the chart,” says Dr. Franko. “Patients can get treatment earlier rather than later.”
Implementing the Form
The charter team still had to decide how the form would be presented to physicians and nursing staff. “We learned that there are no such things as standing orders,” says Dr. Franko. “But we can make the form a permanent part of each patient record, so that it cannot be discarded.”
The next hurdle was educating the staff, particularly nurses, on the new quality-improvement program. The team timed the implementation of the new process so that it began in March 2005, DVT Awareness Month. “We used the posters and giveaways provided by the Coalition to Prevent DVT to boost awareness in the staff,” says Peters. In April and May, the form went live.
“We used it for three months, then got information back from the nursing staff,” recalls Peters. “We went back to the committee with some suggested changes.” One of those changes was the inclusion of step 3: information on whether the patient was already receiving VTE prophylaxis.
The second wave of staff education began in late November, and the nursing staff continues to address the form in their bimonthly meetings. “Nurses fear the form, because they think it’s an order,” says Peters. “The top [of the form] will be done, but the bottom will be completely blank.”
She is working to educate nurses so that they are more comfortable with the form, and she has created an e-learning module with detailed information to supplement the form.
“This was a wonderful multidisciplinary effort,” says Dr. Franko. “I feel that the nursing service in particular has done a superb job. They get all the credit for this.”
Carolyn Webster, RN, vice president, Carilion Medical Center Nursing Operations, adds, “I’m happy that patients are being treated.”
First Findings: Dramatic Improvement
In May 2005, within two months after implementing the form, the charter team pulled 70 random patient charts to check their progress.
“We found that we had increased the percent of prophylaxis by SCD, low-molecular-weight heparins and unfractionated heparin [from 30%] to 60%,” says Dr. Franko. “And in June and July of 2005, we pulled 70 charts again. Eighty-seven percent of the patients had received prophylaxis. We were pleased with that increase.”
An Ongoing Process
When this period of education is over and any changes are made to the form and the process, the charter team will continue to meet once or twice a year to track progress and watch for problems.
“I’m not convinced that we’re going to sustain those numbers,” says Dr. Franko of the 87% success rate. “I hope we can keep the score up, but it’s going to take constant re-education.”
One positive factor was that the hospital’s staff is now well educated about VTE prophylaxis, so awareness continues to remain high.
The project will continue—and it will continue to be a work in progress. “We’re always relying on staff feedback to make [the form] more user-friendly,” says Dr. Franko. “And the prophylaxis may change over time, too.” TH
Contributing Writer Jane Jerrard is based in Chicago.
Twilight of the Sliding Scale
An explosion of interest in managing hyperglycemia in the hospital has resulted from recent evidence that glycemic control can reduce mortality and other morbidities. Programs of intensification using historical controls for comparison and clinical trials demonstrating the ability of glycemic control to improve outcomes have mandated specific blood glucose thresholds for initiating intensive therapy in the ICU.1-12 These studies have convinced the world that in the ICU intravenous insulin infusion should supplant sliding scale.
A large body of observational data point to the likelihood that the benefits of glycemic control might extend to the general hospital ward.13,14 Although intravenous infusion of insulin might be more widely used in the future than it is now, the standard practice at most hospitals is to address glycemic control on general wards through the use of subcutaneous insulin.15,16
Two recent publications from Rush University Medical Center in Chicago and from St. Joseph’s/Candler Health System in Savannah, Ga., added weight to older literature and to a large body of long-held expert opinion that the anticipatory use of subcutaneous insulin in the hospital outperforms sliding scale.
Sliding Scale and Its Flaws
Throughout a half century of PubMed indexing, the medical literature has referred to sliding scale insulin.17 In its simplest form at a given blood glucose level, sliding scale delivers the same number of units of subcutaneous regular insulin to every patient. For example, it might require:
150-199 + 2
200-249 + 4
250-299 + 6
300-349 + 8
350-399 +10
400 and up Call physician
Protocols attempting to improve upon the scale offer differing amounts of insulin at several assumed degrees of insulin sensitivity.18,19 However, these protocols still retain a reactive approach to glycemic management such that hyperglycemia will recur given the absence of adequate basal and nutritional insulin coverage. Under sliding scale the risk of ketoacidosis in type-1 diabetes is not addressed. Overcompensation for hyperglycemia results in hypoglycemia for some patients. By writing sliding scale orders physicians may create the appearance of having designed a detailed and attentive care plan, while in reality they neglect to individualize care to meet the patient’s needs.20
Discussions about sliding scale and correction dose insulin are frequently misinterpreted because of differences in use of terminology. Practitioners who disagree with use of sliding scale monotherapy nevertheless recommend using correction doses or supplements of insulin for patients already receiving anticipatory insulin.21 Some practitioners may refer to correction doses used in addition to anticipatory insulin as sliding scale insulin.22,23 Patients themselves sometimes use the term sliding scale.
A patient may, for example, use glargine and aspart and, when asked how she determines the dose of aspart, she may say she uses “sliding scale.” What she means, though, may be one of several possible management styles. She may mean that she uses aspart only for correction of hyperglycemia. She may mean that she has a table with two columns, showing paired blood glucose ranges and premeal aspart doses, such that the prandial and correction components of the aspart doses are bundled. She may mean that she practices advanced carbohydrate counting, utilizes an insulin-to-carbohydrate ratio to determine aspart coverage for the meal, and additionally calculates a premeal correction dose of aspart for hyperglycemia (i.e., she may practice basal-prandial-correction therapy).24-26
For purposes of this discussion, by “sliding scale” insulin, I mean monotherapy with sliding scale without concomitant anticipatory use of insulin (scheduled, routine, standing, or programmed insulin) or sliding scale with its faults, as described by Saul Genuth, MD.27
Evidence Against Sliding Scale
Relying on sliding scale insulin sometimes causes hypoglycemic events, severe hyperglycemic events, patient relapse after treatment of ketoacidosis, and the in-house development of diabetic ketoacidosis. In the study by Kathleen and colleagues, using sliding scale doses too high for patients with renal insufficiency was identified as the cause of six episodes of hypoglycemia.28
In the quality improvement project by Roman and colleagues, the use of quality indicators of a) BG < 40 mg/dL, b) BG > 450 mg/dL on two occasions, or c) BG > 45 with acetone, revealed that five cases were caused by physician failure to respond appropriately to hyperglycemia, despite administration of large amounts of additional regular insulin as coverage for capillary blood glucose (one of which resulted in the in-house development of ketoacidosis).29
In a retrospective review of management following ketoacidosis Gearhart and colleagues showed a higher median glucose among the patients treated with sliding scale than those treated proactively with insulin (prospective or anticipatory insulin), or treated with a combination of proactive insulin and “sliding scale” (correction dose insulin).30 Queale and colleagues showed that the use of either a standing dose of insulin or an oral hypoglycemic agent was associated with a reduced risk of hyperglycemic episodes, whereas sliding scale insulin regimens (when used without a standing dose of intermediate-acting insulin) were associated with an increased rate of hyperglycemic episodes.31
Baldwin and colleagues at Rush University Medical Center in Chicago recently reported the superiority of glycemic control among 88 patients for whom sliding scale was not allowed, in comparison with 98 well-matched controls from a historical comparison period.32 In the study group, standing orders for insulin were not permitted. House staff reviewed the results of glucose monitoring performed four times daily, and they twice daily reordered anticipatory insulin if appropriate. Glargine and rapid-acting analog were continued only for those patients already using such therapy prior to admission. Premixed insulins were not used. Oral agents were not used in combination with insulin and sometimes were discontinued for medical reasons.
In the control group, the percentages of patients with specific orders were: 100% sliding scale as defined by the authors, 32% twice-daily dosing with NPH/regular insulin, 37% orals agents, and 15% combination oral agents with NPH/regular insulin. In the study group, the percentages were: 0% sliding scale, 68% twice-daily NPH/regular insulin, 30% orals, and 0% combination NPH/regular with oral agents. For the study patients versus the historical controls, the mean blood glucose was 150 ± 37 mg/dL mg/dL versus 200 ± 51 mg/dL (p<0.01). The frequency of hypoglycemia between the two groups did not differ.
Schoeffler and colleagues in the St. Joseph’s/Candler Health System in Savannah, Ga., recently conducted a randomized study of 20 patients that reported the use of a 70/30 dose titration algorithm is superior to sliding scale insulin in achieving glycemic control.33 Patients were identified for possible enrollment through discovery of orders for sliding scale insulin in the pharmacy. After exclusion of patients receiving tube feeds or TPN and patients having type-1 diabetes, those consenting to be randomized either received the sliding scale as written by their physician or titration of 70/30 insulin given twice daily under algorithm. Hypoglycemia did not occur in either group. Downward trend over time and lower mean blood glucose (151.3 versus 175.6 mg/dL, p = 0.042) were observed in the 70/30 insulin group.
Anticipatory Use of Insulin in the Hospital
The components of anticipatory subcutaneous insulin order-writing have been described according to preference of several authors (having basal, nutritional, and correction components). But in the hospital no style has been validated as superior to any other.34-37 The anticipatory delivery of nutritional insulin must match the expected pattern of exposure to carbohydrate. Specific standing orders should include additional nursing directions such as “do not withhold” or “hold if NPO.” For abrupt discontinuation of carbohydrate exposure, change of organ function, or decline of insulin resistance, protections must be in place to guard against hypoglycemia.38
An essential aspect of management is the frequent review of orders for subcutaneous insulin and patient response. At least once every day, the caregiver must reconsider “today’s insulin dose.”
How to Get Rid of Sliding Scale
Computerized order entry for managing hyperglycemia now is widespread among hospitals. Under a misdirected allocation of resources, motivated by concern for quality and safety, institutions have embraced the programming of order-entry options for standardized sliding scales. The sliding scale menu may provide a quick link to order entry for point-of-care blood capillary glucose monitoring, call parameters, and treatment of hypoglycemia. Nurses and doctors may come to believe that it is impossible even to order blood glucose monitoring without an accompanying sliding scale. Thus the sliding scale menu may possess all the accoutrements of glycemic management program except the one element most needed—a provision for anticipatory insulin.
One study by Achtmeyer and colleagues reduced utilization of a computerized sliding scale order by attaching a warning that the order was not approved by endocrinology.39 Emphasizing the importance of physician education to the successful abolition of sliding scale insulin, the study by Baldwin details an intensive house staff re-education program on how to write anticipatory insulin orders.32 The computerized order entry options used at Rush University Medical Center in Chicago (one of the two better performers in the recent benchmarking study of the University HealthSystem Consortium) were presented by Baldwin at the Aug. 19, 2005, “Glycemic Control Knowledge Transfer Meeting of the Consortium in Chicago.”
Why has use of the sliding scale persisted in practice? Is it for fear of hypoglycemia? Is it for lack of evidence on the importance of glycemic control? Even before computerization was sliding scale the path of least resistance? Is it because no clear superiority has been demonstrated among various styles of writing anticipatory insulin plans? Is it because physicians do not know how to write insulin orders? Or is it all in a name?
It just might seem that ordering sliding scale is the easy thing to call for or is the sophisticated thing to order. After all, sliding scale is an in-group term. A newly graduated physician is not likely to reject the suggestion of an experienced nurse that an order is needed for sliding scale.
For the next 50 years what is the call for, and what are the orders? Quite simply we have seen the twilight of the sliding scale—and “today’s insulin” dawning. TH
Dr. Braithwaite is clinical professor of medicine at the University of North Carolina, Diabetes Care Center, Durham.
References
- Zerr KJ, Furnary AP, Grunkemeier GL. Glucose control lowers the risk of wound infection in diabetics after open heart operations. Ann Thorac Surg. 1997;63:356-361.
- Furnary AP, Zerr KJ, Grunkemeier GL, et al. Continuous intravenous insulin infusion reduces the incidence of deep sternal wound infection in diabetic patients after cardiac surgical procedures. Ann Thorac Surg. 1999;67:352-362.
- Furnary AP, Wu Y, Bookin SO. Effect of hyperglycemia and continuous intravenous insulin infusions on outcomes of cardiac surgical procedures: the Portland diabetic project. Endocr Pract. 2004;10 (Suppl. 2):21-33.
- Furnary AP, Gao G, Grunkemeier GL, et al. Continuous insulin infusion reduces mortality in patients with diabetes undergoing coronary artery bypass grafting. J Thorac Cardiovasc Surg. 2003;125(5):1007-1021.
- Malmberg K, Rydén L, Efendic S, et al. Randomized trial of insulin-glucose infusion followed by subcutaneous insulin treatment in diabetic patients with acute myocardial infarction (DIGAMI study): effects on mortality at 1 year. J Am Coll Cardiol. 1995;26:57-65.
- Malmberg K, Norhammar A, Wedel H, et al. Glycometabolic state at admission: important risk marker of mortality in conventionally treated patients with diabetes mellitus and acute myocardial infarction: long-term results from the diabetes and insulin-glucose infusion in acute myocardial infarction (DIGAMI) study. Circulation. 1999;99:2626-2632.
- Malmberg K. (for the DIGAMI study group) Prospective randomised study of intensive insulin treatment on long term survival after acute myocardial infarction in patients with diabetes mellitus. BMJ. 1997;314:1512-1515.
- Van den Berghe G, Wouters PJ, Bouillon R, et al. Outcome benefit of intensive insulin therapy in the critically ill: insulin dose versus glycemic control. Crit Care Med. 2003;31(2):359-366.
- Van den Berghe G, Wouters P, Weekers F, et al. Intensive insulin therapy in critically ill patients. N Engl J Med. November 8, 2001;345(19):1359-1367.
- Van den Berghe G, Schoonheydt K, Becx P, et al. Insulin therapy protects the central and peripheral nervous system of intensive care patients. Neurology. April 26, 2005;64(8):1348-1353.
- Krinsley JS. Effect of an intensive glucose management protocol on the mortality of critically ill adult patients. Mayo Clin Proc. 2004:992-1000.
- Krinsley JS. Association between hyperglycemia and increased hospital mortality in a heterogeneous population of critically ill patients Mayo Clin Proc. 2003;78:1471-1478.
- Clement S, Braithwaite SS, Magee MF, et al. Management of diabetes and hyperglycemia in hospitals. Diabetes Care. 2004;27(2):553-591.
- American College of Endocrinology Position Statement on Inpatient Diabetes and Metabolic Control. Endocr Pract. 2004;10(1):77-82.
- Ku SY, Sayre CA, Hirsch IB, et al. New insulin infusion protocol improves blood glucose control in hospitalized patients without increasing hypoglycemia. Jt Comm J Qual Patient Saf. 2005;31(3):141-147.
- Davidson PC, Steed RD, Bode BW. Glucommander: a computer-directed intravenous insulin system shown to be safe, simple, and effective in 120,618 h of operation. Diabetes Care. 2005;28(10):2418-2423.
- Massie RW. Use of the sliding scale for determination of insulin dosage. J Tn State Med Assoc. 1958;51(10):423-425.
- Hanish LR. Standardizing regimens for sliding-scale insulin. Am J Health Syst Pharm. May 1, 1997;54(9):1046-1047.
- Raforth RJ. Standardizing sliding scale insulin orders. Am J Med Qual. 2002;17(5):169-170.
- Kletter GG. Sliding scale fallacy. Arch Intern Med. July 13, 1998;158(13):1472.
- Hirsch IB, Paauw DS, Brunzell J. Inpatient management of adults with diabetes. Diabetes Care. 1995;18(6):870-878.
- Bergenstal RM, Fish LH, List S. The insulin sliding scale is not dead. Arch Intern Med. February 9, 1998;158(3):298.
- Dickerson LM, Xiaobu Y, Sack JL. Glycemic control in medical inpatients with type 2 diabetes mellitus receiving sliding scale insulin regimens versus routine diabetes medications: a multicenter randomized controlled trial. Ann Fam Med. 2003;1(1):29-35.
- Hirsch IB. Insulin analogues. N Engl J Med. January 13, 2005 ;352(2):174-183.
- DeWitt DE, Hirsch IB. Outpatient insulin therapy in type 1 and type 2 diabetes mellitus: scientific review. JAMA. May 7, 2003;289(17):2254-2264.
- DAFNE Study Group. Training in flexible, intensive insulin management to enable dietary freedom in people with type 1 diabetes: dose adjustment for normal eating (DAFNE) randomised controlled trial. BMJ. 2002;325(7367):746-752.
- Genuth S. The automatic (regular insulin) sliding scale, or 2, 4, 6, 8—call H.O. Clinical Diabetes. 1994:40-42.
- Fischer KF, Lees JA, Newman JH. Hypoglycemia in hospitalized patients. N Engl J Med. 1986;315:1245-1250.
- Roman SH, Linekin PL, Stagnaro-Green A. An inpatient diabetes QI program. Jt Comm J Qual Improv. 1995;21(2):693-699.
- Gearhart JG, Duncan JL, Replogle WH, et al. Efficacy of sliding-scale insulin therapy: a comparison with prospective regimens. Fam Pract Res J. 1994;14:313-322.
- Queale WS, Seidler AJ, Brancati FL. Glycemic control and sliding scale insulin use in medical inpatients with diabetes mellitus. Arch Intern Med. 1997;157(5):545-552.
- Baldwin D, Villanueva G, McNutt R, et al. Eliminating inpatient sliding-scale insulin: a reeducation project with medical house staff. Diabetes Care. 2005;28(5):1008-1011.
- Schoeffler JM, Rice DAK, Gresham DG. 70/30 insulin algorithm versus sliding scale insulin. Ann Pharmacother. 2005;39(10):1606-1609.
- Trence DL, Kelly JL, Hirsch IB. The rationale and management of hyperglycemia for in-patients with cardiovascular disease: time for change. J Clin Endocrinol Metab. 2003;88 2430-2437.
- Magee MR, Clement S. Subcutaneous insulin therapy in the hospital setting: issues, concerns, and implementation. Endocr Pract. 2004;10 (suppl 2):81-88.
- Thompson CL, Dunn KC, Menon MC, et al. Hyperglycemia in the hospital. Diabetes Spectr. 2005;18(1):20-27.
- Campbell KB, Braithwaite SS. Hospital management of hyperglycemia. Clinical Diabetes. April 2004;22(2):81-88.
- Braithwaite SS, Buie MM, Thompson CL, et al. Hospital hypoglycemia: not only treatment but also prevention. Endocr Pract. 2004;10 (Suppl 2):71-80.
- Achtmeyer CE, Payne TH, Anawalt BD. Computer order entry system decreased use of sliding scale insulin regimens. Methods Inf Med. 2002;41:277-281.
Proof Positive
Many studies have been published in recent years about the effect of hospitalists on outcomes, efficiency, and cost-effectiveness of care (see also “In the Literature,” p. 30). While the studies have demonstrated varying results, the majority suggest that hospitalists contribute positively to care. And the tremendous growth of hospitalist programs nationwide indicates that hospital administrators and others agree.
Does this mean that there have been enough studies about the cost-effectiveness and efficiency of hospitalists, and about outcomes relating to hospitalists? Also, where should hospitalist research go next?
Looking Back
To date, the results of studies regarding hospitalists and their effect on outcomes and cost-effectiveness have varied. Most suggest positive correlations:
- Diamond, Goldberg, and Janosky demonstrated a 54% decrease in hospital readmission rates and shorter LOS when a community teaching hospital implemented full-time faculty hospitalists.1
- Auerbach, Wachter, and colleagues studied 5,308 patients cared for by hospitalists and community physicians at a community teaching hospital. They found that the voluntary hospitalist service reduced lengths of stay and costs that were statistically significant in the second year the services were used.2
- Bellet and Whitaker compared traditional ward service with a hospitalist system of care at a pediatric teaching hospital and found that the average LOS was a day shorter for the patients care for by hospitalists.3
- A review of five years of evidence-based hospitalist studies showed an average 13.4% cost reduction, as well as a 16.6% LOS reduction.4
- Rifkin, et al, compared treatment provided by hospitalist and primary care physicians among patients with community-acquired pneumonia. The authors found that hospitalists’ patients had shorter LOS and reduced costs.5
- Wachter reviewed the data to date in 2002 and concluded that it supported the hypothesis that hospitalists can lead to improved efficiency without compromising patient outcomes or satisfaction.6
- Meltzer, et al, studied costs and outcomes associated with patients on an academic general medical service cared for by hospitalists and non-hospitalists. They found that the average adjusted costs were similar for hospitalists and non-hospitalists in the first year. However, hospitalist costs were reduced by $782 in year two. The authors also concluded that short-term mortality was lower for hospitalists as well, but, again, only in the second year.7
- Auerbach and Pantilat assessed the effects of hospitalists’ care on communication, care patterns, and outcomes of end-of-life patients. They found that hospitalists documented “substantial efforts” to communicate with their dying patients and their families; and this may have resulted in better care.8
- Hauer, et al, analyzed house staff and student evaluations of their attending physicians and internal medicine ward rotations at two university-affiliated teaching hospitals over a two-year period. They found that trainees reported they received more effective teaching and more satisfying inpatient rotations when supervised by hospitalists.9

—Peter Lindenauer, MD, MSc
A few studies have indicated that hospitalists may have less impact on costs and outcomes. Among them:
- Smith, Westfall, and Nicholas performed a retrospective chart review of HMO critical care patients and found that the mean charge by primary care physicians ($5,680) was significantly lower than that of the hospitalists ($7,699). The authors suggested that “claims of better and cheaper care by hospitalists need further investigation” and that HMOs should not mandate the use of hospitalists.10
- Kearns, et al, compared clinical outcomes and care costs for patients treated by hospital- and clinic-based attending physicians. The researchers detected no difference in costs or clinical outcomes associated with either type of physician.11
Clearly, the majority of the studies suggest that hospitalists have a positive effect on outcomes, effectiveness, and/or costs. But can the research take credit for the growing popularity of hospitalists?
“The studies have gone a long way toward proving the value of hospitalist care. But the experiences of physicians and hospitals also have been very positive,” says Robert Wachter, MD, FACP, professor of medicine at the University of California, San Francisco, associate chairman of UCSF’s Department of Medicine, and chief of the Medical Service at UCSF Medical Center. He adds that the studies wouldn’t mean much if the experiences of hospitals didn’t back up their findings.
So what has been learned from hospitalist studies on costs and outcomes to date? The data “suggest that hospitalists have the greatest impact on efficiency,” says Dr. Wachter, in part because “it is much easier to measure lengths of stay than improvements in outcomes.” He states that data are “strong on cost-effectiveness and reducing lengths of stay.”
Dr. Wachter says that the greatest effect of hospitalist studies to date has been “the presence of a very large number of energetic, enthusiastic physicians who ‘live’ in the hospital and have embraced the notion that they are there not only to improve care but to benefit the hospital and contribute to making it a better place. We have seen hospitalists emerge as leaders on virtually every committee aimed at improving care.”
Peter Lindenauer, MD, MSc, a hospitalist at Baystate Medical Center in Springfield, Mass., and assistant professor of medicine at Tufts University School of Medical School, Boston, agrees.
“What’s been most astounding has been the growth of the field,” he says. “And one of the more interesting facets has been the extent to which hospitalists have fully integrated themselves into every aspect of hospital operations and care in a short period of time.
“It is now rare to find hospitals that do not have hospitalists,” continues Dr. Lindenauer. “It also is uncommon to see quality improvement, patient safety, patient satisfaction, and other activities at the hospital that don’t have a hospitalist as a key member.”
Nonetheless, there is always room for improvement. While the data “are quite clear that efficiency improves without harming quality, they are not strong enough to show definitively that hospitalists improve quality and safety,” cautions Dr. Wachter. “We need more data on this.”
He cautions that data involving mature hospitalist programs may not show the same increases in efficiency as studies about new or young programs. He refers to a study coming out next year that looks at six academic medical centers and mature hospitalists programs and doesn’t show the same increase in efficiency as earlier studies.
“It may be natural that some efficiency may wash away. As hospitalists become more dominant, they set the practice style and standards for their hospitals,” he says. “We need to continue to look for ways to improve.” However, he stresses that none of this takes away from the original argument that hospitalists improve efficiency.
—David Meltzer, MD, PhD
The Next Generation of Hospitalist Studies
Dr. Wachter suggests that the next generation of hospitalist research will have greater impact and importance if it goes beyond examining efficiency and cost-effectiveness.
“I don’t think the studies we began years ago are very interesting anymore, and I don’t think the system is looking for more of them,” he says. Now, research needs to look at the role of hospitalists—the role of hospitalists in teaching hospitals, what physicians make the best hospitalists, and so on.
Dr. Lindenauer would like to see more studies about hospitalists’ impact on quality of care. “There remains a relative paucity of information on this,” he says. “To date, there have been mostly small observational studies on this.” There is a need “to learn more about the impact of hospitalists, especially on more clinical outcomes and quality.”
Studies that “go under the hood and answer questions about the mechanisms by which hospitalists improve outcomes” also will be useful predicts Dr. Lindenauer. “Hospitals need to realize that hospitalists aren’t a magic bullet. It’s not as simple as implementing a hospitalist model of care and costs go down.”
Results of such studies need to be shared with hospitals nationwide so they can make the best and most effective use of hospitalists.
Studies addressing hospitalists working in specialty areas also are likely to become more common in the future, says Michael Phy, DO, MSC, associate program director and assistant professor at Texas Tech University Health Sciences Center in Austin, Texas. Earlier this year, he and his colleagues published a study looking at the hospitalist’s impact on geriatric surgical patients.12 During a two-year period, Dr. Phy and his team studied 466 elderly patients admitted to a hospital for surgical repair of a hip fracture. They found that a hospitalist model decreased the time to surgery, as well as the time from surgery to discharge, without adversely affecting mortality.
Dr. Phy’s study has interested other hospitals around the country. “We’ve been invited to speak on the model. People want to know how we did it, what the flaws were,” he explains. “The say that they are interested in using this kind of model, and they want to learn how to do it.
“I would like to see more studies about patient satisfaction and hospitalists,” says Dr. Phy. He also thinks that more studies about the impact of hospitalists on resident education will be useful. “There are a lot of studies about hospitalist involvement with residents; I am more interested in hospitalist’s indirect impact on residents. Does resident education improve when they are not so overworked because they have hospitalists who help provide patient care?”
In contrast, David Meltzer, MD, PhD, a hospitalist and an associate professor of medicine, General Internal Medicine, at the University of Chicago, doesn’t see patient satisfaction as a priority for the future. “Patient satisfaction isn’t an unreasonable thing to study,” he asserts. “But I personally don’t think that this is the most important issue.
“I don’t know what future studies will look like. I would like to say that we will see more and bigger studies,” continues Dr. Meltzer. “I also think we’ll see more studies about hospitalists in the community environment, more studies on mechanisms, and more hospitalists doing research on hospital care.”
To date, “hospitalist studies have been messy and ask the wrong questions,” says Robert Centor, MD, director of the Division of Internal Medicine, professor of internal medicine, and associate dean at the Huntsville Regional Medical Center in Alabama. He suggests that future studies should “look at hospitalists as a function of years of experience—first-year hospitalists compared to second, third, and forth.” Another useful focus would be to compare hospitalists with non-hospitalists, looking at “volume and lengths of stay and where the curve straightens out.”
Hurdling the Barriers
Especially as they get larger and involve more facilities, hospitalist studies will face some challenges. “Different people define hospitalists in different ways. It’s hard to tell what definitions studies are using; so in looking at two studies or trying to compare a study to what is happening at your facility, you don’t know if you’re comparing apples to apples or apples to oranges,” says Dr. Centor.
The nature of studies addressing hospitalist quality also poses some challenges. “Quality improvement interventions are harder to measure and are more institutionally dependent. Results can’t necessarily be translated from one institution to another,” explains Dr. Lindenauer.
He suggests that identifying funding sources for hospitalist studies will be an ongoing challenge. Researchers will be competing for an already shrinking number of dollars.
“The funding base for producing knowledge is limited, especially for studies that are not intrinsically disease-focused,” agrees Dr. Meltzer.
There is some organizational support for hospitalist researchers. For example, Dr. Phy notes that the SHM Web site will soon have a page where “you can list yourself and your clinical research interests, with the goal of hooking up with collaborators or mentors.”
The Third Generation
“At a certain point, we will turn our attention away from ‘navel gazing’—constantly assessing our impact—and accept that the hospitalist model is here to stay. Then hospitalists will begin to conduct research about the management of common conditions we take care of on a day-to-day basis—asthma, pneumonia, heart failure, COPD, and so on,” says Dr. Lindenauer. This is the third generation of hospitalist research, he suggests, adding, “This is where I would like to see the field evolve.” TH
Contributing Writer Joanne Kaldy wrote about psychiatric hospitalists in the October 2005 issue.
References
- Diamond HS, Goldberg E, Janosky JE. The effect of full-time faculty hospitalists on the efficiency of care at a community teaching hospital. Ann Intern Med. 1999;130:338-342.
- Auerbach AD, Wachter RM, Katz P, et al. Implementation of a voluntary hospitalist service at a community teaching hospital: improved clinical efficiency and patient outcomes. Ann Intern Med. 2002:137;859-865.
- Bellet PS, Whitaker RC. Evaluation of a pediatric hospitalist service: impact on length of stay and hospital charges. Pediatrics. 2000;105(3):478-484.
- No author listed. Hospitalist prove their worth for capitated providers, plans. Capitation Manag Rep. 2002;Apr;9(4):62-64, 49.
- Rifkin WD, Conner D, Silver A, et al. Comparison of processes and outcomes of pneumonia care between hospitalists and community-based primary care physicians. Mayo Clin Proc. 2002;77(10):1053-1058.
- Wachter RM. The evolution of the hospitalist model in the United States. Med Clin North Am. 2002;86(4):687-706.
- Meltzer D, Manning WG, Morrison J, et al. Effects of physician experience on costs and outcomes on an academic general medicine service: results of a trial of hospitalists. Ann Intern Med. 2002;137:866-874.
- Auerbach AD, Pantilat SZ. End-of-life care in a voluntary hospitalist model: effects on communication, processes of care, and patient symptoms. Am J Med. 2004;116(10):669-675.
- Hauer KE, Wachter RM, McCulloch CE, et al. Effects of hospitalist attending physicians on trainee satisfaction with teaching and with internal medicine rotations. Arch Intern Med. 2004;164(17):1866-1871.
- Smith PC, Westfall JM, Nicholas RA. Primary care family physicians and two hospitalist models: comparison of outcomes, processes, and costs. J Fam Pract. 2002;51:1021-1027.
- Kearns PJ, Wang CC, Morris WJ, et al. Hospital care by hospital-based and clinic-based faculty: a prospective, controlled trial. Arch Intern Med. 2001;161:235-241.
Many studies have been published in recent years about the effect of hospitalists on outcomes, efficiency, and cost-effectiveness of care (see also “In the Literature,” p. 30). While the studies have demonstrated varying results, the majority suggest that hospitalists contribute positively to care. And the tremendous growth of hospitalist programs nationwide indicates that hospital administrators and others agree.
Does this mean that there have been enough studies about the cost-effectiveness and efficiency of hospitalists, and about outcomes relating to hospitalists? Also, where should hospitalist research go next?
Looking Back
To date, the results of studies regarding hospitalists and their effect on outcomes and cost-effectiveness have varied. Most suggest positive correlations:
- Diamond, Goldberg, and Janosky demonstrated a 54% decrease in hospital readmission rates and shorter LOS when a community teaching hospital implemented full-time faculty hospitalists.1
- Auerbach, Wachter, and colleagues studied 5,308 patients cared for by hospitalists and community physicians at a community teaching hospital. They found that the voluntary hospitalist service reduced lengths of stay and costs that were statistically significant in the second year the services were used.2
- Bellet and Whitaker compared traditional ward service with a hospitalist system of care at a pediatric teaching hospital and found that the average LOS was a day shorter for the patients care for by hospitalists.3
- A review of five years of evidence-based hospitalist studies showed an average 13.4% cost reduction, as well as a 16.6% LOS reduction.4
- Rifkin, et al, compared treatment provided by hospitalist and primary care physicians among patients with community-acquired pneumonia. The authors found that hospitalists’ patients had shorter LOS and reduced costs.5
- Wachter reviewed the data to date in 2002 and concluded that it supported the hypothesis that hospitalists can lead to improved efficiency without compromising patient outcomes or satisfaction.6
- Meltzer, et al, studied costs and outcomes associated with patients on an academic general medical service cared for by hospitalists and non-hospitalists. They found that the average adjusted costs were similar for hospitalists and non-hospitalists in the first year. However, hospitalist costs were reduced by $782 in year two. The authors also concluded that short-term mortality was lower for hospitalists as well, but, again, only in the second year.7
- Auerbach and Pantilat assessed the effects of hospitalists’ care on communication, care patterns, and outcomes of end-of-life patients. They found that hospitalists documented “substantial efforts” to communicate with their dying patients and their families; and this may have resulted in better care.8
- Hauer, et al, analyzed house staff and student evaluations of their attending physicians and internal medicine ward rotations at two university-affiliated teaching hospitals over a two-year period. They found that trainees reported they received more effective teaching and more satisfying inpatient rotations when supervised by hospitalists.9
—Peter Lindenauer, MD, MSc
A few studies have indicated that hospitalists may have less impact on costs and outcomes. Among them:
- Smith, Westfall, and Nicholas performed a retrospective chart review of HMO critical care patients and found that the mean charge by primary care physicians ($5,680) was significantly lower than that of the hospitalists ($7,699). The authors suggested that “claims of better and cheaper care by hospitalists need further investigation” and that HMOs should not mandate the use of hospitalists.10
- Kearns, et al, compared clinical outcomes and care costs for patients treated by hospital- and clinic-based attending physicians. The researchers detected no difference in costs or clinical outcomes associated with either type of physician.11
Clearly, the majority of the studies suggest that hospitalists have a positive effect on outcomes, effectiveness, and/or costs. But can the research take credit for the growing popularity of hospitalists?
“The studies have gone a long way toward proving the value of hospitalist care. But the experiences of physicians and hospitals also have been very positive,” says Robert Wachter, MD, FACP, professor of medicine at the University of California, San Francisco, associate chairman of UCSF’s Department of Medicine, and chief of the Medical Service at UCSF Medical Center. He adds that the studies wouldn’t mean much if the experiences of hospitals didn’t back up their findings.
So what has been learned from hospitalist studies on costs and outcomes to date? The data “suggest that hospitalists have the greatest impact on efficiency,” says Dr. Wachter, in part because “it is much easier to measure lengths of stay than improvements in outcomes.” He states that data are “strong on cost-effectiveness and reducing lengths of stay.”
Dr. Wachter says that the greatest effect of hospitalist studies to date has been “the presence of a very large number of energetic, enthusiastic physicians who ‘live’ in the hospital and have embraced the notion that they are there not only to improve care but to benefit the hospital and contribute to making it a better place. We have seen hospitalists emerge as leaders on virtually every committee aimed at improving care.”
Peter Lindenauer, MD, MSc, a hospitalist at Baystate Medical Center in Springfield, Mass., and assistant professor of medicine at Tufts University School of Medical School, Boston, agrees.
“What’s been most astounding has been the growth of the field,” he says. “And one of the more interesting facets has been the extent to which hospitalists have fully integrated themselves into every aspect of hospital operations and care in a short period of time.
“It is now rare to find hospitals that do not have hospitalists,” continues Dr. Lindenauer. “It also is uncommon to see quality improvement, patient safety, patient satisfaction, and other activities at the hospital that don’t have a hospitalist as a key member.”
Nonetheless, there is always room for improvement. While the data “are quite clear that efficiency improves without harming quality, they are not strong enough to show definitively that hospitalists improve quality and safety,” cautions Dr. Wachter. “We need more data on this.”
He cautions that data involving mature hospitalist programs may not show the same increases in efficiency as studies about new or young programs. He refers to a study coming out next year that looks at six academic medical centers and mature hospitalists programs and doesn’t show the same increase in efficiency as earlier studies.
“It may be natural that some efficiency may wash away. As hospitalists become more dominant, they set the practice style and standards for their hospitals,” he says. “We need to continue to look for ways to improve.” However, he stresses that none of this takes away from the original argument that hospitalists improve efficiency.
—David Meltzer, MD, PhD
The Next Generation of Hospitalist Studies
Dr. Wachter suggests that the next generation of hospitalist research will have greater impact and importance if it goes beyond examining efficiency and cost-effectiveness.
“I don’t think the studies we began years ago are very interesting anymore, and I don’t think the system is looking for more of them,” he says. Now, research needs to look at the role of hospitalists—the role of hospitalists in teaching hospitals, what physicians make the best hospitalists, and so on.
Dr. Lindenauer would like to see more studies about hospitalists’ impact on quality of care. “There remains a relative paucity of information on this,” he says. “To date, there have been mostly small observational studies on this.” There is a need “to learn more about the impact of hospitalists, especially on more clinical outcomes and quality.”
Studies that “go under the hood and answer questions about the mechanisms by which hospitalists improve outcomes” also will be useful predicts Dr. Lindenauer. “Hospitals need to realize that hospitalists aren’t a magic bullet. It’s not as simple as implementing a hospitalist model of care and costs go down.”
Results of such studies need to be shared with hospitals nationwide so they can make the best and most effective use of hospitalists.
Studies addressing hospitalists working in specialty areas also are likely to become more common in the future, says Michael Phy, DO, MSC, associate program director and assistant professor at Texas Tech University Health Sciences Center in Austin, Texas. Earlier this year, he and his colleagues published a study looking at the hospitalist’s impact on geriatric surgical patients.12 During a two-year period, Dr. Phy and his team studied 466 elderly patients admitted to a hospital for surgical repair of a hip fracture. They found that a hospitalist model decreased the time to surgery, as well as the time from surgery to discharge, without adversely affecting mortality.
Dr. Phy’s study has interested other hospitals around the country. “We’ve been invited to speak on the model. People want to know how we did it, what the flaws were,” he explains. “The say that they are interested in using this kind of model, and they want to learn how to do it.
“I would like to see more studies about patient satisfaction and hospitalists,” says Dr. Phy. He also thinks that more studies about the impact of hospitalists on resident education will be useful. “There are a lot of studies about hospitalist involvement with residents; I am more interested in hospitalist’s indirect impact on residents. Does resident education improve when they are not so overworked because they have hospitalists who help provide patient care?”
In contrast, David Meltzer, MD, PhD, a hospitalist and an associate professor of medicine, General Internal Medicine, at the University of Chicago, doesn’t see patient satisfaction as a priority for the future. “Patient satisfaction isn’t an unreasonable thing to study,” he asserts. “But I personally don’t think that this is the most important issue.
“I don’t know what future studies will look like. I would like to say that we will see more and bigger studies,” continues Dr. Meltzer. “I also think we’ll see more studies about hospitalists in the community environment, more studies on mechanisms, and more hospitalists doing research on hospital care.”
To date, “hospitalist studies have been messy and ask the wrong questions,” says Robert Centor, MD, director of the Division of Internal Medicine, professor of internal medicine, and associate dean at the Huntsville Regional Medical Center in Alabama. He suggests that future studies should “look at hospitalists as a function of years of experience—first-year hospitalists compared to second, third, and forth.” Another useful focus would be to compare hospitalists with non-hospitalists, looking at “volume and lengths of stay and where the curve straightens out.”
Hurdling the Barriers
Especially as they get larger and involve more facilities, hospitalist studies will face some challenges. “Different people define hospitalists in different ways. It’s hard to tell what definitions studies are using; so in looking at two studies or trying to compare a study to what is happening at your facility, you don’t know if you’re comparing apples to apples or apples to oranges,” says Dr. Centor.
The nature of studies addressing hospitalist quality also poses some challenges. “Quality improvement interventions are harder to measure and are more institutionally dependent. Results can’t necessarily be translated from one institution to another,” explains Dr. Lindenauer.
He suggests that identifying funding sources for hospitalist studies will be an ongoing challenge. Researchers will be competing for an already shrinking number of dollars.
“The funding base for producing knowledge is limited, especially for studies that are not intrinsically disease-focused,” agrees Dr. Meltzer.
There is some organizational support for hospitalist researchers. For example, Dr. Phy notes that the SHM Web site will soon have a page where “you can list yourself and your clinical research interests, with the goal of hooking up with collaborators or mentors.”
The Third Generation
“At a certain point, we will turn our attention away from ‘navel gazing’—constantly assessing our impact—and accept that the hospitalist model is here to stay. Then hospitalists will begin to conduct research about the management of common conditions we take care of on a day-to-day basis—asthma, pneumonia, heart failure, COPD, and so on,” says Dr. Lindenauer. This is the third generation of hospitalist research, he suggests, adding, “This is where I would like to see the field evolve.” TH
Contributing Writer Joanne Kaldy wrote about psychiatric hospitalists in the October 2005 issue.
References
- Diamond HS, Goldberg E, Janosky JE. The effect of full-time faculty hospitalists on the efficiency of care at a community teaching hospital. Ann Intern Med. 1999;130:338-342.
- Auerbach AD, Wachter RM, Katz P, et al. Implementation of a voluntary hospitalist service at a community teaching hospital: improved clinical efficiency and patient outcomes. Ann Intern Med. 2002:137;859-865.
- Bellet PS, Whitaker RC. Evaluation of a pediatric hospitalist service: impact on length of stay and hospital charges. Pediatrics. 2000;105(3):478-484.
- No author listed. Hospitalist prove their worth for capitated providers, plans. Capitation Manag Rep. 2002;Apr;9(4):62-64, 49.
- Rifkin WD, Conner D, Silver A, et al. Comparison of processes and outcomes of pneumonia care between hospitalists and community-based primary care physicians. Mayo Clin Proc. 2002;77(10):1053-1058.
- Wachter RM. The evolution of the hospitalist model in the United States. Med Clin North Am. 2002;86(4):687-706.
- Meltzer D, Manning WG, Morrison J, et al. Effects of physician experience on costs and outcomes on an academic general medicine service: results of a trial of hospitalists. Ann Intern Med. 2002;137:866-874.
- Auerbach AD, Pantilat SZ. End-of-life care in a voluntary hospitalist model: effects on communication, processes of care, and patient symptoms. Am J Med. 2004;116(10):669-675.
- Hauer KE, Wachter RM, McCulloch CE, et al. Effects of hospitalist attending physicians on trainee satisfaction with teaching and with internal medicine rotations. Arch Intern Med. 2004;164(17):1866-1871.
- Smith PC, Westfall JM, Nicholas RA. Primary care family physicians and two hospitalist models: comparison of outcomes, processes, and costs. J Fam Pract. 2002;51:1021-1027.
- Kearns PJ, Wang CC, Morris WJ, et al. Hospital care by hospital-based and clinic-based faculty: a prospective, controlled trial. Arch Intern Med. 2001;161:235-241.
There Was a Farmer Had a Rash ...
A61-year-old farmer from Iowa with a medical history significant for non-Hodgkin’s lymphoma in remission presented for evaluation and treatment of two ulcerating lesions, located on his left forearm and left thigh of two months’ duration. He denied a history of pulmonary symptoms, fever, or unintentional weight loss. Physical examination was negative for lymphadenopathy or splenomegaly. Two large, beefy hyperkeratotic plaques with an underlying border with pustules were noted. The lesion shown is on the left lateral leg and is 5.3 x 4.0 cm.
What is your diagnosis:
- Cutaneous sarcoidosis;
- Recurrent lymphoma with skin metastasis;
- Blastomycosis;
- Pyoderma gangrenosum; or
- Anthrax.
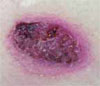
Discussion
The answer is C: blastomycosis. A pathology specimen from a left arm skin punch biopsy was read as pseudoepitheliomatous hyperplasia, dermal abscess, and broad-based yeast organisms suggestive of blastomycosis. Fungal cultures grew a white-like colony of hyphae suggestive of blastomycosis. DNA probe was positive for blastomycosis dermatitidis. Interestingly, his fungal serologies were negative. The patient was started on itraconazole 200 mg twice daily.
Blastomycosis typically presents in one of two ways:
- Pulmonary infection and/or
- Cutaneous infection.
Typically, the spores of Blastomyces dermatitidis are inhaled from the soil, decomposed vegetation, or rotting wood, and the respiratory system is the first site of infection. Occupations with frequent outdoor exposure in highly endemic areas (including the southeastern states of the United States) connote increased risk. Case series have documented inoculation arising after outdoor activities in the woods near water sources.
Although pulmonary infection is subclinical in 50% of inhalational cases, one study found that pulmonary manifestations were present in 154 of 170 cases (91%) with cough (90%), fever (75%), night sweats (68%), weight loss (66%), chest pain (63%), dyspnea (54%), and aches (50%). Therefore, respiratory symptoms may signal the disease.
According to another review of 100 cases in an endemic area, pulmonary blastomycosis should be considered for any pulmonary infiltrate, especially in the upper lobes. For this patient, because there were no pulmonary symptoms or cutaneous trauma, the most likely etiology is via hematogenous spread. However, whereas the chest radiograph did not show classic signs of blastomycosis (one or more densely consolidated areas of pneumonia or nodular infiltrates), it did show slight fibrosis and pleural thickenings in the apices that is occasionally associated with blastomycosis infection.
As in this case, a presenting cutaneous lesion may be the first sign of disease. The cutaneous findings are usually the result of hematogenous spread; however, uncommon primary cutaneous blastomycosis can occur after direct inoculation from trauma to the skin. Classically, they are described as well-demarcated papulopustules and verrucous plaques with central scarring and black crusting. But the skin lesions can present in many forms and often confound the differential diagnosis. Other cutaneous infectious etiologies include verrucae, nocardiosis, cutaneous tuberculosis, and other dimorphic fungi. However, other dimorphic fungi are less likely to infect the skin. Inflammatory conditions, such as pyoderma gangrenosum and sarcoidosis, must be considered. Ulcerating squamous cell carcinoma is also a consideration.
Blastomycosis is recognized histologically by its broad-based budding and thick, double-contoured walls of the yeast forms found at body temperature (37º C) while it grows as tan or white mold at room temperature. Cultures can be drawn from sputum, pus, or urine. Severe disease often requires systemic antifungal treatment, whereas more moderate to mild disease can be treated topically. TH
References
- Baumgardner DJ, Halsmer SE, Eagan G. Symptoms of pulmonary blastomycosis: northern Wisconsin, United States. Wilderness Environ Med. 2004;15:250-256.
- Patel RG, Patel B, Petrini MF, et al. Clinical presentation, radiographic findings, and diagnostic methods of pulmonary blastomycosis: a review of 100 consecutive cases. South Med J. 1999;92:289-295.
- Bolognia J, ed. Dermatology. Barcelona, Spain: Mosby; 2003.
- Kasper DL, ed. Harrison’s Online Principles of Internal Medicine. 16th ed. New York: McGraw-Hill; 2005.
A61-year-old farmer from Iowa with a medical history significant for non-Hodgkin’s lymphoma in remission presented for evaluation and treatment of two ulcerating lesions, located on his left forearm and left thigh of two months’ duration. He denied a history of pulmonary symptoms, fever, or unintentional weight loss. Physical examination was negative for lymphadenopathy or splenomegaly. Two large, beefy hyperkeratotic plaques with an underlying border with pustules were noted. The lesion shown is on the left lateral leg and is 5.3 x 4.0 cm.
What is your diagnosis:
- Cutaneous sarcoidosis;
- Recurrent lymphoma with skin metastasis;
- Blastomycosis;
- Pyoderma gangrenosum; or
- Anthrax.
Discussion
The answer is C: blastomycosis. A pathology specimen from a left arm skin punch biopsy was read as pseudoepitheliomatous hyperplasia, dermal abscess, and broad-based yeast organisms suggestive of blastomycosis. Fungal cultures grew a white-like colony of hyphae suggestive of blastomycosis. DNA probe was positive for blastomycosis dermatitidis. Interestingly, his fungal serologies were negative. The patient was started on itraconazole 200 mg twice daily.
Blastomycosis typically presents in one of two ways:
- Pulmonary infection and/or
- Cutaneous infection.
Typically, the spores of Blastomyces dermatitidis are inhaled from the soil, decomposed vegetation, or rotting wood, and the respiratory system is the first site of infection. Occupations with frequent outdoor exposure in highly endemic areas (including the southeastern states of the United States) connote increased risk. Case series have documented inoculation arising after outdoor activities in the woods near water sources.
Although pulmonary infection is subclinical in 50% of inhalational cases, one study found that pulmonary manifestations were present in 154 of 170 cases (91%) with cough (90%), fever (75%), night sweats (68%), weight loss (66%), chest pain (63%), dyspnea (54%), and aches (50%). Therefore, respiratory symptoms may signal the disease.
According to another review of 100 cases in an endemic area, pulmonary blastomycosis should be considered for any pulmonary infiltrate, especially in the upper lobes. For this patient, because there were no pulmonary symptoms or cutaneous trauma, the most likely etiology is via hematogenous spread. However, whereas the chest radiograph did not show classic signs of blastomycosis (one or more densely consolidated areas of pneumonia or nodular infiltrates), it did show slight fibrosis and pleural thickenings in the apices that is occasionally associated with blastomycosis infection.
As in this case, a presenting cutaneous lesion may be the first sign of disease. The cutaneous findings are usually the result of hematogenous spread; however, uncommon primary cutaneous blastomycosis can occur after direct inoculation from trauma to the skin. Classically, they are described as well-demarcated papulopustules and verrucous plaques with central scarring and black crusting. But the skin lesions can present in many forms and often confound the differential diagnosis. Other cutaneous infectious etiologies include verrucae, nocardiosis, cutaneous tuberculosis, and other dimorphic fungi. However, other dimorphic fungi are less likely to infect the skin. Inflammatory conditions, such as pyoderma gangrenosum and sarcoidosis, must be considered. Ulcerating squamous cell carcinoma is also a consideration.
Blastomycosis is recognized histologically by its broad-based budding and thick, double-contoured walls of the yeast forms found at body temperature (37º C) while it grows as tan or white mold at room temperature. Cultures can be drawn from sputum, pus, or urine. Severe disease often requires systemic antifungal treatment, whereas more moderate to mild disease can be treated topically. TH
References
- Baumgardner DJ, Halsmer SE, Eagan G. Symptoms of pulmonary blastomycosis: northern Wisconsin, United States. Wilderness Environ Med. 2004;15:250-256.
- Patel RG, Patel B, Petrini MF, et al. Clinical presentation, radiographic findings, and diagnostic methods of pulmonary blastomycosis: a review of 100 consecutive cases. South Med J. 1999;92:289-295.
- Bolognia J, ed. Dermatology. Barcelona, Spain: Mosby; 2003.
- Kasper DL, ed. Harrison’s Online Principles of Internal Medicine. 16th ed. New York: McGraw-Hill; 2005.
The Herbal Hospitalist

In 2002, the NIH surveyed more than 30,000 U.S. adults regarding their use of complementary and alternative medicine (CAM).1 This survey revealed that approximately 40% of U.S. adults had used some form of CAM in the past year. When one excludes prayer as a CAM modality, the most common modality used was the category of natural products (i.e., herbs and dietary supplements).
This has significant implications for all healthcare providers, but especially for those who practice in the hospital environment. Herbs can be potentially toxic in their own right and can cause drug-herb interactions as well. Such adverse effects may be particularly important in hospitalized patients undergoing surgery or who are acutely ill and exposed to a number of narrow-window therapeutic pharmaceuticals. Thus, it is imperative for hospital physicians to have a basic understanding of some of the risks, challenges, and potential benefits of herbs.

Use of Herbs by Hospitalized Patients
Surveys performed in the United States and around the world consistently demonstrate that the use of dietary supplements and herbs tends to be higher (as is all CAM usage) in individuals with chronic or incurable diseases. This is especially true for conditions such as HIV, diabetes, heart disease, and cancer.2–6 Thus, considering the complexity of illness of most hospitalized patients, it should not be surprising that use of herbs and dietary supplements is high in the hospital population. This has been borne out in several national and international studies.
A study reported in the Annals of Emergency Medicine in 2000 found that 56% of ED patients had tried alternative therapies in the past.7 The most frequently tried alternative therapies were massage therapy (31%), chiropractic (30%), and herbs (24%). Interestingly, 70% of the respondents who had tried these alternative therapies did not inform their physicians, highlighting a challenge for physicians and caregivers in the hospital setting.
Kay and colleagues reported 1,017 patients presenting for a preanesthetic evaluation prior to surgery.8 They found that 482 of 755 (64%) of patients had used at least one natural product. The majority of these were vitamin users, but several herbs with potential importance in the hospital setting were used as well: garlic extract (43%), ginkgo (32%), St. John’s wort (30%), ephedra (18%), and echinacea (12%).
Pediatric patients are not immune to the use of herbs and dietary supplement either. A survey at Children’s Hospital in Boston looked at 1,100 patients younger than 18 during their preoperative visit.9 A total of 1,021 surveys were completed and, of these, 30% patients indicated that they had tried one or more complementary and alternative therapies in the past year before surgery. Importantly, 13% had used herbal remedies before surgery.
Finally, international studies confirm similar usage patterns in adult hospital patients in Germany, Spain, Hong Kong, and Australia.10–13 Thus, it appears well established that the use of dietary supplements has become a fixed part of conventional healthcare. Recognizing that a significant percentage of patients under our care are using herbs is the first step in bringing critically needed information and guidance to our patients.
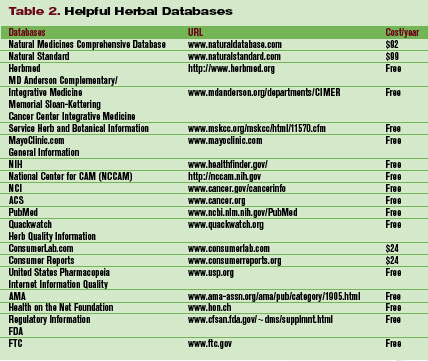
Herb Toxicity and Herb–Drug Interactions
There are many well-recognized herbal toxicities and/or drug-herb interactions with which all clinicians should have some degree of familiarity. For example, St. John’s wort stimulation of the cytochrome P450 enzyme system resulting in enhanced metabolism of several pharmaceutical drugs has been well reported. Ephedra’s ability to induce elevated blood pressure, stroke, and MI also received a great deal of publicity. (Note: Ephedra sales were banned by the FDA in 2004. However the prohibition excluded ephedra-containing teas, and—despite the ban—many internet sites still have ephedra available for purchase. Thus, be aware that your patients may still have access to ephedra.)
Which herbs might have specific importance in the hospital setting? This question was answered to some degree by researchers at the University of Chicago in 2001.14 The authors reviewed the literature on commonly used herbal medications in the context of the perioperative period and attempted to provide rationale strategies for managing their preoperative use. They identified echinacea, ephedra, garlic, ginkgo, ginseng, kava, St. John’s wort, and valerian as commonly used herbal medications that could pose a concern during the perioperative period.
Direct effects include bleeding from garlic, ginkgo, and ginseng; cardiovascular instability from ephedra; and hypoglycemia from ginseng. Pharmacodynamic herb-drug interactions include potentiation of the sedative effects of anesthetic by kava and valerian. Pharmacokinetic herb-drug interactions include increased metabolism of many drugs used in the perioperative period by St. John’s wort. (The findings are outlined in “Table 1. Clinically Important Effects and Perioperative Concerns of Eight Herbal Medicines and Recommendations for Discontinuation of Use Before Surgery,” p. 16.)
These authors concluded, “during the preoperative evaluation, physicians should explicitly elicit and document a history of herbal medication use. Physicians should be familiar with the potential perioperative effects of the commonly used herbal medications to prevent, recognize, and treat potentially serious problems associated with their use and discontinuation.”
However, it is quite clear that the numbers of herbs that patients can encounter seem almost limitless, and there is no way for any clinician to maintain currency with every potential toxicity or other adverse event. Because of the phenomenon of new herbs becoming popular almost on a monthly basis, the use of textbooks to assist the hospital clinician in identifying potentially toxic herbs or drug–herb interactions has limited utility.
For the most part, databases that maintain greater currency of such reports are most helpful. Some of this information can be found in nonproprietary sites (see “Table 2. Helpful Herbal Databases,” to right), whereas others require a subscription. In the latter category, Natural Medicines Comprehensive Database (www.naturaldatabase.com) is a helpful and extremely comprehensive resource. It is laid out in a systematic fashion that makes it easy to identify an herb of interest, discover if there are potential adverse effects, and also provide patient handout information to patients.
Future Directions
Some of the bloom is off the rose in terms of enthusiasm for dietary supplements and herbs as a panacea for all human ills. Increasingly, consumers are becoming savvy with regard to challenges related to quality of products including contamination and lack of standardization. In addition, the common mythologies that “herbs are natural and therefore safe” or that “if two doses of an herb are good, 10 must be better” are slowly becoming recognized as the dangerous platitudes that they are. A more rationale approach to herbal use is slowly emerging.
With a more informed public and better resources for physicians to counsel patients and consumers, it is possible that we will see beneficial dietary supplements and herbs assume a helpful role in managing common problems. For example, valerian may be of significant benefit in helping restructure sleep patterns in patients with insomnia (possibly with fewer side effects than benzodiazepines and less expense than some of the newer hypnotics). Still, long-term studies are generally lacking, so final determination of the role of valerian in the physician’s armamentarium await such studies.
At the Mayo Clinic, many such studies are under way. The use of valerian as a sleep aid for patients undergoing chemotherapy is nearing completion. Another study looking at the role of American ginseng (Panax quinquefolius) as a treatment for cancer-related fatigue has just gotten under way. As these and dozens of similar studies at research institutions across the country are completed, the missing pieces in the herb story will begin to be filled in.
Until all the answers are in, clinicians need to remember that herbs are popular and will probably be part of our healthcare system for the foreseeable future. Although many herbs have promising data to suggest we may welcome them into our repertoire of agents, the focus in the hospital (for now) must be to make sure our patients do not suffer harm from such agents. By working with them in a collaborative partnership and sharing the data we do have at hand, we can ensure that our patients have the information they need to make informed decisions about their decision to use (or not to use) herbs. TH
Brent Bauer, MD, is consultant director for the Complementary and Alternative Medicine Program, Mayo Clinic Rochester.
References
- Barnes P, Powell-Griner E, McFann K, et al. CDC Advance Data Report #343. Complementary and alternative medicine use among adults: United States, 2002; May 27, 2004.
- Hsiao AF, Wong MD, Kanouse DE, et al. Complementary and alternative medicine use and substitution for conventional therapy by HIV-infected patients. J Acquir Immune Defic Syndr. 2003;33:157-165.
- Yeh GY, Eisenberg DM, Davis RB, et al. Use of complementary and alternative medicine among persons with diabetes mellitus: results of a national survey. Am J Public Health. 2002;92:1648-1652.
- Wood MJ, Stewart RL, Merry H, et al. Use of complementary and alternative medical therapies in patients with cardiovascular disease. Am Heart J. 2003;145:806-812.
- Liu EH, Turner LM, Lin SX, et al. Use of alternative medicine by patients undergoing cardiac surgery. J Thorac Cardiovasc Surg. 2000;120:335-341.
- Richardson MA, Sanders T, Palmer JL, et al. Complementary/alternative medicine use in a comprehensive cancer center and the implications for oncology. J Clin Oncol. 2000;18:2505-2514.
- Gulla J, Singer AJ. Use of alternative therapies among emergency department patients. Ann Emerg Med. 2000;35:226-228.
- Kaye AD, Clarke RC, Sabar R, et al. Herbal medicines: current trends in anesthesiology practice—a hospital survey. J Clin Anesth. 2000;12:468-471.
- Lin YC, Bioteau AB, Ferrari LR, et al. The use of herbs and complementary and alternative medicine in pediatric preoperative patients. J Clin Anesth. 2004;16:4-6.
- Huber R, Koch D, Beiser I, et al. Experience and attitudes towards CAM—a survey of internal and psychosomatic patients in a German university hospital. Altern Ther Health Med. 2004;10:32-36.
- Valencia Orgaz O, Orts Castro A, Castells Armenter MV, et al. Assessing preoperative use of medicinal plants during preanesthetic interviews. Rev Esp Anestesiol Reanim. 2005;52:453-458. Spanish.
- Critchley LA, Chen DQ, Lee A, et al. A survey of Chinese herbal medicine intake amongst preoperative patients in Hong Kong. Anaesth Intensive Care. 2005;33:506-513.
- Grauer RP, Thomas RD, Tronson MD, et al. Preoperative use of herbal medicines and vitamin supplements. Anaesth Intensive Care. 2004;32:173-177.
- Ang-Lee MK, Moss J, Yuan CS. Herbal medicines and perioperative care. JAMA. 2001;286:208-216.
In 2002, the NIH surveyed more than 30,000 U.S. adults regarding their use of complementary and alternative medicine (CAM).1 This survey revealed that approximately 40% of U.S. adults had used some form of CAM in the past year. When one excludes prayer as a CAM modality, the most common modality used was the category of natural products (i.e., herbs and dietary supplements).
This has significant implications for all healthcare providers, but especially for those who practice in the hospital environment. Herbs can be potentially toxic in their own right and can cause drug-herb interactions as well. Such adverse effects may be particularly important in hospitalized patients undergoing surgery or who are acutely ill and exposed to a number of narrow-window therapeutic pharmaceuticals. Thus, it is imperative for hospital physicians to have a basic understanding of some of the risks, challenges, and potential benefits of herbs.
Use of Herbs by Hospitalized Patients
Surveys performed in the United States and around the world consistently demonstrate that the use of dietary supplements and herbs tends to be higher (as is all CAM usage) in individuals with chronic or incurable diseases. This is especially true for conditions such as HIV, diabetes, heart disease, and cancer.2–6 Thus, considering the complexity of illness of most hospitalized patients, it should not be surprising that use of herbs and dietary supplements is high in the hospital population. This has been borne out in several national and international studies.
A study reported in the Annals of Emergency Medicine in 2000 found that 56% of ED patients had tried alternative therapies in the past.7 The most frequently tried alternative therapies were massage therapy (31%), chiropractic (30%), and herbs (24%). Interestingly, 70% of the respondents who had tried these alternative therapies did not inform their physicians, highlighting a challenge for physicians and caregivers in the hospital setting.
Kay and colleagues reported 1,017 patients presenting for a preanesthetic evaluation prior to surgery.8 They found that 482 of 755 (64%) of patients had used at least one natural product. The majority of these were vitamin users, but several herbs with potential importance in the hospital setting were used as well: garlic extract (43%), ginkgo (32%), St. John’s wort (30%), ephedra (18%), and echinacea (12%).
Pediatric patients are not immune to the use of herbs and dietary supplement either. A survey at Children’s Hospital in Boston looked at 1,100 patients younger than 18 during their preoperative visit.9 A total of 1,021 surveys were completed and, of these, 30% patients indicated that they had tried one or more complementary and alternative therapies in the past year before surgery. Importantly, 13% had used herbal remedies before surgery.
Finally, international studies confirm similar usage patterns in adult hospital patients in Germany, Spain, Hong Kong, and Australia.10–13 Thus, it appears well established that the use of dietary supplements has become a fixed part of conventional healthcare. Recognizing that a significant percentage of patients under our care are using herbs is the first step in bringing critically needed information and guidance to our patients.
Herb Toxicity and Herb–Drug Interactions
There are many well-recognized herbal toxicities and/or drug-herb interactions with which all clinicians should have some degree of familiarity. For example, St. John’s wort stimulation of the cytochrome P450 enzyme system resulting in enhanced metabolism of several pharmaceutical drugs has been well reported. Ephedra’s ability to induce elevated blood pressure, stroke, and MI also received a great deal of publicity. (Note: Ephedra sales were banned by the FDA in 2004. However the prohibition excluded ephedra-containing teas, and—despite the ban—many internet sites still have ephedra available for purchase. Thus, be aware that your patients may still have access to ephedra.)
Which herbs might have specific importance in the hospital setting? This question was answered to some degree by researchers at the University of Chicago in 2001.14 The authors reviewed the literature on commonly used herbal medications in the context of the perioperative period and attempted to provide rationale strategies for managing their preoperative use. They identified echinacea, ephedra, garlic, ginkgo, ginseng, kava, St. John’s wort, and valerian as commonly used herbal medications that could pose a concern during the perioperative period.
Direct effects include bleeding from garlic, ginkgo, and ginseng; cardiovascular instability from ephedra; and hypoglycemia from ginseng. Pharmacodynamic herb-drug interactions include potentiation of the sedative effects of anesthetic by kava and valerian. Pharmacokinetic herb-drug interactions include increased metabolism of many drugs used in the perioperative period by St. John’s wort. (The findings are outlined in “Table 1. Clinically Important Effects and Perioperative Concerns of Eight Herbal Medicines and Recommendations for Discontinuation of Use Before Surgery,” p. 16.)
These authors concluded, “during the preoperative evaluation, physicians should explicitly elicit and document a history of herbal medication use. Physicians should be familiar with the potential perioperative effects of the commonly used herbal medications to prevent, recognize, and treat potentially serious problems associated with their use and discontinuation.”
However, it is quite clear that the numbers of herbs that patients can encounter seem almost limitless, and there is no way for any clinician to maintain currency with every potential toxicity or other adverse event. Because of the phenomenon of new herbs becoming popular almost on a monthly basis, the use of textbooks to assist the hospital clinician in identifying potentially toxic herbs or drug–herb interactions has limited utility.
For the most part, databases that maintain greater currency of such reports are most helpful. Some of this information can be found in nonproprietary sites (see “Table 2. Helpful Herbal Databases,” to right), whereas others require a subscription. In the latter category, Natural Medicines Comprehensive Database (www.naturaldatabase.com) is a helpful and extremely comprehensive resource. It is laid out in a systematic fashion that makes it easy to identify an herb of interest, discover if there are potential adverse effects, and also provide patient handout information to patients.
Future Directions
Some of the bloom is off the rose in terms of enthusiasm for dietary supplements and herbs as a panacea for all human ills. Increasingly, consumers are becoming savvy with regard to challenges related to quality of products including contamination and lack of standardization. In addition, the common mythologies that “herbs are natural and therefore safe” or that “if two doses of an herb are good, 10 must be better” are slowly becoming recognized as the dangerous platitudes that they are. A more rationale approach to herbal use is slowly emerging.
With a more informed public and better resources for physicians to counsel patients and consumers, it is possible that we will see beneficial dietary supplements and herbs assume a helpful role in managing common problems. For example, valerian may be of significant benefit in helping restructure sleep patterns in patients with insomnia (possibly with fewer side effects than benzodiazepines and less expense than some of the newer hypnotics). Still, long-term studies are generally lacking, so final determination of the role of valerian in the physician’s armamentarium await such studies.
At the Mayo Clinic, many such studies are under way. The use of valerian as a sleep aid for patients undergoing chemotherapy is nearing completion. Another study looking at the role of American ginseng (Panax quinquefolius) as a treatment for cancer-related fatigue has just gotten under way. As these and dozens of similar studies at research institutions across the country are completed, the missing pieces in the herb story will begin to be filled in.
Until all the answers are in, clinicians need to remember that herbs are popular and will probably be part of our healthcare system for the foreseeable future. Although many herbs have promising data to suggest we may welcome them into our repertoire of agents, the focus in the hospital (for now) must be to make sure our patients do not suffer harm from such agents. By working with them in a collaborative partnership and sharing the data we do have at hand, we can ensure that our patients have the information they need to make informed decisions about their decision to use (or not to use) herbs. TH
Brent Bauer, MD, is consultant director for the Complementary and Alternative Medicine Program, Mayo Clinic Rochester.
References
- Barnes P, Powell-Griner E, McFann K, et al. CDC Advance Data Report #343. Complementary and alternative medicine use among adults: United States, 2002; May 27, 2004.
- Hsiao AF, Wong MD, Kanouse DE, et al. Complementary and alternative medicine use and substitution for conventional therapy by HIV-infected patients. J Acquir Immune Defic Syndr. 2003;33:157-165.
- Yeh GY, Eisenberg DM, Davis RB, et al. Use of complementary and alternative medicine among persons with diabetes mellitus: results of a national survey. Am J Public Health. 2002;92:1648-1652.
- Wood MJ, Stewart RL, Merry H, et al. Use of complementary and alternative medical therapies in patients with cardiovascular disease. Am Heart J. 2003;145:806-812.
- Liu EH, Turner LM, Lin SX, et al. Use of alternative medicine by patients undergoing cardiac surgery. J Thorac Cardiovasc Surg. 2000;120:335-341.
- Richardson MA, Sanders T, Palmer JL, et al. Complementary/alternative medicine use in a comprehensive cancer center and the implications for oncology. J Clin Oncol. 2000;18:2505-2514.
- Gulla J, Singer AJ. Use of alternative therapies among emergency department patients. Ann Emerg Med. 2000;35:226-228.
- Kaye AD, Clarke RC, Sabar R, et al. Herbal medicines: current trends in anesthesiology practice—a hospital survey. J Clin Anesth. 2000;12:468-471.
- Lin YC, Bioteau AB, Ferrari LR, et al. The use of herbs and complementary and alternative medicine in pediatric preoperative patients. J Clin Anesth. 2004;16:4-6.
- Huber R, Koch D, Beiser I, et al. Experience and attitudes towards CAM—a survey of internal and psychosomatic patients in a German university hospital. Altern Ther Health Med. 2004;10:32-36.
- Valencia Orgaz O, Orts Castro A, Castells Armenter MV, et al. Assessing preoperative use of medicinal plants during preanesthetic interviews. Rev Esp Anestesiol Reanim. 2005;52:453-458. Spanish.
- Critchley LA, Chen DQ, Lee A, et al. A survey of Chinese herbal medicine intake amongst preoperative patients in Hong Kong. Anaesth Intensive Care. 2005;33:506-513.
- Grauer RP, Thomas RD, Tronson MD, et al. Preoperative use of herbal medicines and vitamin supplements. Anaesth Intensive Care. 2004;32:173-177.
- Ang-Lee MK, Moss J, Yuan CS. Herbal medicines and perioperative care. JAMA. 2001;286:208-216.
Evidence-Based Medicine for the Hospitalist
We evaluate the validity of a study before examining its results because it will generally be inappropriate to apply the results of a biased study to our patients. If we cannot trust that the results reflect a reasonable estimation of the truth we seek to address, how can we then use those results to guide patient care? However, if we are satisfied with a study’s validity we need to know what the results mean and what to do with them.
In this segment of the evidence-based medicine series, we discuss several commonly reported study measures and how we can ultimately apply study findings for the good of patients. This is, after all, why we ask clinical questions in the first place.
Measures of Treatment Effect
For many types of clinical questions, the proportion of patients in each group experiencing an outcome is the most commonly reported result. This can be presented in several ways, each with subtly different effects.
For example, suppose a hypothetical trial of perioperative beta-blockade finds a postoperative mortality of 5% in the treatment group and 15% in the control group. In this study, the absolute risk reduction (ARR) is 0.15-0.05 = 0.10, and the relative risk (RR) of death is 0.05/0.15 = 0.33. In other words, the risk of death in the treatment group is one-third the risk of death in the control group, whereas the difference in risk between treated and untreated patients is 0.10, or 10%. The relative risk reduction (RRR) is (1-RR) x 100% = 67%, meaning that perioperative beta-blockers reduce the risk of death by 67%.
Although these numbers all seem quite different from one another, they are derived from the same study results: a difference in the proportion of deaths between the intervention groups. However, taken together they provide far more information than any individual result.
To illustrate this, suppose you knew the relative risk of death found in Study A was 10%, meaning the relative risk reduction was 90%. This may sound quite striking, until you later learn that the risk in the treatment group was 0.0001 and the risk in the control group was 0.001. This is quite different from Study B, in which the risk of death in the treatment group was 10% and the risk in the control group was 100%, even though the RR was still 10%. This difference is captured in the ARR. For the first study, the ARR was 0.0009 (or 0.09%), whereas in the second study the ARR was 0.90 (or 90%).
It can be difficult to communicate these differences clearly using terms such as ARR, but the number needed to treat (NNT) provides a more accessible means of reporting effects. The NNT is the number of patients you would need to treat to prevent one adverse event, or achieve one more successful outcome and is calculated as 1/ARR.
For Study A the NNT is 1,111, meaning we would need to treat more than 1,000 patients to prevent a single death. For many treatments, this would prove prohibitively costly and perhaps even dangerous depending on the frequency and severity of side effects. Study B, on the other hand, has an NNT of just over 1, meaning that nearly every treated case represents an averted death: Even though the relative risks are identical, the full meaning of the results is drastically different.
Other measures of treatment effect include odds ratios, commonly reported in case–control studies but actually appropriate in any comparative study, and hazard ratios, commonly reported in survival studies. We do not address these measures in more detail here, but loosely speaking the same principles discussed for relative risks apply.
Measures from Studies of Diagnostic Tests
When we order a diagnostic study, we are trying to gain information about the patient’s underlying probability of a disorder. That is, the diagnostic test moves us from a pre-test probability to a post-test probability. Historically, terms such as sensitivity and specificity have been used to describe the properties of a diagnostic test. But these terms have significant limitations, one of which is that they do not consider the pre-test probability at all.
Likelihood ratios overcome this limitation. Basically, a likelihood ratio (LR) converts pre-test odds to post-test odds. Because we think in terms of probabilities rather than odds, we can either use a nomogram to make the conversion for us or recall that for a probability p, odds = p/(1 - p) and p = odds/(1 + odds).
For example, suppose we suspect that a patient may have iron-deficiency anemia and quantify this suspicion with a pre-test probability of 25%. If the ferritin is 8 mcg/L, we can apply the likelihood ratio of 55 found from a literature search locating Guyatt, et al. (1992). The pre-test odds is one-third, which when multiplied by the LR of 55 yields a post-test odds of 18.3. This then can be converted back to a post-test probability of 95%. Alternatively, the widely available nomograms give the same result.
Clearly, this diagnostic test has drastically affected our sense of whether the patient has iron-deficiency anemia. Likelihood ratios for many common problems may be found in the recommended readings.
Perhaps the greatest stumbling block to the use of likelihood ratios is how to determine pre-test probabilities. This really should not be a major worry because it is our business to estimate probabilities of disease every time we see a patient. However, this estimation can be strengthened by using evidence-based principles to find literature to support your chosen pre-test probabilities. This further emphasizes that EBM affects all aspects of clinical decision-making.
Measures of Precision
Each of the measures discussed thus far is a point estimate of the true effect based on the study data. Because the true effect for all humans can never be known, we need some way of describing how precise our point estimates are. Statistically, confidence intervals (CIs) provide this information. An accurate definition of this measure of precision is not intuitive, but in practice the CI can provide answers to two key questions. First, does the CI cross the point of no effect (e.g., a relative risk of 1 or an absolute risk reduction of 0)? Second, how wide is the CI?
If the answer to the first question is yes, we cannot state with any certainty that there really is an effect of the treatment: a finding of “no effect” is considered plausible, because it is contained within the CI. If the CI is very wide, the true effect could be any value across a wide range of possibilities. This makes decision making problematic, unless the entire range of the CI represents a clinically important effect.
We will talk in more detail about CIs in a later segment, but the important message here is that a point estimate requires a CI before meaningful conclusions affecting patient care may be reached.
Applying Results to Patient Care
Once validity issues have been addressed and results have been processed, the key determinants of whether a study’s results can be applied to your patient are whether the study population was reasonably similar to your patient and whether the study setting was reasonably similar to your own. This need not be exact, but if a study enrolled only men, application of the results to women may not be supported.
On the other hand, if a study excluded individuals younger than 60 and your patient is 59 you may still feel comfortable applying the findings of this study to your patient’s care. The application of study results to individual patients is often not a simple decision. A general recommendation is to carefully determine whether there is a compelling reason to suggest that the study results might not apply to your patient. If not, generalizing the results is likely reasonable.
Additional considerations include the balance between benefits and risks, costs, and, of course, patient and provider values. If a treatment promotes survival but may have a negative impact on quality of life (for a recent example, see the MADIT II trial of AICD implantation in patients with prior MI and heart failure), patients and providers must carefully evaluate their priorities in determining the best course of action. Also, a costly treatment having a small but significant benefit may not be justified in an era of limited resources. These issues are at the heart of medicine and are best addressed by collaborative decision-making among patients, care providers, insurers, policy makers, and all other members of our healthcare system.
Summary
The results of a study can be reported in many ways, with different measures fitting different clinical questions. The keys to look for are a point estimate and a measure of the precision of that estimate. Applying results to patient care requires complex decisions that go well beyond the numbers from any study. In the upcoming segments of this series, we will focus more attention on how results are evaluated statistically. This will provide additional depth to the discussion of study results and how they inform our clinical decisions. TH
Dr. West practices in the Division of General Internal Medicine, Mayo Clinic College of Medicine, Rochester, Minn.