User login
Impact on Length of Stay of a Hospital Medicine Emergency Department Boarder Service
Emergency department (ED) crowding and boarding of patients awaiting admission to the hospital (ED boarding) are growing problems with important clinical care and public safety implications.1-4 Increased ED boarding times have been associated with lower patient satisfaction, inadequate care of critically ill patients, adverse events, and increased mortality.3,5-7 Furthermore, ED boarding can diminish the ED’s ability to evaluate new patients.5,8,9 ED boarding is more severe in hospitals with high inpatient occupancy with resultant disproportionate burden on large urban institutions.2,4,5,10
Earlier studies suggest, but have not consistently shown, an association between longer ED length of stay (LOS) and longer overall hospital LOS.5 This association implies that the additional time spent in the ED waiting for a bed does not meaningfully contribute to advancing the required inpatient care. Thus, this waiting time is “dead time” that is added to the overall hospital duration.
The complexity and the volume of medical patients boarding in the ED can challenge the resources of an already overtaxed ED staff. Potential solutions to mitigate ED boarding of medicine patients generally focus on reducing barriers to timely movement of patients from the ED to an inpatient unit.1,3,11-13 Ultimately, these barriers are a function of inadequate hospital capacity (eg, hospital beds, staffing) and are difficult to overcome. Two primary strategies have been used to reduce these barriers. One strategy focuses on shifting inpatient discharge times earlier to better match inpatient bed supply with ED demand.14-19 Another common strategy is utilizing inpatient attendings to triage and better match bed needs to bed availability.20-22
A separate area of interest, and the focus of this study, is the deployment of inpatient teams to hasten delivery of inpatient care to patients waiting in the ED.8,23 One institution implemented an “ED hospitalist” model.23 Another created a hospital medicine team to provide inpatient medical care to ED boarder patients and to lend clinical input to bed management.8
At our large, urban academic medical center, the Department of Medicine in collaboration with the Department of Emergency Medicine created a full-time hospital medicine team dedicated to providing care in the ED for patients awaiting admission to a general medicine unit. We present our multiyear experience with this ED-based hospital medicine team. We hypothesized that this new team would expedite inpatient care delivery to medical boarder patients, thereby reducing the overall hospital LOS.
METHODS
Study Setting and Design
This retrospective cross-sectional study, approved by the Institutional Review Board, was conducted at a 1,011-bed academic medical center in the northeast United States. The study period was July 1, 2016 through June 30, 2018, which was divided into Academic Year 16 (AY) (July 1, 2016 to June 30, 2017) and AY17 (July 1, 2017 to June 30, 2018).
The Hospital Medicine Unit (HMU) was a 60 full-time equivalent hospital medicine group consisting of 80 physicians and 25 advanced practice providers (APPs). During the study, the general medical services cared for an average of 260 patients per day on inpatient units with a wide variety of diagnoses and comorbidities. The ED had 48 monitored bed spaces for adult patients, as well as two dedicated ED observation units with 32 beds. The observation units are separate units within the hospital, staffed by ED clinicians, and were not included in this study. In 2016, the ED had a total of 110,741 patient visits and 13,908 patients were admitted to a medical service.
In 2010, the Department of Public Health for the state in which the medical center resides defined an ED boarder (EDB) patient as “a patient who remains in the ED two hours after the decision to admit.”24 According to this definition, any patient waiting for an inpatient bed for more than two hours after a bed request was considered as an EDB. Operationally, further distinctions were made between patients who were “eligible” for care by an internal medicine team in the ED versus those who were actually “covered”. Before the intervention outlined in the current study, some care was provided by resident and hospitalist teams to eligible EDB patients from 2010 to 2015, although this was limited in scope. From July 1, 2015 to June 30, 2016, there was no coverage of medicine EDB patients.
Intervention
ED Boarder Service Staffing
On July 1, 2016, the HMU deployed a dedicated full-time team of clinicians to care for boarding patients, which was known as the EDB service. The service was created with the goal of seeing a maximum of 25 patients over 24 hours.
Inpatient medicine attending physicians (hospitalists) and APPs worked on the EDB service. During the day (7
There was a dedicated nursing team for the EDB service. For AY16, there were two daytime EDB nurses and one night nurse, all with a coverage ratio of three to four patients per nurse. For AY17, there were four to five daytime nurses and two to three nighttime nurses with the same coverage ratio as that for AY16. EDB nurses received special training on caring for boarder patients and followed the usual inpatient nursing protocols and assessments. During each shift, an EDB charge nurse worked in conjunction with the hospitalist, bed management, and inpatient units to determine patients requiring coverage by the EDB team.
Patient Eligibility
Similar to the workflow before the intervention, the ED team was responsible for determining a patient’s need for admission to a medical service. Patients were eligible for EDB service coverage if they waited in the ED for more than two hours after the request for an inpatient bed was made. The EDB charge nurse was responsible for identifying all eligible boarder patients based on time elapsed since bed request. Patients were not eligible for the hospital medicine EDB service if they were in the ED observation units or were being admitted to the intensive care unit, cardiology service, oncology service, or any service outside of the Department of Medicine.
The EDB service did not automatically assume care of all eligible patients. Instead, eligible patients were accepted based on several factors including EDB clinician census, anticipated availability of an inpatient bed, and clinical appropriateness as deemed by the physician. If the EDB physician census was fewer than 10 patients and an eligible patient was not expected to move to an inpatient unit within the next hour, the patient was accepted by the EDB service. Patients who were not accepted by the EDB service remained under the care of the ED team until either the patient received an inpatient bed or space became available on the EDB service census. Eligible EDB patients who received an inpatient bed before being picked up by the EDB service were considered as noncovered EDB patients. Alternatively, an eligible patient may initially be declined from EDB service coverage due to, for example, a high census but later accepted when capacity allowed—this patient would be considered a covered EDB patient.
Handoff and Coordination
When an eligible patient was accepted onto the EDB service, clinical handoff between the ED and EDB teams occurred. The EDB physician wrote admission orders, including the inpatient admission order. Once on the EDB service, when space allowed, the patient was physically moved to a dedicated geographic space (8 beds) within the ED designed for the EDB service. When the dedicated EDB area was full, new patients would remain in their original patient bay and receive care from the EDB service. Multidisciplinary rounds with nursing, inpatient clinicians, and case management that normally occur every weekday on inpatient units were adapted to occur on the EDB service to discuss patient care needs. The duration of the patient’s stay in the ED, including the time on the EDB service, was dictated by bed availability rather than by clinical discretion of the EDB clinician. When an EDB patient was assigned a ready inpatient bed, the EDB clinician immediately passed off clinical care to the inpatient medical team. There was no change in the process of assigning patients to inpatient beds during the intervention period.
Study Population
This study included patients who were admitted to the general medical services through the ED during the defined period. We excluded medicine patients who did not pass through the ED (eg, direct admissions or outside transfer) as well as patients admitted to a specialty service (cardiology, oncology) or the intensive care unit. Patients admitted to a nonmedical service were also excluded.
Two hours following a bed request, an ED patient was designated as an eligible EDB patient. Operationally, and for the purposes of this study, patients were separated into three groups: (1) an eligible EDB patient for whom the EDB service assumed care for any portion of their ED stay was considered as a “covered ED boarder,” (2) an eligible EDB patient who did not have any coverage by the EDB service at any point during their ED stay was considered as a “noncovered boarder,” and (3) a patient who received an inpatient bed within two hours of bed request was considered as a “nonboarder”. Patients admitted to a specialty service, intensive care unit, or nonmedical services were not included in any of the abovementioned three groups.
We defined metrics to quantify the extent of EDB team coverage. First, the number of covered EDB patients was divided by all medicine boarders (covered + noncovered) to determine the percentage of medicine EDBs covered. Second, the total patient hours spent under the care of the EDB service was divided by the total boarding hours for all medicine boarders to determine the percentage of boarder hours covered.
Data Sources and Collection
The Electronic Health Record (EHR; Epic Systems Corporation, Verona, Wisconsin) captured whether patients were eligible EDBs. For covered EDB patients, the time when care was assumed by the EDB service was captured electronically. Patient demographics, admitting diagnoses, time stamps throughout the hospitalization, admission volumes, LOS, and discharge disposition were extracted from the EHR.
Primary and Secondary Outcome Measures
The primary outcome of this study was hospital LOS defined as the time from ED arrival to hospital departure (Figure). Secondary outcomes included ED LOS (time from ED arrival to ED departure) and the rate of 30-day ED readmission to the study institution.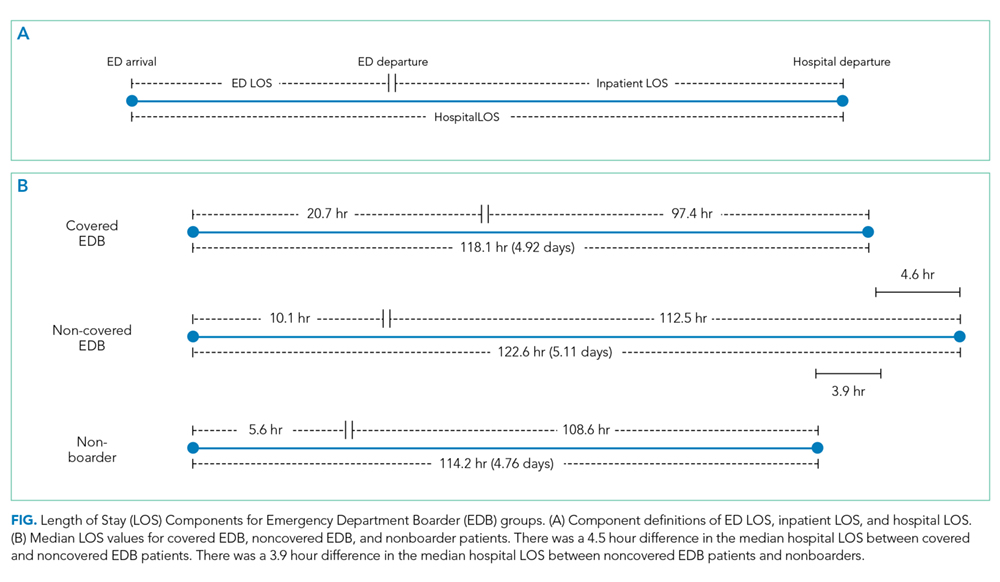
Statistical Analysis
SAS version 9.4 (SAS Institute, Cary, North Carolina) was used for all statistical analyses. Continuous outcomes were compared using the Mann–Whitney test and dichotomized outcomes were compared using chi-square tests. We further analyzed the differences in the primary and secondary outcomes between covered and noncovered EDB groups using a multivariable regression analysis adjusting for age, gender, race, academic year, hour of the day, and day of the week at the time of becoming an EDB. We used quantile regression and linear regression with log-transformed continuous outcomes and logistic regression for the dichotomized outcome. A P value of .05 was used as a threshold for statistical significance.
RESULTS
Study Population and Demographics
There were a total of 16,668 patients admitted from the ED to the general medical services during the study period (Table 1). There were 8,776 (53%) patients in the covered EDB group, 5,866 (35%) patients in the noncovered EDB group, and 2,026 (12%) patients in the nonboarder group. There were more patients admitted during AY17 compared with AY16 (8,934 vs 7,734 patients, respectively, Appendix 1). Patient demographics, including age, gender, race, insurance coverage, admitting diagnoses, and discharge disposition, were similar among all three patient groups (Table 1). A majority of patients in the covered EDB and nonboarder groups presented to the ED in the afternoon, whereas noncovered EDB patients presented more in the morning (Table 1). Consistent with this pattern, inpatient bed requests for covered EDB and nonboarder patients were more frequent between 7 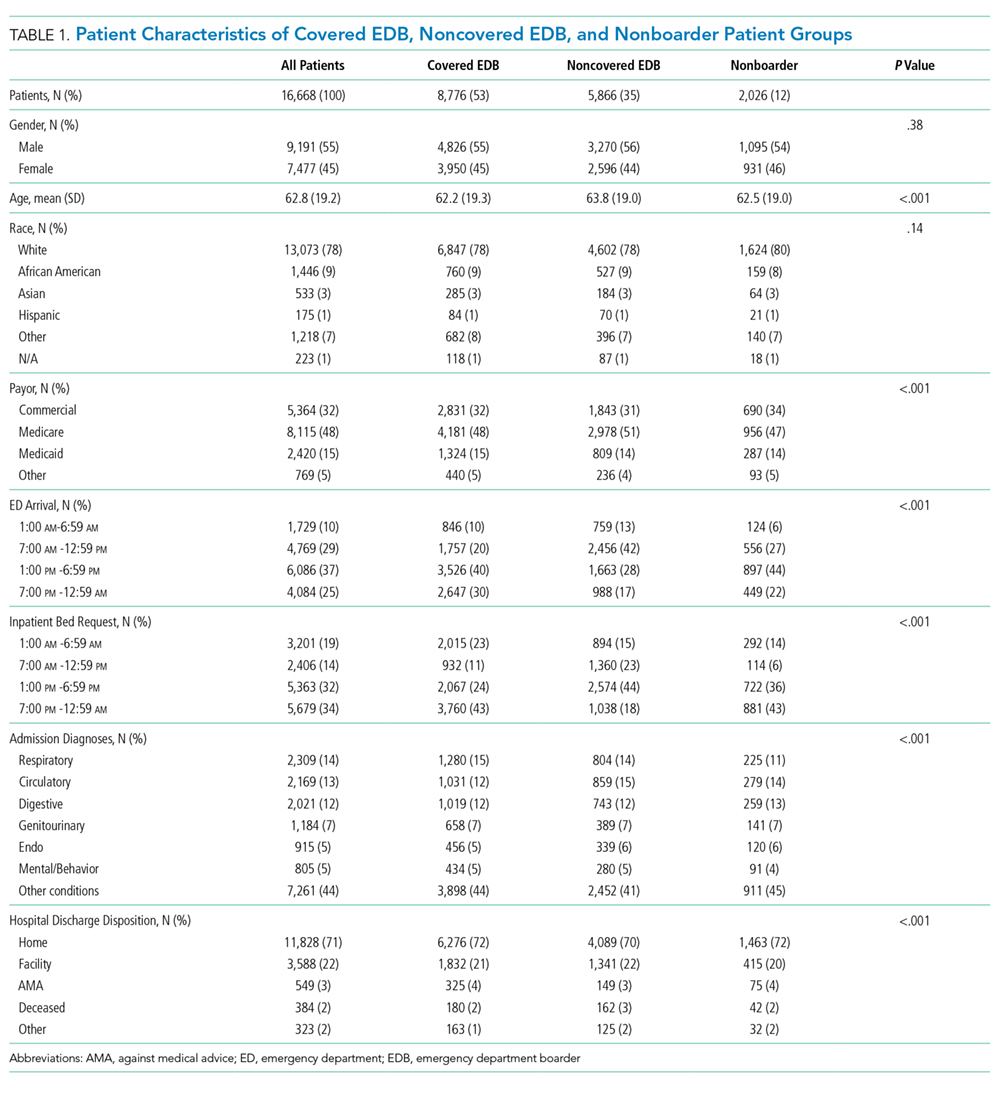
Hospital Length of Stay
Nonboarders had the shortest median hospital LOS (4.76; interquartile range [IQR] 2.90-7.22 days). Covered EDB patients had a median hospital LOS that was 4.6 hours (0.19 day) shorter compared with noncovered EDB patients (4.92 [IQR 3.00-8.03] days vs 5.11 [IQR 3.16-8.34 days]; Table 2). The differences among the three groups were all significant in the univariate comparison (P < .001). Multivariable regression controlling for patient age, gender, race, academic year, and hour and day of the week at the time of becoming an EDB demonstrated that the difference in hospital LOS between covered and noncovered EDB patients remained significant (P < .001).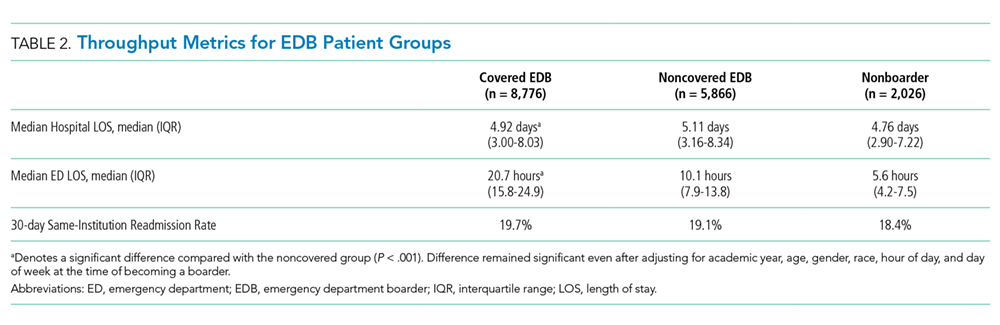
ED Length of Stay and 30-Day ED Readmission
Covered EDB patients had a longer median ED LOS compared with noncovered EDB patients and nonboarder patients (20.7 [IQR 15.8-24.9] hours vs 10.1 [IQR 7.9-13.8] hours vs 5.6 [IQR 4.2-7.5] hours, respectively, Table 2). These differences remained significant in the multivariable regression models (P < .001). Finally, the 30-day same-institution ED readmission rate was similar between covered and noncovered EDB patients.
DISCUSSION
We present two years of data describing a hospital medicine-led team designed to enhance the care of medical patients boarding in the ED. The period spent boarding in the ED is a vulnerable time for patients, and we created the EDB service with the goal of delivering inpatient medicine-led care to ED patients awaiting their inpatient bed.
When a bed request is made in an efficient ideal world, patients could be immediately transferred to an open inpatient bed to initiate care. In our study, patients who were not EDBs (ie, waited for less than two hours for their inpatient bed) had the most time-efficient care as they had the shortest ED and hospital LOS. However, nonboarders represented only 12% of patients and the majority of patients admitted to medicine were boarders. Patients covered by the EDB service had an overall hospital LOS that was 4.6 hours shorter compared with noncovered EDB patients despite having an ED LOS that was 15.1 hours longer. These LOS differences were observed without any difference to 30-day ED readmission rates.
Given that not all boarding patients were cared by the EDB service, the role of selection bias in our study warrants discussion. Similar to other studies, ED LOS for our patient cohort is heavily influenced by the availability of inpatient beds.10-12 The EDB service handed off patients they were covering as soon as an inpatient bed became available. Although there was discretion from the EDB charge nurse and the EDB physician about which patient to accept, this was primarily focused on choosing patients who did not have a pending inpatient bed (eg, a patient who was assigned a bed but was awaiting room cleaning). Importantly, there was no change in the bed assignment process as a part of the intervention. Our intervention’s design did not allow for elucidation of causation; however, we believe that the longer ED LOS for covered EDB patients compared with noncovered EDB patients reflects the fact that the team chose patients with a higher expected ED LOS rather than that the patients had a longer LOS due to being cared by the service. Consistent with this, patients covered by the EDB service tended to have bed requests placed during the night shift compared with noncovered EDB patients; patients with bed requests at night are more likely to wait longer for their inpatient bed given that inpatient beds are generally freed up in the afternoon. We acknowledge that it is impossible to completely rule out the possibility that patient factors (eg, infectious precautions) influence inpatient bed wait time and could be another factor influencing the probability of EDB service coverage.
The current study adds to the expanding literature on EDB care models. Briones et al. demonstrated that an “ED hospitalist” led to increased care delivery as measured by an increased follow-up on laboratory results and medication orders.23 However, their study was not structured to demonstrate LOS changes.23 In another study, Chadaga et al. reported about their experience with a hospital medicine team providing care for EDB patients, similar to our study.8 Their hospital medicine team consisted of a hospitalist and APP deployed in the ED during the day, with night coverage provided by existing ED clinicians. They demonstrated less ED diversion, more ED discharges, and positive perceptions among the ED team.8 However, there was no impact on ED or hospital LOS, although their results may have been limited by the short duration of postintervention data and the lack of nighttime coverage.8 Finally, a modeling study demonstrated a reduction in ED LOS by adding ED clinicians only for patients being discharged from the ED and not for those being admitted, although there was no explicit adjustment for LOS accounting for initiation of inpatient care in the ED.15 Extending the current literature, our study suggests that a hospitalist team providing continuous coverage to a large portion of EDB patients could shorten the overall hospital LOS for boarding patients, but even this was not enough to reduce LOS to the same level as that of patients who did not board.
Practically, there were challenges to creating the EDB service described in our study. Additional clinical staff (physician, APP, and nursing) were hired for the team, requiring a financial commitment from the institution. The new team required space within the ED footprint incurring construction costs. Before the existence of the EDB service, other ancillary services (eg, physical therapy) were unaccustomed to seeing ED patients, and thus new workflows were created. Another challenge was that internal medicine clinicians were not used to caring for patients for short durations of time before passing off clinical care to another team. This required a different approach, focusing on acute issues rather than conducting an exhaustive evaluation. Finally, the EDB service workflow introduced an additional handoff, increasing discontinuity of care. These challenges are factors to consider for institutions considering a similar EDB team and should be weighed against other interventions to alleviate ED boarding or improve throughput such as expanding inpatient capacity.
Ideal metrics to track the coverage and performance of an EDB service such as the one described in this study are undefined. It was difficult to know whether the goal should be complete coverage given the increase in handoffs, particularly for patients with short boarding times. This EDB service covered 59.9% of boarding patients and 62.9% of total boarding hours. Factors that contributed to covering less than 100% included physician staffing that was insufficient to meet demand and discretion to not accept patients expected to quickly get an inpatient bed. Therefore, the percentage of patients and boarding hours covered are crude metrics and further investigation is needed to develop optimal metrics for an EDB team.
Future studies on care models for EDB patients are warranted. Recognizing that EDB teams require additional resources, studies to define which patients receive the most benefit from EDB coverage will be helpful. Moreover, the EDB team composition may need to adapt to different environments (eg, academic, urban, nonacademic, rural). Diving deeper to study whether specific patient populations benefit more than others from care by the EDB service, as measured by hospital LOS or other outcomes, would be important. Clinical outcomes, in addition to throughput metrics such as LOS, must be analyzed to understand whether factors such as increased handoffs outweigh any benefits in throughput.
There were several limitations to this study. First, it was performed at a single academic institution, potentially limiting its generalizability. However, although some workflows and team coverage structures may be institution-specific, the concept of a hospital medicine-led EDB team providing earlier inpatient care can be adapted locally and may probably achieve similar benefits. Our study population included only patients destined for general medical admission; thus, it is uncertain whether the gains demonstrated in our study would be realized for patients boarding for nonmedical services. In addition, considering the observational nature of this study, it is difficult to prove the causation that a hospitalist EDB service solely led to reductions in hospital LOS. Finally, we did not adjust for nor measure whether ED clinicians provided different care to patients whom they felt were destined for the EDB service.
In summary, nonboarder patients had the shortest overall LOS; however, among those patients who boarded, coverage by a hospitalist-led team was associated with a shorter LOS. Given the limited inpatient capacity, eliminating ED boarding is often not possible. We present a model to expedite inpatient care and allow ED clinicians to focus on newly arriving ED patients. Additional studies are required to better understand how to optimally care for patients boarding in the ED.
1. Asplin BR, Magid DJ, Rhodes KV, Solberg LI, Lurie N, Camargo CA, Jr. A conceptual model of emergency department crowding. Ann Emerg Med. 2003;42(2):173-180. https://doi.org/10.1067/mem.2003.302.
2. Trzeciak S, Rivers EP. Emergency department overcrowding in the United States: an emerging threat to patient safety and public health. Emerg Med J. 2003;20(5):402-405. https://doi.org/10.1136/emj.20.5.402.
3. Olshaker JS. Managing emergency department overcrowding. Emerg Med Clin North Am. 2009;27(4):593-603. https://doi.org/10.1016/jemc.2009.07.004.
4. Richardson LD, Asplin BR, Lowe RA. Emergency department crowding as a health policy issue: past development, future directions. Ann Emerg Med. 2002;40(4):388-393. https://doi.org/10.1067/mem.2002.128012.
5. Bernstein SL, Aronsky D, Duseja R, et al. The effect of emergency department crowding on clinically oriented outcomes. Acad Emerg Med. 2009;16(1):1-10. https://doi.org/10.1111/j.1553-2712.2008.00295.x.
6. Singer AJ, Thode HC, Jr., Viccellio P, Pines JM. The association between length of emergency department boarding and mortality. Acad Emerg Med. 2011;18(12):1324-1329. https://doi.org/10.1111/j.1553-2712.2011.01236.x.
7. Silvester KM, Mohammed MA, Harriman P, Girolami A, Downes TW. Timely care for frail older people referred to hospital improves efficiency and reduces mortality without the need for extra resources. Age Ageing. 2014;43(4):472-477. https://doi.org/10.1093/ageing/aft170.
8. Chadaga SR, Shockley L, Keniston A, et al. Hospitalist-led medicine emergency department team: associations with throughput, timeliness of patient care, and satisfaction. J Hosp Med. 2012;7(7):562-566. https://doi.org/10.1002/jhm.1957.
9. Lucas R, Farley H, Twanmoh J, Urumov A, Evans B, Olsen N. Measuring the opportunity loss of time spent boarding admitted patients in the emergency department: a multihospital analysis. J Healthc Manag. 2009;54(2):117-124; discussion 124-115. https://doi.org/10.1097/00115514-200903000-00009.
10. Forster AJ, Stiell I, Wells G, Lee AJ, van Walraven C. The effect of hospital occupancy on emergency department length of stay and patient disposition. Acad Emerg Med. 2003;10(2):127-133. https://doi.org/10.1111/j.1553-2712.2003.tb00029.x.
11. Hoot NR, Aronsky D. Systematic review of emergency department crowding: causes, effects, and solutions. Ann Emerg Med. 2008;52(2):126-136. https://doi.org/10.1016/j.annemergmed.2008.03.014.
12. Asaro PV, Lewis LM, Boxerman SB. The impact of input and output factors on emergency department throughput. Acad Emerg Med. 2007;14(3):235-242. https://doi.org/10.1197/j.aem.2006.10.104.
13. Khare RK, Powell ES, Reinhardt G, Lucenti M. Adding more beds to the emergency department or reducing admitted patient boarding times: which has a more significant influence on emergency department congestion? Ann Emerg Med. 2009;53(5):575-585. https://doi.org/10.1016/j.annemergmed.2008.07.009.
14. Wertheimer B, Jacobs RE, Bailey M, et al. Discharge before noon: an achievable hospital goal. J Hosp Med. 2014;9(4):210-214. https://doi.org/10.1002/jhm.2154.
15. Paul JA, Lin L. Models for improving patient throughput and waiting at hospital emergency departments. J Emerg Med. 2012;43(6):1119-1126. https://doi.org/10.1016/j.jemermed.2012.01.063.
16. Wertheimer B, Jacobs RE, Iturrate E, Bailey M, Hochman K. Discharge before noon: effect on throughput and sustainability. J Hosp Med. 2015;10(10):664-669. https://doi.org/10.1002/jhm.2412.
17. Khanna S, Sier D, Boyle J, Zeitz K. Discharge timeliness and its impact on hospital crowding and emergency department flow performance. Emerg Med Australas. 2016;28(2):164-170. https://doi.org/10.1111/1742-6723.12543.
18. Patel H, Morduchowicz S, Mourad M. Using a systematic framework of interventions to improve early discharges. Jt Comm J Qual Patient Saf. 2017;43(4):189-196. https://doi.org/10.1016/j.jcjq.2016.12.003.
19. Powell ES, Khare RK, Venkatesh AK, Van Roo BD, Adams JG, Reinhardt G. The relationship between inpatient discharge timing and emergency department boarding. J Emerg Med. 2012;42(2):186-196. https://doi.org/10.1016/j.jemermed.2010.06.028.
20. Howell E, Bessman E, Kravet S, Kolodner K, Marshall R, Wright S. Active bed management by hospitalists and emergency department throughput. Ann Intern Med. 2008;149(11):804-811. https://doi.org/10.7326/0003-4819-149-11-200812020-00006.
21. Howell E, Bessman E, Marshall R, Wright S. Hospitalist bed management effecting throughput from the emergency department to the intensive care unit. J Crit Care. 2010;25(2):184-189. https://doi.org/10.1016/j.jcrc.2009.08.004.
22. Howell EE, Bessman ES, Rubin HR. Hospitalists and an innovative emergency department admission process. J Gen Intern Med. 2004;19(3):266-268. https://doi.org/10.1111/j.1525-1497.2004.30431.x.
23. Briones A, Markoff B, Kathuria N, et al. A model of a hospitalist role in the care of admitted patients in the emergency department. J Hosp Med. 2010;5(6):360-364. https://doi.org/10.1002/jhm.636.
24. Auerbach J. Reducing emergency department patient boarding and submitting code help policies to the Department of Public Health. In: Executive Office of Health and Human Services. Boston: Department of Public Health; 2010.
Emergency department (ED) crowding and boarding of patients awaiting admission to the hospital (ED boarding) are growing problems with important clinical care and public safety implications.1-4 Increased ED boarding times have been associated with lower patient satisfaction, inadequate care of critically ill patients, adverse events, and increased mortality.3,5-7 Furthermore, ED boarding can diminish the ED’s ability to evaluate new patients.5,8,9 ED boarding is more severe in hospitals with high inpatient occupancy with resultant disproportionate burden on large urban institutions.2,4,5,10
Earlier studies suggest, but have not consistently shown, an association between longer ED length of stay (LOS) and longer overall hospital LOS.5 This association implies that the additional time spent in the ED waiting for a bed does not meaningfully contribute to advancing the required inpatient care. Thus, this waiting time is “dead time” that is added to the overall hospital duration.
The complexity and the volume of medical patients boarding in the ED can challenge the resources of an already overtaxed ED staff. Potential solutions to mitigate ED boarding of medicine patients generally focus on reducing barriers to timely movement of patients from the ED to an inpatient unit.1,3,11-13 Ultimately, these barriers are a function of inadequate hospital capacity (eg, hospital beds, staffing) and are difficult to overcome. Two primary strategies have been used to reduce these barriers. One strategy focuses on shifting inpatient discharge times earlier to better match inpatient bed supply with ED demand.14-19 Another common strategy is utilizing inpatient attendings to triage and better match bed needs to bed availability.20-22
A separate area of interest, and the focus of this study, is the deployment of inpatient teams to hasten delivery of inpatient care to patients waiting in the ED.8,23 One institution implemented an “ED hospitalist” model.23 Another created a hospital medicine team to provide inpatient medical care to ED boarder patients and to lend clinical input to bed management.8
At our large, urban academic medical center, the Department of Medicine in collaboration with the Department of Emergency Medicine created a full-time hospital medicine team dedicated to providing care in the ED for patients awaiting admission to a general medicine unit. We present our multiyear experience with this ED-based hospital medicine team. We hypothesized that this new team would expedite inpatient care delivery to medical boarder patients, thereby reducing the overall hospital LOS.
METHODS
Study Setting and Design
This retrospective cross-sectional study, approved by the Institutional Review Board, was conducted at a 1,011-bed academic medical center in the northeast United States. The study period was July 1, 2016 through June 30, 2018, which was divided into Academic Year 16 (AY) (July 1, 2016 to June 30, 2017) and AY17 (July 1, 2017 to June 30, 2018).
The Hospital Medicine Unit (HMU) was a 60 full-time equivalent hospital medicine group consisting of 80 physicians and 25 advanced practice providers (APPs). During the study, the general medical services cared for an average of 260 patients per day on inpatient units with a wide variety of diagnoses and comorbidities. The ED had 48 monitored bed spaces for adult patients, as well as two dedicated ED observation units with 32 beds. The observation units are separate units within the hospital, staffed by ED clinicians, and were not included in this study. In 2016, the ED had a total of 110,741 patient visits and 13,908 patients were admitted to a medical service.
In 2010, the Department of Public Health for the state in which the medical center resides defined an ED boarder (EDB) patient as “a patient who remains in the ED two hours after the decision to admit.”24 According to this definition, any patient waiting for an inpatient bed for more than two hours after a bed request was considered as an EDB. Operationally, further distinctions were made between patients who were “eligible” for care by an internal medicine team in the ED versus those who were actually “covered”. Before the intervention outlined in the current study, some care was provided by resident and hospitalist teams to eligible EDB patients from 2010 to 2015, although this was limited in scope. From July 1, 2015 to June 30, 2016, there was no coverage of medicine EDB patients.
Intervention
ED Boarder Service Staffing
On July 1, 2016, the HMU deployed a dedicated full-time team of clinicians to care for boarding patients, which was known as the EDB service. The service was created with the goal of seeing a maximum of 25 patients over 24 hours.
Inpatient medicine attending physicians (hospitalists) and APPs worked on the EDB service. During the day (7
There was a dedicated nursing team for the EDB service. For AY16, there were two daytime EDB nurses and one night nurse, all with a coverage ratio of three to four patients per nurse. For AY17, there were four to five daytime nurses and two to three nighttime nurses with the same coverage ratio as that for AY16. EDB nurses received special training on caring for boarder patients and followed the usual inpatient nursing protocols and assessments. During each shift, an EDB charge nurse worked in conjunction with the hospitalist, bed management, and inpatient units to determine patients requiring coverage by the EDB team.
Patient Eligibility
Similar to the workflow before the intervention, the ED team was responsible for determining a patient’s need for admission to a medical service. Patients were eligible for EDB service coverage if they waited in the ED for more than two hours after the request for an inpatient bed was made. The EDB charge nurse was responsible for identifying all eligible boarder patients based on time elapsed since bed request. Patients were not eligible for the hospital medicine EDB service if they were in the ED observation units or were being admitted to the intensive care unit, cardiology service, oncology service, or any service outside of the Department of Medicine.
The EDB service did not automatically assume care of all eligible patients. Instead, eligible patients were accepted based on several factors including EDB clinician census, anticipated availability of an inpatient bed, and clinical appropriateness as deemed by the physician. If the EDB physician census was fewer than 10 patients and an eligible patient was not expected to move to an inpatient unit within the next hour, the patient was accepted by the EDB service. Patients who were not accepted by the EDB service remained under the care of the ED team until either the patient received an inpatient bed or space became available on the EDB service census. Eligible EDB patients who received an inpatient bed before being picked up by the EDB service were considered as noncovered EDB patients. Alternatively, an eligible patient may initially be declined from EDB service coverage due to, for example, a high census but later accepted when capacity allowed—this patient would be considered a covered EDB patient.
Handoff and Coordination
When an eligible patient was accepted onto the EDB service, clinical handoff between the ED and EDB teams occurred. The EDB physician wrote admission orders, including the inpatient admission order. Once on the EDB service, when space allowed, the patient was physically moved to a dedicated geographic space (8 beds) within the ED designed for the EDB service. When the dedicated EDB area was full, new patients would remain in their original patient bay and receive care from the EDB service. Multidisciplinary rounds with nursing, inpatient clinicians, and case management that normally occur every weekday on inpatient units were adapted to occur on the EDB service to discuss patient care needs. The duration of the patient’s stay in the ED, including the time on the EDB service, was dictated by bed availability rather than by clinical discretion of the EDB clinician. When an EDB patient was assigned a ready inpatient bed, the EDB clinician immediately passed off clinical care to the inpatient medical team. There was no change in the process of assigning patients to inpatient beds during the intervention period.
Study Population
This study included patients who were admitted to the general medical services through the ED during the defined period. We excluded medicine patients who did not pass through the ED (eg, direct admissions or outside transfer) as well as patients admitted to a specialty service (cardiology, oncology) or the intensive care unit. Patients admitted to a nonmedical service were also excluded.
Two hours following a bed request, an ED patient was designated as an eligible EDB patient. Operationally, and for the purposes of this study, patients were separated into three groups: (1) an eligible EDB patient for whom the EDB service assumed care for any portion of their ED stay was considered as a “covered ED boarder,” (2) an eligible EDB patient who did not have any coverage by the EDB service at any point during their ED stay was considered as a “noncovered boarder,” and (3) a patient who received an inpatient bed within two hours of bed request was considered as a “nonboarder”. Patients admitted to a specialty service, intensive care unit, or nonmedical services were not included in any of the abovementioned three groups.
We defined metrics to quantify the extent of EDB team coverage. First, the number of covered EDB patients was divided by all medicine boarders (covered + noncovered) to determine the percentage of medicine EDBs covered. Second, the total patient hours spent under the care of the EDB service was divided by the total boarding hours for all medicine boarders to determine the percentage of boarder hours covered.
Data Sources and Collection
The Electronic Health Record (EHR; Epic Systems Corporation, Verona, Wisconsin) captured whether patients were eligible EDBs. For covered EDB patients, the time when care was assumed by the EDB service was captured electronically. Patient demographics, admitting diagnoses, time stamps throughout the hospitalization, admission volumes, LOS, and discharge disposition were extracted from the EHR.
Primary and Secondary Outcome Measures
The primary outcome of this study was hospital LOS defined as the time from ED arrival to hospital departure (Figure). Secondary outcomes included ED LOS (time from ED arrival to ED departure) and the rate of 30-day ED readmission to the study institution.
Statistical Analysis
SAS version 9.4 (SAS Institute, Cary, North Carolina) was used for all statistical analyses. Continuous outcomes were compared using the Mann–Whitney test and dichotomized outcomes were compared using chi-square tests. We further analyzed the differences in the primary and secondary outcomes between covered and noncovered EDB groups using a multivariable regression analysis adjusting for age, gender, race, academic year, hour of the day, and day of the week at the time of becoming an EDB. We used quantile regression and linear regression with log-transformed continuous outcomes and logistic regression for the dichotomized outcome. A P value of .05 was used as a threshold for statistical significance.
RESULTS
Study Population and Demographics
There were a total of 16,668 patients admitted from the ED to the general medical services during the study period (Table 1). There were 8,776 (53%) patients in the covered EDB group, 5,866 (35%) patients in the noncovered EDB group, and 2,026 (12%) patients in the nonboarder group. There were more patients admitted during AY17 compared with AY16 (8,934 vs 7,734 patients, respectively, Appendix 1). Patient demographics, including age, gender, race, insurance coverage, admitting diagnoses, and discharge disposition, were similar among all three patient groups (Table 1). A majority of patients in the covered EDB and nonboarder groups presented to the ED in the afternoon, whereas noncovered EDB patients presented more in the morning (Table 1). Consistent with this pattern, inpatient bed requests for covered EDB and nonboarder patients were more frequent between 7
Hospital Length of Stay
Nonboarders had the shortest median hospital LOS (4.76; interquartile range [IQR] 2.90-7.22 days). Covered EDB patients had a median hospital LOS that was 4.6 hours (0.19 day) shorter compared with noncovered EDB patients (4.92 [IQR 3.00-8.03] days vs 5.11 [IQR 3.16-8.34 days]; Table 2). The differences among the three groups were all significant in the univariate comparison (P < .001). Multivariable regression controlling for patient age, gender, race, academic year, and hour and day of the week at the time of becoming an EDB demonstrated that the difference in hospital LOS between covered and noncovered EDB patients remained significant (P < .001).
ED Length of Stay and 30-Day ED Readmission
Covered EDB patients had a longer median ED LOS compared with noncovered EDB patients and nonboarder patients (20.7 [IQR 15.8-24.9] hours vs 10.1 [IQR 7.9-13.8] hours vs 5.6 [IQR 4.2-7.5] hours, respectively, Table 2). These differences remained significant in the multivariable regression models (P < .001). Finally, the 30-day same-institution ED readmission rate was similar between covered and noncovered EDB patients.
DISCUSSION
We present two years of data describing a hospital medicine-led team designed to enhance the care of medical patients boarding in the ED. The period spent boarding in the ED is a vulnerable time for patients, and we created the EDB service with the goal of delivering inpatient medicine-led care to ED patients awaiting their inpatient bed.
When a bed request is made in an efficient ideal world, patients could be immediately transferred to an open inpatient bed to initiate care. In our study, patients who were not EDBs (ie, waited for less than two hours for their inpatient bed) had the most time-efficient care as they had the shortest ED and hospital LOS. However, nonboarders represented only 12% of patients and the majority of patients admitted to medicine were boarders. Patients covered by the EDB service had an overall hospital LOS that was 4.6 hours shorter compared with noncovered EDB patients despite having an ED LOS that was 15.1 hours longer. These LOS differences were observed without any difference to 30-day ED readmission rates.
Given that not all boarding patients were cared by the EDB service, the role of selection bias in our study warrants discussion. Similar to other studies, ED LOS for our patient cohort is heavily influenced by the availability of inpatient beds.10-12 The EDB service handed off patients they were covering as soon as an inpatient bed became available. Although there was discretion from the EDB charge nurse and the EDB physician about which patient to accept, this was primarily focused on choosing patients who did not have a pending inpatient bed (eg, a patient who was assigned a bed but was awaiting room cleaning). Importantly, there was no change in the bed assignment process as a part of the intervention. Our intervention’s design did not allow for elucidation of causation; however, we believe that the longer ED LOS for covered EDB patients compared with noncovered EDB patients reflects the fact that the team chose patients with a higher expected ED LOS rather than that the patients had a longer LOS due to being cared by the service. Consistent with this, patients covered by the EDB service tended to have bed requests placed during the night shift compared with noncovered EDB patients; patients with bed requests at night are more likely to wait longer for their inpatient bed given that inpatient beds are generally freed up in the afternoon. We acknowledge that it is impossible to completely rule out the possibility that patient factors (eg, infectious precautions) influence inpatient bed wait time and could be another factor influencing the probability of EDB service coverage.
The current study adds to the expanding literature on EDB care models. Briones et al. demonstrated that an “ED hospitalist” led to increased care delivery as measured by an increased follow-up on laboratory results and medication orders.23 However, their study was not structured to demonstrate LOS changes.23 In another study, Chadaga et al. reported about their experience with a hospital medicine team providing care for EDB patients, similar to our study.8 Their hospital medicine team consisted of a hospitalist and APP deployed in the ED during the day, with night coverage provided by existing ED clinicians. They demonstrated less ED diversion, more ED discharges, and positive perceptions among the ED team.8 However, there was no impact on ED or hospital LOS, although their results may have been limited by the short duration of postintervention data and the lack of nighttime coverage.8 Finally, a modeling study demonstrated a reduction in ED LOS by adding ED clinicians only for patients being discharged from the ED and not for those being admitted, although there was no explicit adjustment for LOS accounting for initiation of inpatient care in the ED.15 Extending the current literature, our study suggests that a hospitalist team providing continuous coverage to a large portion of EDB patients could shorten the overall hospital LOS for boarding patients, but even this was not enough to reduce LOS to the same level as that of patients who did not board.
Practically, there were challenges to creating the EDB service described in our study. Additional clinical staff (physician, APP, and nursing) were hired for the team, requiring a financial commitment from the institution. The new team required space within the ED footprint incurring construction costs. Before the existence of the EDB service, other ancillary services (eg, physical therapy) were unaccustomed to seeing ED patients, and thus new workflows were created. Another challenge was that internal medicine clinicians were not used to caring for patients for short durations of time before passing off clinical care to another team. This required a different approach, focusing on acute issues rather than conducting an exhaustive evaluation. Finally, the EDB service workflow introduced an additional handoff, increasing discontinuity of care. These challenges are factors to consider for institutions considering a similar EDB team and should be weighed against other interventions to alleviate ED boarding or improve throughput such as expanding inpatient capacity.
Ideal metrics to track the coverage and performance of an EDB service such as the one described in this study are undefined. It was difficult to know whether the goal should be complete coverage given the increase in handoffs, particularly for patients with short boarding times. This EDB service covered 59.9% of boarding patients and 62.9% of total boarding hours. Factors that contributed to covering less than 100% included physician staffing that was insufficient to meet demand and discretion to not accept patients expected to quickly get an inpatient bed. Therefore, the percentage of patients and boarding hours covered are crude metrics and further investigation is needed to develop optimal metrics for an EDB team.
Future studies on care models for EDB patients are warranted. Recognizing that EDB teams require additional resources, studies to define which patients receive the most benefit from EDB coverage will be helpful. Moreover, the EDB team composition may need to adapt to different environments (eg, academic, urban, nonacademic, rural). Diving deeper to study whether specific patient populations benefit more than others from care by the EDB service, as measured by hospital LOS or other outcomes, would be important. Clinical outcomes, in addition to throughput metrics such as LOS, must be analyzed to understand whether factors such as increased handoffs outweigh any benefits in throughput.
There were several limitations to this study. First, it was performed at a single academic institution, potentially limiting its generalizability. However, although some workflows and team coverage structures may be institution-specific, the concept of a hospital medicine-led EDB team providing earlier inpatient care can be adapted locally and may probably achieve similar benefits. Our study population included only patients destined for general medical admission; thus, it is uncertain whether the gains demonstrated in our study would be realized for patients boarding for nonmedical services. In addition, considering the observational nature of this study, it is difficult to prove the causation that a hospitalist EDB service solely led to reductions in hospital LOS. Finally, we did not adjust for nor measure whether ED clinicians provided different care to patients whom they felt were destined for the EDB service.
In summary, nonboarder patients had the shortest overall LOS; however, among those patients who boarded, coverage by a hospitalist-led team was associated with a shorter LOS. Given the limited inpatient capacity, eliminating ED boarding is often not possible. We present a model to expedite inpatient care and allow ED clinicians to focus on newly arriving ED patients. Additional studies are required to better understand how to optimally care for patients boarding in the ED.
1. Asplin BR, Magid DJ, Rhodes KV, Solberg LI, Lurie N, Camargo CA, Jr. A conceptual model of emergency department crowding. Ann Emerg Med. 2003;42(2):173-180. https://doi.org/10.1067/mem.2003.302.
2. Trzeciak S, Rivers EP. Emergency department overcrowding in the United States: an emerging threat to patient safety and public health. Emerg Med J. 2003;20(5):402-405. https://doi.org/10.1136/emj.20.5.402.
3. Olshaker JS. Managing emergency department overcrowding. Emerg Med Clin North Am. 2009;27(4):593-603. https://doi.org/10.1016/jemc.2009.07.004.
4. Richardson LD, Asplin BR, Lowe RA. Emergency department crowding as a health policy issue: past development, future directions. Ann Emerg Med. 2002;40(4):388-393. https://doi.org/10.1067/mem.2002.128012.
5. Bernstein SL, Aronsky D, Duseja R, et al. The effect of emergency department crowding on clinically oriented outcomes. Acad Emerg Med. 2009;16(1):1-10. https://doi.org/10.1111/j.1553-2712.2008.00295.x.
6. Singer AJ, Thode HC, Jr., Viccellio P, Pines JM. The association between length of emergency department boarding and mortality. Acad Emerg Med. 2011;18(12):1324-1329. https://doi.org/10.1111/j.1553-2712.2011.01236.x.
7. Silvester KM, Mohammed MA, Harriman P, Girolami A, Downes TW. Timely care for frail older people referred to hospital improves efficiency and reduces mortality without the need for extra resources. Age Ageing. 2014;43(4):472-477. https://doi.org/10.1093/ageing/aft170.
8. Chadaga SR, Shockley L, Keniston A, et al. Hospitalist-led medicine emergency department team: associations with throughput, timeliness of patient care, and satisfaction. J Hosp Med. 2012;7(7):562-566. https://doi.org/10.1002/jhm.1957.
9. Lucas R, Farley H, Twanmoh J, Urumov A, Evans B, Olsen N. Measuring the opportunity loss of time spent boarding admitted patients in the emergency department: a multihospital analysis. J Healthc Manag. 2009;54(2):117-124; discussion 124-115. https://doi.org/10.1097/00115514-200903000-00009.
10. Forster AJ, Stiell I, Wells G, Lee AJ, van Walraven C. The effect of hospital occupancy on emergency department length of stay and patient disposition. Acad Emerg Med. 2003;10(2):127-133. https://doi.org/10.1111/j.1553-2712.2003.tb00029.x.
11. Hoot NR, Aronsky D. Systematic review of emergency department crowding: causes, effects, and solutions. Ann Emerg Med. 2008;52(2):126-136. https://doi.org/10.1016/j.annemergmed.2008.03.014.
12. Asaro PV, Lewis LM, Boxerman SB. The impact of input and output factors on emergency department throughput. Acad Emerg Med. 2007;14(3):235-242. https://doi.org/10.1197/j.aem.2006.10.104.
13. Khare RK, Powell ES, Reinhardt G, Lucenti M. Adding more beds to the emergency department or reducing admitted patient boarding times: which has a more significant influence on emergency department congestion? Ann Emerg Med. 2009;53(5):575-585. https://doi.org/10.1016/j.annemergmed.2008.07.009.
14. Wertheimer B, Jacobs RE, Bailey M, et al. Discharge before noon: an achievable hospital goal. J Hosp Med. 2014;9(4):210-214. https://doi.org/10.1002/jhm.2154.
15. Paul JA, Lin L. Models for improving patient throughput and waiting at hospital emergency departments. J Emerg Med. 2012;43(6):1119-1126. https://doi.org/10.1016/j.jemermed.2012.01.063.
16. Wertheimer B, Jacobs RE, Iturrate E, Bailey M, Hochman K. Discharge before noon: effect on throughput and sustainability. J Hosp Med. 2015;10(10):664-669. https://doi.org/10.1002/jhm.2412.
17. Khanna S, Sier D, Boyle J, Zeitz K. Discharge timeliness and its impact on hospital crowding and emergency department flow performance. Emerg Med Australas. 2016;28(2):164-170. https://doi.org/10.1111/1742-6723.12543.
18. Patel H, Morduchowicz S, Mourad M. Using a systematic framework of interventions to improve early discharges. Jt Comm J Qual Patient Saf. 2017;43(4):189-196. https://doi.org/10.1016/j.jcjq.2016.12.003.
19. Powell ES, Khare RK, Venkatesh AK, Van Roo BD, Adams JG, Reinhardt G. The relationship between inpatient discharge timing and emergency department boarding. J Emerg Med. 2012;42(2):186-196. https://doi.org/10.1016/j.jemermed.2010.06.028.
20. Howell E, Bessman E, Kravet S, Kolodner K, Marshall R, Wright S. Active bed management by hospitalists and emergency department throughput. Ann Intern Med. 2008;149(11):804-811. https://doi.org/10.7326/0003-4819-149-11-200812020-00006.
21. Howell E, Bessman E, Marshall R, Wright S. Hospitalist bed management effecting throughput from the emergency department to the intensive care unit. J Crit Care. 2010;25(2):184-189. https://doi.org/10.1016/j.jcrc.2009.08.004.
22. Howell EE, Bessman ES, Rubin HR. Hospitalists and an innovative emergency department admission process. J Gen Intern Med. 2004;19(3):266-268. https://doi.org/10.1111/j.1525-1497.2004.30431.x.
23. Briones A, Markoff B, Kathuria N, et al. A model of a hospitalist role in the care of admitted patients in the emergency department. J Hosp Med. 2010;5(6):360-364. https://doi.org/10.1002/jhm.636.
24. Auerbach J. Reducing emergency department patient boarding and submitting code help policies to the Department of Public Health. In: Executive Office of Health and Human Services. Boston: Department of Public Health; 2010.
© 2020 Society of Hospital Medicine
Antibiotics for Aspiration Pneumonia in Neurologically Impaired Children
Neurologic impairment (NI) encompasses static and progressive diseases of the central and/or peripheral nervous systems that result in functional and intellectual impairments.1 While a variety of neurologic diseases are responsible for NI (eg, hypoxic-ischemic encephalopathy, muscular dystrophy), consequences of these diseases extend beyond neurologic manifestations.1 These children are at an increased risk for aspiration of oral and gastric contents given their common comorbidities of dysphagia, gastroesophageal reflux, impaired cough, and respiratory muscle weakness.2 While aspiration may manifest as a self-resolving pneumonitis, the presence of oral or enteric bacteria in aspirated material may result in the development of bacterial pneumonia. Children with NI hospitalized with aspiration pneumonia have higher complication rates, longer and costlier hospitalizations, and higher readmission rates when compared with children with nonaspiration pneumonia.3
While pediatric aspiration pneumonia is commonly attributed to anaerobic bacteria, this is largely based on extrapolation from epidemiologic studies that were conducted in past decades.4-8 A single randomized controlled trial found that penicillin and clindamycin, antimicrobials with similar antimicrobial activity against anaerobes, to be equally effective.9 However, the recent literature emphasizes the polymicrobial nature of aspiration pneumonia in adults, with the common isolation of Gram-negative enteric bacteria.10 Further, while Pseudomonas aeruginosa is often identified in respiratory cultures from children with NI and chronic respiratory insufficiency,11,12 the significance of P. aeruginosa in lower airways remains unclear.
We designed this study to compare hospital outcomes associated with the most commonly prescribed empiric antimicrobial therapies for aspiration pneumonia in children with NI.
MATERIALS AND METHODS
Study Design and Data Source
This multicenter, retrospective cohort study used the Pediatric Health Information System (PHIS) database. PHIS, an administrative database of 50 not-for-profit tertiary care pediatric hospitals, contains data regarding patient demographics, diagnoses and procedures, and daily billed resource utilization, including laboratory and imaging studies. Data quality and reliability are assured through the Children’s Hospital Association (CHA; Lenexa, Kansas) and participating hospitals. Due to incomplete data through the study period and data quality issues, six hospitals were excluded.
STUDY POPULATION
Inclusion Criteria
Children 1-18 years of age who were discharged between July 1, 2007 and June 30, 2015 were included if they had a NI diagnosis,1 a principal diagnosis indicative of aspiration pneumonia (507.x),3,13,14 and received antibiotics in the first two calendar days of admission. NI was determined using previously defined International Classification of Diseases, Ninth Revision-Clinical Modification (ICD-9-CM) diagnosis codes.1 We only included children who received antibiotics in the first two calendar days of admission to minimize the likelihood of including children admitted for other reasons who acquired aspiration pneumonia after hospitalization. For children with multiple hospitalizations, one admission was randomly selected for inclusion to minimize weighting results toward repeat visits.
Exclusion Criteria
Children transferred from another hospital were excluded as records from their initial presentation, including treatment and outcomes, were not available. We also excluded children with tracheostomy15,16 or chronic ventilator dependence,17 those with a diagnosis of human immunodeficiency virus or tuberculosis, and children who received chemotherapy during hospitalization given expected differences in etiology, treatment, and outcomes.18
Exposure
The primary exposure was antibiotic therapy received in the first two days of admission. Antibiotics were classified by their antimicrobial spectra of activity as defined by The Sanford Guide to Antimicrobial Therapy19 against the most commonly recognized pathogens of aspiration pneumonia: anaerobes, Gram-negatives, and P. aeruginosa (Appendix Table 1).10,20 For example, penicillin G and clindamycin were among the antibiotics classified as providing anaerobic coverage alone, whereas ceftriaxone was classified as providing Gram-negative coverage alone and ampicillin-sulbactam or as combination therapy with clindamycin and ceftriaxone were classified as providing anaerobic and Gram-negative coverage. Piperacillin-tazobactam and meropenem were classified as providing anaerobic, Gram-negative, and P. aeruginosa coverage. We excluded antibiotics that do not provide coverage against anaerobes, Gram-negative, or P. aeruginosa (eg, ampicillin, azithromycin) or that provide coverage against Gram-negative and P. aeruginosa, but not anaerobes (eg, cefepime, tobramycin), as these therapies were prescribed for <5% of the cohort. We chose not to examine the coverage for Streptococcus pneumonia or Staphylococcus aureus as antibiotics included in this analysis covered these bacteria for 99.9% of our cohort.
OUTCOMES
Outcomes included acute respiratory failure during hospitalization, intensive care unit (ICU) transfer, and hospital length of stay (LOS). Acute respiratory failure during hospitalization was defined as the presence of Clinical Transaction Classification (CTC) or ICD-9 procedure code for noninvasive or invasive mechanical ventilation on day two or later of hospitalization, with or without the need for respiratory support on day 0 or day 1 (Appendix Table 2). Given the variability in hospital policies that may drive ICU admission criteria for complex patients, our outcome of ICU transfer was defined as the requirement for ICU level care on day two or later of hospitalization without ICU admission. Acute respiratory failure and ICU care occurring within the first two hospital days were not classified as outcomes because these early events likely reflect illness severity at presentation rather than outcomes attributable to treatment failure; these were included as markers of severity in the models.
Patient Demographics and Clinical Characteristics
Demographic and clinical characteristics that might influence antibiotic choice and/or hospital outcomes were assessed. Clinical characteristics included complex chronic conditions,21-23 medical technology assistance,24 performance of diagnostic testing, and markers of severe illness on presentation. Diagnostic testing included bacterial cultures (blood, respiratory, urine) and chest radiograph performance in the first two days of hospitalization. Results of diagnostic testing are not available in the PHIS. Illness severity on presentation included acute respiratory failure, pleural drainage, receipt of vasoactive agents, and transfusion of blood products in the first two days of hospitalization (Appendix Table 2).17,25,26
STASTICAL ANALYSIS
Continuous data were described with median and interquartile ranges (IQR) due to nonnormal distribution. Categorical data were described with frequencies and percentages. Patient demographics, clinical characteristics, and hospital outcomes were stratified by empiric antimicrobial coverage and compared using chi-square and Kruskal–Wallis tests as appropriate.
Generalized linear mixed-effects models with random hospital intercepts were derived to assess the independent effect of antimicrobial spectra of activity on outcomes of acute respiratory failure, ICU transfer, and LOS while adjusting for important differences in demographic and clinical characteristics. LOS had a nonnormal distribution. Thus, we used an exponential distribution. Covariates were chosen a priori given the clinical and biological relevance to exposure and outcomes—age, presence of complex chronic condition diagnoses, the number of complex chronic conditions, technology dependence, the performance of diagnostic tests on presentation, and illness severity on presentation. ICU admission was included as a covariate in acute respiratory failure and LOS outcome models. The results of the model for acute respiratory failure and ICU transfer are presented as adjusted odds ratios (OR) with a 95% CI. LOS results are presented as adjusted rate ratios (RR) with 95% CI.
All analyses were performed with SAS 9.3 (SAS Institute, Cary, North Carolina). P values <.05 were considered statistically significant. Cincinnati Children’s Hospital Medical Center Institutional Review Board considered this deidentified dataset study as not human subjects research.
RESULTS
Study Cohort
At the 44 hospitals included, 4,812 children with NI hospitalized with the diagnosis of aspiration pneumonia met the eligibility criteria. However, 79 received antibiotics with the spectra of activity not examined, leaving 4,733 children in our final analysis (Appendix Figure). Demographic and clinical characteristics of the study cohort are shown in Table 1. Median age was five years (interquartile range [IQR]: 2-11 years). Most subjects were male (53.9%), non-Hispanic white (47.9%), and publicly insured (63.6%). There was a slight variation in the distribution of admissions across seasons (spring 31.6%, summer 19.2%, fall 21.3%, and winter 27.9%). One-third of children had four or more comorbid CCCs (complex chronic conditions; 34.2%). The three most common nonneurologic CCC diagnosis categories were gastrointestinal (63.1%), congenital and/or genetic defects (36.9%), and respiratory (8.9%). Assistance with medical technologies was also common (82%)—particularly gastrointestinal (63.1%) and neurologic/neuromuscular (9.8%) technologies. The vast majority of children (92.5%) had either a chest radiograph (90.5%), respiratory viral study (33.7%), or respiratory culture (10.0%) obtained on presentation. A minority required noninvasive or invasive respiratory support (25.4%), vasoactive agents (8.9%), blood products (1.2%), or pleural drainage (0.3%) in the first two hospital days.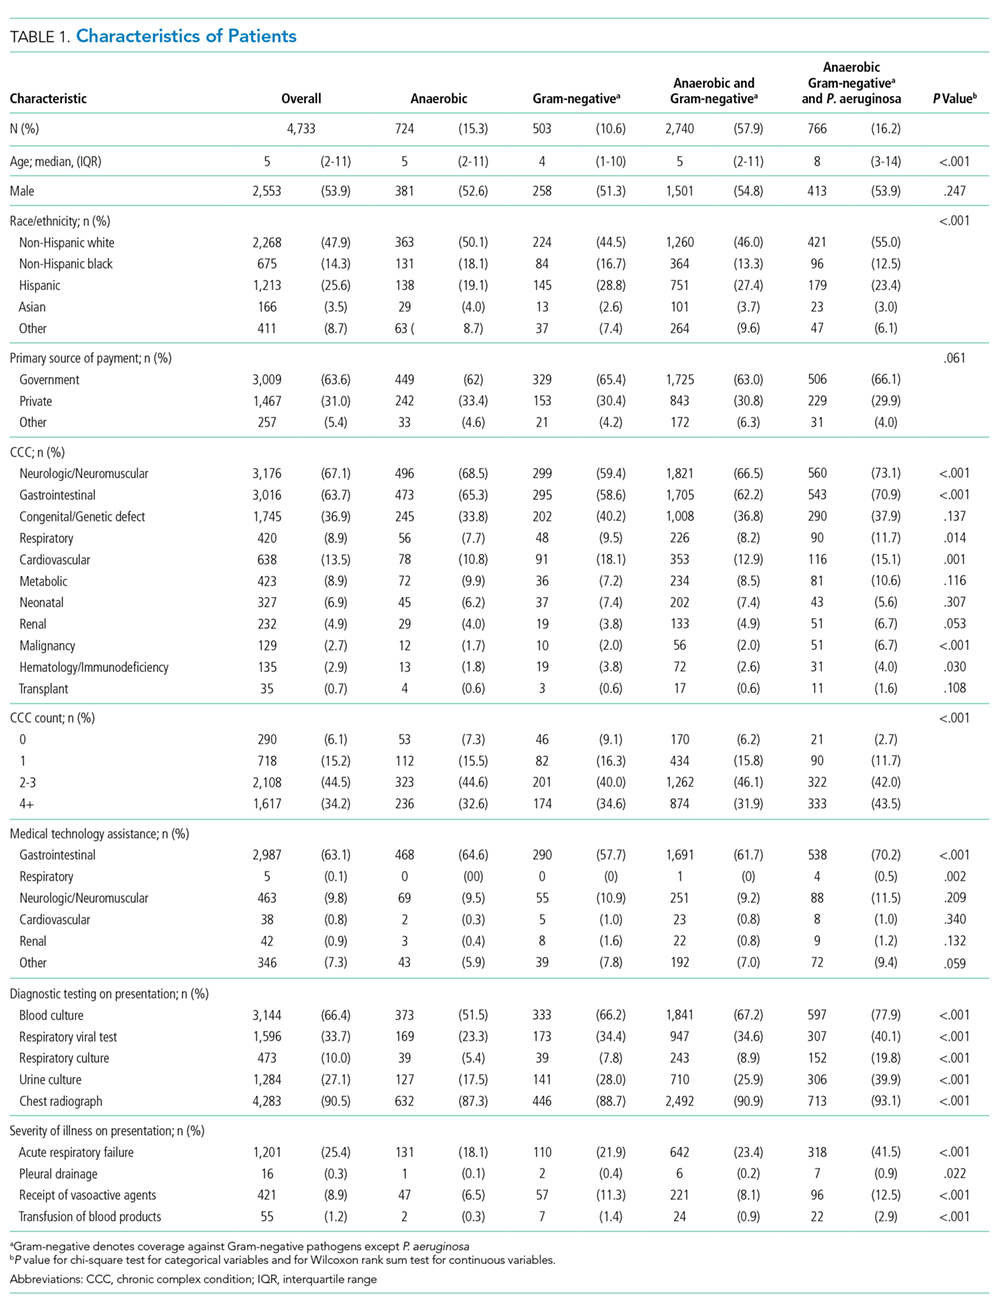
Spectrum of Antimicrobial Coverage
Most children (57.9%) received anaerobic and Gram-negative coverage; 16.2% received anaerobic, Gram-negative and P. aeruginosa coverage; 15.3% received anaerobic coverage alone; and 10.6% received Gram-negative coverage alone. Empiric antimicrobial coverage varied substantially across hospitals: anaerobic coverage was prescribed for 0%-44% of patients; Gram-negative coverage was prescribed for 3%-26% of patients; anaerobic and Gram-negative coverage was prescribed for 25%-90% of patients; and anaerobic, Gram-negative, and P. aeruginosa coverage was prescribed for 0%-65% of patients (Figure 1).
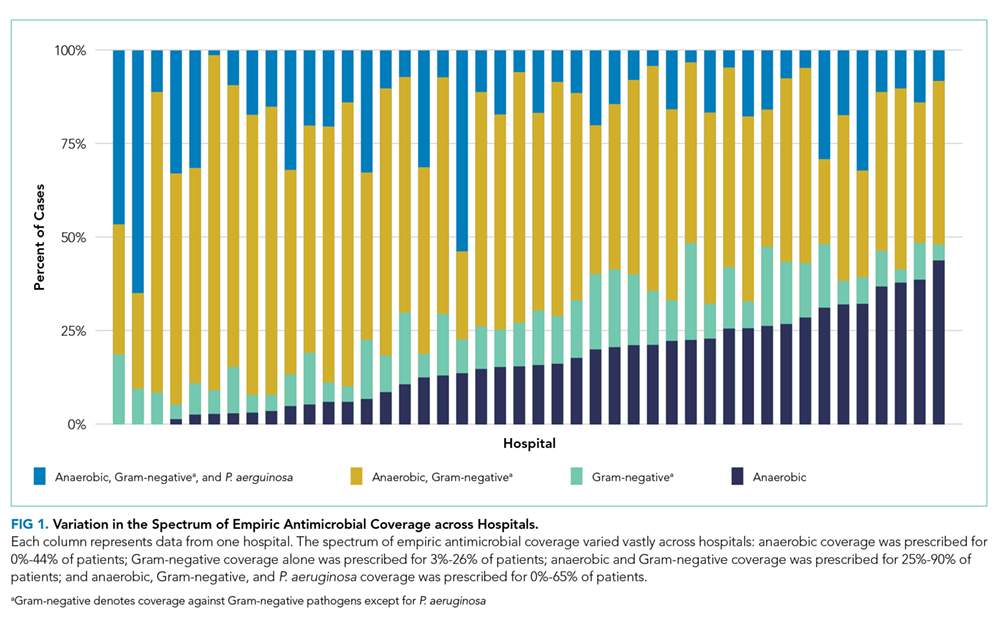
Outcomes
Acute Respiratory Failure
One-quarter (25.4%) of patients had acute respiratory failure on presentation; 22.5% required respiratory support (continued from presentation or were new) on day two or later of hospitalization (Table 2). In the adjusted analysis, children receiving Gram-negative coverage alone had two-fold greater odds (OR 2.15, 95% CI: 1.41-3.27) and children receiving anaerobic and Gram-negative coverage had 1.6-fold greater odds (OR 1.65, 95% CI: 1.19-2.28), of respiratory failure during hospitalization compared with those receiving anaerobic coverage alone (Figure 2). Odds of respiratory failure during hospitalization did not significantly differ for children receiving anaerobic, Gram-negative, and P. aeruginosa coverage compared with those receiving anaerobic coverage alone.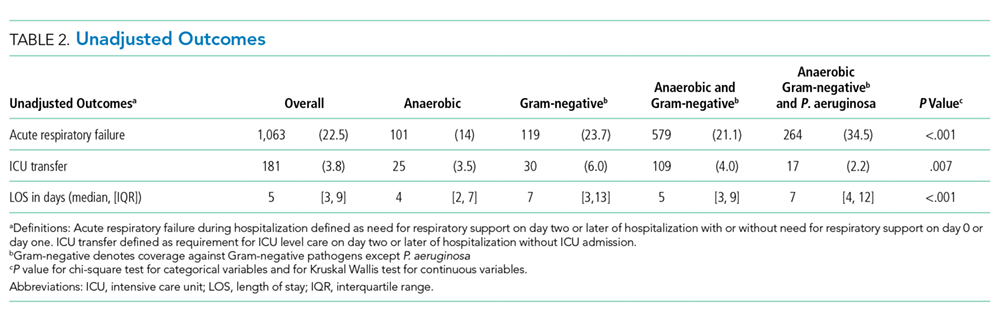
ICU Transfer
Nearly thirty percent (29.0%) of children required ICU admission, with an additional 3.8% requiring ICU transfer following admission (Table 2). In the multivariable analysis, the odds of an ICU transfer were greater for children receiving Gram-negative coverage alone (OR 1.80, 95% CI: 1.03-3.14) compared with those receiving anaerobic coverage alone. There was no statistical difference in ICU transfer for those receiving anaerobic and Gram-negative coverage (with or without P. aeruginosa coverage) compared with those receiving anaerobic coverage alone (Figure 2).
Length of Stay
Median hospital LOS for the total cohort was five days (IQR: 3-9 days; Table 2). In the multivariable analysis, children receiving Gram-negative coverage alone had a longer LOS (RR 1.28; 95% CI: 1.16-1.41) compared with those receiving anaerobic coverage alone, whereas children receiving anaerobic, Gram-negative, and P. aeruginosa coverage had a shorter LOS (RR 0.83; 95% CI: 0.76-0.90) than those receiving anaerobic coverage alone (Figure 2). There was no statistical difference in the LOS between children receiving anaerobic and Gram-negative coverage and those receiving anaerobic coverage alone.
DISCUSSION
In this multicenter study of children with NI hospitalized with aspiration pneumonia, we found substantial variation in empiric antimicrobial coverage for children with aspiration pneumonia. When comparing outcomes across groups, children who received anaerobic and Gram-negative coverage had outcomes similar to children who received anaerobic therapy alone. However, children who did not receive anaerobic coverage (ie, Gram-negative coverage alone) had worse outcomes, most notably a greater than two-fold increase in the odds of experiencing acute respiratory failure during hospitalization when compared with children receiving anaerobic therapy. These findings support prior literature that has highlighted the importance of anaerobic therapy in the treatment of aspiration pneumonia. The benefit of antibiotics targeting Gram-negative organisms, in addition to anaerobes, remains uncertain.
The variability in empiric antimicrobial coverage likely reflects the paucity of available information on oral and/or enteric bacteria required to identify them as causative organisms in aspiration pneumonia. In part, this problem is due to the difficulty in obtaining adequate sputum for culture from pediatric patients.27 While it may be more feasible to obtain tracheal aspirates for respiratory culture in children with a tracheostomy, interpretation of culture results remains challenging because the lower airways of children with tracheostomy are commonly colonized with bacterial pathogens.28 Thus, physicians are often left to choose empiric antimicrobial coverage with inadequate supporting evidence.29 Although the polymicrobial nature of aspiration pneumonia is well recognized in adult and pediatric literature,10,30 it is less clear which organisms are of pathological significance and require treatment.
The treatment standard for aspiration pneumonia has long included anaerobic therapy.29 The worse outcomes of children not receiving anaerobic therapy (ie, Gram-negative coverage alone) compared with children who received anaerobic therapy support the continued importance of anaerobic therapy in the treatment of aspiration pneumonia for hospitalized children with NI. The role of antibiotics covering Gram-negative organisms is less clear. Recent studies suggest the role of anaerobes is overemphasized in the etiology and treatment of aspiration pneumonia.10,29,31-38 Multiple studies on aspiration pneumonia bacteriology in hospitalized adults have demonstrated a predominance of Gram-negative organisms (ranging from 37%-71% of isolates identified on respiratory culture) and a relative scarcity of anaerobes (ranging from 0%-16% of isolates).31-37 A prospective study of 50 children hospitalized with clinical and radiographic evidence of pneumonia with known aspiration risk (eg, neuromuscular disease or dysphagia) found that ~80% of 163 bacterial isolates were Gram-negative.38 However, this study included repeat cultures from the same children, and thus, may overestimate the prevalence of Gram-negative organisms. In our study, children who received both anaerobic and Gram-negative therapy had no differences in ICU transfer or LOS but did experience higher odds of acute respiratory failure. As these results may be due to unmeasured confounding, future studies should further explore the necessity of Gram-negative coverage in addition to anaerobic coverage in this population.
While these recent studies may seem to suggest that anaerobic coverage is not necessary for aspiration pneumonia, there are important limitations worth noting. First, these studies used a variety of sampling techniques. While organisms grown from samples obtained via bronchoalveolar lavage31-34,36 are likely pathogenic, those grown from tracheal or oral samples obtained via percutaneous transtracheal aspiration,34 a protected specimen brush,34,36,37 or expectorated sputum35,38 may not represent lower airway organisms. Second, anaerobic cultures were not obtained in all studies.31,34,38 Anaerobic organisms are difficult to isolate using traditional clinical specimen collection techniques and aerobic culture media.18 Furthermore, anaerobes are not easily recovered from lung infections after the receipt of antibiotic therapy.39 Details regarding pretreatment, which are largely lacking from these studies, are necessary to interpret the relative scarcity of anaerobes on respiratory culture. Finally, caution should be taken when extrapolating the results of studies focused on the etiology and treatment of aspiration pneumonia in elderly adults to children. Our results, particularly in the context of the limitation of these more recent studies, suggest that the role of anaerobes has been underestimated.
Recent studies examining populations of children with cerebral palsy and/or tracheostomy have emphasized the high rates of carriage and infection rates with Gram-negative and drug-resistant bacteria; in particular, P. aeruginosa accounts for 50%-72% of pathogenic bacteria.11,12,38,40
Our multicenter observational study has several limitations. We used diagnosis codes to identify patients with aspiration pneumonia. As validated clinical criteria for the diagnosis of aspiration pneumonia do not exist, clinicians may assign a diagnosis of and treatment for aspiration pneumonia by subjective suspicion based on a child’s severe NI or illness severity on presentation leading to selection bias. Although administrative data are not able to verify pneumonia type with absolute certainty, we previously demonstrated that the differences in the outcomes of children with aspiration and nonaspiration pneumonia diagnosis codes persist after accounting for the complexity that might influence the diagnosis.3
Frthermore, we were unable to account for laboratory, microbiology, or radiology test results, and other management practices (eg, frequency of airway clearance, previous antimicrobial therapy) that may influence outcomes. Future studies should certainly include an examination of the concordance of the antibiotics prescribed with causative organisms, as this undoubtedly affects patient outcomes. Other outcomes are important to examine (eg, time to return to respiratory baseline), but we were unable to do so, given the lack of clinical detail in our database. We randomly selected a single hospitalization for children with multiple admissions; alternative methods could have different results. Although children with NI predominately use children’s hospitals,1 results may not be generalizable.
CONCLUSION
These findings support prior literature that has highlighted the important role anaerobic therapy plays in the treatment of aspiration pneumonia in children with NI. In light of the limitations of our study design, we believe that rigorous clinical trials comparing anaerobic with anaerobic and Gram-negative therapy are an important and necessary next step to determine the optimal treatment for aspiration pneumonia in this population.
Disclosures
The authors do not have any financial relationships relevant to this article to disclose.
Funding
Dr. Thomson was supported by the Agency for Healthcare Research and Quality (AHRQ) under award number K08HS025138. Dr. Ambroggio was supported by the National Institute for Allergy and Infectious Diseases (NIAID) under award number K01AI125413. The content is solely the responsibility of the authors and does not necessarily represent the official views of the AHRQ or NIAID.
1. Berry JG, Poduri A, Bonkowsky JL, et al. Trends in resource utilization by children with neurological impairment in the United States inpatient health care system: a repeat cross-sectional study. PLoS Med. 2012;9(1):e1001158. https://doi.org/10.1371/journal.pmed.1001158.
2. Seddon PC, Khan Y. Respiratory problems in children with neurological impairment. Arch Dis Child. 2003;88(1):75-78. https://doi.org/10.1136/adc.88.1.75.
3. Thomson J, Hall M, Ambroggio L, et al. Aspiration and non-aspiration pneumonia in hospitalized children with neurologic impairment. Pediatrics. 2016;137(2):e20151612. https://doi.org/10.1542/peds.2015-1612.
4. Brook I. Anaerobic pulmonary infections in children. Pediatr Emerg Care. 2004;20(9):636-640. https://doi.org/10.1097/01.pec.0000139751.63624.0b.
5. Bartlett JG, Gorbach SL. Treatment of aspiration pneumonia and primary lung abscess. Penicillin G vs clindamycin. JAMA. 1975;234(9):935-937. https://doi.org/10.1001/jamadermatol.2017.0297.
6. Bartlett JG, Gorbach SL, Finegold SM. The bacteriology of aspiration pneumonia. Am J Med. 1974;56(2):202-207. https://doi.org/10.1016/0002-9343(74)90598-1.
7. Lode H. Microbiological and clinical aspects of aspiration pneumonia. J Antimicrob Chemother. 1988;21:83-90. https://doi.org/10.1093/jac/21.suppl_c.83.
8. Brook I. Treatment of aspiration or tracheostomy-associated pneumonia in neurologically impaired children: effect of antimicrobials effective against anaerobic bacteria. Int J Pediatr Otorhinolaryngol. 1996;35(2):171-177. https://doi.org/10.1016/0165-5876(96)01332-8.
9. Jacobson SJ, Griffiths K, Diamond S, et al. A randomized controlled trial of penicillin vs clindamycin for the treatment of aspiration pneumonia in children. Arch Pediatr Adolesc Med. 1997;151(7):701-704. https://doi.org/10.1001/archpedi.1997.02170440063011.
10. DiBardino DM, Wunderink RG. Aspiration pneumonia: a review of modern trends. J Crit Care. 2015;30(1):40-48. https://doi.org/10.1016/j.jcrc.2014.07.011.
11. Gerdung CA, Tsang A, Yasseen AS, 3rd, Armstrong K, McMillan HJ, Kovesi T. Association between chronic aspiration and chronic airway infection with Pseudomonas aeruginosa and other Gram-negative bacteria in children with cerebral palsy. Lung. 2016;194(2):307-314. https://doi.org/10.1007/s00408-016-9856-5.
12. Thorburn K, Jardine M, Taylor N, Reilly N, Sarginson RE, van Saene HK. Antibiotic-resistant bacteria and infection in children with cerebral palsy requiring mechanical ventilation. Pedr Crit Care Med. 2009;10(2):222-226. https://doi.org/10.1097/PCC.0b013e31819368ac.
13. Lanspa MJ, Jones BE, Brown SM, Dean NC. Mortality, morbidity, and disease severity of patients with aspiration pneumonia. J Hosp Med. 2013;8(2):83-90. https://doi.org/10.1002/jhm.1996.
14. Lanspa MJ, Peyrani P, Wiemken T, Wilson EL, Ramirez JA, Dean NC. Characteristics associated with clinician diagnosis of aspiration pneumonia: a descriptive study of afflicted patients and their outcomes. J Hosp Med. 2015;10(2):90-96. https://doi.org/10.1002/jhm.2280.
15. Berry JG, Graham RJ, Roberson DW, et al. Patient characteristics associated with in-hospital mortality in children following tracheotomy. Arch Dis Child. 2010;95(9):703-710.
16. Berry JG, Graham DA, Graham RJ, et al. Predictors of clinical outcomes and hospital resource use of children after tracheotomy. Pediatrics. 2009;124(2):563-572. https://doi.org/10.1136/adc.2009.180836.
17. Balamuth F, Weiss SL, Hall M, et al. Identifying pediatric severe sepsis and septic shock: Accuracy of diagnosis codes. J Pediatr. 2015;167(6):1295-1300 e1294. https://doi.org/10.1016/j.jpeds.2015.09.027.
18. American Academy of Pediatrics., Pickering LK, American Academy of Pediatrics. Committee on Infectious Diseases. In: Red book : 2012 report of the Committee on Infectious Diseases. 29th ed. Elk Grove Village: American Academy of Pediatrics; 2012.
19. Gilbert DN. The Sanford Guide to Antimicrobial Therapy 2014. 44th ed. Sperryville: Antimicrobial Therapy, Inc; 2011.
20. Marik PE. Aspiration pneumonitis and aspiration pneumonia. N Engl J Med. 2001;344(9):665-671. https://doi.org/10.1056/NEJM200103013440908.
21. Feudtner C, Feinstein JA, Zhong W, Hall M, Dai D. Pediatric complex chronic conditions classification system version 2: updated for ICD-10 and complex medical technology dependence and transplantation. BMC Pediatrics. 2014;14:199. https://doi.org/10.1186/1471-2431-14-199.
22. Feudtner C, Hays RM, Haynes G, Geyer JR, Neff JM, Koepsell TD. Deaths attributed to pediatric complex chronic conditions: national trends and implications for supportive care services. Pediatrics. 2001;107(6):E99. https://doi.org/10.1542/peds.107.6.e99.
23. Feinstein JA, Russell S, DeWitt PE, Feudtner C, Dai D, Bennett TD. R package for pediatric complex chronic condition classification. JAMA Pediatr. 2018;172(6):596-598. https://doi.org/10.1001/jamapediatrics.2018.0256.
24. Berry JG, Hall DE, Kuo DZ, Cohen E, Agrawal R, Feudtner C, Hall M, Kueser J, Kaplan W, Neff J. Hospital utilization and characteristics of patients experiencing recurrent readmissions within children’s hospitals. JAMA. 2011;305(7):682-690. https://doi.org/10.1001/jama.2011.122.
25. Shah SS, Hall M, Newland JG, et al. Comparative effectiveness of pleural drainage procedures for the treatment of complicated pneumonia in childhood. J Hosp Med. 2011;6(5):256-263. https://doi.org/10.1002/jhm.872.
26. Child Health Corporation of America. CTC™ 2010 Code Structure: Module 5 Clinical Services. 2010 January 4; Available at https://sharepoint.chca.com/CHCAForums/PerformanceImprovement/PHIS/Reference Library/CTC Resources/Forms/AllItems.aspx Version: Modified.
27. Bradley JS, Byington CL, Shah SS, et al. The management of community-acquired pneumonia in infants and children older than 3 months of age: clinical practice guidelines by the Pediatric Infectious Diseases Society and the Infectious Diseases Society of America. Clin Infect Dis. 2011;53(7):e25-76. https://doi.org/10.1093/cid/cir531.
28. Brook I. Bacterial colonization, tracheobronchitis, and pneumonia following tracheostomy and long-term intubation in pediatric patients. Chest. 1979;76(4):420-424.
29. Waybright RA, Coolidge W, Johnson TJ. Treatment of clinical aspiration: a reappraisal. Am J Health Syst Pharm. 2013;70(15):1291-1300. https://doi.org/10.2146/ajhp120319.
30. Brook I, Finegold SM. Bacteriology of aspiration pneumonia in children. Pediatrics. 1980;65(6):1115-1120.
31. Wei C, Cheng Z, Zhang L, Yang J. Microbiology and prognostic factors of hospital- and community-acquired aspiration pneumonia in respiratory intensive care unit. Am J Infect Control. 2013;41(10):880-884. https://doi.org/10.1016/j.ajic.2013.01.007.
32. El-Solh AA, Pietrantoni C, Bhat A, et al. Microbiology of severe aspiration pneumonia in institutionalized elderly. Am J Respir Crit Care Med. 2003;167(12):1650-1654. https://doi.org/10.1164/rccm.200212-1543OC.
33. Tokuyasu H, Harada T, Watanabe E, et al. Effectiveness of meropenem for the treatment of aspiration pneumonia in elderly patients. Intern Med. 2009;48(3):129-135. https://doi.org/10.2169/internalmedicine.48.1308.
34. Ott SR, Allewelt M, Lorenz J, Reimnitz P, Lode H, German Lung Abscess Study Group. Moxifloxacin vs ampicillin/sulbactam in aspiration pneumonia and primary lung abscess. Infection. 2008;36(1):23-30. https://doi.org/10.1007/s15010-007-7043-6.
35. Kadowaki M, Demura Y, Mizuno S, et al. Reappraisal of clindamycin IV monotherapy for treatment of mild-to-moderate aspiration pneumonia in elderly patients. Chest. 2005;127(4):1276-1282. https://doi.org/10.1016/j.chest.2017.05.019.
36. Marik PE, Careau P. The role of anaerobes in patients with ventilator-associated pneumonia and aspiration pneumonia: a prospective study. Chest. 1999;115(1):178-183. https://doi.org/10.1378/chest.115.1.178.
37. Mier L, Dreyfuss D, Darchy B, et al. Is penicillin G an adequate initial treatment for aspiration pneumonia? A prospective evaluation using a protected specimen brush and quantitative cultures. Intensive Care Med. 1993;19(5):279-284. https://doi.org/10.1007/bf01690548.
38. Ashkenazi-Hoffnung L, Ari A, Bilavsky E, Scheuerman O, Amir J, Prais D. Pseudomonas aeruginosa identified as a key pathogen in hospitalised children with aspiration pneumonia and a high aspiration risk. Acta Paediatr. 2016;105(12):e588-e592. https://doi.org/10.1111/apa.13523.
39. Bartlett JG, Gorbach SL, Tally FP, Finegold SM. Bacteriology and treatment of primary lung abscess. Am Rev Respir Dis. 1974;109(5):510-518. https://doi.org/10.1164/arrd.1974.109.5.510.
40. Russell CJ, Simon TD, Mamey MR, Newth CJL, Neely MN. Pseudomonas aeruginosa and post-tracheotomy bacterial respiratory tract infection readmissions. Pediatr Pulmonol. 2017;52(9):1212-1218. https://doi.org/10.1002/ppul.23716.
41. Russell CJ, Mamey MR, Koh JY, Schrager SM, Neely MN, Wu S. Length of stay and hospital revisit after bacterial tracheostomy-associated respiratory tract infection hospitalizations. Hosp Pediatr. Hosp Pediatr. 2018;8(2):72-80. https://doi.org/10.1542/hpeds.2017-0106.
42. Russell CJ, Mack WJ, Schrager SM, Wu S. Care variations and outcomes for children hospitalized with bacterial tracheostomy-associated respiratory infections. Hosp Pediatr. 2017;7(1):16-23. https://doi.org/10.1542/hpeds.2016-0104.
Neurologic impairment (NI) encompasses static and progressive diseases of the central and/or peripheral nervous systems that result in functional and intellectual impairments.1 While a variety of neurologic diseases are responsible for NI (eg, hypoxic-ischemic encephalopathy, muscular dystrophy), consequences of these diseases extend beyond neurologic manifestations.1 These children are at an increased risk for aspiration of oral and gastric contents given their common comorbidities of dysphagia, gastroesophageal reflux, impaired cough, and respiratory muscle weakness.2 While aspiration may manifest as a self-resolving pneumonitis, the presence of oral or enteric bacteria in aspirated material may result in the development of bacterial pneumonia. Children with NI hospitalized with aspiration pneumonia have higher complication rates, longer and costlier hospitalizations, and higher readmission rates when compared with children with nonaspiration pneumonia.3
While pediatric aspiration pneumonia is commonly attributed to anaerobic bacteria, this is largely based on extrapolation from epidemiologic studies that were conducted in past decades.4-8 A single randomized controlled trial found that penicillin and clindamycin, antimicrobials with similar antimicrobial activity against anaerobes, to be equally effective.9 However, the recent literature emphasizes the polymicrobial nature of aspiration pneumonia in adults, with the common isolation of Gram-negative enteric bacteria.10 Further, while Pseudomonas aeruginosa is often identified in respiratory cultures from children with NI and chronic respiratory insufficiency,11,12 the significance of P. aeruginosa in lower airways remains unclear.
We designed this study to compare hospital outcomes associated with the most commonly prescribed empiric antimicrobial therapies for aspiration pneumonia in children with NI.
MATERIALS AND METHODS
Study Design and Data Source
This multicenter, retrospective cohort study used the Pediatric Health Information System (PHIS) database. PHIS, an administrative database of 50 not-for-profit tertiary care pediatric hospitals, contains data regarding patient demographics, diagnoses and procedures, and daily billed resource utilization, including laboratory and imaging studies. Data quality and reliability are assured through the Children’s Hospital Association (CHA; Lenexa, Kansas) and participating hospitals. Due to incomplete data through the study period and data quality issues, six hospitals were excluded.
STUDY POPULATION
Inclusion Criteria
Children 1-18 years of age who were discharged between July 1, 2007 and June 30, 2015 were included if they had a NI diagnosis,1 a principal diagnosis indicative of aspiration pneumonia (507.x),3,13,14 and received antibiotics in the first two calendar days of admission. NI was determined using previously defined International Classification of Diseases, Ninth Revision-Clinical Modification (ICD-9-CM) diagnosis codes.1 We only included children who received antibiotics in the first two calendar days of admission to minimize the likelihood of including children admitted for other reasons who acquired aspiration pneumonia after hospitalization. For children with multiple hospitalizations, one admission was randomly selected for inclusion to minimize weighting results toward repeat visits.
Exclusion Criteria
Children transferred from another hospital were excluded as records from their initial presentation, including treatment and outcomes, were not available. We also excluded children with tracheostomy15,16 or chronic ventilator dependence,17 those with a diagnosis of human immunodeficiency virus or tuberculosis, and children who received chemotherapy during hospitalization given expected differences in etiology, treatment, and outcomes.18
Exposure
The primary exposure was antibiotic therapy received in the first two days of admission. Antibiotics were classified by their antimicrobial spectra of activity as defined by The Sanford Guide to Antimicrobial Therapy19 against the most commonly recognized pathogens of aspiration pneumonia: anaerobes, Gram-negatives, and P. aeruginosa (Appendix Table 1).10,20 For example, penicillin G and clindamycin were among the antibiotics classified as providing anaerobic coverage alone, whereas ceftriaxone was classified as providing Gram-negative coverage alone and ampicillin-sulbactam or as combination therapy with clindamycin and ceftriaxone were classified as providing anaerobic and Gram-negative coverage. Piperacillin-tazobactam and meropenem were classified as providing anaerobic, Gram-negative, and P. aeruginosa coverage. We excluded antibiotics that do not provide coverage against anaerobes, Gram-negative, or P. aeruginosa (eg, ampicillin, azithromycin) or that provide coverage against Gram-negative and P. aeruginosa, but not anaerobes (eg, cefepime, tobramycin), as these therapies were prescribed for <5% of the cohort. We chose not to examine the coverage for Streptococcus pneumonia or Staphylococcus aureus as antibiotics included in this analysis covered these bacteria for 99.9% of our cohort.
OUTCOMES
Outcomes included acute respiratory failure during hospitalization, intensive care unit (ICU) transfer, and hospital length of stay (LOS). Acute respiratory failure during hospitalization was defined as the presence of Clinical Transaction Classification (CTC) or ICD-9 procedure code for noninvasive or invasive mechanical ventilation on day two or later of hospitalization, with or without the need for respiratory support on day 0 or day 1 (Appendix Table 2). Given the variability in hospital policies that may drive ICU admission criteria for complex patients, our outcome of ICU transfer was defined as the requirement for ICU level care on day two or later of hospitalization without ICU admission. Acute respiratory failure and ICU care occurring within the first two hospital days were not classified as outcomes because these early events likely reflect illness severity at presentation rather than outcomes attributable to treatment failure; these were included as markers of severity in the models.
Patient Demographics and Clinical Characteristics
Demographic and clinical characteristics that might influence antibiotic choice and/or hospital outcomes were assessed. Clinical characteristics included complex chronic conditions,21-23 medical technology assistance,24 performance of diagnostic testing, and markers of severe illness on presentation. Diagnostic testing included bacterial cultures (blood, respiratory, urine) and chest radiograph performance in the first two days of hospitalization. Results of diagnostic testing are not available in the PHIS. Illness severity on presentation included acute respiratory failure, pleural drainage, receipt of vasoactive agents, and transfusion of blood products in the first two days of hospitalization (Appendix Table 2).17,25,26
STASTICAL ANALYSIS
Continuous data were described with median and interquartile ranges (IQR) due to nonnormal distribution. Categorical data were described with frequencies and percentages. Patient demographics, clinical characteristics, and hospital outcomes were stratified by empiric antimicrobial coverage and compared using chi-square and Kruskal–Wallis tests as appropriate.
Generalized linear mixed-effects models with random hospital intercepts were derived to assess the independent effect of antimicrobial spectra of activity on outcomes of acute respiratory failure, ICU transfer, and LOS while adjusting for important differences in demographic and clinical characteristics. LOS had a nonnormal distribution. Thus, we used an exponential distribution. Covariates were chosen a priori given the clinical and biological relevance to exposure and outcomes—age, presence of complex chronic condition diagnoses, the number of complex chronic conditions, technology dependence, the performance of diagnostic tests on presentation, and illness severity on presentation. ICU admission was included as a covariate in acute respiratory failure and LOS outcome models. The results of the model for acute respiratory failure and ICU transfer are presented as adjusted odds ratios (OR) with a 95% CI. LOS results are presented as adjusted rate ratios (RR) with 95% CI.
All analyses were performed with SAS 9.3 (SAS Institute, Cary, North Carolina). P values <.05 were considered statistically significant. Cincinnati Children’s Hospital Medical Center Institutional Review Board considered this deidentified dataset study as not human subjects research.
RESULTS
Study Cohort
At the 44 hospitals included, 4,812 children with NI hospitalized with the diagnosis of aspiration pneumonia met the eligibility criteria. However, 79 received antibiotics with the spectra of activity not examined, leaving 4,733 children in our final analysis (Appendix Figure). Demographic and clinical characteristics of the study cohort are shown in Table 1. Median age was five years (interquartile range [IQR]: 2-11 years). Most subjects were male (53.9%), non-Hispanic white (47.9%), and publicly insured (63.6%). There was a slight variation in the distribution of admissions across seasons (spring 31.6%, summer 19.2%, fall 21.3%, and winter 27.9%). One-third of children had four or more comorbid CCCs (complex chronic conditions; 34.2%). The three most common nonneurologic CCC diagnosis categories were gastrointestinal (63.1%), congenital and/or genetic defects (36.9%), and respiratory (8.9%). Assistance with medical technologies was also common (82%)—particularly gastrointestinal (63.1%) and neurologic/neuromuscular (9.8%) technologies. The vast majority of children (92.5%) had either a chest radiograph (90.5%), respiratory viral study (33.7%), or respiratory culture (10.0%) obtained on presentation. A minority required noninvasive or invasive respiratory support (25.4%), vasoactive agents (8.9%), blood products (1.2%), or pleural drainage (0.3%) in the first two hospital days.
Spectrum of Antimicrobial Coverage
Most children (57.9%) received anaerobic and Gram-negative coverage; 16.2% received anaerobic, Gram-negative and P. aeruginosa coverage; 15.3% received anaerobic coverage alone; and 10.6% received Gram-negative coverage alone. Empiric antimicrobial coverage varied substantially across hospitals: anaerobic coverage was prescribed for 0%-44% of patients; Gram-negative coverage was prescribed for 3%-26% of patients; anaerobic and Gram-negative coverage was prescribed for 25%-90% of patients; and anaerobic, Gram-negative, and P. aeruginosa coverage was prescribed for 0%-65% of patients (Figure 1).
Outcomes
Acute Respiratory Failure
One-quarter (25.4%) of patients had acute respiratory failure on presentation; 22.5% required respiratory support (continued from presentation or were new) on day two or later of hospitalization (Table 2). In the adjusted analysis, children receiving Gram-negative coverage alone had two-fold greater odds (OR 2.15, 95% CI: 1.41-3.27) and children receiving anaerobic and Gram-negative coverage had 1.6-fold greater odds (OR 1.65, 95% CI: 1.19-2.28), of respiratory failure during hospitalization compared with those receiving anaerobic coverage alone (Figure 2). Odds of respiratory failure during hospitalization did not significantly differ for children receiving anaerobic, Gram-negative, and P. aeruginosa coverage compared with those receiving anaerobic coverage alone.
ICU Transfer
Nearly thirty percent (29.0%) of children required ICU admission, with an additional 3.8% requiring ICU transfer following admission (Table 2). In the multivariable analysis, the odds of an ICU transfer were greater for children receiving Gram-negative coverage alone (OR 1.80, 95% CI: 1.03-3.14) compared with those receiving anaerobic coverage alone. There was no statistical difference in ICU transfer for those receiving anaerobic and Gram-negative coverage (with or without P. aeruginosa coverage) compared with those receiving anaerobic coverage alone (Figure 2).
Length of Stay
Median hospital LOS for the total cohort was five days (IQR: 3-9 days; Table 2). In the multivariable analysis, children receiving Gram-negative coverage alone had a longer LOS (RR 1.28; 95% CI: 1.16-1.41) compared with those receiving anaerobic coverage alone, whereas children receiving anaerobic, Gram-negative, and P. aeruginosa coverage had a shorter LOS (RR 0.83; 95% CI: 0.76-0.90) than those receiving anaerobic coverage alone (Figure 2). There was no statistical difference in the LOS between children receiving anaerobic and Gram-negative coverage and those receiving anaerobic coverage alone.
DISCUSSION
In this multicenter study of children with NI hospitalized with aspiration pneumonia, we found substantial variation in empiric antimicrobial coverage for children with aspiration pneumonia. When comparing outcomes across groups, children who received anaerobic and Gram-negative coverage had outcomes similar to children who received anaerobic therapy alone. However, children who did not receive anaerobic coverage (ie, Gram-negative coverage alone) had worse outcomes, most notably a greater than two-fold increase in the odds of experiencing acute respiratory failure during hospitalization when compared with children receiving anaerobic therapy. These findings support prior literature that has highlighted the importance of anaerobic therapy in the treatment of aspiration pneumonia. The benefit of antibiotics targeting Gram-negative organisms, in addition to anaerobes, remains uncertain.
The variability in empiric antimicrobial coverage likely reflects the paucity of available information on oral and/or enteric bacteria required to identify them as causative organisms in aspiration pneumonia. In part, this problem is due to the difficulty in obtaining adequate sputum for culture from pediatric patients.27 While it may be more feasible to obtain tracheal aspirates for respiratory culture in children with a tracheostomy, interpretation of culture results remains challenging because the lower airways of children with tracheostomy are commonly colonized with bacterial pathogens.28 Thus, physicians are often left to choose empiric antimicrobial coverage with inadequate supporting evidence.29 Although the polymicrobial nature of aspiration pneumonia is well recognized in adult and pediatric literature,10,30 it is less clear which organisms are of pathological significance and require treatment.
The treatment standard for aspiration pneumonia has long included anaerobic therapy.29 The worse outcomes of children not receiving anaerobic therapy (ie, Gram-negative coverage alone) compared with children who received anaerobic therapy support the continued importance of anaerobic therapy in the treatment of aspiration pneumonia for hospitalized children with NI. The role of antibiotics covering Gram-negative organisms is less clear. Recent studies suggest the role of anaerobes is overemphasized in the etiology and treatment of aspiration pneumonia.10,29,31-38 Multiple studies on aspiration pneumonia bacteriology in hospitalized adults have demonstrated a predominance of Gram-negative organisms (ranging from 37%-71% of isolates identified on respiratory culture) and a relative scarcity of anaerobes (ranging from 0%-16% of isolates).31-37 A prospective study of 50 children hospitalized with clinical and radiographic evidence of pneumonia with known aspiration risk (eg, neuromuscular disease or dysphagia) found that ~80% of 163 bacterial isolates were Gram-negative.38 However, this study included repeat cultures from the same children, and thus, may overestimate the prevalence of Gram-negative organisms. In our study, children who received both anaerobic and Gram-negative therapy had no differences in ICU transfer or LOS but did experience higher odds of acute respiratory failure. As these results may be due to unmeasured confounding, future studies should further explore the necessity of Gram-negative coverage in addition to anaerobic coverage in this population.
While these recent studies may seem to suggest that anaerobic coverage is not necessary for aspiration pneumonia, there are important limitations worth noting. First, these studies used a variety of sampling techniques. While organisms grown from samples obtained via bronchoalveolar lavage31-34,36 are likely pathogenic, those grown from tracheal or oral samples obtained via percutaneous transtracheal aspiration,34 a protected specimen brush,34,36,37 or expectorated sputum35,38 may not represent lower airway organisms. Second, anaerobic cultures were not obtained in all studies.31,34,38 Anaerobic organisms are difficult to isolate using traditional clinical specimen collection techniques and aerobic culture media.18 Furthermore, anaerobes are not easily recovered from lung infections after the receipt of antibiotic therapy.39 Details regarding pretreatment, which are largely lacking from these studies, are necessary to interpret the relative scarcity of anaerobes on respiratory culture. Finally, caution should be taken when extrapolating the results of studies focused on the etiology and treatment of aspiration pneumonia in elderly adults to children. Our results, particularly in the context of the limitation of these more recent studies, suggest that the role of anaerobes has been underestimated.
Recent studies examining populations of children with cerebral palsy and/or tracheostomy have emphasized the high rates of carriage and infection rates with Gram-negative and drug-resistant bacteria; in particular, P. aeruginosa accounts for 50%-72% of pathogenic bacteria.11,12,38,40
Our multicenter observational study has several limitations. We used diagnosis codes to identify patients with aspiration pneumonia. As validated clinical criteria for the diagnosis of aspiration pneumonia do not exist, clinicians may assign a diagnosis of and treatment for aspiration pneumonia by subjective suspicion based on a child’s severe NI or illness severity on presentation leading to selection bias. Although administrative data are not able to verify pneumonia type with absolute certainty, we previously demonstrated that the differences in the outcomes of children with aspiration and nonaspiration pneumonia diagnosis codes persist after accounting for the complexity that might influence the diagnosis.3
Frthermore, we were unable to account for laboratory, microbiology, or radiology test results, and other management practices (eg, frequency of airway clearance, previous antimicrobial therapy) that may influence outcomes. Future studies should certainly include an examination of the concordance of the antibiotics prescribed with causative organisms, as this undoubtedly affects patient outcomes. Other outcomes are important to examine (eg, time to return to respiratory baseline), but we were unable to do so, given the lack of clinical detail in our database. We randomly selected a single hospitalization for children with multiple admissions; alternative methods could have different results. Although children with NI predominately use children’s hospitals,1 results may not be generalizable.
CONCLUSION
These findings support prior literature that has highlighted the important role anaerobic therapy plays in the treatment of aspiration pneumonia in children with NI. In light of the limitations of our study design, we believe that rigorous clinical trials comparing anaerobic with anaerobic and Gram-negative therapy are an important and necessary next step to determine the optimal treatment for aspiration pneumonia in this population.
Disclosures
The authors do not have any financial relationships relevant to this article to disclose.
Funding
Dr. Thomson was supported by the Agency for Healthcare Research and Quality (AHRQ) under award number K08HS025138. Dr. Ambroggio was supported by the National Institute for Allergy and Infectious Diseases (NIAID) under award number K01AI125413. The content is solely the responsibility of the authors and does not necessarily represent the official views of the AHRQ or NIAID.
1. Berry JG, Poduri A, Bonkowsky JL, et al. Trends in resource utilization by children with neurological impairment in the United States inpatient health care system: a repeat cross-sectional study. PLoS Med. 2012;9(1):e1001158. https://doi.org/10.1371/journal.pmed.1001158.
2. Seddon PC, Khan Y. Respiratory problems in children with neurological impairment. Arch Dis Child. 2003;88(1):75-78. https://doi.org/10.1136/adc.88.1.75.
3. Thomson J, Hall M, Ambroggio L, et al. Aspiration and non-aspiration pneumonia in hospitalized children with neurologic impairment. Pediatrics. 2016;137(2):e20151612. https://doi.org/10.1542/peds.2015-1612.
4. Brook I. Anaerobic pulmonary infections in children. Pediatr Emerg Care. 2004;20(9):636-640. https://doi.org/10.1097/01.pec.0000139751.63624.0b.
5. Bartlett JG, Gorbach SL. Treatment of aspiration pneumonia and primary lung abscess. Penicillin G vs clindamycin. JAMA. 1975;234(9):935-937. https://doi.org/10.1001/jamadermatol.2017.0297.
6. Bartlett JG, Gorbach SL, Finegold SM. The bacteriology of aspiration pneumonia. Am J Med. 1974;56(2):202-207. https://doi.org/10.1016/0002-9343(74)90598-1.
7. Lode H. Microbiological and clinical aspects of aspiration pneumonia. J Antimicrob Chemother. 1988;21:83-90. https://doi.org/10.1093/jac/21.suppl_c.83.
8. Brook I. Treatment of aspiration or tracheostomy-associated pneumonia in neurologically impaired children: effect of antimicrobials effective against anaerobic bacteria. Int J Pediatr Otorhinolaryngol. 1996;35(2):171-177. https://doi.org/10.1016/0165-5876(96)01332-8.
9. Jacobson SJ, Griffiths K, Diamond S, et al. A randomized controlled trial of penicillin vs clindamycin for the treatment of aspiration pneumonia in children. Arch Pediatr Adolesc Med. 1997;151(7):701-704. https://doi.org/10.1001/archpedi.1997.02170440063011.
10. DiBardino DM, Wunderink RG. Aspiration pneumonia: a review of modern trends. J Crit Care. 2015;30(1):40-48. https://doi.org/10.1016/j.jcrc.2014.07.011.
11. Gerdung CA, Tsang A, Yasseen AS, 3rd, Armstrong K, McMillan HJ, Kovesi T. Association between chronic aspiration and chronic airway infection with Pseudomonas aeruginosa and other Gram-negative bacteria in children with cerebral palsy. Lung. 2016;194(2):307-314. https://doi.org/10.1007/s00408-016-9856-5.
12. Thorburn K, Jardine M, Taylor N, Reilly N, Sarginson RE, van Saene HK. Antibiotic-resistant bacteria and infection in children with cerebral palsy requiring mechanical ventilation. Pedr Crit Care Med. 2009;10(2):222-226. https://doi.org/10.1097/PCC.0b013e31819368ac.
13. Lanspa MJ, Jones BE, Brown SM, Dean NC. Mortality, morbidity, and disease severity of patients with aspiration pneumonia. J Hosp Med. 2013;8(2):83-90. https://doi.org/10.1002/jhm.1996.
14. Lanspa MJ, Peyrani P, Wiemken T, Wilson EL, Ramirez JA, Dean NC. Characteristics associated with clinician diagnosis of aspiration pneumonia: a descriptive study of afflicted patients and their outcomes. J Hosp Med. 2015;10(2):90-96. https://doi.org/10.1002/jhm.2280.
15. Berry JG, Graham RJ, Roberson DW, et al. Patient characteristics associated with in-hospital mortality in children following tracheotomy. Arch Dis Child. 2010;95(9):703-710.
16. Berry JG, Graham DA, Graham RJ, et al. Predictors of clinical outcomes and hospital resource use of children after tracheotomy. Pediatrics. 2009;124(2):563-572. https://doi.org/10.1136/adc.2009.180836.
17. Balamuth F, Weiss SL, Hall M, et al. Identifying pediatric severe sepsis and septic shock: Accuracy of diagnosis codes. J Pediatr. 2015;167(6):1295-1300 e1294. https://doi.org/10.1016/j.jpeds.2015.09.027.
18. American Academy of Pediatrics., Pickering LK, American Academy of Pediatrics. Committee on Infectious Diseases. In: Red book : 2012 report of the Committee on Infectious Diseases. 29th ed. Elk Grove Village: American Academy of Pediatrics; 2012.
19. Gilbert DN. The Sanford Guide to Antimicrobial Therapy 2014. 44th ed. Sperryville: Antimicrobial Therapy, Inc; 2011.
20. Marik PE. Aspiration pneumonitis and aspiration pneumonia. N Engl J Med. 2001;344(9):665-671. https://doi.org/10.1056/NEJM200103013440908.
21. Feudtner C, Feinstein JA, Zhong W, Hall M, Dai D. Pediatric complex chronic conditions classification system version 2: updated for ICD-10 and complex medical technology dependence and transplantation. BMC Pediatrics. 2014;14:199. https://doi.org/10.1186/1471-2431-14-199.
22. Feudtner C, Hays RM, Haynes G, Geyer JR, Neff JM, Koepsell TD. Deaths attributed to pediatric complex chronic conditions: national trends and implications for supportive care services. Pediatrics. 2001;107(6):E99. https://doi.org/10.1542/peds.107.6.e99.
23. Feinstein JA, Russell S, DeWitt PE, Feudtner C, Dai D, Bennett TD. R package for pediatric complex chronic condition classification. JAMA Pediatr. 2018;172(6):596-598. https://doi.org/10.1001/jamapediatrics.2018.0256.
24. Berry JG, Hall DE, Kuo DZ, Cohen E, Agrawal R, Feudtner C, Hall M, Kueser J, Kaplan W, Neff J. Hospital utilization and characteristics of patients experiencing recurrent readmissions within children’s hospitals. JAMA. 2011;305(7):682-690. https://doi.org/10.1001/jama.2011.122.
25. Shah SS, Hall M, Newland JG, et al. Comparative effectiveness of pleural drainage procedures for the treatment of complicated pneumonia in childhood. J Hosp Med. 2011;6(5):256-263. https://doi.org/10.1002/jhm.872.
26. Child Health Corporation of America. CTC™ 2010 Code Structure: Module 5 Clinical Services. 2010 January 4; Available at https://sharepoint.chca.com/CHCAForums/PerformanceImprovement/PHIS/Reference Library/CTC Resources/Forms/AllItems.aspx Version: Modified.
27. Bradley JS, Byington CL, Shah SS, et al. The management of community-acquired pneumonia in infants and children older than 3 months of age: clinical practice guidelines by the Pediatric Infectious Diseases Society and the Infectious Diseases Society of America. Clin Infect Dis. 2011;53(7):e25-76. https://doi.org/10.1093/cid/cir531.
28. Brook I. Bacterial colonization, tracheobronchitis, and pneumonia following tracheostomy and long-term intubation in pediatric patients. Chest. 1979;76(4):420-424.
29. Waybright RA, Coolidge W, Johnson TJ. Treatment of clinical aspiration: a reappraisal. Am J Health Syst Pharm. 2013;70(15):1291-1300. https://doi.org/10.2146/ajhp120319.
30. Brook I, Finegold SM. Bacteriology of aspiration pneumonia in children. Pediatrics. 1980;65(6):1115-1120.
31. Wei C, Cheng Z, Zhang L, Yang J. Microbiology and prognostic factors of hospital- and community-acquired aspiration pneumonia in respiratory intensive care unit. Am J Infect Control. 2013;41(10):880-884. https://doi.org/10.1016/j.ajic.2013.01.007.
32. El-Solh AA, Pietrantoni C, Bhat A, et al. Microbiology of severe aspiration pneumonia in institutionalized elderly. Am J Respir Crit Care Med. 2003;167(12):1650-1654. https://doi.org/10.1164/rccm.200212-1543OC.
33. Tokuyasu H, Harada T, Watanabe E, et al. Effectiveness of meropenem for the treatment of aspiration pneumonia in elderly patients. Intern Med. 2009;48(3):129-135. https://doi.org/10.2169/internalmedicine.48.1308.
34. Ott SR, Allewelt M, Lorenz J, Reimnitz P, Lode H, German Lung Abscess Study Group. Moxifloxacin vs ampicillin/sulbactam in aspiration pneumonia and primary lung abscess. Infection. 2008;36(1):23-30. https://doi.org/10.1007/s15010-007-7043-6.
35. Kadowaki M, Demura Y, Mizuno S, et al. Reappraisal of clindamycin IV monotherapy for treatment of mild-to-moderate aspiration pneumonia in elderly patients. Chest. 2005;127(4):1276-1282. https://doi.org/10.1016/j.chest.2017.05.019.
36. Marik PE, Careau P. The role of anaerobes in patients with ventilator-associated pneumonia and aspiration pneumonia: a prospective study. Chest. 1999;115(1):178-183. https://doi.org/10.1378/chest.115.1.178.
37. Mier L, Dreyfuss D, Darchy B, et al. Is penicillin G an adequate initial treatment for aspiration pneumonia? A prospective evaluation using a protected specimen brush and quantitative cultures. Intensive Care Med. 1993;19(5):279-284. https://doi.org/10.1007/bf01690548.
38. Ashkenazi-Hoffnung L, Ari A, Bilavsky E, Scheuerman O, Amir J, Prais D. Pseudomonas aeruginosa identified as a key pathogen in hospitalised children with aspiration pneumonia and a high aspiration risk. Acta Paediatr. 2016;105(12):e588-e592. https://doi.org/10.1111/apa.13523.
39. Bartlett JG, Gorbach SL, Tally FP, Finegold SM. Bacteriology and treatment of primary lung abscess. Am Rev Respir Dis. 1974;109(5):510-518. https://doi.org/10.1164/arrd.1974.109.5.510.
40. Russell CJ, Simon TD, Mamey MR, Newth CJL, Neely MN. Pseudomonas aeruginosa and post-tracheotomy bacterial respiratory tract infection readmissions. Pediatr Pulmonol. 2017;52(9):1212-1218. https://doi.org/10.1002/ppul.23716.
41. Russell CJ, Mamey MR, Koh JY, Schrager SM, Neely MN, Wu S. Length of stay and hospital revisit after bacterial tracheostomy-associated respiratory tract infection hospitalizations. Hosp Pediatr. Hosp Pediatr. 2018;8(2):72-80. https://doi.org/10.1542/hpeds.2017-0106.
42. Russell CJ, Mack WJ, Schrager SM, Wu S. Care variations and outcomes for children hospitalized with bacterial tracheostomy-associated respiratory infections. Hosp Pediatr. 2017;7(1):16-23. https://doi.org/10.1542/hpeds.2016-0104.
© 2019 Society of Hospital Medicine
Part 2: The ABCs of managing COPD exacerbations

Do you know the ABCs of medication management for chronic obstructive pulmonary disease exacerbations?
In the second episode of a two-part interview, Robert A. Wise, MD, outlines the evidence and best practices for treating patients with corticosteroids, and he discusses potential new approaches to preventing exacerbations.
Dr. Wise is a professor of medicine at the Johns Hopkins University, Baltimore. He is the coauthor of a review of medication regimens to manage COPD exacerbations (Respir Care. 2018 Jun;63[6]:773-82).

Part 1: The ABCs of managing COPD exacerbations

Do you know the ABCs of medication management for chronic obstructive pulmonary disease exacerbations?
Understanding how to effectively use the ABCs – antibiotics, bronchodilators, and corticosteroids – in COPD exacerbations can reduce morbidity and improve patient outcomes.
In the first episode of a two-part interview, Robert A. Wise, MD, outlines the evidence and best practices for treating patients with antibiotics and bronchodilators.
Dr. Wise is a professor of medicine at Johns Hopkins University, Baltimore. He is the coauthor of a review of medication regimens to manage COPD exacerbations (Respir Care. 2018 Jun;63[6]:773-82).
Ubrogepant may relieve migraine pain at 2 hours
Ubrogepant, an oral calcitonin gene–related peptide (CGRP)–receptor antagonist, may relieve patients’ migraine pain and their most bothersome associated symptom, such as photophobia, phonophobia, or nausea, at 2 hours after acute treatment, according to phase 3 trial results published Nov. 19 in JAMA.

“Among adults with migraine, acute treatment with ubrogepant, compared with placebo, led to significantly greater rates of pain freedom at 2 hours with the 50-mg and 25-mg doses, and absence of the most bothersome migraine-associated symptom at 2 hours only with the 50-mg dose,” wrote first author Richard B. Lipton, MD, director of the Montefiore Headache Center at Albert Einstein College of Medicine, New York, and his colleagues. “Further research is needed to assess the effectiveness of ubrogepant against other acute treatments for migraine and to evaluate the long-term safety of ubrogepant among unselected patient populations.”
A researcher who commented on the results said that the drug appears “modestly better than placebo” and called for a trial comparing ubrogepant, aspirin, and oral sumatriptan.
The Food and Drug Administration is reviewing an application for ubrogepant. Allergan, the company developing the drug, has said it expects a regulatory decision in December.
ACHIEVE II
To evaluate the efficacy and tolerability of ubrogepant versus placebo for the acute treatment of a migraine attack, investigators conducted ACHIEVE II, a randomized, double-blind, placebo-controlled, single-attack clinical trial. The study was conducted at 99 primary care and research clinics during 2016-2018.
The trial included adults with migraine with or without aura who experienced two to eight migraine attacks per month. Participants had a mean age of 41.5 years, and 90% were female. The safety analysis included data from 1,465 participants, and the efficacy analysis included data from 1,355 participants. The primary efficacy outcomes were pain freedom and the absence of participants’ most bothersome migraine-associated symptom at 2 hours after taking the medication. Patients received ubrogepant 50 mg, ubrogepant 25 mg, or placebo to treat a migraine attack of moderate or severe pain intensity.
At 2 hours, pain freedom was reported by 101 of 464 participants in the ubrogepant 50-mg group (21.8%), 90 of 435 in the ubrogepant 25-mg group (20.7%), and 65 of 456 in the placebo group (14.3%). Absence of the most bothersome symptom was reported by 180 of 463 participants in the ubrogepant 50-mg group (38.9%), 148 of 434 in the ubrogepant 25-mg group (34.1%), and 125 of 456 in the placebo group (27.4%).
The most common adverse events within 48 hours were nausea and dizziness. Nausea occurred in 2.0% of the 50-mg group, 2.5% of the 25-mg group, and 2.0% of the placebo group. Dizziness occurred in 1.4% of the 50-mg group, 2.1% of the 25-mg group, and 1.6% of the placebo group.
At conferences, researchers have presented results from the phase 3 ACHIEVE I trial as well as an analysis that suggests ubrogepant may be effective in patients for whom triptans have been ineffective. In addition, studies have supported the safety of “gepants” after earlier concerns about potential liver toxicity. Physicians have called the safety data reassuring.
The ACHIEVE II trial was sponsored by Allergan. Several authors are Allergan employees. Dr. Lipton is a consultant, advisory board member, or has received honoraria from Allergan and other companies.
Number needed to treat
“The study was large, appears to have been well conducted, is clearly reported, and used appropriate outcome measures,” said Elizabeth Loder, MD, commenting on the trial.

A year ago, Dr. Loder, chief of the division of headache at Brigham and Women’s Hospital and professor of neurology at Harvard Medical School in Boston, coauthored a paper with Peer Tfelt-Hansen, MD, DMSc, of the University of Copenhagen, that said the phase 3 trials of gepants so far have found the drugs to have small effect sizes and low efficacy (Headache. 2019 Jan;59[1]:113-7. doi: 10.1111/head.13444).
Their publication included preliminary figures from ACHIEVE II, which are consistent with those published in JAMA. “The effect size for both doses of ubrogepant is small and of debatable clinical significance,” Dr. Loder said. “The therapeutic gain over placebo is 7.5% for the 50-mg dose and 6.4% for the 25-mg dose for the outcome of pain freedom at 2 hours. That corresponds to a number needed to treat of 13 and 15.6 people, respectively, in order to have one person achieve pain freedom at 2 hours that is attributable to the active treatment.”
For a secondary outcome of pain relief at 2 hours, defined as reduction of headache pain severity from moderate or severe to mild or none, the therapeutic gain versus placebo is 14.5% for the 50-mg dose and 12.3% for the 25-mg dose. “That corresponds to a number needed to treat of 6.8 and 8.1 people, respectively, to have one person achieve pain relief at 2 hours attributable to the drug,” Dr. Loder said.
“Although there are no head to head studies comparing ubrogepant to triptans, for reference the [number needed to treat] for a 100-mg oral dose of sumatriptan is on the order of 3.5 for pain relief at 2 hours, meaning that one needs to treat just 3.5 people with sumatriptan in order to have one person achieve pain relief at 2 hours attributable to the drug,” she said (Cochrane Database Syst Rev. 2014;5:CD009108. doi: 10.1002/14651858.CD009108.pub2).
“The bottom line is that in the ACHIEVE II study, ubrogepant appears, on average, to be modestly better than placebo to treat migraine. It does not appear to be in the same league as sumatriptan. Instead, as Dr. Tfelt-Hansen and I said in our article, the results look comparable to those likely to be achieved with inexpensive nonprescription medications such as NSAIDs.”
Dr. Loder called for a trial comparing ubrogepant and other therapies. “I challenge the authors and the company to conduct a large, placebo-controlled trial comparing ubrogepant to 100 mg of oral sumatriptan and to 650 mg of aspirin,” Dr. Loder said.
Dr. Loder has no financial connections with any pharmaceutical or device companies and is paid for her work as the head of research for the British Medical Journal.
SOURCE: Lipton RB et al. JAMA. 2019;322(19):1887-98. doi: 10.1001/jama.2019.16711.
Ubrogepant, an oral calcitonin gene–related peptide (CGRP)–receptor antagonist, may relieve patients’ migraine pain and their most bothersome associated symptom, such as photophobia, phonophobia, or nausea, at 2 hours after acute treatment, according to phase 3 trial results published Nov. 19 in JAMA.
“Among adults with migraine, acute treatment with ubrogepant, compared with placebo, led to significantly greater rates of pain freedom at 2 hours with the 50-mg and 25-mg doses, and absence of the most bothersome migraine-associated symptom at 2 hours only with the 50-mg dose,” wrote first author Richard B. Lipton, MD, director of the Montefiore Headache Center at Albert Einstein College of Medicine, New York, and his colleagues. “Further research is needed to assess the effectiveness of ubrogepant against other acute treatments for migraine and to evaluate the long-term safety of ubrogepant among unselected patient populations.”
A researcher who commented on the results said that the drug appears “modestly better than placebo” and called for a trial comparing ubrogepant, aspirin, and oral sumatriptan.
The Food and Drug Administration is reviewing an application for ubrogepant. Allergan, the company developing the drug, has said it expects a regulatory decision in December.
ACHIEVE II
To evaluate the efficacy and tolerability of ubrogepant versus placebo for the acute treatment of a migraine attack, investigators conducted ACHIEVE II, a randomized, double-blind, placebo-controlled, single-attack clinical trial. The study was conducted at 99 primary care and research clinics during 2016-2018.
The trial included adults with migraine with or without aura who experienced two to eight migraine attacks per month. Participants had a mean age of 41.5 years, and 90% were female. The safety analysis included data from 1,465 participants, and the efficacy analysis included data from 1,355 participants. The primary efficacy outcomes were pain freedom and the absence of participants’ most bothersome migraine-associated symptom at 2 hours after taking the medication. Patients received ubrogepant 50 mg, ubrogepant 25 mg, or placebo to treat a migraine attack of moderate or severe pain intensity.
At 2 hours, pain freedom was reported by 101 of 464 participants in the ubrogepant 50-mg group (21.8%), 90 of 435 in the ubrogepant 25-mg group (20.7%), and 65 of 456 in the placebo group (14.3%). Absence of the most bothersome symptom was reported by 180 of 463 participants in the ubrogepant 50-mg group (38.9%), 148 of 434 in the ubrogepant 25-mg group (34.1%), and 125 of 456 in the placebo group (27.4%).
The most common adverse events within 48 hours were nausea and dizziness. Nausea occurred in 2.0% of the 50-mg group, 2.5% of the 25-mg group, and 2.0% of the placebo group. Dizziness occurred in 1.4% of the 50-mg group, 2.1% of the 25-mg group, and 1.6% of the placebo group.
At conferences, researchers have presented results from the phase 3 ACHIEVE I trial as well as an analysis that suggests ubrogepant may be effective in patients for whom triptans have been ineffective. In addition, studies have supported the safety of “gepants” after earlier concerns about potential liver toxicity. Physicians have called the safety data reassuring.
The ACHIEVE II trial was sponsored by Allergan. Several authors are Allergan employees. Dr. Lipton is a consultant, advisory board member, or has received honoraria from Allergan and other companies.
Number needed to treat
“The study was large, appears to have been well conducted, is clearly reported, and used appropriate outcome measures,” said Elizabeth Loder, MD, commenting on the trial.
A year ago, Dr. Loder, chief of the division of headache at Brigham and Women’s Hospital and professor of neurology at Harvard Medical School in Boston, coauthored a paper with Peer Tfelt-Hansen, MD, DMSc, of the University of Copenhagen, that said the phase 3 trials of gepants so far have found the drugs to have small effect sizes and low efficacy (Headache. 2019 Jan;59[1]:113-7. doi: 10.1111/head.13444).
Their publication included preliminary figures from ACHIEVE II, which are consistent with those published in JAMA. “The effect size for both doses of ubrogepant is small and of debatable clinical significance,” Dr. Loder said. “The therapeutic gain over placebo is 7.5% for the 50-mg dose and 6.4% for the 25-mg dose for the outcome of pain freedom at 2 hours. That corresponds to a number needed to treat of 13 and 15.6 people, respectively, in order to have one person achieve pain freedom at 2 hours that is attributable to the active treatment.”
For a secondary outcome of pain relief at 2 hours, defined as reduction of headache pain severity from moderate or severe to mild or none, the therapeutic gain versus placebo is 14.5% for the 50-mg dose and 12.3% for the 25-mg dose. “That corresponds to a number needed to treat of 6.8 and 8.1 people, respectively, to have one person achieve pain relief at 2 hours attributable to the drug,” Dr. Loder said.
“Although there are no head to head studies comparing ubrogepant to triptans, for reference the [number needed to treat] for a 100-mg oral dose of sumatriptan is on the order of 3.5 for pain relief at 2 hours, meaning that one needs to treat just 3.5 people with sumatriptan in order to have one person achieve pain relief at 2 hours attributable to the drug,” she said (Cochrane Database Syst Rev. 2014;5:CD009108. doi: 10.1002/14651858.CD009108.pub2).
“The bottom line is that in the ACHIEVE II study, ubrogepant appears, on average, to be modestly better than placebo to treat migraine. It does not appear to be in the same league as sumatriptan. Instead, as Dr. Tfelt-Hansen and I said in our article, the results look comparable to those likely to be achieved with inexpensive nonprescription medications such as NSAIDs.”
Dr. Loder called for a trial comparing ubrogepant and other therapies. “I challenge the authors and the company to conduct a large, placebo-controlled trial comparing ubrogepant to 100 mg of oral sumatriptan and to 650 mg of aspirin,” Dr. Loder said.
Dr. Loder has no financial connections with any pharmaceutical or device companies and is paid for her work as the head of research for the British Medical Journal.
SOURCE: Lipton RB et al. JAMA. 2019;322(19):1887-98. doi: 10.1001/jama.2019.16711.
FROM JAMA
Novel antibody looks promising in lupus nephritis
WASHINGTON – A novel antibody, obinutuzumab, enhances renal responses in patients with lupus nephritis, through more complete B-cell depletion, compared with standard immunotherapy, and is well tolerated, according to results from the phase 2 NOBILITY trial.
“We know from our previous trials with anti–B-cell antibodies that results were mixed and we felt that these variable results were possibly due to variability in B-cell depletion with a type 1 anti-CD20 antibody such as rituximab,” Brad Rovin, MD, director, division of nephrology, Ohio State University in Columbus, told a press briefing here at Kidney Week 2019: American Society of Nephrology annual meeting.
“So we hypothesized that if we could deplete B cells more efficiently and completely, we would achieve better results. At week 52, 35% of patients in the obinutuzumab-treated group achieved a complete renal response, compared to 23% in the standard-of-care arm.”
And by week 76, the difference between obinutuzumab and the standard of care was actually larger at 40% vs. 18%, respectively, “and this was statistically significant at a P value of .01,” added Dr. Rovin, who presented the full findings of the study at the conference.
Obinutuzumab, a highly engineered anti-CD20 antibody, is already approved under the brand name Gazyva for use in certain leukemias and lymphomas. The NOBILITY study was funded by Genentech-Roche, and Dr. Rovin reported being a consultant for the company.
Asked by Medscape Medical News to comment on the study, Duvuru Geetha, MBBS, noted that with standard-of-care mycophenolate mofetil (MMF) plus corticosteroids, “the remissions rates we achieve [for lupus nephritis] are still not great,” ranging from 30% to 50%, depending on the patient population.
“This is why there is a need for alternative agents,” added Dr. Geetha, who is an associate professor of medicine, Johns Hopkins University, Baltimore.
With obinutuzumab, “the data look very promising because there is a much more profound and sustained effect on B-cell depletion and the renal response rate is much higher [than with MMF and corticosteroids],” she noted.
Dr. Geetha added, however, that she presumes patients were all premedicated with prophylactic agents to prevent infectious events, as they are when treated with rituximab.
“I think what is definitely different about this drug is that it induces direct cell death more efficiently than rituximab and that is probably what’s accounting for the higher efficacy seen with it,” said Dr. Geetha, who disclosed having received honoraria from Genentech a number of years ago.
“So yes, I believe the results are clinically meaningful,” she concluded.
NOBILITY study design
The NOBILITY trial randomized 125 patients with Class III or IV lupus nephritis to either obinutuzumab plus MMF and corticosteroids, or to MMF plus corticosteroids alone, for a treatment interval of 104 weeks.
Patients in the obinutuzumab group received two infusions of the highly engineered anti-CD20 antibody at week 0 and week 2 and another two infusions at 6 months.
“The primary endpoint was complete renal response at week 52,” the authors wrote, “while key secondary endpoints included overall renal response and modified complete renal response.”
Both at week 52 and week 76, more patients in the obinutuzumab group achieved an overall renal response as well as a modified complete renal response, compared with those treated with immunosuppression alone.
“If you look at the complete renal response over time, you can see that the curves separate after about 6 months but the placebo group starts to decline as you go further out, whereas the obinutuzumab group continues to separate, so my prediction is that we are going to see this trend continue because of the mechanism of action of obinutuzumab,” Dr. Rovin explained.
Phase 3 trials to start early 2020
All of the serologies relevant to lupus and lupus nephritis “including C3 and C4 improved while antidoubled stranded DNA levels declined, as did the urine protein-to-creatinine ratio, although the decline was more rapid and more profound in the obinutuzumab-treated patients,” Dr. Rovin said.
Importantly as well, despite the profound B-cell depletion produced by obinutuzumab, “the adverse event profile of this drug was very similar to the placebo group,” he stressed.
As expected, rates of infusion reactions were slightly higher in the experimental group than the immunosuppression alone group, but rates of serious adverse events were the same between groups, as were adverse infectious events, he noted.
Investigators have now initiated a global phase 3 trial, scheduled to start in early 2020, to evaluate the same treatment protocol in a larger group of patients.
Kidney Week 2019. Abstract #FR-OR136. Presented Nov. 8, 2019.
This story first appeared on Medscape.com.
What’s new and different with ESVS guidelines for aortoabdominal aortic and iliac aneurysms?
On Thursday afternoon, Karin Elisabeth Schmidt, MD, of the Center of Cardiovascular Surgery, Hospital Floridsdorf, Vienna, Austria, will discuss the guidelines of the European Society of Vascular Surgery (ESVS) for the management of abdominal and iliac aortic aneurysms, which were published in January 2019. “Since the last guideline, this field has experienced a rapid technological devices progress, significantly impacting our clinical practice as well as the care of the affected patients,” according to Dr. Schmidt and her colleagues.
They analyzed the different recommendations of the European, British and American guidelines for the treatment of abdominal aortic aneurysms was performed. The publications used for this literature study include the current and previous guidelines of the ESVS published in the European Journal of Vascular and Endovascular Surgery and the guideline published by the Society for Vascular Surgery (SVS) in January 2018, as well as the draft guideline of the National Institute for Health and Care Excellence (NICE) issued in May 2018.
There is consensus for the preference of endovascular treatment of a ruptured aortic aneurysm if this is anatomically possible, according to Dr. Schmidt. She will discuss how, for the majority of elective cases, endovascular care is favored in the SVS and ESVS guidelines in contrast to the NICE draft.
There are generally still more ambiguities than clear recommendations, especially regarding the preferred procedures for complex aortic pathologies, population screening, and follow-up after open and endovascular aortic intervention.
She recommended a critical analysis of the U.S. and European guidelines, as both partly cover different aspects.
The final version of the guideline for the United Kingdom is eagerly expected, according to Dr. Schmidt and her colleagues, as it currently prefers open surgical care in the elective setting. Many research possibilities exist in the search for biomarkers for better assessment of the progression of small aortic aneurysms coupled with functional imaging or pharmacologic influence on aneurysm growth progression. In addition, global platforms for data collection, in particular for newer devices (low profile) and their long-term performance with jointly defined endpoints, should be established.
Dr. Schmidt will discuss how techniques such as artificial intelligence and machine learning will be used in future for monitoring large amounts of data, finding patterns and thus gain new insights.
Dealing with complications associated with central venous access catheters
On Thursday morning, John T. Loree, a medical student at SUNY Upstate Medical School, Syracuse, will present a study that he and his colleagues performed to assess the risks and complications associated with the use of central venous access (CVA) catheters over the long term. They attempted to identify high-risk subgroups based upon patient characteristics and line type. The research is warranted so that modified follow-up regimens can be implemented to reduce risk and improve patient outcomes. In his presentation, Mr. Loree will discuss selected therapies for specific complications.
The researchers performed a PubMed data base search, which located 21 papers published between 2012 and 2018. In this sample, 6,781 catheters were placed in 6,183 patients, with a total dwell time of 2,538,323 days. Patients characteristics varied from children to adults. Various line types were used (peripherally inserted central catheter [PICC], central line, mediport, tunneled central venous catheter). Indications for catheterization included (chemotherapy, dialysis, total parenteral nutrition (TPN), and other medication infusion.
Mr. Loree will discuss the primary outcomes – overall complication rate and the infectious and mechanical complication rates per 1,000 catheter-days.
He and his colleagues found that port purpose was significantly predictive of infection rate, while port type was selectively predictive of overall and mechanical complication rate. Subgroup analysis demonstrated significantly increased overall complication rates in peripherally inserted catheters and patients receiving medications, and increased mechanical complication rates with central lines.
Mr. Loree will discuss how the complication rates associated with long-term use of CVA catheters were associated with factors easily identifiable at the initial patient visit.
Their data will show how, overall, PICC lines used for TPN/medication administration were associated with the highest complication rate, while mediports used for chemotherapy were associated with the lowest complication rate. Based on these patient characteristics, stricter follow-up to monitor for complications can be used in select patients to improve patient outcomes, according to Mr. Loree.
Satisfaction high among psoriasis patients on apremilast
MADRID – within the next 12 months than were patients on their first tumor necrosis factor (TNF) inhibitor, in a large retrospective national propensity score-matched study.

“This was surprising to us,” David L. Kaplan, MD, admitted in presenting the study findings at the annual congress of the European Academy of Dermatology and Venereology.
The surprise came because apremilast, a phosphodiesterase 4 (PDE4)-inhibitor, is less potent than the injectable biologics at driving down Psoriasis Area and Severity Index (PASI) scores.
“This is real-world data. And this is what patients are saying at 1 year: that they’re actually happier [with apremilast] and they’re not interested in changing,” said Dr. Kaplan, a dermatologist at the University of Kansas and in private practice in Overland Park, Kan.
He and his coinvestigators tapped the IBM Watson MarketScan health insurance claims database for 2015-2016 and identified 1,645 biologic-naive adults with psoriasis who started on apremilast therapy and an equal number of biologic-naive psoriasis patients who initiated treatment with a biologic, of whom 1,207 started on an TNF inhibitor and 438 began on an interleukin inhibitor, which was ustekinumab in 81% of cases. The TNF inhibitor cohort was split 80/20 between adalimumab and etanercept. The three groups – new users of apremilast, a TNF inhibitor, or an interleukin inhibitor – were propensity-matched based upon age, prior usage of systemic psoriasis therapies, Charlson Comorbidity Index scores, and other potential confounders.
The primary endpoint was the switch rate to a different psoriasis treatment within 12 months. The switch rate was significantly lower in patients who had started on apremilast than in those on a TNF inhibitor by a margin of 14% to 25%, while the 11% switch rate among patients on an interleukin inhibitor was not significantly different from the rate in the apremilast group.
“I think this data kind of gives us pause,” the dermatologist said. “As a clinician myself, when patients come back in the first question I always ask is, ‘How’re you doing? Are you happy?’ And at the end of the day, the data in terms of switch rates shows where patients are at. And that doesn’t really follow what we see with PASI scores.”
A secondary endpoint was the switch rate through 24 months. The same pattern held true: 24.9% in the apremilast starters, which was similar to the 22.9% in patients initiated on an interleukin inhibitor, and significantly less than the 39.1% rate in the TNF inhibitor group.
Among patients who switched medications within the first 12 months, the mean number of days to the switch was similar across all three groups.
The study had several limitations. Propensity score–matching is not a cure-all that can eradicate all potential biases. And the claims database didn’t include information on why patients switched, nor what their PASI scores were. “This is real-world data, and clinicians don’t do PASI scores in the real world,” he noted.
Audience member Andrew Blauvelt, MD, a dermatologist and president of the Oregon Medical Research Center, Portland, rose to challenge Dr. Kaplan’s conclusion that patients on apremilast were happier with their care.
“How can you rule out that it’s just practices that don’t use biologics, and they’re keeping patients on apremilast regardless of whether they’re better or happy because they’re not using biologics?” inquired Dr. Blauvelt.
Dr. Kaplan conceded that might well be a partial explanation for the results.
“Reluctance to use biologics is out there,” he agreed.
Dr. Kaplan reported serving as a consultant and paid speaker for Celgene, the study sponsor, as well as several other pharmaceutical companies.
SOURCE: Kaplan DL. EADV Abstract FC04.04.
MADRID – within the next 12 months than were patients on their first tumor necrosis factor (TNF) inhibitor, in a large retrospective national propensity score-matched study.
“This was surprising to us,” David L. Kaplan, MD, admitted in presenting the study findings at the annual congress of the European Academy of Dermatology and Venereology.
The surprise came because apremilast, a phosphodiesterase 4 (PDE4)-inhibitor, is less potent than the injectable biologics at driving down Psoriasis Area and Severity Index (PASI) scores.
“This is real-world data. And this is what patients are saying at 1 year: that they’re actually happier [with apremilast] and they’re not interested in changing,” said Dr. Kaplan, a dermatologist at the University of Kansas and in private practice in Overland Park, Kan.
He and his coinvestigators tapped the IBM Watson MarketScan health insurance claims database for 2015-2016 and identified 1,645 biologic-naive adults with psoriasis who started on apremilast therapy and an equal number of biologic-naive psoriasis patients who initiated treatment with a biologic, of whom 1,207 started on an TNF inhibitor and 438 began on an interleukin inhibitor, which was ustekinumab in 81% of cases. The TNF inhibitor cohort was split 80/20 between adalimumab and etanercept. The three groups – new users of apremilast, a TNF inhibitor, or an interleukin inhibitor – were propensity-matched based upon age, prior usage of systemic psoriasis therapies, Charlson Comorbidity Index scores, and other potential confounders.
The primary endpoint was the switch rate to a different psoriasis treatment within 12 months. The switch rate was significantly lower in patients who had started on apremilast than in those on a TNF inhibitor by a margin of 14% to 25%, while the 11% switch rate among patients on an interleukin inhibitor was not significantly different from the rate in the apremilast group.
“I think this data kind of gives us pause,” the dermatologist said. “As a clinician myself, when patients come back in the first question I always ask is, ‘How’re you doing? Are you happy?’ And at the end of the day, the data in terms of switch rates shows where patients are at. And that doesn’t really follow what we see with PASI scores.”
A secondary endpoint was the switch rate through 24 months. The same pattern held true: 24.9% in the apremilast starters, which was similar to the 22.9% in patients initiated on an interleukin inhibitor, and significantly less than the 39.1% rate in the TNF inhibitor group.
Among patients who switched medications within the first 12 months, the mean number of days to the switch was similar across all three groups.
The study had several limitations. Propensity score–matching is not a cure-all that can eradicate all potential biases. And the claims database didn’t include information on why patients switched, nor what their PASI scores were. “This is real-world data, and clinicians don’t do PASI scores in the real world,” he noted.
Audience member Andrew Blauvelt, MD, a dermatologist and president of the Oregon Medical Research Center, Portland, rose to challenge Dr. Kaplan’s conclusion that patients on apremilast were happier with their care.
“How can you rule out that it’s just practices that don’t use biologics, and they’re keeping patients on apremilast regardless of whether they’re better or happy because they’re not using biologics?” inquired Dr. Blauvelt.
Dr. Kaplan conceded that might well be a partial explanation for the results.
“Reluctance to use biologics is out there,” he agreed.
Dr. Kaplan reported serving as a consultant and paid speaker for Celgene, the study sponsor, as well as several other pharmaceutical companies.
SOURCE: Kaplan DL. EADV Abstract FC04.04.
REPORTING FROM EADV 2019
Early lenalidomide may delay progression of smoldering myeloma
Early treatment with lenalidomide may delay disease progression and prevent end-organ damage in patients with high-risk smoldering multiple myeloma (SMM), according to findings from a phase 3 trial.

While observation is the current standard of care in SMM, early therapy may represent a new standard for patients with high-risk disease, explained Sagar Lonial, MD, of Winship Cancer Institute, Emory University, Atlanta, and colleagues. Their findings were published in the Journal of Clinical Oncology.
The randomized, open-label, phase 3 study included 182 patients with intermediate- or high-risk SMM. Study patients were randomly allocated to receive either oral lenalidomide at 25 mg daily on days 1-21 of a 28-day cycle or observation.
Study subjects were stratified based on time since SMM diagnosis – 1 year or less vs. more than 1 year, and all patients in the lenalidomide arm received aspirin at 325 mg on days 1-28. Both interventions were maintained until unacceptable toxicity, disease progression, or withdrawal for other reasons.
The primary outcome was progression-free survival (PFS), measured from baseline to the development of symptomatic multiple myeloma (MM). The criteria for progression included evidence of end-organ damage in relation to MM and biochemical disease progression.
The researchers found that at 1 year PFS was 98% in the lenalidomide group and 89% in the observation group. At 2 years, PFS was 93% in the lenalidomide group and 76% in the observation group. PFS was 91% in the lenalidomide group and 66% in the observation group at 3 years (hazard ratio, 0.28; P = .002).
Among lenalidomide-treated patients, grade 3 or 4 hematologic and nonhematologic adverse events occurred in 36 patients (41%). Nonhematologic adverse events occurred in 25 patients (28%).
Frequent AEs among lenalidomide-treated patients included grade 4 decreased neutrophil count (4.5%), as well as grade 3 infections (20.5%), hypertension (9.1%), fatigue (6.8%), skin problems (5.7%), dyspnea (5.7%), and hypokalemia (3.4%). “In most cases, [adverse events] could be managed with dose modifications,” they wrote.
To reduce long-term toxicity, the researchers recommended a 2-year duration of therapy for patients at highest risk.
“Our results support the use of early intervention in patients with high-risk SMM – as defined by the 20/2/20 criteria where our magnitude of benefit was the greatest – rather than continued observation,” the researchers wrote.
The trial was funded by the National Cancer Institute. The authors reported financial affiliations with AbbVie, Aduro Biotech, Amgen, Bristol-Myers Squibb, Celgene, Juno Therapeutics, Kite Pharma, Sanofi, Takeda, and several other companies.
SOURCE: Lonial S et al. J Clin Oncol. 2019 Oct 25. doi: 10.1200/JCO.19.01740.
Early treatment with lenalidomide may delay disease progression and prevent end-organ damage in patients with high-risk smoldering multiple myeloma (SMM), according to findings from a phase 3 trial.
While observation is the current standard of care in SMM, early therapy may represent a new standard for patients with high-risk disease, explained Sagar Lonial, MD, of Winship Cancer Institute, Emory University, Atlanta, and colleagues. Their findings were published in the Journal of Clinical Oncology.
The randomized, open-label, phase 3 study included 182 patients with intermediate- or high-risk SMM. Study patients were randomly allocated to receive either oral lenalidomide at 25 mg daily on days 1-21 of a 28-day cycle or observation.
Study subjects were stratified based on time since SMM diagnosis – 1 year or less vs. more than 1 year, and all patients in the lenalidomide arm received aspirin at 325 mg on days 1-28. Both interventions were maintained until unacceptable toxicity, disease progression, or withdrawal for other reasons.
The primary outcome was progression-free survival (PFS), measured from baseline to the development of symptomatic multiple myeloma (MM). The criteria for progression included evidence of end-organ damage in relation to MM and biochemical disease progression.
The researchers found that at 1 year PFS was 98% in the lenalidomide group and 89% in the observation group. At 2 years, PFS was 93% in the lenalidomide group and 76% in the observation group. PFS was 91% in the lenalidomide group and 66% in the observation group at 3 years (hazard ratio, 0.28; P = .002).
Among lenalidomide-treated patients, grade 3 or 4 hematologic and nonhematologic adverse events occurred in 36 patients (41%). Nonhematologic adverse events occurred in 25 patients (28%).
Frequent AEs among lenalidomide-treated patients included grade 4 decreased neutrophil count (4.5%), as well as grade 3 infections (20.5%), hypertension (9.1%), fatigue (6.8%), skin problems (5.7%), dyspnea (5.7%), and hypokalemia (3.4%). “In most cases, [adverse events] could be managed with dose modifications,” they wrote.
To reduce long-term toxicity, the researchers recommended a 2-year duration of therapy for patients at highest risk.
“Our results support the use of early intervention in patients with high-risk SMM – as defined by the 20/2/20 criteria where our magnitude of benefit was the greatest – rather than continued observation,” the researchers wrote.
The trial was funded by the National Cancer Institute. The authors reported financial affiliations with AbbVie, Aduro Biotech, Amgen, Bristol-Myers Squibb, Celgene, Juno Therapeutics, Kite Pharma, Sanofi, Takeda, and several other companies.
SOURCE: Lonial S et al. J Clin Oncol. 2019 Oct 25. doi: 10.1200/JCO.19.01740.
FROM JOURNAL OF CLINICAL ONCOLOGY