User login
Pulmonary embolism treatment teams adopted widely for complex disease
NEW YORK – Seven years after the formation of the first pulmonary embolism response team (PERT), more than 100 institutions have joined the PERT Consortium, which was created to guide care and research for this thrombotic complication, according to a status report at a symposium on vascular and endovascular issues sponsored by the Cleveland Clinic Foundation.

“Why are PERTs needed? Pulmonary embolism patients are like snowflakes. No two are the same,” explained Richard Channick, MD, director of the pulmonary vascular disease program, University of California, Los Angeles.
Patient variability is an issue because algorithms for pulmonary embolism (PE) often differ at the point of diagnosis, such as the emergency department or intensive are unit, according to Dr. Channick, who was present when the first PERT was created in 2012 at Massachusetts General Hospital (MGH) in Boston. In addition, treatment algorithms can seem complex at a time when patients are deteriorating quickly.
“The treatment algorithms always say consider this or consider that, and then you get a recommendation with a 2B grade of evidence. So what do you do?” Dr. Channick asked, “This has really been crying for an organized approach.”
PERTs were created to fill this need. In most centers, PERTs are organized to respond to a diagnosis of PE wherever it occurs in the hospital. The goal is rapid activation of a team of experts who can reach a single consensus recommendation.
At MGH and UCLA, a similar relatively simple scheme has been created to guide physicians on how to activate the PERT and which situations make this appropriate.
“A big part of the PERT value has been our ability to conduct a real-time virtual consultation where we leverage online technology to look at images together in order to agree on a strategy,” Dr. Channick explained.
Although frequently asked what specialists are needed for an effective PERT, Dr. Channick said it depends on institutional structures, the types of specialists available, and, in some cases, the specific characteristics of the patient. In many situations, a pulmonary vascular specialist and an interventional radiologist might be sufficient. In others, team members might include some combination of an interventional cardiologist, a cardiac surgeon, and a hematologist.
It is also appropriate to include clinicians likely to participate in care following acute treatment of the PE. “One of the most critical values to PERT is the ability to systematically follow patients” after the PE is treated, Dr. Channick said.
So far, there are no data to confirm patients managed with PERT achieve better outcomes than those who are not. Reductions in mortality, length of stay, and costs are reasonably anticipated and might eventually be demonstrated, but Dr. Channick said that PERTs already have value.
“I think the efficiency of care is important,”he said. He called PERT a “one-stop shopping” approach to ensuring that multiple strategies are considered systematically.
There are many anecdotal examples of the benefits of shared decision-making for PE treatment. In one, a pulmonary specialist in a PERT team narrowly averted a planned thrombolysis in a patient diagnosed with PE who was actually found to have severe pulmonary fibrosis, according to Dr. Channick.
Not least important, the shared decision-making of a PERT could relieve the burden of difficult choices in complex situations. Bad outcomes in PE can be unavoidable even with optimal therapy.
“To me personally, a very important benefit of being part of a PERT is the feeling that we are all in it together,” Dr. Channick said. “Patients can go from being pretty stable to being dead very quickly.”
The PERT Consortium has sponsored an annual meeting on PE since 2015. It also maintains an ongoing registry for PE data from member institutions. These data are expected to have increasing value for comparing the impact of patient characteristics, treatment strategies, and other variables on outcomes.
For clinicians who are uncertain whether the PE incidence at their institution justifies a PERT, Dr. Channick had some advice. “If you build it, they will clot,” he said, meaning that due to the frequency of PE, a PERT will generally have plenty of work once created.
SOURCE: VEITHSYMPOSIUM
NEW YORK – Seven years after the formation of the first pulmonary embolism response team (PERT), more than 100 institutions have joined the PERT Consortium, which was created to guide care and research for this thrombotic complication, according to a status report at a symposium on vascular and endovascular issues sponsored by the Cleveland Clinic Foundation.
“Why are PERTs needed? Pulmonary embolism patients are like snowflakes. No two are the same,” explained Richard Channick, MD, director of the pulmonary vascular disease program, University of California, Los Angeles.
Patient variability is an issue because algorithms for pulmonary embolism (PE) often differ at the point of diagnosis, such as the emergency department or intensive are unit, according to Dr. Channick, who was present when the first PERT was created in 2012 at Massachusetts General Hospital (MGH) in Boston. In addition, treatment algorithms can seem complex at a time when patients are deteriorating quickly.
“The treatment algorithms always say consider this or consider that, and then you get a recommendation with a 2B grade of evidence. So what do you do?” Dr. Channick asked, “This has really been crying for an organized approach.”
PERTs were created to fill this need. In most centers, PERTs are organized to respond to a diagnosis of PE wherever it occurs in the hospital. The goal is rapid activation of a team of experts who can reach a single consensus recommendation.
At MGH and UCLA, a similar relatively simple scheme has been created to guide physicians on how to activate the PERT and which situations make this appropriate.
“A big part of the PERT value has been our ability to conduct a real-time virtual consultation where we leverage online technology to look at images together in order to agree on a strategy,” Dr. Channick explained.
Although frequently asked what specialists are needed for an effective PERT, Dr. Channick said it depends on institutional structures, the types of specialists available, and, in some cases, the specific characteristics of the patient. In many situations, a pulmonary vascular specialist and an interventional radiologist might be sufficient. In others, team members might include some combination of an interventional cardiologist, a cardiac surgeon, and a hematologist.
It is also appropriate to include clinicians likely to participate in care following acute treatment of the PE. “One of the most critical values to PERT is the ability to systematically follow patients” after the PE is treated, Dr. Channick said.
So far, there are no data to confirm patients managed with PERT achieve better outcomes than those who are not. Reductions in mortality, length of stay, and costs are reasonably anticipated and might eventually be demonstrated, but Dr. Channick said that PERTs already have value.
“I think the efficiency of care is important,”he said. He called PERT a “one-stop shopping” approach to ensuring that multiple strategies are considered systematically.
There are many anecdotal examples of the benefits of shared decision-making for PE treatment. In one, a pulmonary specialist in a PERT team narrowly averted a planned thrombolysis in a patient diagnosed with PE who was actually found to have severe pulmonary fibrosis, according to Dr. Channick.
Not least important, the shared decision-making of a PERT could relieve the burden of difficult choices in complex situations. Bad outcomes in PE can be unavoidable even with optimal therapy.
“To me personally, a very important benefit of being part of a PERT is the feeling that we are all in it together,” Dr. Channick said. “Patients can go from being pretty stable to being dead very quickly.”
The PERT Consortium has sponsored an annual meeting on PE since 2015. It also maintains an ongoing registry for PE data from member institutions. These data are expected to have increasing value for comparing the impact of patient characteristics, treatment strategies, and other variables on outcomes.
For clinicians who are uncertain whether the PE incidence at their institution justifies a PERT, Dr. Channick had some advice. “If you build it, they will clot,” he said, meaning that due to the frequency of PE, a PERT will generally have plenty of work once created.
SOURCE: VEITHSYMPOSIUM
REPORTING FROM THE VEITHSYMPOSIUM
Clinical Progress Note: High Flow Nasal Cannula Therapy for Bronchiolitis Outside the ICU in Infants
Viral bronchiolitis is the most common indication for infant hospitalization in the United States.1 The treatment mainstay remains supportive care, including supplemental oxygen when indicated.1 High flow nasal cannula (HFNC) therapy delivers humidified, heated air blended with oxygen, allowing much higher flow rates than standard nasal cannula therapy and is being used more frequently in inpatient settings.
OVERVIEW AND CLINICAL QUESTION
Infants and toddlers with bronchiolitis develop increased work of breathing to preserve oxygenation and ventilation in the setting of altered airway resistance and lung compliance.2,3 In addition to oxygen supplementation, HFNC is used to reduce work of breathing through several mechanisms:2-6 (1) Nasopharyngeal dead space washout clears oxygen-depleted gas at the end of expiration, facilitating alveolar ventilation (ie, carbon dioxide retention improves); (2) High flow rates match increased inspiratory flow demands of acutely ill patients, reducing nasopharyngeal inspiratory resistance and optimizing dead space washout, thus decreasing work of breathing; (3) Adequate flow rates generate distending pressure, which prevents pharyngeal collapse, supports lung recruitment, and reduces respiratory effort (demonstrated in younger infants); and (4) HFNC systems heat and humidify the breathing gas, reducing the metabolic work required to condition cool, dry gas and improving conductance and pulmonary compliance.2-5
HFNC therapy is used more commonly in acute care units despite limited literature on its effectiveness outside the intensive care unit (ICU).7,8 We asked the question, “Does use of HFNC therapy for infants with bronchiolitis hospitalized in acute care units result in improved outcomes when compared with standard nasal cannula oxygen therapy, including length of stay (LOS), oxygen therapy duration, and preventing escalations of care such as ICU transfer, positive pressure ventilation, and intubation?” Also, do published studies provide guidance for the initiation and management of HFNC? We focused our search on studies published in the last five years that included patients with bronchiolitis treated with HFNC outside the ICU; here, we review those studies most relevant to pediatric hospitalists.
RECENT LITERATURE REVIEW
No guideline exists for initiating flow or fraction of inspired oxygen (FiO2). HFNC may be initiated for hypoxia, increased work of breathing, or both in patients with bronchiolitis. To achieve optimal dead space washout, inspiratory flow, and distending pressure, initial flow rates should be 1.5 to 2 L/kg/min, particularly for infants and young children.2-5 Weiler et al.3 evaluated the breathing effort of ICU patients at 0.5, 1, 1.5, and 2 L/kg/min and found optimal flow rates for improved work of breathing were 1.5-2 L/kg/min. The smallest patients, ≤8 kg, saw the greatest benefit, a finding likely explained by larger anatomic dead space in infants/small children compared with older children.3 For older/larger children (>20 kg), an initial flow closer to 1 L/kg/min is often appropriate.5 When used for hypoxia, initiating flow without supplemental FiO2 may improve oxygenation by flushing nasopharyngeal dead space. FiO2 should be titrated to achieve the goal set by the treatment team, often ≥90%. Improvement in heart rate and peripheral oxygen saturation (SpO2) can be observed within 60 minutes of initiating HFNC in patients responsive to therapy.6
HFNC therapy is safe when used correctly.6,9,10Potential adverse effects include pneumothorax, pressure injury, mucosal injury/bleeding, and delayed escalation to invasive ventilation. While difficult to quantify, recent studies report low rates or no serious HFNC complications. For example, only 2 of 1,127 patients supported with HFNC developed a pneumothorax and neither required evacuation.2,9-12
Inclusion criteria and HFNC protocols vary among published studies. Most HFNC protocols reviewed may not have optimally supported all of the patients in their HFNC groups, often by limiting flow to <2 L/kg/min.6-9,11,12 These variables may explain the disparate results, with some studies demonstrating apparent benefits and others no difference.7,9,10,12
Two studies of infants with bronchiolitis showed HFNC therapy may prevent ICU transfer, but this benefit may be limited to rescue when standard oxygen therapy fails, rather than as a superior initial support modality.7,9 Kepreotes et al.9 reported a single-center, randomized controlled trial comparing HFNC with standard oxygen therapy with 101 patients in each treatment arm. The primary outcome, median time to wean off oxygen, was not significantly different between the two groups: 24 hours (95% CI: 18-28) in the HFNC group versus 20 hours in the standard therapy group (95% CI: 17-34). The HFNC group had fewer treatment failures (abnormal heart rate, respiratory rate, SpO2 <90%, or severe respiratory distress score while on maximum therapy) than the standard therapy group, and 20 (63%) of the 33 patients who failed standard therapy were rescued with HFNC, avoiding transfer to the ICU. Fourteen patients from the HFNC group and 12 from the standard oxygen group required transfer to the ICU for support escalation. Although this study did not show a significant difference in oxygen weaning time between groups, it appears to support HFNC use as a rescue modality to reduce or prevent ICU transfer.9 Franklin et al.10 conducted a multicenter, randomized, controlled trial to compare standard nasal cannula oxygen therapy with HFNC (2 L/kg/min) in 1,472 patients. Patients receiving HFNC had lower care escalation rates due to treatment failure, defined as the presence of at least three of four clinical criteria and the clinician determining escalation was indicated. Oxygen therapy duration, ICU admission rates, and LOS were not significantly different between groups. Similar to the previous study, a large portion of the standard therapy patients who failed treatment (102 of 167) crossed over to the HFNC arm in an attempt to avoid ICU transfer. Twelve patients required intubation: 8 (1%) receiving HFNC and 4 (0.5%) receiving the standard therapy.10
Two additional studies, both with study design limitations, did not demonstrate differences in ICU transfer rates and had variable differences in outcomes. Riese et al.7 retrospectively assessed HFNC use outside the ICU at one institution and included 936 patients admitted before and 1,001 patients admitted after HFNC guideline implementation on the wards. Flow rates were based on age and not weight. They found no difference in LOS, ICU transfer rate, ICU LOS, intubation rates, or 30-day readmission rates, though HFNC use increased over time. The HFNC guideline is a potentially significant limitation as it may not have provided optimal flow rates to all subjects given it was based on age rather than weight. Milani et al.12 performed a single-center observational study of 36 infants aged <12 months, treated for bronchiolitis on the ward, who were informally assigned to HFNC or standard therapy based upon HFNC device availability. HFNC flow rate was determined by the equation: L/min = 8 mL/kg × respiratory rate × 0.3. Using mean weight and respiratory rate for patients in this group, it appears patients in the HFNC group were treated with flow rates less than the 1.5-2 L/kg/min recommended to be effective.2,3,12 Despite this, clinical improvement was faster in the HFNC group, including respiratory rate and effort, ability to feed, days on oxygen supplementation, and hospital LOS. ICU admission was not different between the two groups.12 The Table compares the four studies discussed above.
Given increasing use of HFNC outside the ICU, institutions risk overuse and increased healthcare costs.13 Limited data on HFNC overuse exist, but several studies report increased use after implementation on the wards without robust evidence indicating it improves outcomes.7,14 Overuse of HFNC is a concern that should be considered as institutions develop HFNC protocols. Another important consideration is safe feeding. One study examined 132 children ages one month to two years with bronchiolitis who were receiving HFNC and enteral nutrition.15 Only one patient had aspiration respiratory failure, and 12 had nutrition interruptions, demonstrating oral nutrition is generally well tolerated15 and should be considered in patients with stable respiratory status on HFNC.
CONCLUSIONS
Many children’s hospitals have extended the use of HFNC outside the ICU for children with bronchiolitis despite the paucity of evidence demonstrating its benefit over standard flow oxygen. Given variation in protocols, study designs, outcomes, and number of patients studied, it is difficult to assess its efficacy outside the ICU. However, based on the studies reviewed herein, HFNC therapy does not appear to decrease LOS, time on oxygen, or escalations of care, such as ICU transfers, positive pressure ventilation, or intubation, when used as a primary therapy.7,9,11,12 Future research will ideally use optimal flow rates to determine the effectiveness of HFNC on acute care units. Although not addressed in the above studies, additional benefits to be considered in future studies include: (1) increased critical care capacity by allowing patients to be supported on the floor and (2) the ability for patients to remain closer to home when HFNC is used in the community hospital setting.
In each of the large, randomized studies reviewed, most (66%-75%) patients treated with standard low flow oxygen were supported successfully and did not require escalation to HFNC.9,10 Hospitalists should continue to use standard low flow oxygen as first-line respiratory support for patients with bronchiolitis.1 No evidence supports the use of HFNC therapy early in a child’s inpatient course; rather, it should be used when standard oxygen therapy fails. Future research should focus on better elucidating which patients will benefit most from HFNC to prevent overuse.
1. Ralston SL, Lieberthal AS, Meissner HC, et al. Clinical practice guideline: the diagnosis, management, and prevention of bronchiolitis. Pediatrics. 2014;134(5):e1474-1502. https://doi.org/10.1542/peds.2014-2742.
2. Milesi C, Baleine J, Matecki S, et al. Is treatment with a high flow nasal cannula effective in acute viral bronchiolitis? A physiologic study. Intensive Care Med. 2013;39(6):1088-1094. https://doi.org/10.1007/s00134-013-2879-y.
3. Weiler T, Kamerkar A, Hotz J, Ross PA, Newth CJL, Khemani RG. The relationship between high flow nasal cannula flow rate and effort of breathing in children. J Pediatr. 2017;189:66-71. https://doi.org/10.1016/j.jpeds.2017.06.006.
4. Dysart K, Miller TL, Wolfson MR, Shaffer TH. Research in high flow therapy: mechanisms of action. Respir Med. 2009;103(10):1400-1405. https://doi.org/10.1016/j.rmed.2009.04.007.
5. Milesi C, Boubal M, Jacquot A, et al. High-flow nasal cannula: recommendations for daily practice in pediatrics. Ann Intensive Care. 2014;4(1):29. https://doi.org/10.1186/s13613-014-0029-5.
6. Heikkila P, Sokuri P, Mecklin M, et al. Using high-flow nasal cannulas for infants with bronchiolitis admitted to paediatric wards is safe and feasible. Acta Paediatr. 2018;107(11):1971-1976. https://doi.org/10.1111/apa.14421.
7. Riese J, Porter T, Fierce J, Riese A, Richardson T, Alverson BK. Clinical outcomes of bronchiolitis after implementation of a general ward high flow nasal cannula guideline. Hosp Pediatr. 2017;7(4):197-203. https://doi.org/10.1542/hpeds.2016-0195.
8. Betters KA, Gillespie SE, Miller J, Kotzbauer D, Hebbar KB. High flow nasal cannula use outside of the ICU; factors associated with failure. Pediatr Pulmonol. 2017;52(6):806-812. https://doi.org/10.1002/ppul.23626.
9. Kepreotes E, Whitehead B, Attia J, et al. High-flow warm humidified oxygen versus standard low-flow nasal cannula oxygen for moderate bronchiolitis (HFWHO RCT): an open, phase 4, randomised controlled trial. Lancet. 2017;389(10072):930-939. https://doi.org/10.1016/S0140-6736(17)30061-2.
10. Franklin D, Babl FE, Schibler A. High-flow oxygen therapy in infants with bronchiolitis. N Engl J Med. 2018;378(25):2446-2447. https://doi.org/10.1056/NEJMc1805312.
11. Mayfield S, Bogossian F, O’Malley L, Schibler A. High-flow nasal cannula oxygen therapy for infants with bronchiolitis: pilot study. J Paediatr Child Health. 2014;50(5):373-378. https://doi.org/10.1111/jpc.12509.
12. Milani GP, Plebani AM, Arturi E, et al. Using a high-flow nasal cannula provided superior results to low-flow oxygen delivery in moderate to severe bronchiolitis. Acta Paediatr. 2016;105(8):e368-e372. https://doi.org/10.1111/apa.13444.
13. Modesto i Alapont V, Garcia Cusco M, Medina A. High-flow oxygen therapy in infants with bronchiolitis. N Engl J Med. 2018;378(25):2444. https://doi.org/10.1056/NEJMc1805312.
14. Mace AO, Gibbons J, Schultz A, Knight G, Martin AC. Humidified high-flow nasal cannula oxygen for bronchiolitis: should we go with the flow? Arch Dis Child. 2018;103(3):303. https://doi.org/10.1136/archdischild-2017-313950.
15. Sochet AA, McGee JA, October TW. Oral nutrition in children with bronchiolitis on high-flow nasal cannula is well tolerated. Hosp Pediatr. 2017;7(5):249-255. https://doi.org/10.1542/hpeds.2016-0131.
Viral bronchiolitis is the most common indication for infant hospitalization in the United States.1 The treatment mainstay remains supportive care, including supplemental oxygen when indicated.1 High flow nasal cannula (HFNC) therapy delivers humidified, heated air blended with oxygen, allowing much higher flow rates than standard nasal cannula therapy and is being used more frequently in inpatient settings.
OVERVIEW AND CLINICAL QUESTION
Infants and toddlers with bronchiolitis develop increased work of breathing to preserve oxygenation and ventilation in the setting of altered airway resistance and lung compliance.2,3 In addition to oxygen supplementation, HFNC is used to reduce work of breathing through several mechanisms:2-6 (1) Nasopharyngeal dead space washout clears oxygen-depleted gas at the end of expiration, facilitating alveolar ventilation (ie, carbon dioxide retention improves); (2) High flow rates match increased inspiratory flow demands of acutely ill patients, reducing nasopharyngeal inspiratory resistance and optimizing dead space washout, thus decreasing work of breathing; (3) Adequate flow rates generate distending pressure, which prevents pharyngeal collapse, supports lung recruitment, and reduces respiratory effort (demonstrated in younger infants); and (4) HFNC systems heat and humidify the breathing gas, reducing the metabolic work required to condition cool, dry gas and improving conductance and pulmonary compliance.2-5
HFNC therapy is used more commonly in acute care units despite limited literature on its effectiveness outside the intensive care unit (ICU).7,8 We asked the question, “Does use of HFNC therapy for infants with bronchiolitis hospitalized in acute care units result in improved outcomes when compared with standard nasal cannula oxygen therapy, including length of stay (LOS), oxygen therapy duration, and preventing escalations of care such as ICU transfer, positive pressure ventilation, and intubation?” Also, do published studies provide guidance for the initiation and management of HFNC? We focused our search on studies published in the last five years that included patients with bronchiolitis treated with HFNC outside the ICU; here, we review those studies most relevant to pediatric hospitalists.
RECENT LITERATURE REVIEW
No guideline exists for initiating flow or fraction of inspired oxygen (FiO2). HFNC may be initiated for hypoxia, increased work of breathing, or both in patients with bronchiolitis. To achieve optimal dead space washout, inspiratory flow, and distending pressure, initial flow rates should be 1.5 to 2 L/kg/min, particularly for infants and young children.2-5 Weiler et al.3 evaluated the breathing effort of ICU patients at 0.5, 1, 1.5, and 2 L/kg/min and found optimal flow rates for improved work of breathing were 1.5-2 L/kg/min. The smallest patients, ≤8 kg, saw the greatest benefit, a finding likely explained by larger anatomic dead space in infants/small children compared with older children.3 For older/larger children (>20 kg), an initial flow closer to 1 L/kg/min is often appropriate.5 When used for hypoxia, initiating flow without supplemental FiO2 may improve oxygenation by flushing nasopharyngeal dead space. FiO2 should be titrated to achieve the goal set by the treatment team, often ≥90%. Improvement in heart rate and peripheral oxygen saturation (SpO2) can be observed within 60 minutes of initiating HFNC in patients responsive to therapy.6
HFNC therapy is safe when used correctly.6,9,10Potential adverse effects include pneumothorax, pressure injury, mucosal injury/bleeding, and delayed escalation to invasive ventilation. While difficult to quantify, recent studies report low rates or no serious HFNC complications. For example, only 2 of 1,127 patients supported with HFNC developed a pneumothorax and neither required evacuation.2,9-12
Inclusion criteria and HFNC protocols vary among published studies. Most HFNC protocols reviewed may not have optimally supported all of the patients in their HFNC groups, often by limiting flow to <2 L/kg/min.6-9,11,12 These variables may explain the disparate results, with some studies demonstrating apparent benefits and others no difference.7,9,10,12
Two studies of infants with bronchiolitis showed HFNC therapy may prevent ICU transfer, but this benefit may be limited to rescue when standard oxygen therapy fails, rather than as a superior initial support modality.7,9 Kepreotes et al.9 reported a single-center, randomized controlled trial comparing HFNC with standard oxygen therapy with 101 patients in each treatment arm. The primary outcome, median time to wean off oxygen, was not significantly different between the two groups: 24 hours (95% CI: 18-28) in the HFNC group versus 20 hours in the standard therapy group (95% CI: 17-34). The HFNC group had fewer treatment failures (abnormal heart rate, respiratory rate, SpO2 <90%, or severe respiratory distress score while on maximum therapy) than the standard therapy group, and 20 (63%) of the 33 patients who failed standard therapy were rescued with HFNC, avoiding transfer to the ICU. Fourteen patients from the HFNC group and 12 from the standard oxygen group required transfer to the ICU for support escalation. Although this study did not show a significant difference in oxygen weaning time between groups, it appears to support HFNC use as a rescue modality to reduce or prevent ICU transfer.9 Franklin et al.10 conducted a multicenter, randomized, controlled trial to compare standard nasal cannula oxygen therapy with HFNC (2 L/kg/min) in 1,472 patients. Patients receiving HFNC had lower care escalation rates due to treatment failure, defined as the presence of at least three of four clinical criteria and the clinician determining escalation was indicated. Oxygen therapy duration, ICU admission rates, and LOS were not significantly different between groups. Similar to the previous study, a large portion of the standard therapy patients who failed treatment (102 of 167) crossed over to the HFNC arm in an attempt to avoid ICU transfer. Twelve patients required intubation: 8 (1%) receiving HFNC and 4 (0.5%) receiving the standard therapy.10
Two additional studies, both with study design limitations, did not demonstrate differences in ICU transfer rates and had variable differences in outcomes. Riese et al.7 retrospectively assessed HFNC use outside the ICU at one institution and included 936 patients admitted before and 1,001 patients admitted after HFNC guideline implementation on the wards. Flow rates were based on age and not weight. They found no difference in LOS, ICU transfer rate, ICU LOS, intubation rates, or 30-day readmission rates, though HFNC use increased over time. The HFNC guideline is a potentially significant limitation as it may not have provided optimal flow rates to all subjects given it was based on age rather than weight. Milani et al.12 performed a single-center observational study of 36 infants aged <12 months, treated for bronchiolitis on the ward, who were informally assigned to HFNC or standard therapy based upon HFNC device availability. HFNC flow rate was determined by the equation: L/min = 8 mL/kg × respiratory rate × 0.3. Using mean weight and respiratory rate for patients in this group, it appears patients in the HFNC group were treated with flow rates less than the 1.5-2 L/kg/min recommended to be effective.2,3,12 Despite this, clinical improvement was faster in the HFNC group, including respiratory rate and effort, ability to feed, days on oxygen supplementation, and hospital LOS. ICU admission was not different between the two groups.12 The Table compares the four studies discussed above.
Given increasing use of HFNC outside the ICU, institutions risk overuse and increased healthcare costs.13 Limited data on HFNC overuse exist, but several studies report increased use after implementation on the wards without robust evidence indicating it improves outcomes.7,14 Overuse of HFNC is a concern that should be considered as institutions develop HFNC protocols. Another important consideration is safe feeding. One study examined 132 children ages one month to two years with bronchiolitis who were receiving HFNC and enteral nutrition.15 Only one patient had aspiration respiratory failure, and 12 had nutrition interruptions, demonstrating oral nutrition is generally well tolerated15 and should be considered in patients with stable respiratory status on HFNC.
CONCLUSIONS
Many children’s hospitals have extended the use of HFNC outside the ICU for children with bronchiolitis despite the paucity of evidence demonstrating its benefit over standard flow oxygen. Given variation in protocols, study designs, outcomes, and number of patients studied, it is difficult to assess its efficacy outside the ICU. However, based on the studies reviewed herein, HFNC therapy does not appear to decrease LOS, time on oxygen, or escalations of care, such as ICU transfers, positive pressure ventilation, or intubation, when used as a primary therapy.7,9,11,12 Future research will ideally use optimal flow rates to determine the effectiveness of HFNC on acute care units. Although not addressed in the above studies, additional benefits to be considered in future studies include: (1) increased critical care capacity by allowing patients to be supported on the floor and (2) the ability for patients to remain closer to home when HFNC is used in the community hospital setting.
In each of the large, randomized studies reviewed, most (66%-75%) patients treated with standard low flow oxygen were supported successfully and did not require escalation to HFNC.9,10 Hospitalists should continue to use standard low flow oxygen as first-line respiratory support for patients with bronchiolitis.1 No evidence supports the use of HFNC therapy early in a child’s inpatient course; rather, it should be used when standard oxygen therapy fails. Future research should focus on better elucidating which patients will benefit most from HFNC to prevent overuse.
1. Ralston SL, Lieberthal AS, Meissner HC, et al. Clinical practice guideline: the diagnosis, management, and prevention of bronchiolitis. Pediatrics. 2014;134(5):e1474-1502. https://doi.org/10.1542/peds.2014-2742.
2. Milesi C, Baleine J, Matecki S, et al. Is treatment with a high flow nasal cannula effective in acute viral bronchiolitis? A physiologic study. Intensive Care Med. 2013;39(6):1088-1094. https://doi.org/10.1007/s00134-013-2879-y.
3. Weiler T, Kamerkar A, Hotz J, Ross PA, Newth CJL, Khemani RG. The relationship between high flow nasal cannula flow rate and effort of breathing in children. J Pediatr. 2017;189:66-71. https://doi.org/10.1016/j.jpeds.2017.06.006.
4. Dysart K, Miller TL, Wolfson MR, Shaffer TH. Research in high flow therapy: mechanisms of action. Respir Med. 2009;103(10):1400-1405. https://doi.org/10.1016/j.rmed.2009.04.007.
5. Milesi C, Boubal M, Jacquot A, et al. High-flow nasal cannula: recommendations for daily practice in pediatrics. Ann Intensive Care. 2014;4(1):29. https://doi.org/10.1186/s13613-014-0029-5.
6. Heikkila P, Sokuri P, Mecklin M, et al. Using high-flow nasal cannulas for infants with bronchiolitis admitted to paediatric wards is safe and feasible. Acta Paediatr. 2018;107(11):1971-1976. https://doi.org/10.1111/apa.14421.
7. Riese J, Porter T, Fierce J, Riese A, Richardson T, Alverson BK. Clinical outcomes of bronchiolitis after implementation of a general ward high flow nasal cannula guideline. Hosp Pediatr. 2017;7(4):197-203. https://doi.org/10.1542/hpeds.2016-0195.
8. Betters KA, Gillespie SE, Miller J, Kotzbauer D, Hebbar KB. High flow nasal cannula use outside of the ICU; factors associated with failure. Pediatr Pulmonol. 2017;52(6):806-812. https://doi.org/10.1002/ppul.23626.
9. Kepreotes E, Whitehead B, Attia J, et al. High-flow warm humidified oxygen versus standard low-flow nasal cannula oxygen for moderate bronchiolitis (HFWHO RCT): an open, phase 4, randomised controlled trial. Lancet. 2017;389(10072):930-939. https://doi.org/10.1016/S0140-6736(17)30061-2.
10. Franklin D, Babl FE, Schibler A. High-flow oxygen therapy in infants with bronchiolitis. N Engl J Med. 2018;378(25):2446-2447. https://doi.org/10.1056/NEJMc1805312.
11. Mayfield S, Bogossian F, O’Malley L, Schibler A. High-flow nasal cannula oxygen therapy for infants with bronchiolitis: pilot study. J Paediatr Child Health. 2014;50(5):373-378. https://doi.org/10.1111/jpc.12509.
12. Milani GP, Plebani AM, Arturi E, et al. Using a high-flow nasal cannula provided superior results to low-flow oxygen delivery in moderate to severe bronchiolitis. Acta Paediatr. 2016;105(8):e368-e372. https://doi.org/10.1111/apa.13444.
13. Modesto i Alapont V, Garcia Cusco M, Medina A. High-flow oxygen therapy in infants with bronchiolitis. N Engl J Med. 2018;378(25):2444. https://doi.org/10.1056/NEJMc1805312.
14. Mace AO, Gibbons J, Schultz A, Knight G, Martin AC. Humidified high-flow nasal cannula oxygen for bronchiolitis: should we go with the flow? Arch Dis Child. 2018;103(3):303. https://doi.org/10.1136/archdischild-2017-313950.
15. Sochet AA, McGee JA, October TW. Oral nutrition in children with bronchiolitis on high-flow nasal cannula is well tolerated. Hosp Pediatr. 2017;7(5):249-255. https://doi.org/10.1542/hpeds.2016-0131.
© 2020 Society of Hospital Medicine
High-Flow Nasal Cannula Oxygen in Patients with Acute Respiratory Failure and Do-Not-Intubate or Do-Not-Resuscitate Orders: A Systematic Review
High-flow nasal cannula (HFNC) oxygen therapy is effective in treating adults with acute hypoxemic respiratory failure, and to a lesser extent acute hypercapnic respiratory failure.1-3 HFNC oxygen is capable of delivering oxygen with flows of 30-60 liters/minute, and can provide a high fraction of inspired oxygen, flush anatomic dead space, augment respiratory efforts, and provide mild continuous positive airway pressure effects. Several systematic reviews and meta-analyses have evaluated the effectiveness of HFNC oxygen and have shown modestly lower rates of intubation compared with conventional oxygen4,5 and similar intubation rates compared with noninvasive positive pressure ventilation.4-9 Although one randomized trial showed a lower risk of 90-day mortality for HFNC oxygen compared with either conventional oxygen or noninvasive positive pressure ventilation, several meta-analyses have shown no difference in intensive care unit (ICU) mortality.4,6,8,10 The majority of studies have shown improvements in oxygenation, comfort, dyspnea scores, and breathing pattern with the initiation of HFNC oxygen.6
While the evidence to support the use of HFNC oxygen in patients with nonhypercapnic acute hypoxemic respiratory failure is growing, this evidence is based on patients enrolled in clinical trials who have no treatment limitations and consent to intubation if necessary. Indeed, several, if not all, randomized trials evaluating HFNC oxygen excluded patients who had do-not-intubate (DNI) or do-not-resuscitate (DNR) orders.1,2,11 For patients with acute respiratory failure whose primary goal is not to extend life or utilize life support interventions such as invasive mechanical ventilation, HFNC oxygen may offer several benefits compared with other treatment options such as noninvasive positive pressure ventilation, conventional oxygen therapy, or palliative opioid therapy (Appendix Table 1). Determining which treatment options to use depends on the goals of care of the individual patient and the reasonable ability of a particular treatment to help the patient achieve those goals.
While a recent systematic review evaluated the existing evidence regarding the utility and outcomes of noninvasive positive pressure ventilation in adult patients with DNI orders,12 a systematic review evaluating the evidence and rationale for HFNC oxygen in patients with DNI and/or DNR orders is lacking. Assessing such evidence is necessary to help clinicians and patients determine appropriate treatment choices and establish research priorities. Therefore, our primary objective was to determine what were the following outcomes: mortality, dyspnea, work of breathing, opioid doses, and quality of life in patients who received HFNC oxygen for acute respiratory failure and had a DNI and/or DNR order.
METHODS
We conducted a systematic review of studies that evaluated patients who used HFNC oxygen for acute respiratory failure and had a DNI and/or DNR order. We reported the results using the Preferred Reporting Items for Systematic Reviews and Meta-Analyses (PRISMA) statements.13 This review was registered with the PROSPERO registry, CRD42017059914.
We included studies that enrolled patients who were (1) hospitalized, (2) >18 years old, (3) had an acute respiratory failure of any cause, (4) received HFNC oxygen, and (5) had a DNI or DNR or comfort measures only order. We included publications of all study designs (interventional, observational, and posthoc analyses) and all languages. We excluded studies that enrolled <5 patients. If necessary, we contacted the authors of the included studies for additional information.
Our search strategy included the following databases from inception to October 14, 2018: PubMed, MEDLINE, CINAHL, MICROMEDEX, EMBASE, Web of Science, and Scopus. The database-specific search strategy was developed using an experienced librarian (Appendix Table 2). In addition, we screened the reference lists of systematic reviews as well as the included studies to find additional relevant articles. Two authors (AM, MEW) independently assessed the inclusion criteria of the titles and abstracts that were identified in the search. In addition, these two authors abstracted relevant data of the included studies.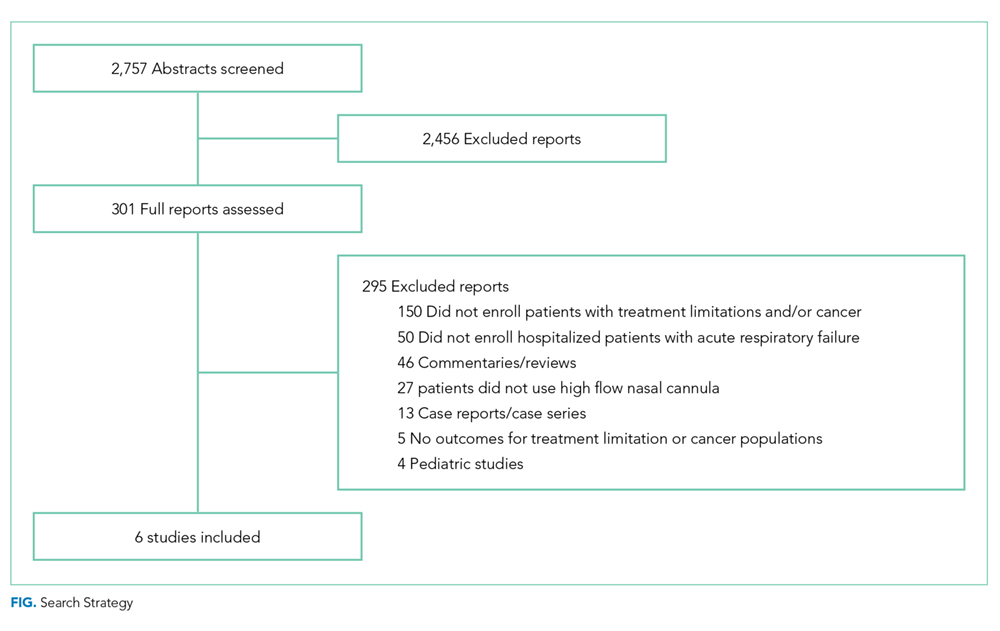
The primary outcomes were mortality, dyspnea and work of breathing, quality of life, and reduction of opioid doses. Secondary, posthoc, outcomes included the transition to noninvasive positive pressure ventilation (NPPV), tolerance of HFNC, adverse events, and quality of death in nonsurvivors. The risk of bias was evaluated using a modified Newcastle-Ottawa Quality Assessment Scale (Appendix Table 3).
RESULTS
Using the search strategy, we identified 2,757 citations and included 301 of these in the full-text review (Figure). We included six studies, which enrolled 293 patients in the final systematic review. Table 1 summarizes the characteristics of the included investigations, all of which were observational studies.15-20 The studies were conducted in the United States of America (n = 3), Europe (n = 2), and Asia (n = 1). Two studies were conducted in the general ICU populations and included patients with hypoxemic respiratory failure only. Four studies were conducted in cancer populations in the hospital wards or ICU and did not specify the type of respiratory failure (hypoxemic versus hypercapnic). Two studies included patients with DNI orders only.15,20 One study included patients with DNR orders only (DNI orders were excluded).17 Three studies included patients with both DNR and DNI orders.16,18,19 The numbers of enrolled patients with treatment limitations were generally low, with the two largest studies including 101 patients each on HFNC oxygen.18,19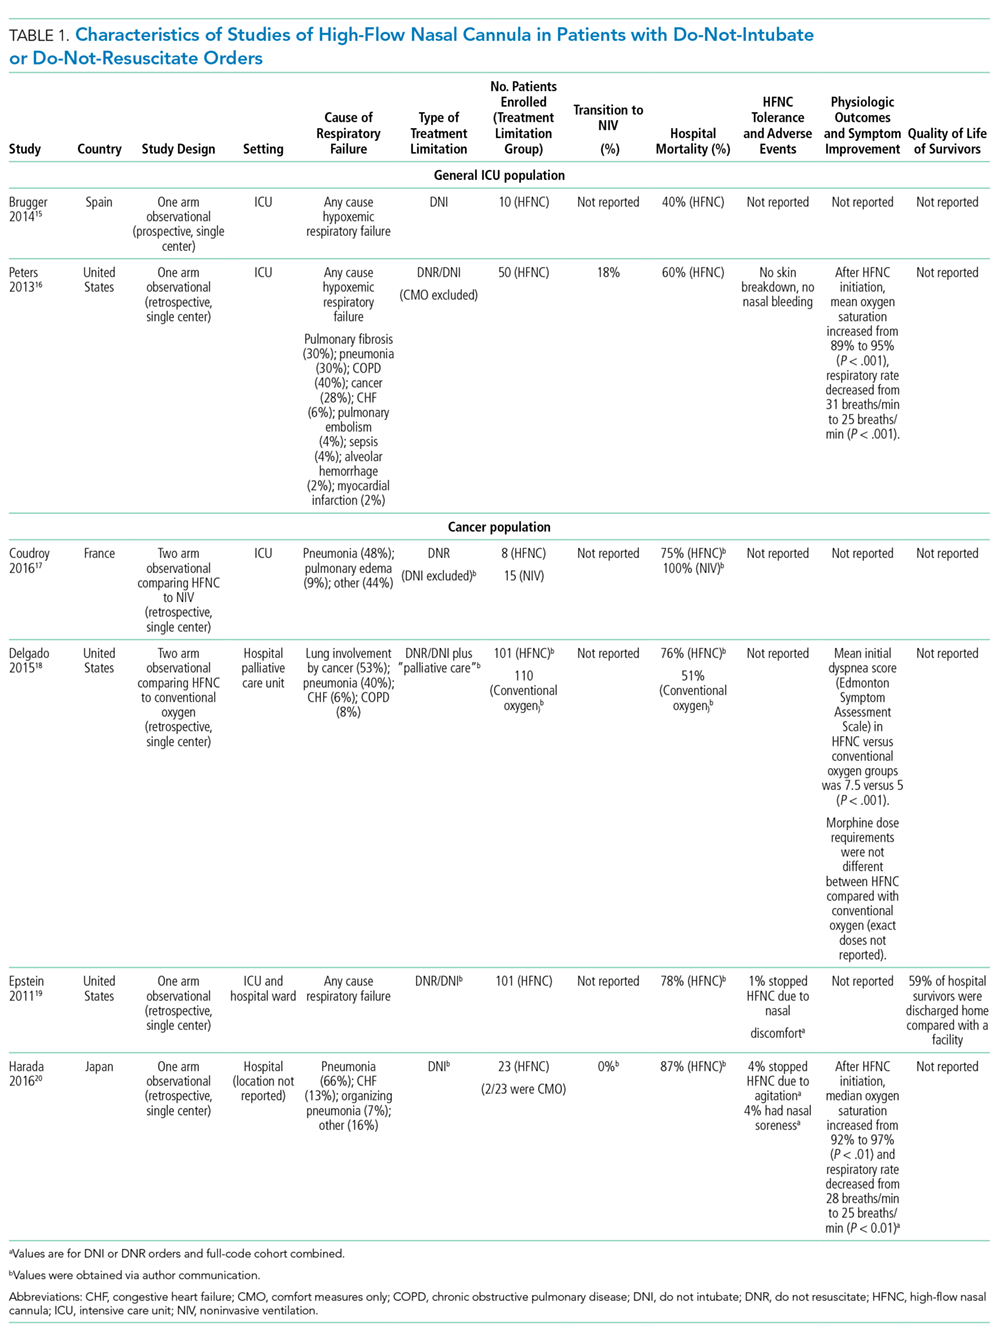
Risk of Bias
All included studies had a high risk of bias (Table 2). A high risk of bias was suggested because the investigations were single-center studies with unclear patient selection methods, did not explicitly report how decisions to limit treatments were made, and did not explicitly differentiate and separately analyze patients with “comfort measures only” goals of care.
Mortality
The hospital mortality rates of patients with DNI and/or DNR orders receiving HFNC were variable and ranged from 40% to 87%. In the two studies enrolling general ICU patient populations, the hospital mortality rates ranged from 40% to 60%. In the four studies enrolling patients with active malignancy, the hospital mortality rates ranged from 75% to 87%. No studies compared mortality rates with and without DNI and/or DNR orders.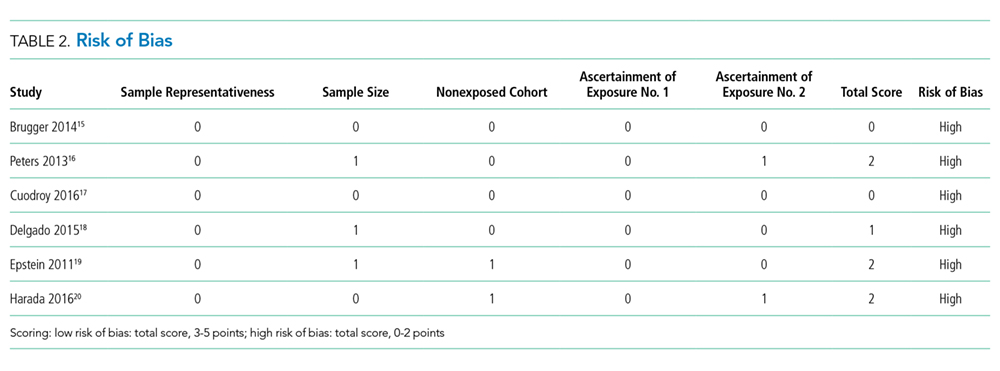
Dyspnea, Work of Breathing, and Reduction in Opioid Doses
The impact of HFNC oxygen on symptom relief was reported in one retrospective observational study (published as a conference abstract only to date), which compared the effect of HFNC oxygen (n = 101) with conventional oxygen (n = 110).18 At first evaluation after hospital admission to a palliative care unit (after the patients had previously been started on either conventional oxygen or high-flow oxygen), patients in the HFNC oxygen group had worse (higher) dyspnea scores compared with patients who used conventional oxygen (Edmonton Symptom Assessment Scale score of 7.5 versus 5, P < .001). At follow-up, approximately 24 hours after admission to the hospital palliative care unit, there was no difference in the change of dyspnea between the HFNC oxygen group (dyspnea score change of 0) and the conventional oxygen group (dyspnea score change of −1, P = .18. In the same study, there was also no significant difference in the morphine dose requirement in each group, and exact doses were not reported.
Two studies reported improvement in oxygen saturation and respiratory rate after HFNC oxygen initiation (compared with before HFNC initiation).16,20 Oxygen saturation increased from 89% to 95%, P < .01, in one study and 92% to 97%, P < .01, in a second study. The respiratory rate decreased from 31 to 25 breaths/minute in one study, and from 28 to 25 breaths/minute in a second study (both P < .01).
Quality of Life
No studies evaluated the quality of life of survivors.
Secondary Outcomes
Transition to Noninvasive Positive Pressure Ventilation
The proportion of patients who transitioned from HFNC oxygen to NPPV was relatively low in the two studies that reported this outcome, ranging from 0%20 to 18%.16 In one observational study of a general ICU population, 9/50 (18%) of patients transitioned from HFNC oxygen to NPPV. There was no statistically significant difference in hospital mortality rates among those who progressed to NPPV (67%) versus those who did not progress to NPPV (58%), P = .72.
Tolerance of HFNC and Adverse Events
HFNC oxygen was generally well tolerated based on the assessment of three studies (Table 1). One study reported no adverse events,16 one study reported that HFNC oxygen had to be discontinued because of nasal discomfort in 1% of patients,19 and a second study reported that HFNC oxygen had to be discontinued because of agitation in 4% of patients.20
Quality of Death in Nonsurvivors
No studies evaluated the quality of death in those patients who died.
DISCUSSION
In this systematic review of six studies, all with a high risk of bias, a significant proportion of patients with a DNI and/or DNR order who used HFNC oxygen survived to hospital discharge. Oxygen saturation and respiratory rate consistently improved in the three studies that reported these outcomes. Only one study (published as a conference abstract only to date),18 however, measured patient-important outcomes related to symptom management and found no significant difference in dyspnea or morphine dose requirements in patients on HFNC oxygen compared with patients on conventional oxygen. HFNC oxygen was generally well tolerated and only had to be stopped in <5% of patients due to intolerance. We found no studies that assessed the quality of life in survivors or the quality of death in nonsurvivors.
Based on the limited evidence in the included studies, HFNC may be a viable treatment option for patients with preset treatment limitations who have acute respiratory failure—with potential benefits of improved oxygenation, decreased respiratory rates, and hospital survival in a proportion of patients. Nevertheless, this systematic review highlights the vast paucity of data available to guide the use of HFNC oxygen in patients with treatment limitations and acute respiratory failure. Only a few studies, which were at high risk of bias, have been conducted on this topic to date. There is an inadequate evidence base to evaluate the comparative effectiveness of HFNC oxygen (versus NPPV versus conventional oxygen versus palliative opioids) in patients with DNI orders or comfort measures only orders.
Our review included two studies that evaluated the comparative effectiveness of HFNC oxygen in patients with DNI and/or DNR orders. The first retrospective observational study compared HFNC oxygen with conventional oxygen in patients with DNR and DNI orders and malignancy—and found no change in dyspnea—but did note an increase in mortality with HFNC oxygen (76% versus 51%).18 The second observational study compared HFNC oxygen with NPPV in patients with DNR orders with malignancy noted no difference in mortality.17 In patients with full-code orders, systematic reviews have shown that HFNC oxygen (compared with conventional oxygen) was associated with possible reductions in intubation rates, respiratory rates, and improvements in oxygenation—with no difference in mortality, dyspnea, patient comfort, or ICU/hospital length of stay. Compared with NPPV, HFNC oxygen was associated with similar rates of intubation and mortality.4-6,21
Future studies in patients with acute respiratory failure and DNI and/or DNR orders should identify which treatment modality (HFNC oxygen compared with other modalities, such as NPPV, conventional oxygen, with or without palliative opioids) impacts outcomes, such as dyspnea reduction while maintaining an alert mental status, short- and long-term quality of life in survivors, and quality of death in nonsurvivors. Future studies should also identify the optimal treatment pathway to utilize when patients using HFNC oxygen fail this therapy (eg, transition to NPPV versus intensifying palliative opioids) as well as the optimal process to withdraw palliative HFNC oxygen.22 Identifying which patient populations may benefit from different treatment pathways should also be considered as different treatment strategies may be more beneficial in different patient populations (eg, based on cause and severity of acute respiratory failure). In addition, it should be noted that the primary goal of care might affect which outcomes are the most important to measure. While patients with comfort measures only, orders usually have a primary goal to prepare for a high-quality death, patients with DNI and/or DNR orders (but without comfort measures only orders) may have a primary goal to survive—but with the desire not to endure the high burden of intubation and mechanical ventilation if it became necessary. Finally, future studies should utilize high-quality study designs (eg, randomized controlled trials) that enable robust evaluation of comparative effectiveness of clinically relevant treatment strategies.
While several previous systematic reviews have evaluated the efficacy of HFNC in patients with acute respiratory failure without preset limitations on life support; to our knowledge, this is the first systematic review to assess outcomes in patients rigorously with preset treatment limitations. Our review is, however, limited by the high risk of bias of the studies that were included (single-center nature, retrospective observational study designs, small sample sizes, and lack of a description of how DNI and/or DNR statuses were determined) as well as the small number of studies available to be included.
CONCLUSIONS
This systematic review points to a significant evidence gap in our understanding of the role for HFNC oxygen (compared with other acceptable alternative treatment strategies) in adult patients with acute respiratory failure who have DNI and/or DNR orders. Further high-quality research is needed to explore these unanswered questions in an effort to best treat, guide, and engage in optimal end-of-life decision making among patients with acute respiratory failure.
1. Frat J-P, Thille AW, Mercat A, et al. High-flow oxygen through nasal cannula in acute hypoxemic respiratory failure. N Eng J Med. 2015;372(23):2185-2196. https://doi.org/ 10.1056/NEJMoa1503326.
2. Stephan F, Barrucand B, Petit P, et al. High-flow nasal oxygen vs noninvasive positive airway pressure in hypoxemic patients after cardiothoracic surgery: a randomized clinical trial. JAMA. 2015;313(23):2331-2339. https://doi.org/ 10.1001/jama.2015.5213.
3. Lee MK, Choi J, Park B, et al. High flow nasal cannulae oxygen therapy in acute-moderate hypercapnic respiratory failure. Clin Respir J. 2018;12(6):2046-2056. https://doi.org/10.1111/crj.12772 28.
4. Ni YN, Luo J, Yu H, et al. Can high-flow nasal cannula reduce the rate of endotracheal intubation in adult patients with acute respiratory failure compared with conventional oxygen therapy and noninvasive positive pressure ventilation?: a systematic review and meta-analysis. Chest. 2017;151(4):764-775. https://doi.org/10.1016/j.chest.2017.01.004.
5. Ou X, Hua Y, Liu J, Gong C, Zhao W. Effect of high-flow nasal cannula oxygen therapy in adults with acute hypoxemic respiratory failure: a meta-analysis of randomized controlled trials. CMAJ. 2017;189(7):E260-E267. https://doi.org/10.1503/cmaj.160570.
6. Monro-Somerville T, Sim M, Ruddy J, Vilas M, Gillies MA. The effect of high-flow nasal cannula oxygen therapy on mortality and intubation rate in acute respiratory failure: a systematic review and meta-analysis. Crit Care Med. 2017;45(4):e449-e456. https://doi.org/10.1097/CCM.0000000000002091.
7. Maitra S, Som A, Bhattacharjee S, Arora MK, Baidya DK. Comparison of high-flow nasal oxygen therapy with conventional oxygen therapy and noninvasive ventilation in adult patients with acute hypoxemic respiratory failure: a meta-analysis and systematic review. J Crit Care. 2016;35:138-144. https://doi.org/10.1016/j.jcrc.2016.05.013.
8. Nedel WL, Deutschendorf C, Moraes Rodrigues Filho E. High-flow nasal cannula in critically ill subjects with or at risk for respiratory failure: a systematic review and meta-analysis. Respir Care. 2017;62(1):123-132. https://doi.org/10.4187/respcare.04831.
9. Zhu Y, Yin H, Zhang R, Wei J. High-flow nasal cannula oxygen therapy vs conventional oxygen therapy in cardiac surgical patients: a meta-analysis. J Crit Care. 2017;38:123-128. https://doi.org/10.1016/j.jcrc.2016.10.027.
10. Leeies M, Flynn E, Turgeon AF, et al. High-flow oxygen via nasal cannulae in patients with acute hypoxemic respiratory failure: a systematic review and meta-analysis. Syst Rev. 2017;6(1):202. https://doi.org/10.1186/s13643-017-0593-5.
11. Hernandez G, Vaquero C, Gonzalez P, et al. Effect of postextubation high-flow nasal cannula vs conventional oxygen therapy on reintubation in low-risk patients: a randomized clinical trial. JAMA. 2016;315(13):1354-1361. https://doi.org/10.1001/jama.2016.2711.
12. Wilson ME, Majzoub AM, Dobler CC, et al. Noninvasive ventilation in patients with do-not-intubate and comfort-measures-only orders: a systematic review and meta-analysis. Crit Care Med. 2018. 46(8):1209-1216. https://doi.org/10.1097/CCM.0000000000003082.
13. Moher D, Liberati A, Tetzlaff J, Altman DG. Preferred reporting items for systematic reviews and meta-analyses: the PRISMA statement. BMJ. 2009;339:b2535. https://doi.org/10.1136/bmj.b2535.
14. Stroup DF, Berlin JA, Morton SC, et al. Meta-analysis of observational studies in epidemiology: a proposal for reporting. Meta-analysis Of Observational Studies in Epidemiology (MOOSE) group. JAMA. 2000;283(15):2008-2012. https://doi.org/10.1001/jama.283.15.2008.
15. Brugger SC, Rodriguez S, Domingo J, et al. High-flow nasal cannula therapy (HFNC) for patients with severe acute respiratory failure and do not intubate orders. Pilot study. Palliative Medicine. 2014;28(6):755.
16. Peters SG, Holets SR, Gay PC. High-flow nasal cannula therapy in do-not-intubate patients with hypoxemic respiratory distress. Respir Care. 2013;58(4):597-600. https://doi.org/10.4187/respcare.01887.
17. Coudroy R, Jamet A, Petua P, Robert R, Frat JP, Thille AW. High-flow nasal cannula oxygen therapy versus noninvasive ventilation in immunocompromised patients with acute respiratory failure: an observational cohort study. Ann Intensive Care. 2016;6(1):45. https://doi.org/10.1186/s13613-016-0151-7.
18. Delgado-Guay MO, Rodriguez-Nunez A, Adegboyega OO, et al. Characteristics and outcomes of advanced cancer patients admitted to an acute palliative care unit (PCU) with severe dyspnea receiving high flow oxygen (HFO). Journal of Clinical Oncology Conference. 2015;33(29 SUPPL. 1):247.
19. Epstein AS, Hartridge-Lambert SK, Ramaker JS, Voigt LP, Portlock CS. Humidified high-flow nasal oxygen utilization in patients with cancer at Memorial Sloan-Kettering Cancer Center. J Palliat Med. 2011;14(7):835-839. https://doi.org/10.1089/jpm.2011.0005.
20. Harada K, Kurosawa S, Hino Y, et al. Clinical utility of high-flow nasal cannula oxygen therapy for acute respiratory failure in patients with hematological disease. Springerplus. 2016;5(1):512. https://doi.org/10.1186/s40064-016-2161-1.
21. Rochwerg B, Granton D, Wang DX, et al. High flow nasal cannula compared with conventional oxygen therapy for acute hypoxemic respiratory failure: a systematic review and meta-analysis. Intensive Care Med. 2019;45(5):563-572. https://doi.org/10.1007/s00134-019-05590-5.
22. Halpern SD, Hansen-Flaschen J. Terminal withdrawal of life-sustaining supplemental oxygen. JAMA. 2006;296(11):1397-1400. https://doi.org/10.1001/jama.296.11.1397.
High-flow nasal cannula (HFNC) oxygen therapy is effective in treating adults with acute hypoxemic respiratory failure, and to a lesser extent acute hypercapnic respiratory failure.1-3 HFNC oxygen is capable of delivering oxygen with flows of 30-60 liters/minute, and can provide a high fraction of inspired oxygen, flush anatomic dead space, augment respiratory efforts, and provide mild continuous positive airway pressure effects. Several systematic reviews and meta-analyses have evaluated the effectiveness of HFNC oxygen and have shown modestly lower rates of intubation compared with conventional oxygen4,5 and similar intubation rates compared with noninvasive positive pressure ventilation.4-9 Although one randomized trial showed a lower risk of 90-day mortality for HFNC oxygen compared with either conventional oxygen or noninvasive positive pressure ventilation, several meta-analyses have shown no difference in intensive care unit (ICU) mortality.4,6,8,10 The majority of studies have shown improvements in oxygenation, comfort, dyspnea scores, and breathing pattern with the initiation of HFNC oxygen.6
While the evidence to support the use of HFNC oxygen in patients with nonhypercapnic acute hypoxemic respiratory failure is growing, this evidence is based on patients enrolled in clinical trials who have no treatment limitations and consent to intubation if necessary. Indeed, several, if not all, randomized trials evaluating HFNC oxygen excluded patients who had do-not-intubate (DNI) or do-not-resuscitate (DNR) orders.1,2,11 For patients with acute respiratory failure whose primary goal is not to extend life or utilize life support interventions such as invasive mechanical ventilation, HFNC oxygen may offer several benefits compared with other treatment options such as noninvasive positive pressure ventilation, conventional oxygen therapy, or palliative opioid therapy (Appendix Table 1). Determining which treatment options to use depends on the goals of care of the individual patient and the reasonable ability of a particular treatment to help the patient achieve those goals.
While a recent systematic review evaluated the existing evidence regarding the utility and outcomes of noninvasive positive pressure ventilation in adult patients with DNI orders,12 a systematic review evaluating the evidence and rationale for HFNC oxygen in patients with DNI and/or DNR orders is lacking. Assessing such evidence is necessary to help clinicians and patients determine appropriate treatment choices and establish research priorities. Therefore, our primary objective was to determine what were the following outcomes: mortality, dyspnea, work of breathing, opioid doses, and quality of life in patients who received HFNC oxygen for acute respiratory failure and had a DNI and/or DNR order.
METHODS
We conducted a systematic review of studies that evaluated patients who used HFNC oxygen for acute respiratory failure and had a DNI and/or DNR order. We reported the results using the Preferred Reporting Items for Systematic Reviews and Meta-Analyses (PRISMA) statements.13 This review was registered with the PROSPERO registry, CRD42017059914.
We included studies that enrolled patients who were (1) hospitalized, (2) >18 years old, (3) had an acute respiratory failure of any cause, (4) received HFNC oxygen, and (5) had a DNI or DNR or comfort measures only order. We included publications of all study designs (interventional, observational, and posthoc analyses) and all languages. We excluded studies that enrolled <5 patients. If necessary, we contacted the authors of the included studies for additional information.
Our search strategy included the following databases from inception to October 14, 2018: PubMed, MEDLINE, CINAHL, MICROMEDEX, EMBASE, Web of Science, and Scopus. The database-specific search strategy was developed using an experienced librarian (Appendix Table 2). In addition, we screened the reference lists of systematic reviews as well as the included studies to find additional relevant articles. Two authors (AM, MEW) independently assessed the inclusion criteria of the titles and abstracts that were identified in the search. In addition, these two authors abstracted relevant data of the included studies.
The primary outcomes were mortality, dyspnea and work of breathing, quality of life, and reduction of opioid doses. Secondary, posthoc, outcomes included the transition to noninvasive positive pressure ventilation (NPPV), tolerance of HFNC, adverse events, and quality of death in nonsurvivors. The risk of bias was evaluated using a modified Newcastle-Ottawa Quality Assessment Scale (Appendix Table 3).
RESULTS
Using the search strategy, we identified 2,757 citations and included 301 of these in the full-text review (Figure). We included six studies, which enrolled 293 patients in the final systematic review. Table 1 summarizes the characteristics of the included investigations, all of which were observational studies.15-20 The studies were conducted in the United States of America (n = 3), Europe (n = 2), and Asia (n = 1). Two studies were conducted in the general ICU populations and included patients with hypoxemic respiratory failure only. Four studies were conducted in cancer populations in the hospital wards or ICU and did not specify the type of respiratory failure (hypoxemic versus hypercapnic). Two studies included patients with DNI orders only.15,20 One study included patients with DNR orders only (DNI orders were excluded).17 Three studies included patients with both DNR and DNI orders.16,18,19 The numbers of enrolled patients with treatment limitations were generally low, with the two largest studies including 101 patients each on HFNC oxygen.18,19
Risk of Bias
All included studies had a high risk of bias (Table 2). A high risk of bias was suggested because the investigations were single-center studies with unclear patient selection methods, did not explicitly report how decisions to limit treatments were made, and did not explicitly differentiate and separately analyze patients with “comfort measures only” goals of care.
Mortality
The hospital mortality rates of patients with DNI and/or DNR orders receiving HFNC were variable and ranged from 40% to 87%. In the two studies enrolling general ICU patient populations, the hospital mortality rates ranged from 40% to 60%. In the four studies enrolling patients with active malignancy, the hospital mortality rates ranged from 75% to 87%. No studies compared mortality rates with and without DNI and/or DNR orders.
Dyspnea, Work of Breathing, and Reduction in Opioid Doses
The impact of HFNC oxygen on symptom relief was reported in one retrospective observational study (published as a conference abstract only to date), which compared the effect of HFNC oxygen (n = 101) with conventional oxygen (n = 110).18 At first evaluation after hospital admission to a palliative care unit (after the patients had previously been started on either conventional oxygen or high-flow oxygen), patients in the HFNC oxygen group had worse (higher) dyspnea scores compared with patients who used conventional oxygen (Edmonton Symptom Assessment Scale score of 7.5 versus 5, P < .001). At follow-up, approximately 24 hours after admission to the hospital palliative care unit, there was no difference in the change of dyspnea between the HFNC oxygen group (dyspnea score change of 0) and the conventional oxygen group (dyspnea score change of −1, P = .18. In the same study, there was also no significant difference in the morphine dose requirement in each group, and exact doses were not reported.
Two studies reported improvement in oxygen saturation and respiratory rate after HFNC oxygen initiation (compared with before HFNC initiation).16,20 Oxygen saturation increased from 89% to 95%, P < .01, in one study and 92% to 97%, P < .01, in a second study. The respiratory rate decreased from 31 to 25 breaths/minute in one study, and from 28 to 25 breaths/minute in a second study (both P < .01).
Quality of Life
No studies evaluated the quality of life of survivors.
Secondary Outcomes
Transition to Noninvasive Positive Pressure Ventilation
The proportion of patients who transitioned from HFNC oxygen to NPPV was relatively low in the two studies that reported this outcome, ranging from 0%20 to 18%.16 In one observational study of a general ICU population, 9/50 (18%) of patients transitioned from HFNC oxygen to NPPV. There was no statistically significant difference in hospital mortality rates among those who progressed to NPPV (67%) versus those who did not progress to NPPV (58%), P = .72.
Tolerance of HFNC and Adverse Events
HFNC oxygen was generally well tolerated based on the assessment of three studies (Table 1). One study reported no adverse events,16 one study reported that HFNC oxygen had to be discontinued because of nasal discomfort in 1% of patients,19 and a second study reported that HFNC oxygen had to be discontinued because of agitation in 4% of patients.20
Quality of Death in Nonsurvivors
No studies evaluated the quality of death in those patients who died.
DISCUSSION
In this systematic review of six studies, all with a high risk of bias, a significant proportion of patients with a DNI and/or DNR order who used HFNC oxygen survived to hospital discharge. Oxygen saturation and respiratory rate consistently improved in the three studies that reported these outcomes. Only one study (published as a conference abstract only to date),18 however, measured patient-important outcomes related to symptom management and found no significant difference in dyspnea or morphine dose requirements in patients on HFNC oxygen compared with patients on conventional oxygen. HFNC oxygen was generally well tolerated and only had to be stopped in <5% of patients due to intolerance. We found no studies that assessed the quality of life in survivors or the quality of death in nonsurvivors.
Based on the limited evidence in the included studies, HFNC may be a viable treatment option for patients with preset treatment limitations who have acute respiratory failure—with potential benefits of improved oxygenation, decreased respiratory rates, and hospital survival in a proportion of patients. Nevertheless, this systematic review highlights the vast paucity of data available to guide the use of HFNC oxygen in patients with treatment limitations and acute respiratory failure. Only a few studies, which were at high risk of bias, have been conducted on this topic to date. There is an inadequate evidence base to evaluate the comparative effectiveness of HFNC oxygen (versus NPPV versus conventional oxygen versus palliative opioids) in patients with DNI orders or comfort measures only orders.
Our review included two studies that evaluated the comparative effectiveness of HFNC oxygen in patients with DNI and/or DNR orders. The first retrospective observational study compared HFNC oxygen with conventional oxygen in patients with DNR and DNI orders and malignancy—and found no change in dyspnea—but did note an increase in mortality with HFNC oxygen (76% versus 51%).18 The second observational study compared HFNC oxygen with NPPV in patients with DNR orders with malignancy noted no difference in mortality.17 In patients with full-code orders, systematic reviews have shown that HFNC oxygen (compared with conventional oxygen) was associated with possible reductions in intubation rates, respiratory rates, and improvements in oxygenation—with no difference in mortality, dyspnea, patient comfort, or ICU/hospital length of stay. Compared with NPPV, HFNC oxygen was associated with similar rates of intubation and mortality.4-6,21
Future studies in patients with acute respiratory failure and DNI and/or DNR orders should identify which treatment modality (HFNC oxygen compared with other modalities, such as NPPV, conventional oxygen, with or without palliative opioids) impacts outcomes, such as dyspnea reduction while maintaining an alert mental status, short- and long-term quality of life in survivors, and quality of death in nonsurvivors. Future studies should also identify the optimal treatment pathway to utilize when patients using HFNC oxygen fail this therapy (eg, transition to NPPV versus intensifying palliative opioids) as well as the optimal process to withdraw palliative HFNC oxygen.22 Identifying which patient populations may benefit from different treatment pathways should also be considered as different treatment strategies may be more beneficial in different patient populations (eg, based on cause and severity of acute respiratory failure). In addition, it should be noted that the primary goal of care might affect which outcomes are the most important to measure. While patients with comfort measures only, orders usually have a primary goal to prepare for a high-quality death, patients with DNI and/or DNR orders (but without comfort measures only orders) may have a primary goal to survive—but with the desire not to endure the high burden of intubation and mechanical ventilation if it became necessary. Finally, future studies should utilize high-quality study designs (eg, randomized controlled trials) that enable robust evaluation of comparative effectiveness of clinically relevant treatment strategies.
While several previous systematic reviews have evaluated the efficacy of HFNC in patients with acute respiratory failure without preset limitations on life support; to our knowledge, this is the first systematic review to assess outcomes in patients rigorously with preset treatment limitations. Our review is, however, limited by the high risk of bias of the studies that were included (single-center nature, retrospective observational study designs, small sample sizes, and lack of a description of how DNI and/or DNR statuses were determined) as well as the small number of studies available to be included.
CONCLUSIONS
This systematic review points to a significant evidence gap in our understanding of the role for HFNC oxygen (compared with other acceptable alternative treatment strategies) in adult patients with acute respiratory failure who have DNI and/or DNR orders. Further high-quality research is needed to explore these unanswered questions in an effort to best treat, guide, and engage in optimal end-of-life decision making among patients with acute respiratory failure.
1. Frat J-P, Thille AW, Mercat A, et al. High-flow oxygen through nasal cannula in acute hypoxemic respiratory failure. N Eng J Med. 2015;372(23):2185-2196. https://doi.org/ 10.1056/NEJMoa1503326.
2. Stephan F, Barrucand B, Petit P, et al. High-flow nasal oxygen vs noninvasive positive airway pressure in hypoxemic patients after cardiothoracic surgery: a randomized clinical trial. JAMA. 2015;313(23):2331-2339. https://doi.org/ 10.1001/jama.2015.5213.
3. Lee MK, Choi J, Park B, et al. High flow nasal cannulae oxygen therapy in acute-moderate hypercapnic respiratory failure. Clin Respir J. 2018;12(6):2046-2056. https://doi.org/10.1111/crj.12772 28.
4. Ni YN, Luo J, Yu H, et al. Can high-flow nasal cannula reduce the rate of endotracheal intubation in adult patients with acute respiratory failure compared with conventional oxygen therapy and noninvasive positive pressure ventilation?: a systematic review and meta-analysis. Chest. 2017;151(4):764-775. https://doi.org/10.1016/j.chest.2017.01.004.
5. Ou X, Hua Y, Liu J, Gong C, Zhao W. Effect of high-flow nasal cannula oxygen therapy in adults with acute hypoxemic respiratory failure: a meta-analysis of randomized controlled trials. CMAJ. 2017;189(7):E260-E267. https://doi.org/10.1503/cmaj.160570.
6. Monro-Somerville T, Sim M, Ruddy J, Vilas M, Gillies MA. The effect of high-flow nasal cannula oxygen therapy on mortality and intubation rate in acute respiratory failure: a systematic review and meta-analysis. Crit Care Med. 2017;45(4):e449-e456. https://doi.org/10.1097/CCM.0000000000002091.
7. Maitra S, Som A, Bhattacharjee S, Arora MK, Baidya DK. Comparison of high-flow nasal oxygen therapy with conventional oxygen therapy and noninvasive ventilation in adult patients with acute hypoxemic respiratory failure: a meta-analysis and systematic review. J Crit Care. 2016;35:138-144. https://doi.org/10.1016/j.jcrc.2016.05.013.
8. Nedel WL, Deutschendorf C, Moraes Rodrigues Filho E. High-flow nasal cannula in critically ill subjects with or at risk for respiratory failure: a systematic review and meta-analysis. Respir Care. 2017;62(1):123-132. https://doi.org/10.4187/respcare.04831.
9. Zhu Y, Yin H, Zhang R, Wei J. High-flow nasal cannula oxygen therapy vs conventional oxygen therapy in cardiac surgical patients: a meta-analysis. J Crit Care. 2017;38:123-128. https://doi.org/10.1016/j.jcrc.2016.10.027.
10. Leeies M, Flynn E, Turgeon AF, et al. High-flow oxygen via nasal cannulae in patients with acute hypoxemic respiratory failure: a systematic review and meta-analysis. Syst Rev. 2017;6(1):202. https://doi.org/10.1186/s13643-017-0593-5.
11. Hernandez G, Vaquero C, Gonzalez P, et al. Effect of postextubation high-flow nasal cannula vs conventional oxygen therapy on reintubation in low-risk patients: a randomized clinical trial. JAMA. 2016;315(13):1354-1361. https://doi.org/10.1001/jama.2016.2711.
12. Wilson ME, Majzoub AM, Dobler CC, et al. Noninvasive ventilation in patients with do-not-intubate and comfort-measures-only orders: a systematic review and meta-analysis. Crit Care Med. 2018. 46(8):1209-1216. https://doi.org/10.1097/CCM.0000000000003082.
13. Moher D, Liberati A, Tetzlaff J, Altman DG. Preferred reporting items for systematic reviews and meta-analyses: the PRISMA statement. BMJ. 2009;339:b2535. https://doi.org/10.1136/bmj.b2535.
14. Stroup DF, Berlin JA, Morton SC, et al. Meta-analysis of observational studies in epidemiology: a proposal for reporting. Meta-analysis Of Observational Studies in Epidemiology (MOOSE) group. JAMA. 2000;283(15):2008-2012. https://doi.org/10.1001/jama.283.15.2008.
15. Brugger SC, Rodriguez S, Domingo J, et al. High-flow nasal cannula therapy (HFNC) for patients with severe acute respiratory failure and do not intubate orders. Pilot study. Palliative Medicine. 2014;28(6):755.
16. Peters SG, Holets SR, Gay PC. High-flow nasal cannula therapy in do-not-intubate patients with hypoxemic respiratory distress. Respir Care. 2013;58(4):597-600. https://doi.org/10.4187/respcare.01887.
17. Coudroy R, Jamet A, Petua P, Robert R, Frat JP, Thille AW. High-flow nasal cannula oxygen therapy versus noninvasive ventilation in immunocompromised patients with acute respiratory failure: an observational cohort study. Ann Intensive Care. 2016;6(1):45. https://doi.org/10.1186/s13613-016-0151-7.
18. Delgado-Guay MO, Rodriguez-Nunez A, Adegboyega OO, et al. Characteristics and outcomes of advanced cancer patients admitted to an acute palliative care unit (PCU) with severe dyspnea receiving high flow oxygen (HFO). Journal of Clinical Oncology Conference. 2015;33(29 SUPPL. 1):247.
19. Epstein AS, Hartridge-Lambert SK, Ramaker JS, Voigt LP, Portlock CS. Humidified high-flow nasal oxygen utilization in patients with cancer at Memorial Sloan-Kettering Cancer Center. J Palliat Med. 2011;14(7):835-839. https://doi.org/10.1089/jpm.2011.0005.
20. Harada K, Kurosawa S, Hino Y, et al. Clinical utility of high-flow nasal cannula oxygen therapy for acute respiratory failure in patients with hematological disease. Springerplus. 2016;5(1):512. https://doi.org/10.1186/s40064-016-2161-1.
21. Rochwerg B, Granton D, Wang DX, et al. High flow nasal cannula compared with conventional oxygen therapy for acute hypoxemic respiratory failure: a systematic review and meta-analysis. Intensive Care Med. 2019;45(5):563-572. https://doi.org/10.1007/s00134-019-05590-5.
22. Halpern SD, Hansen-Flaschen J. Terminal withdrawal of life-sustaining supplemental oxygen. JAMA. 2006;296(11):1397-1400. https://doi.org/10.1001/jama.296.11.1397.
© 2019 Society of Hospital Medicine
Clinical Progress Note: Point-of-Care Ultrasound for the Pediatric Hospitalist
The recent designation of Pediatric Hospital Medicine (PHM) as a board-certified subspecialty has provided the opportunity to define which skills are core to hospitalist practice. One skill that is novel to the field and gaining traction is point-of-care ultrasonography (POCUS). POCUS differs from traditional ultrasonography in that it is performed at the bedside by the primary clinician and aims to answer a focused clinical question (eg, does this patient have a skin abscess?) rather than to provide a comprehensive evaluation of the anatomy and physiology. The proposed advantages of POCUS include real-time image interpretation, cost savings, procedural guidance to minimize complications, and reduction of ionizing radiation. Although specialties such as Critical Care (CC) and Emergency Medicine (EM) have integrated POCUS into their practice and training, best practices in PHM have not been defined. This Progress Note is a summary of recent evidence to update past reviews and set the stage for future PHM POCUS research and education.
LITERATURE SEARCH STRATEGY AND TOPIC SELECTION
We met with an academic librarian in March 2019 and performed a search of PubMed using Medical Subject Headings (MESH) terms associated with POCUS as well as Pediatrics. We limited our search to studies published within the past five years. The search was originally focused to the field of PHM before expanding to a broader search since very few studies were found that focused on Hospital Medicine or general pediatric ward populations. This initial search generated 274 publications. We then performed a supplemental literature search using references from studies found in our initial search, as well as further ad hoc searching in Embase and Google Scholar.
After our literature search, we reviewed the PHM core competencies and identified the common clinical diagnoses and core skills for which there is POCUS literature published in the past five years. These included acute abdominal pain, bronchiolitis, pneumonia, skin and soft tissue infection, newborn care/delivery room management, bladder catheterization, fluid management, intravenous access, and lumbar puncture (LP). We chose to focus on one skill and two diagnoses that were generalizable to pediatric hospitalists across different settings and for which there was compelling evidence for POCUS use, such as pneumonia, skin abscess, and LP. We found few studies that included general pediatric ward patients, but we considered EM and CC studies to be relevant as several pediatric hospitalists practice in these clinical settings and with these patient populations.
PNEUMONIA
POCUS can be useful for diagnosing pneumonia by direct visualization of lung consolidation or by identification of various sonographic artifacts that suggest pathology. For example, “B-lines” are vertical artifacts that extend from the pleura and suggest interstitial fluid or pneumonia when they are present in abnormally high numbers or density. POCUS can also be used to diagnose parapneumonic effusions by scanning dependent areas of the lung (eg, the diaphragm in children sitting upright) and looking for anechoic or hypoechoic areas.
Three recent meta-analyses found favorable operating characteristics when using POCUS for the diagnosis of pneumonia in children, with summary sensitivities of 93%-94% and specificities of 92%-96%.1-3 However, these meta-analyses were limited by high heterogeneity due to the inclusion of multiple different care settings and the use of variable reference standards and sonographic criteria for diagnosing pneumonia. POCUS is superior to chest radiography for evaluating parapneumonic pleural effusions,4 allowing for rapid identification of loculations, fibrin strands, and proteinaceous material, and for serial bedside evaluation of effusion size and characteristics.
Additional advantages of POCUS include avoidance of ionizing radiation and the potential for cost and time savings. Two studies demonstrated reductions in radiography use and improved cost, although they were not conducted on hospitalized patients. One randomized controlled trial (RCT) conducted in a pediatric emergency department (ED) demonstrated a 38.8% reduction in chest radiography use without increasing the ED length of stay (EDLOS), antibiotic use, or unscheduled follow-up visits.5 A retrospective matched cohort study conducted in another pediatric ED reported that when compared with patients evaluated by chest radiography, those evaluated by POCUS had significantly shorter EDLOS (−60.9 min) and mean health systems savings ($187 per patient).6 We believe that POCUS has value in the evaluation and management of pneumonia and parapneumonic effusions, although further studies investigating patient outcomes and involving inpatient populations are required.
SKIN ABSCESS
POCUS can augment the physical examination, helping to both avoid unnecessary incision and drainage (I+D) procedures and detect drainable fluid collections. Abscess is suggested when hypoechoic material without vascular flow is detected, and although other structures such as vessels, cysts, and lymph nodes can mimic skin abscesses, this is a relatively straightforward examination for clinicians to learn.
Two meta-analyses found that POCUS had high sensitivity for diagnosing skin abscesses in the ED.7,8 A pediatric subgroup analysis conducted in a study by Barbic et al. found a sensitivity and a specificity of 94% (95% C: 88%-98%) and 83% (95% C: 47%-97%), respectively.7 Subramaniam et al. included six studies (four pediatric) with 800 patients (653 ≤ 18 years old) and found an overall pooled sensitivity of 97% (95% C: 94%-98%) and a specificity of 83% (95% C: 75%-88%).8 No subgroup analysis was performed, but the included pediatric studies reported sensitivities and specificities between 90%-98% and 68%-87%, respectively.
Although POCUS performs better than physical examination for the diagnosis of drainable abscesses, evidence regarding patient outcomes is mixed. A retrospective review from four pediatric EDs found that integration of POCUS lowered treatment failure rates, defined as any incision and drainage (I+D) or surgical manipulation after discharge from the initial ED visit (4.4% vs 15.6%, P < .005).9 A single-center retrospective cohort study found that POCUS reduced EDLOS by a median of 73 minutes (95% C: 52-94 min) when compared with radiology-performed studies.10 The aforementioned study conducted by Barbic et al. found that in pediatric studies, POCUS led to a change in management (eg, whether or not to attempt I+D) in 14%-27% of patients.7 However, a multicenter prospective observational cohort study involving seven pediatric EDs found that despite changing the management in 22.9% of cases, POCUS was not associated with any statistically significant differences in treatment failure rates, EDLOS, discharge rates, use of sedation, or use of alternative imaging.11 These studies were limited by a lack of randomization or control group and emphasize the need for RCTs that measure patient outcomes. Future studies should investigate how POCUS can be used in inpatient settings both for initial diagnosis of drainable abscesses and for serial evaluation of evolving phlegmon or incompletely drained collections.
LUMBAR PUNCTURE
LP is commonly performed by pediatric hospitalists, although success can be influenced by numerous factors, including provider and staff expertise, patient anatomy, and body habitus. Requiring multiple attempts can increase patient discomfort and parental anxiety. Failure to obtain cerebrospinal fluid can delay diagnosis or leave providers in uncertain clinical situations that may commit patients to prolonged antibiotic courses. POCUS can be used to identify anatomic markers such as interspinous processes, anatomic midline, and depth of the ligamentum flavum.12 It can also be used to identify epidural hematomas after failed LPs to avoid additional unsuccessful attempts.13 POCUS guidance for LP has been described using both static (preprocedural marking) and dynamic (scanning during the procedure) techniques, although most of the studies use the static approach. The Society for Hospital Medicine POCUS Task Force has recently released a position statement recommending that POCUS should be used for site selection before performing LP in adult patients when providers are adequately trained.12 Although this position statement was for adult patients, recent evidence suggests that there is also benefit in Pediatrics.
Two recent meta-analyses have investigated POCUS use for pediatric LPs.14,15 Olowoyeye et al. included four studies with a total of 277 patients and found that POCUS use was associated with a reduction in traumatic taps (risk ratio [RR] = 0.53, 95% C: 0.13-0.82) when compared with landmark approaches.14 However, there was no statistically significant reduction in LP failure, number of needle insertion attempts, or procedure length. A more recent meta-analysis performed a pediatric subgroup analysis of six studies including 452 patients and found a statistically significant reduction in traumatic taps (13.7% vs 31.8%, risk difference = −21.3%, 95% C: −38.2% to −4.3%) and number of needle insertion attempts (1.53 vs 2.07, mean difference = −0.47, 95% C: −0.73 to −0.21).15 The primary outcome of LP success trended toward favoring POCUS, but it was not statistically significant (88.4% vs 74.0%, OR = 2.55, 95% C: 0.99-6.52). We believe t
CONCLUSION
Evidence accumulated in the past five years has built on previous work suggesting that POCUS has a role in the diagnosis of pneumonia and skin abscess and in the performance of LPs. However, gaps in the literature remain when applying POCUS in PHM. Only a few studies to date were conducted in non-CC inpatient settings, and although several pediatric hospitalists work in EDs or care for critically ill children, our largest population comprises general pediatric ward patients. Studies have also used ultrasonographers with variable POCUS training and clinical experience, which makes comparing or combining studies challenging since POCUS is dependent on provider skills. Studies involving PHM providers and inpatient populations are needed. Additional studies evaluating the process and outcome measures are also needed to understand whether the theoretical advantages are consistently realized in real-world PHM practice. Finally, PHM-specific curricula should be designed in collaboration with various PHM stakeholders and with specialties who already have robust POCUS training pathways. There is opportunity within PHM for multi institutional research collaboration, identification of best practices, and development of PHM-specific training for fellowship and faculty development programs.
1. Orso D, Ban A, Guglielmo N. Lung ultrasound in diagnosing pneumonia in childhood: a systematic review and meta-analysis. J Ultrasound. 2018;21(3):183-195. https://doi.org/10.1007/s40477-018-0306-5.
2. Najgrodzka P, Buda N, Zamojska A, Marciniewicz E, Lewandowicz-Uszynska A. Lung ultrasonography in the diagnosis of pneumonia in children-a metaanalysis and a review of pediatric lung imaging. Ultrasound Q. 2019; 35(2):157-163. https://doi.org/10.1097/RUQ.0000000000000411.
3. Xin H, Li J, Hu HY. Is lung ultrasound useful for diagnosing pneumonia in children?: a meta-analysis and systematic review. Ultrasound Q. 2018;34(1):3-10. https://doi.org/10.1097/RUQ.0000000000000330.
4. Esposito S, Papa SS, Borzani I, et al. Performance of lung ultrasonography in children with community-acquired pneumonia. Ital J Pediatr. 2014;40(1):37. https://doi.org/10.1186/1824-7288-40-37.
5. Jones BP, Tay ET, Elikashvili I, et al. Feasibility and safety of substituting lung ultrasonography for chest radiography when diagnosing pneumonia in children: a randomized controlled trial. Chest. 2016;150(1):131-138. https://doi.org/10.1016/j.chest.2016.02.643.
6. Harel‐Sterling M, Diallo M, Santhirakumaran S, Maxim T, Tessaro M. Emergency department resource use in pediatric pneumonia: point‐of‐care lung ultrasonography versus chest radiography. J Ultrasound Med. 2019;38(2):407-414. https://doi.org/10.1002/jum.14703.
7. Barbic D, Chenkin J, Cho DD, Jelic T, Scheuermeyer FX. In patients presenting to the emergency department with skin and soft tissue infections what is the diagnostic accuracy of point-of-care ultrasonography for the diagnosis of abscess compared to the current standard of care? A systematic review and meta-analysis. BMJ Open. 2017;7(1):e013688. https://doi.org/10.1136/bmjopen-2016-013688.
8. Subramaniam S, Bober J, Chao J, Zehtabchi S. Point-of-care ultrasound for diagnosis of abscess in skin and soft tissue infections. Acad Emerg Med. 2016;23(11):1298-1306. https://doi.org/10.1111/acem.13049.
9. Gaspari RJ, Sanseverino A. Ultrasound-guided drainage for pediatric soft tissue abscesses decreases clinical failure rates compared to drainage without ultrasound: a retrospective study. J Ultrasound Med. 2018;37(1):131-136. https://doi.org/10.1002/jum.14318.
10. Lin MJ, Neuman M, Rempell R, Monuteaux M, Levy J. Point-of-care ultrasound is associated with decreased length of stay in children presenting to the emergency department with soft tissue infection. J Emerg Med. 2018;54(1):96-101. https://doi.org/10.1016/j.jemermed.2017.09.017.
11. Lam SHF, Sivitz A, Alade K, et al. Comparison of ultrasound guidance vs. clinical assessment alone for management of pediatric skin and soft tissue infections. J Emerg Med. 2018;55(5):693-701. https://doi.org/10.1016/j.jemermed.2018.07.010.
12. Soni NJ, Franco-Sadud R, Kobaidze K, et al. Recommendations on the use of ultrasound guidance for adult lumbar puncture: a position statement of the society of hospital medicine [published online ahead of print June 10, 2019. J Hosp Med. 2019;14:E1-E11. https://doi.org/10.12788/jhm.3197.
13. Kusulas MP, Eutsler EP, DePiero AD. Bedside ultrasound for the evaluation of epidural hematoma after infant lumbar puncture [published online ahead of print January 2, 2018]. Pediatr Emerg Care. 2018. https://doi.org/10.1097/PEC.0000000000001383.
14. Olowoyeye A, Fadahunsi O, Okudo J, Opaneye O, Okwundu C. Ultrasound imaging versus palpation method for diagnostic lumbar puncture in neonates and infants: a systematic review and meta-analysis. BMJ Paediatr Open. 2019;3(1):e000412. https://doi.org/10.1136/bmjpo-2018-000412
15. Gottlieb M, Holladay D, Peksa GD. Ultrasound-assisted lumbar punctures: a systematic review and meta-analysis. Acad Emerg Med. 2019;26(1):85-96. https://doi.org/10.1111/acem.13558.
The recent designation of Pediatric Hospital Medicine (PHM) as a board-certified subspecialty has provided the opportunity to define which skills are core to hospitalist practice. One skill that is novel to the field and gaining traction is point-of-care ultrasonography (POCUS). POCUS differs from traditional ultrasonography in that it is performed at the bedside by the primary clinician and aims to answer a focused clinical question (eg, does this patient have a skin abscess?) rather than to provide a comprehensive evaluation of the anatomy and physiology. The proposed advantages of POCUS include real-time image interpretation, cost savings, procedural guidance to minimize complications, and reduction of ionizing radiation. Although specialties such as Critical Care (CC) and Emergency Medicine (EM) have integrated POCUS into their practice and training, best practices in PHM have not been defined. This Progress Note is a summary of recent evidence to update past reviews and set the stage for future PHM POCUS research and education.
LITERATURE SEARCH STRATEGY AND TOPIC SELECTION
We met with an academic librarian in March 2019 and performed a search of PubMed using Medical Subject Headings (MESH) terms associated with POCUS as well as Pediatrics. We limited our search to studies published within the past five years. The search was originally focused to the field of PHM before expanding to a broader search since very few studies were found that focused on Hospital Medicine or general pediatric ward populations. This initial search generated 274 publications. We then performed a supplemental literature search using references from studies found in our initial search, as well as further ad hoc searching in Embase and Google Scholar.
After our literature search, we reviewed the PHM core competencies and identified the common clinical diagnoses and core skills for which there is POCUS literature published in the past five years. These included acute abdominal pain, bronchiolitis, pneumonia, skin and soft tissue infection, newborn care/delivery room management, bladder catheterization, fluid management, intravenous access, and lumbar puncture (LP). We chose to focus on one skill and two diagnoses that were generalizable to pediatric hospitalists across different settings and for which there was compelling evidence for POCUS use, such as pneumonia, skin abscess, and LP. We found few studies that included general pediatric ward patients, but we considered EM and CC studies to be relevant as several pediatric hospitalists practice in these clinical settings and with these patient populations.
PNEUMONIA
POCUS can be useful for diagnosing pneumonia by direct visualization of lung consolidation or by identification of various sonographic artifacts that suggest pathology. For example, “B-lines” are vertical artifacts that extend from the pleura and suggest interstitial fluid or pneumonia when they are present in abnormally high numbers or density. POCUS can also be used to diagnose parapneumonic effusions by scanning dependent areas of the lung (eg, the diaphragm in children sitting upright) and looking for anechoic or hypoechoic areas.
Three recent meta-analyses found favorable operating characteristics when using POCUS for the diagnosis of pneumonia in children, with summary sensitivities of 93%-94% and specificities of 92%-96%.1-3 However, these meta-analyses were limited by high heterogeneity due to the inclusion of multiple different care settings and the use of variable reference standards and sonographic criteria for diagnosing pneumonia. POCUS is superior to chest radiography for evaluating parapneumonic pleural effusions,4 allowing for rapid identification of loculations, fibrin strands, and proteinaceous material, and for serial bedside evaluation of effusion size and characteristics.
Additional advantages of POCUS include avoidance of ionizing radiation and the potential for cost and time savings. Two studies demonstrated reductions in radiography use and improved cost, although they were not conducted on hospitalized patients. One randomized controlled trial (RCT) conducted in a pediatric emergency department (ED) demonstrated a 38.8% reduction in chest radiography use without increasing the ED length of stay (EDLOS), antibiotic use, or unscheduled follow-up visits.5 A retrospective matched cohort study conducted in another pediatric ED reported that when compared with patients evaluated by chest radiography, those evaluated by POCUS had significantly shorter EDLOS (−60.9 min) and mean health systems savings ($187 per patient).6 We believe that POCUS has value in the evaluation and management of pneumonia and parapneumonic effusions, although further studies investigating patient outcomes and involving inpatient populations are required.
SKIN ABSCESS
POCUS can augment the physical examination, helping to both avoid unnecessary incision and drainage (I+D) procedures and detect drainable fluid collections. Abscess is suggested when hypoechoic material without vascular flow is detected, and although other structures such as vessels, cysts, and lymph nodes can mimic skin abscesses, this is a relatively straightforward examination for clinicians to learn.
Two meta-analyses found that POCUS had high sensitivity for diagnosing skin abscesses in the ED.7,8 A pediatric subgroup analysis conducted in a study by Barbic et al. found a sensitivity and a specificity of 94% (95% C: 88%-98%) and 83% (95% C: 47%-97%), respectively.7 Subramaniam et al. included six studies (four pediatric) with 800 patients (653 ≤ 18 years old) and found an overall pooled sensitivity of 97% (95% C: 94%-98%) and a specificity of 83% (95% C: 75%-88%).8 No subgroup analysis was performed, but the included pediatric studies reported sensitivities and specificities between 90%-98% and 68%-87%, respectively.
Although POCUS performs better than physical examination for the diagnosis of drainable abscesses, evidence regarding patient outcomes is mixed. A retrospective review from four pediatric EDs found that integration of POCUS lowered treatment failure rates, defined as any incision and drainage (I+D) or surgical manipulation after discharge from the initial ED visit (4.4% vs 15.6%, P < .005).9 A single-center retrospective cohort study found that POCUS reduced EDLOS by a median of 73 minutes (95% C: 52-94 min) when compared with radiology-performed studies.10 The aforementioned study conducted by Barbic et al. found that in pediatric studies, POCUS led to a change in management (eg, whether or not to attempt I+D) in 14%-27% of patients.7 However, a multicenter prospective observational cohort study involving seven pediatric EDs found that despite changing the management in 22.9% of cases, POCUS was not associated with any statistically significant differences in treatment failure rates, EDLOS, discharge rates, use of sedation, or use of alternative imaging.11 These studies were limited by a lack of randomization or control group and emphasize the need for RCTs that measure patient outcomes. Future studies should investigate how POCUS can be used in inpatient settings both for initial diagnosis of drainable abscesses and for serial evaluation of evolving phlegmon or incompletely drained collections.
LUMBAR PUNCTURE
LP is commonly performed by pediatric hospitalists, although success can be influenced by numerous factors, including provider and staff expertise, patient anatomy, and body habitus. Requiring multiple attempts can increase patient discomfort and parental anxiety. Failure to obtain cerebrospinal fluid can delay diagnosis or leave providers in uncertain clinical situations that may commit patients to prolonged antibiotic courses. POCUS can be used to identify anatomic markers such as interspinous processes, anatomic midline, and depth of the ligamentum flavum.12 It can also be used to identify epidural hematomas after failed LPs to avoid additional unsuccessful attempts.13 POCUS guidance for LP has been described using both static (preprocedural marking) and dynamic (scanning during the procedure) techniques, although most of the studies use the static approach. The Society for Hospital Medicine POCUS Task Force has recently released a position statement recommending that POCUS should be used for site selection before performing LP in adult patients when providers are adequately trained.12 Although this position statement was for adult patients, recent evidence suggests that there is also benefit in Pediatrics.
Two recent meta-analyses have investigated POCUS use for pediatric LPs.14,15 Olowoyeye et al. included four studies with a total of 277 patients and found that POCUS use was associated with a reduction in traumatic taps (risk ratio [RR] = 0.53, 95% C: 0.13-0.82) when compared with landmark approaches.14 However, there was no statistically significant reduction in LP failure, number of needle insertion attempts, or procedure length. A more recent meta-analysis performed a pediatric subgroup analysis of six studies including 452 patients and found a statistically significant reduction in traumatic taps (13.7% vs 31.8%, risk difference = −21.3%, 95% C: −38.2% to −4.3%) and number of needle insertion attempts (1.53 vs 2.07, mean difference = −0.47, 95% C: −0.73 to −0.21).15 The primary outcome of LP success trended toward favoring POCUS, but it was not statistically significant (88.4% vs 74.0%, OR = 2.55, 95% C: 0.99-6.52). We believe t
CONCLUSION
Evidence accumulated in the past five years has built on previous work suggesting that POCUS has a role in the diagnosis of pneumonia and skin abscess and in the performance of LPs. However, gaps in the literature remain when applying POCUS in PHM. Only a few studies to date were conducted in non-CC inpatient settings, and although several pediatric hospitalists work in EDs or care for critically ill children, our largest population comprises general pediatric ward patients. Studies have also used ultrasonographers with variable POCUS training and clinical experience, which makes comparing or combining studies challenging since POCUS is dependent on provider skills. Studies involving PHM providers and inpatient populations are needed. Additional studies evaluating the process and outcome measures are also needed to understand whether the theoretical advantages are consistently realized in real-world PHM practice. Finally, PHM-specific curricula should be designed in collaboration with various PHM stakeholders and with specialties who already have robust POCUS training pathways. There is opportunity within PHM for multi institutional research collaboration, identification of best practices, and development of PHM-specific training for fellowship and faculty development programs.
1. Orso D, Ban A, Guglielmo N. Lung ultrasound in diagnosing pneumonia in childhood: a systematic review and meta-analysis. J Ultrasound. 2018;21(3):183-195. https://doi.org/10.1007/s40477-018-0306-5.
2. Najgrodzka P, Buda N, Zamojska A, Marciniewicz E, Lewandowicz-Uszynska A. Lung ultrasonography in the diagnosis of pneumonia in children-a metaanalysis and a review of pediatric lung imaging. Ultrasound Q. 2019; 35(2):157-163. https://doi.org/10.1097/RUQ.0000000000000411.
3. Xin H, Li J, Hu HY. Is lung ultrasound useful for diagnosing pneumonia in children?: a meta-analysis and systematic review. Ultrasound Q. 2018;34(1):3-10. https://doi.org/10.1097/RUQ.0000000000000330.
4. Esposito S, Papa SS, Borzani I, et al. Performance of lung ultrasonography in children with community-acquired pneumonia. Ital J Pediatr. 2014;40(1):37. https://doi.org/10.1186/1824-7288-40-37.
5. Jones BP, Tay ET, Elikashvili I, et al. Feasibility and safety of substituting lung ultrasonography for chest radiography when diagnosing pneumonia in children: a randomized controlled trial. Chest. 2016;150(1):131-138. https://doi.org/10.1016/j.chest.2016.02.643.
6. Harel‐Sterling M, Diallo M, Santhirakumaran S, Maxim T, Tessaro M. Emergency department resource use in pediatric pneumonia: point‐of‐care lung ultrasonography versus chest radiography. J Ultrasound Med. 2019;38(2):407-414. https://doi.org/10.1002/jum.14703.
7. Barbic D, Chenkin J, Cho DD, Jelic T, Scheuermeyer FX. In patients presenting to the emergency department with skin and soft tissue infections what is the diagnostic accuracy of point-of-care ultrasonography for the diagnosis of abscess compared to the current standard of care? A systematic review and meta-analysis. BMJ Open. 2017;7(1):e013688. https://doi.org/10.1136/bmjopen-2016-013688.
8. Subramaniam S, Bober J, Chao J, Zehtabchi S. Point-of-care ultrasound for diagnosis of abscess in skin and soft tissue infections. Acad Emerg Med. 2016;23(11):1298-1306. https://doi.org/10.1111/acem.13049.
9. Gaspari RJ, Sanseverino A. Ultrasound-guided drainage for pediatric soft tissue abscesses decreases clinical failure rates compared to drainage without ultrasound: a retrospective study. J Ultrasound Med. 2018;37(1):131-136. https://doi.org/10.1002/jum.14318.
10. Lin MJ, Neuman M, Rempell R, Monuteaux M, Levy J. Point-of-care ultrasound is associated with decreased length of stay in children presenting to the emergency department with soft tissue infection. J Emerg Med. 2018;54(1):96-101. https://doi.org/10.1016/j.jemermed.2017.09.017.
11. Lam SHF, Sivitz A, Alade K, et al. Comparison of ultrasound guidance vs. clinical assessment alone for management of pediatric skin and soft tissue infections. J Emerg Med. 2018;55(5):693-701. https://doi.org/10.1016/j.jemermed.2018.07.010.
12. Soni NJ, Franco-Sadud R, Kobaidze K, et al. Recommendations on the use of ultrasound guidance for adult lumbar puncture: a position statement of the society of hospital medicine [published online ahead of print June 10, 2019. J Hosp Med. 2019;14:E1-E11. https://doi.org/10.12788/jhm.3197.
13. Kusulas MP, Eutsler EP, DePiero AD. Bedside ultrasound for the evaluation of epidural hematoma after infant lumbar puncture [published online ahead of print January 2, 2018]. Pediatr Emerg Care. 2018. https://doi.org/10.1097/PEC.0000000000001383.
14. Olowoyeye A, Fadahunsi O, Okudo J, Opaneye O, Okwundu C. Ultrasound imaging versus palpation method for diagnostic lumbar puncture in neonates and infants: a systematic review and meta-analysis. BMJ Paediatr Open. 2019;3(1):e000412. https://doi.org/10.1136/bmjpo-2018-000412
15. Gottlieb M, Holladay D, Peksa GD. Ultrasound-assisted lumbar punctures: a systematic review and meta-analysis. Acad Emerg Med. 2019;26(1):85-96. https://doi.org/10.1111/acem.13558.
© 2020 Society of Hospital Medicine
Methodolgical Progress Note: Handling Missing Data in Clinical Research
Research, in the field of Hospital Medicine, often leverages data collected for reasons other than research. For example, electronic medical record data or patient satisfaction survey results can be used to answer questions that are relevant to the practice of hospital medicine. In these types of datasets, data will inevitably be missing. Such missing data can compromise our ability to draw definitive conclusions from our research study. This review introduces the concept of missing data, describes patterns and mechanisms of missing data, and discusses common approaches for the handling of missing data, including sensitivity analyses for determining how robust the results are despite assumptions made about the missing data.
CONSEQUENCES OF MISSING DATA
Missing data create a host of problems for researchers. First, missing data result in a loss of information and can diminish the power of the proposed study. Second, the irregular data complicate the analysis because many of the standard software procedures used have been developed for fully observed or “complete” data (ie, each subject has a value for all measures of interest). Finally, missing data may introduce bias due to the systematic difference between the observed and the unobserved data. For example, if men are less likely than women to complete all questions in a patient satisfaction survey when they are not satisfied, then hospital satisfaction analyses that rely on completed surveys would tend to provide biased estimates of the satisfaction males have with their care.
MINIMIZING MISSING DATA WITH STUDY DESIGN
The ideal approach to mitigating problems caused by missing data is to anticipate and incorporate strategies to minimize missing data into the study design (ie, when planning data collection protocols for prospective studies). This plan should provide strategies for minimizing nonresponse and estimating the magnitude of anticipated missing data to ensure that the study achieves sufficient strength despite the missing data.
Strategies for minimizing nonresponse include (1) informing potential study participants, at initial contact, about the implications of missing data on the ability to answer the research question; (2) collecting several phone numbers, addresses, preferred method of contact and calling times, as well as an alternative contact, in case the primary study contact is unable to be reached; (3) specifying the number of call backs, as well as the time of contact; and (4) piloting data capture questions for phrasing, clarity, and sensitivity, in order to resolve problems before initiating the study. One approach that can be used to mitigate the impact of missing data in surveys is to contact a sample of the initial nonrespondents using a more intensive follow-up approach (eg, a nonresponse to a mailed survey is followed up by a telephone call in order to conduct the survey again over the phone), and this is referred to as “nonresponse two-phase sampling.” The additional data, captured in the second phase, not only reduces the nonresponse rate but can also provide important information on the missing data mechanism.1,2 In longitudinal studies with dropouts, one can measure participants’ intent to drop out in order to evaluate how much the probability of dropping out depends on missing responses.3 One may also choose to determine the power and implications of sample size under different missing data assumptions.4
UNDERSTANDING THE REASONS FOR MISSING DATA
Different data sources are likely to have unique reasons for missing values due to the workflows involved in how the data are collected. In research involving the use of data from electronic medical records, missing data on specific diagnoses involving patients who are regularly engaged in care are often considered to be “not present” or “normal”, since clinical documentation workflows are largely governed by the concept of “documentation by exception” in which diagnoses are documented only when there is an exception to the expectation that these are not present. For example, “diabetes mellitus” is commonly documented, but “diabetes mellitus not present” is rarely documented in electronic medical records which are used for clinical care. Thus, lack of explicit documentation is likely to indicate that diabetes mellitus is, in fact, not present.
Certain variables may be missing simply because there is no quantifiable value—ie, the data do not exist. Structural missingness refers to a value that does not exist for a logical reason (eg, “What is the gender of your first child?” for those who do not have a child). Censoring, which occurs during “time to event” analysis, refers to a situation where information about a subject stops before the event of interest happens, for example, when a subject in a study involving a 30-day outcome dies at day 14. The term “limit of detection” refers to the lowest or highest level at which two distinct values can reasonably be distinguished (eg, the lower limit of detection of a C-reactive protein assay may be 1 mg/dL, so lower values might simply be reported by the lab as <1 mg/dL).5 These types of missing data require specific methods that are not discussed in this review.
These examples illustrate that approaches to dealing with missing data vary depending on what data sources are used and how data are collected. Understanding the reasons missing data are present is a necessary step in formulating a robust analytic approach to handling missing data.
MISSING DATA PATTERNS AND MECHANISMS
Missing Data Patterns
Evaluating missing data patterns provides information on the degree and complexity of the missing data problem and can aid in choosing an appropriate missing data handling method. This is because some analytic methods work well for a general pattern (nonmonotone) and other methods work for special patterns (eg, monotone, file matching). In longitudinal studies, missing data is commonly missing in a monotone pattern, where once one variable is missing then all subsequent variables are also missing for a particular subject. This occurs when a study participant is lost to follow-up. For example, a monotone missing data pattern may occur in a study that requires a series of follow-up visits for laboratory blood tests. If a patient drops out, it results in a monotone missing data pattern, as no data on blood test results are available once the patient drops out. If the patient just skips an intermediate visit but returns for the final blood test, this would show a nonmonotone missing data pattern. A file-matching pattern occurs when variables are never observed together. This pattern can occur when data from several studies are merged and some variables are not collected in all studies. For example, three studies are merged and all three collect blood pressure, but only one study collects age and only one study collects sex.
Missing Data Mechanisms
The missing data mechanism relates to the underlying reasons for missing values and the relationships between variables with and without missing data. In general, missing data can be either random or nonrandom with distinctions in randomness made by three types: (1) data missing completely at random (MCAR); (2) data missing at random (MAR); and (3) data missing not at random (MNAR).6 As with the missing data pattern, understanding the missing data mechanism can aid in selecting an appropriate approach to handling the missing data.
Data are MCAR if the missingness does not depend on any study variables, meaning that all subjects are equally likely to be missing certain data elements. When the data are MCAR, those with missing values can be viewed as a simple random sample from the complete (but never actually observed) data and can be dropped from analysis without causing bias in the results. If the values of some diagnostic tests were missing for some patients due to equipment malfunction or electricity outage, for example, then the missingness may be considered MCAR.
Data are MAR if the missingness depends on the observed characteristics but not the unobserved characteristics, meaning that the relationships observed in the data can be used to predict the occurrence of missing values. Because the “randomness” of MAR is conditional on observed characteristics, which distinguishes it from the “completely at random” type of MCAR, dropping or omitting those cases with missing values from the analysis may lead to biased results.7 In a study of quality of life (QOL) for patients with mild to moderate traumatic brain injury, if health-related QOL questions were not answered by some patients with high pain levels (even though the pain levels were recorded), the missingness of QOL may be considered as MAR. This is due to the fact that within subjects grouped by the observed characteristic of pain (that is, conditional on similar levels of pain) the missingness of QOL is the result of chance and does not depend on the values (observed or unobserved) of QOL. It follows then, that once grouped into a high (or low) pain stratum, if QOL is considered MAR, then, whether or not it is observed, is random.
Data are considered MNAR if their missingness depends on characteristics that are not observed and cannot be fully explained by the observed characteristics. Systematic differences between missing and nonmissing data exist for data that is MNAR. For example, if a survey of household income had an increased probability of missing incomes from the low-income families then the data would be considered as MNAR.
Randomness in the missing data mechanism may be ignored without affecting the inference in some circumstances.8 Both MCAR and MAR can be considered as “ignorable” in the sense that a proper method (eg, multiple imputation) may recover the missing information without modeling (ie, accounting for) the random process of the missing data mechanism (Table).9 In contrast, the MNAR mechanism requires a method that takes into account the missing data mechanism in order to make inferences about the complete (and partially unobserved) data; or in other words, a model for the missing data mechanism cannot be ignored. It is for this reason that the MNAR mechanism is often called “nonignorable”. Nonignorable missing data present a challenge to researchers because the mechanism underlying the missingness must be included in the analysis. Yet researchers rarely know what the missingness mechanism is, and the data needed to validate any putative mechanism is, in fact, missing. In cases when more than one variable is subject to missingness, researchers need to assess the missingness mechanism for each variable and tailor their approach to the specific missing data problems.9
ANALYTIC APPROACHES
There is no universally accepted standard to guide when statistical methods should be applied to account for missing data. The amount of missing data alone cannot fully assess the missing data problem; missing data patterns and mechanisms can have greater impact on research results than the proportion of missing data alone. A good statistical method for handling missing data should provide an unbiased estimate of the quantity that the investigators intend to estimate; make use of the partial information in the incomplete cases to improve efficiency (and in most cases also to reduce bias); and provide valid estimates of the standard errors, confidence intervals, and P values for statistical tests. There are generally four broadly defined classes of methods for handling missing data in clinical research: (1) the complete-case analysis, (2) single imputation methods, (3) the weighted estimating-equation approach, and (4) the model-based approach including maximum likelihood (ML) and multiple imputation (Table and Appendix).10
Since missing data mechanisms cannot be conclusively verified, it is good practice to conduct some sensitivity analyses to test the robustness of the primary results. For this purpose, pattern-mixture models provide a flexible framework for implementing sensitivity analyses to missing data assumptions and can be used to evaluate the possibility of the data being MNAR. In this framework, the missing data distribution is modeled and then incorporated into the outcome model of interest. Tipping-point analysis is a sensitivity analysis where the missing data is replaced with a range of values to determine how much the values must change for the results of the study to tip from significant to not significant. If the same general conclusions remain valid over a range of assumptions about the missing data values, then one can have greater confidence in the study conclusions.
SUMMARY AND RECOMMENDATIONS
In dealing with missing data from clinical research, clinicians and statisticians need to work together to minimize missingness at the data collection stage, document the reasons for missingness, use substantive knowledge, if possible, to assess the missing data mechanism, perform primary analysis based on a defensible missing data mechanism, and conduct a sensitivity analysis to assess whether the primary result is robust despite departure from the assumed missing data mechanism.
Acknowledgments
The following members of the Journal of Hospital Medicine Leadership team contributed to this review: Mel L. Anderson, MD; Peter Cram, MD, MBA; JoAnna K. Leyenaar, MD, PhD, MPH; Brian P. Lucas, MD, MS; Oanh Nguyen, MD, MAS; Samir S. Shah, MD, MSCE; Erin E. Shaughnessy, MD, MSHCM; and Heidi J. Sucharew, PhD.
1. Zhang N, Chen H, Elliott MR. Nonrespondent subsample multiple imputation in two-phase sampling for nonresponse. J Off Stat. 2016;32(3):769-785. https://doi.org/10.1515/jos-2016-0039
2. Zhang Y, Chen H, Zhang N. Bayesian inference for nonresponse two-phase sampling. Stat Sin. 2018;28(4):2167-2187. https://doi.org/10.5705/ss.202017.0016
3. Demirtas H, Schafer JL. On the performance of random-coefficient pattern-mixture models for non-ignorable drop-out. Stat Med. 2003;22(16):2553-2575. https://doi.org/10.1002/sim.1475
4. Davey A, Savla J. Estimating statistical power with incomplete data. Org Res Methods. 2009;12(2):320-346. https://doi.org/10.1177/1094428107300366
5. Harel O, Perkins N, Schisterman EF. The use of multiple imputation for data subject to limits of detection. Sri Lankan J Appl Stat. 2014;5(4):227. https://doi.org/10.4038/sljastats.v5i4.7792
6. Rubin DB. Inference and missing data. Biometrika. 1976;63(3):581-592. https://doi.org/10.2307/2335739
7. Van der Heijden GJ, Donders ART, Stijnen T, Moons KG. Imputation of missing values is superior to complete case analysis and the missing-indicator method in multivariable diagnostic research: a clinical example. J Clin Epidemiol.2006;59(10):1102-1109. https://doi.org/10.1016/j.jclinepi.2006.01.015
8. Little RJ, Rubin DB. Statistical analysis with missing data: Wiley; 2019. Hoboken, New Jersey.
9. Little RJ, Zhang N. Subsample ignorable likelihood for regression analysis with missing data. J Royal Stat Soc. 2011;60(4):591-605. https://doi.org/10.1111/j.1467-9876.2011.00763.x
10. Little RJ, D’agostino R, Cohen ML, et al. The prevention and treatment of missing data in clinical trials. N Engl J Med. 2012;367(14):1355-1360. https://doi.org/10.1056/NEJMsr1203730
11. Little RJ, Rubin DB. Single imputation methods. Statistical analysis with missing data 2002:59-74. Hoboken, New Jersey.
12. Seaman SR, White IR. Review of inverse probability weighting for dealing with missing data. Stat Methods Med Res. 2013;22(3):278-295. https://doi.org/10.1177/0962280210395740
13. Han P. Multiply robust estimation in regression analysis with missing data. J Am Stat Assoc. 2014;109(504):1159-1173. https://doi.org/10.1080/01621459.2014.880058
14. Yucel RM. State of the multiple imputation software. J Stat Softw. 2011;45(1). https://doi.org/10.18637/jss.v045.i01
Research, in the field of Hospital Medicine, often leverages data collected for reasons other than research. For example, electronic medical record data or patient satisfaction survey results can be used to answer questions that are relevant to the practice of hospital medicine. In these types of datasets, data will inevitably be missing. Such missing data can compromise our ability to draw definitive conclusions from our research study. This review introduces the concept of missing data, describes patterns and mechanisms of missing data, and discusses common approaches for the handling of missing data, including sensitivity analyses for determining how robust the results are despite assumptions made about the missing data.
CONSEQUENCES OF MISSING DATA
Missing data create a host of problems for researchers. First, missing data result in a loss of information and can diminish the power of the proposed study. Second, the irregular data complicate the analysis because many of the standard software procedures used have been developed for fully observed or “complete” data (ie, each subject has a value for all measures of interest). Finally, missing data may introduce bias due to the systematic difference between the observed and the unobserved data. For example, if men are less likely than women to complete all questions in a patient satisfaction survey when they are not satisfied, then hospital satisfaction analyses that rely on completed surveys would tend to provide biased estimates of the satisfaction males have with their care.
MINIMIZING MISSING DATA WITH STUDY DESIGN
The ideal approach to mitigating problems caused by missing data is to anticipate and incorporate strategies to minimize missing data into the study design (ie, when planning data collection protocols for prospective studies). This plan should provide strategies for minimizing nonresponse and estimating the magnitude of anticipated missing data to ensure that the study achieves sufficient strength despite the missing data.
Strategies for minimizing nonresponse include (1) informing potential study participants, at initial contact, about the implications of missing data on the ability to answer the research question; (2) collecting several phone numbers, addresses, preferred method of contact and calling times, as well as an alternative contact, in case the primary study contact is unable to be reached; (3) specifying the number of call backs, as well as the time of contact; and (4) piloting data capture questions for phrasing, clarity, and sensitivity, in order to resolve problems before initiating the study. One approach that can be used to mitigate the impact of missing data in surveys is to contact a sample of the initial nonrespondents using a more intensive follow-up approach (eg, a nonresponse to a mailed survey is followed up by a telephone call in order to conduct the survey again over the phone), and this is referred to as “nonresponse two-phase sampling.” The additional data, captured in the second phase, not only reduces the nonresponse rate but can also provide important information on the missing data mechanism.1,2 In longitudinal studies with dropouts, one can measure participants’ intent to drop out in order to evaluate how much the probability of dropping out depends on missing responses.3 One may also choose to determine the power and implications of sample size under different missing data assumptions.4
UNDERSTANDING THE REASONS FOR MISSING DATA
Different data sources are likely to have unique reasons for missing values due to the workflows involved in how the data are collected. In research involving the use of data from electronic medical records, missing data on specific diagnoses involving patients who are regularly engaged in care are often considered to be “not present” or “normal”, since clinical documentation workflows are largely governed by the concept of “documentation by exception” in which diagnoses are documented only when there is an exception to the expectation that these are not present. For example, “diabetes mellitus” is commonly documented, but “diabetes mellitus not present” is rarely documented in electronic medical records which are used for clinical care. Thus, lack of explicit documentation is likely to indicate that diabetes mellitus is, in fact, not present.
Certain variables may be missing simply because there is no quantifiable value—ie, the data do not exist. Structural missingness refers to a value that does not exist for a logical reason (eg, “What is the gender of your first child?” for those who do not have a child). Censoring, which occurs during “time to event” analysis, refers to a situation where information about a subject stops before the event of interest happens, for example, when a subject in a study involving a 30-day outcome dies at day 14. The term “limit of detection” refers to the lowest or highest level at which two distinct values can reasonably be distinguished (eg, the lower limit of detection of a C-reactive protein assay may be 1 mg/dL, so lower values might simply be reported by the lab as <1 mg/dL).5 These types of missing data require specific methods that are not discussed in this review.
These examples illustrate that approaches to dealing with missing data vary depending on what data sources are used and how data are collected. Understanding the reasons missing data are present is a necessary step in formulating a robust analytic approach to handling missing data.
MISSING DATA PATTERNS AND MECHANISMS
Missing Data Patterns
Evaluating missing data patterns provides information on the degree and complexity of the missing data problem and can aid in choosing an appropriate missing data handling method. This is because some analytic methods work well for a general pattern (nonmonotone) and other methods work for special patterns (eg, monotone, file matching). In longitudinal studies, missing data is commonly missing in a monotone pattern, where once one variable is missing then all subsequent variables are also missing for a particular subject. This occurs when a study participant is lost to follow-up. For example, a monotone missing data pattern may occur in a study that requires a series of follow-up visits for laboratory blood tests. If a patient drops out, it results in a monotone missing data pattern, as no data on blood test results are available once the patient drops out. If the patient just skips an intermediate visit but returns for the final blood test, this would show a nonmonotone missing data pattern. A file-matching pattern occurs when variables are never observed together. This pattern can occur when data from several studies are merged and some variables are not collected in all studies. For example, three studies are merged and all three collect blood pressure, but only one study collects age and only one study collects sex.
Missing Data Mechanisms
The missing data mechanism relates to the underlying reasons for missing values and the relationships between variables with and without missing data. In general, missing data can be either random or nonrandom with distinctions in randomness made by three types: (1) data missing completely at random (MCAR); (2) data missing at random (MAR); and (3) data missing not at random (MNAR).6 As with the missing data pattern, understanding the missing data mechanism can aid in selecting an appropriate approach to handling the missing data.
Data are MCAR if the missingness does not depend on any study variables, meaning that all subjects are equally likely to be missing certain data elements. When the data are MCAR, those with missing values can be viewed as a simple random sample from the complete (but never actually observed) data and can be dropped from analysis without causing bias in the results. If the values of some diagnostic tests were missing for some patients due to equipment malfunction or electricity outage, for example, then the missingness may be considered MCAR.
Data are MAR if the missingness depends on the observed characteristics but not the unobserved characteristics, meaning that the relationships observed in the data can be used to predict the occurrence of missing values. Because the “randomness” of MAR is conditional on observed characteristics, which distinguishes it from the “completely at random” type of MCAR, dropping or omitting those cases with missing values from the analysis may lead to biased results.7 In a study of quality of life (QOL) for patients with mild to moderate traumatic brain injury, if health-related QOL questions were not answered by some patients with high pain levels (even though the pain levels were recorded), the missingness of QOL may be considered as MAR. This is due to the fact that within subjects grouped by the observed characteristic of pain (that is, conditional on similar levels of pain) the missingness of QOL is the result of chance and does not depend on the values (observed or unobserved) of QOL. It follows then, that once grouped into a high (or low) pain stratum, if QOL is considered MAR, then, whether or not it is observed, is random.
Data are considered MNAR if their missingness depends on characteristics that are not observed and cannot be fully explained by the observed characteristics. Systematic differences between missing and nonmissing data exist for data that is MNAR. For example, if a survey of household income had an increased probability of missing incomes from the low-income families then the data would be considered as MNAR.
Randomness in the missing data mechanism may be ignored without affecting the inference in some circumstances.8 Both MCAR and MAR can be considered as “ignorable” in the sense that a proper method (eg, multiple imputation) may recover the missing information without modeling (ie, accounting for) the random process of the missing data mechanism (Table).9 In contrast, the MNAR mechanism requires a method that takes into account the missing data mechanism in order to make inferences about the complete (and partially unobserved) data; or in other words, a model for the missing data mechanism cannot be ignored. It is for this reason that the MNAR mechanism is often called “nonignorable”. Nonignorable missing data present a challenge to researchers because the mechanism underlying the missingness must be included in the analysis. Yet researchers rarely know what the missingness mechanism is, and the data needed to validate any putative mechanism is, in fact, missing. In cases when more than one variable is subject to missingness, researchers need to assess the missingness mechanism for each variable and tailor their approach to the specific missing data problems.9
ANALYTIC APPROACHES
There is no universally accepted standard to guide when statistical methods should be applied to account for missing data. The amount of missing data alone cannot fully assess the missing data problem; missing data patterns and mechanisms can have greater impact on research results than the proportion of missing data alone. A good statistical method for handling missing data should provide an unbiased estimate of the quantity that the investigators intend to estimate; make use of the partial information in the incomplete cases to improve efficiency (and in most cases also to reduce bias); and provide valid estimates of the standard errors, confidence intervals, and P values for statistical tests. There are generally four broadly defined classes of methods for handling missing data in clinical research: (1) the complete-case analysis, (2) single imputation methods, (3) the weighted estimating-equation approach, and (4) the model-based approach including maximum likelihood (ML) and multiple imputation (Table and Appendix).10
Since missing data mechanisms cannot be conclusively verified, it is good practice to conduct some sensitivity analyses to test the robustness of the primary results. For this purpose, pattern-mixture models provide a flexible framework for implementing sensitivity analyses to missing data assumptions and can be used to evaluate the possibility of the data being MNAR. In this framework, the missing data distribution is modeled and then incorporated into the outcome model of interest. Tipping-point analysis is a sensitivity analysis where the missing data is replaced with a range of values to determine how much the values must change for the results of the study to tip from significant to not significant. If the same general conclusions remain valid over a range of assumptions about the missing data values, then one can have greater confidence in the study conclusions.
SUMMARY AND RECOMMENDATIONS
In dealing with missing data from clinical research, clinicians and statisticians need to work together to minimize missingness at the data collection stage, document the reasons for missingness, use substantive knowledge, if possible, to assess the missing data mechanism, perform primary analysis based on a defensible missing data mechanism, and conduct a sensitivity analysis to assess whether the primary result is robust despite departure from the assumed missing data mechanism.
Acknowledgments
The following members of the Journal of Hospital Medicine Leadership team contributed to this review: Mel L. Anderson, MD; Peter Cram, MD, MBA; JoAnna K. Leyenaar, MD, PhD, MPH; Brian P. Lucas, MD, MS; Oanh Nguyen, MD, MAS; Samir S. Shah, MD, MSCE; Erin E. Shaughnessy, MD, MSHCM; and Heidi J. Sucharew, PhD.
1. Zhang N, Chen H, Elliott MR. Nonrespondent subsample multiple imputation in two-phase sampling for nonresponse. J Off Stat. 2016;32(3):769-785. https://doi.org/10.1515/jos-2016-0039
2. Zhang Y, Chen H, Zhang N. Bayesian inference for nonresponse two-phase sampling. Stat Sin. 2018;28(4):2167-2187. https://doi.org/10.5705/ss.202017.0016
3. Demirtas H, Schafer JL. On the performance of random-coefficient pattern-mixture models for non-ignorable drop-out. Stat Med. 2003;22(16):2553-2575. https://doi.org/10.1002/sim.1475
4. Davey A, Savla J. Estimating statistical power with incomplete data. Org Res Methods. 2009;12(2):320-346. https://doi.org/10.1177/1094428107300366
5. Harel O, Perkins N, Schisterman EF. The use of multiple imputation for data subject to limits of detection. Sri Lankan J Appl Stat. 2014;5(4):227. https://doi.org/10.4038/sljastats.v5i4.7792
6. Rubin DB. Inference and missing data. Biometrika. 1976;63(3):581-592. https://doi.org/10.2307/2335739
7. Van der Heijden GJ, Donders ART, Stijnen T, Moons KG. Imputation of missing values is superior to complete case analysis and the missing-indicator method in multivariable diagnostic research: a clinical example. J Clin Epidemiol.2006;59(10):1102-1109. https://doi.org/10.1016/j.jclinepi.2006.01.015
8. Little RJ, Rubin DB. Statistical analysis with missing data: Wiley; 2019. Hoboken, New Jersey.
9. Little RJ, Zhang N. Subsample ignorable likelihood for regression analysis with missing data. J Royal Stat Soc. 2011;60(4):591-605. https://doi.org/10.1111/j.1467-9876.2011.00763.x
10. Little RJ, D’agostino R, Cohen ML, et al. The prevention and treatment of missing data in clinical trials. N Engl J Med. 2012;367(14):1355-1360. https://doi.org/10.1056/NEJMsr1203730
11. Little RJ, Rubin DB. Single imputation methods. Statistical analysis with missing data 2002:59-74. Hoboken, New Jersey.
12. Seaman SR, White IR. Review of inverse probability weighting for dealing with missing data. Stat Methods Med Res. 2013;22(3):278-295. https://doi.org/10.1177/0962280210395740
13. Han P. Multiply robust estimation in regression analysis with missing data. J Am Stat Assoc. 2014;109(504):1159-1173. https://doi.org/10.1080/01621459.2014.880058
14. Yucel RM. State of the multiple imputation software. J Stat Softw. 2011;45(1). https://doi.org/10.18637/jss.v045.i01
© 2019 Society of Hospital Medicine
Dialysis in the Undocumented: Driving Policy Change with Data
Hilda and I shared childhood stories while we enjoyed one of her favorite Mexican dishes, grilled nopalitos (cactus). Hilda loved nopalitos, but she rarely ate them because they are high in potassium. Hilda had end-stage kidney disease (ESKD), and as an undocumented Mexican immigrant in Denver, CO, she relied on emergency-only hemodialysis. Instead of receiving standard hemodialysis three times per week as required, Hilda would arrive critically ill to the hospital after her nausea, vomiting, and shortness of breath became unbearable. After three cardiac arrests from high potassium levels, she fervently avoided foods high in it. This time, however, she was not worried about potassium. This was our last meal together. She would fly to Mexico a few days later to die.
Our hospital medicine team knew Hilda well. We had continuity because we had been admitting her to the intensive care unit or medicine floor one night each week to receive two hemodialysis sessions when she was critically ill. I immediately connected with Hilda because our lives were parallel in many ways. Hilda and I were both in our early 30s, English was our second language, we both grew up in poverty, and we now had children in elementary school. I, however, was documented. My United States citizenship allowed me the privilege of pursuing a medical degree and gaining access to quality healthcare. In contrast, Hilda had been forced to end her education prematurely, marry her mother’s friend for financial stability at the age of 14, and eventually flee to the US to escape poverty. She survived by cleaning homes until her kidneys failed. Initially, Hilda was my patient. Over time, she became a dear friend.
The first two years of emergency-only hemodialysis devastated Hilda. Too sick to work, she became homeless, staying with a nurse until we found a shelter for single mothers. Multiple cardiac arrests and resuscitations traumatized her young sons, who called 911 each time she collapsed and witnessed the resuscitations. Her boys did not understand the cycle of separation from their mother for her emergent, weekly dialysis hospital admissions and wondered if she would survive to the following week. After two years of emergency-only dialysis, Hilda’s deep love for her boys and concern about the possibility that her sudden death could leave them alone led her to pre-emptively decide to stop emergency-only dialysis. Had Hilda’s treatment costs been covered by emergency Medicaid, as undocumented immigrants with ESKD are in some other states, she may not have been forced into this terrible decision. Moving to a state where standard dialysis is covered was not an option for Hilda because she wanted her boys to stay in Colorado where they had family and friends. With no other options, she first sought a loving adoptive family in the US so that her boys could grow up and have the opportunity to pursue an education. After carefully finding the right adoptive parents, Hilda wanted to celebrate her life with the people she loved. To show her gratitude, she organized a large Mexican Christmas party and invited all of the healthcare providers and friends that had supported her. She generously gave everyone a small gift to remember her by from the few things she owned. I received the wooden rosary her father had left her. A short while later, Hilda flew home to Mexico and passed away on Mother’s Day in 2014.
Two years of caring for Hilda as an internal medicine hospitalist changed me. Grief gave way to anger, anger to determination. I found it morally distressing to continue to provide this type of care. Something had to change and there was little research in this area. One small study had demonstrated that emergency-only hemodialysis was nearly four-fold more expensive due to additional visits to the emergency department and admissions to the hospital, compared to standard outpatient hemodialysis.1 After much soul-searching and advice seeking, I scaled down my clinical hospitalist shifts and gathered a team to do research. For four years, we worked on illuminating the suffering of undocumented immigrants with ESKD that rely on emergency-only hemodialysis. We conducted 20 individual face-to-face qualitative interviews with undocumented immigrants with ESKD and heard first-hand about the emotional and physical burdens and the existential anxiety associated with weekly threats to life.2 We published a retrospective cohort study looking at differences in mortality and found that immigrants who relied on emergency-only hemodialysis had a 14-fold greater mortality rate than those on standard hemodialysis five years after initiating hemodialysis.3 In another retrospective study, we described the circumstances among undocumented immigrants with ESKD who died in the hospital after presenting with ESKD complications, and found that the majority presented with high potassium and a recorded rhythm disturbance.4 I discovered that as a hospitalist physician, I was not the only one distressed. We conducted 50 qualitative interviews to determine the perspectives of interdisciplinary clinicians on providing emergency dialysis and found that there are more clinicians experiencing moral distress. They described several important drivers of burnout,5 including emotional exhaustion from witnessing needless suffering and high mortality, as well as physical exhaustion from overextending themselves to bridge their patient’s care. Together, we discovered that the research told the larger narrative behind Hilda’s struggles. These publications caught the attention of the media and enabled us to speak to a wider audience of clinicians, health policy makers, and the general public.6-10 They also became a catalyst to engaging and enlisting the good will and interest of a number of key stakeholders to look for solutions.
In the US, undocumented immigrants do not qualify for insurance through traditional Medicaid, Medicare, or the provisions from the Patient Protection and Affordable Care Act. Instead, emergency Medicaid provides reimbursements for care of undocumented immigrants. According to the 1986 Emergency Medicaid Treatment and Active Labor Act, federal Medicaid payments can only be made for the care of undocumented immigrants if care is necessary for the treatment of an emergency medical condition.11 However, the Centers for Medicare and Medicaid (CMS) has outlined certain conditions that cannot qualify for matching federal funds under emergency Medicaid (ie, organ transplant and routine prenatal or postpartum care). Beyond these requirements, federal CMS and the Office of the Inspector General defer to states to define what constitutes a medical emergency. A few states include ESKD in the definition of “emergency medical condition,” thereby expanding access to standard hemodialysis to undocumented immigrants. We wanted Colorado to join that list.
On August 2018, after four years of research and months of dialog, everything changed: Colorado Medicaid announced that ESKD was now an “emergency medical condition.” As simple as that, undocumented immigrants would receive standard maintenance hemodialysis. Tears streamed down my face as I read a message from a policy specialist from the Colorado Medicaid: Your team “played a big role in bringing awareness to this issue, and your advocacy for these patients is impressive … thank you for fighting for such an important cause.” I reread her message, imagining what this would have meant to Hilda and her boys.
Our work to enhance care in this community is not over. To better understand the provision of dialysis care for undocumented immigrants in the United States, our team reviewed the Medicaid language for each of the 50 US states in addition to connecting with clinicians and organizations (eg, National Kidney Foundation and ESKD Networks). We found that only 12 states provide Medicaid reimbursement for standard dialysis and that a majority of the US states do not currently define need for dialysis as an emergency medical condition.12 As our Colorado team works with stakeholders in other states interested in similarly redefining their state’s emergency Medicaid definition, our most important advice is that advocacy is a team-based effort. There may be resistance and some may argue that expanding access to care would be an economic burden on taxpayers; however, research demonstrates that undocumented immigrants contribute more to the US Medicare Trust Fund than they actually withdraw toward healthcare.13 Furthermore, a new study has demonstrated that a net savings of nearly $6,000 per person per month is realized when patients are transitioned from emergency-only hemodialysis to standard hemodialysis.14
Internal medicine hospitalists on the front-line of healthcare systems are regular witnesses to its horrible injustices. We rarely share our perspectives and do not expect change to follow. With Hilda, we saw how a powerful combination of research and coalition building could lift one patient’s tragic story to a level where it could produce change. Augmenting Hilda’s experience of tragically poor access to care with evidence-based research gave her story validity far beyond our immediate circle of friends and colleagues, making a singular tragedy, policy relevant. Each time we shared our research to community advocacy groups, health policy stakeholders, state legislators, nurses, and staff; we began with Hilda’s story, not just because it inspired us, but because its truth was undeniable. Our patients’ stories matter, and it is our responsibility to tell them.
Each time I prepare nopalitos for my family, I think of my last meal with Hilda. No matter how painful or difficult her struggle with ESKD, Hilda persisted. She protected her boys. They were her purpose. When she knew she could no longer give them the life she wanted for them, she found a family who would. Hilda’s sons now live with a loving adoptive family, are thriving in school, and her oldest is interested in becoming a physician. Nopal, or cactus, symbolizes such endurance—a plant with unique adaptations and strength that can flourish under extreme environmental stress. Like a cactus storing precious water, Hilda treasured her children, and her resolve to provide for them was unstoppable, right to the edge of death. When our team first took up Hilda’s cause, change seemed impossible. We discovered the opposite. As I clench the wooden rosary she left me that Christmas, I thank her for giving our team the courage to adapt and persist, for in doing so we found a path, first to research and then to broader partnerships and more meaningful policy changes.
Acknowledgments
The author would like to thank Hilda, her family, and the patients at Denver Health. She would also like to acknowledge Hilda’s family, Drs. Mark Earnest, John F. Steiner, Romana Hasnain-Wynia, Rudolph Rodriguez, Judy Regensteiner, and Michel Chonchol for reading and providing feedback on earlier drafts of this narrative.
1. Sheikh-Hamad D, Paiuk E, Wright AJ, Kleinmann C, Khosla U, Shandera WX. Care for immigrants with end-stage renal disease in Houston: a comparison of two practices. Tex Med. 2007;103(4):54-58, 53.
2. Cervantes L, Fischer S, Berlinger N, et al. The illness experience of undocumented immigrants with end-stage renal disease. JAMA Intern Med. 2017;177(4):529-535. https://doi.org/510.1001/jamainternmed.2016.8865.
3. Cervantes L, Tuot D, Raghavan R, et al. Association of emergency-only vs standard hemodialysis with mortality and health care use among undocumented immigrants with end-stage renal disease. JAMA Intern Med. 2018;178(2):188-195. https://doi.org/10.1001/jamainternmed.2017.7039.
4. Cervantes L, O’Hare A, Chonchol M, et al. Circumstances of death among undocumented immigrants who rely on emergency-only hemodialysis. Clin J Am Soc Nephr. 2018;13(9):1405-1406. https://doi.org/10.2215/CJN.03440318.
5. Cervantes L, Richardson S, Raghavan R, et al. Clinicians’ perspectives on providing emergency-only hemodialysis to undocumented immigrants: a qualitative study. Ann Intern Med. 2018;169(2):78-86. https://doi.org/10.7326/M18-0400.
6. Brown J. Colorado immigrants force to wait until the brink of death to get kidney care. The Denver Post 2017; https://www.denverpost.com/2017/02/07/study-undocumented-immigrants-kidney-disease/. Accessed August 27, 2019.
7. Gupta S. CNN: Undocumented immigrants on dialysis forced to cheat death every week. 2018; https://www.cnn.com/2018/08/02/health/kidney-dialysis-undocumented-immigrants/index.html. Accessed August 27, 2019.
8. Harper J. NPR: Another cause of doctor burnout? Being forced to give immigrants unequal care. 2018; https://www.npr.org/sections/health-shots/2018/05/21/613115383/another-cause-of-doctor-burnout-being-forced-to-give-immigrants-unequal-care. Accessed August 27, 2019.
9. Rapaport L. Doctors distress by ‘unethical’ dialysis rules for undocumented immigrants. 2018; https://www.reuters.com/article/us-health-physicians-moral-distress/doctors-distressed-by-unethical-dialysis-rules-for-undocumented-immigrants-idUSKCN1IN30T. Accessed August 27, 2019.
10. Mitchell D. Undocumented immigrants with kidney failure can’t get proper medical care. 2018; https://kdvr.com/2018/08/10/undocumented-immigrants-with-kidney-failure-cant-get-proper-medical-care/. Accessed August 27, 2019.
11. Rodriguez RA. Dialysis for undocumented immigrants in the United States. Adv Chronic Kidney Dis. 2015;22(1):60-65. https://doi.org/10.1053/j.ackd.2014.1007.1003.
12. Cervantes L, Mundo W, Powe NR. The Status of provision of standard outpatient dialysis for US undocumented immigrants with ESKD. Clin J Am Soc Nephr. 2019;14(8):1258-1260. https://doi.org/https://doi.org/10.2215/CJN.03460319.
13. Zallman L, Woolhandler S, Himmelstein D, Bor D, McCormick D. Immigrants contributed an estimated $115.2 billion more to the Medicare Trust Fund than they took out in 2002-09. Health Aff. 2013;32(6):1153-1160. https://doi.org/10.1377/hlthaff.2012.1223.
14. Nguyen OK, Vazquez MA, Charles L, et al. Association of scheduled vs emergency-only dialysis with health outcomes and costs in undocumented immigrants with end-stage renal disease. JAMA Int Med. 2019;179(2):175-183. https://doi.org/10.1001/jamainternmed.2018.5866.
Hilda and I shared childhood stories while we enjoyed one of her favorite Mexican dishes, grilled nopalitos (cactus). Hilda loved nopalitos, but she rarely ate them because they are high in potassium. Hilda had end-stage kidney disease (ESKD), and as an undocumented Mexican immigrant in Denver, CO, she relied on emergency-only hemodialysis. Instead of receiving standard hemodialysis three times per week as required, Hilda would arrive critically ill to the hospital after her nausea, vomiting, and shortness of breath became unbearable. After three cardiac arrests from high potassium levels, she fervently avoided foods high in it. This time, however, she was not worried about potassium. This was our last meal together. She would fly to Mexico a few days later to die.
Our hospital medicine team knew Hilda well. We had continuity because we had been admitting her to the intensive care unit or medicine floor one night each week to receive two hemodialysis sessions when she was critically ill. I immediately connected with Hilda because our lives were parallel in many ways. Hilda and I were both in our early 30s, English was our second language, we both grew up in poverty, and we now had children in elementary school. I, however, was documented. My United States citizenship allowed me the privilege of pursuing a medical degree and gaining access to quality healthcare. In contrast, Hilda had been forced to end her education prematurely, marry her mother’s friend for financial stability at the age of 14, and eventually flee to the US to escape poverty. She survived by cleaning homes until her kidneys failed. Initially, Hilda was my patient. Over time, she became a dear friend.
The first two years of emergency-only hemodialysis devastated Hilda. Too sick to work, she became homeless, staying with a nurse until we found a shelter for single mothers. Multiple cardiac arrests and resuscitations traumatized her young sons, who called 911 each time she collapsed and witnessed the resuscitations. Her boys did not understand the cycle of separation from their mother for her emergent, weekly dialysis hospital admissions and wondered if she would survive to the following week. After two years of emergency-only dialysis, Hilda’s deep love for her boys and concern about the possibility that her sudden death could leave them alone led her to pre-emptively decide to stop emergency-only dialysis. Had Hilda’s treatment costs been covered by emergency Medicaid, as undocumented immigrants with ESKD are in some other states, she may not have been forced into this terrible decision. Moving to a state where standard dialysis is covered was not an option for Hilda because she wanted her boys to stay in Colorado where they had family and friends. With no other options, she first sought a loving adoptive family in the US so that her boys could grow up and have the opportunity to pursue an education. After carefully finding the right adoptive parents, Hilda wanted to celebrate her life with the people she loved. To show her gratitude, she organized a large Mexican Christmas party and invited all of the healthcare providers and friends that had supported her. She generously gave everyone a small gift to remember her by from the few things she owned. I received the wooden rosary her father had left her. A short while later, Hilda flew home to Mexico and passed away on Mother’s Day in 2014.
Two years of caring for Hilda as an internal medicine hospitalist changed me. Grief gave way to anger, anger to determination. I found it morally distressing to continue to provide this type of care. Something had to change and there was little research in this area. One small study had demonstrated that emergency-only hemodialysis was nearly four-fold more expensive due to additional visits to the emergency department and admissions to the hospital, compared to standard outpatient hemodialysis.1 After much soul-searching and advice seeking, I scaled down my clinical hospitalist shifts and gathered a team to do research. For four years, we worked on illuminating the suffering of undocumented immigrants with ESKD that rely on emergency-only hemodialysis. We conducted 20 individual face-to-face qualitative interviews with undocumented immigrants with ESKD and heard first-hand about the emotional and physical burdens and the existential anxiety associated with weekly threats to life.2 We published a retrospective cohort study looking at differences in mortality and found that immigrants who relied on emergency-only hemodialysis had a 14-fold greater mortality rate than those on standard hemodialysis five years after initiating hemodialysis.3 In another retrospective study, we described the circumstances among undocumented immigrants with ESKD who died in the hospital after presenting with ESKD complications, and found that the majority presented with high potassium and a recorded rhythm disturbance.4 I discovered that as a hospitalist physician, I was not the only one distressed. We conducted 50 qualitative interviews to determine the perspectives of interdisciplinary clinicians on providing emergency dialysis and found that there are more clinicians experiencing moral distress. They described several important drivers of burnout,5 including emotional exhaustion from witnessing needless suffering and high mortality, as well as physical exhaustion from overextending themselves to bridge their patient’s care. Together, we discovered that the research told the larger narrative behind Hilda’s struggles. These publications caught the attention of the media and enabled us to speak to a wider audience of clinicians, health policy makers, and the general public.6-10 They also became a catalyst to engaging and enlisting the good will and interest of a number of key stakeholders to look for solutions.
In the US, undocumented immigrants do not qualify for insurance through traditional Medicaid, Medicare, or the provisions from the Patient Protection and Affordable Care Act. Instead, emergency Medicaid provides reimbursements for care of undocumented immigrants. According to the 1986 Emergency Medicaid Treatment and Active Labor Act, federal Medicaid payments can only be made for the care of undocumented immigrants if care is necessary for the treatment of an emergency medical condition.11 However, the Centers for Medicare and Medicaid (CMS) has outlined certain conditions that cannot qualify for matching federal funds under emergency Medicaid (ie, organ transplant and routine prenatal or postpartum care). Beyond these requirements, federal CMS and the Office of the Inspector General defer to states to define what constitutes a medical emergency. A few states include ESKD in the definition of “emergency medical condition,” thereby expanding access to standard hemodialysis to undocumented immigrants. We wanted Colorado to join that list.
On August 2018, after four years of research and months of dialog, everything changed: Colorado Medicaid announced that ESKD was now an “emergency medical condition.” As simple as that, undocumented immigrants would receive standard maintenance hemodialysis. Tears streamed down my face as I read a message from a policy specialist from the Colorado Medicaid: Your team “played a big role in bringing awareness to this issue, and your advocacy for these patients is impressive … thank you for fighting for such an important cause.” I reread her message, imagining what this would have meant to Hilda and her boys.
Our work to enhance care in this community is not over. To better understand the provision of dialysis care for undocumented immigrants in the United States, our team reviewed the Medicaid language for each of the 50 US states in addition to connecting with clinicians and organizations (eg, National Kidney Foundation and ESKD Networks). We found that only 12 states provide Medicaid reimbursement for standard dialysis and that a majority of the US states do not currently define need for dialysis as an emergency medical condition.12 As our Colorado team works with stakeholders in other states interested in similarly redefining their state’s emergency Medicaid definition, our most important advice is that advocacy is a team-based effort. There may be resistance and some may argue that expanding access to care would be an economic burden on taxpayers; however, research demonstrates that undocumented immigrants contribute more to the US Medicare Trust Fund than they actually withdraw toward healthcare.13 Furthermore, a new study has demonstrated that a net savings of nearly $6,000 per person per month is realized when patients are transitioned from emergency-only hemodialysis to standard hemodialysis.14
Internal medicine hospitalists on the front-line of healthcare systems are regular witnesses to its horrible injustices. We rarely share our perspectives and do not expect change to follow. With Hilda, we saw how a powerful combination of research and coalition building could lift one patient’s tragic story to a level where it could produce change. Augmenting Hilda’s experience of tragically poor access to care with evidence-based research gave her story validity far beyond our immediate circle of friends and colleagues, making a singular tragedy, policy relevant. Each time we shared our research to community advocacy groups, health policy stakeholders, state legislators, nurses, and staff; we began with Hilda’s story, not just because it inspired us, but because its truth was undeniable. Our patients’ stories matter, and it is our responsibility to tell them.
Each time I prepare nopalitos for my family, I think of my last meal with Hilda. No matter how painful or difficult her struggle with ESKD, Hilda persisted. She protected her boys. They were her purpose. When she knew she could no longer give them the life she wanted for them, she found a family who would. Hilda’s sons now live with a loving adoptive family, are thriving in school, and her oldest is interested in becoming a physician. Nopal, or cactus, symbolizes such endurance—a plant with unique adaptations and strength that can flourish under extreme environmental stress. Like a cactus storing precious water, Hilda treasured her children, and her resolve to provide for them was unstoppable, right to the edge of death. When our team first took up Hilda’s cause, change seemed impossible. We discovered the opposite. As I clench the wooden rosary she left me that Christmas, I thank her for giving our team the courage to adapt and persist, for in doing so we found a path, first to research and then to broader partnerships and more meaningful policy changes.
Acknowledgments
The author would like to thank Hilda, her family, and the patients at Denver Health. She would also like to acknowledge Hilda’s family, Drs. Mark Earnest, John F. Steiner, Romana Hasnain-Wynia, Rudolph Rodriguez, Judy Regensteiner, and Michel Chonchol for reading and providing feedback on earlier drafts of this narrative.
1. Sheikh-Hamad D, Paiuk E, Wright AJ, Kleinmann C, Khosla U, Shandera WX. Care for immigrants with end-stage renal disease in Houston: a comparison of two practices. Tex Med. 2007;103(4):54-58, 53.
2. Cervantes L, Fischer S, Berlinger N, et al. The illness experience of undocumented immigrants with end-stage renal disease. JAMA Intern Med. 2017;177(4):529-535. https://doi.org/510.1001/jamainternmed.2016.8865.
3. Cervantes L, Tuot D, Raghavan R, et al. Association of emergency-only vs standard hemodialysis with mortality and health care use among undocumented immigrants with end-stage renal disease. JAMA Intern Med. 2018;178(2):188-195. https://doi.org/10.1001/jamainternmed.2017.7039.
4. Cervantes L, O’Hare A, Chonchol M, et al. Circumstances of death among undocumented immigrants who rely on emergency-only hemodialysis. Clin J Am Soc Nephr. 2018;13(9):1405-1406. https://doi.org/10.2215/CJN.03440318.
5. Cervantes L, Richardson S, Raghavan R, et al. Clinicians’ perspectives on providing emergency-only hemodialysis to undocumented immigrants: a qualitative study. Ann Intern Med. 2018;169(2):78-86. https://doi.org/10.7326/M18-0400.
6. Brown J. Colorado immigrants force to wait until the brink of death to get kidney care. The Denver Post 2017; https://www.denverpost.com/2017/02/07/study-undocumented-immigrants-kidney-disease/. Accessed August 27, 2019.
7. Gupta S. CNN: Undocumented immigrants on dialysis forced to cheat death every week. 2018; https://www.cnn.com/2018/08/02/health/kidney-dialysis-undocumented-immigrants/index.html. Accessed August 27, 2019.
8. Harper J. NPR: Another cause of doctor burnout? Being forced to give immigrants unequal care. 2018; https://www.npr.org/sections/health-shots/2018/05/21/613115383/another-cause-of-doctor-burnout-being-forced-to-give-immigrants-unequal-care. Accessed August 27, 2019.
9. Rapaport L. Doctors distress by ‘unethical’ dialysis rules for undocumented immigrants. 2018; https://www.reuters.com/article/us-health-physicians-moral-distress/doctors-distressed-by-unethical-dialysis-rules-for-undocumented-immigrants-idUSKCN1IN30T. Accessed August 27, 2019.
10. Mitchell D. Undocumented immigrants with kidney failure can’t get proper medical care. 2018; https://kdvr.com/2018/08/10/undocumented-immigrants-with-kidney-failure-cant-get-proper-medical-care/. Accessed August 27, 2019.
11. Rodriguez RA. Dialysis for undocumented immigrants in the United States. Adv Chronic Kidney Dis. 2015;22(1):60-65. https://doi.org/10.1053/j.ackd.2014.1007.1003.
12. Cervantes L, Mundo W, Powe NR. The Status of provision of standard outpatient dialysis for US undocumented immigrants with ESKD. Clin J Am Soc Nephr. 2019;14(8):1258-1260. https://doi.org/https://doi.org/10.2215/CJN.03460319.
13. Zallman L, Woolhandler S, Himmelstein D, Bor D, McCormick D. Immigrants contributed an estimated $115.2 billion more to the Medicare Trust Fund than they took out in 2002-09. Health Aff. 2013;32(6):1153-1160. https://doi.org/10.1377/hlthaff.2012.1223.
14. Nguyen OK, Vazquez MA, Charles L, et al. Association of scheduled vs emergency-only dialysis with health outcomes and costs in undocumented immigrants with end-stage renal disease. JAMA Int Med. 2019;179(2):175-183. https://doi.org/10.1001/jamainternmed.2018.5866.
© 2019 Society of Hospital Medicine
The Socrates Project for Difficult Diagnosis at Northwestern Medicine
Internists are experts in general medicine, skilled at mapping the few hundred ways the human body can go awry onto thousands of diagnoses, and managing the uncertainty inherent in that process. Generalists, almost by definition, consult specialists with their specialty-focused questions; but who does one call for a general consultation about diagnosis if a specific diagnosis remains elusive and the pathology does not fit cleanly into the purview of a consultant? Outside of sage advice from colleagues (usually senior), most medical centers lack a consultation service focused on diagnosis. There is no oracle to seek. In this perspective, we describe our institution’s answer to this problem: the creation of a service for difficult diagnosis based on Socratic principles, particularly the role of iterative hypothesis testing in the process of diagnosis.1
In 2015, Northwestern Medicine began the Socrates Project, a physician-to-physician consultation service that assists doctors working to diagnose conditions that have so far eluded detection. Our service’s goal is to improve patient care by providing an opinion to the referring physician on diagnostic possibilities for a particular case and ideas to reduce—or at least manage—diagnostic uncertainty.
Most patients referred to the Socrates Project have already undergone an extensive evaluation at top medical centers by experienced clinicians. It would be hubris to assume that we will find a definitive diagnosis in every case; indeed, because of the types of cases referred to our group, it is rare that we find a “Eureka!” diagnosis. When a colleague consults our group, we under-promise in hopes of over-delivering. Instead, we convey to referring physicians that we will conduct a thorough case review and explain our thinking in hopes of uncovering an additional diagnostic avenue, even if that avenue does not ultimately lead to a definitive diagnosis. In addition, the Socrates Project often serves as a broker between consulting services that are deadlocked because of differing diagnostic opinions. We also assist with cases in which a functional disorder is suspected, yet the referring physician is hesitant to diagnose a patient with such a disorder out of concern about missing an important (and possibly obscure) diagnosis.
PERSONNEL AND PROCESS
The Socrates Project receives approximately two consult requests per week, usually from general internists but also from specialists in nearly all disciplines. Around 80% of the referrals are for current inpatients. Our service model is similar to a tumor board, which exists as an interdisciplinary group operating in parallel to the clinical services, to provide consensus-based recommendations. As a result, we act as doctors for doctors, formalizing the curbside consultation. Our usual turnaround time is a week but can be faster for urgent cases. Currently, Socrates Project members, including the faculty leader, volunteer their time and effort at no cost, and there are no charges to patients when physicians consult our group. An overview of the Socrates Project’s personnel and process are outlined in the Figure.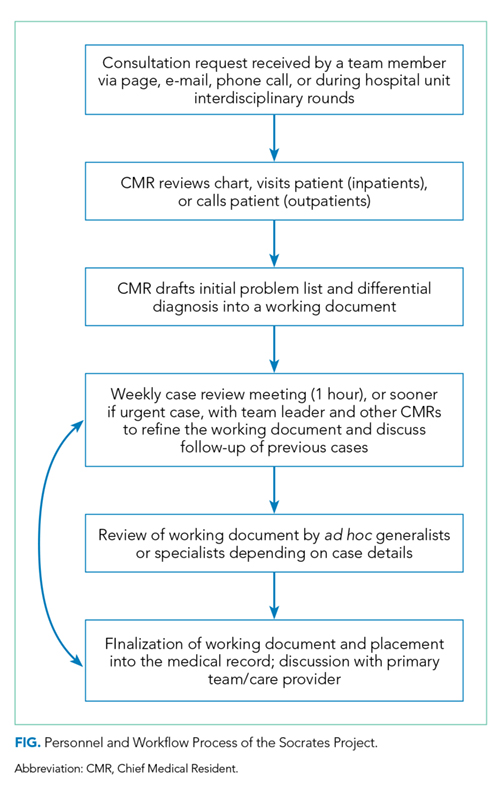
Northwestern’s Chief Medical Residents (CMRs) serve as the fellows for the service, and one of them assumes primary responsibility for each new consultation request the service receives. After obtaining the patient’s case history from the referring provider, the CMR then undertakes a thorough review of the electronic health record and any other available records from other institutions. In the inpatient setting, the CMR performs a new history and physical; phone calls or video conferencing permit history taking for outpatients. In contrast with the standard consultant note, we do not redocument the history, physical, and lab and imaging findings but instead construct a detailed problem list that synthesizes relevant findings into a useful working document.
The service’s faculty leader (BDS) then reviews the problem list with the CMRs to help refine the problem list and begin producing a differential diagnosis during a weekly hour-long meeting. As evidence supports team-based diagnostic collaborations,2 the problem list and preliminary differential diagnosis then becomes a shareable document that the CMR or team leader presents to ad hoc general internists, specialists, and the other CMRs. The presentation can be in person, by phone, or e-mail. These ad hoc members, approximately 20 in number and spanning from junior attending physicians to senior clinicians, have volunteered to help the Socrates Project by adding their thoughts on differential diagnoses that explain the problem list and how to move forward with further testing. The ad hoc members have self-identified as clinicians with an interest in medical diagnosis—including surgeons, neurologists, psychiatrists, radiologists, and pathologists—and range in expertise from general internists to subspecialists. Finally, we document our problem list, differential diagnosis, and recommendations in the medical record and discuss the case with the referring team. The service limits its scope of clinical recommendation to diagnosis and avoids commenting on management decisions outside of the use of therapies as empiric diagnostic tests. A sample note is provided as an online Appendix.
MOVING FORWARD WITH ONGOING UNCERTAINTY
Despite our process, we are often left without a satisfying diagnosis. We then are then faced with three possibilities: (1) The diagnosis is identifiable, just not by the physicians involved in the case—we did not think of the diagnosis in our deliberations; (2) The diagnosis is a described condition but without an available test—autoimmune limbic encephalitis associated with an unassayable or unknown auto-antibody, or the acuity of a critically ill patient makes diagnostic testing unreliable or not feasible; (3) The diagnosis has not yet been described by medical science—we are seeing a case of HIV infection in 1971.
With the personnel and process outlined above, we hope to provide recommendations that are useful in guiding a diagnostic workup regardless of which of these three scenarios is applicable. Our flexibility with involving the appropriate specialists in the Socrates Project should minimize the number of patients with a knowable diagnosis that is unknown to us. In the second scenario, our recommendations may rest upon the incorporation of a treatment as a diagnostic test. In the limbic encephalitis example above, a trial of steroids with rapid improvement in the patient’s condition may increase diagnostic certainty. The third scenario is the most difficult to identify. Pattern recognition of similarly presenting patients, keeping ourselves updated on pertinent primary literature, and consideration of advanced diagnostic testing such as exome sequencing and other next-generation sequencing strategies are essential in hoping to characterize a specific clinical syndrome that has yet to be described.
For situations in which our recommendations do not yield a diagnosis, we recognize the role for protocols such as genomic or metagenomic sequencing that assess multiple diagnostic possibilities in parallel without an a priori hypothesis.3,4 The utility of multi-omics testing in diagnostic workups has been detailed by the Undiagnosed Diseases Network (UDN), which has created a systematic approach to describing new syndromes with the aid of metabolomic and genomic profiling.5 It is important to note that even with the resources available to the UDN, the diagnosis rate is 35%, emphasizing that in the majority of diagnosis-refractory cases, a diagnosis will not be found. This low diagnosis rate underscores the need for continued inquiry and cataloging of cases and data for further review or synthesis as the body of medical knowledge continues to expand. For these reasons, we have a follow-up system in place, which involves the assigned CMR regularly reviewing the chart and reporting during our weekly meetings. We make phone calls to patients and providers for cases that appear to be lost to follow-up.
LIMITATIONS
We recognize several important limitations to our care model that may represent barriers to establishing, maintaining, and evaluating a similar service at other institutions. For example, there are limitations and benefits of the CMR as point person for managing our consultations. While they are admittedly junior colleagues with limited experience, CMRs tend to be among the best-read and up-to-date clinicians in the hospital by virtue of their recent general-medicine training and identification as a top clinician and leader. Moreover, in their role with the Socrates Project, CMRs have more time to think, talk with patients, and review the medical record than other clinicians, who may be under pressure to see an increasing number of patients while billing at higher levels. Indeed, the Socrates Project CMRs have, on a number of occasions, been the team members who find the piece of data that no one else thought relevant.
Another factor that may limit establishment of a similar team at other institutions is our volunteer-based model. The Socrates Project members volunteer because they love clinical medicine and serve on the team without remuneration for professional effort. With the CMR role as a notable exception, pressure from achieving relative value unit targets, obtaining grant funding, and publishing primary research publications in their field may limit this care model, particularly when shifting from a clinical-only activity to one that also formally investigates the service’s process and outcomes.
DISCOVERY AND FUTURE DIRECTIONS
Beyond our clinical objective, we hope that the Socrates Project will further the discovery and description of previously unrecognized disease processes. To that end, we are pursuing an institutional review board-approved protocol to perform a rigorous assessment of the Socrates Project’s process and outcomes, including a cataloging of case archetypes and the time to definitive diagnosis if a diagnosis is established. As we continue to collect data, increasing our referral network may also lead to refinement and improvement in diagnostic processes and outcomes. Over time, we expect that the diagnostic resources available to us will evolve. Utilizing collective intelligence has been shown to improve diagnostic accuracy,6 and emerging artificial intelligence technologies may improve diagnostic performance as well.7,8 Most importantly, through this endeavor, we hope to serve less as an oracle and more as a humble Socratic consultant for clinicians working to reduce diagnostic uncertainty for their patients.
Acknowledgments
The authors wish to thank the Northwestern University Chief Medical Residents, 2015-present, for their tireless efforts in support of the Socrates Project.
1. Cooper JM. Plato: Five dialogues : euthyphro, apology, crito, meno, phaedo. Hackett Publishing; 2002.
2. Hautz WE, Kammer JE, Schauber SK, Spies CD, Gaissmaier W. Diagnostic performance by medical students working individually or in teams. JAMA. 2015;313(3):303-304. https://doi.org/10.1001/jama.2014.15770.
3. Adams DR, Eng CM. Next-generation sequencing to diagnose suspected genetic disorders. N Engl J Med. 2018;379(14):1353-1362. https://doi.org/10.1056/NEJMra1711801.
4. Chiu CY, Miller SA. Clinical metagenomics. Nat Rev Genet. 2019;20(6):341-355. https://doi.org/10.1038/s41576-019-0113-7.
5. Splinter K, Adams DR, Bacino CA, et al. Effect of genetic diagnosis on patients with previously undiagnosed disease. N Engl J Med. 2018;379(22):2131-2139. https://doi.org/10.1056/NEJMoa1714458.
6. Barnett ML, Boddupalli D, Nundy S, Bates DW. Comparative accuracy of diagnosis by collective intelligence of multiple physicians vs individual physicians. JAMA Netw Open. 2019;2(3):e190096. https://doi.org/10.1001/jamanetworkopen.2019.0096.
7. Liang H, Tsui BY, Ni H, et al. Evaluation and accurate diagnoses of pediatric diseases using artificial intelligence. Nat Med. 2019;25(3):433-438. https://doi.org/10.1038/s41591-018-0335-9.
8. Rajkomar A, Dean J, Kohane I. Machine learning in medicine. N Engl J Med. 2019;380(14):1347-1358. https://doi.org/10.1056/NEJMra1814259.
Internists are experts in general medicine, skilled at mapping the few hundred ways the human body can go awry onto thousands of diagnoses, and managing the uncertainty inherent in that process. Generalists, almost by definition, consult specialists with their specialty-focused questions; but who does one call for a general consultation about diagnosis if a specific diagnosis remains elusive and the pathology does not fit cleanly into the purview of a consultant? Outside of sage advice from colleagues (usually senior), most medical centers lack a consultation service focused on diagnosis. There is no oracle to seek. In this perspective, we describe our institution’s answer to this problem: the creation of a service for difficult diagnosis based on Socratic principles, particularly the role of iterative hypothesis testing in the process of diagnosis.1
In 2015, Northwestern Medicine began the Socrates Project, a physician-to-physician consultation service that assists doctors working to diagnose conditions that have so far eluded detection. Our service’s goal is to improve patient care by providing an opinion to the referring physician on diagnostic possibilities for a particular case and ideas to reduce—or at least manage—diagnostic uncertainty.
Most patients referred to the Socrates Project have already undergone an extensive evaluation at top medical centers by experienced clinicians. It would be hubris to assume that we will find a definitive diagnosis in every case; indeed, because of the types of cases referred to our group, it is rare that we find a “Eureka!” diagnosis. When a colleague consults our group, we under-promise in hopes of over-delivering. Instead, we convey to referring physicians that we will conduct a thorough case review and explain our thinking in hopes of uncovering an additional diagnostic avenue, even if that avenue does not ultimately lead to a definitive diagnosis. In addition, the Socrates Project often serves as a broker between consulting services that are deadlocked because of differing diagnostic opinions. We also assist with cases in which a functional disorder is suspected, yet the referring physician is hesitant to diagnose a patient with such a disorder out of concern about missing an important (and possibly obscure) diagnosis.
PERSONNEL AND PROCESS
The Socrates Project receives approximately two consult requests per week, usually from general internists but also from specialists in nearly all disciplines. Around 80% of the referrals are for current inpatients. Our service model is similar to a tumor board, which exists as an interdisciplinary group operating in parallel to the clinical services, to provide consensus-based recommendations. As a result, we act as doctors for doctors, formalizing the curbside consultation. Our usual turnaround time is a week but can be faster for urgent cases. Currently, Socrates Project members, including the faculty leader, volunteer their time and effort at no cost, and there are no charges to patients when physicians consult our group. An overview of the Socrates Project’s personnel and process are outlined in the Figure.
Northwestern’s Chief Medical Residents (CMRs) serve as the fellows for the service, and one of them assumes primary responsibility for each new consultation request the service receives. After obtaining the patient’s case history from the referring provider, the CMR then undertakes a thorough review of the electronic health record and any other available records from other institutions. In the inpatient setting, the CMR performs a new history and physical; phone calls or video conferencing permit history taking for outpatients. In contrast with the standard consultant note, we do not redocument the history, physical, and lab and imaging findings but instead construct a detailed problem list that synthesizes relevant findings into a useful working document.
The service’s faculty leader (BDS) then reviews the problem list with the CMRs to help refine the problem list and begin producing a differential diagnosis during a weekly hour-long meeting. As evidence supports team-based diagnostic collaborations,2 the problem list and preliminary differential diagnosis then becomes a shareable document that the CMR or team leader presents to ad hoc general internists, specialists, and the other CMRs. The presentation can be in person, by phone, or e-mail. These ad hoc members, approximately 20 in number and spanning from junior attending physicians to senior clinicians, have volunteered to help the Socrates Project by adding their thoughts on differential diagnoses that explain the problem list and how to move forward with further testing. The ad hoc members have self-identified as clinicians with an interest in medical diagnosis—including surgeons, neurologists, psychiatrists, radiologists, and pathologists—and range in expertise from general internists to subspecialists. Finally, we document our problem list, differential diagnosis, and recommendations in the medical record and discuss the case with the referring team. The service limits its scope of clinical recommendation to diagnosis and avoids commenting on management decisions outside of the use of therapies as empiric diagnostic tests. A sample note is provided as an online Appendix.
MOVING FORWARD WITH ONGOING UNCERTAINTY
Despite our process, we are often left without a satisfying diagnosis. We then are then faced with three possibilities: (1) The diagnosis is identifiable, just not by the physicians involved in the case—we did not think of the diagnosis in our deliberations; (2) The diagnosis is a described condition but without an available test—autoimmune limbic encephalitis associated with an unassayable or unknown auto-antibody, or the acuity of a critically ill patient makes diagnostic testing unreliable or not feasible; (3) The diagnosis has not yet been described by medical science—we are seeing a case of HIV infection in 1971.
With the personnel and process outlined above, we hope to provide recommendations that are useful in guiding a diagnostic workup regardless of which of these three scenarios is applicable. Our flexibility with involving the appropriate specialists in the Socrates Project should minimize the number of patients with a knowable diagnosis that is unknown to us. In the second scenario, our recommendations may rest upon the incorporation of a treatment as a diagnostic test. In the limbic encephalitis example above, a trial of steroids with rapid improvement in the patient’s condition may increase diagnostic certainty. The third scenario is the most difficult to identify. Pattern recognition of similarly presenting patients, keeping ourselves updated on pertinent primary literature, and consideration of advanced diagnostic testing such as exome sequencing and other next-generation sequencing strategies are essential in hoping to characterize a specific clinical syndrome that has yet to be described.
For situations in which our recommendations do not yield a diagnosis, we recognize the role for protocols such as genomic or metagenomic sequencing that assess multiple diagnostic possibilities in parallel without an a priori hypothesis.3,4 The utility of multi-omics testing in diagnostic workups has been detailed by the Undiagnosed Diseases Network (UDN), which has created a systematic approach to describing new syndromes with the aid of metabolomic and genomic profiling.5 It is important to note that even with the resources available to the UDN, the diagnosis rate is 35%, emphasizing that in the majority of diagnosis-refractory cases, a diagnosis will not be found. This low diagnosis rate underscores the need for continued inquiry and cataloging of cases and data for further review or synthesis as the body of medical knowledge continues to expand. For these reasons, we have a follow-up system in place, which involves the assigned CMR regularly reviewing the chart and reporting during our weekly meetings. We make phone calls to patients and providers for cases that appear to be lost to follow-up.
LIMITATIONS
We recognize several important limitations to our care model that may represent barriers to establishing, maintaining, and evaluating a similar service at other institutions. For example, there are limitations and benefits of the CMR as point person for managing our consultations. While they are admittedly junior colleagues with limited experience, CMRs tend to be among the best-read and up-to-date clinicians in the hospital by virtue of their recent general-medicine training and identification as a top clinician and leader. Moreover, in their role with the Socrates Project, CMRs have more time to think, talk with patients, and review the medical record than other clinicians, who may be under pressure to see an increasing number of patients while billing at higher levels. Indeed, the Socrates Project CMRs have, on a number of occasions, been the team members who find the piece of data that no one else thought relevant.
Another factor that may limit establishment of a similar team at other institutions is our volunteer-based model. The Socrates Project members volunteer because they love clinical medicine and serve on the team without remuneration for professional effort. With the CMR role as a notable exception, pressure from achieving relative value unit targets, obtaining grant funding, and publishing primary research publications in their field may limit this care model, particularly when shifting from a clinical-only activity to one that also formally investigates the service’s process and outcomes.
DISCOVERY AND FUTURE DIRECTIONS
Beyond our clinical objective, we hope that the Socrates Project will further the discovery and description of previously unrecognized disease processes. To that end, we are pursuing an institutional review board-approved protocol to perform a rigorous assessment of the Socrates Project’s process and outcomes, including a cataloging of case archetypes and the time to definitive diagnosis if a diagnosis is established. As we continue to collect data, increasing our referral network may also lead to refinement and improvement in diagnostic processes and outcomes. Over time, we expect that the diagnostic resources available to us will evolve. Utilizing collective intelligence has been shown to improve diagnostic accuracy,6 and emerging artificial intelligence technologies may improve diagnostic performance as well.7,8 Most importantly, through this endeavor, we hope to serve less as an oracle and more as a humble Socratic consultant for clinicians working to reduce diagnostic uncertainty for their patients.
Acknowledgments
The authors wish to thank the Northwestern University Chief Medical Residents, 2015-present, for their tireless efforts in support of the Socrates Project.
1. Cooper JM. Plato: Five dialogues : euthyphro, apology, crito, meno, phaedo. Hackett Publishing; 2002.
2. Hautz WE, Kammer JE, Schauber SK, Spies CD, Gaissmaier W. Diagnostic performance by medical students working individually or in teams. JAMA. 2015;313(3):303-304. https://doi.org/10.1001/jama.2014.15770.
3. Adams DR, Eng CM. Next-generation sequencing to diagnose suspected genetic disorders. N Engl J Med. 2018;379(14):1353-1362. https://doi.org/10.1056/NEJMra1711801.
4. Chiu CY, Miller SA. Clinical metagenomics. Nat Rev Genet. 2019;20(6):341-355. https://doi.org/10.1038/s41576-019-0113-7.
5. Splinter K, Adams DR, Bacino CA, et al. Effect of genetic diagnosis on patients with previously undiagnosed disease. N Engl J Med. 2018;379(22):2131-2139. https://doi.org/10.1056/NEJMoa1714458.
6. Barnett ML, Boddupalli D, Nundy S, Bates DW. Comparative accuracy of diagnosis by collective intelligence of multiple physicians vs individual physicians. JAMA Netw Open. 2019;2(3):e190096. https://doi.org/10.1001/jamanetworkopen.2019.0096.
7. Liang H, Tsui BY, Ni H, et al. Evaluation and accurate diagnoses of pediatric diseases using artificial intelligence. Nat Med. 2019;25(3):433-438. https://doi.org/10.1038/s41591-018-0335-9.
8. Rajkomar A, Dean J, Kohane I. Machine learning in medicine. N Engl J Med. 2019;380(14):1347-1358. https://doi.org/10.1056/NEJMra1814259.
© 2019 Society of Hospital Medicine
Patient Safety Indicator-12 Rarely Identifies Problems with Quality of Care in Perioperative Venous Thromboembolism
Perioperative venous thromboembolism (VTE) is a major contributor to the morbidity and mortality of hospitalized patients. The historical incidence of postoperative VTE varied between 15%-80% depending on the type of procedure and monitoring strategies. Higher incidences of VTE occurred with major surgery (15%-40%), knee or hip arthroplasty (40%-60%), and trauma (60%-80%).1 The use of VTE prophylaxis with subcutaneous heparin reduced DVTs by 70% and PEs by 50%.2 A recent study from Olmstead County showed improved adherence to inpatient VTE prophylaxis from 2005 to 2010 but no difference in VTE incidence. However, 52% of VTE events were associated with hospitalization.3 As such, VTE continues to be a healthcare-associated adverse event, and surgery remains a significant risk factor for thrombosis.4
The Agency for Healthcare Research and Quality (AHRQ) released Patient Safety Indicators (PSI) in 2003 to provide a means of screening for adverse events.5 Over time, PSIs have been adopted as a measure of hospital performance and are utilized in several pay-for-performance programs. PSI-90 is a composite measure of several other PSIs and is a core metric in the Centers for Medicare and Medicaid Services (CMS) Hospital-Acquired Condition Reduction Program and the Hospital Value-Based Purchasing Program which impacts up to 2% of a hospital’s Medicare payments.6,7 One component of PSI-90 is PSI-12, which captures perioperative VTE. PSI-12 events are identified using software that screens medical records based on International Classification of Diseases (ICD)-9/10 codes for thrombosis and procedure codes at time of discharge.8
Over the last several years, there has been concern regarding the validity of including PSI-12 in pay-for-performance metrics. Common areas for concern include PSI-12’s accuracy in detecting true postoperative VTE9 in addition to surveillance bias.10,11 However, some note that PSI-12 is useful when applied with its original intent: as a screening tool for hospitals to identify specific areas to implement improvements.9,12The aim of our study was to review all PSI-12 events at our institution to evaluate the accuracy of PSI-12 and identify areas for improvement to prevent VTE events in surgical patients. While several other studies have looked at the positive predictive values, accuracy, or surveillance bias of PSI-12, to the best of our knowledge, few, if any, previous studies have reported PSI-12 events in relation to their timing, type of prophylaxis used, and mitigating factors to identify areas for quality improvement.
METHODS
PSI-12 events were identified between June 2015 and June 2017 using AHRQ software (version 5). Cases were also identified through Vizient and reviewed to ensure congruence between the methods. Patients’ electronic medical records were reviewed for patient demographics, type of VTE event, platelet count at VTE diagnosis, procedure type, and both the timing and type of VTE prophylaxis. Summary statistics were calculated.
We considered perioperative VTE pharmacologic prophylaxis appropriate if started within 24 hours of a low bleeding risk procedure or 72 hours of a high-bleeding risk procedure.13 Mechanical prophylaxis was considered appropriate if pharmacologic prophylaxis was not used because of procedure risk, thrombocytopenia, or active bleeding. The medication administration record was reviewed to determine if prophylaxis was ordered, given, and/or refused.
RESULTS
During the two-year period, 18,084 surgeries were performed, and 161 cases of VTE events were identified. A detailed chart review and correction of documentation led to the exclusion of seven cases (4%) because the VTE event occurred prior to admission (n = 5) or were incidental findings that did not meet the Uniform Hospital Discharge Data Set definition for reporting (n = 2). In total, 154 (0.9% of all surgeries) cases were considered PSI-12 events. Pulmonary embolism (PE) occurred in most cases (n = 97, 62.9%), followed by deep vein thrombosis (DVT) (n = 37, 24.0%). Twenty cases (12.9%) experienced concurrent PE and DVT. Within the PE group, 16 cases (14%) were subsegmental PE only. Eight patients (14% of DVT cases) had only a distal DVT. The mean age of patients was 56 years (+/− 16 years), and the majority (59%) were male. The clinical specialties with the most events included neurosurgery (21%), orthopedics (14%), general surgery (13%), and trauma (11%). Fourteen patients (9%) died during the hospitalization, and of these, six (43%) had either sudden death or death attributed to PE (Table 1).
Cases were also reviewed for the type of VTE prophylactic strategy administered at the time of the event. The top three prophylactic strategies were subcutaneous unfractionated heparin (61%), mechanical prophylaxis only (51%), and enoxaparin (31%). Nine cases of VTE occurred during therapeutic anticoagulation (6%; Table 1).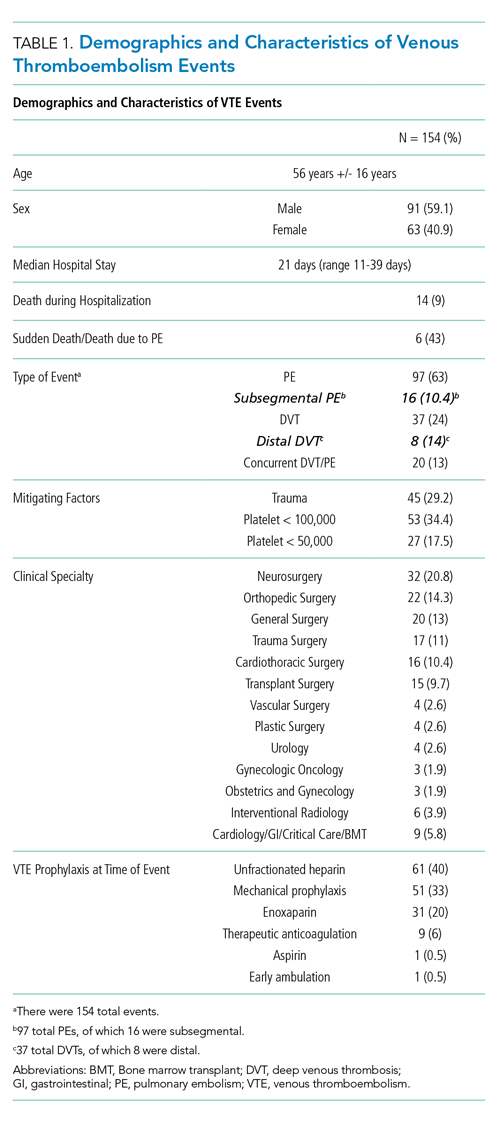
We also evaluated the timing of VTE in relation to hospitalization and procedure. Overall, the median length of hospital stay was 21 days (range: 11-39 days). VTE occurred early in the hospitalization; 21% of cases of VTE occurred within three days of admission, and 43.5% occurred within seven days of admission (Figure 1). With regard to VTE timing in relation to the procedure, 4.5% of cases of VTE occurred prior to the procedure, 33% occurred within three days of the procedure, and 53% occurred within seven days (Figure 2).
Absence of guideline-appropriate VTE prophylaxis was identified in only nine (6%) cases: seven patients had delayed initiation of pharmacologic prophylaxis, and two had pharmacologic prophylaxis held for unknown reasons. When accounting for pharmacologic prophylaxis missed based on patient refusal (n = 10 patients), the number of patients without guideline- appropriate VTE prophylaxis increased to 17 cases (11%), as two of the cases with patient refusal were found to have other quality issues present. Pharmacologic prophylaxis was given to 125 patients during their hospitalization. A median of 8% of ordered doses was refused, and an additional 8% of doses were held for a procedure (Table 2). We evaluated other factors that could have influenced the rate or type of VTE prophylactic strategies toward the use of mechanical prophylaxis, including thrombocytopenia and trauma. Although 11% of cases were treated primarily by the trauma teams (Table 1), a trauma-related procedure accounted for 29% of PSI-12 cases. Thrombocytopenia (platelets of less than 100,000) occurred in 53 cases (34%), with 27 patients (18%) having a platelet count of less than 50,000.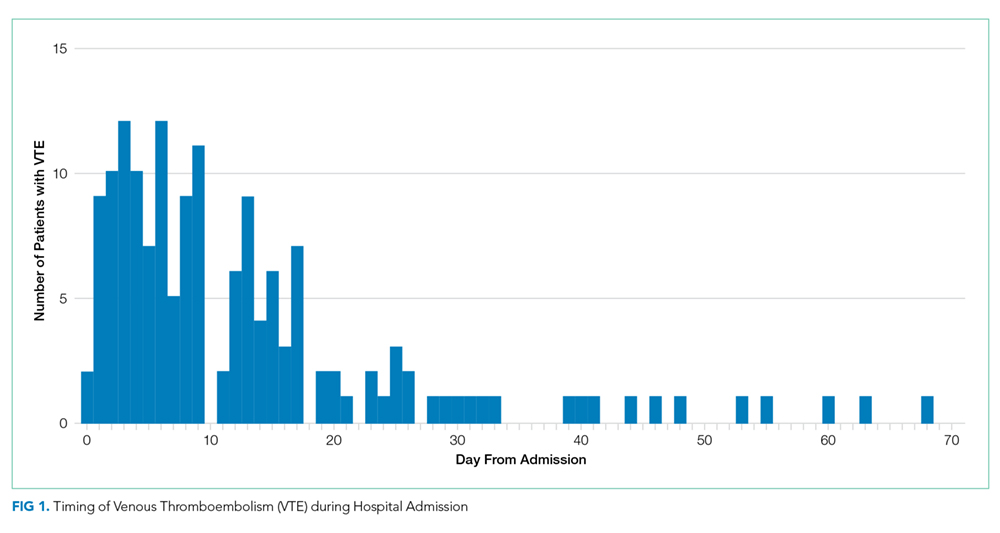
DISCUSSION
Utilizing AHRQ version 5 software for PSI-12, our institution identified 154 cases of perioperative VTE. Most of these cases were a pulmonary embolism, occurred within a week of admission, and were associated with surgical specialties that portend a higher risk of VTE. Very few of these cases were deficient in guideline-directed VTE prophylaxis, and several cases had associated factors such as trauma and thrombocytopenia that may have appropriately influenced the decision to use mechanical only prophylaxis. Sixteen percent of pharmacologic VTE prophylactic doses were refused or held for a procedure, a known but rarely quantified influence on rates of pharmacologic prophylaxis. The use of patient-level data and adjudication of the clinical decision that affected the administration of VTE prophylaxis is a major strength of this work. In all, our data raise several questions about the accuracy of PSI-12 in identifying preventable postoperative VTE, especially as it is utilized as a marker for pay-for-performance measures in addition to identifying further areas for research and improvement.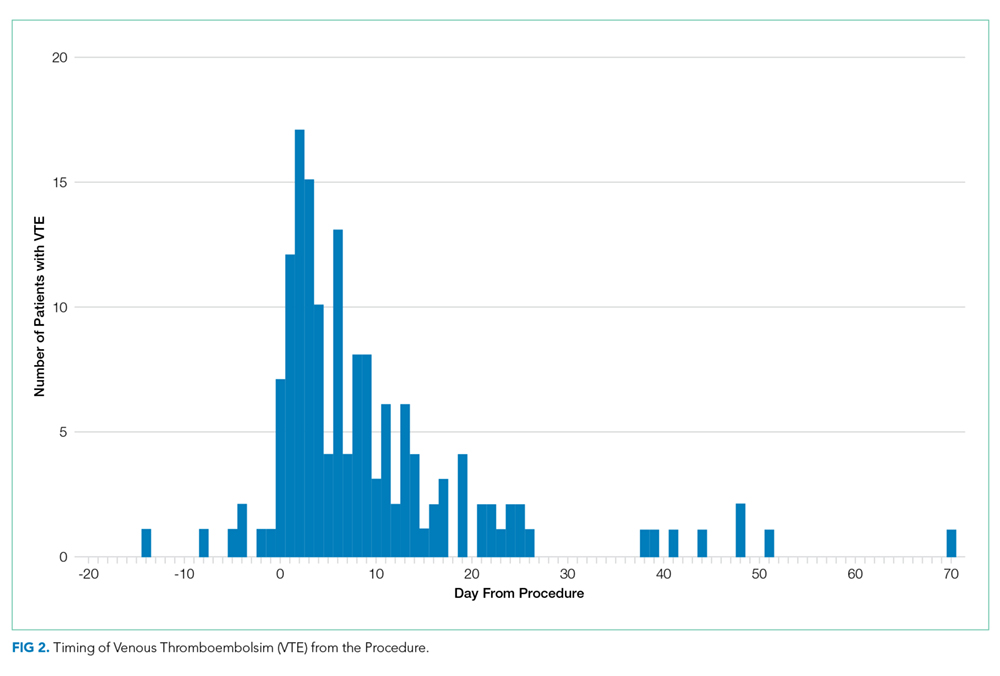
Our results align with previous studies that suggest that PSI-12 is an inaccurate measure of performance quality. A study by Bilimoria et al. in 2013 noted that surveillance biases associated with PSI-12, showing that hospitals with higher compliance to appropriate VTE prophylaxis paradoxically had worse outcomes.10 Furthermore, Blay et al. recently published a study evaluating PSI-90 scores for hospitals with and without the VTE measure included. Their results indicated that larger hospitals (teaching hospitals, level I trauma centers, etc) caring for sicker patients were noted to improve by 8%-25% when the VTE measure was removed.11 Similarly, our data indicate that the PSI-12 may not be an accurate measure of quality performance, as only 6% of cases were noted to be deficient in appropriate guideline-directed prophylaxis. Even when accounting for the refusal of doses of pharmacologic prophylaxis, this figure only increased to 11%.
Procedures included in the current PSI-12 algorithm also vary in the risk they pose to developing VTE. For example, the current version of PSI-12 includes surgical Medicare Severity Diagnosis Related Groups (MS-DRGs) for procedures with a high risk of VTE such as orthopedic, abdominal, or thoracic procedures.14,15, However, it is worth noting that procedures such as tracheostomy and ocular surgery are also included.14 The variation in risk for development of VTE is reflected in the Caprini score, a perioperative risk stratification tool. These latter procedures only contribute one point, whereas trauma would add five points each to the total score, and make the patient a high VTE risk from the procedure alone.16 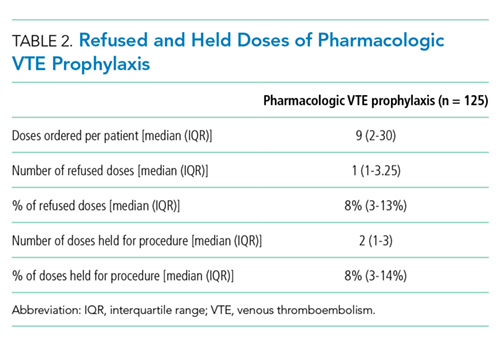
While most of our cases of VTE occurred within higher risk surgical subspecialties, 15 (10%) of our cases were within the clinical specialties of interventional radiology, cardiology, gastroenterology, and bone marrow transplant. One procedure of notable conflict includes bronchoalveolar lavage (BAL), which is included as an operating room procedure per the current version of PSI-12 software,17 but is no longer recognized by CMS as a surgical MS-DRG for reimbursement. The PSI-12 observed-to-expected rates take the DRG and comorbidity codes into consideration, but which DRG is selected does not always reflect the procedure type or the risk of VTE associated with the procedure.
Regarding the type of VTE event, our data revealed that PE was the predominant event, accounting for 62% of cases. This is different compared with other studies, such as the population-based studies in which PE and DVT account for approximately 40%-42% of events, respectively, and approximately 15% with concurrent PE and DVT. 9,18 Borzecki et al. however, noted similar rates to our study, with 55% as PE only, 38% as DVT only, and 8% had both PE and DVT. This study also found a positive correlation between PSI-12 rates and VTE imaging rates, such that if more CT scans were completed, more PEs could be found.19 Our data identified 16 of the 97 cases of PE were subsegmental PE, a subset of VTE whose clinical significance has been questioned.20 Excluding these cases brings the percentage closer to 52%. Also, screening ultrasounds are not performed at our institution. Asymptomatic or minimally symptomatic DVTs could be missed.
Further, this study also highlights that the reliability of PSI-12 is dependent on accurate documentation and coding. This is most evident when reviewing studies that evaluated the positive predictive value (PPV) of this measure.9,12,21 A study of 28 Veteran’s Affairs hospitals from 2003 to 2007 used the AHRQ version 3 software to assess the PPV of PSI-12. Out of the 112 cases flagged by the AHRQ PSI software, only 48 were true events of postoperative DVT, yielding a PPV of only 43%. False-positive results were primarily patients with VTE present on admission and cases that were diagnosed after admission but prior to the index procedure. They also noted that coding inaccuracies were present in 38% of cases.9 Similarly, Henderson et al. conducted a retrospective review of 112 postsurgical discharges noting a PPV of 54%, with most false-positives resulting from superficial clots identified by PSI-12 related to coding ambiguity.12 Our data similarly showed false-positive results as seven cases were excluded based on chart review and documentation correction, and 4.5% were preprocedural. However, there is some discordance with previous studies, as our data yields a PPV of 91% for VTE when accounting for preprocedural events as well as those excluded based on chart review. One explanation is an improvement in documentation strategies and coding, as our institution has adopted strategies to review cases and clarify documentation prior to billing to improve accuracy, and inclusion of a checkbox to indicate that a diagnosis was present on admission. Another possibility is improved accuracy with ICD-10 coding, as shown in a paper by Quan et al. that found a 79% PPV of PSI-12, which improved to 89% when cases present on admission were excluded.21 Lastly, we used newer versions of the AHRQ software, which could have improved the accuracy of detection. Despite these improvements in PSI-12 identifying true cases of postoperative VTE, as our data show, there is still much to be desired in terms of identifying issues with the quality of care and inclusion of PSI-12 in pay-for-performance.
Our study has several limitations. As a retrospective review, a major limiting factor is that data obtained are subject to the accuracy of documentation within the provider and nursing notes. As such, we focused on broad topics such as VTE events, the type of VTE event, and timing of the event in relation to admission and procedure. We actively review cases at discharge prior to billing to correct documentation if required. However, a prolonged hospital stay could lead to a review of the case weeks to months later. A real-time alert for a VTE event in a patient with surgery could improve documentation.
Further, although mechanical only prophylaxis was present on chart review, it is impossible to know both the rate of compliance with this method and whether it contributed to some events.
Despite these limitations, our goals of evaluating the validity of PSI-12 and identifying areas for improved measurement and techniques for DVT prophylaxis were met. As previously discussed, our data suggest that PSI-12 has several limitations in identifying quality of care issues with the prevention of DVT. For example, PSI-12 included many cases in which pharmacologic prophylaxis was appropriately not given. Approximately 50% of cases occurred in patients who were thrombocytopenic (platelets < 100,000), and 29% of events occurred in trauma patients. In addition, 33% of cases identified were within three days of the procedure, which, in cases of high-bleeding risk procedures, is an appropriate time to refrain from pharmacologic anticoagulation.13 In cases such as these, it may be worth evaluating alternative forms of mechanical only prophylaxis, or other strategies to mitigate this risk.
This study also highlights areas for further research. Many of the VTE events in this study occurred while patients were treated with appropriate prophylaxis, as other studies have also shown.22,23 Gangireddy et al. looked at demographic and clinical information surrounding postoperative VTE and found several other risk factors that incur a higher risk of VTE, including steroid use, infections, and myocardial infarction.24 Perhaps future studies could target these groups as potential points for increased prophylactic strategies. As noted by Lau et al. appropriate VTE prophylaxis involves risk stratification, ordering the appropriate prophylaxis by clinicians, patient acceptance of prescribed therapy, and nursing administration of prescribed therapy.25 As exemplified by our data, despite appropriate prophylaxis being ordered, eight events were associated solely with the refusal of pharmacologic prophylaxis. An ideal VTE metric would identify patients with a VTE who had a defective VTE prophylactic process,25 but the cost associated with manual data abstraction may limit the inclusion of a process metric into pay-for-performance. Additional research also needs to identify whether modifications to PSI-12 can improve its accuracy and predictive value, such as the exclusion of VTE prior to a procedure, modifications to what counts as a procedure, or utilizing markers to assess adherence to VTE prophylactic rates. These points are especially important to consider if PSI-12 is to remain as one of the key factors in pay-for-performance outcome measures. Lastly, understanding the effectiveness and patient adherence to oral VTE prophylactic regimens could also decrease the rates of refusal of VTE prophylaxis.
Overall, VTE remains a large contributor to morbidity and mortality among hospitalized surgical patients. While there is utility in PSI-12 as a screening tool to identify these events and potential areas for improved processes to decrease VTE, its usefulness for detection of true quality issues and its utilization in pay-for-performance is questionable. The universally high rates of VTE prophylaxis question the need for a VTE prophylactic metric. However, if these metrics are going to continue to be used in determining payments, modifications to the current processes and algorithms are needed to improve accuracy in identifying issues in quality of care.
1. Valsami S, Asmis LM. A brief review of 50 years of perioperative thrombosis and hemostasis management. Semin Hematol. 2013;50(2):79-87. https://doi.org/10.1053/j.seminhematol.2013.04.001.
2. Collins R, Scrimgeour A, Yusuf S, Peto R. Reduction in fatal pulmonary embolism and venous thrombosis by perioperative administration of subcutaneous heparin. N Engl J Med. 1988;318(18):1162-1173. https://doi.org/10.1056/NEJM198805053181805.
3. Heit JA, Crusan DJ, Ashrani AA, Petterson TM, Bailey KR. Effect of a near-universal hospitalization-based prophylaxis regimen on annual number of venous thromboembolism events in the US. Blood. 2017;130(2):109-114. https://doi.org/10.1182/blood-2016-12-758995.
4. Landrigan CP, Parry GJ, Bones CB, Hackbarth AD, Goldmann DA, Sharek PJ. Temporal trends in rates of patient harm resulting from medical care. N Engl J Med. 2010;363(22):2124-2134. https://doi.org/10.1056/NEJMsa1004404.
5. Agency for Healthcare Research and Quality. Patient Safety Indicators Brochure. 2015 Edition. https://www.qualityindicators.ahrq.gov/Downloads/Modules/PSI/V50/PSI_Brochure.pdf. Accessed 10 Jun 2019.
6. Centers for Medicare & Medicaid Services. CMS Hospital Value-Based Purchasing Program Results for Fiscal Year 2018. 2017. https://www.cms.gov/newsroom/fact-sheets/cms-hospital-value-based-purchasing-program-results-fiscal-year-2018. Accessed June 10, 2019.
7. Rajaram R, Barnard C, Bilimoria KY. Concerns about using the patient safety indicator-90 composite in pay-for-performance programs. JAMA. 2015;313(9):897-898. https://doi.org/10.1001/jamacardio.2018.2382.
8. Agency for Healthcare Research and Quality. Patient Safety Indicator 12 (PSI 12) Perioperative Pulmonary Embolism or Deep Vein Thrombosis Rate. 2017. https://www.qualityindicators.ahrq.gov/Downloads/Modules/PSI/V60-ICD09/TechSpecs/PSI_12_Perioperative_Pulmonary_Embolism_or_Deep_Vein_Thrombosis_Rate.pdf. Accessed June 9, 2019.
9. Kaafarani HM, Borzecki AM, Itani KM, et al. Validity of selected patient safety indicators: opportunities and concerns. J Am Coll Surg. 2011;212(6):924-934. https://doi.org/10.1016/j.jamcollsurg.2010.07.007.
10. Bilimoria KY, Chung J, Ju MH, et al. Evaluation of surveillance bias and the validity of the venous thromboembolism quality measure. JAMA. 2013;310(14):1482-1489. https://doi.org/10.1001/jama.2013.280048.
11. Blay E, Jr., Huang R, Chung JW, et al. Evaluating the impact of the venous thromboembolism outcome measure on the PSI 90 composite quality metric. Jt Comm J Qual Patient Saf. 2019;45(3):148-155. https://doi.org/10.1016/j.jcjq.2018.08.009
12. Henderson KE, Recktenwald A, Reichley RM, et al. Clinical validation of the AHRQ postoperative venous thromboembolism patient safety indicator. Jt Comm J Qual Patient Saf. 2009;35(7):370-376.
13. Douketis JD, Spyropoulos AC, Spencer FA, et al. Perioperative management of antithrombotic therapy: antithrombotic therapy and prevention of thrombosis, 9th ed: American College of Chest Physicians Evidence-Based Clinical Practice Guidelines. Chest. 2012;141(2):e326S-e350S. https://doi.org/10.1378/chest.11-2298.
14. Agency for Healthcare Research and Quality. Appendix E: Surgical Discharge MS-DRGs. 2018. https://www.qualityindicators.ahrq.gov/Downloads/Modules/PSI/V2018/TechSpecs/PSI_Appendix_E.pdf. Accessed June 9, 2019.
15. Anderson FA, Jr., Spencer FA. Risk factors for venous thromboembolism. Circulation. 2003;107(23 Suppl 1):I9-16. https://doi.org/10.1161/01.CIR.0000078469.07362.E6.
16. Caprini JA. Thrombosis risk assessment as a guide to quality patient care. Dis Mon. 2005;51(2-3):70-78. https://doi.org/10.1016/j.disamonth.2005.02.003.
17. Agency for Healthcare Research and Quality. Appendix A: Operating Room Procedure Codes. 2018. https://www.qualityindicators.ahrq.gov/Downloads/Modules/PSI/V2018/TechSpecs/PSI_Appendix_A.pdf. Accessed June 9, 2019
18. Silverstein MD, Heit JA, Mohr DN, Petterson TM, O’Fallon WM, Melton LJ, 3rd. Trends in the incidence of deep vein thrombosis and pulmonary embolism: a 25-year population-based study. Arch Intern Med. 1998;158(6):585-593. https://doi.org/10.1001/archinte.158.6.585.
19. Borzecki AM, Chen Q, O’Brien W, et al. The patient safety indicator perioperative pulmonary embolism or deep vein thrombosis: is there associated surveillance bias in the veterans health administration? Am J Surg. 2018;216(5):974-979. https://doi.org/10.1016/j.amjsurg.2018.06.023.
20. Carrier M, Righini M, Wells PS, et al. Subsegmental pulmonary embolism diagnosed by computed tomography: incidence and clinical implications. A systematic review and meta-analysis of the management outcome studies. J Thromb Haemost. 2010;8(8):1716-1722. https://doi.org/10.1111/j.1538-7836.2010.03938.x.
21. Quan H, Eastwood C, Cunningham CT, et al. Validity of AHRQ patient safety indicators derived from ICD-10 hospital discharge abstract data (chart review study). BMJ Open. 2013;3(10):e003716. https://doi.org/10.1136/bmjopen-2013-003716.
22. Flanders SA, Greene MT, Grant P, et al. Hospital performance for pharmacologic venous thromboembolism prophylaxis and rate of venous thromboembolism: a cohort study. JAMA Intern Med. 2014;174(10):1577-1584. https://doi.org/10.1001/jamainternmed.2014.3384.
23. Wang TF, Wong CA, Milligan PE, Thoelke MS, Woeltje KF, Gage BF. Risk factors for inpatient venous thromboembolism despite thromboprophylaxis. Thromb Res. 2014;133(1):25-29. https://doi.org/10.1016/j.thromres.2013.09.011.
24. Gangireddy C, Rectenwald JR, Upchurch GR, et al. Risk factors and clinical impact of postoperative symptomatic venous thromboembolism. J Vass Surg. 2007;45(2):335-341; discussion 341-332. https://doi.org/10.1016/j.jvs.2006.10.034.
25. Lau BD, Streiff MB, Pronovost PJ, Haut ER. Venous thromboembolism quality measures fail to accurately measure quality. Circulation. 2018;137(12):1278-1284. https://doi.org/10.1161/CIRCULATIONAHA.116.026897.
Perioperative venous thromboembolism (VTE) is a major contributor to the morbidity and mortality of hospitalized patients. The historical incidence of postoperative VTE varied between 15%-80% depending on the type of procedure and monitoring strategies. Higher incidences of VTE occurred with major surgery (15%-40%), knee or hip arthroplasty (40%-60%), and trauma (60%-80%).1 The use of VTE prophylaxis with subcutaneous heparin reduced DVTs by 70% and PEs by 50%.2 A recent study from Olmstead County showed improved adherence to inpatient VTE prophylaxis from 2005 to 2010 but no difference in VTE incidence. However, 52% of VTE events were associated with hospitalization.3 As such, VTE continues to be a healthcare-associated adverse event, and surgery remains a significant risk factor for thrombosis.4
The Agency for Healthcare Research and Quality (AHRQ) released Patient Safety Indicators (PSI) in 2003 to provide a means of screening for adverse events.5 Over time, PSIs have been adopted as a measure of hospital performance and are utilized in several pay-for-performance programs. PSI-90 is a composite measure of several other PSIs and is a core metric in the Centers for Medicare and Medicaid Services (CMS) Hospital-Acquired Condition Reduction Program and the Hospital Value-Based Purchasing Program which impacts up to 2% of a hospital’s Medicare payments.6,7 One component of PSI-90 is PSI-12, which captures perioperative VTE. PSI-12 events are identified using software that screens medical records based on International Classification of Diseases (ICD)-9/10 codes for thrombosis and procedure codes at time of discharge.8
Over the last several years, there has been concern regarding the validity of including PSI-12 in pay-for-performance metrics. Common areas for concern include PSI-12’s accuracy in detecting true postoperative VTE9 in addition to surveillance bias.10,11 However, some note that PSI-12 is useful when applied with its original intent: as a screening tool for hospitals to identify specific areas to implement improvements.9,12The aim of our study was to review all PSI-12 events at our institution to evaluate the accuracy of PSI-12 and identify areas for improvement to prevent VTE events in surgical patients. While several other studies have looked at the positive predictive values, accuracy, or surveillance bias of PSI-12, to the best of our knowledge, few, if any, previous studies have reported PSI-12 events in relation to their timing, type of prophylaxis used, and mitigating factors to identify areas for quality improvement.
METHODS
PSI-12 events were identified between June 2015 and June 2017 using AHRQ software (version 5). Cases were also identified through Vizient and reviewed to ensure congruence between the methods. Patients’ electronic medical records were reviewed for patient demographics, type of VTE event, platelet count at VTE diagnosis, procedure type, and both the timing and type of VTE prophylaxis. Summary statistics were calculated.
We considered perioperative VTE pharmacologic prophylaxis appropriate if started within 24 hours of a low bleeding risk procedure or 72 hours of a high-bleeding risk procedure.13 Mechanical prophylaxis was considered appropriate if pharmacologic prophylaxis was not used because of procedure risk, thrombocytopenia, or active bleeding. The medication administration record was reviewed to determine if prophylaxis was ordered, given, and/or refused.
RESULTS
During the two-year period, 18,084 surgeries were performed, and 161 cases of VTE events were identified. A detailed chart review and correction of documentation led to the exclusion of seven cases (4%) because the VTE event occurred prior to admission (n = 5) or were incidental findings that did not meet the Uniform Hospital Discharge Data Set definition for reporting (n = 2). In total, 154 (0.9% of all surgeries) cases were considered PSI-12 events. Pulmonary embolism (PE) occurred in most cases (n = 97, 62.9%), followed by deep vein thrombosis (DVT) (n = 37, 24.0%). Twenty cases (12.9%) experienced concurrent PE and DVT. Within the PE group, 16 cases (14%) were subsegmental PE only. Eight patients (14% of DVT cases) had only a distal DVT. The mean age of patients was 56 years (+/− 16 years), and the majority (59%) were male. The clinical specialties with the most events included neurosurgery (21%), orthopedics (14%), general surgery (13%), and trauma (11%). Fourteen patients (9%) died during the hospitalization, and of these, six (43%) had either sudden death or death attributed to PE (Table 1).
Cases were also reviewed for the type of VTE prophylactic strategy administered at the time of the event. The top three prophylactic strategies were subcutaneous unfractionated heparin (61%), mechanical prophylaxis only (51%), and enoxaparin (31%). Nine cases of VTE occurred during therapeutic anticoagulation (6%; Table 1).
We also evaluated the timing of VTE in relation to hospitalization and procedure. Overall, the median length of hospital stay was 21 days (range: 11-39 days). VTE occurred early in the hospitalization; 21% of cases of VTE occurred within three days of admission, and 43.5% occurred within seven days of admission (Figure 1). With regard to VTE timing in relation to the procedure, 4.5% of cases of VTE occurred prior to the procedure, 33% occurred within three days of the procedure, and 53% occurred within seven days (Figure 2).
Absence of guideline-appropriate VTE prophylaxis was identified in only nine (6%) cases: seven patients had delayed initiation of pharmacologic prophylaxis, and two had pharmacologic prophylaxis held for unknown reasons. When accounting for pharmacologic prophylaxis missed based on patient refusal (n = 10 patients), the number of patients without guideline- appropriate VTE prophylaxis increased to 17 cases (11%), as two of the cases with patient refusal were found to have other quality issues present. Pharmacologic prophylaxis was given to 125 patients during their hospitalization. A median of 8% of ordered doses was refused, and an additional 8% of doses were held for a procedure (Table 2). We evaluated other factors that could have influenced the rate or type of VTE prophylactic strategies toward the use of mechanical prophylaxis, including thrombocytopenia and trauma. Although 11% of cases were treated primarily by the trauma teams (Table 1), a trauma-related procedure accounted for 29% of PSI-12 cases. Thrombocytopenia (platelets of less than 100,000) occurred in 53 cases (34%), with 27 patients (18%) having a platelet count of less than 50,000.
DISCUSSION
Utilizing AHRQ version 5 software for PSI-12, our institution identified 154 cases of perioperative VTE. Most of these cases were a pulmonary embolism, occurred within a week of admission, and were associated with surgical specialties that portend a higher risk of VTE. Very few of these cases were deficient in guideline-directed VTE prophylaxis, and several cases had associated factors such as trauma and thrombocytopenia that may have appropriately influenced the decision to use mechanical only prophylaxis. Sixteen percent of pharmacologic VTE prophylactic doses were refused or held for a procedure, a known but rarely quantified influence on rates of pharmacologic prophylaxis. The use of patient-level data and adjudication of the clinical decision that affected the administration of VTE prophylaxis is a major strength of this work. In all, our data raise several questions about the accuracy of PSI-12 in identifying preventable postoperative VTE, especially as it is utilized as a marker for pay-for-performance measures in addition to identifying further areas for research and improvement.
Our results align with previous studies that suggest that PSI-12 is an inaccurate measure of performance quality. A study by Bilimoria et al. in 2013 noted that surveillance biases associated with PSI-12, showing that hospitals with higher compliance to appropriate VTE prophylaxis paradoxically had worse outcomes.10 Furthermore, Blay et al. recently published a study evaluating PSI-90 scores for hospitals with and without the VTE measure included. Their results indicated that larger hospitals (teaching hospitals, level I trauma centers, etc) caring for sicker patients were noted to improve by 8%-25% when the VTE measure was removed.11 Similarly, our data indicate that the PSI-12 may not be an accurate measure of quality performance, as only 6% of cases were noted to be deficient in appropriate guideline-directed prophylaxis. Even when accounting for the refusal of doses of pharmacologic prophylaxis, this figure only increased to 11%.
Procedures included in the current PSI-12 algorithm also vary in the risk they pose to developing VTE. For example, the current version of PSI-12 includes surgical Medicare Severity Diagnosis Related Groups (MS-DRGs) for procedures with a high risk of VTE such as orthopedic, abdominal, or thoracic procedures.14,15, However, it is worth noting that procedures such as tracheostomy and ocular surgery are also included.14 The variation in risk for development of VTE is reflected in the Caprini score, a perioperative risk stratification tool. These latter procedures only contribute one point, whereas trauma would add five points each to the total score, and make the patient a high VTE risk from the procedure alone.16
While most of our cases of VTE occurred within higher risk surgical subspecialties, 15 (10%) of our cases were within the clinical specialties of interventional radiology, cardiology, gastroenterology, and bone marrow transplant. One procedure of notable conflict includes bronchoalveolar lavage (BAL), which is included as an operating room procedure per the current version of PSI-12 software,17 but is no longer recognized by CMS as a surgical MS-DRG for reimbursement. The PSI-12 observed-to-expected rates take the DRG and comorbidity codes into consideration, but which DRG is selected does not always reflect the procedure type or the risk of VTE associated with the procedure.
Regarding the type of VTE event, our data revealed that PE was the predominant event, accounting for 62% of cases. This is different compared with other studies, such as the population-based studies in which PE and DVT account for approximately 40%-42% of events, respectively, and approximately 15% with concurrent PE and DVT. 9,18 Borzecki et al. however, noted similar rates to our study, with 55% as PE only, 38% as DVT only, and 8% had both PE and DVT. This study also found a positive correlation between PSI-12 rates and VTE imaging rates, such that if more CT scans were completed, more PEs could be found.19 Our data identified 16 of the 97 cases of PE were subsegmental PE, a subset of VTE whose clinical significance has been questioned.20 Excluding these cases brings the percentage closer to 52%. Also, screening ultrasounds are not performed at our institution. Asymptomatic or minimally symptomatic DVTs could be missed.
Further, this study also highlights that the reliability of PSI-12 is dependent on accurate documentation and coding. This is most evident when reviewing studies that evaluated the positive predictive value (PPV) of this measure.9,12,21 A study of 28 Veteran’s Affairs hospitals from 2003 to 2007 used the AHRQ version 3 software to assess the PPV of PSI-12. Out of the 112 cases flagged by the AHRQ PSI software, only 48 were true events of postoperative DVT, yielding a PPV of only 43%. False-positive results were primarily patients with VTE present on admission and cases that were diagnosed after admission but prior to the index procedure. They also noted that coding inaccuracies were present in 38% of cases.9 Similarly, Henderson et al. conducted a retrospective review of 112 postsurgical discharges noting a PPV of 54%, with most false-positives resulting from superficial clots identified by PSI-12 related to coding ambiguity.12 Our data similarly showed false-positive results as seven cases were excluded based on chart review and documentation correction, and 4.5% were preprocedural. However, there is some discordance with previous studies, as our data yields a PPV of 91% for VTE when accounting for preprocedural events as well as those excluded based on chart review. One explanation is an improvement in documentation strategies and coding, as our institution has adopted strategies to review cases and clarify documentation prior to billing to improve accuracy, and inclusion of a checkbox to indicate that a diagnosis was present on admission. Another possibility is improved accuracy with ICD-10 coding, as shown in a paper by Quan et al. that found a 79% PPV of PSI-12, which improved to 89% when cases present on admission were excluded.21 Lastly, we used newer versions of the AHRQ software, which could have improved the accuracy of detection. Despite these improvements in PSI-12 identifying true cases of postoperative VTE, as our data show, there is still much to be desired in terms of identifying issues with the quality of care and inclusion of PSI-12 in pay-for-performance.
Our study has several limitations. As a retrospective review, a major limiting factor is that data obtained are subject to the accuracy of documentation within the provider and nursing notes. As such, we focused on broad topics such as VTE events, the type of VTE event, and timing of the event in relation to admission and procedure. We actively review cases at discharge prior to billing to correct documentation if required. However, a prolonged hospital stay could lead to a review of the case weeks to months later. A real-time alert for a VTE event in a patient with surgery could improve documentation.
Further, although mechanical only prophylaxis was present on chart review, it is impossible to know both the rate of compliance with this method and whether it contributed to some events.
Despite these limitations, our goals of evaluating the validity of PSI-12 and identifying areas for improved measurement and techniques for DVT prophylaxis were met. As previously discussed, our data suggest that PSI-12 has several limitations in identifying quality of care issues with the prevention of DVT. For example, PSI-12 included many cases in which pharmacologic prophylaxis was appropriately not given. Approximately 50% of cases occurred in patients who were thrombocytopenic (platelets < 100,000), and 29% of events occurred in trauma patients. In addition, 33% of cases identified were within three days of the procedure, which, in cases of high-bleeding risk procedures, is an appropriate time to refrain from pharmacologic anticoagulation.13 In cases such as these, it may be worth evaluating alternative forms of mechanical only prophylaxis, or other strategies to mitigate this risk.
This study also highlights areas for further research. Many of the VTE events in this study occurred while patients were treated with appropriate prophylaxis, as other studies have also shown.22,23 Gangireddy et al. looked at demographic and clinical information surrounding postoperative VTE and found several other risk factors that incur a higher risk of VTE, including steroid use, infections, and myocardial infarction.24 Perhaps future studies could target these groups as potential points for increased prophylactic strategies. As noted by Lau et al. appropriate VTE prophylaxis involves risk stratification, ordering the appropriate prophylaxis by clinicians, patient acceptance of prescribed therapy, and nursing administration of prescribed therapy.25 As exemplified by our data, despite appropriate prophylaxis being ordered, eight events were associated solely with the refusal of pharmacologic prophylaxis. An ideal VTE metric would identify patients with a VTE who had a defective VTE prophylactic process,25 but the cost associated with manual data abstraction may limit the inclusion of a process metric into pay-for-performance. Additional research also needs to identify whether modifications to PSI-12 can improve its accuracy and predictive value, such as the exclusion of VTE prior to a procedure, modifications to what counts as a procedure, or utilizing markers to assess adherence to VTE prophylactic rates. These points are especially important to consider if PSI-12 is to remain as one of the key factors in pay-for-performance outcome measures. Lastly, understanding the effectiveness and patient adherence to oral VTE prophylactic regimens could also decrease the rates of refusal of VTE prophylaxis.
Overall, VTE remains a large contributor to morbidity and mortality among hospitalized surgical patients. While there is utility in PSI-12 as a screening tool to identify these events and potential areas for improved processes to decrease VTE, its usefulness for detection of true quality issues and its utilization in pay-for-performance is questionable. The universally high rates of VTE prophylaxis question the need for a VTE prophylactic metric. However, if these metrics are going to continue to be used in determining payments, modifications to the current processes and algorithms are needed to improve accuracy in identifying issues in quality of care.
1. Valsami S, Asmis LM. A brief review of 50 years of perioperative thrombosis and hemostasis management. Semin Hematol. 2013;50(2):79-87. https://doi.org/10.1053/j.seminhematol.2013.04.001.
2. Collins R, Scrimgeour A, Yusuf S, Peto R. Reduction in fatal pulmonary embolism and venous thrombosis by perioperative administration of subcutaneous heparin. N Engl J Med. 1988;318(18):1162-1173. https://doi.org/10.1056/NEJM198805053181805.
3. Heit JA, Crusan DJ, Ashrani AA, Petterson TM, Bailey KR. Effect of a near-universal hospitalization-based prophylaxis regimen on annual number of venous thromboembolism events in the US. Blood. 2017;130(2):109-114. https://doi.org/10.1182/blood-2016-12-758995.
4. Landrigan CP, Parry GJ, Bones CB, Hackbarth AD, Goldmann DA, Sharek PJ. Temporal trends in rates of patient harm resulting from medical care. N Engl J Med. 2010;363(22):2124-2134. https://doi.org/10.1056/NEJMsa1004404.
5. Agency for Healthcare Research and Quality. Patient Safety Indicators Brochure. 2015 Edition. https://www.qualityindicators.ahrq.gov/Downloads/Modules/PSI/V50/PSI_Brochure.pdf. Accessed 10 Jun 2019.
6. Centers for Medicare & Medicaid Services. CMS Hospital Value-Based Purchasing Program Results for Fiscal Year 2018. 2017. https://www.cms.gov/newsroom/fact-sheets/cms-hospital-value-based-purchasing-program-results-fiscal-year-2018. Accessed June 10, 2019.
7. Rajaram R, Barnard C, Bilimoria KY. Concerns about using the patient safety indicator-90 composite in pay-for-performance programs. JAMA. 2015;313(9):897-898. https://doi.org/10.1001/jamacardio.2018.2382.
8. Agency for Healthcare Research and Quality. Patient Safety Indicator 12 (PSI 12) Perioperative Pulmonary Embolism or Deep Vein Thrombosis Rate. 2017. https://www.qualityindicators.ahrq.gov/Downloads/Modules/PSI/V60-ICD09/TechSpecs/PSI_12_Perioperative_Pulmonary_Embolism_or_Deep_Vein_Thrombosis_Rate.pdf. Accessed June 9, 2019.
9. Kaafarani HM, Borzecki AM, Itani KM, et al. Validity of selected patient safety indicators: opportunities and concerns. J Am Coll Surg. 2011;212(6):924-934. https://doi.org/10.1016/j.jamcollsurg.2010.07.007.
10. Bilimoria KY, Chung J, Ju MH, et al. Evaluation of surveillance bias and the validity of the venous thromboembolism quality measure. JAMA. 2013;310(14):1482-1489. https://doi.org/10.1001/jama.2013.280048.
11. Blay E, Jr., Huang R, Chung JW, et al. Evaluating the impact of the venous thromboembolism outcome measure on the PSI 90 composite quality metric. Jt Comm J Qual Patient Saf. 2019;45(3):148-155. https://doi.org/10.1016/j.jcjq.2018.08.009
12. Henderson KE, Recktenwald A, Reichley RM, et al. Clinical validation of the AHRQ postoperative venous thromboembolism patient safety indicator. Jt Comm J Qual Patient Saf. 2009;35(7):370-376.
13. Douketis JD, Spyropoulos AC, Spencer FA, et al. Perioperative management of antithrombotic therapy: antithrombotic therapy and prevention of thrombosis, 9th ed: American College of Chest Physicians Evidence-Based Clinical Practice Guidelines. Chest. 2012;141(2):e326S-e350S. https://doi.org/10.1378/chest.11-2298.
14. Agency for Healthcare Research and Quality. Appendix E: Surgical Discharge MS-DRGs. 2018. https://www.qualityindicators.ahrq.gov/Downloads/Modules/PSI/V2018/TechSpecs/PSI_Appendix_E.pdf. Accessed June 9, 2019.
15. Anderson FA, Jr., Spencer FA. Risk factors for venous thromboembolism. Circulation. 2003;107(23 Suppl 1):I9-16. https://doi.org/10.1161/01.CIR.0000078469.07362.E6.
16. Caprini JA. Thrombosis risk assessment as a guide to quality patient care. Dis Mon. 2005;51(2-3):70-78. https://doi.org/10.1016/j.disamonth.2005.02.003.
17. Agency for Healthcare Research and Quality. Appendix A: Operating Room Procedure Codes. 2018. https://www.qualityindicators.ahrq.gov/Downloads/Modules/PSI/V2018/TechSpecs/PSI_Appendix_A.pdf. Accessed June 9, 2019
18. Silverstein MD, Heit JA, Mohr DN, Petterson TM, O’Fallon WM, Melton LJ, 3rd. Trends in the incidence of deep vein thrombosis and pulmonary embolism: a 25-year population-based study. Arch Intern Med. 1998;158(6):585-593. https://doi.org/10.1001/archinte.158.6.585.
19. Borzecki AM, Chen Q, O’Brien W, et al. The patient safety indicator perioperative pulmonary embolism or deep vein thrombosis: is there associated surveillance bias in the veterans health administration? Am J Surg. 2018;216(5):974-979. https://doi.org/10.1016/j.amjsurg.2018.06.023.
20. Carrier M, Righini M, Wells PS, et al. Subsegmental pulmonary embolism diagnosed by computed tomography: incidence and clinical implications. A systematic review and meta-analysis of the management outcome studies. J Thromb Haemost. 2010;8(8):1716-1722. https://doi.org/10.1111/j.1538-7836.2010.03938.x.
21. Quan H, Eastwood C, Cunningham CT, et al. Validity of AHRQ patient safety indicators derived from ICD-10 hospital discharge abstract data (chart review study). BMJ Open. 2013;3(10):e003716. https://doi.org/10.1136/bmjopen-2013-003716.
22. Flanders SA, Greene MT, Grant P, et al. Hospital performance for pharmacologic venous thromboembolism prophylaxis and rate of venous thromboembolism: a cohort study. JAMA Intern Med. 2014;174(10):1577-1584. https://doi.org/10.1001/jamainternmed.2014.3384.
23. Wang TF, Wong CA, Milligan PE, Thoelke MS, Woeltje KF, Gage BF. Risk factors for inpatient venous thromboembolism despite thromboprophylaxis. Thromb Res. 2014;133(1):25-29. https://doi.org/10.1016/j.thromres.2013.09.011.
24. Gangireddy C, Rectenwald JR, Upchurch GR, et al. Risk factors and clinical impact of postoperative symptomatic venous thromboembolism. J Vass Surg. 2007;45(2):335-341; discussion 341-332. https://doi.org/10.1016/j.jvs.2006.10.034.
25. Lau BD, Streiff MB, Pronovost PJ, Haut ER. Venous thromboembolism quality measures fail to accurately measure quality. Circulation. 2018;137(12):1278-1284. https://doi.org/10.1161/CIRCULATIONAHA.116.026897.
© 2019 Society of Hospital Medicine
Imaging Strategies and Outcomes in Children Hospitalized with Cervical Lymphadenitis
Cervical lymphadenitis is a common superficial neck infection in childhood. While most children with cervical lymphadenitis recover with antibiotic therapy, a subset can develop an abscess that may require surgical drainage. Radiologic imaging, most commonly ultrasound or computed tomography (CT), is often performed to identify such an abscess.1-3 However, no national standards exist to guide clinician decision making around imaging in this population. In the absence of evidence-based guidelines, variability in frequency, timing, and modality of imaging likely exists in children hospitalized with cervical lymphadenitis.
As demonstrated for several other common pediatric conditions,4,5 variability in imaging practices may contribute to overutilization of resources in children with cervical lymphadenitis. In particular, routinely conducting imaging on presentation may constitute overuse, as children with cervical lymphadenitis who present with less than 72 hours of neck swelling rarely undergo surgical drainage within the first 24 hours of hospitalization.1,6,7 Imaging performed on presentation is often repeated later during hospitalization, particularly if the patient has not improved with antibiotic therapy. The net result may be unnecessary, redundant radiologic studies. Furthermore, serious complications such as bacteremia, extension of infection into the retropharyngeal space, or involvement of the airway or vasculature rarely occur in children with cervical lymphadenitis.6,8 In this context, deferring initial imaging in this population is unlikely to lead to adverse outcomes and may reduce radiation exposure.
The overall objectives of this study are to describe hospital-level variation in imaging practices for pediatric cervical lymphadenitis and to examine the association between early imaging and outcomes in this population.
METHODS
Study Design and Data Source
We conducted a multicenter, cross-sectional study using the Pediatric Health Information Systems (PHIS) database, which contains administrative and billing data from 49 geographically diverse children’s hospitals across the United States (US) affiliated with the Children’s Hospital Association (Lenexa, Kansas). PHIS includes data on patient demographics, discharge diagnoses, and procedures using the International Classification of Diseases, 9th (ICD-9) and 10th Revision (ICD-10) diagnosis codes, as well as daily billed resource utilization for laboratory tests, imaging studies, and medications. Encrypted medical record numbers permit longitudinal identification of children across multiple visits to the same hospital. Use of de-identified PHIS data was deemed to be nonhuman subjects research; our approach to validation of ICD codes using local electronic medical record review was reviewed and approved by the Cincinnati Children’s Hospital Medical Center Institutional Review Board.
Study Population
Our study team developed an algorithm to identify children with cervical lymphadenitis and minimize misclassification using PHIS (Appendix A). All children with lymphadenitis-related ICD-9 and ICD-10 discharge diagnosis codes were eligible for inclusion.
This algorithm was subsequently applied to the PHIS database. Children ages two months to 18 years hospitalized at participating PHIS institutions between July 2013 and December 2017 with a diagnosis of cervical lymphadenitis as per th
Measures of Interest
To examine hospital-level variation in imaging practices, we measured the proportion of children at each hospital who underwent any neck imaging study, CT or ultrasound imaging, early imaging, and multiple imaging studies within a single hospitalization. Neck imaging was defined as the presence of a billing code for ultrasound, CT, or magnetic resonance imaging (MRI) study of the neck (Appendix B). Early imaging was defined as neck imaging conducted on day 0 of hospitalization (ie, calendar day of admission and ending at midnight). Multiple imaging studies were defined as the receipt of more than one imaging study, regardless of timing or modality. We also measured the proportion of children by hospital who received surgical drainage, defined by the presence of procedure codes for incision and drainage of abscess of the neck (Appendix B).
In examining patient-level association between early imaging and clinical outcomes, our primary outcome of interest was the receipt of multiple imaging studies. Secondary outcomes included rates of surgical drainage, length of stay (in hospital days), and rates of lymphadenitis-related hospital readmission within 30 days of index discharge.
Covariates
Baseline demographic characteristics included age, gender, race/ethnicity, and insurance type. We measured ED visits associated with lymphadenitis-related diagnosis codes in the 30 days prior to admission as a proxy measure for illness duration prior to presentation. To approximate illness severity, we included the following covariates: rates of intensive care unit admission on presentation, rates of receipt of intravenous (IV) analgesia (Appendix B) on hospital days prior to surgical drainage, and rates of receipt of broad-spectrum antibiotics on day 0 or 1 of hospitalization. Broad-spectrum antibiotics (Appendix B) were defined by an independent three-person review of available antibiotic codes (SD, SSS, and JT); differences were resolved by group consensus.
Analysis
Categorical variables were described using frequencies and percentages, while continuous data were described using median and interquartile range. We described hospital-level variation in imaging practices by calculating and comparing the proportion of children at each hospital who underwent any neck imaging study, CT imaging, ultrasound imaging, early imaging, multiple imaging studies, and surgical drainage.
Patient-level demographics and clinical characteristics were compared across groups using chi-square test. To examine the association between early imaging and outcomes, we used generalized linear or logistic mixed effects models to control for patient demographic characteristics and clinical markers of illness duration and severity, with a random effect for hospital to account for clustering. Patient demographics in the model defined a priori included age, race/ethnicity, and insurance type; clinical characteristics included prior ED visit for lymphadenitis, initial intensive care unit (ICU) admission, use of IV analgesia, and use of broad-spectrum antibiotics on day 0 or 1 of hospitalization. To assess the potential for misclassification related to the availability of calendar day but not time of imaging in PHIS, we conducted a secondary analysis to examine the patient-level association between early imaging and outcomes using an alternative definition for early imaging (defined as imaging conducted on day 0 or day 1 of hospitalization).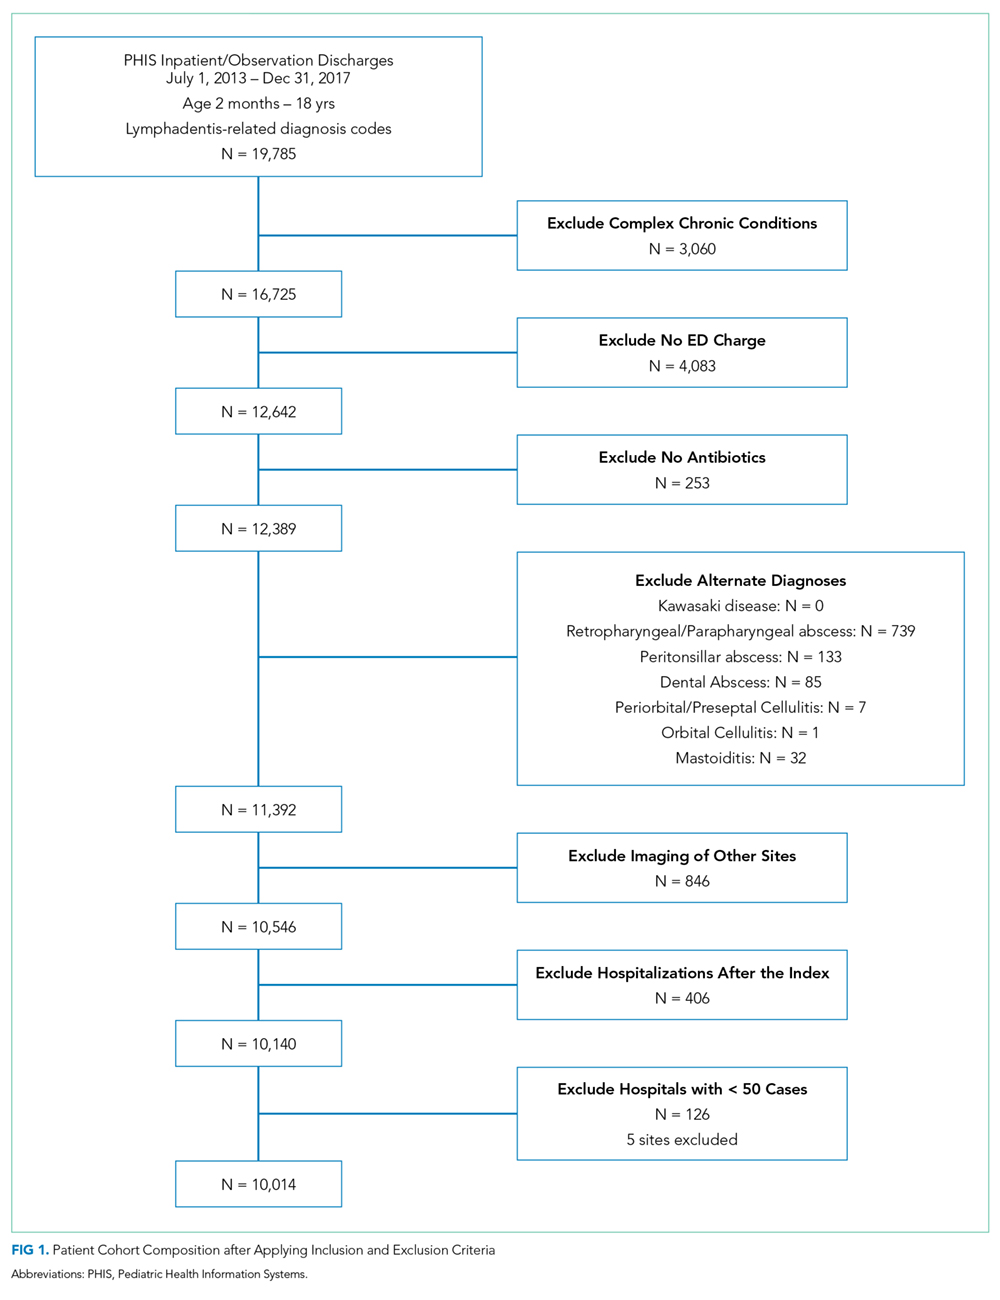
All statistical analyses were performed by using SAS version 9.4 (SAS Institute, Cary, North Carolina); P < .05 was considered statistically significant.
RESULTS
We identified 19,785 PHIS hospitalizations with lymphadenitis-related discharge diagnosis codes between July 1, 2013 and December 31, 2017. Applying our algorithm and exclusion criteria, we assembled a cohort of 10,014 children hospitalized with cervical lymphadenitis (Figure 1). Two-thirds of the children in our cohort were <4 years old, 42% were non-Hispanic white, and 63% had a government payor (Table 1). Neck imaging (ultrasound, CT, or MRI) was conducted in 8,103 (81%) children. CT imaging was performed in 4,097 (41%) of children, and early imaging was conducted in 6,111 (61%) of children with cervical lymphadenitis.
We noted hospital-level variation in rates of any neck imaging (median: 82.1%, interquartile range [IQR]: 77.7%-85.5%, full range: 68.7%-93.1%), CT imaging (median: 42.3%, IQR: 26.7%-55.2%, full range: 12.0%-81.5%), early imaging (median: 64.4%, IQR: 59.8%-68.4%, full range: 13.8%-76.9%), and multiple imaging studies (median: 23.7%, IQR: 18.6%-28.9%, full range: 1.2%-40.7%; Figure 2). Rates of surgical drainage also varied by hospital (median: 35.1%, IQR: 31.3%-42.0%, full range: 17.1%-54.5%).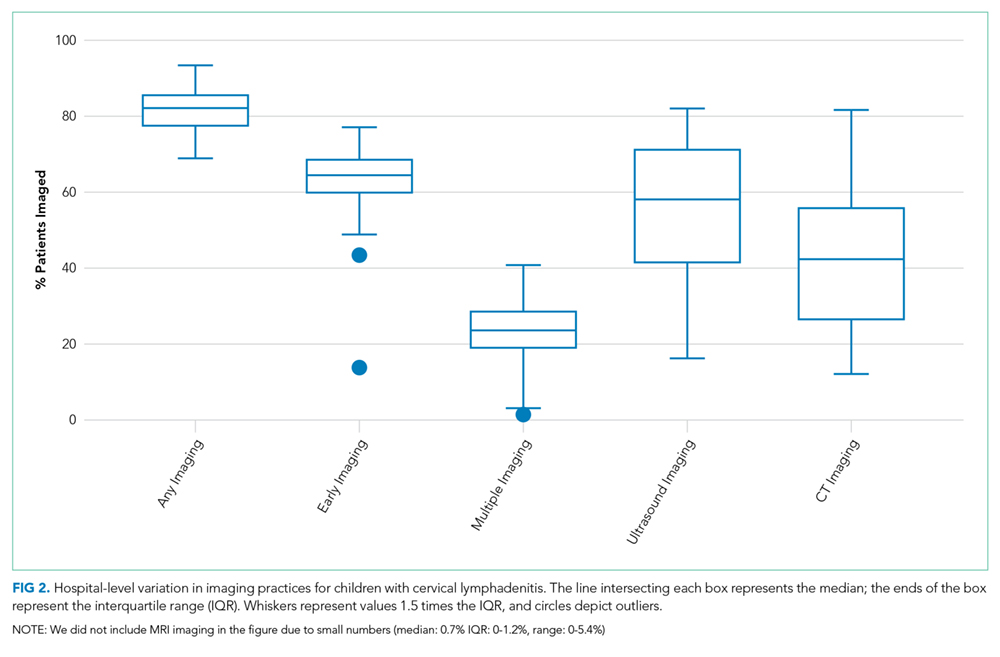
At the patient level, children who received early imaging were more likely to be <1 year old (21% vs 16%, P < .001), or Hispanic or Black when compared with children who did not receive early imaging (Table 1). Children who received early imaging were more likely to have had an ED visit for lymphadenitis in the preceding 30 days (8% vs 6%, P = .001). However, they were less likely to have received broad-spectrum antibiotics on admission (6% vs 8%, P < .001; Table 1). Of the 6,111 patients who received early imaging, 2,538 (41.5%) received CT imaging and 3,902 (63.9%) received ultrasound imaging on day 0. Of the 2,272 patients receiving multiple imaging studies, 116 (5.1%) received two or more CT scans.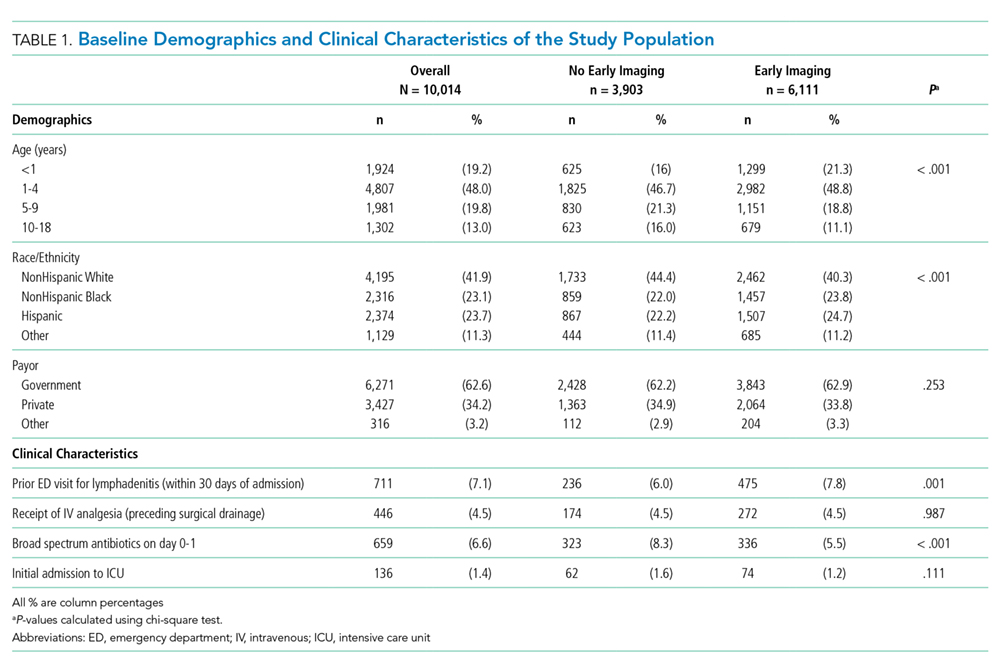
In multivariable analysis at the patient level, early imaging was associated with higher adjusted odds of receiving multiple imaging studies (adjusted odds ratio [aOR] 3.0, 95% CI: 2.6-3.6). Similarly, early imaging was associated with higher adjusted odds of surgical drainage (aOR: 1.3, 95% CI: 1.1-1.4), increased 30-day readmission for lymphadenitis (aOR: 1.5, 95% CI: 1.2-1.9), and longer length of stay (adjusted rate ratio: 1.2, 95% CI: 1.1-1.2; Table 2). For the subset of patients who did not receive surgical drainage during the index admission, the adjusted odds ratio for the association between early imaging at index admission and 30-day readmission was 1.7 (95% CI: 1.3-2.1). About 63% of readmissions occurred within 7 days of index discharge; 89% occurred within 14 days (Appendix Figure).
In secondary analysis using an alternative definition for early imaging (ie, imaging conducted on day 0 or day 1 of hospitalization), the adjusted odds ratio for multiple imaging studies was 22.6 (95% CI: 15.8-32.4). The adjusted odds and rate ratios for the remaining outcomes were similar to our primary analysis.
DISCUSSION
In this large multicenter study of children with cervical lymphadenitis, we found variation in imaging practices across 44 US children’s hospitals. Children with cervical lymphadenitis who underwent early imaging were more likely to receive multiple imaging studies during a single hospitalization than those who did not receive early imaging. At the patient level, early imaging was also associated with higher rates of surgical drainage, more frequent 30-day readmission, and longer lengths of stay.
To our knowledge, imaging practices in the population of children hospitalized with cervical lymphadenitis have not been previously characterized in the US; one study from Atlanta, Georgia, describes imaging practices in all children evaluated in the ED.1 Single-center studies of children hospitalized with cervical lymphadenitis have been previously conducted in Canada6 and New Zealand,8 in which 42%-51% of children received imaging. In our study, most (81%) children hospitalized with lymphadenitis received some form of imaging, with 61% of all children receiving early imaging. Furthermore, 41% received CT imaging, as compared with 8%-10% of children in the aforementioned studies from Canada and New Zealand.6,8 This finding is consistent with a pattern of imaging overuse in the US, which has amongst the highest utilization rates globally for advanced imaging such as CT and MRI.10,11 Identifying opportunities to safely reduce routine imaging, particularly CT imaging, in this population could decrease unnecessary radiation exposure without compromising outcomes.
We also noted variability in imaging practices across PHIS hospitals. Some of this variability may be partially explained by differences in the patient population or illness severity across hospitals. However, given the absence of evidence-based best practices for children with cervical lymphadenitis, clinicians may rely on anecdotal experience or local practice culture to guide their decision making,12 leading to variability in frequency, timing, and modality of imaging.
At the patient level, we found that children who received early imaging were more likely to receive multiple imaging studies. This finding supports our hypothesis that clinicians often order a second imaging study when the initial imaging study does not clearly demonstrate an abscess, and the child subsequently fails to demonstrate clear improvement after 24-48 hours of antibiotics.
Furthermore, early imaging was associated with overall increased utilization in our cohort, including increased likelihood of surgical drainage, 30-day readmission for lymphadenitis, as well as longer lengths of stay. Confounding may be one explanation for this finding. For instance, clinicians may pursue early imaging in children who present with longer duration of symptoms or more severe illness on presentation, as these factors may be associated with abscess formation.1,6,7 These clinical covariates are not available in PHIS. Thus, we used prior ED visits for lymphadenitis to approximate illness duration, and initial admission to ICU, receipt of IV analgesia, and receipt of broad-spectrum antibiotics to approximate illness severity in an attempt to mitigate confounding.
On the other hand, it is also possible that a proportion of children with a small fluid collection on imaging may have improved with antibiotics alone. There is a growing body of evidence in children with other head and neck infections (eg, retropharyngeal abscess and orbital cellulitis with periosteal abscess)13-15 that suggests that children with small abscesses often improve with antibiotic therapy alone. In children with cervical lymphadenitis who have small or developing abscesses identified via routine imaging on presentation, clinicians may be driven to pursue a surgical intervention with uncertain benefit. Deferring routine imaging in this population may provide an opportunity to improve the value of care in children with lymphadenitis without adversely affecting outcomes.
This study has several limitations given our use of an administrative database. Children with lymphadenitis may have been misclassified as these patients were identified using discharge diagnosis codes
Furthermore, we were unable to measure the exact time of imaging study in PHIS; we used imaging conducted on hospital day 0 as a proxy measure for imaging conducted within the first 24 hours of presentation. With this definition, some children who had early imaging were likely misclassified as not having received early imaging. For example, a patient who arrived in the ED at 9
Additionally, there may be a subset of children who underwent imaging prior to presentation at the PHIS hospital ED for further workup and admission. Imaging conducted outside a PHIS hospital was not captured in this database. Similarly, children who had a readmission at a different hospital than their index admission would not be captured using PHIS. Finally, PHIS captures data from children’s hospitals; practices at these hospitals may not be generalizable to practices in the community hospital setting.
CONCLUSION
In conclusion, we found that imaging practices in children hospitalized with cervical lymphadenitis were widely variable across hospitals. Children receiving early imaging had more resource utilization and intervention when compared with children who did not receive early imaging. Our findings may represent a cascade effect, in which routinely conducted early imaging prompts clinicians to pursue more testing and interventions in this population. Future studies should obtain more detailed patient level covariates to further characterize clinical factors that may impact decisions around imaging and clinical outcomes for children with cervical lymphadenitis.
Acknowledgments
The authors would like to acknowledge the following investigators for their contributions to data interpretation and review of the final manuscript: Angela Choe MD, Cincinnati Children’s Hospital Medical Center, Cincinnati, Ohio; Margaret Rush MD, Children’s National Medical Center, Washington, DC; Ryosuke Takei MD, Children’s Hospital of Philadelphia, Philadelphia, Pennsylvania; Wallis Molchen DO, Texas Children’s Hospital, Houston, Texas; Stephanie Royer Moss MD, Cleveland Clinic, Cleveland, Ohio; Rebecca Dang, MD, Lucile Packard Children’s Hospital Stanford, Palo Alto, California; Joy Solano MD, Children’s Mercy Hospital Kansas, Overland Park, Kansas; Nathaniel P. Goodrich MD, Children’s Hospital & Medical Center, Omaha, Nebraska; Ngozi Eboh MD, Texas Tech University Health Sciences Center, Dallas, Texas; Ashley Jenkins MD, Cincinnati Children’s Hospital Medical Center, Cincinnati, Ohio; Rebecca Steuart MD, Cincinnati Children’s Hospital Medical Center, Cincinnati, Ohio; Sonya Tang Girdwood MD, PhD, Cincinnati Children’s Hospital Medical Center, Cincinnati, Ohio; Alissa McInerney MD, Maria Fareri Children’s Hospital at Westchester Medical Center, Valhalla, New York; Sumeet Banker MD, MPH, New York Presbyterian Morgan Stanley Children’s Hospital, New York, New York; Corrie McDaniel DO, Seattle Children’s Hospital, Seattle, Washington; Christiane Lenzen MD, Rady Children’s Hospital, San Diego, California; Aleisha Nabower MD, Children’s Hospital & Medical Center, Omaha, Nebraska; Waheeda Samady MD, Ann & Robert H. Lurie Children’s Hospital, Chicago, Illinois; Jennifer Chen MD, Rady Children’s Hospital, San Diego, California; Marquita Genies MD, MPH, John’s Hopkins Children’s Center, Baltimore, Maryland; Justin Lockwood MD, Children’s Hospital Colorado, Aurora, Colorado; David Synhorst MD, Children’s Mercy Hospital Kansas, Overland Park, Kansas.
1. Sauer MW, Sharma S, Hirsh DA et al. Acute neck infections in children: who is likely to undergo surgical drainage? Am J Emerg Med. 2013;31(6):906-909. https://doi.org/10.1016/j.ajem.2013.02.043.
2. Sethia R, Mahida JB, Subbarayan RA, et al. Evaluation of an imaging protocol using ultrasound as the primary diagnostic modality in pediatric patients with superficial soft tissue infections of the face and neck. Int J Pediatr Otorhinolaryngol. 2017;96:89-93. https://doi.org/10.1016/j.ijporl.2017.02.027.
3. Neff L, Newland JG, Sykes KJ, Selvarangan R, Wei JL. Microbiology and antimicrobial treatment of pediatric cervical lymphadenitis requiring surgical intervention. Int J Pediatr Otorhinolaryngol. 2013;77(5):817-820. https://doi.org/10.1016/j.ijporl.2013.02.018.
4. Brogan TV, Hall M, Williams DJ, et al. Variability in processes of care and outcomes among children hospitalized with community-acquired pneumonia. Pediatr Infect Dis J. 2012;31(10):1036-1041. https://doi.org/10.1097/INF.0b013e31825f2b10.
5. Conway PH, Keren R. Factors associated with variability in outcomes for children hospitalized with urinary tract infection. J Pediatr. 2009;154(6):789-796. https://doi.org/10.1016/j.jpeds.2009.01.010.
6. Luu TM, Chevalier I, Gauthier M et al. Acute adenitis in children: clinical course and factors predictive of surgical drainage. J Paediatr Child Health. 2005;41(5-6):273-277. https://doi.org/10.1111/j.1440-1754.2005.00610.x.
7. Golriz F, Bisset GS, 3rd, D’Amico B, et al. A clinical decision rule for the use of ultrasound in children presenting with acute inflammatory neck masses. Pediatr Rad. 2017;47(4):422-428. https://doi.org/10.1007/s00247-016-3774-9.
8. Courtney MJ, Miteff A, Mahadevan M. Management of pediatric lateral neck infections: does the adage “… never let the sun go down on undrained pus …” hold true? Int J Pediatr Otorhinolaryngol. 2007;71(1):95-100. https://doi.org/10.1016/j.ijporl.2006.09.009.
9. Feudtner C, Feinstein JA, Zhong W, Hall M, Dai D. Pediatric complex chronic conditions classification system version 2: updated for ICD-10 and complex medical technology dependence and transplantation. BMC Pediatr. 2014;14:199. https://doi.org/10.1186/1471-2431-14-199.
10. Papanicolas I, Woskie LR, Jha AK. Health care spending in the United States and other high-income countries. JAMA. 2018;319(10):1024-1039. https://doi.org/10.1001/jama.2018.1150.
11. Oren O, Kebebew E, Ioannidis JPA. Curbing unnecessary and wasted diagnostic imaging. JAMA. 2019;321(3):245-246. https://doi.org/10.1001/jama.2018.20295.
12. Palmer RH, Miller MR. Methodologic challenges in developing and implementing measures of quality for child health care. Ambul Pediatr Off J Ambul Pediatr Assoc. 2001;1(1):39-52. https://doi.org/10.1367/1539-4409(2001)001<0039:MCIDAI>2.0.CO;2.
13. Daya H, Lo S, Papsin BC, et al. Retropharyngeal and parapharyngeal infections in children: the Toronto experience. Int J Pediatr Otorhinolaryngol. 2005;69(1):81-86. https://doi.org/10.1016/j.ijporl.2004.08.010.
14. Wong SJ, Levi J. Management of pediatric orbital cellulitis: A systematic review. Int J Pediatr Otorhinolaryngol. 2018;110:123-129. https://doi.org/10.1016/j.ijporl.2018.05.006.
15. Wong DK, Brown C, Mills N, Spielmann P, Neeff M. To drain or not to drain-management of pediatric deep neck abscesses: a case-control study. Int J Pediatr Otorhinolaryngol. 2012;76(12):1810-1813. https://doi.org/10.1016/j.ijporl.2012.09.006.
Cervical lymphadenitis is a common superficial neck infection in childhood. While most children with cervical lymphadenitis recover with antibiotic therapy, a subset can develop an abscess that may require surgical drainage. Radiologic imaging, most commonly ultrasound or computed tomography (CT), is often performed to identify such an abscess.1-3 However, no national standards exist to guide clinician decision making around imaging in this population. In the absence of evidence-based guidelines, variability in frequency, timing, and modality of imaging likely exists in children hospitalized with cervical lymphadenitis.
As demonstrated for several other common pediatric conditions,4,5 variability in imaging practices may contribute to overutilization of resources in children with cervical lymphadenitis. In particular, routinely conducting imaging on presentation may constitute overuse, as children with cervical lymphadenitis who present with less than 72 hours of neck swelling rarely undergo surgical drainage within the first 24 hours of hospitalization.1,6,7 Imaging performed on presentation is often repeated later during hospitalization, particularly if the patient has not improved with antibiotic therapy. The net result may be unnecessary, redundant radiologic studies. Furthermore, serious complications such as bacteremia, extension of infection into the retropharyngeal space, or involvement of the airway or vasculature rarely occur in children with cervical lymphadenitis.6,8 In this context, deferring initial imaging in this population is unlikely to lead to adverse outcomes and may reduce radiation exposure.
The overall objectives of this study are to describe hospital-level variation in imaging practices for pediatric cervical lymphadenitis and to examine the association between early imaging and outcomes in this population.
METHODS
Study Design and Data Source
We conducted a multicenter, cross-sectional study using the Pediatric Health Information Systems (PHIS) database, which contains administrative and billing data from 49 geographically diverse children’s hospitals across the United States (US) affiliated with the Children’s Hospital Association (Lenexa, Kansas). PHIS includes data on patient demographics, discharge diagnoses, and procedures using the International Classification of Diseases, 9th (ICD-9) and 10th Revision (ICD-10) diagnosis codes, as well as daily billed resource utilization for laboratory tests, imaging studies, and medications. Encrypted medical record numbers permit longitudinal identification of children across multiple visits to the same hospital. Use of de-identified PHIS data was deemed to be nonhuman subjects research; our approach to validation of ICD codes using local electronic medical record review was reviewed and approved by the Cincinnati Children’s Hospital Medical Center Institutional Review Board.
Study Population
Our study team developed an algorithm to identify children with cervical lymphadenitis and minimize misclassification using PHIS (Appendix A). All children with lymphadenitis-related ICD-9 and ICD-10 discharge diagnosis codes were eligible for inclusion.
This algorithm was subsequently applied to the PHIS database. Children ages two months to 18 years hospitalized at participating PHIS institutions between July 2013 and December 2017 with a diagnosis of cervical lymphadenitis as per th
Measures of Interest
To examine hospital-level variation in imaging practices, we measured the proportion of children at each hospital who underwent any neck imaging study, CT or ultrasound imaging, early imaging, and multiple imaging studies within a single hospitalization. Neck imaging was defined as the presence of a billing code for ultrasound, CT, or magnetic resonance imaging (MRI) study of the neck (Appendix B). Early imaging was defined as neck imaging conducted on day 0 of hospitalization (ie, calendar day of admission and ending at midnight). Multiple imaging studies were defined as the receipt of more than one imaging study, regardless of timing or modality. We also measured the proportion of children by hospital who received surgical drainage, defined by the presence of procedure codes for incision and drainage of abscess of the neck (Appendix B).
In examining patient-level association between early imaging and clinical outcomes, our primary outcome of interest was the receipt of multiple imaging studies. Secondary outcomes included rates of surgical drainage, length of stay (in hospital days), and rates of lymphadenitis-related hospital readmission within 30 days of index discharge.
Covariates
Baseline demographic characteristics included age, gender, race/ethnicity, and insurance type. We measured ED visits associated with lymphadenitis-related diagnosis codes in the 30 days prior to admission as a proxy measure for illness duration prior to presentation. To approximate illness severity, we included the following covariates: rates of intensive care unit admission on presentation, rates of receipt of intravenous (IV) analgesia (Appendix B) on hospital days prior to surgical drainage, and rates of receipt of broad-spectrum antibiotics on day 0 or 1 of hospitalization. Broad-spectrum antibiotics (Appendix B) were defined by an independent three-person review of available antibiotic codes (SD, SSS, and JT); differences were resolved by group consensus.
Analysis
Categorical variables were described using frequencies and percentages, while continuous data were described using median and interquartile range. We described hospital-level variation in imaging practices by calculating and comparing the proportion of children at each hospital who underwent any neck imaging study, CT imaging, ultrasound imaging, early imaging, multiple imaging studies, and surgical drainage.
Patient-level demographics and clinical characteristics were compared across groups using chi-square test. To examine the association between early imaging and outcomes, we used generalized linear or logistic mixed effects models to control for patient demographic characteristics and clinical markers of illness duration and severity, with a random effect for hospital to account for clustering. Patient demographics in the model defined a priori included age, race/ethnicity, and insurance type; clinical characteristics included prior ED visit for lymphadenitis, initial intensive care unit (ICU) admission, use of IV analgesia, and use of broad-spectrum antibiotics on day 0 or 1 of hospitalization. To assess the potential for misclassification related to the availability of calendar day but not time of imaging in PHIS, we conducted a secondary analysis to examine the patient-level association between early imaging and outcomes using an alternative definition for early imaging (defined as imaging conducted on day 0 or day 1 of hospitalization).
All statistical analyses were performed by using SAS version 9.4 (SAS Institute, Cary, North Carolina); P < .05 was considered statistically significant.
RESULTS
We identified 19,785 PHIS hospitalizations with lymphadenitis-related discharge diagnosis codes between July 1, 2013 and December 31, 2017. Applying our algorithm and exclusion criteria, we assembled a cohort of 10,014 children hospitalized with cervical lymphadenitis (Figure 1). Two-thirds of the children in our cohort were <4 years old, 42% were non-Hispanic white, and 63% had a government payor (Table 1). Neck imaging (ultrasound, CT, or MRI) was conducted in 8,103 (81%) children. CT imaging was performed in 4,097 (41%) of children, and early imaging was conducted in 6,111 (61%) of children with cervical lymphadenitis.
We noted hospital-level variation in rates of any neck imaging (median: 82.1%, interquartile range [IQR]: 77.7%-85.5%, full range: 68.7%-93.1%), CT imaging (median: 42.3%, IQR: 26.7%-55.2%, full range: 12.0%-81.5%), early imaging (median: 64.4%, IQR: 59.8%-68.4%, full range: 13.8%-76.9%), and multiple imaging studies (median: 23.7%, IQR: 18.6%-28.9%, full range: 1.2%-40.7%; Figure 2). Rates of surgical drainage also varied by hospital (median: 35.1%, IQR: 31.3%-42.0%, full range: 17.1%-54.5%).
At the patient level, children who received early imaging were more likely to be <1 year old (21% vs 16%, P < .001), or Hispanic or Black when compared with children who did not receive early imaging (Table 1). Children who received early imaging were more likely to have had an ED visit for lymphadenitis in the preceding 30 days (8% vs 6%, P = .001). However, they were less likely to have received broad-spectrum antibiotics on admission (6% vs 8%, P < .001; Table 1). Of the 6,111 patients who received early imaging, 2,538 (41.5%) received CT imaging and 3,902 (63.9%) received ultrasound imaging on day 0. Of the 2,272 patients receiving multiple imaging studies, 116 (5.1%) received two or more CT scans.
In multivariable analysis at the patient level, early imaging was associated with higher adjusted odds of receiving multiple imaging studies (adjusted odds ratio [aOR] 3.0, 95% CI: 2.6-3.6). Similarly, early imaging was associated with higher adjusted odds of surgical drainage (aOR: 1.3, 95% CI: 1.1-1.4), increased 30-day readmission for lymphadenitis (aOR: 1.5, 95% CI: 1.2-1.9), and longer length of stay (adjusted rate ratio: 1.2, 95% CI: 1.1-1.2; Table 2). For the subset of patients who did not receive surgical drainage during the index admission, the adjusted odds ratio for the association between early imaging at index admission and 30-day readmission was 1.7 (95% CI: 1.3-2.1). About 63% of readmissions occurred within 7 days of index discharge; 89% occurred within 14 days (Appendix Figure).
In secondary analysis using an alternative definition for early imaging (ie, imaging conducted on day 0 or day 1 of hospitalization), the adjusted odds ratio for multiple imaging studies was 22.6 (95% CI: 15.8-32.4). The adjusted odds and rate ratios for the remaining outcomes were similar to our primary analysis.
DISCUSSION
In this large multicenter study of children with cervical lymphadenitis, we found variation in imaging practices across 44 US children’s hospitals. Children with cervical lymphadenitis who underwent early imaging were more likely to receive multiple imaging studies during a single hospitalization than those who did not receive early imaging. At the patient level, early imaging was also associated with higher rates of surgical drainage, more frequent 30-day readmission, and longer lengths of stay.
To our knowledge, imaging practices in the population of children hospitalized with cervical lymphadenitis have not been previously characterized in the US; one study from Atlanta, Georgia, describes imaging practices in all children evaluated in the ED.1 Single-center studies of children hospitalized with cervical lymphadenitis have been previously conducted in Canada6 and New Zealand,8 in which 42%-51% of children received imaging. In our study, most (81%) children hospitalized with lymphadenitis received some form of imaging, with 61% of all children receiving early imaging. Furthermore, 41% received CT imaging, as compared with 8%-10% of children in the aforementioned studies from Canada and New Zealand.6,8 This finding is consistent with a pattern of imaging overuse in the US, which has amongst the highest utilization rates globally for advanced imaging such as CT and MRI.10,11 Identifying opportunities to safely reduce routine imaging, particularly CT imaging, in this population could decrease unnecessary radiation exposure without compromising outcomes.
We also noted variability in imaging practices across PHIS hospitals. Some of this variability may be partially explained by differences in the patient population or illness severity across hospitals. However, given the absence of evidence-based best practices for children with cervical lymphadenitis, clinicians may rely on anecdotal experience or local practice culture to guide their decision making,12 leading to variability in frequency, timing, and modality of imaging.
At the patient level, we found that children who received early imaging were more likely to receive multiple imaging studies. This finding supports our hypothesis that clinicians often order a second imaging study when the initial imaging study does not clearly demonstrate an abscess, and the child subsequently fails to demonstrate clear improvement after 24-48 hours of antibiotics.
Furthermore, early imaging was associated with overall increased utilization in our cohort, including increased likelihood of surgical drainage, 30-day readmission for lymphadenitis, as well as longer lengths of stay. Confounding may be one explanation for this finding. For instance, clinicians may pursue early imaging in children who present with longer duration of symptoms or more severe illness on presentation, as these factors may be associated with abscess formation.1,6,7 These clinical covariates are not available in PHIS. Thus, we used prior ED visits for lymphadenitis to approximate illness duration, and initial admission to ICU, receipt of IV analgesia, and receipt of broad-spectrum antibiotics to approximate illness severity in an attempt to mitigate confounding.
On the other hand, it is also possible that a proportion of children with a small fluid collection on imaging may have improved with antibiotics alone. There is a growing body of evidence in children with other head and neck infections (eg, retropharyngeal abscess and orbital cellulitis with periosteal abscess)13-15 that suggests that children with small abscesses often improve with antibiotic therapy alone. In children with cervical lymphadenitis who have small or developing abscesses identified via routine imaging on presentation, clinicians may be driven to pursue a surgical intervention with uncertain benefit. Deferring routine imaging in this population may provide an opportunity to improve the value of care in children with lymphadenitis without adversely affecting outcomes.
This study has several limitations given our use of an administrative database. Children with lymphadenitis may have been misclassified as these patients were identified using discharge diagnosis codes
Furthermore, we were unable to measure the exact time of imaging study in PHIS; we used imaging conducted on hospital day 0 as a proxy measure for imaging conducted within the first 24 hours of presentation. With this definition, some children who had early imaging were likely misclassified as not having received early imaging. For example, a patient who arrived in the ED at 9
Additionally, there may be a subset of children who underwent imaging prior to presentation at the PHIS hospital ED for further workup and admission. Imaging conducted outside a PHIS hospital was not captured in this database. Similarly, children who had a readmission at a different hospital than their index admission would not be captured using PHIS. Finally, PHIS captures data from children’s hospitals; practices at these hospitals may not be generalizable to practices in the community hospital setting.
CONCLUSION
In conclusion, we found that imaging practices in children hospitalized with cervical lymphadenitis were widely variable across hospitals. Children receiving early imaging had more resource utilization and intervention when compared with children who did not receive early imaging. Our findings may represent a cascade effect, in which routinely conducted early imaging prompts clinicians to pursue more testing and interventions in this population. Future studies should obtain more detailed patient level covariates to further characterize clinical factors that may impact decisions around imaging and clinical outcomes for children with cervical lymphadenitis.
Acknowledgments
The authors would like to acknowledge the following investigators for their contributions to data interpretation and review of the final manuscript: Angela Choe MD, Cincinnati Children’s Hospital Medical Center, Cincinnati, Ohio; Margaret Rush MD, Children’s National Medical Center, Washington, DC; Ryosuke Takei MD, Children’s Hospital of Philadelphia, Philadelphia, Pennsylvania; Wallis Molchen DO, Texas Children’s Hospital, Houston, Texas; Stephanie Royer Moss MD, Cleveland Clinic, Cleveland, Ohio; Rebecca Dang, MD, Lucile Packard Children’s Hospital Stanford, Palo Alto, California; Joy Solano MD, Children’s Mercy Hospital Kansas, Overland Park, Kansas; Nathaniel P. Goodrich MD, Children’s Hospital & Medical Center, Omaha, Nebraska; Ngozi Eboh MD, Texas Tech University Health Sciences Center, Dallas, Texas; Ashley Jenkins MD, Cincinnati Children’s Hospital Medical Center, Cincinnati, Ohio; Rebecca Steuart MD, Cincinnati Children’s Hospital Medical Center, Cincinnati, Ohio; Sonya Tang Girdwood MD, PhD, Cincinnati Children’s Hospital Medical Center, Cincinnati, Ohio; Alissa McInerney MD, Maria Fareri Children’s Hospital at Westchester Medical Center, Valhalla, New York; Sumeet Banker MD, MPH, New York Presbyterian Morgan Stanley Children’s Hospital, New York, New York; Corrie McDaniel DO, Seattle Children’s Hospital, Seattle, Washington; Christiane Lenzen MD, Rady Children’s Hospital, San Diego, California; Aleisha Nabower MD, Children’s Hospital & Medical Center, Omaha, Nebraska; Waheeda Samady MD, Ann & Robert H. Lurie Children’s Hospital, Chicago, Illinois; Jennifer Chen MD, Rady Children’s Hospital, San Diego, California; Marquita Genies MD, MPH, John’s Hopkins Children’s Center, Baltimore, Maryland; Justin Lockwood MD, Children’s Hospital Colorado, Aurora, Colorado; David Synhorst MD, Children’s Mercy Hospital Kansas, Overland Park, Kansas.
1. Sauer MW, Sharma S, Hirsh DA et al. Acute neck infections in children: who is likely to undergo surgical drainage? Am J Emerg Med. 2013;31(6):906-909. https://doi.org/10.1016/j.ajem.2013.02.043.
2. Sethia R, Mahida JB, Subbarayan RA, et al. Evaluation of an imaging protocol using ultrasound as the primary diagnostic modality in pediatric patients with superficial soft tissue infections of the face and neck. Int J Pediatr Otorhinolaryngol. 2017;96:89-93. https://doi.org/10.1016/j.ijporl.2017.02.027.
3. Neff L, Newland JG, Sykes KJ, Selvarangan R, Wei JL. Microbiology and antimicrobial treatment of pediatric cervical lymphadenitis requiring surgical intervention. Int J Pediatr Otorhinolaryngol. 2013;77(5):817-820. https://doi.org/10.1016/j.ijporl.2013.02.018.
4. Brogan TV, Hall M, Williams DJ, et al. Variability in processes of care and outcomes among children hospitalized with community-acquired pneumonia. Pediatr Infect Dis J. 2012;31(10):1036-1041. https://doi.org/10.1097/INF.0b013e31825f2b10.
5. Conway PH, Keren R. Factors associated with variability in outcomes for children hospitalized with urinary tract infection. J Pediatr. 2009;154(6):789-796. https://doi.org/10.1016/j.jpeds.2009.01.010.
6. Luu TM, Chevalier I, Gauthier M et al. Acute adenitis in children: clinical course and factors predictive of surgical drainage. J Paediatr Child Health. 2005;41(5-6):273-277. https://doi.org/10.1111/j.1440-1754.2005.00610.x.
7. Golriz F, Bisset GS, 3rd, D’Amico B, et al. A clinical decision rule for the use of ultrasound in children presenting with acute inflammatory neck masses. Pediatr Rad. 2017;47(4):422-428. https://doi.org/10.1007/s00247-016-3774-9.
8. Courtney MJ, Miteff A, Mahadevan M. Management of pediatric lateral neck infections: does the adage “… never let the sun go down on undrained pus …” hold true? Int J Pediatr Otorhinolaryngol. 2007;71(1):95-100. https://doi.org/10.1016/j.ijporl.2006.09.009.
9. Feudtner C, Feinstein JA, Zhong W, Hall M, Dai D. Pediatric complex chronic conditions classification system version 2: updated for ICD-10 and complex medical technology dependence and transplantation. BMC Pediatr. 2014;14:199. https://doi.org/10.1186/1471-2431-14-199.
10. Papanicolas I, Woskie LR, Jha AK. Health care spending in the United States and other high-income countries. JAMA. 2018;319(10):1024-1039. https://doi.org/10.1001/jama.2018.1150.
11. Oren O, Kebebew E, Ioannidis JPA. Curbing unnecessary and wasted diagnostic imaging. JAMA. 2019;321(3):245-246. https://doi.org/10.1001/jama.2018.20295.
12. Palmer RH, Miller MR. Methodologic challenges in developing and implementing measures of quality for child health care. Ambul Pediatr Off J Ambul Pediatr Assoc. 2001;1(1):39-52. https://doi.org/10.1367/1539-4409(2001)001<0039:MCIDAI>2.0.CO;2.
13. Daya H, Lo S, Papsin BC, et al. Retropharyngeal and parapharyngeal infections in children: the Toronto experience. Int J Pediatr Otorhinolaryngol. 2005;69(1):81-86. https://doi.org/10.1016/j.ijporl.2004.08.010.
14. Wong SJ, Levi J. Management of pediatric orbital cellulitis: A systematic review. Int J Pediatr Otorhinolaryngol. 2018;110:123-129. https://doi.org/10.1016/j.ijporl.2018.05.006.
15. Wong DK, Brown C, Mills N, Spielmann P, Neeff M. To drain or not to drain-management of pediatric deep neck abscesses: a case-control study. Int J Pediatr Otorhinolaryngol. 2012;76(12):1810-1813. https://doi.org/10.1016/j.ijporl.2012.09.006.
© 2019 Society of Hospital Medicine
The Association between Limited English Proficiency and Sepsis Mortality
Sepsis is defined as a life-threatening organ dysfunction that occurs in response to systemic infection.1,2 It is frequently fatal, common in hospital medicine, and a leading contributor to critical illness, morbidity, and healthcare expenditures.2-5 While sepsis care and outcomes have improved in the past decade,6,7 inpatient mortality remains high.8
A number of studies have sought to determine whether race plays a role in sepsis mortality. While Black patients with sepsis have frequently been identified as having the highest rates of death,9-14 similar observations have been made for most non-White races/ethnicities.13-15 Studies have also demonstrated higher rates of hospital-acquired infections among Asian and Latino patients.16
There are several possible explanations for why racial minorities experience disparate outcomes in sepsis, including access to care, comorbidities, implicit biases, and biological or environmental factors,17-20 as well as characteristics of hospitals most likely to care for racial minorities.13,15,21 One explanation that has not been explored is that racial disparities in sepsis are mediated by language. Limited English proficiency (LEP) has previously been associated with increased rates of adverse hospital events,22 longer length of stay,23 and greater likelihood of readmission.24 LEP has also been shown to represent a significant barrier to accessing healthcare and preventive screening.25 The role of LEP in sepsis mortality, however, has yet to be examined.
The diverse patient population at the University of California, San Francisco (UCSF) provides a unique opportunity to build upon existing literature by further exploring racial differences in sepsis, specifically by investigating the role of LEP. The objective of this study was to determine the association between LEP and inpatient mortality among adults hospitalized with sepsis.
METHODS
Setting
The study was conducted at the University of California, San Francisco, California (UCSF), an 800-bed tertiary care, academic medical center. It was approved by the UCSF Institutional Review Board with waiver of informed consent. UCSF cares for a population of patients who are racially and linguistically diverse, with high proportions of patients of East Asian descent and with LEP. According to recent United States census estimates, more than half of San Francisco County residents identify as non-White (35% Asians, 15% Hispanic/Latino, 6% Black), and 44% report speaking a language other than English at home.26
Study Population and Data Collection
The UCSF Medical Center uses the electronic health record (EHR) Epic (Epic 2017, Epic Systems Corporation, Verona, Wisconsin). We obtained computerized EHR data from Clarity, the relational database that stores Epic’s inpatient data in thousands of tables. We identified all patients ≥18 years of age presenting to the emergency department (ED) between June 1, 2012 and December 31, 2016 with suspected serious infection, defined as having blood cultures ordered within 72 hours of ED presentation (N = 25,441). Patients who did not receive at least two doses of intravenous (IV) antibiotics within 48 hours were excluded, as they were unlikely to have serious infections.
We defined sepsis based on Sepsis-3 consensus guidelines2 as a change in sequential [sepsis-related] organ failure assessment (SOFA) score ≥2 within the first 48 hours of ED presentation. The SOFA score is comprised of six variables representing different organ systems, each rated 0-4 based on the degree of dysfunction.2 Patient vital signs, laboratory data, vasopressor medication doses, and ventilator settings were used to determine the exact timestamp at which each patient attained a change in SOFA score ≥2. Missing values were considered to be normal. To adjust for baseline organ dysfunction, SOFA elements associated with elevated bilirubin and/or creatinine were excluded for patients with chronic liver/kidney disease based on Elixhauser comorbidities.27 We chose to focus on the first 48 hours in an attempt to capture patients with the most severe illnesses and the highest probability of true sepsis.
All primary and secondary International Classification of Diseases (ICD)-9/10 diagnosis codes were extracted from Clarity coding tables at the time of hospital discharge. Diagnosis codes signifying bacterial infection were grouped into the following categories based on type/location: pneumonia; bacteremia; urinary tract infection; and skin and soft tissue infection. All remaining diagnostic codes indicating bacterial infections at other sites were categorized as “Other”. If no codes indicating infection were present, patients were categorized as “None coded”. Patients with discharge diagnosis codes of “sepsis” were also identified. Dates and times of antibiotic administrations were obtained from the medications table. Time to first antibiotic was defined as the time in minutes from ED presentation to initiation of the first IV antibacterial medication. This variable was transformed using a natural log transformation based on best fit for normal distribution.
We limited our analyses to 8,974 patients who were diagnosed with sepsis as defined above and had either (1) ≥4 qualifying antibiotic days (QADs) or (2) an ICD-9/10 discharge diagnosis code of “sepsis” (Figure). QADs were defined based on the recent publication by Rhee et al. as having received four or more consecutive days of antibiotics, with the first dose given IV within 48 hours of presentation.28 Patients who died or were discharged to hospice prior to the 4th QAD were also included. These additional parameters were added to increase specificity of the study sample for patients with true sepsis. Patients admitted to all levels of care (acute care, transitional care unit [TCU], intensive care unit [ICU]) and under all hospital services were included. There were no missing data for mortality, race, or language. We chose to focus on patients with sepsis in this initial study as this is a common diagnosis in hospital medicine that is enriched for high mortality.
Primary Outcome
The primary outcome of the study was inpatient mortality, which was obtained from the hospital encounters table in Clarity.
Primary Predictors
The primary predictor of interest was LEP. The encounter numbers from the dataset were used to link to self-reported demographic data, including “preferred language” and need for interpreter services. A manual chart review of 60 patients speaking the top six languages was conducted to verify the accuracy of the data on language and interpreter use (KNK). Defining the gold standard for LEP as having any chart note indicating non-English language and/or that an interpreter was used, the “interpreter needed” variable in Epic was found to have a positive predictive value for LEP of 100%. Therefore, patients in the study cohort were defined as having LEP if they met both of the following criteria: (1) a self-reported “preferred language” other than English and (2) having the “interpreter needed” variable indicating “yes”.
Covariate Data Collection
Additional data were obtained from the demographics tables, including age, race, sex, and insurance status. Race and ethnicity were combined into a single five-category variable including White, Asian, Black, Latino, and Other. This approach has been suggested as the best way to operationalize these variables29 and has been utilized by similar studies in the literature.9,14,15 We considered the Asian race to include all people of East Asian, Southeast Asian, or South Asian descent, which is consistent with the United States Census Bureau definition.30 Patients identifying as Native Hawaiians/Pacific Islanders, Native Americans/Alaskan Natives, as well as those with unspecified race or ethnicity, were categorized as Other. Insurance status was categorized as Commercial, Medicare, Medicaid, or Other.
We estimated illness severity in several ways. First, the total qualifying SOFA score was calculated for each patient, which was defined as the total score achieved at the time that SOFA criteria were first met (≥2, within 48 hours). Second, we dichotomized patients based on whether they had received mechanical ventilation at any point during hospitalization. Finally, we used admission location as a surrogate marker for severity at the time of initial hospitalization.
To estimate the burden of baseline comorbidities, we calculated the van Walraven score (VWS),31 a validated modification of the Elixhauser Comorbidity Index.27 This score conveys an estimated risk of in hospital death based on ICD-9/10 diagnosis codes for preexisting conditions, which ranges from <1% for the minimum score of –19 to >99% for the maximum score of 89.
Statistical Analyses
All statistical analyses were performed using Stata software version 15 (StataCorp LLC, College Station, Texas). Baseline demographics and patient characteristics were stratified by LEP. These were compared using two-sample t-tests or chi-squared tests of significance. Wilcoxon rank-sum tests were used for non-normally distributed variables. Inpatient mortality was compared across all races stratified by LEP using chi-squared tests of significance.
We fit a series of multivariable logistic regression models to examine the association between race and inpatient mortality adjusting for LEP and other patient/clinical characteristics. We first examined the unadjusted association between mortality and race; then adjusted for LEP alone; and finally adjusted for all covariates of interest, including LEP, age, sex, insurance status, year, admission level of care, VWS, total qualifying SOFA score, need for mechanical ventilation, site of infection, and time to first IV antibiotic. A subgroup analysis was also performed using the fully adjusted model restricted to patients who were mechanically ventilated. This population was selected because the patients (1) have among the highest severity of illness and (2) share a common barrier to communication, regardless of English proficiency.
Several potential interactions between LEP with other covariates were explored, including age, race, ICU admission level of care, and need for mechanical ventilation. Lastly, a mediation analysis was performed based on Baron & Kenny’s four-step model32 in order to calculate the proportion of the association between race and mortality explained by the proposed mediator (LEP).
To evaluate for the likelihood of residual confounding, we calculated an E-value, which is defined as the minimum strength of association that an unmeasured confounder would need to have with both the predictor and outcome variables, above and beyond the measured covariates, in order to fully explain away an observed predictor-outcome association.33,34
RESULTS
We identified 8,974 patients hospitalized with sepsis based on the above inclusion criteria. This represented a medically complex, racially and linguistically diverse population (Table 1). The cohort was comprised of 24% Asian, 12% Black, and 11% Latino patients. Among those categorized as Other race, Native Americans/Alaskan Natives and Native Hawaiians/Pacific Islanders accounted for 4% (n = 31) and 21% (n = 159), respectively. A fifth of all patients had LEP (n = 1,716), 62% of whom were Asian (n = 1,064). Patients with LEP tended to be older, female, and to have a greater number of comorbid conditions (Table 1). The total qualifying SOFA score was also higher among patients with LEP (median 5; interquartile range [IQR]: 4-8 vs 5; IQR: 3-7; P <.001), though there was no association between LEP and mechanical ventilation (P = .22). The prevalence of LEP differed significantly across races, with 50% LEP among Asians, 32% among Latinos, 5% among White patients (P < .001). Only eight Black patients had LEP. More than 40 unique languages were represented in the cohort, with English, Cantonese, Spanish, Russian, and Mandarin accounting for ~95% (Appendix Table 1). Among Latino patients, 63% spoke English and 36% spoke Spanish.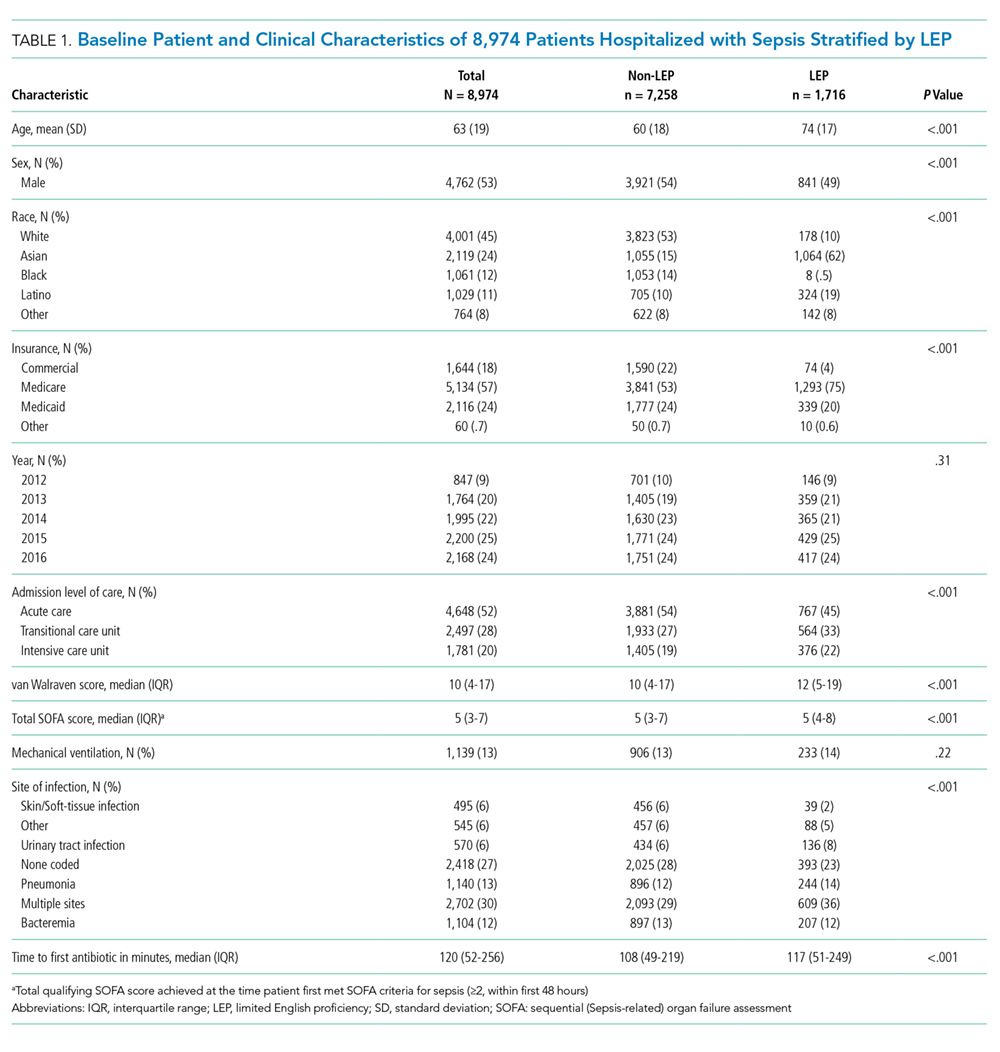
In-hospital mortality was significantly higher among patients who had LEP (n = 268/1,716, 16%) compared to non-LEP patients (n = 678/7,258, 9%), with 80% greater unadjusted odds of mortality (OR 1.80; 95% CI: 1.54-2.09; P < .001). Notably we also found that Asian race was associated with a 1.57 unadjusted odds of mortality compared to White race (95% CI: 1.34-1.85; P < .001). Age, VWS, total qualifying SOFA score, mechanical ventilation, and admission level of care all exhibited a positive dose-response association with mortality (Appendix Table 2). In unadjusted analyses, there was no evidence of interaction between LEP and age (P = .38), LEP and race (P = .45), LEP and ICU admission level of care (P = .31), or LEP and mechanical ventilation (P = .19). Asian patients had the highest overall mortality (14% total, 17% with LEP). LEP was associated with increased unadjusted mortality among White, Asian, and Other races compared to their non-LEP counterparts (Appendix Figure 1). There was no significant difference in mortality between Latino patients with and without LEP. The sample size for Black patients with LEP (n = 8) was too small to draw conclusions about mortality.
Following multivariable logistic regression modeling for the association between race and mortality, we found that the increased odds of death among Asian patients was partially attenuated after adjusting for LEP (odds ratio [OR] 1.23, 95% CI: 1.02-1.48; P = .03; Table 2). Meanwhile, LEP was associated with a 1.66 odds of mortality (95% CI: 1.38-1.99; P < .001) after adjustment for race. In the full multivariable model adjusting for demographics and clinical characteristics, illness severity, and comorbidities, LEP was associated with a 31% increase in the odds of mortality compared to non-LEP (95% CI: 1.06-1.63; P = .02). In this model, the association between Asian race and mortality was now fully attenuated, with a point estimate near 1.0 (OR 0.98; 95% CI: 0.79-1.22; P = .87). Markers of illness severity, including total qualifying SOFA score (OR 1.23; 95% CI: 1.20-1.27; P < .001) and need for mechanical ventilation (OR 1.88; 95% CI: 1.52-2.33; P < .001), were both associated with greater odds of death. Based on a four-step mediation analysis, LEP was found to be a partial mediator to the association between Asian race and mortality (76% proportion explained). The E-value for the association between LEP and mortality was 1.95, with an E-value for the corresponding confidence interval of 1.29.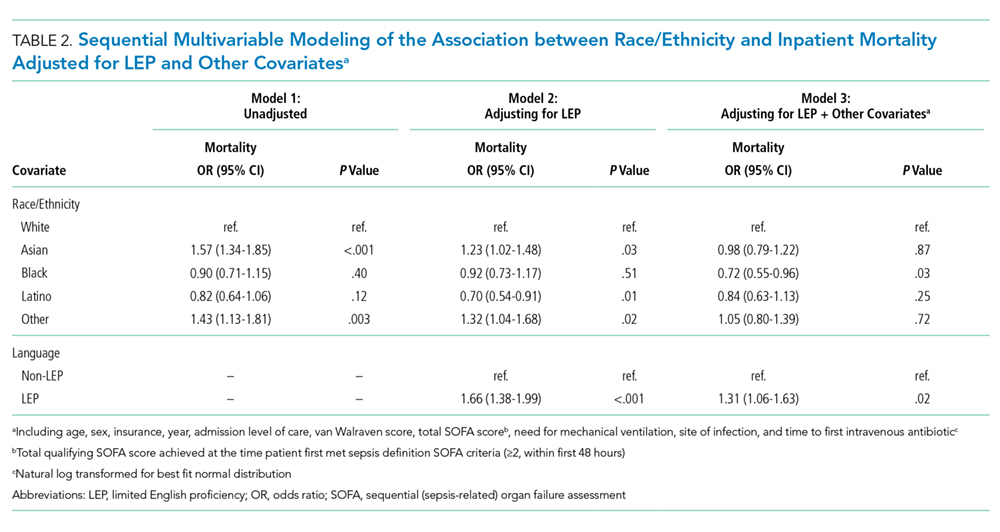
In a subgroup analysis using the fully adjusted model restricted to patients who were mechanically ventilated during hospitalization, the association between LEP and mortality was no longer present (OR 1.15; 95% CI: 0.76-1.72; P = .51).
DISCUSSION
At a single US academic medical center serving a diverse population, we found that LEP was associated with sepsis mortality across all races except Black and Latino, conveying a 31% increase in the odds of death after adjusting for illness severity, comorbidities, and baseline characteristics. The higher mortality among Asian patients was largely mediated by LEP (76% proportion explained). While previous studies have variably found Black, Asian, Latino, and other non-White races/ethnicities to be at an increased risk of death from sepsis,9-15 LEP has not been previously evaluated as a mediator of sepsis mortality. We were uniquely suited to uncover such an association due to the racial and linguistic diversity of our patient population. LEP has previously been implicated in poor health outcomes among hospitalized patients in general.22-24 Future studies will be necessary to determine whether similar associations between LEP and mortality are observed among broader patient populations outside of sepsis.
There are a number of possible explanations for how LEP could mediate the association between race and mortality. First, LEP is known to be associated with greater difficulties in accessing medical care,25 which could result in poorer baseline control of chronic comorbid conditions, fewer opportunities for preventive screening, and greater reluctance to seek medical attention when ill, theoretically leading to more severe presentations and worse outcomes. Indeed, LEP patients in our cohort had both a shorter median time to receiving their first antibiotic, as well as a higher total qualifying SOFA score, both of which may suggest more severe initial presentations. LEP is also known to contribute to, or exacerbate, the impact of low health literacy, which is itself associated with poor health.35 Second, implicit biases may also have been present, as they are known to be common among healthcare providers and have been shown to negatively impact patient care.36
Finally,it is possible that the association is related to the language barrier itself, which impacts providers’ ability to take an appropriate clinical history, and can lead to clinical errors or delays in care.37 The fact that the association between LEP and mortality was eliminated when the analysis was restricted to mechanically ventilated patients seems to support this, since differences in language proficiency become irrelevant in this subgroup. While we are unable to comment on causality based on this observational study, we included a directed acyclic graph (DAG) in the supplemental materials, which shows one proposed model for describing these associations (Appendix Figure 2).
Assuming that the language barrier itself does, at least in part, drive the observed association, LEP represents a potentially modifiable risk factor that could be a target for quality improvement interventions. There is evidence that the use of medical interpreters among patients with LEP leads to greater satisfaction, fewer errors, and improved clinical outcomes;38 however, several recent studies have documented underutilization of professional interpreter services, even when readily available.39,40 At our institution, phone and video interpreter services are available 24/7 for approximately 150 languages. Due to limitations inherent to the EHR, we were unable to ascertain the extent to which these services were used in the present study. Heavy clinical workloads, connectivity issues, and missing or faulty equipment represent theoretical barriers to utilization of these services.
There are some limitations to our study. First, by utilizing a large database of electronic data, the quality of our analyses was reliant on the accuracy of the EHR. Demographic data such as language may have been subject to misclassification due to self-reporting. We attempted to minimize this by also including the need for interpreter services within the definition of LEP, which was validated by manual chart review. Second, generalizability is limited in this single-center study conducted at an institution with unique demographics, wherein nearly two-thirds of the LEP patients were Asian, and the Chinese-speaking population outnumbered those who speak Spanish.
Finally, the most important limitation to our study is the potential for residual confounding. While we attempted to mitigate this by adjusting for as many clinically relevant covariates as possible, there may still be unmeasured confounders to the association between LEP and mortality, such as access to outpatient care, functional status, interpreter use, and other markers of illness severity like the number and type of supportive therapies received. Based on our E-value calculations, with an observed OR of 1.31 for the association between LEP and mortality, an unmeasured confounder with an OR of 1.95 would fully explain away this association, while an OR of 1.29 would shift the confidence interval to include the null. These values suggest at least some risk of residual confounding. The fact that our fully adjusted model included multiple covariates, including several markers of illness severity, does somewhat lessen the likelihood of a confounder achieving these values, since they represent the minimum strength of an unmeasured confounder above and beyond the measured covariates. Regardless, the finding that patients with LEP are more likely to die from sepsis remains an important one, recognizing the need for further studies including multicenter investigations.
In this study, we showed that LEP was associated with sepsis mortality across nearly all races in our cohort. While Asian race was associated with a higher unadjusted odds of death compared to White race, this was attenuated after adjusting for LEP. This may suggest that some of the racial disparities in sepsis identified in prior studies were in fact mediated by language proficiency. Further studies will be required to explore the causal nature of this novel association. If modifiable factors are identified, this could represent a potential target for future quality improvement initiatives aimed at improving sepsis outcomes.
Disclaimer
The contents are solely the responsibility of the authors and do not necessarily represent the official views of the University of California, San Francisco or the National Institutes of Health.
1. De Backer DD, Dorman T. Surviving sepsis guidelines: A continuous move toward better care of patients with sepsis. JAMA. 2017;317(8):807-808. https://doi.org/10.1001/jama.2017.0059.
2. Singer M, Deutschman CS, Seymour CW, et al. The third international consensus definitions for sepsis and septic shock (Sepsis-3). JAMA. 2016;315(8):801-810. https://doi.org/10.1001/jama.2016.0287.
3. Angus DC, Linde-Zwirble WT, Lidicker J, et al. Epidemiology of severe sepsis in the United States: analysis of incidence, outcome, and associated costs of care. Crit Care Med. 2001;29(7):1303-1310. https://doi.org/10.1097/00003246-200107000-00002.
4. Mayr FB, Yende S, Angus DC. Epidemiology of severe sepsis. Virulence. 2014;5(1):4-11. https://doi.org/10.4161/viru.27372.
5. Dellinger RP, Levy MM, Rhodes A, et al. Surviving Sepsis Campaign: international guidelines for management of severe sepsis and septic shock: 2012. Crit Care Med. 2013;41(2):580-637. https://doi.org/10.1097/CCM.0b013e31827e83af.
6. Levy MM, Rhodes A, Phillips GS, et al. Surviving Sepsis Campaign: association between performance metrics and outcomes in a 7.5-year study. Crit Care Med. 2015;43(1):3-12. https://doi.org/10.1097/CCM.0000000000000723.
7. Damiani E, Donati A, Serafini G, et al. Effect of performance improvement programs on compliance with sepsis bundles and mortality: a systematic review and meta-analysis of observational studies. PLOS ONE. 2015;10(5):e0125827. https://doi.org/10.1371/journal.pone.0125827.
8. Paoli CJ, Reynolds MA, Sinha M, Gitlin M, Crouser E. Epidemiology and costs of sepsis in the United States-an analysis based on timing of diagnosis and severity level. Crit Care Med. 2018;46(12):1889-1897. https://doi.org/10.1097/CCM.0000000000003342.
9. Barnato AE, Alexander SL, Linde-Zwirble WT, Angus DC. Racial variation in the incidence, care, and outcomes of severe sepsis: analysis of population, patient, and hospital characteristics. Am J Respir Crit Care Med [patient]. 2008;177(3):279-284. https://doi.org/10.1164/rccm.200703-480OC.
10. Mayr FB, Yende S, Linde-Zwirble WT, et al. Infection rate and acute organ dysfunction risk as explanations for racial differences in severe sepsis. JAMA. 2010;303(24):2495-2503. https://doi.org/10.1001/jama.2010.851.
11. Dombrovskiy VY, Martin AA, Sunderram J, Paz HL. Occurrence and outcomes of sepsis: influence of race. Crit Care Med. 2007;35(3):763-768. https://doi.org/10.1097/01.CCM.0000256726.80998.BF.
12. Yamane D, Huancahuari N, Hou P, Schuur J. Disparities in acute sepsis care: a systematic review. Crit Care. 2015;19(Suppl 1):22. https://doi.org/10.1186/cc14102.
13. Martin GS, Mannino DM, Eaton S, Moss M. The epidemiology of sepsis in the United States from 1979 through 2000. N Engl J Med. 2003;348(16):1546-1554. https://doi.org/10.1056/NEJMoa022139.
14. Melamed A, Sorvillo FJ. The burden of sepsis-associated mortality in the United States from 1999 to 2005: an analysis of multiple-cause-of-death data. Crit Care. 2009;13(1):R28. https://doi.org/10.1186/cc7733.
15. Jones JM, Fingar KR, Miller MA, et al. Racial disparities in sepsis-related in-hospital mortality: using a broad case capture method and multivariate controls for clinical and hospital variables, 2004-2013. Crit Care Med. 2017;45(12):e1209-e1217. https://doi.org/10.1097/CCM.0000000000002699.
16. Bakullari A, Metersky ML, Wang Y, et al. Racial and ethnic disparities in healthcare-associated infections in the United States, 2009–2011. Infect Control Hosp Epidemiol. 2014;35(S3):S10-S16. https://doi.org/10.1086/677827.
17. Institute of Medicine. Unequal Treatment: What Healthcare Providers Need to Know about Racial and Ethnic Disparities in Healthcare. Washington, DC: National Academy Press; 2002.
18. Vogel TR. Update and review of racial disparities in sepsis. Surg Infect. 2012;13(4):203-208. https://doi.org/10.1089/sur.2012.124.
19. Esper AM, Moss M, Lewis CA, et al. The role of infection and comorbidity: factors that influence disparities in sepsis. Crit Care Med. 2006;34(10):2576-2582. https://doi.org/10.1097/01.CCM.0000239114.50519.0E.
20. Soto GJ, Martin GS, Gong MN. Healthcare disparities in critical illness. Crit Care Med. 2013;41(12):2784-2793. https://doi.org/10.1097/CCM.0b013e3182a84a43.
21. Taylor SP, Karvetski CH, Templin MA, Taylor BT. Hospital differences drive antibiotic delays for black patients compared with white patients with suspected septic shock. Crit Care Med. 2018;46(2):e126-e131. https://doi.org/10.1097/CCM.0000000000002829.
22. Divi C, Koss RG, Schmaltz SP, Loeb JM. Language proficiency and adverse events in US hospitals: a pilot study. Int J Qual Health Care. 2007;19(2):60-67. https://doi.org/10.1093/intqhc/mzl069.
23. John-Baptiste A, Naglie G, Tomlinson G, et al. The effect of English language proficiency on length of stay and in-hospital mortality. J Gen Intern Med. 2004;19(3):221-228. https://doi.org/10.1111/j.1525-1497.2004.21205.x.
24. Karliner LS, Kim SE, Meltzer DO, Auerbach AD. Influence of language barriers on outcomes of hospital care for general medicine inpatients. J Hosp Med. 2010;5(5):276-282. https://doi.org/10.1002/jhm.658.
25. Hacker K, Anies M, Folb BL, Zallman L. Barriers to health care for undocumented immigrants: a literature review. Risk Manag Healthc Policy. 2015;8:175-183. https://doi.org/10.2147/RMHP.S70173.
26. QuickFacts: San Francisco County, California. U.S. Census Bureau (2016). https://www.census.gov/quickfacts/fact/table/sanfranciscocountycalifornia/RHI425216. Accessed May 15, 2018.
27. Moore BJ, White S, Washington R, Coenen N, Elixhauser A. Identifying increased risk of readmission and in-hospital mortality using hospital administrative data: The AHRQ Elixhauser comorbidity index. Med Care. 2017;55(7):698-705. https://doi.org/10.1097/MLR.0000000000000735.
28. Rhee C, Dantes R, Epstein L, et al. Incidence and trends of sepsis in us hospitals using clinical vs claims data, 2009-2014. JAMA. 2017;318(13):1241-1249. https://doi.org/10.1001/jama.2017.13836.
29. Howell J, Emerson MO, So M. What “should” we use? Evaluating the impact of five racial measures on markers of social inequality. Sociol Race Ethn. 2017;3(1):14-30. https://doi.org/10.1177/2332649216648465.
30. Reeves T, Claudett B. United States Census Bureau. Asian Pac Islander Popul. March 2002;2003.
31. van Walraven C, Austin PC, Jennings A, Quan H, Forster AJ. A modification of the Elixhauser comorbidity measures into a point system for hospital death using administrative data. Med Care. 2009;47(6):626-633. https://doi.org/10.1097/MLR.0b013e31819432e5.
32. Baron RM, Kenny DA. The moderator-mediator variable distinction in social psychological research: conceptual, strategic, and statistical considerations. J Pers Soc Psychol. 1986;51(6):1173-1182. https://doi.org/10.1037//0022-3514.51.6.1173. 33. VanderWeele TJ, Ding P. Sensitivity analysis in observational research: introducing the E-value. Ann Intern Med. 2017;167(4):268-274. https://doi.org/10.7326/M16-2607.
34. Mathur MB, Ding P, Riddell CA, VanderWeele TJ. Website and R package for computing E-values. Epidemiology. 2018;29(5):e45-e47. https://doi.org/10.1097/EDE.0000000000000864.
35. Sentell T, Braun KL. Low Health Literacy, Limited English proficiency, and health status in Asians, Latinos, and other racial/ethnic groups in California. J Health Commun. 2012;17 Supplement 3:82-99. https://doi.org/10.1080/10810730.2012.712621.
36. FitzGerald C, Hurst S. Implicit bias in healthcare professionals: a systematic review. BMC Med Eth. 2017;18(1):19. https://doi.org/10.1186/s12910-017-0179-8.
37. Flores G. The impact of medical interpreter services on the quality of health care: A systematic review. Med Care Res Rev. 2005;62(3):255-299. https://doi.org/10.1177/1077558705275416.
38. Karliner LS, Jacobs EA, Chen AH, Mutha S. Do professional interpreters improve clinical care for patients with limited English proficiency? A systematic review of the literature. Health Serv Res. 2007;42(2):727-754. https://doi.org/10.1111/j.1475-6773.2006.00629.x.
39. Diamond LC, Schenker Y, Curry L, Bradley EH, Fernandez A. Getting by: underuse of interpreters by resident physicians. J Gen Intern Med. 2009;24(2):256-262. https://doi.org/10.1007/s11606-008-0875-7.
40. López L, Rodriguez F, Huerta D, Soukup J, Hicks L. Use of interpreters by physicians for hospitalized limited English proficient patients and its impact on patient outcomes. J Gen Intern Med. 2015;30(6):783-789. https://doi.org/10.1007/s11606-015-3213-x.
Sepsis is defined as a life-threatening organ dysfunction that occurs in response to systemic infection.1,2 It is frequently fatal, common in hospital medicine, and a leading contributor to critical illness, morbidity, and healthcare expenditures.2-5 While sepsis care and outcomes have improved in the past decade,6,7 inpatient mortality remains high.8
A number of studies have sought to determine whether race plays a role in sepsis mortality. While Black patients with sepsis have frequently been identified as having the highest rates of death,9-14 similar observations have been made for most non-White races/ethnicities.13-15 Studies have also demonstrated higher rates of hospital-acquired infections among Asian and Latino patients.16
There are several possible explanations for why racial minorities experience disparate outcomes in sepsis, including access to care, comorbidities, implicit biases, and biological or environmental factors,17-20 as well as characteristics of hospitals most likely to care for racial minorities.13,15,21 One explanation that has not been explored is that racial disparities in sepsis are mediated by language. Limited English proficiency (LEP) has previously been associated with increased rates of adverse hospital events,22 longer length of stay,23 and greater likelihood of readmission.24 LEP has also been shown to represent a significant barrier to accessing healthcare and preventive screening.25 The role of LEP in sepsis mortality, however, has yet to be examined.
The diverse patient population at the University of California, San Francisco (UCSF) provides a unique opportunity to build upon existing literature by further exploring racial differences in sepsis, specifically by investigating the role of LEP. The objective of this study was to determine the association between LEP and inpatient mortality among adults hospitalized with sepsis.
METHODS
Setting
The study was conducted at the University of California, San Francisco, California (UCSF), an 800-bed tertiary care, academic medical center. It was approved by the UCSF Institutional Review Board with waiver of informed consent. UCSF cares for a population of patients who are racially and linguistically diverse, with high proportions of patients of East Asian descent and with LEP. According to recent United States census estimates, more than half of San Francisco County residents identify as non-White (35% Asians, 15% Hispanic/Latino, 6% Black), and 44% report speaking a language other than English at home.26
Study Population and Data Collection
The UCSF Medical Center uses the electronic health record (EHR) Epic (Epic 2017, Epic Systems Corporation, Verona, Wisconsin). We obtained computerized EHR data from Clarity, the relational database that stores Epic’s inpatient data in thousands of tables. We identified all patients ≥18 years of age presenting to the emergency department (ED) between June 1, 2012 and December 31, 2016 with suspected serious infection, defined as having blood cultures ordered within 72 hours of ED presentation (N = 25,441). Patients who did not receive at least two doses of intravenous (IV) antibiotics within 48 hours were excluded, as they were unlikely to have serious infections.
We defined sepsis based on Sepsis-3 consensus guidelines2 as a change in sequential [sepsis-related] organ failure assessment (SOFA) score ≥2 within the first 48 hours of ED presentation. The SOFA score is comprised of six variables representing different organ systems, each rated 0-4 based on the degree of dysfunction.2 Patient vital signs, laboratory data, vasopressor medication doses, and ventilator settings were used to determine the exact timestamp at which each patient attained a change in SOFA score ≥2. Missing values were considered to be normal. To adjust for baseline organ dysfunction, SOFA elements associated with elevated bilirubin and/or creatinine were excluded for patients with chronic liver/kidney disease based on Elixhauser comorbidities.27 We chose to focus on the first 48 hours in an attempt to capture patients with the most severe illnesses and the highest probability of true sepsis.
All primary and secondary International Classification of Diseases (ICD)-9/10 diagnosis codes were extracted from Clarity coding tables at the time of hospital discharge. Diagnosis codes signifying bacterial infection were grouped into the following categories based on type/location: pneumonia; bacteremia; urinary tract infection; and skin and soft tissue infection. All remaining diagnostic codes indicating bacterial infections at other sites were categorized as “Other”. If no codes indicating infection were present, patients were categorized as “None coded”. Patients with discharge diagnosis codes of “sepsis” were also identified. Dates and times of antibiotic administrations were obtained from the medications table. Time to first antibiotic was defined as the time in minutes from ED presentation to initiation of the first IV antibacterial medication. This variable was transformed using a natural log transformation based on best fit for normal distribution.
We limited our analyses to 8,974 patients who were diagnosed with sepsis as defined above and had either (1) ≥4 qualifying antibiotic days (QADs) or (2) an ICD-9/10 discharge diagnosis code of “sepsis” (Figure). QADs were defined based on the recent publication by Rhee et al. as having received four or more consecutive days of antibiotics, with the first dose given IV within 48 hours of presentation.28 Patients who died or were discharged to hospice prior to the 4th QAD were also included. These additional parameters were added to increase specificity of the study sample for patients with true sepsis. Patients admitted to all levels of care (acute care, transitional care unit [TCU], intensive care unit [ICU]) and under all hospital services were included. There were no missing data for mortality, race, or language. We chose to focus on patients with sepsis in this initial study as this is a common diagnosis in hospital medicine that is enriched for high mortality.
Primary Outcome
The primary outcome of the study was inpatient mortality, which was obtained from the hospital encounters table in Clarity.
Primary Predictors
The primary predictor of interest was LEP. The encounter numbers from the dataset were used to link to self-reported demographic data, including “preferred language” and need for interpreter services. A manual chart review of 60 patients speaking the top six languages was conducted to verify the accuracy of the data on language and interpreter use (KNK). Defining the gold standard for LEP as having any chart note indicating non-English language and/or that an interpreter was used, the “interpreter needed” variable in Epic was found to have a positive predictive value for LEP of 100%. Therefore, patients in the study cohort were defined as having LEP if they met both of the following criteria: (1) a self-reported “preferred language” other than English and (2) having the “interpreter needed” variable indicating “yes”.
Covariate Data Collection
Additional data were obtained from the demographics tables, including age, race, sex, and insurance status. Race and ethnicity were combined into a single five-category variable including White, Asian, Black, Latino, and Other. This approach has been suggested as the best way to operationalize these variables29 and has been utilized by similar studies in the literature.9,14,15 We considered the Asian race to include all people of East Asian, Southeast Asian, or South Asian descent, which is consistent with the United States Census Bureau definition.30 Patients identifying as Native Hawaiians/Pacific Islanders, Native Americans/Alaskan Natives, as well as those with unspecified race or ethnicity, were categorized as Other. Insurance status was categorized as Commercial, Medicare, Medicaid, or Other.
We estimated illness severity in several ways. First, the total qualifying SOFA score was calculated for each patient, which was defined as the total score achieved at the time that SOFA criteria were first met (≥2, within 48 hours). Second, we dichotomized patients based on whether they had received mechanical ventilation at any point during hospitalization. Finally, we used admission location as a surrogate marker for severity at the time of initial hospitalization.
To estimate the burden of baseline comorbidities, we calculated the van Walraven score (VWS),31 a validated modification of the Elixhauser Comorbidity Index.27 This score conveys an estimated risk of in hospital death based on ICD-9/10 diagnosis codes for preexisting conditions, which ranges from <1% for the minimum score of –19 to >99% for the maximum score of 89.
Statistical Analyses
All statistical analyses were performed using Stata software version 15 (StataCorp LLC, College Station, Texas). Baseline demographics and patient characteristics were stratified by LEP. These were compared using two-sample t-tests or chi-squared tests of significance. Wilcoxon rank-sum tests were used for non-normally distributed variables. Inpatient mortality was compared across all races stratified by LEP using chi-squared tests of significance.
We fit a series of multivariable logistic regression models to examine the association between race and inpatient mortality adjusting for LEP and other patient/clinical characteristics. We first examined the unadjusted association between mortality and race; then adjusted for LEP alone; and finally adjusted for all covariates of interest, including LEP, age, sex, insurance status, year, admission level of care, VWS, total qualifying SOFA score, need for mechanical ventilation, site of infection, and time to first IV antibiotic. A subgroup analysis was also performed using the fully adjusted model restricted to patients who were mechanically ventilated. This population was selected because the patients (1) have among the highest severity of illness and (2) share a common barrier to communication, regardless of English proficiency.
Several potential interactions between LEP with other covariates were explored, including age, race, ICU admission level of care, and need for mechanical ventilation. Lastly, a mediation analysis was performed based on Baron & Kenny’s four-step model32 in order to calculate the proportion of the association between race and mortality explained by the proposed mediator (LEP).
To evaluate for the likelihood of residual confounding, we calculated an E-value, which is defined as the minimum strength of association that an unmeasured confounder would need to have with both the predictor and outcome variables, above and beyond the measured covariates, in order to fully explain away an observed predictor-outcome association.33,34
RESULTS
We identified 8,974 patients hospitalized with sepsis based on the above inclusion criteria. This represented a medically complex, racially and linguistically diverse population (Table 1). The cohort was comprised of 24% Asian, 12% Black, and 11% Latino patients. Among those categorized as Other race, Native Americans/Alaskan Natives and Native Hawaiians/Pacific Islanders accounted for 4% (n = 31) and 21% (n = 159), respectively. A fifth of all patients had LEP (n = 1,716), 62% of whom were Asian (n = 1,064). Patients with LEP tended to be older, female, and to have a greater number of comorbid conditions (Table 1). The total qualifying SOFA score was also higher among patients with LEP (median 5; interquartile range [IQR]: 4-8 vs 5; IQR: 3-7; P <.001), though there was no association between LEP and mechanical ventilation (P = .22). The prevalence of LEP differed significantly across races, with 50% LEP among Asians, 32% among Latinos, 5% among White patients (P < .001). Only eight Black patients had LEP. More than 40 unique languages were represented in the cohort, with English, Cantonese, Spanish, Russian, and Mandarin accounting for ~95% (Appendix Table 1). Among Latino patients, 63% spoke English and 36% spoke Spanish.
In-hospital mortality was significantly higher among patients who had LEP (n = 268/1,716, 16%) compared to non-LEP patients (n = 678/7,258, 9%), with 80% greater unadjusted odds of mortality (OR 1.80; 95% CI: 1.54-2.09; P < .001). Notably we also found that Asian race was associated with a 1.57 unadjusted odds of mortality compared to White race (95% CI: 1.34-1.85; P < .001). Age, VWS, total qualifying SOFA score, mechanical ventilation, and admission level of care all exhibited a positive dose-response association with mortality (Appendix Table 2). In unadjusted analyses, there was no evidence of interaction between LEP and age (P = .38), LEP and race (P = .45), LEP and ICU admission level of care (P = .31), or LEP and mechanical ventilation (P = .19). Asian patients had the highest overall mortality (14% total, 17% with LEP). LEP was associated with increased unadjusted mortality among White, Asian, and Other races compared to their non-LEP counterparts (Appendix Figure 1). There was no significant difference in mortality between Latino patients with and without LEP. The sample size for Black patients with LEP (n = 8) was too small to draw conclusions about mortality.
Following multivariable logistic regression modeling for the association between race and mortality, we found that the increased odds of death among Asian patients was partially attenuated after adjusting for LEP (odds ratio [OR] 1.23, 95% CI: 1.02-1.48; P = .03; Table 2). Meanwhile, LEP was associated with a 1.66 odds of mortality (95% CI: 1.38-1.99; P < .001) after adjustment for race. In the full multivariable model adjusting for demographics and clinical characteristics, illness severity, and comorbidities, LEP was associated with a 31% increase in the odds of mortality compared to non-LEP (95% CI: 1.06-1.63; P = .02). In this model, the association between Asian race and mortality was now fully attenuated, with a point estimate near 1.0 (OR 0.98; 95% CI: 0.79-1.22; P = .87). Markers of illness severity, including total qualifying SOFA score (OR 1.23; 95% CI: 1.20-1.27; P < .001) and need for mechanical ventilation (OR 1.88; 95% CI: 1.52-2.33; P < .001), were both associated with greater odds of death. Based on a four-step mediation analysis, LEP was found to be a partial mediator to the association between Asian race and mortality (76% proportion explained). The E-value for the association between LEP and mortality was 1.95, with an E-value for the corresponding confidence interval of 1.29.
In a subgroup analysis using the fully adjusted model restricted to patients who were mechanically ventilated during hospitalization, the association between LEP and mortality was no longer present (OR 1.15; 95% CI: 0.76-1.72; P = .51).
DISCUSSION
At a single US academic medical center serving a diverse population, we found that LEP was associated with sepsis mortality across all races except Black and Latino, conveying a 31% increase in the odds of death after adjusting for illness severity, comorbidities, and baseline characteristics. The higher mortality among Asian patients was largely mediated by LEP (76% proportion explained). While previous studies have variably found Black, Asian, Latino, and other non-White races/ethnicities to be at an increased risk of death from sepsis,9-15 LEP has not been previously evaluated as a mediator of sepsis mortality. We were uniquely suited to uncover such an association due to the racial and linguistic diversity of our patient population. LEP has previously been implicated in poor health outcomes among hospitalized patients in general.22-24 Future studies will be necessary to determine whether similar associations between LEP and mortality are observed among broader patient populations outside of sepsis.
There are a number of possible explanations for how LEP could mediate the association between race and mortality. First, LEP is known to be associated with greater difficulties in accessing medical care,25 which could result in poorer baseline control of chronic comorbid conditions, fewer opportunities for preventive screening, and greater reluctance to seek medical attention when ill, theoretically leading to more severe presentations and worse outcomes. Indeed, LEP patients in our cohort had both a shorter median time to receiving their first antibiotic, as well as a higher total qualifying SOFA score, both of which may suggest more severe initial presentations. LEP is also known to contribute to, or exacerbate, the impact of low health literacy, which is itself associated with poor health.35 Second, implicit biases may also have been present, as they are known to be common among healthcare providers and have been shown to negatively impact patient care.36
Finally,it is possible that the association is related to the language barrier itself, which impacts providers’ ability to take an appropriate clinical history, and can lead to clinical errors or delays in care.37 The fact that the association between LEP and mortality was eliminated when the analysis was restricted to mechanically ventilated patients seems to support this, since differences in language proficiency become irrelevant in this subgroup. While we are unable to comment on causality based on this observational study, we included a directed acyclic graph (DAG) in the supplemental materials, which shows one proposed model for describing these associations (Appendix Figure 2).
Assuming that the language barrier itself does, at least in part, drive the observed association, LEP represents a potentially modifiable risk factor that could be a target for quality improvement interventions. There is evidence that the use of medical interpreters among patients with LEP leads to greater satisfaction, fewer errors, and improved clinical outcomes;38 however, several recent studies have documented underutilization of professional interpreter services, even when readily available.39,40 At our institution, phone and video interpreter services are available 24/7 for approximately 150 languages. Due to limitations inherent to the EHR, we were unable to ascertain the extent to which these services were used in the present study. Heavy clinical workloads, connectivity issues, and missing or faulty equipment represent theoretical barriers to utilization of these services.
There are some limitations to our study. First, by utilizing a large database of electronic data, the quality of our analyses was reliant on the accuracy of the EHR. Demographic data such as language may have been subject to misclassification due to self-reporting. We attempted to minimize this by also including the need for interpreter services within the definition of LEP, which was validated by manual chart review. Second, generalizability is limited in this single-center study conducted at an institution with unique demographics, wherein nearly two-thirds of the LEP patients were Asian, and the Chinese-speaking population outnumbered those who speak Spanish.
Finally, the most important limitation to our study is the potential for residual confounding. While we attempted to mitigate this by adjusting for as many clinically relevant covariates as possible, there may still be unmeasured confounders to the association between LEP and mortality, such as access to outpatient care, functional status, interpreter use, and other markers of illness severity like the number and type of supportive therapies received. Based on our E-value calculations, with an observed OR of 1.31 for the association between LEP and mortality, an unmeasured confounder with an OR of 1.95 would fully explain away this association, while an OR of 1.29 would shift the confidence interval to include the null. These values suggest at least some risk of residual confounding. The fact that our fully adjusted model included multiple covariates, including several markers of illness severity, does somewhat lessen the likelihood of a confounder achieving these values, since they represent the minimum strength of an unmeasured confounder above and beyond the measured covariates. Regardless, the finding that patients with LEP are more likely to die from sepsis remains an important one, recognizing the need for further studies including multicenter investigations.
In this study, we showed that LEP was associated with sepsis mortality across nearly all races in our cohort. While Asian race was associated with a higher unadjusted odds of death compared to White race, this was attenuated after adjusting for LEP. This may suggest that some of the racial disparities in sepsis identified in prior studies were in fact mediated by language proficiency. Further studies will be required to explore the causal nature of this novel association. If modifiable factors are identified, this could represent a potential target for future quality improvement initiatives aimed at improving sepsis outcomes.
Disclaimer
The contents are solely the responsibility of the authors and do not necessarily represent the official views of the University of California, San Francisco or the National Institutes of Health.
1. De Backer DD, Dorman T. Surviving sepsis guidelines: A continuous move toward better care of patients with sepsis. JAMA. 2017;317(8):807-808. https://doi.org/10.1001/jama.2017.0059.
2. Singer M, Deutschman CS, Seymour CW, et al. The third international consensus definitions for sepsis and septic shock (Sepsis-3). JAMA. 2016;315(8):801-810. https://doi.org/10.1001/jama.2016.0287.
3. Angus DC, Linde-Zwirble WT, Lidicker J, et al. Epidemiology of severe sepsis in the United States: analysis of incidence, outcome, and associated costs of care. Crit Care Med. 2001;29(7):1303-1310. https://doi.org/10.1097/00003246-200107000-00002.
4. Mayr FB, Yende S, Angus DC. Epidemiology of severe sepsis. Virulence. 2014;5(1):4-11. https://doi.org/10.4161/viru.27372.
5. Dellinger RP, Levy MM, Rhodes A, et al. Surviving Sepsis Campaign: international guidelines for management of severe sepsis and septic shock: 2012. Crit Care Med. 2013;41(2):580-637. https://doi.org/10.1097/CCM.0b013e31827e83af.
6. Levy MM, Rhodes A, Phillips GS, et al. Surviving Sepsis Campaign: association between performance metrics and outcomes in a 7.5-year study. Crit Care Med. 2015;43(1):3-12. https://doi.org/10.1097/CCM.0000000000000723.
7. Damiani E, Donati A, Serafini G, et al. Effect of performance improvement programs on compliance with sepsis bundles and mortality: a systematic review and meta-analysis of observational studies. PLOS ONE. 2015;10(5):e0125827. https://doi.org/10.1371/journal.pone.0125827.
8. Paoli CJ, Reynolds MA, Sinha M, Gitlin M, Crouser E. Epidemiology and costs of sepsis in the United States-an analysis based on timing of diagnosis and severity level. Crit Care Med. 2018;46(12):1889-1897. https://doi.org/10.1097/CCM.0000000000003342.
9. Barnato AE, Alexander SL, Linde-Zwirble WT, Angus DC. Racial variation in the incidence, care, and outcomes of severe sepsis: analysis of population, patient, and hospital characteristics. Am J Respir Crit Care Med [patient]. 2008;177(3):279-284. https://doi.org/10.1164/rccm.200703-480OC.
10. Mayr FB, Yende S, Linde-Zwirble WT, et al. Infection rate and acute organ dysfunction risk as explanations for racial differences in severe sepsis. JAMA. 2010;303(24):2495-2503. https://doi.org/10.1001/jama.2010.851.
11. Dombrovskiy VY, Martin AA, Sunderram J, Paz HL. Occurrence and outcomes of sepsis: influence of race. Crit Care Med. 2007;35(3):763-768. https://doi.org/10.1097/01.CCM.0000256726.80998.BF.
12. Yamane D, Huancahuari N, Hou P, Schuur J. Disparities in acute sepsis care: a systematic review. Crit Care. 2015;19(Suppl 1):22. https://doi.org/10.1186/cc14102.
13. Martin GS, Mannino DM, Eaton S, Moss M. The epidemiology of sepsis in the United States from 1979 through 2000. N Engl J Med. 2003;348(16):1546-1554. https://doi.org/10.1056/NEJMoa022139.
14. Melamed A, Sorvillo FJ. The burden of sepsis-associated mortality in the United States from 1999 to 2005: an analysis of multiple-cause-of-death data. Crit Care. 2009;13(1):R28. https://doi.org/10.1186/cc7733.
15. Jones JM, Fingar KR, Miller MA, et al. Racial disparities in sepsis-related in-hospital mortality: using a broad case capture method and multivariate controls for clinical and hospital variables, 2004-2013. Crit Care Med. 2017;45(12):e1209-e1217. https://doi.org/10.1097/CCM.0000000000002699.
16. Bakullari A, Metersky ML, Wang Y, et al. Racial and ethnic disparities in healthcare-associated infections in the United States, 2009–2011. Infect Control Hosp Epidemiol. 2014;35(S3):S10-S16. https://doi.org/10.1086/677827.
17. Institute of Medicine. Unequal Treatment: What Healthcare Providers Need to Know about Racial and Ethnic Disparities in Healthcare. Washington, DC: National Academy Press; 2002.
18. Vogel TR. Update and review of racial disparities in sepsis. Surg Infect. 2012;13(4):203-208. https://doi.org/10.1089/sur.2012.124.
19. Esper AM, Moss M, Lewis CA, et al. The role of infection and comorbidity: factors that influence disparities in sepsis. Crit Care Med. 2006;34(10):2576-2582. https://doi.org/10.1097/01.CCM.0000239114.50519.0E.
20. Soto GJ, Martin GS, Gong MN. Healthcare disparities in critical illness. Crit Care Med. 2013;41(12):2784-2793. https://doi.org/10.1097/CCM.0b013e3182a84a43.
21. Taylor SP, Karvetski CH, Templin MA, Taylor BT. Hospital differences drive antibiotic delays for black patients compared with white patients with suspected septic shock. Crit Care Med. 2018;46(2):e126-e131. https://doi.org/10.1097/CCM.0000000000002829.
22. Divi C, Koss RG, Schmaltz SP, Loeb JM. Language proficiency and adverse events in US hospitals: a pilot study. Int J Qual Health Care. 2007;19(2):60-67. https://doi.org/10.1093/intqhc/mzl069.
23. John-Baptiste A, Naglie G, Tomlinson G, et al. The effect of English language proficiency on length of stay and in-hospital mortality. J Gen Intern Med. 2004;19(3):221-228. https://doi.org/10.1111/j.1525-1497.2004.21205.x.
24. Karliner LS, Kim SE, Meltzer DO, Auerbach AD. Influence of language barriers on outcomes of hospital care for general medicine inpatients. J Hosp Med. 2010;5(5):276-282. https://doi.org/10.1002/jhm.658.
25. Hacker K, Anies M, Folb BL, Zallman L. Barriers to health care for undocumented immigrants: a literature review. Risk Manag Healthc Policy. 2015;8:175-183. https://doi.org/10.2147/RMHP.S70173.
26. QuickFacts: San Francisco County, California. U.S. Census Bureau (2016). https://www.census.gov/quickfacts/fact/table/sanfranciscocountycalifornia/RHI425216. Accessed May 15, 2018.
27. Moore BJ, White S, Washington R, Coenen N, Elixhauser A. Identifying increased risk of readmission and in-hospital mortality using hospital administrative data: The AHRQ Elixhauser comorbidity index. Med Care. 2017;55(7):698-705. https://doi.org/10.1097/MLR.0000000000000735.
28. Rhee C, Dantes R, Epstein L, et al. Incidence and trends of sepsis in us hospitals using clinical vs claims data, 2009-2014. JAMA. 2017;318(13):1241-1249. https://doi.org/10.1001/jama.2017.13836.
29. Howell J, Emerson MO, So M. What “should” we use? Evaluating the impact of five racial measures on markers of social inequality. Sociol Race Ethn. 2017;3(1):14-30. https://doi.org/10.1177/2332649216648465.
30. Reeves T, Claudett B. United States Census Bureau. Asian Pac Islander Popul. March 2002;2003.
31. van Walraven C, Austin PC, Jennings A, Quan H, Forster AJ. A modification of the Elixhauser comorbidity measures into a point system for hospital death using administrative data. Med Care. 2009;47(6):626-633. https://doi.org/10.1097/MLR.0b013e31819432e5.
32. Baron RM, Kenny DA. The moderator-mediator variable distinction in social psychological research: conceptual, strategic, and statistical considerations. J Pers Soc Psychol. 1986;51(6):1173-1182. https://doi.org/10.1037//0022-3514.51.6.1173.33. VanderWeele TJ, Ding P. Sensitivity analysis in observational research: introducing the E-value. Ann Intern Med. 2017;167(4):268-274. https://doi.org/10.7326/M16-2607.
34. Mathur MB, Ding P, Riddell CA, VanderWeele TJ. Website and R package for computing E-values. Epidemiology. 2018;29(5):e45-e47. https://doi.org/10.1097/EDE.0000000000000864.
35. Sentell T, Braun KL. Low Health Literacy, Limited English proficiency, and health status in Asians, Latinos, and other racial/ethnic groups in California. J Health Commun. 2012;17 Supplement 3:82-99. https://doi.org/10.1080/10810730.2012.712621.
36. FitzGerald C, Hurst S. Implicit bias in healthcare professionals: a systematic review. BMC Med Eth. 2017;18(1):19. https://doi.org/10.1186/s12910-017-0179-8.
37. Flores G. The impact of medical interpreter services on the quality of health care: A systematic review. Med Care Res Rev. 2005;62(3):255-299. https://doi.org/10.1177/1077558705275416.
38. Karliner LS, Jacobs EA, Chen AH, Mutha S. Do professional interpreters improve clinical care for patients with limited English proficiency? A systematic review of the literature. Health Serv Res. 2007;42(2):727-754. https://doi.org/10.1111/j.1475-6773.2006.00629.x.
39. Diamond LC, Schenker Y, Curry L, Bradley EH, Fernandez A. Getting by: underuse of interpreters by resident physicians. J Gen Intern Med. 2009;24(2):256-262. https://doi.org/10.1007/s11606-008-0875-7.
40. López L, Rodriguez F, Huerta D, Soukup J, Hicks L. Use of interpreters by physicians for hospitalized limited English proficient patients and its impact on patient outcomes. J Gen Intern Med. 2015;30(6):783-789. https://doi.org/10.1007/s11606-015-3213-x.
© 2019 Society of Hospital Medicine