User login
Counseling Your Patients About Hypoactive Sexual Desire Disorder and Advances in its Diagnosis and Treatment

For women, sexual health involves both body and mind. Conditions that compromise a woman’s sexual health interfere with intimacy and ultimately impact all areas of her well-being. Hypoactive sexual desire disorder (HSDD) is the most common of the female sexual dysfunctions. HSDD occurs in women of all ages but is continuously underdiagnosed and undermanaged.
The articles in this CME journal supplement comprehensively address the areas of concern that inhibit women’s healthcare clinicians in effectively addressing HSDD—namely patient communications, diagnostic strategies, and therapeutic modalities for treating HSDD. The information presented will allow these healthcare providers to implement strategies that will improve the sexual health of their patients presenting with HSDD, with the intent of improving these patients’ overall sense of well-being.
Click here to read the supplement.
To access the posttest and evaluation and claim credit, visit: www.omniaeducation.com/hsdd

Health care resource utilization leading to a diagnosis of soft tissue sarcoma
Introduction
Soft tissue sarcomas (STS) are a heterogeneous group of cancerous tumors, comprised of more than 50 histological subtypes that develop from soft tissues of the body (eg, fat, muscles, nerve tissue, deep skin tissue, visceral nonepithelial tissue). Due to many factors, not limited to the heterogeneity of this set of diseases and lack of screening tests, reaching a diagnosis of STS is challenging for the general practitioner as well as for the oncologist. Sarcomas may present with nonspecific and often indolent symptomology, depending on the specific histological subtype. According to the American Cancer Society, the signs and symptoms of a sarcoma include a new or growing lump, worsening abdominal pain, blood in stool or vomit, and black stools (due to abdominal bleeding).1 Unfortunately, these symptoms could be indicative of any number of other health conditions and are nonspecific to sarcoma.
As with many cancers, the early detection of disease when it may be completely resected could lead to a cure, whereas diagnosis when the disease is no longer amenable to surgery will impact patient survival. Among all forms of STS, early diagnosis when the patient has only localized disease is associated with an 80.8% five-year survival rate, which decreases to 16.4% for patients whose disease has already metastasized to other parts of the body at the time of diagnosis.2
Previous work has evaluated the relationship between duration of symptoms that may lead to a diagnosis of sarcoma and cancer outcomes. A retrospective analysis of a cohort of adults with bone or STS found no correlation between patient recall of duration of prediagnosis symptoms and survival or metastatic disease at diagnosis.3,4 Little other research was identified that examined the challenges of identifying a potential sarcoma. Despite the gap in knowledge, advocacy and patient-centered organizations emphasize the risk of delayed diagnosis and report high levels of stress and frustration among patients by the time an accurate diagnosis is obtained.5 The objective of this study was to quantify the health care experience and misdiagnoses that occurred prior to a sarcoma diagnosis compared to a cohort of matched controls.
Methods
A retrospective observational database study was conducted using detailed resource utilization and cost data from the Truven MarketScan claims database. Truven MarketScan® is a HIPAA-compliant, fully integrated patient-level database containing inpatient, outpatient, drug, lab, health risk assessment, and benefit design information from commercial and Medicare supplemental insurance plans. Additionally, the Health and Productivity Management (HPM) database, containing workplace absence, short-term disability, long-term disability, and worker’s compensation data, is linked at the individual patient level. The linkage of the claims and HPM database was used for this study.
Patients were eligible for inclusion in the cohort of a sarcoma if they had at least two ICD-9 codes of 171.x on two different days between July 1, 2004, and March 30, 2014. The date of the first eligible code was considered the index date. Patients were required to have at least 6 months of health care plan enrollment prior to the first eligible ICD-9 code to allow for prediagnosis activity to be identified in the database. Patients were also required to be 18 years of age or older on the first eligible ICD-9 code date. Patients were excluded who had evidence suggesting a diagnosis of osteosarcoma, Kaposi’s sarcoma, or gastrointestinal stromal tumors (treatment with methotrexate, ICD-9 codes of 176.x, 171.x, or 238.1), a history of any cancer before the eligible sarcoma ICD-9 code, or history of systemic anticancer therapy during the 6-month pre-index period. All patients meeting eligibility criteria were included in the matching algorithm to identify the control cohort.
The matched control cohort was required to have at least the same duration of follow-up at the case level as the matched sarcoma patient, could not have any evidence of any malignancy at any time in the database, nor could have received any systemic anticancer therapy at any time. Controls were randomly selected from the more than 100 million individual patient cases in the MarketScan database to be matched to the eligible sarcoma patient cohort exactly on age, geographic region of residence, health insurance plan type, gender, noncancer comorbid conditions (measured by Charlson Comorbidity Index items), and employment status. All factors were exact matched at the sarcoma cohort index diagnosis date. In the case of missing variables, patients were matched on missingness (eg, a case with missing employment status would be matched to a control with missing employment status).
The eligible time period for the index date of the possible sarcoma cohort and matched controls was between July 1, 2004, and March 30, 2014, which allowed for a minimum of 1-year follow-up through the end of the database available at the time of analysis.
All ICD-9 diagnostic and procedure codes present in the matched 6-month time period pre-index diagnosis were compared to explore factors that may be more likely to be present in the sarcoma cohort compared to matched controls. Univariate analysis was conducted for each prediagnosis variable. Analyses were conducted using T test for continuous variables, and Chi-square or Fisher’s exact test was used for categorical variables.
Number of physician visits, inpatient hospital stays, surgical procedures, and emergency room visits were compared between those in the sarcoma cohort and matched controls during the matched 6-month pre-index period. The post-index diagnosis employment status was also compared between groups using the HPM database. Comparisons between the sarcoma cohort and control cohort were made among the actively employed patients at baseline related to the proportion of patients who continued active employment, the proportion who permanently discontinued work, and the proportion who initially discontinued work and then returned to work at a later time. No adjustments were made for multiple comparisons.
Results
A total of 7826 controls were each matched to patients in the sarcoma cohort. The baseline characteristics of the study cohorts are provided in Table 1. 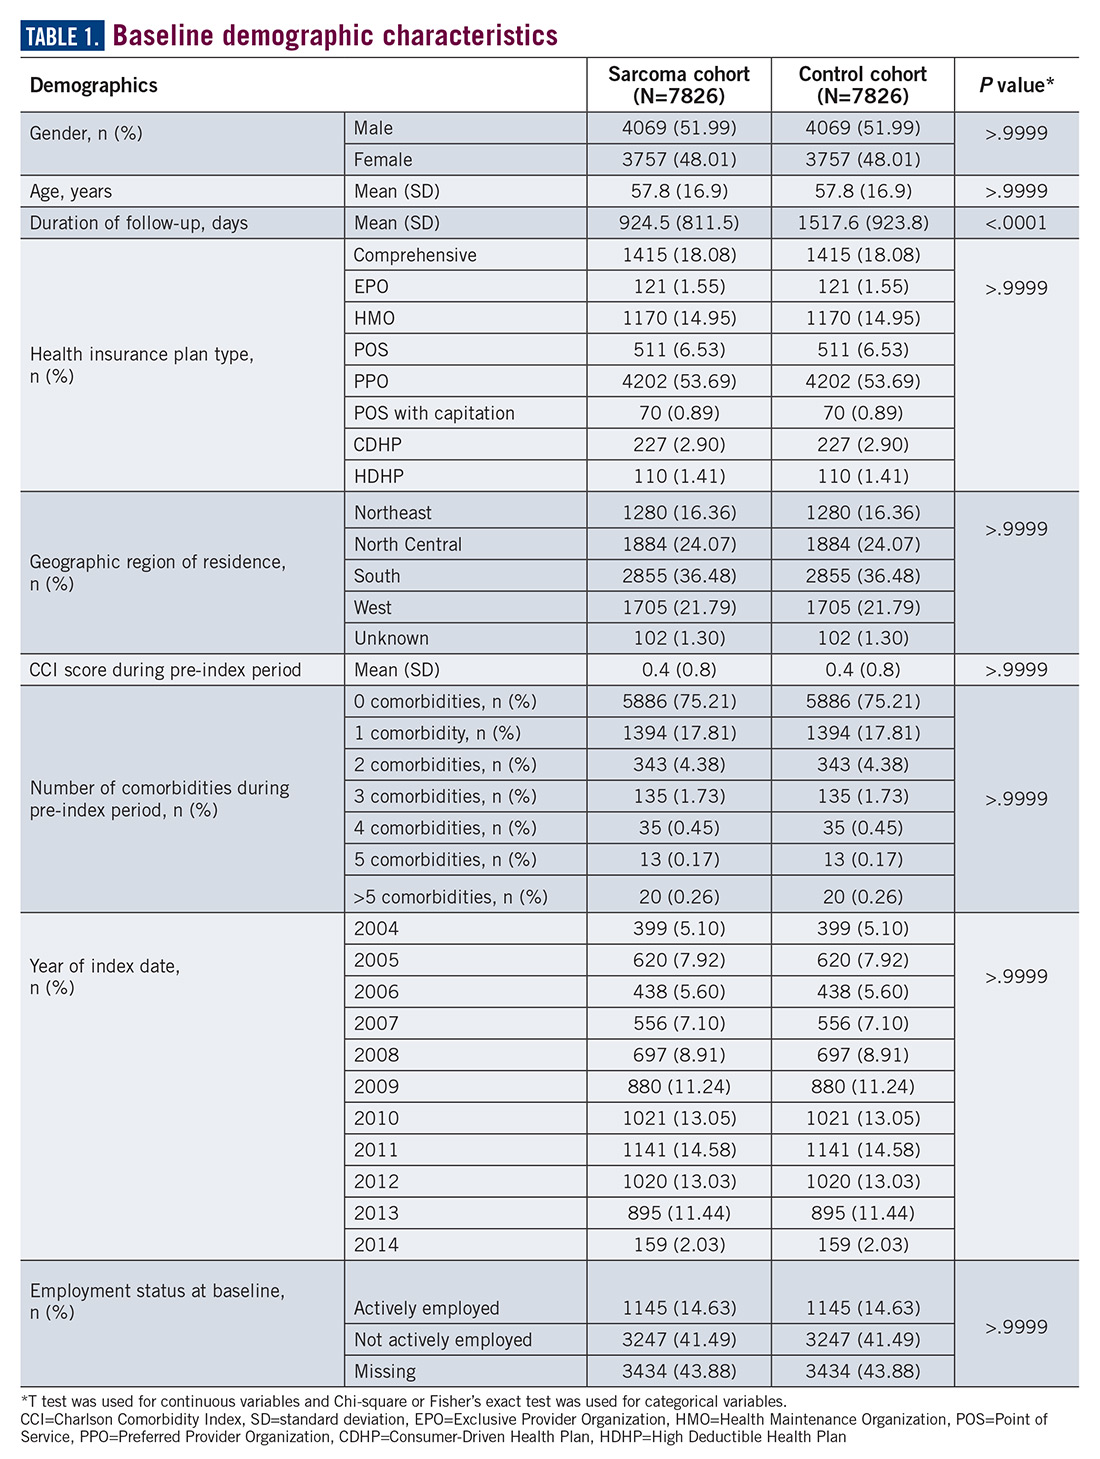
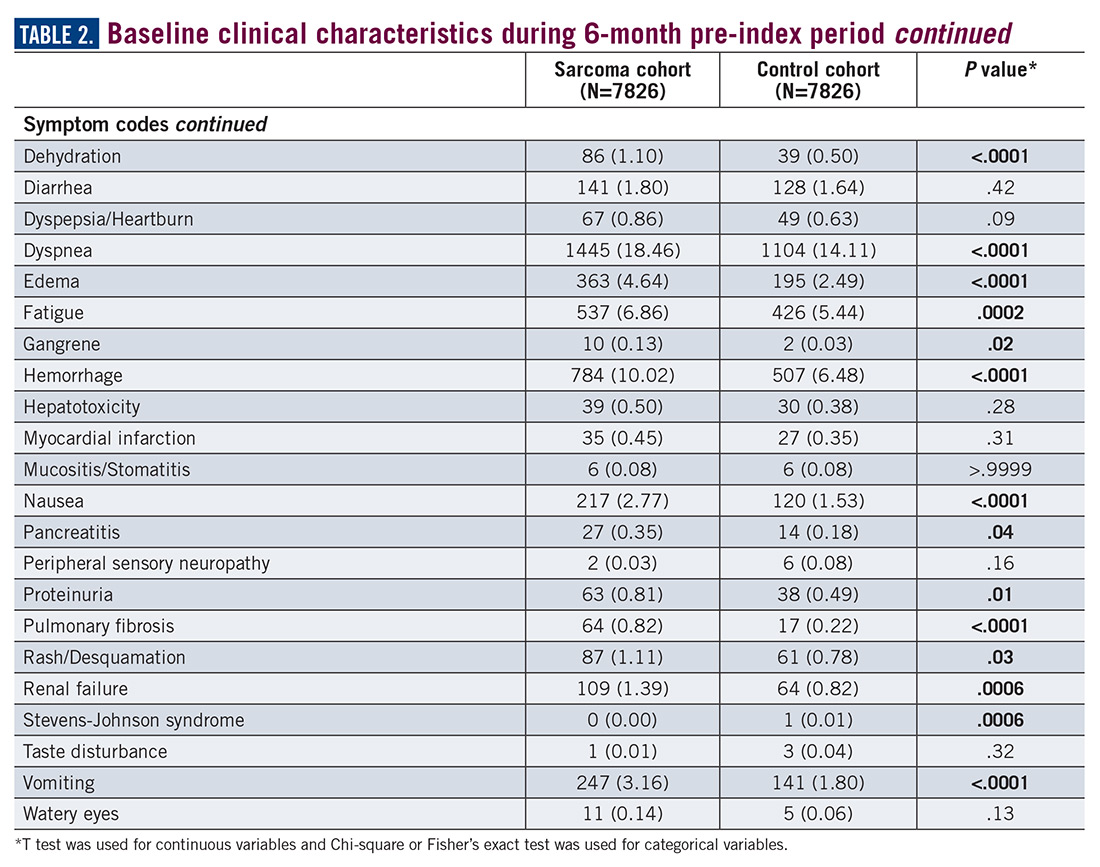
During the 6-month period before the sarcoma diagnosis (prediagnosis period), patients had significantly greater frequency of diagnoses identified than controls for uncertain neoplasms, limb pain, and hypertension (all P<.001, Table 2). 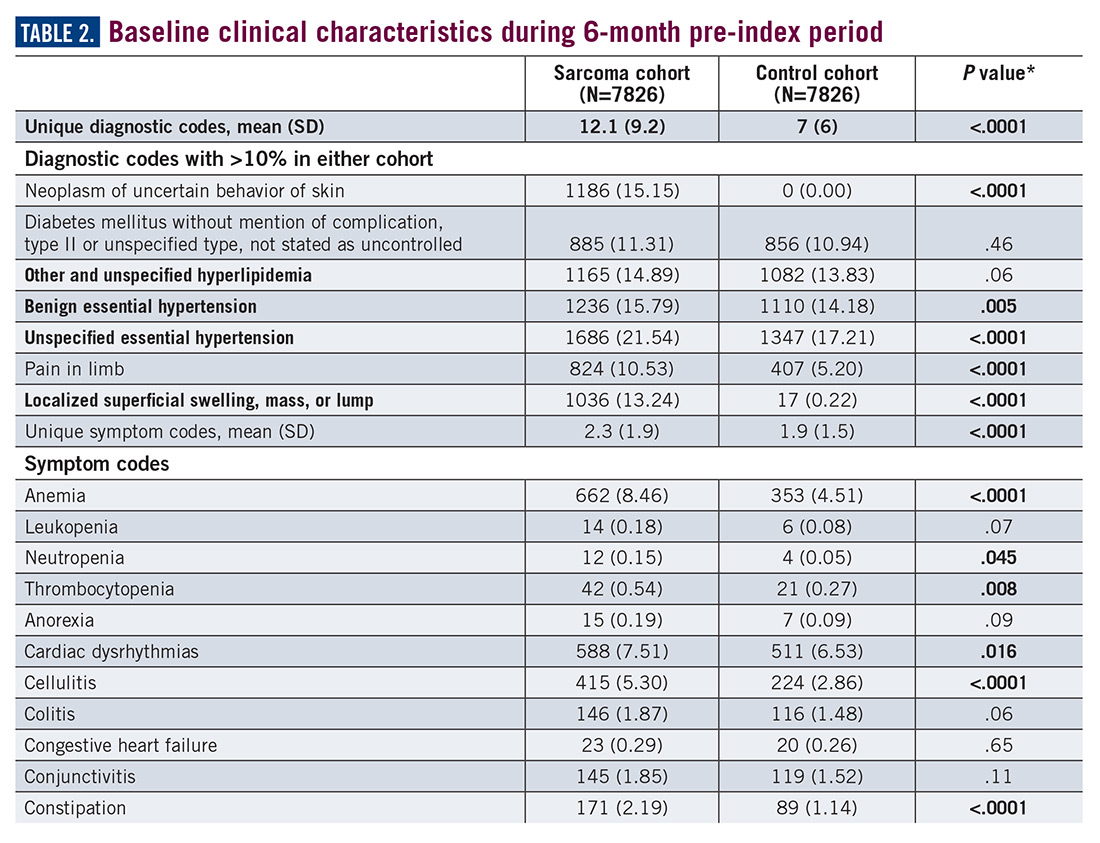
Similarly, the majority of health care resource utilization factors evaluated showed statistically higher health care use among patients later suspected of having sarcoma than matched controls (Table 3). 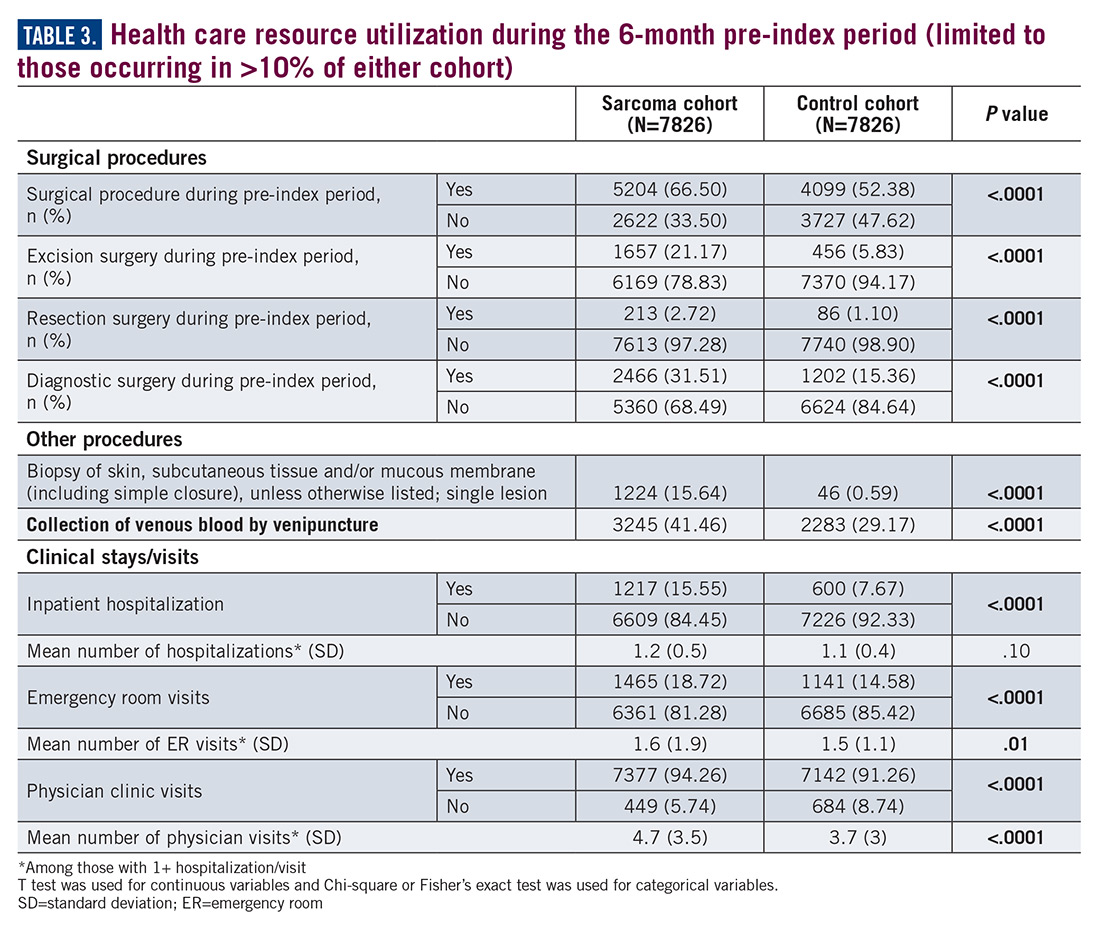
Employment status was missing for 44% of the cohort at baseline and approximately half the cohort during follow-up (Table 4).
Discussion
The symptoms experienced by patients that were recorded in claims were significantly higher across multiple categories than matched controls. However, the rates were relatively low, demonstrating the wide variability in the presentation of sarcoma. Patients had a variety of recorded problems, not limited to a lump or pain, but including hematologic, gastric, and cardiac concerns, that differed from those who had no suspected sarcoma. These factors highlight the challenges that may be facing patients who have an undetected sarcoma.
An expected finding was the difference in duration of follow-up between cohorts. This could be due to longer survival of those without a sarcoma diagnosis or due to insurance changes among those who had a sarcoma diagnosis. The absence of death data did not allow for further exploration of this finding within this study. Future research may wish to identify more comprehensive datasets to allow for the objective evaluation of the differences in time to diagnosis and stage of disease and survival, which would be the ultimate goal in order to develop potential strategies to improve patient outcomes.
This study was limited in that the sarcoma diagnosis could not be verified in a clinical record due to the de-identified nature of the claims data used for this study. Prior work has shown that the ICD coding for sarcoma is incomplete6,7; therefore it is likely there are many other patients in the claims dataset who had a suspected sarcoma but who did not have a 171.x code recorded. Hence, this study is limited to a comparison of a cohort for whom the provider specified a sarcoma code in their billing records. While there are gaps in the ability to identify the entire population of sarcoma patients, the patients with ICD codes used in this study are likely true sarcoma cases. Prior work has demonstrated that the presence of these codes accurately reflects a true sarcoma diagnosis.7 However, given the concerns with ICD coding, two sarcoma codes were required on unique days to reduce the risk of single rule-out codes or data entry error. Patients diagnosed with sarcoma demonstrate significantly greater health care resource use across variables as matched controls during the 6-month period leading to diagnosis, supporting the observations within advocacy and patient reports of the challenges faced during the process to reach an accurate diagnosis. This work may provide the initial basis for the development of strategies to more rapidly identify a potential sarcoma. Future research could also evaluate more than 6 months prior to diagnosis, to quantify the duration of time during which these differences versus controls may exist. Additionally, the cost of care may be of interest to future research to better quantify the burden of misdiagnosis on the health care system.
Acknowledgement
The authors would like to acknowledge Yun Fang, MS, for her support in the SAS coding for the analysis of this study.
Corresponding Author
Lisa M. Hess, PhD, Eli Lilly and Company. hess_lisa_m@lilly.com
Disclosures
No funding was received or exchanged in the conceptualization, conduct, data collection, analysis, interpretation, or writing related to this study. This unfunded study was conducted by employees of Eli Lilly and Company.
1. ACS. Signs and Symptoms of Soft Tissue Sarcomas. 2018. https://www.cancer.org/cancer/soft-tissue-sarcoma/detection-diagnosis-staging/signs-symptoms.html. Accessed September 27, 2018.
2. SEER. Cancer Stat Facts: Soft Tissue including Heart Cancer. National Cancer Institute Surveillance, Epidemiology, and End Results Program; 2018. https://seer.cancer.gov/statfacts/html/soft.html. Accessed February 20, 2019.
3. Rougraff BT, Davis K, Lawrence J. Does length of symptoms before diagnosis of sarcoma affect patient survival? Clin Orthop Relat Res. 2007;462:181-189.
4. Rougraff BT, Lawrence J, Davis K. Length of symptoms before referral: prognostic variable for high-grade soft tissue sarcoma? Clin Orthop Relat Res. 2012;470(3):706-711.
5. LSSI. Liddy Shriver Sarcoma Initiative. Sarcoma: A diagnosis of patience. http://sarcomahelp.org/articles/patience.html. Accessed September 20, 2018.
6. Hess LM, Zhu EY, Sugihara T, Fang Y, Collins N, Nicol S. Challenges with use of the International Classification of Disease Coding (ICD-9-CM/ICD-10-CM) for soft tissue sarcoma. Perspect Health Inf Manage. 2019;16 (Spring). eCollection 2019.
7. Lyu HG, Stein LA, Saadat LV, Phicil SN, Haider A, Raut CP. Assessment of the accuracy of disease coding among patients diagnosed with sarcoma. JAMA Oncol. 2018;4(9):1293-1295.
Introduction
Soft tissue sarcomas (STS) are a heterogeneous group of cancerous tumors, comprised of more than 50 histological subtypes that develop from soft tissues of the body (eg, fat, muscles, nerve tissue, deep skin tissue, visceral nonepithelial tissue). Due to many factors, not limited to the heterogeneity of this set of diseases and lack of screening tests, reaching a diagnosis of STS is challenging for the general practitioner as well as for the oncologist. Sarcomas may present with nonspecific and often indolent symptomology, depending on the specific histological subtype. According to the American Cancer Society, the signs and symptoms of a sarcoma include a new or growing lump, worsening abdominal pain, blood in stool or vomit, and black stools (due to abdominal bleeding).1 Unfortunately, these symptoms could be indicative of any number of other health conditions and are nonspecific to sarcoma.
As with many cancers, the early detection of disease when it may be completely resected could lead to a cure, whereas diagnosis when the disease is no longer amenable to surgery will impact patient survival. Among all forms of STS, early diagnosis when the patient has only localized disease is associated with an 80.8% five-year survival rate, which decreases to 16.4% for patients whose disease has already metastasized to other parts of the body at the time of diagnosis.2
Previous work has evaluated the relationship between duration of symptoms that may lead to a diagnosis of sarcoma and cancer outcomes. A retrospective analysis of a cohort of adults with bone or STS found no correlation between patient recall of duration of prediagnosis symptoms and survival or metastatic disease at diagnosis.3,4 Little other research was identified that examined the challenges of identifying a potential sarcoma. Despite the gap in knowledge, advocacy and patient-centered organizations emphasize the risk of delayed diagnosis and report high levels of stress and frustration among patients by the time an accurate diagnosis is obtained.5 The objective of this study was to quantify the health care experience and misdiagnoses that occurred prior to a sarcoma diagnosis compared to a cohort of matched controls.
Methods
A retrospective observational database study was conducted using detailed resource utilization and cost data from the Truven MarketScan claims database. Truven MarketScan® is a HIPAA-compliant, fully integrated patient-level database containing inpatient, outpatient, drug, lab, health risk assessment, and benefit design information from commercial and Medicare supplemental insurance plans. Additionally, the Health and Productivity Management (HPM) database, containing workplace absence, short-term disability, long-term disability, and worker’s compensation data, is linked at the individual patient level. The linkage of the claims and HPM database was used for this study.
Patients were eligible for inclusion in the cohort of a sarcoma if they had at least two ICD-9 codes of 171.x on two different days between July 1, 2004, and March 30, 2014. The date of the first eligible code was considered the index date. Patients were required to have at least 6 months of health care plan enrollment prior to the first eligible ICD-9 code to allow for prediagnosis activity to be identified in the database. Patients were also required to be 18 years of age or older on the first eligible ICD-9 code date. Patients were excluded who had evidence suggesting a diagnosis of osteosarcoma, Kaposi’s sarcoma, or gastrointestinal stromal tumors (treatment with methotrexate, ICD-9 codes of 176.x, 171.x, or 238.1), a history of any cancer before the eligible sarcoma ICD-9 code, or history of systemic anticancer therapy during the 6-month pre-index period. All patients meeting eligibility criteria were included in the matching algorithm to identify the control cohort.
The matched control cohort was required to have at least the same duration of follow-up at the case level as the matched sarcoma patient, could not have any evidence of any malignancy at any time in the database, nor could have received any systemic anticancer therapy at any time. Controls were randomly selected from the more than 100 million individual patient cases in the MarketScan database to be matched to the eligible sarcoma patient cohort exactly on age, geographic region of residence, health insurance plan type, gender, noncancer comorbid conditions (measured by Charlson Comorbidity Index items), and employment status. All factors were exact matched at the sarcoma cohort index diagnosis date. In the case of missing variables, patients were matched on missingness (eg, a case with missing employment status would be matched to a control with missing employment status).
The eligible time period for the index date of the possible sarcoma cohort and matched controls was between July 1, 2004, and March 30, 2014, which allowed for a minimum of 1-year follow-up through the end of the database available at the time of analysis.
All ICD-9 diagnostic and procedure codes present in the matched 6-month time period pre-index diagnosis were compared to explore factors that may be more likely to be present in the sarcoma cohort compared to matched controls. Univariate analysis was conducted for each prediagnosis variable. Analyses were conducted using T test for continuous variables, and Chi-square or Fisher’s exact test was used for categorical variables.
Number of physician visits, inpatient hospital stays, surgical procedures, and emergency room visits were compared between those in the sarcoma cohort and matched controls during the matched 6-month pre-index period. The post-index diagnosis employment status was also compared between groups using the HPM database. Comparisons between the sarcoma cohort and control cohort were made among the actively employed patients at baseline related to the proportion of patients who continued active employment, the proportion who permanently discontinued work, and the proportion who initially discontinued work and then returned to work at a later time. No adjustments were made for multiple comparisons.
Results
A total of 7826 controls were each matched to patients in the sarcoma cohort. The baseline characteristics of the study cohorts are provided in Table 1.
During the 6-month period before the sarcoma diagnosis (prediagnosis period), patients had significantly greater frequency of diagnoses identified than controls for uncertain neoplasms, limb pain, and hypertension (all P<.001, Table 2).
Similarly, the majority of health care resource utilization factors evaluated showed statistically higher health care use among patients later suspected of having sarcoma than matched controls (Table 3).
Employment status was missing for 44% of the cohort at baseline and approximately half the cohort during follow-up (Table 4).
Discussion
The symptoms experienced by patients that were recorded in claims were significantly higher across multiple categories than matched controls. However, the rates were relatively low, demonstrating the wide variability in the presentation of sarcoma. Patients had a variety of recorded problems, not limited to a lump or pain, but including hematologic, gastric, and cardiac concerns, that differed from those who had no suspected sarcoma. These factors highlight the challenges that may be facing patients who have an undetected sarcoma.
An expected finding was the difference in duration of follow-up between cohorts. This could be due to longer survival of those without a sarcoma diagnosis or due to insurance changes among those who had a sarcoma diagnosis. The absence of death data did not allow for further exploration of this finding within this study. Future research may wish to identify more comprehensive datasets to allow for the objective evaluation of the differences in time to diagnosis and stage of disease and survival, which would be the ultimate goal in order to develop potential strategies to improve patient outcomes.
This study was limited in that the sarcoma diagnosis could not be verified in a clinical record due to the de-identified nature of the claims data used for this study. Prior work has shown that the ICD coding for sarcoma is incomplete6,7; therefore it is likely there are many other patients in the claims dataset who had a suspected sarcoma but who did not have a 171.x code recorded. Hence, this study is limited to a comparison of a cohort for whom the provider specified a sarcoma code in their billing records. While there are gaps in the ability to identify the entire population of sarcoma patients, the patients with ICD codes used in this study are likely true sarcoma cases. Prior work has demonstrated that the presence of these codes accurately reflects a true sarcoma diagnosis.7 However, given the concerns with ICD coding, two sarcoma codes were required on unique days to reduce the risk of single rule-out codes or data entry error. Patients diagnosed with sarcoma demonstrate significantly greater health care resource use across variables as matched controls during the 6-month period leading to diagnosis, supporting the observations within advocacy and patient reports of the challenges faced during the process to reach an accurate diagnosis. This work may provide the initial basis for the development of strategies to more rapidly identify a potential sarcoma. Future research could also evaluate more than 6 months prior to diagnosis, to quantify the duration of time during which these differences versus controls may exist. Additionally, the cost of care may be of interest to future research to better quantify the burden of misdiagnosis on the health care system.
Acknowledgement
The authors would like to acknowledge Yun Fang, MS, for her support in the SAS coding for the analysis of this study.
Corresponding Author
Lisa M. Hess, PhD, Eli Lilly and Company. hess_lisa_m@lilly.com
Disclosures
No funding was received or exchanged in the conceptualization, conduct, data collection, analysis, interpretation, or writing related to this study. This unfunded study was conducted by employees of Eli Lilly and Company.
1. ACS. Signs and Symptoms of Soft Tissue Sarcomas. 2018. https://www.cancer.org/cancer/soft-tissue-sarcoma/detection-diagnosis-staging/signs-symptoms.html. Accessed September 27, 2018.
2. SEER. Cancer Stat Facts: Soft Tissue including Heart Cancer. National Cancer Institute Surveillance, Epidemiology, and End Results Program; 2018. https://seer.cancer.gov/statfacts/html/soft.html. Accessed February 20, 2019.
3. Rougraff BT, Davis K, Lawrence J. Does length of symptoms before diagnosis of sarcoma affect patient survival? Clin Orthop Relat Res. 2007;462:181-189.
4. Rougraff BT, Lawrence J, Davis K. Length of symptoms before referral: prognostic variable for high-grade soft tissue sarcoma? Clin Orthop Relat Res. 2012;470(3):706-711.
5. LSSI. Liddy Shriver Sarcoma Initiative. Sarcoma: A diagnosis of patience. http://sarcomahelp.org/articles/patience.html. Accessed September 20, 2018.
6. Hess LM, Zhu EY, Sugihara T, Fang Y, Collins N, Nicol S. Challenges with use of the International Classification of Disease Coding (ICD-9-CM/ICD-10-CM) for soft tissue sarcoma. Perspect Health Inf Manage. 2019;16 (Spring). eCollection 2019.
7. Lyu HG, Stein LA, Saadat LV, Phicil SN, Haider A, Raut CP. Assessment of the accuracy of disease coding among patients diagnosed with sarcoma. JAMA Oncol. 2018;4(9):1293-1295.
Abstract
Introduction: The challenges of diagnosing soft tissue sarcoma are not well studied; however, the heterogeneity of its presentation would suggest that patients may experience a complex journey in the health care system prior to reaching an accurate diagnosis. This study was designed to evaluate the diagnoses, procedures, and health care resource utilization of patients with soft tissue sarcoma compared to a matched healthy control cohort.
Methods: Patients in the sarcoma cohort were identified in claims data by the presence of diagnosis codes for soft tissue sarcoma. Controls were matched using exact methods on demographic, employment, and insurance variables at the date of the index sarcoma diagnosis. Health care resource utilization and diagnosis and procedure codes were compared between the cohorts during the prediagnosis period (6 months prior to the index and matched date). T test was used for continuous variables and Chi-square or Fisher’s exact test was used for categorical variables.
Results: A total of 7826 sarcoma patients were matched to 7826 controls on demographic, employment, and insurance variables. Diagnoses of uncertain neoplasms, limb pain, and hypertension, as well as anemia, neutropenia, thrombocytopenia, cardiac dysrhythmia, cellulitis, constipation, dehydration, diarrhea, dyspnea, edema, fatigue, gangrene, hemorrhage, nausea, pancreatitis, proteinuria, pulmonary fibrosis, rash, renal failure, vomiting, and watery eyes were significantly greater in the sarcoma cohort versus controls (all P <.05). The majority of health care resource utilization evaluated showed statistically higher utilization in the sarcoma cohort versus matched controls.
Conclusions: Sarcoma patients had many health conditions and diagnoses that significantly differed from controls during the 6-month period prior to diagnosis. These data provide initial evidence regarding the quantity and frequency of additional health care resources used and symptoms experienced leading to the diagnosis of sarcoma.
Key words: sarcoma, diagnosis, health care resource utilization, health care economics
The Sarcoma Journal enters its second full year with renewed commitment and energy
We begin this second full year publishing The Sarcoma Journal—Official Journal of the Sarcoma Foundation of AmericaTM—with renewed energy and dedication to its founding principle of communicating authoritative and comprehensive scientific information on the diagnosis and treatment of sarcomas and sarcoma subtypes.
Despite advances in treatment and management options for our patients, the need still exists for more effective treatment strategies, new treatment paradigms, and improved understanding of disease biology. This journal, along with its online platform, plays an important role in the dissemination of reliable, peer-reviewed content to the sarcoma community and aims to bridge the gap between bench and bedside.
To this end, we have again recruited an outstanding advisory board, many of whom have long-standing affiliations with the Sarcoma Foundation of America. With their help, the editorial staff and I will continue to build the journal and make it the number one academic and practice resource for the sarcoma community.
We invite you and your colleagues to submit original research, review articles, case reports, opinion pieces, and meeting summaries for publication. In this way we will create the robust forum we all desire.

Recurrence of a small gastric gastrointestinal stromal tumor with high mitotic index
Gastrointestinal stromal tumor (GIST) is the most common soft tissue sarcoma of the gastrointestinal tract, usually arising from the interstitial cells of Cajal or similar cells in the outer wall of the gastrointestinal tract.1,2 Most GISTs have an activating mutation in KIT or platelet-derived growth factor receptor alpha (PDGFRα). Tumor size, mitotic rate, and anatomic site are the most common pathological features used to risk stratify GIST tumors.3-10 It is important to note when using such risk calculators that preoperative imatinib before determining tumor characteristics (such as mitoses per 50 high-power fields [hpf]) often changes the relevant parameters so that the same risk calculations may not apply. Tumors with a mitotic rate ≤5 mitoses per 50 hpf and a size ≤5 cm in greatest dimension have a lower recurrence rate after resection than tumors with a mitotic rate >5 mitoses per 50 hpf and a size >10 cm, and larger tumors can have a recurrence rate of up to 86%.11,12 Findings from a large observational study have suggested that the prognosis of gastric GIST in Korea and Japan may be more favorable compared with that in Western countries.13
The primary treatment of a localized primary GIST is surgical excision, but a cure is limited by recurrence.14,15 Imatinib is useful in the treatment of metastatic or recurrent GIST, and adjuvant treatment with imatinib after surgery has been shown to improve progression-free and overall survival in some cases.3,16-18 Responses to adjuvant imatinib depend on tumor sensitivity to the drug and the risk of recurrence. Drug sensitivity is largely dependent on the presence of mutations in KIT or PDGFRα.3,18 Recurrence risk is highly dependent on tumor size, tumor site, tumor rupture, and mitotic index.1,3,5,6,8,9,18,19 Findings on the use of gene expression patterns to predict recurrence risk have also been reported.20-27 However, recurrence risk is poorly understood for categories in which there are few cases with known outcomes, such as very small gastric GIST with a high mitotic index. For example, few cases of gastric GIST have been reported with a tumor size ≤2 cm, a mitotic rate >5 mitoses per 50 hpf, and adequate clinical follow-up. In such cases, it is difficult to assess the risk of recurrence.6 We report here the long-term outcome of a patient with a 1.8-cm gastric GIST with a mitotic index of 36 mitoses per 50 hpf and a KIT exon 11 mutation.
Case Presentation and Summary
A 69-year-old man presented with periumbilical and epigastric pain of 6-month duration. His medical history was notable for hyperlipidemia, hypertension, coronary angioplasty, and spinal surgery. He had a 40 pack-year smoking history and consumed 2 to 4 alcoholic drinks per day. The results of a physical examination were unremarkable. A computed tomographic (CT) scan showed no abnormalities. An esophagogastroduodenoscopy (EGD) revealed gastric ulcers. He was treated successfully with omeprazole 20 mg by mouth daily.
A month later, a follow-up EGD revealed a 1.8 x 1.5-cm submucosal mass 3 cm from the gastroesophageal junction. The patient underwent a fundus wedge resection, and a submucosal mass 1.8 cm in greatest dimension was removed. Pathologic examination revealed a GIST, spindle cell type, with a mitotic rate of 36 mitoses per 50 hpf with negative margins. Immunohistochemistry was positive for CD117. An exon 11 deletion (KVV558-560NV) was present in KIT. The patient’s risk of recurrence was unclear, and his follow-up included CT scans of the abdomen and pelvis every 3 to 4 months for the first 2 years, then every 6 months for the next 2.5 years.
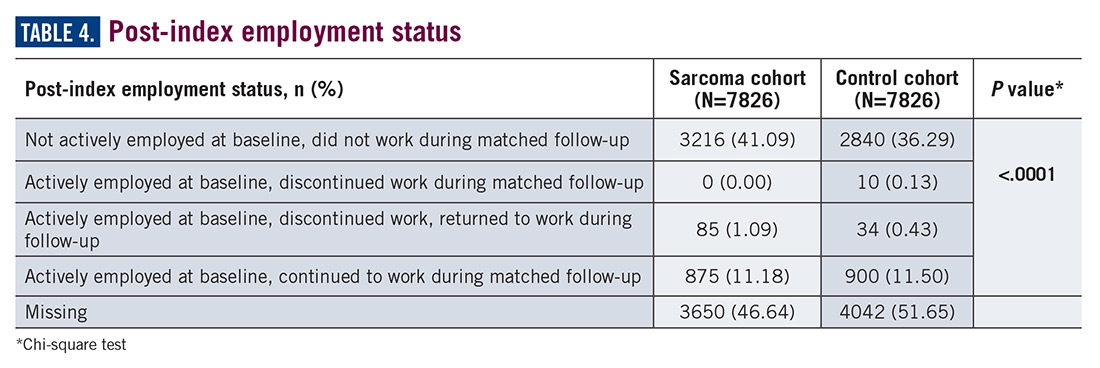
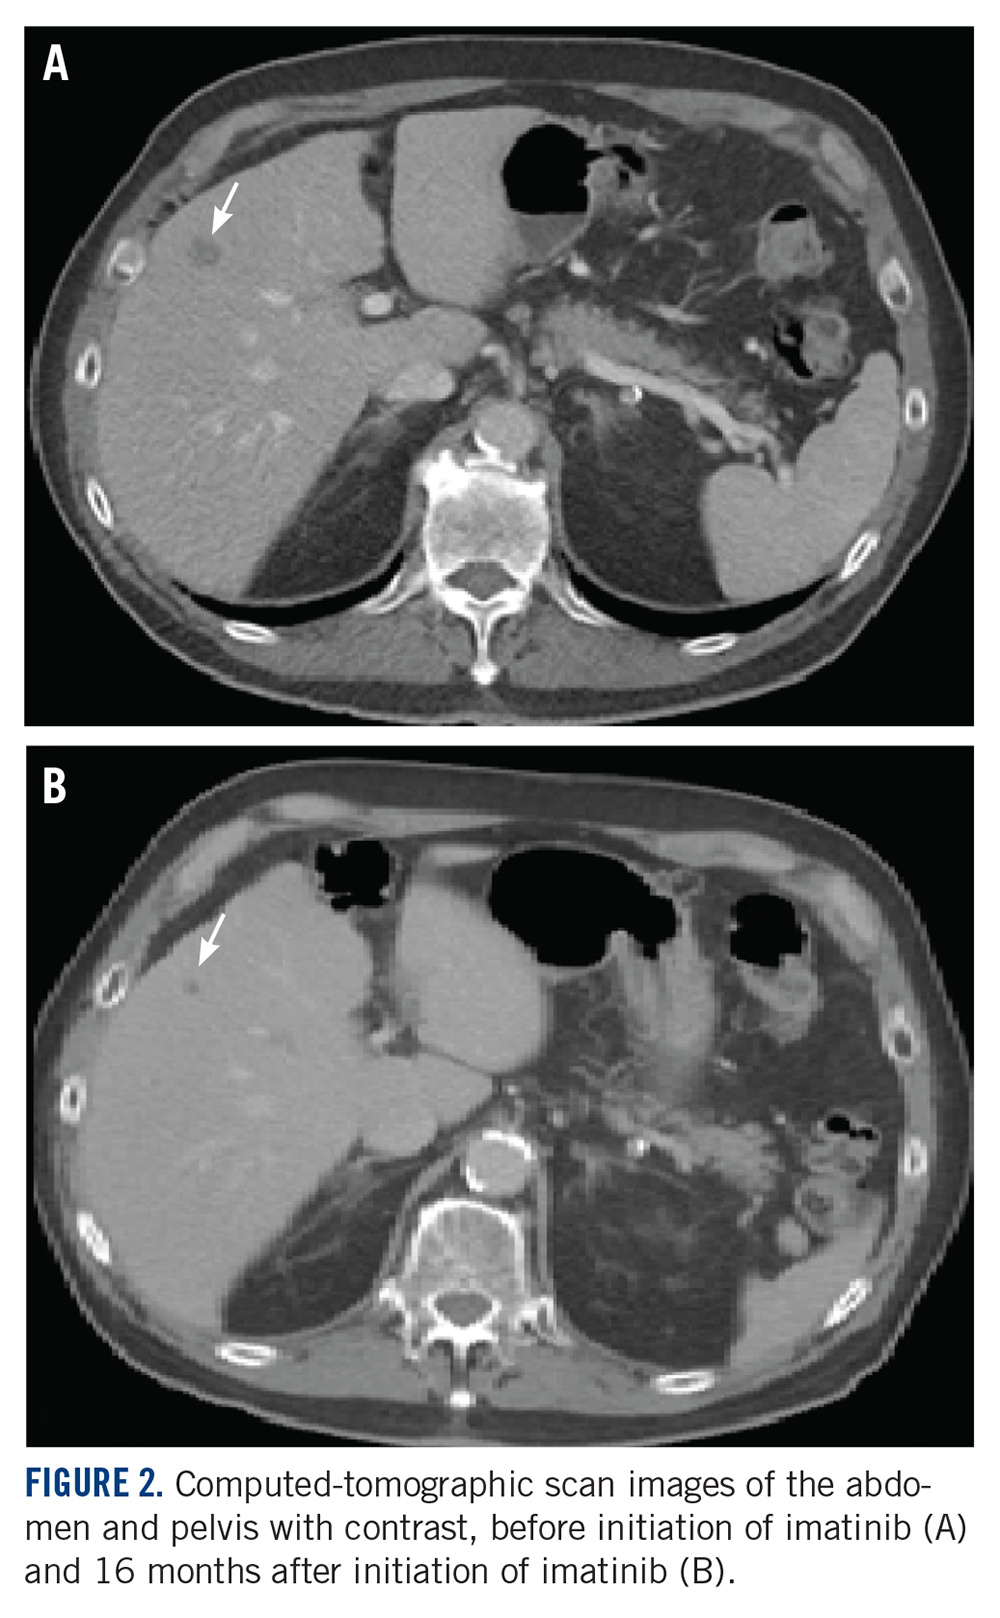
A CT scan about 3.5 years after primary resection revealed small nonspecific liver hypodensities that became more prominent during the next year. About 5 years after primary resection, magnetic resonance imaging (MRI) revealed several liver lesions, the largest of which measured 1.3 cm in greatest dimension. The patient’s liver metastases were readily identified by MRI (Figure 1) and CT imaging (Figure 2A). 
Discussion
Small gastric GISTs are sometimes found by endoscopy performed for unrelated reasons. Recent data suggest that the incidence of gastric GIST may be higher than previously thought. In a Japanese study of patients with gastric cancer in which 100 stomachs were systematically examined pathologically, 50 microscopic GISTs were found in 35 patients.28 Most small gastric GISTs have a low mitotic index. Few cases have been described with a high mitotic index. In a study of 1765 cases of GIST of the stomach, 8 patients had a tumor size less than 2 cm and a mitotic index greater than 5. Of those, only 6 patients had long-term follow-up, and 3 were alive without disease at 2, 17, and 20 years of follow-up.7 These limited data make it impossible to predict outcomes in patients with small gastric GIST with a high mitotic index.
For patients who are at high risk of recurrence after surgery, 3 years of adjuvant imatinib treatment compared with 1 year has been shown to improve overall survival and is the current standard of care.10,17 A study comparing 5 and 3 years of imatinib is ongoing to establish whether a longer period of adjuvant treatment is warranted. In patients with metastatic GIST, lifelong imatinib until lack of benefit is considered optimal treatment.10 All patients should undergo KIT mutation analysis. Those with the PDGFRα D842V mutation, SDH (succinate dehydrogenase) deficiency, or neurofibromatosis-related GIST should not receive adjuvant imatinib.
This case has several unusual features. The small tumor size with a very high mitotic rate is rare. Such cases have not been reported in large numbers and have therefore not been reliably incorporated into risk prediction algorithms. In addition, despite a high mitotic index, the tumor was not FDG avid on PET imaging. The diagnosis of GIST is strongly supported by the KIT mutation and response to imatinib. This particular KIT mutation in larger GISTs is associated with aggressive disease. The present case adds to the data on the biology of small gastric GISTs with a high mitotic index and suggests the mitotic index in these tumors may be a more important predictor than size. TSJ
Acknowlegement
The authors thank Michael Franklin, MS, for editorial assistance, and Sabrina Porter for media edits.
aDepartment of Medicine, University of Minnesota Medical School; bDepartment of Laboratory Medicine and Pathology, University of Minnesota Medical School; and cMasonic Cancer Center, University of Minnesota Medical School, Minneapolis, Minnesota.
Disclosures
The authors report no disclosures or conflicts of interest. This article was originally published in The Journal of Community and Supportive Oncology JCSO. 2018;16(3):e163-e166. ©Frontline Medical Communications. doi:10.12788/jcso.0402. It is reproduced with permission from the copyright owner. Further reproduction prohibited without permission.
1. Corless CL, Barnett CM, Heinrich MC. Gastrointestinal stromal tumours: origin and molecular oncology. Nat Rev Cancer. 2011;11(12):865-878.
2. Hirota S, Isozaki K, Moriyama Y, Hashimoto K, Nishida T, Ishiguro S, et al. Gain-of-function mutations of c-kit in human gastrointestinal stromal tumors. Science. 1998;279(5350):577-580.
3. Corless CL, Ballman KV, Antonescu CR, Kolesnikova V, Maki RG, Pisters PW, et al. Pathologic and molecular features correlate with long-term outcome after adjuvant therapy of resected primary GI stromal tumor: the ACOSOG Z9001 trial. J Clin Oncol. 2014;32(15):1563-1570.
4. Huang J, Zheng DL, Qin FS, Cheng N, Chen H, Wan BB, et al. Genetic and epigenetic silencing of SCARA5 may contribute to human hepatocellular carcinoma by activating FAK signaling. J Clin Invest. 2010;120(1):223-241.
5. Joensuu H, Vehtari A, Riihimaki J, Nishida T, Steigen SE, Brabec P, et al. Risk of recurrence of gastrointestinal stromal tumour after surgery: an analysis of pooled population-based cohorts. Lancet Oncol. 2012;13(3):265-274.
6. Miettinen M, Lasota J. Gastrointestinal stromal tumors: review on morphology, molecular pathology, prognosis, and differential diagnosis. Arch Pathol Lab Med. 2006;130(10):1466-1478.
7. Miettinen M, Sobin LH, Lasota J. Gastrointestinal stromal tumors of the stomach: a clinicopathologic, immunohistochemical, and molecular genetic study of 1765 cases with long-term follow-up. Am J Surg Pathol. 2005;29(1):52-68.
8. Patel S. Navigating risk stratification systems for the management of patients with GIST. Ann Surg Oncol. 2011;18(6):1698-1704.
9. Rossi S, Miceli R, Messerini L, Bearzi I, Mazzoleni G, Capella C, et al. Natural history of imatinib-naive GISTs: a retrospective analysis of 929 cases with long-term follow-up and development of a survival nomogram based on mitotic index and size as continuous variables. Am J Surg Pathol. 2011;35(11):1646-1656.
10. National Comprehensive Cancer Network. Sarcoma. https://www.nccn.org/professionals/physician_gls/default.aspx#age. Accessed March 27, 2018.
11. Fletcher CD, Berman JJ, Corless C, Gorstein F, Lasota J, Longley BJ, et al. Diagnosis of gastrointestinal stromal tumors: a consensus approach. Int J Surg Pathol. 2002;10(2):81-89.
12. Huang HY, Li CF, Huang WW, Hu TH, Lin CN, Uen YH, et al. A modification of NIH consensus criteria to better distinguish the highly lethal subset of primary localized gastrointestinal stromal tumors: a subdivision of the original high-risk group on the basis of outcome. Surgery. 2007;141(6):748-756.
13. Kim MC, Yook JH, Yang HK, Lee HJ, Sohn TS, Hyung WJ, et al. Long-term surgical outcome of 1057 gastric GISTs according to 7th UICC/AJCC TNM system: multicenter observational study from Korea and Japan. Medicine (Baltimore). 2015;94(41):e1526.
14. Casali PG, Blay JY; ESMO/CONTICANET/EUROBONET Consensus Panel of experts. Soft tissue sarcomas: ESMO Clinical Practice Guidelines for diagnosis, treatment and follow-up. Ann Oncol. 2010;21(Suppl 5):v198-v203.
15. Joensuu H, DeMatteo RP. The management of gastrointestinal stromal tumors: a model for targeted and multidisciplinary therapy of malignancy. Annu Rev Med. 2012;63:247-258.
16. Dematteo RP, Ballman KV, Antonescu CR, Maki RG, Pisters PW, Demetri GD, et al. Adjuvant imatinib mesylate after resection of localised, primary gastrointestinal stromal tumour: a randomised, double-blind, placebo-controlled trial. Lancet. 2009;373(9669):1097-1104.
17. Joensuu H, Eriksson M, Sundby Hall K, Hartmann JT, Pink D, Schütte J, et al. One vs three years of adjuvant imatinib for operable gastrointestinal stromal tumor: a randomized trial. JAMA. 2012;307(12):1265-1272.
18. Joensuu H, Rutkowski P, Nishida T, Steigen SE, Brabec P, Plank L, et al. KIT and PDGFRA mutations and the risk of GI stromal tumor recurrence. J Clin Oncol. 2015;33(6):634-642.
19. Fletcher CD, Berman JJ, Corless C, Gorstein F, Lasota J, Longley BJ, et al. Diagnosis of gastrointestinal stromal tumors: A consensus approach. Hum Pathol. 2002;33(5):459-465.
20. Antonescu CR, Viale A, Sarran L, Tschernyavsky SJ, Gonen M, Segal NH, et al. Gene expression in gastrointestinal stromal tumors is distinguished by KIT genotype and anatomic site. Clin Cancer Res. 2004;10(10):3282-3290.
21. Arne G, Kristiansson E, Nerman O, Kindblom LG, Ahlman H, Nilsson B, et al. Expression profiling of GIST: CD133 is associated with KIT exon 11 mutations, gastric location and poor prognosis. Int J Cancer. 2011;129(5):1149-1161.
22. Bertucci F, Finetti P, Ostrowski J, Kim WK, Kim H, Pantaleo MA, et al. Genomic Grade Index predicts postoperative clinical outcome of GIST. Br J Cancer. 2012;107(8):1433-1441.
23. Koon N, Schneider-Stock R, Sarlomo-Rikala M, Lasota J, Smolkin M, Petroni G, et al. Molecular targets for tumour progression in gastrointestinal stromal tumours. Gut. 2004;53(2):235-240.
24. Lagarde P, Perot G, Kauffmann A, Brulard C, Dapremont V, Hostein I, et al. Mitotic checkpoints and chromosome instability are strong predictors of clinical outcome in gastrointestinal stromal tumors. Clin Cancer Res. 2012;18(3):826-838.
25. Skubitz KM, Geschwind K, Xu WW, Koopmeiners JS, Skubitz AP. Gene expression identifies heterogeneity of metastatic behavior among gastrointestinal stromal tumors. J Transl Med. 2016;14:51.
26. Yamaguchi U, Nakayama R, Honda K, Ichikawa H, Haseqawa T, Shitashige M, et al. Distinct gene expression-defined classes of gastrointestinal stromal tumor. J Clin Oncol. 2008;26(25):4100-4108.
27. Ylipaa A, Hunt KK, Yang J, Lazar AJ, Torres KE, Lev DC, et al. Integrative genomic characterization and a genomic staging system for gastrointestinal stromal tumors. Cancer. 2011;117(2):380-389.
28. Kawanowa K, Sakuma Y, Sakurai S, Hishima T, Iwasaki Y, Saito K, et al. High incidence of microscopic gastrointestinal stromal tumors in the stomach. Hum Pathol. 2006;37(12):1527-1535.
Gastrointestinal stromal tumor (GIST) is the most common soft tissue sarcoma of the gastrointestinal tract, usually arising from the interstitial cells of Cajal or similar cells in the outer wall of the gastrointestinal tract.1,2 Most GISTs have an activating mutation in KIT or platelet-derived growth factor receptor alpha (PDGFRα). Tumor size, mitotic rate, and anatomic site are the most common pathological features used to risk stratify GIST tumors.3-10 It is important to note when using such risk calculators that preoperative imatinib before determining tumor characteristics (such as mitoses per 50 high-power fields [hpf]) often changes the relevant parameters so that the same risk calculations may not apply. Tumors with a mitotic rate ≤5 mitoses per 50 hpf and a size ≤5 cm in greatest dimension have a lower recurrence rate after resection than tumors with a mitotic rate >5 mitoses per 50 hpf and a size >10 cm, and larger tumors can have a recurrence rate of up to 86%.11,12 Findings from a large observational study have suggested that the prognosis of gastric GIST in Korea and Japan may be more favorable compared with that in Western countries.13
The primary treatment of a localized primary GIST is surgical excision, but a cure is limited by recurrence.14,15 Imatinib is useful in the treatment of metastatic or recurrent GIST, and adjuvant treatment with imatinib after surgery has been shown to improve progression-free and overall survival in some cases.3,16-18 Responses to adjuvant imatinib depend on tumor sensitivity to the drug and the risk of recurrence. Drug sensitivity is largely dependent on the presence of mutations in KIT or PDGFRα.3,18 Recurrence risk is highly dependent on tumor size, tumor site, tumor rupture, and mitotic index.1,3,5,6,8,9,18,19 Findings on the use of gene expression patterns to predict recurrence risk have also been reported.20-27 However, recurrence risk is poorly understood for categories in which there are few cases with known outcomes, such as very small gastric GIST with a high mitotic index. For example, few cases of gastric GIST have been reported with a tumor size ≤2 cm, a mitotic rate >5 mitoses per 50 hpf, and adequate clinical follow-up. In such cases, it is difficult to assess the risk of recurrence.6 We report here the long-term outcome of a patient with a 1.8-cm gastric GIST with a mitotic index of 36 mitoses per 50 hpf and a KIT exon 11 mutation.
Case Presentation and Summary
A 69-year-old man presented with periumbilical and epigastric pain of 6-month duration. His medical history was notable for hyperlipidemia, hypertension, coronary angioplasty, and spinal surgery. He had a 40 pack-year smoking history and consumed 2 to 4 alcoholic drinks per day. The results of a physical examination were unremarkable. A computed tomographic (CT) scan showed no abnormalities. An esophagogastroduodenoscopy (EGD) revealed gastric ulcers. He was treated successfully with omeprazole 20 mg by mouth daily.
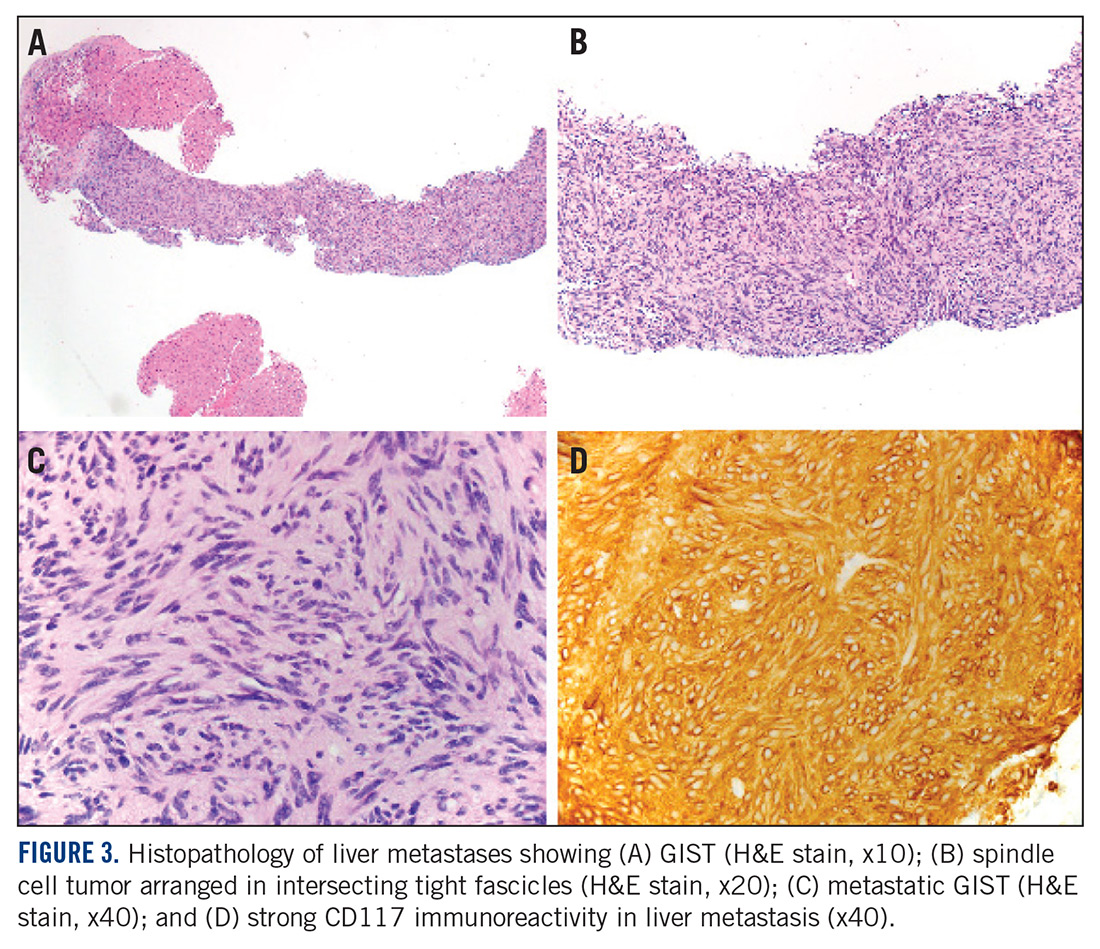
A month later, a follow-up EGD revealed a 1.8 x 1.5-cm submucosal mass 3 cm from the gastroesophageal junction. The patient underwent a fundus wedge resection, and a submucosal mass 1.8 cm in greatest dimension was removed. Pathologic examination revealed a GIST, spindle cell type, with a mitotic rate of 36 mitoses per 50 hpf with negative margins. Immunohistochemistry was positive for CD117. An exon 11 deletion (KVV558-560NV) was present in KIT. The patient’s risk of recurrence was unclear, and his follow-up included CT scans of the abdomen and pelvis every 3 to 4 months for the first 2 years, then every 6 months for the next 2.5 years.
A CT scan about 3.5 years after primary resection revealed small nonspecific liver hypodensities that became more prominent during the next year. About 5 years after primary resection, magnetic resonance imaging (MRI) revealed several liver lesions, the largest of which measured 1.3 cm in greatest dimension. The patient’s liver metastases were readily identified by MRI (Figure 1) and CT imaging (Figure 2A).
Discussion
Small gastric GISTs are sometimes found by endoscopy performed for unrelated reasons. Recent data suggest that the incidence of gastric GIST may be higher than previously thought. In a Japanese study of patients with gastric cancer in which 100 stomachs were systematically examined pathologically, 50 microscopic GISTs were found in 35 patients.28 Most small gastric GISTs have a low mitotic index. Few cases have been described with a high mitotic index. In a study of 1765 cases of GIST of the stomach, 8 patients had a tumor size less than 2 cm and a mitotic index greater than 5. Of those, only 6 patients had long-term follow-up, and 3 were alive without disease at 2, 17, and 20 years of follow-up.7 These limited data make it impossible to predict outcomes in patients with small gastric GIST with a high mitotic index.
For patients who are at high risk of recurrence after surgery, 3 years of adjuvant imatinib treatment compared with 1 year has been shown to improve overall survival and is the current standard of care.10,17 A study comparing 5 and 3 years of imatinib is ongoing to establish whether a longer period of adjuvant treatment is warranted. In patients with metastatic GIST, lifelong imatinib until lack of benefit is considered optimal treatment.10 All patients should undergo KIT mutation analysis. Those with the PDGFRα D842V mutation, SDH (succinate dehydrogenase) deficiency, or neurofibromatosis-related GIST should not receive adjuvant imatinib.
This case has several unusual features. The small tumor size with a very high mitotic rate is rare. Such cases have not been reported in large numbers and have therefore not been reliably incorporated into risk prediction algorithms. In addition, despite a high mitotic index, the tumor was not FDG avid on PET imaging. The diagnosis of GIST is strongly supported by the KIT mutation and response to imatinib. This particular KIT mutation in larger GISTs is associated with aggressive disease. The present case adds to the data on the biology of small gastric GISTs with a high mitotic index and suggests the mitotic index in these tumors may be a more important predictor than size. TSJ
Acknowlegement
The authors thank Michael Franklin, MS, for editorial assistance, and Sabrina Porter for media edits.
aDepartment of Medicine, University of Minnesota Medical School; bDepartment of Laboratory Medicine and Pathology, University of Minnesota Medical School; and cMasonic Cancer Center, University of Minnesota Medical School, Minneapolis, Minnesota.
Disclosures
The authors report no disclosures or conflicts of interest. This article was originally published in The Journal of Community and Supportive Oncology JCSO. 2018;16(3):e163-e166. ©Frontline Medical Communications. doi:10.12788/jcso.0402. It is reproduced with permission from the copyright owner. Further reproduction prohibited without permission.
Gastrointestinal stromal tumor (GIST) is the most common soft tissue sarcoma of the gastrointestinal tract, usually arising from the interstitial cells of Cajal or similar cells in the outer wall of the gastrointestinal tract.1,2 Most GISTs have an activating mutation in KIT or platelet-derived growth factor receptor alpha (PDGFRα). Tumor size, mitotic rate, and anatomic site are the most common pathological features used to risk stratify GIST tumors.3-10 It is important to note when using such risk calculators that preoperative imatinib before determining tumor characteristics (such as mitoses per 50 high-power fields [hpf]) often changes the relevant parameters so that the same risk calculations may not apply. Tumors with a mitotic rate ≤5 mitoses per 50 hpf and a size ≤5 cm in greatest dimension have a lower recurrence rate after resection than tumors with a mitotic rate >5 mitoses per 50 hpf and a size >10 cm, and larger tumors can have a recurrence rate of up to 86%.11,12 Findings from a large observational study have suggested that the prognosis of gastric GIST in Korea and Japan may be more favorable compared with that in Western countries.13
The primary treatment of a localized primary GIST is surgical excision, but a cure is limited by recurrence.14,15 Imatinib is useful in the treatment of metastatic or recurrent GIST, and adjuvant treatment with imatinib after surgery has been shown to improve progression-free and overall survival in some cases.3,16-18 Responses to adjuvant imatinib depend on tumor sensitivity to the drug and the risk of recurrence. Drug sensitivity is largely dependent on the presence of mutations in KIT or PDGFRα.3,18 Recurrence risk is highly dependent on tumor size, tumor site, tumor rupture, and mitotic index.1,3,5,6,8,9,18,19 Findings on the use of gene expression patterns to predict recurrence risk have also been reported.20-27 However, recurrence risk is poorly understood for categories in which there are few cases with known outcomes, such as very small gastric GIST with a high mitotic index. For example, few cases of gastric GIST have been reported with a tumor size ≤2 cm, a mitotic rate >5 mitoses per 50 hpf, and adequate clinical follow-up. In such cases, it is difficult to assess the risk of recurrence.6 We report here the long-term outcome of a patient with a 1.8-cm gastric GIST with a mitotic index of 36 mitoses per 50 hpf and a KIT exon 11 mutation.
Case Presentation and Summary
A 69-year-old man presented with periumbilical and epigastric pain of 6-month duration. His medical history was notable for hyperlipidemia, hypertension, coronary angioplasty, and spinal surgery. He had a 40 pack-year smoking history and consumed 2 to 4 alcoholic drinks per day. The results of a physical examination were unremarkable. A computed tomographic (CT) scan showed no abnormalities. An esophagogastroduodenoscopy (EGD) revealed gastric ulcers. He was treated successfully with omeprazole 20 mg by mouth daily.
A month later, a follow-up EGD revealed a 1.8 x 1.5-cm submucosal mass 3 cm from the gastroesophageal junction. The patient underwent a fundus wedge resection, and a submucosal mass 1.8 cm in greatest dimension was removed. Pathologic examination revealed a GIST, spindle cell type, with a mitotic rate of 36 mitoses per 50 hpf with negative margins. Immunohistochemistry was positive for CD117. An exon 11 deletion (KVV558-560NV) was present in KIT. The patient’s risk of recurrence was unclear, and his follow-up included CT scans of the abdomen and pelvis every 3 to 4 months for the first 2 years, then every 6 months for the next 2.5 years.
A CT scan about 3.5 years after primary resection revealed small nonspecific liver hypodensities that became more prominent during the next year. About 5 years after primary resection, magnetic resonance imaging (MRI) revealed several liver lesions, the largest of which measured 1.3 cm in greatest dimension. The patient’s liver metastases were readily identified by MRI (Figure 1) and CT imaging (Figure 2A).
Discussion
Small gastric GISTs are sometimes found by endoscopy performed for unrelated reasons. Recent data suggest that the incidence of gastric GIST may be higher than previously thought. In a Japanese study of patients with gastric cancer in which 100 stomachs were systematically examined pathologically, 50 microscopic GISTs were found in 35 patients.28 Most small gastric GISTs have a low mitotic index. Few cases have been described with a high mitotic index. In a study of 1765 cases of GIST of the stomach, 8 patients had a tumor size less than 2 cm and a mitotic index greater than 5. Of those, only 6 patients had long-term follow-up, and 3 were alive without disease at 2, 17, and 20 years of follow-up.7 These limited data make it impossible to predict outcomes in patients with small gastric GIST with a high mitotic index.
For patients who are at high risk of recurrence after surgery, 3 years of adjuvant imatinib treatment compared with 1 year has been shown to improve overall survival and is the current standard of care.10,17 A study comparing 5 and 3 years of imatinib is ongoing to establish whether a longer period of adjuvant treatment is warranted. In patients with metastatic GIST, lifelong imatinib until lack of benefit is considered optimal treatment.10 All patients should undergo KIT mutation analysis. Those with the PDGFRα D842V mutation, SDH (succinate dehydrogenase) deficiency, or neurofibromatosis-related GIST should not receive adjuvant imatinib.
This case has several unusual features. The small tumor size with a very high mitotic rate is rare. Such cases have not been reported in large numbers and have therefore not been reliably incorporated into risk prediction algorithms. In addition, despite a high mitotic index, the tumor was not FDG avid on PET imaging. The diagnosis of GIST is strongly supported by the KIT mutation and response to imatinib. This particular KIT mutation in larger GISTs is associated with aggressive disease. The present case adds to the data on the biology of small gastric GISTs with a high mitotic index and suggests the mitotic index in these tumors may be a more important predictor than size. TSJ
Acknowlegement
The authors thank Michael Franklin, MS, for editorial assistance, and Sabrina Porter for media edits.
aDepartment of Medicine, University of Minnesota Medical School; bDepartment of Laboratory Medicine and Pathology, University of Minnesota Medical School; and cMasonic Cancer Center, University of Minnesota Medical School, Minneapolis, Minnesota.
Disclosures
The authors report no disclosures or conflicts of interest. This article was originally published in The Journal of Community and Supportive Oncology JCSO. 2018;16(3):e163-e166. ©Frontline Medical Communications. doi:10.12788/jcso.0402. It is reproduced with permission from the copyright owner. Further reproduction prohibited without permission.
1. Corless CL, Barnett CM, Heinrich MC. Gastrointestinal stromal tumours: origin and molecular oncology. Nat Rev Cancer. 2011;11(12):865-878.
2. Hirota S, Isozaki K, Moriyama Y, Hashimoto K, Nishida T, Ishiguro S, et al. Gain-of-function mutations of c-kit in human gastrointestinal stromal tumors. Science. 1998;279(5350):577-580.
3. Corless CL, Ballman KV, Antonescu CR, Kolesnikova V, Maki RG, Pisters PW, et al. Pathologic and molecular features correlate with long-term outcome after adjuvant therapy of resected primary GI stromal tumor: the ACOSOG Z9001 trial. J Clin Oncol. 2014;32(15):1563-1570.
4. Huang J, Zheng DL, Qin FS, Cheng N, Chen H, Wan BB, et al. Genetic and epigenetic silencing of SCARA5 may contribute to human hepatocellular carcinoma by activating FAK signaling. J Clin Invest. 2010;120(1):223-241.
5. Joensuu H, Vehtari A, Riihimaki J, Nishida T, Steigen SE, Brabec P, et al. Risk of recurrence of gastrointestinal stromal tumour after surgery: an analysis of pooled population-based cohorts. Lancet Oncol. 2012;13(3):265-274.
6. Miettinen M, Lasota J. Gastrointestinal stromal tumors: review on morphology, molecular pathology, prognosis, and differential diagnosis. Arch Pathol Lab Med. 2006;130(10):1466-1478.
7. Miettinen M, Sobin LH, Lasota J. Gastrointestinal stromal tumors of the stomach: a clinicopathologic, immunohistochemical, and molecular genetic study of 1765 cases with long-term follow-up. Am J Surg Pathol. 2005;29(1):52-68.
8. Patel S. Navigating risk stratification systems for the management of patients with GIST. Ann Surg Oncol. 2011;18(6):1698-1704.
9. Rossi S, Miceli R, Messerini L, Bearzi I, Mazzoleni G, Capella C, et al. Natural history of imatinib-naive GISTs: a retrospective analysis of 929 cases with long-term follow-up and development of a survival nomogram based on mitotic index and size as continuous variables. Am J Surg Pathol. 2011;35(11):1646-1656.
10. National Comprehensive Cancer Network. Sarcoma. https://www.nccn.org/professionals/physician_gls/default.aspx#age. Accessed March 27, 2018.
11. Fletcher CD, Berman JJ, Corless C, Gorstein F, Lasota J, Longley BJ, et al. Diagnosis of gastrointestinal stromal tumors: a consensus approach. Int J Surg Pathol. 2002;10(2):81-89.
12. Huang HY, Li CF, Huang WW, Hu TH, Lin CN, Uen YH, et al. A modification of NIH consensus criteria to better distinguish the highly lethal subset of primary localized gastrointestinal stromal tumors: a subdivision of the original high-risk group on the basis of outcome. Surgery. 2007;141(6):748-756.
13. Kim MC, Yook JH, Yang HK, Lee HJ, Sohn TS, Hyung WJ, et al. Long-term surgical outcome of 1057 gastric GISTs according to 7th UICC/AJCC TNM system: multicenter observational study from Korea and Japan. Medicine (Baltimore). 2015;94(41):e1526.
14. Casali PG, Blay JY; ESMO/CONTICANET/EUROBONET Consensus Panel of experts. Soft tissue sarcomas: ESMO Clinical Practice Guidelines for diagnosis, treatment and follow-up. Ann Oncol. 2010;21(Suppl 5):v198-v203.
15. Joensuu H, DeMatteo RP. The management of gastrointestinal stromal tumors: a model for targeted and multidisciplinary therapy of malignancy. Annu Rev Med. 2012;63:247-258.
16. Dematteo RP, Ballman KV, Antonescu CR, Maki RG, Pisters PW, Demetri GD, et al. Adjuvant imatinib mesylate after resection of localised, primary gastrointestinal stromal tumour: a randomised, double-blind, placebo-controlled trial. Lancet. 2009;373(9669):1097-1104.
17. Joensuu H, Eriksson M, Sundby Hall K, Hartmann JT, Pink D, Schütte J, et al. One vs three years of adjuvant imatinib for operable gastrointestinal stromal tumor: a randomized trial. JAMA. 2012;307(12):1265-1272.
18. Joensuu H, Rutkowski P, Nishida T, Steigen SE, Brabec P, Plank L, et al. KIT and PDGFRA mutations and the risk of GI stromal tumor recurrence. J Clin Oncol. 2015;33(6):634-642.
19. Fletcher CD, Berman JJ, Corless C, Gorstein F, Lasota J, Longley BJ, et al. Diagnosis of gastrointestinal stromal tumors: A consensus approach. Hum Pathol. 2002;33(5):459-465.
20. Antonescu CR, Viale A, Sarran L, Tschernyavsky SJ, Gonen M, Segal NH, et al. Gene expression in gastrointestinal stromal tumors is distinguished by KIT genotype and anatomic site. Clin Cancer Res. 2004;10(10):3282-3290.
21. Arne G, Kristiansson E, Nerman O, Kindblom LG, Ahlman H, Nilsson B, et al. Expression profiling of GIST: CD133 is associated with KIT exon 11 mutations, gastric location and poor prognosis. Int J Cancer. 2011;129(5):1149-1161.
22. Bertucci F, Finetti P, Ostrowski J, Kim WK, Kim H, Pantaleo MA, et al. Genomic Grade Index predicts postoperative clinical outcome of GIST. Br J Cancer. 2012;107(8):1433-1441.
23. Koon N, Schneider-Stock R, Sarlomo-Rikala M, Lasota J, Smolkin M, Petroni G, et al. Molecular targets for tumour progression in gastrointestinal stromal tumours. Gut. 2004;53(2):235-240.
24. Lagarde P, Perot G, Kauffmann A, Brulard C, Dapremont V, Hostein I, et al. Mitotic checkpoints and chromosome instability are strong predictors of clinical outcome in gastrointestinal stromal tumors. Clin Cancer Res. 2012;18(3):826-838.
25. Skubitz KM, Geschwind K, Xu WW, Koopmeiners JS, Skubitz AP. Gene expression identifies heterogeneity of metastatic behavior among gastrointestinal stromal tumors. J Transl Med. 2016;14:51.
26. Yamaguchi U, Nakayama R, Honda K, Ichikawa H, Haseqawa T, Shitashige M, et al. Distinct gene expression-defined classes of gastrointestinal stromal tumor. J Clin Oncol. 2008;26(25):4100-4108.
27. Ylipaa A, Hunt KK, Yang J, Lazar AJ, Torres KE, Lev DC, et al. Integrative genomic characterization and a genomic staging system for gastrointestinal stromal tumors. Cancer. 2011;117(2):380-389.
28. Kawanowa K, Sakuma Y, Sakurai S, Hishima T, Iwasaki Y, Saito K, et al. High incidence of microscopic gastrointestinal stromal tumors in the stomach. Hum Pathol. 2006;37(12):1527-1535.
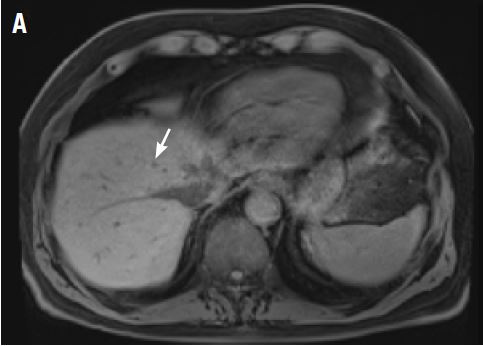
POEM outcomes ‘outstanding’ in achalasia with long-term follow-up
PHILADELPHIA – , Stavros N. Stavropoulos, MD, said at a meeting jointly provided by Rutgers and Global Academy for Medical Education.
“POEM represents a first-line treatment option for achalasia that has equivalent or superior efficacy to Heller [myotomy],” said Dr. Stavropoulos, MD, director of the program in advanced GI endoscopy at NYU Winthrop Hospital, Mineola, N.Y.
Although POEM is associated with more gastrointestinal reflux disease (GERD) than laparoscopic Heller myotomy, there is some evidence that the advantage of Heller in this respect may decrease over time, he told attendees.
“GERD after POEM is easily treatable with proton pump inhibitors (PPIs), with good patient satisfaction and no significant long-term GERD complications,” Dr. Stavropoulos said in a presentation on minimally invasive approaches to esophageal disorders.
NYU Winthrop Hospital was the site of the first human POEM outside of Japan, performed in 2009 by Dr. Stavropoulos, who along with colleagues recently published what he said is the largest single-operator POEM series in the Western hemisphere.
That report in Gastrointestinal Endoscopy (2018 Apr;87[4]:972-85) was based on 318 consecutive POEMs performed through October 2016. Dr. Stavropoulos and colleagues reported that over a median follow-up of 28 months they had a 95.7% clinical success rate, defined as a Eckardt score of 3 or more and no further treatment needed.
Those results suggested POEM should be a “treatment of choice” for challenging cases managed at centers who have a high level of experience with the procedure, the investigators said at the time.
Dr. Stavropoulos presented his center’s updated experience including 515 patients undergoing POEM, with a median follow-up of 37 months. About 50% of the patients were previously treated, including 73 (14% who underwent Heller myotomy).
Mean Eckardt scores were 7.7 preprocedure and 0.5 post procedure, while on timed barium swallow, emptying of 50% or greater at 5 minutes was seen in 96% of patients, and 100% emptying at 5 minutes was seen in 68%, according to data Dr. Stavropoulos presented.
Disease-free probability was 99% at 1 year and 90% at 5 years, he added.
There were no deaths, leaks, aborted procedures, or need for drains in this series, according to the investigator. Three percent of patients had a hospitalization exceeding 5 days, while 1% were readmitted because of minor adverse events related to POEM, such as dehydration, Dr. Stavropoulos reported.
In 2017, the American Gastroenterological Association published a clinical practice update “legitimizing” POEM as a first-line achalasia treatment, Dr. Stavropoulos said. That update said POEM should be performed in high-volume centers by experienced physicians.
Patients who experience GERD after POEM can be effectively treated with standard, once-daily PPI therapy, according to the expert.
“The absolute difference in GERD rates between laparoscopic Heller myotomy and POEM is 20%-25% at 1 year, but may decrease with time, and may be associated with inferior dysphagia relief in LHM patients,” Dr. Stavropoulos told attendees.
Dr. Stavropoulos disclosed that he is a consultant for Boston Scientific and ERBE.
Global Academy and this news organization are owned by the same company.
REPORTING FROM DIGESTIVE DISEASES: NEW ADVANCES
Psychiatrists sue ABPN over its MOC process
Two psychiatrists are suing the American Board of Psychiatry and Neurology (ABPN) over its maintenance of certification program, contending that the board has created a monopoly over the MOC market and that its process violates antitrust laws.

The lawsuit, filed March 6 in U.S. District Court for the Northern District of Illinois, alleges that the board is illegally tying its initial certification product to its MOC product, and that ABPN is using anticompetitive actions to prevent and limit competition from new MOC providers. The suit is filed as a class action on behalf of all psychiatrists and neurologists required by ABPN to buy MOC to maintain their certifications. The plaintiffs seek damages and injunctive relief arising from the alleged violations.
In an interview, ABPN President and CEO Larry R. Faulkner, MD, said the legal challenge has no merit.
“The ABPN intends to defend itself vigorously and anticipates that, like other similar cases previously filed against the American Board of Medical Specialties and other member boards, this lawsuit will be dismissed.”
Plaintiff Emily Lazarou, MD, an Odessa, Fla.-based psychiatrist, did not return messages seeking comment. The other plaintiff, Aafaque Akhter, MD, a psychiatrist based in Norton, Mass., declined to comment at the advice of his attorneys. In a LinkedIn post, Dr. Akhter wrote that he filed the class action to put an end to MOC.
“This moneymaking operation has to be abolished,” he wrote in the post. “MOC has to go.
The 35-page complaint against the ABPN contends that the organization’s antitrust and monopolistic actions have resulted in overly burdensome conditions for physicians forced to buy MOC, and that the board’s requirements constrain the supply of psychiatrists and neurologists, thereby harming competition. The ABPN has made tens of millions of dollars in MOC revenue from psychiatrists and neurologists, the suit alleges, while physicians face countless hours away from their practice and families in order to meet MOC demands, to the physicians’ financial detriment. The challenge also asserts that ABPN’s grandfather clause – which exempts from MOC physicians who received initial certifications prior to Oct. 1, 1994 – discriminates against younger physicians, women, and persons of color, all of whom are underrepresented in the group of psychiatrists and neurologists grandfathered by ABPN.
The lawsuit details how MOC has personally and professionally affected the plaintiffs. In 2017, Dr. Lazarou, a forensic psychiatrist who also practices telepsychiatry, asked the ABPN in advance for a private room during her upcoming 10-year MOC examination. At the time, Dr. Lazarou was nursing her twin newborns and needed the private room to pump, according to the lawsuit. The suit alleges that ABPN would not make an accommodation for Dr. Lazarou to pump at the testing site; however, as a professional courtesy, board officials allowed her to travel to a test center farther away that had private rooms. Because the distance required Dr. Lazarou to be away from her newborns for an extended period, she did not take the MOC examination, and her ABPN certification lapsed, according to the suit. Because of the lapse, she is no longer able to practice telepsychiatry, which has resulted in a loss of income and to the detriment of patients who need telepsychiatric care, she claims in the lawsuit.
Dr. Akhter, who practices addiction medicine, was informed in August 2018 that he was selected for a random audit of his ABPN MOC activities. During the audit, officials informed Dr. Akhter that the continuing medical education (CME) requirement for completion of his 3-year continuance maintenance of certification (C-MOC) cycle had not been met, according to the suit. As part of the 3-year C-MOC cycle, physicians are required to complete 90 CME credits, including 24 credits for self-assessment (SA) activities. ABPN defines SA activities as a specific type of CME activity that help physicians recognize their current knowledge base in order to identify specific topics for gaining further knowledge. Although Dr. Akhter had obtained a subspecialty certification from the American Board of Preventive Medicine, including completion of 60 CME credits that included SA activities, the board determined that those efforts did not fulfill Dr. Akhter’s SA CME requirements. The board denied his request to recognize the 60 CME credits as SA CME credits and also refused to give him SA CME credits for obtaining his subspecialty certification, the lawsuit says. He now is listed on the ABPN website as “Not Meeting MOC Requirements.”
The ABPN has not yet responded to the lawsuit. Defendants generally have 30 days from the time a challenge is filed to respond, unless they request an extension. Court documents show that an attorney for ABPN entered his appearance on March 20.

The ABPN lawsuit comes on the heels of a similar class action filed last year by a group of internists against the American Board of Internal Medicine (ABIM) over its MOC process. That lawsuit, filed Dec. 6 in Pennsylvania district court, contends that the ABIM is charging inflated monopoly prices for maintaining certification and that the organization is violating antitrust laws. In a motion filed March 18, attorneys for the ABIM asked the court to dismiss the suit for failure to state a valid claim. A third lawsuit that levies similar allegations against the Board of Radiology was filed in late February. All three lawsuits are being funded by the advocacy organization Practicing Physicians of America, through a GoFundMe campaign.
Richard Rosin, MD, a geriatric psychiatrist based in Vancouver, said in an interview that he welcomes and applauds the lawsuit against ABPN. He hopes that the legal challenge will put a spotlight on the board’s activities and compel administrators to answer questions about the MOC process that have gone unanswered in the past.
“If it is successful, I think the impact will be dramatic,” said Dr. Rosin, an outspoken critic of the ABPN’s MOC process. “They’ll essentially have to disband the [MOC] program.”
Paul G. Mathew, MD, a Boston-based neurologist, said he was not surprised by the lawsuit. Dissatisfaction about MOC continues to rise, and resistance grows as more diplomates learn about the financial misdoings and monopolistic nature of the board, said Dr. Mathew, director of legislative affairs for the National Board of Physicians and Surgeons, an alternative board that provides continuing certification for physicians.

“At the end of the day, I hope that the case wins, because diplomates have been forced to expend their time, effort, and money on a product that has scant evidence that it improves practice,” Dr. Mathew said in an interview. “Unnecessary administrative burdens of this nature that do not improve patient care contribute to physician burnout, which is a nationwide epidemic.”
Dr. Mathew hopes to see monetary damages awarded as well as injunctive relief that would enable competition in the MOC market, he said. Such relief would prevent insurance companies and other stakeholders from only recognizing and requiring recertification with ABPN.*
“This would allow physicians the flexibility to recertify with boards like the National Board of Physicians and Surgeons,” he said.
The ABPN, meanwhile, defended its recertification, calling it a credential that is valued by patients, families, and medical organizations as an indicator that physicians have pursued “a meaningful program of lifelong learning sufficient to maintain the competence to provide quality patient care.” In recent years, the board has made improvements to its MOC requirements based on constructive feedback from diplomates and consistent with the evolving standards of the American Board of Medical Specialties, Dr. Faulkner said in the interview.
“Relevant options have been provided for the documentation of self-assessment and performance improvement, and they have been well received by diplomates,” he said. “The ABPN is also in the process of implementing an optional, article-based Pilot Project as an alternative to its secure continuing certification examination. Almost 15,000 ABPN diplomates have enrolled to date in the Pilot Project, and initial feedback from those diplomates has also been very favorable.”
*Correction, 4/5/19: Due to an editing error, an earlier version of this article omitted the word "only" from this sentence.
Two psychiatrists are suing the American Board of Psychiatry and Neurology (ABPN) over its maintenance of certification program, contending that the board has created a monopoly over the MOC market and that its process violates antitrust laws.
The lawsuit, filed March 6 in U.S. District Court for the Northern District of Illinois, alleges that the board is illegally tying its initial certification product to its MOC product, and that ABPN is using anticompetitive actions to prevent and limit competition from new MOC providers. The suit is filed as a class action on behalf of all psychiatrists and neurologists required by ABPN to buy MOC to maintain their certifications. The plaintiffs seek damages and injunctive relief arising from the alleged violations.
In an interview, ABPN President and CEO Larry R. Faulkner, MD, said the legal challenge has no merit.
“The ABPN intends to defend itself vigorously and anticipates that, like other similar cases previously filed against the American Board of Medical Specialties and other member boards, this lawsuit will be dismissed.”
Plaintiff Emily Lazarou, MD, an Odessa, Fla.-based psychiatrist, did not return messages seeking comment. The other plaintiff, Aafaque Akhter, MD, a psychiatrist based in Norton, Mass., declined to comment at the advice of his attorneys. In a LinkedIn post, Dr. Akhter wrote that he filed the class action to put an end to MOC.
“This moneymaking operation has to be abolished,” he wrote in the post. “MOC has to go.
The 35-page complaint against the ABPN contends that the organization’s antitrust and monopolistic actions have resulted in overly burdensome conditions for physicians forced to buy MOC, and that the board’s requirements constrain the supply of psychiatrists and neurologists, thereby harming competition. The ABPN has made tens of millions of dollars in MOC revenue from psychiatrists and neurologists, the suit alleges, while physicians face countless hours away from their practice and families in order to meet MOC demands, to the physicians’ financial detriment. The challenge also asserts that ABPN’s grandfather clause – which exempts from MOC physicians who received initial certifications prior to Oct. 1, 1994 – discriminates against younger physicians, women, and persons of color, all of whom are underrepresented in the group of psychiatrists and neurologists grandfathered by ABPN.
The lawsuit details how MOC has personally and professionally affected the plaintiffs. In 2017, Dr. Lazarou, a forensic psychiatrist who also practices telepsychiatry, asked the ABPN in advance for a private room during her upcoming 10-year MOC examination. At the time, Dr. Lazarou was nursing her twin newborns and needed the private room to pump, according to the lawsuit. The suit alleges that ABPN would not make an accommodation for Dr. Lazarou to pump at the testing site; however, as a professional courtesy, board officials allowed her to travel to a test center farther away that had private rooms. Because the distance required Dr. Lazarou to be away from her newborns for an extended period, she did not take the MOC examination, and her ABPN certification lapsed, according to the suit. Because of the lapse, she is no longer able to practice telepsychiatry, which has resulted in a loss of income and to the detriment of patients who need telepsychiatric care, she claims in the lawsuit.
Dr. Akhter, who practices addiction medicine, was informed in August 2018 that he was selected for a random audit of his ABPN MOC activities. During the audit, officials informed Dr. Akhter that the continuing medical education (CME) requirement for completion of his 3-year continuance maintenance of certification (C-MOC) cycle had not been met, according to the suit. As part of the 3-year C-MOC cycle, physicians are required to complete 90 CME credits, including 24 credits for self-assessment (SA) activities. ABPN defines SA activities as a specific type of CME activity that help physicians recognize their current knowledge base in order to identify specific topics for gaining further knowledge. Although Dr. Akhter had obtained a subspecialty certification from the American Board of Preventive Medicine, including completion of 60 CME credits that included SA activities, the board determined that those efforts did not fulfill Dr. Akhter’s SA CME requirements. The board denied his request to recognize the 60 CME credits as SA CME credits and also refused to give him SA CME credits for obtaining his subspecialty certification, the lawsuit says. He now is listed on the ABPN website as “Not Meeting MOC Requirements.”
The ABPN has not yet responded to the lawsuit. Defendants generally have 30 days from the time a challenge is filed to respond, unless they request an extension. Court documents show that an attorney for ABPN entered his appearance on March 20.
The ABPN lawsuit comes on the heels of a similar class action filed last year by a group of internists against the American Board of Internal Medicine (ABIM) over its MOC process. That lawsuit, filed Dec. 6 in Pennsylvania district court, contends that the ABIM is charging inflated monopoly prices for maintaining certification and that the organization is violating antitrust laws. In a motion filed March 18, attorneys for the ABIM asked the court to dismiss the suit for failure to state a valid claim. A third lawsuit that levies similar allegations against the Board of Radiology was filed in late February. All three lawsuits are being funded by the advocacy organization Practicing Physicians of America, through a GoFundMe campaign.
Richard Rosin, MD, a geriatric psychiatrist based in Vancouver, said in an interview that he welcomes and applauds the lawsuit against ABPN. He hopes that the legal challenge will put a spotlight on the board’s activities and compel administrators to answer questions about the MOC process that have gone unanswered in the past.
“If it is successful, I think the impact will be dramatic,” said Dr. Rosin, an outspoken critic of the ABPN’s MOC process. “They’ll essentially have to disband the [MOC] program.”
Paul G. Mathew, MD, a Boston-based neurologist, said he was not surprised by the lawsuit. Dissatisfaction about MOC continues to rise, and resistance grows as more diplomates learn about the financial misdoings and monopolistic nature of the board, said Dr. Mathew, director of legislative affairs for the National Board of Physicians and Surgeons, an alternative board that provides continuing certification for physicians.
“At the end of the day, I hope that the case wins, because diplomates have been forced to expend their time, effort, and money on a product that has scant evidence that it improves practice,” Dr. Mathew said in an interview. “Unnecessary administrative burdens of this nature that do not improve patient care contribute to physician burnout, which is a nationwide epidemic.”
Dr. Mathew hopes to see monetary damages awarded as well as injunctive relief that would enable competition in the MOC market, he said. Such relief would prevent insurance companies and other stakeholders from only recognizing and requiring recertification with ABPN.*
“This would allow physicians the flexibility to recertify with boards like the National Board of Physicians and Surgeons,” he said.
The ABPN, meanwhile, defended its recertification, calling it a credential that is valued by patients, families, and medical organizations as an indicator that physicians have pursued “a meaningful program of lifelong learning sufficient to maintain the competence to provide quality patient care.” In recent years, the board has made improvements to its MOC requirements based on constructive feedback from diplomates and consistent with the evolving standards of the American Board of Medical Specialties, Dr. Faulkner said in the interview.
“Relevant options have been provided for the documentation of self-assessment and performance improvement, and they have been well received by diplomates,” he said. “The ABPN is also in the process of implementing an optional, article-based Pilot Project as an alternative to its secure continuing certification examination. Almost 15,000 ABPN diplomates have enrolled to date in the Pilot Project, and initial feedback from those diplomates has also been very favorable.”
*Correction, 4/5/19: Due to an editing error, an earlier version of this article omitted the word "only" from this sentence.
Ibrutinib sustained responses in refractory CLL in long-term follow-up
Prolonged exposure to ibrutinib showed sustained progression-free and overall survival and had tolerable safety outcomes in patients with relapsed or refractory chronic lymphocytic leukemia, according to a post hoc analysis of the phase 3 RESONATE trial.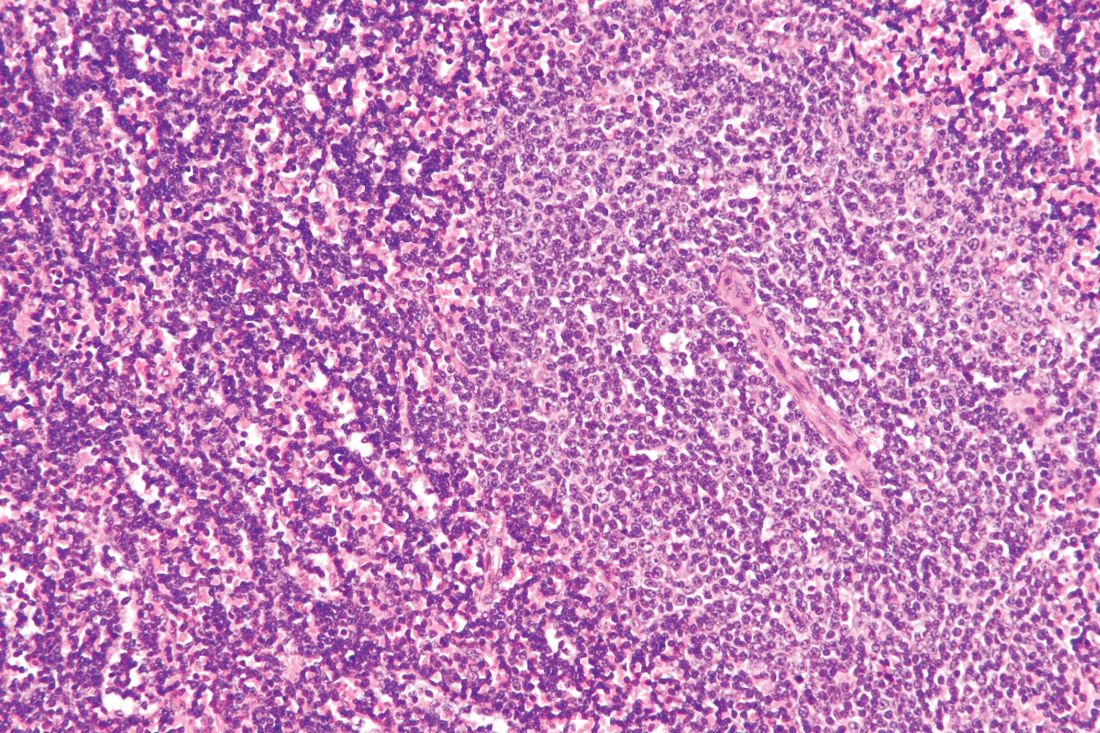
“This study ... provides further evidence for efficacy and safety with prolonged treatment across multiple high-risk genomic and clinical disease features and with increasing depth of response,” John C. Byrd, MD, of the Ohio State University, Columbus, and his colleagues wrote in Blood.
RESONATE included 391 high-risk patients with relapsed or refractory chronic lymphocytic leukemia (CLL). Study participants were randomized in a 1:1 fashion to receive ibrutinib 420 mg daily or ofatumumab (initial infusion of 300 mg followed by seven weekly infusions and four monthly infusions of 2,000 mg) for a maximum of 24 weeks. Drug therapy was continued until cancer progression or intolerable toxicity of either agent was seen.
“Primary analysis at median follow-up of 9.7 months demonstrated superiority of ibrutinib over ofatumumab in PFS [progression-free survival], OS [overall survival], and overall response,” the researchers wrote. “With extended follow-up of median 44 months, these same results persist; a plateau of PFS has not yet been reached in this long-term follow-up. We also observe very durable remissions among patients of all genomic groups, including those with del(17)(p13.1), del(11)(q22.3), or unmutated IgHV [immunoglobulin heavy chain gene], who are traditionally considered high-risk populations.”
After an extended follow-up (median, 44 months), the team found that the PFS benefit with ibrutinib was sustained, compared with ofatumumab (hazard ratio, 0.133; 95% confidence interval, 0.099-0.178; P less than .0001). The 3-year PFS rate was 59% for ibrutinib, compared with 3% for ofatumumab. Similar PFS benefits were seen among subgroups of high- and very high–risk patients, based on their scores on the International Prognostic Index for CLL.
The OS benefit was also sustained in those randomized to ibrutinib (HR, 0.591; 95% CI, 0.378-0.926; P = .0208). The continued OS benefit with ibrutinib versus ofatumumab continued even after a sensitivity analysis adjusted for crossover of patients to ibrutinib.
With respect to safety, adverse events of any grade were similar to previous reports of ibrutinib. In fact, the prevalence of adverse events (grade 3 or higher) decreased over time for participants that continued on ibrutinib.
“Multiple studies are ongoing to investigate ibrutinib earlier in the course of CLL therapy, including phase 3 studies of first-line ibrutinib [or ibrutinib combined with anti-CD20 therapy], compared with standard chemoimmunotherapy regimens,” they wrote.
The study was sponsored by Pharmacyclics and Janssen. The authors reported financial disclosures related to the sponsors and several other companies.
SOURCE: Byrd JC et al. Blood. 2019 Mar 6. doi: 10.1182/blood-2018-08-870238.
FROM BLOOD
Emicizumab may improve thrombosis management in hemophilia A
The use of concurrent anticoagulation and emicizumab prophylaxis eliminated the need for bypassing therapy and improved a life-threatening central venous access device (CVAD)–associated thrombus in a patient with severe hemophilia A.
“Systemic anticoagulation with concomitant emicizumab has not been previously described,” Angela Weyand, MD, of the University of Michigan, Ann Arbor, and her colleagues wrote in a letter to the editor published in Haemophilia.
The researchers reported findings from a case of a 6-year-old boy with severe hemophilia A who developed a CVAD‐associated thrombus during immune tolerance induction with recombinant factor VIII (rFVIII). As his clinical condition worsened, the team hypothesized thrombus development was being caused by the ongoing use of bypassing therapy.
Dr. Weyand and her colleagues started prophylaxis with subcutaneous emicizumab (3 mg/kg once weekly for 4 weeks followed by 1.5 mg/kg weekly thereafter) and anticoagulation therapy (low-molecular-weight heparin given twice daily; anti‐Xa target of 0.3‐0.5 IU/ mL, later increased to 0.5‐0.7 IU/mL).
After 2 months of concurrent therapy, the team saw major symptomatic improvement and the thrombus had substantially decreased in size. One month later, his port access was removed without any bleeding complications and no further hemostatic agents were required.
“Follow‐up echocardiogram 3 months after discontinuation of anticoagulation demonstrated continued improvement with increasing organization of the thrombus,” they wrote.
Afterward, the patient was continued on emicizumab prophylaxis and did not require additional bypassing agent therapy.
“Consideration was given to surgical thrombectomy as that would be the recommendation in a non-haemophilic patient, but ultimately anticoagulation was deemed to be a safer alternative,” they wrote.
The researchers acknowledged that very little evidence is available to guide treatment of patients similar to the one described in this case. “Although this particular scenario is rare, its real‐life efficacy data in these types of settings will help inform emicizumab use, which is critical given its expanding indications,” they concluded.
No funding sources were reported. The authors reported financial disclosures related to Bayer, CSL Behring, Novo Nordisk, Octapharma, Shire, and others.
SOURCE: Weyand AC et al. Haemophilia. 2019 Mar 13. doi: 10.1111/hae.13721.
FROM HAEMOPHILIA
More fiber looks safe, might benefit ICU patients
MIAMI –

“Higher fiber intake was associated with greater preservation of short-chain fatty acid–producing bacteria, even after we adjusted for antibiotics and acute severity of illness,” said Yichun Fu, a fourth-year medical student at Columbia University, New York, at the annual Gut Microbiota for Health World Summit.
She explained that, after 72 hours on the high-fiber diet, only 11% of patients had abdominal distension noted in their EMRs, compared with 36% of patients who received no dietary fiber (P less than .01). Fiber was not associated with bowel obstruction, high gastric residuals, enteric infections, edema, or diarrhea. She and her associates presented the findings in a poster at the meeting sponsored by the American Gastroenterological Association and the European Society for Neurogastroenterology and Motility.
Dietary fiber is a prebiotic that increases the abundance of short-chain fatty acid (SCFA)–producing bacteria in the gut. Growing evidence links these bacteria and their metabolites – such as acetate, propionate, and butyrate – to immunomodulatory benefits and suggests that they help maintain gut barrier function, glucose homeostasis, adipose tissue lipolysis, and normal blood pressure. Thus, fiber for ICU patients might make sense, but relevant dietary guidelines rarely address the topic. In practice, fiber is often withheld in the ICU because of concerns that it might cause bloating or diarrhea, Ms. Fu said.
For the study, the researchers performed 16s ribosomal RNA sequencing on baseline and 72-hour rectal swabs collected from 129 consecutive adults newly admitted to the ICU. Patients were eligible for the study regardless of whether they received nothing by mouth, enteral feeding, or food by mouth. They were grouped in tertiles based on fiber intake over 72 hours, corrected by caloric intake. The resulting groups were dubbed “no fiber” (median and interquartile range, 0 grams), “low fiber” (median, 11.2 g; IQR, 3.8-18.2 g), and “high fiber” (median, 39.3 g; IQR, 4.7-50.2 g).
Patients in these three groups had a similar relative abundance of SCFA-producing bacteria at baseline. At 72 hours, the high-fiber group had a significantly greater relative abundance of SCFA producers than the no fiber group (P = .01). Compared with no fiber, high-fiber intake also correlated with significantly increased gut bacterial diversity (P = .04) and a lower relative abundance of Enterococcus bacteria (P less than .01). None of these measures differed significantly between the no-fiber and low-fiber groups.
The groups were demographically and clinically similar at baseline, except that the high-fiber group had lower Acute Physiology and Chronic Health Evaluation IV scores (P = .02) and was less likely to receive antibiotics, mechanical ventilation, hemodialysis, or vasopressors (P less than .01). After correcting for these differences, each 10-g increase in fiber intake over 72 hours correlated with a 0.3% median increase in the relative abundance of SCFA-producing bacteria (estimated IQR, 0.10%-0.46%; P less than .01).
“Fiber may be a simple candidate therapy for ICU patients,” the researchers concluded. The team is now designing a prospective, interventional study to further test whether fiber can modify the gut microbiome to benefit ICU patients, Ms. Fu explained.
Funders included the American Gastroenterological Association, the National Institutes of Health, and the Feldstein Medical Foundation. Ms. Fu reported no competing interests.
MIAMI –
“Higher fiber intake was associated with greater preservation of short-chain fatty acid–producing bacteria, even after we adjusted for antibiotics and acute severity of illness,” said Yichun Fu, a fourth-year medical student at Columbia University, New York, at the annual Gut Microbiota for Health World Summit.
She explained that, after 72 hours on the high-fiber diet, only 11% of patients had abdominal distension noted in their EMRs, compared with 36% of patients who received no dietary fiber (P less than .01). Fiber was not associated with bowel obstruction, high gastric residuals, enteric infections, edema, or diarrhea. She and her associates presented the findings in a poster at the meeting sponsored by the American Gastroenterological Association and the European Society for Neurogastroenterology and Motility.
Dietary fiber is a prebiotic that increases the abundance of short-chain fatty acid (SCFA)–producing bacteria in the gut. Growing evidence links these bacteria and their metabolites – such as acetate, propionate, and butyrate – to immunomodulatory benefits and suggests that they help maintain gut barrier function, glucose homeostasis, adipose tissue lipolysis, and normal blood pressure. Thus, fiber for ICU patients might make sense, but relevant dietary guidelines rarely address the topic. In practice, fiber is often withheld in the ICU because of concerns that it might cause bloating or diarrhea, Ms. Fu said.
For the study, the researchers performed 16s ribosomal RNA sequencing on baseline and 72-hour rectal swabs collected from 129 consecutive adults newly admitted to the ICU. Patients were eligible for the study regardless of whether they received nothing by mouth, enteral feeding, or food by mouth. They were grouped in tertiles based on fiber intake over 72 hours, corrected by caloric intake. The resulting groups were dubbed “no fiber” (median and interquartile range, 0 grams), “low fiber” (median, 11.2 g; IQR, 3.8-18.2 g), and “high fiber” (median, 39.3 g; IQR, 4.7-50.2 g).
Patients in these three groups had a similar relative abundance of SCFA-producing bacteria at baseline. At 72 hours, the high-fiber group had a significantly greater relative abundance of SCFA producers than the no fiber group (P = .01). Compared with no fiber, high-fiber intake also correlated with significantly increased gut bacterial diversity (P = .04) and a lower relative abundance of Enterococcus bacteria (P less than .01). None of these measures differed significantly between the no-fiber and low-fiber groups.
The groups were demographically and clinically similar at baseline, except that the high-fiber group had lower Acute Physiology and Chronic Health Evaluation IV scores (P = .02) and was less likely to receive antibiotics, mechanical ventilation, hemodialysis, or vasopressors (P less than .01). After correcting for these differences, each 10-g increase in fiber intake over 72 hours correlated with a 0.3% median increase in the relative abundance of SCFA-producing bacteria (estimated IQR, 0.10%-0.46%; P less than .01).
“Fiber may be a simple candidate therapy for ICU patients,” the researchers concluded. The team is now designing a prospective, interventional study to further test whether fiber can modify the gut microbiome to benefit ICU patients, Ms. Fu explained.
Funders included the American Gastroenterological Association, the National Institutes of Health, and the Feldstein Medical Foundation. Ms. Fu reported no competing interests.
REPORTING FROM GMFM 2019
MS researchers aim to build MRI diagnostic portfolio beyond the central vein sign
DALLAS –

“The goal is to have something to guide us, even before we think about applying the McDonald criteria, to give us some probability of whether or not the patient has MS,” Andrew J. Solomon, MD, said at a meeting of the Americas Committee for Treatment and Research in Multiple Sclerosis.
Thalamic atrophy
Measuring thalamic volume is one approach of interest (see Neurol Neuroimmunol Neuroinflamm. 2017 Sep;4[5]:e387). “Thalamic atrophy occurs early in MS,” said Dr. Solomon, division chief of multiple sclerosis in the department of neurological sciences at the University of Vermont, Burlington. “It certainly reflects pathology that seems to be specific to MS, compared to other diseases that mimic MS.”
In a recent analysis, investigators prospectively studied 520 patients with relapse-onset MS and 81 healthy controls who received annual MRI brain scans. MS patients received 2,485 scans during a mean follow-up of 4.1 years, while controls received 147 scans during a mean follow-up of 1.3 years (Ann Neurol. 2018;83[2]:223-34). They found that the annual thalamic volume loss from baseline was significantly greater in MS patients than in controls (–0.71% vs. –0.28%). In addition, lower thalamic volume at baseline correlated modestly with worse baseline disability and functional measures of cognition, ambulation, and upper extremity function.
“Thalamic atrophy can be assessed from clinically acquired 3-D scans,” said Dr. Solomon, who was not involved with the study. “Maybe it can serve as an adjunct for patients who have a low number of lesions for central vein sign evaluation. We can look at their thalamic volume in combination with that and develop a threshold that’s helpful. We need larger cohorts and standardized, automated segmentation.”
Cortical myelin content
Using imaging techniques to detect cortical myelin content also may be beneficial. “We’ve known for a long time that cortical gray matter is involved in MS,” Dr. Solomon said. “It’s really hard to image these lesions on 3T [Tesla] MRI scanners. Some data suggest that patients with migraine don’t have cortical lesions. Patients with neuromyelitis optica don’t seem to have cortical lesions. There is some interesting data using T1 and T2 scans from routine MRI [see Ann Neurol. 2017;82[4]:519-29]. The research suggests that you can develop this ratio and look at myelin content of the cortex.”
Dr. Solomon and his colleagues validated this approach by evaluating data from 20 patients with MS and 10 with migraine. They used the Human Connectome Project pipelines version 3.16.1 to create cortical myelin maps. Specifically, signal intensities from the T1-weighted and FLAIR volumes were used to create maps of ratio and signal intensities as a proxy for cortical myelin content and cortical thickness. Z-score maps were created for each subject, and they used vertices with a Z score of less than 3 as a threshold. They found that the number of vertices in MS vs. non-MS had an area under the curve (AUC) of 0.837. “Maybe looking at cortical myelin content can help us differentiate MS from other disorders,” he said. “It reflects pathology that may be specific to MS. We can use routine clinically acquired sequences. We certainly need much larger cohorts, and we’re working on this.”
Dark rim on gray matter–double inversion recovery
Another promising imaging technique, developed by researchers at the Mayo Clinic, was found to enhance diagnostic specificity in MS (AJNR Am J Neuroradiol. 2018;39[6]:1052-8). Using a novel double inversion recovery sequence that suppresses cerebrospinal fluid and gray matter signal (GM–double inversion recovery), they compared white matter lesions in a group of 107 MS patients and in a second group of 36 positive controls with white matter lesions who did not have a diagnosis of MS. In patients with MS lesions, 35% had a dark rim visible on GM–double inversion recovery, compared with only 1% of the positive control group. Dark rims were associated with a decrease in the lesion T1 ratio. “We need a larger prospective study to see how this pans out,” Dr. Solomon said.
Lesion morphology
Evaluation of lesion morphology also holds promise. In one recent study, researchers performed standardized 3T 3-D brain MRI studies on 19 MS patients and 11 patients with nonspecific white matter (NSWM) disease (J Neuroimaging. 2017;27[6]:613-9). They identified focal supratentorial lesions, used maximum intensity projection to reconstruct them, and created 3-D printed models. The models were randomly evaluated by three blinded raters who scored lesions based on symmetry (symmetrical or asymmetrical), surface morphology (simple or complex), and a long list of secondary characteristics. In all, the researchers evaluated 1,001 supratentorial lesions, including 710 in MS patients and 291 in patients with NSWM disease.
MS vs. NSWM disease lesions had a higher percentage of asymmetry (75.9% vs. 43%; odds ratio, 4.39; P less than .001); complex surface morphologies (65.9% vs. 27.8%; OR, 2.3; P less than .001); multilobular lesions (11% vs. 3%; P less than .001), and elongated lesion (12.8% vs. 2.4%; P less than .001). “This is interesting, but it was a small study,” Dr. Solomon said. “We need to look at this in other diagnoses, and we need prospective data.”
Dr. Solomon disclosed that he has received consulting fees from EMD Serono and research funding from Biogen. He has also performed contracted research for Biogen, Novartis, Actelion, and Genentech/Roche.
dbrunk@mdedge.com
DALLAS –
“The goal is to have something to guide us, even before we think about applying the McDonald criteria, to give us some probability of whether or not the patient has MS,” Andrew J. Solomon, MD, said at a meeting of the Americas Committee for Treatment and Research in Multiple Sclerosis.
Thalamic atrophy
Measuring thalamic volume is one approach of interest (see Neurol Neuroimmunol Neuroinflamm. 2017 Sep;4[5]:e387). “Thalamic atrophy occurs early in MS,” said Dr. Solomon, division chief of multiple sclerosis in the department of neurological sciences at the University of Vermont, Burlington. “It certainly reflects pathology that seems to be specific to MS, compared to other diseases that mimic MS.”
In a recent analysis, investigators prospectively studied 520 patients with relapse-onset MS and 81 healthy controls who received annual MRI brain scans. MS patients received 2,485 scans during a mean follow-up of 4.1 years, while controls received 147 scans during a mean follow-up of 1.3 years (Ann Neurol. 2018;83[2]:223-34). They found that the annual thalamic volume loss from baseline was significantly greater in MS patients than in controls (–0.71% vs. –0.28%). In addition, lower thalamic volume at baseline correlated modestly with worse baseline disability and functional measures of cognition, ambulation, and upper extremity function.
“Thalamic atrophy can be assessed from clinically acquired 3-D scans,” said Dr. Solomon, who was not involved with the study. “Maybe it can serve as an adjunct for patients who have a low number of lesions for central vein sign evaluation. We can look at their thalamic volume in combination with that and develop a threshold that’s helpful. We need larger cohorts and standardized, automated segmentation.”
Cortical myelin content
Using imaging techniques to detect cortical myelin content also may be beneficial. “We’ve known for a long time that cortical gray matter is involved in MS,” Dr. Solomon said. “It’s really hard to image these lesions on 3T [Tesla] MRI scanners. Some data suggest that patients with migraine don’t have cortical lesions. Patients with neuromyelitis optica don’t seem to have cortical lesions. There is some interesting data using T1 and T2 scans from routine MRI [see Ann Neurol. 2017;82[4]:519-29]. The research suggests that you can develop this ratio and look at myelin content of the cortex.”
Dr. Solomon and his colleagues validated this approach by evaluating data from 20 patients with MS and 10 with migraine. They used the Human Connectome Project pipelines version 3.16.1 to create cortical myelin maps. Specifically, signal intensities from the T1-weighted and FLAIR volumes were used to create maps of ratio and signal intensities as a proxy for cortical myelin content and cortical thickness. Z-score maps were created for each subject, and they used vertices with a Z score of less than 3 as a threshold. They found that the number of vertices in MS vs. non-MS had an area under the curve (AUC) of 0.837. “Maybe looking at cortical myelin content can help us differentiate MS from other disorders,” he said. “It reflects pathology that may be specific to MS. We can use routine clinically acquired sequences. We certainly need much larger cohorts, and we’re working on this.”
Dark rim on gray matter–double inversion recovery
Another promising imaging technique, developed by researchers at the Mayo Clinic, was found to enhance diagnostic specificity in MS (AJNR Am J Neuroradiol. 2018;39[6]:1052-8). Using a novel double inversion recovery sequence that suppresses cerebrospinal fluid and gray matter signal (GM–double inversion recovery), they compared white matter lesions in a group of 107 MS patients and in a second group of 36 positive controls with white matter lesions who did not have a diagnosis of MS. In patients with MS lesions, 35% had a dark rim visible on GM–double inversion recovery, compared with only 1% of the positive control group. Dark rims were associated with a decrease in the lesion T1 ratio. “We need a larger prospective study to see how this pans out,” Dr. Solomon said.
Lesion morphology
Evaluation of lesion morphology also holds promise. In one recent study, researchers performed standardized 3T 3-D brain MRI studies on 19 MS patients and 11 patients with nonspecific white matter (NSWM) disease (J Neuroimaging. 2017;27[6]:613-9). They identified focal supratentorial lesions, used maximum intensity projection to reconstruct them, and created 3-D printed models. The models were randomly evaluated by three blinded raters who scored lesions based on symmetry (symmetrical or asymmetrical), surface morphology (simple or complex), and a long list of secondary characteristics. In all, the researchers evaluated 1,001 supratentorial lesions, including 710 in MS patients and 291 in patients with NSWM disease.
MS vs. NSWM disease lesions had a higher percentage of asymmetry (75.9% vs. 43%; odds ratio, 4.39; P less than .001); complex surface morphologies (65.9% vs. 27.8%; OR, 2.3; P less than .001); multilobular lesions (11% vs. 3%; P less than .001), and elongated lesion (12.8% vs. 2.4%; P less than .001). “This is interesting, but it was a small study,” Dr. Solomon said. “We need to look at this in other diagnoses, and we need prospective data.”
Dr. Solomon disclosed that he has received consulting fees from EMD Serono and research funding from Biogen. He has also performed contracted research for Biogen, Novartis, Actelion, and Genentech/Roche.
dbrunk@mdedge.com
EXPERT ANALYSIS FROM ACTRIMS FORUM 2019