User login
Increasing Mobility via In-hospital Ambulation Protocol Delivered by Mobility Technicians: A Pilot Randomized Controlled Trial
Individuals aged 65 years and over represent 13% of the United States population and account for nearly 40% of hospital discharges.1 Bedrest hastens the functional decline of older patients2-5 and is associated with risk of serious complications, such as falls, delirium, venous thrombosis, and skin breakdown.6,7 Ambulation is widely recognized as important for improving hospital outcomes.8-10 Observational studies suggest that increases of 600 steps per day are associated with shortened length of hospital stay.9 However, randomized trials of assisted ambulation have not demonstrated consistent benefit.11-14 As a result, usual care at most hospitals in the United States does not include assisted ambulation. Even when ambulation is ordered, execution of the orders is inconsistent.15-17
Studies have demonstrated the benefits of various exercise protocols for older patients in rehabilitation facilities,18,19 medical intensive care units,20 and medical and surgical wards.13,18,21 These interventions are usually nursing centered; however, assisting patients with ambulation multiple times per day may be a burdensome addition to the myriad responsibilities of nurses.19,22,23 In fact, ambulation orders are the most frequently overlooked nursing task.24
We designed a graded protocol of assisted ambulation implemented by a dedicated patient care nursing assistant (PCNA) multiple times daily to increase patient mobility. The objective of this study was to assess the feasibility and effectiveness of such an intervention for older inpatients. We hypothesized that the intervention would prove feasible and improve hospital outcomes, including less need for inpatient rehabilitation and shorter length of stay.
METHODS
We conducted a single-blind randomized controlled trial of patients aged ≥60 years and admitted as medical inpatients to the Cleveland Clinic Main Campus, a tertiary care center with over 1,440 inpatient beds. The consent form and study protocol were approved by the Cleveland Clinic Institutional Review Board, and the study was registered with ClinicalTrials.gov (NCT02757131).
Patients
All patients who were admitted to study wards for a medical illness and evaluated by Physical Therapy (PT) were eligible for the study. PT evaluations were ordered by the medical team if deemed necessary on the basis of factors, such as age, estimated mobility, and concerns raised by the ancillary staff. All patients who were expected to be discharged to a skilled nursing facility placement or who required home PT received a PT evaluation. Assessment of mobility was documented via Activity Measure for Postacute Care Inpatient Basic Mobility “six-clicks” short form, hereafter abbreviated as “six-clicks.” Based on past experience, patients with scores <16 rarely go home (<20% of the time), and those with scores >20 usually go home regardless of ambulation. Therefore, only patients with scores of 16-20 were invited to participate in the study. Although patients who were not evaluated by PT might also benefit from the intervention, we required a six-clicks score to assess eligibility. The exclusion criteria included anticipated remaining length of stay less than three days, admission under observation status, admission to the intensive care unit (ICU,) patients receiving comfort care measures, and patients with medical conditions precluding ambulation, such as decompensated heart failure or unstable angina.
Randomization
Patients were randomized to “usual care” or “mobility technician” after baseline evaluation using a computerized system. A block randomization scheme with a size of four was used to ensure an approximately equal number of patients per group.
Intervention
Patients randomized to the intervention group were asked to participate in the ambulation protocol outlined by the PT three times daily under the supervision of the mobility technician. The protocol involved four exercise levels (sitting, standing, walking, and stairs), which were implemented depending on the patient’s physical capacity. The mobility technicians, who were PCNAs, were trained by the PT team. PCNAs have no specific degrees or certification. They are taught safe handling techniques during their job orientation, so they already had an understanding of how to transfer and assist a patient with ambulation. The mobility technician training consisted of one four-hour session run by the PT team in the physical therapy department and the nursing unit. The training included safe handling practices and basic mobility, such as transfers from bed to chair, bed to standing, walking with assistance, and walking independently with equipment such as cane, rolling walker, and walking belt. All instruction was demonstrated by the trainer, and the mobility technician was then able to practice. The mobility technician then shadowed the trainer and practiced the techniques under supervision. Competency was assessed by the trainer.
The cohort of patients randomized to “usual care” was not seen by the mobility technicians but was not otherwise restricted in nursing’s baseline ability to execute recommendations placed by the PT team. Compliance with the recommendations is highly variable and dependent on patient acuity during the shift, staffing issues, and competing duties. Cleveland Clinic promotes a “culture of mobility,” and nurses are encouraged to get patients out of bed and assist with ambulation.
Study Instruments—Measures of Mobility
The six-clicks instrument is a tool for measuring basic mobility. It was adapted from the Activity Measures for Post-Acute Care (AM-PAC) instrument.25 Although initially created for self-report in the post-acute care setting, six-clicks has been validated for use by PTs in the acute care setting26 and is currently in use at more than 1,000 US hospitals. Cleveland Clinic PTs have used this measure for routine evaluation since 2011. The instrument has high interrater reliability and can predict discharge disposition.27-29
Each patient was provided with a tracking device (Fitbit) attached at the wrist to record daily steps for measuring mobility. The use of Fitbit has been validated in ambulatory and inpatient settings.30 The device produces step counts within 3% of the observed step count for most patients but may undercount steps in patients with very slow gait.31 The device was provided to each enrollee and collected at discharge.
Variables
Demographic information, comorbid diagnoses, and discharge destination were extracted from the electronic medical record. Information on prehospitalization physical activity level was obtained from the initial PT assessment. Falls were tracked through the safety event reporting system.
Outcomes
The primary outcomes were discharge disposition and hospital length of stay. The secondary outcomes included average steps per day, change in six-clicks score from admission to discharge, inpatient mortality, admission to ICU, falls, deep vein thrombosis, pulmonary embolism, or pneumonia, and readmission within 30 days.
Statistical Analysis
Patient characteristics were summarized as means and standard deviations or medians and interquartile ranges for continuous variables and as frequencies and percentages for categorical variables. The t-test or Wilcoxon rank sum test was applied to compare continuous characteristics between the intervention and control groups. Chi-squared test or Fisher’s exact test was applied to compare categorical characteristics. Given its skewed distribution, the length of stay was log-transformed and compared between the two groups using Student’s t-test. Chi-squared test was used to compare categorical outcomes. The analysis of final six-clicks scores was adjusted for baseline scores, and the least-square estimates are provided. A linear mixed effects model was used to compare the number of daily steps taken because each participant had multiple steps measured. Results were adjusted for prehospital activity. In addition to comparing the total steps taken by each group, we determined the proportion of patients who exceeded a particular threshold by taking the average number of steps per day for all subjects and relating it to home discharge using the Receiver Operating Characteristics (ROC) curve. An optimal cut-off was determined to maximize the Youden index. We also compared the proportion of patients who exceeded 900 steps because this value was previously reported as an important threshold.32 All analyses were conducted using intention-to-treat principles. We also conducted a per-protocol analysis in which we limited the intervention group to those who received at least one assisted ambulation session. A dose-response analysis was also performed, in which patients were categorized as not receiving the therapy, receiving sessions on one or two days, or receiving them on more than two days.
All analyses were conducted using R-studio (Boston, MA). Statistical significance was defined as a P-value < .05. Given that this is a pilot study, the results were not adjusted for multiple comparisons.
RESULTS
Characteristics of patients in the intervention and control groups are shown in Table 1. The patients were mostly white and female, with an average age in the mid-70s (range 61-98). All measures evaluated were not significantly different between the intervention and control groups. However, more patients in the intervention group had a prehospital activity level classified as independent.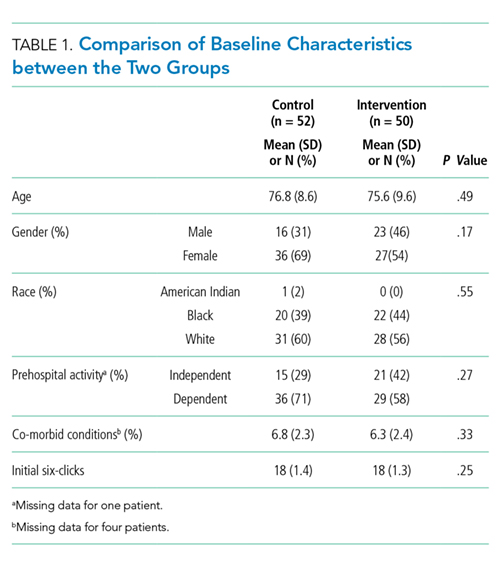
Table 2 demonstrates the feasibility of the intervention. Of patients randomized to the intervention group, 74% were ambulated at least once. Once enrolled, the patients successfully participated in assisted ambulation for about two-thirds of their hospital stay. However, the intervention was delivered for only one-third of the total length of stay because most patients were not enrolled on admission. On average, the mobility technicians made 11 attempts to ambulate each patient and 56% of these attempts were successful. The proportion of unsuccessful attempts did not change over the course of the study. The reasons for unsuccessful attempts included patient refusal (n = 102) or unavailability (n = 68), mobility technicians running out of time (n = 2), and other (n = 12).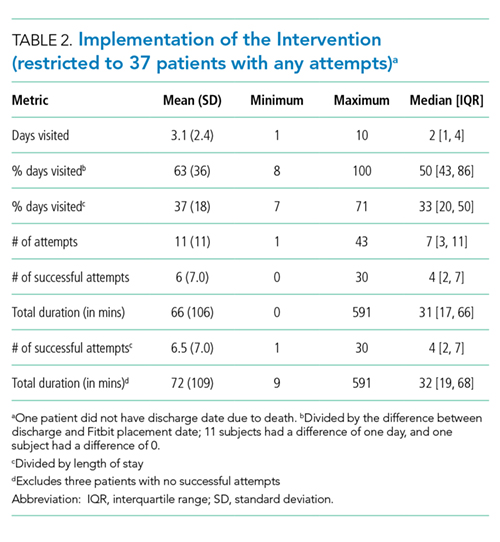
Initially, the mobility technicians were not available on weekends. In addition, they were often reassigned to other duties by their nurse managers, who were dealing with staffing shortages. As the study progressed, we were able to secure the mobility technicians to work seven days per week and to convince the nurse managers that their role should be protected. Consequently, the median number [IQR] of successful attempts increased from 1.5 [0, 2] in the first two months to 3 [0, 5] in the next three months and finally to 5 [1.5, 13] in the final months (P < .002). The median visit duration was 10 minutes, with an interquartile range of 6-15 minutes.
In the intention-to-treat analysis, patients in the intervention group took close to 50% more steps than did the control patients. After adjustment for prehospital activity level, the difference was not statistically significant. The intervention also did not significantly affect the length of stay or discharge disposition (Table 3). In the per protocol analysis, the difference in the step count was significant, even after adjustment. The six-clicks score also significantly increased.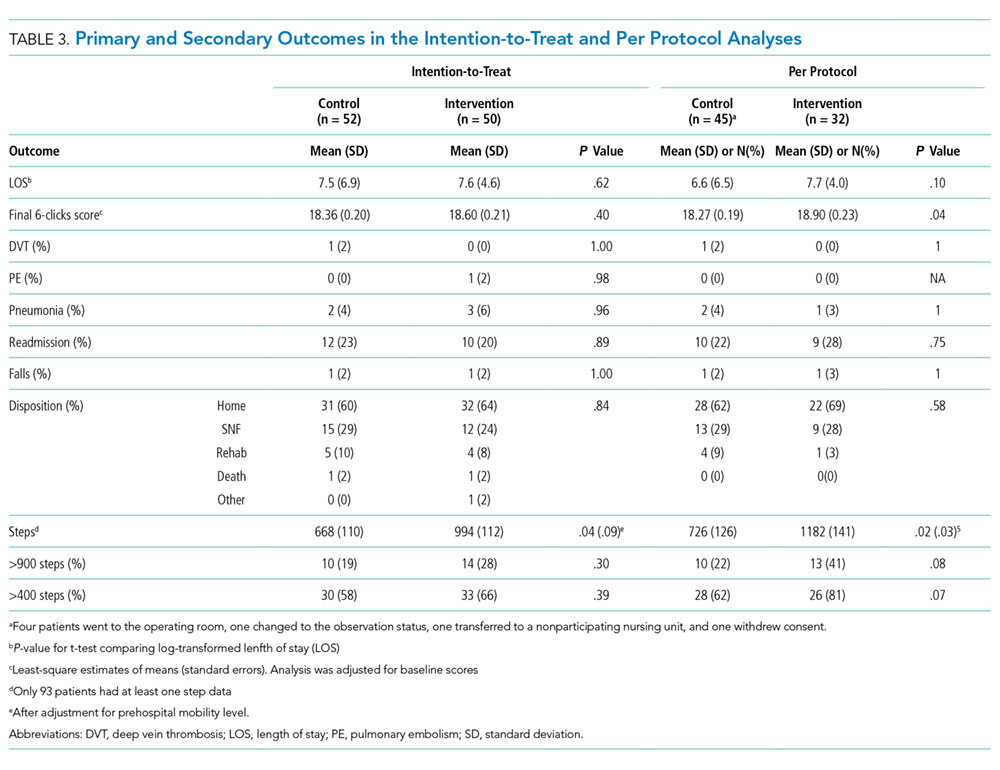
To assess for dose response, we compared outcomes among patients who received no intervention, those who received two or fewer days of intervention, and those who received more than two days of intervention (Table 4). The length of stay was significantly longer in patients with more than two days of intervention, likely reflecting greater opportunities for exposure to the intervention. The longer intervention time significantly increased the six-clicks score.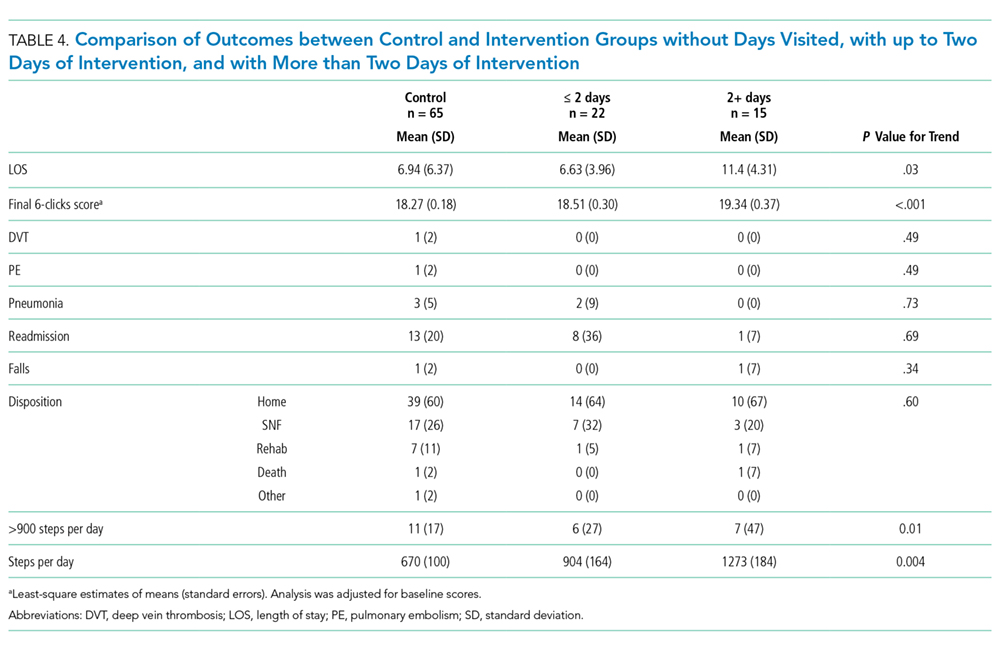
We examined the relationship between steps achieved and discharge disposition. Patients who achieved at least 900 steps more often went home than those who did not (79% vs. 56%, P < .05). The ROC for the model of discharge disposition using steps taken as the only predictor had an area under the curve of 0.67, with optimal discrimination at 411 steps. At a threshold of 400 steps, the model had a sensitivity of 75.9% and a specificity of 51.4%. Patients achieving 400 steps were more likely to go home than those who did not achieve that goal (71% vs. 46%, P =.01). More patients in the intervention group achieved the 900 step goal (28% vs. 19%, P = .30) and the 400 step goal (66% vs. 58%, P = .39), but neither association reached statistical significance.
DISCUSSION
In this pilot study conducted with older medical inpatients, we found that assisted ambulation provided by a dedicated mobility technician was feasible and increased the number of steps taken by patients. Not all patients in the treatment group received the intervention partly due to the fact that the program initially did not include weekends and the mobility technicians were sometimes redirected to other nursing duties. Both issues were addressed during the course of the study. In the per protocol analysis, the intervention increased the average six-clicks score and there was a nonsignificant reduction in the percentage of patients discharged to a rehabilitation facility.
A range of hospital-based mobility interventions have been described. Several of which were complex multidisciplinary interventions that included a mobility component. The compliance rates have ranged from 82% to 93.7%,12,13 although a systematic review noted that many studies do not provide this level of information.11 Interventions were carried out by nursing staff and PT with support from family members and social workers.33-35 Ambulation-specific programs have also relied on nurses and PT13,14,36 and, occasionally, on research assistants to implement assisted ambulation protocols.12,37 A recent study that employed research assistants to deliver inhospital ambulation reported achieving 51.3% of intended walks.37
In contradistinction to previous studies, we created a new role, employing PCNAs as dedicated mobility technicians. We did this for two reasons. First, the approach is less expensive than deploying registered nurses or PTs to ambulate patients and therefore more likely to be adopted by hospitals, especially if it can decrease the cost of an episode of care by avoiding subsequent inpatient rehabilitation. Mobility technicians have no degree or certification requirements and are therefore paid less than nurses or physical therapists. Second, by having a single responsibility, mobility technicians were more likely to engage in their task than nurses, who have competing responsibilities. However, when nurse staffing was short, nurse managers were tempted to recall the PCNAs for other nursing duties. It took time before PCNAs and supervisors prioritized this new responsibility. When they did, the number of attempted walks increased substantially, but the percentage of successful attempts remained constant at 56%, highlighting the difficulty of getting hospitalized patients to walk.
On average, patients who received the intervention engaged in 72 minutes of additional physical activity and averaged 990 steps per day. Observational data suggest patients accrue about 1,100 steps in the day before discharge, with older patients accruing closer to 900.21 One study found that older patients with fewer than 900 steps per day were likely to experience a functional decline.32 We also found that patients who achieved at least 900 steps were more likely to go home. However, we found that a lower threshold, namely, 400 steps, offered better discrimination between patients who go home and those who do not. Future prospective studies are needed to establish the appropriate goal for exercise interventions. A lower step goal could dramatically enhance the efficiency of the intervention.
A Cochrane review found that pooled analysis of multidisciplinary interventions that included exercise, often in the form of walking, achieved a small but significant increase in the proportion of patients discharged to home (RR 1.08, 95%CI 1.03 to 1.14).11 We found no significant change in the discharge disposition, but our study was underpowered for this endpoint. The six-clicks score showed a small but significant change in the per protocol analysis. The six-clicks score has been shown to correlate with discharge disposition,28,29 and an improvement in the score suggests that discharge disposition may be influenced.
The intervention may also not have been implemented for long enough. On average, visits were achieved for one-third of the hospital stay partly because of the delay in PT evaluation, which we required for eligibility. In practice, PT evaluation can occur just a few days before the anticipated discharge. We observed a dose dependent response among patients in the intervention group, suggesting that earlier intervention could be more effective. Earlier intervention might be achieved if the MT performed the six-clicks on potentially eligible patients.
The effects of hospitalization on mobility may be the most pronounced in the long term; one study found that 40% of hospitalized older patients manifested new ADL or IADL disability three months after discharge compared with 31% at discharge.7 Hospital-based mobility interventions may continue to affect subjects’ independence for weeks or months. In one RCT, an inpatient ambulation intervention improved mobility in the community one month after discharge.37 A hospital-based exercise program that included ambulation achieved better functional outcomes one month later.13 One RCT that combined inpatient exercise with outpatient care coordination also decreased readmission rates.34 We found that the intervention did not affect readmission.
This pilot study has several limitations. The sample size was small, and the findings need to be replicated in a larger randomized controlled trial. This is particularly important because the two study arms were not balanced in terms of their prehospital activity. After adjustment for prehospital activity, the differences in the step count in the intention-to-treat analysis were no longer significant. As we adjusted the intervention to hospital workflow, the intervention changed over time. The intention-to-treat analysis may therefore underestimate the effect of the intervention. This work provides a basis for future trial. Finally, discharge disposition depends on a complex interplay of factors, including social factors and preferences, which may not be affected by a mobility intervention.
In summary, an inhospital mobility protocol of attempting ambulation delivered by dedicated mobility technicians three times daily successfully increased the daily step counts and mobility scores of the patients. Studies with a larger sample size are needed to determine whether the proposed approach can affect length of hospital stay, discharge disposition, and overall cost of an episode of care.
Disclosures
Mary Stilphen reports consulting for CreCare and Adeo, which license and distribute AM-PAC short forms, including 6 clicks. All other authors report no conflicts of interest.
Funding
This study was supported by a Research Program Committee grant from the Cleveland Clinic.
1. National Center for Health Statistics. National Hospital Discharge Survey. 2010. PubMed
2. Corcoran PJ. Use it or lose it--the hazards of bed rest and inactivity. West J Med. 1991;154(5):536-538. PubMed
3. Gillick MR, Serrell NA, Gillick LS. Adverse consequences of hospitalization in the elderly. Soc Sci Med. 1982;16(10):1033-1038. doi: 10.1016/0277-9536(82)90175-7. PubMed
4. Hirsch CH, Sommers L, Olsen A, Mullen L, Winograd CH. The natural history of functional morbidity in hospitalized older patients. J Am Geriatr Soc. 1990;38(12):1296-1303. doi: 10.1111/j.1532-5415.1990.tb03451.x. PubMed
5. Zisberg A, Shadmi E, Sinoff G, Gur-Yaish N, Srulovici E, Admi H. Low mobility during hospitalization and functional decline in older adults. J Am Geriatr Soc. 2011;59(2):266-273. doi: 10.1111/j.1532-5415.2010.03276.x. PubMed
6. Heit JA, Silverstein MD, Mohr DN, Petterson TM, O’Fallon WM, Melton LJ, 3rd. Risk factors for deep vein thrombosis and pulmonary embolism: A population-based case-control study. Arch Intern Med. 2000;160(6):809-815. doi: 10.1067/mob.2001.107919. PubMed
7. Sager MA, Franke T, Inouye SK, et al. Functional outcomes of acute medical illness and hospitalization in older persons. Arch Intern Med. 1996;156(6):645-652. doi: 10.1001/archinte.1996.00440060067008. PubMed
8. Campbell AJ, Borrie MJ, Spears GF. Risk factors for falls in a community-based prospective study of people 70 years and older. J Gerontol. 1989;44(4):M112-M117. doi: 10.1093/geronj/44.4.M112. PubMed
9. Fisher SR, Kuo YF, Graham JE, Ottenbacher KJ, Ostir GV. Early ambulation and length of stay in older adults hospitalized for acute illness. Arch Intern Med. 2010;170(21):1942-1943. doi: 0.1001/archinternmed.2010.422. PubMed
10. Graf C. Functional decline in hospitalized older adults. Am J Nurs. 2006;106(1):58-67, quiz 67-58. PubMed
11. de Morton NA, Keating JL, Jeffs K. Exercise for acutely hospitalised older medical patients. Cochrane Database Syst Rev. 2007(1):CD005955. doi: 10.1002/14651858.CD005955. PubMed
12. Jones CT, Lowe AJ, MacGregor L, Brand CA, Tweddle N, Russell DM. A randomised controlled trial of an exercise intervention to reduce functional decline and health service utilisation in the hospitalised elderly. Australas J Ageing. 2006;25(3):126-133. doi: 10.1111/j.1741-6612.2006.00167.x.
13. Siebens H, Aronow H, Edwards D, Ghasemi Z. A randomized controlled trial of exercise to improve outcomes of acute hospitalization in older adults. J Am Geriatr Soc. 2000;48(12):1545-1552. doi: 10.1111/j.1532-5415.2000.tb03862.x. PubMed
14. Mundy LM, Leet TL, Darst K, Schnitzler MA, Dunagan WC. Early mobilization of patients hospitalized with community-acquired pneumonia. Chest. 2003;124(3):883-889. doi: 10.1378/chest.124.3.883. PubMed
15. Brown CJ, Redden DT, Flood KL, Allman RM. The underrecognized epidemic of low mobility during hospitalization of older adults. J Am Geriatr Soc. 2009;57(9):1660-1665. doi: 10.1111/j.1532-5415.2009.02393.x. PubMed
16. Callen BL, Mahoney JE, Grieves CB, Wells TJ, Enloe M. Frequency of hallway ambulation by hospitalized older adults on medical units of an academic hospital. Geriatr Nurs. 2004;25(4):212-217. doi: 10.1016/j.gerinurse.2004.06.016. PubMed
17. Fisher SR, Goodwin JS, Protas EJ, et al. Ambulatory activity of older adults hospitalized with acute medical illness. J Am Geriatr Soc. 2011;59(1):91-95. doi: 10.1111/j.1532-5415.2010.03202.x. PubMed
18. McVey LJ, Becker PM, Saltz CC, Feussner JR, Cohen HJ. Effect of a geriatric consultation team on functional status of elderly hospitalized patients: A randomized, controlled clinical trial. Ann Intern Med. 1989;110(1):79-84. doi: PubMed
19. Said CM, Morris ME, Woodward M, Churilov L, Bernhardt J. Enhancing physical activity in older adults receiving hospital based rehabilitation: A phase II feasibility study. BMC Geriatr. 2012;12:26. doi: 10.1186/1471-2318-12-26. PubMed
20. Timmerman RA. A mobility protocol for critically ill adults. Dimens Crit Care Nurs. 2007;26(5):175-179; quiz 180-171. doi: 10.1097/01.DCC.0000286816.40570.da. PubMed
21. Sallis R, Roddy-Sturm Y, Chijioke E, et al. Stepping toward discharge: Level of ambulation in hospitalized patients. J Hosp Med. 2015;10(6):384-389. doi: 10.1002/jhm.2343. PubMed
22. Inouye SK, Wagner DR, Acampora D, Horwitz RI, Cooney LM, Jr., Tinetii ME. A controlled trial of a nursing-centered intervention in hospitalized elderly medical patients: The yale geriatric care program. J Am Geriatr Soc. 1993;41(12):1353-1360. doi: 10.1111/j.1532-5415.1993.tb06487.x. PubMed
23. Kalisch BJ, Landstrom GL, Hinshaw AS. Missed nursing care: A concept analysis. J Adv Nurs. 2009;65(7):1509-1517. doi: 10.1111/j.1365-2648.2009.05027.x. PubMed
24. Kalisch BJ, Tschannen D, Lee H, Friese CR. Hospital variation in missed nursing care. Am J Med Qual. 2011;26(4):291-299. doi: 10.1177/1062860610395929. PubMed
25. Haley SM, Coster WJ, Andres PL, et al. Activity outcome measurement for postacute care. Med Care. 2004;42(1 Suppl):I49-161. doi: 10.1097/01.mlr.0000103520.43902.6c. PubMed
26. Jette DU, Stilphen M, Ranganathan VK, Passek SD, Frost FS, Jette AM. Validity of the AM-PAC “6-Clicks” inpatient daily activity and basic mobility short forms. Phys Ther. 2014;94(3):379-391. doi: 10.2522/ptj.20130199. PubMed
27. Jette DU, Stilphen M, Ranganathan VK, Passek S, Frost FS, Jette AM. Interrater reliability of AM-PAC 6-Clicks” basic mobility and daily activity short forms. Phys Ther. 2015;95(5):758-766. doi: 10.2522/ptj.20140174. PubMed
28. Jette DU, Stilphen M, Ranganathan VK, Passek SD, Frost FS, Jette AM. AM-PAC “6-Clicks” functional assessment scores predict acute care hospital discharge destination. Phys Ther. 2014;94(9):1252-1261. doi: 10.2522/ptj.20130359. PubMed
29. Menendez ME, Schumacher CS, Ring D, Freiberg AA, Rubash HE, Kwon YM. Does “6-Clicks” day 1 postoperative mobility score predict discharge disposition after total hip and knee arthroplasties? J Arthroplasty. 2016;31(9):1916-1920. doi: 10.1016/j.arth.2016.02.017. PubMed
30. Feehan LM, Geldman J, Sayre EC, et al. Accuracy of fitbit devices: Systematic review and narrative syntheses of quantitative data. JMIR Mhealth Uhealth. 2018;6(8):e10527-e10527. doi: 10.2196/10527. PubMed
31. Treacy D, Hassett L, Schurr K, Chagpar S, Paul SS, Sherrington C. Validity of different activity monitors to count steps in an inpatient rehabilitation setting. Phys Ther. 2017;97(5):581-588. doi: 10.1093/ptj/pzx010. PubMed
32. Agmon M, Zisberg A, Gil E, Rand D, Gur-Yaish N, Azriel M. Association between 900 steps a day and functional decline in older hospitalized patients. JAMA Intern Med. 2017;177(2):272-274. doi: 10.1001/jamainternmed.2016.7266. PubMed
33. Counsell SR, Holder CM, Liebenauer LL, et al. Effects of a multicomponent intervention on functional outcomes and process of care in hospitalized older patients: a randomized controlled trial of Acute Care for Elders (ACE) in a community hospital. J Am Geriatr Soc. 2000;48(12):1572-1581. doi: 10.1111/j.1532-5415.2000.tb03866.x. PubMed
34. Courtney M, Edwards H, Chang A, Parker A, Finlayson K, Hamilton K. Fewer emergency readmissions and better quality of life for older adults at risk of hospital readmission: a randomized controlled trial to determine the effectiveness of a 24-week exercise and telephone follow-up program. J Am Geriatr Soc. 2009;57(3):395-402. doi: 10.1111/j.1532-5415.2009.02138.x. PubMed
35. Landefeld CS, Palmer RM, Kresevic DM, Fortinsky RH, Kowal J. A randomized trial of care in a hospital medical unit especially designed to improve the functional outcomes of acutely ill older patients. N Engl J Med. 1995;332(20):1338-1344. doi: 10.1056/NEJM199505183322006. PubMed
36. Hoyer EH, Friedman M, Lavezza A, et al. Promoting mobility and reducing length of stay in hospitalized general medicine patients: A quality-improvement project. J Hosp Med. 2016;11(5):341-347. doi: 10.1002/jhm.2546. PubMed
37. Brown CJ, Foley KT, Lowman JD, Jr., et al. comparison of posthospitalization function and community mobility in hospital mobility program and usual care patients: a randomized clinical trial. JAMA Intern Med. 2016;176(7):921-927. doi: 10.1001/jamainternmed.2016.1870. PubMed
Individuals aged 65 years and over represent 13% of the United States population and account for nearly 40% of hospital discharges.1 Bedrest hastens the functional decline of older patients2-5 and is associated with risk of serious complications, such as falls, delirium, venous thrombosis, and skin breakdown.6,7 Ambulation is widely recognized as important for improving hospital outcomes.8-10 Observational studies suggest that increases of 600 steps per day are associated with shortened length of hospital stay.9 However, randomized trials of assisted ambulation have not demonstrated consistent benefit.11-14 As a result, usual care at most hospitals in the United States does not include assisted ambulation. Even when ambulation is ordered, execution of the orders is inconsistent.15-17
Studies have demonstrated the benefits of various exercise protocols for older patients in rehabilitation facilities,18,19 medical intensive care units,20 and medical and surgical wards.13,18,21 These interventions are usually nursing centered; however, assisting patients with ambulation multiple times per day may be a burdensome addition to the myriad responsibilities of nurses.19,22,23 In fact, ambulation orders are the most frequently overlooked nursing task.24
We designed a graded protocol of assisted ambulation implemented by a dedicated patient care nursing assistant (PCNA) multiple times daily to increase patient mobility. The objective of this study was to assess the feasibility and effectiveness of such an intervention for older inpatients. We hypothesized that the intervention would prove feasible and improve hospital outcomes, including less need for inpatient rehabilitation and shorter length of stay.
METHODS
We conducted a single-blind randomized controlled trial of patients aged ≥60 years and admitted as medical inpatients to the Cleveland Clinic Main Campus, a tertiary care center with over 1,440 inpatient beds. The consent form and study protocol were approved by the Cleveland Clinic Institutional Review Board, and the study was registered with ClinicalTrials.gov (NCT02757131).
Patients
All patients who were admitted to study wards for a medical illness and evaluated by Physical Therapy (PT) were eligible for the study. PT evaluations were ordered by the medical team if deemed necessary on the basis of factors, such as age, estimated mobility, and concerns raised by the ancillary staff. All patients who were expected to be discharged to a skilled nursing facility placement or who required home PT received a PT evaluation. Assessment of mobility was documented via Activity Measure for Postacute Care Inpatient Basic Mobility “six-clicks” short form, hereafter abbreviated as “six-clicks.” Based on past experience, patients with scores <16 rarely go home (<20% of the time), and those with scores >20 usually go home regardless of ambulation. Therefore, only patients with scores of 16-20 were invited to participate in the study. Although patients who were not evaluated by PT might also benefit from the intervention, we required a six-clicks score to assess eligibility. The exclusion criteria included anticipated remaining length of stay less than three days, admission under observation status, admission to the intensive care unit (ICU,) patients receiving comfort care measures, and patients with medical conditions precluding ambulation, such as decompensated heart failure or unstable angina.
Randomization
Patients were randomized to “usual care” or “mobility technician” after baseline evaluation using a computerized system. A block randomization scheme with a size of four was used to ensure an approximately equal number of patients per group.
Intervention
Patients randomized to the intervention group were asked to participate in the ambulation protocol outlined by the PT three times daily under the supervision of the mobility technician. The protocol involved four exercise levels (sitting, standing, walking, and stairs), which were implemented depending on the patient’s physical capacity. The mobility technicians, who were PCNAs, were trained by the PT team. PCNAs have no specific degrees or certification. They are taught safe handling techniques during their job orientation, so they already had an understanding of how to transfer and assist a patient with ambulation. The mobility technician training consisted of one four-hour session run by the PT team in the physical therapy department and the nursing unit. The training included safe handling practices and basic mobility, such as transfers from bed to chair, bed to standing, walking with assistance, and walking independently with equipment such as cane, rolling walker, and walking belt. All instruction was demonstrated by the trainer, and the mobility technician was then able to practice. The mobility technician then shadowed the trainer and practiced the techniques under supervision. Competency was assessed by the trainer.
The cohort of patients randomized to “usual care” was not seen by the mobility technicians but was not otherwise restricted in nursing’s baseline ability to execute recommendations placed by the PT team. Compliance with the recommendations is highly variable and dependent on patient acuity during the shift, staffing issues, and competing duties. Cleveland Clinic promotes a “culture of mobility,” and nurses are encouraged to get patients out of bed and assist with ambulation.
Study Instruments—Measures of Mobility
The six-clicks instrument is a tool for measuring basic mobility. It was adapted from the Activity Measures for Post-Acute Care (AM-PAC) instrument.25 Although initially created for self-report in the post-acute care setting, six-clicks has been validated for use by PTs in the acute care setting26 and is currently in use at more than 1,000 US hospitals. Cleveland Clinic PTs have used this measure for routine evaluation since 2011. The instrument has high interrater reliability and can predict discharge disposition.27-29
Each patient was provided with a tracking device (Fitbit) attached at the wrist to record daily steps for measuring mobility. The use of Fitbit has been validated in ambulatory and inpatient settings.30 The device produces step counts within 3% of the observed step count for most patients but may undercount steps in patients with very slow gait.31 The device was provided to each enrollee and collected at discharge.
Variables
Demographic information, comorbid diagnoses, and discharge destination were extracted from the electronic medical record. Information on prehospitalization physical activity level was obtained from the initial PT assessment. Falls were tracked through the safety event reporting system.
Outcomes
The primary outcomes were discharge disposition and hospital length of stay. The secondary outcomes included average steps per day, change in six-clicks score from admission to discharge, inpatient mortality, admission to ICU, falls, deep vein thrombosis, pulmonary embolism, or pneumonia, and readmission within 30 days.
Statistical Analysis
Patient characteristics were summarized as means and standard deviations or medians and interquartile ranges for continuous variables and as frequencies and percentages for categorical variables. The t-test or Wilcoxon rank sum test was applied to compare continuous characteristics between the intervention and control groups. Chi-squared test or Fisher’s exact test was applied to compare categorical characteristics. Given its skewed distribution, the length of stay was log-transformed and compared between the two groups using Student’s t-test. Chi-squared test was used to compare categorical outcomes. The analysis of final six-clicks scores was adjusted for baseline scores, and the least-square estimates are provided. A linear mixed effects model was used to compare the number of daily steps taken because each participant had multiple steps measured. Results were adjusted for prehospital activity. In addition to comparing the total steps taken by each group, we determined the proportion of patients who exceeded a particular threshold by taking the average number of steps per day for all subjects and relating it to home discharge using the Receiver Operating Characteristics (ROC) curve. An optimal cut-off was determined to maximize the Youden index. We also compared the proportion of patients who exceeded 900 steps because this value was previously reported as an important threshold.32 All analyses were conducted using intention-to-treat principles. We also conducted a per-protocol analysis in which we limited the intervention group to those who received at least one assisted ambulation session. A dose-response analysis was also performed, in which patients were categorized as not receiving the therapy, receiving sessions on one or two days, or receiving them on more than two days.
All analyses were conducted using R-studio (Boston, MA). Statistical significance was defined as a P-value < .05. Given that this is a pilot study, the results were not adjusted for multiple comparisons.
RESULTS
Characteristics of patients in the intervention and control groups are shown in Table 1. The patients were mostly white and female, with an average age in the mid-70s (range 61-98). All measures evaluated were not significantly different between the intervention and control groups. However, more patients in the intervention group had a prehospital activity level classified as independent.
Table 2 demonstrates the feasibility of the intervention. Of patients randomized to the intervention group, 74% were ambulated at least once. Once enrolled, the patients successfully participated in assisted ambulation for about two-thirds of their hospital stay. However, the intervention was delivered for only one-third of the total length of stay because most patients were not enrolled on admission. On average, the mobility technicians made 11 attempts to ambulate each patient and 56% of these attempts were successful. The proportion of unsuccessful attempts did not change over the course of the study. The reasons for unsuccessful attempts included patient refusal (n = 102) or unavailability (n = 68), mobility technicians running out of time (n = 2), and other (n = 12).
Initially, the mobility technicians were not available on weekends. In addition, they were often reassigned to other duties by their nurse managers, who were dealing with staffing shortages. As the study progressed, we were able to secure the mobility technicians to work seven days per week and to convince the nurse managers that their role should be protected. Consequently, the median number [IQR] of successful attempts increased from 1.5 [0, 2] in the first two months to 3 [0, 5] in the next three months and finally to 5 [1.5, 13] in the final months (P < .002). The median visit duration was 10 minutes, with an interquartile range of 6-15 minutes.
In the intention-to-treat analysis, patients in the intervention group took close to 50% more steps than did the control patients. After adjustment for prehospital activity level, the difference was not statistically significant. The intervention also did not significantly affect the length of stay or discharge disposition (Table 3). In the per protocol analysis, the difference in the step count was significant, even after adjustment. The six-clicks score also significantly increased.
To assess for dose response, we compared outcomes among patients who received no intervention, those who received two or fewer days of intervention, and those who received more than two days of intervention (Table 4). The length of stay was significantly longer in patients with more than two days of intervention, likely reflecting greater opportunities for exposure to the intervention. The longer intervention time significantly increased the six-clicks score.
We examined the relationship between steps achieved and discharge disposition. Patients who achieved at least 900 steps more often went home than those who did not (79% vs. 56%, P < .05). The ROC for the model of discharge disposition using steps taken as the only predictor had an area under the curve of 0.67, with optimal discrimination at 411 steps. At a threshold of 400 steps, the model had a sensitivity of 75.9% and a specificity of 51.4%. Patients achieving 400 steps were more likely to go home than those who did not achieve that goal (71% vs. 46%, P =.01). More patients in the intervention group achieved the 900 step goal (28% vs. 19%, P = .30) and the 400 step goal (66% vs. 58%, P = .39), but neither association reached statistical significance.
DISCUSSION
In this pilot study conducted with older medical inpatients, we found that assisted ambulation provided by a dedicated mobility technician was feasible and increased the number of steps taken by patients. Not all patients in the treatment group received the intervention partly due to the fact that the program initially did not include weekends and the mobility technicians were sometimes redirected to other nursing duties. Both issues were addressed during the course of the study. In the per protocol analysis, the intervention increased the average six-clicks score and there was a nonsignificant reduction in the percentage of patients discharged to a rehabilitation facility.
A range of hospital-based mobility interventions have been described. Several of which were complex multidisciplinary interventions that included a mobility component. The compliance rates have ranged from 82% to 93.7%,12,13 although a systematic review noted that many studies do not provide this level of information.11 Interventions were carried out by nursing staff and PT with support from family members and social workers.33-35 Ambulation-specific programs have also relied on nurses and PT13,14,36 and, occasionally, on research assistants to implement assisted ambulation protocols.12,37 A recent study that employed research assistants to deliver inhospital ambulation reported achieving 51.3% of intended walks.37
In contradistinction to previous studies, we created a new role, employing PCNAs as dedicated mobility technicians. We did this for two reasons. First, the approach is less expensive than deploying registered nurses or PTs to ambulate patients and therefore more likely to be adopted by hospitals, especially if it can decrease the cost of an episode of care by avoiding subsequent inpatient rehabilitation. Mobility technicians have no degree or certification requirements and are therefore paid less than nurses or physical therapists. Second, by having a single responsibility, mobility technicians were more likely to engage in their task than nurses, who have competing responsibilities. However, when nurse staffing was short, nurse managers were tempted to recall the PCNAs for other nursing duties. It took time before PCNAs and supervisors prioritized this new responsibility. When they did, the number of attempted walks increased substantially, but the percentage of successful attempts remained constant at 56%, highlighting the difficulty of getting hospitalized patients to walk.
On average, patients who received the intervention engaged in 72 minutes of additional physical activity and averaged 990 steps per day. Observational data suggest patients accrue about 1,100 steps in the day before discharge, with older patients accruing closer to 900.21 One study found that older patients with fewer than 900 steps per day were likely to experience a functional decline.32 We also found that patients who achieved at least 900 steps were more likely to go home. However, we found that a lower threshold, namely, 400 steps, offered better discrimination between patients who go home and those who do not. Future prospective studies are needed to establish the appropriate goal for exercise interventions. A lower step goal could dramatically enhance the efficiency of the intervention.
A Cochrane review found that pooled analysis of multidisciplinary interventions that included exercise, often in the form of walking, achieved a small but significant increase in the proportion of patients discharged to home (RR 1.08, 95%CI 1.03 to 1.14).11 We found no significant change in the discharge disposition, but our study was underpowered for this endpoint. The six-clicks score showed a small but significant change in the per protocol analysis. The six-clicks score has been shown to correlate with discharge disposition,28,29 and an improvement in the score suggests that discharge disposition may be influenced.
The intervention may also not have been implemented for long enough. On average, visits were achieved for one-third of the hospital stay partly because of the delay in PT evaluation, which we required for eligibility. In practice, PT evaluation can occur just a few days before the anticipated discharge. We observed a dose dependent response among patients in the intervention group, suggesting that earlier intervention could be more effective. Earlier intervention might be achieved if the MT performed the six-clicks on potentially eligible patients.
The effects of hospitalization on mobility may be the most pronounced in the long term; one study found that 40% of hospitalized older patients manifested new ADL or IADL disability three months after discharge compared with 31% at discharge.7 Hospital-based mobility interventions may continue to affect subjects’ independence for weeks or months. In one RCT, an inpatient ambulation intervention improved mobility in the community one month after discharge.37 A hospital-based exercise program that included ambulation achieved better functional outcomes one month later.13 One RCT that combined inpatient exercise with outpatient care coordination also decreased readmission rates.34 We found that the intervention did not affect readmission.
This pilot study has several limitations. The sample size was small, and the findings need to be replicated in a larger randomized controlled trial. This is particularly important because the two study arms were not balanced in terms of their prehospital activity. After adjustment for prehospital activity, the differences in the step count in the intention-to-treat analysis were no longer significant. As we adjusted the intervention to hospital workflow, the intervention changed over time. The intention-to-treat analysis may therefore underestimate the effect of the intervention. This work provides a basis for future trial. Finally, discharge disposition depends on a complex interplay of factors, including social factors and preferences, which may not be affected by a mobility intervention.
In summary, an inhospital mobility protocol of attempting ambulation delivered by dedicated mobility technicians three times daily successfully increased the daily step counts and mobility scores of the patients. Studies with a larger sample size are needed to determine whether the proposed approach can affect length of hospital stay, discharge disposition, and overall cost of an episode of care.
Disclosures
Mary Stilphen reports consulting for CreCare and Adeo, which license and distribute AM-PAC short forms, including 6 clicks. All other authors report no conflicts of interest.
Funding
This study was supported by a Research Program Committee grant from the Cleveland Clinic.
1. National Center for Health Statistics. National Hospital Discharge Survey. 2010. PubMed
2. Corcoran PJ. Use it or lose it--the hazards of bed rest and inactivity. West J Med. 1991;154(5):536-538. PubMed
3. Gillick MR, Serrell NA, Gillick LS. Adverse consequences of hospitalization in the elderly. Soc Sci Med. 1982;16(10):1033-1038. doi: 10.1016/0277-9536(82)90175-7. PubMed
4. Hirsch CH, Sommers L, Olsen A, Mullen L, Winograd CH. The natural history of functional morbidity in hospitalized older patients. J Am Geriatr Soc. 1990;38(12):1296-1303. doi: 10.1111/j.1532-5415.1990.tb03451.x. PubMed
5. Zisberg A, Shadmi E, Sinoff G, Gur-Yaish N, Srulovici E, Admi H. Low mobility during hospitalization and functional decline in older adults. J Am Geriatr Soc. 2011;59(2):266-273. doi: 10.1111/j.1532-5415.2010.03276.x. PubMed
6. Heit JA, Silverstein MD, Mohr DN, Petterson TM, O’Fallon WM, Melton LJ, 3rd. Risk factors for deep vein thrombosis and pulmonary embolism: A population-based case-control study. Arch Intern Med. 2000;160(6):809-815. doi: 10.1067/mob.2001.107919. PubMed
7. Sager MA, Franke T, Inouye SK, et al. Functional outcomes of acute medical illness and hospitalization in older persons. Arch Intern Med. 1996;156(6):645-652. doi: 10.1001/archinte.1996.00440060067008. PubMed
8. Campbell AJ, Borrie MJ, Spears GF. Risk factors for falls in a community-based prospective study of people 70 years and older. J Gerontol. 1989;44(4):M112-M117. doi: 10.1093/geronj/44.4.M112. PubMed
9. Fisher SR, Kuo YF, Graham JE, Ottenbacher KJ, Ostir GV. Early ambulation and length of stay in older adults hospitalized for acute illness. Arch Intern Med. 2010;170(21):1942-1943. doi: 0.1001/archinternmed.2010.422. PubMed
10. Graf C. Functional decline in hospitalized older adults. Am J Nurs. 2006;106(1):58-67, quiz 67-58. PubMed
11. de Morton NA, Keating JL, Jeffs K. Exercise for acutely hospitalised older medical patients. Cochrane Database Syst Rev. 2007(1):CD005955. doi: 10.1002/14651858.CD005955. PubMed
12. Jones CT, Lowe AJ, MacGregor L, Brand CA, Tweddle N, Russell DM. A randomised controlled trial of an exercise intervention to reduce functional decline and health service utilisation in the hospitalised elderly. Australas J Ageing. 2006;25(3):126-133. doi: 10.1111/j.1741-6612.2006.00167.x.
13. Siebens H, Aronow H, Edwards D, Ghasemi Z. A randomized controlled trial of exercise to improve outcomes of acute hospitalization in older adults. J Am Geriatr Soc. 2000;48(12):1545-1552. doi: 10.1111/j.1532-5415.2000.tb03862.x. PubMed
14. Mundy LM, Leet TL, Darst K, Schnitzler MA, Dunagan WC. Early mobilization of patients hospitalized with community-acquired pneumonia. Chest. 2003;124(3):883-889. doi: 10.1378/chest.124.3.883. PubMed
15. Brown CJ, Redden DT, Flood KL, Allman RM. The underrecognized epidemic of low mobility during hospitalization of older adults. J Am Geriatr Soc. 2009;57(9):1660-1665. doi: 10.1111/j.1532-5415.2009.02393.x. PubMed
16. Callen BL, Mahoney JE, Grieves CB, Wells TJ, Enloe M. Frequency of hallway ambulation by hospitalized older adults on medical units of an academic hospital. Geriatr Nurs. 2004;25(4):212-217. doi: 10.1016/j.gerinurse.2004.06.016. PubMed
17. Fisher SR, Goodwin JS, Protas EJ, et al. Ambulatory activity of older adults hospitalized with acute medical illness. J Am Geriatr Soc. 2011;59(1):91-95. doi: 10.1111/j.1532-5415.2010.03202.x. PubMed
18. McVey LJ, Becker PM, Saltz CC, Feussner JR, Cohen HJ. Effect of a geriatric consultation team on functional status of elderly hospitalized patients: A randomized, controlled clinical trial. Ann Intern Med. 1989;110(1):79-84. doi: PubMed
19. Said CM, Morris ME, Woodward M, Churilov L, Bernhardt J. Enhancing physical activity in older adults receiving hospital based rehabilitation: A phase II feasibility study. BMC Geriatr. 2012;12:26. doi: 10.1186/1471-2318-12-26. PubMed
20. Timmerman RA. A mobility protocol for critically ill adults. Dimens Crit Care Nurs. 2007;26(5):175-179; quiz 180-171. doi: 10.1097/01.DCC.0000286816.40570.da. PubMed
21. Sallis R, Roddy-Sturm Y, Chijioke E, et al. Stepping toward discharge: Level of ambulation in hospitalized patients. J Hosp Med. 2015;10(6):384-389. doi: 10.1002/jhm.2343. PubMed
22. Inouye SK, Wagner DR, Acampora D, Horwitz RI, Cooney LM, Jr., Tinetii ME. A controlled trial of a nursing-centered intervention in hospitalized elderly medical patients: The yale geriatric care program. J Am Geriatr Soc. 1993;41(12):1353-1360. doi: 10.1111/j.1532-5415.1993.tb06487.x. PubMed
23. Kalisch BJ, Landstrom GL, Hinshaw AS. Missed nursing care: A concept analysis. J Adv Nurs. 2009;65(7):1509-1517. doi: 10.1111/j.1365-2648.2009.05027.x. PubMed
24. Kalisch BJ, Tschannen D, Lee H, Friese CR. Hospital variation in missed nursing care. Am J Med Qual. 2011;26(4):291-299. doi: 10.1177/1062860610395929. PubMed
25. Haley SM, Coster WJ, Andres PL, et al. Activity outcome measurement for postacute care. Med Care. 2004;42(1 Suppl):I49-161. doi: 10.1097/01.mlr.0000103520.43902.6c. PubMed
26. Jette DU, Stilphen M, Ranganathan VK, Passek SD, Frost FS, Jette AM. Validity of the AM-PAC “6-Clicks” inpatient daily activity and basic mobility short forms. Phys Ther. 2014;94(3):379-391. doi: 10.2522/ptj.20130199. PubMed
27. Jette DU, Stilphen M, Ranganathan VK, Passek S, Frost FS, Jette AM. Interrater reliability of AM-PAC 6-Clicks” basic mobility and daily activity short forms. Phys Ther. 2015;95(5):758-766. doi: 10.2522/ptj.20140174. PubMed
28. Jette DU, Stilphen M, Ranganathan VK, Passek SD, Frost FS, Jette AM. AM-PAC “6-Clicks” functional assessment scores predict acute care hospital discharge destination. Phys Ther. 2014;94(9):1252-1261. doi: 10.2522/ptj.20130359. PubMed
29. Menendez ME, Schumacher CS, Ring D, Freiberg AA, Rubash HE, Kwon YM. Does “6-Clicks” day 1 postoperative mobility score predict discharge disposition after total hip and knee arthroplasties? J Arthroplasty. 2016;31(9):1916-1920. doi: 10.1016/j.arth.2016.02.017. PubMed
30. Feehan LM, Geldman J, Sayre EC, et al. Accuracy of fitbit devices: Systematic review and narrative syntheses of quantitative data. JMIR Mhealth Uhealth. 2018;6(8):e10527-e10527. doi: 10.2196/10527. PubMed
31. Treacy D, Hassett L, Schurr K, Chagpar S, Paul SS, Sherrington C. Validity of different activity monitors to count steps in an inpatient rehabilitation setting. Phys Ther. 2017;97(5):581-588. doi: 10.1093/ptj/pzx010. PubMed
32. Agmon M, Zisberg A, Gil E, Rand D, Gur-Yaish N, Azriel M. Association between 900 steps a day and functional decline in older hospitalized patients. JAMA Intern Med. 2017;177(2):272-274. doi: 10.1001/jamainternmed.2016.7266. PubMed
33. Counsell SR, Holder CM, Liebenauer LL, et al. Effects of a multicomponent intervention on functional outcomes and process of care in hospitalized older patients: a randomized controlled trial of Acute Care for Elders (ACE) in a community hospital. J Am Geriatr Soc. 2000;48(12):1572-1581. doi: 10.1111/j.1532-5415.2000.tb03866.x. PubMed
34. Courtney M, Edwards H, Chang A, Parker A, Finlayson K, Hamilton K. Fewer emergency readmissions and better quality of life for older adults at risk of hospital readmission: a randomized controlled trial to determine the effectiveness of a 24-week exercise and telephone follow-up program. J Am Geriatr Soc. 2009;57(3):395-402. doi: 10.1111/j.1532-5415.2009.02138.x. PubMed
35. Landefeld CS, Palmer RM, Kresevic DM, Fortinsky RH, Kowal J. A randomized trial of care in a hospital medical unit especially designed to improve the functional outcomes of acutely ill older patients. N Engl J Med. 1995;332(20):1338-1344. doi: 10.1056/NEJM199505183322006. PubMed
36. Hoyer EH, Friedman M, Lavezza A, et al. Promoting mobility and reducing length of stay in hospitalized general medicine patients: A quality-improvement project. J Hosp Med. 2016;11(5):341-347. doi: 10.1002/jhm.2546. PubMed
37. Brown CJ, Foley KT, Lowman JD, Jr., et al. comparison of posthospitalization function and community mobility in hospital mobility program and usual care patients: a randomized clinical trial. JAMA Intern Med. 2016;176(7):921-927. doi: 10.1001/jamainternmed.2016.1870. PubMed
© 2019 Society of Hospital Medicine
Examining the Utility of 30-day Readmission Rates and Hospital Profiling in the Veterans Health Administration
Using methodology created by the Centers for Medicare & Medicaid Services (CMS), the Department of Veterans Affairs (VA) calculates and reports hospital performance measures for several key conditions, including acute myocardial infarction (AMI), heart failure (HF), and pneumonia.1 These measures are designed to benchmark individual hospitals against how average hospitals perform when caring for a similar case-mix index. Because readmissions to the hospital within 30-days of discharge are common and costly, this metric has garnered extensive attention in recent years.
To summarize the 30-day readmission metric, the VA utilizes the Strategic Analytics for Improvement and Learning (SAIL) system to present internally its findings to VA practitioners and leadership.2 The VA provides these data as a means to drive quality improvement and allow for comparison of individual hospitals’ performance across measures throughout the VA healthcare system. Since 2010, the VA began using and publicly reporting the CMS-derived 30-day Risk-Stratified Readmission Rate (RSRR) on the Hospital Compare website.3 Similar to CMS, the VA uses three years of combined data so that patients, providers, and other stakeholders can compare individual hospitals’ performance across these measures.1 In response to this, hospitals and healthcare organizations have implemented quality improvement and large-scale programmatic interventions in an attempt to improve quality around readmissions.4-6 A recent assessment on how hospitals within the Medicare fee-for-service program have responded to such reporting found large degrees of variability, with more than half of the participating institutions facing penalties due to greater-than-expected readmission rates.5 Although the VA utilizes the same CMS-derived model in its assessments and reporting, the variability and distribution around this metric are not publicly reported—thus making it difficult to ascertain how individual VA hospitals compare with one another. Without such information, individual facilities may not know how to benchmark the quality of their care to others, nor would the VA recognize which interventions addressing readmissions are working, and which are not. Although previous assessments of interinstitutional variance have been performed in Medicare populations,7 a focused analysis of such variance within the VA has yet to be performed.
In this study, we performed a multiyear assessment of the CMS-derived 30-day RSRR metric for AMI, HF, and pneumonia as a useful measure to drive VA quality improvement or distinguish VA facility performance based on its ability to detect interfacility variability.
METHODS
Data Source
We used VA administrative and Medicare claims data from 2010 to 2012. After identifying index hospitalizations to VA hospitals, we obtained patients’ respective inpatient Medicare claims data from the Medicare Provider Analysis and Review (MedPAR) and Outpatient files. All Medicare records were linked to VA records via scrambled Social Security numbers and were provided by the VA Information Resource Center. This study was approved by the San Francisco VA Medical Center Institutional Review Board.
Study Sample
Our cohort consisted of hospitalized VA beneficiary and Medicare fee-for-service patients who were aged ≥65 years and admitted to and discharged from a VA acute care center with a primary discharge diagnosis of AMI, HF, or pneumonia. These comorbidities were chosen as they are publicly reported and frequently used for interfacility comparisons. Because studies have found that inclusion of secondary payer data (ie, CMS data) may affect hospital-profiling outcomes, we included Medicare data on all available patients.8 We excluded hospitalizations that resulted in a transfer to another acute care facility and those admitted to observation status at their index admission. To ensure a full year of data for risk adjustment, beneficiaries were included only if they were enrolled in Medicare for 12 months prior to and including the date of the index admission.
Index hospitalizations were first identified using VA-only inpatient data similar to methods outlined by the CMS and endorsed by the National Quality Forum for Hospital Profiling.9 An index hospitalization was defined as an acute inpatient discharge between 2010 and 2012 in which the principal diagnosis was AMI, HF, or pneumonia. We excluded in-hospital deaths, discharges against medical advice, and--for the AMI cohort only--discharges on the same day as admission. Patients may have multiple admissions per year, but only admissions after 30 days of discharge from an index admission were eligible to be included as an additional index admission.
Outcomes
A readmission was defined as any unplanned rehospitalization to either non-VA or VA acute care facilities for any cause within 30 days of discharge from the index hospitalization. Readmissions to observation status or nonacute or rehabilitation units, such as skilled nursing facilities, were not included. Planned readmissions for elective procedures, such as elective chemotherapy and revascularization following an AMI index admission, were not considered as an outcome event.
Risk Standardization for 30-day Readmission
Using approaches developed by CMS,10-12 we calculated hospital-specific 30-day RSRRs for each VA. Briefly, the RSRR is a ratio of the number of predicted readmissions within 30 days of discharge to the expected number of readmissions within 30 days of hospital discharge, multiplied by the national unadjusted 30-day readmission rate. This measure calculates hospital-specific RSRRs using hierarchical logistic regression models, which account for clustering of patients within hospitals and risk-adjusting for differences in case-mix, during the assessed time periods.13 This approach simultaneously models two levels (patient and hospital) to account for the variance in patient outcomes within and between hospitals.14 At the patient level, the model uses the log odds of readmissions as the dependent variable and age and selected comorbidities as the independent variables. The second level models the hospital-specific intercepts. According to CMS guidelines, the analysis was limited to facilities with at least 25 patient admissions annually for each condition. All readmissions were attributed to the hospital that initially discharged the patient to a nonacute setting.
Analysis
We examined and reported the distribution of patient and clinical characteristics at the hospital level. For each condition, we determined the number of hospitals that had a sufficient number of admissions (n ≥ 25) to be included in the analyses. We calculated the mean, median, and interquartile range for the observed unadjusted readmission rates across all included hospitals.
Similar to methods used by CMS, we used one year of data in the VA to assess hospital quality and variation in facility performance. First, we calculated the 30-day RSRRs using one year (2012) of data. To assess how variability changed with higher facility volume (ie, more years included in the analysis), we also calculated the 30-day RSRRs using two and three years of data. For this, we identified and quantified the number of hospitals whose RSRRs were calculated as being above or below the national VA average (mean ± 95% CI). Specifically, we calculated the number and percentage of hospitals that were classified as either above (+95% CI) or below the national average (−95% CI) using data from all three time periods. All analyses were conducted using SAS Enterprise Guide, Version 7.1. The SAS statistical packages made available by the CMS Measure Team were used to calculate RSRRs.
RESULTS
Patient Characteristics
Patients were predominantly older males (98.3%). Among those hospitalized for AMI, most of them had a history of previous coronary artery bypass graft (CABG) (69.1%), acute coronary syndrome (ACS; 66.2%), or documented coronary atherosclerosis (89.8%). Similarly, patients admitted for HF had high rates of CABG (71.3%) and HF (94.6%), in addition to cardiac arrhythmias (69.3%) and diabetes (60.8%). Patients admitted with a diagnosis of pneumonia had high rates of CABG (61.9%), chronic obstructive pulmonary disease (COPD; 58.1%), and previous diagnosis of pneumonia (78.8%; Table 1). Patient characteristics for two and three years of data are presented in Supplementary Table 1.
VA Hospitals with Sufficient Volume to Be Included in Profiling Assessments
There were 146 acute-care hospitals in the VA. In 2012, 56 (38%) VA hospitals had at least 25 admissions for AMI, 102 (70%) hospitals had at least 25 admissions for CHF, and 106 (73%) hospitals had at least 25 admissions for pneumonia (Table 1) and therefore qualified for analysis based on CMS criteria for 30-day RSRR calculation. The study sample included 3,571 patients with AMI, 10,609 patients with CHF, and 10,191 patients with pneumonia.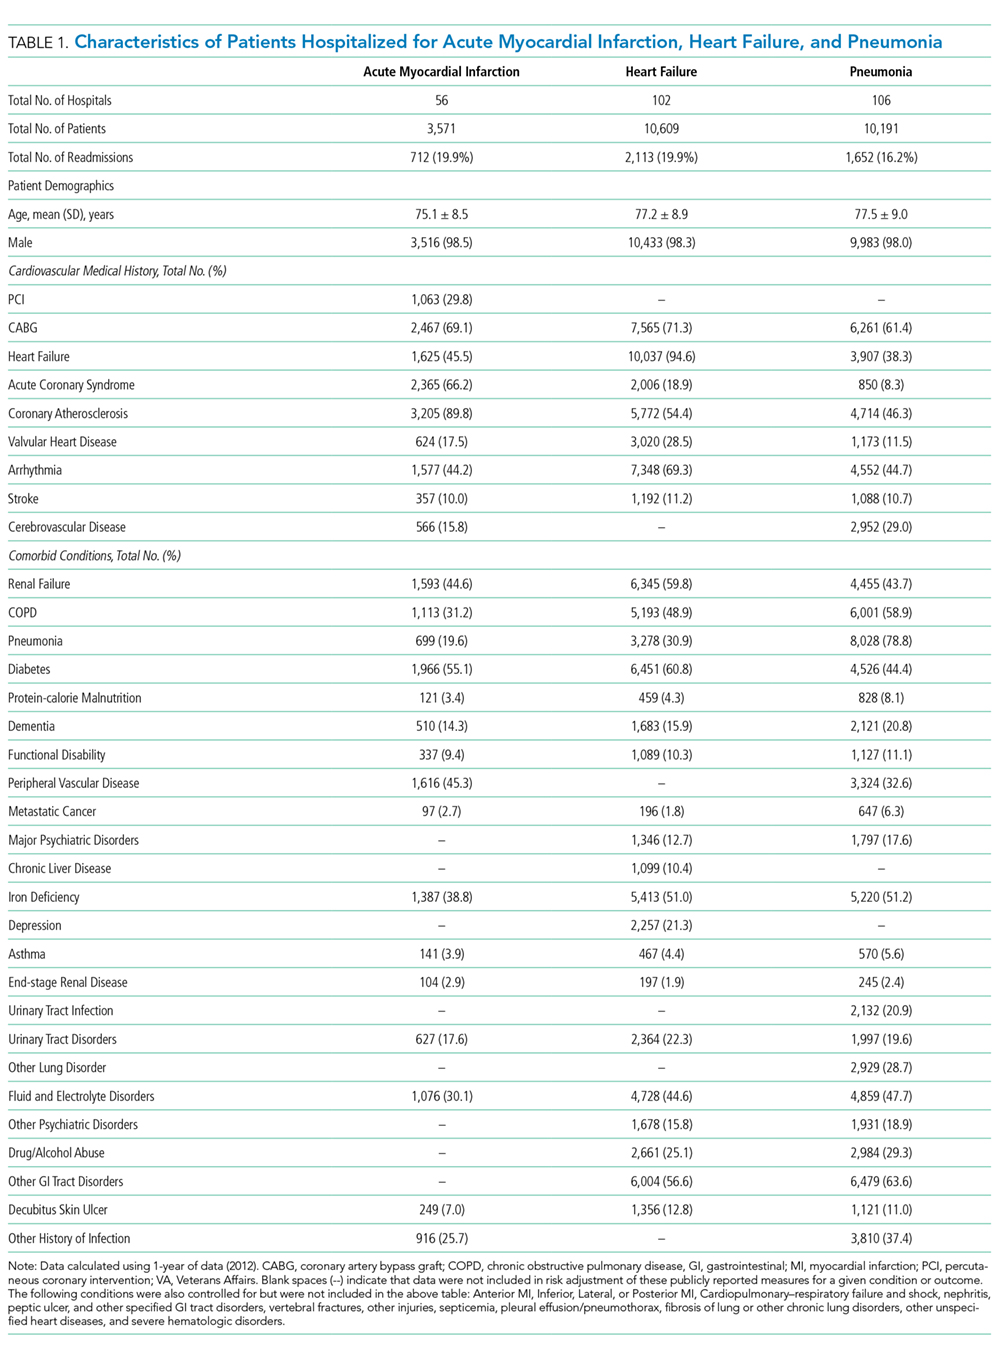
30-Day Readmission Rates
The mean observed readmission rates in 2012 were 20% (95% CI 19%-21%) among patients admitted for AMI, 20% (95% CI 19%-20%) for patients admitted with CHF, and 15% (95% CI 15%-16%) for patients admitted with pneumonia. No significant variation from these rates was noted following risk standardization across hospitals (Table 2). Observed and risk-standardized rates were also calculated for two and three years of data (Supplementary Table 2) but were not found to be grossly different when utilizing a single year of data.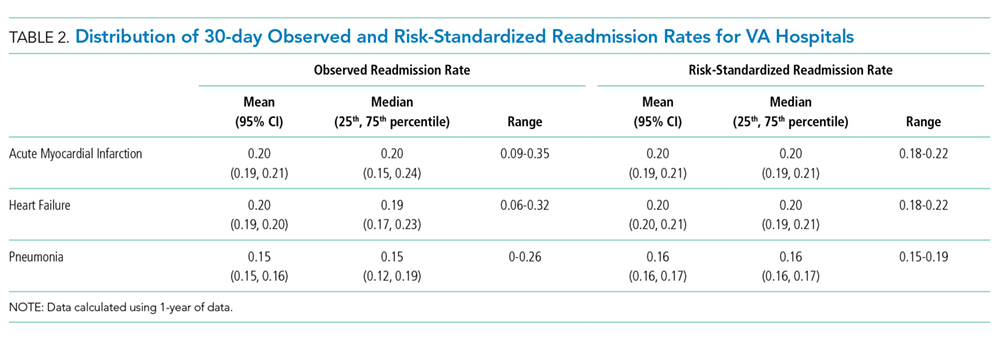
In 2012, two hospitals (2%) exhibited HF RSRRs worse than the national average (+95% CI), whereas no hospital demonstrated worse-than-average rates (+95% CI) for AMI or pneumonia (Table 3, Figure 1). Similarly, in 2012, only three hospitals had RSRRs better than the national average (−95% CI) for HF and pneumonia.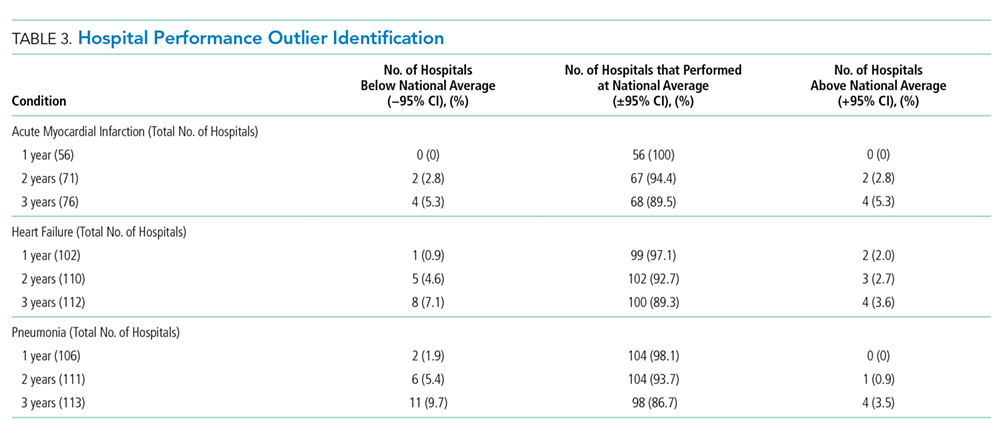
We combined data from three years to increase the volume of admissions per hospital. Even after combining three years of data across all three conditions, only four hospitals (range: 3.5%-5.3%) had RSRRs worse than the national average (+95% CI). However, four (5.3%), eight (7.1%), and 11 (9.7%) VA hospitals had RSRRs better than the national average (−95% CI).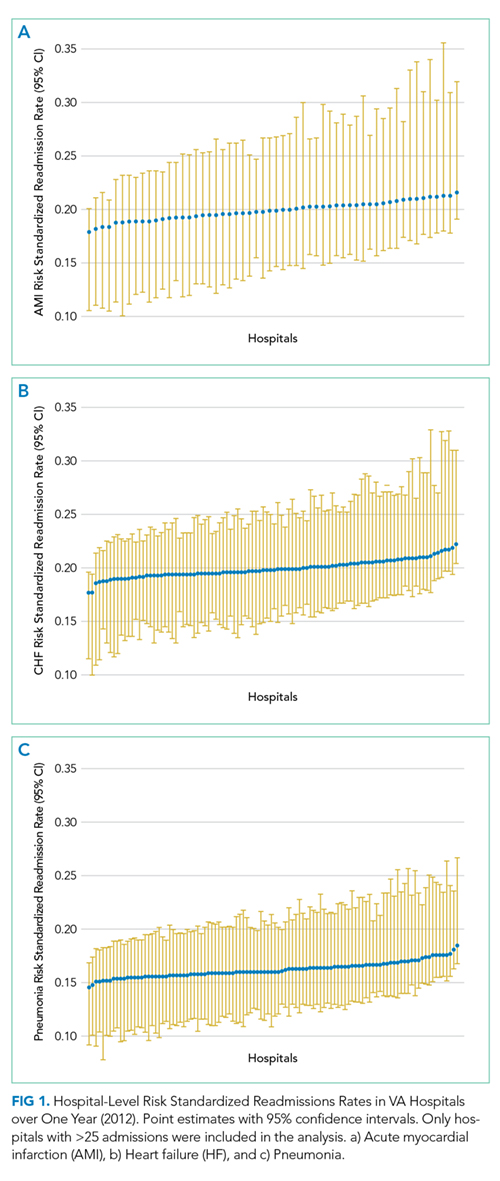
DISCUSSION
We found that the CMS-derived 30-day risk-stratified readmission metric for AMI, HF, and pneumonia showed little variation among VA hospitals. The lack of institutional 30-day readmission volume appears to be a fundamental limitation that subsequently requires multiple years of data to make this metric clinically meaningful. As the largest integrated healthcare system in the United States, the VA relies upon and makes large-scale programmatic decisions based on such performance data. The inability to detect meaningful interhospital variation in a timely manner suggests that the CMS-derived 30-day RSRR may not be a sensitive metric to distinguish facility performance or drive quality improvement initiatives within the VA.
First, we found it notable that among the 146 VA medical centers available for analysis,15 between 38% and 77% of hospitals qualified for evaluation when using CMS-based participation criteria—which excludes institutions with fewer than 25 episodes per year. Although this low degree of qualification for profiling was most dramatic when using one year of data (range: 38%-72%), we noted that it did not dramatically improve when we combined three years of data (range: 52%-77%). These findings act to highlight the population and systems differences between CMS and VA populations16 and further support the idea that CMS-derived models may not be optimized for use in the VA healthcare system.
Our findings are particularly relevant within the VA given the quarterly rate with which these data are reported within the VA SAIL scorecard.2 The VA designed SAIL for internal benchmarking to spotlight successful strategies of top performing institutions and promote high-quality, value-based care. Using one year of data, the minimum required to utilize CMS models, showed that quarterly feedback (ie, three months of data) may not be informative or useful given that few hospitals are able to differentiate themselves from the mean (±95% CI). Although the capacity to distinguish between high and low performers does improve by combining hospital admissions over three years, this is not a reasonable timeline for institutions to wait for quality comparisons. Furthermore, although the VA does present its data on CMS’s Hospital Compare website using three years of combined data, the variability and distribution of such results are not supplied.3
This lack of discriminability raises concerns about the ability to compare hospital performance between low- and high-volume institutions. Although these models function well in CMS settings with large patient volumes in which greater variability exists,5 they lose their capacity to discriminate when applied to low-volume settings such as the VA. Given that several hospitals in the US are small community hospitals with low patient volumes,17 this issue probably occurs in other non-VA settings. Although our study focuses on the VA, others have been able to compare VA and non-VA settings’ variation and distribution. For example, Nuti et al. explored the differences in 30-day RSRRs among hospitalized patients with AMI, HF, and pneumonia and similarly showed little variation, narrow distributions, and few outliers in the VA setting compared to those in the non-VA setting. For small patient volume institutions, including the VA, a focus on high-volume services, outcomes, and measures (ie, blood pressure control, medication reconciliation, etc.) may offer more discriminability between high- and low-performing facilities. For example, Patel et al. found that VA process measures in patients with HF (ie, beta-blocker and ACE-inhibitor use) can be used as valid quality measures as they exhibited consistent reliability over time and validity with adjusted mortality rates, whereas the 30-day RSRR did not.18
Our findings may have substantial financial, resource, and policy implications. Automatically developing and reporting measures created for the Medicare program in the VA may not be a good use of VA resources. In addition, facilities may react to these reported outcomes and expend local resources and finances to implement interventions to improve on a performance outcome whose measure is statistically no different than the vast majority of its comparators. Such events have been highlighted in the public media and have pointed to the fact that small changes in quality, or statistical errors themselves, can have large ramifications within the VA’s hospital rating system.19
These findings may also add to the discussion on whether public reporting of health and quality outcomes improves patient care. Since the CMS began public reporting on RSRRs in 2009, these rates have fallen for all three examined conditions (AMI, HF, and pneumonia),7,20,21 in addition to several other health outcomes.17 Although recent studies have suggested that these decreased rates have been driven by the CMS-sponsored Hospital Readmissions Reduction Program (HRRP),22 others have suggested that these findings are consistent with ongoing secular trends toward decreased readmissions and may not be completely explained by public reporting alone.23 Moreover, prior work has also found that readmissions may be strongly impacted by factors external to the hospital setting, such as patients’ social demographics (ie, household income, social isolation), that are not currently captured in risk-prediction models.24 Given the small variability we see in our data, public reporting within the VA is probably not beneficial, as only a small number of facilities are outliers based on RSRR.
Our study has several limitations. First, although we adapted the CMS model to the VA, we did not include gender in the model because >99% of all patient admissions were male. Second, we assessed only three medical conditions that were being tracked by both CMS and VA during this time period, and these outcomes may not be representative of other aspects of care and cannot be generalized to other medical conditions. Finally, more contemporary data could lead to differing results – though we note that no large-scale structural or policy changes addressing readmission rates have been implemented within the VA since our study period.
The results of this study suggest that the CMS-derived 30-day risk-stratified readmission metric for AMI, HF, and pneumonia may not have the capacity to properly detect interfacility variance and thus may not be an optimal quality indicator within the VA. As the VA and other healthcare systems continually strive to improve the quality of care they provide, they will require more accurate and timely metrics for which to index their performance.
Disclosures
The authors have nothing to disclose
1. Medicare C for, Baltimore MS 7500 SB, Usa M. VA Data. https://www.cms.gov/Medicare/Quality-Initiatives-Patient-Assessment-Instruments/HospitalQualityInits/VA-Data.html. Published October 19, 2016. Accessed July 15, 2018.
2. Strategic Analytics for Improvement and Learning (SAIL) - Quality of Care. https://www.va.gov/QUALITYOFCARE/measure-up/Strategic_Analytics_for_Improvement_and_Learning_SAIL.asp. Accessed July 15, 2018.
3. Snapshot. https://www.cms.gov/Medicare/Quality-Initiatives-Patient-Assessment-Instruments/HospitalQualityInits/VA-Data.html. Accessed September 10, 2018.
4. Bradley EH, Curry L, Horwitz LI, et al. Hospital strategies associated with 30-day readmission rates for patients with heart failure. Circ Cardiovasc Qual Outcomes. 2013;6(4):444-450. doi: 10.1161/CIRCOUTCOMES.111.000101. PubMed
5. Desai NR, Ross JS, Kwon JY, et al. Association between hospital penalty status under the hospital readmission reduction program and readmission rates for target and nontarget conditions. JAMA. 2016;316(24):2647-2656. doi: 10.1001/jama.2016.18533. PubMed
6. McIlvennan CK, Eapen ZJ, Allen LA. Hospital readmissions reduction program. Circulation. 2015;131(20):1796-1803. doi: 10.1161/CIRCULATIONAHA.114.010270. PubMed
7. Suter LG, Li S-X, Grady JN, et al. National patterns of risk-standardized mortality and readmission after hospitalization for acute myocardial infarction, heart failure, and pneumonia: update on publicly reported outcomes measures based on the 2013 release. J Gen Intern Med. 2014;29(10):1333-1340. doi: 10.1007/s11606-014-2862-5. PubMed
8. O’Brien WJ, Chen Q, Mull HJ, et al. What is the value of adding Medicare data in estimating VA hospital readmission rates? Health Serv Res. 2015;50(1):40-57. doi: 10.1111/1475-6773.12207. PubMed
9. NQF: All-Cause Admissions and Readmissions 2015-2017 Technical Report. https://www.qualityforum.org/Publications/2017/04/All-Cause_Admissions_and_Readmissions_2015-2017_Technical_Report.aspx. Accessed August 2, 2018.
10. Keenan PS, Normand S-LT, Lin Z, et al. An administrative claims measure suitable for profiling hospital performance on the basis of 30-day all-cause readmission rates among patients with heart failure. Circ Cardiovasc Qual Outcomes. 2008;1(1):29-37. doi: 10.1161/CIRCOUTCOMES.108.802686. PubMed
11. Krumholz HM, Lin Z, Drye EE, et al. An administrative claims measure suitable for profiling hospital performance based on 30-day all-cause readmission rates among patients with acute myocardial infarction. Circ Cardiovasc Qual Outcomes. 2011;4(2):243-252. doi: 10.1161/CIRCOUTCOMES.110.957498. PubMed
12. Lindenauer PK, Normand S-LT, Drye EE, et al. Development, validation, and results of a measure of 30-day readmission following hospitalization for pneumonia. J Hosp Med. 2011;6(3):142-150. doi: 10.1002/jhm.890. PubMed
13. Medicare C for, Baltimore MS 7500 SB, Usa M. OutcomeMeasures. https://www.cms.gov/Medicare/Quality-Initiatives-Patient-Assessment-Instruments/HospitalQualityInits/OutcomeMeasures.html. Published October 13, 2017. Accessed July 19, 2018.
14. Nuti SV, Qin L, Rumsfeld JS, et al. Association of admission to Veterans Affairs hospitals vs non-Veterans Affairs hospitals with mortality and readmission rates among older hospitalized with acute myocardial infarction, heart failure, or pneumonia. JAMA. 2016;315(6):582-592. doi: 10.1001/jama.2016.0278. PubMed
15. Solutions VW. Veterans Health Administration - Locations. https://www.va.gov/directory/guide/division.asp?dnum=1. Accessed September 13, 2018.
16. Duan-Porter W (Denise), Martinson BC, Taylor B, et al. Evidence Review: Social Determinants of Health for Veterans. Washington (DC): Department of Veterans Affairs (US); 2017. http://www.ncbi.nlm.nih.gov/books/NBK488134/. Accessed June 13, 2018.
17. Fast Facts on U.S. Hospitals, 2018 | AHA. American Hospital Association. https://www.aha.org/statistics/fast-facts-us-hospitals. Accessed September 5, 2018.
18. Patel J, Sandhu A, Parizo J, Moayedi Y, Fonarow GC, Heidenreich PA. Validity of performance and outcome measures for heart failure. Circ Heart Fail. 2018;11(9):e005035. PubMed
19. Philipps D. Canceled Operations. Unsterile Tools. The V.A. Gave This Hospital 5 Stars. The New York Times. https://www.nytimes.com/2018/11/01/us/veterans-hospitals-rating-system-star.html. Published November 3, 2018. Accessed November 19, 2018.
20. DeVore AD, Hammill BG, Hardy NC, Eapen ZJ, Peterson ED, Hernandez AF. Has public reporting of hospital readmission rates affected patient outcomes?: Analysis of Medicare claims data. J Am Coll Cardiol. 2016;67(8):963-972. doi: 10.1016/j.jacc.2015.12.037. PubMed
21. Wasfy JH, Zigler CM, Choirat C, Wang Y, Dominici F, Yeh RW. Readmission rates after passage of the hospital readmissions reduction program: a pre-post analysis. Ann Intern Med. 2017;166(5):324-331. doi: 10.7326/M16-0185. PubMed
22. Medicare C for, Baltimore MS 7500 SB, Usa M. Hospital Readmission Reduction Program. https://www.cms.gov/Medicare/Quality-Initiatives-Patient-Assessment-Instruments/Value-Based-Programs/HRRP/Hospital-Readmission-Reduction-Program.html. Published March 26, 2018. Accessed July 19, 2018.
23. Radford MJ. Does public reporting improve care? J Am Coll Cardiol. 2016;67(8):973-975. doi: 10.1016/j.jacc.2015.12.038. PubMed
24. Barnett ML, Hsu J, McWilliams JM. Patient characteristics and differences in hospital readmission rates. JAMA Intern Med. 2015;175(11):1803-1812. doi: 10.1001/jamainternmed.2015.4660. PubMed
Using methodology created by the Centers for Medicare & Medicaid Services (CMS), the Department of Veterans Affairs (VA) calculates and reports hospital performance measures for several key conditions, including acute myocardial infarction (AMI), heart failure (HF), and pneumonia.1 These measures are designed to benchmark individual hospitals against how average hospitals perform when caring for a similar case-mix index. Because readmissions to the hospital within 30-days of discharge are common and costly, this metric has garnered extensive attention in recent years.
To summarize the 30-day readmission metric, the VA utilizes the Strategic Analytics for Improvement and Learning (SAIL) system to present internally its findings to VA practitioners and leadership.2 The VA provides these data as a means to drive quality improvement and allow for comparison of individual hospitals’ performance across measures throughout the VA healthcare system. Since 2010, the VA began using and publicly reporting the CMS-derived 30-day Risk-Stratified Readmission Rate (RSRR) on the Hospital Compare website.3 Similar to CMS, the VA uses three years of combined data so that patients, providers, and other stakeholders can compare individual hospitals’ performance across these measures.1 In response to this, hospitals and healthcare organizations have implemented quality improvement and large-scale programmatic interventions in an attempt to improve quality around readmissions.4-6 A recent assessment on how hospitals within the Medicare fee-for-service program have responded to such reporting found large degrees of variability, with more than half of the participating institutions facing penalties due to greater-than-expected readmission rates.5 Although the VA utilizes the same CMS-derived model in its assessments and reporting, the variability and distribution around this metric are not publicly reported—thus making it difficult to ascertain how individual VA hospitals compare with one another. Without such information, individual facilities may not know how to benchmark the quality of their care to others, nor would the VA recognize which interventions addressing readmissions are working, and which are not. Although previous assessments of interinstitutional variance have been performed in Medicare populations,7 a focused analysis of such variance within the VA has yet to be performed.
In this study, we performed a multiyear assessment of the CMS-derived 30-day RSRR metric for AMI, HF, and pneumonia as a useful measure to drive VA quality improvement or distinguish VA facility performance based on its ability to detect interfacility variability.
METHODS
Data Source
We used VA administrative and Medicare claims data from 2010 to 2012. After identifying index hospitalizations to VA hospitals, we obtained patients’ respective inpatient Medicare claims data from the Medicare Provider Analysis and Review (MedPAR) and Outpatient files. All Medicare records were linked to VA records via scrambled Social Security numbers and were provided by the VA Information Resource Center. This study was approved by the San Francisco VA Medical Center Institutional Review Board.
Study Sample
Our cohort consisted of hospitalized VA beneficiary and Medicare fee-for-service patients who were aged ≥65 years and admitted to and discharged from a VA acute care center with a primary discharge diagnosis of AMI, HF, or pneumonia. These comorbidities were chosen as they are publicly reported and frequently used for interfacility comparisons. Because studies have found that inclusion of secondary payer data (ie, CMS data) may affect hospital-profiling outcomes, we included Medicare data on all available patients.8 We excluded hospitalizations that resulted in a transfer to another acute care facility and those admitted to observation status at their index admission. To ensure a full year of data for risk adjustment, beneficiaries were included only if they were enrolled in Medicare for 12 months prior to and including the date of the index admission.
Index hospitalizations were first identified using VA-only inpatient data similar to methods outlined by the CMS and endorsed by the National Quality Forum for Hospital Profiling.9 An index hospitalization was defined as an acute inpatient discharge between 2010 and 2012 in which the principal diagnosis was AMI, HF, or pneumonia. We excluded in-hospital deaths, discharges against medical advice, and--for the AMI cohort only--discharges on the same day as admission. Patients may have multiple admissions per year, but only admissions after 30 days of discharge from an index admission were eligible to be included as an additional index admission.
Outcomes
A readmission was defined as any unplanned rehospitalization to either non-VA or VA acute care facilities for any cause within 30 days of discharge from the index hospitalization. Readmissions to observation status or nonacute or rehabilitation units, such as skilled nursing facilities, were not included. Planned readmissions for elective procedures, such as elective chemotherapy and revascularization following an AMI index admission, were not considered as an outcome event.
Risk Standardization for 30-day Readmission
Using approaches developed by CMS,10-12 we calculated hospital-specific 30-day RSRRs for each VA. Briefly, the RSRR is a ratio of the number of predicted readmissions within 30 days of discharge to the expected number of readmissions within 30 days of hospital discharge, multiplied by the national unadjusted 30-day readmission rate. This measure calculates hospital-specific RSRRs using hierarchical logistic regression models, which account for clustering of patients within hospitals and risk-adjusting for differences in case-mix, during the assessed time periods.13 This approach simultaneously models two levels (patient and hospital) to account for the variance in patient outcomes within and between hospitals.14 At the patient level, the model uses the log odds of readmissions as the dependent variable and age and selected comorbidities as the independent variables. The second level models the hospital-specific intercepts. According to CMS guidelines, the analysis was limited to facilities with at least 25 patient admissions annually for each condition. All readmissions were attributed to the hospital that initially discharged the patient to a nonacute setting.
Analysis
We examined and reported the distribution of patient and clinical characteristics at the hospital level. For each condition, we determined the number of hospitals that had a sufficient number of admissions (n ≥ 25) to be included in the analyses. We calculated the mean, median, and interquartile range for the observed unadjusted readmission rates across all included hospitals.
Similar to methods used by CMS, we used one year of data in the VA to assess hospital quality and variation in facility performance. First, we calculated the 30-day RSRRs using one year (2012) of data. To assess how variability changed with higher facility volume (ie, more years included in the analysis), we also calculated the 30-day RSRRs using two and three years of data. For this, we identified and quantified the number of hospitals whose RSRRs were calculated as being above or below the national VA average (mean ± 95% CI). Specifically, we calculated the number and percentage of hospitals that were classified as either above (+95% CI) or below the national average (−95% CI) using data from all three time periods. All analyses were conducted using SAS Enterprise Guide, Version 7.1. The SAS statistical packages made available by the CMS Measure Team were used to calculate RSRRs.
RESULTS
Patient Characteristics
Patients were predominantly older males (98.3%). Among those hospitalized for AMI, most of them had a history of previous coronary artery bypass graft (CABG) (69.1%), acute coronary syndrome (ACS; 66.2%), or documented coronary atherosclerosis (89.8%). Similarly, patients admitted for HF had high rates of CABG (71.3%) and HF (94.6%), in addition to cardiac arrhythmias (69.3%) and diabetes (60.8%). Patients admitted with a diagnosis of pneumonia had high rates of CABG (61.9%), chronic obstructive pulmonary disease (COPD; 58.1%), and previous diagnosis of pneumonia (78.8%; Table 1). Patient characteristics for two and three years of data are presented in Supplementary Table 1.
VA Hospitals with Sufficient Volume to Be Included in Profiling Assessments
There were 146 acute-care hospitals in the VA. In 2012, 56 (38%) VA hospitals had at least 25 admissions for AMI, 102 (70%) hospitals had at least 25 admissions for CHF, and 106 (73%) hospitals had at least 25 admissions for pneumonia (Table 1) and therefore qualified for analysis based on CMS criteria for 30-day RSRR calculation. The study sample included 3,571 patients with AMI, 10,609 patients with CHF, and 10,191 patients with pneumonia.
30-Day Readmission Rates
The mean observed readmission rates in 2012 were 20% (95% CI 19%-21%) among patients admitted for AMI, 20% (95% CI 19%-20%) for patients admitted with CHF, and 15% (95% CI 15%-16%) for patients admitted with pneumonia. No significant variation from these rates was noted following risk standardization across hospitals (Table 2). Observed and risk-standardized rates were also calculated for two and three years of data (Supplementary Table 2) but were not found to be grossly different when utilizing a single year of data.
In 2012, two hospitals (2%) exhibited HF RSRRs worse than the national average (+95% CI), whereas no hospital demonstrated worse-than-average rates (+95% CI) for AMI or pneumonia (Table 3, Figure 1). Similarly, in 2012, only three hospitals had RSRRs better than the national average (−95% CI) for HF and pneumonia.
We combined data from three years to increase the volume of admissions per hospital. Even after combining three years of data across all three conditions, only four hospitals (range: 3.5%-5.3%) had RSRRs worse than the national average (+95% CI). However, four (5.3%), eight (7.1%), and 11 (9.7%) VA hospitals had RSRRs better than the national average (−95% CI).
DISCUSSION
We found that the CMS-derived 30-day risk-stratified readmission metric for AMI, HF, and pneumonia showed little variation among VA hospitals. The lack of institutional 30-day readmission volume appears to be a fundamental limitation that subsequently requires multiple years of data to make this metric clinically meaningful. As the largest integrated healthcare system in the United States, the VA relies upon and makes large-scale programmatic decisions based on such performance data. The inability to detect meaningful interhospital variation in a timely manner suggests that the CMS-derived 30-day RSRR may not be a sensitive metric to distinguish facility performance or drive quality improvement initiatives within the VA.
First, we found it notable that among the 146 VA medical centers available for analysis,15 between 38% and 77% of hospitals qualified for evaluation when using CMS-based participation criteria—which excludes institutions with fewer than 25 episodes per year. Although this low degree of qualification for profiling was most dramatic when using one year of data (range: 38%-72%), we noted that it did not dramatically improve when we combined three years of data (range: 52%-77%). These findings act to highlight the population and systems differences between CMS and VA populations16 and further support the idea that CMS-derived models may not be optimized for use in the VA healthcare system.
Our findings are particularly relevant within the VA given the quarterly rate with which these data are reported within the VA SAIL scorecard.2 The VA designed SAIL for internal benchmarking to spotlight successful strategies of top performing institutions and promote high-quality, value-based care. Using one year of data, the minimum required to utilize CMS models, showed that quarterly feedback (ie, three months of data) may not be informative or useful given that few hospitals are able to differentiate themselves from the mean (±95% CI). Although the capacity to distinguish between high and low performers does improve by combining hospital admissions over three years, this is not a reasonable timeline for institutions to wait for quality comparisons. Furthermore, although the VA does present its data on CMS’s Hospital Compare website using three years of combined data, the variability and distribution of such results are not supplied.3
This lack of discriminability raises concerns about the ability to compare hospital performance between low- and high-volume institutions. Although these models function well in CMS settings with large patient volumes in which greater variability exists,5 they lose their capacity to discriminate when applied to low-volume settings such as the VA. Given that several hospitals in the US are small community hospitals with low patient volumes,17 this issue probably occurs in other non-VA settings. Although our study focuses on the VA, others have been able to compare VA and non-VA settings’ variation and distribution. For example, Nuti et al. explored the differences in 30-day RSRRs among hospitalized patients with AMI, HF, and pneumonia and similarly showed little variation, narrow distributions, and few outliers in the VA setting compared to those in the non-VA setting. For small patient volume institutions, including the VA, a focus on high-volume services, outcomes, and measures (ie, blood pressure control, medication reconciliation, etc.) may offer more discriminability between high- and low-performing facilities. For example, Patel et al. found that VA process measures in patients with HF (ie, beta-blocker and ACE-inhibitor use) can be used as valid quality measures as they exhibited consistent reliability over time and validity with adjusted mortality rates, whereas the 30-day RSRR did not.18
Our findings may have substantial financial, resource, and policy implications. Automatically developing and reporting measures created for the Medicare program in the VA may not be a good use of VA resources. In addition, facilities may react to these reported outcomes and expend local resources and finances to implement interventions to improve on a performance outcome whose measure is statistically no different than the vast majority of its comparators. Such events have been highlighted in the public media and have pointed to the fact that small changes in quality, or statistical errors themselves, can have large ramifications within the VA’s hospital rating system.19
These findings may also add to the discussion on whether public reporting of health and quality outcomes improves patient care. Since the CMS began public reporting on RSRRs in 2009, these rates have fallen for all three examined conditions (AMI, HF, and pneumonia),7,20,21 in addition to several other health outcomes.17 Although recent studies have suggested that these decreased rates have been driven by the CMS-sponsored Hospital Readmissions Reduction Program (HRRP),22 others have suggested that these findings are consistent with ongoing secular trends toward decreased readmissions and may not be completely explained by public reporting alone.23 Moreover, prior work has also found that readmissions may be strongly impacted by factors external to the hospital setting, such as patients’ social demographics (ie, household income, social isolation), that are not currently captured in risk-prediction models.24 Given the small variability we see in our data, public reporting within the VA is probably not beneficial, as only a small number of facilities are outliers based on RSRR.
Our study has several limitations. First, although we adapted the CMS model to the VA, we did not include gender in the model because >99% of all patient admissions were male. Second, we assessed only three medical conditions that were being tracked by both CMS and VA during this time period, and these outcomes may not be representative of other aspects of care and cannot be generalized to other medical conditions. Finally, more contemporary data could lead to differing results – though we note that no large-scale structural or policy changes addressing readmission rates have been implemented within the VA since our study period.
The results of this study suggest that the CMS-derived 30-day risk-stratified readmission metric for AMI, HF, and pneumonia may not have the capacity to properly detect interfacility variance and thus may not be an optimal quality indicator within the VA. As the VA and other healthcare systems continually strive to improve the quality of care they provide, they will require more accurate and timely metrics for which to index their performance.
Disclosures
The authors have nothing to disclose
1. Medicare C for, Baltimore MS 7500 SB, Usa M. VA Data. https://www.cms.gov/Medicare/Quality-Initiatives-Patient-Assessment-Instruments/HospitalQualityInits/VA-Data.html. Published October 19, 2016. Accessed July 15, 2018.
2. Strategic Analytics for Improvement and Learning (SAIL) - Quality of Care. https://www.va.gov/QUALITYOFCARE/measure-up/Strategic_Analytics_for_Improvement_and_Learning_SAIL.asp. Accessed July 15, 2018.
3. Snapshot. https://www.cms.gov/Medicare/Quality-Initiatives-Patient-Assessment-Instruments/HospitalQualityInits/VA-Data.html. Accessed September 10, 2018.
4. Bradley EH, Curry L, Horwitz LI, et al. Hospital strategies associated with 30-day readmission rates for patients with heart failure. Circ Cardiovasc Qual Outcomes. 2013;6(4):444-450. doi: 10.1161/CIRCOUTCOMES.111.000101. PubMed
5. Desai NR, Ross JS, Kwon JY, et al. Association between hospital penalty status under the hospital readmission reduction program and readmission rates for target and nontarget conditions. JAMA. 2016;316(24):2647-2656. doi: 10.1001/jama.2016.18533. PubMed
6. McIlvennan CK, Eapen ZJ, Allen LA. Hospital readmissions reduction program. Circulation. 2015;131(20):1796-1803. doi: 10.1161/CIRCULATIONAHA.114.010270. PubMed
7. Suter LG, Li S-X, Grady JN, et al. National patterns of risk-standardized mortality and readmission after hospitalization for acute myocardial infarction, heart failure, and pneumonia: update on publicly reported outcomes measures based on the 2013 release. J Gen Intern Med. 2014;29(10):1333-1340. doi: 10.1007/s11606-014-2862-5. PubMed
8. O’Brien WJ, Chen Q, Mull HJ, et al. What is the value of adding Medicare data in estimating VA hospital readmission rates? Health Serv Res. 2015;50(1):40-57. doi: 10.1111/1475-6773.12207. PubMed
9. NQF: All-Cause Admissions and Readmissions 2015-2017 Technical Report. https://www.qualityforum.org/Publications/2017/04/All-Cause_Admissions_and_Readmissions_2015-2017_Technical_Report.aspx. Accessed August 2, 2018.
10. Keenan PS, Normand S-LT, Lin Z, et al. An administrative claims measure suitable for profiling hospital performance on the basis of 30-day all-cause readmission rates among patients with heart failure. Circ Cardiovasc Qual Outcomes. 2008;1(1):29-37. doi: 10.1161/CIRCOUTCOMES.108.802686. PubMed
11. Krumholz HM, Lin Z, Drye EE, et al. An administrative claims measure suitable for profiling hospital performance based on 30-day all-cause readmission rates among patients with acute myocardial infarction. Circ Cardiovasc Qual Outcomes. 2011;4(2):243-252. doi: 10.1161/CIRCOUTCOMES.110.957498. PubMed
12. Lindenauer PK, Normand S-LT, Drye EE, et al. Development, validation, and results of a measure of 30-day readmission following hospitalization for pneumonia. J Hosp Med. 2011;6(3):142-150. doi: 10.1002/jhm.890. PubMed
13. Medicare C for, Baltimore MS 7500 SB, Usa M. OutcomeMeasures. https://www.cms.gov/Medicare/Quality-Initiatives-Patient-Assessment-Instruments/HospitalQualityInits/OutcomeMeasures.html. Published October 13, 2017. Accessed July 19, 2018.
14. Nuti SV, Qin L, Rumsfeld JS, et al. Association of admission to Veterans Affairs hospitals vs non-Veterans Affairs hospitals with mortality and readmission rates among older hospitalized with acute myocardial infarction, heart failure, or pneumonia. JAMA. 2016;315(6):582-592. doi: 10.1001/jama.2016.0278. PubMed
15. Solutions VW. Veterans Health Administration - Locations. https://www.va.gov/directory/guide/division.asp?dnum=1. Accessed September 13, 2018.
16. Duan-Porter W (Denise), Martinson BC, Taylor B, et al. Evidence Review: Social Determinants of Health for Veterans. Washington (DC): Department of Veterans Affairs (US); 2017. http://www.ncbi.nlm.nih.gov/books/NBK488134/. Accessed June 13, 2018.
17. Fast Facts on U.S. Hospitals, 2018 | AHA. American Hospital Association. https://www.aha.org/statistics/fast-facts-us-hospitals. Accessed September 5, 2018.
18. Patel J, Sandhu A, Parizo J, Moayedi Y, Fonarow GC, Heidenreich PA. Validity of performance and outcome measures for heart failure. Circ Heart Fail. 2018;11(9):e005035. PubMed
19. Philipps D. Canceled Operations. Unsterile Tools. The V.A. Gave This Hospital 5 Stars. The New York Times. https://www.nytimes.com/2018/11/01/us/veterans-hospitals-rating-system-star.html. Published November 3, 2018. Accessed November 19, 2018.
20. DeVore AD, Hammill BG, Hardy NC, Eapen ZJ, Peterson ED, Hernandez AF. Has public reporting of hospital readmission rates affected patient outcomes?: Analysis of Medicare claims data. J Am Coll Cardiol. 2016;67(8):963-972. doi: 10.1016/j.jacc.2015.12.037. PubMed
21. Wasfy JH, Zigler CM, Choirat C, Wang Y, Dominici F, Yeh RW. Readmission rates after passage of the hospital readmissions reduction program: a pre-post analysis. Ann Intern Med. 2017;166(5):324-331. doi: 10.7326/M16-0185. PubMed
22. Medicare C for, Baltimore MS 7500 SB, Usa M. Hospital Readmission Reduction Program. https://www.cms.gov/Medicare/Quality-Initiatives-Patient-Assessment-Instruments/Value-Based-Programs/HRRP/Hospital-Readmission-Reduction-Program.html. Published March 26, 2018. Accessed July 19, 2018.
23. Radford MJ. Does public reporting improve care? J Am Coll Cardiol. 2016;67(8):973-975. doi: 10.1016/j.jacc.2015.12.038. PubMed
24. Barnett ML, Hsu J, McWilliams JM. Patient characteristics and differences in hospital readmission rates. JAMA Intern Med. 2015;175(11):1803-1812. doi: 10.1001/jamainternmed.2015.4660. PubMed
© 2019 Society of Hospital Medicine
Limitation of Life-Sustaining Care in the Critically Ill: A Systematic Review of the Literature
Access to life-sustaining treatment (LST) became a mainstay in hospitals across the United States in the 1970s. This has raised complex ethical questions surrounding the use of these therapies, particularly in the face of a poor prognosis or significant morbidity. The Society for Critical Care Medicine formed a consensus panel in 1989 to construct ethical guidelines regarding the initiation, continuation, and withdrawal of intensive care.1 These guidelines emphasized that withdrawing and withholding are not only permissible but may be necessary to preserve the balance between quantity and quality of life. Nevertheless, an increasing number of Americans are dying after aggressive LST in the hospital, and greater than one in five deaths occur after admission to the ICU.2 Understanding the factors associated with decisions to withhold or withdraw LST are important to policy makers, ethicists, and healthcare leaders because they affect resources used at the end of life and the need for palliative care and hospice in the ICU setting.
Several studies have characterized the patient characteristics, incidence, and variability associated with limitation of LST in various populations of critically ill patients in the US. We are unaware of another systematic review of the literature that has examined data from these studies in order to understand the process and outcomes of LST limitations. We defined limitations of LST as decisions to withdraw or withhold cardiopulmonary resuscitation through Do Not Resuscitate (DNR) orders, mechanical ventilation, renal replacement therapy, intravenous blood pressure support, or artificial nutrition (enteric or intravenous).
METHODS
The Preferred Reporting Items for Systematic Reviews and Meta-Analyses statement was used for reporting. A comprehensive literature search was performed by a medical librarian (TWE) in Ovid MEDLINE, PubMed, Embase, the full Cochrane Library, CINAHL, PsycINFO, the Philosopher’s Index, Scopus, Web of Science, and Google Scholar. PubMed was limited to non-MEDLINE records in order to complement the Ovid results. The Georgetown Bioethics Research Library at the Kennedy Institute (https://bioethics.georgetown.edu/) was also searched for any unpublished literature. Initial searches were conducted in December 2014, and an update was performed in April 2017. All databases were searched from inception, and bibliographies of relevant studies were reviewed for additional references (Appendix 1).
Database-specific subject headings and keyword variants for each of the five main concepts—intensive care, end-of-life, decision making, limitation of treatment, and death—were identified and combined. Results were limited to the adult population and to the English language.
Two authors independently reviewed article titles and abstracts (KM, AMT). The full text of potentially eligible studies was then reviewed for inclusion. All disputes were discussed and resolved by consensus. The criteria for inclusion were reporting of patient-level data, critical care patients only (or reported separately from other unit types), US setting, and reporting of data on limitations of LST. The exclusion criteria were studies published only as research abstracts, surveys of physicians or families, organ donors, studies of brain death, surveys, patients less than 18 years old, and long-term intensive care settings (ie, long-term acute care hospitals, long-term respiratory units). Also excluded were studies in which an intervention was performed; as a result, all included studies were observational. Research abstracts were excluded because they lacked sufficient detail from which to abstract study quality or results. Studies of organ donation, brain death, and pediatrics were excluded due to differences in the decision-making context that would make it difficult to draw conclusions about adult ICU care. Studies which included an intervention were excluded to avoid affecting the rate of limitation of LST as a result of the intervention, since our goal was to quantify the number of limitations of LST in usual medical practice.
For each article, we abstracted the number of patients who experienced a limitation of LST out of the total population and factors associated with the limitation. If a multivariable analysis was performed, we reported only variables that remained significant in this analysis. We also reported the number of patients who died, and of those, the number of decedents who underwent a limitation of LST before death. In some cases, this proportion was not reported in the manuscript but could be calculated based on the data presented. This number was calculated based on the number of deaths that were preceded by a limitation in life-sustaining care divided by the total number of deaths. Patients with brain death were not counted as having had a “limitation” if support was withdrawn after the declaration of brain death. We were unable to conduct a meta-analysis of the findings because of the wide variation in study populations and criteria used to define limitations of care.
To assess risk of bias in individual studies, the two raters independently made a yes/no determination regarding several quality metrics established at the outset of the review: clarity of the eligibility criteria for participant inclusion, whether a power or sample size calculation was done, adequacy of the description of the sampling approach and recruitment, and generalizability. Disagreements were resolved by consensus.
RESULTS
Study Selection
A total of 2,460 references were identified, and after removal of 578 duplicates, 1,882 unique titles and abstracts were reviewed. One hundred thirteen titles met the inclusion criteria. After review of complete texts, 83 were excluded based on the above criteria (Appendix). This led to a final number of 36 studies included for analysis.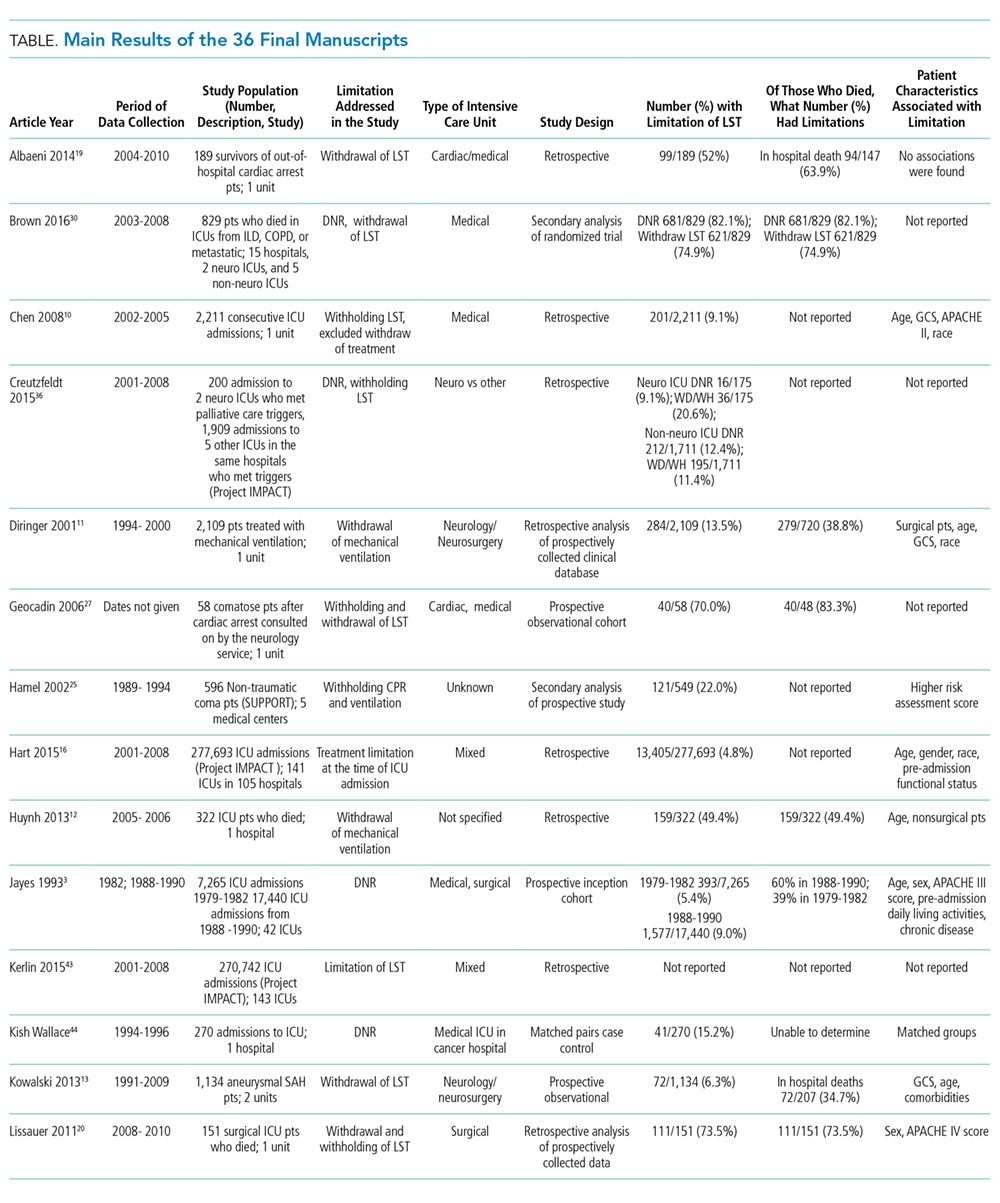
Fifteen articles were prospective, observational studies. The rest were retrospective analyses of patient-level data. Seven were large, multicenter studies with greater than 20 centers involved (including Project IMPACT); six such studies included medical and surgical patients. The remaining large, multicenter study examined a surgical trauma cohort.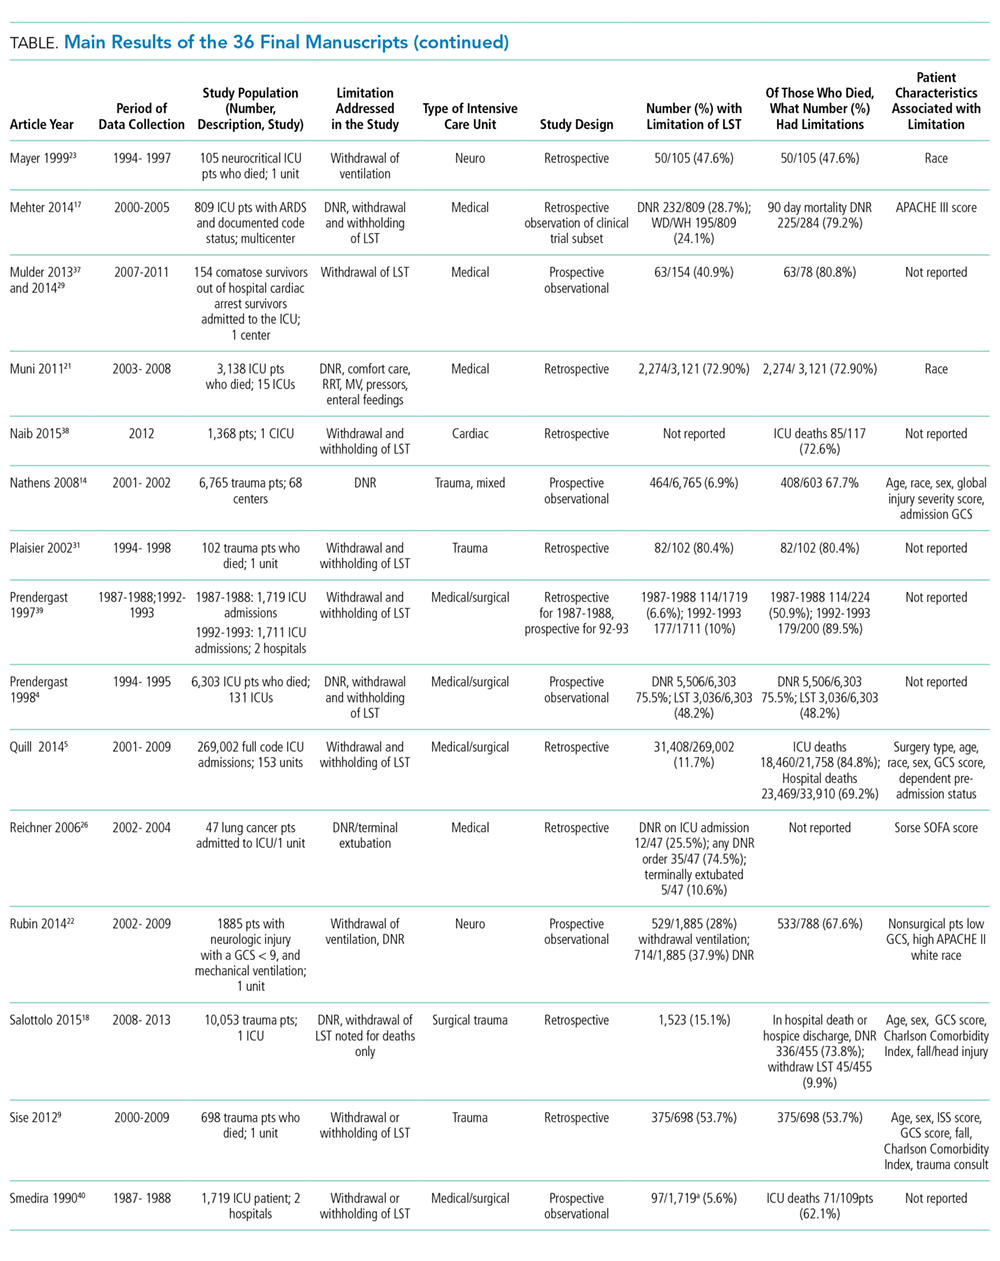
Fifteen of the studies addressed DNR as a limitation and 25 addressed other limitations such as withdrawing or withholding LST (several addressed both DNR and another limitation). Nine studies enrolled only patients who had died and the remaining 27 enrolled all ICU admissions.
Historical Trends
Examination of the three studies that looked at >20 regionally diverse ICUs revealed a trend over time toward increased limitation prior to death (Figure). Jayes looked at the number of DNR orders preceding death from 1979 to 1980 then compared that to a cohort from 1988 to 1990; Prendergast included withholding/withdrawing of LST prior to death from 1994 to 1995;and Quill used the IMPACT database to examine limitations prior to death from 2001 to 2009.3-5
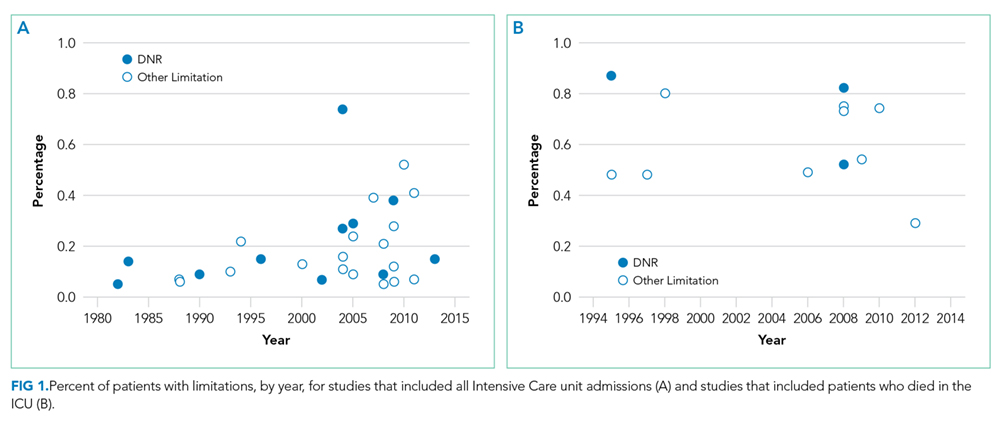
Effect of Unit Specialty
Twelve studies were mixed (surgical/medical or medical/neuro) ICUs, 11 were medical/cardiac units, five were neurologic units, and six were surgical/trauma units only. Two studies did not report unit specialty. Four studies that compared surgical and medical ICUs found that surgical patients were more likely to die with full intervention.4-7 In all of these studies, medical patients were more likely to have limitations of LST preceding death. Quill, et al. further detailed that emergency surgery was more likely to be associated with limitation than elective surgery.5
Patient Factors
In 15 studies, older age was associated with an increased likelihood of limitations on LST.3,5-18 In one study, advanced age was associated with early versus late withdrawal.19 Poor performance status and multiple medical comorbidities were also associated with limitations of LST. The largest population-based study by Quill et al. found that being fully dependent on others upon admission to the ICU was associated with an increased likelihood of limiting LST.5 Sise et al. found, in an analysis performed over 10 years in one trauma center, that increased age, comorbidities, and a fall as the reason for trauma admission were associated with limitation of LST.9 Salottolo et al. found that if the reason for trauma admission was a fall, there was an increased odds ratio of DNR status.18 Many studies found that having medical comorbidities prior to admission was associated with increased likelihood of limiting LST in both medical and surgical patients.3,7,9,13,15,18
Five studies found a statistically significant difference between women and men in the likelihood of limitation of LST,3,5,9,14,16 and another study reported that women who were trauma patients had an increased odds ratio of changing to DNR code status.18 Only one study found that males were associated with an increased likelihood of limiting aggressive treatment.20
White race was associated with increased limitation of LST in nine studies.4,5,10,11,14-16,21,22 One study in neurocritical care patients found that both white and Hispanic races were correlated with a higher likelihood of limitations.23 Muni et al. found that nonwhite patients had a statistically significantly lower likelihood of having comfort measures and DNR orders written prior to death, but discussion of prognosis was more likely to be documented in nonwhite patients.21
In summary, white race, female gender, and older age were the most frequent factors associated with a higher likelihood of limiting LST.
Factors Related to Critical Illness
There were several illness severity indicators that were associated with limitations. The Acute Physiology and Chronic Health Evaluation (APACHE) scores were the most common for medical patients and Glasgow Coma Scale (GCS) was the most common for patients with neurologic injury. Eight studies reported that a higher APACHE score was associated with an increased likelihood of limitations.3,7,10,15,17,20,22,24 Similar associations were found based on the Sepsis Related Organ Failure Assessment score in one study and a scoring system developed by the author in a second study.25,26
Seven studies, consisting of three neurologic, two medical-surgical, and two trauma cohorts, reported that a lower GCS score increased the likelihood that the patient would have limited LST.5,10,11,13,14,18,22 Additionally, Geocadin and colleagues discussed the difficulty with neurological prognostication in clinical practice; they reported that the cortical evoked potential (CEP) was correlated with the time to withdrawLST if the CEP was malignant, and the time to withdraw LST was less in malignant than in benign CEP.27
Mortality and End Effects of Limiting LST
Chen and colleagues used propensity scores to control for mortality differences between patients who had full interventions versus those with limitations and found that higher mortality correlated with the decision to withhold or withdraw LST.10 Weimer and colleagues used modeling to predict the probable outcome of patients who experienced an intracranial hemorrhage who had limitation of LST. Based on this model, nearly all the patients in their study would have died or had severe disability at 12 months despite having maximal therapy; they concluded that withdrawal of LST may not have been a self-fulfilling prophecy as others have proposed.28 Mulder and colleagues reported that in a small cohort of out-of-hospital cardiac arrest survivors admitted to the hospital, over one-third had good neurological outcomes after coding after 72 hours.29 The study highlighted the importance of timing in neurological prognostication.
Variation in Limitation Rates among Centers
In the 36 studies, we found an overall range of DNR orders from 5.4%7 to 82.0%.30 For other limitations, the rates ranged from 6.3%13 to 80.4%.31 Hart reported a low rate of limitations (4.8%) at the time of ICU admission.16 Four large, multicenter studies drew attention to the large variability between critical care centers and the limitation of end-of-life care.3-5,14 Jayes first described this phenomenon when examining the frequency of DNR orders from 1979 to 1980 and 1988 to 1990.3 This study found a range from 1.5% to 22%. Later, in another large, multicenter study, Prendergast et al. looked at 131 ICUs at 110 different institutions in 38 states that participated in postgraduate training and found variability in CPR attempts prior to death between 4% and 79%.4 In 2008, Nathens et al. reported significant variation in DNR rates across trauma centers; they found a higher incidence of DNR orders when there was an open ICU structure.14
Overall, there was wide variation in the proportion of deaths preceded by limitation of LST, ranging from 29.5% in one study of trauma patients8 to 92% in another study of trauma patients whose death occurred after 24 hours of care.9 In the largest study to date by Quill and colleagues utilizing the IMPACT database, they found large variability in the number of deaths preceded by full intervention based on differences in practice patterns of critical care centers.5
Bias
All studies indicated clear eligibility criteria for inclusion and described their sampling approach in adequate detail. All but one stated their method of participant recruitment, and the one remaining study was a secondary analysis and referenced the earlier manuscript.30 No study provided a power or sample size calculation, and sample sizes varied widely. Generalizability was most affected by the fact that many studies were conducted in a single ICU.
DISCUSSION
This systematic review of LST in US ICUs found several patient and illness factors that were associated with limitation of LST. The association of preadmission functional status and comorbidities with limitation of LST suggest that prior health is a factor in decision making. Further, ICU severity of illness, as measured by several commonly used indices, was associated with limitations.
Although variations in study design precluded meta-analysis, examination of the largest studies suggests that limitations are becoming more frequent over time. Also, early studies generally addressed DNR status, while later studies included withdrawal or withholding of LST, most commonly artificial ventilation. These findings reflect the current consensus in US medicine that it is ethically acceptable to limit LSTs in cases when they no longer benefit the patient or the patient would no longer want them.32,33
Some studies found variability by unit type, suggesting that decision making may differ among surgical, medical, and neurologic illness. Mayerand Kossoff concluded, in study of a cohort of neurocritical care ICU patients, that medical patients often have issues of physiologic futility and imminent death, whereas neurologic patients more often confront issues of quality of life. They also note that there is a difference in how patients with differing illnesses die; medical patients will have limitation of hemodialysis or vasopressors, whereas neurologic surrogate decision makers often confront decisions around terminal extubation.23
Some patient-level factors, such as race or ethnicity, may point to cultural differences in preferences for LST at the end of life. Other authors have documented that African American patients are more likely to choose end-of-life care for themselves or their family members, which may be due to cultural or religious factors as well as to a history of unequal access to medical care.34 Reasons for the finding that women are more likely to have limitations has not been as well described. Further research could explore whether this is due to differences in patient preferences by gender or to other factors.
Even when examining patient-level factors, illness severity and type of ICU, the wide variability in end-of-life care in critical care units across the country is still large. A worldwide review also found a high degree of variability, even within geographical regions.35 More research is needed to understand the factors associated with this wide variability, as this seems to indicate that approaches to end-of-life care may vary based on the ICU as much as individual patient preferences or clinical factors.
These findings can inform clinicians about variables that are important in the decision-making process. Patient age and race are factors to consider in the likelihood of reaching a decision to set limitations. Information about patients’ health status prior to critical illness, as well as ICU illness severity, are also important considerations.
The limitations of this review include the wide variety of LSTs assessed, including code status change, ventilator withdrawal, removal of pressors, and cessation of renal replacement therapy. Also, there was variation in sample size and the number of included units. There was also significant heterogeneity in the outcomes addressed and the variety of methods used in the included studies. We attempted to address this with an analysis of the quality of the studies, but given the wide variability, we were unable to account for all of the differences; unfortunately, this is a standard issue within studies that utilize systematic reviews, as well as similar concepts such as meta-analyses.
In conclusion, the increase in the frequency of limitations of LST in critically ill patients and a change in the nature of limitations from DNR order to withdrawal or withholding of LST suggests a trend toward growing acceptance of limiting treatments in critical illness. The wide variation in withdrawal of care in US ICUs does not seem fully explained by patient variables including preferences, illness type, or changes over time. Factors such as poor prefunctional status, a higher number of comorbid conditions prior to critical illness, and the severity of critical illness are likely important for surrogates and clinicians to consider during goals of care discussions. Further research is needed to explore why patients may receive very different types of care at the end of life depending the institution and ICU in which they receive their care.
Disclosures
The authors have no conflicts of interest to disclose. This work was performed at the Indiana University School of Medicine.
Funding
Financial support for Dr. Torke was provided by a Midcareer Investigator Award in Patient Oriented Research from the National Institute on Aging (K24AG053794). Dr. McPherson was supported by the Indiana University Department of Medicine.
1. Sprung CL, Raphaely RC, Hynninen M, et al. Consensus report on the ethics of foregoing life-sustaining treatments in the critically ill. Task Force on Ethics of the Society of Critical Care Medicine. Crit Care Med. 1990;18(12):1435-1439. PubMed
2. Angus DC, Barnato AE, Linde-Zwirble WT, et al. Use of intensive care at the end of life in the United States: an epidemiologic study. Crit Care Med. 2004;32(3):638-643. PubMed
3. Jayes RL, Zimmerman JE, Wagner DP, Draper EA, Knaus WA. Do-not-resuscitate orders in intensive care units. Current practices and recent changes. JAMA. 1993;270(18):2213-2217. doi: 10.1001/jama.1993.03510180083039. PubMed
4. Prendergast TJ, Claessens MT, Luce JM. A national survey of end-of-life care for critically ill patients. Am J Respir Crit Care Med. 1998;158(4):1163-1167. doi: 10.1164/ajrccm.158.4.9801108. PubMed
5. Quill CM, Ratcliffe SJ, Harhay MO, Halpern SD. Variation in decisions to forgo life-sustaining therapies in US ICUs. Chest. 2014;146(3):573-582. doi: 10.1378/chest.13-2529. PubMed
6. Turnbull AE, Ruhl AP, Lau BM, Mendez-Tellez PA, Shanholtz CB, Needham DM. Timing of limitations in life support in acute lung injury patients: a multisite study. Crit Care Med. 2014;42(2):296-302. doi: 10.1097/CCM.0b013e3182a272db. PubMed
7. Zimmerman JE, Knaus WA, Sharpe SM, Anderson AS, Draper EA, Wagner DP. The use and implications of do not resuscitate orders in intensive care units. JAMA. 1986;255(3):351-356. doi: 10.1001/jama.1986.03370030071030. PubMed
8. Weireter LJ, Jr., Collins JN, Britt RC, Novosel TJ, Britt LD. Withdrawal of care in a trauma intensive care unit: the impact on mortality rate. Am Surg. 2014;80(8):764-767. PubMed
9. Sise MJ, Sise CB, Thorndike JF, Kahl JE, Calvo RY, Shackford SR. Withdrawal of care: A 10-year perspective at a Level I trauma center. J Trauma Acute Care Surg. 2012;72(5):1186-1191. doi: 10.1097/TA.0b013e31824d0e57. PubMed
10. Chen Y-Y, Connors AF, Jr., Garland A. Effect of decisions to withhold life support on prolonged survival. Chest. 2008;133(6):1312-1318. doi: 10.1378/chest.07-1500. PubMed
11. Diringer MN, Edwards DF, Aiyagari V, Hollingsworth H. Factors associated with withdrawal of mechanical ventilation in a neurology/neurosurgery intensive care unit. Crit Care Med. 2001;29(9):1792-1797. PubMed
12. Huynh TN, Walling AM, Le TX, Kleerup EC, Liu H, Wenger NS. Factors associated with palliative withdrawal of mechanical ventilation and time to death after withdrawal. J Palliat Med. 2013;16(11):1368-1374. doi: 10.1089/jpm.2013.0142. PubMed
13. Kowalski RG, Chang TR, Carhuapoma JR, Tamargo RJ, Naval NS. Withdrawal of technological life support following subarachnoid hemorrhage. Neurocrit Care. 2013;19:269-275. doi: 10.1007/s12028-013-9929-8. PubMed
14. Nathens AB, Rivara FP, Wang J, Mackenzie EJ, Jurkovich GJ. Variation in the rates of do not resuscitate orders after major trauma and the impact of intensive care unit environment. J Trauma. 2008;64(1):81-88;discussion 8-91. doi: 10.1097/TA.0b013e31815dd4d7. PubMed
15. Youngner SJ, Lewandowski W, McClish DK, Juknialis BW, Coulton C, Bartlett ET. ‘Do not resuscitate’ orders. Incidence and implications in a medical-intensive care unit. JAMA. 1985;253(1):54-57. doi: 10.1001/jama.1985.03350250062023. PubMed
16. Hart JL, Harhay MO, Gabler NB, Ratcliffe SJ, Quill CM, Halpern SD. Variability among US intensive care units in managing the care of patients admitted with preexisting limits on life-sustaining therapies. JAMA Intern Med. 2015;175(6):1019-1026. doi: 10.1001/jamainternmed.2015.0372. PubMed
17. Mehter HM, Wiener RS, Walkey AJ. “Do not resuscitate” decisions in acute respiratory distress syndrome: a secondary analysis of clinical trial data. Ann Am Thorac Soc. 2014;11(10):1592-1596. doi: 10.1513/AnnalsATS.201406-244BC. PubMed
18. Salottolo K, Offner PJ, Orlando A, et al. The epidemiology of do-not-resuscitate orders in patients with trauma: a community level one trauma center observational experience. Scand J Trauma Resusc Emerg Med. 2015;23(1):9. doi: 10.1186/s13049-015-0094-2. PubMed
19. Albaeni A, Chandra-Strobos N, Vaidya D, Eid SM. Predictors of early care withdrawal following out-of-hospital cardiac arrest. Resuscitation. 2014;85(11):1455-1461. doi: 10.1016/j.resuscitation.2014.08.030. PubMed
20. Lissauer ME, Naranjo LS, Kirchoffner J, Scalea TM, Johnson SB. Patient characteristics associated with end-of-life decision making in critically ill surgical patients. J Am Coll Surg. 2011;213(6):766-770. doi: 10.1016/j.jamcollsurg.2011.09.003. PubMed
21. Muni S, Engelberg RA, Treece PD, Dotolo D, Curtis JR. The influence of race/ethnicity and socioeconomic status on end-of-life care in the ICU. Chest. 2011;139(5):1025-1033. doi: 10.1378/chest.10-3011. PubMed
22. Rubin MA, Dhar R, Diringer MN. Racial differences in withdrawal of mechanical ventilation do not alter mortality in neurologically injured patients. J Crit Care. 2014;29(1):49-53. doi: 10.1016/j.jcrc.2013.08.023. PubMed
23. Mayer SA, Kossoff SB. Withdrawal of life support in the neurological intensive care unit. Neurology. 1999;52(8):1602-1609. doi: 10.1212/WNL.52.8.1602. PubMed
24. 2nd National Congress on Medicinal Plants. Iranian J Pharm Res. 2013;12:43.
25. Hamel MB, Phillips R, Teno J, et al. Cost effectiveness of aggressive care for patients with nontraumatic coma. Crit Care Med. 2002;30(6):1191-1196. PubMed
26. Reichner CA, Thompson JA, O’Brien S, Kuru T, Anderson ED. Outcome and code status of lung cancer patients admitted to the medical ICU. Chest. 2006;130(3):719-723. doi: 10.1378/chest.130.3.719. PubMed
27. Geocadin RG, Buitrago MM, Torbey MT, Chandra-Strobos N, Williams MA, Kaplan PW. Neurologic prognosis and withdrawal of life support after resuscitation from cardiac arrest. Neurology. 2006;67(1):105-108. doi: 10.1212/01.wnl.0000223335.86166.b4. PubMed
28. Weimer JM, Nowacki AS, Frontera JA. Withdrawal of life-sustaining therapy in patients with intracranial hemorrhage: self-fulfilling prophecy or accurate prediction of outcome? Crit Care Med. 2016;44(5):1161-1172. doi: 10.1097/CCM.0000000000001570. PubMed
29. Mulder M, Gibbs HG, Smith SW, et al. Awakening and withdrawal of life-sustaining treatment in cardiac arrest survivors treated with therapeutic hypothermia. Crit Care Med. 2014;42(12):2493-2499. doi: 10.1097/CCM.0000000000000540. PubMed
30. Brown CE, Engelberg RA, Nielsen EL, Curtis JR. Palliative care for patients dying in the intensive care unit with chronic lung disease compared with metastatic cancer. Ann Am Thorac Soc. 2016;13(5):684-689. doi: 10.1513/AnnalsATS.201510-667OC. PubMed
31. Plaisier BR, Blostein PA, Hurt KJ, Malangoni MA. Withholding/withdrawal of life support in trauma patients: is there an age bias? Am Surg. 2002;68(2):159-162. PubMed
32. Beauchamp, Childress JF. Principles of Biomedical Ethics. 13th ed. Oxford: Oxford University Press; 2013.
33. Jonson AR, Siegler M, Winslade WJ. Clinical Ethics: A Practical Approach to Ethical Decisions in Clinical Medicine. New York: McGraw Hill; 2015.
34. Johnson KS, Elbert Avila KI, Tulsky JA. The influence of spiritual beliefs and practices on the treatment preferences of African Americans: a review of the literature. J Am Geriatr Soc. 2005;53(4):711-719. doi: 10.1111/j.1532-5415.2005.53224.x. PubMed
35. Mark NM, Rayner SG, Lee NJ, Curtis JR. Global variability in withholding and withdrawal of life-sustaining treatment in the intensive care unit: a systematic review. Intensive Care Med. 2015;41(9):1572-1585. doi: 10.1007/s00134-015-3810-5. PubMed
36. Creutzfeldt CJ, Wunsch H, Curtis JR, Hua M. Prevalence and Outcomes of Patients Meeting Palliative Care Consultation Triggers in Neurological Intensive Care Units. Neurocrit Care. 2015;23:14-21. PubMed
37. Mulder M, Smith SW, Dhaliwal RS, Goodwin HE, Scott NL, Geocadin RG. Comatose survivors of cardiac arrest and therapeutic hypothermia: Time of awakening and withdrawal of life sustaining therapies. Neurocrit Care. 2013;19:S281. PubMed
38. Naib T, Lahewala S, Arora S, Gidwani U. Palliative care in the cardiac intensive care unit. Am J Cardiol. 2015;115:687-90. PubMed
39. Prendergast TJ, Luce JM. Increasing incidence of withholding and withdrawal of life support from the critically ill. Am J Respir Crit Care Med. 1997;155:15-20. PubMed
40. Smedira NG, Evans BH, Grais LS, et al. Withholding and withdrawal of life support from the critically ill. N Engl J Med. 1990;322:309-15. PubMed
41. Van Scoy LJ, Sherman M. Factors Affecting Code Status in a University Hospital Intensive Care Unit. Death Stud. 2013;37:768-81. PubMed
42. White DB, Curtis JR, Lo B, Luce JM. Decisions to limit life-sustaining treatment for critically ill patients who lack both decision-making capacity and surrogate decision-makers. Crit Care Med. 2006;34:2053-9. PubMed
43. Kerlin MP, Harhay MO, Kahn JM, Halpern SD. Nighttime intensivist staffing, mortality, and limits on life support; a retrospective cohort study. Chest. 2015;147(4):951-958. PubMed
44. Kish Wallace S, Martin CG, Shaw AD, Price KJ. Influence of an advance directive on the initiation of life support technology in critically ill cancer patients. Crit Care Med. 2001;29(12):2294-2298. PubMed
Access to life-sustaining treatment (LST) became a mainstay in hospitals across the United States in the 1970s. This has raised complex ethical questions surrounding the use of these therapies, particularly in the face of a poor prognosis or significant morbidity. The Society for Critical Care Medicine formed a consensus panel in 1989 to construct ethical guidelines regarding the initiation, continuation, and withdrawal of intensive care.1 These guidelines emphasized that withdrawing and withholding are not only permissible but may be necessary to preserve the balance between quantity and quality of life. Nevertheless, an increasing number of Americans are dying after aggressive LST in the hospital, and greater than one in five deaths occur after admission to the ICU.2 Understanding the factors associated with decisions to withhold or withdraw LST are important to policy makers, ethicists, and healthcare leaders because they affect resources used at the end of life and the need for palliative care and hospice in the ICU setting.
Several studies have characterized the patient characteristics, incidence, and variability associated with limitation of LST in various populations of critically ill patients in the US. We are unaware of another systematic review of the literature that has examined data from these studies in order to understand the process and outcomes of LST limitations. We defined limitations of LST as decisions to withdraw or withhold cardiopulmonary resuscitation through Do Not Resuscitate (DNR) orders, mechanical ventilation, renal replacement therapy, intravenous blood pressure support, or artificial nutrition (enteric or intravenous).
METHODS
The Preferred Reporting Items for Systematic Reviews and Meta-Analyses statement was used for reporting. A comprehensive literature search was performed by a medical librarian (TWE) in Ovid MEDLINE, PubMed, Embase, the full Cochrane Library, CINAHL, PsycINFO, the Philosopher’s Index, Scopus, Web of Science, and Google Scholar. PubMed was limited to non-MEDLINE records in order to complement the Ovid results. The Georgetown Bioethics Research Library at the Kennedy Institute (https://bioethics.georgetown.edu/) was also searched for any unpublished literature. Initial searches were conducted in December 2014, and an update was performed in April 2017. All databases were searched from inception, and bibliographies of relevant studies were reviewed for additional references (Appendix 1).
Database-specific subject headings and keyword variants for each of the five main concepts—intensive care, end-of-life, decision making, limitation of treatment, and death—were identified and combined. Results were limited to the adult population and to the English language.
Two authors independently reviewed article titles and abstracts (KM, AMT). The full text of potentially eligible studies was then reviewed for inclusion. All disputes were discussed and resolved by consensus. The criteria for inclusion were reporting of patient-level data, critical care patients only (or reported separately from other unit types), US setting, and reporting of data on limitations of LST. The exclusion criteria were studies published only as research abstracts, surveys of physicians or families, organ donors, studies of brain death, surveys, patients less than 18 years old, and long-term intensive care settings (ie, long-term acute care hospitals, long-term respiratory units). Also excluded were studies in which an intervention was performed; as a result, all included studies were observational. Research abstracts were excluded because they lacked sufficient detail from which to abstract study quality or results. Studies of organ donation, brain death, and pediatrics were excluded due to differences in the decision-making context that would make it difficult to draw conclusions about adult ICU care. Studies which included an intervention were excluded to avoid affecting the rate of limitation of LST as a result of the intervention, since our goal was to quantify the number of limitations of LST in usual medical practice.
For each article, we abstracted the number of patients who experienced a limitation of LST out of the total population and factors associated with the limitation. If a multivariable analysis was performed, we reported only variables that remained significant in this analysis. We also reported the number of patients who died, and of those, the number of decedents who underwent a limitation of LST before death. In some cases, this proportion was not reported in the manuscript but could be calculated based on the data presented. This number was calculated based on the number of deaths that were preceded by a limitation in life-sustaining care divided by the total number of deaths. Patients with brain death were not counted as having had a “limitation” if support was withdrawn after the declaration of brain death. We were unable to conduct a meta-analysis of the findings because of the wide variation in study populations and criteria used to define limitations of care.
To assess risk of bias in individual studies, the two raters independently made a yes/no determination regarding several quality metrics established at the outset of the review: clarity of the eligibility criteria for participant inclusion, whether a power or sample size calculation was done, adequacy of the description of the sampling approach and recruitment, and generalizability. Disagreements were resolved by consensus.
RESULTS
Study Selection
A total of 2,460 references were identified, and after removal of 578 duplicates, 1,882 unique titles and abstracts were reviewed. One hundred thirteen titles met the inclusion criteria. After review of complete texts, 83 were excluded based on the above criteria (Appendix). This led to a final number of 36 studies included for analysis.
Fifteen articles were prospective, observational studies. The rest were retrospective analyses of patient-level data. Seven were large, multicenter studies with greater than 20 centers involved (including Project IMPACT); six such studies included medical and surgical patients. The remaining large, multicenter study examined a surgical trauma cohort.
Fifteen of the studies addressed DNR as a limitation and 25 addressed other limitations such as withdrawing or withholding LST (several addressed both DNR and another limitation). Nine studies enrolled only patients who had died and the remaining 27 enrolled all ICU admissions.
Historical Trends
Examination of the three studies that looked at >20 regionally diverse ICUs revealed a trend over time toward increased limitation prior to death (Figure). Jayes looked at the number of DNR orders preceding death from 1979 to 1980 then compared that to a cohort from 1988 to 1990; Prendergast included withholding/withdrawing of LST prior to death from 1994 to 1995;and Quill used the IMPACT database to examine limitations prior to death from 2001 to 2009.3-5
Effect of Unit Specialty
Twelve studies were mixed (surgical/medical or medical/neuro) ICUs, 11 were medical/cardiac units, five were neurologic units, and six were surgical/trauma units only. Two studies did not report unit specialty. Four studies that compared surgical and medical ICUs found that surgical patients were more likely to die with full intervention.4-7 In all of these studies, medical patients were more likely to have limitations of LST preceding death. Quill, et al. further detailed that emergency surgery was more likely to be associated with limitation than elective surgery.5
Patient Factors
In 15 studies, older age was associated with an increased likelihood of limitations on LST.3,5-18 In one study, advanced age was associated with early versus late withdrawal.19 Poor performance status and multiple medical comorbidities were also associated with limitations of LST. The largest population-based study by Quill et al. found that being fully dependent on others upon admission to the ICU was associated with an increased likelihood of limiting LST.5 Sise et al. found, in an analysis performed over 10 years in one trauma center, that increased age, comorbidities, and a fall as the reason for trauma admission were associated with limitation of LST.9 Salottolo et al. found that if the reason for trauma admission was a fall, there was an increased odds ratio of DNR status.18 Many studies found that having medical comorbidities prior to admission was associated with increased likelihood of limiting LST in both medical and surgical patients.3,7,9,13,15,18
Five studies found a statistically significant difference between women and men in the likelihood of limitation of LST,3,5,9,14,16 and another study reported that women who were trauma patients had an increased odds ratio of changing to DNR code status.18 Only one study found that males were associated with an increased likelihood of limiting aggressive treatment.20
White race was associated with increased limitation of LST in nine studies.4,5,10,11,14-16,21,22 One study in neurocritical care patients found that both white and Hispanic races were correlated with a higher likelihood of limitations.23 Muni et al. found that nonwhite patients had a statistically significantly lower likelihood of having comfort measures and DNR orders written prior to death, but discussion of prognosis was more likely to be documented in nonwhite patients.21
In summary, white race, female gender, and older age were the most frequent factors associated with a higher likelihood of limiting LST.
Factors Related to Critical Illness
There were several illness severity indicators that were associated with limitations. The Acute Physiology and Chronic Health Evaluation (APACHE) scores were the most common for medical patients and Glasgow Coma Scale (GCS) was the most common for patients with neurologic injury. Eight studies reported that a higher APACHE score was associated with an increased likelihood of limitations.3,7,10,15,17,20,22,24 Similar associations were found based on the Sepsis Related Organ Failure Assessment score in one study and a scoring system developed by the author in a second study.25,26
Seven studies, consisting of three neurologic, two medical-surgical, and two trauma cohorts, reported that a lower GCS score increased the likelihood that the patient would have limited LST.5,10,11,13,14,18,22 Additionally, Geocadin and colleagues discussed the difficulty with neurological prognostication in clinical practice; they reported that the cortical evoked potential (CEP) was correlated with the time to withdrawLST if the CEP was malignant, and the time to withdraw LST was less in malignant than in benign CEP.27
Mortality and End Effects of Limiting LST
Chen and colleagues used propensity scores to control for mortality differences between patients who had full interventions versus those with limitations and found that higher mortality correlated with the decision to withhold or withdraw LST.10 Weimer and colleagues used modeling to predict the probable outcome of patients who experienced an intracranial hemorrhage who had limitation of LST. Based on this model, nearly all the patients in their study would have died or had severe disability at 12 months despite having maximal therapy; they concluded that withdrawal of LST may not have been a self-fulfilling prophecy as others have proposed.28 Mulder and colleagues reported that in a small cohort of out-of-hospital cardiac arrest survivors admitted to the hospital, over one-third had good neurological outcomes after coding after 72 hours.29 The study highlighted the importance of timing in neurological prognostication.
Variation in Limitation Rates among Centers
In the 36 studies, we found an overall range of DNR orders from 5.4%7 to 82.0%.30 For other limitations, the rates ranged from 6.3%13 to 80.4%.31 Hart reported a low rate of limitations (4.8%) at the time of ICU admission.16 Four large, multicenter studies drew attention to the large variability between critical care centers and the limitation of end-of-life care.3-5,14 Jayes first described this phenomenon when examining the frequency of DNR orders from 1979 to 1980 and 1988 to 1990.3 This study found a range from 1.5% to 22%. Later, in another large, multicenter study, Prendergast et al. looked at 131 ICUs at 110 different institutions in 38 states that participated in postgraduate training and found variability in CPR attempts prior to death between 4% and 79%.4 In 2008, Nathens et al. reported significant variation in DNR rates across trauma centers; they found a higher incidence of DNR orders when there was an open ICU structure.14
Overall, there was wide variation in the proportion of deaths preceded by limitation of LST, ranging from 29.5% in one study of trauma patients8 to 92% in another study of trauma patients whose death occurred after 24 hours of care.9 In the largest study to date by Quill and colleagues utilizing the IMPACT database, they found large variability in the number of deaths preceded by full intervention based on differences in practice patterns of critical care centers.5
Bias
All studies indicated clear eligibility criteria for inclusion and described their sampling approach in adequate detail. All but one stated their method of participant recruitment, and the one remaining study was a secondary analysis and referenced the earlier manuscript.30 No study provided a power or sample size calculation, and sample sizes varied widely. Generalizability was most affected by the fact that many studies were conducted in a single ICU.
DISCUSSION
This systematic review of LST in US ICUs found several patient and illness factors that were associated with limitation of LST. The association of preadmission functional status and comorbidities with limitation of LST suggest that prior health is a factor in decision making. Further, ICU severity of illness, as measured by several commonly used indices, was associated with limitations.
Although variations in study design precluded meta-analysis, examination of the largest studies suggests that limitations are becoming more frequent over time. Also, early studies generally addressed DNR status, while later studies included withdrawal or withholding of LST, most commonly artificial ventilation. These findings reflect the current consensus in US medicine that it is ethically acceptable to limit LSTs in cases when they no longer benefit the patient or the patient would no longer want them.32,33
Some studies found variability by unit type, suggesting that decision making may differ among surgical, medical, and neurologic illness. Mayerand Kossoff concluded, in study of a cohort of neurocritical care ICU patients, that medical patients often have issues of physiologic futility and imminent death, whereas neurologic patients more often confront issues of quality of life. They also note that there is a difference in how patients with differing illnesses die; medical patients will have limitation of hemodialysis or vasopressors, whereas neurologic surrogate decision makers often confront decisions around terminal extubation.23
Some patient-level factors, such as race or ethnicity, may point to cultural differences in preferences for LST at the end of life. Other authors have documented that African American patients are more likely to choose end-of-life care for themselves or their family members, which may be due to cultural or religious factors as well as to a history of unequal access to medical care.34 Reasons for the finding that women are more likely to have limitations has not been as well described. Further research could explore whether this is due to differences in patient preferences by gender or to other factors.
Even when examining patient-level factors, illness severity and type of ICU, the wide variability in end-of-life care in critical care units across the country is still large. A worldwide review also found a high degree of variability, even within geographical regions.35 More research is needed to understand the factors associated with this wide variability, as this seems to indicate that approaches to end-of-life care may vary based on the ICU as much as individual patient preferences or clinical factors.
These findings can inform clinicians about variables that are important in the decision-making process. Patient age and race are factors to consider in the likelihood of reaching a decision to set limitations. Information about patients’ health status prior to critical illness, as well as ICU illness severity, are also important considerations.
The limitations of this review include the wide variety of LSTs assessed, including code status change, ventilator withdrawal, removal of pressors, and cessation of renal replacement therapy. Also, there was variation in sample size and the number of included units. There was also significant heterogeneity in the outcomes addressed and the variety of methods used in the included studies. We attempted to address this with an analysis of the quality of the studies, but given the wide variability, we were unable to account for all of the differences; unfortunately, this is a standard issue within studies that utilize systematic reviews, as well as similar concepts such as meta-analyses.
In conclusion, the increase in the frequency of limitations of LST in critically ill patients and a change in the nature of limitations from DNR order to withdrawal or withholding of LST suggests a trend toward growing acceptance of limiting treatments in critical illness. The wide variation in withdrawal of care in US ICUs does not seem fully explained by patient variables including preferences, illness type, or changes over time. Factors such as poor prefunctional status, a higher number of comorbid conditions prior to critical illness, and the severity of critical illness are likely important for surrogates and clinicians to consider during goals of care discussions. Further research is needed to explore why patients may receive very different types of care at the end of life depending the institution and ICU in which they receive their care.
Disclosures
The authors have no conflicts of interest to disclose. This work was performed at the Indiana University School of Medicine.
Funding
Financial support for Dr. Torke was provided by a Midcareer Investigator Award in Patient Oriented Research from the National Institute on Aging (K24AG053794). Dr. McPherson was supported by the Indiana University Department of Medicine.
1. Sprung CL, Raphaely RC, Hynninen M, et al. Consensus report on the ethics of foregoing life-sustaining treatments in the critically ill. Task Force on Ethics of the Society of Critical Care Medicine. Crit Care Med. 1990;18(12):1435-1439. PubMed
2. Angus DC, Barnato AE, Linde-Zwirble WT, et al. Use of intensive care at the end of life in the United States: an epidemiologic study. Crit Care Med. 2004;32(3):638-643. PubMed
3. Jayes RL, Zimmerman JE, Wagner DP, Draper EA, Knaus WA. Do-not-resuscitate orders in intensive care units. Current practices and recent changes. JAMA. 1993;270(18):2213-2217. doi: 10.1001/jama.1993.03510180083039. PubMed
4. Prendergast TJ, Claessens MT, Luce JM. A national survey of end-of-life care for critically ill patients. Am J Respir Crit Care Med. 1998;158(4):1163-1167. doi: 10.1164/ajrccm.158.4.9801108. PubMed
5. Quill CM, Ratcliffe SJ, Harhay MO, Halpern SD. Variation in decisions to forgo life-sustaining therapies in US ICUs. Chest. 2014;146(3):573-582. doi: 10.1378/chest.13-2529. PubMed
6. Turnbull AE, Ruhl AP, Lau BM, Mendez-Tellez PA, Shanholtz CB, Needham DM. Timing of limitations in life support in acute lung injury patients: a multisite study. Crit Care Med. 2014;42(2):296-302. doi: 10.1097/CCM.0b013e3182a272db. PubMed
7. Zimmerman JE, Knaus WA, Sharpe SM, Anderson AS, Draper EA, Wagner DP. The use and implications of do not resuscitate orders in intensive care units. JAMA. 1986;255(3):351-356. doi: 10.1001/jama.1986.03370030071030. PubMed
8. Weireter LJ, Jr., Collins JN, Britt RC, Novosel TJ, Britt LD. Withdrawal of care in a trauma intensive care unit: the impact on mortality rate. Am Surg. 2014;80(8):764-767. PubMed
9. Sise MJ, Sise CB, Thorndike JF, Kahl JE, Calvo RY, Shackford SR. Withdrawal of care: A 10-year perspective at a Level I trauma center. J Trauma Acute Care Surg. 2012;72(5):1186-1191. doi: 10.1097/TA.0b013e31824d0e57. PubMed
10. Chen Y-Y, Connors AF, Jr., Garland A. Effect of decisions to withhold life support on prolonged survival. Chest. 2008;133(6):1312-1318. doi: 10.1378/chest.07-1500. PubMed
11. Diringer MN, Edwards DF, Aiyagari V, Hollingsworth H. Factors associated with withdrawal of mechanical ventilation in a neurology/neurosurgery intensive care unit. Crit Care Med. 2001;29(9):1792-1797. PubMed
12. Huynh TN, Walling AM, Le TX, Kleerup EC, Liu H, Wenger NS. Factors associated with palliative withdrawal of mechanical ventilation and time to death after withdrawal. J Palliat Med. 2013;16(11):1368-1374. doi: 10.1089/jpm.2013.0142. PubMed
13. Kowalski RG, Chang TR, Carhuapoma JR, Tamargo RJ, Naval NS. Withdrawal of technological life support following subarachnoid hemorrhage. Neurocrit Care. 2013;19:269-275. doi: 10.1007/s12028-013-9929-8. PubMed
14. Nathens AB, Rivara FP, Wang J, Mackenzie EJ, Jurkovich GJ. Variation in the rates of do not resuscitate orders after major trauma and the impact of intensive care unit environment. J Trauma. 2008;64(1):81-88;discussion 8-91. doi: 10.1097/TA.0b013e31815dd4d7. PubMed
15. Youngner SJ, Lewandowski W, McClish DK, Juknialis BW, Coulton C, Bartlett ET. ‘Do not resuscitate’ orders. Incidence and implications in a medical-intensive care unit. JAMA. 1985;253(1):54-57. doi: 10.1001/jama.1985.03350250062023. PubMed
16. Hart JL, Harhay MO, Gabler NB, Ratcliffe SJ, Quill CM, Halpern SD. Variability among US intensive care units in managing the care of patients admitted with preexisting limits on life-sustaining therapies. JAMA Intern Med. 2015;175(6):1019-1026. doi: 10.1001/jamainternmed.2015.0372. PubMed
17. Mehter HM, Wiener RS, Walkey AJ. “Do not resuscitate” decisions in acute respiratory distress syndrome: a secondary analysis of clinical trial data. Ann Am Thorac Soc. 2014;11(10):1592-1596. doi: 10.1513/AnnalsATS.201406-244BC. PubMed
18. Salottolo K, Offner PJ, Orlando A, et al. The epidemiology of do-not-resuscitate orders in patients with trauma: a community level one trauma center observational experience. Scand J Trauma Resusc Emerg Med. 2015;23(1):9. doi: 10.1186/s13049-015-0094-2. PubMed
19. Albaeni A, Chandra-Strobos N, Vaidya D, Eid SM. Predictors of early care withdrawal following out-of-hospital cardiac arrest. Resuscitation. 2014;85(11):1455-1461. doi: 10.1016/j.resuscitation.2014.08.030. PubMed
20. Lissauer ME, Naranjo LS, Kirchoffner J, Scalea TM, Johnson SB. Patient characteristics associated with end-of-life decision making in critically ill surgical patients. J Am Coll Surg. 2011;213(6):766-770. doi: 10.1016/j.jamcollsurg.2011.09.003. PubMed
21. Muni S, Engelberg RA, Treece PD, Dotolo D, Curtis JR. The influence of race/ethnicity and socioeconomic status on end-of-life care in the ICU. Chest. 2011;139(5):1025-1033. doi: 10.1378/chest.10-3011. PubMed
22. Rubin MA, Dhar R, Diringer MN. Racial differences in withdrawal of mechanical ventilation do not alter mortality in neurologically injured patients. J Crit Care. 2014;29(1):49-53. doi: 10.1016/j.jcrc.2013.08.023. PubMed
23. Mayer SA, Kossoff SB. Withdrawal of life support in the neurological intensive care unit. Neurology. 1999;52(8):1602-1609. doi: 10.1212/WNL.52.8.1602. PubMed
24. 2nd National Congress on Medicinal Plants. Iranian J Pharm Res. 2013;12:43.
25. Hamel MB, Phillips R, Teno J, et al. Cost effectiveness of aggressive care for patients with nontraumatic coma. Crit Care Med. 2002;30(6):1191-1196. PubMed
26. Reichner CA, Thompson JA, O’Brien S, Kuru T, Anderson ED. Outcome and code status of lung cancer patients admitted to the medical ICU. Chest. 2006;130(3):719-723. doi: 10.1378/chest.130.3.719. PubMed
27. Geocadin RG, Buitrago MM, Torbey MT, Chandra-Strobos N, Williams MA, Kaplan PW. Neurologic prognosis and withdrawal of life support after resuscitation from cardiac arrest. Neurology. 2006;67(1):105-108. doi: 10.1212/01.wnl.0000223335.86166.b4. PubMed
28. Weimer JM, Nowacki AS, Frontera JA. Withdrawal of life-sustaining therapy in patients with intracranial hemorrhage: self-fulfilling prophecy or accurate prediction of outcome? Crit Care Med. 2016;44(5):1161-1172. doi: 10.1097/CCM.0000000000001570. PubMed
29. Mulder M, Gibbs HG, Smith SW, et al. Awakening and withdrawal of life-sustaining treatment in cardiac arrest survivors treated with therapeutic hypothermia. Crit Care Med. 2014;42(12):2493-2499. doi: 10.1097/CCM.0000000000000540. PubMed
30. Brown CE, Engelberg RA, Nielsen EL, Curtis JR. Palliative care for patients dying in the intensive care unit with chronic lung disease compared with metastatic cancer. Ann Am Thorac Soc. 2016;13(5):684-689. doi: 10.1513/AnnalsATS.201510-667OC. PubMed
31. Plaisier BR, Blostein PA, Hurt KJ, Malangoni MA. Withholding/withdrawal of life support in trauma patients: is there an age bias? Am Surg. 2002;68(2):159-162. PubMed
32. Beauchamp, Childress JF. Principles of Biomedical Ethics. 13th ed. Oxford: Oxford University Press; 2013.
33. Jonson AR, Siegler M, Winslade WJ. Clinical Ethics: A Practical Approach to Ethical Decisions in Clinical Medicine. New York: McGraw Hill; 2015.
34. Johnson KS, Elbert Avila KI, Tulsky JA. The influence of spiritual beliefs and practices on the treatment preferences of African Americans: a review of the literature. J Am Geriatr Soc. 2005;53(4):711-719. doi: 10.1111/j.1532-5415.2005.53224.x. PubMed
35. Mark NM, Rayner SG, Lee NJ, Curtis JR. Global variability in withholding and withdrawal of life-sustaining treatment in the intensive care unit: a systematic review. Intensive Care Med. 2015;41(9):1572-1585. doi: 10.1007/s00134-015-3810-5. PubMed
36. Creutzfeldt CJ, Wunsch H, Curtis JR, Hua M. Prevalence and Outcomes of Patients Meeting Palliative Care Consultation Triggers in Neurological Intensive Care Units. Neurocrit Care. 2015;23:14-21. PubMed
37. Mulder M, Smith SW, Dhaliwal RS, Goodwin HE, Scott NL, Geocadin RG. Comatose survivors of cardiac arrest and therapeutic hypothermia: Time of awakening and withdrawal of life sustaining therapies. Neurocrit Care. 2013;19:S281. PubMed
38. Naib T, Lahewala S, Arora S, Gidwani U. Palliative care in the cardiac intensive care unit. Am J Cardiol. 2015;115:687-90. PubMed
39. Prendergast TJ, Luce JM. Increasing incidence of withholding and withdrawal of life support from the critically ill. Am J Respir Crit Care Med. 1997;155:15-20. PubMed
40. Smedira NG, Evans BH, Grais LS, et al. Withholding and withdrawal of life support from the critically ill. N Engl J Med. 1990;322:309-15. PubMed
41. Van Scoy LJ, Sherman M. Factors Affecting Code Status in a University Hospital Intensive Care Unit. Death Stud. 2013;37:768-81. PubMed
42. White DB, Curtis JR, Lo B, Luce JM. Decisions to limit life-sustaining treatment for critically ill patients who lack both decision-making capacity and surrogate decision-makers. Crit Care Med. 2006;34:2053-9. PubMed
43. Kerlin MP, Harhay MO, Kahn JM, Halpern SD. Nighttime intensivist staffing, mortality, and limits on life support; a retrospective cohort study. Chest. 2015;147(4):951-958. PubMed
44. Kish Wallace S, Martin CG, Shaw AD, Price KJ. Influence of an advance directive on the initiation of life support technology in critically ill cancer patients. Crit Care Med. 2001;29(12):2294-2298. PubMed
© 2019 Society of Hospital Medicine
Things We Do for No Reason: The Use of Thickened Liquids in Treating Hospitalized Adult Patients with Dysphagia
Inspired by the ABIM Foundation's Choosing Wisely campaign, the “Things We Do for No Reason” (TWDFNR) series reviews practices that have become common parts of hospital care but may provide little value to our patients. Practices reviewed in the TWDFNR series do not represent “black and white” conclusions or clinical practice standards but are meant as a starting place for research and active discussions among hospitalists and patients. We invite you to be part of that discussion. https://www.choosingwisely.org/
CLINICAL SCENARIO
A 74-year-old man with Alzheimer’s dementia and chronic dysphagia with a history of aspiration pneumonia presents with urinary tract infection, hypovolemia, and hypernatremia. He has been on thickened liquids at home for the past several months. As his overall condition improves with intravenous fluids and antibiotics, he requests to drink thin liquids.
BACKGROUND
Dysphagia is defined as difficulty or discomfort with feeding or swallowing1 and is a common clinical problem facing hospitalists. The prevalence of swallowing difficulties is estimated to affect 13 million people in the United States, which is likely to increase as the population ages.2 Dysphagia often results in inadequate fluid consumption, resulting in complications such as dehydration.1 However, the most dreaded complication is pneumonia from aspiration. Aspiration, the entry of material from the oropharynx or the gastrointestinal tract into the larynx and lungs, can be problematic since it is often colonized with pathogens.3-5 It constitutes 5%-15% of the four and a half million cases of community-acquired pneumonia per year with a mortality rate as high as 21%.5,6
Dysphagia is a clinical diagnosis, and assessment tools are available to help establish the mechanism and severity.3 For example, the bedside swallow evaluation uses the administration of water by the clinician to the patient to assess for the presence and severity of dysphagia.1,7 The evaluation is performed by making the patient sit upright at up at 90° and administering either single sips of ≤20 ml of water, consecutive sips with intake up to 100 ml of water, or progressively increasing volumes of water. The clinician then observes for clinical signs of aspiration such as choking or coughing. This evaluation is inexpensive, noninvasive, and time-efficient with a sensitivity as high as 91%, if conducted using the consecutive sips technique.7 A video fluoroscopic swallowing exam (VFSE) includes the administration of various barium consistencies that may be helpful in determining the precise mechanism of dysphagia, particularly in the pharyngeal stage of swallowing.3,8 VFSE is often considered as the standard for dysphagia evaluation, although it is expensive, time-consuming, exposes the patient to radiation, and its translation to functional ability to safely eat and drink is unproven.8
WHY YOU MIGHT THINK THICKENED LIQUIDS ARE HELPFUL FOR ADULT PATIENTS WITH DYSPHAGIA
Modifying oral liquid intake using thickened liquids has been the cornerstone of clinical practice in treating adults with dysphagia.4,9-11 Water, a thin liquid with a low viscosity, flows rapidly from the mouth into the oropharynx. The rapid rate may be too fast for the patient’s pharyngeal muscles to compensate, thus allowing aspiration.10 Thickening the liquids is meant to slow the flow of liquids to allow more time for airway closure, which could potentially reduce the risk of aspiration.10,11
The strongest evidence for thickened liquids originates from a study based on videofluoroscopy findings. Clave et al. studied patients with stroke or traumatic brain injury, patients with neurodegenerative diseases, and healthy volunteers using videofluoroscopy while swallowing liquid, nectar, and pudding boluses.11 Of the 46 patients with stroke or traumatic brain injury, 21.6% had aspiration of liquid into the airway, but this incidence was reduced to 10.5% and 5.3% when the diet was modified to nectar and pudding, respectively. Of the 46 patients with neurodegenerative diseases, 16.2% had aspiration of liquid into the airway, which was reduced to 8.3% and 2.9% when given nectar and pudding boluses, respectively. Thus, thickened liquids significantly improved the videofluoroscopy results, leading to a presumptive decrease in the rate of respiratory complications. Other authors have reached similar conclusions in different settings and selected patient populations.9 These results, although mostly based on imaging findings and in only narrow populations, have been widely extrapolated to routine clinical practice.1,9,12
WHY THICKENED LIQUIDS ARE NOT HELPFUL FOR ADULT PATIENTS WITH DYSPHAGIA
Evidence against thickened liquids dates back to 1994, when a comparative effectiveness trial of stroke patients found that family instruction on appropriate compensatory swallowing techniques without the use of thickened liquids carried no increased risk of pneumonia, dehydration, malnutrition, or death when compared with thickened liquids.13 Recent evidence has established the risk for harm with thickened liquids. Specifically, patients assigned to thickened liquids in one study had a higher rate of dehydration (6%-2%), fever (4%-2%), and urinary tract infections (6%-3%) than those assigned to thin liquids.14 This is presumed to be related to poor fluid and nutritional intake resulting from the thickened liquids.1,9,14
Patients’ perceived quality of life is also lower when on thickened liquids. Studies typically measured this using the validated Swallowing Quality of Life (SWAL-QOL), which is a quality-of-life and quality-of-care outcomes tool designed for patients with oropharyngeal dysphagia.1,15 One study found that those started on thickened liquids had a significant reduction in their SWAL-QOL score by nearly 14 points (P < .05).15 Perhaps because of this reduced quality of life, patient compliance has been reported to be as low as 35% at five days.16
Several systematic reviews support allowing access to free water rather than limiting patients to thickened liquids in the setting of dysphagia. Gillman et al., Kaneoka et al., and Loeb et al. found no statistical difference in the risk of developing aspiration pneumonia in patients granted access to free water when compared to those with thickened liquids.1,9,12,15 In the meta-analysis of Gillman et al. of 206 patients, there was no significant increase in the odds of having lung complications when allowing patients access to free water in comparison to thickened liquids (odds ratio 1.51, 95% confidence interval 0.2-100.03).1 The meta-analysis of Kaneoka et al. showed no significant difference in the odds of developing pneumonia in patients with access to free water compared with thickened liquids in a sample of 135 patients (odds ratio 0.82, 95% confidence interval 0.05-13.42).12 However, the systematic reviews of Gillman et al. and Kaneoka et al. included studies with stringent exclusion criteria, including impaired cognition and mobility limitations, which limits their applicability.1,12
IN WHAT CIRCUMSTANCES MIGHT THICKENED LIQUIDS BE HELPFUL
In patients who have extreme choking with water intake, restricting access to oral water may be reasonable to avoid the physical stress of coughing. Similarly, in end-of-life situations, if coughing is so bothersome to patients or families as to be inconsistent with goals of care, then thickened liquids for comfort measures may be reasonable. Finally, Foley et al. found that combining thickened liquids with texture-modified diets and intensive training sessions with speech-language pathologists focused on swallowing techniques led to a reduced risk for aspiration pneumonia during the first seven days following an acute stroke. Since risk reduction did not persist after seven days, prolonged modification is likely not helpful.4
WHAT WE SHOULD DO INSTEAD
Access to free water is important for hydration, quality of life, and delirium prevention. A collaborative approach with nurses, speech therapists, and caretakers should be employed to focus on strategies to prevent aspiration pneumonia via positioning, oral hygiene, and patient and family education. Postural adjustment with the chin-down posture alters the flow of the bolus during the pharyngeal phase of the swallow.14,17 This technique has shown superior safety when directly compared with thickened liquids without any difference in aspiration pneumonia rates.14 In addition, oral hygiene for patients who cannot perform oral care themselves should be implemented to decrease the amount of pathogenic bacteria in secretions.1,15 Finally, ensuring that patients and families understand the risks and benefits of access to free water is paramount.
Tube feeding (eg, nasogastric and gastric tubes) allows for reliable delivery of enteral nutrition and medications. Tube feeding does not decrease aspiration events compared with oral diets. Moreover, the risk of developing aspiration pneumonia appears to be similar among gastrostomy, nasogastric, and postpyloric feeding tubes.5 This approach may be preferable, though, when the dysphagia is the result of a structural abnormality such as stroke deficit, neoplastic changes, or surgical alteration of the larynx.
Free water protocols use an interdisciplinary approach to safely improve access to water for patients with dysphagia. Free water protocols involve screening high-risk populations such as the elderly, confused, or stroke patients with a bedside swallow evaluation. Those with difficulty following directions, who are unable to limit their drinking to manageable-sized sips, or with excessive cough are restricted to supervised water drinking with access to water only between meals (30 minutes after a meal) and with aggressive oral hygiene. Posturing techniques with the chin-down position may be employed. Patients and their families must be educated on protocol implementation and rationale.1,9,12
Overall, free water protocols have demonstrated an improvement in quality of life, no change in adverse events, and improved water intake. SWAL-QOL scores were significantly improved by nearly three points (P < .05).15 There was no significant difference in the odds of developing aspiration pneumonia when comparing those on thickened liquids to those with access to free water.1,9,12 Furthermore, one study by Loeb et al. even found that those allocated to a thickened liquid group were more likely to develop aspiration pneumonia, although this difference was not statistically significant.9 Finally, those given access to free water had higher amounts of fluid intake by a mean of 180 ml.1
RECOMMENDATIONS
- Allow patients with dysphagia access to free water
- Initiate protocols to ensure adequate oral hygiene, patient and family education, and optimization of positioning strategies
CONCLUSIONS
Our patient is assessed with a bedside swallow evaluation and has issues with minor coughing. Despite this, he repeatedly requests access to free water, and these requests are upsetting to his family. The risks of potential aspiration are explained to him, and he and his family express understanding. He is given supervised access to water between meals and is encouraged to sit upright and brush his teeth prior to drinking. He continues to improve throughout the hospitalization and at the time of discharge, his sodium level is within normal limits and he is delighted to be drinking regular water.
Patients with dysphagia are often restricted to thickened liquids. This approach does alter the liquid flow throughout the oropharynx and minimal clinical evidence supports this practice as a method to reduce aspiration pneumonia. Given the potential harm and the reduced quality of life, we recommend against thickened liquids in this setting. Taken as a whole, available evidence suggests that protocols to facilitate safe access to water,1 family information and education,13 and positioning techniques14 are safe, effective, and preferable to thickened liquids.1,12
Do you think this is a low-value practice? Is this truly a “Thing We Do for No Reason?” Share what you do in your practice and join in the conversation online by retweeting it on Twitter (#TWDFNR) and liking it on Facebook. We invite you to propose ideas for other “Things We Do for No Reason” topics by emailing TWDFNR@hospitalmedicine.org.
Disclosures
The authors have nothing to disclose.
1. Gillman A, Winkler R, Taylor NF. Implementing the free water protocol does not result in aspiration pneumonia in carefully selected patients with dysphagia: a systematic review. Dysphagia. 2017;32(3):345-361. doi: 10.1007/s00455-016-9761-3. PubMed
2. Bhattacharyya N. The prevalence of dysphagia among adults in the United States. Otolaryngol Head Neck Surg. 2014;151(5):765-769. doi: 10.1177/0194599814549156. PubMed
3. Karagiannis MJP CL, Karagiannis TC. Effects of oral intake of water in patients with oropharyngeal dysphagia. BMC Geriatrics. 2011;11(2):9. doi: 10.1186/1471-2318-11-9. PubMed
4. Foley N, Teasell R, Salter K, Kruger E, Martino R. Dysphagia treatment post stroke: a systematic review of randomised controlled trials. Age Ageing. 2008;37(3):258-264. doi: 10.1093/ageing/afn064. PubMed
5. Marik PE. Aspiration pneumonitis and aspiration pneumonia. N Engl J Med. 2001;344(9):665-671. doi: 10.1056/NEJM200103013440908. PubMed
6. Lanspa MJ, Jones BE, Brown SM, Dean NC. Mortality, morbidity, and disease severity of patients with aspiration pneumonia. J Hosp Med. 2013;8(2):83-90. doi: 10.1002/jhm.1996. PubMed
7. Brodsky MB, Suiter DM, Gonzalez-Fernandez M, et al. Screening accuracy for aspiration using bedside water swallow tests: a systematic review and meta-analysis. Chest. 2016;150(1):148-163. doi: 10.1016/j.chest.2016.03.059. PubMed
8. Carnaby-Mann G, Lenius K. The bedside examination in dysphagia. Phys Med Rehabil Clin N Am. 2008;19(4):747-768, viii. doi: 10.1016/j.pmr.2008.05.008. PubMed
9. Loeb MB, Becker M, Eady A, Walker-Dilks C. Interventions to prevent aspiration pneumonia in older adults: a systematic review. J Am Geriatr Soc. 2003;51(7):1018-1022. doi: 10.1046/j.1365-2389.2003.51318.x. PubMed
10. Steele CM, Alsanei WA, Ayanikalath S, et al. The influence of food texture and liquid consistency modification on swallowing physiology and function: a systematic review. Dysphagia. 2015;30(1):2-26. doi: 10.1007/s00455-014-9578-x. PubMed
11. Clave P, de Kraa M, Arreola V, et al. The effect of bolus viscosity on swallowing function in neurogenic dysphagia. Aliment Pharmacol Ther. 2006;24(9):1385-1394. doi: 10.1111/j.1365-2036.2006.03118.x. PubMed
12. Kaneoka A, Pisegna JM, Saito H, et al. A systematic review and meta-analysis of pneumonia associated with thin liquid vs. thickened liquid intake in patients who aspirate. Clin Rehabil. 2017;31(8):1116-1125. doi: 10.1177/0269215516677739. PubMed
13. DePippo KL, Holas MA, Reding MJ, Mandel FS, Lesser ML. Dysphagia therapy following stroke: a controlled trial. Neurology. 1994;44(9):1655-1660. doi: 10.1212/WNL.44.9.1655. PubMed
14. Robbins J, Gensler G, Hind J, et al. Comparison of 2 interventions for liquid aspiration on pneumonia incidence: a randomized trial. Ann Intern Med. 2008;148(7):509-518. doi: 10.7326/0003-4819-148-7-200804010-00007. PubMed
15. Carlaw C, Finlayson H, Beggs K, et al. Outcomes of a pilot water protocol project in a rehabilitation setting. Dysphagia. 2012;27(3):297-306. doi: 10.1007/s00455-011-9366-9. PubMed
16. Leiter AE WJ. Compliance of geriatric dysphagic patients with safe-swallowing instructions. J Med Speech Lang Pathol. 1996;4(4):289-300.
17. Ashford J, McCabe D, Wheeler-Hegland K, et al. Evidence-based systematic review: Oropharyngeal dysphagia behavioral treatments. Part III--impact of dysphagia treatments on populations with neurological disorders. J Rehabil Res Dev. 2009;46(2):195-204. doi: 10.1682/JRRD.2008.08.0091. PubMed
Inspired by the ABIM Foundation's Choosing Wisely campaign, the “Things We Do for No Reason” (TWDFNR) series reviews practices that have become common parts of hospital care but may provide little value to our patients. Practices reviewed in the TWDFNR series do not represent “black and white” conclusions or clinical practice standards but are meant as a starting place for research and active discussions among hospitalists and patients. We invite you to be part of that discussion. https://www.choosingwisely.org/
CLINICAL SCENARIO
A 74-year-old man with Alzheimer’s dementia and chronic dysphagia with a history of aspiration pneumonia presents with urinary tract infection, hypovolemia, and hypernatremia. He has been on thickened liquids at home for the past several months. As his overall condition improves with intravenous fluids and antibiotics, he requests to drink thin liquids.
BACKGROUND
Dysphagia is defined as difficulty or discomfort with feeding or swallowing1 and is a common clinical problem facing hospitalists. The prevalence of swallowing difficulties is estimated to affect 13 million people in the United States, which is likely to increase as the population ages.2 Dysphagia often results in inadequate fluid consumption, resulting in complications such as dehydration.1 However, the most dreaded complication is pneumonia from aspiration. Aspiration, the entry of material from the oropharynx or the gastrointestinal tract into the larynx and lungs, can be problematic since it is often colonized with pathogens.3-5 It constitutes 5%-15% of the four and a half million cases of community-acquired pneumonia per year with a mortality rate as high as 21%.5,6
Dysphagia is a clinical diagnosis, and assessment tools are available to help establish the mechanism and severity.3 For example, the bedside swallow evaluation uses the administration of water by the clinician to the patient to assess for the presence and severity of dysphagia.1,7 The evaluation is performed by making the patient sit upright at up at 90° and administering either single sips of ≤20 ml of water, consecutive sips with intake up to 100 ml of water, or progressively increasing volumes of water. The clinician then observes for clinical signs of aspiration such as choking or coughing. This evaluation is inexpensive, noninvasive, and time-efficient with a sensitivity as high as 91%, if conducted using the consecutive sips technique.7 A video fluoroscopic swallowing exam (VFSE) includes the administration of various barium consistencies that may be helpful in determining the precise mechanism of dysphagia, particularly in the pharyngeal stage of swallowing.3,8 VFSE is often considered as the standard for dysphagia evaluation, although it is expensive, time-consuming, exposes the patient to radiation, and its translation to functional ability to safely eat and drink is unproven.8
WHY YOU MIGHT THINK THICKENED LIQUIDS ARE HELPFUL FOR ADULT PATIENTS WITH DYSPHAGIA
Modifying oral liquid intake using thickened liquids has been the cornerstone of clinical practice in treating adults with dysphagia.4,9-11 Water, a thin liquid with a low viscosity, flows rapidly from the mouth into the oropharynx. The rapid rate may be too fast for the patient’s pharyngeal muscles to compensate, thus allowing aspiration.10 Thickening the liquids is meant to slow the flow of liquids to allow more time for airway closure, which could potentially reduce the risk of aspiration.10,11
The strongest evidence for thickened liquids originates from a study based on videofluoroscopy findings. Clave et al. studied patients with stroke or traumatic brain injury, patients with neurodegenerative diseases, and healthy volunteers using videofluoroscopy while swallowing liquid, nectar, and pudding boluses.11 Of the 46 patients with stroke or traumatic brain injury, 21.6% had aspiration of liquid into the airway, but this incidence was reduced to 10.5% and 5.3% when the diet was modified to nectar and pudding, respectively. Of the 46 patients with neurodegenerative diseases, 16.2% had aspiration of liquid into the airway, which was reduced to 8.3% and 2.9% when given nectar and pudding boluses, respectively. Thus, thickened liquids significantly improved the videofluoroscopy results, leading to a presumptive decrease in the rate of respiratory complications. Other authors have reached similar conclusions in different settings and selected patient populations.9 These results, although mostly based on imaging findings and in only narrow populations, have been widely extrapolated to routine clinical practice.1,9,12
WHY THICKENED LIQUIDS ARE NOT HELPFUL FOR ADULT PATIENTS WITH DYSPHAGIA
Evidence against thickened liquids dates back to 1994, when a comparative effectiveness trial of stroke patients found that family instruction on appropriate compensatory swallowing techniques without the use of thickened liquids carried no increased risk of pneumonia, dehydration, malnutrition, or death when compared with thickened liquids.13 Recent evidence has established the risk for harm with thickened liquids. Specifically, patients assigned to thickened liquids in one study had a higher rate of dehydration (6%-2%), fever (4%-2%), and urinary tract infections (6%-3%) than those assigned to thin liquids.14 This is presumed to be related to poor fluid and nutritional intake resulting from the thickened liquids.1,9,14
Patients’ perceived quality of life is also lower when on thickened liquids. Studies typically measured this using the validated Swallowing Quality of Life (SWAL-QOL), which is a quality-of-life and quality-of-care outcomes tool designed for patients with oropharyngeal dysphagia.1,15 One study found that those started on thickened liquids had a significant reduction in their SWAL-QOL score by nearly 14 points (P < .05).15 Perhaps because of this reduced quality of life, patient compliance has been reported to be as low as 35% at five days.16
Several systematic reviews support allowing access to free water rather than limiting patients to thickened liquids in the setting of dysphagia. Gillman et al., Kaneoka et al., and Loeb et al. found no statistical difference in the risk of developing aspiration pneumonia in patients granted access to free water when compared to those with thickened liquids.1,9,12,15 In the meta-analysis of Gillman et al. of 206 patients, there was no significant increase in the odds of having lung complications when allowing patients access to free water in comparison to thickened liquids (odds ratio 1.51, 95% confidence interval 0.2-100.03).1 The meta-analysis of Kaneoka et al. showed no significant difference in the odds of developing pneumonia in patients with access to free water compared with thickened liquids in a sample of 135 patients (odds ratio 0.82, 95% confidence interval 0.05-13.42).12 However, the systematic reviews of Gillman et al. and Kaneoka et al. included studies with stringent exclusion criteria, including impaired cognition and mobility limitations, which limits their applicability.1,12
IN WHAT CIRCUMSTANCES MIGHT THICKENED LIQUIDS BE HELPFUL
In patients who have extreme choking with water intake, restricting access to oral water may be reasonable to avoid the physical stress of coughing. Similarly, in end-of-life situations, if coughing is so bothersome to patients or families as to be inconsistent with goals of care, then thickened liquids for comfort measures may be reasonable. Finally, Foley et al. found that combining thickened liquids with texture-modified diets and intensive training sessions with speech-language pathologists focused on swallowing techniques led to a reduced risk for aspiration pneumonia during the first seven days following an acute stroke. Since risk reduction did not persist after seven days, prolonged modification is likely not helpful.4
WHAT WE SHOULD DO INSTEAD
Access to free water is important for hydration, quality of life, and delirium prevention. A collaborative approach with nurses, speech therapists, and caretakers should be employed to focus on strategies to prevent aspiration pneumonia via positioning, oral hygiene, and patient and family education. Postural adjustment with the chin-down posture alters the flow of the bolus during the pharyngeal phase of the swallow.14,17 This technique has shown superior safety when directly compared with thickened liquids without any difference in aspiration pneumonia rates.14 In addition, oral hygiene for patients who cannot perform oral care themselves should be implemented to decrease the amount of pathogenic bacteria in secretions.1,15 Finally, ensuring that patients and families understand the risks and benefits of access to free water is paramount.
Tube feeding (eg, nasogastric and gastric tubes) allows for reliable delivery of enteral nutrition and medications. Tube feeding does not decrease aspiration events compared with oral diets. Moreover, the risk of developing aspiration pneumonia appears to be similar among gastrostomy, nasogastric, and postpyloric feeding tubes.5 This approach may be preferable, though, when the dysphagia is the result of a structural abnormality such as stroke deficit, neoplastic changes, or surgical alteration of the larynx.
Free water protocols use an interdisciplinary approach to safely improve access to water for patients with dysphagia. Free water protocols involve screening high-risk populations such as the elderly, confused, or stroke patients with a bedside swallow evaluation. Those with difficulty following directions, who are unable to limit their drinking to manageable-sized sips, or with excessive cough are restricted to supervised water drinking with access to water only between meals (30 minutes after a meal) and with aggressive oral hygiene. Posturing techniques with the chin-down position may be employed. Patients and their families must be educated on protocol implementation and rationale.1,9,12
Overall, free water protocols have demonstrated an improvement in quality of life, no change in adverse events, and improved water intake. SWAL-QOL scores were significantly improved by nearly three points (P < .05).15 There was no significant difference in the odds of developing aspiration pneumonia when comparing those on thickened liquids to those with access to free water.1,9,12 Furthermore, one study by Loeb et al. even found that those allocated to a thickened liquid group were more likely to develop aspiration pneumonia, although this difference was not statistically significant.9 Finally, those given access to free water had higher amounts of fluid intake by a mean of 180 ml.1
RECOMMENDATIONS
- Allow patients with dysphagia access to free water
- Initiate protocols to ensure adequate oral hygiene, patient and family education, and optimization of positioning strategies
CONCLUSIONS
Our patient is assessed with a bedside swallow evaluation and has issues with minor coughing. Despite this, he repeatedly requests access to free water, and these requests are upsetting to his family. The risks of potential aspiration are explained to him, and he and his family express understanding. He is given supervised access to water between meals and is encouraged to sit upright and brush his teeth prior to drinking. He continues to improve throughout the hospitalization and at the time of discharge, his sodium level is within normal limits and he is delighted to be drinking regular water.
Patients with dysphagia are often restricted to thickened liquids. This approach does alter the liquid flow throughout the oropharynx and minimal clinical evidence supports this practice as a method to reduce aspiration pneumonia. Given the potential harm and the reduced quality of life, we recommend against thickened liquids in this setting. Taken as a whole, available evidence suggests that protocols to facilitate safe access to water,1 family information and education,13 and positioning techniques14 are safe, effective, and preferable to thickened liquids.1,12
Do you think this is a low-value practice? Is this truly a “Thing We Do for No Reason?” Share what you do in your practice and join in the conversation online by retweeting it on Twitter (#TWDFNR) and liking it on Facebook. We invite you to propose ideas for other “Things We Do for No Reason” topics by emailing TWDFNR@hospitalmedicine.org.
Disclosures
The authors have nothing to disclose.
1. Gillman A, Winkler R, Taylor NF. Implementing the free water protocol does not result in aspiration pneumonia in carefully selected patients with dysphagia: a systematic review. Dysphagia. 2017;32(3):345-361. doi: 10.1007/s00455-016-9761-3. PubMed
2. Bhattacharyya N. The prevalence of dysphagia among adults in the United States. Otolaryngol Head Neck Surg. 2014;151(5):765-769. doi: 10.1177/0194599814549156. PubMed
3. Karagiannis MJP CL, Karagiannis TC. Effects of oral intake of water in patients with oropharyngeal dysphagia. BMC Geriatrics. 2011;11(2):9. doi: 10.1186/1471-2318-11-9. PubMed
4. Foley N, Teasell R, Salter K, Kruger E, Martino R. Dysphagia treatment post stroke: a systematic review of randomised controlled trials. Age Ageing. 2008;37(3):258-264. doi: 10.1093/ageing/afn064. PubMed
5. Marik PE. Aspiration pneumonitis and aspiration pneumonia. N Engl J Med. 2001;344(9):665-671. doi: 10.1056/NEJM200103013440908. PubMed
6. Lanspa MJ, Jones BE, Brown SM, Dean NC. Mortality, morbidity, and disease severity of patients with aspiration pneumonia. J Hosp Med. 2013;8(2):83-90. doi: 10.1002/jhm.1996. PubMed
7. Brodsky MB, Suiter DM, Gonzalez-Fernandez M, et al. Screening accuracy for aspiration using bedside water swallow tests: a systematic review and meta-analysis. Chest. 2016;150(1):148-163. doi: 10.1016/j.chest.2016.03.059. PubMed
8. Carnaby-Mann G, Lenius K. The bedside examination in dysphagia. Phys Med Rehabil Clin N Am. 2008;19(4):747-768, viii. doi: 10.1016/j.pmr.2008.05.008. PubMed
9. Loeb MB, Becker M, Eady A, Walker-Dilks C. Interventions to prevent aspiration pneumonia in older adults: a systematic review. J Am Geriatr Soc. 2003;51(7):1018-1022. doi: 10.1046/j.1365-2389.2003.51318.x. PubMed
10. Steele CM, Alsanei WA, Ayanikalath S, et al. The influence of food texture and liquid consistency modification on swallowing physiology and function: a systematic review. Dysphagia. 2015;30(1):2-26. doi: 10.1007/s00455-014-9578-x. PubMed
11. Clave P, de Kraa M, Arreola V, et al. The effect of bolus viscosity on swallowing function in neurogenic dysphagia. Aliment Pharmacol Ther. 2006;24(9):1385-1394. doi: 10.1111/j.1365-2036.2006.03118.x. PubMed
12. Kaneoka A, Pisegna JM, Saito H, et al. A systematic review and meta-analysis of pneumonia associated with thin liquid vs. thickened liquid intake in patients who aspirate. Clin Rehabil. 2017;31(8):1116-1125. doi: 10.1177/0269215516677739. PubMed
13. DePippo KL, Holas MA, Reding MJ, Mandel FS, Lesser ML. Dysphagia therapy following stroke: a controlled trial. Neurology. 1994;44(9):1655-1660. doi: 10.1212/WNL.44.9.1655. PubMed
14. Robbins J, Gensler G, Hind J, et al. Comparison of 2 interventions for liquid aspiration on pneumonia incidence: a randomized trial. Ann Intern Med. 2008;148(7):509-518. doi: 10.7326/0003-4819-148-7-200804010-00007. PubMed
15. Carlaw C, Finlayson H, Beggs K, et al. Outcomes of a pilot water protocol project in a rehabilitation setting. Dysphagia. 2012;27(3):297-306. doi: 10.1007/s00455-011-9366-9. PubMed
16. Leiter AE WJ. Compliance of geriatric dysphagic patients with safe-swallowing instructions. J Med Speech Lang Pathol. 1996;4(4):289-300.
17. Ashford J, McCabe D, Wheeler-Hegland K, et al. Evidence-based systematic review: Oropharyngeal dysphagia behavioral treatments. Part III--impact of dysphagia treatments on populations with neurological disorders. J Rehabil Res Dev. 2009;46(2):195-204. doi: 10.1682/JRRD.2008.08.0091. PubMed
© 2019 Society of Hospital Medicine
In the Hospital: Laura Shea
We spoke with medical social worker Laura Shea, MSW, LICSW on her role at our tertiary care hospital. Laura’s reflections on the struggles and rewards of her job may resonate with those of us who search for balance and meaning in work.
Laura, tell us about yourself. What made you want to be a social worker?
I couldn’t really picture doing anything else. I got a degree in psychology and loved counseling. Social work was a natural fit because of the social justice component and the look into larger systems. I knew I had the skill set for this, and for those most marginalized, to be a supportive person for someone who doesn’t have that.
I also have a family member with major mental illness and chronic suicidality who I supported for a very long time. In many ways, I was a personal social worker advocating on their behalf while growing up. I remember being in high school when they overdosed, and going to the ER in the middle of the night. The next morning, I was back at school. I was a total do-gooder—President of the student council and on top of my grades. I tried dealing with this while keeping up the appearance that everything was ok, even though it wasn’t.
As I got older, there were middle-of-the-night phone calls professing suicidality which were so painful. I learned a lot about compartmentalizing and resiliency. It has given me an incredible amount of empathy for family members of patients. I have learned that it’s not always simple, and decisions aren’t easy, and solutions are complicated and can feel incomplete. We often hear, “Why hasn’t the family stepped in?” Well these issues are hard for families too, I know from firsthand experience.
At the end of the day, as challenging as the work is, I get something from it. I feel honored to bear witness to some of people’s darkest moments and also some of the most beautiful moments—the joys of coming out the other side of their process and journey.
How much of your personal story do you reveal to your patients?
I rarely do. However, to some families that are particularly devastated, I do share some of my family story. I try to affirm their challenge and acknowledge that family and friends can’t always “solve this.”
We have a culture that reveres going above and beyond, however I really honor those family members who can set boundaries. Sometimes caregivers need space, that doesn’t make you a bad person. It’s actually brave and really hard to do. You can’t give from an empty well.
Laura, tell us about your typical day.
Well, it begins with responding to e-mails. Then I meet with patients and obtain collateral to prep for multidisciplinary rounds (with physicians, RNs, case managers). I usually consult on 20-30 patients a day. In the afternoon, it varies -- maybe three patients are leaving that may need my help with things like providing substance use information or shelter resources. Typically, I’ll have a few complicated long-term patients, who may have challenging family dynamics, ongoing goals of care discussions, or behavioral difficulties. These patients keep me just as busy, it’s not quite as time sensitive but I have to keep chipping away at the work.
Seems like a busy day. Do you get a break at all?
When possible, I take a walk in the woods behind the hospital on my lunch break. There’s a beautiful path, it’s an important part of my day -- getting outside and taking a step back. I bring my pager, so I am still connected.
I used to feel like I didn’t have time to take a break, and I would work through lunch. But now I find if I take a break, I am more productive the rest of the day because it makes me more mindful. It quiets me a little, gives me perspective on the stress and stressors of working in the hospital and allows me to better connect to my job and others around me.
What does a successful day look like?
Well, one involved a homeless gentleman and a search for his family. He was in his 40s, though he looked much older, and recently had been assaulted at a shelter. He presented to either the ER or was admitted to various hospitals 14 times over the past month – typically for intoxication and hypothermia. He kept saying “I just need to find my brother” though no one was taking this request too seriously. We spent a lot of time looking for his brother with the Office of Public Guardian’s help, and we actually found him! The patient hadn’t seen his brother in four years and as it turns out was searching for him too. The brother thought the patient had passed away. With his brother’s support, the patient is now housed, going to alcohol treatment, reunited with his family, and taking his medications. His whole life changed. So that was amazing, and a reminder of how rewarding this job can be.
What is most challenging about your work?
The biggest challenge is grappling with the limitations of the system, and discharging someone to the community when the community has limited resources for these patients.
Though it’s not just the limitation of resources, some patients have been through the system so many times that as a coping mechanism and to protect themselves they do everything possible to push you away. They have walls firmly up, because of prior negative experiences with providers. I am not fazed by being yelled at, but it’s hard trying to connect with someone who has learned not to let you in. These are often the patients that need the support the most, and yet I want to respect their ability to have control or to say no. It is a tough balance.
What’s fun about your job?
I love meeting new people. I met a woman a few weeks ago who was talking about being a hippie in the ‘60s in San Francisco, and how great it was and how soft millennials are. She actually put meth in her coffee because she needed a pick-me-up to clean her house. You can’t make this stuff up! It’s just really fascinating how people live their lives, and to have a window into their world and perspective is a privilege.
Do you take work home with you or do you disconnect?
I try to disconnect, however there are days when something sticks with you and you really worry and wonder about a patient. As I mentioned, you can’t give from an empty well—so I try to acknowledge this. I find that trying to have a rich life outside of work is an important part of self-care as well. Social work is a big part of my identity but it’s not entirely who I am. I focus on friends, family, travel, yoga, and things that sustain me. I can’t do my job effectively if I am not taking a step back regularly.
What advice do you have for other providers and for patients?
The hospital is so overwhelming for our patients, more so than some providers realize. I could be in the room with a patient for 45 minutes and six different providers may come in. I try to maintain that this is the patient’s bedroom I’m walking into. It’s a private, and a sacred space for them. That’s where they sleep. This is where they are trying to recover and grapple with what brought them into the hospital.
Laura, thank you so much for telling us about your work. Anything else you’d like to share with us?
Some days I’ll go home completely exhausted and wiped out, and at first, I don’t feel like I did a single solitary thing. Some of the things that I’m trying to help people work through ...it never occurred to me that someone could, for whatever reason, find themselves in such challenging situations. I don’t have a magic wand to provide someone with housing or sobriety, but maybe in that moment I can begin to make a connection. When I just listen, I am beginning to build relationships – which for some patients is something they haven’t had in a long time. It’s in these moments of being present, without an agenda, walking with them in their challenges, that I feel most connected to the work.
Thanks, Laura.
© 2019 Society of Hospital Medicine
Care Transitions Program for High-Risk Frail Older Adults is Most Beneficial for Patients with Cognitive Impairment
Unplanned hospital admissions and readmissions have become a major focus of efforts to improve the value of healthcare given that these potentially preventable events exert substantial burden on patients, caregivers, health systems, and the economy.1 The percentage of patients who are rehospitalized within 30 days have decreased from 20%-21% at the start of the Accountable Care Act and readmission penalties to approximately 18%.2-5 Rehospitalization rates are 33% at 90 days and approach 40% at six months.6,7 Readmissions cost Medicare more than $26 billion annually,4 with one in five Medicare beneficiaries readmitted within 30 days of hospital discharge.8 Centers for Medicare and Medicaid Services and other payers use condition-specific and all-cause 30-day unplanned readmission rates and potentially preventable admissions among patients with complex or multiple comorbidities for public reporting, value-based purchasing, and performance-based reimbursement.9,10 Consequently, medical groups and hospitals have begun to place an increasing emphasis on improving the transitions of care following hospitalization with the goal of reducing unplanned readmissions.11 Care transitions programs have been shown to decrease readmission rates, mortality, and emergency department (ED) visits.12
Care transitions programs vary greatly in their scope of intervention and target groups, as well as in their efficacy in reducing readmissions.13,14 The Mayo Clinic Care Transition Program, hereafter referred to as CTP, was launched in 2011. This program was modeled after other successful programs and involves home visits by a nurse practitioner (NP) and telephonic support and triage provided by a registered nurse (RN). It is offered to high-risk community-dwelling patients during their hospitalization and begins within a week of hospital discharge.
Although the CTP reduces 30-day readmissions from 20% to 17%,7 it is a highly resource-intensive, multimodal, multidisciplinary program. Moreover, whether some components of the CTP are more critical than others remains unknown. Prior studies that examined the individual components of successful CTPs have suggested that a multipronged approach that includes close patient and caregiver support is most predictive of program efficacy.13 Long-term program sustainability would benefit from optimization of the most critical components of the program while reducing or eliminating resource-intensive factors that have negligible effects on program success. We therefore examined our CTP to identify whether and which program components are most critical for preventing 30-day readmissions and whether any patient characteristics contribute risk within this complex population.
METHODS
Study Design and Setting
This study is a retrospective cohort study of patients who were enrolled in the care transitions program of Mayo Clinic Rochester during the period January 1, 2010 to June 30, 2013. Patient demographic and clinical data were obtained from electronic health records (EHR), and information regarding CTP processes and interventions was obtained from a prospectively maintained program database. The study complied with the principles of the Declaration of Helsinki and was approved by the Mayo Clinic Institutional Review Board.
Objectives
The study aimed to describe the performance and utilization of a multidisciplinary care transitions program that has been successful in reducing readmissions for high-risk patients. The study also sought to identify patient and/or program factors associated with failure to prevent readmission within 30 days of program enrollment.
Population
Patients who were enrolled in the CTP following hospital discharge and seen for a posthospital in-home visit prior to hospital readmission (for those readmitted) were included. Patients discharged to a skilled nursing facility were excluded. Patients were eligible for CTP enrollment if they were hospitalized for any cause, community dwelling (including assisted living) prior to hospitalization, and ≥60 years old with an Elder Risk Assessment (ERA) score ≥16.7 The ERA incorporates information regarding previous hospital days, age, and comorbid health burden and has been shown to predict 30-day readmissions, mortality, and critical illness (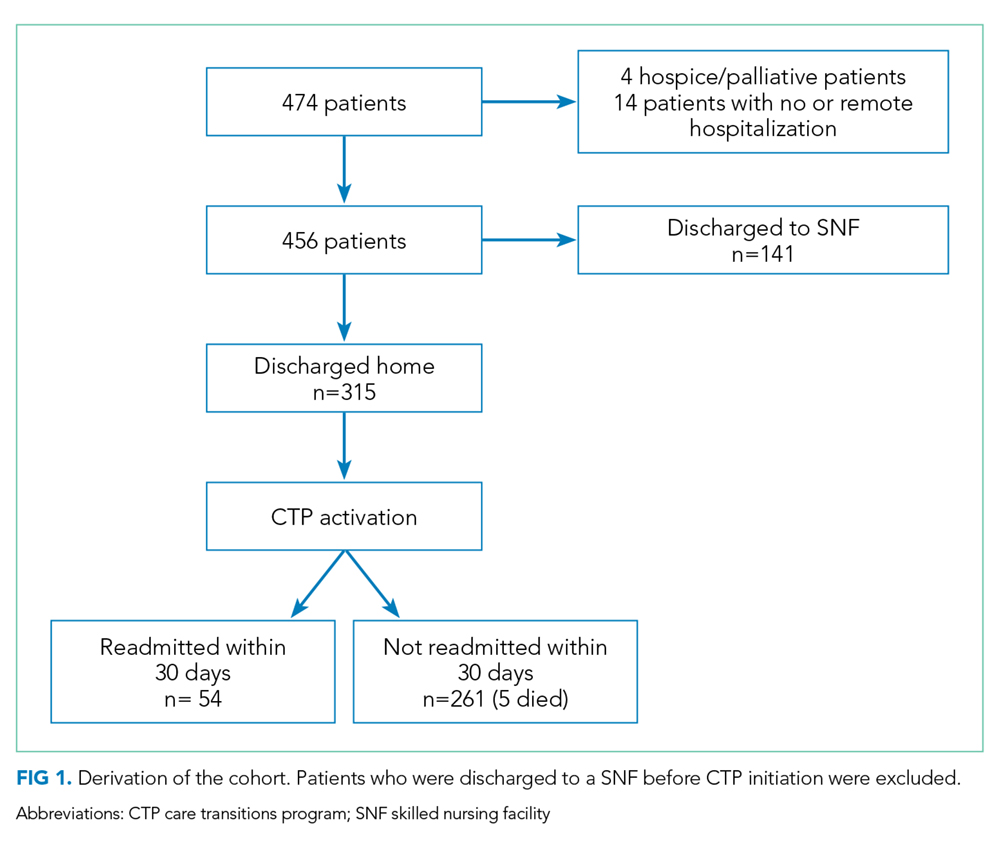
Intervention
Detailed descriptions of the CTP have been previously published.7,17 Patients meeting enrollment criteria are enrolled into the CTP by a RN prior to or immediately after hospital discharge. The patient is then seen at home within one to five business days of discharge and again the following week by a NP who performs medication reconciliation; chronic illness management; and acute illness, mobility, safety, and cognition assessments. The NP also provides patient education on self-care and advance care planning. Patient and caregiver support and liaisons with community resources are provided. Home visits by an NP or MD are continued as needed for at least one month. A RN case manager performs weekly phone calls to assess changes in the patient’s clinical status and is available for phone triage of acute health issues. An interdisciplinary team composed of MDs, NPs, RNs, and pharmacists review patient management at weekly meetings. Although after-hours or weekend coverage for home visits are unavailable, an on-call primary care physician is available by phone at all times.
Primary Outcome
The primary outcome was all-cause hospital readmission within 30 days of the first CTP home visit, indicating successful program enrollment. Hospitalization was determined on the basis of billing codes from Mayo Clinic hospitals; this approach is 99% reliable in detecting readmissions for this population.18
Secondary Outcome Measures
Secondary outcome measures included six-month mortality and hospitalizations, as well as the number of hospital and ICU days and home, ED, primary care, and specialty office visits within 180 days after index hospitalizations as per the EHR. ED visits were counted only when they did not result in a hospital admission.
Independent Variables
Patient characteristics and clinical variables were retrieved from the EHR and included patient age, sex, and marital status. Comorbidities, ERA score,19 and Charlson comorbidity index (CCI)20 within two years of program enrollment were determined by using ICD-9 billing codes. The frequencies of primary care and specialty visits within six months of the index hospitalization were also ascertained using the EHR. Mobility limitations and cognitive impairment were categorized as binary variables (yes/no) and were assessed at the first home visit by the NP. The presence of mobility limitations was defined as a Barthel’s score of <7521,22 or Timed up and Go time of >20 seconds.23 Cognitive impairment was established as Kokmen below the normal cutoff for patient’s age group,24 Mini-Cog ≤2,25or AD8 ≥2.26 If these measures were not specifically documented during the first visit, clinical notes were queried for the description of pertinent cognitive and/or mobility limitations. Dementia diagnosis billing codes (ICD9 Code 290.*) were also included. High medication use was defined as >14 given the reported average medication number ranges from 8-13 in this population.27
As previously published, fidelity measures were abstracted from clinical notes by a trained nurse abstractor within 30 days of program enrollment and prior to a readmission.7 The five program fidelity measures included medication reconciliation, home service evaluation, advanced directives discussion, action plan for acute and chronic disease, safety plan, and discussion of community resources. The presence of advanced care planning was determined on the basis of visit medical notes and/or change of code status within the EHR, the identification or scanning of written advanced directives or “provider order for life-sustaining treatment,” and documentation of the discussion of resuscitation status. It was abstracted in duplicate by a nurse abstractor with physician adjudication for disagreement. Moreover, whether the initial visit met the goal of being within five days of discharge was determined by using billing data.
Analysis
The contribution of each independent variable to 30-day readmission was first directly assessed by using a univariate logistic regression model. Five patients died within 30 days without being admitted. These deaths, however, were not censored given that home death (as opposed to hospital death) was considered a positive outcome of the CTP. Multivariable modeling was performed through log rank test with backwards elimination and included all independent variables with P < .05. Variables with P values between .05 and >.1 were tested for interaction with age and sex. Age was categorized as <80 or ≥80 years. The length of hospital stay was categorized as <3 days (not qualifying for a Medicare skilled nursing facility), 3-13 days, or ≥14 days.
This study had 30% power to detect a reduction of 5% in the rates of hospital admissions; 5% is the median absolute risk reduction reported by previous randomized studies on care transitions programs previously reported.10 All analyses were performed using SAS 6.01 (SAS Inc., Cary, North Carolina).
RESULTS
Study Population
The study cohort included 315 patients who met the inclusion criteria (Fig 1). The demographic and clinical characteristics of the participants were ascertained at the time of CTP enrollment and are shown in Table 1. Patients were, on average, 82.5 (SD, 8.2) years old and had multiple comorbidities with a mean CCI score of 6.2 and ERA score of 18.5. Almost half of the patients (43.2%) exhibited cognitive impairment and more than half (51.7%) had mobility limitations. Among the patients, 42.9% had been hospitalized at least once in the 180 days prior to their CTP-qualifying hospitalization and 14.2% had ≥2 hospitalizations prior to their CTP-qualifying hospitalization. Similarly, 32.4% had at least one emergency department (ED) visit, and 3.5% had ≥3 ED visits. The majority of patients had frequent outpatient visits, with 30.8% having ≥4 office visits in primary care and 32.4% having ≥4 specialty office visits in the preceding six months.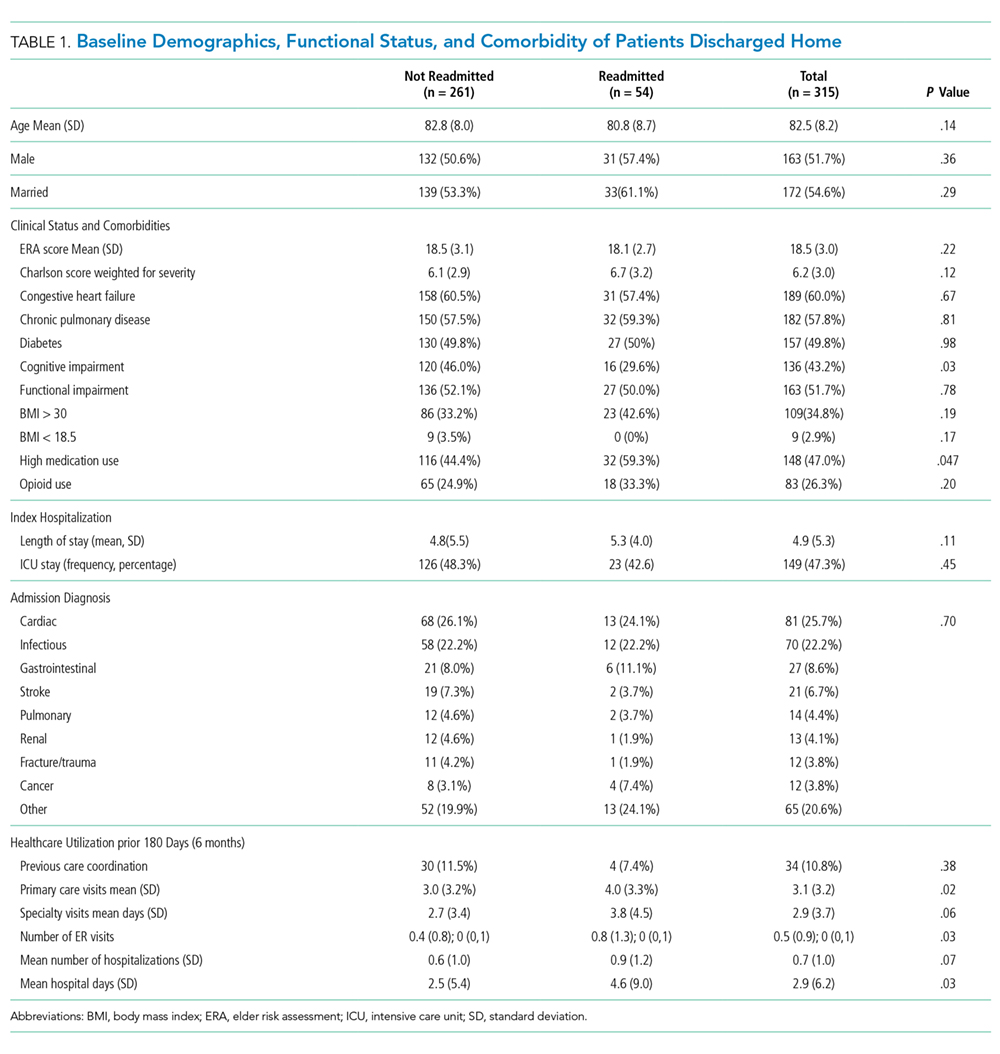
Readmissions, Mortality, ED, and Outpatient Visits
Of the 315 patients, 54 (17.1%) had a readmission within 30 days and seven (2%) had >1 readmission. Among the patients, 126 (40.0%) were readmitted at least once within 180 days with 55 (17.5%) having more than one readmission. A total of 41 patients (13.1%) died during the six-month follow-up period. The need for both office and ED visits was reduced compared to the 180 days prior to admission with the biggest difference in ED visits: 72 (22.9%) of patients needed visits within 180 days of enrollment, as opposed to 102 (32.4%) before enrollment.
Impact of Patient Clinical Variables on Readmission Risk
Readmitted patients were less likely to exhibit cognitive impairment (29.6% vs 46.0%; P = .03) and were more likely to have high medication use (59.3% vs 44.4%; P = .047) than patients without readmission (Table 1). Readmitted patients had a higher frequency of visits to primary care (4.0 vs 3.0; P =.02) in the six months prior to admission and more hospital days in the prior year (4.6 vs 2.5; P = .04) than those without readmission.
Multivariable analysis, which included the cognitive status of the patient; the high use of medication; and the number of ED visits, primary care visits, and hospital days in the previous six months, provided a C statistic of 0.665. After backwards elimination, only the cognitive status of the patient and number of ED visits remained predictive of readmission risk.
Impact of Program Interventions on Readmission Risk
The completion of the CTP fidelity measures drastically varied with completion rates between 29.5% (community resource evaluation) and 87.0% (home visit within five days of hospital discharge; Table 2). Only 12.1% of patients received all components of the CTP at the first home visit. Readmission rates among patients who received all program components (13.2%) were lower than those among patients who did not receive all program components. This difference, however, failed to reach statistical significance. No single program component significantly reduced readmission risk. The completion rate of program fidelity measures increased with time (Figure 2). The present findings did not change even after performing sensitivity analysis that excluded the first program year. The overall agreement between chart abstractors on determining whether advance care planning occurred was 69.5% but the Cohens Kappa was only 18.4. This result was largely ascribed to the following: One abstractor counted the presence of a shorthand template used to document the delivery of an advance care planning document as discussion, whereas the other abstractor required further documentation or corroborating evidence (ie, change of code status). The majority of patients required multiple home visits to address ongoing medical needs (mean 2.7; SD = 1.3) over the first 30 days. Among these patients, only 17.1% received one visit, and 54.6% of patients received ≥3 visits. Eleven (3.5%) patients transitioned to a palliative homebound program that we began offering toward the end of this study to meet patient needs.28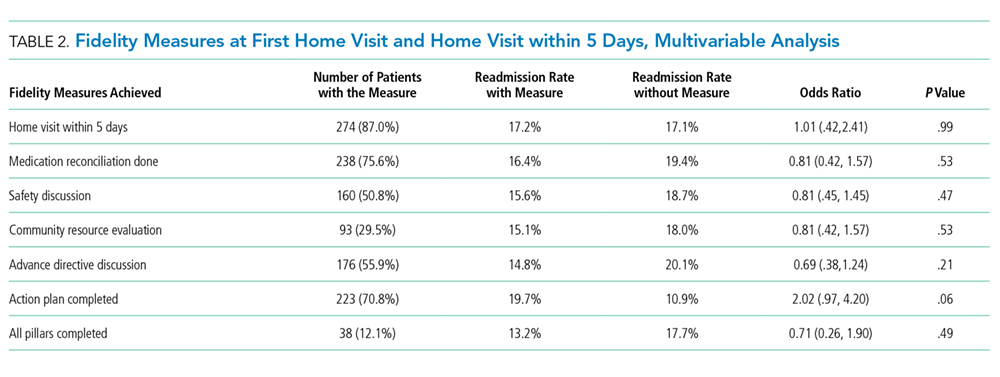
DISCUSSION
The present study met our objective of identifying individual patient factors that are predictive of the success of our CTP. Cognitively impaired patients were less likely to be readmitted than cognitively intact patients. This finding is particularly important because patients with dementia constitute a subgroup that is at an increased risk of readmission after hospitalization29 and often suffer burdensome transitions at the end of life.30,31 High medication use and high number of visits to primary care and number of hospital days in the six months leading up to enrollment increase the likelihood of readmission and are plausible measures of disease severity or multi-morbidity that have been identified in previous studies.32,33 No one program intervention was found to be significantly associated with readmission. This result is consistent with prior works that demonstrated the need for multifaceted and intensive interventions to reduce readmission risk among highly complex and multimorbid patients.13,14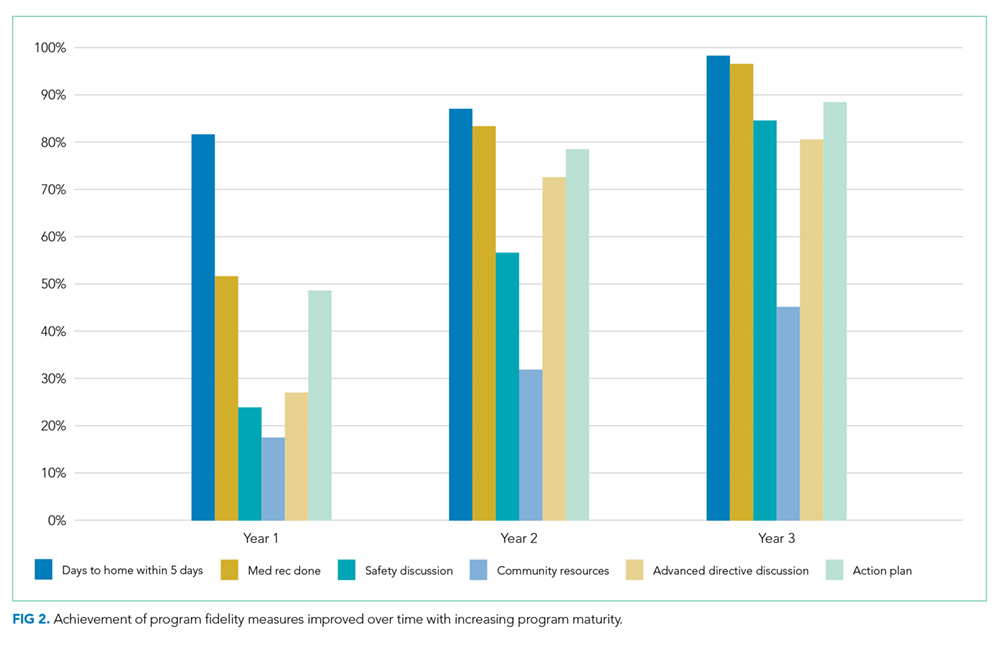
Our findings suggest that the provision of an alternative to stressful hospitalization to cognitively impaired patients and their caregivers may be an important benefit of care transitions programs. Having a trusted team to consult in acute situations may have enabled early intervention and crisis avoidance. Avoiding hospitalizations and ED visits may also have been in line with their goals of care.34,35 Given that program intensity varied on the basis of the discretion of the clinical team, patients with cognitive impairment and their caregivers may also have received more intensive support than cognitively intact patients.
In contrast to recent systematic reviews, our study did not find that advance directive discussion had significant effects on reductions in readmission.36,37 The lack of discussion surrounding the goals of care for patients with serious illnesses was also listed as one of four factors that are strongly associated with preventability in a national cohort of readmitted general medicine patients.38 The lack of power and incomplete documentation may have contributed to our null findings. Trust building must also occur before any meaningful discussion of the goals of care could be achieved, and follow-up time may have to be extended. Toward the end of this study, we developed an extension of our program for patients with limited life expectancy and conservative goals of care. In this extension, reductions in hospitalizations were observed among patients who had multiple goals of care discussions.28
Previous studies have shown that readmissions reduced with timely follow up among patients with heart failure.39 Our results showed no difference in readmission rate based on whether or not our patients were visited within five days from discharge, but we may have been underpowered to detect this difference. In addition, we may have missed readmissions that occurred before the enrollment visit.
The elements of the CTP were evidence based. Fidelity to program goals improved over time and reached high levels with program maturity. Only 12% of the patients received all program components at the first home visit. Patients that had all pillars addressed and documented showed a nonsignificant trend toward reduced readmission rates. NPs were given discretion as to how many visits were required to stabilize a patient and achieve program objectives. Heart failure management was driven by protocol with input from cardiology. Medication reconciliation and clinical assessment with action plan were prioritized at the first visit and thus allowed for the completion of other goals at a subsequent visit if time was insufficient. These decisions were deliberated at weekly physician-led multidisciplinary meetings. This variability allowed the team to meet chronic and urgent needs but further confounded the interpretation of our results. One possible way to interpret the lack of significant predictors of success is that through clinical assessment and flexibility, we were able to tailor our program to meet the needs of this complex multi-morbid population.
This study has important limitations. Given that it is a retrospective cohort study, we were unable to include patients who were enrolled but were either readmitted or dropped out before the first program visit. In addition, because of our study’s limited sample size and readmission rate, we had limited power to detect other potential predictor variables and test for confounding and interaction. While we included numerous variables in our analyses, we lacked information on mental health and the social determinants of health, which are known to influence readmission risk.40,41 Similarly, we lacked patient self-reported measures of health and information regarding caregiver support, which are important.42,43 Several of our predictive measures (cognitive impairment, mobility limitations, and program objective completion) were dependent on supplementing billing codes with heterogeneous data abstracted from usual clinical care as opposed to standardized research protocols. Neither method is completely accurate, nor can the combination of the two be assumed to be without inaccuracies. Failure to adequately document the clinical interventions performed by the clinical team is possibly a major confounder as evidenced by the considerable lack of agreement by our trained abstractors in determining whether advance care planning took place. The generalizability of our results is also a concern because the local population is largely white and highly educated, although our experience tells us that many of our program patients have limited means and thus may more closely resemble the general US population.44 The strength of our study is that it uses real, practice-based data that can be directly translated to practice.
CONCLUSION
This study focused on a successful high-intensity CTP. Results showed that compared with patients without dementia, patients with dementia were more likely to avoid hospitalizations as a result of enrollment in the investigated CTP. This study, however, failed to identify specific programmatic components critical for the success of the CTP. These findings support the current hypothesis that multidisciplinary, multimodal, and highly intensive interventions are necessary to care for complex and multi-morbid patients. They also suggest that compared with cognitively functional patients, cognitively impaired patients with conservative goals of care may be more likely to avoid burdensome hospitalizations when provided with early intervention in their home.
Acknowledgments
B.T. conceived and designed the study, interpreted the data, drafted and provided final revisions to the manuscript. P.Y.T, N.D.S., and J.M.N obtained funding, contributed to the conception and design of the study, analysis, and interpretation of the data, and provided critical revisions to the manuscript. P.A.R., R.G.M, and G.J.H., contributed to the conception and design of the study, analysis, and interpretation of the data, and provided critical revisions to the manuscript. S.M.P. Assisted with data acquisition and interpretation, performed the data analysis, and drafted parts of the manuscript. C.Y.Y.C, L.J.H., A.L, A.C., L.B., and R.H. helped with methodologic questions and data interpretation, and provided critical revisions to the manuscript.
All authors read and approved the final manuscript and the decision to submit the manuscript for publication.
We thank Donna Lawson, RN for her help with data abstraction and Annika Beck and Anna Jones in Mayo Clinic Biomedical Ethics Research Program for her help in preparing this manuscript for publication.
Disclosures
The authors declare no conflicts of interest.
Funding
This publication was supported by the Mayo Clinic, Robert D and Patricia E. Center for the Science of Health Care Delivery (B.T., R.H., R.G.M, L.J.H), by the Extramural Grant Program by Satellite Healthcare, a not-for-profit renal care provider (L.J.H., B.T.), and by the National Institute of Health (NIH) National Institute Of Diabetes And Digestive And Kidney Diseases grant K23 DK109134 (L.J.H.) K23DK114497 (RGM) and National Institute on Aging grant K23 AG051679 (B.T.). Additional support was provided by the National Center for Advancing Translational Sciences grant UL1 TR000135. Study contents are the sole responsibility of the authors and do not necessarily represent the official views of NIH.
The sponsors had no role in the design, execution, or reporting of this study.
Prior Presentations
Part of this data was presented in poster format at the American Geriatrics Society meeting in Washington DC 2015.
1. Joynt KE, Jha AK. A path forward on Medicare readmissions. N Engl J Med. 2013;368(13):1175-1177. doi: 10.1056/NEJMp1300122. PubMed
2. Epstein AM, Jha AK, Orav EJ. The relationship between hospital admission rates and rehospitalizations. N Engl J Med. 2011;365(24):2287-2295. doi: 10.1056/NEJMsa1101942. PubMed
3. Zuckerman RB, Sheingold SH, Orav EJ, Ruhter J, Epstein AM. Readmissions, observation, and the hospital readmissions reduction program. N Engl J Med. 2016;374(16):1543-1551. doi: 10.1056/NEJMsa1513024. PubMed
4. Jencks SF, Williams MV, Coleman EA. Rehospitalizations among patients in the Medicare fee-for-service program. N Engl J Med. 2009;360(14):1418-1428. doi: 10.1056/NEJMsa0803563. PubMed
5. Gerhardt G, Yemane A, Hickman P, Oelschlaeger A, Rollins E, Brennan N. Medicare readmission rates showed meaningful decline in 2012. Medicare Medicaid Res Rev. 2013;3(2). doi: 10.5600/mmrr.003.02.b01. PubMed
6. Naylor MD, Brooten D, Campbell R, et al. Comprehensive discharge planning and home follow-up of hospitalized elders: a randomized clinical trial. JAMA. 1999;281(7):613-620. PubMed
7. Takahashi PY, Naessens JM, Peterson SM, et al. Short-term and long-term effectiveness of a post-hospital care transitions program in an older, medically complex population. Healthcare. 2016;4(1):30-35. doi: 10.1016/j.hjdsi.2015.06.006. PubMed
8. Desai NR, Ross JS, Kwon JY, et al. Association between hospital penalty status under the hospital readmission reduction program and readmission rates for target and nontarget conditions. JAMA. 2016;316(24):2647-2656. doi: 10.1001/jama.2016.18533. PubMed
9. CMS. U.S. Centers for Medicare & Medicaid Services (CMS) measure methodology. https://www.cms.gov/Medicare/Quality-Initiatives-Patient-Assessment-Instruments/HospitalQualityInits/Measure-Methodology.html. Accessed December 1, 2017; 2017.
10. National Committee for Quality Assurance. All-Cause Readmissions: the Number of Acute Inpatient Stays during the Measurement Year That Were Followed by an Acute Readmission for Any Diagnosis within 30 Days and the Predicted Probability of an Acute Readmission, for Patients 18 Years of Age and Older. Accessed May 18, 2017; 2014.
11. Naylor MD, Hirschman KB, Hanlon AL, et al. Comparison of evidence-based interventions on outcomes of hospitalized, cognitively impaired older adults. J Comp Eff Res. 2014;3(3):245-257. doi: 10.2217/cer.14.14. PubMed
12. Le Berre M, Maimon G, Sourial N, Guériton M, Vedel I. Impact of transitional care services for chronically ill older patients: A systematic evidence review. J Am Geriatr Soc. 2017;65(7):1597-1608. doi: 10.1111/jgs.14828. PubMed
13. Leppin AL, Gionfriddo MR, Kessler M, et al. Preevnting 30-day hospital readmissions: A systematic review and meta-analysis of randomized trials. JAMA Intern Med. 2014;174(7):1095-1107. doi: 10.1001/jamainternmed.2014.1608. PubMed
14. Hansen LO, Young RS, Hinami K, Leung A, Williams MV. Interventions to reduce 30-day rehospitalization: a systematic review. Ann Intern Med. 2011;155(8):520-528. doi: 10.7326/0003-4819-155-8-201110180-00008. PubMed
15. Takahashi PY, Tung EE, Crane SJ, Chaudhry R, Cha S, Hanson GJ. Use of the elderly risk assessment (ERA) index to predict 2-year mortality and nursing home placement among community dwelling older adults. Arch Gerontol Geriatr. 2012;54(1):34-38. doi: 10.1016/j.archger.2011.02.012. PubMed
16. Biehl M, Takahashi PY, Cha SS, Chaudhry R, Gajic O, Thorsteinsdottir B. Prediction of critical illness in elderly outpatients using elder risk assessment: a population-based study. Clin Interv Aging. 2016;11:829-834. doi: 10.2147/CIA.S99419. PubMed
17. Takahashi PY, Haas LR, Quigg SM, et al. 30-day hospital readmission of older adults using care transitions after hospitalization: a pilot prospective cohort study. Clin Interv Aging. 2013;8:729-736. doi: 10.2147/CIA.S44390. PubMed
18. Dunlay SM, Pack QR, Thomas RJ, Killian JM, Roger VL. Participation in cardiac rehabilitation, readmissions, and death after acute myocardial infarction. Am J Med. 2014;127(6):538-546. doi: 10.1016/j.amjmed.2014.02.008. PubMed
19. Crane SJ, Tung EE, Hanson GJ, Cha S, Chaudhry R, Takahashi PY. Use of an electronic administrative database to identify older community dwelling adults at high-risk for hospitalization or emergency department visits: the elders risk assessment index. BMC Health Serv Res. 2010;10:338. doi: 10.1186/1472-6963-10-338. PubMed
20. Charlson ME, Pompei P, Ales KL, MacKenzie CR. A new method of classifying prognostic comorbidity in longitudinal studies: development and validation. J Chronic Dis. 1987;40(5):373-383. doi: 10.1016/0021-9681(87)90171-8. PubMed
21. Collin C, Wade DT, Davies S, Horne V. The Barthel ADL Index: a reliability study. Int Disabil Stud. 1988;10(2):61-63. doi: 10.3109/09638288809164103. PubMed
22. Sulter G, Steen C, De Keyser J. Use of the Barthel index and modified Rankin scale in acute stroke trials. Stroke. 1999;30(8):1538-1541. doi: 10.1161/01.STR.30.8.1538. PubMed
23. Bohannon RW. Reference values for the timed up and go test: A descriptive meta-analysis. J Geriatr Phys Ther. 2006;29(2):64-68. doi: 10.1519/00139143-200608000-00004. PubMed
24. Kokmen E, Naessens JM, Offord KP. A short test of mental status: description and preliminary results. Mayo Clin Proc. 1987;62(4):281-288. doi: 10.1016/S0025-6196(12)61905-3. PubMed
25. Folstein MF, Folstein SE, McHugh PR. “Mini-mental state”. A practical method for grading the cognitive state of patients for the clinician. J Psychiatr Res. 1975;12(3):189-198. doi: 10.1016/0022-3956(75)90026-6. PubMed
26. Galvin JE, Roe CM, Powlishta KK, et al. The AD8: A brief informant interview to detect dementia. Neurology. 2005;65(4):559-564. doi: 10.1212/01.wnl.0000172958.95282.2a. PubMed
27. Farrell B, Szeto W, Shamji S. Drug-related problems in the frail elderly. Can Fam Phys. 2011;57(2):168-169. PubMed
28. Chen CY, Thorsteinsdottir B, Cha SS, et al. Health care outcomes and advance care planning in older adults who receive home-based palliative care: a pilot cohort study. J Palliat Med. 2015;18(1):38-44. doi: 10.1089/jpm.2014.0150. PubMed
29. Rao A, Suliman A, Vuik S, Aylin P, Darzi A. Outcomes of dementia: systematic review and meta-analysis of hospital administrative database studies. Arch Gerontol Geriatr. 2016;66(Suppl C):198-204. doi: 10.1016/j.archger.2016.06.008. PubMed
30. Gozalo P, Teno JM, Mitchell SL, et al. End-of-life transitions among nursing home residents with cognitive issues. N Engl J Med. 2011;365(13):1212-1221. doi: 10.1056/NEJMsa1100347. PubMed
31. Wang SY, Aldridge MD, Gross CP, Canavan M, Cherlin E, Bradley E. End-of-life care transition patterns of Medicare beneficiaries. J Am Geriatr Soc. 2017;65(7):1406-1413. doi: 10.1111/jgs.14891. PubMed
32. Pedersen MK, Meyer G, Uhrenfeldt L. Risk factors for acute care hospital readmission in older persons in Western countries: a systematic review. JBI Database System Rev Implement Rep. 2017;15(2):454-485. doi: 10.11124/JBISRIR-2016-003267. PubMed

33. Edwards ST, Saha S, Prentice JC, Pizer SD. Preventing hospitalization with Veterans Affairs home-based primary care: which individuals benefit most? J Am Geriatr Soc. 2017;65(8):1676-1683. doi: 10.1111/jgs.14843. PubMed
34. Mitchell SL, Palmer JA, Volandes AE, Hanson LC, Habtemariam D, Shaffer ML. Level of care preferences Among nursing home residents With advanced dementia. J Pain Symptom Manage. 2017;54(3):340-345. doi: 10.1016/j.jpainsymman.2017.04.020. PubMed
35. D’Avolio DA, Strumpf NE, Feldman J, Mitchell P, Rebholz CM. Barriers to primary care: perceptions of older adults utilizing the ED for nonurgent visits. Clin Nurs Res. 2013;22(4):416-431. doi: 10.1177/1054773813485597. PubMed
36. Brinkman-Stoppelenburg A, Rietjens JA, van der Heide A. The effects of advance care planning on end-of-life care: a systematic review. Palliat Med. 2014;28(8):1000-1025. doi: 10.1177/0269216314526272. PubMed
37. Martin RS, Hayes B, Gregorevic K, Lim WK. The effects of advance care planning interventions on nursing home residents: A systematic review. J Am Med Dir Assoc. 2016;17(4):284-293. doi: 10.1016/j.jamda.2015.12.017. PubMed
38. Auerbach AD, Kripalani S, Vasilevskis EE, et al. Preventability and causes of readmissions in a national cohort of general medicine patients. JAMA Intern Med. 2016;176(4):484-493. doi: 10.1001/jamainternmed.2015.7863. PubMed
39. Parrinello G, Torres D, Paterna S, et al. Early and personalized ambulatory follow-up to tailor furosemide and fluid intake according to congestion in post-discharge heart failure. Intern Emerg Med. 2013;8(3):221-228. doi: 10.1007/s11739-011-0602-y. PubMed
40. Barnett ML, Hsu J, McWilliams JM. Patient characteristics and differences in hospital readmission rates. JAMA Intern Med. 2015;175(11):1803-1812. doi: 10.1001/jamainternmed.2015.4660. PubMed
41. Calvillo–King L, Arnold D, Eubank KJ, et al. Impact of social factors on risk of readmission or mortality in pneumonia and heart failure: systematic review. J Gen Intern Med. 2013;28(2):269-282. doi: 10.1007/s11606-012-2235-x. PubMed
42. Rönneikkö JK, Mäkelä M, Jämsen ER, et al. Predictors for unplanned hospitalization of New Home care clients. J Am Geriatr Soc. 2017;65(2):407-414. doi: 10.1111/jgs.14486. PubMed
43. Hasan O, Meltzer DO, Shaykevich SA, et al. Hospital readmission in general medicine patients: a prediction model. J Gen Intern Med. 2010;25(3):211-219. doi: 10.1007/s11606-009-1196-1. PubMed
44. St Sauver JL, Grossardt BR, Leibson CL, Yawn BP, Melton LJ, 3rd, Rocca WA. Generalizability of epidemiological findings and public health decisions: an illustration from the Rochester Epidemiology Project. Mayo Clin Proc. 2012;87(2):151-160. doi: 10.1016/j.mayocp.2011.11.009. PubMed
Unplanned hospital admissions and readmissions have become a major focus of efforts to improve the value of healthcare given that these potentially preventable events exert substantial burden on patients, caregivers, health systems, and the economy.1 The percentage of patients who are rehospitalized within 30 days have decreased from 20%-21% at the start of the Accountable Care Act and readmission penalties to approximately 18%.2-5 Rehospitalization rates are 33% at 90 days and approach 40% at six months.6,7 Readmissions cost Medicare more than $26 billion annually,4 with one in five Medicare beneficiaries readmitted within 30 days of hospital discharge.8 Centers for Medicare and Medicaid Services and other payers use condition-specific and all-cause 30-day unplanned readmission rates and potentially preventable admissions among patients with complex or multiple comorbidities for public reporting, value-based purchasing, and performance-based reimbursement.9,10 Consequently, medical groups and hospitals have begun to place an increasing emphasis on improving the transitions of care following hospitalization with the goal of reducing unplanned readmissions.11 Care transitions programs have been shown to decrease readmission rates, mortality, and emergency department (ED) visits.12
Care transitions programs vary greatly in their scope of intervention and target groups, as well as in their efficacy in reducing readmissions.13,14 The Mayo Clinic Care Transition Program, hereafter referred to as CTP, was launched in 2011. This program was modeled after other successful programs and involves home visits by a nurse practitioner (NP) and telephonic support and triage provided by a registered nurse (RN). It is offered to high-risk community-dwelling patients during their hospitalization and begins within a week of hospital discharge.
Although the CTP reduces 30-day readmissions from 20% to 17%,7 it is a highly resource-intensive, multimodal, multidisciplinary program. Moreover, whether some components of the CTP are more critical than others remains unknown. Prior studies that examined the individual components of successful CTPs have suggested that a multipronged approach that includes close patient and caregiver support is most predictive of program efficacy.13 Long-term program sustainability would benefit from optimization of the most critical components of the program while reducing or eliminating resource-intensive factors that have negligible effects on program success. We therefore examined our CTP to identify whether and which program components are most critical for preventing 30-day readmissions and whether any patient characteristics contribute risk within this complex population.
METHODS
Study Design and Setting
This study is a retrospective cohort study of patients who were enrolled in the care transitions program of Mayo Clinic Rochester during the period January 1, 2010 to June 30, 2013. Patient demographic and clinical data were obtained from electronic health records (EHR), and information regarding CTP processes and interventions was obtained from a prospectively maintained program database. The study complied with the principles of the Declaration of Helsinki and was approved by the Mayo Clinic Institutional Review Board.
Objectives
The study aimed to describe the performance and utilization of a multidisciplinary care transitions program that has been successful in reducing readmissions for high-risk patients. The study also sought to identify patient and/or program factors associated with failure to prevent readmission within 30 days of program enrollment.
Population
Patients who were enrolled in the CTP following hospital discharge and seen for a posthospital in-home visit prior to hospital readmission (for those readmitted) were included. Patients discharged to a skilled nursing facility were excluded. Patients were eligible for CTP enrollment if they were hospitalized for any cause, community dwelling (including assisted living) prior to hospitalization, and ≥60 years old with an Elder Risk Assessment (ERA) score ≥16.7 The ERA incorporates information regarding previous hospital days, age, and comorbid health burden and has been shown to predict 30-day readmissions, mortality, and critical illness (
Intervention
Detailed descriptions of the CTP have been previously published.7,17 Patients meeting enrollment criteria are enrolled into the CTP by a RN prior to or immediately after hospital discharge. The patient is then seen at home within one to five business days of discharge and again the following week by a NP who performs medication reconciliation; chronic illness management; and acute illness, mobility, safety, and cognition assessments. The NP also provides patient education on self-care and advance care planning. Patient and caregiver support and liaisons with community resources are provided. Home visits by an NP or MD are continued as needed for at least one month. A RN case manager performs weekly phone calls to assess changes in the patient’s clinical status and is available for phone triage of acute health issues. An interdisciplinary team composed of MDs, NPs, RNs, and pharmacists review patient management at weekly meetings. Although after-hours or weekend coverage for home visits are unavailable, an on-call primary care physician is available by phone at all times.
Primary Outcome
The primary outcome was all-cause hospital readmission within 30 days of the first CTP home visit, indicating successful program enrollment. Hospitalization was determined on the basis of billing codes from Mayo Clinic hospitals; this approach is 99% reliable in detecting readmissions for this population.18
Secondary Outcome Measures
Secondary outcome measures included six-month mortality and hospitalizations, as well as the number of hospital and ICU days and home, ED, primary care, and specialty office visits within 180 days after index hospitalizations as per the EHR. ED visits were counted only when they did not result in a hospital admission.
Independent Variables
Patient characteristics and clinical variables were retrieved from the EHR and included patient age, sex, and marital status. Comorbidities, ERA score,19 and Charlson comorbidity index (CCI)20 within two years of program enrollment were determined by using ICD-9 billing codes. The frequencies of primary care and specialty visits within six months of the index hospitalization were also ascertained using the EHR. Mobility limitations and cognitive impairment were categorized as binary variables (yes/no) and were assessed at the first home visit by the NP. The presence of mobility limitations was defined as a Barthel’s score of <7521,22 or Timed up and Go time of >20 seconds.23 Cognitive impairment was established as Kokmen below the normal cutoff for patient’s age group,24 Mini-Cog ≤2,25or AD8 ≥2.26 If these measures were not specifically documented during the first visit, clinical notes were queried for the description of pertinent cognitive and/or mobility limitations. Dementia diagnosis billing codes (ICD9 Code 290.*) were also included. High medication use was defined as >14 given the reported average medication number ranges from 8-13 in this population.27
As previously published, fidelity measures were abstracted from clinical notes by a trained nurse abstractor within 30 days of program enrollment and prior to a readmission.7 The five program fidelity measures included medication reconciliation, home service evaluation, advanced directives discussion, action plan for acute and chronic disease, safety plan, and discussion of community resources. The presence of advanced care planning was determined on the basis of visit medical notes and/or change of code status within the EHR, the identification or scanning of written advanced directives or “provider order for life-sustaining treatment,” and documentation of the discussion of resuscitation status. It was abstracted in duplicate by a nurse abstractor with physician adjudication for disagreement. Moreover, whether the initial visit met the goal of being within five days of discharge was determined by using billing data.
Analysis
The contribution of each independent variable to 30-day readmission was first directly assessed by using a univariate logistic regression model. Five patients died within 30 days without being admitted. These deaths, however, were not censored given that home death (as opposed to hospital death) was considered a positive outcome of the CTP. Multivariable modeling was performed through log rank test with backwards elimination and included all independent variables with P < .05. Variables with P values between .05 and >.1 were tested for interaction with age and sex. Age was categorized as <80 or ≥80 years. The length of hospital stay was categorized as <3 days (not qualifying for a Medicare skilled nursing facility), 3-13 days, or ≥14 days.
This study had 30% power to detect a reduction of 5% in the rates of hospital admissions; 5% is the median absolute risk reduction reported by previous randomized studies on care transitions programs previously reported.10 All analyses were performed using SAS 6.01 (SAS Inc., Cary, North Carolina).
RESULTS
Study Population
The study cohort included 315 patients who met the inclusion criteria (Fig 1). The demographic and clinical characteristics of the participants were ascertained at the time of CTP enrollment and are shown in Table 1. Patients were, on average, 82.5 (SD, 8.2) years old and had multiple comorbidities with a mean CCI score of 6.2 and ERA score of 18.5. Almost half of the patients (43.2%) exhibited cognitive impairment and more than half (51.7%) had mobility limitations. Among the patients, 42.9% had been hospitalized at least once in the 180 days prior to their CTP-qualifying hospitalization and 14.2% had ≥2 hospitalizations prior to their CTP-qualifying hospitalization. Similarly, 32.4% had at least one emergency department (ED) visit, and 3.5% had ≥3 ED visits. The majority of patients had frequent outpatient visits, with 30.8% having ≥4 office visits in primary care and 32.4% having ≥4 specialty office visits in the preceding six months.
Readmissions, Mortality, ED, and Outpatient Visits
Of the 315 patients, 54 (17.1%) had a readmission within 30 days and seven (2%) had >1 readmission. Among the patients, 126 (40.0%) were readmitted at least once within 180 days with 55 (17.5%) having more than one readmission. A total of 41 patients (13.1%) died during the six-month follow-up period. The need for both office and ED visits was reduced compared to the 180 days prior to admission with the biggest difference in ED visits: 72 (22.9%) of patients needed visits within 180 days of enrollment, as opposed to 102 (32.4%) before enrollment.
Impact of Patient Clinical Variables on Readmission Risk
Readmitted patients were less likely to exhibit cognitive impairment (29.6% vs 46.0%; P = .03) and were more likely to have high medication use (59.3% vs 44.4%; P = .047) than patients without readmission (Table 1). Readmitted patients had a higher frequency of visits to primary care (4.0 vs 3.0; P =.02) in the six months prior to admission and more hospital days in the prior year (4.6 vs 2.5; P = .04) than those without readmission.
Multivariable analysis, which included the cognitive status of the patient; the high use of medication; and the number of ED visits, primary care visits, and hospital days in the previous six months, provided a C statistic of 0.665. After backwards elimination, only the cognitive status of the patient and number of ED visits remained predictive of readmission risk.
Impact of Program Interventions on Readmission Risk
The completion of the CTP fidelity measures drastically varied with completion rates between 29.5% (community resource evaluation) and 87.0% (home visit within five days of hospital discharge; Table 2). Only 12.1% of patients received all components of the CTP at the first home visit. Readmission rates among patients who received all program components (13.2%) were lower than those among patients who did not receive all program components. This difference, however, failed to reach statistical significance. No single program component significantly reduced readmission risk. The completion rate of program fidelity measures increased with time (Figure 2). The present findings did not change even after performing sensitivity analysis that excluded the first program year. The overall agreement between chart abstractors on determining whether advance care planning occurred was 69.5% but the Cohens Kappa was only 18.4. This result was largely ascribed to the following: One abstractor counted the presence of a shorthand template used to document the delivery of an advance care planning document as discussion, whereas the other abstractor required further documentation or corroborating evidence (ie, change of code status). The majority of patients required multiple home visits to address ongoing medical needs (mean 2.7; SD = 1.3) over the first 30 days. Among these patients, only 17.1% received one visit, and 54.6% of patients received ≥3 visits. Eleven (3.5%) patients transitioned to a palliative homebound program that we began offering toward the end of this study to meet patient needs.28
DISCUSSION
The present study met our objective of identifying individual patient factors that are predictive of the success of our CTP. Cognitively impaired patients were less likely to be readmitted than cognitively intact patients. This finding is particularly important because patients with dementia constitute a subgroup that is at an increased risk of readmission after hospitalization29 and often suffer burdensome transitions at the end of life.30,31 High medication use and high number of visits to primary care and number of hospital days in the six months leading up to enrollment increase the likelihood of readmission and are plausible measures of disease severity or multi-morbidity that have been identified in previous studies.32,33 No one program intervention was found to be significantly associated with readmission. This result is consistent with prior works that demonstrated the need for multifaceted and intensive interventions to reduce readmission risk among highly complex and multimorbid patients.13,14
Our findings suggest that the provision of an alternative to stressful hospitalization to cognitively impaired patients and their caregivers may be an important benefit of care transitions programs. Having a trusted team to consult in acute situations may have enabled early intervention and crisis avoidance. Avoiding hospitalizations and ED visits may also have been in line with their goals of care.34,35 Given that program intensity varied on the basis of the discretion of the clinical team, patients with cognitive impairment and their caregivers may also have received more intensive support than cognitively intact patients.
In contrast to recent systematic reviews, our study did not find that advance directive discussion had significant effects on reductions in readmission.36,37 The lack of discussion surrounding the goals of care for patients with serious illnesses was also listed as one of four factors that are strongly associated with preventability in a national cohort of readmitted general medicine patients.38 The lack of power and incomplete documentation may have contributed to our null findings. Trust building must also occur before any meaningful discussion of the goals of care could be achieved, and follow-up time may have to be extended. Toward the end of this study, we developed an extension of our program for patients with limited life expectancy and conservative goals of care. In this extension, reductions in hospitalizations were observed among patients who had multiple goals of care discussions.28
Previous studies have shown that readmissions reduced with timely follow up among patients with heart failure.39 Our results showed no difference in readmission rate based on whether or not our patients were visited within five days from discharge, but we may have been underpowered to detect this difference. In addition, we may have missed readmissions that occurred before the enrollment visit.
The elements of the CTP were evidence based. Fidelity to program goals improved over time and reached high levels with program maturity. Only 12% of the patients received all program components at the first home visit. Patients that had all pillars addressed and documented showed a nonsignificant trend toward reduced readmission rates. NPs were given discretion as to how many visits were required to stabilize a patient and achieve program objectives. Heart failure management was driven by protocol with input from cardiology. Medication reconciliation and clinical assessment with action plan were prioritized at the first visit and thus allowed for the completion of other goals at a subsequent visit if time was insufficient. These decisions were deliberated at weekly physician-led multidisciplinary meetings. This variability allowed the team to meet chronic and urgent needs but further confounded the interpretation of our results. One possible way to interpret the lack of significant predictors of success is that through clinical assessment and flexibility, we were able to tailor our program to meet the needs of this complex multi-morbid population.
This study has important limitations. Given that it is a retrospective cohort study, we were unable to include patients who were enrolled but were either readmitted or dropped out before the first program visit. In addition, because of our study’s limited sample size and readmission rate, we had limited power to detect other potential predictor variables and test for confounding and interaction. While we included numerous variables in our analyses, we lacked information on mental health and the social determinants of health, which are known to influence readmission risk.40,41 Similarly, we lacked patient self-reported measures of health and information regarding caregiver support, which are important.42,43 Several of our predictive measures (cognitive impairment, mobility limitations, and program objective completion) were dependent on supplementing billing codes with heterogeneous data abstracted from usual clinical care as opposed to standardized research protocols. Neither method is completely accurate, nor can the combination of the two be assumed to be without inaccuracies. Failure to adequately document the clinical interventions performed by the clinical team is possibly a major confounder as evidenced by the considerable lack of agreement by our trained abstractors in determining whether advance care planning took place. The generalizability of our results is also a concern because the local population is largely white and highly educated, although our experience tells us that many of our program patients have limited means and thus may more closely resemble the general US population.44 The strength of our study is that it uses real, practice-based data that can be directly translated to practice.
CONCLUSION
This study focused on a successful high-intensity CTP. Results showed that compared with patients without dementia, patients with dementia were more likely to avoid hospitalizations as a result of enrollment in the investigated CTP. This study, however, failed to identify specific programmatic components critical for the success of the CTP. These findings support the current hypothesis that multidisciplinary, multimodal, and highly intensive interventions are necessary to care for complex and multi-morbid patients. They also suggest that compared with cognitively functional patients, cognitively impaired patients with conservative goals of care may be more likely to avoid burdensome hospitalizations when provided with early intervention in their home.
Acknowledgments
B.T. conceived and designed the study, interpreted the data, drafted and provided final revisions to the manuscript. P.Y.T, N.D.S., and J.M.N obtained funding, contributed to the conception and design of the study, analysis, and interpretation of the data, and provided critical revisions to the manuscript. P.A.R., R.G.M, and G.J.H., contributed to the conception and design of the study, analysis, and interpretation of the data, and provided critical revisions to the manuscript. S.M.P. Assisted with data acquisition and interpretation, performed the data analysis, and drafted parts of the manuscript. C.Y.Y.C, L.J.H., A.L, A.C., L.B., and R.H. helped with methodologic questions and data interpretation, and provided critical revisions to the manuscript.
All authors read and approved the final manuscript and the decision to submit the manuscript for publication.
We thank Donna Lawson, RN for her help with data abstraction and Annika Beck and Anna Jones in Mayo Clinic Biomedical Ethics Research Program for her help in preparing this manuscript for publication.
Disclosures
The authors declare no conflicts of interest.
Funding
This publication was supported by the Mayo Clinic, Robert D and Patricia E. Center for the Science of Health Care Delivery (B.T., R.H., R.G.M, L.J.H), by the Extramural Grant Program by Satellite Healthcare, a not-for-profit renal care provider (L.J.H., B.T.), and by the National Institute of Health (NIH) National Institute Of Diabetes And Digestive And Kidney Diseases grant K23 DK109134 (L.J.H.) K23DK114497 (RGM) and National Institute on Aging grant K23 AG051679 (B.T.). Additional support was provided by the National Center for Advancing Translational Sciences grant UL1 TR000135. Study contents are the sole responsibility of the authors and do not necessarily represent the official views of NIH.
The sponsors had no role in the design, execution, or reporting of this study.
Prior Presentations
Part of this data was presented in poster format at the American Geriatrics Society meeting in Washington DC 2015.
1. Joynt KE, Jha AK. A path forward on Medicare readmissions. N Engl J Med. 2013;368(13):1175-1177. doi: 10.1056/NEJMp1300122. PubMed
2. Epstein AM, Jha AK, Orav EJ. The relationship between hospital admission rates and rehospitalizations. N Engl J Med. 2011;365(24):2287-2295. doi: 10.1056/NEJMsa1101942. PubMed
3. Zuckerman RB, Sheingold SH, Orav EJ, Ruhter J, Epstein AM. Readmissions, observation, and the hospital readmissions reduction program. N Engl J Med. 2016;374(16):1543-1551. doi: 10.1056/NEJMsa1513024. PubMed
4. Jencks SF, Williams MV, Coleman EA. Rehospitalizations among patients in the Medicare fee-for-service program. N Engl J Med. 2009;360(14):1418-1428. doi: 10.1056/NEJMsa0803563. PubMed
5. Gerhardt G, Yemane A, Hickman P, Oelschlaeger A, Rollins E, Brennan N. Medicare readmission rates showed meaningful decline in 2012. Medicare Medicaid Res Rev. 2013;3(2). doi: 10.5600/mmrr.003.02.b01. PubMed
6. Naylor MD, Brooten D, Campbell R, et al. Comprehensive discharge planning and home follow-up of hospitalized elders: a randomized clinical trial. JAMA. 1999;281(7):613-620. PubMed
7. Takahashi PY, Naessens JM, Peterson SM, et al. Short-term and long-term effectiveness of a post-hospital care transitions program in an older, medically complex population. Healthcare. 2016;4(1):30-35. doi: 10.1016/j.hjdsi.2015.06.006. PubMed
8. Desai NR, Ross JS, Kwon JY, et al. Association between hospital penalty status under the hospital readmission reduction program and readmission rates for target and nontarget conditions. JAMA. 2016;316(24):2647-2656. doi: 10.1001/jama.2016.18533. PubMed
9. CMS. U.S. Centers for Medicare & Medicaid Services (CMS) measure methodology. https://www.cms.gov/Medicare/Quality-Initiatives-Patient-Assessment-Instruments/HospitalQualityInits/Measure-Methodology.html. Accessed December 1, 2017; 2017.
10. National Committee for Quality Assurance. All-Cause Readmissions: the Number of Acute Inpatient Stays during the Measurement Year That Were Followed by an Acute Readmission for Any Diagnosis within 30 Days and the Predicted Probability of an Acute Readmission, for Patients 18 Years of Age and Older. Accessed May 18, 2017; 2014.
11. Naylor MD, Hirschman KB, Hanlon AL, et al. Comparison of evidence-based interventions on outcomes of hospitalized, cognitively impaired older adults. J Comp Eff Res. 2014;3(3):245-257. doi: 10.2217/cer.14.14. PubMed
12. Le Berre M, Maimon G, Sourial N, Guériton M, Vedel I. Impact of transitional care services for chronically ill older patients: A systematic evidence review. J Am Geriatr Soc. 2017;65(7):1597-1608. doi: 10.1111/jgs.14828. PubMed
13. Leppin AL, Gionfriddo MR, Kessler M, et al. Preevnting 30-day hospital readmissions: A systematic review and meta-analysis of randomized trials. JAMA Intern Med. 2014;174(7):1095-1107. doi: 10.1001/jamainternmed.2014.1608. PubMed
14. Hansen LO, Young RS, Hinami K, Leung A, Williams MV. Interventions to reduce 30-day rehospitalization: a systematic review. Ann Intern Med. 2011;155(8):520-528. doi: 10.7326/0003-4819-155-8-201110180-00008. PubMed
15. Takahashi PY, Tung EE, Crane SJ, Chaudhry R, Cha S, Hanson GJ. Use of the elderly risk assessment (ERA) index to predict 2-year mortality and nursing home placement among community dwelling older adults. Arch Gerontol Geriatr. 2012;54(1):34-38. doi: 10.1016/j.archger.2011.02.012. PubMed
16. Biehl M, Takahashi PY, Cha SS, Chaudhry R, Gajic O, Thorsteinsdottir B. Prediction of critical illness in elderly outpatients using elder risk assessment: a population-based study. Clin Interv Aging. 2016;11:829-834. doi: 10.2147/CIA.S99419. PubMed
17. Takahashi PY, Haas LR, Quigg SM, et al. 30-day hospital readmission of older adults using care transitions after hospitalization: a pilot prospective cohort study. Clin Interv Aging. 2013;8:729-736. doi: 10.2147/CIA.S44390. PubMed
18. Dunlay SM, Pack QR, Thomas RJ, Killian JM, Roger VL. Participation in cardiac rehabilitation, readmissions, and death after acute myocardial infarction. Am J Med. 2014;127(6):538-546. doi: 10.1016/j.amjmed.2014.02.008. PubMed
19. Crane SJ, Tung EE, Hanson GJ, Cha S, Chaudhry R, Takahashi PY. Use of an electronic administrative database to identify older community dwelling adults at high-risk for hospitalization or emergency department visits: the elders risk assessment index. BMC Health Serv Res. 2010;10:338. doi: 10.1186/1472-6963-10-338. PubMed
20. Charlson ME, Pompei P, Ales KL, MacKenzie CR. A new method of classifying prognostic comorbidity in longitudinal studies: development and validation. J Chronic Dis. 1987;40(5):373-383. doi: 10.1016/0021-9681(87)90171-8. PubMed
21. Collin C, Wade DT, Davies S, Horne V. The Barthel ADL Index: a reliability study. Int Disabil Stud. 1988;10(2):61-63. doi: 10.3109/09638288809164103. PubMed
22. Sulter G, Steen C, De Keyser J. Use of the Barthel index and modified Rankin scale in acute stroke trials. Stroke. 1999;30(8):1538-1541. doi: 10.1161/01.STR.30.8.1538. PubMed
23. Bohannon RW. Reference values for the timed up and go test: A descriptive meta-analysis. J Geriatr Phys Ther. 2006;29(2):64-68. doi: 10.1519/00139143-200608000-00004. PubMed
24. Kokmen E, Naessens JM, Offord KP. A short test of mental status: description and preliminary results. Mayo Clin Proc. 1987;62(4):281-288. doi: 10.1016/S0025-6196(12)61905-3. PubMed
25. Folstein MF, Folstein SE, McHugh PR. “Mini-mental state”. A practical method for grading the cognitive state of patients for the clinician. J Psychiatr Res. 1975;12(3):189-198. doi: 10.1016/0022-3956(75)90026-6. PubMed
26. Galvin JE, Roe CM, Powlishta KK, et al. The AD8: A brief informant interview to detect dementia. Neurology. 2005;65(4):559-564. doi: 10.1212/01.wnl.0000172958.95282.2a. PubMed
27. Farrell B, Szeto W, Shamji S. Drug-related problems in the frail elderly. Can Fam Phys. 2011;57(2):168-169. PubMed
28. Chen CY, Thorsteinsdottir B, Cha SS, et al. Health care outcomes and advance care planning in older adults who receive home-based palliative care: a pilot cohort study. J Palliat Med. 2015;18(1):38-44. doi: 10.1089/jpm.2014.0150. PubMed
29. Rao A, Suliman A, Vuik S, Aylin P, Darzi A. Outcomes of dementia: systematic review and meta-analysis of hospital administrative database studies. Arch Gerontol Geriatr. 2016;66(Suppl C):198-204. doi: 10.1016/j.archger.2016.06.008. PubMed
30. Gozalo P, Teno JM, Mitchell SL, et al. End-of-life transitions among nursing home residents with cognitive issues. N Engl J Med. 2011;365(13):1212-1221. doi: 10.1056/NEJMsa1100347. PubMed
31. Wang SY, Aldridge MD, Gross CP, Canavan M, Cherlin E, Bradley E. End-of-life care transition patterns of Medicare beneficiaries. J Am Geriatr Soc. 2017;65(7):1406-1413. doi: 10.1111/jgs.14891. PubMed
32. Pedersen MK, Meyer G, Uhrenfeldt L. Risk factors for acute care hospital readmission in older persons in Western countries: a systematic review. JBI Database System Rev Implement Rep. 2017;15(2):454-485. doi: 10.11124/JBISRIR-2016-003267. PubMed
33. Edwards ST, Saha S, Prentice JC, Pizer SD. Preventing hospitalization with Veterans Affairs home-based primary care: which individuals benefit most? J Am Geriatr Soc. 2017;65(8):1676-1683. doi: 10.1111/jgs.14843. PubMed
34. Mitchell SL, Palmer JA, Volandes AE, Hanson LC, Habtemariam D, Shaffer ML. Level of care preferences Among nursing home residents With advanced dementia. J Pain Symptom Manage. 2017;54(3):340-345. doi: 10.1016/j.jpainsymman.2017.04.020. PubMed
35. D’Avolio DA, Strumpf NE, Feldman J, Mitchell P, Rebholz CM. Barriers to primary care: perceptions of older adults utilizing the ED for nonurgent visits. Clin Nurs Res. 2013;22(4):416-431. doi: 10.1177/1054773813485597. PubMed
36. Brinkman-Stoppelenburg A, Rietjens JA, van der Heide A. The effects of advance care planning on end-of-life care: a systematic review. Palliat Med. 2014;28(8):1000-1025. doi: 10.1177/0269216314526272. PubMed
37. Martin RS, Hayes B, Gregorevic K, Lim WK. The effects of advance care planning interventions on nursing home residents: A systematic review. J Am Med Dir Assoc. 2016;17(4):284-293. doi: 10.1016/j.jamda.2015.12.017. PubMed
38. Auerbach AD, Kripalani S, Vasilevskis EE, et al. Preventability and causes of readmissions in a national cohort of general medicine patients. JAMA Intern Med. 2016;176(4):484-493. doi: 10.1001/jamainternmed.2015.7863. PubMed
39. Parrinello G, Torres D, Paterna S, et al. Early and personalized ambulatory follow-up to tailor furosemide and fluid intake according to congestion in post-discharge heart failure. Intern Emerg Med. 2013;8(3):221-228. doi: 10.1007/s11739-011-0602-y. PubMed
40. Barnett ML, Hsu J, McWilliams JM. Patient characteristics and differences in hospital readmission rates. JAMA Intern Med. 2015;175(11):1803-1812. doi: 10.1001/jamainternmed.2015.4660. PubMed
41. Calvillo–King L, Arnold D, Eubank KJ, et al. Impact of social factors on risk of readmission or mortality in pneumonia and heart failure: systematic review. J Gen Intern Med. 2013;28(2):269-282. doi: 10.1007/s11606-012-2235-x. PubMed
42. Rönneikkö JK, Mäkelä M, Jämsen ER, et al. Predictors for unplanned hospitalization of New Home care clients. J Am Geriatr Soc. 2017;65(2):407-414. doi: 10.1111/jgs.14486. PubMed
43. Hasan O, Meltzer DO, Shaykevich SA, et al. Hospital readmission in general medicine patients: a prediction model. J Gen Intern Med. 2010;25(3):211-219. doi: 10.1007/s11606-009-1196-1. PubMed
44. St Sauver JL, Grossardt BR, Leibson CL, Yawn BP, Melton LJ, 3rd, Rocca WA. Generalizability of epidemiological findings and public health decisions: an illustration from the Rochester Epidemiology Project. Mayo Clin Proc. 2012;87(2):151-160. doi: 10.1016/j.mayocp.2011.11.009. PubMed
© 2019 Society of Hospital Medicine
AHRQ Evidence-based Practice Center Program--Applying the Knowledge to Practice to Data Cycle to Strengthen the Value of Patient Care
Research evidence is critical for strengthening the value, quality, and safety of patient care. Learning healthcare systems (LHS) can support the delivery of evidence-based healthcare by establishing organizational processes that support three activities (Figure).1-3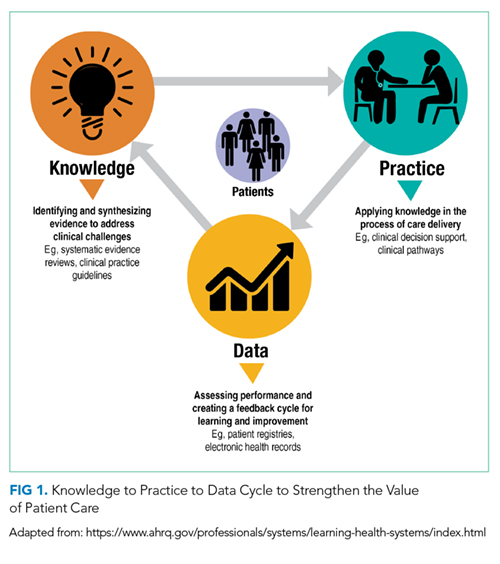
- Knowledge: Identifying and synthesizing evidence to address clinical challenges
- Practice: Applying knowledge in the process of care delivery
- Data: Assessing performance and creating a feedback cycle for learning and improvement
The systematic implementation of evidence into practice continues to be a challenge for many healthcare organizations4-7 due to limited resources, expertise, and culture.5,8-12 Missing opportunities for translating knowledge into practice not only results in low-value care (ie, waste) but also in harm.1
The AHRQ (Agency for Healthcare Research and Quality) Evidence-based Practice Center (EPC) Program was established in 1997, with the goal of synthesizing research to inform evidence-based healthcare. The national impact of this program has been significant. Since the American Recovery and Reinvestment Act of 2009, EPC program reports have been used to inform over 95 clinical practice guidelines from societies such as the American College of Physicians, 16 health coverage decisions from payers such as the Centers for Medicare & Medicaid Services, and 24 government policies and program planning efforts, such as the National Institutes of Health Pathways to Prevention Program.13
The EPC program recognizes that evidence awareness is not sufficient to change practice and improve clinical outcomes. As such, the EPC program also embarked on initiatives to facilitate the translation of evidence into clinical practice and to measure and monitor how changes in practice impact health outcomes. AHRQ has historically worked with professional organizations to translate systematic reviews into clinical practice guidelines as well as federal agencies to inform payer decisions and program planning. Recently, the EPC program has increased collaborative efforts with hospitals and healthcare systems to understand how they use evidence and to partner with them to identify methods to improve the uptake of evidence into practice.9,12
In this perspective, we describe the AHRQ EPC Program’s work to address the three phases of the LHS cycle (knowledge, practice, and data) to support high-value care, using the topic of preventing and treating Clostridium difficile colitis as a relevant example to the hospital medicine field (Figure 2). By sharing this work, we hope it can serve as a model to illustrate how partnerships between organizations and AHRQ can lead to improvements in healthcare.
USING THE LEARNING HEALTHCARE SYSTEM CYCLE TO STRUCTURE AHRQ EPC WORK
Knowledge: Identifying and Synthesizing Evidence to Address Clinical Challenges
Systematic reviews use carefully formulated questions to summarize the literature results using specific and established methods.14 Given that individual studies can have disparate results, it is critical to summarize and synthesize findings across studies, so we know what the overall evidence suggests, and whether we can be confident in the findings. To date, the EPC program has developed more than 500 evidence synthesis reports. An example relevant to the field of hospital medicine is the 2016 review that examined the effects of interventions to prevent and treat Clostridium difficile colitis in adults.15
The review examined the best available evidence, including data from randomized controlled trials and observational studies, on diagnosing, preventing, and treating Clostridium difficile colitis. Major findings included the following: vancomycin is more effective than metronidazole for treating the first occurrence of Clostridium difficile colitis (high-strength evidence), fecal transplantation may have a significant benefit in the treatment of recurrent Clostridium difficile colitis (low-strength evidence), and institutional preventive interventions such as antibiotic stewardship practices, transmission interruption through terminal room cleaning, and handwashing campaigns reduce the incidence of Clostridium difficile colitis (low-strength evidence). The report results provided the most recent review of the evidence and were particularly important as they suggested a need for significant practice changes in the treatment of Clostridium difficile colitis based on the new evidence available. Previous to this report, the 2010 guidelines from the Infectious Diseases Society of America (IDSA) recommended metronidazole over vancomycin for the treatment of the first occurrence of Clostridium difficile colitis.16 Subsequently, the newly released 2018 IDSA guideline provides recommendations consistent with the findings in this AHRQ report.17
Practice: Applying Knowledge in the Process of Care Delivery
AHRQ recognizes there are many interim steps between having the results from a systematic review and changing practice and improving care. In 2017, the EPC program began piloting approaches to make it easier for healthcare systems and hospitals to use its reports to improve the delivery of patient care and clinical outcomes. A pilot project conducted by the ECRI Institute - Penn Medicine EPC evaluated the feasibility of using an existing clinical pathway development and dissemination framework18 to translate findings from the 2016 AHRQ EPC report on Clostridium difficile colitis into a pathway for Clostridium difficile colitis treatment in the acute care setting.
To develop a Clostridium difficile colitis treatment pathway, the ECRI-Penn EPC team recruited a representative stakeholder group from Penn Medicine to review the EPC report as well as existing society guidelines. The clinical pathway was subsequently developed and approved by the stakeholders and disseminated through the Penn Medicine cloud-based pathways repository beginning on April 16, 2018.19 Most recently, the pathway became available in the electronic health record (EHR; 2018 Epic Systems Corporation) to facilitate provider review during care. Specifically, hyperlinks to the pathway are embedded within the ordering screens for those antibiotics used to treat Clostridium difficile colitis (ie, oral and rectal vancomycin, fidaxomicin, and metronidazole). Upon clicking the link in the ordering screen, the pathway launches a floating internet explorer window. The pathway is now publicly available on the AHRQ’s Clinical Decision Support (CDS) Connect Project (https://cds.ahrq.gov/), which is a resource to share pathway artifacts for other healthcare systems to use.
Data: Assessing Performance and Creating a Feedback Cycle for Learning and Improvement
The last step in the LHS cycle is to identify the impact of interventions on practice change and clinical outcomes, to understand how local results compare to peer institutions, and to inform future research and knowledge.
For the ECRI Institute-Penn Medicine EPC pilot project, both qualitative and quantitative outcomes were assessed. The initial qualitative analysis focused on the feasibility of using the AHRQ report in an existing pathway development and dissemination framework.18 It was found that clinical stakeholders identified the EPC report as trustworthy and more current than the society guidelines available at the time of development, particularly regarding the finding that vancomycin was more effective than metronidazole for the first occurrence of Clostridium difficile colitis. Additional qualitative analysis will be conducted to understand provider satisfaction with the pathway and practice impact. The quantitative analysis focused on pathway use (clicks over time) and found that as of September 16, 2018, the pathway had been viewed by providers 403 times. Future analysis will evaluate the impact of the pathway on the use of oral vancomycin for the first occurrences of Clostridium difficile colitis.
Patient registries can also help clinicians and healthcare systems to complete the feedback cycle and evaluate outcomes. Patient registries collect data from clinical and other sources in a standardized way in order to evaluate specific outcomes for various populations.20 AHRQ has created a registry handbook, including best practices for how to create, operate, and evaluate registries.20 This handbook enables the development of high-quality registries with data that can be leveraged for both research and improvement.
In the example of the ECRI Institute-Penn Medicine EPC pilot project, one way that a learning healthcare system, such as Penn Medicine, might measure the impact of the clinical pathway is to develop a quality improvement registry, which might be developed with information from their electronic health record, to examine the impact on the use of vancomycin for first occurrences of Clostridium difficile colitis. This information could help drive improvement in the implementation of the clinical pathway.
Registries can also be used as a source for research data. The NIH-funded American Gastroenterological Association (AGA) Fecal Microbiota Transplantation National Registry is an example of a research registry that collects data on outcomes and adverse events associated with fecal transplants to fill gaps in existing research. The 2016 AHRQ EPC review found low-strength evidence on fecal transplant for treatment of recurrent Clostridium difficile colitis. When designing the protocol for this registry, the researchers used the AHRQ handbook to inform the design. Given that this is a research registry, it can be used by researchers to examine trends and outcomes of fecal transplant to treat Clostridium difficile colitis. Publications that use the registry as its source of data may be used in future systematic reviews, thus completing the cycle of learning.
ADDITIONAL RESOURCES
The EPC program recognizes that gaps remain in the evidence to practice translation process and that more support is needed. Some upcoming activities of the AHRQ EPC Program to address these gaps and make its evidence reports more actionable for healthcare systems include:
- Projects to Disseminate EPC Reports into Clinical Practice. In addition to the ECRI Institute - Penn Medicine EPC pilot dissemination project, other pilot projects are aimed at helping systems apply evidence to practice and include new ways to visualize evidence to make it more actionable and usable; creating other dissemination products, such as evidence summaries and presentations for decision makers; and other implementation tools, such as decision aids. These products and summary reports are available on the AHRQ Effective Health Care Program website at https://effectivehealthcare.ahrq.gov/topics/health-systems-use-evidence/overview.
- Healthcare Systems Stakeholder Panel. Starting in Fall 2018, the AHRQ EPC Program will be convening a panel of healthcare system leaders to help make its reports and products more useful and responsive to the needs of healthcare systems and promote the use of evidence in clinical practice.
- Rapid Evidence Products. AHRQ understands that healthcare systems need information rapidly and cannot wait a year or more for a traditional systematic review to be completed. Therefore, AHRQ is applying its methods work on rapid reviews21-24 to pilot new report types that systematically identify and summarize the evidence quickly for healthcare systems and quality improvement efforts.25
- Data Integration. Originally launched in 2012, the Systematic Review Data Repository (SRDR) is an AHRQ-supported online open-access repository of abstracted data from individual studies from systematic reviews. The goal is to enable more efficient updates of systematic reviews through data reuse. An updated version of the SRDR is scheduled to launch in 2020. With the new version, future sharing of summary data from systematic reviews digitally in a computable and portable format may allow integration into CDS tools and clinical practice guideline development and dissemination, facilitating the use of evidence in clinical practice.
CONCLUSIONS
The AHRQ EPC program supports initiatives to make evidence more actionable and provide resources and tools throughout all the phases of the learning healthcare system cycle. This case study on C. difficile is one example of how the EPC program is helping hospitals and healthcare systems improve clinical care delivery and its derivative value.
Disclosures
Dr. Umscheid reports grants from AHRQ, during the conduct of the study; serves on the Advisory Board of DynaMed, and founded and directed a hospital-based evidence-based practice center. All other authors have nothing to disclose.
Disclaimer
The findings and conclusions in this document are those of the author(s), who are responsible for its content, and do not necessarily represent the views of AHRQ. No statement in this report should be construed as an official position of AHRQ or of the U.S. Department of Health and Human Services.
1. Committee on the Learning Health Care System in A, Institute of M. In: Smith M, Saunders R, Stuckhardt L, McGinnis JM, eds. Best Care at Lower Cost: The Path to Continuously Learning Health Care in America. Washington (DC): National Academies Press (US); 2013. PubMed
2. Agency for Healthcare Research and Quality. Learning Health Systems. 2017; https://www.ahrq.gov/professionals/systems/learning-health-systems/index.html. Accessed September 26, 2018.
3. Umscheid CA, Brennan PJ. Incentivizing “structures” over “outcomes” to bridge the knowing-doing gap. JAMA Intern Med. 2015;175(3):354-355. doi: 10.1001/jamainternmed.2014.5293. PubMed
4. Brownson RC, Colditz GA, Proctor EK. Dissemination and Implementation Research in Health: Translating Science to Practice. New York: Oxford University Press; 2012.
5. Marquez C, Johnson AM, Jassemi S, et al. Enhancing the uptake of systematic reviews of effects: what is the best format for health care managers and policy-makers? A mixed-methods study. Implement Sci. 2018;13(1):84. doi: 10.1186/s13012-018-0779-9. PubMed
6. Villa L, Warholak TL, Hines LE, et al. Health care decision makers’ use of comparative effectiveness research: report from a series of focus groups. J Manag Care Pharm. 2013;19(9):745-754. doi: 10.18553/jmcp.2013.19.9.745. PubMed
7. Guise JM, Savitz LA, Friedman CP. Mind the gap: putting evidence into practice in the era of learning health systems. J Gen Intern Med. 2018;33(12): 2237-2239. doi: 10.1007/s11606-018-4633-1. PubMed
8. Ako-Arrey DE, Brouwers MC, Lavis JN, Giacomini MK. Health systems guidance appraisal--a critical interpretive synthesis. Implement Sci. 2016;11(1):9. doi:10.1186/s13012-016-0373-y. PubMed
9. White CM, Butler M, Wang Z, et al. Understanding Health-Systems’ Use of and Need for Evidence To Inform Decisionmaking. Rockville, MD: Agency for Healthcare Research and Quality; 2017. PubMed
10. Murthy L, Shepperd S, Clarke MJ, et al. Interventions to improve the use of systematic reviews in decision-making by health system managers, policy makers, and clinicians. Cochrane Database Syst Rev. 2012(9):Cd009401. doi: 10.1002/14651858.CD009401.pub2. PubMed
11. Bornstein S, Baker R, Navarro P, Mackey S, Speed D, Sullivan M. Putting research in place: an innovative approach to providing contextualized evidence synthesis for decision makers. Syst Rev. 2017;6(1):218. doi: 10.1186/s13643-017-0606-4. PubMed
12. Schoelles K, Umscheid CA, Lin JS, et al. A Framework for Conceptualizing Evidence Needs of Health Systems. Rockville, MD: Agency for Healthcare Research and Quality; 2017. PubMed
13. Chang S, Chang C, Borsky A. Putting the Evidence into Decision Making. Prevention Policy Matters Blog 2018; https://health.gov/news/blog/2018/04/putting-the-evidence-into-decision-making/. Accessed September 28, 2018.
14. Institute of Medicine Committee on Standards for Systematic Reviews of Comparative Effectiveness R. In: Eden J, Levit L, Berg A, Morton S, eds. Finding What Works in Health Care: Standards for Systematic Reviews. Washington (DC): National Academies Press (US); 2011. https://www.nihlibrary.nih.gov/sites/default/files/Finding_What_Works_in_Health_Care_Standards_for_Systematic_Reviews_IOM_2011.pdf. Accessed January 17, 2019.
15. Butler M, Olson A, Drekonja D, et al. AHRQ comparative effectiveness reviews. In: Early Diagnosis, Prevention, and Treatment of Clostridium difficile: Update. Rockville (MD): Agency for Healthcare Research and Quality (US); 2016. https://effectivehealthcare.ahrq.gov/topics/c-difficile-update/research. Accessed January 17, 2019.
16. Cohen SH, Gerding DN, Johnson S, et al. Clinical practice guidelines for Clostridium difficile infection in adults: 2010 update by the society for healthcare epidemiology of America (SHEA) and the infectious diseases society of America (IDSA). Infect Control Hosp Epidemiol. 2010;31(5):431-455. doi: 10.1086/651706. PubMed
17. McDonald LC, Gerding DN, Johnson S, et al. Clinical practice guidelines for Clostridium difficile infection in adults and children: 2017 Update by the Infectious Diseases Society of America (IDSA) and Society for Healthcare Epidemiology of America (SHEA). Clin Infect Dis. 2018;66(7): e1-e48. doi: 10.1093/cid/cix1085. PubMed
18. Flores EJ, Mull NK, Lavenberg JG, et al. Utilizing a 10-step framework to support the implementation of an evidence-based clinical pathways. BMJ Qual Saf. 2018:bmjqs-2018. doi: 10.1136/bmjqs-2018-008454. PubMed
19. Flores E, Jue JJ, Girardi G, Schoelles K, Umscheid CA. Use of a Clinical Pathway to Facilitate the Translation and Utilization of AHRQ EPC Report Findings. Agency for Healthcare Research and Quality. Rockville, MD: Prepared by the ECRI Institute–Penn Medicine Evidence-based Practice Center; 2018. PubMed
20. AHRQ methods for effective health care. In: Gliklich RE, Dreyer NA, Leavy MB, eds. Registries for Evaluating Patient Outcomes: A User’s Guide. Rockville (MD): Agency for Healthcare Research and Quality (US); 2014.
21. Hartling L, Guise JM, Kato E, et al. AHRQ comparative effectiveness reviews. In: EPC Methods: An Exploration of Methods and Context for the Production of Rapid Reviews. Rockville (MD): Agency for Healthcare Research and Quality (US); 2015. PubMed
22. Hartling L, Guise JM, Kato E, et al. A taxonomy of rapid reviews links report types and methods to specific decision-making contexts. J Clin Epidemiol. 2015;68(12):1451-1462.e1453. doi: 10.1016/j.jclinepi.2015.05.036. PubMed
23. Hartling L, Guise JM, Hempel S, et al. AHRQ methods for effective health care. In: EPC Methods: AHRQ End-User Perspectives of Rapid Reviews. Rockville (MD): Agency for Healthcare Research and Quality (US); 2016. PubMed
24. Hartling L, Guise JM, Hempel S, et al. Fit for purpose: perspectives on rapid reviews from end-user interviews. Syst Rev. 2017;6(1):32. doi: 10.1186/s13643-017-0425-7. PubMed
25. Agency for Healthcare Research and Quality. Synthesizing Evidence for Quality Improvement. 2018; https://effectivehealthcare.ahrq.gov/topics/health-systems/quality-improvement. Accessed September 26, 2018.
Research evidence is critical for strengthening the value, quality, and safety of patient care. Learning healthcare systems (LHS) can support the delivery of evidence-based healthcare by establishing organizational processes that support three activities (Figure).1-3
- Knowledge: Identifying and synthesizing evidence to address clinical challenges
- Practice: Applying knowledge in the process of care delivery
- Data: Assessing performance and creating a feedback cycle for learning and improvement
The systematic implementation of evidence into practice continues to be a challenge for many healthcare organizations4-7 due to limited resources, expertise, and culture.5,8-12 Missing opportunities for translating knowledge into practice not only results in low-value care (ie, waste) but also in harm.1
The AHRQ (Agency for Healthcare Research and Quality) Evidence-based Practice Center (EPC) Program was established in 1997, with the goal of synthesizing research to inform evidence-based healthcare. The national impact of this program has been significant. Since the American Recovery and Reinvestment Act of 2009, EPC program reports have been used to inform over 95 clinical practice guidelines from societies such as the American College of Physicians, 16 health coverage decisions from payers such as the Centers for Medicare & Medicaid Services, and 24 government policies and program planning efforts, such as the National Institutes of Health Pathways to Prevention Program.13
The EPC program recognizes that evidence awareness is not sufficient to change practice and improve clinical outcomes. As such, the EPC program also embarked on initiatives to facilitate the translation of evidence into clinical practice and to measure and monitor how changes in practice impact health outcomes. AHRQ has historically worked with professional organizations to translate systematic reviews into clinical practice guidelines as well as federal agencies to inform payer decisions and program planning. Recently, the EPC program has increased collaborative efforts with hospitals and healthcare systems to understand how they use evidence and to partner with them to identify methods to improve the uptake of evidence into practice.9,12
In this perspective, we describe the AHRQ EPC Program’s work to address the three phases of the LHS cycle (knowledge, practice, and data) to support high-value care, using the topic of preventing and treating Clostridium difficile colitis as a relevant example to the hospital medicine field (Figure 2). By sharing this work, we hope it can serve as a model to illustrate how partnerships between organizations and AHRQ can lead to improvements in healthcare.
USING THE LEARNING HEALTHCARE SYSTEM CYCLE TO STRUCTURE AHRQ EPC WORK
Knowledge: Identifying and Synthesizing Evidence to Address Clinical Challenges
Systematic reviews use carefully formulated questions to summarize the literature results using specific and established methods.14 Given that individual studies can have disparate results, it is critical to summarize and synthesize findings across studies, so we know what the overall evidence suggests, and whether we can be confident in the findings. To date, the EPC program has developed more than 500 evidence synthesis reports. An example relevant to the field of hospital medicine is the 2016 review that examined the effects of interventions to prevent and treat Clostridium difficile colitis in adults.15
The review examined the best available evidence, including data from randomized controlled trials and observational studies, on diagnosing, preventing, and treating Clostridium difficile colitis. Major findings included the following: vancomycin is more effective than metronidazole for treating the first occurrence of Clostridium difficile colitis (high-strength evidence), fecal transplantation may have a significant benefit in the treatment of recurrent Clostridium difficile colitis (low-strength evidence), and institutional preventive interventions such as antibiotic stewardship practices, transmission interruption through terminal room cleaning, and handwashing campaigns reduce the incidence of Clostridium difficile colitis (low-strength evidence). The report results provided the most recent review of the evidence and were particularly important as they suggested a need for significant practice changes in the treatment of Clostridium difficile colitis based on the new evidence available. Previous to this report, the 2010 guidelines from the Infectious Diseases Society of America (IDSA) recommended metronidazole over vancomycin for the treatment of the first occurrence of Clostridium difficile colitis.16 Subsequently, the newly released 2018 IDSA guideline provides recommendations consistent with the findings in this AHRQ report.17
Practice: Applying Knowledge in the Process of Care Delivery
AHRQ recognizes there are many interim steps between having the results from a systematic review and changing practice and improving care. In 2017, the EPC program began piloting approaches to make it easier for healthcare systems and hospitals to use its reports to improve the delivery of patient care and clinical outcomes. A pilot project conducted by the ECRI Institute - Penn Medicine EPC evaluated the feasibility of using an existing clinical pathway development and dissemination framework18 to translate findings from the 2016 AHRQ EPC report on Clostridium difficile colitis into a pathway for Clostridium difficile colitis treatment in the acute care setting.
To develop a Clostridium difficile colitis treatment pathway, the ECRI-Penn EPC team recruited a representative stakeholder group from Penn Medicine to review the EPC report as well as existing society guidelines. The clinical pathway was subsequently developed and approved by the stakeholders and disseminated through the Penn Medicine cloud-based pathways repository beginning on April 16, 2018.19 Most recently, the pathway became available in the electronic health record (EHR; 2018 Epic Systems Corporation) to facilitate provider review during care. Specifically, hyperlinks to the pathway are embedded within the ordering screens for those antibiotics used to treat Clostridium difficile colitis (ie, oral and rectal vancomycin, fidaxomicin, and metronidazole). Upon clicking the link in the ordering screen, the pathway launches a floating internet explorer window. The pathway is now publicly available on the AHRQ’s Clinical Decision Support (CDS) Connect Project (https://cds.ahrq.gov/), which is a resource to share pathway artifacts for other healthcare systems to use.
Data: Assessing Performance and Creating a Feedback Cycle for Learning and Improvement
The last step in the LHS cycle is to identify the impact of interventions on practice change and clinical outcomes, to understand how local results compare to peer institutions, and to inform future research and knowledge.
For the ECRI Institute-Penn Medicine EPC pilot project, both qualitative and quantitative outcomes were assessed. The initial qualitative analysis focused on the feasibility of using the AHRQ report in an existing pathway development and dissemination framework.18 It was found that clinical stakeholders identified the EPC report as trustworthy and more current than the society guidelines available at the time of development, particularly regarding the finding that vancomycin was more effective than metronidazole for the first occurrence of Clostridium difficile colitis. Additional qualitative analysis will be conducted to understand provider satisfaction with the pathway and practice impact. The quantitative analysis focused on pathway use (clicks over time) and found that as of September 16, 2018, the pathway had been viewed by providers 403 times. Future analysis will evaluate the impact of the pathway on the use of oral vancomycin for the first occurrences of Clostridium difficile colitis.
Patient registries can also help clinicians and healthcare systems to complete the feedback cycle and evaluate outcomes. Patient registries collect data from clinical and other sources in a standardized way in order to evaluate specific outcomes for various populations.20 AHRQ has created a registry handbook, including best practices for how to create, operate, and evaluate registries.20 This handbook enables the development of high-quality registries with data that can be leveraged for both research and improvement.
In the example of the ECRI Institute-Penn Medicine EPC pilot project, one way that a learning healthcare system, such as Penn Medicine, might measure the impact of the clinical pathway is to develop a quality improvement registry, which might be developed with information from their electronic health record, to examine the impact on the use of vancomycin for first occurrences of Clostridium difficile colitis. This information could help drive improvement in the implementation of the clinical pathway.
Registries can also be used as a source for research data. The NIH-funded American Gastroenterological Association (AGA) Fecal Microbiota Transplantation National Registry is an example of a research registry that collects data on outcomes and adverse events associated with fecal transplants to fill gaps in existing research. The 2016 AHRQ EPC review found low-strength evidence on fecal transplant for treatment of recurrent Clostridium difficile colitis. When designing the protocol for this registry, the researchers used the AHRQ handbook to inform the design. Given that this is a research registry, it can be used by researchers to examine trends and outcomes of fecal transplant to treat Clostridium difficile colitis. Publications that use the registry as its source of data may be used in future systematic reviews, thus completing the cycle of learning.
ADDITIONAL RESOURCES
The EPC program recognizes that gaps remain in the evidence to practice translation process and that more support is needed. Some upcoming activities of the AHRQ EPC Program to address these gaps and make its evidence reports more actionable for healthcare systems include:
- Projects to Disseminate EPC Reports into Clinical Practice. In addition to the ECRI Institute - Penn Medicine EPC pilot dissemination project, other pilot projects are aimed at helping systems apply evidence to practice and include new ways to visualize evidence to make it more actionable and usable; creating other dissemination products, such as evidence summaries and presentations for decision makers; and other implementation tools, such as decision aids. These products and summary reports are available on the AHRQ Effective Health Care Program website at https://effectivehealthcare.ahrq.gov/topics/health-systems-use-evidence/overview.
- Healthcare Systems Stakeholder Panel. Starting in Fall 2018, the AHRQ EPC Program will be convening a panel of healthcare system leaders to help make its reports and products more useful and responsive to the needs of healthcare systems and promote the use of evidence in clinical practice.
- Rapid Evidence Products. AHRQ understands that healthcare systems need information rapidly and cannot wait a year or more for a traditional systematic review to be completed. Therefore, AHRQ is applying its methods work on rapid reviews21-24 to pilot new report types that systematically identify and summarize the evidence quickly for healthcare systems and quality improvement efforts.25
- Data Integration. Originally launched in 2012, the Systematic Review Data Repository (SRDR) is an AHRQ-supported online open-access repository of abstracted data from individual studies from systematic reviews. The goal is to enable more efficient updates of systematic reviews through data reuse. An updated version of the SRDR is scheduled to launch in 2020. With the new version, future sharing of summary data from systematic reviews digitally in a computable and portable format may allow integration into CDS tools and clinical practice guideline development and dissemination, facilitating the use of evidence in clinical practice.
CONCLUSIONS
The AHRQ EPC program supports initiatives to make evidence more actionable and provide resources and tools throughout all the phases of the learning healthcare system cycle. This case study on C. difficile is one example of how the EPC program is helping hospitals and healthcare systems improve clinical care delivery and its derivative value.
Disclosures
Dr. Umscheid reports grants from AHRQ, during the conduct of the study; serves on the Advisory Board of DynaMed, and founded and directed a hospital-based evidence-based practice center. All other authors have nothing to disclose.
Disclaimer
The findings and conclusions in this document are those of the author(s), who are responsible for its content, and do not necessarily represent the views of AHRQ. No statement in this report should be construed as an official position of AHRQ or of the U.S. Department of Health and Human Services.
1. Committee on the Learning Health Care System in A, Institute of M. In: Smith M, Saunders R, Stuckhardt L, McGinnis JM, eds. Best Care at Lower Cost: The Path to Continuously Learning Health Care in America. Washington (DC): National Academies Press (US); 2013. PubMed
2. Agency for Healthcare Research and Quality. Learning Health Systems. 2017; https://www.ahrq.gov/professionals/systems/learning-health-systems/index.html. Accessed September 26, 2018.
3. Umscheid CA, Brennan PJ. Incentivizing “structures” over “outcomes” to bridge the knowing-doing gap. JAMA Intern Med. 2015;175(3):354-355. doi: 10.1001/jamainternmed.2014.5293. PubMed
4. Brownson RC, Colditz GA, Proctor EK. Dissemination and Implementation Research in Health: Translating Science to Practice. New York: Oxford University Press; 2012.
5. Marquez C, Johnson AM, Jassemi S, et al. Enhancing the uptake of systematic reviews of effects: what is the best format for health care managers and policy-makers? A mixed-methods study. Implement Sci. 2018;13(1):84. doi: 10.1186/s13012-018-0779-9. PubMed
6. Villa L, Warholak TL, Hines LE, et al. Health care decision makers’ use of comparative effectiveness research: report from a series of focus groups. J Manag Care Pharm. 2013;19(9):745-754. doi: 10.18553/jmcp.2013.19.9.745. PubMed
7. Guise JM, Savitz LA, Friedman CP. Mind the gap: putting evidence into practice in the era of learning health systems. J Gen Intern Med. 2018;33(12): 2237-2239. doi: 10.1007/s11606-018-4633-1. PubMed
8. Ako-Arrey DE, Brouwers MC, Lavis JN, Giacomini MK. Health systems guidance appraisal--a critical interpretive synthesis. Implement Sci. 2016;11(1):9. doi:10.1186/s13012-016-0373-y. PubMed
9. White CM, Butler M, Wang Z, et al. Understanding Health-Systems’ Use of and Need for Evidence To Inform Decisionmaking. Rockville, MD: Agency for Healthcare Research and Quality; 2017. PubMed
10. Murthy L, Shepperd S, Clarke MJ, et al. Interventions to improve the use of systematic reviews in decision-making by health system managers, policy makers, and clinicians. Cochrane Database Syst Rev. 2012(9):Cd009401. doi: 10.1002/14651858.CD009401.pub2. PubMed
11. Bornstein S, Baker R, Navarro P, Mackey S, Speed D, Sullivan M. Putting research in place: an innovative approach to providing contextualized evidence synthesis for decision makers. Syst Rev. 2017;6(1):218. doi: 10.1186/s13643-017-0606-4. PubMed
12. Schoelles K, Umscheid CA, Lin JS, et al. A Framework for Conceptualizing Evidence Needs of Health Systems. Rockville, MD: Agency for Healthcare Research and Quality; 2017. PubMed
13. Chang S, Chang C, Borsky A. Putting the Evidence into Decision Making. Prevention Policy Matters Blog 2018; https://health.gov/news/blog/2018/04/putting-the-evidence-into-decision-making/. Accessed September 28, 2018.
14. Institute of Medicine Committee on Standards for Systematic Reviews of Comparative Effectiveness R. In: Eden J, Levit L, Berg A, Morton S, eds. Finding What Works in Health Care: Standards for Systematic Reviews. Washington (DC): National Academies Press (US); 2011. https://www.nihlibrary.nih.gov/sites/default/files/Finding_What_Works_in_Health_Care_Standards_for_Systematic_Reviews_IOM_2011.pdf. Accessed January 17, 2019.
15. Butler M, Olson A, Drekonja D, et al. AHRQ comparative effectiveness reviews. In: Early Diagnosis, Prevention, and Treatment of Clostridium difficile: Update. Rockville (MD): Agency for Healthcare Research and Quality (US); 2016. https://effectivehealthcare.ahrq.gov/topics/c-difficile-update/research. Accessed January 17, 2019.
16. Cohen SH, Gerding DN, Johnson S, et al. Clinical practice guidelines for Clostridium difficile infection in adults: 2010 update by the society for healthcare epidemiology of America (SHEA) and the infectious diseases society of America (IDSA). Infect Control Hosp Epidemiol. 2010;31(5):431-455. doi: 10.1086/651706. PubMed
17. McDonald LC, Gerding DN, Johnson S, et al. Clinical practice guidelines for Clostridium difficile infection in adults and children: 2017 Update by the Infectious Diseases Society of America (IDSA) and Society for Healthcare Epidemiology of America (SHEA). Clin Infect Dis. 2018;66(7): e1-e48. doi: 10.1093/cid/cix1085. PubMed
18. Flores EJ, Mull NK, Lavenberg JG, et al. Utilizing a 10-step framework to support the implementation of an evidence-based clinical pathways. BMJ Qual Saf. 2018:bmjqs-2018. doi: 10.1136/bmjqs-2018-008454. PubMed
19. Flores E, Jue JJ, Girardi G, Schoelles K, Umscheid CA. Use of a Clinical Pathway to Facilitate the Translation and Utilization of AHRQ EPC Report Findings. Agency for Healthcare Research and Quality. Rockville, MD: Prepared by the ECRI Institute–Penn Medicine Evidence-based Practice Center; 2018. PubMed
20. AHRQ methods for effective health care. In: Gliklich RE, Dreyer NA, Leavy MB, eds. Registries for Evaluating Patient Outcomes: A User’s Guide. Rockville (MD): Agency for Healthcare Research and Quality (US); 2014.
21. Hartling L, Guise JM, Kato E, et al. AHRQ comparative effectiveness reviews. In: EPC Methods: An Exploration of Methods and Context for the Production of Rapid Reviews. Rockville (MD): Agency for Healthcare Research and Quality (US); 2015. PubMed
22. Hartling L, Guise JM, Kato E, et al. A taxonomy of rapid reviews links report types and methods to specific decision-making contexts. J Clin Epidemiol. 2015;68(12):1451-1462.e1453. doi: 10.1016/j.jclinepi.2015.05.036. PubMed
23. Hartling L, Guise JM, Hempel S, et al. AHRQ methods for effective health care. In: EPC Methods: AHRQ End-User Perspectives of Rapid Reviews. Rockville (MD): Agency for Healthcare Research and Quality (US); 2016. PubMed
24. Hartling L, Guise JM, Hempel S, et al. Fit for purpose: perspectives on rapid reviews from end-user interviews. Syst Rev. 2017;6(1):32. doi: 10.1186/s13643-017-0425-7. PubMed
25. Agency for Healthcare Research and Quality. Synthesizing Evidence for Quality Improvement. 2018; https://effectivehealthcare.ahrq.gov/topics/health-systems/quality-improvement. Accessed September 26, 2018.
©2019 Society of Hospital Medicine
Preventing Hypoglycemia Following Treatment of Hyperkalemia in Hospitalized Patients
Hyperkalemia is common in hospitalized patients, with an estimated prevalence of 1%-10%.1,2 Hyperkalemia can lead to life-threatening cardiac arrhythmias. The risk of arrhythmias increases with serum potassium values >6.5 mmol/L, and hyperkalemia is associated with increased in-hospital mortality.3 Treatment for hyperkalemia is indicated by a combination of the absolute serum potassium level, the rate of change of potassium level, and the presence of electrocardiogram abnormalities.
Intravenous insulin stimulates the sodium/potassium-ATP pump, leading to intracellular uptake of potassium. Recommendations vary regarding the optimal dosing of insulin and dextrose for the treatment of hyperkalemia.4
Hypoglycemia is a common complication following treatment of hyperkalemia with insulin/dextrose. The reported incidence in hospitalized patients ranges from 6% to 75% depending on the population studied, the doses of insulin/dextrose administered, and the definition of hypoglycemia.5-8 Hypoglycemia itself is associated with increased morbidity and mortality in hospitalized patients.9
The aims of this study were to describe the incidence of hypoglycemia following hyperkalemia treatment with intravenous insulin/dextrose in inpatients in a large (900-bed) UK teaching hospital and to determine the risk factors predisposing to hypoglycemia.
METHODS
We conducted a retrospective, single-center cohort study reviewing the Electronic Patient Records (EPR) of all adult (aged ≥18 years) inpatients (excluding critical care) prescribed treatment for hyperkalemia with intravenous insulin from January 1, 2013, to March 1, 2017. Local hyperkalemia treatment guidelines included administration of 10 units of insulin and 100 ml of 20% glucose intravenously in accordance with national guidelines.10 The study received local approval.
Episodes occurring before May 1, 2015, were excluded because modification to the hyperkalemia prescription care bundle was implemented in April 2015 recommending standardized simultaneous insulin and dextrose administration and hourly capillary blood glucose (CBG) measurement for six hours following treatment. Episodes where no dextrose was prescribed or administered (n = 435) or where no CBG value was recorded within six hours after treatment were excluded (n = 63). All patients included in the analysis received the same insulin/dextrose treatment confirmed by electronic signature of the prescription.
Data extracted included patient demographics, laboratory values, and treatment and administration details. Pretreatment and posttreatment potassium measurements were taken within four hours before and after insulin/dextrose administration, respectively. Serum creatinine and estimated glomerular filtration rate (eGFR) measurements were taken within six hours prior to treatment. Pretreatment CBG levels were measured within two hours of insulin/dextrose administration, and the lowest value within six hours after treatment was used for the analysis. We collected data on length of stay and mortality during one-year follow-up.
Hypoglycemia and severe hypoglycemia were defined as CBG ≤3.9 mmol/l (70 mg/dL) and <3.0 mmol/l (54 mg/dL) in line with definitions used in the National Diabetes Inpatient Audit.11
Descriptive statistics are reported as mean (±SD) or median (interquartile range [IQR]) values for continuous data or numbers and percentages for categorical data. All P values are two-tailed, and P values <.05 were considered to indicate statistical significance. Chi-squared test and Student t test were used to assess differences for categorical and continuous variables between groups. The statistical analysis was performed using the SPSS software, version 25 (IBM).
RESULTS
A total of 662 episodes of hyperkalemia treatment with insulin/dextrose were included in the analysis. These episodes occurred over 445 admissions in 415 individuals. The median number of treatments/patient admission was 1.0 (range 1-11); 108 patients received more than one insulin/dextrose treatment during their admission. Mean pretreatment serum potassium level was 6.4 ± 0.5 mmol/l, and treatment reduced the serum potassium level by 0.6 ± 0.6 mmol/l.
Patient Demographics
Median age of the patients was 67 years (IQR 55.0-79.0), and 39.3% of episodes occurred in females (Table 1). Median weight of the patients was 76.6 kg (IQR 62.1-95.0). Diabetes was present in 31.1% of episodes. Renal impairment was common, with median creatinine levels being 166 µmol/l (IQR 113-256) and 1.9 mg/dL (IQR 1.3-2.9) and eGFR being 29.0 ml/min/1.73 m2 (IQR 19.0-45.0), and 11% of episodes occurred in patients requiring acute or chronic dialysis. Median length of stay was 19.5 days (IQR 9.8-49.1). Inpatient mortality was 13%, and one-year mortality was 19.4%.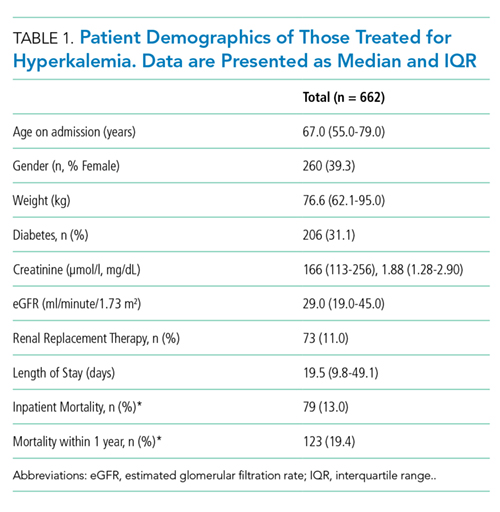
Incidence
Hypoglycemia occurred following 116 of 662 hyperkalemia treatments administered (17.5%), and severe hypoglycemia occurred after 47 of 662 treatments (7.1%).
Risk Factors
The median age of patients with hypoglycemia was significantly greater than that of patients without hypoglycemia (71.0 years [54.8-83.5] vs 67.0 years [55.0-77.0]; P = .023) (Table 2). There were no significant differences in gender, degree of renal impairment, or requirement for renal replacement therapy between the groups with and without hypoglycemia.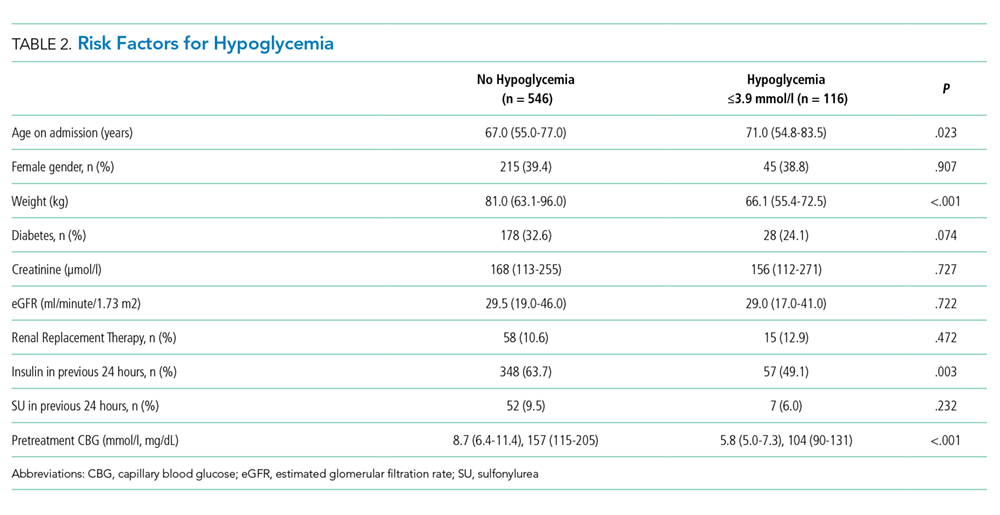
Hypoglycemia occurred in patients who were, on average, 15 kg lighter than those who did not have hypoglycemia (median body weight 66.1 kg [55.4-72.5] vs 81.0 kg [63.1-96.0]; P < .001).
Pretreatment CBG was lower in those who had hypoglycemia following treatment, the levels being 5.8 mmol/l (5.0-7.3), 104 mg/dL (90-131) vs 8.7 mmol/l (6.4-11.4), 157 mg/dL (115-205; P < .001).
There was a nonsignificant trend toward an increased prevalence of diabetes in patients without hypoglycemia (32.6% vs 24.1%; P = .074).
DISCUSSION
This study reports the incidence of iatrogenic hypoglycemia following intravenous insulin treatment for hyperkalemia in a large cohort of general medical and surgical inpatients and describes the risk factors predisposing to this important complication.
The incidence rates of hypoglycemia and severe hypoglycemia in our study were 17.5% and 7.1%, respectively. These rates are greater than previously observed in a smaller US study undertaken in a similar population, which reported an incidence of 8.7% of hypoglycemia and 2.3% of severe hypoglycemia, although it included five different insulin/dextrose prescriptions.8 A similar incidence of hypoglycemia (17%) was reported in patients treated for hyperkalemia in an Emergency Department in the United States.12
Variables that increased the risk of hypoglycemia in the present study included older age, lower body weight, and lower pretreatment CBG level. These risk factors have been reported in previous studies, although inconsistently. Pretreatment CBG is an important predictor of hypoglycemia following treatment for hyperkalemia and has been observed in patients in the emergency department12 and in patients with renal impairment.6,7 In the present study, lower body weight was observed in patients with hypoglycemia compared with those without hypoglycemia. Weight-based insulin dosing (0.1 units/kg) for hyperkalemia has been associated with less hypoglycemia compared with fixed insulin doses (10 units) without affecting the potassium-lowering effect.13
The degree of renal impairment did not affect the risk of hypoglycemia. Chronic kidney disease is associated with increased insulin resistance, which may attenuate the hypoglycemic response to insulin.14 Patients with renal impairment may experience delayed hypoglycemia, which may not have been captured although the posttreatment blood glucose values extended to six hours.
The increased risk of hypoglycemia in older patients treated for hyperkalemia is of concern given the lack of counterregulatory response and reduced symptoms of hypoglycemia in older adults. This association has not been reported in other studies;8,12 however, the average age of subjects in our cohort was higher than that in other studies (67 vs 57 years). Although age did not correlate with weight, older adults may have reduced carbohydrate intake and mild renal impairment affecting insulin clearance.
Hospitalized patients treated for hyperkalemia in the present study had a greater inpatient mortality rate (13%) than the general inpatient population at the same hospital (3%).15 Hyperkalemia often occurs in individuals with comorbidities and is associated with an increased risk of all-cause mortality.3
Mean pretreatment potassium level was 6.4 mmol/l in this study. Evidence-based criteria for treatment thresholds are lacking. Acute potassium increases are associated with cardiac mortality, whereas elevated potassium levels in patients with chronic kidney disease taking renin-angiotensin system drugs are often not treated as emergencies unless significant electrocardiogram (ECG) changes are apparent. It is likely that some hyperkalemia treatments are unnecessary, which is important given the high risk of treatment-related complications.
To our knowledge, this is the largest analysis of hypoglycemic episodes following treatment of hyperkalemia in medical and surgical inpatients. This is a single-center study, thereby limiting its generalizability; however, the patient characteristics are likely similar to those reported from other large, urban institutions.
Treatment prescriptions in our study were consistent due to the electronic prescribing care bundle, allowing us to compare the risk factors for hypoglycemia with standardized prescriptions. Point-of-care CBG measurements can be less accurate at low blood glucose levels; however, laboratory glucose levels are obtained much less frequently, underestimating incidence, due to the need for prompt hypoglycemia treatment without delaying for laboratory glucose measurement.
The dataset was not complete and depended on healthcare professionals entering some data. We did not assess the clinical consequences of hypoglycemia.
FUTURE WORK
An increasing proportion of hospitals are utilizing Electronic Prescribing Systems with the potential to improve patient safety by standardizing prescriptions. However, despite standardized prescriptions, 37% of prescriptions for concurrent dextrose were not administered with insulin and 8.6% of patients had no CBG monitoring within six hours after insulin administration.
We propose to integrate the risk factors identified in this study into a decision support tool embedded within electronic prescriptions and medication administration. This will auto-populate with data from the EPR and identify individuals at high risk of hypoglycemia following hyperkalemia treatment. The decision support tool will then advise a prescription with a higher volume of dextrose and/or lower insulin dose to mitigate this risk.
CONCLUSION
Hyperkalemia treatment with insulin was associated with high incidence of hypoglycemia. Decision support tools highlighting individuals at high risk of hypoglycemia may reduce this incidence.
Disclosures
The authors have nothing to disclose.
1. Stevens MS, Dunlay RW. Hyperkalemia in hospitalized patients. Int Urol Nephrol. 2000;32(2):177-180. doi: 10.1023/A:1007135517950. PubMed
2. Khanagavi J, Gupta T, Aronow WS, et al. Hyperkalemia among hospitalized patients and association between duration of hyperkalemia and outcomes. Arch Med Sci. 2014;10(2):251-257. doi: 10.5114/aoms.2014.42577. PubMed
3. Einhorn LM, Zhan M, Hsu VD, et al. The frequency of hyperkalemia and its significance in chronic kidney disease. Arch Intern Med. 2009;169(12):1156-1162. doi: 10.1001/archinternmed.2009.132. PubMed
4. Harel Z, Kamel KS. Optimal dose and method of administration of intravenous insulin in the management of emergency hyperkalemia: a systematic review. PLoS One. 2016;11(5):e0154963. doi: 10.1371/journal.pone.0154963. PubMed
5. Allon M, Copkney C. Albuterol and insulin for treatment of hyperkalemia in hemodialysis patients. Kidney Int. 1990;38(5):869-872. doi: 10.1038/ki.1990.284. PubMed
6. Apel J, Reutrakul S, Baldwin D. Hypoglycemia in the treatment of hyperkalemia with insulin in patients with end-stage renal disease. Clin Kidney J. 2014;7(3):248-250. doi: 10.1093/ckj/sfu026. PubMed
7. Coca A, Valencia AL, Bustamante J, Mendiluce A, Floege J. Hypoglycemia following intravenous insulin plus glucose for hyperkalemia in patients with impaired renal function. PLoS One. 2017;12(2):e0172961. doi: 10.1371/journal.pone.0172961. PubMed
8. Schafers S, Naunheim R, Vijayan A, Tobin G. Incidence of hypoglycemia following insulin-based acute stabilization of hyperkalemia treatment. J Hosp Med. 2012;7(3):239-242. doi: 10.1002/jhm.977. PubMed
9. Nirantharakumar K, Marshall T, Kennedy A, Narendran P, Hemming K, Coleman JJ. Hypoglycaemia is associated with increased length of stay and mortality in people with diabetes who are hospitalized. Diabet Med. 2012;29(12):e445-e448. doi: 10.1111/dme.12002. PubMed
10. UK Renal Association Clinical Practice Guidelines: Treatment of acute hyperkalaemia in adults. https://renal.org/guidelines/. Published March 2014. Accessed 1October 2018.
11. National Diabetes Inpatient Audit, England and Wales, 2017 - Full Report. NHS Digital. https://digital.nhs.uk/data-and-information/publications/statistical/national-diabetes-inpatient-audit/national-diabetes-inpatient-audit-nadia-2017. Published 14 March 2018. Accessed 5 November 2018.
12. Scott NL, Klein L, Cales E, Driver B. Hypoglycemia as a complication of intravenous insulin to treat hyperkalemia in the emergency department. Am J Emerg Med. 2018; 30379-30386. doi: 10.1016/j.ajem.2018.05.016. PubMed
13. Wheeler DT, Schafers SJ, Horwedel TA, Deal EN, Tobin GS. Weight-based insulin dosing for acute hyperkalemia results in less hypoglycemia. J Hosp Med. 2016;11(5):355-357. doi: 10.1002/jhm.2545. PubMed
14. Spoto B, Pisano A, Zoccali C. Insulin resistance in chronic kidney disease: a systematic review. Am J Physiol Renal Physiol. 2016;311(6):F1087-F1108. doi: 10.1152/ajprenal.00340.2016. PubMed
15. Summary Hospital-level Mortality Indicator (SHMI) - Deaths associated with hospitalisation, England, April 2017 - March 2018. NHS Digital. https://digital.nhs.uk/data-and-information/publications/clinical-indicators/shmi/archive/shmi-april-2017---march-2018. Published 20 September 2018. Accessed 5 November 2018.
Hyperkalemia is common in hospitalized patients, with an estimated prevalence of 1%-10%.1,2 Hyperkalemia can lead to life-threatening cardiac arrhythmias. The risk of arrhythmias increases with serum potassium values >6.5 mmol/L, and hyperkalemia is associated with increased in-hospital mortality.3 Treatment for hyperkalemia is indicated by a combination of the absolute serum potassium level, the rate of change of potassium level, and the presence of electrocardiogram abnormalities.
Intravenous insulin stimulates the sodium/potassium-ATP pump, leading to intracellular uptake of potassium. Recommendations vary regarding the optimal dosing of insulin and dextrose for the treatment of hyperkalemia.4
Hypoglycemia is a common complication following treatment of hyperkalemia with insulin/dextrose. The reported incidence in hospitalized patients ranges from 6% to 75% depending on the population studied, the doses of insulin/dextrose administered, and the definition of hypoglycemia.5-8 Hypoglycemia itself is associated with increased morbidity and mortality in hospitalized patients.9
The aims of this study were to describe the incidence of hypoglycemia following hyperkalemia treatment with intravenous insulin/dextrose in inpatients in a large (900-bed) UK teaching hospital and to determine the risk factors predisposing to hypoglycemia.
METHODS
We conducted a retrospective, single-center cohort study reviewing the Electronic Patient Records (EPR) of all adult (aged ≥18 years) inpatients (excluding critical care) prescribed treatment for hyperkalemia with intravenous insulin from January 1, 2013, to March 1, 2017. Local hyperkalemia treatment guidelines included administration of 10 units of insulin and 100 ml of 20% glucose intravenously in accordance with national guidelines.10 The study received local approval.
Episodes occurring before May 1, 2015, were excluded because modification to the hyperkalemia prescription care bundle was implemented in April 2015 recommending standardized simultaneous insulin and dextrose administration and hourly capillary blood glucose (CBG) measurement for six hours following treatment. Episodes where no dextrose was prescribed or administered (n = 435) or where no CBG value was recorded within six hours after treatment were excluded (n = 63). All patients included in the analysis received the same insulin/dextrose treatment confirmed by electronic signature of the prescription.
Data extracted included patient demographics, laboratory values, and treatment and administration details. Pretreatment and posttreatment potassium measurements were taken within four hours before and after insulin/dextrose administration, respectively. Serum creatinine and estimated glomerular filtration rate (eGFR) measurements were taken within six hours prior to treatment. Pretreatment CBG levels were measured within two hours of insulin/dextrose administration, and the lowest value within six hours after treatment was used for the analysis. We collected data on length of stay and mortality during one-year follow-up.
Hypoglycemia and severe hypoglycemia were defined as CBG ≤3.9 mmol/l (70 mg/dL) and <3.0 mmol/l (54 mg/dL) in line with definitions used in the National Diabetes Inpatient Audit.11
Descriptive statistics are reported as mean (±SD) or median (interquartile range [IQR]) values for continuous data or numbers and percentages for categorical data. All P values are two-tailed, and P values <.05 were considered to indicate statistical significance. Chi-squared test and Student t test were used to assess differences for categorical and continuous variables between groups. The statistical analysis was performed using the SPSS software, version 25 (IBM).
RESULTS
A total of 662 episodes of hyperkalemia treatment with insulin/dextrose were included in the analysis. These episodes occurred over 445 admissions in 415 individuals. The median number of treatments/patient admission was 1.0 (range 1-11); 108 patients received more than one insulin/dextrose treatment during their admission. Mean pretreatment serum potassium level was 6.4 ± 0.5 mmol/l, and treatment reduced the serum potassium level by 0.6 ± 0.6 mmol/l.
Patient Demographics
Median age of the patients was 67 years (IQR 55.0-79.0), and 39.3% of episodes occurred in females (Table 1). Median weight of the patients was 76.6 kg (IQR 62.1-95.0). Diabetes was present in 31.1% of episodes. Renal impairment was common, with median creatinine levels being 166 µmol/l (IQR 113-256) and 1.9 mg/dL (IQR 1.3-2.9) and eGFR being 29.0 ml/min/1.73 m2 (IQR 19.0-45.0), and 11% of episodes occurred in patients requiring acute or chronic dialysis. Median length of stay was 19.5 days (IQR 9.8-49.1). Inpatient mortality was 13%, and one-year mortality was 19.4%.
Incidence
Hypoglycemia occurred following 116 of 662 hyperkalemia treatments administered (17.5%), and severe hypoglycemia occurred after 47 of 662 treatments (7.1%).
Risk Factors
The median age of patients with hypoglycemia was significantly greater than that of patients without hypoglycemia (71.0 years [54.8-83.5] vs 67.0 years [55.0-77.0]; P = .023) (Table 2). There were no significant differences in gender, degree of renal impairment, or requirement for renal replacement therapy between the groups with and without hypoglycemia.
Hypoglycemia occurred in patients who were, on average, 15 kg lighter than those who did not have hypoglycemia (median body weight 66.1 kg [55.4-72.5] vs 81.0 kg [63.1-96.0]; P < .001).
Pretreatment CBG was lower in those who had hypoglycemia following treatment, the levels being 5.8 mmol/l (5.0-7.3), 104 mg/dL (90-131) vs 8.7 mmol/l (6.4-11.4), 157 mg/dL (115-205; P < .001).
There was a nonsignificant trend toward an increased prevalence of diabetes in patients without hypoglycemia (32.6% vs 24.1%; P = .074).
DISCUSSION
This study reports the incidence of iatrogenic hypoglycemia following intravenous insulin treatment for hyperkalemia in a large cohort of general medical and surgical inpatients and describes the risk factors predisposing to this important complication.
The incidence rates of hypoglycemia and severe hypoglycemia in our study were 17.5% and 7.1%, respectively. These rates are greater than previously observed in a smaller US study undertaken in a similar population, which reported an incidence of 8.7% of hypoglycemia and 2.3% of severe hypoglycemia, although it included five different insulin/dextrose prescriptions.8 A similar incidence of hypoglycemia (17%) was reported in patients treated for hyperkalemia in an Emergency Department in the United States.12
Variables that increased the risk of hypoglycemia in the present study included older age, lower body weight, and lower pretreatment CBG level. These risk factors have been reported in previous studies, although inconsistently. Pretreatment CBG is an important predictor of hypoglycemia following treatment for hyperkalemia and has been observed in patients in the emergency department12 and in patients with renal impairment.6,7 In the present study, lower body weight was observed in patients with hypoglycemia compared with those without hypoglycemia. Weight-based insulin dosing (0.1 units/kg) for hyperkalemia has been associated with less hypoglycemia compared with fixed insulin doses (10 units) without affecting the potassium-lowering effect.13
The degree of renal impairment did not affect the risk of hypoglycemia. Chronic kidney disease is associated with increased insulin resistance, which may attenuate the hypoglycemic response to insulin.14 Patients with renal impairment may experience delayed hypoglycemia, which may not have been captured although the posttreatment blood glucose values extended to six hours.
The increased risk of hypoglycemia in older patients treated for hyperkalemia is of concern given the lack of counterregulatory response and reduced symptoms of hypoglycemia in older adults. This association has not been reported in other studies;8,12 however, the average age of subjects in our cohort was higher than that in other studies (67 vs 57 years). Although age did not correlate with weight, older adults may have reduced carbohydrate intake and mild renal impairment affecting insulin clearance.
Hospitalized patients treated for hyperkalemia in the present study had a greater inpatient mortality rate (13%) than the general inpatient population at the same hospital (3%).15 Hyperkalemia often occurs in individuals with comorbidities and is associated with an increased risk of all-cause mortality.3
Mean pretreatment potassium level was 6.4 mmol/l in this study. Evidence-based criteria for treatment thresholds are lacking. Acute potassium increases are associated with cardiac mortality, whereas elevated potassium levels in patients with chronic kidney disease taking renin-angiotensin system drugs are often not treated as emergencies unless significant electrocardiogram (ECG) changes are apparent. It is likely that some hyperkalemia treatments are unnecessary, which is important given the high risk of treatment-related complications.
To our knowledge, this is the largest analysis of hypoglycemic episodes following treatment of hyperkalemia in medical and surgical inpatients. This is a single-center study, thereby limiting its generalizability; however, the patient characteristics are likely similar to those reported from other large, urban institutions.
Treatment prescriptions in our study were consistent due to the electronic prescribing care bundle, allowing us to compare the risk factors for hypoglycemia with standardized prescriptions. Point-of-care CBG measurements can be less accurate at low blood glucose levels; however, laboratory glucose levels are obtained much less frequently, underestimating incidence, due to the need for prompt hypoglycemia treatment without delaying for laboratory glucose measurement.
The dataset was not complete and depended on healthcare professionals entering some data. We did not assess the clinical consequences of hypoglycemia.
FUTURE WORK
An increasing proportion of hospitals are utilizing Electronic Prescribing Systems with the potential to improve patient safety by standardizing prescriptions. However, despite standardized prescriptions, 37% of prescriptions for concurrent dextrose were not administered with insulin and 8.6% of patients had no CBG monitoring within six hours after insulin administration.
We propose to integrate the risk factors identified in this study into a decision support tool embedded within electronic prescriptions and medication administration. This will auto-populate with data from the EPR and identify individuals at high risk of hypoglycemia following hyperkalemia treatment. The decision support tool will then advise a prescription with a higher volume of dextrose and/or lower insulin dose to mitigate this risk.
CONCLUSION
Hyperkalemia treatment with insulin was associated with high incidence of hypoglycemia. Decision support tools highlighting individuals at high risk of hypoglycemia may reduce this incidence.
Disclosures
The authors have nothing to disclose.
1. Stevens MS, Dunlay RW. Hyperkalemia in hospitalized patients. Int Urol Nephrol. 2000;32(2):177-180. doi: 10.1023/A:1007135517950. PubMed
2. Khanagavi J, Gupta T, Aronow WS, et al. Hyperkalemia among hospitalized patients and association between duration of hyperkalemia and outcomes. Arch Med Sci. 2014;10(2):251-257. doi: 10.5114/aoms.2014.42577. PubMed
3. Einhorn LM, Zhan M, Hsu VD, et al. The frequency of hyperkalemia and its significance in chronic kidney disease. Arch Intern Med. 2009;169(12):1156-1162. doi: 10.1001/archinternmed.2009.132. PubMed
4. Harel Z, Kamel KS. Optimal dose and method of administration of intravenous insulin in the management of emergency hyperkalemia: a systematic review. PLoS One. 2016;11(5):e0154963. doi: 10.1371/journal.pone.0154963. PubMed
5. Allon M, Copkney C. Albuterol and insulin for treatment of hyperkalemia in hemodialysis patients. Kidney Int. 1990;38(5):869-872. doi: 10.1038/ki.1990.284. PubMed
6. Apel J, Reutrakul S, Baldwin D. Hypoglycemia in the treatment of hyperkalemia with insulin in patients with end-stage renal disease. Clin Kidney J. 2014;7(3):248-250. doi: 10.1093/ckj/sfu026. PubMed
7. Coca A, Valencia AL, Bustamante J, Mendiluce A, Floege J. Hypoglycemia following intravenous insulin plus glucose for hyperkalemia in patients with impaired renal function. PLoS One. 2017;12(2):e0172961. doi: 10.1371/journal.pone.0172961. PubMed
8. Schafers S, Naunheim R, Vijayan A, Tobin G. Incidence of hypoglycemia following insulin-based acute stabilization of hyperkalemia treatment. J Hosp Med. 2012;7(3):239-242. doi: 10.1002/jhm.977. PubMed
9. Nirantharakumar K, Marshall T, Kennedy A, Narendran P, Hemming K, Coleman JJ. Hypoglycaemia is associated with increased length of stay and mortality in people with diabetes who are hospitalized. Diabet Med. 2012;29(12):e445-e448. doi: 10.1111/dme.12002. PubMed
10. UK Renal Association Clinical Practice Guidelines: Treatment of acute hyperkalaemia in adults. https://renal.org/guidelines/. Published March 2014. Accessed 1October 2018.
11. National Diabetes Inpatient Audit, England and Wales, 2017 - Full Report. NHS Digital. https://digital.nhs.uk/data-and-information/publications/statistical/national-diabetes-inpatient-audit/national-diabetes-inpatient-audit-nadia-2017. Published 14 March 2018. Accessed 5 November 2018.
12. Scott NL, Klein L, Cales E, Driver B. Hypoglycemia as a complication of intravenous insulin to treat hyperkalemia in the emergency department. Am J Emerg Med. 2018; 30379-30386. doi: 10.1016/j.ajem.2018.05.016. PubMed
13. Wheeler DT, Schafers SJ, Horwedel TA, Deal EN, Tobin GS. Weight-based insulin dosing for acute hyperkalemia results in less hypoglycemia. J Hosp Med. 2016;11(5):355-357. doi: 10.1002/jhm.2545. PubMed
14. Spoto B, Pisano A, Zoccali C. Insulin resistance in chronic kidney disease: a systematic review. Am J Physiol Renal Physiol. 2016;311(6):F1087-F1108. doi: 10.1152/ajprenal.00340.2016. PubMed
15. Summary Hospital-level Mortality Indicator (SHMI) - Deaths associated with hospitalisation, England, April 2017 - March 2018. NHS Digital. https://digital.nhs.uk/data-and-information/publications/clinical-indicators/shmi/archive/shmi-april-2017---march-2018. Published 20 September 2018. Accessed 5 November 2018.
© 2019 Society of Hospital Medicine
Follow Up of Incidental High-Risk Pulmonary Nodules on Computed Tomography Pulmonary Angiography at Care Transitions
Computed tomography pulmonary angiography (CTPA) is often used in the evaluation of suspected pulmonary embolism (PE). The detection of incidental findings that require follow-up is common; in just over 50% of cases, those incidental findings are pulmonary nodules.1 Although the majority of these nodules are benign, Fleischner Society guidelines2 recommend that patients with nodules at high risk for malignancy should undergo follow-up CT imaging within 3-12 months, with patients who smoke and have large nodules requiring closer follow up.
The failure to follow-up on abnormal test results is known to contribute to diagnostic error and can lead to patient harm.3 We sought to determine the proportion of high-risk pulmonary nodules on CTPA which did not undergo the recommended follow-up imaging.
Study Setting and Design
This retrospective cohort study included all patients who underwent CTPA in the emergency department (ED) and inpatient settings at three academic health centers (Mount Sinai Hospital, Toronto General Hospital, and Toronto Western Hospital) in Toronto, Canada between September 1, 2014, and August 31, 2015.
We examined the proportion of patients with pulmonary nodules requiring follow up who received repeat CT imaging within six weeks of the time frame recommended by the radiologist. Since we were interested in measuring the rate of an important test result that is missed (rather than accuracy of the test itself), we defined “requiring follow up” as the inclusion of explicit recommendations for follow up in the radiology report.
Montage (Philadelphia, Pennsylvania), a natural language processing software, was applied to a linked radiology information system (RIS) to identify all CTPAs that contained pulmonary nodules. We conducted manual chart review to confirm software accuracy. We initially searched the RIS for all CTPAs that were completed within the study period, resulting in the identification of 1932 imaging studies. Following a review of these 1,932 studies, we excluded 22 as they were not CTPAs. We then applied the search term, “nodule-” to 1,910 confirmed CTPAs, resulting in the identification of 836 imaging studies. Following a review of these 836 studies, we excluded 10 as they were duplicate studies. We also excluded 152 studies where the term “nodule-” did not identify a pulmonary nodule but instead referred to a radiologist reporting the absence of pulmonary nodules (eg “there were no pulmonary nodules found”) or the presence of non-lung nodules (eg thyroid nodules). This resulted in the identification of 674 CTPAs containing pulmonary nodules (Figure 1).
Thereafter, we generated a cohort with possible new lung malignancy eligible for follow-up imaging by reviewing available health records and applying the following prespecified exclusion criteria: (1) patients who died, (2) left against medical advice, (3) were critically ill during the follow-up period, (4) lived outside the hospital catchment area (Greater Toronto Area), (5) were seen in the outpatient setting, (6) identified as palliative, (7) had an active malignancy, (8) had nodules that were already being followed, or (9) had nodules with characteristics suggestive of alternate diagnoses to lung malignancy (such as infection or inflammation) with no follow up recommended as reported by the radiologist. For patients with multiple CTPAs, we included only the first study. For each eligible patient, we determined whether follow-up imaging was completed by manually reviewing the linked RIS. We reviewed available health records to determine whether the pulmonary nodule findings had been discussed with the patient and whether the patient had attended an outpatient follow-up visit. In patients for whom recommended follow-up imaging was not confirmed, we notified the ordering physician by e-mail.
Each radiology department followed the same protocol adherent to the 2005 Fleischner guidelines for identifying nodules requiring follow up.2 Virtually all CTPAs at the three study institutions are read and reported within 72 hours. The ordering physician is sometimes called at the discretion of the reading radiologist when the findings are judged to be urgent and time-sensitive in nature. For example, the ordering physician may be contacted if a CTPA is positive for segmental PE but is not typically called for incidental pulmonary nodules. It is not common practice for ordering physicians to be notified of incidental findings above and beyond the radiology report. Primary care physicians are not typically copied on radiology reports and usually do not use the same electronic health record.
Statistical Analysis
We calculated simple descriptive statistics for all results. Mean values were compared using two-tailed t-tests, categorical groups using chi-square tests, and median values using Mann-Whitney U tests. We performed all analyses using Microsoft Excel version 16.14.1 (Redmond, Washington).
Ethics Approval
This study was approved by each institution’s research ethics board.
RESULTS
Follow Up of Incidental High-Risk Pulmonary Nodules
Of the 1910 CTPAs performed over the study period (Figure), 674 (35.3%) contained pulmonary nodules. Of the 259 patients with new pulmonary nodules eligible for follow-up imaging, 194 (74.9%) did not have an explicit suggestion for follow up by the radiologist. Ninety-five percent of radiologists (184 out of 194) provided an explanation for not recommending follow up in the radiology report; the two most common reasons were small nodule size (often described as “tiny”) and no interval change compared with the prior imaging study.2 Of the 65 patients who did receive an explicit suggestion for follow up by radiology, 35 (53.8%) did not receive repeat imaging within the recommended time frame, allowing for a six-week grace period. Of these 35 patients, 10 eventually went on to receive delayed repeat imaging. The median follow-up time for the 30 patients who received timely repeat imaging was four months (IQR 2-6 months); in contrast, the median follow-up time for the 10 patients who received delayed repeat imaging was seven months (IQR 6-8 months), P = .01.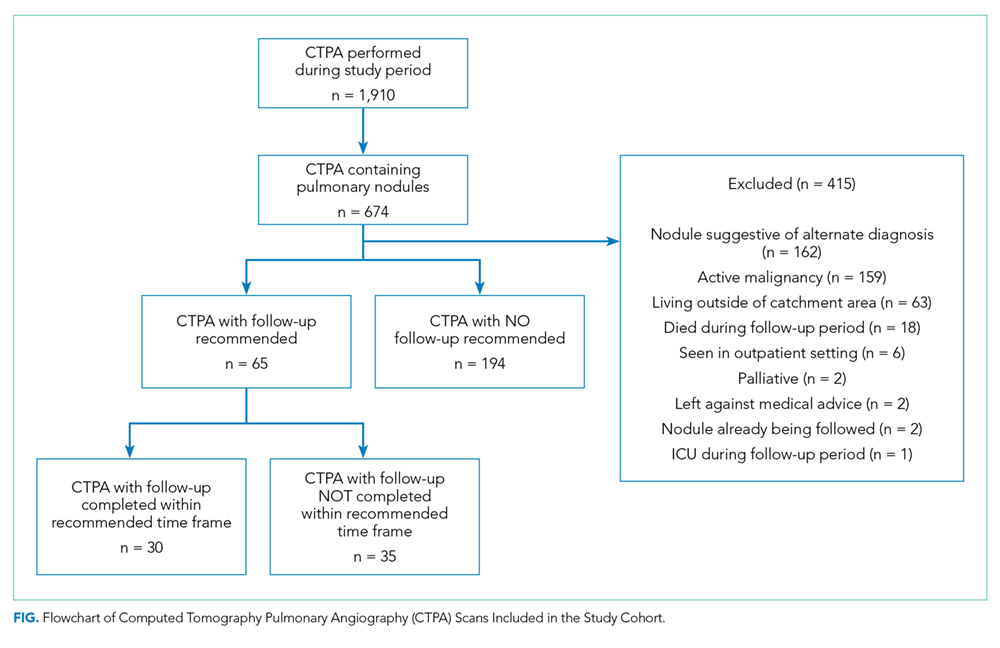
Of the 65 patients for whom follow up was recommended, the medical record showed evidence that there was a discussion between the medical team and the patient regarding patient preference for or against follow up in 55.4% (36 out of 65) of the patients. Notably, all 36 patients showed interest in receiving follow up; no patient indicated a preference for no follow up.
Furthermore, of the 65 patients that had follow up recommended, two patients were eventually diagnosed with lung cancer (one via lung biopsy, the other via positron emission tomography imaging); both patients did not receive timely follow-up imaging. While we did not include nodule size as an exclusion criterion, not one of the 65 patients included in the final cohort had nodules larger than 3 cm.
Physician Notification
In circumstances where we could not confirm that followed up had occurred, we notified the ordering physician by e-mail. Since 10 of the 35 patients who did not receive timely follow-up imaging went on to receive delayed repeat imaging, we notified 25 physicians. Of the 25 physicians that we e-mailed, 24 acknowledged receipt of the information. Of these 24 physicians, 14 reported conducting a detailed review of the chart, from which the following additional information was obtained: one patient expired, and five physicians notified the corresponding primary care physicians (two of whom were unaware of the nodule, and subsequently arranged further follow up with the patient).
Characteristics Associated with Timely Follow Up
Explicit mention that follow up was required in the discharge summary (P = .03), attending an outpatient follow-up visit (P < .001), and younger age (P = .03) were associated with receiving timely follow up; patient sex, smoking history, history of chronic obstructive pulmonary disease, lung nodule count, recommended follow-up time, and hospital department (defined as the discharging service) were not (Table).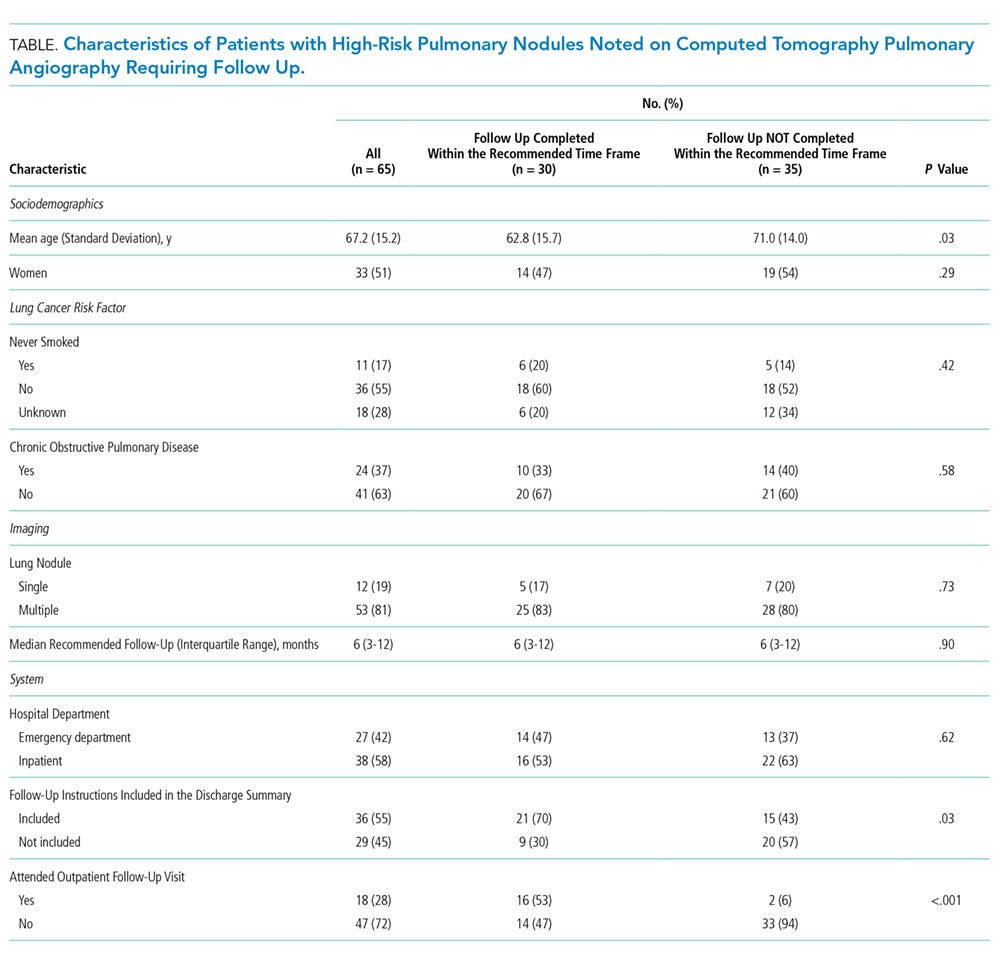
DISCUSSION
In this multicenter cohort study, over 50% of patients with new high-risk pulmonary nodules detected incidentally on CTPA did not receive timely follow-up imaging. Including follow-up recommendations in the discharge summary, attending an outpatient follow-up visit, and younger age were associated with timely follow-up imaging.
Few studies have assessed the follow up of incidental nodules identified on CTPA. In a retrospective cohort study of ED patients in the United States, Blagev et al. found that only 29% received timely follow up.4 Our study contributes to the literature in several ways. First, our study included all hospitalized patients, not only those in the ED. Notably, most of our cohort were inpatients, a group of patients not previously described. Second, we examined factors associated with timely follow up, which may help to inform future quality improvement initiatives and interventions. Third, we included data from three different hospitals, which may improve generalization. Lastly, our study draws on contemporary Canadian data. Most of the studies investigating test result follow up have been conducted in the US5,6 and Europe,7 with few empirical studies describing this phenomenon within the Canadian healthcare setting. We believe that our work contributes to the existing evidence that missed test results occur across diverse healthcare systems and have yet to be solved.5-7
Our study had limitations. First, we defined follow up as repeat imaging and did not include office visits or biopsy in this definition. Second, we may have missed repeat imaging and outpatient follow-up visits that occurred outside the study hospitals. Although we were able to determine if repeat imaging and outpatient follow-up visits (eg, pulmonology or thoracic surgery clinics) had occurred within the study hospitals, we did not have access to follow-up encounters that occurred outside of the study hospitals (eg primary care clinics). We are unaware of any published regional data on the rate of outpatient follow up at the index facility following discharge. However, we know from provincial data of patients discharged from the ED with a new cardiac diagnosis that just under half are seen by a family physician, cardiologist, or internist within seven days, with just under 80% seen within 30 days.8 Third, although we attempted to capture patient preference for or against repeat imaging using chart review, the absence of documentation of patient preference did not confirm that a discussion regarding patient preferences had not occurred. Fourth, while we did exclude patients that had an active malignancy, we did not exclude patients who were younger than 35 years or were immunocompromised, which may have led to an overestimation of the percentage of patients who did not receive follow up.
Incidental findings detected on acute diagnostic tests requiring handoffs for chronic follow up are at risk of falling through the cracks. The inclusion of follow-up recommendations in discharge summaries has been shown to increase the likelihood of follow-up completion.9 Our study provides additional evidence of the urgent need for interventions aimed at closing the loop on test result follow up.5,6
Disclosures
None of the authors have any conflicts of interest to disclose in reference to this study.
Funding
JLK is supported by the Mount Sinai Hospital Department of Medicine Research Fund. PC is supported by a K24 award from the National Institute of Arthritis and Musculoskeletal and Skin Diseases (AR062133).
1. Hall WB, Truitt SG, Scheunemann LP, et al. The prevalence of clinically relevant incidental findings on chest computed tomographic angiograms ordered to diagnose pulmonary embolism. Arch Intern Med 2009;169(21):1961. doi: 10.1001/archinternmed.2009.360. PubMed
2. Macmahon H, Austin JHM, Gamsu G, et al. Guidelines for Management of Small Pulmonary Nodules Detected on CT Scans: A Statement from the Fleischner Society. Radiology 2005;237(2):395-400. doi: 10.1148/radiol.2372041887. PubMed
3. National Academies of Sciences, Engineering, and Medicine. Improving diagnosis in health care. Washington, DC. 2015. PubMed
4. Blagev DP, Lloyd JF, Conner K, et al. Follow-up of incidental pulmonary nodules and the radiology report. J Am Coll Radiol 2014;11(4):378-383. doi: 10.1016/j.jacr.2013.08.003. PubMed
5. Callen J, Georgiou A, Li J, Westbrook JI. The safety implications of missed test results for hospitalized patients: a systematic review. BMJ Quality Safety 2011;20(2):194-199. doi: 10.1136/bmjqs.2010.044339.
6. Callen JL, Westbrook JI, Georgiou A, Li J. Failure to follow-up test results for ambulatory patients: a systematic review. J Gen Intern Med 2011;27(10):1334-1348. doi: 10.1007/s11606-011-1949-5. PubMed
7. Litchfield I, Bentham L, Lilford R, Mcmanus RJ, Hill A, Greenfield S. Test result communication in primary care: a survey of current practice. BMJ Quality Safety 2015;24(11):691-699. doi: 10.1136/bmjqs-2014-003712. PubMed
8. Atzema CL, Yu B, Ivers NM, et al. Predictors of obtaining follow-up care in the province of Ontario, Canada, following a new diagnosis of atrial fibrillation, heart failure, and hypertension in the emergency department. Cjem 2017;20(03):377-391. doi: 10.1017/cem.2017.371. PubMed
9. Moore C, McGinn T, Halm E. Tying up loose ends: Discharging patients with unresolved medical issues. Arch Intern Med 2007;167(12):1305-1311. doi: 10.1001/archinte.167.12.1305 PubMed
Computed tomography pulmonary angiography (CTPA) is often used in the evaluation of suspected pulmonary embolism (PE). The detection of incidental findings that require follow-up is common; in just over 50% of cases, those incidental findings are pulmonary nodules.1 Although the majority of these nodules are benign, Fleischner Society guidelines2 recommend that patients with nodules at high risk for malignancy should undergo follow-up CT imaging within 3-12 months, with patients who smoke and have large nodules requiring closer follow up.
The failure to follow-up on abnormal test results is known to contribute to diagnostic error and can lead to patient harm.3 We sought to determine the proportion of high-risk pulmonary nodules on CTPA which did not undergo the recommended follow-up imaging.
Study Setting and Design
This retrospective cohort study included all patients who underwent CTPA in the emergency department (ED) and inpatient settings at three academic health centers (Mount Sinai Hospital, Toronto General Hospital, and Toronto Western Hospital) in Toronto, Canada between September 1, 2014, and August 31, 2015.
We examined the proportion of patients with pulmonary nodules requiring follow up who received repeat CT imaging within six weeks of the time frame recommended by the radiologist. Since we were interested in measuring the rate of an important test result that is missed (rather than accuracy of the test itself), we defined “requiring follow up” as the inclusion of explicit recommendations for follow up in the radiology report.
Montage (Philadelphia, Pennsylvania), a natural language processing software, was applied to a linked radiology information system (RIS) to identify all CTPAs that contained pulmonary nodules. We conducted manual chart review to confirm software accuracy. We initially searched the RIS for all CTPAs that were completed within the study period, resulting in the identification of 1932 imaging studies. Following a review of these 1,932 studies, we excluded 22 as they were not CTPAs. We then applied the search term, “nodule-” to 1,910 confirmed CTPAs, resulting in the identification of 836 imaging studies. Following a review of these 836 studies, we excluded 10 as they were duplicate studies. We also excluded 152 studies where the term “nodule-” did not identify a pulmonary nodule but instead referred to a radiologist reporting the absence of pulmonary nodules (eg “there were no pulmonary nodules found”) or the presence of non-lung nodules (eg thyroid nodules). This resulted in the identification of 674 CTPAs containing pulmonary nodules (Figure 1).
Thereafter, we generated a cohort with possible new lung malignancy eligible for follow-up imaging by reviewing available health records and applying the following prespecified exclusion criteria: (1) patients who died, (2) left against medical advice, (3) were critically ill during the follow-up period, (4) lived outside the hospital catchment area (Greater Toronto Area), (5) were seen in the outpatient setting, (6) identified as palliative, (7) had an active malignancy, (8) had nodules that were already being followed, or (9) had nodules with characteristics suggestive of alternate diagnoses to lung malignancy (such as infection or inflammation) with no follow up recommended as reported by the radiologist. For patients with multiple CTPAs, we included only the first study. For each eligible patient, we determined whether follow-up imaging was completed by manually reviewing the linked RIS. We reviewed available health records to determine whether the pulmonary nodule findings had been discussed with the patient and whether the patient had attended an outpatient follow-up visit. In patients for whom recommended follow-up imaging was not confirmed, we notified the ordering physician by e-mail.
Each radiology department followed the same protocol adherent to the 2005 Fleischner guidelines for identifying nodules requiring follow up.2 Virtually all CTPAs at the three study institutions are read and reported within 72 hours. The ordering physician is sometimes called at the discretion of the reading radiologist when the findings are judged to be urgent and time-sensitive in nature. For example, the ordering physician may be contacted if a CTPA is positive for segmental PE but is not typically called for incidental pulmonary nodules. It is not common practice for ordering physicians to be notified of incidental findings above and beyond the radiology report. Primary care physicians are not typically copied on radiology reports and usually do not use the same electronic health record.
Statistical Analysis
We calculated simple descriptive statistics for all results. Mean values were compared using two-tailed t-tests, categorical groups using chi-square tests, and median values using Mann-Whitney U tests. We performed all analyses using Microsoft Excel version 16.14.1 (Redmond, Washington).
Ethics Approval
This study was approved by each institution’s research ethics board.
RESULTS
Follow Up of Incidental High-Risk Pulmonary Nodules
Of the 1910 CTPAs performed over the study period (Figure), 674 (35.3%) contained pulmonary nodules. Of the 259 patients with new pulmonary nodules eligible for follow-up imaging, 194 (74.9%) did not have an explicit suggestion for follow up by the radiologist. Ninety-five percent of radiologists (184 out of 194) provided an explanation for not recommending follow up in the radiology report; the two most common reasons were small nodule size (often described as “tiny”) and no interval change compared with the prior imaging study.2 Of the 65 patients who did receive an explicit suggestion for follow up by radiology, 35 (53.8%) did not receive repeat imaging within the recommended time frame, allowing for a six-week grace period. Of these 35 patients, 10 eventually went on to receive delayed repeat imaging. The median follow-up time for the 30 patients who received timely repeat imaging was four months (IQR 2-6 months); in contrast, the median follow-up time for the 10 patients who received delayed repeat imaging was seven months (IQR 6-8 months), P = .01.
Of the 65 patients for whom follow up was recommended, the medical record showed evidence that there was a discussion between the medical team and the patient regarding patient preference for or against follow up in 55.4% (36 out of 65) of the patients. Notably, all 36 patients showed interest in receiving follow up; no patient indicated a preference for no follow up.
Furthermore, of the 65 patients that had follow up recommended, two patients were eventually diagnosed with lung cancer (one via lung biopsy, the other via positron emission tomography imaging); both patients did not receive timely follow-up imaging. While we did not include nodule size as an exclusion criterion, not one of the 65 patients included in the final cohort had nodules larger than 3 cm.
Physician Notification
In circumstances where we could not confirm that followed up had occurred, we notified the ordering physician by e-mail. Since 10 of the 35 patients who did not receive timely follow-up imaging went on to receive delayed repeat imaging, we notified 25 physicians. Of the 25 physicians that we e-mailed, 24 acknowledged receipt of the information. Of these 24 physicians, 14 reported conducting a detailed review of the chart, from which the following additional information was obtained: one patient expired, and five physicians notified the corresponding primary care physicians (two of whom were unaware of the nodule, and subsequently arranged further follow up with the patient).
Characteristics Associated with Timely Follow Up
Explicit mention that follow up was required in the discharge summary (P = .03), attending an outpatient follow-up visit (P < .001), and younger age (P = .03) were associated with receiving timely follow up; patient sex, smoking history, history of chronic obstructive pulmonary disease, lung nodule count, recommended follow-up time, and hospital department (defined as the discharging service) were not (Table).
DISCUSSION
In this multicenter cohort study, over 50% of patients with new high-risk pulmonary nodules detected incidentally on CTPA did not receive timely follow-up imaging. Including follow-up recommendations in the discharge summary, attending an outpatient follow-up visit, and younger age were associated with timely follow-up imaging.
Few studies have assessed the follow up of incidental nodules identified on CTPA. In a retrospective cohort study of ED patients in the United States, Blagev et al. found that only 29% received timely follow up.4 Our study contributes to the literature in several ways. First, our study included all hospitalized patients, not only those in the ED. Notably, most of our cohort were inpatients, a group of patients not previously described. Second, we examined factors associated with timely follow up, which may help to inform future quality improvement initiatives and interventions. Third, we included data from three different hospitals, which may improve generalization. Lastly, our study draws on contemporary Canadian data. Most of the studies investigating test result follow up have been conducted in the US5,6 and Europe,7 with few empirical studies describing this phenomenon within the Canadian healthcare setting. We believe that our work contributes to the existing evidence that missed test results occur across diverse healthcare systems and have yet to be solved.5-7
Our study had limitations. First, we defined follow up as repeat imaging and did not include office visits or biopsy in this definition. Second, we may have missed repeat imaging and outpatient follow-up visits that occurred outside the study hospitals. Although we were able to determine if repeat imaging and outpatient follow-up visits (eg, pulmonology or thoracic surgery clinics) had occurred within the study hospitals, we did not have access to follow-up encounters that occurred outside of the study hospitals (eg primary care clinics). We are unaware of any published regional data on the rate of outpatient follow up at the index facility following discharge. However, we know from provincial data of patients discharged from the ED with a new cardiac diagnosis that just under half are seen by a family physician, cardiologist, or internist within seven days, with just under 80% seen within 30 days.8 Third, although we attempted to capture patient preference for or against repeat imaging using chart review, the absence of documentation of patient preference did not confirm that a discussion regarding patient preferences had not occurred. Fourth, while we did exclude patients that had an active malignancy, we did not exclude patients who were younger than 35 years or were immunocompromised, which may have led to an overestimation of the percentage of patients who did not receive follow up.
Incidental findings detected on acute diagnostic tests requiring handoffs for chronic follow up are at risk of falling through the cracks. The inclusion of follow-up recommendations in discharge summaries has been shown to increase the likelihood of follow-up completion.9 Our study provides additional evidence of the urgent need for interventions aimed at closing the loop on test result follow up.5,6
Disclosures
None of the authors have any conflicts of interest to disclose in reference to this study.
Funding
JLK is supported by the Mount Sinai Hospital Department of Medicine Research Fund. PC is supported by a K24 award from the National Institute of Arthritis and Musculoskeletal and Skin Diseases (AR062133).
1. Hall WB, Truitt SG, Scheunemann LP, et al. The prevalence of clinically relevant incidental findings on chest computed tomographic angiograms ordered to diagnose pulmonary embolism. Arch Intern Med 2009;169(21):1961. doi: 10.1001/archinternmed.2009.360. PubMed
2. Macmahon H, Austin JHM, Gamsu G, et al. Guidelines for Management of Small Pulmonary Nodules Detected on CT Scans: A Statement from the Fleischner Society. Radiology 2005;237(2):395-400. doi: 10.1148/radiol.2372041887. PubMed
3. National Academies of Sciences, Engineering, and Medicine. Improving diagnosis in health care. Washington, DC. 2015. PubMed
4. Blagev DP, Lloyd JF, Conner K, et al. Follow-up of incidental pulmonary nodules and the radiology report. J Am Coll Radiol 2014;11(4):378-383. doi: 10.1016/j.jacr.2013.08.003. PubMed
5. Callen J, Georgiou A, Li J, Westbrook JI. The safety implications of missed test results for hospitalized patients: a systematic review. BMJ Quality Safety 2011;20(2):194-199. doi: 10.1136/bmjqs.2010.044339.
6. Callen JL, Westbrook JI, Georgiou A, Li J. Failure to follow-up test results for ambulatory patients: a systematic review. J Gen Intern Med 2011;27(10):1334-1348. doi: 10.1007/s11606-011-1949-5. PubMed
7. Litchfield I, Bentham L, Lilford R, Mcmanus RJ, Hill A, Greenfield S. Test result communication in primary care: a survey of current practice. BMJ Quality Safety 2015;24(11):691-699. doi: 10.1136/bmjqs-2014-003712. PubMed
8. Atzema CL, Yu B, Ivers NM, et al. Predictors of obtaining follow-up care in the province of Ontario, Canada, following a new diagnosis of atrial fibrillation, heart failure, and hypertension in the emergency department. Cjem 2017;20(03):377-391. doi: 10.1017/cem.2017.371. PubMed
9. Moore C, McGinn T, Halm E. Tying up loose ends: Discharging patients with unresolved medical issues. Arch Intern Med 2007;167(12):1305-1311. doi: 10.1001/archinte.167.12.1305 PubMed
© 2019 Society of Hospital Medicine
National Survey of Hospitalists’ Experiences with Incidental Pulmonary Nodules
Pulmonary nodules are common, and their identification is increasing as a result of the use of more sensitive chest imaging modalities.1 Pulmonary nodules are defined on imaging as small (≤30 mm), well-defined lesions, completely surrounded by pulmonary parenchyma.2 Most of the pulmonary nodules detected incidentally (ie, in asymptomatic patients outside the context of chest CT screening for lung cancer) are benign.1 Lesions >30 mm are defined as masses and have higher risks of malignancy.2
Because the majority of patients will not benefit from the identification of incidental pulmonary nodules (IPNs), improving the benefits and minimizing the harms of IPN follow-up are critical. The Fleischner Society3 published their first guideline on the management of solid IPNs in 2005,4 which was supplemented in 2013 with specific guidance for the management of subsolid IPNs.5 In 2017, both guidelines were combined in a single update.6 The Fleischner Society recommendations for imaging surveillance and tissue sampling are based on nodule type (solid vs subsolid), number (single vs multiple), size, appearance, and patient risk for malignancy.
For IPNs identified in the hospital, management may be particularly challenging. For one, the provider initially ordering the chest imaging may not be the provider coordinating the patient’s discharge, leading to a lack of knowledge that the IPN even exists. The hospitalist to primary care provider (PCP) handoff may also have vulnerabilities, including the lack of inclusion of the IPN follow-up in the discharge summary and the nonreceipt of the discharge summary by the PCP. Moreover, because a patient’s acute medical problems often take precedence during a hospitalization, inpatients may not even be made aware of identified IPNs and the need for follow-up. Thus, the absence of standardized approaches to managing IPNs is a threat to patient safety, as well as a legal liability for providers and their institutions.
To better understand the current state of IPN management in our own institution, we examined the management of IPNs identified by chest computed tomographies (CTs) performed for inpatients on our general medicine services over a two-year period.7 Among the 50 inpatients identified with IPNs requiring follow-up, 78% had no follow-up imaging documented. Moreover, 40% had no mention of the IPN in their hospital summary or discharge instructions.
To inform our approach to addressing this challenge, we sought to examine the practices of hospitalist physicians nationally regarding the management of IPNs, including hospitalists’ familiarity with the Fleischner Society guidelines.
METHODS
We developed a 14-item survey to assess hospitalists’ exposure to and management of IPNs. The survey targeted attendees of the 2016 Society of Hospital Medicine (SHM) annual conference and was available for completion on a tablet at the conference registration desk, the SHM kiosk in the exhibit hall, and at the entrance and exit of the morning plenary sessions. Following the annual conference, the survey was e-mailed to conference attendees, with one follow-up e-mailed to nonresponders.
Analyses were descriptive and included proportions for categorical variables and median and mean values and standard deviations for continuous variables. In addition, we examined the association between survey items and a response of “yes” to the question “Are you familiar with the Fleischner Society guidelines for the management of incidental pulmonary nodules?”
Associations between familiarity with the Fleischner Society guidelines and survey items were examined using Pearson’s chi-square test for categorical variables, Fisher’s exact test for categorical variables with small sample sizes, the Cochran–Armitage test for trend for ordinal variables, and the t-test for continuous variables. The associations between categorical items were measured by odds ratios with 95% confidence intervals. Statistical tests were two-sided using a P =.05 level for statistical significance. All analyses were performed using R version 3.4.4 (R Foundation for Statistical Computing, Vienna, Austria), with the R packages MASS, stats, and Publish. Institutional review board exemption was granted.
RESULTS
We received 174 responses from a total of 3,954 conference attendees. The majority were identified as hospitalist physicians, and most of them were internists (Table 1). About half practiced at a university or a teaching hospital, and more than half supervised trainees and practiced for more than five years. Respondents were involved in direct patient care (whether a teaching or a nonteaching service) for a median of 28 weeks annually (mean 31.2 weeks, standard deviation 13.5), and practice regions were geographically diverse. All respondents reported seeing at least one IPN case in the past six months, with most seeing three or more cases (Table 2). Despite this exposure, 42% were unfamiliar with the Fleischner Society guidelines. When determining the need for IPN follow-up, most of them utilized radiology report recommendations or consulted national or international guidelines, and a third spoke with radiologists directly. About a third agreed that determining the need for follow-up was challenging, with 39% citing patient factors (eg, lack of insurance, poor access to healthcare), and 30% citing scheduling of follow-up imaging. Few reported the availability of an automated tracking system at their institution, although most of them desired automatic notifications of results requiring follow-up.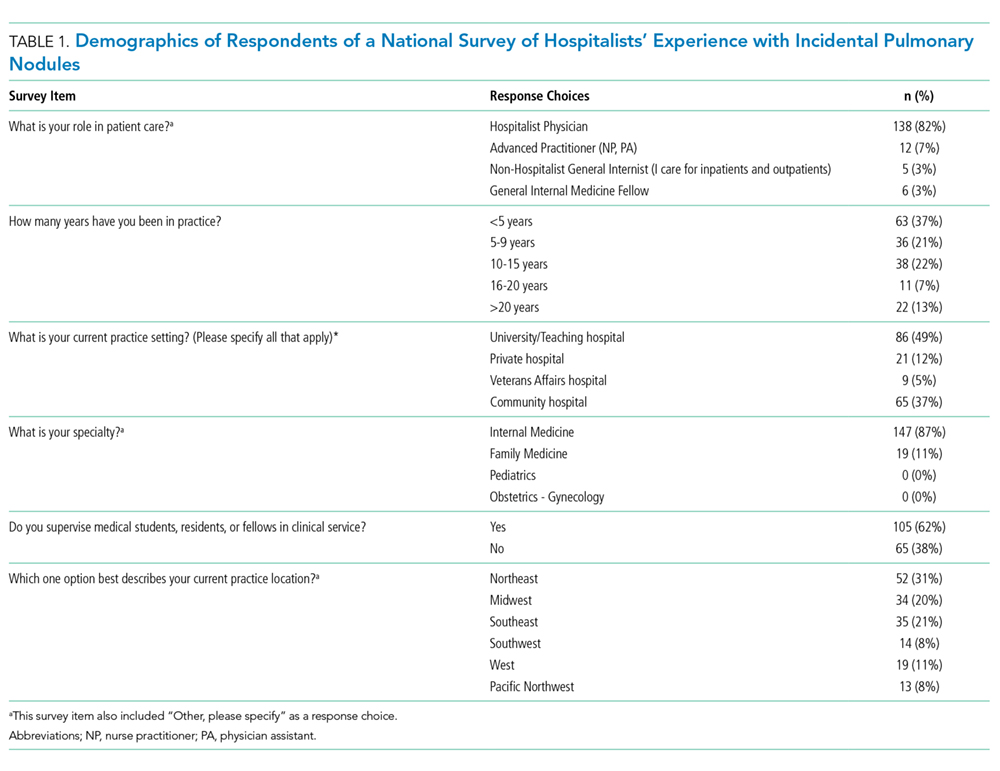
Unadjusted analyses revealed that supervision of trainees and seeing more IPN cases significantly increased the odds of a survey respondent being familiar with the Fleischner Society guidelines (OR 1.96, 95% CI 1.04-3.68, P =.05, and OR 1.55, 95% CI 1.12-2.18, P =.008, respectively; Supplementary Table 1).
DISCUSSION
To our knowledge, the survey reported here is the first to examine hospitalists’ knowledge of the Fleischner Society guidelines and their approach to management of IPNs. Although our data suggest that hospitalists are less familiar with the Fleischner Society recommendations than pulmonologists8 and radiologists,8-10 the majority of hospitalists in our study rely on radiology report recommendations to inform follow-up. This suggests that embedding the Fleischner Society recommendations into radiology reports is an effective method to promote adherence to these recommendations, which has been demonstrated in previous research.11-13 Our study also suggests that hospitalists with more IPN exposure and those who supervise trainees are more likely to be aware of the Fleischner Society recommendations, which is similar to findings from studies examining radiologists and pulmonologists.8-9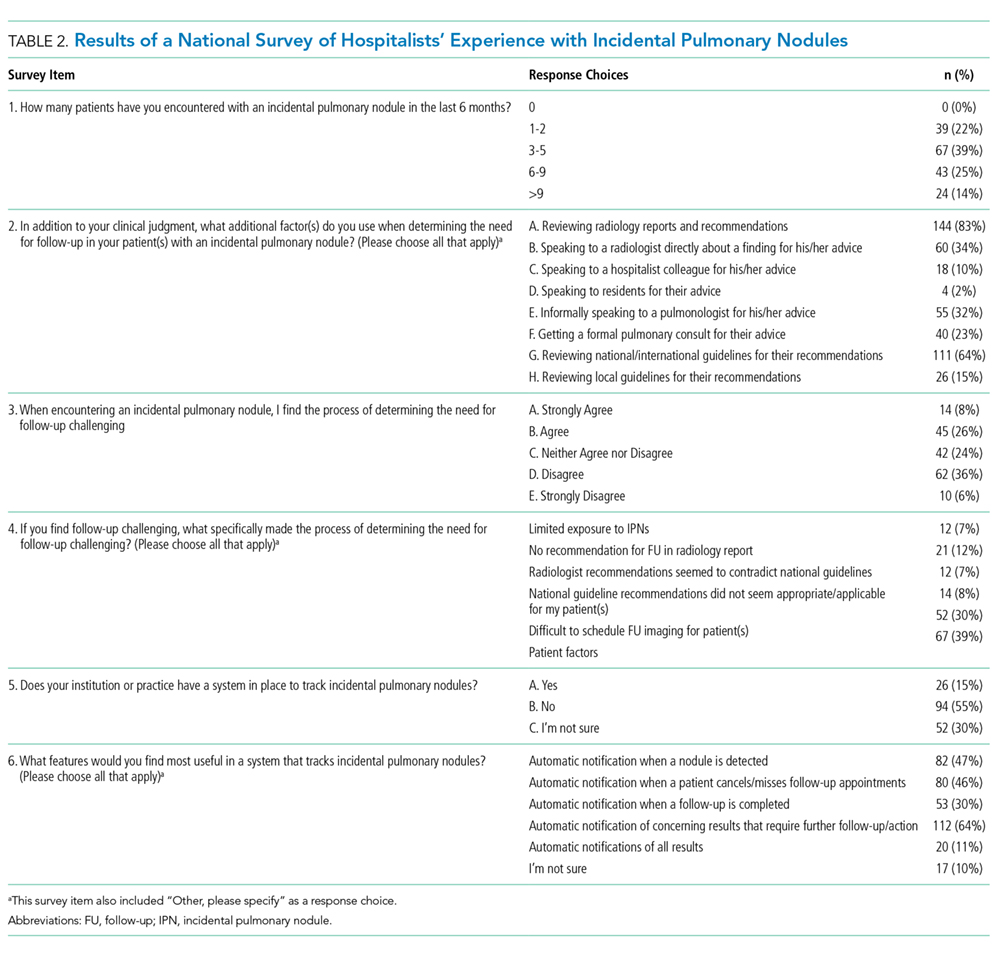
Our findings highlight other opportunities for quality improvement in IPN management. Almost a quarter of hospitalists reported formally consulting pulmonologists for IPN management. Hospitalist groups wishing to improve value could partner with their radiology departments and embed the Fleischner Society recommendations into their imaging reports to potentially reduce unnecessary pulmonary consultations. Among the 59 hospitalists who agreed that IPN management was challenging, a majority cited the scheduling process (30%) as a barrier. Redesigning the scheduling process for follow-up imaging could be a focus in local efforts to improve IPN management. Strengthening communication between hospitalists and PCPs may provide additional opportunities for improved IPN follow-up, given the centrality of PCPs to ensuring such follow-up. This might include enhancing direct communication between hospitalists and PCPs for high-risk patients, or creating systems to ensure robust indirect communication, such as the implementation of standardized discharge summaries that uniformly include essential follow-up information.
At our institution, given the large volume of high-risk patients and imaging performed, and the available resources, we have established an IPN consult team to improve follow-up for inpatients with IPNs identified by chest CTs on Medicine services. The team includes a nurse practitioner (NP) and a pulmonologist who consult by default, to notify patients of their findings and recommended follow-up, and communicate results to their PCPs. The IPN consult team also sees patients for follow-up in the ambulatory IPN clinic. This initiative has addressed the most frequently cited challenges identified in our nationwide hospitalist survey by taking the communication and follow-up out of the hospitalists’ hands. To ensure identification of all IPNs by the NP, our radiology department has created a structured template for radiology attendings to document follow-up for all chest CTs reviewed based on the Fleischner Society guidelines. Compliance with use of the template by radiologists is followed monthly. After a run-in period, almost 100% of chest CT reports use the structured template, consistent with published findings from similar initiatives,14 and 100% of patients with new IPNs identified on the inpatient Medicine services have had an IPN consult.
The major limitation of our survey study is the response rate. It is difficult to determine in what direction this could bias our results, as those with and without experience in managing IPNs may have been equally likely to complete the survey. Despite the low response rate, our sample targeted the general cohort of conference attendees (rather than specific forums such as audiences interested in quality or imaging), and the descriptive characteristics of our convenience sample align well with the overall conference attendee demographics (eg, conference attendees were 77% hospitalist attendings and 9% advanced practice providers, as compared with 82% and 7% of survey respondents, respectively), suggesting that our respondents were representative of conference attendees as a whole.
Next steps for this work at our institution include developing systems to ensure appropriate follow-up for those with IPNs identified on chest CTs performed for Medicine outpatients. In addition, our institution is collaborating on a national study to compare outcomes resulting from following the traditional Fleischner Society recommendations compared to the new 2017 recommendations, which recommend more lenient follow-up.15
Acknowledgments
The authors acknowledge Vivek Ahya, Eduardo Barbosa Jr., Tammy Tursi, and Anil Vachani for their leadership of the local quality improvement initiatives described in our Discussion, namely, the development and implementation of the structured templates for radiology reports and the incidental pulmonary nodule consult team.
Disclosures
Dr. Cook reports relevant financial activity outside the submitted work, including royalties from Osler Institute and grants from ACRIN and Beryl Institute. All other authors report no potential conflicts of interest relevant to this study. There was no financial support for this study.
Previous Presentations
Presented as a poster at the 2017 Society of Hospital Medicine Annual Conference, Las Vegas, NV: Wilen J, Garin M, Umscheid CA, Cook TS, Myers JS. Follow-up of incidental pulmonary nodules: a survey of hospitalists nationwide [abstract]. Journal of Hospital Medicine. 2017; 12 (Suppl 2). Available at: https://www.shmabstracts.com/abstract/follow-up-of-incidental-pulmonary-nodules-a-survey-of-hospitalists-nationwide/. Accessed March 18, 2018.
1. Ost D, Fein AM, Feinsilver SH. Clinical Practice: the solitary pulmonary nodule. N Engl J Med. 2003;348(25):2535-2542. doi: 10.1056/NEJMcp012290 PubMed
2. Tuddenham WJ. Glossary of terms for thoracic radiology: recommendations of the Nomenclature Committee of the Fleischner Society. AJR Am J Roentgenol. 1984;143(3):509-517. PubMed
3. Janower ML. A brief history of the Fleischner Society. J Thorac Imaging. 2010;25(1):27-28. doi: 10.1097/RTI.0b013e3181cc4cee. PubMed
4. Macmahon H, Austin JH, Gamsu G, et al. Guidelines for management of small pulmonary nodules detected on CT scans: a statement from the Fleischner Society. Radiology. 2005;237(2):395-400. doi: 10.1148/radiol.2372041887. PubMed
5. Naidich DP, Bankier AA, MacMahon H, et al. Recommendations for the management of subsolid pulmonary nodules detected at CT: a statement from the Fleischner Society. Radiology. 2013;266(1):304-317. doi: 10.1148/radiol.12120628. PubMed
6. MacMahon H, Naidich DP, Goo JM, et al. Guidelines for management of incidental pulmonary nodules detected on CT images: from the Fleischner Society 2017. Radiology.2017;284(1):228-243. doi: 10.1148/radiol.2017161659. PubMed
7. Garin M, Soran C, Cook T, Ferguson M, Day S, Myers JS. Communication and follow-up of incidental lung nodules found on chest CT in a hospitalized and ambulatory patient population. J Hosp Med. 2014:9(2). Available at: https://www.shmabstracts.com/abstract/communication-and-followup-of-incidental-lung-nodules-found-on-chest-ct-in-a-hospitalized-and-ambulatory-patient-population/ Accessed June 14, 2018.
8. Mets OM, de Jong PA, Chung K, Lammers JWJ, van Ginneken B, Schaefer-Prokop CM. Fleischner recommendations for the management of subsolid pulmonary nodules: high awareness but limited conformance – a survey study. Eur Radiol. 2016;26:3840-3849. doi: 10.1007/s00330-016-4249-y. PubMed
9. Eisenberg RL, Bankier AA, Boiselle PM. Compliance with Fleischner Society Guidelines for management of small lung nodules: a survey of 834 radiologists. Radiology. 2010;255(1):218-224. doi: 10.1148/radiol.09091556. PubMed
10. Eisenberg RL. Ways to improve radiologists’ adherence to Fleischner society guidelines for management of pulmonary nodules. J Am Coll Radiol. 2013;10(6):439-441. doi: 10.1016/j.jacr.2012.10.001. PubMed
11. Blagev DP, Lloyd JF, Conner K, et al. Follow-up of incidental pulmonary nodules and the radiology report. J Am Coll Radiol. 2014;11(4):378-383. doi: 10.1016/j.jacr.2013.08.003. PubMed
12. Woloshin S, Schwartz LM, Dann E, Black WC. Using radiology reports to encourage evidence-based practice in the evaluation of small, incidentally detected pulmonary nodules: a preliminary study. Ann Am Thorac Soc. 2014;11(2):211-214. doi: 10.1513/AnnalsATS.201307-242BC. PubMed
13. McDonald JS, Koo CW, White D, Hartman TE, Bender CE, Sykes AMG. Addition of the Fleischner Society Guidelines to chest CT examination interpretive reports improves adherence to recommended follow-up care for incidental pulmonary nodules. Acad Radiol. 2017;24(3):337-344. doi: 10.1016/j.acra.2016.08.026. PubMed
14. Zygmont ME, Shekhani H, Kerchberger JM, Johnson JO, Hanna TN. Point-of-Care reference materials increase practice compliance with societal guidelines for incidental findings in emergency imaging. J Am Coll Radiol. 2016;13(12):1494-1500. doi: 10.1016/j.jacr.2016.07.032. PubMed
15. Patient-Centered Outcomes Research Institute Portfolio of Funded Projects. Available at: https://www.pcori.org/research-results/2015/pragmatic-trial-more-versus-less-intensive-strategies-active-surveillance#/. Accessed May 22, 2018.
Pulmonary nodules are common, and their identification is increasing as a result of the use of more sensitive chest imaging modalities.1 Pulmonary nodules are defined on imaging as small (≤30 mm), well-defined lesions, completely surrounded by pulmonary parenchyma.2 Most of the pulmonary nodules detected incidentally (ie, in asymptomatic patients outside the context of chest CT screening for lung cancer) are benign.1 Lesions >30 mm are defined as masses and have higher risks of malignancy.2
Because the majority of patients will not benefit from the identification of incidental pulmonary nodules (IPNs), improving the benefits and minimizing the harms of IPN follow-up are critical. The Fleischner Society3 published their first guideline on the management of solid IPNs in 2005,4 which was supplemented in 2013 with specific guidance for the management of subsolid IPNs.5 In 2017, both guidelines were combined in a single update.6 The Fleischner Society recommendations for imaging surveillance and tissue sampling are based on nodule type (solid vs subsolid), number (single vs multiple), size, appearance, and patient risk for malignancy.
For IPNs identified in the hospital, management may be particularly challenging. For one, the provider initially ordering the chest imaging may not be the provider coordinating the patient’s discharge, leading to a lack of knowledge that the IPN even exists. The hospitalist to primary care provider (PCP) handoff may also have vulnerabilities, including the lack of inclusion of the IPN follow-up in the discharge summary and the nonreceipt of the discharge summary by the PCP. Moreover, because a patient’s acute medical problems often take precedence during a hospitalization, inpatients may not even be made aware of identified IPNs and the need for follow-up. Thus, the absence of standardized approaches to managing IPNs is a threat to patient safety, as well as a legal liability for providers and their institutions.
To better understand the current state of IPN management in our own institution, we examined the management of IPNs identified by chest computed tomographies (CTs) performed for inpatients on our general medicine services over a two-year period.7 Among the 50 inpatients identified with IPNs requiring follow-up, 78% had no follow-up imaging documented. Moreover, 40% had no mention of the IPN in their hospital summary or discharge instructions.
To inform our approach to addressing this challenge, we sought to examine the practices of hospitalist physicians nationally regarding the management of IPNs, including hospitalists’ familiarity with the Fleischner Society guidelines.
METHODS
We developed a 14-item survey to assess hospitalists’ exposure to and management of IPNs. The survey targeted attendees of the 2016 Society of Hospital Medicine (SHM) annual conference and was available for completion on a tablet at the conference registration desk, the SHM kiosk in the exhibit hall, and at the entrance and exit of the morning plenary sessions. Following the annual conference, the survey was e-mailed to conference attendees, with one follow-up e-mailed to nonresponders.
Analyses were descriptive and included proportions for categorical variables and median and mean values and standard deviations for continuous variables. In addition, we examined the association between survey items and a response of “yes” to the question “Are you familiar with the Fleischner Society guidelines for the management of incidental pulmonary nodules?”
Associations between familiarity with the Fleischner Society guidelines and survey items were examined using Pearson’s chi-square test for categorical variables, Fisher’s exact test for categorical variables with small sample sizes, the Cochran–Armitage test for trend for ordinal variables, and the t-test for continuous variables. The associations between categorical items were measured by odds ratios with 95% confidence intervals. Statistical tests were two-sided using a P =.05 level for statistical significance. All analyses were performed using R version 3.4.4 (R Foundation for Statistical Computing, Vienna, Austria), with the R packages MASS, stats, and Publish. Institutional review board exemption was granted.
RESULTS
We received 174 responses from a total of 3,954 conference attendees. The majority were identified as hospitalist physicians, and most of them were internists (Table 1). About half practiced at a university or a teaching hospital, and more than half supervised trainees and practiced for more than five years. Respondents were involved in direct patient care (whether a teaching or a nonteaching service) for a median of 28 weeks annually (mean 31.2 weeks, standard deviation 13.5), and practice regions were geographically diverse. All respondents reported seeing at least one IPN case in the past six months, with most seeing three or more cases (Table 2). Despite this exposure, 42% were unfamiliar with the Fleischner Society guidelines. When determining the need for IPN follow-up, most of them utilized radiology report recommendations or consulted national or international guidelines, and a third spoke with radiologists directly. About a third agreed that determining the need for follow-up was challenging, with 39% citing patient factors (eg, lack of insurance, poor access to healthcare), and 30% citing scheduling of follow-up imaging. Few reported the availability of an automated tracking system at their institution, although most of them desired automatic notifications of results requiring follow-up.
Unadjusted analyses revealed that supervision of trainees and seeing more IPN cases significantly increased the odds of a survey respondent being familiar with the Fleischner Society guidelines (OR 1.96, 95% CI 1.04-3.68, P =.05, and OR 1.55, 95% CI 1.12-2.18, P =.008, respectively; Supplementary Table 1).
DISCUSSION
To our knowledge, the survey reported here is the first to examine hospitalists’ knowledge of the Fleischner Society guidelines and their approach to management of IPNs. Although our data suggest that hospitalists are less familiar with the Fleischner Society recommendations than pulmonologists8 and radiologists,8-10 the majority of hospitalists in our study rely on radiology report recommendations to inform follow-up. This suggests that embedding the Fleischner Society recommendations into radiology reports is an effective method to promote adherence to these recommendations, which has been demonstrated in previous research.11-13 Our study also suggests that hospitalists with more IPN exposure and those who supervise trainees are more likely to be aware of the Fleischner Society recommendations, which is similar to findings from studies examining radiologists and pulmonologists.8-9
Our findings highlight other opportunities for quality improvement in IPN management. Almost a quarter of hospitalists reported formally consulting pulmonologists for IPN management. Hospitalist groups wishing to improve value could partner with their radiology departments and embed the Fleischner Society recommendations into their imaging reports to potentially reduce unnecessary pulmonary consultations. Among the 59 hospitalists who agreed that IPN management was challenging, a majority cited the scheduling process (30%) as a barrier. Redesigning the scheduling process for follow-up imaging could be a focus in local efforts to improve IPN management. Strengthening communication between hospitalists and PCPs may provide additional opportunities for improved IPN follow-up, given the centrality of PCPs to ensuring such follow-up. This might include enhancing direct communication between hospitalists and PCPs for high-risk patients, or creating systems to ensure robust indirect communication, such as the implementation of standardized discharge summaries that uniformly include essential follow-up information.
At our institution, given the large volume of high-risk patients and imaging performed, and the available resources, we have established an IPN consult team to improve follow-up for inpatients with IPNs identified by chest CTs on Medicine services. The team includes a nurse practitioner (NP) and a pulmonologist who consult by default, to notify patients of their findings and recommended follow-up, and communicate results to their PCPs. The IPN consult team also sees patients for follow-up in the ambulatory IPN clinic. This initiative has addressed the most frequently cited challenges identified in our nationwide hospitalist survey by taking the communication and follow-up out of the hospitalists’ hands. To ensure identification of all IPNs by the NP, our radiology department has created a structured template for radiology attendings to document follow-up for all chest CTs reviewed based on the Fleischner Society guidelines. Compliance with use of the template by radiologists is followed monthly. After a run-in period, almost 100% of chest CT reports use the structured template, consistent with published findings from similar initiatives,14 and 100% of patients with new IPNs identified on the inpatient Medicine services have had an IPN consult.
The major limitation of our survey study is the response rate. It is difficult to determine in what direction this could bias our results, as those with and without experience in managing IPNs may have been equally likely to complete the survey. Despite the low response rate, our sample targeted the general cohort of conference attendees (rather than specific forums such as audiences interested in quality or imaging), and the descriptive characteristics of our convenience sample align well with the overall conference attendee demographics (eg, conference attendees were 77% hospitalist attendings and 9% advanced practice providers, as compared with 82% and 7% of survey respondents, respectively), suggesting that our respondents were representative of conference attendees as a whole.
Next steps for this work at our institution include developing systems to ensure appropriate follow-up for those with IPNs identified on chest CTs performed for Medicine outpatients. In addition, our institution is collaborating on a national study to compare outcomes resulting from following the traditional Fleischner Society recommendations compared to the new 2017 recommendations, which recommend more lenient follow-up.15
Acknowledgments
The authors acknowledge Vivek Ahya, Eduardo Barbosa Jr., Tammy Tursi, and Anil Vachani for their leadership of the local quality improvement initiatives described in our Discussion, namely, the development and implementation of the structured templates for radiology reports and the incidental pulmonary nodule consult team.
Disclosures
Dr. Cook reports relevant financial activity outside the submitted work, including royalties from Osler Institute and grants from ACRIN and Beryl Institute. All other authors report no potential conflicts of interest relevant to this study. There was no financial support for this study.
Previous Presentations
Presented as a poster at the 2017 Society of Hospital Medicine Annual Conference, Las Vegas, NV: Wilen J, Garin M, Umscheid CA, Cook TS, Myers JS. Follow-up of incidental pulmonary nodules: a survey of hospitalists nationwide [abstract]. Journal of Hospital Medicine. 2017; 12 (Suppl 2). Available at: https://www.shmabstracts.com/abstract/follow-up-of-incidental-pulmonary-nodules-a-survey-of-hospitalists-nationwide/. Accessed March 18, 2018.
1. Ost D, Fein AM, Feinsilver SH. Clinical Practice: the solitary pulmonary nodule. N Engl J Med. 2003;348(25):2535-2542. doi: 10.1056/NEJMcp012290 PubMed
2. Tuddenham WJ. Glossary of terms for thoracic radiology: recommendations of the Nomenclature Committee of the Fleischner Society. AJR Am J Roentgenol. 1984;143(3):509-517. PubMed
3. Janower ML. A brief history of the Fleischner Society. J Thorac Imaging. 2010;25(1):27-28. doi: 10.1097/RTI.0b013e3181cc4cee. PubMed
4. Macmahon H, Austin JH, Gamsu G, et al. Guidelines for management of small pulmonary nodules detected on CT scans: a statement from the Fleischner Society. Radiology. 2005;237(2):395-400. doi: 10.1148/radiol.2372041887. PubMed
5. Naidich DP, Bankier AA, MacMahon H, et al. Recommendations for the management of subsolid pulmonary nodules detected at CT: a statement from the Fleischner Society. Radiology. 2013;266(1):304-317. doi: 10.1148/radiol.12120628. PubMed
6. MacMahon H, Naidich DP, Goo JM, et al. Guidelines for management of incidental pulmonary nodules detected on CT images: from the Fleischner Society 2017. Radiology.2017;284(1):228-243. doi: 10.1148/radiol.2017161659. PubMed
7. Garin M, Soran C, Cook T, Ferguson M, Day S, Myers JS. Communication and follow-up of incidental lung nodules found on chest CT in a hospitalized and ambulatory patient population. J Hosp Med. 2014:9(2). Available at: https://www.shmabstracts.com/abstract/communication-and-followup-of-incidental-lung-nodules-found-on-chest-ct-in-a-hospitalized-and-ambulatory-patient-population/ Accessed June 14, 2018.
8. Mets OM, de Jong PA, Chung K, Lammers JWJ, van Ginneken B, Schaefer-Prokop CM. Fleischner recommendations for the management of subsolid pulmonary nodules: high awareness but limited conformance – a survey study. Eur Radiol. 2016;26:3840-3849. doi: 10.1007/s00330-016-4249-y. PubMed
9. Eisenberg RL, Bankier AA, Boiselle PM. Compliance with Fleischner Society Guidelines for management of small lung nodules: a survey of 834 radiologists. Radiology. 2010;255(1):218-224. doi: 10.1148/radiol.09091556. PubMed
10. Eisenberg RL. Ways to improve radiologists’ adherence to Fleischner society guidelines for management of pulmonary nodules. J Am Coll Radiol. 2013;10(6):439-441. doi: 10.1016/j.jacr.2012.10.001. PubMed
11. Blagev DP, Lloyd JF, Conner K, et al. Follow-up of incidental pulmonary nodules and the radiology report. J Am Coll Radiol. 2014;11(4):378-383. doi: 10.1016/j.jacr.2013.08.003. PubMed
12. Woloshin S, Schwartz LM, Dann E, Black WC. Using radiology reports to encourage evidence-based practice in the evaluation of small, incidentally detected pulmonary nodules: a preliminary study. Ann Am Thorac Soc. 2014;11(2):211-214. doi: 10.1513/AnnalsATS.201307-242BC. PubMed
13. McDonald JS, Koo CW, White D, Hartman TE, Bender CE, Sykes AMG. Addition of the Fleischner Society Guidelines to chest CT examination interpretive reports improves adherence to recommended follow-up care for incidental pulmonary nodules. Acad Radiol. 2017;24(3):337-344. doi: 10.1016/j.acra.2016.08.026. PubMed
14. Zygmont ME, Shekhani H, Kerchberger JM, Johnson JO, Hanna TN. Point-of-Care reference materials increase practice compliance with societal guidelines for incidental findings in emergency imaging. J Am Coll Radiol. 2016;13(12):1494-1500. doi: 10.1016/j.jacr.2016.07.032. PubMed
15. Patient-Centered Outcomes Research Institute Portfolio of Funded Projects. Available at: https://www.pcori.org/research-results/2015/pragmatic-trial-more-versus-less-intensive-strategies-active-surveillance#/. Accessed May 22, 2018.
© 2019 Society of Hospital Medicine